Embed Size (px)
Citation preview
AECOM Alberta Flood Recovery Task Force Appendix B – Climatic and Hydrometric Data
RPT3-2014-06-06-App_B_Sheep_River_Climatic_And_Hydrometric_Data.Docx
Appendix B Climatic and Hydrometric Data
AECOM Alberta Flood Recovery Task Force Appendix B – Climatic and Hydrometric Data
RPT3-2014-06-06-App_B_Sheep_River_Climatic_And_Hydrometric_Data.Docx
Table of Contents
page 1. Background ...................................................................................................................................................... 1
2. Climate Stations ............................................................................................................................................... 2
3. Hydrometric Data ............................................................................................................................................. 5
3.1 Largest Recorded Discharges .............................................................................................................. 5
3.2 Frequency Floods ................................................................................................................................. 5
3.3 WSC Summaries .................................................................................................................................. 6
3.3.1 05BL012 Sheep River at Okotoks ........................................................................................... 6
3.3.2 05BL013 Three Point Creek near Millarville ............................................................................ 8
3.3.3 05BL014 Sheep River at Black Diamond ................................................................................ 9
3.3.4 05BL018 Sheep River at Buck Ranch ................................................................................... 10
4. References...................................................................................................................................................... 12
5. Sign-Off ........................................................................................................................................................... 13
List of Figures
Figure 2-1: Sheep River Basin Hydrometric and Climate Stations ............................................................................... 4
List of Tables
Table 2-1: Climate Stations considered for the Sheep River Basin ............................................................................. 2
Table 2-2: Mean Monthly Air Temperatures (1981-2010) ............................................................................................ 3
Table 2-3: Monthly Precipitation (1981-2010) .............................................................................................................. 3
Table 3-1: Water Survey of Canada Hydrometric Stations in Sheep River Basin ........................................................ 5
Table 3-2: Ten Largest Mean Daily Discharges by WSC Station ................................................................................. 5
Table 3-3: Maximum Instantaneous Frequency Floods at 05BL014 ............................................................................ 6
Table 3-4: Annual Peak Instantaneous Discharge Range at 05BL012 ........................................................................ 6
Table 3-5: Minimum Open Water Discharges at 05BL012 ........................................................................................... 7
Table 3-6: Mean Monthly Discharges at 05BL012 ....................................................................................................... 7
Table 3-7: Freeze-Up Discharges at 05BL012 ............................................................................................................. 7
Table 3-8: Earliest Open Water Discharges at 05BL012 ............................................................................................. 7
Table 3-9: Peak Instantaneous Discharge at 05BL012 ................................................................................................ 7
Table 3-10: Annual Peak Instantaneous Discharge Range at 05BL013 ...................................................................... 8
Table 3-11: Minimum Open Water Discharges at 05BL013 ......................................................................................... 8
Table 3-12: Mean Monthly Discharges at 05BL013 ..................................................................................................... 8
Table 3-13: Freeze-Up Discharges at 05BL013 ........................................................................................................... 8
Table 3-14: Earliest Open Water Discharges at 05BL013 ........................................................................................... 8
Table 3-15: Peak Instantaneous Discharge at 05BL013 .............................................................................................. 9
AECOM Alberta Flood Recovery Task Force Appendix B – Climatic and Hydrometric Data
RPT3-2014-06-06-App_B_Sheep_River_Climatic_And_Hydrometric_Data.Docx
Table 3-16: Annual Peak Instantaneous Discharge Range at 05BL014 ...................................................................... 9
Table 3-17: Minimum Open Water Discharges at 05BL014 ......................................................................................... 9
Table 3-18: Minimum Discharges at 05BL014 ............................................................................................................. 9
Table 3-19: Mean Monthly Discharges at 05BL014 ................................................................................................... 10
Table 3-20: Freeze-Up Discharges at 05BL014 ......................................................................................................... 10
Table 3-21: Earliest Open Water Discharges at 05BL014 ......................................................................................... 10
Table 3-22: Peak Instantaneous Discharge at 05BL014 ............................................................................................ 10
Table 3-23: Annual Peak Instantaneous Discharge Range at 05BL018 .................................................................... 11
Table 3-24: Minimum Open Water Discharges at 05BL018 ....................................................................................... 11
Table 3-25: Mean Monthly Discharges at 05BL018 ................................................................................................... 11
Table 3-26: Freeze-Up Discharges at 05BL018 ......................................................................................................... 11
Table 3-27: Earliest Open Water Discharges at 05BL018 ......................................................................................... 11
AECOM Alberta Flood Recovery Task Force Appendix B – Climatic and Hydrometric Data
RPT3-2014-06-06-App_B_Sheep_River_Climatic_And_Hydrometric_Data.Docx 1
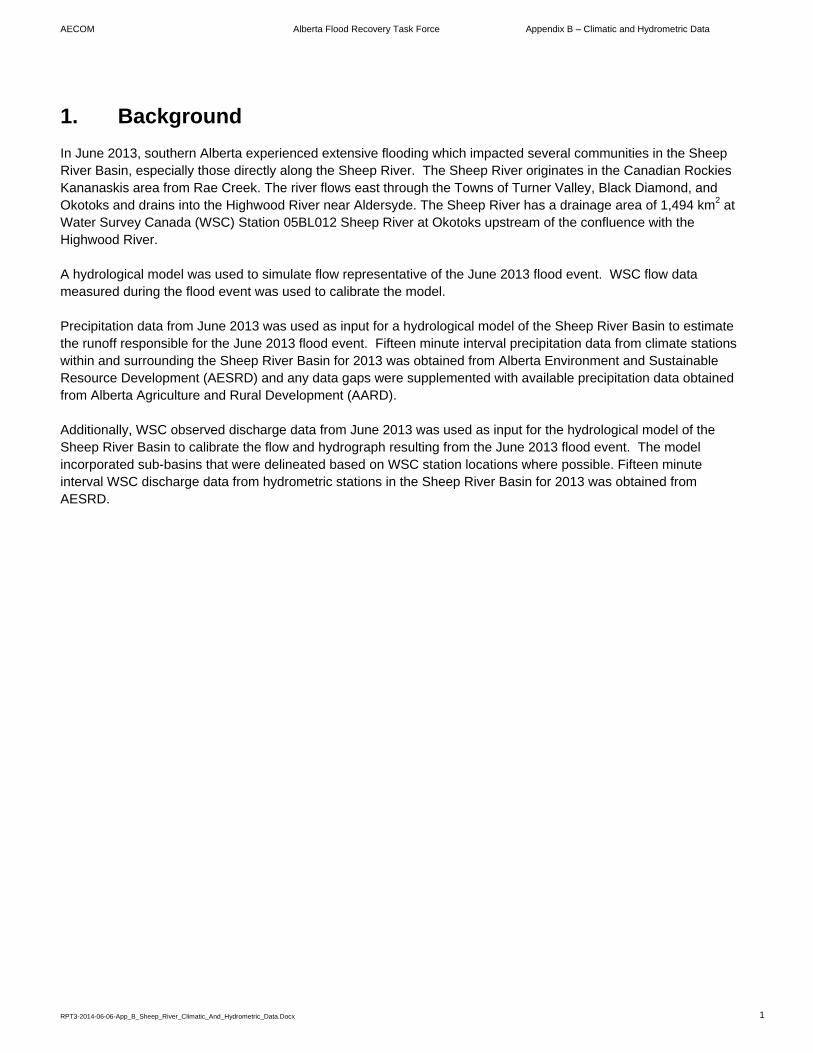
1. Background
In June 2013, southern Alberta experienced extensive flooding which impacted several communities in the Sheep River Basin, especially those directly along the Sheep River. The Sheep River originates in the Canadian Rockies Kananaskis area from Rae Creek. The river flows east through the Towns of Turner Valley, Black Diamond, and Okotoks and drains into the Highwood River near Aldersyde. The Sheep River has a drainage area of 1,494 km2 at Water Survey Canada (WSC) Station 05BL012 Sheep River at Okotoks upstream of the confluence with the Highwood River. A hydrological model was used to simulate flow representative of the June 2013 flood event. WSC flow data measured during the flood event was used to calibrate the model. Precipitation data from June 2013 was used as input for a hydrological model of the Sheep River Basin to estimate the runoff responsible for the June 2013 flood event. Fifteen minute interval precipitation data from climate stations within and surrounding the Sheep River Basin for 2013 was obtained from Alberta Environment and Sustainable Resource Development (AESRD) and any data gaps were supplemented with available precipitation data obtained from Alberta Agriculture and Rural Development (AARD). Additionally, WSC observed discharge data from June 2013 was used as input for the hydrological model of the Sheep River Basin to calibrate the flow and hydrograph resulting from the June 2013 flood event. The model incorporated sub-basins that were delineated based on WSC station locations where possible. Fifteen minute interval WSC discharge data from hydrometric stations in the Sheep River Basin for 2013 was obtained from AESRD.
AECOM Alberta Flood Recovery Task Force Appendix B – Climatic and Hydrometric Data
RPT3-2014-06-06-App_B_Sheep_River_Climatic_And_Hydrometric_Data.Docx 2
2. Climate Stations
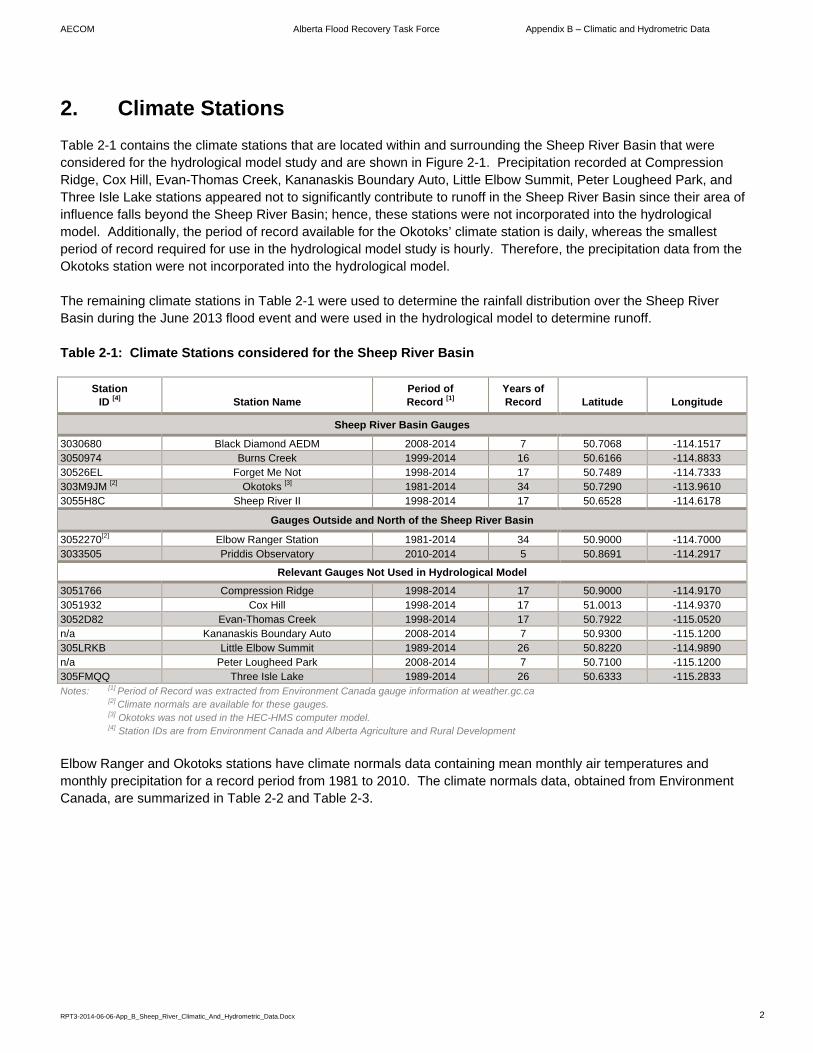
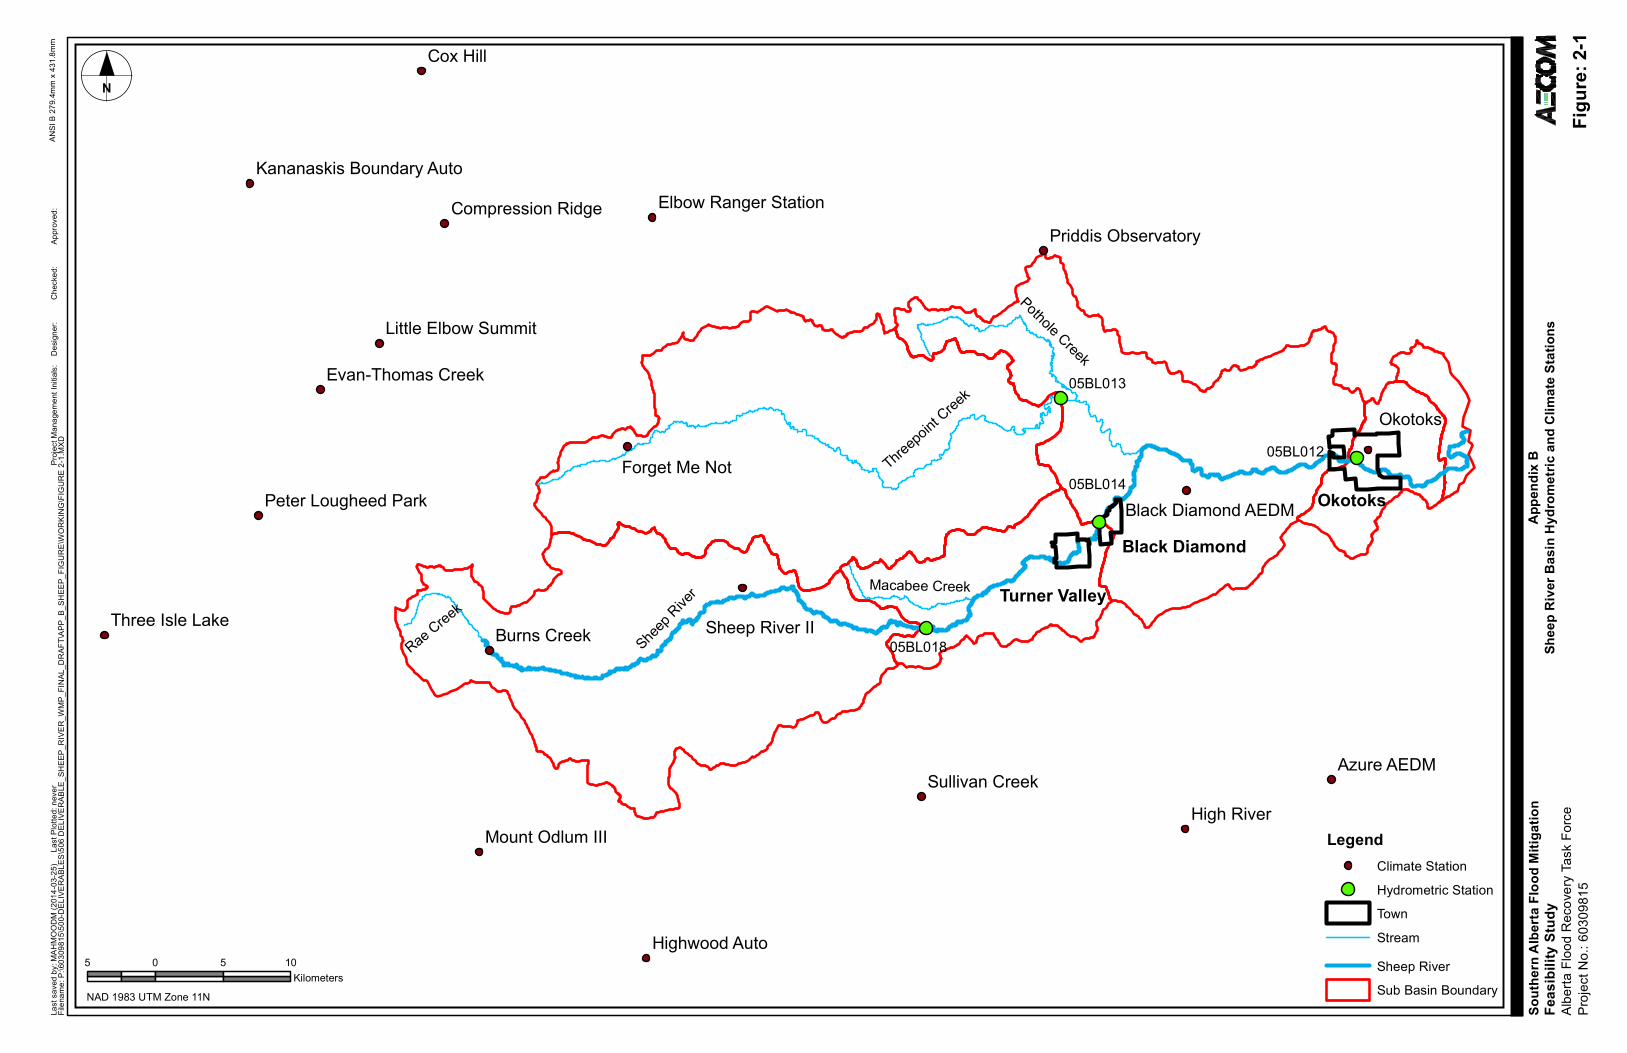
Table 2-1 contains the climate stations that are located within and surrounding the Sheep River Basin that were considered for the hydrological model study and are shown in Figure 2-1. Precipitation recorded at Compression Ridge, Cox Hill, Evan-Thomas Creek, Kananaskis Boundary Auto, Little Elbow Summit, Peter Lougheed Park, and Three Isle Lake stations appeared not to significantly contribute to runoff in the Sheep River Basin since their area of influence falls beyond the Sheep River Basin; hence, these stations were not incorporated into the hydrological model. Additionally, the period of record available for the Okotoks’ climate station is daily, whereas the smallest period of record required for use in the hydrological model study is hourly. Therefore, the precipitation data from the Okotoks station were not incorporated into the hydrological model. The remaining climate stations in Table 2-1 were used to determine the rainfall distribution over the Sheep River Basin during the June 2013 flood event and were used in the hydrological model to determine runoff. Table 2-1: Climate Stations considered for the Sheep River Basin
Station ID [4] Station Name
Period of Record [1]
Years of Record Latitude Longitude
Sheep River Basin Gauges
3030680 Black Diamond AEDM 2008-2014 7 50.7068 -114.1517 3050974 Burns Creek 1999-2014 16 50.6166 -114.8833 30526EL Forget Me Not 1998-2014 17 50.7489 -114.7333 303M9JM [2] Okotoks [3] 1981-2014 34 50.7290 -113.9610 3055H8C Sheep River II 1998-2014 17 50.6528 -114.6178
Gauges Outside and North of the Sheep River Basin
3052270[2] Elbow Ranger Station 1981-2014 34 50.9000 -114.7000 3033505 Priddis Observatory 2010-2014 5 50.8691 -114.2917
Relevant Gauges Not Used in Hydrological Model
3051766 Compression Ridge 1998-2014 17 50.9000 -114.9170 3051932 Cox Hill 1998-2014 17 51.0013 -114.9370 3052D82 Evan-Thomas Creek 1998-2014 17 50.7922 -115.0520 n/a Kananaskis Boundary Auto 2008-2014 7 50.9300 -115.1200 305LRKB Little Elbow Summit 1989-2014 26 50.8220 -114.9890 n/a Peter Lougheed Park 2008-2014 7 50.7100 -115.1200 305FMQQ Three Isle Lake 1989-2014 26 50.6333 -115.2833 Notes: [1] Period of Record was extracted from Environment Canada gauge information at weather.gc.ca [2] Climate normals are available for these gauges. [3] Okotoks was not used in the HEC-HMS computer model. [4] Station IDs are from Environment Canada and Alberta Agriculture and Rural Development
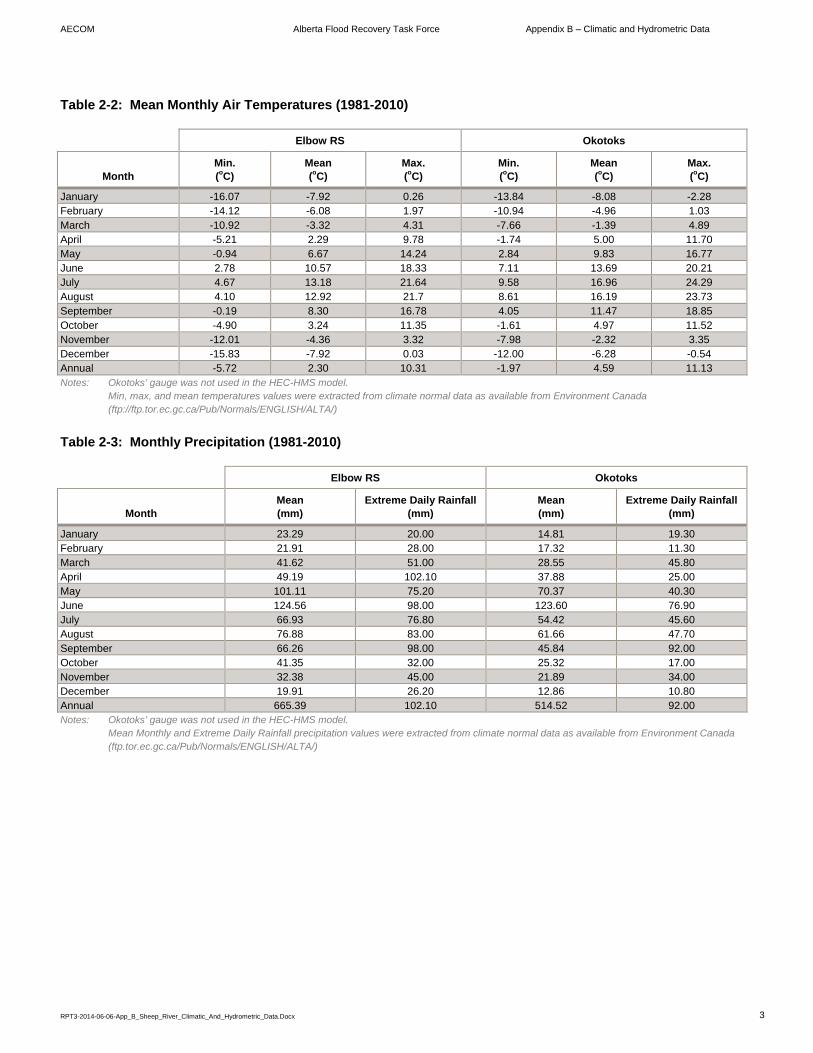
Elbow Ranger and Okotoks stations have climate normals data containing mean monthly air temperatures and monthly precipitation for a record period from 1981 to 2010. The climate normals data, obtained from Environment Canada, are summarized in Table 2-2 and Table 2-3.
AECOM Alberta Flood Recovery Task Force Appendix B – Climatic and Hydrometric Data
RPT3-2014-06-06-App_B_Sheep_River_Climatic_And_Hydrometric_Data.Docx 3
Table 2-2: Mean Monthly Air Temperatures (1981-2010)
Elbow RS Okotoks
Month Min. (oC)
Mean (oC)
Max. (oC)
Min. (oC)
Mean (oC)
Max. (oC)
January -16.07 -7.92 0.26 -13.84 -8.08 -2.28 February -14.12 -6.08 1.97 -10.94 -4.96 1.03 March -10.92 -3.32 4.31 -7.66 -1.39 4.89 April -5.21 2.29 9.78 -1.74 5.00 11.70 May -0.94 6.67 14.24 2.84 9.83 16.77 June 2.78 10.57 18.33 7.11 13.69 20.21 July 4.67 13.18 21.64 9.58 16.96 24.29 August 4.10 12.92 21.7 8.61 16.19 23.73 September -0.19 8.30 16.78 4.05 11.47 18.85 October -4.90 3.24 11.35 -1.61 4.97 11.52 November -12.01 -4.36 3.32 -7.98 -2.32 3.35 December -15.83 -7.92 0.03 -12.00 -6.28 -0.54 Annual -5.72 2.30 10.31 -1.97 4.59 11.13 Notes: Okotoks’ gauge was not used in the HEC-HMS model. Min, max, and mean temperatures values were extracted from climate normal data as available from Environment Canada
(ftp://ftp.tor.ec.gc.ca/Pub/Normals/ENGLISH/ALTA/)
Table 2-3: Monthly Precipitation (1981-2010)
Elbow RS Okotoks
Month Mean (mm)
Extreme Daily Rainfall(mm)
Mean (mm)
Extreme Daily Rainfall(mm)
January 23.29 20.00 14.81 19.30 February 21.91 28.00 17.32 11.30 March 41.62 51.00 28.55 45.80 April 49.19 102.10 37.88 25.00 May 101.11 75.20 70.37 40.30 June 124.56 98.00 123.60 76.90 July 66.93 76.80 54.42 45.60 August 76.88 83.00 61.66 47.70 September 66.26 98.00 45.84 92.00 October 41.35 32.00 25.32 17.00 November 32.38 45.00 21.89 34.00 December 19.91 26.20 12.86 10.80 Annual 665.39 102.10 514.52 92.00 Notes: Okotoks’ gauge was not used in the HEC-HMS model. Mean Monthly and Extreme Daily Rainfall precipitation values were extracted from climate normal data as available from Environment Canada
(ftp.tor.ec.gc.ca/Pub/Normals/ENGLISH/ALTA/)
05BL018
05BL014
05BL013
05BL012
Okotoks
Turner Valley
Black Diamond
Sheep R
iver
Threepo
int Creek
Pothole Creek
Macabee Creek
Rae Creek
Cox Hill
Azure AEDM
High River
Okotoks
Burns Creek
Highwood Auto
Forget Me Not
Sullivan Creek
Sheep River II
Mount Odlum III
Three Isle Lake
Evan-Thomas Creek
Compression Ridge
Black Diamond AEDMPeter Lougheed Park
Little Elbow Summit
Priddis ObservatoryElbow Ranger Station
Kananaskis Boundary Auto
Sout
hern
Albe
rta Fl
ood M
itigati
onFe
asibi
lity S
tudy
Albert
a Floo
d Rec
overy
Task
Force
Proje
ct No
.: 603
0981
5Fig
ure:
2-1
N►
5 0 5 10Kilometers
Last
save
d by:
MAHM
OODM
(201
4-03-2
5)
Last
Plotte
d: ne
ver
Filen
ame:
P:\60
3098
15\50
0-DEL
IVERA
BLES
\506 D
ELIVE
RABL
E_SH
EEP_
RIVE
R_W
MP_F
INAL
_DRA
FT\A
PP_B
_SHE
EP_F
IGUR
E\W
ORKI
NG\FI
GURE
2-1.M
XDPr
oject
Mana
geme
nt Ini
tials:
De
signe
r:
Ch
ecke
d:
Ap
prove
d:AN
SI B
279.4
mm x
431.8
mm
NAD 1983 UTM Zone 11N
Appe
ndix
BSh
eep R
iver B
asin
Hydr
ometr
ic an
d Clim
ate St
ation
s
LegendClimate StationHydrometric StationTownStreamSheep RiverSub Basin Boundary
AECOM Alberta Flood Recovery Task Force Appendix B – Climatic and Hydrometric Data
RPT3-2014-06-06-App_B_Sheep_River_Climatic_And_Hydrometric_Data.Docx 5
3. Hydrometric Data
The locations of Water Survey of Canada (WSC) stream gauges used in the hydrological model study of the Sheep River Basin are summarized in Table 3-1 and are shown in Figure 2-1. Table 3-1: Water Survey of Canada Hydrometric Stations in Sheep River Basin
Station Station Name Location Drainage
Area (km2) Record Period Type of Data
05BL012 Sheep River at Okotoks 50° 43' 26'' N, 113° 58' 24'' W 1494 1908-1915 Seasonal Manual 1916-1920 Continuous Manual 1965-1968 Continuous Recorder 2006-2014 Continuous Recorder
05BL013 Three Point Creek near Millarville 50° 46' 16'' N, 114° 16' 43'' W 507 1908-1911 Miscellaneous Manual1912-1916 Seasonal Manual 1965-2014 Seasonal Recorder
05BL014 Sheep River at Black Diamond 50° 41' 16'' N, 114° 14' 37'' W 592 1908-1908 Miscellaneous Manual1909-1916 Seasonal Manual 1968-2014 Continuous Recorder
05BL018 Sheep River at Buck Ranch 50°37'20" N, 114°25'40" W 454 1950-1969 Seasonal Recorder
3.1 Largest Recorded Discharges
Largest recorded discharges for selected WSC stations in the Sheep River basin are shown in Table 3-2. Table 3-2: Ten Largest Mean Daily Discharges by WSC Station
05BL012* (at Okotoks) 05BL013 (near Millarville) 05BL014 (at Black Diamond)
Year Discharge (m3/s) Year Discharge (m3/s) Year Discharge (m3/s)
2013 >1,000 (est.) 2005 389 2013 720 (est.)1915 730† 1967 283 2005 380 1967 662† 2013 265*** 1995 366 2011 581† 2011 226 2008 259 2008 383 2008 220 1990 207 1916 361† 1915 159 1970 195 1908 294† 2006 157 2011 185 2006 283 1969 146 2012 180 1912 203† 1995 129 1992 150 1917 203† 1994 119 2006 126 Notes: *Highly intermittent data set **2013 WSC discharge measurement not available ***2013 peak estimated from provisional15 min data provided by AESRD †Estimated from maximum daily data.
3.2 Frequency Floods
Flood frequency discharges have been estimated at WSC Station 05BL014 Sheep River at Black Diamond. The frequency analysis includes data from Station 05BL018 Sheep River at Buck Ranch to increase the record period. Peak data from Station 05BL009 was transferred downstream by establishing an exponential relationship between discharge and drainage basin area. The frequency discharges for various return periods are provided in Table 2-6. The frequency analysis includes a provisional 2013 peak discharge published by the Government of Alberta of 720 m3/s. Provisional peak discharge was not available from WSC.
AECOM Alberta Flood Recovery Task Force Appendix B – Climatic and Hydrometric Data
RPT3-2014-06-06-App_B_Sheep_River_Climatic_And_Hydrometric_Data.Docx 6
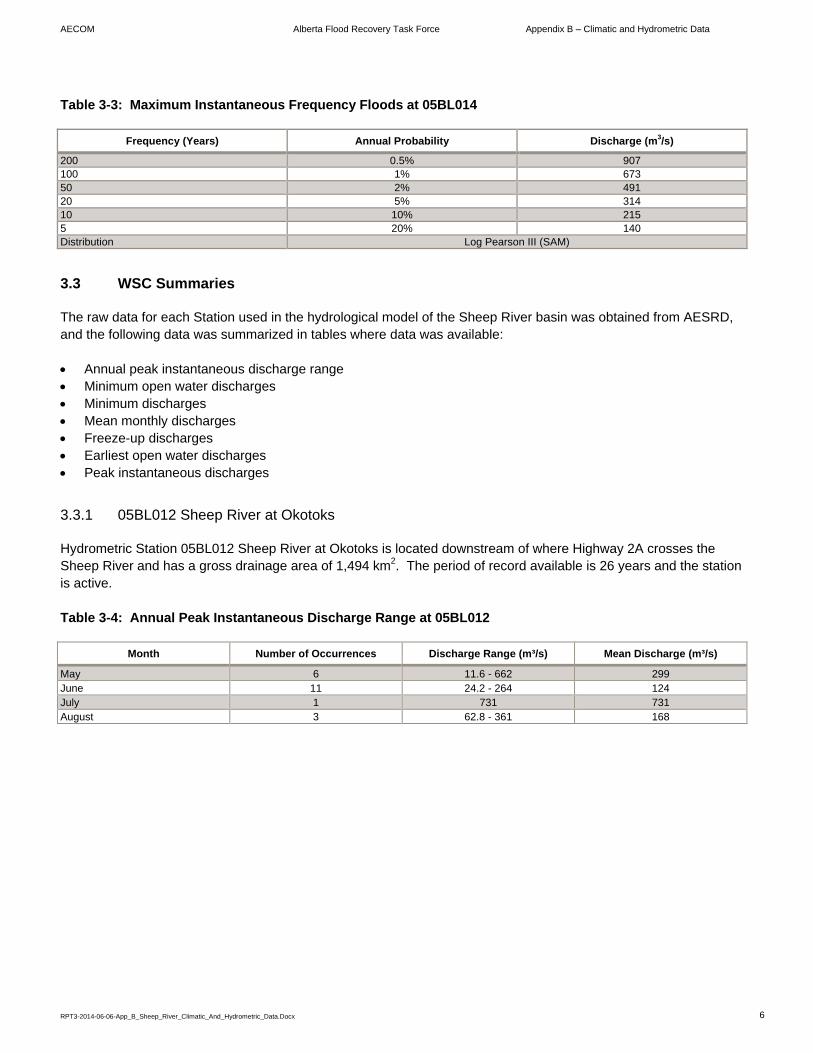
Table 3-3: Maximum Instantaneous Frequency Floods at 05BL014
Frequency (Years) Annual Probability Discharge (m3/s)
200 0.5% 907 100 1% 673 50 2% 491 20 5% 314 10 10% 215 5 20% 140 Distribution Log Pearson III (SAM)
3.3 WSC Summaries
The raw data for each Station used in the hydrological model of the Sheep River basin was obtained from AESRD, and the following data was summarized in tables where data was available: Annual peak instantaneous discharge range Minimum open water discharges Minimum discharges Mean monthly discharges Freeze-up discharges Earliest open water discharges Peak instantaneous discharges
3.3.1 05BL012 Sheep River at Okotoks
Hydrometric Station 05BL012 Sheep River at Okotoks is located downstream of where Highway 2A crosses the Sheep River and has a gross drainage area of 1,494 km2. The period of record available is 26 years and the station is active. Table 3-4: Annual Peak Instantaneous Discharge Range at 05BL012
Month Number of Occurrences Discharge Range (m³/s) Mean Discharge (m³/s)
May 6 11.6 - 662 299 June 11 24.2 - 264 124 July 1 731 731 August 3 62.8 - 361 168
AECOM Alberta Flood Recovery Task Force Appendix B – Climatic and Hydrometric Data
RPT3-2014-06-06-App_B_Sheep_River_Climatic_And_Hydrometric_Data.Docx 7
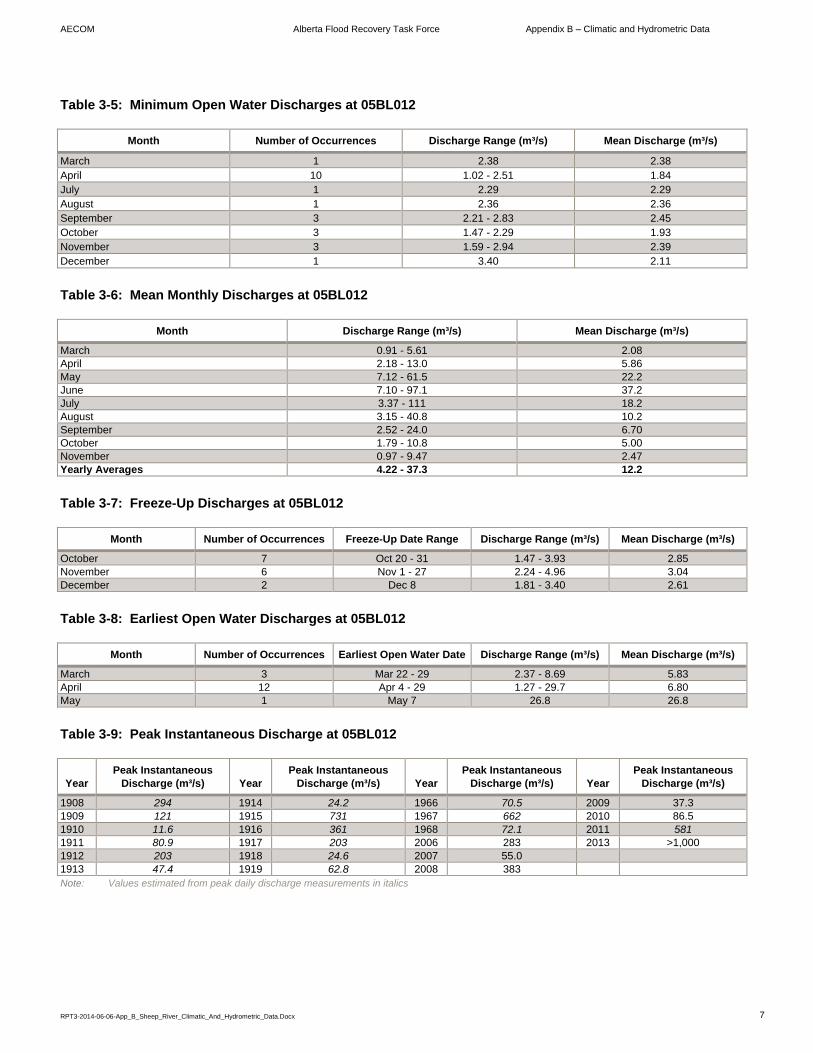
Table 3-5: Minimum Open Water Discharges at 05BL012
Month Number of Occurrences Discharge Range (m³/s) Mean Discharge (m³/s)
March 1 2.38 2.38 April 10 1.02 - 2.51 1.84 July 1 2.29 2.29 August 1 2.36 2.36 September 3 2.21 - 2.83 2.45 October 3 1.47 - 2.29 1.93 November 3 1.59 - 2.94 2.39 December 1 3.40 2.11
Table 3-6: Mean Monthly Discharges at 05BL012
Month Discharge Range (m³/s) Mean Discharge (m³/s)
March 0.91 - 5.61 2.08 April 2.18 - 13.0 5.86 May 7.12 - 61.5 22.2 June 7.10 - 97.1 37.2 July 3.37 - 111 18.2 August 3.15 - 40.8 10.2 September 2.52 - 24.0 6.70 October 1.79 - 10.8 5.00 November 0.97 - 9.47 2.47 Yearly Averages 4.22 - 37.3 12.2
Table 3-7: Freeze-Up Discharges at 05BL012
Month Number of Occurrences Freeze-Up Date Range Discharge Range (m³/s) Mean Discharge (m³/s)
October 7 Oct 20 - 31 1.47 - 3.93 2.85 November 6 Nov 1 - 27 2.24 - 4.96 3.04 December 2 Dec 8 1.81 - 3.40 2.61
Table 3-8: Earliest Open Water Discharges at 05BL012
Month Number of Occurrences Earliest Open Water Date Discharge Range (m³/s) Mean Discharge (m³/s)
March 3 Mar 22 - 29 2.37 - 8.69 5.83 April 12 Apr 4 - 29 1.27 - 29.7 6.80 May 1 May 7 26.8 26.8
Table 3-9: Peak Instantaneous Discharge at 05BL012
Year Peak Instantaneous
Discharge (m³/s) Year Peak Instantaneous
Discharge (m³/s) Year Peak Instantaneous
Discharge (m³/s) Year Peak Instantaneous
Discharge (m³/s)
1908 294 1914 24.2 1966 70.5 2009 37.3 1909 121 1915 731 1967 662 2010 86.5 1910 11.6 1916 361 1968 72.1 2011 581 1911 80.9 1917 203 2006 283 2013 >1,000 1912 203 1918 24.6 2007 55.0 1913 47.4 1919 62.8 2008 383 Note: Values estimated from peak daily discharge measurements in italics
AECOM Alberta Flood Recovery Task Force Appendix B – Climatic and Hydrometric Data
RPT3-2014-06-06-App_B_Sheep_River_Climatic_And_Hydrometric_Data.Docx 8
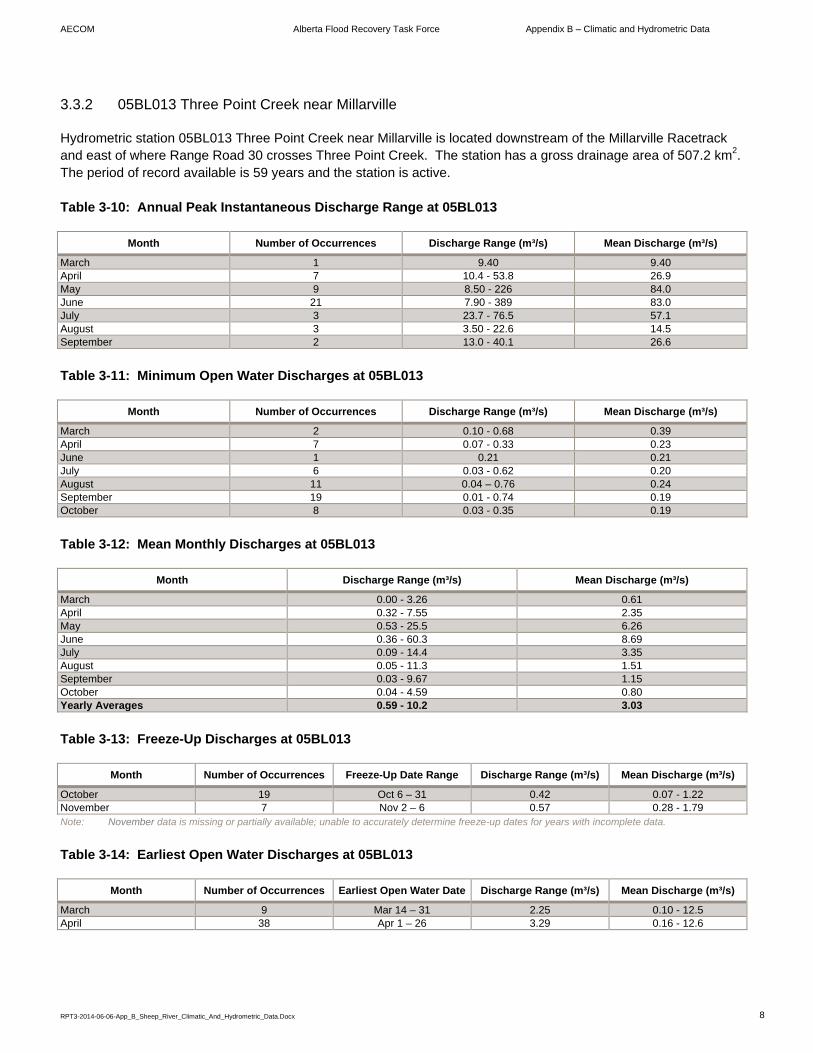
3.3.2 05BL013 Three Point Creek near Millarville
Hydrometric station 05BL013 Three Point Creek near Millarville is located downstream of the Millarville Racetrack and east of where Range Road 30 crosses Three Point Creek. The station has a gross drainage area of 507.2 km2. The period of record available is 59 years and the station is active. Table 3-10: Annual Peak Instantaneous Discharge Range at 05BL013
Month Number of Occurrences Discharge Range (m³/s) Mean Discharge (m³/s)
March 1 9.40 9.40 April 7 10.4 - 53.8 26.9 May 9 8.50 - 226 84.0 June 21 7.90 - 389 83.0 July 3 23.7 - 76.5 57.1 August 3 3.50 - 22.6 14.5 September 2 13.0 - 40.1 26.6
Table 3-11: Minimum Open Water Discharges at 05BL013
Month Number of Occurrences Discharge Range (m³/s) Mean Discharge (m³/s)
March 2 0.10 - 0.68 0.39 April 7 0.07 - 0.33 0.23 June 1 0.21 0.21 July 6 0.03 - 0.62 0.20 August 11 0.04 – 0.76 0.24 September 19 0.01 - 0.74 0.19 October 8 0.03 - 0.35 0.19
Table 3-12: Mean Monthly Discharges at 05BL013
Month Discharge Range (m³/s) Mean Discharge (m³/s)
March 0.00 - 3.26 0.61 April 0.32 - 7.55 2.35 May 0.53 - 25.5 6.26 June 0.36 - 60.3 8.69 July 0.09 - 14.4 3.35 August 0.05 - 11.3 1.51 September 0.03 - 9.67 1.15 October 0.04 - 4.59 0.80 Yearly Averages 0.59 - 10.2 3.03
Table 3-13: Freeze-Up Discharges at 05BL013
Month Number of Occurrences Freeze-Up Date Range Discharge Range (m³/s) Mean Discharge (m³/s)
October 19 Oct 6 – 31 0.42 0.07 - 1.22 November 7 Nov 2 – 6 0.57 0.28 - 1.79 Note: November data is missing or partially available; unable to accurately determine freeze-up dates for years with incomplete data.
Table 3-14: Earliest Open Water Discharges at 05BL013
Month Number of Occurrences Earliest Open Water Date Discharge Range (m³/s) Mean Discharge (m³/s)
March 9 Mar 14 – 31 2.25 0.10 - 12.5 April 38 Apr 1 – 26 3.29 0.16 - 12.6
AECOM Alberta Flood Recovery Task Force Appendix B – Climatic and Hydrometric Data
RPT3-2014-06-06-App_B_Sheep_River_Climatic_And_Hydrometric_Data.Docx 9
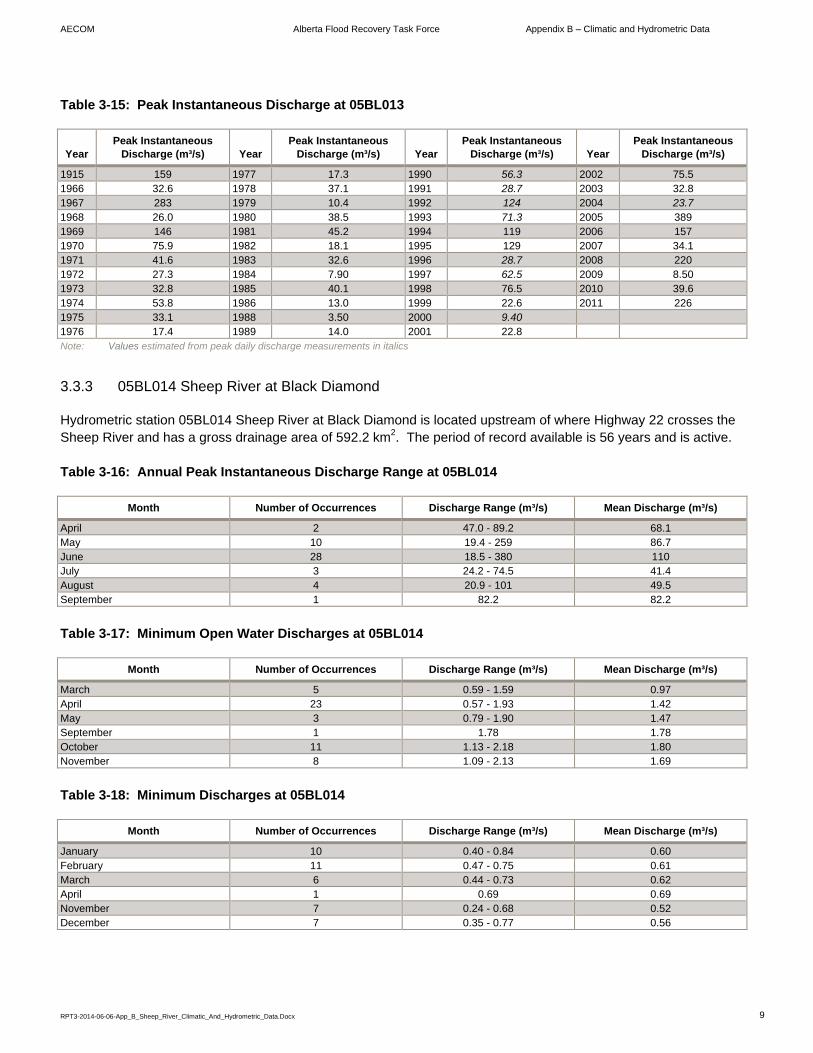
Table 3-15: Peak Instantaneous Discharge at 05BL013
Year Peak Instantaneous
Discharge (m³/s) Year Peak Instantaneous
Discharge (m³/s) Year Peak Instantaneous
Discharge (m³/s) Year Peak Instantaneous
Discharge (m³/s)
1915 159 1977 17.3 1990 56.3 2002 75.5 1966 32.6 1978 37.1 1991 28.7 2003 32.8 1967 283 1979 10.4 1992 124 2004 23.7 1968 26.0 1980 38.5 1993 71.3 2005 389 1969 146 1981 45.2 1994 119 2006 157 1970 75.9 1982 18.1 1995 129 2007 34.1 1971 41.6 1983 32.6 1996 28.7 2008 220 1972 27.3 1984 7.90 1997 62.5 2009 8.50 1973 32.8 1985 40.1 1998 76.5 2010 39.6 1974 53.8 1986 13.0 1999 22.6 2011 226 1975 33.1 1988 3.50 2000 9.40 1976 17.4 1989 14.0 2001 22.8 Note: Values estimated from peak daily discharge measurements in italics
3.3.3 05BL014 Sheep River at Black Diamond
Hydrometric station 05BL014 Sheep River at Black Diamond is located upstream of where Highway 22 crosses the Sheep River and has a gross drainage area of 592.2 km2. The period of record available is 56 years and is active. Table 3-16: Annual Peak Instantaneous Discharge Range at 05BL014
Month Number of Occurrences Discharge Range (m³/s) Mean Discharge (m³/s)
April 2 47.0 - 89.2 68.1 May 10 19.4 - 259 86.7 June 28 18.5 - 380 110 July 3 24.2 - 74.5 41.4 August 4 20.9 - 101 49.5 September 1 82.2 82.2
Table 3-17: Minimum Open Water Discharges at 05BL014
Month Number of Occurrences Discharge Range (m³/s) Mean Discharge (m³/s)
March 5 0.59 - 1.59 0.97 April 23 0.57 - 1.93 1.42 May 3 0.79 - 1.90 1.47 September 1 1.78 1.78 October 11 1.13 - 2.18 1.80 November 8 1.09 - 2.13 1.69
Table 3-18: Minimum Discharges at 05BL014
Month Number of Occurrences Discharge Range (m³/s) Mean Discharge (m³/s)
January 10 0.40 - 0.84 0.60 February 11 0.47 - 0.75 0.61 March 6 0.44 - 0.73 0.62 April 1 0.69 0.69 November 7 0.24 - 0.68 0.52 December 7 0.35 - 0.77 0.56
AECOM Alberta Flood Recovery Task Force Appendix B – Climatic and Hydrometric Data
RPT3-2014-06-06-App_B_Sheep_River_Climatic_And_Hydrometric_Data.Docx 10
Table 3-19: Mean Monthly Discharges at 05BL014
Month Discharge Range (m³/s) Mean Discharge (m³/s)
March 0.60 - 3.03 1.27 April 1.08 - 8.83 2.95 May 2.62 - 29.5 11.6 June 4.26 - 64.3 20.8 July 2.43 - 28.8 9.84 August 2.05 - 25.2 5.89 September 1.45 - 13.0 4.33 October 1.01 - 7.50 2.96 November 0.69 - 3.42 1.61 Yearly Averages 0.25 - 10.1 5.14
Table 3-20: Freeze-Up Discharges at 05BL014
Month Number of Occurrences Freeze-Up Date Range Discharge Range (m³/s) Mean Discharge (m³/s)
October 30 Oct 7 – 31 1.13 - 4.84 2.34 November 14 Nov 2 – 22 1.23 - 3.32 2.24
Table 3-21: Earliest Open Water Discharges at 05BL014
Month Number of Occurrences Earliest Open Water Date Discharge Range (m³/s) Mean Discharge (m³/s)
March 10 Mar 5 – 30 0.62 - 9.09 3.17 April 32 Apr 1 – 29 0.92 - 12.5 3.12 May 4 May 1 – 3 2.53 - 4.65 3.38 Note: Freeze and thaw dates from 1969 to 1984 are estimated from surrounding stations and river flow patterns
Table 3-22: Peak Instantaneous Discharge at 05BL014
Year Peak Instantaneous
Discharge (m³/s) Year Peak Instantaneous
Discharge (m³/s) Year Peak Instantaneous
Discharge (m³/s) Year Peak Instantaneous
Discharge (m³/s)
1911 101 1976 45.0 1989 19.4 2002 67.8 1912 74.8 1977 20.9 1990 207 2003 89.2 1913 36.5 1978 53.2 1991 60.7 2004 31.8 1914 19.3 1979 39.6 1992 150 2005 380 1915 214 1980 69.1 1993 161 2006 126 1916 328 1981 122 1994 81.6 2007 35.5 1969 151 1982 26.3 1995 366 2008 259 1970 195 1983 47.0 1996 40.0 2009 30.8 1971 92.0 1984 24.8 1997 63.9 2010 47.7 1972 45.9 1985 82.2 1998 121 2011 185 1973 39.4 1986 39.6 1999 25.3 2012 180 1974 55.8 1987 24.2 2000 18.5 2013 720 1975 104 1988 29.4 2001 35.8 Note: Values estimated from peak daily discharge measurements in italics
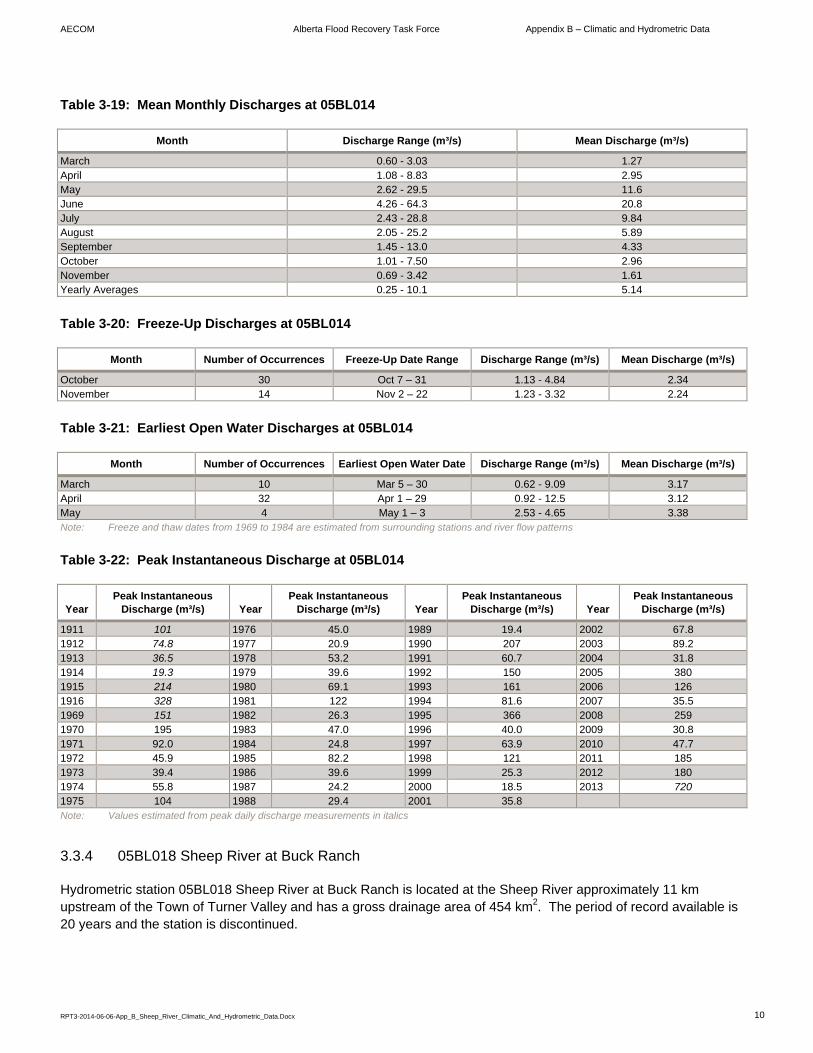
3.3.4 05BL018 Sheep River at Buck Ranch
Hydrometric station 05BL018 Sheep River at Buck Ranch is located at the Sheep River approximately 11 km upstream of the Town of Turner Valley and has a gross drainage area of 454 km2. The period of record available is 20 years and the station is discontinued.
AECOM Alberta Flood Recovery Task Force Appendix B – Climatic and Hydrometric Data
RPT3-2014-06-06-App_B_Sheep_River_Climatic_And_Hydrometric_Data.Docx 11
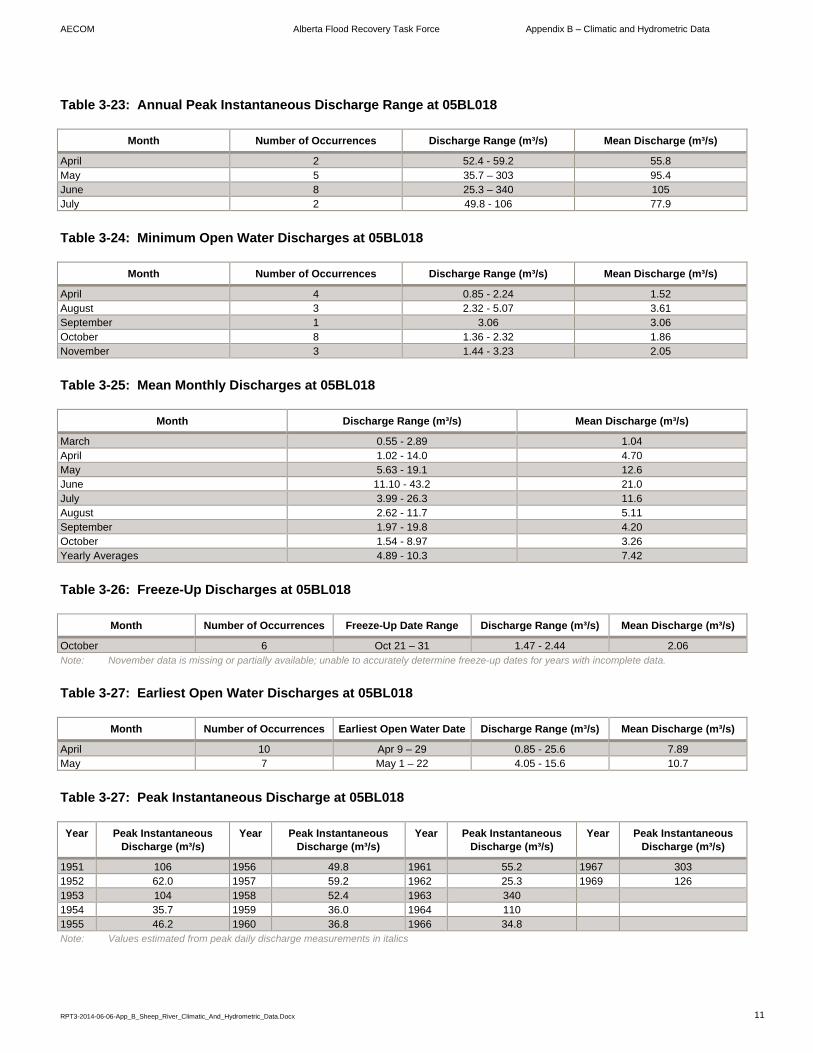
Table 3-23: Annual Peak Instantaneous Discharge Range at 05BL018
Month Number of Occurrences Discharge Range (m³/s) Mean Discharge (m³/s)
April 2 52.4 - 59.2 55.8 May 5 35.7 – 303 95.4 June 8 25.3 – 340 105 July 2 49.8 - 106 77.9
Table 3-24: Minimum Open Water Discharges at 05BL018
Month Number of Occurrences Discharge Range (m³/s) Mean Discharge (m³/s)
April 4 0.85 - 2.24 1.52 August 3 2.32 - 5.07 3.61 September 1 3.06 3.06 October 8 1.36 - 2.32 1.86 November 3 1.44 - 3.23 2.05
Table 3-25: Mean Monthly Discharges at 05BL018
Month Discharge Range (m³/s) Mean Discharge (m³/s)
March 0.55 - 2.89 1.04 April 1.02 - 14.0 4.70 May 5.63 - 19.1 12.6 June 11.10 - 43.2 21.0 July 3.99 - 26.3 11.6 August 2.62 - 11.7 5.11 September 1.97 - 19.8 4.20 October 1.54 - 8.97 3.26 Yearly Averages 4.89 - 10.3 7.42
Table 3-26: Freeze-Up Discharges at 05BL018
Month Number of Occurrences Freeze-Up Date Range Discharge Range (m³/s) Mean Discharge (m³/s)
October 6 Oct 21 – 31 1.47 - 2.44 2.06 Note: November data is missing or partially available; unable to accurately determine freeze-up dates for years with incomplete data.
Table 3-27: Earliest Open Water Discharges at 05BL018
Month Number of Occurrences Earliest Open Water Date Discharge Range (m³/s) Mean Discharge (m³/s)
April 10 Apr 9 – 29 0.85 - 25.6 7.89 May 7 May 1 – 22 4.05 - 15.6 10.7
Table 3-27: Peak Instantaneous Discharge at 05BL018
Year Peak Instantaneous Discharge (m³/s)
Year Peak Instantaneous Discharge (m³/s)
Year Peak Instantaneous Discharge (m³/s)
Year Peak Instantaneous Discharge (m³/s)
1951 106 1956 49.8 1961 55.2 1967 303 1952 62.0 1957 59.2 1962 25.3 1969 126 1953 104 1958 52.4 1963 340 1954 35.7 1959 36.0 1964 110 1955 46.2 1960 36.8 1966 34.8 Note: Values estimated from peak daily discharge measurements in italics
AECOM Alberta Flood Recovery Task Force Appendix B – Climatic and Hydrometric Data
RPT3-2014-06-06-App_B_Sheep_River_Climatic_And_Hydrometric_Data.Docx 12
4. References
Environment Canada. (n.d.) Climate Normals. Retrieved February 2014, from ftp://ftp.tor.ec.gc.ca/Pub/Normals/ ENGLISH/ALTA/
Alberta Agriculture and Rural Development. (n.d.) Current and Historical Weather Station Data Viewer - Retrieved
January 2014, from http://agriculture.alberta.ca/acis/alberta-weather-data-viewer.jsp Environment Canada (n.d.) Water Survey of Canada Hydrometric Data. Retrieved February 2014, from
http:/wsc.ec.gc.ca/applications/H2O/index-eng.cfm Environment Canada. (n.d.) Water Office. Retrieved February 2014, from http://wateroffice.ec.gc.ca/google_map/
google_map_e.html?search_by=p&province=AB