Embed Size (px)
Citation preview
Appendix AThe GAGE Application
Appendix Table of Contents
INTRODUCTION . . . . . . . . . . . . . . . . . . . . . . . . . . . . . . . .1809Terminology . . . . . . . . . . . . . . . . . . . . . . . . . . . . . . . . . . .1810
GETTING STARTED . . . . . . . . . . . . . . . . . . . . . . . . . . . . . .1811Invoking the GAGE Application . . . . . . . . . . . . . . . . . . . . . . . .1811Entering Data . . . . . . . . . . . . . . . . . . . . . . . . . . . . . . . . . .1813Performing a Range Chart Analysis . . . . . . . . . . . . . . . . . . . . . .1815Performing an Average Chart Analysis . . . . . . . . . . . . . . . . . . . . .1817Selecting a Statistical Method . . . . . . . . . . . . . . . . . . . . . . . . .1818Performing an Average and Range Analysis . . . . . . . . . . . . . . . . . .1818Performing a Variance Components Analysis .. . . . . . . . . . . . . . . .1820Saving the Data . . . . . . . . . . . . . . . . . . . . . . . . . . . . . . . . .1821Entering Another Set of Data . . . . . . . . . . . . . . . . . . . . . . . . . .1822Reading Data from a Data Set . . . . . . . . . . . . . . . . . . . . . . . . .1822
DETAILS . . . . . . . . . . . . . . . . . . . . . . . . . . . . . . . . . . . . .1824Range Chart . . . . . . . . . . . . . . . . . . . . . . . . . . . . . . . . . . .1824Average Chart . . . . . . . . . . . . . . . . . . . . . . . . . . . . . . . . . .1824Average and Range Method . . . . . . . . . . . . . . . . . . . . . . . . . . .1825Variance Components Method . . .. . . . . . . . . . . . . . . . . . . . . .1828Creating a Data Set Outside the GAGE Application . . . . . . . . . . . . . .1831Extensibility of the Application . . .. . . . . . . . . . . . . . . . . . . . . .1834

Part 10. The CAPABILITY Procedure
SAS OnlineDoc: Version 81808
Appendix AThe GAGE Application
This appendix describes the GAGE application, which is a tool for assessing gagerepeatability and reproducibility (R&R). The GAGE application is available with Re-lease 6.10 of the SAS/QC Sample Library.
IntroductionMeasurement systems are essential to the quality of a manufacturing process. Thegages or instruments that take measurements are subject to variation. Too much vari-ation in the measurement system may mask variation in the process.
One type of measurement variation is caused by conditions inherent in gages. Thisvariation, known as repeatability, is obtained when one person measures the samecharacteristic several times with the same gage. Another type of measurement vari-ation, known as reproducibility, occurs when different individuals measure the samecharacteristic with the same gage. Other sources of measurement variation includepart-to-part variation, accuracy, stability, and linearity.
Two graphical methods for evaluating the measurement system are range charts andaverage charts. Range charts assess repeatability by showing whether the gage vari-ability is consistent. Average charts show consistency of operator variability (repro-ducibility) and part-to-part variation.
Two statistical approaches to determining gage R&R are the average and rangemethod and the variance components method. The variance components method canprovide more information, is more accurate, and is more flexible than the average andrange method.
The GAGE application makes it easy for you to enter your data, create range andaverage charts, and determine gage R&R. Whether you use the average and rangemethod or the more powerful variance components method, the GAGE applicationreports the results in a standard form. It allows you to save the graphs for laterreference, and it allows you to save the reports. You can save the data in a SAS data setfor subsequent gage analysis or for more extensive analysis using other componentsof the SAS System. Because gage R&R techniques are open to local interpretation,this application has been designed so that it can be modified to suit the needs of yourcompany.
Part 10. The CAPABILITY Procedure
Terminology
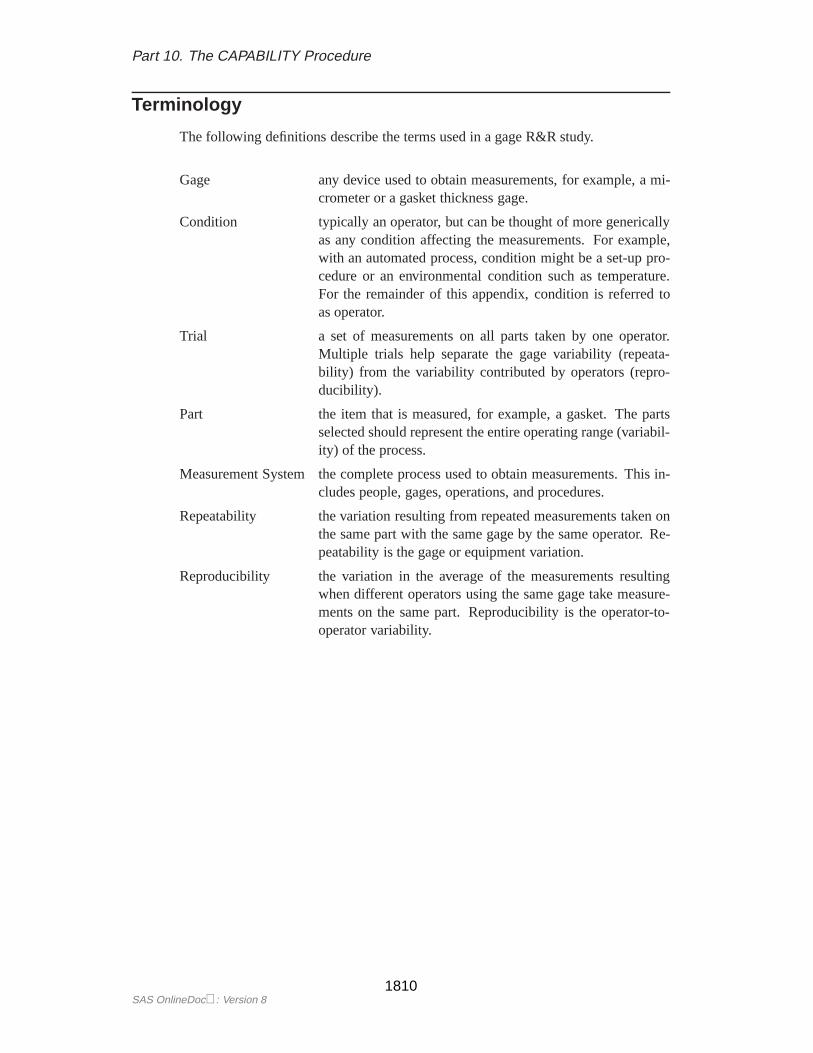
The following definitions describe the terms used in a gage R&R study.
Gage any device used to obtain measurements, for example, a mi-crometer or a gasket thickness gage.
Condition typically an operator, but can be thought of more genericallyas any condition affecting the measurements. For example,with an automated process, condition might be a set-up pro-cedure or an environmental condition such as temperature.For the remainder of this appendix, condition is referred toas operator.
Trial a set of measurements on all parts taken by one operator.Multiple trials help separate the gage variability (repeata-bility) from the variability contributed by operators (repro-ducibility).
Part the item that is measured, for example, a gasket. The partsselected should represent the entire operating range (variabil-ity) of the process.
Measurement System the complete process used to obtain measurements. This in-cludes people, gages, operations, and procedures.
Repeatability the variation resulting from repeated measurements taken onthe same part with the same gage by the same operator. Re-peatability is the gage or equipment variation.
Reproducibility the variation in the average of the measurements resultingwhen different operators using the same gage take measure-ments on the same part. Reproducibility is the operator-to-operator variability.
SAS OnlineDoc: Version 81810
Appendix A. Getting Started
Getting Started
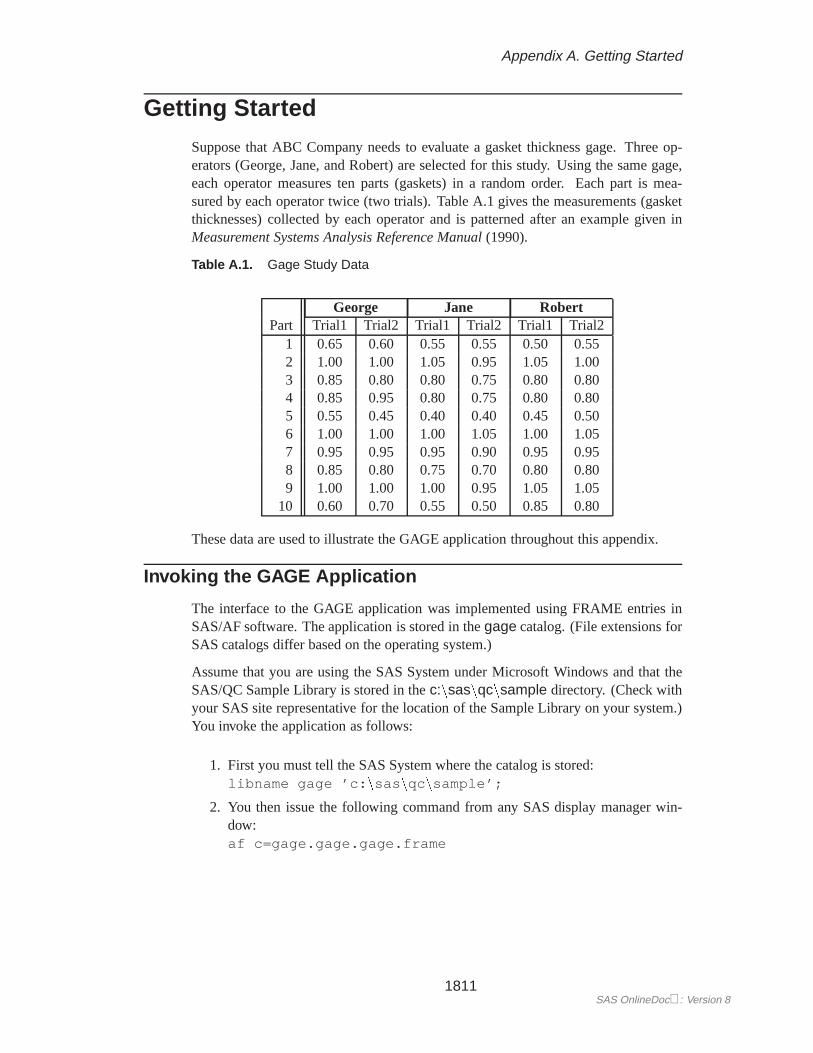
Suppose that ABC Company needs to evaluate a gasket thickness gage. Three op-erators (George, Jane, and Robert) are selected for this study. Using the same gage,each operator measures ten parts (gaskets) in a random order. Each part is mea-sured by each operator twice (two trials). Table A.1 gives the measurements (gasketthicknesses) collected by each operator and is patterned after an example given inMeasurement Systems Analysis Reference Manual(1990).
Table A.1. Gage Study Data
George Jane RobertPart Trial1 Trial2 Trial1 Trial2 Trial1 Trial2
1 0.65 0.60 0.55 0.55 0.50 0.552 1.00 1.00 1.05 0.95 1.05 1.003 0.85 0.80 0.80 0.75 0.80 0.804 0.85 0.95 0.80 0.75 0.80 0.805 0.55 0.45 0.40 0.40 0.45 0.506 1.00 1.00 1.00 1.05 1.00 1.057 0.95 0.95 0.95 0.90 0.95 0.958 0.85 0.80 0.75 0.70 0.80 0.809 1.00 1.00 1.00 0.95 1.05 1.05
10 0.60 0.70 0.55 0.50 0.85 0.80
These data are used to illustrate the GAGE application throughout this appendix.
Invoking the GAGE Application
The interface to the GAGE application was implemented using FRAME entries inSAS/AF software. The application is stored in thegage catalog. (File extensions forSAS catalogs differ based on the operating system.)
Assume that you are using the SAS System under Microsoft Windows and that theSAS/QC Sample Library is stored in thec:nsasnqcnsample directory. (Check withyour SAS site representative for the location of the Sample Library on your system.)You invoke the application as follows:
1. First you must tell the SAS System where the catalog is stored:libname gage ’c: nsas nqc nsample’;
2. You then issue the following command from any SAS display manager win-dow:af c=gage.gage.gage.frame
1811SAS OnlineDoc: Version 8
Part 10. The CAPABILITY Procedure
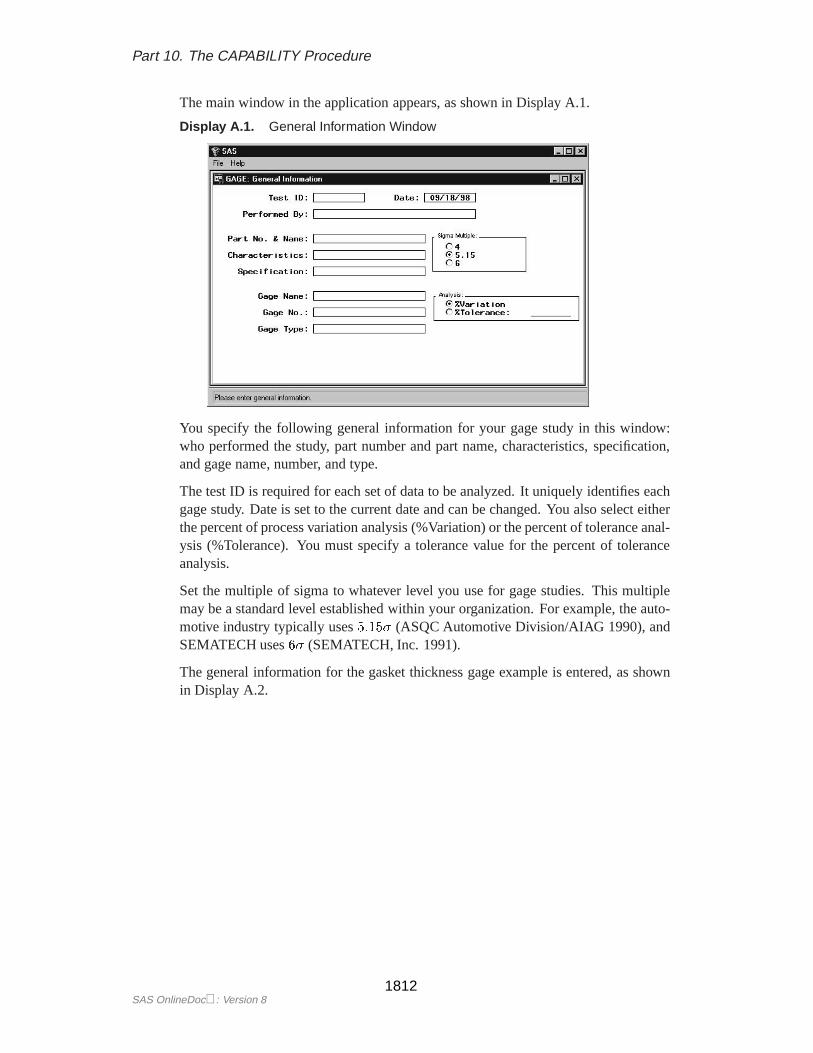
The main window in the application appears, as shown in Display A.1.
Display A.1. General Information Window
You specify the following general information for your gage study in this window:who performed the study, part number and part name, characteristics, specification,and gage name, number, and type.
The test ID is required for each set of data to be analyzed. It uniquely identifies eachgage study. Date is set to the current date and can be changed. You also select eitherthe percent of process variation analysis (%Variation) or the percent of tolerance anal-ysis (%Tolerance). You must specify a tolerance value for the percent of toleranceanalysis.
Set the multiple of sigma to whatever level you use for gage studies. This multiplemay be a standard level established within your organization. For example, the auto-motive industry typically uses5:15� (ASQC Automotive Division/AIAG 1990), andSEMATECH uses6� (SEMATECH, Inc. 1991).
The general information for the gasket thickness gage example is entered, as shownin Display A.2.
SAS OnlineDoc: Version 81812
Appendix A. Getting Started
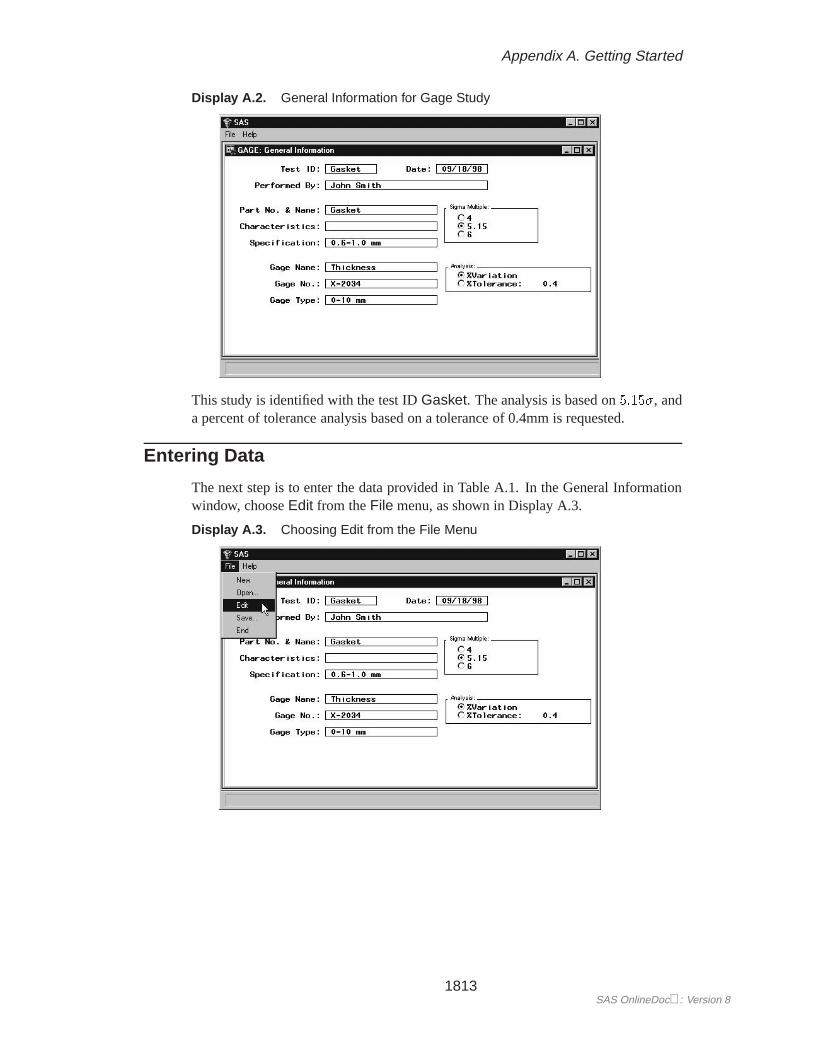
Display A.2. General Information for Gage Study
This study is identified with the test IDGasket. The analysis is based on5:15�, anda percent of tolerance analysis based on a tolerance of 0.4mm is requested.
Entering Data
The next step is to enter the data provided in Table A.1. In the General Informationwindow, chooseEdit from theFile menu, as shown in Display A.3.
Display A.3. Choosing Edit from the File Menu
1813SAS OnlineDoc: Version 8
Part 10. The CAPABILITY Procedure
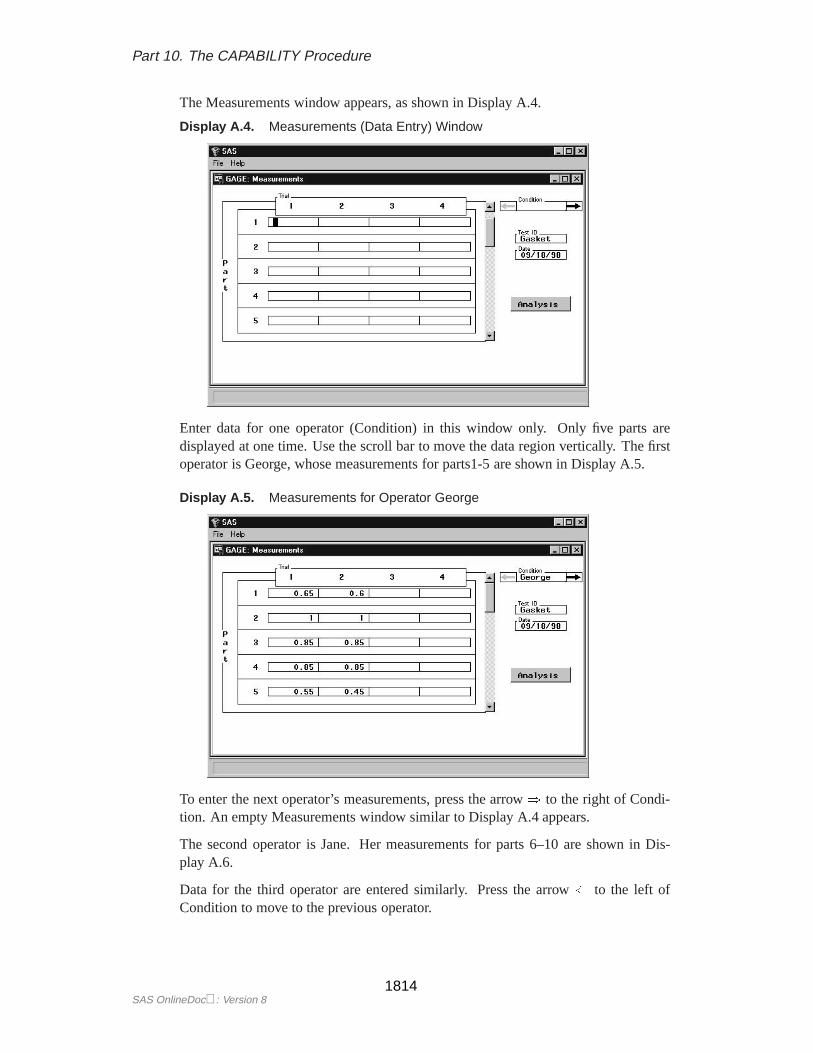
The Measurements window appears, as shown in Display A.4.
Display A.4. Measurements (Data Entry) Window
Enter data for one operator (Condition) in this window only. Only five parts aredisplayed at one time. Use the scroll bar to move the data region vertically. The firstoperator is George, whose measurements for parts1-5 are shown in Display A.5.
Display A.5. Measurements for Operator George
To enter the next operator’s measurements, press the arrow) to the right of Condi-tion. An empty Measurements window similar to Display A.4 appears.
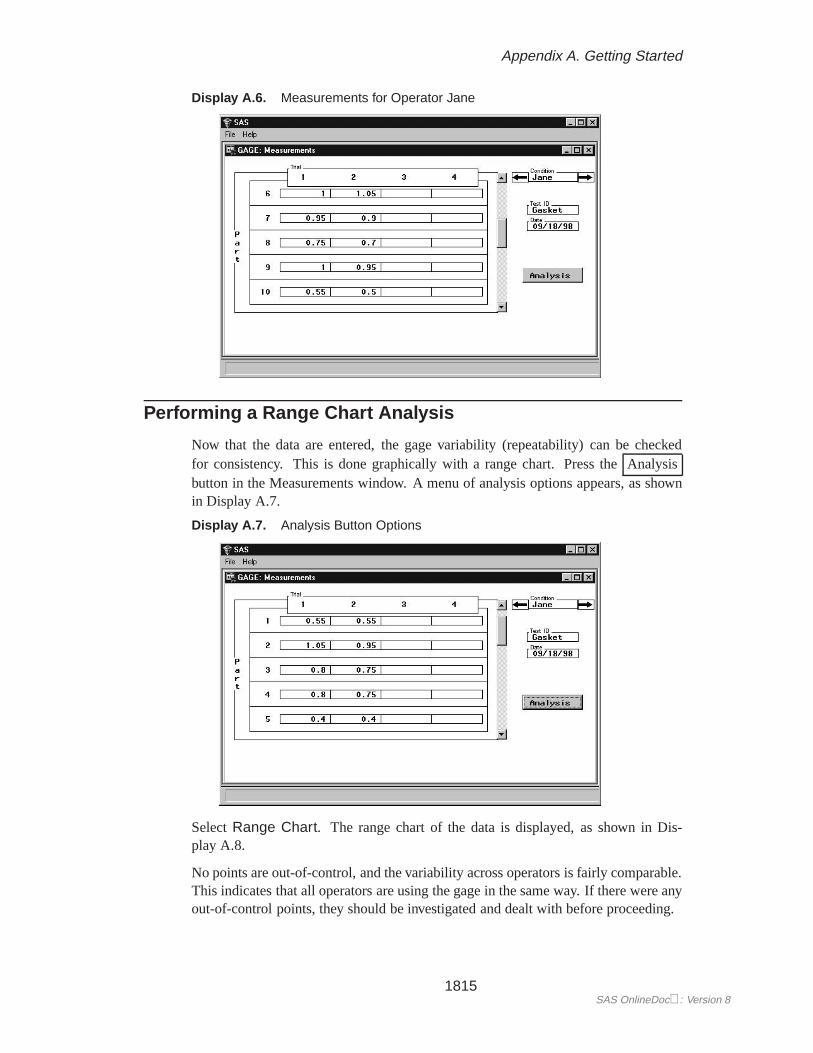
The second operator is Jane. Her measurements for parts 6–10 are shown in Dis-play A.6.
Data for the third operator are entered similarly. Press the arrow( to the left ofCondition to move to the previous operator.
SAS OnlineDoc: Version 81814
Appendix A. Getting Started
Display A.6. Measurements for Operator Jane
Performing a Range Chart Analysis
Now that the data are entered, the gage variability (repeatability) can be checkedfor consistency. This is done graphically with a range chart. Press theAnalysisbutton in the Measurements window. A menu of analysis options appears, as shownin Display A.7.
Display A.7. Analysis Button Options
SelectRange Chart. The range chart of the data is displayed, as shown in Dis-play A.8.
No points are out-of-control, and the variability across operators is fairly comparable.This indicates that all operators are using the gage in the same way. If there were anyout-of-control points, they should be investigated and dealt with before proceeding.
1815SAS OnlineDoc: Version 8
Part 10. The CAPABILITY Procedure
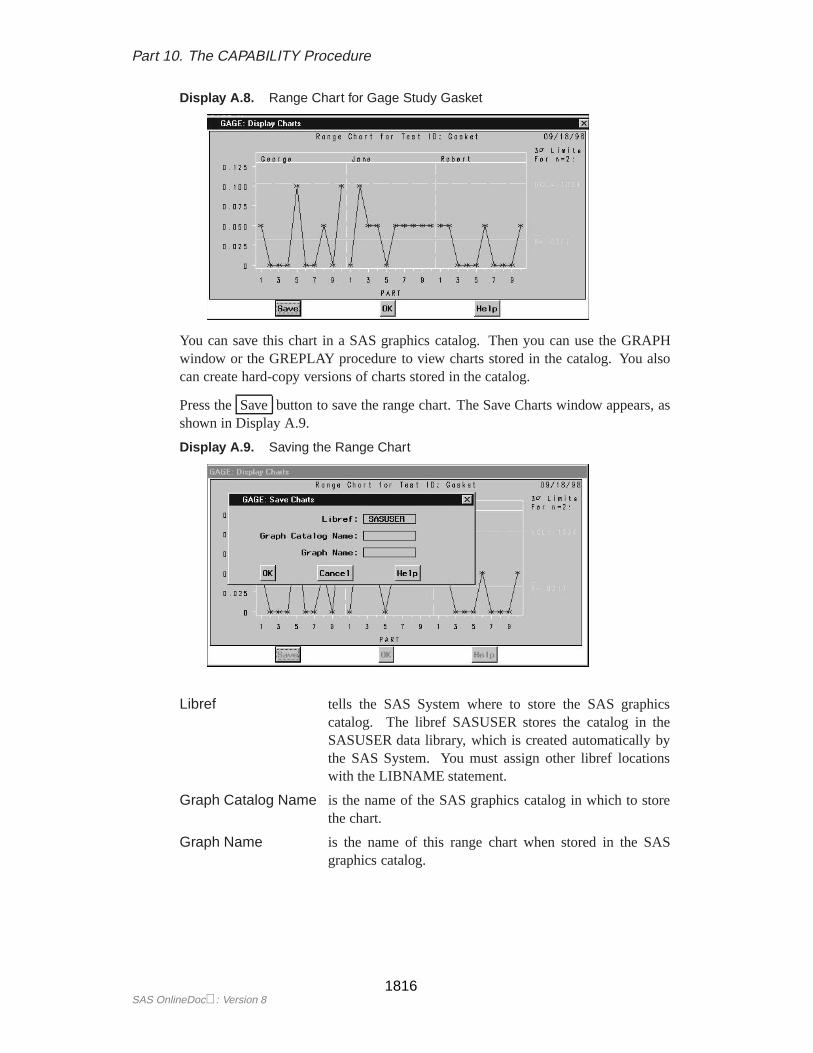
Display A.8. Range Chart for Gage Study Gasket
You can save this chart in a SAS graphics catalog. Then you can use the GRAPHwindow or the GREPLAY procedure to view charts stored in the catalog. You alsocan create hard-copy versions of charts stored in the catalog.
Press theSave button to save the range chart. The Save Charts window appears, asshown in Display A.9.
Display A.9. Saving the Range Chart
Libref tells the SAS System where to store the SAS graphicscatalog. The libref SASUSER stores the catalog in theSASUSER data library, which is created automatically bythe SAS System. You must assign other libref locationswith the LIBNAME statement.
Graph Catalog Name is the name of the SAS graphics catalog in which to storethe chart.
Graph Name is the name of this range chart when stored in the SASgraphics catalog.
SAS OnlineDoc: Version 81816
Appendix A. Getting Started
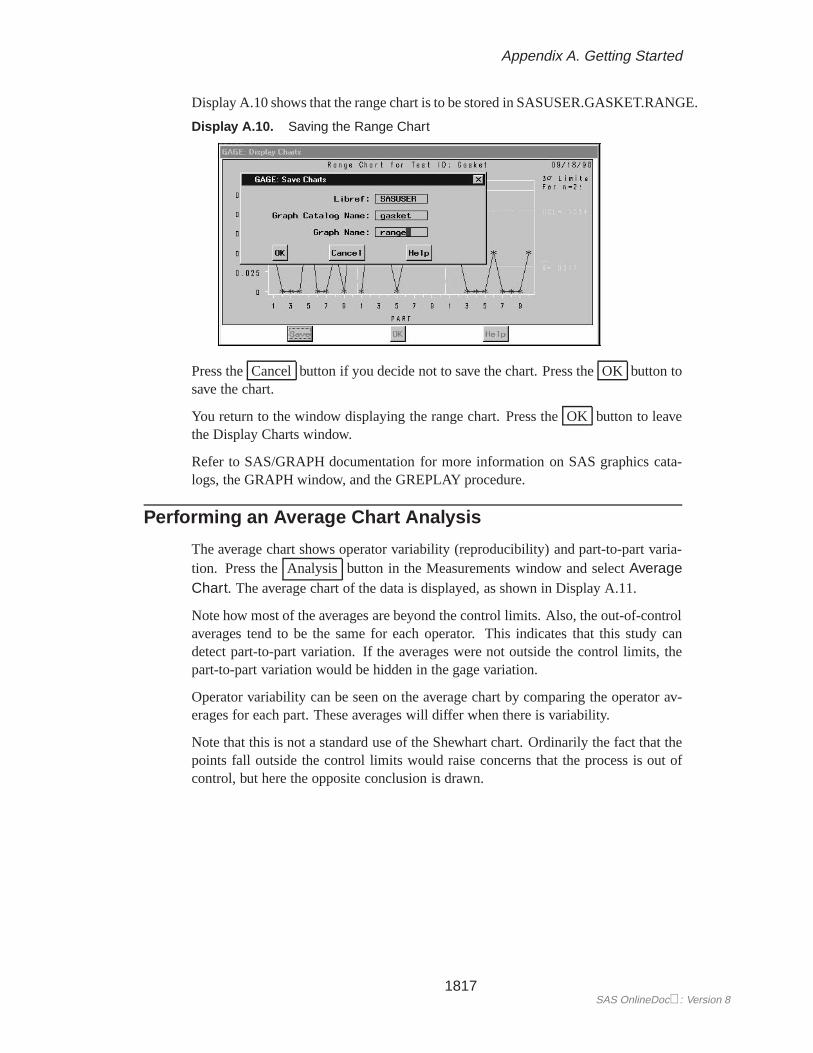
Display A.10 shows that the range chart is to be stored in SASUSER.GASKET.RANGE.
Display A.10. Saving the Range Chart
Press theCancel button if you decide not to save the chart. Press theOK button tosave the chart.
You return to the window displaying the range chart. Press theOK button to leavethe Display Charts window.
Refer to SAS/GRAPH documentation for more information on SAS graphics cata-logs, the GRAPH window, and the GREPLAY procedure.
Performing an Average Chart Analysis
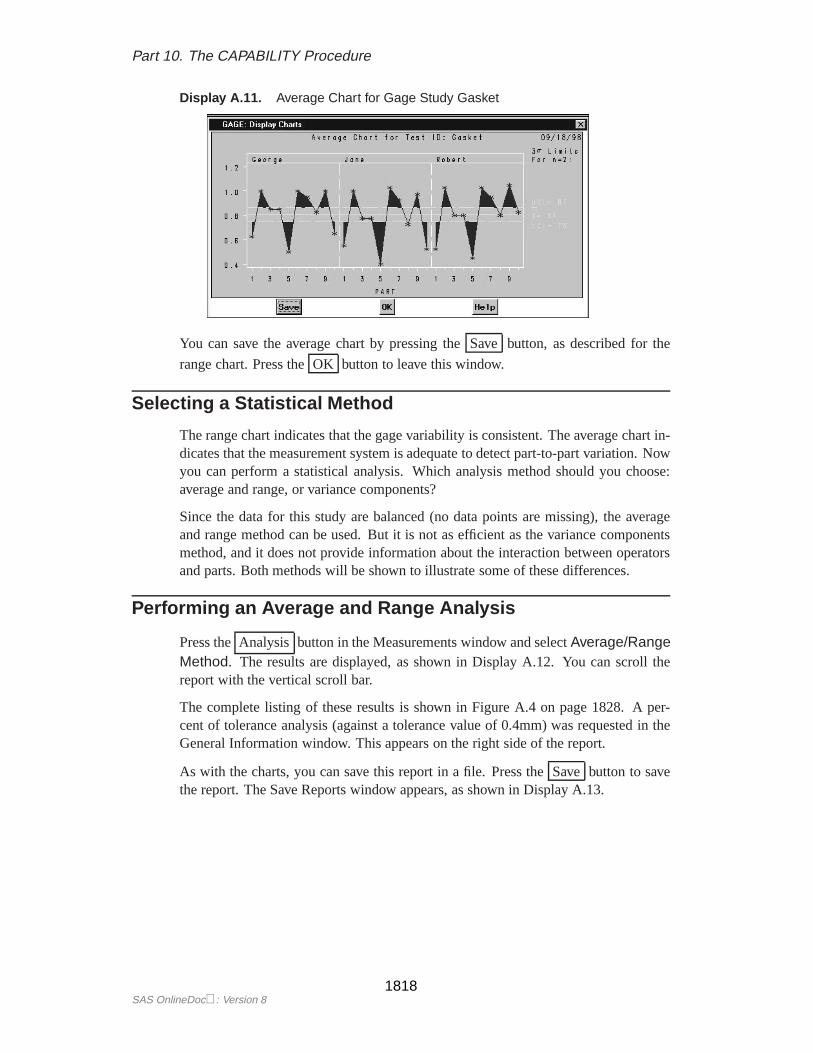
The average chart shows operator variability (reproducibility) and part-to-part varia-tion. Press theAnalysis button in the Measurements window and selectAverageChart. The average chart of the data is displayed, as shown in Display A.11.
Note how most of the averages are beyond the control limits. Also, the out-of-controlaverages tend to be the same for each operator. This indicates that this study candetect part-to-part variation. If the averages were not outside the control limits, thepart-to-part variation would be hidden in the gage variation.
Operator variability can be seen on the average chart by comparing the operator av-erages for each part. These averages will differ when there is variability.
Note that this is not a standard use of the Shewhart chart. Ordinarily the fact that thepoints fall outside the control limits would raise concerns that the process is out ofcontrol, but here the opposite conclusion is drawn.
1817SAS OnlineDoc: Version 8
Part 10. The CAPABILITY Procedure
Display A.11. Average Chart for Gage Study Gasket
You can save the average chart by pressing theSave button, as described for the
range chart. Press theOK button to leave this window.
Selecting a Statistical Method
The range chart indicates that the gage variability is consistent. The average chart in-dicates that the measurement system is adequate to detect part-to-part variation. Nowyou can perform a statistical analysis. Which analysis method should you choose:average and range, or variance components?
Since the data for this study are balanced (no data points are missing), the averageand range method can be used. But it is not as efficient as the variance componentsmethod, and it does not provide information about the interaction between operatorsand parts. Both methods will be shown to illustrate some of these differences.
Performing an Average and Range Analysis
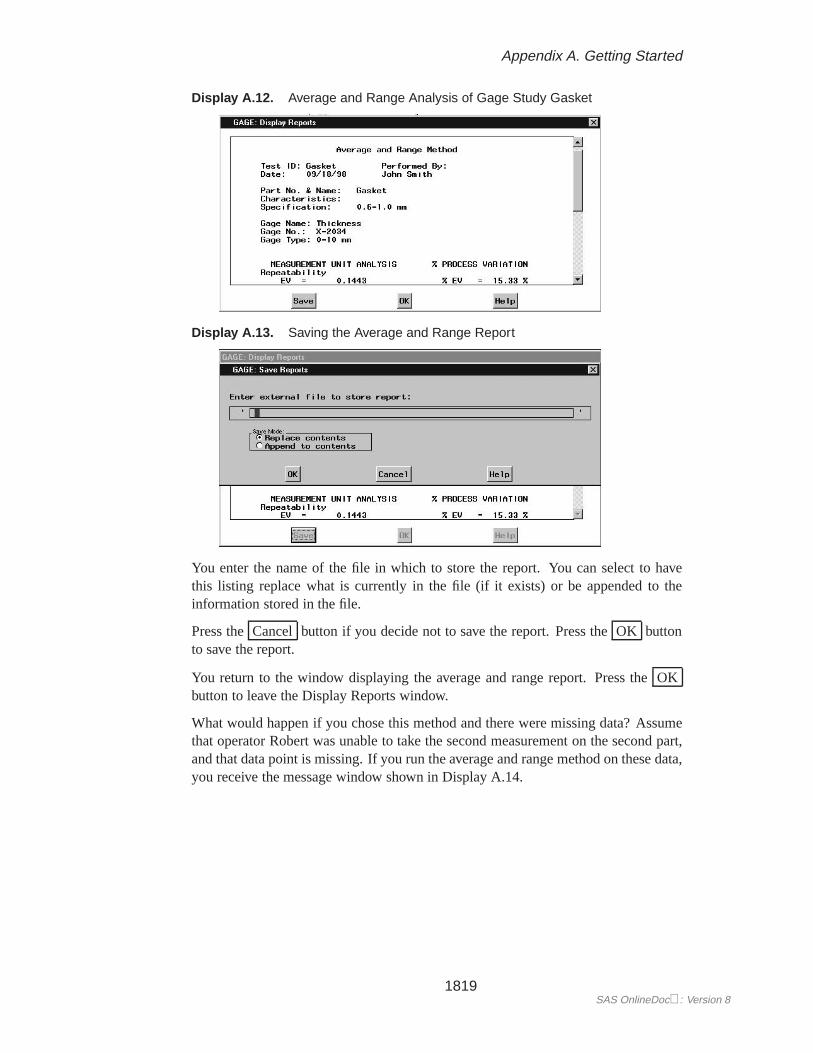
Press theAnalysis button in the Measurements window and selectAverage/RangeMethod. The results are displayed, as shown in Display A.12. You can scroll thereport with the vertical scroll bar.
The complete listing of these results is shown in Figure A.4 on page 1828. A per-cent of tolerance analysis (against a tolerance value of 0.4mm) was requested in theGeneral Information window. This appears on the right side of the report.
As with the charts, you can save this report in a file. Press theSave button to savethe report. The Save Reports window appears, as shown in Display A.13.
SAS OnlineDoc: Version 81818
Appendix A. Getting Started
Display A.12. Average and Range Analysis of Gage Study Gasket
Display A.13. Saving the Average and Range Report
You enter the name of the file in which to store the report. You can select to havethis listing replace what is currently in the file (if it exists) or be appended to theinformation stored in the file.
Press theCancel button if you decide not to save the report. Press theOK buttonto save the report.
You return to the window displaying the average and range report. Press theOKbutton to leave the Display Reports window.
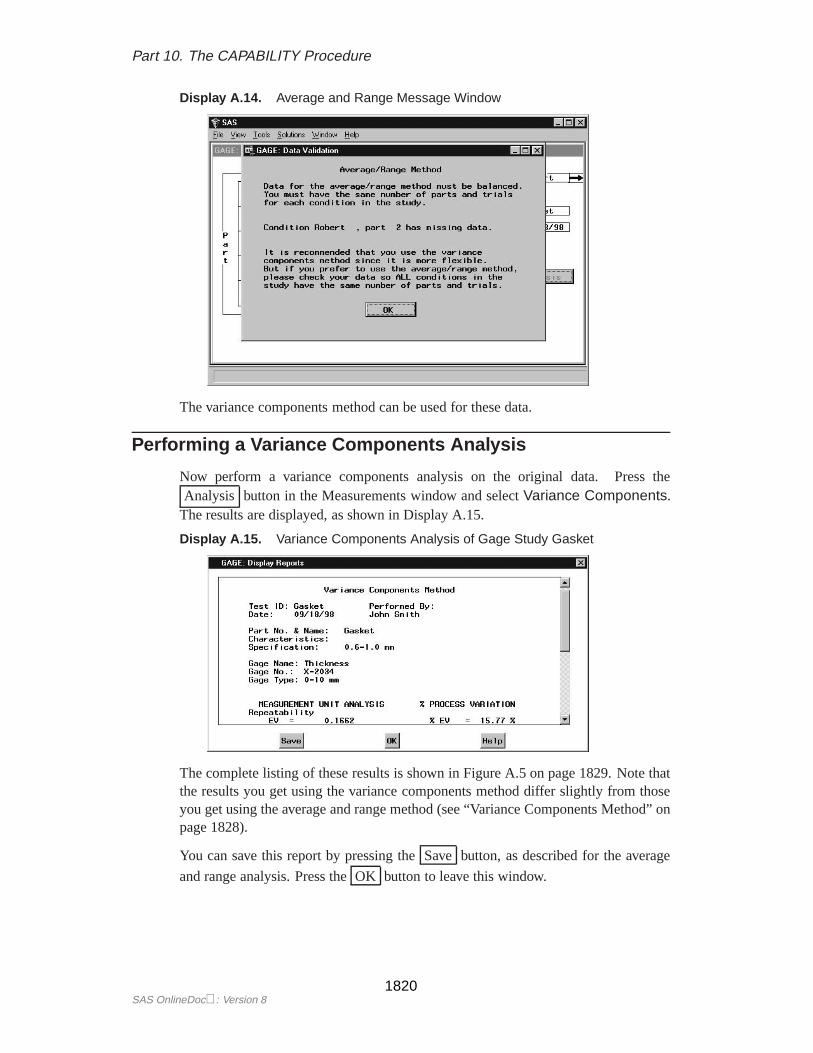
What would happen if you chose this method and there were missing data? Assumethat operator Robert was unable to take the second measurement on the second part,and that data point is missing. If you run the average and range method on these data,you receive the message window shown in Display A.14.
1819SAS OnlineDoc: Version 8
Part 10. The CAPABILITY Procedure
Display A.14. Average and Range Message Window
The variance components method can be used for these data.
Performing a Variance Components Analysis
Now perform a variance components analysis on the original data. Press theAnalysis button in the Measurements window and selectVariance Components.
The results are displayed, as shown in Display A.15.
Display A.15. Variance Components Analysis of Gage Study Gasket
The complete listing of these results is shown in Figure A.5 on page 1829. Note thatthe results you get using the variance components method differ slightly from thoseyou get using the average and range method (see “Variance Components Method” onpage 1828).
You can save this report by pressing theSave button, as described for the average
and range analysis. Press theOK button to leave this window.
SAS OnlineDoc: Version 81820
Appendix A. Getting Started
Saving the Data
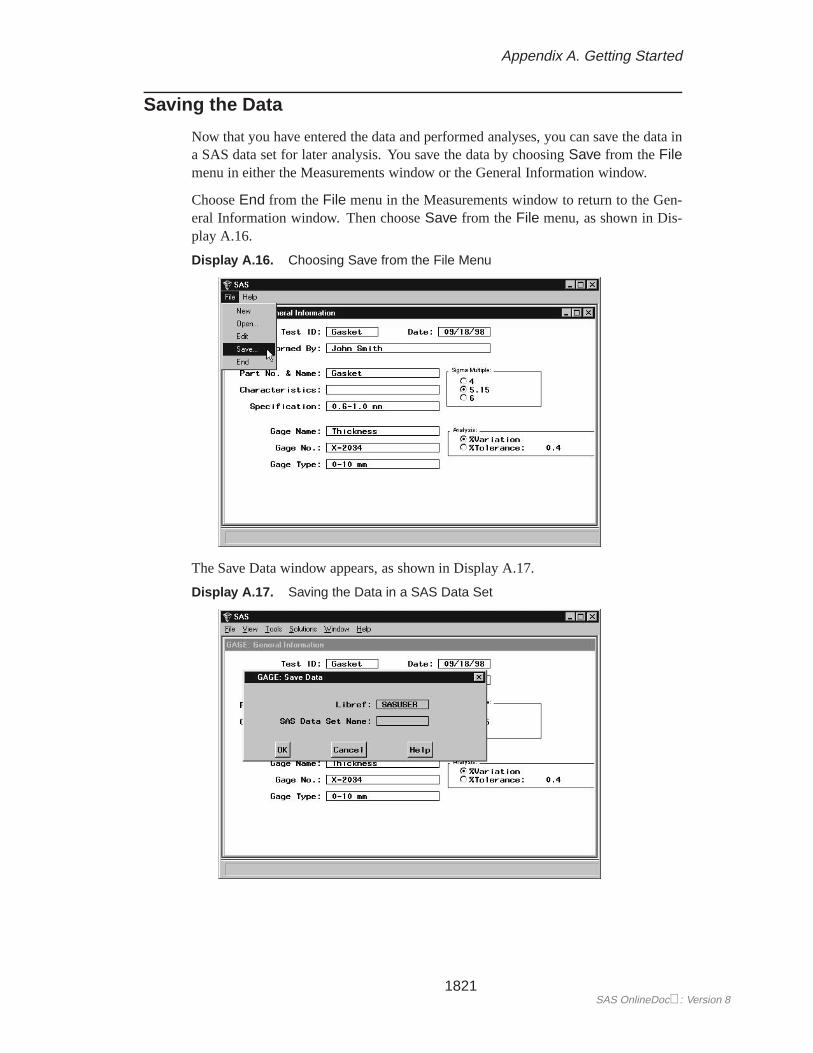
Now that you have entered the data and performed analyses, you can save the data ina SAS data set for later analysis. You save the data by choosingSave from theFilemenu in either the Measurements window or the General Information window.
ChooseEnd from theFile menu in the Measurements window to return to the Gen-eral Information window. Then chooseSave from theFile menu, as shown in Dis-play A.16.
Display A.16. Choosing Save from the File Menu
The Save Data window appears, as shown in Display A.17.
Display A.17. Saving the Data in a SAS Data Set
1821SAS OnlineDoc: Version 8
Part 10. The CAPABILITY Procedure
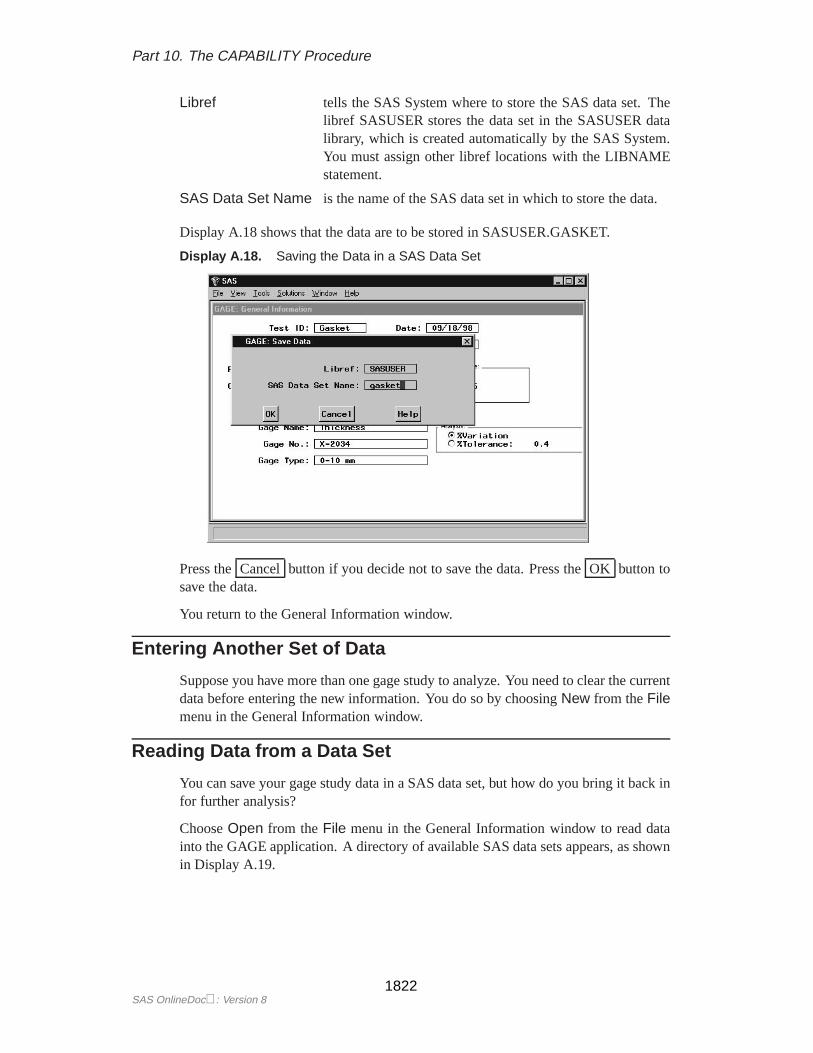
Libref tells the SAS System where to store the SAS data set. Thelibref SASUSER stores the data set in the SASUSER datalibrary, which is created automatically by the SAS System.You must assign other libref locations with the LIBNAMEstatement.
SAS Data Set Name is the name of the SAS data set in which to store the data.
Display A.18 shows that the data are to be stored in SASUSER.GASKET.
Display A.18. Saving the Data in a SAS Data Set
Press theCancel button if you decide not to save the data. Press theOK button tosave the data.
You return to the General Information window.
Entering Another Set of Data
Suppose you have more than one gage study to analyze. You need to clear the currentdata before entering the new information. You do so by choosingNew from theFilemenu in the General Information window.
Reading Data from a Data Set
You can save your gage study data in a SAS data set, but how do you bring it back infor further analysis?
ChooseOpen from theFile menu in the General Information window to read datainto the GAGE application. A directory of available SAS data sets appears, as shownin Display A.19.
SAS OnlineDoc: Version 81822
Appendix A. Getting Started
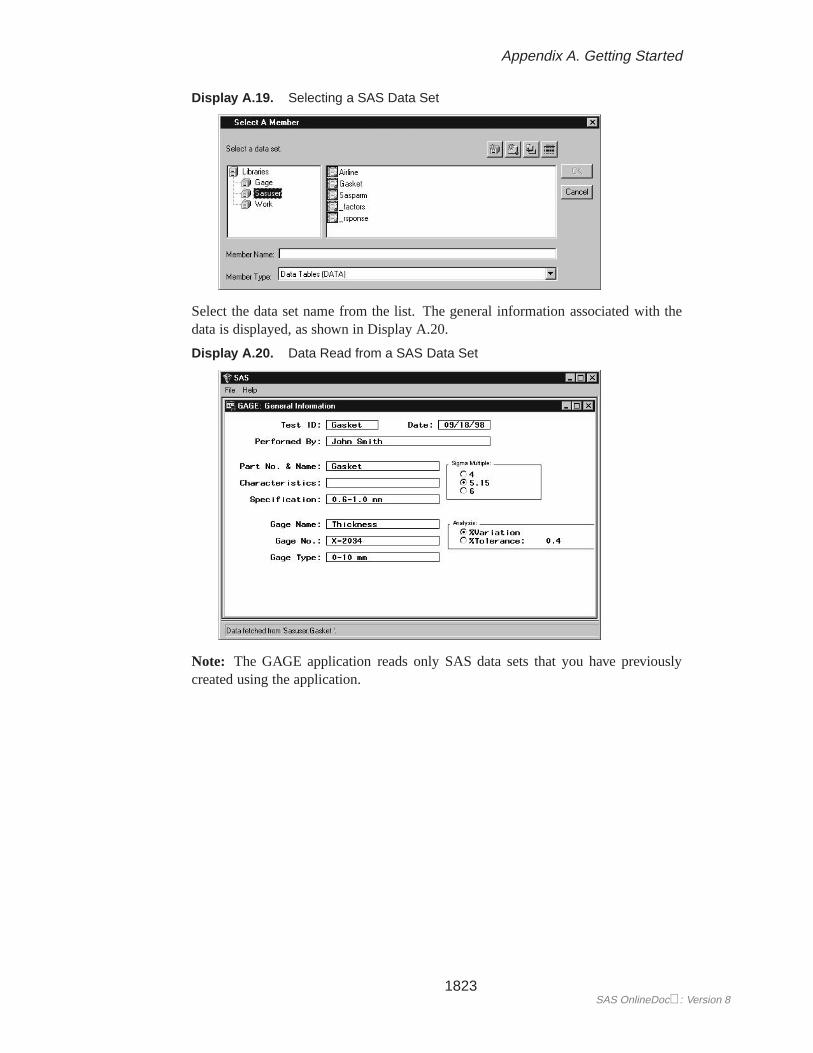
Display A.19. Selecting a SAS Data Set
Select the data set name from the list. The general information associated with thedata is displayed, as shown in Display A.20.
Display A.20. Data Read from a SAS Data Set
Note: The GAGE application reads only SAS data sets that you have previouslycreated using the application.
1823SAS OnlineDoc: Version 8
Part 10. The CAPABILITY Procedure
DetailsRange Chart
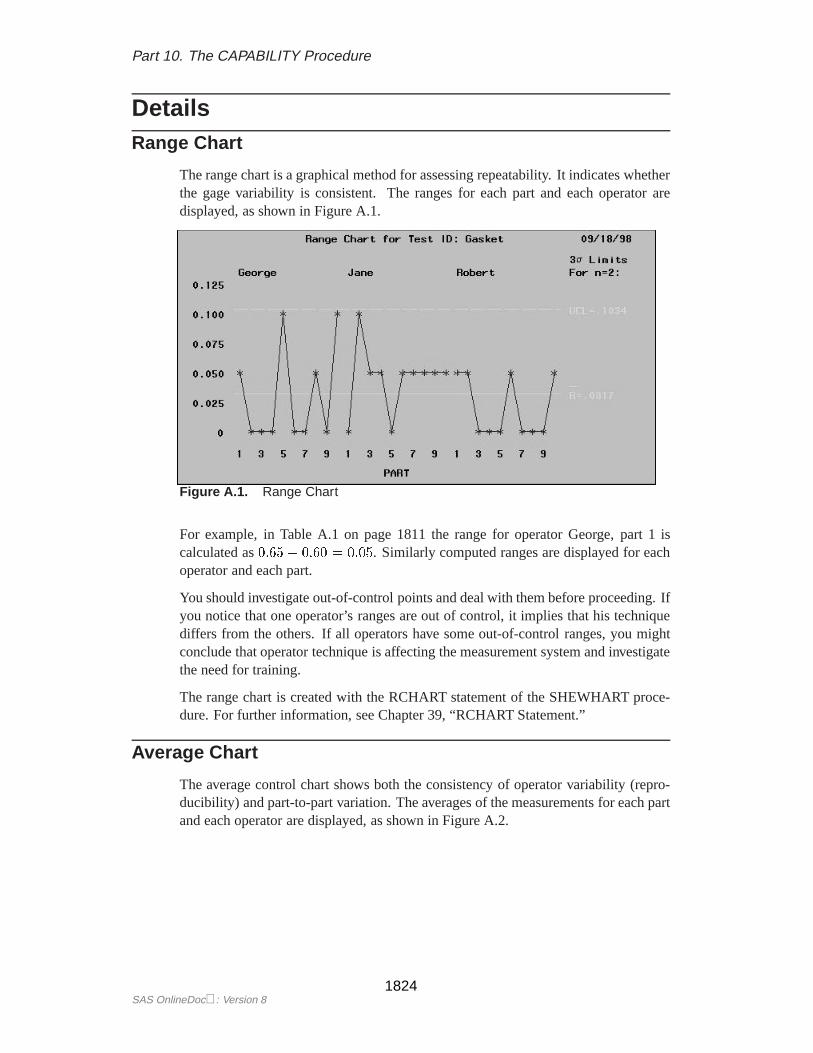
The range chart is a graphical method for assessing repeatability. It indicates whetherthe gage variability is consistent. The ranges for each part and each operator aredisplayed, as shown in Figure A.1.
Figure A.1. Range Chart
For example, in Table A.1 on page 1811 the range for operator George, part 1 iscalculated as0:65 � 0:60 = 0:05. Similarly computed ranges are displayed for eachoperator and each part.
You should investigate out-of-control points and deal with them before proceeding. Ifyou notice that one operator’s ranges are out of control, it implies that his techniquediffers from the others. If all operators have some out-of-control ranges, you mightconclude that operator technique is affecting the measurement system and investigatethe need for training.
The range chart is created with the RCHART statement of the SHEWHART proce-dure. For further information, see Chapter 39, “RCHART Statement.”
Average Chart
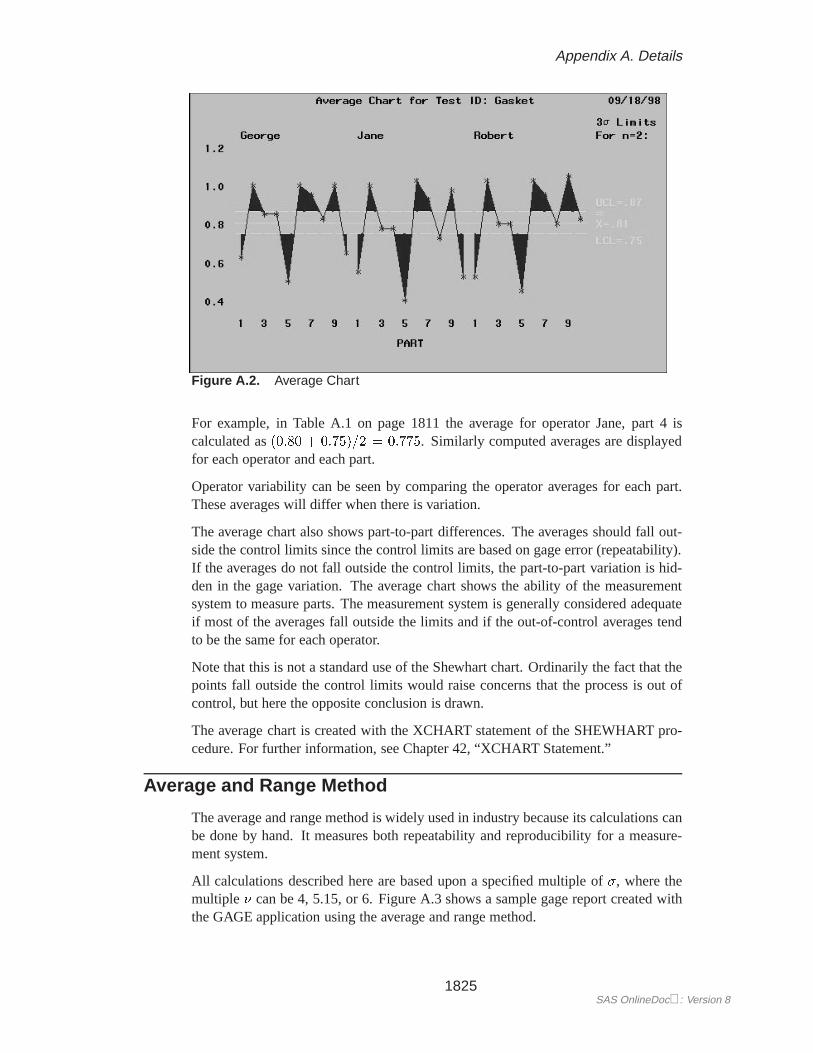
The average control chart shows both the consistency of operator variability (repro-ducibility) and part-to-part variation. The averages of the measurements for each partand each operator are displayed, as shown in Figure A.2.
SAS OnlineDoc: Version 81824
Appendix A. Details
Figure A.2. Average Chart
For example, in Table A.1 on page 1811 the average for operator Jane, part 4 iscalculated as(0:80 + 0:75)=2 = 0:775. Similarly computed averages are displayedfor each operator and each part.
Operator variability can be seen by comparing the operator averages for each part.These averages will differ when there is variation.
The average chart also shows part-to-part differences. The averages should fall out-side the control limits since the control limits are based on gage error (repeatability).If the averages do not fall outside the control limits, the part-to-part variation is hid-den in the gage variation. The average chart shows the ability of the measurementsystem to measure parts. The measurement system is generally considered adequateif most of the averages fall outside the limits and if the out-of-control averages tendto be the same for each operator.
Note that this is not a standard use of the Shewhart chart. Ordinarily the fact that thepoints fall outside the control limits would raise concerns that the process is out ofcontrol, but here the opposite conclusion is drawn.
The average chart is created with the XCHART statement of the SHEWHART pro-cedure. For further information, see Chapter 42, “XCHART Statement.”
Average and Range Method
The average and range method is widely used in industry because its calculations canbe done by hand. It measures both repeatability and reproducibility for a measure-ment system.
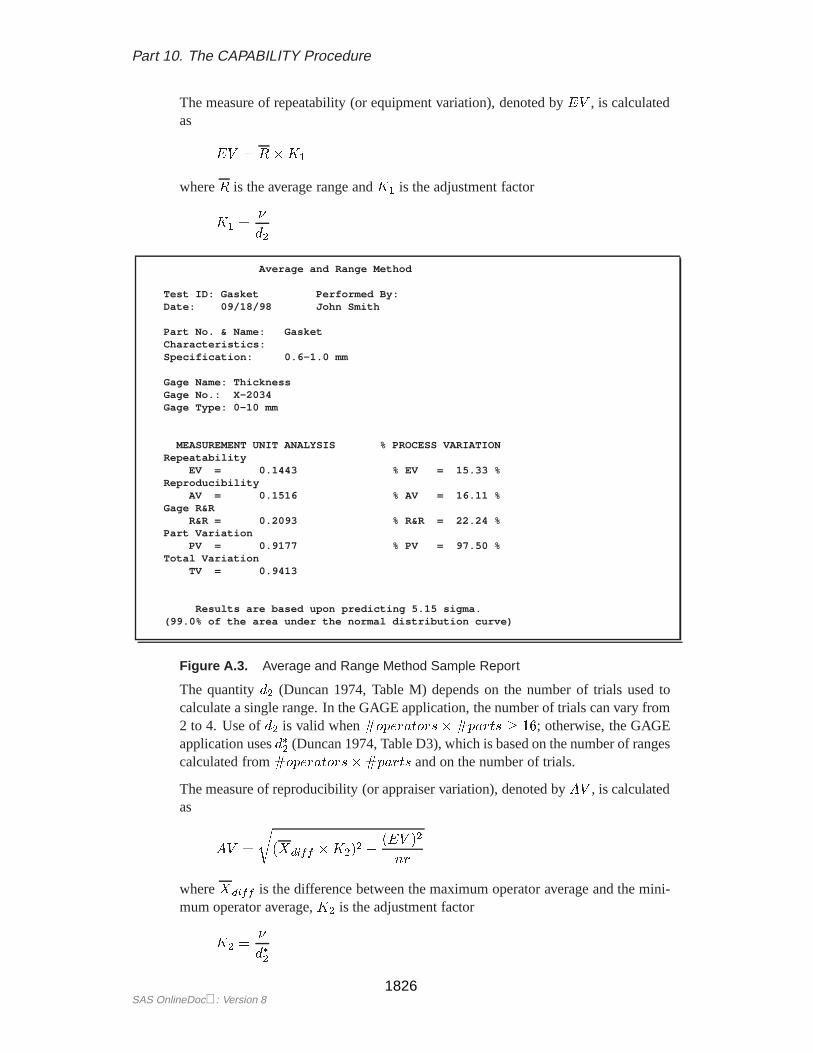
All calculations described here are based upon a specified multiple of�, where themultiple � can be 4, 5.15, or 6. Figure A.3 shows a sample gage report created withthe GAGE application using the average and range method.
1825SAS OnlineDoc: Version 8
Part 10. The CAPABILITY Procedure
The measure of repeatability (or equipment variation), denoted byEV , is calculatedas
EV = R�K1
whereR is the average range andK1 is the adjustment factor
K1 =�
d2
Average and Range Method
Test ID: Gasket Performed By:Date: 09/18/98 John Smith
Part No. & Name: GasketCharacteristics:Specification: 0.6-1.0 mm
Gage Name: ThicknessGage No.: X-2034Gage Type: 0-10 mm
MEASUREMENT UNIT ANALYSIS % PROCESS VARIATIONRepeatability
EV = 0.1443 % EV = 15.33 %Reproducibility
AV = 0.1516 % AV = 16.11 %Gage R&R
R&R = 0.2093 % R&R = 22.24 %Part Variation
PV = 0.9177 % PV = 97.50 %Total Variation
TV = 0.9413
Results are based upon predicting 5.15 sigma.(99.0% of the area under the normal distribution curve)
Figure A.3. Average and Range Method Sample Report
The quantityd2 (Duncan 1974, Table M) depends on the number of trials used tocalculate a single range. In the GAGE application, the number of trials can vary from2 to 4. Use ofd2 is valid when#operators�#parts � 16; otherwise, the GAGEapplication usesd�
2(Duncan 1974, Table D3), which is based on the number of ranges
calculated from#operators�#parts and on the number of trials.
The measure of reproducibility (or appraiser variation), denoted byAV , is calculatedas
AV =
r(Xdiff �K2)2 �
(EV )2
nr
whereXdiff is the difference between the maximum operator average and the mini-mum operator average,K2 is the adjustment factor
K2 =�
d�2
SAS OnlineDoc: Version 81826
Appendix A. Details
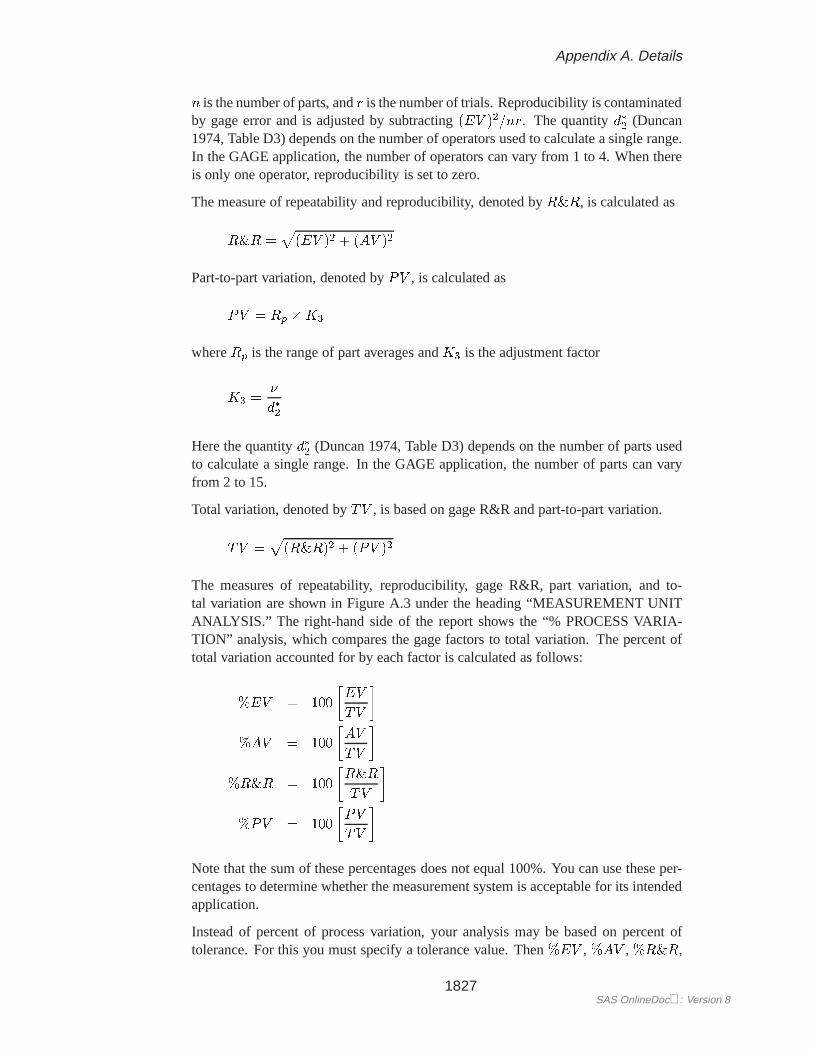
n is the number of parts, andr is the number of trials. Reproducibility is contaminatedby gage error and is adjusted by subtracting(EV )2=nr. The quantityd�
2(Duncan
1974, Table D3) depends on the number of operators used to calculate a single range.In the GAGE application, the number of operators can vary from 1 to 4. When thereis only one operator, reproducibility is set to zero.
The measure of repeatability and reproducibility, denoted byR&R, is calculated as
R&R =p(EV )2 + (AV )2
Part-to-part variation, denoted byPV , is calculated as
PV = Rp �K3
whereRp is the range of part averages andK3 is the adjustment factor
K3 =�
d�2
Here the quantityd�2
(Duncan 1974, Table D3) depends on the number of parts usedto calculate a single range. In the GAGE application, the number of parts can varyfrom 2 to 15.
Total variation, denoted byTV , is based on gage R&R and part-to-part variation.
TV =p(R&R)2 + (PV )2
The measures of repeatability, reproducibility, gage R&R, part variation, and to-tal variation are shown in Figure A.3 under the heading “MEASUREMENT UNITANALYSIS.” The right-hand side of the report shows the “% PROCESS VARIA-TION” analysis, which compares the gage factors to total variation. The percent oftotal variation accounted for by each factor is calculated as follows:
%EV = 100
�EV
TV
�
%AV = 100
�AV
TV
�
%R&R = 100
�R&R
TV
�
%PV = 100
�PV
TV
�
Note that the sum of these percentages does not equal 100%. You can use these per-centages to determine whether the measurement system is acceptable for its intendedapplication.
Instead of percent of process variation, your analysis may be based on percent oftolerance. For this you must specify a tolerance value. Then%EV , %AV , %R&R,
1827SAS OnlineDoc: Version 8
Part 10. The CAPABILITY Procedure
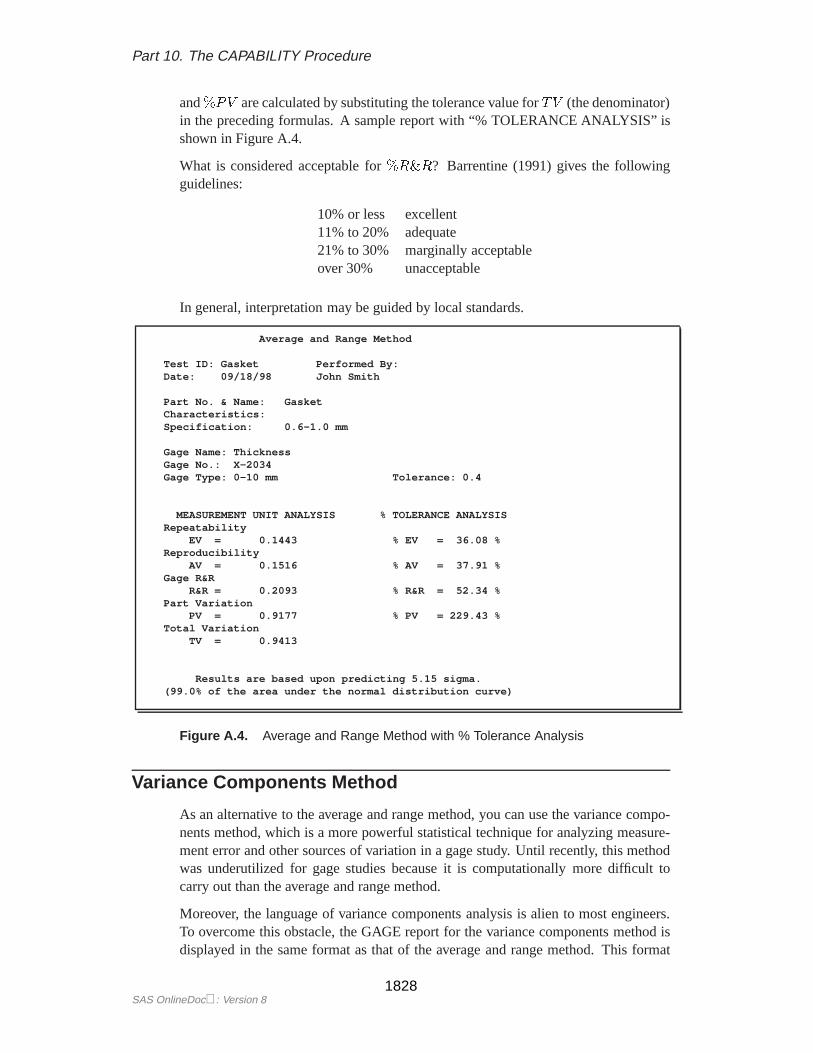
and%PV are calculated by substituting the tolerance value forTV (the denominator)in the preceding formulas. A sample report with “% TOLERANCE ANALYSIS” isshown in Figure A.4.
What is considered acceptable for%R&R? Barrentine (1991) gives the followingguidelines:
10% or less excellent11% to 20% adequate21% to 30% marginally acceptableover 30% unacceptable
In general, interpretation may be guided by local standards.
Average and Range Method
Test ID: Gasket Performed By:Date: 09/18/98 John Smith
Part No. & Name: GasketCharacteristics:Specification: 0.6-1.0 mm
Gage Name: ThicknessGage No.: X-2034Gage Type: 0-10 mm Tolerance: 0.4
MEASUREMENT UNIT ANALYSIS % TOLERANCE ANALYSISRepeatability
EV = 0.1443 % EV = 36.08 %Reproducibility
AV = 0.1516 % AV = 37.91 %Gage R&R
R&R = 0.2093 % R&R = 52.34 %Part Variation
PV = 0.9177 % PV = 229.43 %Total Variation
TV = 0.9413
Results are based upon predicting 5.15 sigma.(99.0% of the area under the normal distribution curve)
Figure A.4. Average and Range Method with % Tolerance Analysis
Variance Components Method
As an alternative to the average and range method, you can use the variance compo-nents method, which is a more powerful statistical technique for analyzing measure-ment error and other sources of variation in a gage study. Until recently, this methodwas underutilized for gage studies because it is computationally more difficult tocarry out than the average and range method.
Moreover, the language of variance components analysis is alien to most engineers.To overcome this obstacle, the GAGE report for the variance components method isdisplayed in the same format as that of the average and range method. This format
SAS OnlineDoc: Version 81828
Appendix A. Details
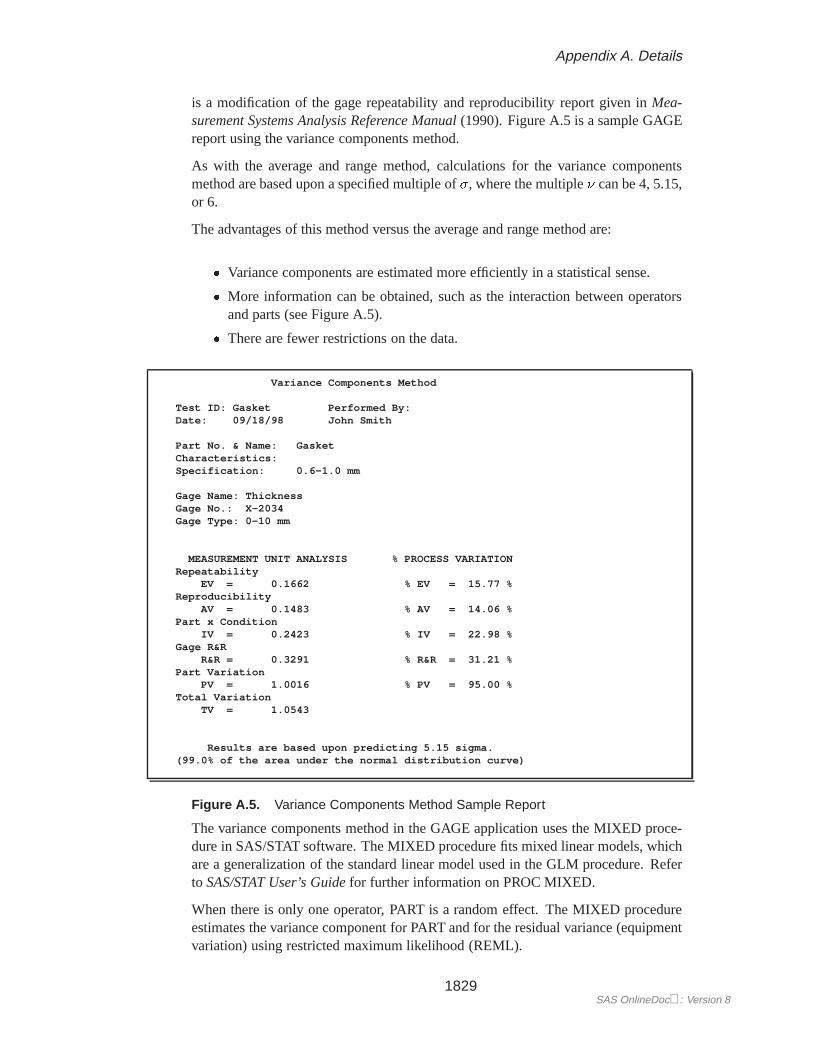
is a modification of the gage repeatability and reproducibility report given inMea-surement Systems Analysis Reference Manual(1990). Figure A.5 is a sample GAGEreport using the variance components method.
As with the average and range method, calculations for the variance componentsmethod are based upon a specified multiple of�, where the multiple� can be 4, 5.15,or 6.
The advantages of this method versus the average and range method are:
� Variance components are estimated more efficiently in a statistical sense.
� More information can be obtained, such as the interaction between operatorsand parts (see Figure A.5).
� There are fewer restrictions on the data.
Variance Components Method
Test ID: Gasket Performed By:Date: 09/18/98 John Smith
Part No. & Name: GasketCharacteristics:Specification: 0.6-1.0 mm
Gage Name: ThicknessGage No.: X-2034Gage Type: 0-10 mm
MEASUREMENT UNIT ANALYSIS % PROCESS VARIATIONRepeatability
EV = 0.1662 % EV = 15.77 %Reproducibility
AV = 0.1483 % AV = 14.06 %Part x Condition
IV = 0.2423 % IV = 22.98 %Gage R&R
R&R = 0.3291 % R&R = 31.21 %Part Variation
PV = 1.0016 % PV = 95.00 %Total Variation
TV = 1.0543
Results are based upon predicting 5.15 sigma.(99.0% of the area under the normal distribution curve)
Figure A.5. Variance Components Method Sample Report
The variance components method in the GAGE application uses the MIXED proce-dure in SAS/STAT software. The MIXED procedure fits mixed linear models, whichare a generalization of the standard linear model used in the GLM procedure. Referto SAS/STAT User’s Guidefor further information on PROC MIXED.
When there is only one operator, PART is a random effect. The MIXED procedureestimates the variance component for PART and for the residual variance (equipmentvariation) using restricted maximum likelihood (REML).
1829SAS OnlineDoc: Version 8
Part 10. The CAPABILITY Procedure
proc mixed;class part;model meas=;random part;
run;
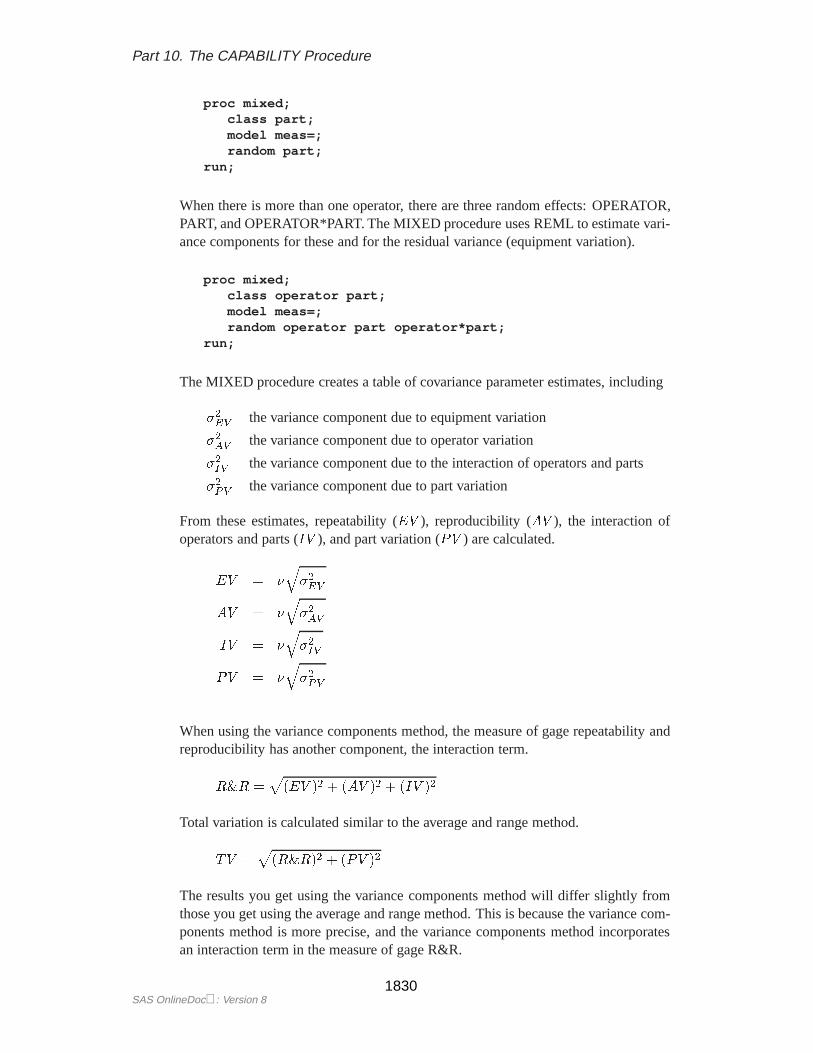
When there is more than one operator, there are three random effects: OPERATOR,PART, and OPERATOR*PART. The MIXED procedure uses REML to estimate vari-ance components for these and for the residual variance (equipment variation).
proc mixed;class operator part;model meas=;random operator part operator*part;
run;
The MIXED procedure creates a table of covariance parameter estimates, including
�2EV the variance component due to equipment variation
�2AV the variance component due to operator variation
�2IV the variance component due to the interaction of operators and parts
�2PV the variance component due to part variation
From these estimates, repeatability (EV ), reproducibility (AV ), the interaction ofoperators and parts (IV ), and part variation (PV ) are calculated.
EV = �q�2EV
AV = �q�2AV
IV = �q�2IV
PV = �q�2PV
When using the variance components method, the measure of gage repeatability andreproducibility has another component, the interaction term.
R&R =p(EV )2 + (AV )2 + (IV )2
Total variation is calculated similar to the average and range method.
TV =p(R&R)2 + (PV )2
The results you get using the variance components method will differ slightly fromthose you get using the average and range method. This is because the variance com-ponents method is more precise, and the variance components method incorporatesan interaction term in the measure of gage R&R.
SAS OnlineDoc: Version 81830
Appendix A. Details
As with the average and range method, the right-hand side of the report can be apercent of process variation or a percent of tolerance.%EV , %AV , %IV , %R&R,and%PV are calculated similar to the average and range method.
The variance components method is more flexible than the average and range methodin terms of the data that it can handle. Data for the average and range method shouldbe balanced with the same number of parts and trials for each operator in the study.For example, if your study is composed of two operators, two trials, and ten parts,each operator should have 20 measurements. If the measurement for operator one,trial two, part three is missing, the average and range method cannot compute thegage measures. However, the variance components method can handle such missingdata.
The average and range method also requires that a minimum number of parts be col-lected depending on the number of operators and the number of trials. Otherwise, theestimates will be imprecise. This is another situation where the variance componentsmethod can be used.
Note: The flexibility of the variance components method does not imply that youshould not use locally recommended procedures for setting up and collecting data forgage studies.
Only a subset of the capabilities of PROC MIXED is used in the GAGE application.The procedure is capable of analyzing much more sophisticated statistical models.For example, you could fit an extended model to study the variability among severalgages.
Creating a Data Set Outside the GAGE Application
Note: This section assumes you have some knowledge of creating SAS data sets.
Suppose your gage study data are stored in an external file, and you want to use theGAGE application but do not want to type in the data. How do you create a SAS dataset that can be read by the GAGE application?
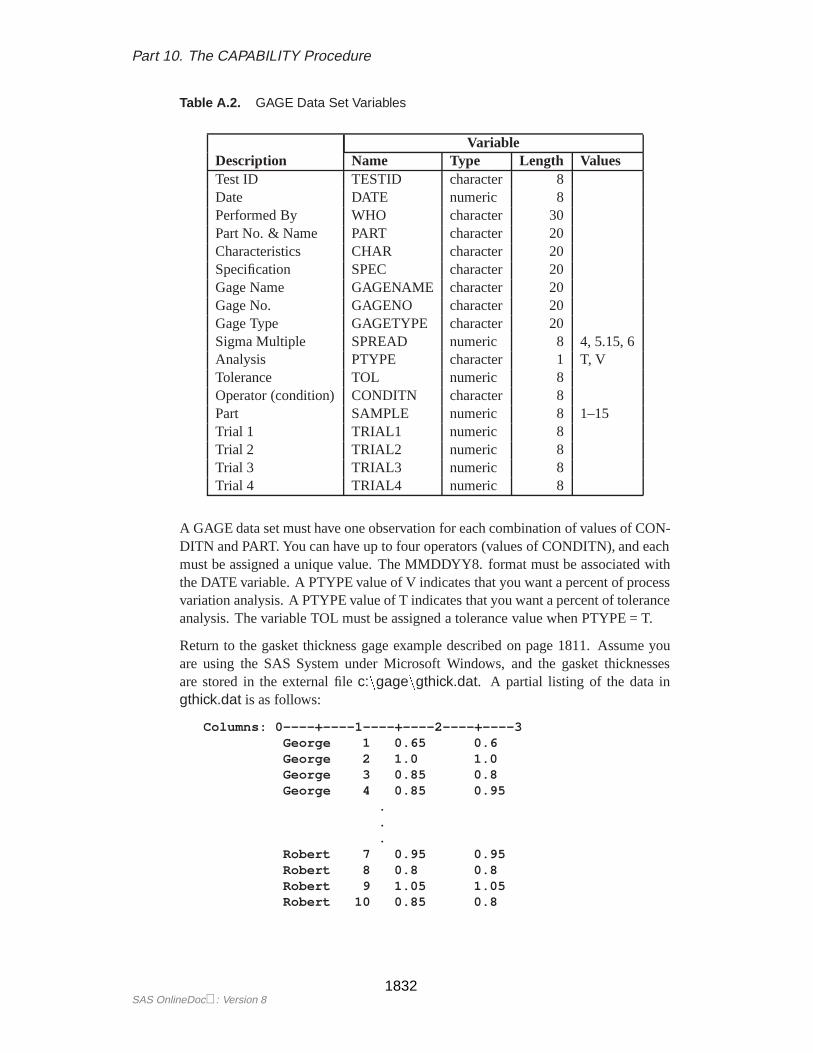
Table A.2 lists the SAS variables needed for the general information and the mea-surements in a GAGE data set.
1831SAS OnlineDoc: Version 8
Part 10. The CAPABILITY Procedure
Table A.2. GAGE Data Set Variables
VariableDescription Name Type Length ValuesTest ID TESTID character 8Date DATE numeric 8Performed By WHO character 30Part No. & Name PART character 20Characteristics CHAR character 20Specification SPEC character 20Gage Name GAGENAME character 20Gage No. GAGENO character 20Gage Type GAGETYPE character 20Sigma Multiple SPREAD numeric 8 4, 5.15, 6Analysis PTYPE character 1 T, VTolerance TOL numeric 8Operator (condition) CONDITN character 8Part SAMPLE numeric 8 1–15Trial 1 TRIAL1 numeric 8Trial 2 TRIAL2 numeric 8Trial 3 TRIAL3 numeric 8Trial 4 TRIAL4 numeric 8
A GAGE data set must have one observation for each combination of values of CON-DITN and PART. You can have up to four operators (values of CONDITN), and eachmust be assigned a unique value. The MMDDYY8. format must be associated withthe DATE variable. A PTYPE value of V indicates that you want a percent of processvariation analysis. A PTYPE value of T indicates that you want a percent of toleranceanalysis. The variable TOL must be assigned a tolerance value when PTYPE = T.
Return to the gasket thickness gage example described on page 1811. Assume youare using the SAS System under Microsoft Windows, and the gasket thicknessesare stored in the external filec:ngagengthick.dat. A partial listing of the data ingthick.dat is as follows:
Columns: 0----+----1----+----2----+----3George 1 0.65 0.6George 2 1.0 1.0George 3 0.85 0.8George 4 0.85 0.95
.
.
.Robert 7 0.95 0.95Robert 8 0.8 0.8Robert 9 1.05 1.05Robert 10 0.85 0.8
SAS OnlineDoc: Version 81832
Appendix A. Details
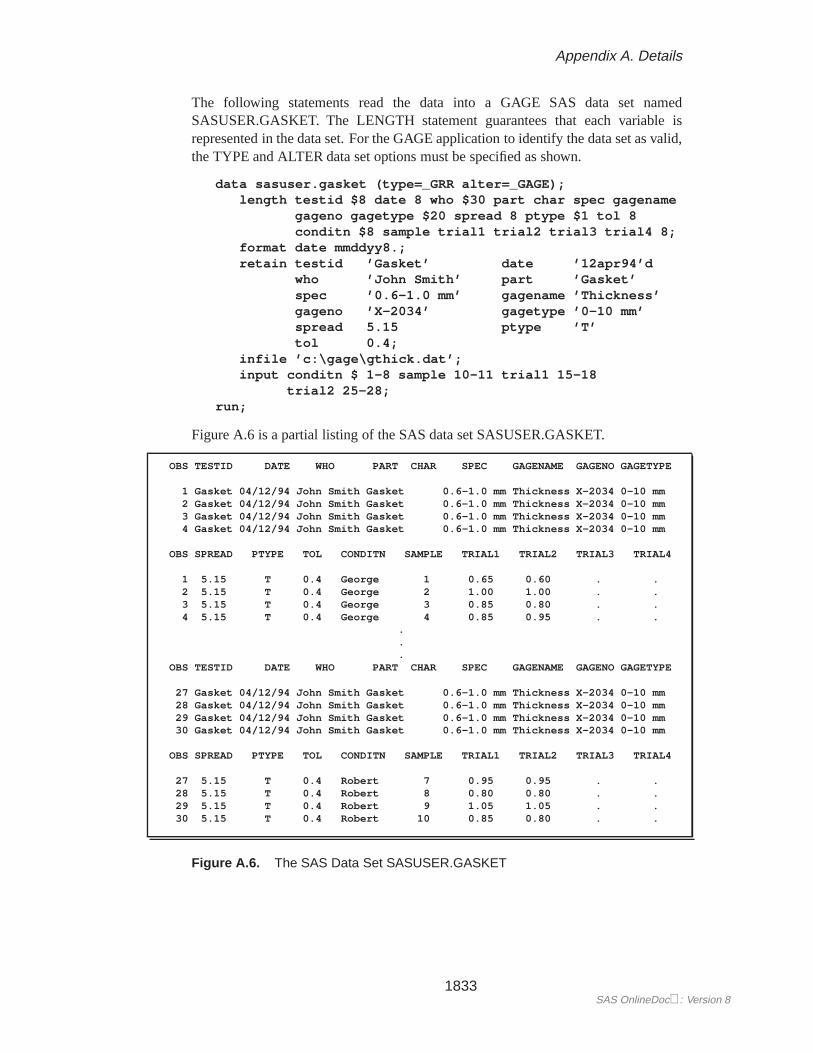
The following statements read the data into a GAGE SAS data set namedSASUSER.GASKET. The LENGTH statement guarantees that each variable isrepresented in the data set. For the GAGE application to identify the data set as valid,the TYPE and ALTER data set options must be specified as shown.
data sasuser.gasket (type=_GRR alter=_GAGE);length testid $8 date 8 who $30 part char spec gagename
gageno gagetype $20 spread 8 ptype $1 tol 8conditn $8 sample trial1 trial2 trial3 trial4 8;
format date mmddyy8.;retain testid ’Gasket’ date ’12apr94’d
who ’John Smith’ part ’Gasket’spec ’0.6-1.0 mm’ gagename ’Thickness’gageno ’X-2034’ gagetype ’0-10 mm’spread 5.15 ptype ’T’tol 0.4;
infile ’c:\gage\gthick.dat’;input conditn $ 1-8 sample 10-11 trial1 15-18
trial2 25-28;run;
Figure A.6 is a partial listing of the SAS data set SASUSER.GASKET.
OBS TESTID DATE WHO PART CHAR SPEC GAGENAME GAGENO GAGETYPE
1 Gasket 04/12/94 John Smith Gasket 0.6-1.0 mm Thickness X-2034 0-10 mm2 Gasket 04/12/94 John Smith Gasket 0.6-1.0 mm Thickness X-2034 0-10 mm3 Gasket 04/12/94 John Smith Gasket 0.6-1.0 mm Thickness X-2034 0-10 mm4 Gasket 04/12/94 John Smith Gasket 0.6-1.0 mm Thickness X-2034 0-10 mm
OBS SPREAD PTYPE TOL CONDITN SAMPLE TRIAL1 TRIAL2 TRIAL3 TRIAL4
1 5.15 T 0.4 George 1 0.65 0.60 . .2 5.15 T 0.4 George 2 1.00 1.00 . .3 5.15 T 0.4 George 3 0.85 0.80 . .4 5.15 T 0.4 George 4 0.85 0.95 . .
.
.
.OBS TESTID DATE WHO PART CHAR SPEC GAGENAME GAGENO GAGETYPE
27 Gasket 04/12/94 John Smith Gasket 0.6-1.0 mm Thickness X-2034 0-10 mm28 Gasket 04/12/94 John Smith Gasket 0.6-1.0 mm Thickness X-2034 0-10 mm29 Gasket 04/12/94 John Smith Gasket 0.6-1.0 mm Thickness X-2034 0-10 mm30 Gasket 04/12/94 John Smith Gasket 0.6-1.0 mm Thickness X-2034 0-10 mm
OBS SPREAD PTYPE TOL CONDITN SAMPLE TRIAL1 TRIAL2 TRIAL3 TRIAL4
27 5.15 T 0.4 Robert 7 0.95 0.95 . .28 5.15 T 0.4 Robert 8 0.80 0.80 . .29 5.15 T 0.4 Robert 9 1.05 1.05 . .30 5.15 T 0.4 Robert 10 0.85 0.80 . .
Figure A.6. The SAS Data Set SASUSER.GASKET
1833SAS OnlineDoc: Version 8
Part 10. The CAPABILITY Procedure
Extensibility of the Application
The GAGE application was not designed for any particular industry or company.Because many companies have their own techniques and guidelines for gage studies,the application is designed so that you can tailor it to suit your needs.
The interface to the GAGE application was implemented using FRAME entries inSAS/AF software and the SAS Screen Control Language (SCL). The FRAME entriesand SCL source code are available in thegage catalog. FRAME entries provide aflexible environment for building graphical user interfaces. SCL is a programminglanguage that enhances the capabilities of SAS/FSP software and SAS/AF software,including FRAME entries.
For further information on FRAME entries and SCL, refer toSAS Component Lan-guage: Referenceand toSAS Screen Control Language: Reference.
SAS OnlineDoc: Version 81834
The correct bibliographic citation for this manual is as follows: SAS Institute Inc.,SAS/QC ® User’s Guide, Version 8, Cary, NC: SAS Institute Inc., 1999. 1994 pp.
SAS/QC® User’s Guide, Version 8Copyright © 1999 SAS Institute Inc., Cary, NC, USA.ISBN 1–58025–493–4All rights reserved. Printed in the United States of America. No part of this publicationmay be reproduced, stored in a retrieval system, or transmitted, by any form or by anymeans, electronic, mechanical, photocopying, or otherwise, without the prior writtenpermission of the publisher, SAS Institute Inc.U.S. Government Restricted Rights Notice. Use, duplication, or disclosure of thesoftware by the government is subject to restrictions as set forth in FAR 52.227–19Commercial Computer Software-Restricted Rights (June 1987).SAS Institute Inc., SAS Campus Drive, Cary, North Carolina 27513.1st printing, October 1999SAS® and all other SAS Institute Inc. product or service names are registered trademarksor trademarks of SAS Institute in the USA and other countries.® indicates USAregistration.IBM®, ACF/VTAM®, AIX®, APPN®, MVS/ESA®, OS/2®, OS/390®, VM/ESA®, and VTAM®
are registered trademarks or trademarks of International Business Machines Corporation.® indicates USA registration.Other brand and product names are registered trademarks or trademarks of theirrespective companies.The Institute is a private company devoted to the support and further development of itssoftware and related services.