Embed Size (px)
Citation preview
84
Appendix A – Oxymax Calculations
A.1 Metabolic Calculations
The metabolic data reported by Oxymax is based on five empirical measurements:
Gas concentrations measured by sensors:
Reference Oxygen Concentration (O2i)
Reference Carbon Dioxide Concentration (CO2i)
Sample Oxygen Concentration (O2o)
Sample Carbon Dioxide Concentration (CO2o)
Fresh Air Flow
The fresh air flow measured by Oxymax for Windows depends on the ventilation
system used. Positive ventilation systems throttle and measure the fresh air
before delivering it to the chambers (Vi). Negative ventilation systems draw
fresh air into the chamber from the atmosphere around it. The measured flow
in this case is not the rate of air entering the cage, but exiting it (Vo).
The calculation of Oxygen consumption (VO2) and Carbon Dioxide production (VCO2) values
requires the use of both the input (Vi) and output (Vo) flows to the chamber. Despite the
fact that the chamber is not pressurized and does not allow gas to build up as an experiment
progresses, the chamber cannot be modeled as a perfect steady state system because of the
subject’s unequal effect on the respiratory gases: the subject does not exhale the same
volume of gas as it inhales.
Gases in an Oxymax system are broken into three categories:
Consumed – Oxygen
Produced – Carbon Dioxide, Methane
Inert – All other gases not involved in respiration (Nitrogen, Argon, and other noble
gases)
Since inert gases are not used during respiration, their rates of flow at the output (VNo) and
input (VNi) are the same (Equation 1).
Equation 1
The flows of inert gases are products of the flows to and from the chamber and the
concentration of inert gases (Ni and No) in each flow (Equation 2). The concentrations can
be calculated and one of the flows is measured so the other (Vo for positive ventilation, Vi for
negative ventilation) can be calculated.
Equation 2
85
The concentration of inert gases in a sample is assumed to be all gases that are not involved
in respiration (Equation 3).
Equation 3
Assuming a positive flow system, combining the previous equations yields the Vo for the
system (Equation 4).
Equation 4
The volumetric flow rates for consumption and production can then both be calculated. The
equations are arranged such that both consumption and production are presented as
positive values (Equation 5, Equation 6, Equation 7).
Equation 5
Equation 6
Equation 7
Oxymax for Windows always presents consumption and production rates normalized to the
subject’s body mass in kilograms. To convert the whole-body rates into mass-normalized
rates just divide the whole-body rate by the mass (m) of the subject in kilograms (Equation
8).
Equation 8
The accumulated respiration figures (A) are calculated using the whole-body rate and the
amount of time that has elapsed since the last measurement (t). The amount of gas
consumed or produced in an interval is added to a running total of all sample volumes.
Units are adjusted to match the ones specified in the experiment settings (Equation 9).
[ ] [ ]
Equation 9
86
The respiratory exchange ratio can be calculated from either set of consumption and
production rates (Equation 10).
Equation 10
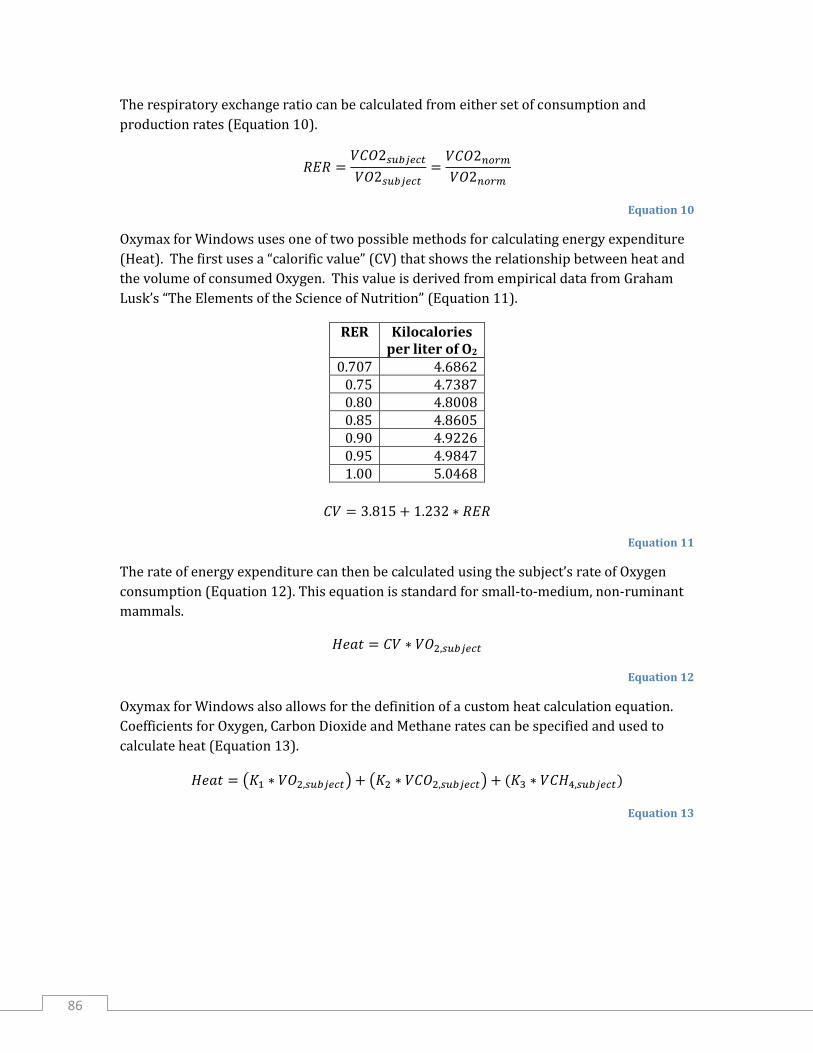
Oxymax for Windows uses one of two possible methods for calculating energy expenditure
(Heat). The first uses a “calorific value” (CV) that shows the relationship between heat and
the volume of consumed Oxygen. This value is derived from empirical data from Graham
Lusk’s “The Elements of the Science of Nutrition” (Equation 11).
RER Kilocalories per liter of O2
0.707 4.6862 0.75 4.7387 0.80 4.8008 0.85 4.8605 0.90 4.9226 0.95 4.9847 1.00 5.0468
Equation 11
The rate of energy expenditure can then be calculated using the subject’s rate of Oxygen
consumption (Equation 12). This equation is standard for small-to-medium, non-ruminant
mammals.
Equation 12
Oxymax for Windows also allows for the definition of a custom heat calculation equation.
Coefficients for Oxygen, Carbon Dioxide and Methane rates can be specified and used to
calculate heat (Equation 13).
( ) ( )
Equation 13
87
A.2 “Analysis of the Oxidation of Mixtures of Carbohydrate and Fat”
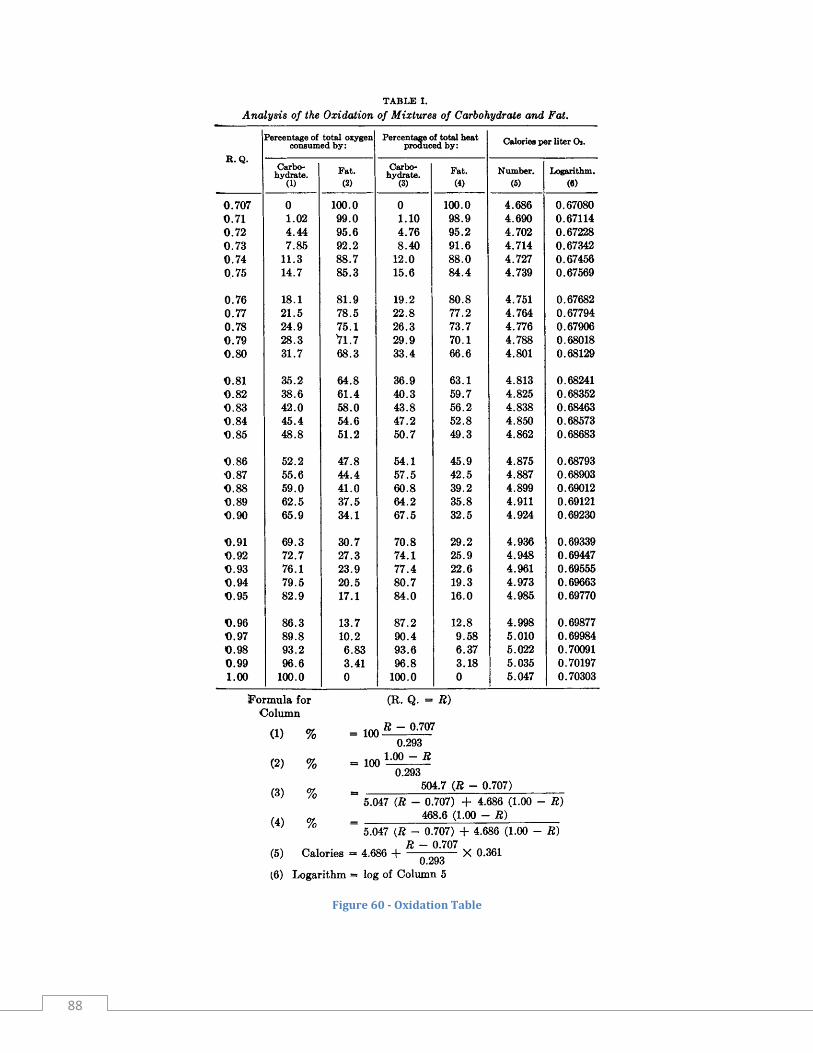
The following is an excerpt from a correction issued by Graham Lusk in 1923 that was
published in the journal, “Animal Calorimetry”. It contains the table of oxidation figures for
carbohydrates and fats and the equation used by Oxymax for calculation of Heat.
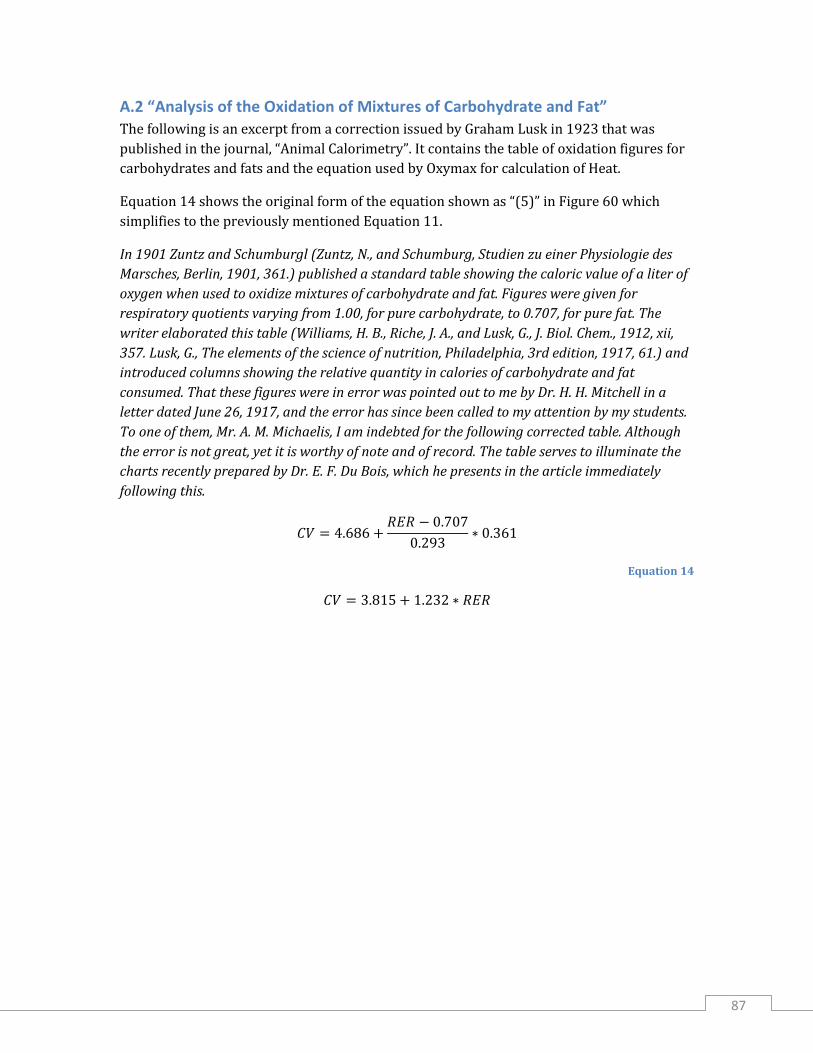
Equation 14 shows the original form of the equation shown as “(5)” in Figure 60 which
simplifies to the previously mentioned Equation 11.
In 1901 Zuntz and Schumburgl (Zuntz, N., and Schumburg, Studien zu einer Physiologie des
Marsches, Berlin, 1901, 361.) published a standard table showing the caloric value of a liter of
oxygen when used to oxidize mixtures of carbohydrate and fat. Figures were given for
respiratory quotients varying from 1.00, for pure carbohydrate, to 0.707, for pure fat. The
writer elaborated this table (Williams, H. B., Riche, J. A., and Lusk, G., J. Biol. Chem., 1912, xii,
357. Lusk, G., The elements of the science of nutrition, Philadelphia, 3rd edition, 1917, 61.) and
introduced columns showing the relative quantity in calories of carbohydrate and fat
consumed. That these figures were in error was pointed out to me by Dr. H. H. Mitchell in a
letter dated June 26, 1917, and the error has since been called to my attention by my students.
To one of them, Mr. A. M. Michaelis, I am indebted for the following corrected table. Although
the error is not great, yet it is worthy of note and of record. The table serves to illuminate the
charts recently prepared by Dr. E. F. Du Bois, which he presents in the article immediately
following this.
Equation 14
88
Figure 60 - Oxidation Table