Embed Size (px)
Citation preview
Appendix A
Material Properties
A-1
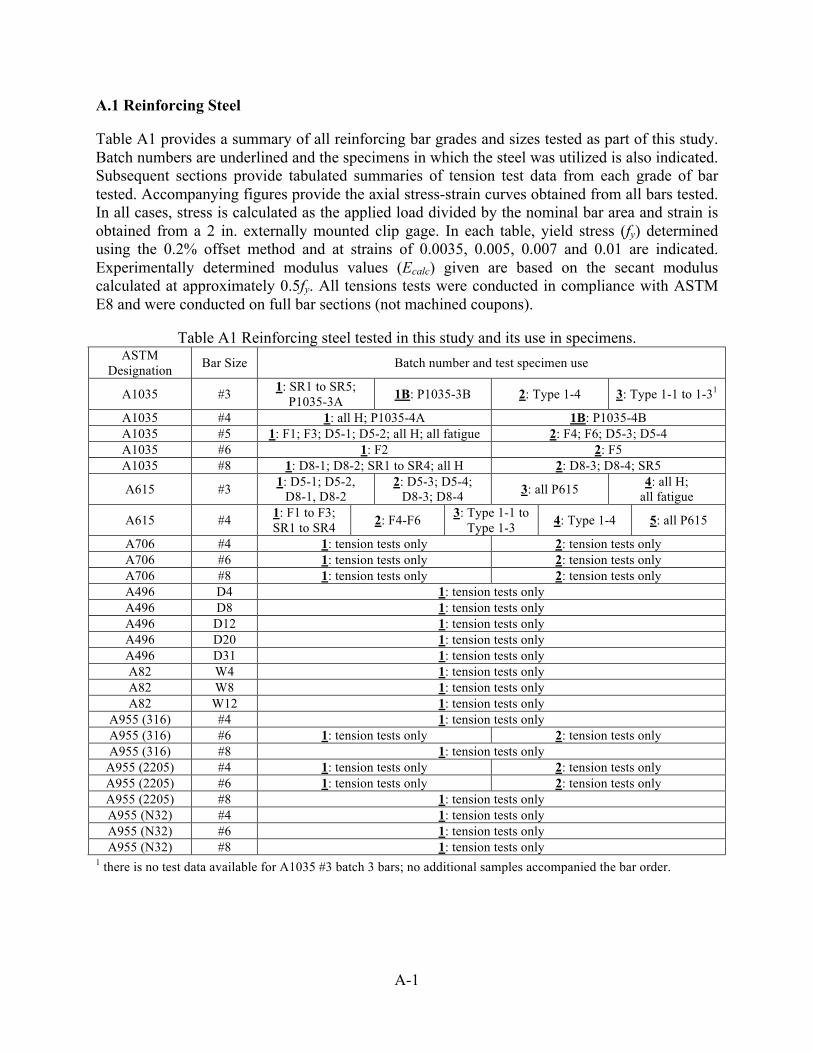
A.1 Reinforcing Steel
Table A1 provides a summary of all reinforcing bar grades and sizes tested as part of this study. Batch numbers are underlined and the specimens in which the steel was utilized is also indicated. Subsequent sections provide tabulated summaries of tension test data from each grade of bar tested. Accompanying figures provide the axial stress-strain curves obtained from all bars tested. In all cases, stress is calculated as the applied load divided by the nominal bar area and strain is obtained from a 2 in. externally mounted clip gage. In each table, yield stress (fy) determined using the 0.2% offset method and at strains of 0.0035, 0.005, 0.007 and 0.01 are indicated. Experimentally determined modulus values (Ecalc) given are based on the secant modulus calculated at approximately 0.5fy. All tensions tests were conducted in compliance with ASTM E8 and were conducted on full bar sections (not machined coupons).
Table A1 Reinforcing steel tested in this study and its use in specimens.
ASTM Designation Bar Size Batch number and test specimen use
A1035 #3 1: SR1 to SR5; P1035-3A 1B: P1035-3B 2: Type 1-4 3: Type 1-1 to 1-31
A1035 #4 1: all H; P1035-4A 1B: P1035-4B A1035 #5 1: F1; F3; D5-1; D5-2; all H; all fatigue 2: F4; F6; D5-3; D5-4 A1035 #6 1: F2 2: F5 A1035 #8 1: D8-1; D8-2; SR1 to SR4; all H 2: D8-3; D8-4; SR5
A615 #3 1: D5-1; D5-2, D8-1, D8-2
2: D5-3; D5-4; D8-3; D8-4 3: all P615 4: all H;
all fatigue
A615 #4 1: F1 to F3; SR1 to SR4 2: F4-F6 3: Type 1-1 to
Type 1-3 4: Type 1-4 5: all P615
A706 #4 1: tension tests only 2: tension tests only A706 #6 1: tension tests only 2: tension tests only A706 #8 1: tension tests only 2: tension tests only A496 D4 1: tension tests only A496 D8 1: tension tests only A496 D12 1: tension tests only A496 D20 1: tension tests only A496 D31 1: tension tests only A82 W4 1: tension tests only A82 W8 1: tension tests only A82 W12 1: tension tests only
A955 (316) #4 1: tension tests only A955 (316) #6 1: tension tests only 2: tension tests only A955 (316) #8 1: tension tests only
A955 (2205) #4 1: tension tests only 2: tension tests only A955 (2205) #6 1: tension tests only 2: tension tests only A955 (2205) #8 1: tension tests only A955 (N32) #4 1: tension tests only A955 (N32) #6 1: tension tests only A955 (N32) #8 1: tension tests only
1 there is no test data available for A1035 #3 batch 3 bars; no additional samples accompanied the bar order.
A-2
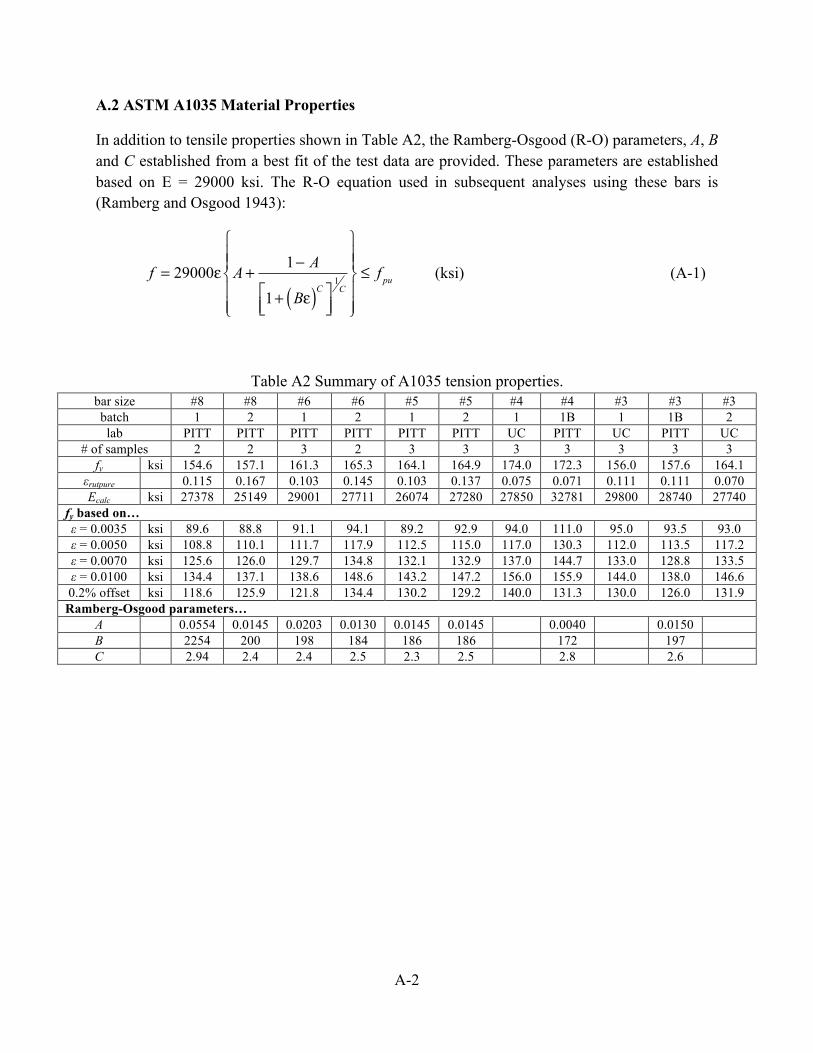
A.2 ASTM A1035 Material Properties
In addition to tensile properties shown in Table A2, the Ramberg-Osgood (R-O) parameters, A, B and C established from a best fit of the test data are provided. These parameters are established based on E = 29000 ksi. The R-O equation used in subsequent analyses using these bars is (Ramberg and Osgood 1943):
f = 29000ε A+1− A
1+ Bε( )C⎡⎣⎢
⎤⎦⎥
1C
⎧
⎨⎪⎪
⎩⎪⎪
⎫
⎬⎪⎪
⎭⎪⎪
≤ f pu (ksi) (A-1)
Table A2 Summary of A1035 tension properties. bar size #8 #8 #6 #6 #5 #5 #4 #4 #3 #3 #3 batch 1 2 1 2 1 2 1 1B 1 1B 2 lab PITT PITT PITT PITT PITT PITT UC PITT UC PITT UC
# of samples 2 2 3 2 3 3 3 3 3 3 3 fy ksi 154.6 157.1 161.3 165.3 164.1 164.9 174.0 172.3 156.0 157.6 164.1
εrutpure 0.115 0.167 0.103 0.145 0.103 0.137 0.075 0.071 0.111 0.111 0.070 Ecalc ksi 27378 25149 29001 27711 26074 27280 27850 32781 29800 28740 27740
fy based on… ε = 0.0035 ksi 89.6 88.8 91.1 94.1 89.2 92.9 94.0 111.0 95.0 93.5 93.0 ε = 0.0050 ksi 108.8 110.1 111.7 117.9 112.5 115.0 117.0 130.3 112.0 113.5 117.2 ε = 0.0070 ksi 125.6 126.0 129.7 134.8 132.1 132.9 137.0 144.7 133.0 128.8 133.5 ε = 0.0100 ksi 134.4 137.1 138.6 148.6 143.2 147.2 156.0 155.9 144.0 138.0 146.6 0.2% offset ksi 118.6 125.9 121.8 134.4 130.2 129.2 140.0 131.3 130.0 126.0 131.9
Ramberg-Osgood parameters… A 0.0554 0.0145 0.0203 0.0130 0.0145 0.0145 0.0040 0.0150 B 2254 200 198 184 186 186 172 197 C 2.94 2.4 2.4 2.5 2.3 2.5 2.8 2.6
A-3
a) A1035 #8 batch 1 b) A1035 #8 batch 2
c) A1035 #6 batch 1 d) A1035 #6 batch 2
e) A1035 #5 batch 1 f) A1035 #5 batch 2
Figure A1 Axial stress-strain curves for A1035 reinforcing steel.
A-4
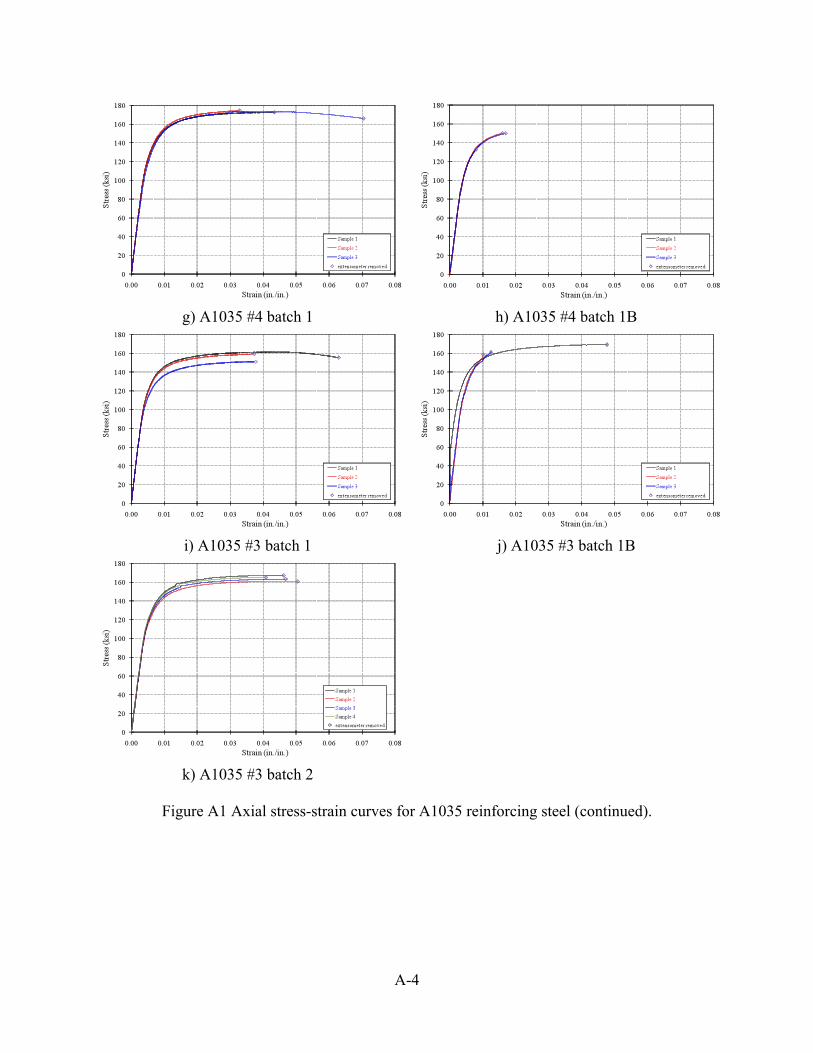
g) A1035 #4 batch 1 h) A1035 #4 batch 1B
i) A1035 #3 batch 1 j) A1035 #3 batch 1B
k) A1035 #3 batch 2
Figure A1 Axial stress-strain curves for A1035 reinforcing steel (continued).
A-5
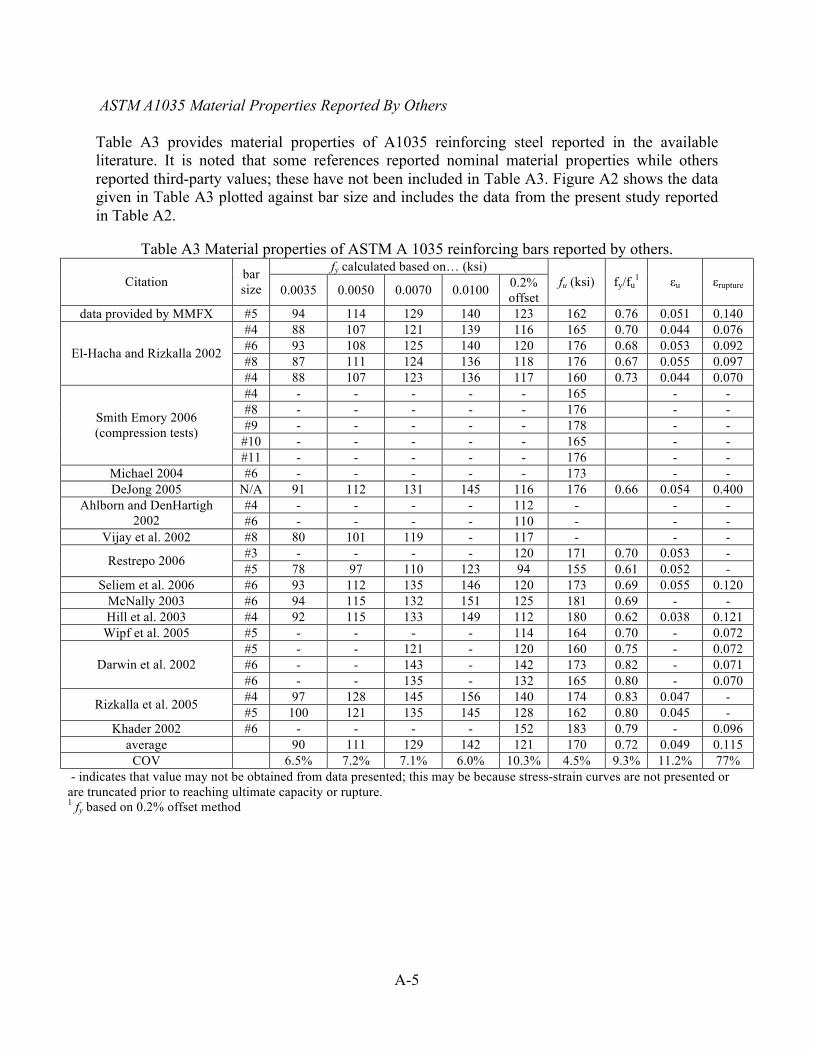
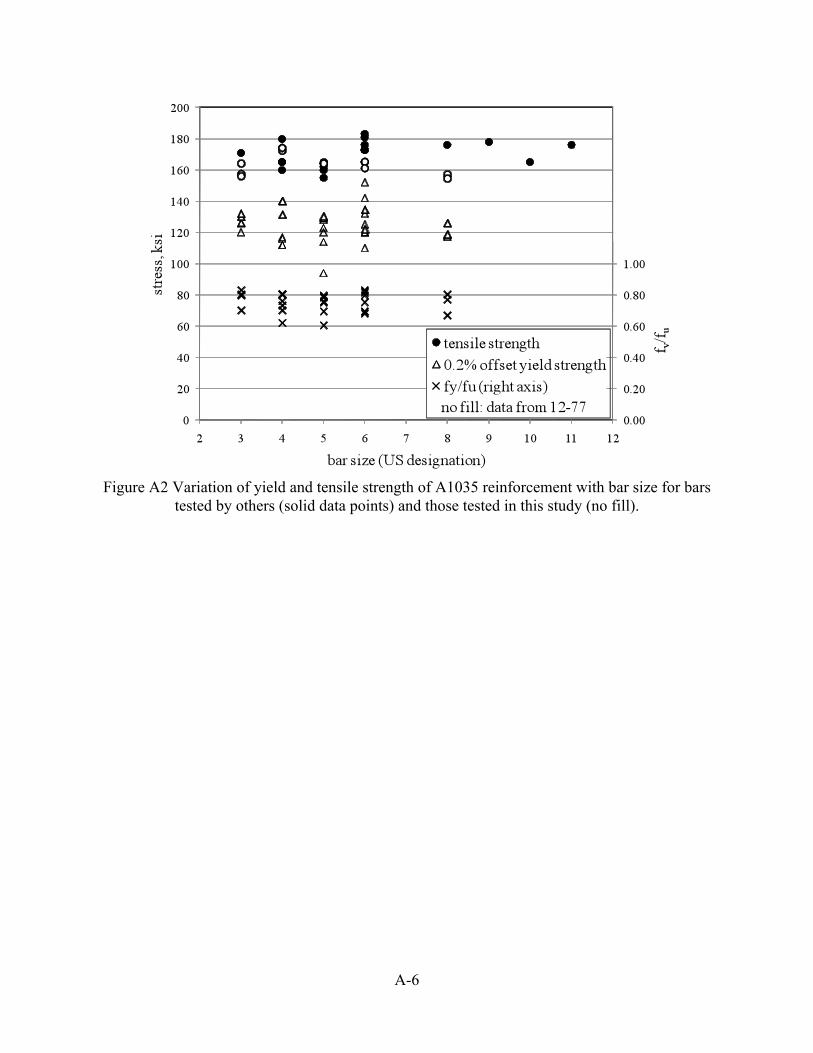
ASTM A1035 Material Properties Reported By Others Table A3 provides material properties of A1035 reinforcing steel reported in the available literature. It is noted that some references reported nominal material properties while others reported third-party values; these have not been included in Table A3. Figure A2 shows the data given in Table A3 plotted against bar size and includes the data from the present study reported in Table A2.
Table A3 Material properties of ASTM A 1035 reinforcing bars reported by others.
fy calculated based on… (ksi) Citation bar
size 0.0035 0.0050 0.0070 0.0100 0.2% offset
fu (ksi) fy/fu1 εu εrupture
data provided by MMFX #5 94 114 129 140 123 162 0.76 0.051 0.140 #4 88 107 121 139 116 165 0.70 0.044 0.076 #6 93 108 125 140 120 176 0.68 0.053 0.092 #8 87 111 124 136 118 176 0.67 0.055 0.097 El-Hacha and Rizkalla 2002
#4 88 107 123 136 117 160 0.73 0.044 0.070 #4 - - - - - 165 - - #8 - - - - - 176 - - #9 - - - - - 178 - -
#10 - - - - - 165 - -
Smith Emory 2006 (compression tests)
#11 - - - - - 176 - - Michael 2004 #6 - - - - - 173 - - DeJong 2005 N/A 91 112 131 145 116 176 0.66 0.054 0.400
#4 - - - - 112 - - - Ahlborn and DenHartigh 2002 #6 - - - - 110 - - -
Vijay et al. 2002 #8 80 101 119 - 117 - - - #3 - - - - 120 171 0.70 0.053 - Restrepo 2006 #5 78 97 110 123 94 155 0.61 0.052 -
Seliem et al. 2006 #6 93 112 135 146 120 173 0.69 0.055 0.120 McNally 2003 #6 94 115 132 151 125 181 0.69 - - Hill et al. 2003 #4 92 115 133 149 112 180 0.62 0.038 0.121
Wipf et al. 2005 #5 - - - - 114 164 0.70 - 0.072 #5 - - 121 - 120 160 0.75 - 0.072 #6 - - 143 - 142 173 0.82 - 0.071 Darwin et al. 2002 #6 - - 135 - 132 165 0.80 - 0.070 #4 97 128 145 156 140 174 0.83 0.047 - Rizkalla et al. 2005 #5 100 121 135 145 128 162 0.80 0.045 -
Khader 2002 #6 - - - - 152 183 0.79 - 0.096 average 90 111 129 142 121 170 0.72 0.049 0.115
COV 6.5% 7.2% 7.1% 6.0% 10.3% 4.5% 9.3% 11.2% 77% - indicates that value may not be obtained from data presented; this may be because stress-strain curves are not presented or are truncated prior to reaching ultimate capacity or rupture. 1 fy based on 0.2% offset method
A-6
Figure A2 Variation of yield and tensile strength of A1035 reinforcement with bar size for bars
tested by others (solid data points) and those tested in this study (no fill).
A-7
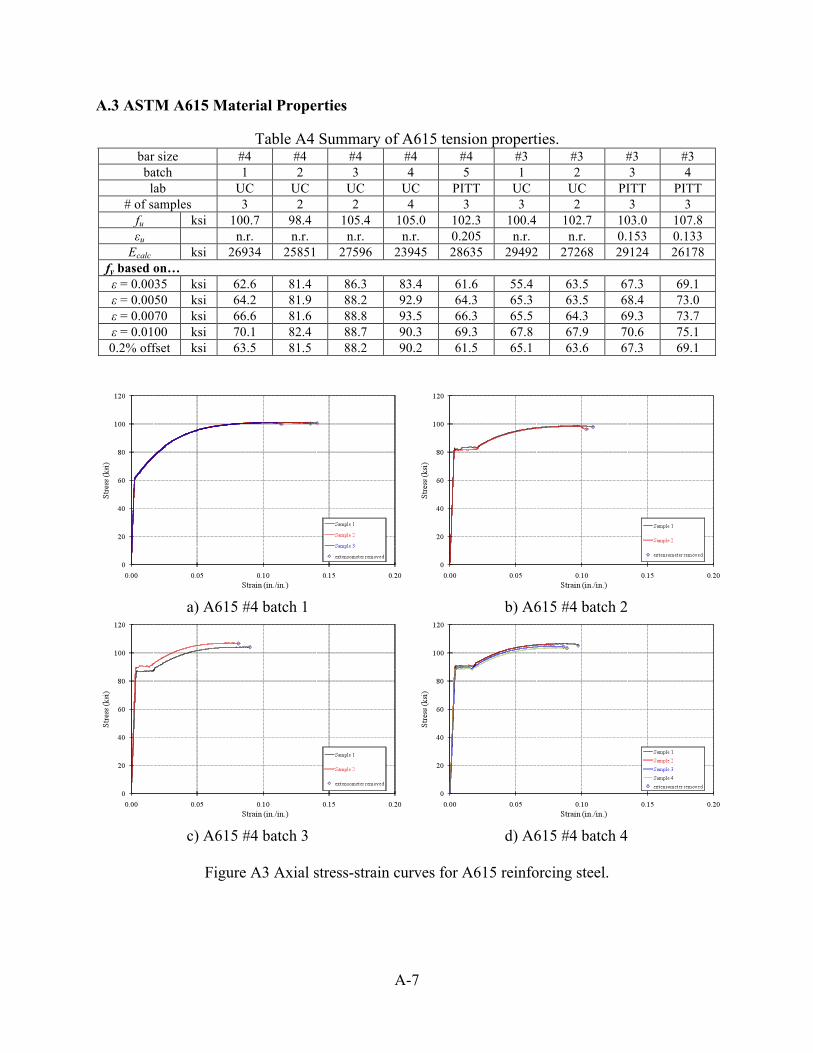
A.3 ASTM A615 Material Properties
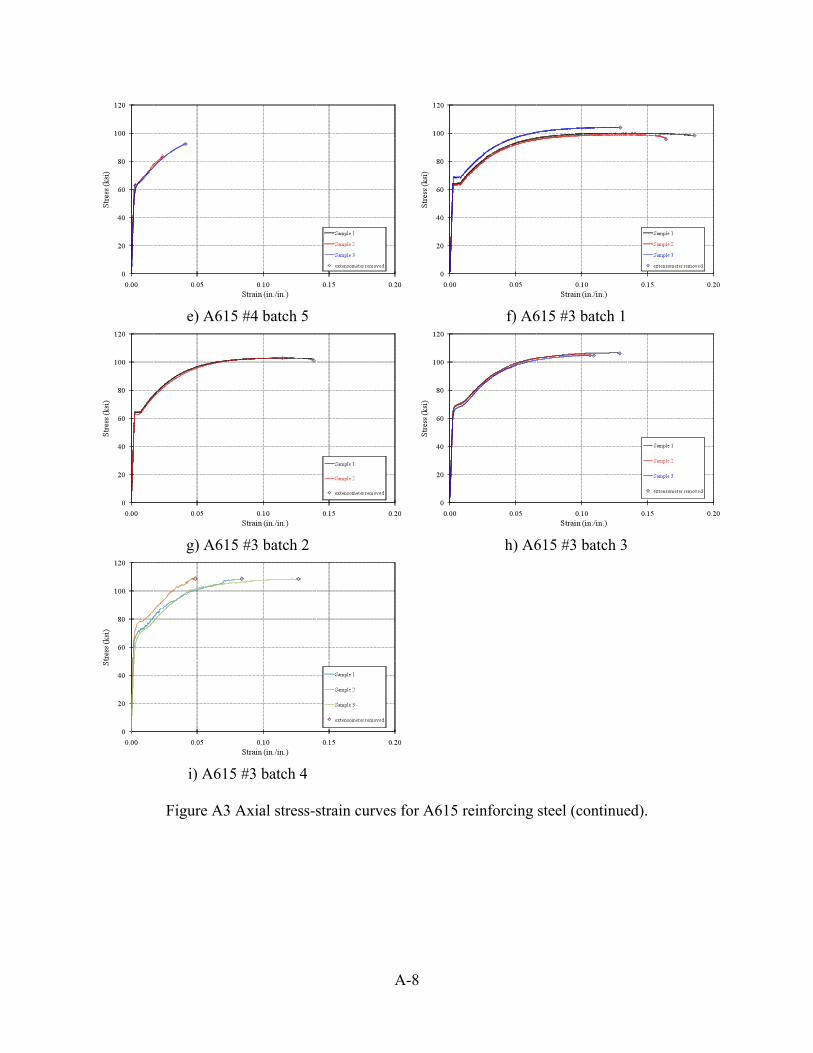
Table A4 Summary of A615 tension properties. bar size #4 #4 #4 #4 #4 #3 #3 #3 #3 batch 1 2 3 4 5 1 2 3 4 lab UC UC UC UC PITT UC UC PITT PITT
# of samples 3 2 2 4 3 3 2 3 3 fu ksi 100.7 98.4 105.4 105.0 102.3 100.4 102.7 103.0 107.8 εu n.r. n.r. n.r. n.r. 0.205 n.r. n.r. 0.153 0.133
Ecalc ksi 26934 25851 27596 23945 28635 29492 27268 29124 26178 fy based on… ε = 0.0035 ksi 62.6 81.4 86.3 83.4 61.6 55.4 63.5 67.3 69.1 ε = 0.0050 ksi 64.2 81.9 88.2 92.9 64.3 65.3 63.5 68.4 73.0 ε = 0.0070 ksi 66.6 81.6 88.8 93.5 66.3 65.5 64.3 69.3 73.7 ε = 0.0100 ksi 70.1 82.4 88.7 90.3 69.3 67.8 67.9 70.6 75.1 0.2% offset ksi 63.5 81.5 88.2 90.2 61.5 65.1 63.6 67.3 69.1
a) A615 #4 batch 1 b) A615 #4 batch 2
c) A615 #4 batch 3 d) A615 #4 batch 4
Figure A3 Axial stress-strain curves for A615 reinforcing steel.
A-8
e) A615 #4 batch 5 f) A615 #3 batch 1
g) A615 #3 batch 2 h) A615 #3 batch 3
i) A615 #3 batch 4
Figure A3 Axial stress-strain curves for A615 reinforcing steel (continued).
A-9
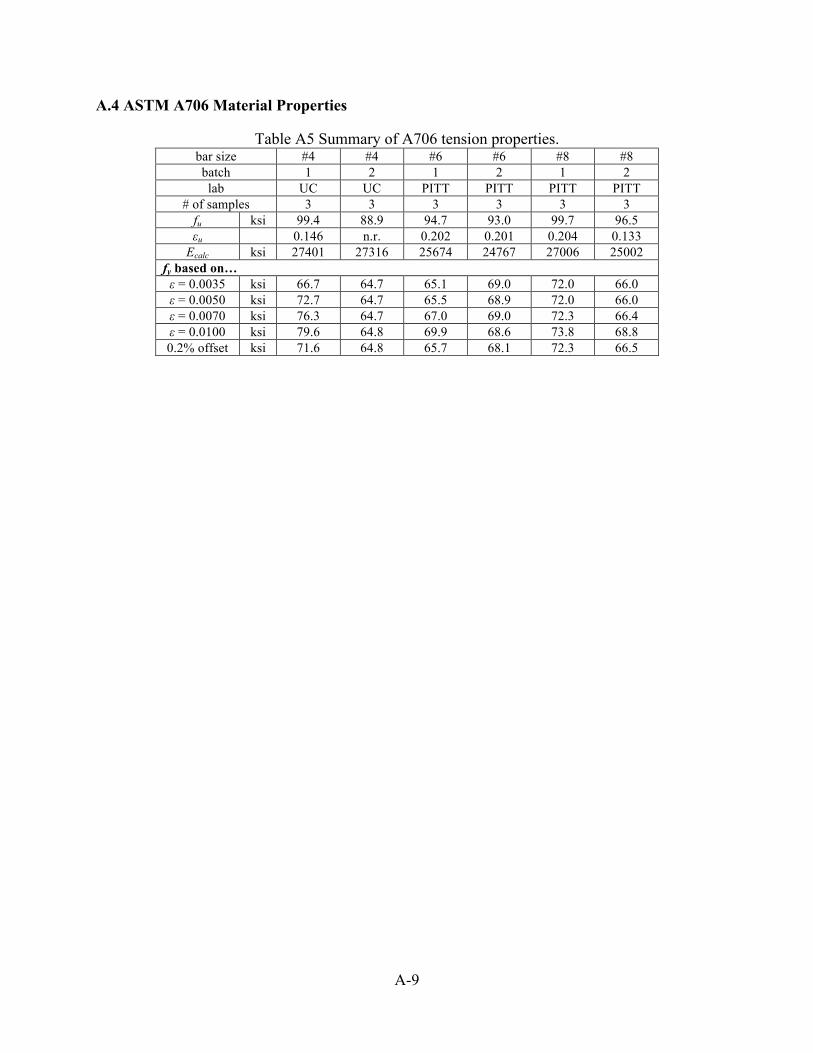
A.4 ASTM A706 Material Properties
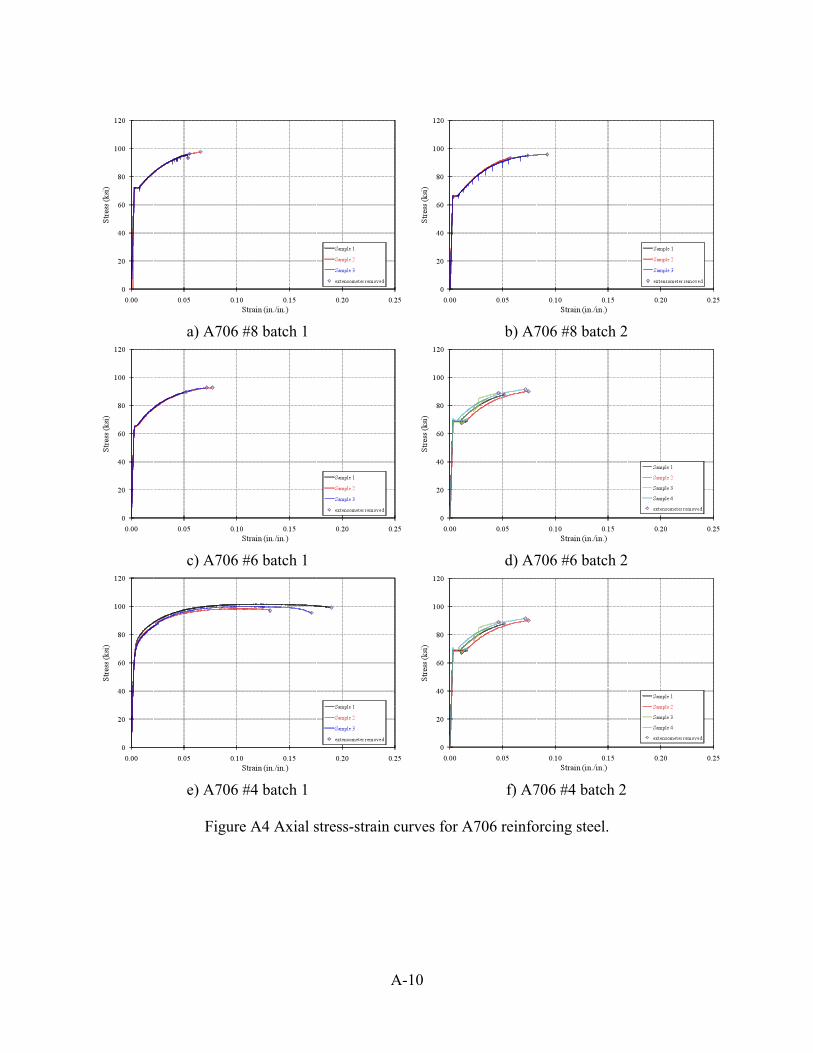
Table A5 Summary of A706 tension properties. bar size #4 #4 #6 #6 #8 #8 batch 1 2 1 2 1 2 lab UC UC PITT PITT PITT PITT
# of samples 3 3 3 3 3 3 fu ksi 99.4 88.9 94.7 93.0 99.7 96.5 εu 0.146 n.r. 0.202 0.201 0.204 0.133
Ecalc ksi 27401 27316 25674 24767 27006 25002 fy based on… ε = 0.0035 ksi 66.7 64.7 65.1 69.0 72.0 66.0 ε = 0.0050 ksi 72.7 64.7 65.5 68.9 72.0 66.0 ε = 0.0070 ksi 76.3 64.7 67.0 69.0 72.3 66.4 ε = 0.0100 ksi 79.6 64.8 69.9 68.6 73.8 68.8 0.2% offset ksi 71.6 64.8 65.7 68.1 72.3 66.5
A-10
a) A706 #8 batch 1 b) A706 #8 batch 2
c) A706 #6 batch 1 d) A706 #6 batch 2
e) A706 #4 batch 1 f) A706 #4 batch 2
Figure A4 Axial stress-strain curves for A706 reinforcing steel.
A-11
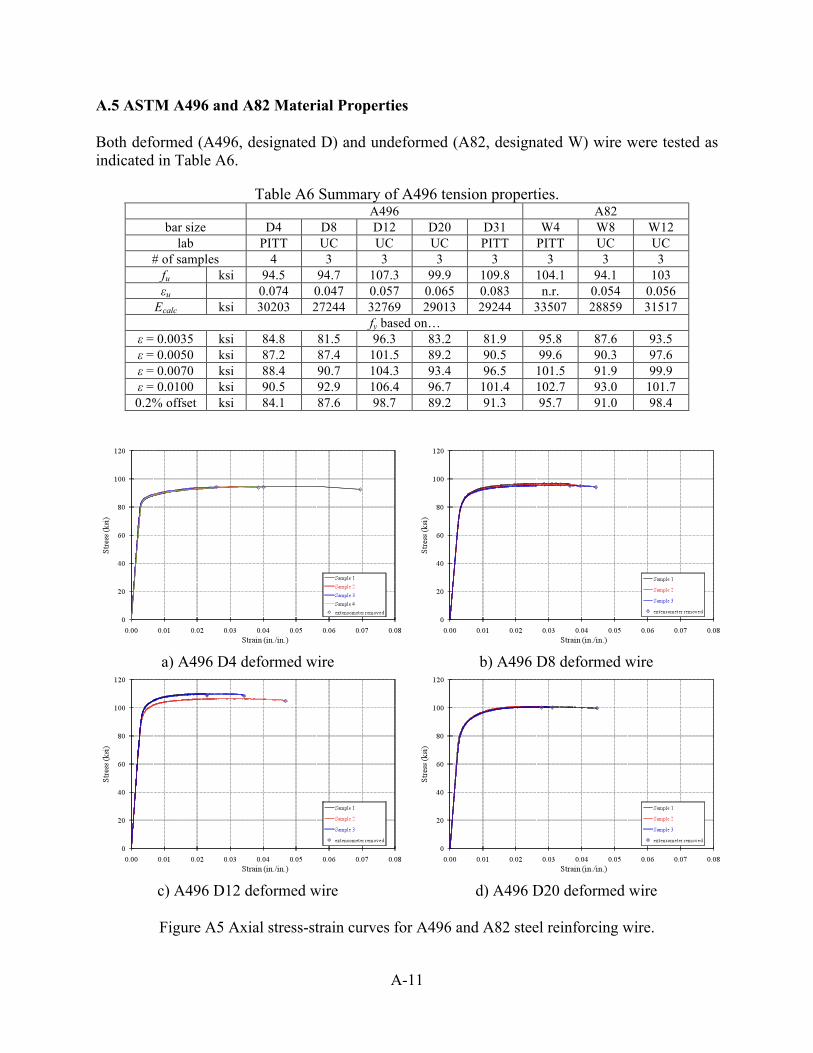
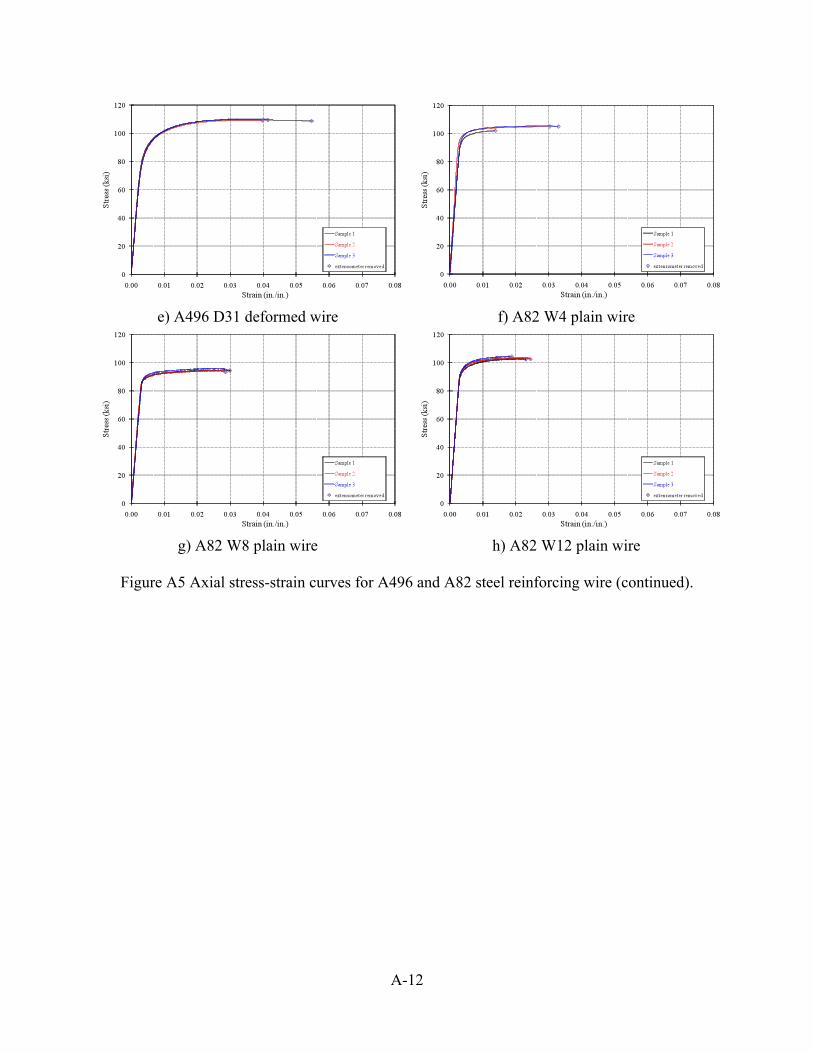
A.5 ASTM A496 and A82 Material Properties Both deformed (A496, designated D) and undeformed (A82, designated W) wire were tested as indicated in Table A6.
Table A6 Summary of A496 tension properties.
A496 A82 bar size D4 D8 D12 D20 D31 W4 W8 W12
lab PITT UC UC UC PITT PITT UC UC # of samples 4 3 3 3 3 3 3 3
fu ksi 94.5 94.7 107.3 99.9 109.8 104.1 94.1 103 εu 0.074 0.047 0.057 0.065 0.083 n.r. 0.054 0.056
Ecalc ksi 30203 27244 32769 29013 29244 33507 28859 31517 fy based on…
ε = 0.0035 ksi 84.8 81.5 96.3 83.2 81.9 95.8 87.6 93.5 ε = 0.0050 ksi 87.2 87.4 101.5 89.2 90.5 99.6 90.3 97.6 ε = 0.0070 ksi 88.4 90.7 104.3 93.4 96.5 101.5 91.9 99.9 ε = 0.0100 ksi 90.5 92.9 106.4 96.7 101.4 102.7 93.0 101.7 0.2% offset ksi 84.1 87.6 98.7 89.2 91.3 95.7 91.0 98.4
a) A496 D4 deformed wire b) A496 D8 deformed wire
c) A496 D12 deformed wire d) A496 D20 deformed wire
Figure A5 Axial stress-strain curves for A496 and A82 steel reinforcing wire.
A-12
e) A496 D31 deformed wire f) A82 W4 plain wire
g) A82 W8 plain wire h) A82 W12 plain wire
Figure A5 Axial stress-strain curves for A496 and A82 steel reinforcing wire (continued).
A-13
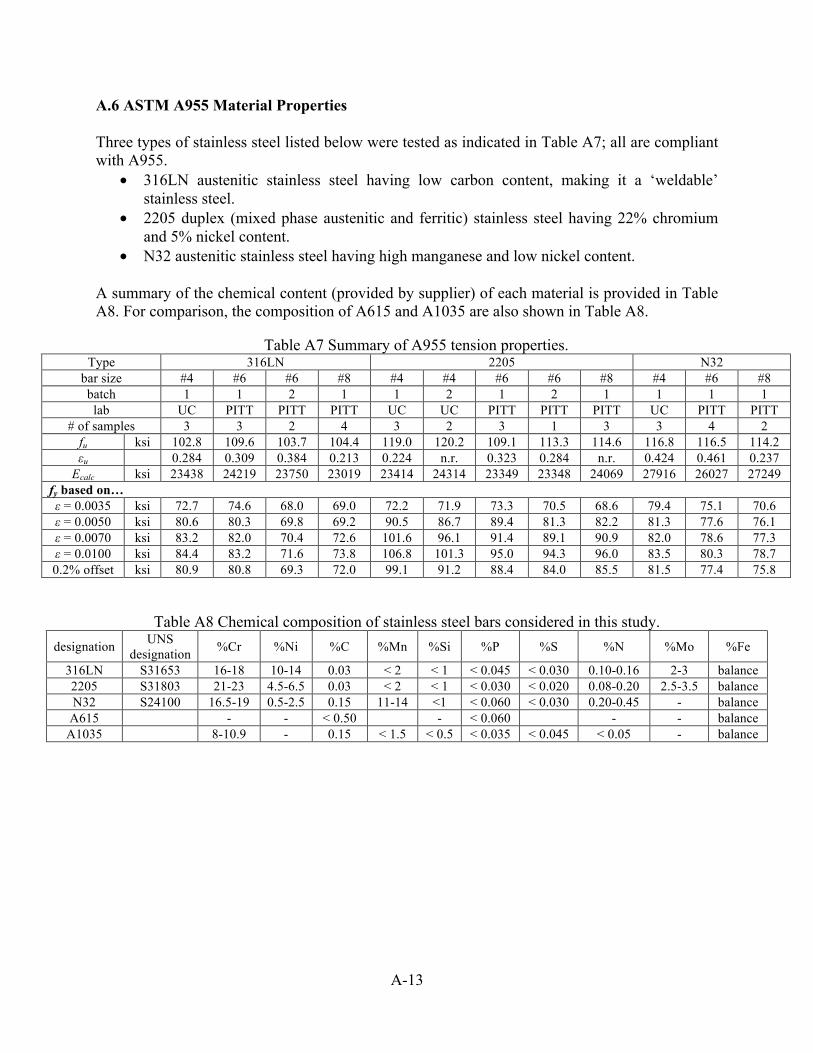
A.6 ASTM A955 Material Properties Three types of stainless steel listed below were tested as indicated in Table A7; all are compliant with A955.
• 316LN austenitic stainless steel having low carbon content, making it a ‘weldable’ stainless steel.
• 2205 duplex (mixed phase austenitic and ferritic) stainless steel having 22% chromium and 5% nickel content.
• N32 austenitic stainless steel having high manganese and low nickel content. A summary of the chemical content (provided by supplier) of each material is provided in Table A8. For comparison, the composition of A615 and A1035 are also shown in Table A8.
Table A7 Summary of A955 tension properties.
Type 316LN 2205 N32 bar size #4 #6 #6 #8 #4 #4 #6 #6 #8 #4 #6 #8 batch 1 1 2 1 1 2 1 2 1 1 1 1 lab UC PITT PITT PITT UC UC PITT PITT PITT UC PITT PITT
# of samples 3 3 2 4 3 2 3 1 3 3 4 2 fu ksi 102.8 109.6 103.7 104.4 119.0 120.2 109.1 113.3 114.6 116.8 116.5 114.2 εu 0.284 0.309 0.384 0.213 0.224 n.r. 0.323 0.284 n.r. 0.424 0.461 0.237
Ecalc ksi 23438 24219 23750 23019 23414 24314 23349 23348 24069 27916 26027 27249 fy based on… ε = 0.0035 ksi 72.7 74.6 68.0 69.0 72.2 71.9 73.3 70.5 68.6 79.4 75.1 70.6 ε = 0.0050 ksi 80.6 80.3 69.8 69.2 90.5 86.7 89.4 81.3 82.2 81.3 77.6 76.1 ε = 0.0070 ksi 83.2 82.0 70.4 72.6 101.6 96.1 91.4 89.1 90.9 82.0 78.6 77.3 ε = 0.0100 ksi 84.4 83.2 71.6 73.8 106.8 101.3 95.0 94.3 96.0 83.5 80.3 78.7 0.2% offset ksi 80.9 80.8 69.3 72.0 99.1 91.2 88.4 84.0 85.5 81.5 77.4 75.8
Table A8 Chemical composition of stainless steel bars considered in this study. designation UNS
designation %Cr %Ni %C %Mn %Si %P %S %N %Mo %Fe
316LN S31653 16-18 10-14 0.03 < 2 < 1 < 0.045 < 0.030 0.10-0.16 2-3 balance 2205 S31803 21-23 4.5-6.5 0.03 < 2 < 1 < 0.030 < 0.020 0.08-0.20 2.5-3.5 balance N32 S24100 16.5-19 0.5-2.5 0.15 11-14 <1 < 0.060 < 0.030 0.20-0.45 - balance
A615 - - < 0.50 - < 0.060 - - balance A1035 8-10.9 - 0.15 < 1.5 < 0.5 < 0.035 < 0.045 < 0.05 - balance
A-14
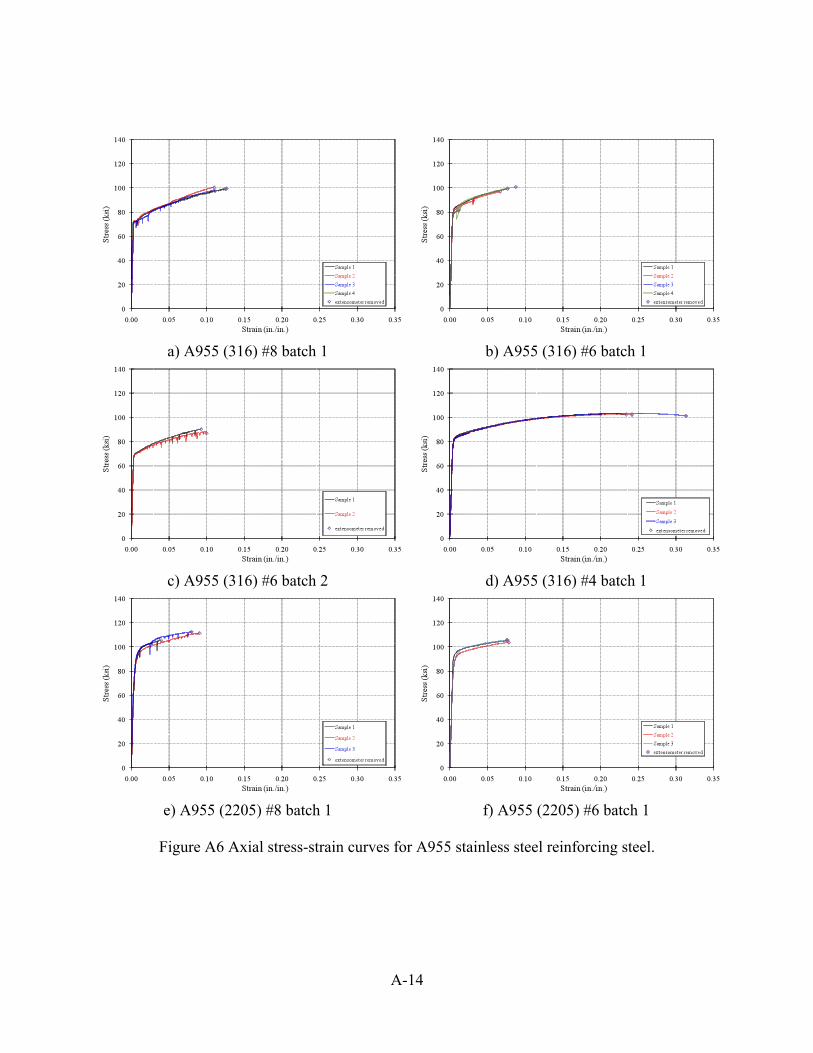
a) A955 (316) #8 batch 1 b) A955 (316) #6 batch 1
c) A955 (316) #6 batch 2 d) A955 (316) #4 batch 1
e) A955 (2205) #8 batch 1 f) A955 (2205) #6 batch 1
Figure A6 Axial stress-strain curves for A955 stainless steel reinforcing steel.
A-15
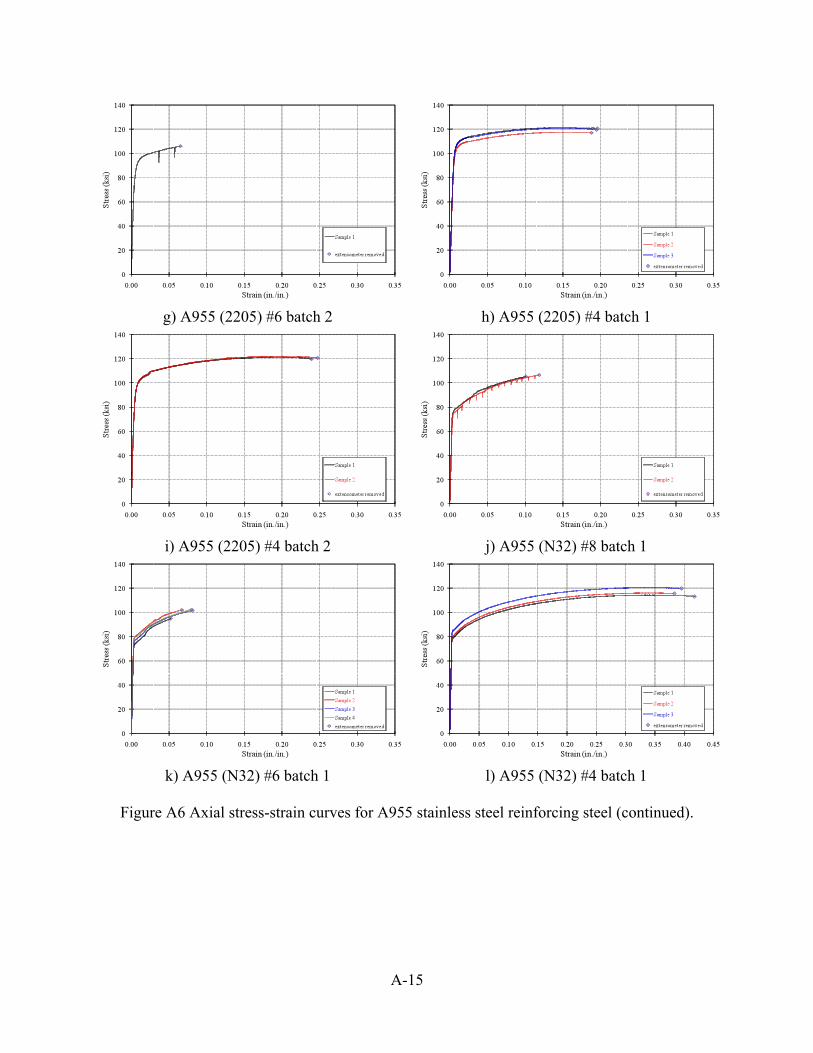
g) A955 (2205) #6 batch 2 h) A955 (2205) #4 batch 1
i) A955 (2205) #4 batch 2 j) A955 (N32) #8 batch 1
k) A955 (N32) #6 batch 1 l) A955 (N32) #4 batch 1
Figure A6 Axial stress-strain curves for A955 stainless steel reinforcing steel (continued).
A-16
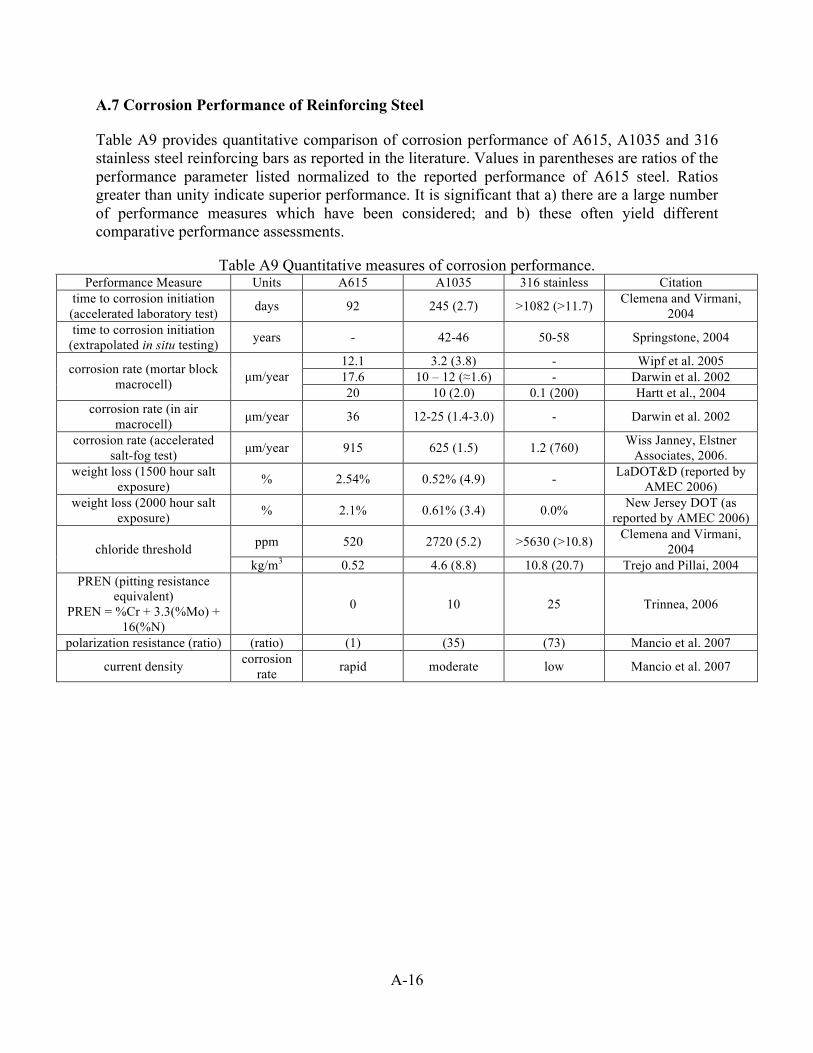
A.7 Corrosion Performance of Reinforcing Steel
Table A9 provides quantitative comparison of corrosion performance of A615, A1035 and 316 stainless steel reinforcing bars as reported in the literature. Values in parentheses are ratios of the performance parameter listed normalized to the reported performance of A615 steel. Ratios greater than unity indicate superior performance. It is significant that a) there are a large number of performance measures which have been considered; and b) these often yield different comparative performance assessments.
Table A9 Quantitative measures of corrosion performance.
Performance Measure Units A615 A1035 316 stainless Citation time to corrosion initiation (accelerated laboratory test) days 92 245 (2.7) >1082 (>11.7) Clemena and Virmani,
2004 time to corrosion initiation
(extrapolated in situ testing) years - 42-46 50-58 Springstone, 2004
12.1 3.2 (3.8) - Wipf et al. 2005 17.6 10 – 12 (≈1.6) - Darwin et al. 2002 corrosion rate (mortar block
macrocell) µm/year 20 10 (2.0) 0.1 (200) Hartt et al., 2004
corrosion rate (in air macrocell) µm/year 36 12-25 (1.4-3.0) - Darwin et al. 2002
corrosion rate (accelerated salt-fog test) µm/year 915 625 (1.5) 1.2 (760) Wiss Janney, Elstner
Associates, 2006. weight loss (1500 hour salt
exposure) % 2.54% 0.52% (4.9) - LaDOT&D (reported by AMEC 2006)
weight loss (2000 hour salt exposure) % 2.1% 0.61% (3.4) 0.0% New Jersey DOT (as
reported by AMEC 2006)
ppm 520 2720 (5.2) >5630 (>10.8) Clemena and Virmani, 2004 chloride threshold
kg/m3 0.52 4.6 (8.8) 10.8 (20.7) Trejo and Pillai, 2004 PREN (pitting resistance
equivalent) PREN = %Cr + 3.3(%Mo) +
16(%N)
0 10 25 Trinnea, 2006
polarization resistance (ratio) (ratio) (1) (35) (73) Mancio et al. 2007
current density corrosion rate rapid moderate low Mancio et al. 2007
A-17
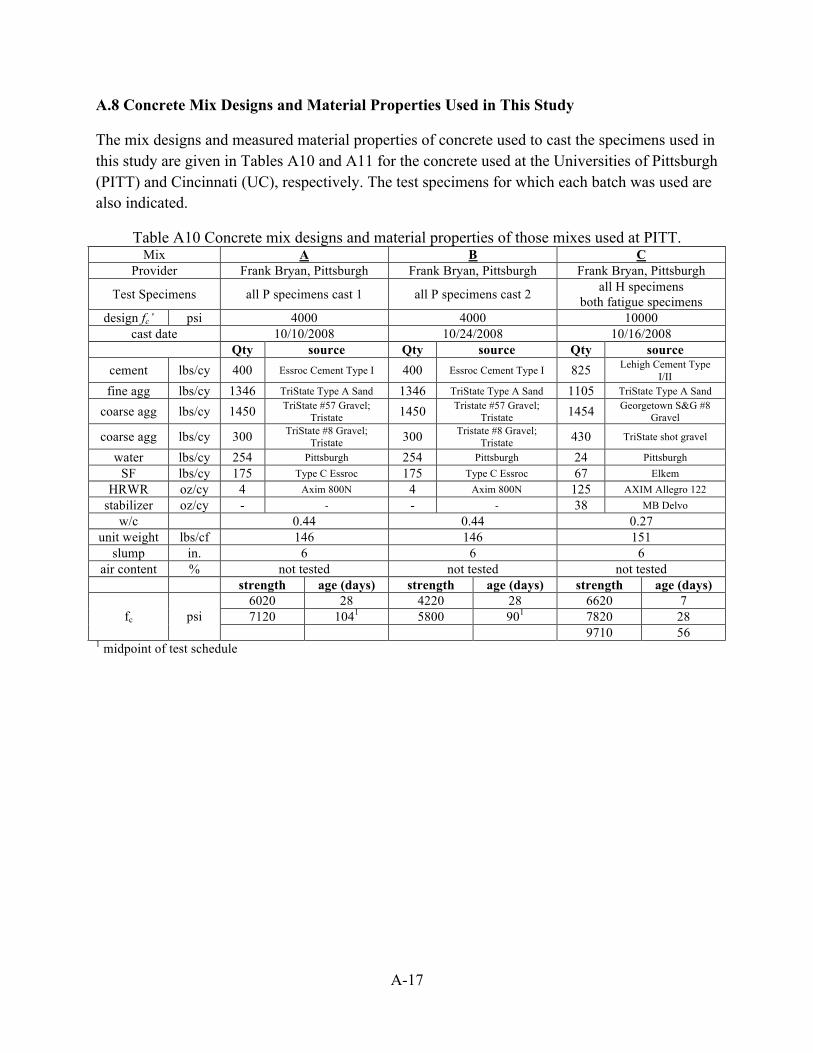
A.8 Concrete Mix Designs and Material Properties Used in This Study
The mix designs and measured material properties of concrete used to cast the specimens used in this study are given in Tables A10 and A11 for the concrete used at the Universities of Pittsburgh (PITT) and Cincinnati (UC), respectively. The test specimens for which each batch was used are also indicated.
Table A10 Concrete mix designs and material properties of those mixes used at PITT. Mix A B C
Provider Frank Bryan, Pittsburgh Frank Bryan, Pittsburgh Frank Bryan, Pittsburgh
Test Specimens all P specimens cast 1 all P specimens cast 2 all H specimens both fatigue specimens
design fc’ psi 4000 4000 10000 cast date 10/10/2008 10/24/2008 10/16/2008
Qty source Qty source Qty source cement lbs/cy 400 Essroc Cement Type I 400 Essroc Cement Type I 825 Lehigh Cement Type
I/II fine agg lbs/cy 1346 TriState Type A Sand 1346 TriState Type A Sand 1105 TriState Type A Sand
coarse agg lbs/cy 1450 TriState #57 Gravel; Tristate 1450 Tristate #57 Gravel;
Tristate 1454 Georgetown S&G #8 Gravel
coarse agg lbs/cy 300 TriState #8 Gravel; Tristate 300 Tristate #8 Gravel;
Tristate 430 TriState shot gravel
water lbs/cy 254 Pittsburgh 254 Pittsburgh 24 Pittsburgh SF lbs/cy 175 Type C Essroc 175 Type C Essroc 67 Elkem
HRWR oz/cy 4 Axim 800N 4 Axim 800N 125 AXIM Allegro 122 stabilizer oz/cy - - - - 38 MB Delvo
w/c 0.44 0.44 0.27 unit weight lbs/cf 146 146 151
slump in. 6 6 6 air content % not tested not tested not tested
strength age (days) strength age (days) strength age (days) 6020 28 4220 28 6620 7 7120 1041 5800 901 7820 28 fc psi
9710 56 1 midpoint of test schedule
A-18
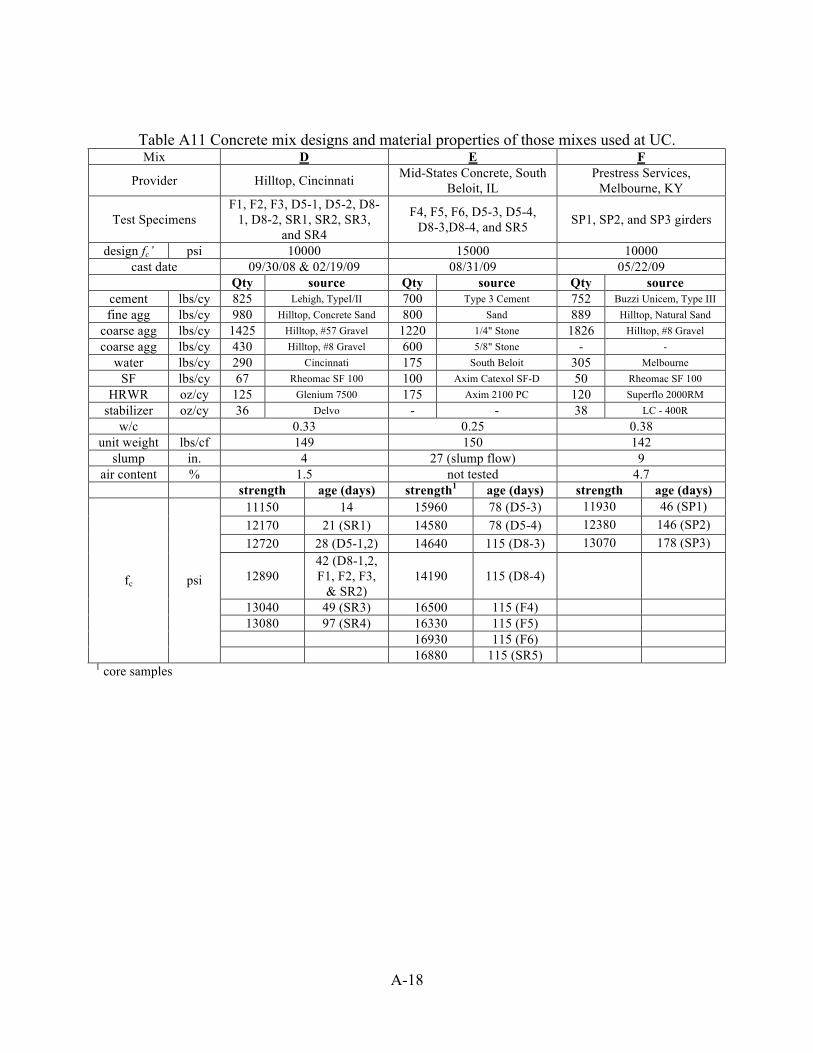
Table A11 Concrete mix designs and material properties of those mixes used at UC. Mix D E F
Provider Hilltop, Cincinnati Mid-States Concrete, South Beloit, IL
Prestress Services, Melbourne, KY
Test Specimens F1, F2, F3, D5-1, D5-2, D8-
1, D8-2, SR1, SR2, SR3, and SR4
F4, F5, F6, D5-3, D5-4, D8-3,D8-4, and SR5 SP1, SP2, and SP3 girders
design fc’ psi 10000 15000 10000 cast date 09/30/08 & 02/19/09 08/31/09 05/22/09
Qty source Qty source Qty source cement lbs/cy 825 Lehigh, TypeI/II 700 Type 3 Cement 752 Buzzi Unicem, Type III fine agg lbs/cy 980 Hilltop, Concrete Sand 800 Sand 889 Hilltop, Natural Sand
coarse agg lbs/cy 1425 Hilltop, #57 Gravel 1220 1/4" Stone 1826 Hilltop, #8 Gravel coarse agg lbs/cy 430 Hilltop, #8 Gravel 600 5/8" Stone - -
water lbs/cy 290 Cincinnati 175 South Beloit 305 Melbourne SF lbs/cy 67 Rheomac SF 100 100 Axim Catexol SF-D 50 Rheomac SF 100
HRWR oz/cy 125 Glenium 7500 175 Axim 2100 PC 120 Superflo 2000RM stabilizer oz/cy 36 Delvo - - 38 LC - 400R
w/c 0.33 0.25 0.38 unit weight lbs/cf 149 150 142
slump in. 4 27 (slump flow) 9 air content % 1.5 not tested 4.7
strength age (days) strength1 age (days) strength age (days) 11150 14 15960 78 (D5-3) 11930 46 (SP1) 12170 21 (SR1) 14580 78 (D5-4) 12380 146 (SP2) 12720 28 (D5-1,2) 14640 115 (D8-3) 13070 178 (SP3)
12890 42 (D8-1,2, F1, F2, F3,
& SR2) 14190 115 (D8-4)
13040 49 (SR3) 16500 115 (F4) 13080 97 (SR4) 16330 115 (F5)
16930 115 (F6)
fc psi
16880 115 (SR5) 1 core samples
A-19
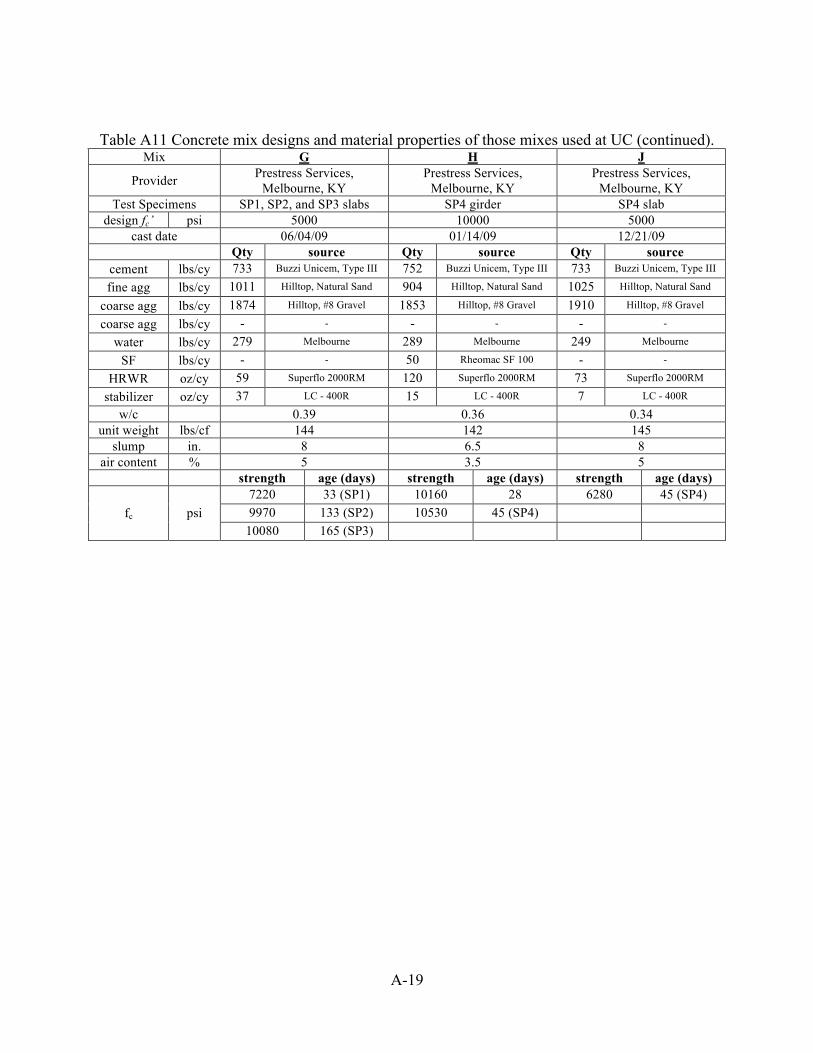
Table A11 Concrete mix designs and material properties of those mixes used at UC (continued). Mix G H J
Provider Prestress Services, Melbourne, KY
Prestress Services, Melbourne, KY
Prestress Services, Melbourne, KY
Test Specimens SP1, SP2, and SP3 slabs SP4 girder SP4 slab design fc’ psi 5000 10000 5000
cast date 06/04/09 01/14/09 12/21/09 Qty source Qty source Qty source
cement lbs/cy 733 Buzzi Unicem, Type III 752 Buzzi Unicem, Type III 733 Buzzi Unicem, Type III
fine agg lbs/cy 1011 Hilltop, Natural Sand 904 Hilltop, Natural Sand 1025 Hilltop, Natural Sand
coarse agg lbs/cy 1874 Hilltop, #8 Gravel 1853 Hilltop, #8 Gravel 1910 Hilltop, #8 Gravel
coarse agg lbs/cy - - - - - -
water lbs/cy 279 Melbourne 289 Melbourne 249 Melbourne
SF lbs/cy - - 50 Rheomac SF 100 - -
HRWR oz/cy 59 Superflo 2000RM 120 Superflo 2000RM 73 Superflo 2000RM
stabilizer oz/cy 37 LC - 400R 15 LC - 400R 7 LC - 400R
w/c 0.39 0.36 0.34 unit weight lbs/cf 144 142 145
slump in. 8 6.5 8 air content % 5 3.5 5
strength age (days) strength age (days) strength age (days) 7220 33 (SP1) 10160 28 6280 45 (SP4) 9970 133 (SP2) 10530 45 (SP4) fc psi
10080 165 (SP3)