Embed Size (px)
Citation preview
A3.2-1
Appendix 3.2: Analysis of the potential gains from switching
Contents Page
Introduction ................................................................................................................ 1
Data ............................................................................................................................ 3
Methodology ............................................................................................................... 4
Results ....................................................................................................................... 7
Annex A: Definitions ................................................................................................. 13
Annex B: Data cleaning ............................................................................................ 16
Annex C: Potential savings calculation steps ........................................................... 23
Annex D: Consumption assumptions ....................................................................... 25
Annex E: Additional tables ....................................................................................... 26
Introduction
1. Since the publication of the provisional findings report, we have extended the scope and the dimension of the analysis of the potential gains from switching (as set out in Appendix 7.4 to our provisional findings).
2. This appendix presents the updated methodology and results of our assessment of the savings in the gas and electricity bills that domestic customers of the Six Large Energy Firms and Mid-tier Suppliers could have potentially made if they had switched to:
(a) tariffs within the same supplier (internal switching);
(b) another supplier but to a tariff with the same characteristics (like-for-like switching); and
(c) any tariff and supplier (flexible switching), over the period Q1 2012 to Q2 2015.
3. We also considered a set of sensitivity tests (see paragraph 16).
4. The analysis of annual potential gains from switching provides a measure of domestic customers’ engagement with the retail markets and price differences between suppliers. We consider that a finding of material, persistent savings that go unexploited by customers would contribute to evidence of weak customer engagement in the retail domestic markets for electricity and gas in GB.
A3.2-2
5. The purpose of the analysis in this appendix is therefore to help assess the extent of weak customer response in the domestic retail energy markets in GB. The purpose of this analysis is not to measure aggregate detriment. We have carried out an assessment of the customer detriment from the AECs we have provisionally identified on the benchmark analysis of domestic energy bills, which uses a similar dataset but also considers factors such as the different costs associated with customers on different payment methods and the sustainability of individual tariffs.
6. We calculated the potential savings available to domestic customers at 14 quarterly snapshot dates from 31 March 2012 to 30 June 2015 (the Relevant Period) using data on: the tariffs to which customers were subscribing on these dates; the numbers of customers subscribing to each tariff on these dates; consumption levels by region and tariff family;1 and all tariffs available in the market at the snapshot dates, including tariffs offered by independent suppliers.2
7. The annual potential savings per customer available to dual fuel domestic customers of the Six Large Energy Firms and Mid-tier Suppliers amounted to, on average across the Relevant Period:3
(a) Internal switching scenarios:
(i) £51–£73 annually (representing savings of between 4 and 6% of the current bill) if they were customers of the Six Large Energy Firms.
(ii) £51–£64 annually (representing savings of between 4 and 5% of the current bill) if they were customers of Mid-tier Suppliers.
(b) Like-for-like scenarios:
(i) £40–£65 annually (representing savings of between 4 and 6% of the current bill) if they were customers of the Six Large Energy Firms.
(ii) £42–£72 annually (representing savings of between 3 and 5% of the current bill) if they were customers of Mid-tier Suppliers.
1 The tariff families group customers by region, meter type (Economy 7 or standard, as observed from the type of tariff they subscribe to), payment method and tariff structure (variable, fixed, capped). A description of the consumption data we use is set out in the next section of this appendix. 2 We included First Utility, Ovo Energy, Utility Warehouse, Co-operative Energy, M&S Energy, Sainsbury’s Energy and Ebico. 3 The results presented in this appendix may differ from those presented in the provisional findings, Appendix 7.4. See paragraph 10 to paragraph 16 for an explanation of the additional work undertaken since publication of the provisional findings report.
A3.2-3
(c) Flexible scenario, deducting exit fees from the annual potential savings where exit fees are charged by the current supplier:
(i) £164 annually from switching to any type of tariff and any payment method offered by any supplier (equivalent to 14% of the current bill).
(ii) £143 annually (equivalent to 11% of the current bill) if they were customers of Mid-tier Suppliers.
8. The structure of this appendix is as follows:
(a) We set out the data we have used in our analysis.
(b) We explain the methodology we have adopted.
(c) We present our results.
9. We provide further detail in the annexes:
(a) Annex A sets out the definitions used in the data and throughout this paper.
(b) Annex B describes in detail the data used for this analysis and the steps taken to clean it.
(c) Annex C explains the steps taken to calculate the annual potential gains from switching.
(d) Annex D sets out the assumptions about electricity and gas consumption used in the calculation of bills and savings.
(e) Annex E presents additional detailed results.
Data
10. The data used for the analysis combines three sets of information:
(a) Tariffs to which customers were subscribing at a given quarterly snapshot, including the number of accounts and the characteristics of each tariff.
(b) Annual data on estimated consumption at different consumption percentiles.4
4 We collected information at the 10th, 25th, 50th, 75th and 90th percentiles and the mean. Information has been provided by group of customers identified by region, meter type (Economy 7 or standard, as observed from the type of tariff they subscribe to), payment method and tariff structure (variable, fixed, capped).
A3.2-4
(c) Data on all tariffs available for subscription at the end of each quarter.5
11. Since the publication of our provisional findings report, we have collected additional information and extended the dimension of each set of data, as follows:
(a) We extended the Relevant Period of the analysis from Q1 2012 to Q2 2014 to Q1 2012 to Q2 2015.
(b) We extended the calculations of annual potential savings to customers of the four Mid-tier Suppliers (ie Co-operative Energy, First Utility, Ovo Energy, Utility Warehouse).
(c) We improved the quality of all existing data, such as missing observations and erroneous entries.
12. We consider that the updated data is representative of the majority of domestic gas and electricity tariffs over the Relevant Period (Q1 2012 to Q2 2015). See Annex B for a list of exclusions applied to the dataset.
Methodology
Dimensions and scope of analysis
13. The analysis of annual potential gains from switching calculates the savings available to groups of customers (as defined by supplier, region, current tariff characteristics and consumption) allowing under different scenarios for several dimensions of customer choice (in particular, supplier, payment method and tariff structure).
Switching scenarios
14. In the provisional findings, we defined a set of switching scenarios that differed according to their assumptions concerning the tariff, supplier and payment method characteristics that customers would be willing to switch to.
15. Since the publication of our provisional findings, we have expanded the set of scenarios, as follows:
(a) Internal switching scenarios (S1 and S2), which estimate potential gains from switching tariffs within a supplier.
5 Information provided by Energylinx, a PCW.
A3.2-5
(b) Like-for-like scenarios (S3a and S3b), which allow switching to another supplier but to a tariff with the same characteristics, such as payment method, tariff structure, online, contract length6 and preference for standard evergreen tariffs.
(c) Flexible scenario (S5), which allows customers to switch to any supplier and any tariff.
16. We have the following scenarios as sensitivities of the most flexible scenario (S5):
(a) S4a calculates gains from external switching to any tariff assuming strict preferences over online tariffs.
(b) S4b calculates gains from external switching to any tariff assuming strict preference for payment method.
(c) S4c also limits customer choice to tariffs offered by one of the Six Large Energy Firms.
(d) S5x calculates gains from external switching to any supplier and tariff deducting exit fees from the annual potential savings where exit fees are charged by the current supplier.7
6 These scenarios also restrict switching to tariffs with a similar contract length (where relevant).The contract length dimension is defined as follows. Some fixed-term tariffs have a fixed end date for their contract (regardless of when exactly a customer signed up), whereas other contracts end based on a contract length that counts from the date the customer signed up. We create a standardised contract length by using the contract ending date of the former to calculate, at first launch of tariff, the maximum length. We then use this standardised measure to classify tariffs into short- and long-term. We define short-term tariffs as those with a contract of up to and including 24 months, and long-term tariffs as those with a contract of more than 24 months. The switching scenarios S3a and S3b allow switching from short to short and from long to long fixed-term tariffs, but not switching from short to long. This restriction does not apply to non-standard variable price products that may have a limited contract, or capped tariffs. See Annex E for the composition of the electricity and gas fixed customer base. 7 We note that [].
A3.2-6
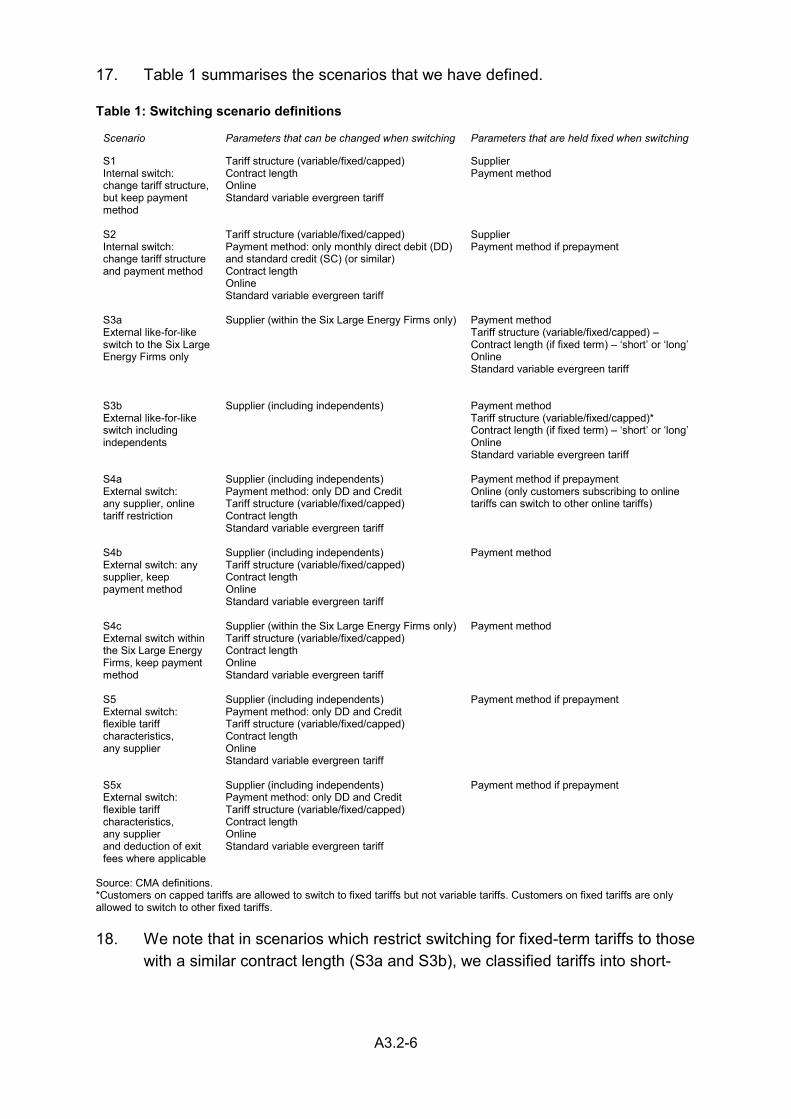
17. Table 1 summarises the scenarios that we have defined.
Table 1: Switching scenario definitions
Scenario Parameters that can be changed when switching Parameters that are held fixed when switching
S1 Internal switch: change tariff structure, but keep payment method
Tariff structure (variable/fixed/capped) Contract length Online Standard variable evergreen tariff
Supplier Payment method
S2 Internal switch: change tariff structure and payment method
Tariff structure (variable/fixed/capped) Payment method: only monthly direct debit (DD) and standard credit (SC) (or similar) Contract length Online Standard variable evergreen tariff
Supplier Payment method if prepayment
S3a External like-for-like switch to the Six Large Energy Firms only
Supplier (within the Six Large Energy Firms only)
Payment method Tariff structure (variable/fixed/capped) – Contract length (if fixed term) – ‘short’ or ‘long’ Online Standard variable evergreen tariff
S3b External like-for-like switch including independents
Supplier (including independents)
Payment method Tariff structure (variable/fixed/capped)* Contract length (if fixed term) – ‘short’ or ‘long’ Online Standard variable evergreen tariff
S4a External switch: any supplier, online tariff restriction
Supplier (including independents) Payment method: only DD and Credit Tariff structure (variable/fixed/capped) Contract length Standard variable evergreen tariff
Payment method if prepayment Online (only customers subscribing to online tariffs can switch to other online tariffs)
S4b External switch: any supplier, keep payment method
Supplier (including independents) Tariff structure (variable/fixed/capped) Contract length Online Standard variable evergreen tariff
Payment method
S4c External switch within the Six Large Energy Firms, keep payment method
Supplier (within the Six Large Energy Firms only) Tariff structure (variable/fixed/capped) Contract length Online Standard variable evergreen tariff
Payment method
S5 External switch: flexible tariff characteristics, any supplier
Supplier (including independents) Payment method: only DD and Credit Tariff structure (variable/fixed/capped) Contract length Online Standard variable evergreen tariff
Payment method if prepayment
S5x External switch: flexible tariff characteristics, any supplier and deduction of exit fees where applicable
Supplier (including independents) Payment method: only DD and Credit Tariff structure (variable/fixed/capped) Contract length Online Standard variable evergreen tariff
Payment method if prepayment
Source: CMA definitions. *Customers on capped tariffs are allowed to switch to fixed tariffs but not variable tariffs. Customers on fixed tariffs are only allowed to switch to other fixed tariffs.
18. We note that in scenarios which restrict switching for fixed-term tariffs to those with a similar contract length (S3a and S3b), we classified tariffs into short-
A3.2-7
and long-term.8 Similarly, in scenarios where payment methods are fixed (S4b and S4c), switching is still allowed within payment subtypes (for example, we do not distinguish quarterly DD and monthly DD as different payment methods). Annex B, provides a detailed description of how payment methods were grouped.
19. As a conservative approach, in each relevant scenario we excluded tariffs offered by small independent suppliers and all tariffs with unusual characteristics (for example, advance payment tariffs) from the choice set available to customers.9 This is because some of the tariffs were products that may have narrow appeal, or had very low or high prices which we were unable to verify on a systematic basis.
Calculation steps
20. We estimated potential savings for each group of customers (as defined by supplier, region, tariff, payment type and fuel type) of the Six Large Energy Firms and Mid-tier Suppliers at each quarterly snapshot from Q1 2012 to Q2 2015.
21. The annual potential savings were calculated as the difference between customers’ current bill (that is, the annual bill of a customer subscribing to a tariff at the quarterly snapshot dates based on the level of consumption that characterises the tariff family (see paragraph 6)) and the cheapest available tariff for group of customers (as defined by supplier, region, current tariff characteristics and consumption). See Annex C for a full explanation of the calculation steps.
Results
22. We calculated the following metrics: the distribution of annual potential savings and the average potential savings available to customers of the Six Large Energy Firms and Mid-tier Suppliers during the Relevant Period (Q1 2012 to Q2 2015).
8 Contract length is defined as follows: some fixed-term tariffs have a fixed end date for their contract (regardless of when exactly a customer signed up), whereas other contracts end based on a contract length that counts from the date the customer signed up. We create a standardised contract length by using the contract ending date of the former to calculate, at first launch of tariff, the maximum length. We define short-term tariffs as those with a contract of up to and including 24 months, and long-term tariffs as those with a contract of more than 24 months. 9 The small independent suppliers that were excluded are: Better Energy, Daligas, Ecotricity, Extra Energy, Flow Energy, Glide, Good Energy, Green Energy, Green Star Energy, iSupply Energy, Loco2 Energy, Pioneer Energy, Spark Energy, Utilita, Woodland Trust Energy and Zog Energy.
A3.2-8
23. In presenting our results, we have focused on the potential savings available to dual fuel customers.10 We have shown potential savings for single fuel gas and electricity customers in Annex E.
Summary statistics of potential savings
Distribution of annual potential savings
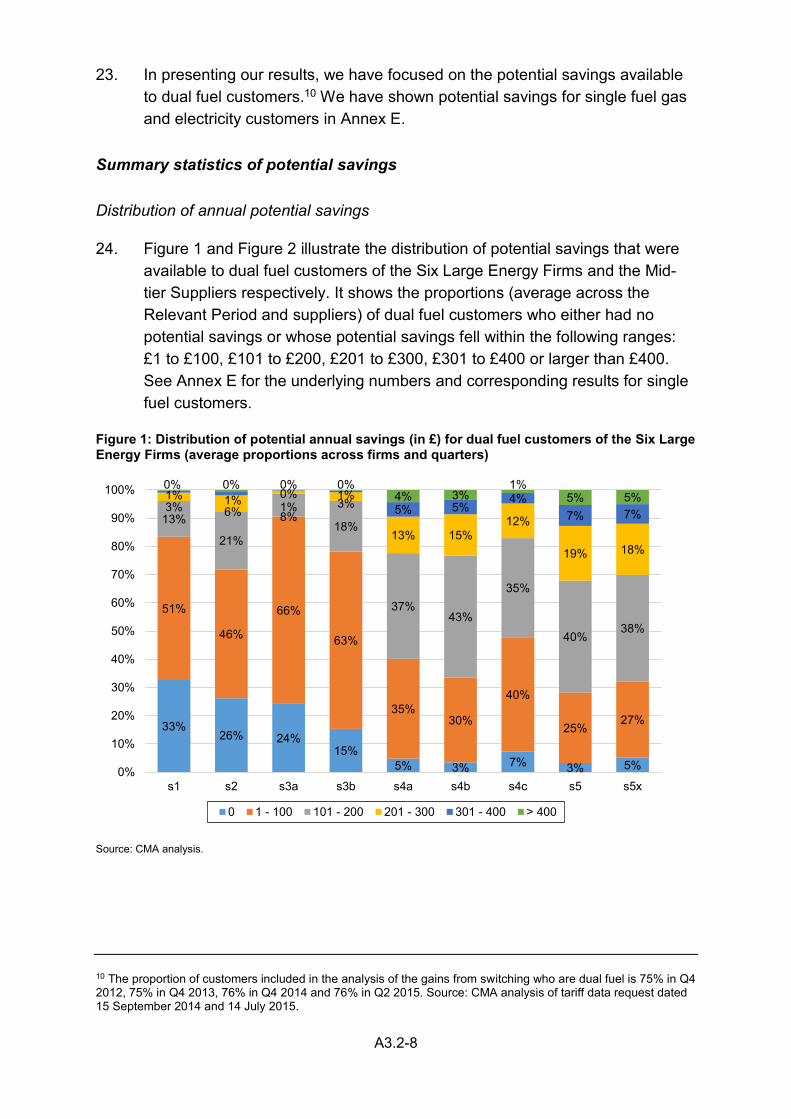
24. Figure 1 and Figure 2 illustrate the distribution of potential savings that were available to dual fuel customers of the Six Large Energy Firms and the Mid-tier Suppliers respectively. It shows the proportions (average across the Relevant Period and suppliers) of dual fuel customers who either had no potential savings or whose potential savings fell within the following ranges: £1 to £100, £101 to £200, £201 to £300, £301 to £400 or larger than £400. See Annex E for the underlying numbers and corresponding results for single fuel customers.
Figure 1: Distribution of potential annual savings (in £) for dual fuel customers of the Six Large Energy Firms (average proportions across firms and quarters)
Source: CMA analysis.
10 The proportion of customers included in the analysis of the gains from switching who are dual fuel is 75% in Q4 2012, 75% in Q4 2013, 76% in Q4 2014 and 76% in Q2 2015. Source: CMA analysis of tariff data request dated 15 September 2014 and 14 July 2015.
33%26% 24%
15%5% 3% 7% 3% 5%
51%
46%
66%
63%
35%30%
40%
25%27%
13%
21%
8%18%
37%43%
35%
40%38%
3% 6% 1% 3%
13% 15%12%
19% 18%
1% 1% 0% 1%5% 5%
4%7% 7%
0% 0% 0% 0%4% 3%
1%5% 5%
0%
10%
20%
30%
40%
50%
60%
70%
80%
90%
100%
s1 s2 s3a s3b s4a s4b s4c s5 s5x
0 1 - 100 101 - 200 201 - 300 301 - 400 > 400
A3.2-9
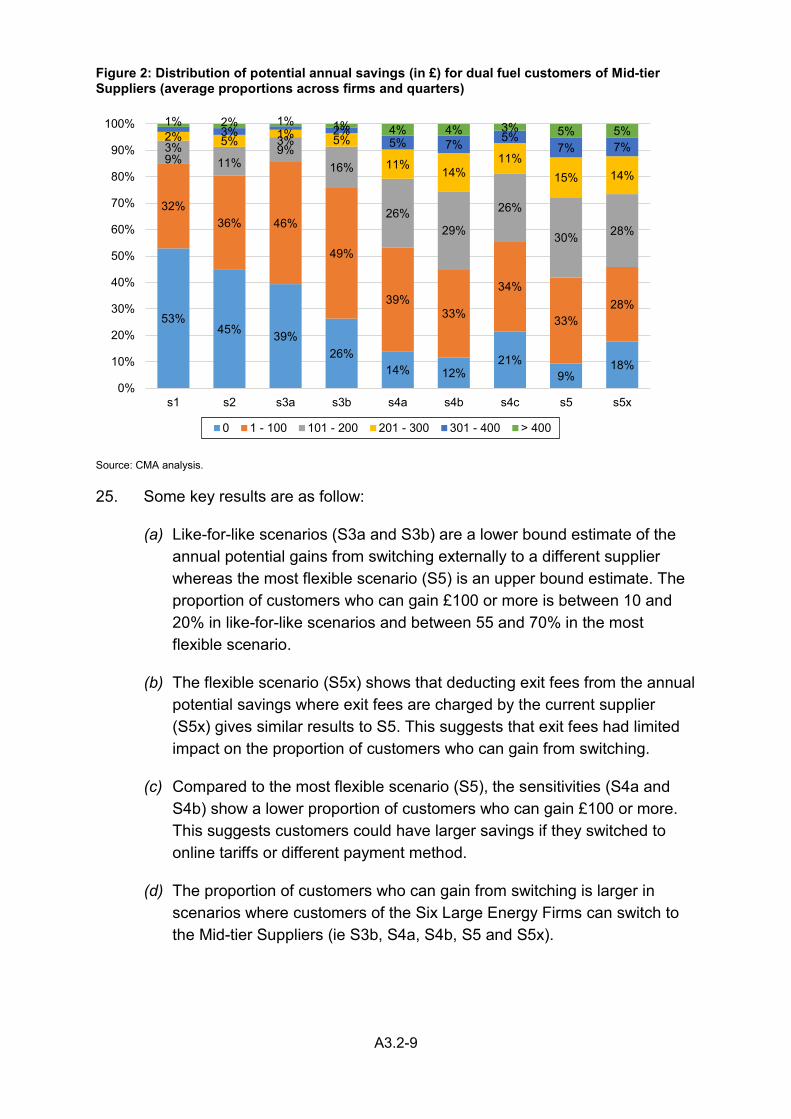
Figure 2: Distribution of potential annual savings (in £) for dual fuel customers of Mid-tier Suppliers (average proportions across firms and quarters)
Source: CMA analysis.
25. Some key results are as follow:
(a) Like-for-like scenarios (S3a and S3b) are a lower bound estimate of the annual potential gains from switching externally to a different supplier whereas the most flexible scenario (S5) is an upper bound estimate. The proportion of customers who can gain £100 or more is between 10 and 20% in like-for-like scenarios and between 55 and 70% in the most flexible scenario.
(b) The flexible scenario (S5x) shows that deducting exit fees from the annual potential savings where exit fees are charged by the current supplier (S5x) gives similar results to S5. This suggests that exit fees had limited impact on the proportion of customers who can gain from switching.
(c) Compared to the most flexible scenario (S5), the sensitivities (S4a and S4b) show a lower proportion of customers who can gain £100 or more. This suggests customers could have larger savings if they switched to online tariffs or different payment method.
(d) The proportion of customers who can gain from switching is larger in scenarios where customers of the Six Large Energy Firms can switch to the Mid-tier Suppliers (ie S3b, S4a, S4b, S5 and S5x).
53%45% 39%
26%14% 12%
21%9%
18%
32%36% 46%
49%
39%33%
34%
33%28%
9% 11%9%
16%
26%29%
26%
30% 28%
3% 5% 3% 5%
11%14%
11%15% 14%
2% 3% 1% 2%5% 7% 5%
7% 7%
1% 2% 1% 1% 4% 4% 3% 5% 5%
0%
10%
20%
30%
40%
50%
60%
70%
80%
90%
100%
s1 s2 s3a s3b s4a s4b s4c s5 s5x
0 1 - 100 101 - 200 201 - 300 301 - 400 > 400
A3.2-10
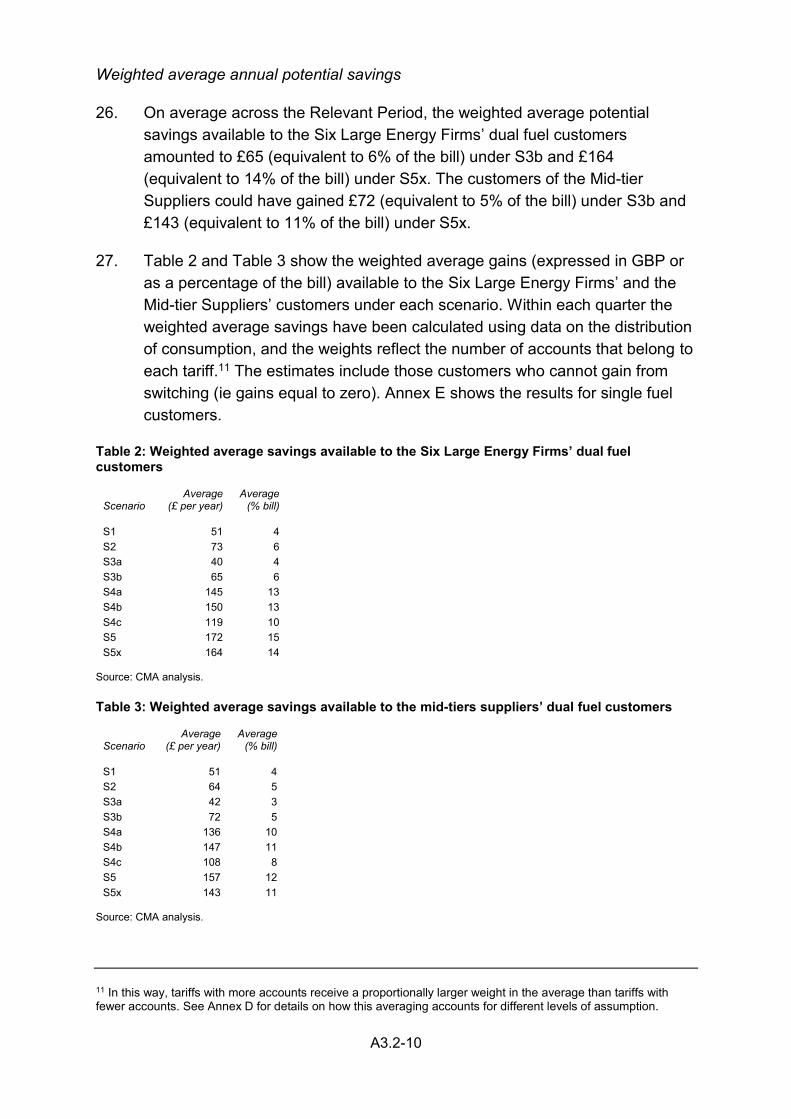
Weighted average annual potential savings
26. On average across the Relevant Period, the weighted average potential savings available to the Six Large Energy Firms’ dual fuel customers amounted to £65 (equivalent to 6% of the bill) under S3b and £164 (equivalent to 14% of the bill) under S5x. The customers of the Mid-tier Suppliers could have gained £72 (equivalent to 5% of the bill) under S3b and £143 (equivalent to 11% of the bill) under S5x.
27. Table 2 and Table 3 show the weighted average gains (expressed in GBP or as a percentage of the bill) available to the Six Large Energy Firms’ and the Mid-tier Suppliers’ customers under each scenario. Within each quarter the weighted average savings have been calculated using data on the distribution of consumption, and the weights reflect the number of accounts that belong to each tariff.11 The estimates include those customers who cannot gain from switching (ie gains equal to zero). Annex E shows the results for single fuel customers.
Table 2: Weighted average savings available to the Six Large Energy Firms’ dual fuel customers
Scenario Average
(£ per year) Average
(% bill)
S1 51 4 S2 73 6 S3a 40 4 S3b 65 6 S4a 145 13 S4b 150 13 S4c 119 10 S5 172 15 S5x 164 14
Source: CMA analysis.
Table 3: Weighted average savings available to the mid-tiers suppliers’ dual fuel customers
Scenario Average
(£ per year) Average
(% bill)
S1 51 4 S2 64 5 S3a 42 3 S3b 72 5 S4a 136 10 S4b 147 11 S4c 108 8 S5 157 12 S5x 143 11
Source: CMA analysis.
11 In this way, tariffs with more accounts receive a proportionally larger weight in the average than tariffs with fewer accounts. See Annex D for details on how this averaging accounts for different levels of assumption.
A3.2-11
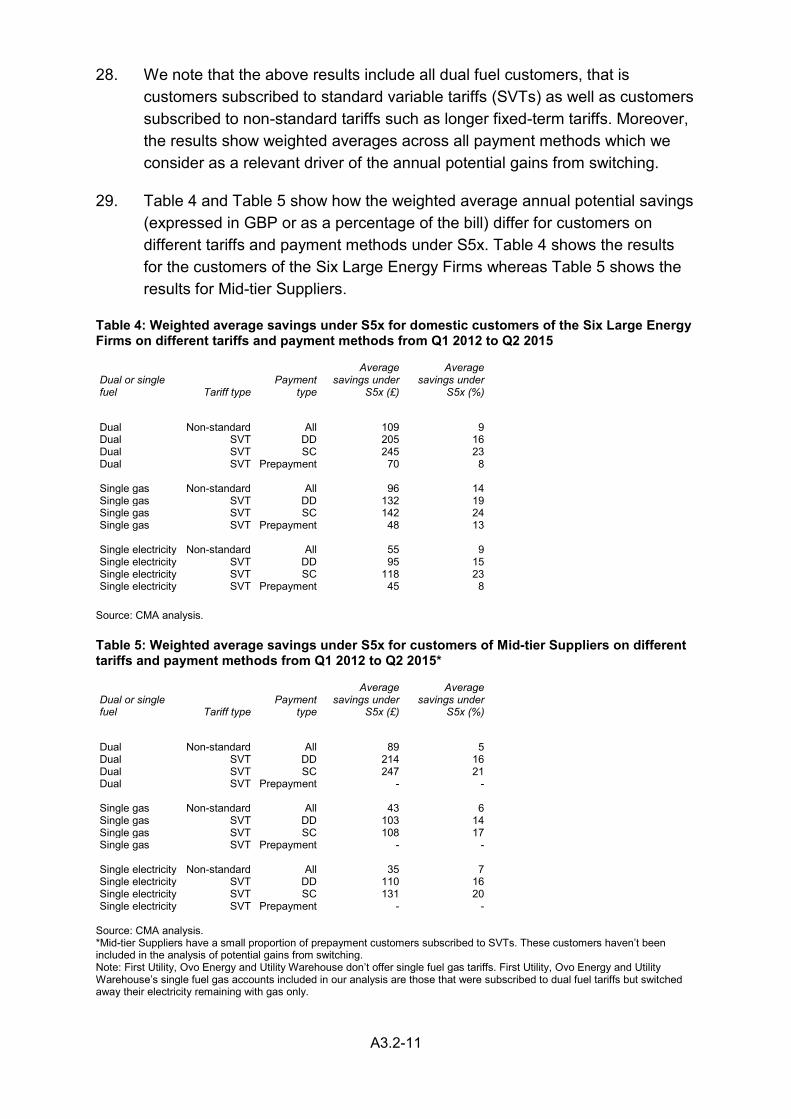
28. We note that the above results include all dual fuel customers, that is customers subscribed to standard variable tariffs (SVTs) as well as customers subscribed to non-standard tariffs such as longer fixed-term tariffs. Moreover, the results show weighted averages across all payment methods which we consider as a relevant driver of the annual potential gains from switching.
29. Table 4 and Table 5 show how the weighted average annual potential savings (expressed in GBP or as a percentage of the bill) differ for customers on different tariffs and payment methods under S5x. Table 4 shows the results for the customers of the Six Large Energy Firms whereas Table 5 shows the results for Mid-tier Suppliers.
Table 4: Weighted average savings under S5x for domestic customers of the Six Large Energy Firms on different tariffs and payment methods from Q1 2012 to Q2 2015
Dual or single fuel Tariff type
Payment type
Average savings under
S5x (£)
Average savings under
S5x (%)
Dual Non-standard All 109 9 Dual SVT DD 205 16 Dual SVT SC 245 23 Dual SVT Prepayment 70 8 Single gas Non-standard All 96 14 Single gas SVT DD 132 19 Single gas SVT SC 142 24 Single gas SVT Prepayment 48 13 Single electricity Non-standard All 55 9 Single electricity SVT DD 95 15 Single electricity SVT SC 118 23 Single electricity SVT Prepayment 45 8 Source: CMA analysis.
Table 5: Weighted average savings under S5x for customers of Mid-tier Suppliers on different tariffs and payment methods from Q1 2012 to Q2 2015*
Dual or single fuel Tariff type
Payment type
Average savings under
S5x (£)
Average savings under
S5x (%)
Dual Non-standard All 89 5 Dual SVT DD 214 16 Dual SVT SC 247 21 Dual SVT Prepayment - - Single gas Non-standard All 43 6 Single gas SVT DD 103 14 Single gas SVT SC 108 17 Single gas SVT Prepayment - - Single electricity Non-standard All 35 7 Single electricity SVT DD 110 16 Single electricity SVT SC 131 20 Single electricity SVT Prepayment - -
Source: CMA analysis. *Mid-tier Suppliers have a small proportion of prepayment customers subscribed to SVTs. These customers haven’t been included in the analysis of potential gains from switching. Note: First Utility, Ovo Energy and Utility Warehouse don’t offer single fuel gas tariffs. First Utility, Ovo Energy and Utility Warehouse’s single fuel gas accounts included in our analysis are those that were subscribed to dual fuel tariffs but switched away their electricity remaining with gas only.
A3.2-12
30. We consider the key results are as follows:
(a) The savings available to SVT customers were, on average, larger than savings available to non-standard tariff customers.
(b) The savings available to customers of the Six Large Energy Firms were, generally, higher than those for the customers of the Mid-tier Suppliers.
(c) The savings available to prepayment customers were, on average, substantially lower than those available to customers on other payment methods, reflecting the more restricted range of tariffs available to them.
(d) The savings available to SC customers were, on average, higher than those available to customers on other payment methods.
(e) The savings available to customers of the Six Large Energy Firms on single fuel tariffs were, on average, comparable to those available to their dual fuel customers.
Comparisons of potential savings over time
31. We also looked at potential savings from switching available to dual fuel customers by supplier over time. Figure 3 shows the trend of the annual potential savings (% of the bill) for dual fuel customers of the Six Large Energy Firms and the Mid-tier Suppliers under S5x.
Figure 3: Weighted average potential savings (% of the bill) available to dual fuel customers of the Six Large Energy Firms and the Mid-tier Suppliers under S5x
[] Source: CMA analysis. Notes: 1. Within each quarter the weighted averages are calculated using data on the distribution of consumption and the weights reflect the number of accounts that belong to each tariff. 2. Base: all dual fuel customers. 32. Figure 3 shows that annual potential savings are lower in the early period Q3
2012 to Q3 2014 compared to later in the period. Particularly, we note that potential savings are increasing from Q1 2014 onwards.
33. We note a similar trend in our like-for-like scenario (S3b) (see Annex E).
A3.2-13
Annex A: Definitions
1. This annex lists the definitions used in the three datasets: the supplier tariff data, consumption data and Energylinx data on available tariffs.
Tariffs, accounts and customer types
2. ‘Tariff’ refers to the product that is being supplied to the customer. It contains a set of characteristics that describe the product, such as: fuel type (single fuel, dual fuel, twin fuel), the terms of the price in the contract (variable, fixed, capped), payment method (DD, credit, prepayment and other), the price of the product, discounts directly associated with the product12 and other relevant characteristics.
3. Where a household purchases both gas and electricity, it would have two ‘accounts’. ‘Customer’ refers to a household that may have one or two accounts with one or two suppliers. Our datasets contain information on the number of accounts rather than customers.
4. We define three customer types with respect to their consumption of electricity and gas:
(a) ‘Dual fuel’ customers have electricity and gas accounts with the same supplier and receive a dual fuel discount.
(b) ‘Twin fuel’ customers have electricity and gas accounts with the same supplier but do not receive any dual fuel discount. For suppliers that do not offer dual fuel discounts or tariffs, all customers who have both electricity and gas accounts with them would be classified as twin fuel customers.
(c) ‘Single fuel’ customers have either an electricity or gas account with a given supplier. This includes customers who have accounts for electricity and gas with two different suppliers, and customers who only use one fuel (electricity).
Regions
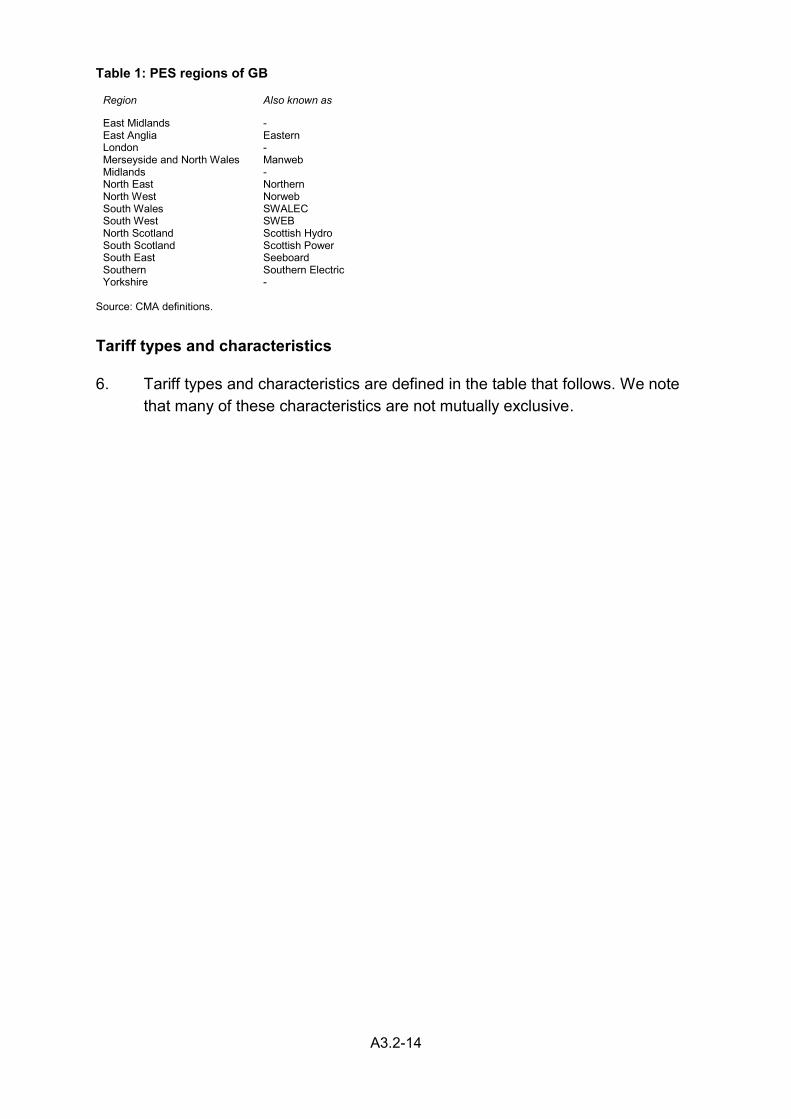
5. Tariffs and accounts for both gas and electricity have been allocated to the 14 PES regions, as defined in the table below.
12 Discounts that are generally available to customers, that is, are not specifically attached to particular tariffs, are not included in this definition. Examples of such discounts include prompt payment discounts that are awarded to any credit customers paying their bill promptly.
A3.2-14
Table 1: PES regions of GB
Region Also known as
East Midlands - East Anglia Eastern London - Merseyside and North Wales Manweb Midlands - North East Northern North West Norweb South Wales SWALEC South West SWEB North Scotland Scottish Hydro South Scotland Scottish Power South East Seeboard Southern Southern Electric Yorkshire -
Source: CMA definitions.
Tariff types and characteristics
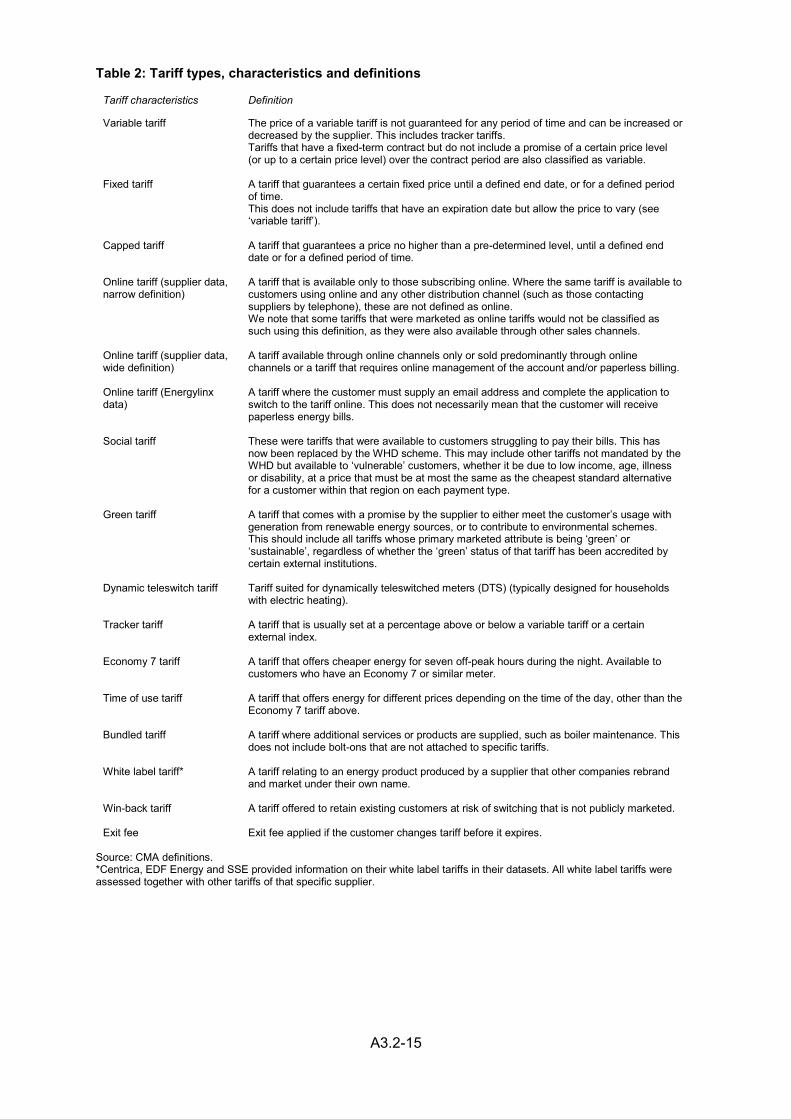
6. Tariff types and characteristics are defined in the table that follows. We note that many of these characteristics are not mutually exclusive.
A3.2-15
Table 2: Tariff types, characteristics and definitions
Tariff characteristics Definition
Variable tariff The price of a variable tariff is not guaranteed for any period of time and can be increased or decreased by the supplier. This includes tracker tariffs. Tariffs that have a fixed-term contract but do not include a promise of a certain price level (or up to a certain price level) over the contract period are also classified as variable.
Fixed tariff A tariff that guarantees a certain fixed price until a defined end date, or for a defined period of time. This does not include tariffs that have an expiration date but allow the price to vary (see ‘variable tariff’).
Capped tariff A tariff that guarantees a price no higher than a pre-determined level, until a defined end date or for a defined period of time.
Online tariff (supplier data, narrow definition)
A tariff that is available only to those subscribing online. Where the same tariff is available to customers using online and any other distribution channel (such as those contacting suppliers by telephone), these are not defined as online. We note that some tariffs that were marketed as online tariffs would not be classified as such using this definition, as they were also available through other sales channels.
Online tariff (supplier data, wide definition)
A tariff available through online channels only or sold predominantly through online channels or a tariff that requires online management of the account and/or paperless billing.
Online tariff (Energylinx data)
A tariff where the customer must supply an email address and complete the application to switch to the tariff online. This does not necessarily mean that the customer will receive paperless energy bills.
Social tariff These were tariffs that were available to customers struggling to pay their bills. This has now been replaced by the WHD scheme. This may include other tariffs not mandated by the WHD but available to ‘vulnerable’ customers, whether it be due to low income, age, illness or disability, at a price that must be at most the same as the cheapest standard alternative for a customer within that region on each payment type.
Green tariff A tariff that comes with a promise by the supplier to either meet the customer’s usage with generation from renewable energy sources, or to contribute to environmental schemes. This should include all tariffs whose primary marketed attribute is being ‘green’ or ‘sustainable’, regardless of whether the ‘green’ status of that tariff has been accredited by certain external institutions.
Dynamic teleswitch tariff Tariff suited for dynamically teleswitched meters (DTS) (typically designed for households with electric heating).
Tracker tariff A tariff that is usually set at a percentage above or below a variable tariff or a certain external index.
Economy 7 tariff A tariff that offers cheaper energy for seven off-peak hours during the night. Available to customers who have an Economy 7 or similar meter.
Time of use tariff A tariff that offers energy for different prices depending on the time of the day, other than the Economy 7 tariff above.
Bundled tariff A tariff where additional services or products are supplied, such as boiler maintenance. This does not include bolt-ons that are not attached to specific tariffs.
White label tariff* A tariff relating to an energy product produced by a supplier that other companies rebrand and market under their own name.
Win-back tariff A tariff offered to retain existing customers at risk of switching that is not publicly marketed.
Exit fee Exit fee applied if the customer changes tariff before it expires. Source: CMA definitions. *Centrica, EDF Energy and SSE provided information on their white label tariffs in their datasets. All white label tariffs were assessed together with other tariffs of that specific supplier.
A3.2-16
Annex B: Data cleaning
1. This annex summarises the structure of the supplier data (tariff and consumption datasets) and the Energylinx data of available tariffs, and the steps we took in cleaning these datasets for the analysis.
Tariff data
2. The tariff dataset includes information on the majority of domestic gas and electricity tariffs at each end of quarterly snapshots from 31 March 2008 (Q1 2008) to 30 June 2015 (Q2 2015).
3. The datasets were constructed such that each row contains the tariff name, information on the number of accounts, prices, discounts, payment method, fuel type and other relevant characteristics of a specific gas or electricity tariff. Each tariff is listed in multiple rows to accommodate the following:
(a) Separate rows to indicate dual fuel, twin fuel and single fuel customers, and the associated prices and discounts.
(b) Separate rows for each payment method associated with a product (credit, debit, prepayment or other), and the associated prices and discounts.
(c) Economy 7 and other time-of-use tariffs are also entered in rows that are separate from the equivalent standard meter tariffs, if any.
4. The data includes discounts that are directly associated with a tariff and excludes discounts that were widely available such as prompt payment discounts, loyalty rewards, credits and rebated and vulnerable customer discounts.
Exclusions
5. We have excluded the following customers from our analysis:13
(a) All customers subscribed to green tariffs. Customers subscribed to such tariffs are likely to value non-monetary characteristics of the tariff more highly than most other customers.
13 These exclusions were done because these types of tariffs tend to be niche products, may be aimed at customers with very specific preferences (for example, green tariffs), have a complex pricing structure or have limited eligibility.
A3.2-17
(b) All customers subscribed to social tariffs or other tariffs that are restricted to certain types of (mostly vulnerable) households.
(c) All customers subscribed to time-of-use tariffs other than Economy 7. The pricing structures for these tariffs can vary considerably according to meter type and across suppliers, so in the interests of data tractability we did not collect the full price information of such tariffs.
(d) All Independent Gas Transporter tariffs.
(e) All customers subscribed to tariffs where the price includes a bundle of energy and non-energy products (for example, boiler maintenance).
(f) All customers of the Six Large Energy Firms subscribed to tariffs that had less than 1,000 accounts across all regions, within a given quarter.
(g) All customers with an uncommon payment method (flagged as ‘other’).
6. We have also excluded data points that were erroneous or inconsistent:
(a) Missing data (unknown region, zero unit price).
(b) All tariffs that were erroneously recorded in the dataset and not relevant to our analysis (non-domestic tariffs or deemed tariffs).
(c) Tariffs where the price structure was inconsistent with the tariff description, or the price was not plausible (for example, extremely high).
(d) All tariffs introduced after the date of the quarterly snapshot, or those whose contract ended before the date of the quarterly snapshot.
(e) All fixed-price and fixed-term tariffs where the remaining contract length was less than three months at the date of the quarterly snapshot.
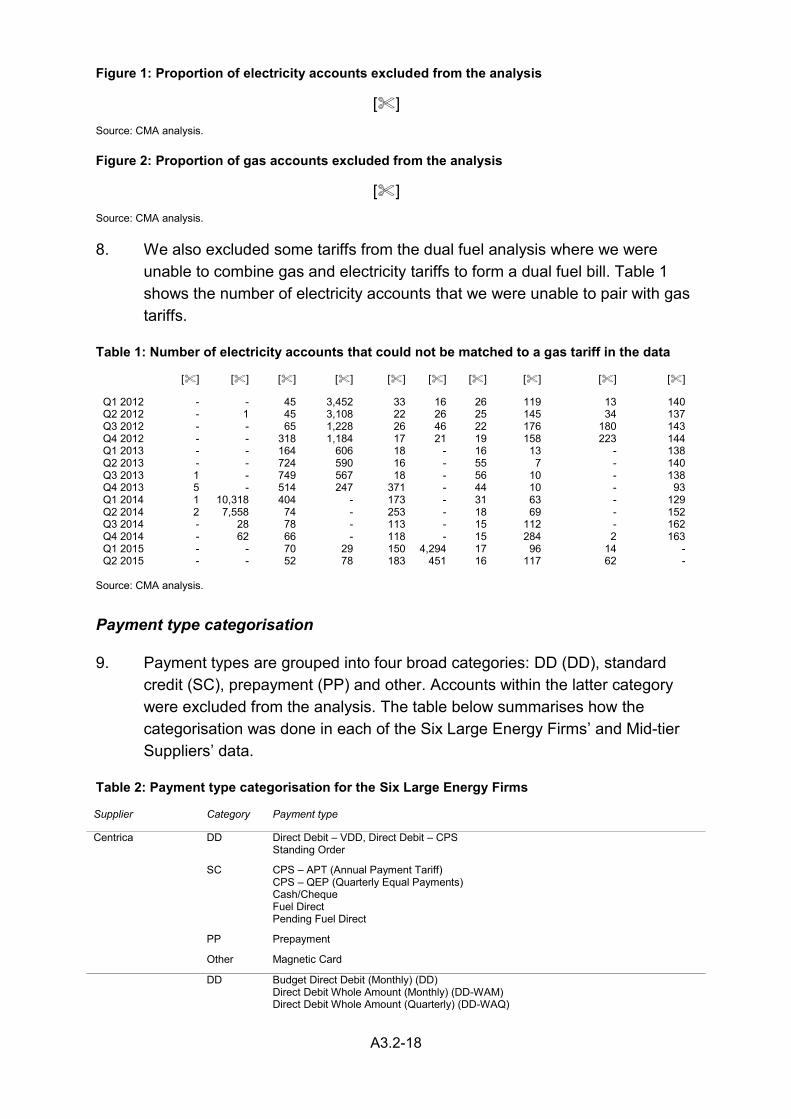
7. The graphs below summarise the proportion of accounts excluded from the analysis of the potential gains from switching.14 Generally the exclusions accounted for less than 20% of customer accounts and mostly reflected tariffs not relevant to our analysis. The proportion of excluded accounts is highest for Utility Warehouse’s electricity and gas dataset. This is because Utility Warehouse mainly offered bundles of energy and non-energy products which have not been included in our analysis (see Annex B, paragraph 5(e)).
14 We note that some suppliers excluded a list of tariffs from the datasets they submitted. This explains why for some suppliers (for example, RWE) the proportion of accounts excluded from the analysis appears to be smaller.
A3.2-18
Figure 1: Proportion of electricity accounts excluded from the analysis
[] Source: CMA analysis.
Figure 2: Proportion of gas accounts excluded from the analysis
[] Source: CMA analysis.
8. We also excluded some tariffs from the dual fuel analysis where we were unable to combine gas and electricity tariffs to form a dual fuel bill. Table 1 shows the number of electricity accounts that we were unable to pair with gas tariffs.
Table 1: Number of electricity accounts that could not be matched to a gas tariff in the data
[] [] [] [] [] [] [] [] [] []
Q1 2012 - - 45 3,452 33 16 26 119 13 140 Q2 2012 - 1 45 3,108 22 26 25 145 34 137 Q3 2012 - - 65 1,228 26 46 22 176 180 143 Q4 2012 - - 318 1,184 17 21 19 158 223 144 Q1 2013 - - 164 606 18 - 16 13 - 138 Q2 2013 - - 724 590 16 - 55 7 - 140 Q3 2013 1 - 749 567 18 - 56 10 - 138 Q4 2013 5 - 514 247 371 - 44 10 - 93 Q1 2014 1 10,318 404 - 173 - 31 63 - 129 Q2 2014 2 7,558 74 - 253 - 18 69 - 152 Q3 2014 - 28 78 - 113 - 15 112 - 162 Q4 2014 - 62 66 - 118 - 15 284 2 163 Q1 2015 - - 70 29 150 4,294 17 96 14 - Q2 2015 - - 52 78 183 451 16 117 62 -
Source: CMA analysis.
Payment type categorisation
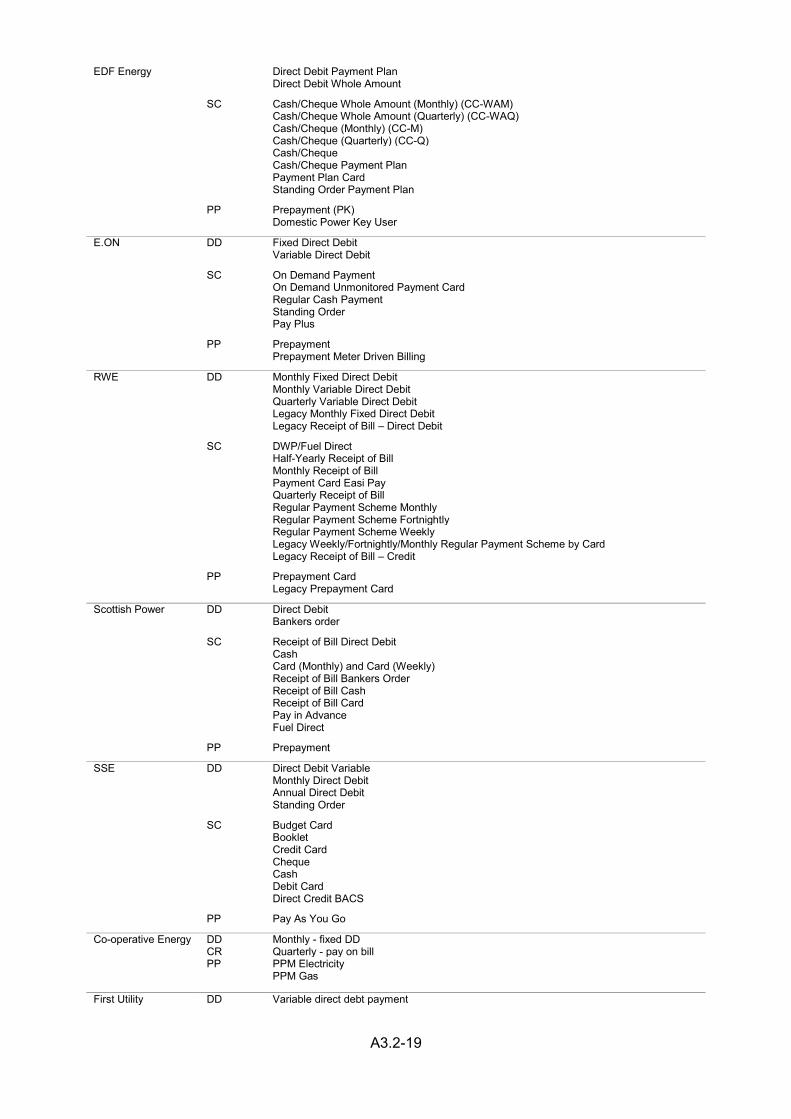
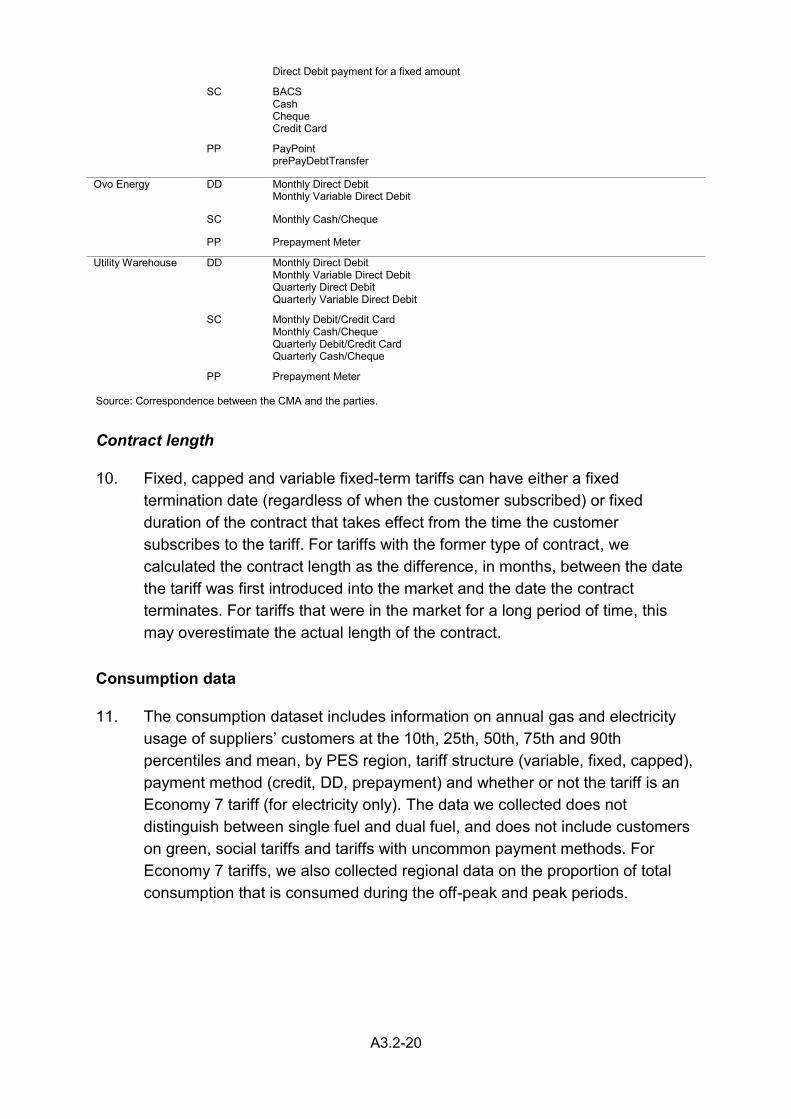
9. Payment types are grouped into four broad categories: DD (DD), standard credit (SC), prepayment (PP) and other. Accounts within the latter category were excluded from the analysis. The table below summarises how the categorisation was done in each of the Six Large Energy Firms’ and Mid-tier Suppliers’ data.
Table 2: Payment type categorisation for the Six Large Energy Firms
Supplier Category Payment type
Centrica DD Direct Debit – VDD, Direct Debit – CPS Standing Order
SC CPS – APT (Annual Payment Tariff) CPS – QEP (Quarterly Equal Payments) Cash/Cheque Fuel Direct Pending Fuel Direct
PP Prepayment
Other Magnetic Card
DD Budget Direct Debit (Monthly) (DD) Direct Debit Whole Amount (Monthly) (DD-WAM) Direct Debit Whole Amount (Quarterly) (DD-WAQ)
A3.2-19
EDF Energy Direct Debit Payment Plan Direct Debit Whole Amount
SC Cash/Cheque Whole Amount (Monthly) (CC-WAM) Cash/Cheque Whole Amount (Quarterly) (CC-WAQ) Cash/Cheque (Monthly) (CC-M) Cash/Cheque (Quarterly) (CC-Q) Cash/Cheque Cash/Cheque Payment Plan Payment Plan Card Standing Order Payment Plan
PP Prepayment (PK) Domestic Power Key User
E.ON DD Fixed Direct Debit Variable Direct Debit
SC On Demand Payment On Demand Unmonitored Payment Card Regular Cash Payment Standing Order Pay Plus
PP Prepayment Prepayment Meter Driven Billing
RWE DD Monthly Fixed Direct Debit Monthly Variable Direct Debit Quarterly Variable Direct Debit Legacy Monthly Fixed Direct Debit Legacy Receipt of Bill – Direct Debit
SC DWP/Fuel Direct Half-Yearly Receipt of Bill Monthly Receipt of Bill Payment Card Easi Pay Quarterly Receipt of Bill Regular Payment Scheme Monthly Regular Payment Scheme Fortnightly Regular Payment Scheme Weekly Legacy Weekly/Fortnightly/Monthly Regular Payment Scheme by Card Legacy Receipt of Bill – Credit
PP Prepayment Card Legacy Prepayment Card
Scottish Power DD Direct Debit Bankers order
SC Receipt of Bill Direct Debit Cash Card (Monthly) and Card (Weekly) Receipt of Bill Bankers Order Receipt of Bill Cash Receipt of Bill Card Pay in Advance Fuel Direct
PP Prepayment
SSE DD Direct Debit Variable Monthly Direct Debit Annual Direct Debit Standing Order
SC Budget Card Booklet Credit Card Cheque Cash Debit Card Direct Credit BACS
PP Pay As You Go
Co-operative Energy DD Monthly - fixed DD CR Quarterly - pay on bill PP PPM Electricity PPM Gas
First Utility DD Variable direct debt payment
A3.2-20
Direct Debit payment for a fixed amount
SC BACS Cash Cheque Credit Card
PP PayPoint prePayDebtTransfer
Ovo Energy DD Monthly Direct Debit Monthly Variable Direct Debit
SC Monthly Cash/Cheque
PP Prepayment Meter
Utility Warehouse DD Monthly Direct Debit Monthly Variable Direct Debit Quarterly Direct Debit Quarterly Variable Direct Debit
SC Monthly Debit/Credit Card Monthly Cash/Cheque Quarterly Debit/Credit Card Quarterly Cash/Cheque
PP Prepayment Meter Source: Correspondence between the CMA and the parties.
Contract length
10. Fixed, capped and variable fixed-term tariffs can have either a fixed termination date (regardless of when the customer subscribed) or fixed duration of the contract that takes effect from the time the customer subscribes to the tariff. For tariffs with the former type of contract, we calculated the contract length as the difference, in months, between the date the tariff was first introduced into the market and the date the contract terminates. For tariffs that were in the market for a long period of time, this may overestimate the actual length of the contract.
Consumption data
11. The consumption dataset includes information on annual gas and electricity usage of suppliers’ customers at the 10th, 25th, 50th, 75th and 90th percentiles and mean, by PES region, tariff structure (variable, fixed, capped), payment method (credit, DD, prepayment) and whether or not the tariff is an Economy 7 tariff (for electricity only). The data we collected does not distinguish between single fuel and dual fuel, and does not include customers on green, social tariffs and tariffs with uncommon payment methods. For Economy 7 tariffs, we also collected regional data on the proportion of total consumption that is consumed during the off-peak and peak periods.
A3.2-21
12. All consumption figures are derived from Estimated Annual Consumption (electricity) and Annual Quantity (for gas) measures on an annual basis.15 These measures were available from all suppliers on a consistent basis.
Energylinx data
13. The Energylinx dataset lists tariffs offered by all suppliers (the Six Large Energy Firms as well as independents) to domestic customers for electricity and gas at each quarterly snapshot date. The dataset does not include time-of-use tariffs other than Economy 7, green tariffs and social tariffs. The structure of the dataset is otherwise the same as that of the supplier tariff data.
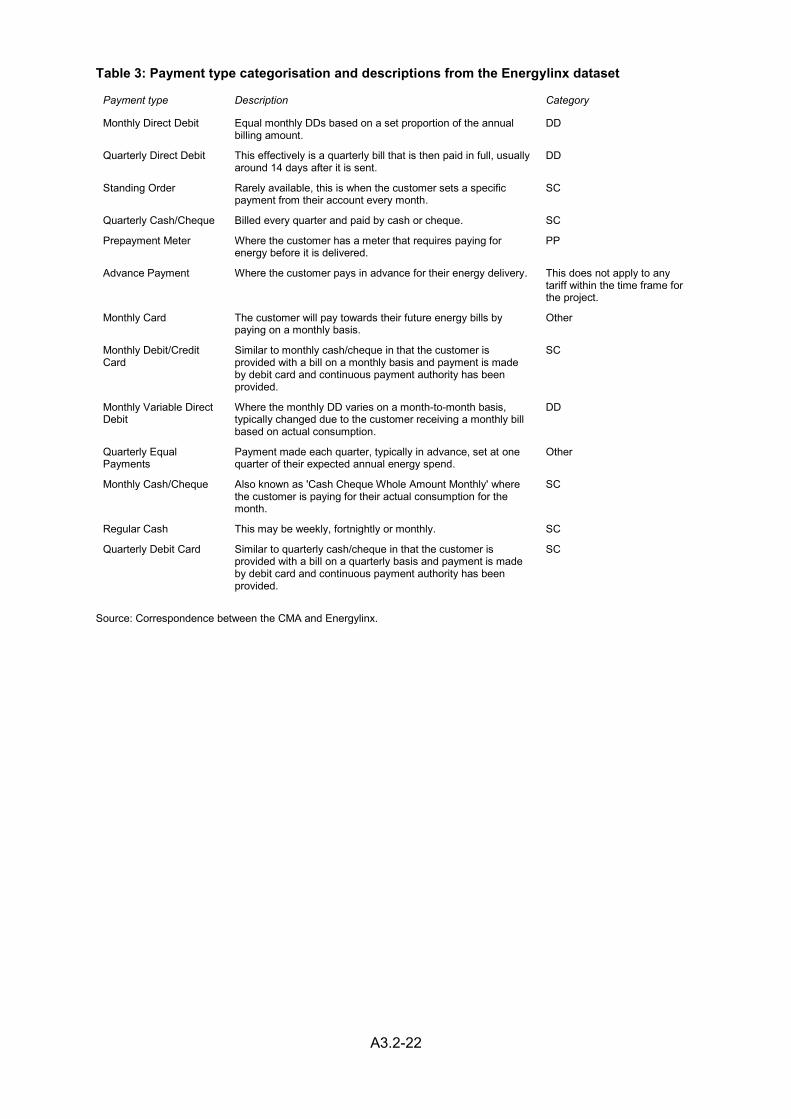
14. The table below summarises the way payment methods were categorised in this dataset. We have excluded the category ‘other’ from all switching scenarios.
15 As at 31 December 2012, 31 December 2013, 30 December 2014 and 30 June 2015.
A3.2-22
Table 3: Payment type categorisation and descriptions from the Energylinx dataset
Payment type Description Category
Monthly Direct Debit Equal monthly DDs based on a set proportion of the annual billing amount.
DD
Quarterly Direct Debit This effectively is a quarterly bill that is then paid in full, usually around 14 days after it is sent.
DD
Standing Order Rarely available, this is when the customer sets a specific payment from their account every month.
SC
Quarterly Cash/Cheque Billed every quarter and paid by cash or cheque. SC
Prepayment Meter Where the customer has a meter that requires paying for energy before it is delivered.
PP
Advance Payment Where the customer pays in advance for their energy delivery. This does not apply to any tariff within the time frame for the project.
Monthly Card The customer will pay towards their future energy bills by paying on a monthly basis.
Other
Monthly Debit/Credit Card
Similar to monthly cash/cheque in that the customer is provided with a bill on a monthly basis and payment is made by debit card and continuous payment authority has been provided.
SC
Monthly Variable Direct Debit
Where the monthly DD varies on a month-to-month basis, typically changed due to the customer receiving a monthly bill based on actual consumption.
DD
Quarterly Equal Payments
Payment made each quarter, typically in advance, set at one quarter of their expected annual energy spend.
Other
Monthly Cash/Cheque Also known as 'Cash Cheque Whole Amount Monthly' where the customer is paying for their actual consumption for the month.
SC
Regular Cash This may be weekly, fortnightly or monthly. SC
Quarterly Debit Card Similar to quarterly cash/cheque in that the customer is provided with a bill on a quarterly basis and payment is made by debit card and continuous payment authority has been provided.
SC
Source: Correspondence between the CMA and Energylinx.
A3.2-23
Annex C: Potential savings calculation steps
1. This annex described the steps we undertook to calculate the annual potential savings.
Step 1: Calculating the current bill
2. First, we calculate the current bill; that is, the annual bill of a customer subscribing to a tariff at the quarterly snapshot dates based on the levels of consumption that characterise the tariff family (see paragraph 6). For Economy 7 users we take account of the proportion of electricity used during the off-peak and peak times of the day.16
3. For single fuel tariffs, the calculated bill is a bill for only one fuel. For dual fuel and twin fuel tariffs, this is a combined gas and electricity bill.
4. To aid the calculation of dual fuel and twin fuel bills we asked the suppliers to indicate, for each electricity tariff, the gas tariff that was most commonly subscribed to by dual fuel customers on the electricity tariff. In a small number of cases the information provided was erroneous (for example, the gas tariff referred to as the most common matching pair did not exist in that quarter or region) and these tariffs had to be excluded from the dual fuel analysis. In a small number of cases, where the corresponding gas tariff could not be found, we assumed that the gas tariff was the standard variable evergreen tariff.
5. Our methodology for combining electricity and gas tariffs assumes that both accounts have the same payment method. Most of the resulting dual fuel bills are also of the same tariff structure (variable, fixed or capped), but a small number of accounts have different types for gas and electricity. Where this is the case, we use the electricity tariff’s characteristics in conducting the search for the cheapest alternative tariff.
6. For dual fuel customers we assume that their level of consumption of electricity is in the same part of the consumption distribution as their gas consumption. That is, we assume that a low consuming electricity customer is also a low consuming gas customer. We have no reason to expect that this assumption would result in a systematic error that would bias our results. The bill calculation uses the standing charge, unit rate and other price information, as well as all tariff-specific discounts. The calculated bill is an annualised bill based on the price of the tariff at the end-of-quarter date.
16 See Annex B for a more detailed description of the consumption data.
A3.2-24
7. The discounts we account for in the bill calculation are dual fuel discounts, discounts associated with payment type, and other discounts directly associated with the tariff (for example, an online discount that is part of an online tariff). Data does not include prompt-pay discounts, cash-backs or other financial or non-financial rewards that are not directly associated with the tariff but were instead widely available to customers who met certain conditions.
Step 2: Calculating the bill for the cheapest alternative tariff
8. Next, for each scenario we searched for the cheapest available tariff for each customer type (as defined by supplier, region, current tariff characteristics and consumption) as follows:
(a) For each type of customer, we filtered all available tariffs to keep only those that met the criteria set in the switching scenario.
(b) For each of the tariffs we identified by (a), we calculated an annual energy bill for each consumption level (as defined by the 10th, 25th, 50th, 75th and 90th percentiles and the mean consumption).
(c) For each consumption level, we identified the tariff (and the value of the associated bill) that offered the lowest possible bill.
(d) We recorded the result from (c) as the best available bill for that type of customer for that quarter in that switching scenario.
Step 3: Calculating the potential savings
9. The annualised potential savings for each customer group was calculated as the difference between the current bill from step 1 and best available tariff from step 2, or zero if the difference was negative.

A3.2-25
Annex D: Consumption assumptions
1. This annex explains the methodology for how we have used the consumption data in summarising the average, the range, or the distribution of the potential gains from switching.
2. For each product in our dataset we know the number of accounts associated with each of those products at the quarterly snapshot date. In addition, each of the products belongs to a tariff family (see paragraph 6 of the appendix), and for each tariff family we have data on six points of the consumption distribution: the three quartiles, the tenth and 90th percentiles, and the mean.
3. In creating summary statistics for the potential gains from switching we allocate the customers subscribed to each product to the known points of the consumption distribution. First, we assume that the three quartiles represent a third of the customers each. Second, we assume that the tenth and 90th points in the consumption distribution represent 5% of the customers each. Finally, we consider the remaining 15% of the customers to either be very low or very high consumption (likely lower than the 7.5th or higher than the 92.5th percentile of the distribution) and as such they are excluded from the summary statistics. Figure 1 illustrates these assumptions.
Figure 1: Allocation of customer accounts to points in the consumption distribution
Source: CMA analysis.
4. We note that using these assumptions would be equivalent to using the simple mean consumption value if the consumption distribution was symmetric. However, in practice the consumption distribution is skewed with a small number of very high consumption consumers. Such high consumption values are not accounted for in our analysis. For this reason our estimate of the average bill, and average gains, for the assumed consumption distribution tends to be slightly lower than what the equivalent estimate for the overall mean consumption level would be.
25% of accounts
25% of accounts
25% of accounts
5% of accounts
5% of accounts
90th 10th 25th median 75th
A3.2-26
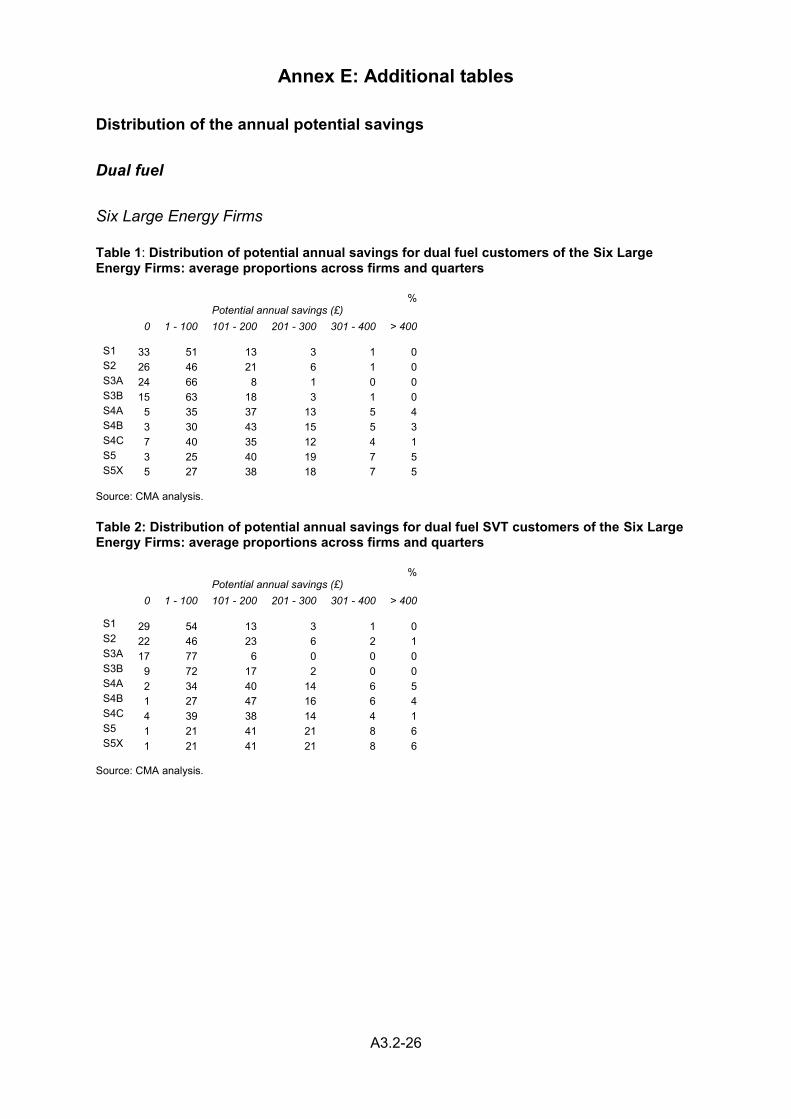
Annex E: Additional tables
Distribution of the annual potential savings
Dual fuel
Six Large Energy Firms
Table 1: Distribution of potential annual savings for dual fuel customers of the Six Large Energy Firms: average proportions across firms and quarters
% Potential annual savings (£)
0 1 - 100 101 - 200 201 - 300 301 - 400 > 400
S1 33 51 13 3 1 0 S2 26 46 21 6 1 0 S3A 24 66 8 1 0 0 S3B 15 63 18 3 1 0 S4A 5 35 37 13 5 4 S4B 3 30 43 15 5 3 S4C 7 40 35 12 4 1 S5 3 25 40 19 7 5 S5X 5 27 38 18 7 5
Source: CMA analysis. Table 2: Distribution of potential annual savings for dual fuel SVT customers of the Six Large Energy Firms: average proportions across firms and quarters
% Potential annual savings (£)
0 1 - 100 101 - 200 201 - 300 301 - 400 > 400
S1 29 54 13 3 1 0 S2 22 46 23 6 2 1 S3A 17 77 6 0 0 0 S3B 9 72 17 2 0 0 S4A 2 34 40 14 6 5 S4B 1 27 47 16 6 4 S4C 4 39 38 14 4 1 S5 1 21 41 21 8 6 S5X 1 21 41 21 8 6
Source: CMA analysis.
A3.2-27
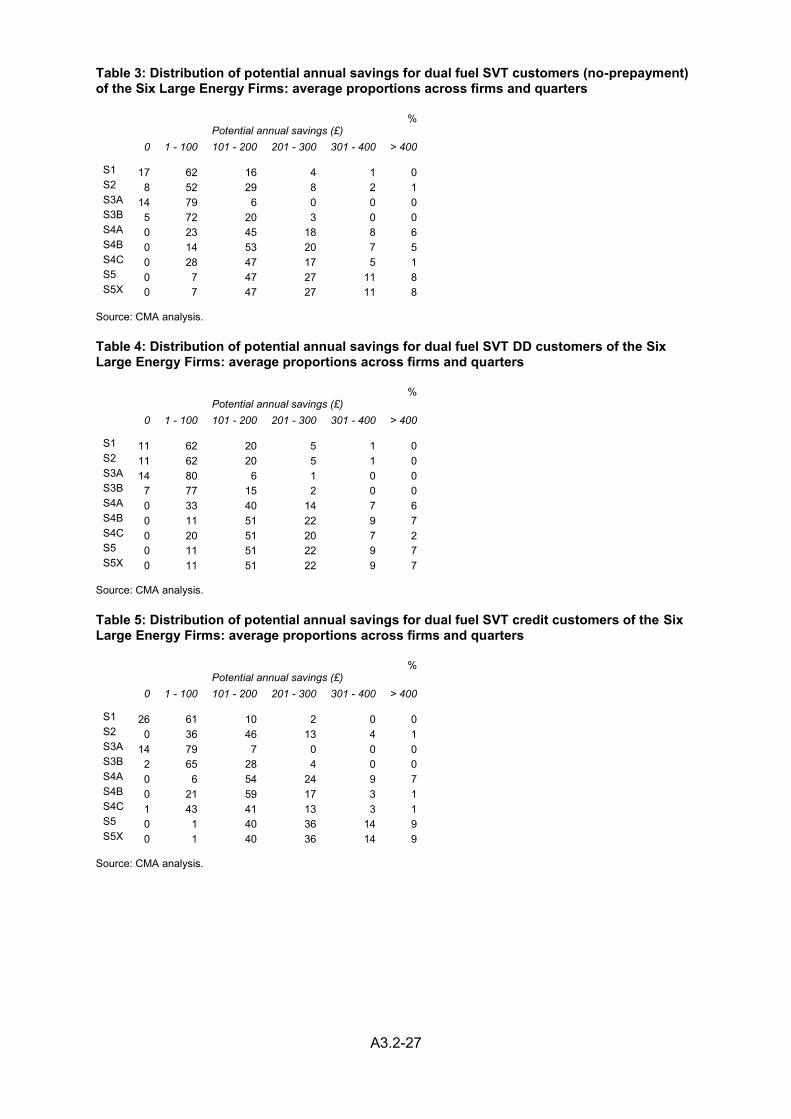
Table 3: Distribution of potential annual savings for dual fuel SVT customers (no-prepayment) of the Six Large Energy Firms: average proportions across firms and quarters
% Potential annual savings (£)
0 1 - 100 101 - 200 201 - 300 301 - 400 > 400
S1 17 62 16 4 1 0 S2 8 52 29 8 2 1 S3A 14 79 6 0 0 0 S3B 5 72 20 3 0 0 S4A 0 23 45 18 8 6 S4B 0 14 53 20 7 5 S4C 0 28 47 17 5 1 S5 0 7 47 27 11 8 S5X 0 7 47 27 11 8
Source: CMA analysis.
Table 4: Distribution of potential annual savings for dual fuel SVT DD customers of the Six Large Energy Firms: average proportions across firms and quarters
% Potential annual savings (£)
0 1 - 100 101 - 200 201 - 300 301 - 400 > 400
S1 11 62 20 5 1 0 S2 11 62 20 5 1 0 S3A 14 80 6 1 0 0 S3B 7 77 15 2 0 0 S4A 0 33 40 14 7 6 S4B 0 11 51 22 9 7 S4C 0 20 51 20 7 2 S5 0 11 51 22 9 7 S5X 0 11 51 22 9 7
Source: CMA analysis.
Table 5: Distribution of potential annual savings for dual fuel SVT credit customers of the Six Large Energy Firms: average proportions across firms and quarters
% Potential annual savings (£)
0 1 - 100 101 - 200 201 - 300 301 - 400 > 400
S1 26 61 10 2 0 0 S2 0 36 46 13 4 1 S3A 14 79 7 0 0 0 S3B 2 65 28 4 0 0 S4A 0 6 54 24 9 7 S4B 0 21 59 17 3 1 S4C 1 43 41 13 3 1 S5 0 1 40 36 14 9 S5X 0 1 40 36 14 9
Source: CMA analysis.
A3.2-28
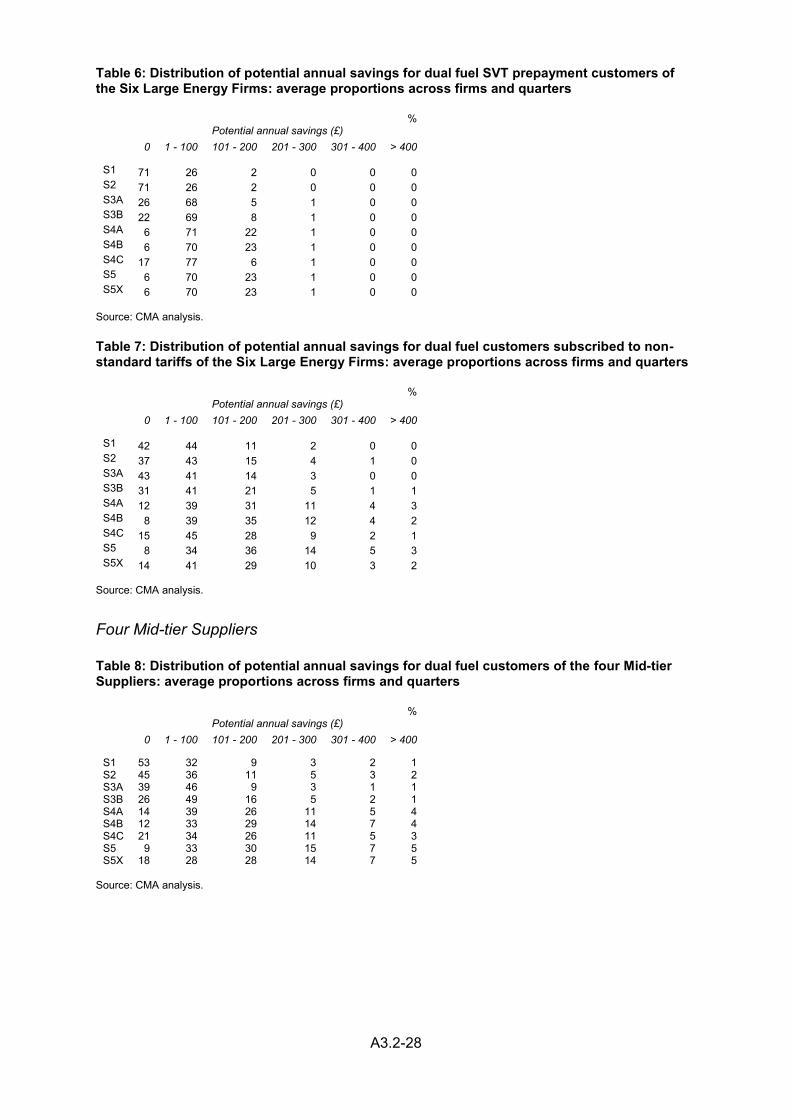
Table 6: Distribution of potential annual savings for dual fuel SVT prepayment customers of the Six Large Energy Firms: average proportions across firms and quarters
% Potential annual savings (£)
0 1 - 100 101 - 200 201 - 300 301 - 400 > 400
S1 71 26 2 0 0 0 S2 71 26 2 0 0 0 S3A 26 68 5 1 0 0 S3B 22 69 8 1 0 0 S4A 6 71 22 1 0 0 S4B 6 70 23 1 0 0 S4C 17 77 6 1 0 0 S5 6 70 23 1 0 0 S5X 6 70 23 1 0 0
Source: CMA analysis.
Table 7: Distribution of potential annual savings for dual fuel customers subscribed to non-standard tariffs of the Six Large Energy Firms: average proportions across firms and quarters
% Potential annual savings (£)
0 1 - 100 101 - 200 201 - 300 301 - 400 > 400
S1 42 44 11 2 0 0 S2 37 43 15 4 1 0 S3A 43 41 14 3 0 0 S3B 31 41 21 5 1 1 S4A 12 39 31 11 4 3 S4B 8 39 35 12 4 2 S4C 15 45 28 9 2 1 S5 8 34 36 14 5 3 S5X 14 41 29 10 3 2
Source: CMA analysis.
Four Mid-tier Suppliers
Table 8: Distribution of potential annual savings for dual fuel customers of the four Mid-tier Suppliers: average proportions across firms and quarters
% Potential annual savings (£)
0 1 - 100 101 - 200 201 - 300 301 - 400 > 400
S1 53 32 9 3 2 1 S2 45 36 11 5 3 2 S3A 39 46 9 3 1 1 S3B 26 49 16 5 2 1 S4A 14 39 26 11 5 4 S4B 12 33 29 14 7 4 S4C 21 34 26 11 5 3 S5 9 33 30 15 7 5 S5X 18 28 28 14 7 5
Source: CMA analysis.
A3.2-29
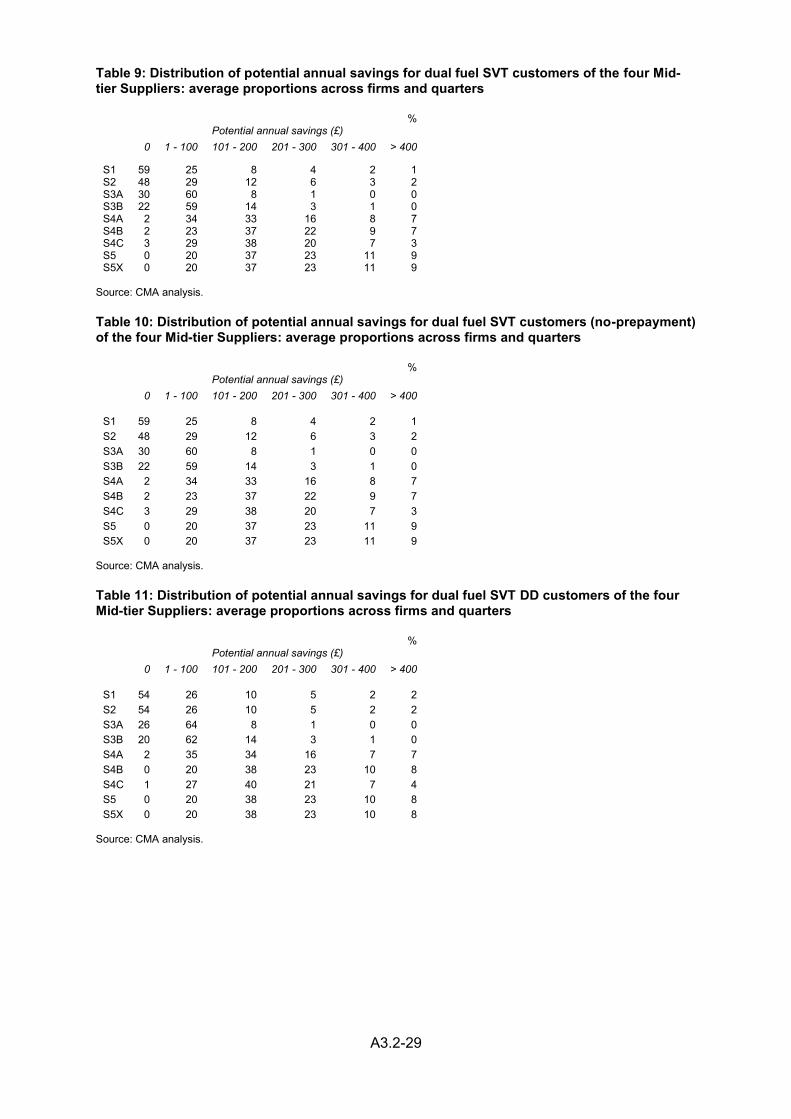
Table 9: Distribution of potential annual savings for dual fuel SVT customers of the four Mid-tier Suppliers: average proportions across firms and quarters
% Potential annual savings (£)
0 1 - 100 101 - 200 201 - 300 301 - 400 > 400
S1 59 25 8 4 2 1 S2 48 29 12 6 3 2 S3A 30 60 8 1 0 0 S3B 22 59 14 3 1 0 S4A 2 34 33 16 8 7 S4B 2 23 37 22 9 7 S4C 3 29 38 20 7 3 S5 0 20 37 23 11 9 S5X 0 20 37 23 11 9
Source: CMA analysis.
Table 10: Distribution of potential annual savings for dual fuel SVT customers (no-prepayment) of the four Mid-tier Suppliers: average proportions across firms and quarters
% Potential annual savings (£)
0 1 - 100 101 - 200 201 - 300 301 - 400 > 400
S1 59 25 8 4 2 1 S2 48 29 12 6 3 2 S3A 30 60 8 1 0 0 S3B 22 59 14 3 1 0 S4A 2 34 33 16 8 7 S4B 2 23 37 22 9 7 S4C 3 29 38 20 7 3 S5 0 20 37 23 11 9 S5X 0 20 37 23 11 9
Source: CMA analysis.
Table 11: Distribution of potential annual savings for dual fuel SVT DD customers of the four Mid-tier Suppliers: average proportions across firms and quarters
% Potential annual savings (£)
0 1 - 100 101 - 200 201 - 300 301 - 400 > 400
S1 54 26 10 5 2 2 S2 54 26 10 5 2 2 S3A 26 64 8 1 0 0 S3B 20 62 14 3 1 0 S4A 2 35 34 16 7 7 S4B 0 20 38 23 10 8 S4C 1 27 40 21 7 4 S5 0 20 38 23 10 8 S5X 0 20 38 23 10 8
Source: CMA analysis.
A3.2-30
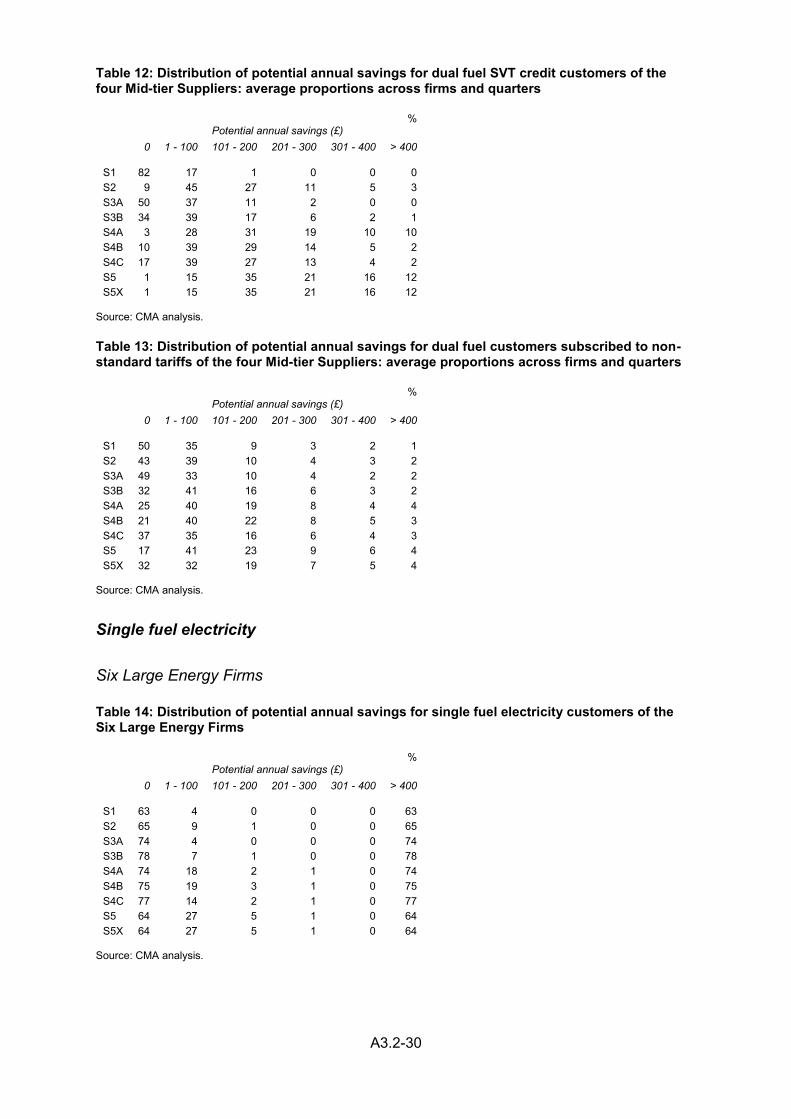
Table 12: Distribution of potential annual savings for dual fuel SVT credit customers of the four Mid-tier Suppliers: average proportions across firms and quarters
% Potential annual savings (£)
0 1 - 100 101 - 200 201 - 300 301 - 400 > 400
S1 82 17 1 0 0 0 S2 9 45 27 11 5 3 S3A 50 37 11 2 0 0 S3B 34 39 17 6 2 1 S4A 3 28 31 19 10 10 S4B 10 39 29 14 5 2 S4C 17 39 27 13 4 2 S5 1 15 35 21 16 12 S5X 1 15 35 21 16 12
Source: CMA analysis.
Table 13: Distribution of potential annual savings for dual fuel customers subscribed to non-standard tariffs of the four Mid-tier Suppliers: average proportions across firms and quarters
% Potential annual savings (£)
0 1 - 100 101 - 200 201 - 300 301 - 400 > 400
S1 50 35 9 3 2 1 S2 43 39 10 4 3 2 S3A 49 33 10 4 2 2 S3B 32 41 16 6 3 2 S4A 25 40 19 8 4 4 S4B 21 40 22 8 5 3 S4C 37 35 16 6 4 3 S5 17 41 23 9 6 4 S5X 32 32 19 7 5 4
Source: CMA analysis.
Single fuel electricity
Six Large Energy Firms
Table 14: Distribution of potential annual savings for single fuel electricity customers of the Six Large Energy Firms
% Potential annual savings (£)
0 1 - 100 101 - 200 201 - 300 301 - 400 > 400
S1 63 4 0 0 0 63 S2 65 9 1 0 0 65 S3A 74 4 0 0 0 74 S3B 78 7 1 0 0 78 S4A 74 18 2 1 0 74 S4B 75 19 3 1 0 75 S4C 77 14 2 1 0 77 S5 64 27 5 1 0 64 S5X 64 27 5 1 0 64
Source: CMA analysis.
A3.2-31
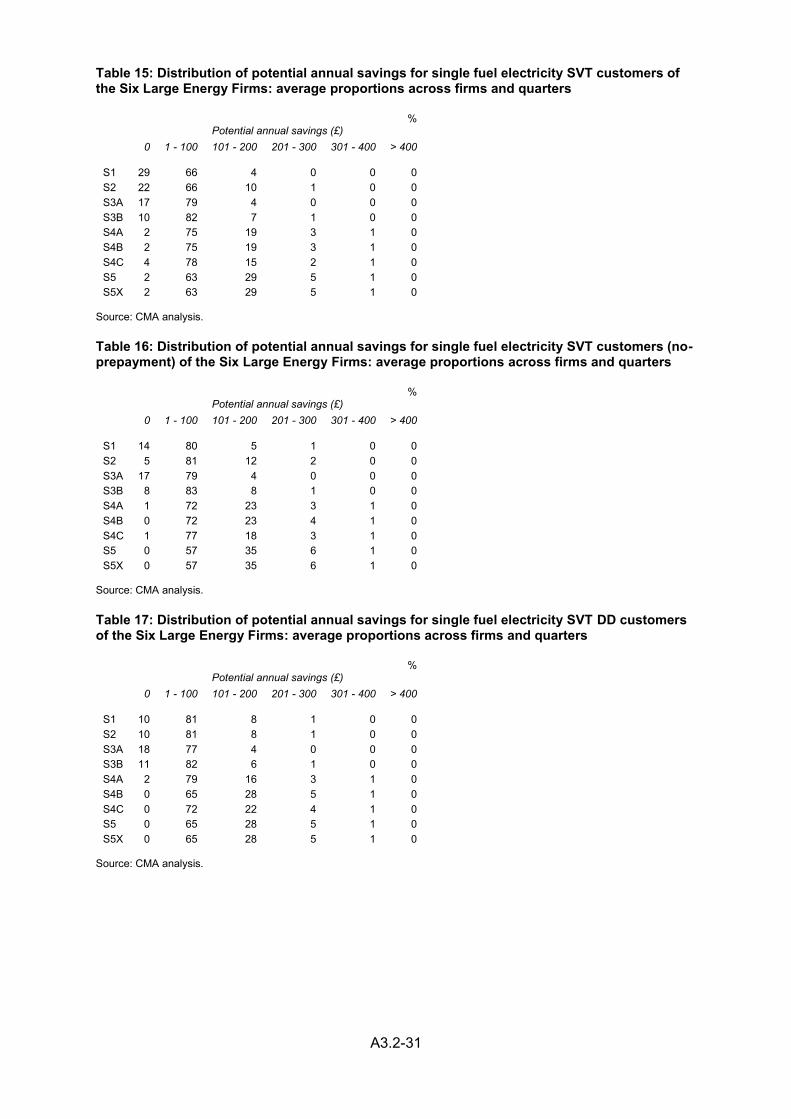
Table 15: Distribution of potential annual savings for single fuel electricity SVT customers of the Six Large Energy Firms: average proportions across firms and quarters
% Potential annual savings (£)
0 1 - 100 101 - 200 201 - 300 301 - 400 > 400
S1 29 66 4 0 0 0 S2 22 66 10 1 0 0 S3A 17 79 4 0 0 0 S3B 10 82 7 1 0 0 S4A 2 75 19 3 1 0 S4B 2 75 19 3 1 0 S4C 4 78 15 2 1 0 S5 2 63 29 5 1 0 S5X 2 63 29 5 1 0
Source: CMA analysis.
Table 16: Distribution of potential annual savings for single fuel electricity SVT customers (no-prepayment) of the Six Large Energy Firms: average proportions across firms and quarters
% Potential annual savings (£)
0 1 - 100 101 - 200 201 - 300 301 - 400 > 400
S1 14 80 5 1 0 0 S2 5 81 12 2 0 0 S3A 17 79 4 0 0 0 S3B 8 83 8 1 0 0 S4A 1 72 23 3 1 0 S4B 0 72 23 4 1 0 S4C 1 77 18 3 1 0 S5 0 57 35 6 1 0 S5X 0 57 35 6 1 0
Source: CMA analysis.
Table 17: Distribution of potential annual savings for single fuel electricity SVT DD customers of the Six Large Energy Firms: average proportions across firms and quarters
% Potential annual savings (£)
0 1 - 100 101 - 200 201 - 300 301 - 400 > 400
S1 10 81 8 1 0 0 S2 10 81 8 1 0 0 S3A 18 77 4 0 0 0 S3B 11 82 6 1 0 0 S4A 2 79 16 3 1 0 S4B 0 65 28 5 1 0 S4C 0 72 22 4 1 0 S5 0 65 28 5 1 0 S5X 0 65 28 5 1 0
Source: CMA analysis.
A3.2-32
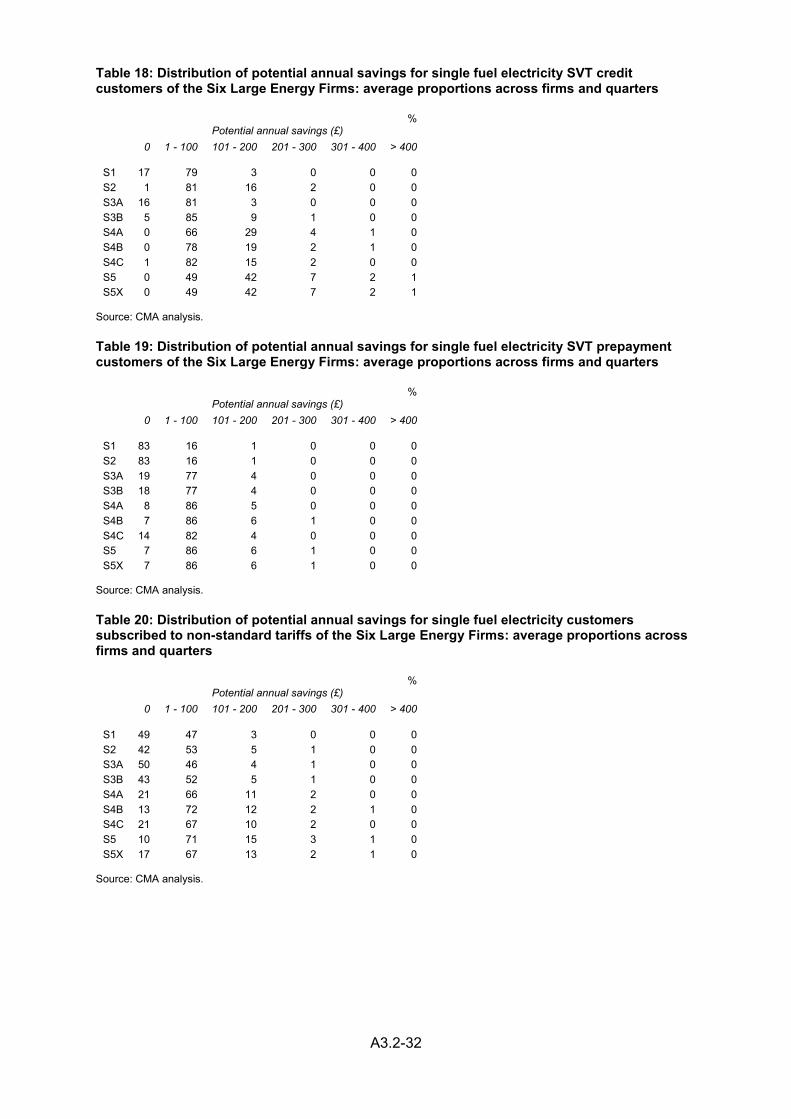
Table 18: Distribution of potential annual savings for single fuel electricity SVT credit customers of the Six Large Energy Firms: average proportions across firms and quarters
% Potential annual savings (£)
0 1 - 100 101 - 200 201 - 300 301 - 400 > 400
S1 17 79 3 0 0 0 S2 1 81 16 2 0 0 S3A 16 81 3 0 0 0 S3B 5 85 9 1 0 0 S4A 0 66 29 4 1 0 S4B 0 78 19 2 1 0 S4C 1 82 15 2 0 0 S5 0 49 42 7 2 1 S5X 0 49 42 7 2 1
Source: CMA analysis.
Table 19: Distribution of potential annual savings for single fuel electricity SVT prepayment customers of the Six Large Energy Firms: average proportions across firms and quarters
% Potential annual savings (£)
0 1 - 100 101 - 200 201 - 300 301 - 400 > 400
S1 83 16 1 0 0 0 S2 83 16 1 0 0 0 S3A 19 77 4 0 0 0 S3B 18 77 4 0 0 0 S4A 8 86 5 0 0 0 S4B 7 86 6 1 0 0 S4C 14 82 4 0 0 0 S5 7 86 6 1 0 0 S5X 7 86 6 1 0 0
Source: CMA analysis.
Table 20: Distribution of potential annual savings for single fuel electricity customers subscribed to non-standard tariffs of the Six Large Energy Firms: average proportions across firms and quarters
% Potential annual savings (£)
0 1 - 100 101 - 200 201 - 300 301 - 400 > 400
S1 49 47 3 0 0 0 S2 42 53 5 1 0 0 S3A 50 46 4 1 0 0 S3B 43 52 5 1 0 0 S4A 21 66 11 2 0 0 S4B 13 72 12 2 1 0 S4C 21 67 10 2 0 0 S5 10 71 15 3 1 0 S5X 17 67 13 2 1 0
Source: CMA analysis.
A3.2-33
Mid-tier suppliers
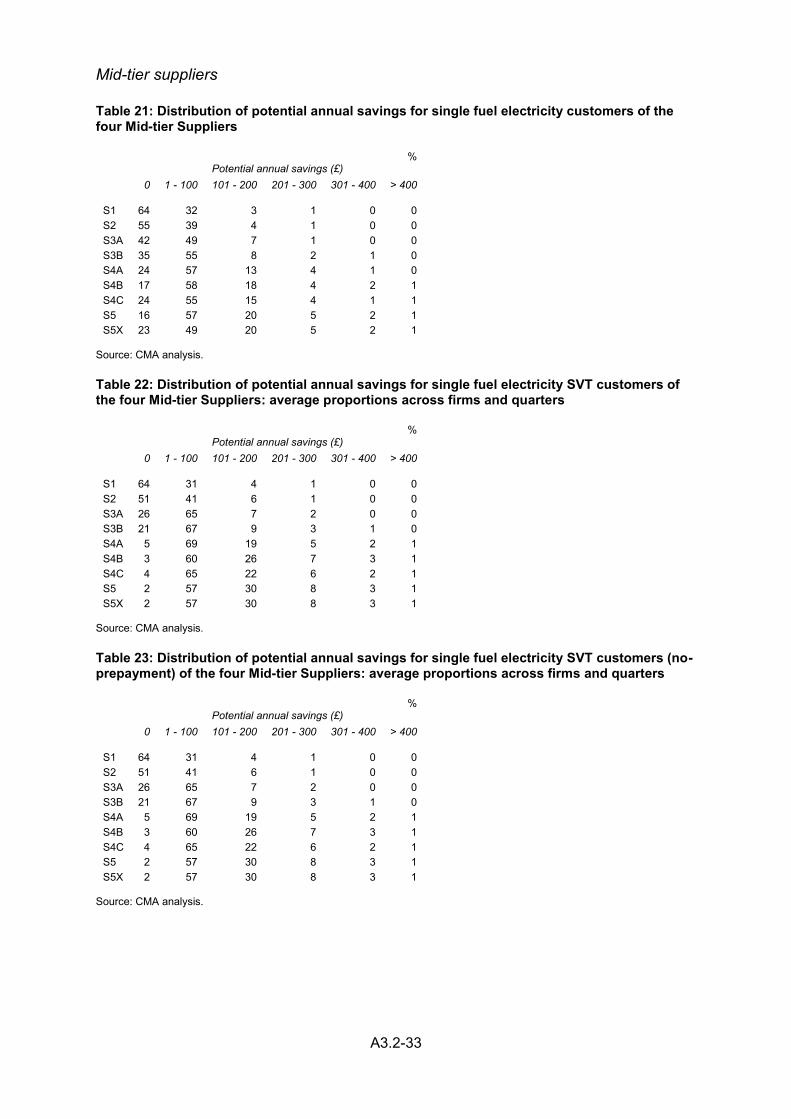
Table 21: Distribution of potential annual savings for single fuel electricity customers of the four Mid-tier Suppliers
% Potential annual savings (£)
0 1 - 100 101 - 200 201 - 300 301 - 400 > 400
S1 64 32 3 1 0 0 S2 55 39 4 1 0 0 S3A 42 49 7 1 0 0 S3B 35 55 8 2 1 0 S4A 24 57 13 4 1 0 S4B 17 58 18 4 2 1 S4C 24 55 15 4 1 1 S5 16 57 20 5 2 1 S5X 23 49 20 5 2 1
Source: CMA analysis.
Table 22: Distribution of potential annual savings for single fuel electricity SVT customers of the four Mid-tier Suppliers: average proportions across firms and quarters
% Potential annual savings (£)
0 1 - 100 101 - 200 201 - 300 301 - 400 > 400
S1 64 31 4 1 0 0 S2 51 41 6 1 0 0 S3A 26 65 7 2 0 0 S3B 21 67 9 3 1 0 S4A 5 69 19 5 2 1 S4B 3 60 26 7 3 1 S4C 4 65 22 6 2 1 S5 2 57 30 8 3 1 S5X 2 57 30 8 3 1
Source: CMA analysis.
Table 23: Distribution of potential annual savings for single fuel electricity SVT customers (no-prepayment) of the four Mid-tier Suppliers: average proportions across firms and quarters
% Potential annual savings (£)
0 1 - 100 101 - 200 201 - 300 301 - 400 > 400
S1 64 31 4 1 0 0 S2 51 41 6 1 0 0 S3A 26 65 7 2 0 0 S3B 21 67 9 3 1 0 S4A 5 69 19 5 2 1 S4B 3 60 26 7 3 1 S4C 4 65 22 6 2 1 S5 2 57 30 8 3 1 S5X 2 57 30 8 3 1
Source: CMA analysis.

A3.2-34
Table 24: Distribution of potential annual savings for single fuel electricity SVT DD customers of the four Mid-tier Suppliers: average proportions across firms and quarters
% Potential annual savings (£)
0 1 - 100 101 - 200 201 - 300 301 - 400 > 400
S1 60 34 5 1 0 0 S2 60 34 5 1 0 0 S3A 23 67 7 2 0 0 S3B 20 68 9 2 1 0 S4A 6 70 17 4 1 1 S4B 2 58 29 7 3 1 S4C 3 64 24 6 3 1 S5 2 58 29 7 3 1 S5X 2 58 29 7 3 1
Source: CMA analysis.
Table 25: Distribution of potential annual savings for single fuel electricity SVT credit customers of the four Mid-tier Suppliers: average proportions across firms and quarters
% Potential annual savings (£)
0 1 - 100 101 - 200 201 - 300 301 - 400 > 400
S1 80 19 1 0 0 0 S2 11 74 11 3 1 0 S3A 35 57 6 2 0 0 S3B 26 60 11 3 1 0 S4A 3 62 25 6 3 1 S4B 9 66 18 4 2 0 S4C 13 66 16 4 1 0 S5 1 49 35 10 3 1 S5X 1 49 35 10 3 1
Source: CMA analysis.
Table 26: Distribution of potential annual savings for single fuel electricity customers subscribed to non-standard tariffs of the four Mid-tier Suppliers: average proportions across firms and quarters
% Potential annual savings (£)
0 1 - 100 101 - 200 201 - 300 301 - 400 > 400
S1 63 34 2 1 0 0 S2 59 37 3 1 0 0 S3A 60 33 6 1 0 0 S3B 48 43 7 1 0 0 S4A 43 46 8 2 0 0 S4B 32 55 10 2 0 1 S4C 44 44 9 2 0 0 S5 29 57 10 3 0 1 S5X 45 42 9 3 0 1
Source: CMA analysis.
A3.2-35
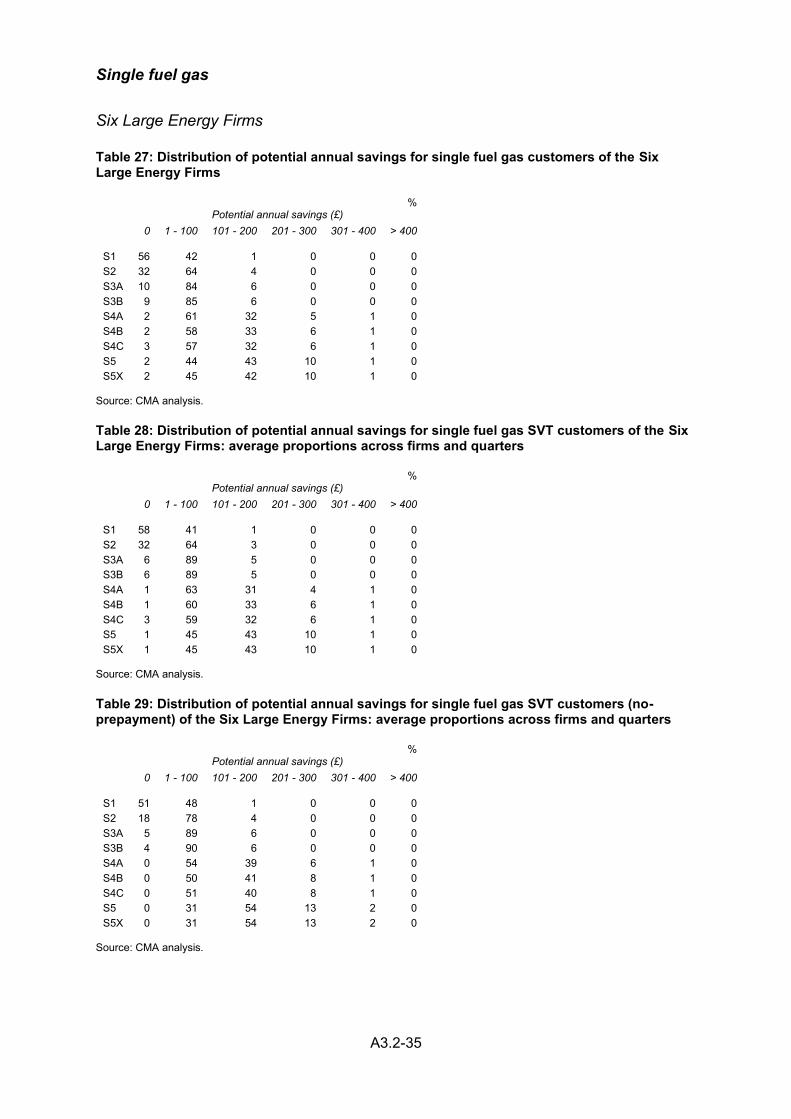
Single fuel gas
Six Large Energy Firms
Table 27: Distribution of potential annual savings for single fuel gas customers of the Six Large Energy Firms
% Potential annual savings (£)
0 1 - 100 101 - 200 201 - 300 301 - 400 > 400
S1 56 42 1 0 0 0 S2 32 64 4 0 0 0 S3A 10 84 6 0 0 0 S3B 9 85 6 0 0 0 S4A 2 61 32 5 1 0 S4B 2 58 33 6 1 0 S4C 3 57 32 6 1 0 S5 2 44 43 10 1 0 S5X 2 45 42 10 1 0
Source: CMA analysis.
Table 28: Distribution of potential annual savings for single fuel gas SVT customers of the Six Large Energy Firms: average proportions across firms and quarters
% Potential annual savings (£)
0 1 - 100 101 - 200 201 - 300 301 - 400 > 400
S1 58 41 1 0 0 0 S2 32 64 3 0 0 0 S3A 6 89 5 0 0 0 S3B 6 89 5 0 0 0 S4A 1 63 31 4 1 0 S4B 1 60 33 6 1 0 S4C 3 59 32 6 1 0 S5 1 45 43 10 1 0 S5X 1 45 43 10 1 0
Source: CMA analysis.
Table 29: Distribution of potential annual savings for single fuel gas SVT customers (no-prepayment) of the Six Large Energy Firms: average proportions across firms and quarters
% Potential annual savings (£)
0 1 - 100 101 - 200 201 - 300 301 - 400 > 400
S1 51 48 1 0 0 0 S2 18 78 4 0 0 0 S3A 5 89 6 0 0 0 S3B 4 90 6 0 0 0 S4A 0 54 39 6 1 0 S4B 0 50 41 8 1 0 S4C 0 51 40 8 1 0 S5 0 31 54 13 2 0 S5X 0 31 54 13 2 0
Source: CMA analysis.
A3.2-36
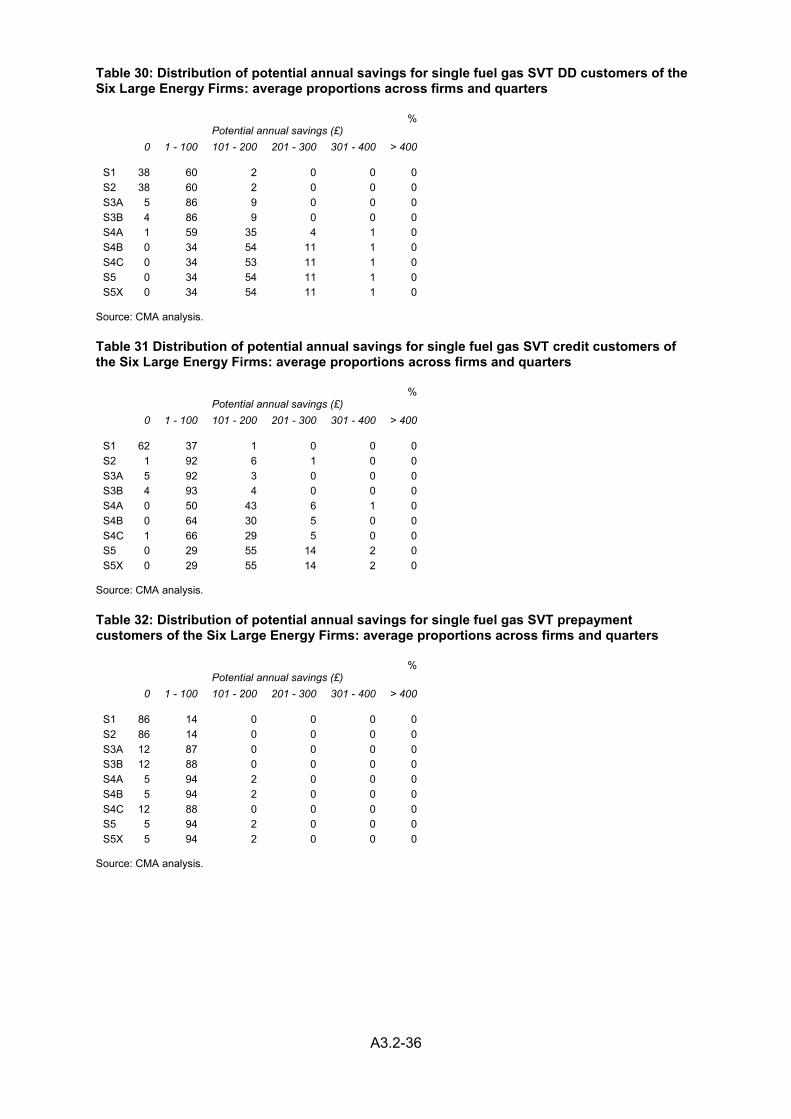
Table 30: Distribution of potential annual savings for single fuel gas SVT DD customers of the Six Large Energy Firms: average proportions across firms and quarters
% Potential annual savings (£)
0 1 - 100 101 - 200 201 - 300 301 - 400 > 400
S1 38 60 2 0 0 0 S2 38 60 2 0 0 0 S3A 5 86 9 0 0 0 S3B 4 86 9 0 0 0 S4A 1 59 35 4 1 0 S4B 0 34 54 11 1 0 S4C 0 34 53 11 1 0 S5 0 34 54 11 1 0 S5X 0 34 54 11 1 0
Source: CMA analysis.
Table 31 Distribution of potential annual savings for single fuel gas SVT credit customers of the Six Large Energy Firms: average proportions across firms and quarters
% Potential annual savings (£)
0 1 - 100 101 - 200 201 - 300 301 - 400 > 400
S1 62 37 1 0 0 0 S2 1 92 6 1 0 0 S3A 5 92 3 0 0 0 S3B 4 93 4 0 0 0 S4A 0 50 43 6 1 0 S4B 0 64 30 5 0 0 S4C 1 66 29 5 0 0 S5 0 29 55 14 2 0 S5X 0 29 55 14 2 0
Source: CMA analysis.
Table 32: Distribution of potential annual savings for single fuel gas SVT prepayment customers of the Six Large Energy Firms: average proportions across firms and quarters
% Potential annual savings (£)
0 1 - 100 101 - 200 201 - 300 301 - 400 > 400
S1 86 14 0 0 0 0 S2 86 14 0 0 0 0 S3A 12 87 0 0 0 0 S3B 12 88 0 0 0 0 S4A 5 94 2 0 0 0 S4B 5 94 2 0 0 0 S4C 12 88 0 0 0 0 S5 5 94 2 0 0 0 S5X 5 94 2 0 0 0
Source: CMA analysis.
A3.2-37
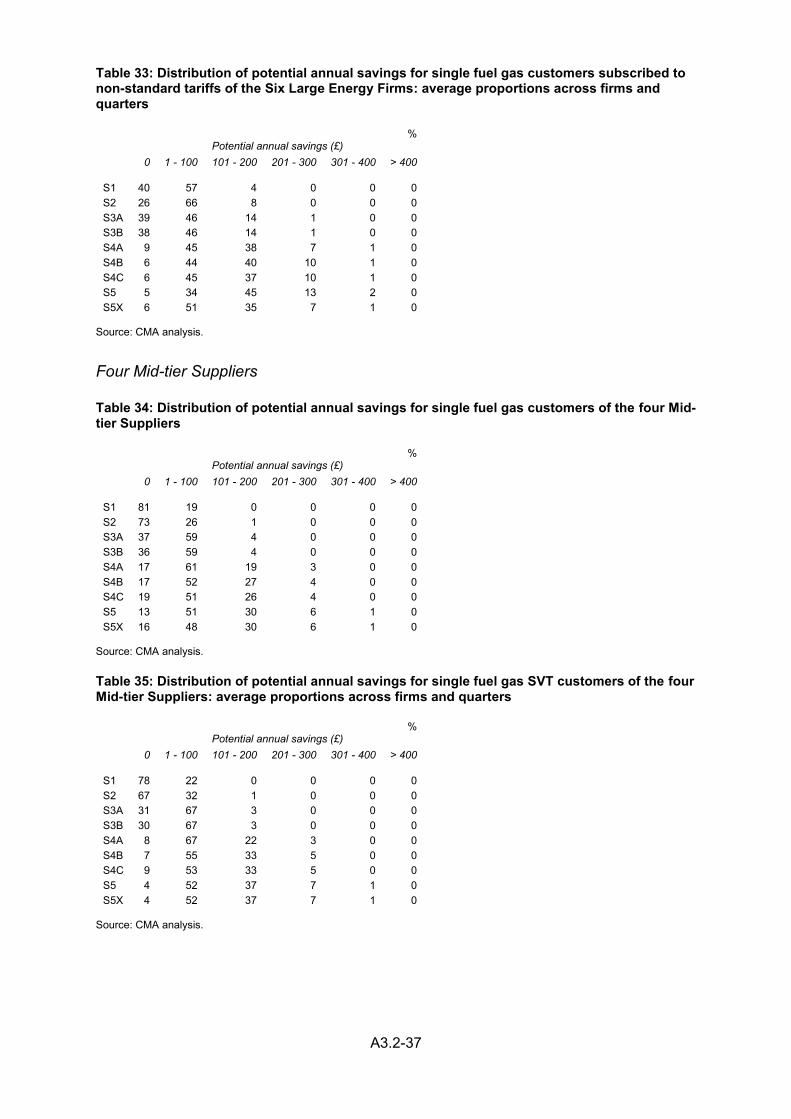
Table 33: Distribution of potential annual savings for single fuel gas customers subscribed to non-standard tariffs of the Six Large Energy Firms: average proportions across firms and quarters
% Potential annual savings (£)
0 1 - 100 101 - 200 201 - 300 301 - 400 > 400
S1 40 57 4 0 0 0 S2 26 66 8 0 0 0 S3A 39 46 14 1 0 0 S3B 38 46 14 1 0 0 S4A 9 45 38 7 1 0 S4B 6 44 40 10 1 0 S4C 6 45 37 10 1 0 S5 5 34 45 13 2 0 S5X 6 51 35 7 1 0
Source: CMA analysis.
Four Mid-tier Suppliers
Table 34: Distribution of potential annual savings for single fuel gas customers of the four Mid-tier Suppliers
% Potential annual savings (£)
0 1 - 100 101 - 200 201 - 300 301 - 400 > 400
S1 81 19 0 0 0 0 S2 73 26 1 0 0 0 S3A 37 59 4 0 0 0 S3B 36 59 4 0 0 0 S4A 17 61 19 3 0 0 S4B 17 52 27 4 0 0 S4C 19 51 26 4 0 0 S5 13 51 30 6 1 0 S5X 16 48 30 6 1 0
Source: CMA analysis.
Table 35: Distribution of potential annual savings for single fuel gas SVT customers of the four Mid-tier Suppliers: average proportions across firms and quarters
% Potential annual savings (£)
0 1 - 100 101 - 200 201 - 300 301 - 400 > 400
S1 78 22 0 0 0 0 S2 67 32 1 0 0 0 S3A 31 67 3 0 0 0 S3B 30 67 3 0 0 0 S4A 8 67 22 3 0 0 S4B 7 55 33 5 0 0 S4C 9 53 33 5 0 0 S5 4 52 37 7 1 0 S5X 4 52 37 7 1 0
Source: CMA analysis.
A3.2-38
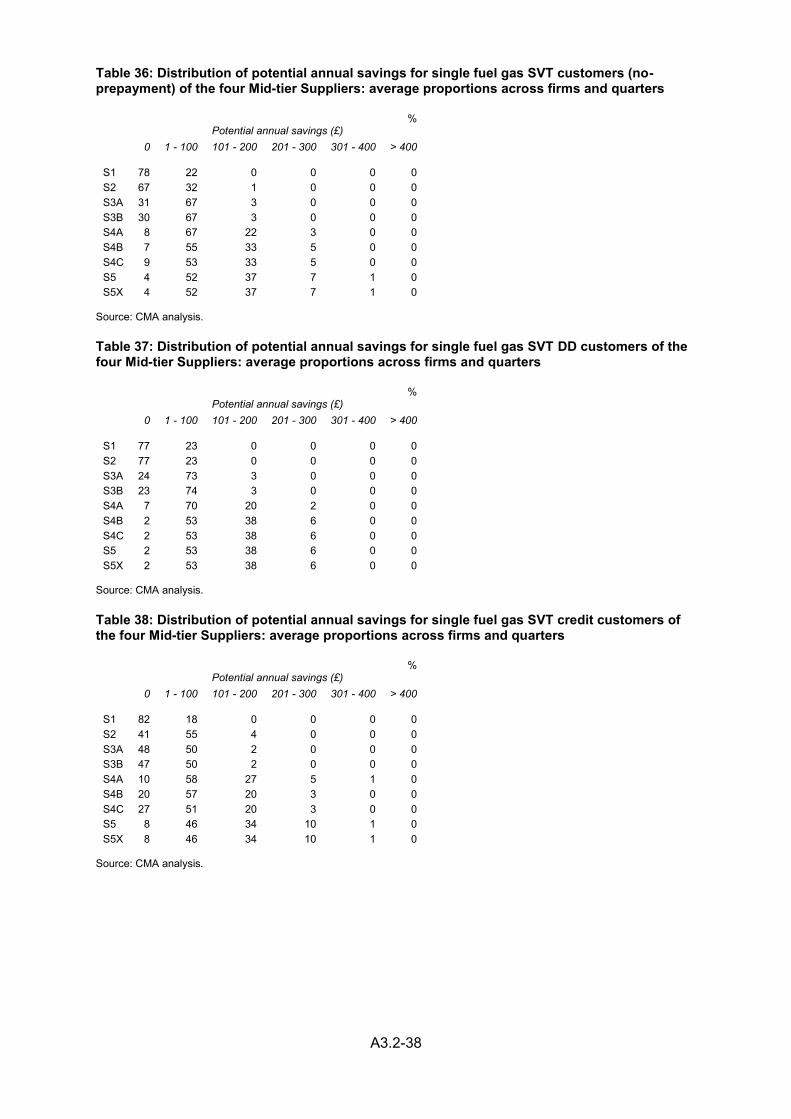
Table 36: Distribution of potential annual savings for single fuel gas SVT customers (no-prepayment) of the four Mid-tier Suppliers: average proportions across firms and quarters
% Potential annual savings (£)
0 1 - 100 101 - 200 201 - 300 301 - 400 > 400
S1 78 22 0 0 0 0 S2 67 32 1 0 0 0 S3A 31 67 3 0 0 0 S3B 30 67 3 0 0 0 S4A 8 67 22 3 0 0 S4B 7 55 33 5 0 0 S4C 9 53 33 5 0 0 S5 4 52 37 7 1 0 S5X 4 52 37 7 1 0
Source: CMA analysis.
Table 37: Distribution of potential annual savings for single fuel gas SVT DD customers of the four Mid-tier Suppliers: average proportions across firms and quarters
% Potential annual savings (£)
0 1 - 100 101 - 200 201 - 300 301 - 400 > 400
S1 77 23 0 0 0 0 S2 77 23 0 0 0 0 S3A 24 73 3 0 0 0 S3B 23 74 3 0 0 0 S4A 7 70 20 2 0 0 S4B 2 53 38 6 0 0 S4C 2 53 38 6 0 0 S5 2 53 38 6 0 0 S5X 2 53 38 6 0 0
Source: CMA analysis.
Table 38: Distribution of potential annual savings for single fuel gas SVT credit customers of the four Mid-tier Suppliers: average proportions across firms and quarters
% Potential annual savings (£)
0 1 - 100 101 - 200 201 - 300 301 - 400 > 400
S1 82 18 0 0 0 0 S2 41 55 4 0 0 0 S3A 48 50 2 0 0 0 S3B 47 50 2 0 0 0 S4A 10 58 27 5 1 0 S4B 20 57 20 3 0 0 S4C 27 51 20 3 0 0 S5 8 46 34 10 1 0 S5X 8 46 34 10 1 0
Source: CMA analysis.
A3.2-39
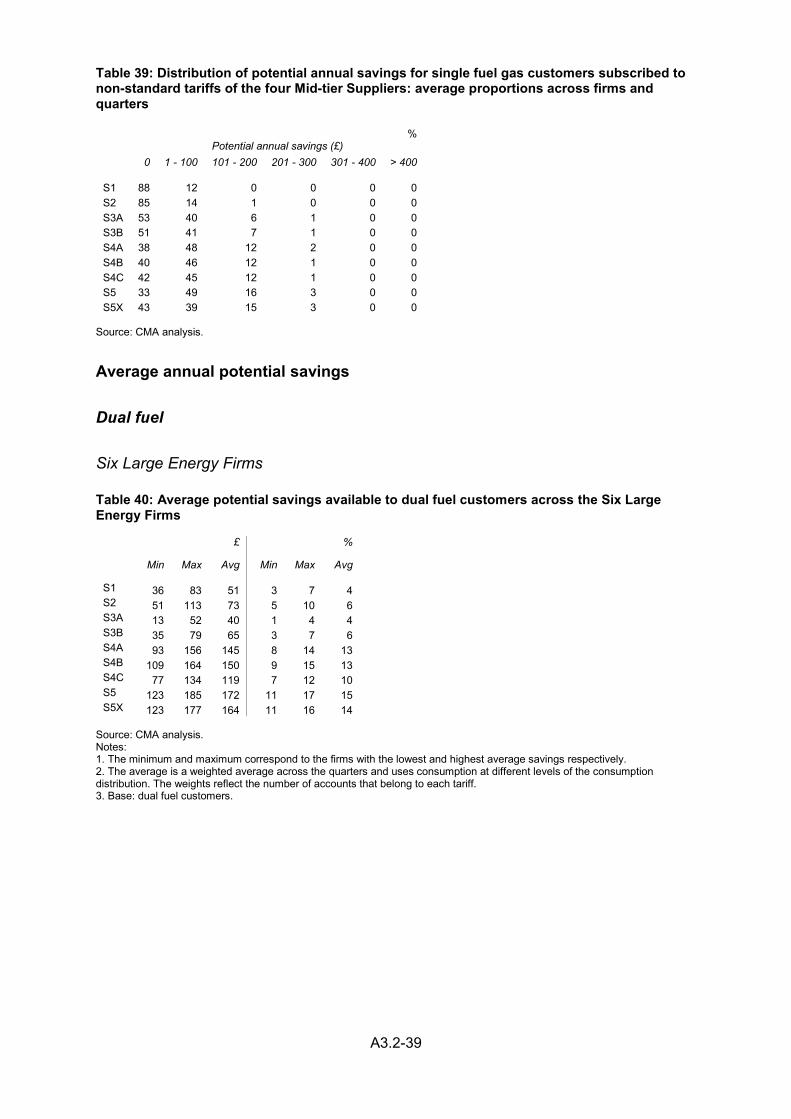
Table 39: Distribution of potential annual savings for single fuel gas customers subscribed to non-standard tariffs of the four Mid-tier Suppliers: average proportions across firms and quarters
% Potential annual savings (£)
0 1 - 100 101 - 200 201 - 300 301 - 400 > 400
S1 88 12 0 0 0 0 S2 85 14 1 0 0 0 S3A 53 40 6 1 0 0 S3B 51 41 7 1 0 0 S4A 38 48 12 2 0 0 S4B 40 46 12 1 0 0 S4C 42 45 12 1 0 0 S5 33 49 16 3 0 0 S5X 43 39 15 3 0 0
Source: CMA analysis.
Average annual potential savings
Dual fuel
Six Large Energy Firms
Table 40: Average potential savings available to dual fuel customers across the Six Large Energy Firms
£ %
Min Max Avg Min Max Avg
S1 36 83 51 3 7 4 S2 51 113 73 5 10 6 S3A 13 52 40 1 4 4 S3B 35 79 65 3 7 6 S4A 93 156 145 8 14 13 S4B 109 164 150 9 15 13 S4C 77 134 119 7 12 10 S5 123 185 172 11 17 15 S5X 123 177 164 11 16 14
Source: CMA analysis. Notes: 1. The minimum and maximum correspond to the firms with the lowest and highest average savings respectively. 2. The average is a weighted average across the quarters and uses consumption at different levels of the consumption distribution. The weights reflect the number of accounts that belong to each tariff. 3. Base: dual fuel customers.
A3.2-40
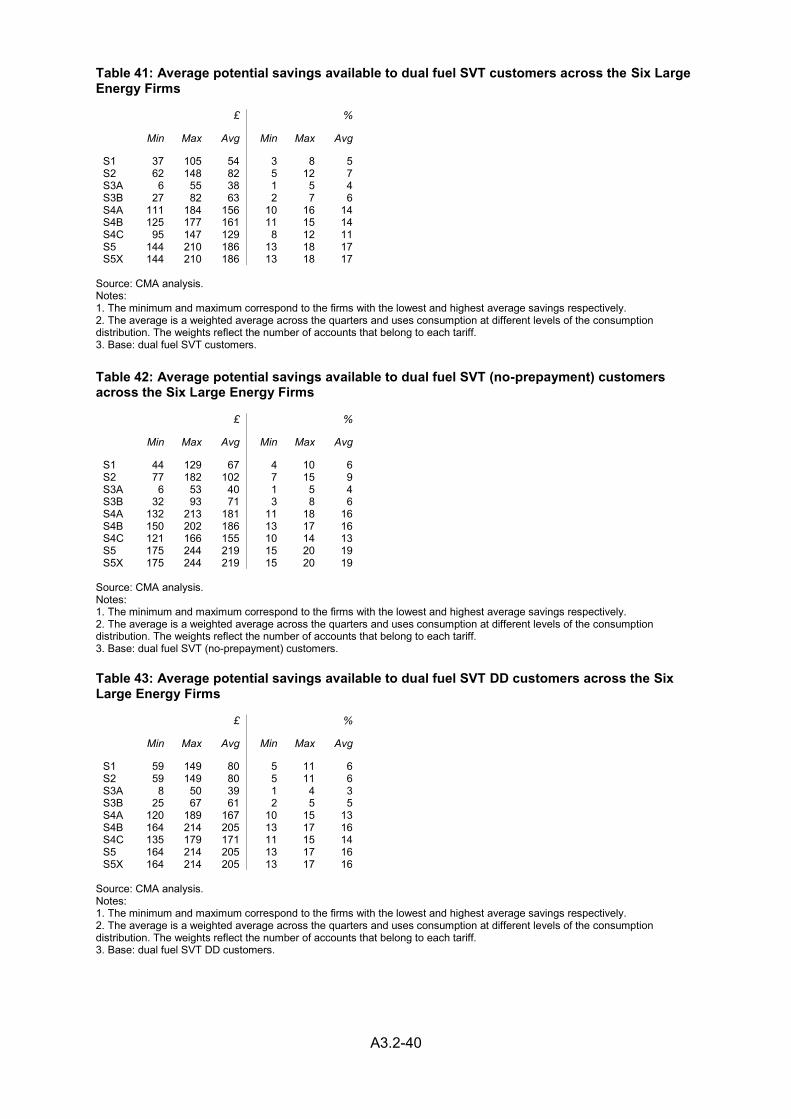
Table 41: Average potential savings available to dual fuel SVT customers across the Six Large Energy Firms
£ %
Min Max Avg Min Max Avg
S1 37 105 54 3 8 5 S2 62 148 82 5 12 7 S3A 6 55 38 1 5 4 S3B 27 82 63 2 7 6 S4A 111 184 156 10 16 14 S4B 125 177 161 11 15 14 S4C 95 147 129 8 12 11 S5 144 210 186 13 18 17 S5X 144 210 186 13 18 17
Source: CMA analysis. Notes: 1. The minimum and maximum correspond to the firms with the lowest and highest average savings respectively. 2. The average is a weighted average across the quarters and uses consumption at different levels of the consumption distribution. The weights reflect the number of accounts that belong to each tariff. 3. Base: dual fuel SVT customers. Table 42: Average potential savings available to dual fuel SVT (no-prepayment) customers across the Six Large Energy Firms
£ %
Min Max Avg Min Max Avg
S1 44 129 67 4 10 6 S2 77 182 102 7 15 9 S3A 6 53 40 1 5 4 S3B 32 93 71 3 8 6 S4A 132 213 181 11 18 16 S4B 150 202 186 13 17 16 S4C 121 166 155 10 14 13 S5 175 244 219 15 20 19 S5X 175 244 219 15 20 19
Source: CMA analysis. Notes: 1. The minimum and maximum correspond to the firms with the lowest and highest average savings respectively. 2. The average is a weighted average across the quarters and uses consumption at different levels of the consumption distribution. The weights reflect the number of accounts that belong to each tariff. 3. Base: dual fuel SVT (no-prepayment) customers.
Table 43: Average potential savings available to dual fuel SVT DD customers across the Six Large Energy Firms
£ %
Min Max Avg Min Max Avg
S1 59 149 80 5 11 6 S2 59 149 80 5 11 6 S3A 8 50 39 1 4 3 S3B 25 67 61 2 5 5 S4A 120 189 167 10 15 13 S4B 164 214 205 13 17 16 S4C 135 179 171 11 15 14 S5 164 214 205 13 17 16 S5X 164 214 205 13 17 16
Source: CMA analysis. Notes: 1. The minimum and maximum correspond to the firms with the lowest and highest average savings respectively. 2. The average is a weighted average across the quarters and uses consumption at different levels of the consumption distribution. The weights reflect the number of accounts that belong to each tariff. 3. Base: dual fuel SVT DD customers.
A3.2-41
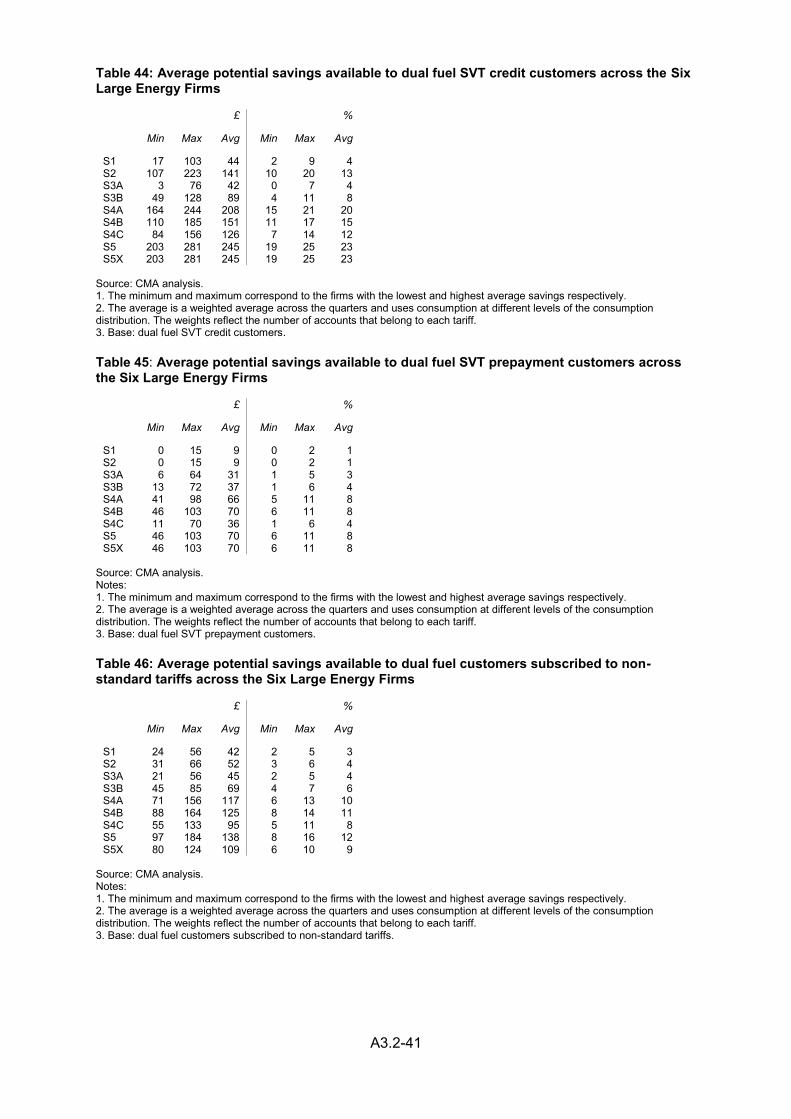
Table 44: Average potential savings available to dual fuel SVT credit customers across the Six Large Energy Firms
£ %
Min Max Avg Min Max Avg
S1 17 103 44 2 9 4 S2 107 223 141 10 20 13 S3A 3 76 42 0 7 4 S3B 49 128 89 4 11 8 S4A 164 244 208 15 21 20 S4B 110 185 151 11 17 15 S4C 84 156 126 7 14 12 S5 203 281 245 19 25 23 S5X 203 281 245 19 25 23
Source: CMA analysis. 1. The minimum and maximum correspond to the firms with the lowest and highest average savings respectively. 2. The average is a weighted average across the quarters and uses consumption at different levels of the consumption distribution. The weights reflect the number of accounts that belong to each tariff. 3. Base: dual fuel SVT credit customers.
Table 45: Average potential savings available to dual fuel SVT prepayment customers across the Six Large Energy Firms
£ %
Min Max Avg Min Max Avg
S1 0 15 9 0 2 1 S2 0 15 9 0 2 1 S3A 6 64 31 1 5 3 S3B 13 72 37 1 6 4 S4A 41 98 66 5 11 8 S4B 46 103 70 6 11 8 S4C 11 70 36 1 6 4 S5 46 103 70 6 11 8 S5X 46 103 70 6 11 8
Source: CMA analysis. Notes: 1. The minimum and maximum correspond to the firms with the lowest and highest average savings respectively. 2. The average is a weighted average across the quarters and uses consumption at different levels of the consumption distribution. The weights reflect the number of accounts that belong to each tariff. 3. Base: dual fuel SVT prepayment customers.
Table 46: Average potential savings available to dual fuel customers subscribed to non-standard tariffs across the Six Large Energy Firms
£ %
Min Max Avg Min Max Avg
S1 24 56 42 2 5 3 S2 31 66 52 3 6 4 S3A 21 56 45 2 5 4 S3B 45 85 69 4 7 6 S4A 71 156 117 6 13 10 S4B 88 164 125 8 14 11 S4C 55 133 95 5 11 8 S5 97 184 138 8 16 12 S5X 80 124 109 6 10 9
Source: CMA analysis. Notes: 1. The minimum and maximum correspond to the firms with the lowest and highest average savings respectively. 2. The average is a weighted average across the quarters and uses consumption at different levels of the consumption distribution. The weights reflect the number of accounts that belong to each tariff. 3. Base: dual fuel customers subscribed to non-standard tariffs.
A3.2-42
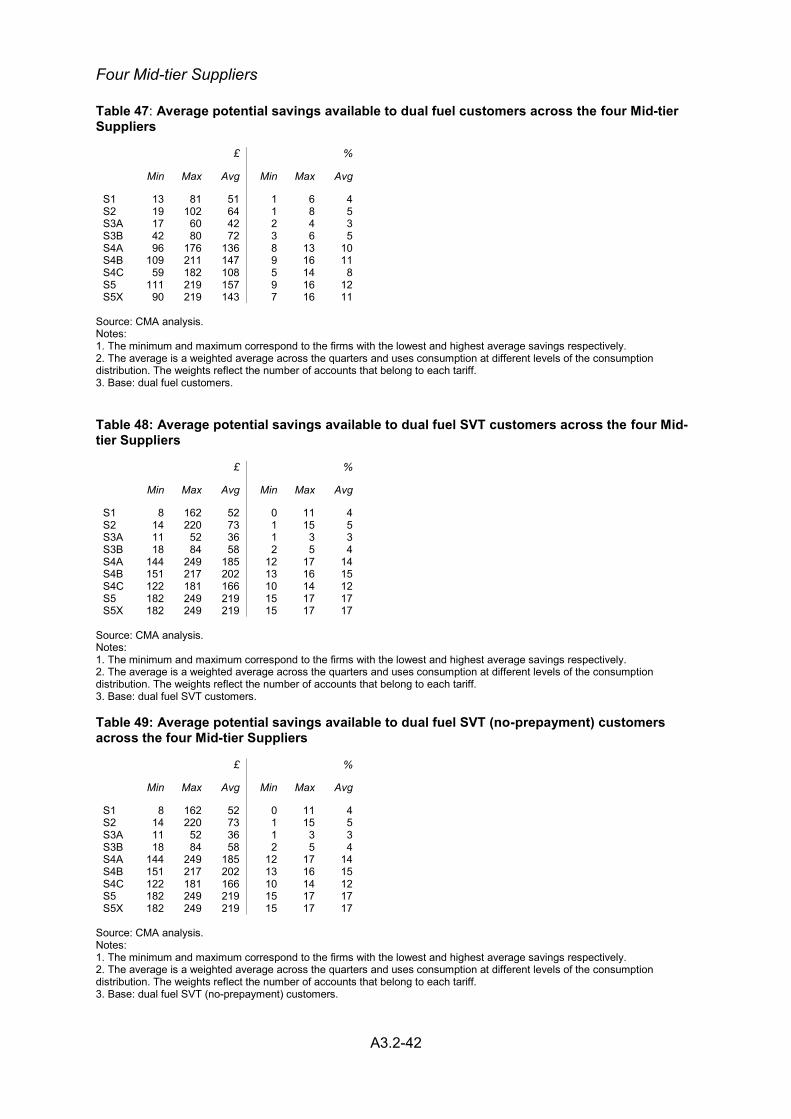
Four Mid-tier Suppliers
Table 47: Average potential savings available to dual fuel customers across the four Mid-tier Suppliers
£ %
Min Max Avg Min Max Avg
S1 13 81 51 1 6 4 S2 19 102 64 1 8 5 S3A 17 60 42 2 4 3 S3B 42 80 72 3 6 5 S4A 96 176 136 8 13 10 S4B 109 211 147 9 16 11 S4C 59 182 108 5 14 8 S5 111 219 157 9 16 12 S5X 90 219 143 7 16 11
Source: CMA analysis. Notes: 1. The minimum and maximum correspond to the firms with the lowest and highest average savings respectively. 2. The average is a weighted average across the quarters and uses consumption at different levels of the consumption distribution. The weights reflect the number of accounts that belong to each tariff. 3. Base: dual fuel customers.
Table 48: Average potential savings available to dual fuel SVT customers across the four Mid-tier Suppliers
£ %
Min Max Avg Min Max Avg
S1 8 162 52 0 11 4 S2 14 220 73 1 15 5 S3A 11 52 36 1 3 3 S3B 18 84 58 2 5 4 S4A 144 249 185 12 17 14 S4B 151 217 202 13 16 15 S4C 122 181 166 10 14 12 S5 182 249 219 15 17 17 S5X 182 249 219 15 17 17
Source: CMA analysis. Notes: 1. The minimum and maximum correspond to the firms with the lowest and highest average savings respectively. 2. The average is a weighted average across the quarters and uses consumption at different levels of the consumption distribution. The weights reflect the number of accounts that belong to each tariff. 3. Base: dual fuel SVT customers. Table 49: Average potential savings available to dual fuel SVT (no-prepayment) customers across the four Mid-tier Suppliers
£ %
Min Max Avg Min Max Avg
S1 8 162 52 0 11 4 S2 14 220 73 1 15 5 S3A 11 52 36 1 3 3 S3B 18 84 58 2 5 4 S4A 144 249 185 12 17 14 S4B 151 217 202 13 16 15 S4C 122 181 166 10 14 12 S5 182 249 219 15 17 17 S5X 182 249 219 15 17 17
Source: CMA analysis. Notes: 1. The minimum and maximum correspond to the firms with the lowest and highest average savings respectively. 2. The average is a weighted average across the quarters and uses consumption at different levels of the consumption distribution. The weights reflect the number of accounts that belong to each tariff. 3. Base: dual fuel SVT (no-prepayment) customers.
A3.2-43
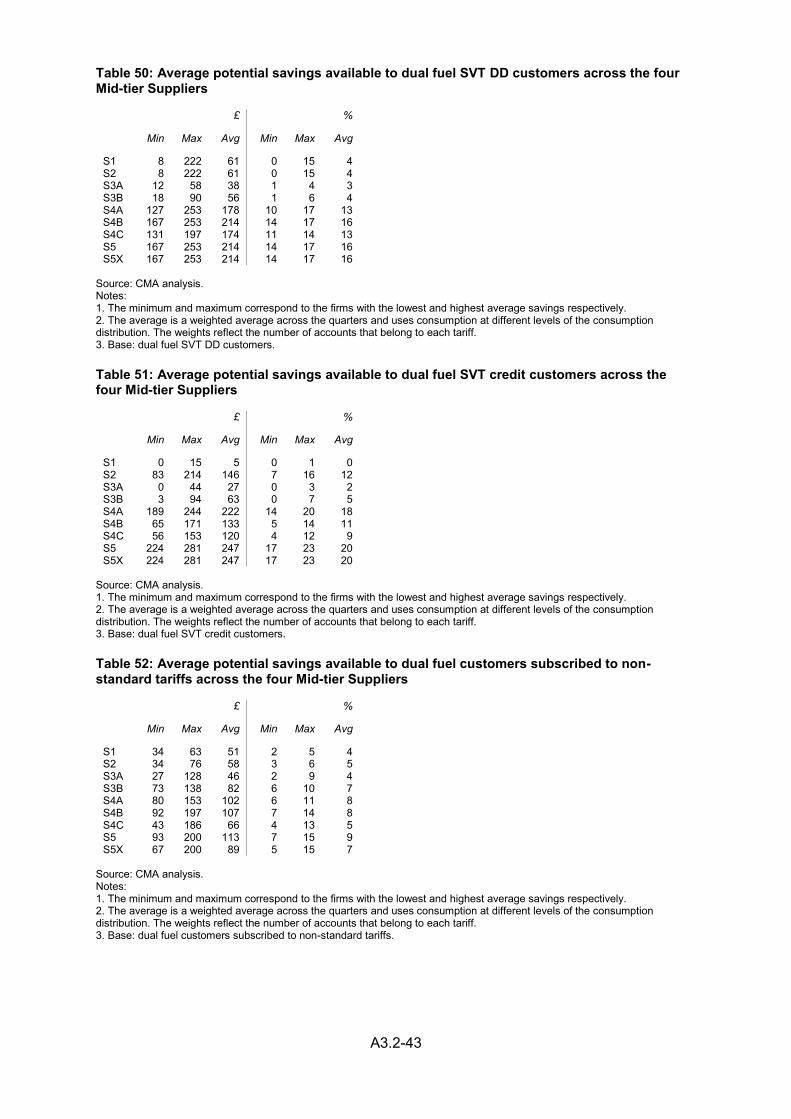
Table 50: Average potential savings available to dual fuel SVT DD customers across the four Mid-tier Suppliers
£ %
Min Max Avg Min Max Avg
S1 8 222 61 0 15 4 S2 8 222 61 0 15 4 S3A 12 58 38 1 4 3 S3B 18 90 56 1 6 4 S4A 127 253 178 10 17 13 S4B 167 253 214 14 17 16 S4C 131 197 174 11 14 13 S5 167 253 214 14 17 16 S5X 167 253 214 14 17 16
Source: CMA analysis. Notes: 1. The minimum and maximum correspond to the firms with the lowest and highest average savings respectively. 2. The average is a weighted average across the quarters and uses consumption at different levels of the consumption distribution. The weights reflect the number of accounts that belong to each tariff. 3. Base: dual fuel SVT DD customers.
Table 51: Average potential savings available to dual fuel SVT credit customers across the four Mid-tier Suppliers
£ %
Min Max Avg Min Max Avg
S1 0 15 5 0 1 0 S2 83 214 146 7 16 12 S3A 0 44 27 0 3 2 S3B 3 94 63 0 7 5 S4A 189 244 222 14 20 18 S4B 65 171 133 5 14 11 S4C 56 153 120 4 12 9 S5 224 281 247 17 23 20 S5X 224 281 247 17 23 20
Source: CMA analysis. 1. The minimum and maximum correspond to the firms with the lowest and highest average savings respectively. 2. The average is a weighted average across the quarters and uses consumption at different levels of the consumption distribution. The weights reflect the number of accounts that belong to each tariff. 3. Base: dual fuel SVT credit customers.
Table 52: Average potential savings available to dual fuel customers subscribed to non-standard tariffs across the four Mid-tier Suppliers
£ %
Min Max Avg Min Max Avg
S1 34 63 51 2 5 4 S2 34 76 58 3 6 5 S3A 27 128 46 2 9 4 S3B 73 138 82 6 10 7 S4A 80 153 102 6 11 8 S4B 92 197 107 7 14 8 S4C 43 186 66 4 13 5 S5 93 200 113 7 15 9 S5X 67 200 89 5 15 7
Source: CMA analysis. Notes: 1. The minimum and maximum correspond to the firms with the lowest and highest average savings respectively. 2. The average is a weighted average across the quarters and uses consumption at different levels of the consumption distribution. The weights reflect the number of accounts that belong to each tariff. 3. Base: dual fuel customers subscribed to non-standard tariffs.
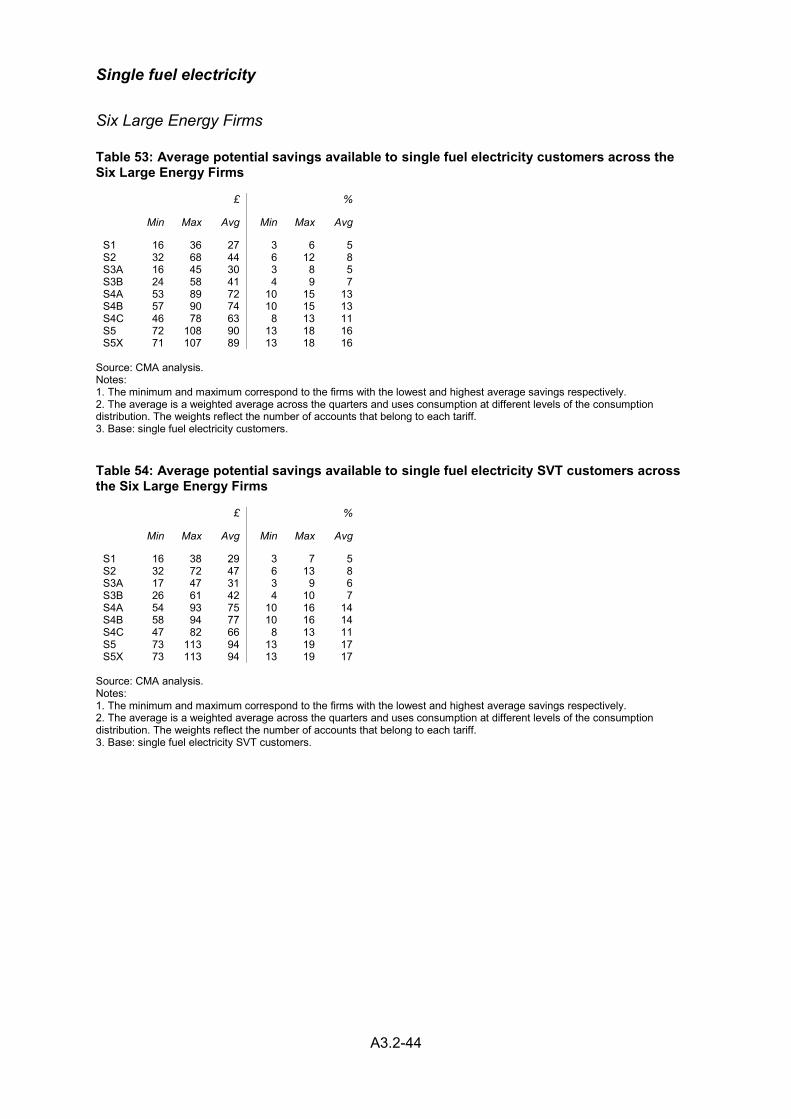
A3.2-44
Single fuel electricity
Six Large Energy Firms
Table 53: Average potential savings available to single fuel electricity customers across the Six Large Energy Firms
£ %
Min Max Avg Min Max Avg
S1 16 36 27 3 6 5 S2 32 68 44 6 12 8 S3A 16 45 30 3 8 5 S3B 24 58 41 4 9 7 S4A 53 89 72 10 15 13 S4B 57 90 74 10 15 13 S4C 46 78 63 8 13 11 S5 72 108 90 13 18 16 S5X 71 107 89 13 18 16
Source: CMA analysis. Notes: 1. The minimum and maximum correspond to the firms with the lowest and highest average savings respectively. 2. The average is a weighted average across the quarters and uses consumption at different levels of the consumption distribution. The weights reflect the number of accounts that belong to each tariff. 3. Base: single fuel electricity customers.
Table 54: Average potential savings available to single fuel electricity SVT customers across the Six Large Energy Firms
£ %
Min Max Avg Min Max Avg
S1 16 38 29 3 7 5 S2 32 72 47 6 13 8 S3A 17 47 31 3 9 6 S3B 26 61 42 4 10 7 S4A 54 93 75 10 16 14 S4B 58 94 77 10 16 14 S4C 47 82 66 8 13 11 S5 73 113 94 13 19 17 S5X 73 113 94 13 19 17
Source: CMA analysis. Notes: 1. The minimum and maximum correspond to the firms with the lowest and highest average savings respectively. 2. The average is a weighted average across the quarters and uses consumption at different levels of the consumption distribution. The weights reflect the number of accounts that belong to each tariff. 3. Base: single fuel electricity SVT customers.
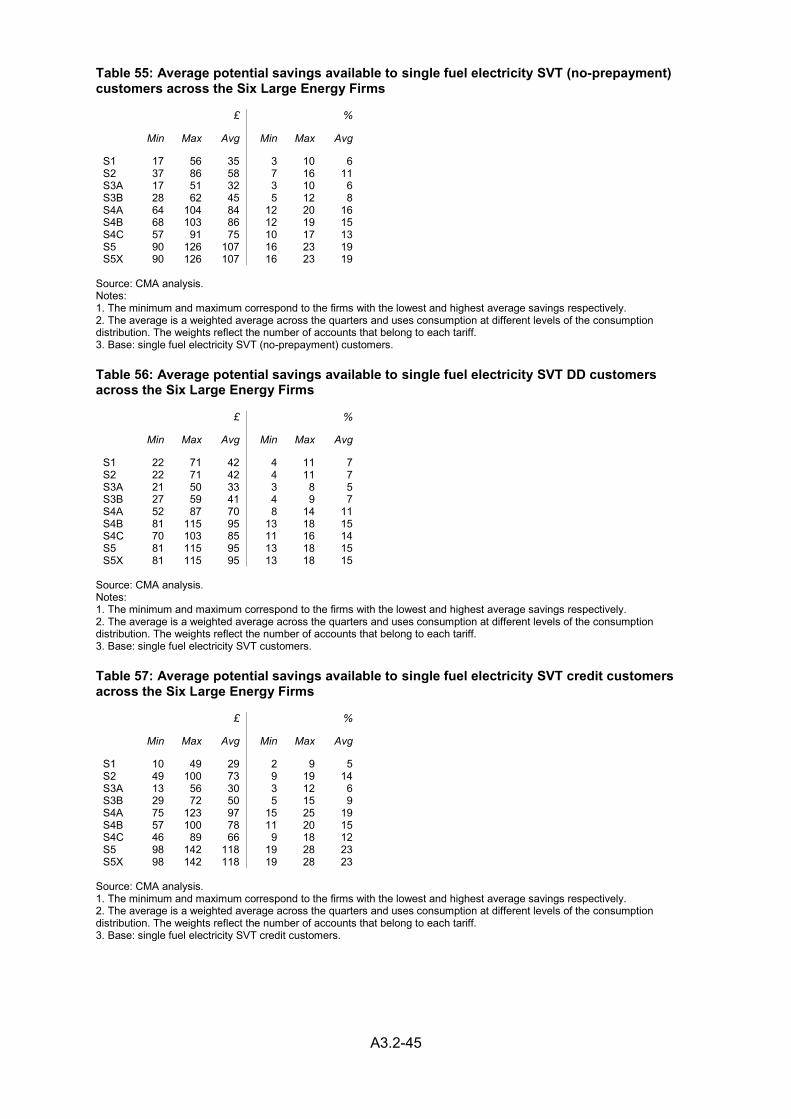
A3.2-45
Table 55: Average potential savings available to single fuel electricity SVT (no-prepayment) customers across the Six Large Energy Firms
£ %
Min Max Avg Min Max Avg
S1 17 56 35 3 10 6 S2 37 86 58 7 16 11 S3A 17 51 32 3 10 6 S3B 28 62 45 5 12 8 S4A 64 104 84 12 20 16 S4B 68 103 86 12 19 15 S4C 57 91 75 10 17 13 S5 90 126 107 16 23 19 S5X 90 126 107 16 23 19
Source: CMA analysis. Notes: 1. The minimum and maximum correspond to the firms with the lowest and highest average savings respectively. 2. The average is a weighted average across the quarters and uses consumption at different levels of the consumption distribution. The weights reflect the number of accounts that belong to each tariff. 3. Base: single fuel electricity SVT (no-prepayment) customers.
Table 56: Average potential savings available to single fuel electricity SVT DD customers across the Six Large Energy Firms
£ %
Min Max Avg Min Max Avg
S1 22 71 42 4 11 7 S2 22 71 42 4 11 7 S3A 21 50 33 3 8 5 S3B 27 59 41 4 9 7 S4A 52 87 70 8 14 11 S4B 81 115 95 13 18 15 S4C 70 103 85 11 16 14 S5 81 115 95 13 18 15 S5X 81 115 95 13 18 15
Source: CMA analysis. Notes: 1. The minimum and maximum correspond to the firms with the lowest and highest average savings respectively. 2. The average is a weighted average across the quarters and uses consumption at different levels of the consumption distribution. The weights reflect the number of accounts that belong to each tariff. 3. Base: single fuel electricity SVT customers.
Table 57: Average potential savings available to single fuel electricity SVT credit customers across the Six Large Energy Firms
£ %
Min Max Avg Min Max Avg
S1 10 49 29 2 9 5 S2 49 100 73 9 19 14 S3A 13 56 30 3 12 6 S3B 29 72 50 5 15 9 S4A 75 123 97 15 25 19 S4B 57 100 78 11 20 15 S4C 46 89 66 9 18 12 S5 98 142 118 19 28 23 S5X 98 142 118 19 28 23
Source: CMA analysis. 1. The minimum and maximum correspond to the firms with the lowest and highest average savings respectively. 2. The average is a weighted average across the quarters and uses consumption at different levels of the consumption distribution. The weights reflect the number of accounts that belong to each tariff. 3. Base: single fuel electricity SVT credit customers.
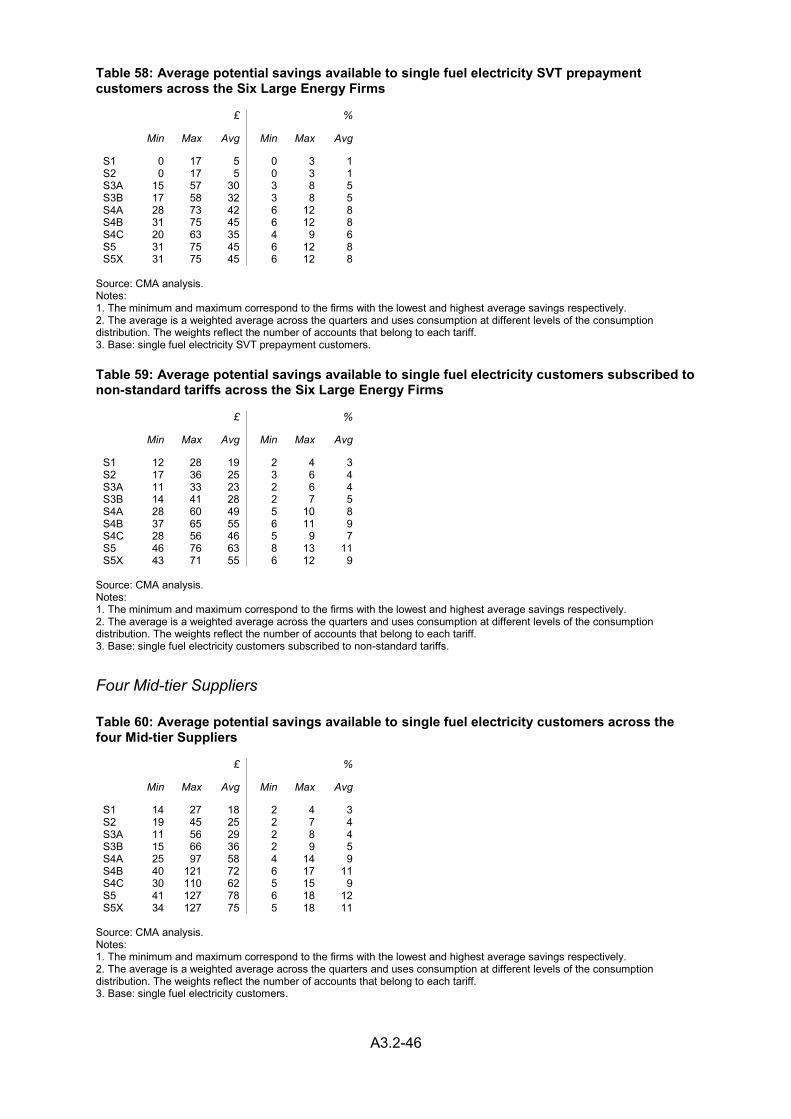
A3.2-46
Table 58: Average potential savings available to single fuel electricity SVT prepayment customers across the Six Large Energy Firms
£ %
Min Max Avg Min Max Avg
S1 0 17 5 0 3 1 S2 0 17 5 0 3 1 S3A 15 57 30 3 8 5 S3B 17 58 32 3 8 5 S4A 28 73 42 6 12 8 S4B 31 75 45 6 12 8 S4C 20 63 35 4 9 6 S5 31 75 45 6 12 8 S5X 31 75 45 6 12 8
Source: CMA analysis. Notes: 1. The minimum and maximum correspond to the firms with the lowest and highest average savings respectively. 2. The average is a weighted average across the quarters and uses consumption at different levels of the consumption distribution. The weights reflect the number of accounts that belong to each tariff. 3. Base: single fuel electricity SVT prepayment customers.
Table 59: Average potential savings available to single fuel electricity customers subscribed to non-standard tariffs across the Six Large Energy Firms
£ %
Min Max Avg Min Max Avg
S1 12 28 19 2 4 3 S2 17 36 25 3 6 4 S3A 11 33 23 2 6 4 S3B 14 41 28 2 7 5 S4A 28 60 49 5 10 8 S4B 37 65 55 6 11 9 S4C 28 56 46 5 9 7 S5 46 76 63 8 13 11 S5X 43 71 55 6 12 9
Source: CMA analysis. Notes: 1. The minimum and maximum correspond to the firms with the lowest and highest average savings respectively. 2. The average is a weighted average across the quarters and uses consumption at different levels of the consumption distribution. The weights reflect the number of accounts that belong to each tariff. 3. Base: single fuel electricity customers subscribed to non-standard tariffs.
Four Mid-tier Suppliers
Table 60: Average potential savings available to single fuel electricity customers across the four Mid-tier Suppliers
£ %
Min Max Avg Min Max Avg
S1 14 27 18 2 4 3 S2 19 45 25 2 7 4 S3A 11 56 29 2 8 4 S3B 15 66 36 2 9 5 S4A 25 97 58 4 14 9 S4B 40 121 72 6 17 11 S4C 30 110 62 5 15 9 S5 41 127 78 6 18 12 S5X 34 127 75 5 18 11
Source: CMA analysis. Notes: 1. The minimum and maximum correspond to the firms with the lowest and highest average savings respectively. 2. The average is a weighted average across the quarters and uses consumption at different levels of the consumption distribution. The weights reflect the number of accounts that belong to each tariff. 3. Base: single fuel electricity customers.
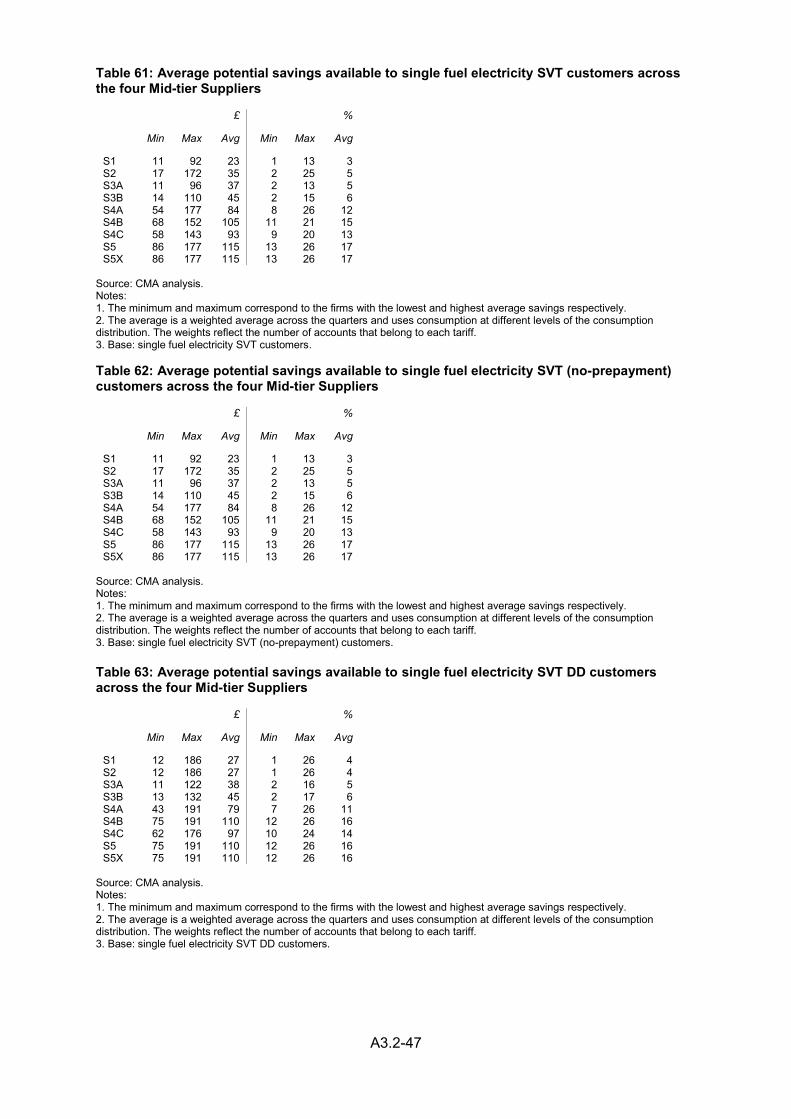
A3.2-47
Table 61: Average potential savings available to single fuel electricity SVT customers across the four Mid-tier Suppliers
£ %
Min Max Avg Min Max Avg
S1 11 92 23 1 13 3 S2 17 172 35 2 25 5 S3A 11 96 37 2 13 5 S3B 14 110 45 2 15 6 S4A 54 177 84 8 26 12 S4B 68 152 105 11 21 15 S4C 58 143 93 9 20 13 S5 86 177 115 13 26 17 S5X 86 177 115 13 26 17
Source: CMA analysis. Notes: 1. The minimum and maximum correspond to the firms with the lowest and highest average savings respectively. 2. The average is a weighted average across the quarters and uses consumption at different levels of the consumption distribution. The weights reflect the number of accounts that belong to each tariff. 3. Base: single fuel electricity SVT customers. Table 62: Average potential savings available to single fuel electricity SVT (no-prepayment) customers across the four Mid-tier Suppliers
£ %
Min Max Avg Min Max Avg
S1 11 92 23 1 13 3 S2 17 172 35 2 25 5 S3A 11 96 37 2 13 5 S3B 14 110 45 2 15 6 S4A 54 177 84 8 26 12 S4B 68 152 105 11 21 15 S4C 58 143 93 9 20 13 S5 86 177 115 13 26 17 S5X 86 177 115 13 26 17
Source: CMA analysis. Notes: 1. The minimum and maximum correspond to the firms with the lowest and highest average savings respectively. 2. The average is a weighted average across the quarters and uses consumption at different levels of the consumption distribution. The weights reflect the number of accounts that belong to each tariff. 3. Base: single fuel electricity SVT (no-prepayment) customers.
Table 63: Average potential savings available to single fuel electricity SVT DD customers across the four Mid-tier Suppliers
£ %
Min Max Avg Min Max Avg
S1 12 186 27 1 26 4 S2 12 186 27 1 26 4 S3A 11 122 38 2 16 5 S3B 13 132 45 2 17 6 S4A 43 191 79 7 26 11 S4B 75 191 110 12 26 16 S4C 62 176 97 10 24 14 S5 75 191 110 12 26 16 S5X 75 191 110 12 26 16
Source: CMA analysis. Notes: 1. The minimum and maximum correspond to the firms with the lowest and highest average savings respectively. 2. The average is a weighted average across the quarters and uses consumption at different levels of the consumption distribution. The weights reflect the number of accounts that belong to each tariff. 3. Base: single fuel electricity SVT DD customers.
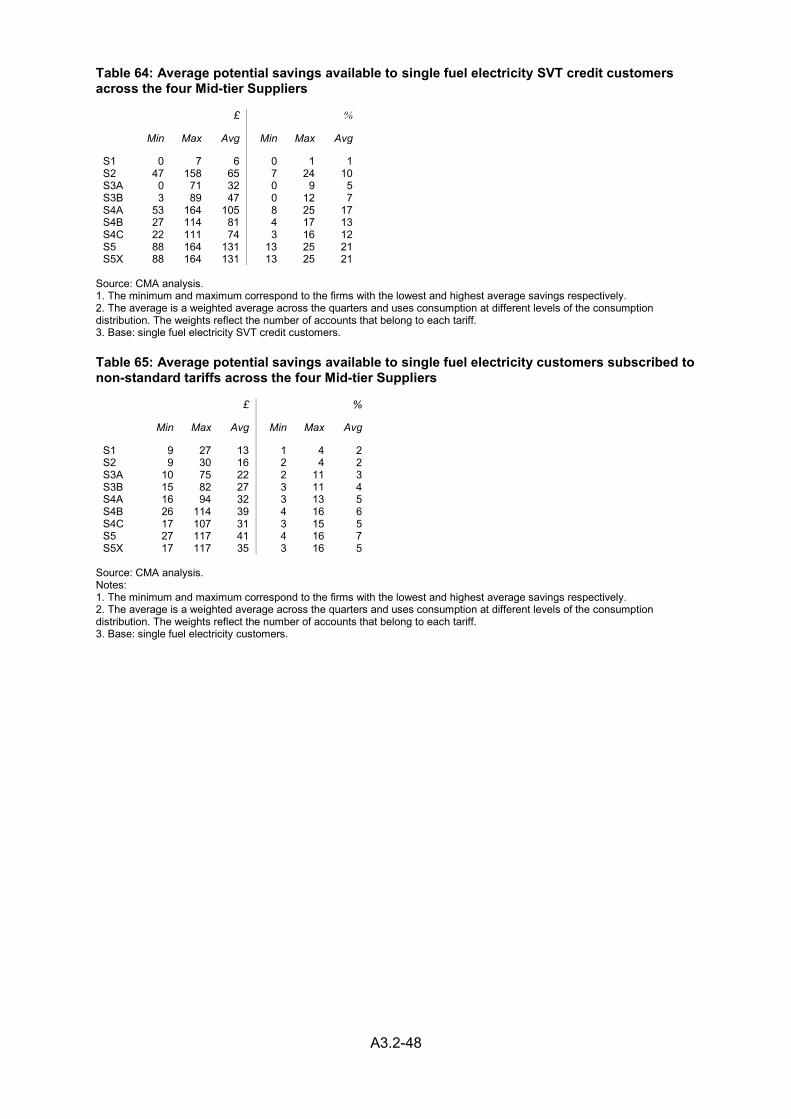
A3.2-48
Table 64: Average potential savings available to single fuel electricity SVT credit customers across the four Mid-tier Suppliers
£ %
Min Max Avg Min Max Avg
S1 0 7 6 0 1 1 S2 47 158 65 7 24 10 S3A 0 71 32 0 9 5 S3B 3 89 47 0 12 7 S4A 53 164 105 8 25 17 S4B 27 114 81 4 17 13 S4C 22 111 74 3 16 12 S5 88 164 131 13 25 21 S5X 88 164 131 13 25 21
Source: CMA analysis. 1. The minimum and maximum correspond to the firms with the lowest and highest average savings respectively. 2. The average is a weighted average across the quarters and uses consumption at different levels of the consumption distribution. The weights reflect the number of accounts that belong to each tariff. 3. Base: single fuel electricity SVT credit customers.
Table 65: Average potential savings available to single fuel electricity customers subscribed to non-standard tariffs across the four Mid-tier Suppliers
£ %
Min Max Avg Min Max Avg
S1 9 27 13 1 4 2 S2 9 30 16 2 4 2 S3A 10 75 22 2 11 3 S3B 15 82 27 3 11 4 S4A 16 94 32 3 13 5 S4B 26 114 39 4 16 6 S4C 17 107 31 3 15 5 S5 27 117 41 4 16 7 S5X 17 117 35 3 16 5
Source: CMA analysis. Notes: 1. The minimum and maximum correspond to the firms with the lowest and highest average savings respectively. 2. The average is a weighted average across the quarters and uses consumption at different levels of the consumption distribution. The weights reflect the number of accounts that belong to each tariff. 3. Base: single fuel electricity customers.
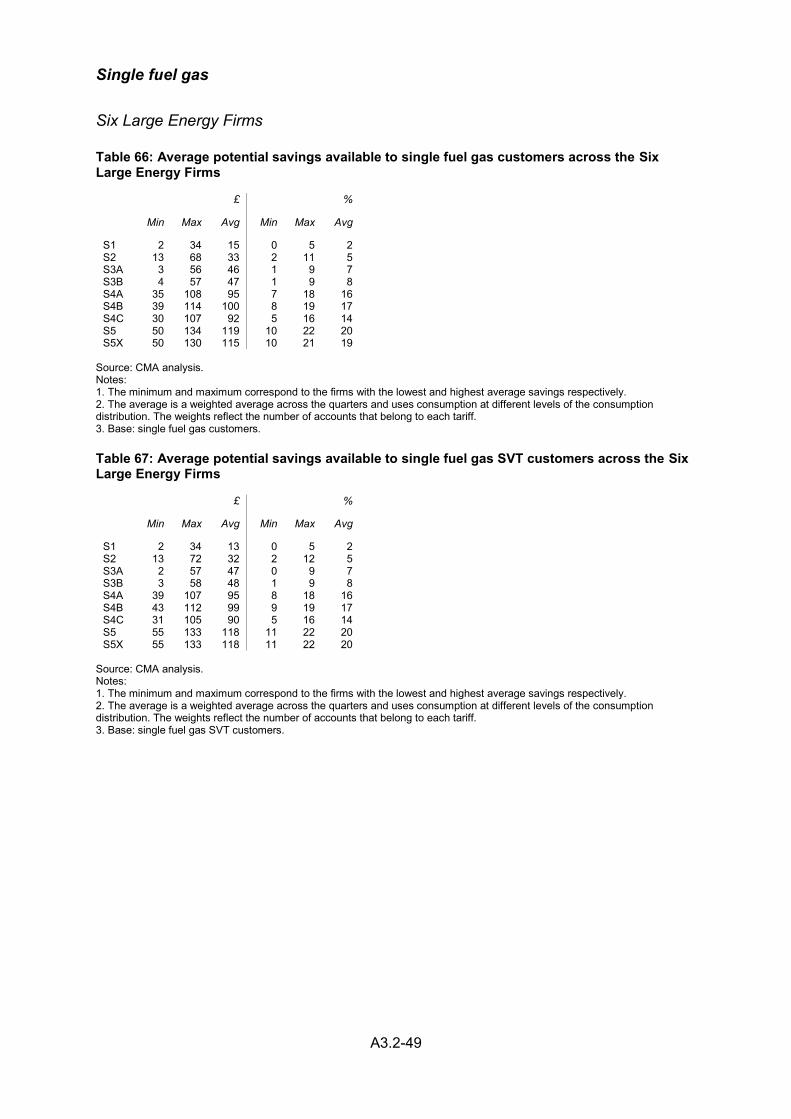
A3.2-49
Single fuel gas
Six Large Energy Firms
Table 66: Average potential savings available to single fuel gas customers across the Six Large Energy Firms
£ %
Min Max Avg Min Max Avg
S1 2 34 15 0 5 2 S2 13 68 33 2 11 5 S3A 3 56 46 1 9 7 S3B 4 57 47 1 9 8 S4A 35 108 95 7 18 16 S4B 39 114 100 8 19 17 S4C 30 107 92 5 16 14 S5 50 134 119 10 22 20 S5X 50 130 115 10 21 19
Source: CMA analysis. Notes: 1. The minimum and maximum correspond to the firms with the lowest and highest average savings respectively. 2. The average is a weighted average across the quarters and uses consumption at different levels of the consumption distribution. The weights reflect the number of accounts that belong to each tariff. 3. Base: single fuel gas customers.
Table 67: Average potential savings available to single fuel gas SVT customers across the Six Large Energy Firms
£ %
Min Max Avg Min Max Avg
S1 2 34 13 0 5 2 S2 13 72 32 2 12 5 S3A 2 57 47 0 9 7 S3B 3 58 48 1 9 8 S4A 39 107 95 8 18 16 S4B 43 112 99 9 19 17 S4C 31 105 90 5 16 14 S5 55 133 118 11 22 20 S5X 55 133 118 11 22 20
Source: CMA analysis. Notes: 1. The minimum and maximum correspond to the firms with the lowest and highest average savings respectively. 2. The average is a weighted average across the quarters and uses consumption at different levels of the consumption distribution. The weights reflect the number of accounts that belong to each tariff. 3. Base: single fuel gas SVT customers.
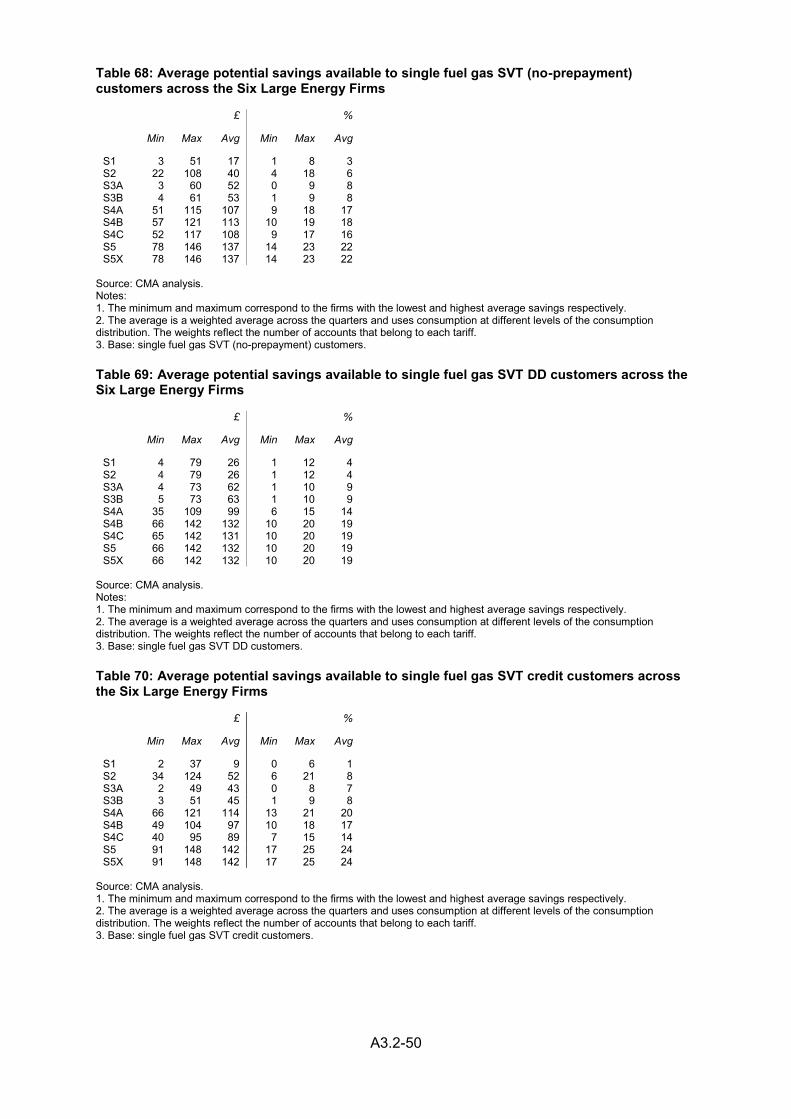
A3.2-50
Table 68: Average potential savings available to single fuel gas SVT (no-prepayment) customers across the Six Large Energy Firms
£ %
Min Max Avg Min Max Avg
S1 3 51 17 1 8 3 S2 22 108 40 4 18 6 S3A 3 60 52 0 9 8 S3B 4 61 53 1 9 8 S4A 51 115 107 9 18 17 S4B 57 121 113 10 19 18 S4C 52 117 108 9 17 16 S5 78 146 137 14 23 22 S5X 78 146 137 14 23 22
Source: CMA analysis. Notes: 1. The minimum and maximum correspond to the firms with the lowest and highest average savings respectively. 2. The average is a weighted average across the quarters and uses consumption at different levels of the consumption distribution. The weights reflect the number of accounts that belong to each tariff. 3. Base: single fuel gas SVT (no-prepayment) customers.
Table 69: Average potential savings available to single fuel gas SVT DD customers across the Six Large Energy Firms
£ %
Min Max Avg Min Max Avg
S1 4 79 26 1 12 4 S2 4 79 26 1 12 4 S3A 4 73 62 1 10 9 S3B 5 73 63 1 10 9 S4A 35 109 99 6 15 14 S4B 66 142 132 10 20 19 S4C 65 142 131 10 20 19 S5 66 142 132 10 20 19 S5X 66 142 132 10 20 19
Source: CMA analysis. Notes: 1. The minimum and maximum correspond to the firms with the lowest and highest average savings respectively. 2. The average is a weighted average across the quarters and uses consumption at different levels of the consumption distribution. The weights reflect the number of accounts that belong to each tariff. 3. Base: single fuel gas SVT DD customers.
Table 70: Average potential savings available to single fuel gas SVT credit customers across the Six Large Energy Firms
£ %
Min Max Avg Min Max Avg
S1 2 37 9 0 6 1 S2 34 124 52 6 21 8 S3A 2 49 43 0 8 7 S3B 3 51 45 1 9 8 S4A 66 121 114 13 21 20 S4B 49 104 97 10 18 17 S4C 40 95 89 7 15 14 S5 91 148 142 17 25 24 S5X 91 148 142 17 25 24
Source: CMA analysis. 1. The minimum and maximum correspond to the firms with the lowest and highest average savings respectively. 2. The average is a weighted average across the quarters and uses consumption at different levels of the consumption distribution. The weights reflect the number of accounts that belong to each tariff. 3. Base: single fuel gas SVT credit customers.
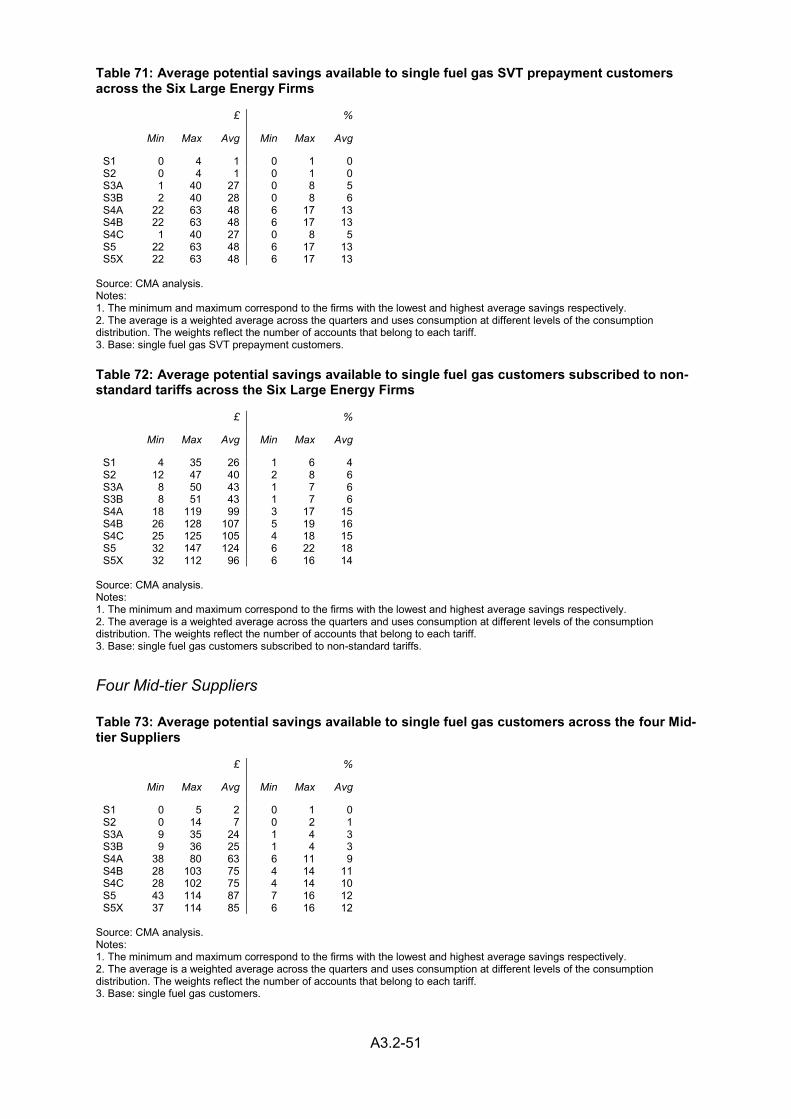
A3.2-51
Table 71: Average potential savings available to single fuel gas SVT prepayment customers across the Six Large Energy Firms
£ %
Min Max Avg Min Max Avg
S1 0 4 1 0 1 0 S2 0 4 1 0 1 0 S3A 1 40 27 0 8 5 S3B 2 40 28 0 8 6 S4A 22 63 48 6 17 13 S4B 22 63 48 6 17 13 S4C 1 40 27 0 8 5 S5 22 63 48 6 17 13 S5X 22 63 48 6 17 13
Source: CMA analysis. Notes: 1. The minimum and maximum correspond to the firms with the lowest and highest average savings respectively. 2. The average is a weighted average across the quarters and uses consumption at different levels of the consumption distribution. The weights reflect the number of accounts that belong to each tariff. 3. Base: single fuel gas SVT prepayment customers.
Table 72: Average potential savings available to single fuel gas customers subscribed to non-standard tariffs across the Six Large Energy Firms
£ %
Min Max Avg Min Max Avg
S1 4 35 26 1 6 4 S2 12 47 40 2 8 6 S3A 8 50 43 1 7 6 S3B 8 51 43 1 7 6 S4A 18 119 99 3 17 15 S4B 26 128 107 5 19 16 S4C 25 125 105 4 18 15 S5 32 147 124 6 22 18 S5X 32 112 96 6 16 14
Source: CMA analysis. Notes: 1. The minimum and maximum correspond to the firms with the lowest and highest average savings respectively. 2. The average is a weighted average across the quarters and uses consumption at different levels of the consumption distribution. The weights reflect the number of accounts that belong to each tariff. 3. Base: single fuel gas customers subscribed to non-standard tariffs.
Four Mid-tier Suppliers
Table 73: Average potential savings available to single fuel gas customers across the four Mid-tier Suppliers
£ %
Min Max Avg Min Max Avg
S1 0 5 2 0 1 0 S2 0 14 7 0 2 1 S3A 9 35 24 1 4 3 S3B 9 36 25 1 4 3 S4A 38 80 63 6 11 9 S4B 28 103 75 4 14 11 S4C 28 102 75 4 14 10 S5 43 114 87 7 16 12 S5X 37 114 85 6 16 12
Source: CMA analysis. Notes: 1. The minimum and maximum correspond to the firms with the lowest and highest average savings respectively. 2. The average is a weighted average across the quarters and uses consumption at different levels of the consumption distribution. The weights reflect the number of accounts that belong to each tariff. 3. Base: single fuel gas customers.
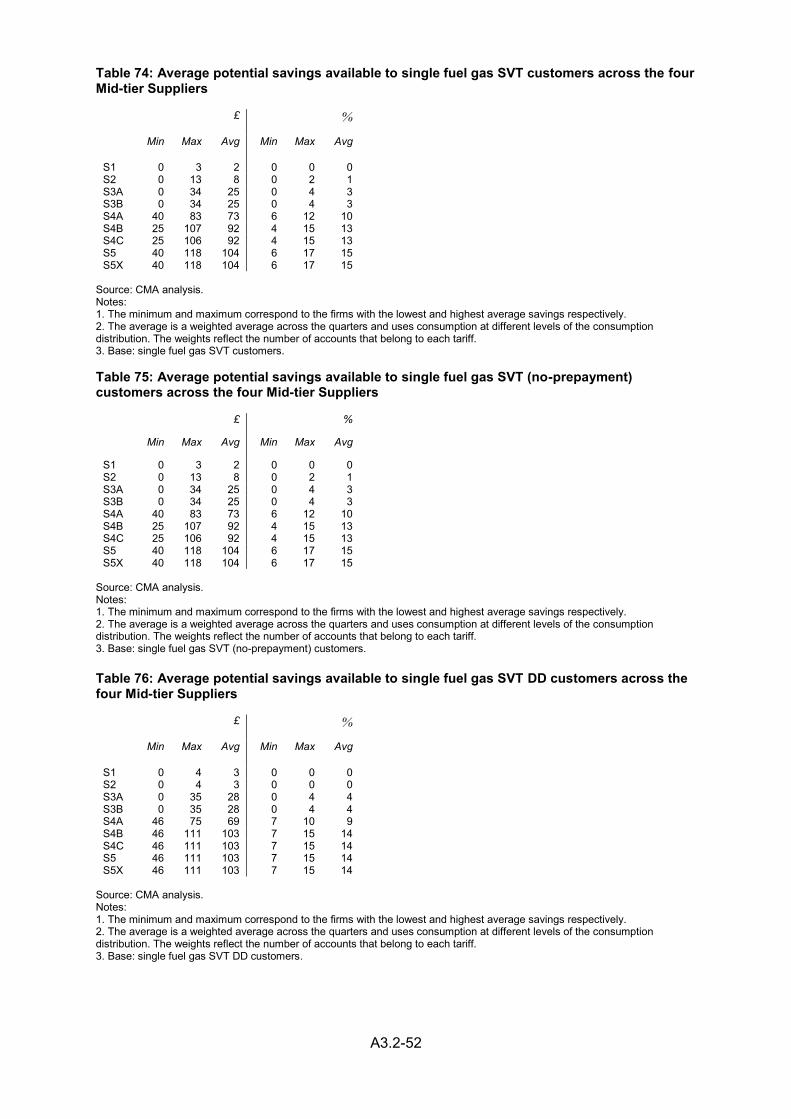
A3.2-52
Table 74: Average potential savings available to single fuel gas SVT customers across the four Mid-tier Suppliers
£ %
Min Max Avg Min Max Avg
S1 0 3 2 0 0 0 S2 0 13 8 0 2 1 S3A 0 34 25 0 4 3 S3B 0 34 25 0 4 3 S4A 40 83 73 6 12 10 S4B 25 107 92 4 15 13 S4C 25 106 92 4 15 13 S5 40 118 104 6 17 15 S5X 40 118 104 6 17 15
Source: CMA analysis. Notes: 1. The minimum and maximum correspond to the firms with the lowest and highest average savings respectively. 2. The average is a weighted average across the quarters and uses consumption at different levels of the consumption distribution. The weights reflect the number of accounts that belong to each tariff. 3. Base: single fuel gas SVT customers. Table 75: Average potential savings available to single fuel gas SVT (no-prepayment) customers across the four Mid-tier Suppliers
£ %
Min Max Avg Min Max Avg
S1 0 3 2 0 0 0 S2 0 13 8 0 2 1 S3A 0 34 25 0 4 3 S3B 0 34 25 0 4 3 S4A 40 83 73 6 12 10 S4B 25 107 92 4 15 13 S4C 25 106 92 4 15 13 S5 40 118 104 6 17 15 S5X 40 118 104 6 17 15
Source: CMA analysis. Notes: 1. The minimum and maximum correspond to the firms with the lowest and highest average savings respectively. 2. The average is a weighted average across the quarters and uses consumption at different levels of the consumption distribution. The weights reflect the number of accounts that belong to each tariff. 3. Base: single fuel gas SVT (no-prepayment) customers.
Table 76: Average potential savings available to single fuel gas SVT DD customers across the four Mid-tier Suppliers
£ %
Min Max Avg Min Max Avg
S1 0 4 3 0 0 0 S2 0 4 3 0 0 0 S3A 0 35 28 0 4 4 S3B 0 35 28 0 4 4 S4A 46 75 69 7 10 9 S4B 46 111 103 7 15 14 S4C 46 111 103 7 15 14 S5 46 111 103 7 15 14 S5X 46 111 103 7 15 14
Source: CMA analysis. Notes: 1. The minimum and maximum correspond to the firms with the lowest and highest average savings respectively. 2. The average is a weighted average across the quarters and uses consumption at different levels of the consumption distribution. The weights reflect the number of accounts that belong to each tariff. 3. Base: single fuel gas SVT DD customers.
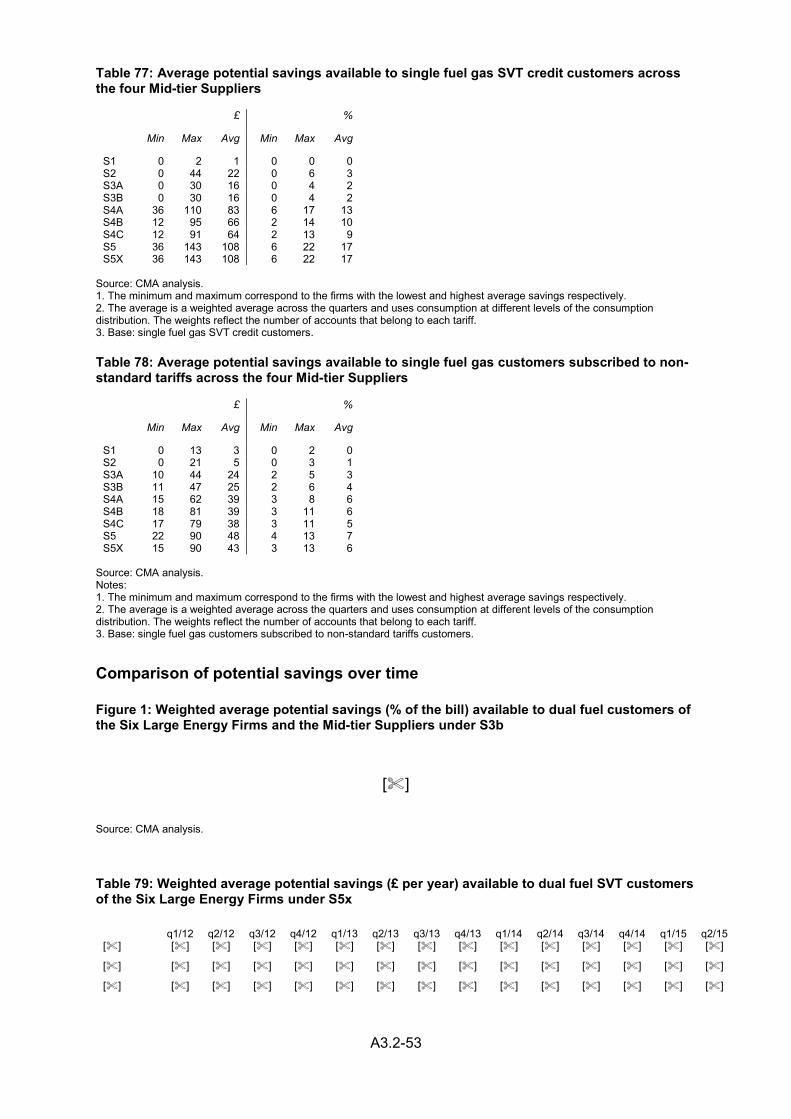
A3.2-53
Table 77: Average potential savings available to single fuel gas SVT credit customers across the four Mid-tier Suppliers
£ %
Min Max Avg Min Max Avg
S1 0 2 1 0 0 0 S2 0 44 22 0 6 3 S3A 0 30 16 0 4 2 S3B 0 30 16 0 4 2 S4A 36 110 83 6 17 13 S4B 12 95 66 2 14 10 S4C 12 91 64 2 13 9 S5 36 143 108 6 22 17 S5X 36 143 108 6 22 17
Source: CMA analysis. 1. The minimum and maximum correspond to the firms with the lowest and highest average savings respectively. 2. The average is a weighted average across the quarters and uses consumption at different levels of the consumption distribution. The weights reflect the number of accounts that belong to each tariff. 3. Base: single fuel gas SVT credit customers.
Table 78: Average potential savings available to single fuel gas customers subscribed to non-standard tariffs across the four Mid-tier Suppliers
£ %
Min Max Avg Min Max Avg
S1 0 13 3 0 2 0 S2 0 21 5 0 3 1 S3A 10 44 24 2 5 3 S3B 11 47 25 2 6 4 S4A 15 62 39 3 8 6 S4B 18 81 39 3 11 6 S4C 17 79 38 3 11 5 S5 22 90 48 4 13 7 S5X 15 90 43 3 13 6
Source: CMA analysis. Notes: 1. The minimum and maximum correspond to the firms with the lowest and highest average savings respectively. 2. The average is a weighted average across the quarters and uses consumption at different levels of the consumption distribution. The weights reflect the number of accounts that belong to each tariff. 3. Base: single fuel gas customers subscribed to non-standard tariffs customers.
Comparison of potential savings over time
Figure 1: Weighted average potential savings (% of the bill) available to dual fuel customers of the Six Large Energy Firms and the Mid-tier Suppliers under S3b
[]
Source: CMA analysis.
Table 79: Weighted average potential savings (£ per year) available to dual fuel SVT customers of the Six Large Energy Firms under S5x
q1/12 q2/12 q3/12 q4/12 q1/13 q2/13 q3/13 q4/13 q1/14 q2/14 q3/14 q4/14 q1/15 q2/15 [] [] [] [] [] [] [] [] [] [] [] [] [] [] []
[] [] [] [] [] [] [] [] [] [] [] [] [] [] []
[] [] [] [] [] [] [] [] [] [] [] [] [] [] []

A3.2-54
[] [] [] [] [] [] [] [] [] [] [] [] [] [] []
[] [] [] [] [] [] [] [] [] [] [] [] [] [] []
[] [] [] [] [] [] [] [] [] [] [] [] [] [] []
Source: CMA analysis.
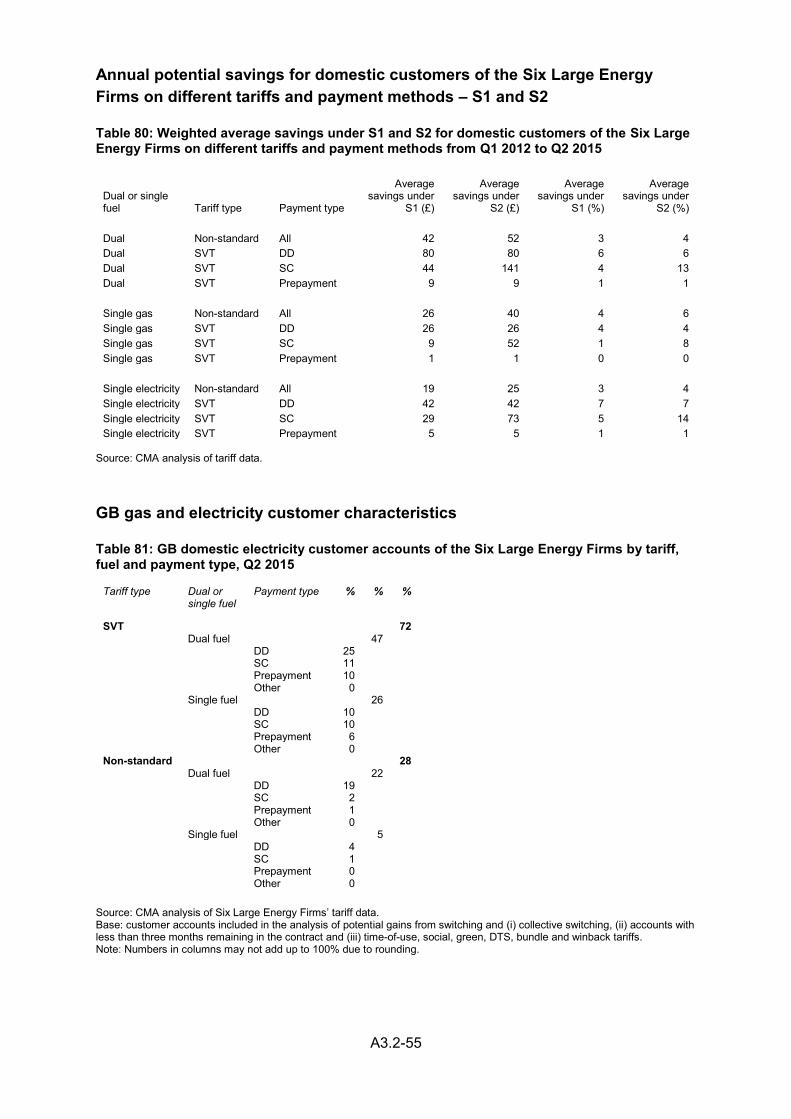
A3.2-55
Annual potential savings for domestic customers of the Six Large Energy Firms on different tariffs and payment methods – S1 and S2
Table 80: Weighted average savings under S1 and S2 for domestic customers of the Six Large Energy Firms on different tariffs and payment methods from Q1 2012 to Q2 2015
Dual or single fuel Tariff type Payment type
Average savings under
S1 (£)
Average savings under
S2 (£)
Average savings under
S1 (%)
Average savings under
S2 (%) Dual Non-standard All 42 52 3 4 Dual SVT DD 80 80 6 6 Dual SVT SC 44 141 4 13 Dual SVT Prepayment 9 9 1 1 Single gas Non-standard All 26 40 4 6 Single gas SVT DD 26 26 4 4 Single gas SVT SC 9 52 1 8 Single gas SVT Prepayment 1 1 0 0 Single electricity Non-standard All 19 25 3 4 Single electricity SVT DD 42 42 7 7 Single electricity SVT SC 29 73 5 14 Single electricity SVT Prepayment 5 5 1 1
Source: CMA analysis of tariff data.
GB gas and electricity customer characteristics
Table 81: GB domestic electricity customer accounts of the Six Large Energy Firms by tariff, fuel and payment type, Q2 2015
Tariff type Dual or single fuel
Payment type % % %
SVT 72 Dual fuel 47
DD 25 SC 11 Prepayment 10 Other 0 Single fuel 26 DD 10 SC 10 Prepayment 6 Other 0 Non-standard 28
Dual fuel 22 DD 19 SC 2 Prepayment 1 Other 0 Single fuel 5 DD 4 SC 1 Prepayment 0 Other 0
Source: CMA analysis of Six Large Energy Firms’ tariff data. Base: customer accounts included in the analysis of potential gains from switching and (i) collective switching, (ii) accounts with less than three months remaining in the contract and (iii) time-of-use, social, green, DTS, bundle and winback tariffs. Note: Numbers in columns may not add up to 100% due to rounding.
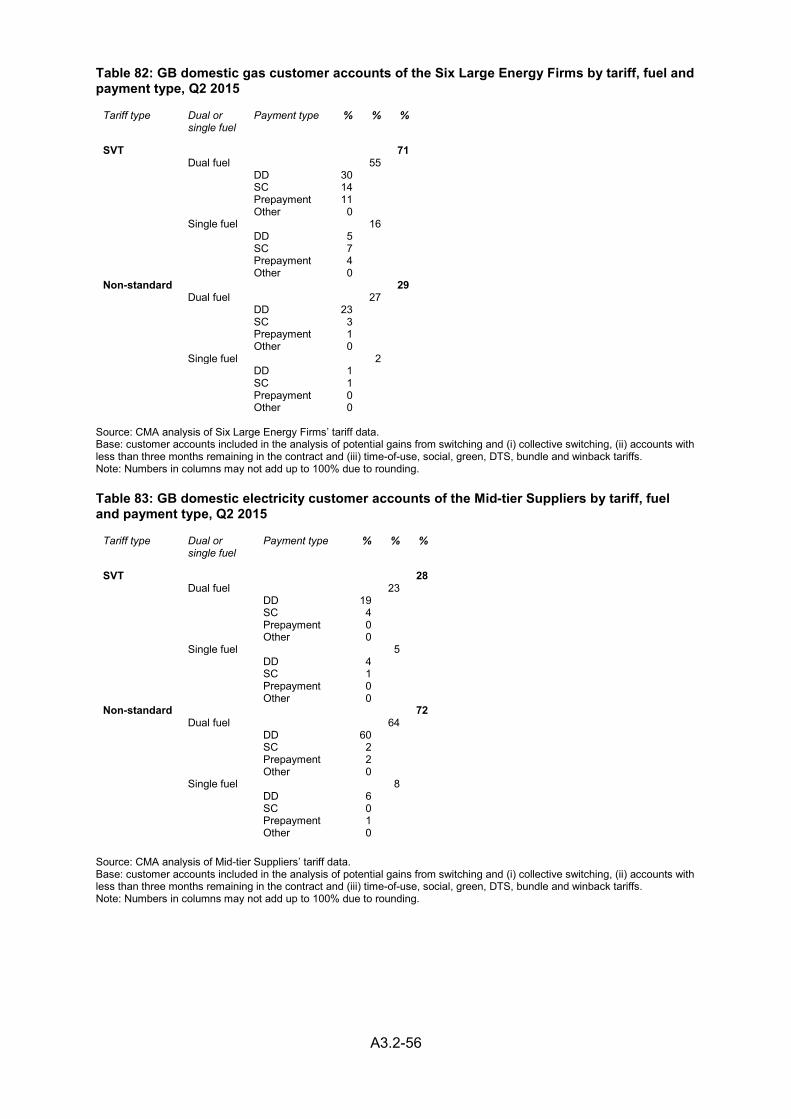
A3.2-56
Table 82: GB domestic gas customer accounts of the Six Large Energy Firms by tariff, fuel and payment type, Q2 2015
Tariff type Dual or single fuel
Payment type % % %
SVT 71 Dual fuel 55
DD 30 SC 14 Prepayment 11 Other 0 Single fuel 16 DD 5 SC 7 Prepayment 4 Other 0 Non-standard 29
Dual fuel 27 DD 23 SC 3 Prepayment 1 Other 0 Single fuel 2 DD 1 SC 1 Prepayment 0 Other 0
Source: CMA analysis of Six Large Energy Firms’ tariff data. Base: customer accounts included in the analysis of potential gains from switching and (i) collective switching, (ii) accounts with less than three months remaining in the contract and (iii) time-of-use, social, green, DTS, bundle and winback tariffs. Note: Numbers in columns may not add up to 100% due to rounding.
Table 83: GB domestic electricity customer accounts of the Mid-tier Suppliers by tariff, fuel and payment type, Q2 2015
Tariff type Dual or single fuel
Payment type % % %
SVT 28 Dual fuel 23
DD 19 SC 4 Prepayment 0 Other 0 Single fuel 5 DD 4 SC 1 Prepayment 0 Other 0 Non-standard 72
Dual fuel 64 DD 60 SC 2 Prepayment 2 Other 0 Single fuel 8 DD 6 SC 0 Prepayment 1 Other 0
Source: CMA analysis of Mid-tier Suppliers’ tariff data. Base: customer accounts included in the analysis of potential gains from switching and (i) collective switching, (ii) accounts with less than three months remaining in the contract and (iii) time-of-use, social, green, DTS, bundle and winback tariffs. Note: Numbers in columns may not add up to 100% due to rounding.
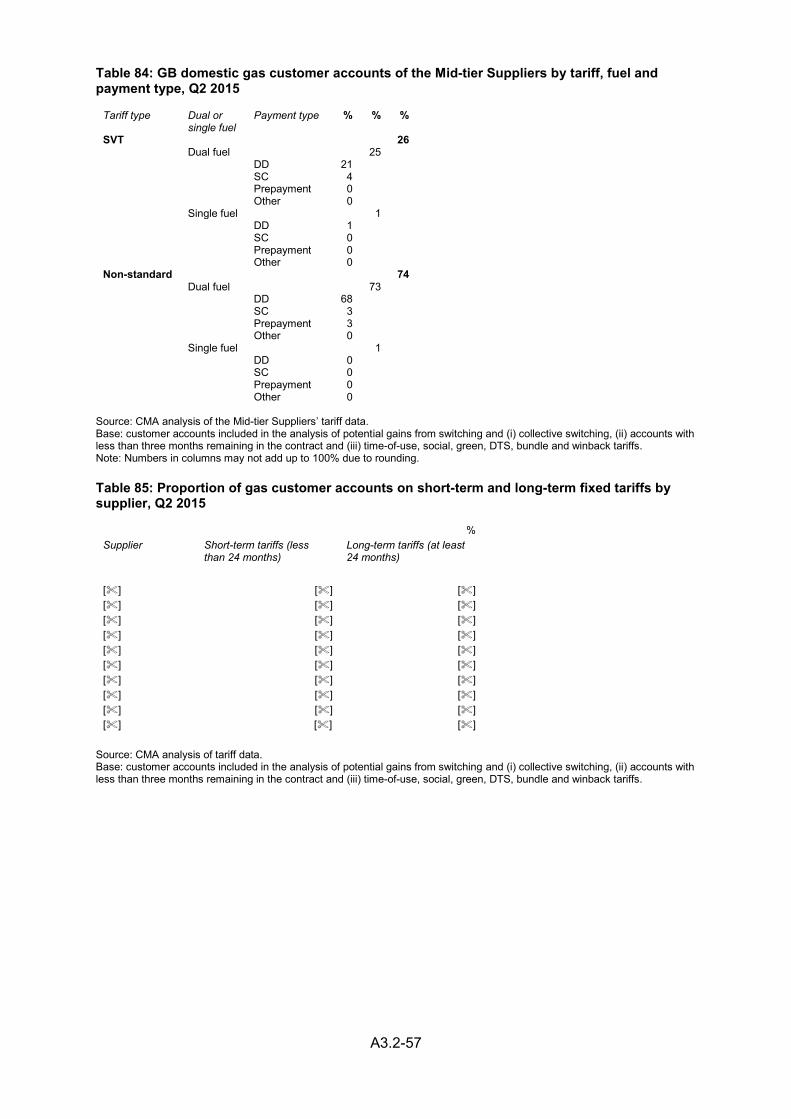
A3.2-57
Table 84: GB domestic gas customer accounts of the Mid-tier Suppliers by tariff, fuel and payment type, Q2 2015
Tariff type Dual or single fuel
Payment type % % %
SVT 26 Dual fuel 25
DD 21 SC 4 Prepayment 0 Other 0 Single fuel 1 DD 1 SC 0 Prepayment 0 Other 0 Non-standard 74
Dual fuel 73 DD 68 SC 3 Prepayment 3 Other 0 Single fuel 1 DD 0 SC 0 Prepayment 0 Other 0
Source: CMA analysis of the Mid-tier Suppliers’ tariff data. Base: customer accounts included in the analysis of potential gains from switching and (i) collective switching, (ii) accounts with less than three months remaining in the contract and (iii) time-of-use, social, green, DTS, bundle and winback tariffs. Note: Numbers in columns may not add up to 100% due to rounding.
Table 85: Proportion of gas customer accounts on short-term and long-term fixed tariffs by supplier, Q2 2015
% Supplier Short-term tariffs (less
than 24 months) Long-term tariffs (at least 24 months)
[] [] [] [] [] [] [] [] [] [] [] [] [] [] [] [] [] [] [] [] [] [] [] [] [] [] [] [] [] []
Source: CMA analysis of tariff data. Base: customer accounts included in the analysis of potential gains from switching and (i) collective switching, (ii) accounts with less than three months remaining in the contract and (iii) time-of-use, social, green, DTS, bundle and winback tariffs.
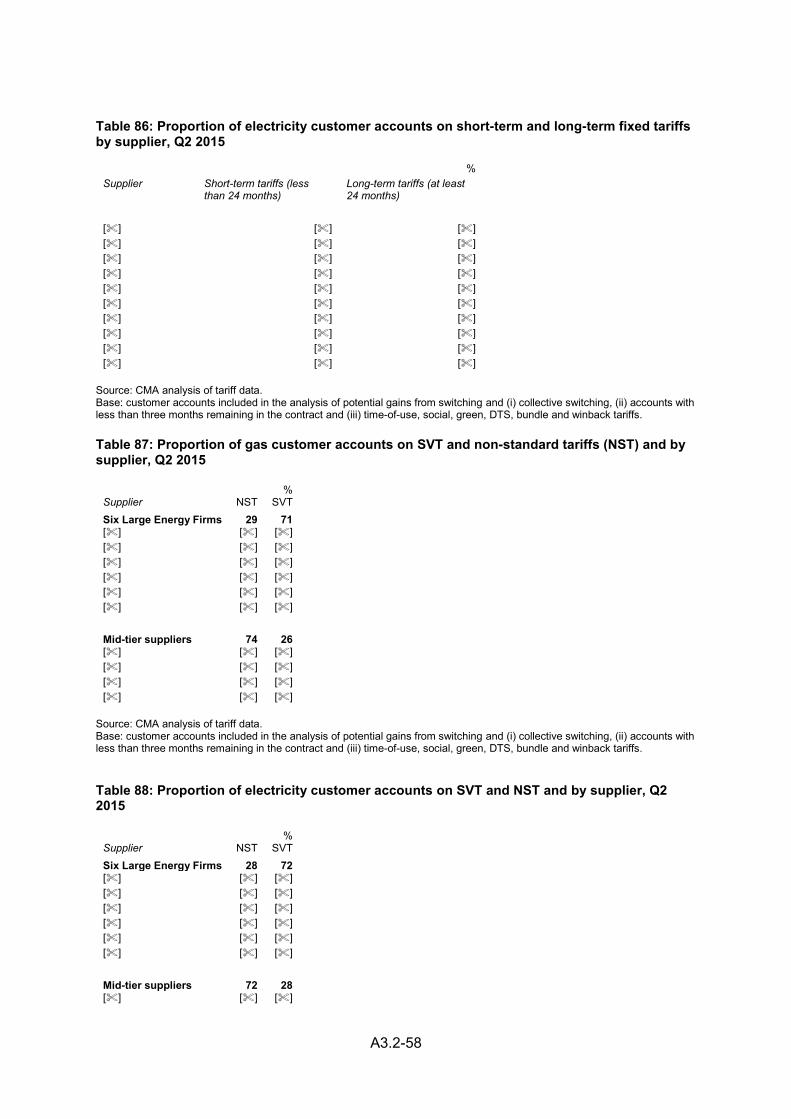
A3.2-58
Table 86: Proportion of electricity customer accounts on short-term and long-term fixed tariffs by supplier, Q2 2015
% Supplier Short-term tariffs (less
than 24 months) Long-term tariffs (at least 24 months)
[] [] [] [] [] [] [] [] [] [] [] [] [] [] [] [] [] [] [] [] [] [] [] [] [] [] [] [] [] []
Source: CMA analysis of tariff data. Base: customer accounts included in the analysis of potential gains from switching and (i) collective switching, (ii) accounts with less than three months remaining in the contract and (iii) time-of-use, social, green, DTS, bundle and winback tariffs.
Table 87: Proportion of gas customer accounts on SVT and non-standard tariffs (NST) and by supplier, Q2 2015
% Supplier NST SVT Six Large Energy Firms 29 71 [] [] [] [] [] [] [] [] [] [] [] [] [] [] [] [] [] [] Mid-tier suppliers 74 26 [] [] [] [] [] [] [] [] [] [] [] []
Source: CMA analysis of tariff data. Base: customer accounts included in the analysis of potential gains from switching and (i) collective switching, (ii) accounts with less than three months remaining in the contract and (iii) time-of-use, social, green, DTS, bundle and winback tariffs.
Table 88: Proportion of electricity customer accounts on SVT and NST and by supplier, Q2 2015
% Supplier NST SVT Six Large Energy Firms 28 72 [] [] [] [] [] [] [] [] [] [] [] [] [] [] [] [] [] [] Mid-tier suppliers 72 28 [] [] []

A3.2-59
Source: CMA analysis of tariff data. Base: customer accounts included in the analysis of potential gains from switching and (i) collective switching, (ii) accounts with less than three months remaining in the contract and (iii) time-of-use, social, green, DTS, bundle and winback tariffs.
[] [] [] [] [] [] [] [] []