Embed Size (px)
Citation preview

Transport Assessment – Issue 2.1 Northampton South SUE
J:\28015 Collingtree\word\Reports\Transport\Transport Assessment\28015 Transport Assessment 140430 - Issue 2.1 - Planning Application.docx
160
Appendix 12.1 - Northamptonshire Strategic Transport Model Local Model Validation Report and correspondence

Northamptonshire Strategic Transport Model Local Model Validation Report
- November 2011 Update Northamptonshire Highways
February 2012
Northampton Riverside House Riverside Way Northampton NN1 5NX Tel: +44 (0)1604 654659 Fax: +44 (0)1604 654699 www.mgwsp.co.uk May Gurney Ltd, Registered Office: Holland Court, The Close, Norwich, NR1 4DY Registered Number 00873179 England WSP Management Services Limited Registered Office: WSP House, 70 Chancery Lane, London WC2A 1AF Registered Number 02454665 England
QM
Issue/revision Issue 1 Revision 1 Revision 2 Revision 3 Remarks Draft for Client
Comments
Date 22/02/2012
Prepared by Emily Butler
Signature
Checked by Alan Cowan
Signature
Authorised by Craig Drennan
Signature
Project number 10581574
File reference N:\Northants Multi Modal Transport Model\TEXT\REPORTS\LMVR\Highway\NSTM Highway LMVR Revision January 2012\NSTM LMVR_220212.doc
[
Contents
1 Introduction 1 2 Northamptonshire Strategic Transport Model - Overview 5 3 Highway Network Development 17 4 Observed Highway Matrix Development 24 5 Calibration - Highway Assignment Model 31 6 Validation - Highway Assignment Model 37 7 Conclusions 49 APPENDIX NO 1: Zone Correspondence Table 50 APPENDIX NO 2: Routeing Validation 51 APPENDIX NO 3: Matrix Sector Comparison 52 APPENDIX NO 4: Trip Length Distribution 53 APPENDIX NO 5: AM Peak - Detailed Calibration/Validation Results 54 APPENDIX NO 6: PM Peak - Detailed Calibration/Validation Results 56 APPENDIX NO 7: AM Peak – Combined Dataset Calibration Results 57 APPENDIX NO 8: PM Peak – Combined Dataset Calibration Results 58 APPENDIX NO 9: Journey Time Graphs – AM Peak 59 APPENDIX NO 10: Journey Time Graphs – PM Peak 60 APPENDIX NO 11: RSI Matrix Assignment – AM Peak 62 APPENDIX NO 12: RSI Matrix Assignment – PM Peak 64 LIST OF FIGURES
Figure 1.1: Strategic Transport Network within Northamptonshire Figure 2.1: Overall NSTM Structure Figure 2.2: RSI Site Locations Figure 2.3: TRADS Site Locations Figure 3.1: Study Area Figure 3.2: SATURN Highway Network Figure 3.3: Northamptonshire Internal Zones Figure 3.4: External Zones Figure 3.5: Internal Sectors Figure 3.6: External Sectors Figure 4.1: Highway Observed Matrix Development Figure 6.1: Journey Time Routes Figure 6.2: Screenlines
LIST OF TABLES
Table 2.1: Location of Roadside Interview Sites ....................................................................... 11 Table 2.2: Location of Sites for TRADS Data ........................................................................... 13 Table 3.1: Speed/flow relationship ............................................................................................ 19 Table 3.2: Default Saturation Flows .......................................................................................... 21 Table 4.1: Number of ME2 Counts ........................................................................................... 27 Table 4.2: AM Peak - Comparison of Trip Matrix Totals ........................................................... 28 Table 4.3: PM Peak - Comparison of Trip Matrix Totals ........................................................... 28 Table 4.4: Total R2 values for Sector to Sector Analysis ......................................................... 29 Table 4.5: Trip Length Distribution ............................................................................................ 29 Table 5.1: Generalised Cost Parameters ................................................................................. 32 Table 5.2: Convergence Criteria ............................................................................................... 33

Table 5.3: Convergence Statistics ............................................................................................ 33 Table 5.4: Assignment Acceptability Guidelines ....................................................................... 34 Table 5.5: Calibration results .................................................................................................... 35 Table 6.1: Validation results ..................................................................................................... 39 Table 6.2: Combined Dataset Link Validation ........................................................................... 40 Table 6.3: Observed Journey Time Statistics – AM Peak and PM Peak .................................. 41 Table 6.4: Journey Time Summary Results – AM Peak ........................................................... 44 Table 6.5: Journey Time Summary Results – PM Peak ........................................................... 45 Table 6.6: AM Peak Screenline Validation ............................................................................... 47 Table 6.7: PM Peak Screenline Validation ............................................................................... 47

NSTM - LMVR Highway Model Version 1.0 1
1 Introduction
1.1 STUDY BRIEF
1.1.1 As part of the sustainable transport highway services contract for Northamptonshire County Council (NCC) the MGWSP joint venture was commissioned by NCC to combine and update the two existing strategic transportation models:
North Northamptonshire Highway Model (SATURN)
West Northamptonshire Multi-Modal Model (SATURN and EMME/2)
1.1.2 Under this commission the existing models have been combined and updated to produce a single County Wide Strategic Transport Model. The SATURN (Simulation and Assignment of Traffic in Urban Road Networks) suite of programs was used to build the observed highway model while EMME3 has been used to build the Demand Model and the Public Transport Model. The strategic model developed by WSP offers an integrated system for a range of transport modes, representing private and public transport as well as modal interchange behaviour such as walking. The model will have the ability to quantify the benefits of a policy change or new transport infrastructure in Northamptonshire, enabling the testing of future transport proposals and developments (including developer led) in an efficient, consistent and evidentially based manner.
1.1.3 The model specification was developed in accordance with current Department for Transport guidelines detailed in the Web based Transport Analysis Guidance (WebTAG), which is aimed at ensuring a consistent and reputable basis for forecasting. The highway model was developed in line with Design Manual for Roads and Bridges (DMRB) guidance.
1.1.4 This involved a multi-modal data collection exercise with the end result being a fully calibrated and validated Multi-Modal Transport Model of Northamptonshire County and the surrounding areas, hereinafter referred to as the Northamptonshire Strategic Transport Model (NSTM).
1.1.5 The purpose of the NSTM is to inform the assessment of the Local Development Framework (LDF) Core Strategy, and will subsequently be used to assess individual development proposals and highway infrastructure schemes.
2 NSTM - LMVR Highway Model Version 1.0
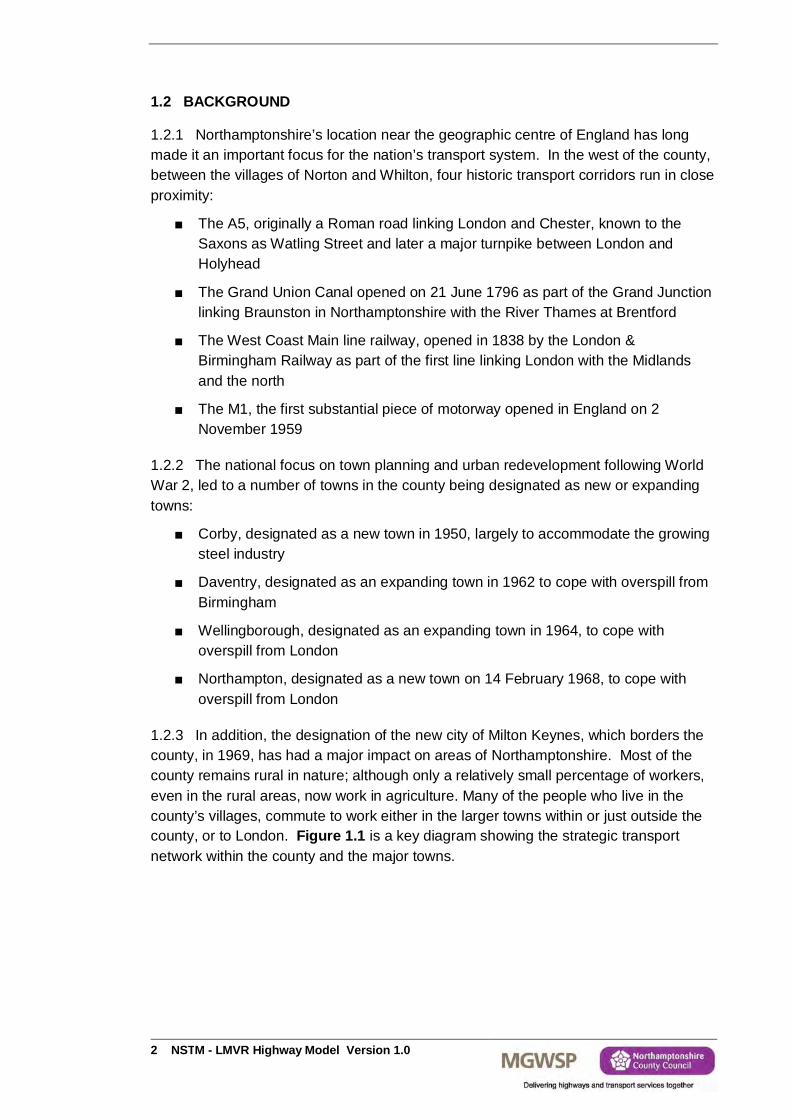
1.2 BACKGROUND
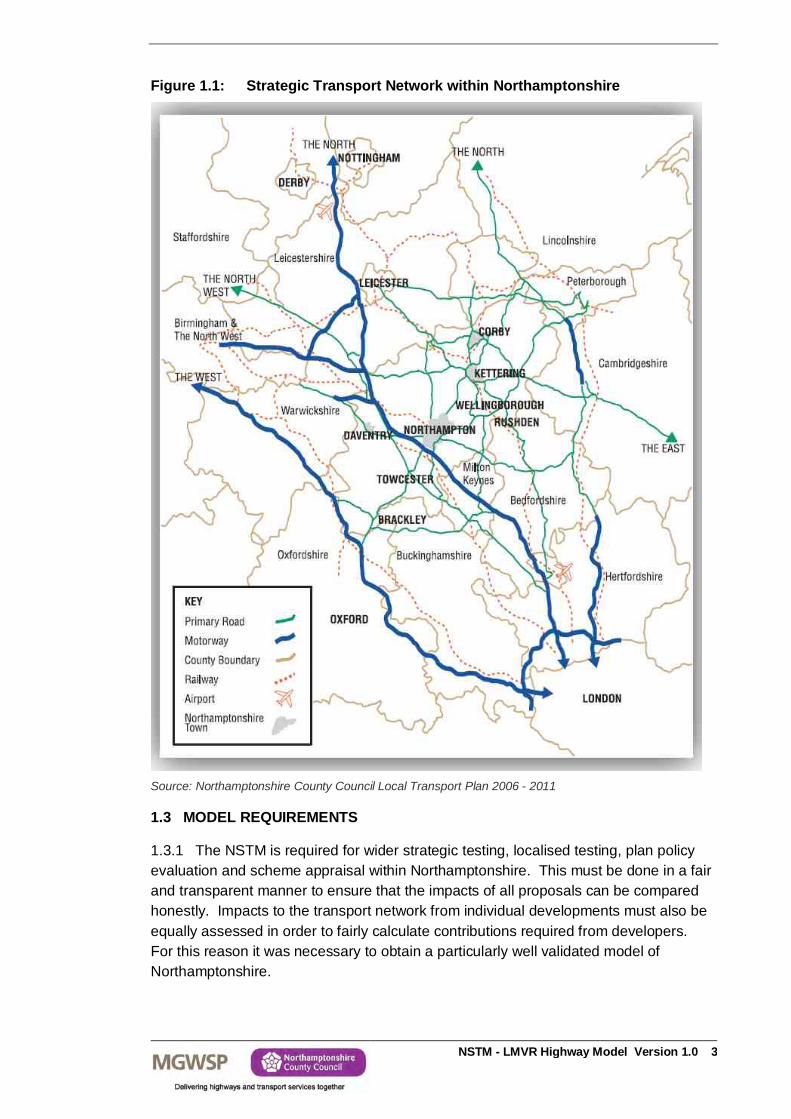
1.2.1 Northamptonshire’s location near the geographic centre of England has long made it an important focus for the nation’s transport system. In the west of the county, between the villages of Norton and Whilton, four historic transport corridors run in close proximity:
The A5, originally a Roman road linking London and Chester, known to the Saxons as Watling Street and later a major turnpike between London and Holyhead
The Grand Union Canal opened on 21 June 1796 as part of the Grand Junction linking Braunston in Northamptonshire with the River Thames at Brentford
The West Coast Main line railway, opened in 1838 by the London & Birmingham Railway as part of the first line linking London with the Midlands and the north
The M1, the first substantial piece of motorway opened in England on 2 November 1959
1.2.2 The national focus on town planning and urban redevelopment following World War 2, led to a number of towns in the county being designated as new or expanding towns:
Corby, designated as a new town in 1950, largely to accommodate the growing steel industry
Daventry, designated as an expanding town in 1962 to cope with overspill from Birmingham
Wellingborough, designated as an expanding town in 1964, to cope with overspill from London
Northampton, designated as a new town on 14 February 1968, to cope with overspill from London
1.2.3 In addition, the designation of the new city of Milton Keynes, which borders the county, in 1969, has had a major impact on areas of Northamptonshire. Most of the county remains rural in nature; although only a relatively small percentage of workers, even in the rural areas, now work in agriculture. Many of the people who live in the county’s villages, commute to work either in the larger towns within or just outside the county, or to London. Figure 1.1 is a key diagram showing the strategic transport network within the county and the major towns.
NSTM - LMVR Highway Model Version 1.0 3
Figure 1.1: Strategic Transport Network within Northamptonshire
Source: Northamptonshire County Council Local Transport Plan 2006 - 2011
1.3 MODEL REQUIREMENTS
1.3.1 The NSTM is required for wider strategic testing, localised testing, plan policy evaluation and scheme appraisal within Northamptonshire. This must be done in a fair and transparent manner to ensure that the impacts of all proposals can be compared honestly. Impacts to the transport network from individual developments must also be equally assessed in order to fairly calculate contributions required from developers. For this reason it was necessary to obtain a particularly well validated model of Northamptonshire.
4 NSTM - LMVR Highway Model Version 1.0
1.3.2 A Steering Group (SG) comprising technically able members from WSP, MGWSP, NCC, AECOM (as advisors to the HA) and the HA, was set up to agree modelling principles, methodologies, assumptions and scope. This has provided a high degree of control and minimised grounds for disagreement at a later stage in the study process.
1.3.3 The purpose of the Local Model Validation Report (LMVR) is to present the development of the NSTM and demonstrate that it was developed in a robust manner, meets WebTAG and DMRB criteria and is fit for purpose.
1.3.4 The LMVR for the original NSTM highway model was published in June 2010, and was updated in June 2011 to include greater detail in Corby and Towcester. Subsequent use of the NSTM highlighted a number of minor points which, when fixed, had a sufficiently large cumulative effect to require a revalidation. This LMVR sets out the results from the November 2011 revalidation of the NSTM.
1.4 STRUCTURE OF THE REPORT
1.4.1 The structure of this Local Model Validation Report (LMVR) – Highway Model is based on guidance contained in the Design Manual for Roads and Bridges (DMRB) Volume 12, Section 2, Part 1, Appendix B (reference 6). It is as follows:
Chapter 2 of this report gives a summary of the overall structure of the NSTM and the way in which this model has been developed is described
Chapter 3 summarises the development of the highway network
Chapter 4 discusses the development of the observed highway matrices
Chapters 5 and 6 describe the calibration and validation process of the highway assignment model
Chapter 7 concludes the report

NSTM - LMVR Highway Model Version 1.0 5
2 Northamptonshire Strategic Transport Model - Overview
2.1 BACKGROUND
2.1.1 The purpose of the Northamptonshire Strategic Transport Model (NSTM) is to inform the assessment of the Local Development Framework (LDF) Core Strategy, and will subsequently be used to assess individual development proposals and highway infrastructure schemes.
2.1.2 With this in mind, the NSTM has been constructed as a strategic highway model covering Northamptonshire and as a multi-modal transport model capable of assessing the impacts of future changes in journey patterns within Northamptonshire.
2.1.3 This section describes the model approach, the software applied and the data collated for use in developing the NSTM.
2.2 MODELLING APPROACH
2.2.1 The NSTM is designed to enable future land use planning and transport policy initiatives to be assessed in an integrated fashion. This integration aims to take account of:
The impacts of economic and demographic trends and of land use change on the spatial and modal pattern of the demand for passenger transport
The impacts of changes in transport costs and characteristics on the costs and spatial patterns of location of employment and households
2.2.2 The modelling specified is wide ranging, in that it includes all modes of travel and has the ability to assess a wider set of short term and longer term behavioural responses to policy initiatives than is normal in more traditional models.
6 NSTM - LMVR Highway Model Version 1.0
2.2.3 This model represents, at the strategic level, the main long-distance transport routes in the entire study area. There is a detailed representation of traffic and public transport service levels within the NSTM area. As a result the key abilities of the model are:
Assessing the transport impacts of significant developments
Reviewing the impact of development plans on the transport network
Forecasting changes in demand as a result of changes in the socio-economic characteristics
Allowing forecasting of demand by all modes for a period in line with current Local Development Framework timescales
Identification of schemes and measures for LTP3 and considering the impact of improvements on the strategic network
Identifying current and future congestion hotspots and assist in the modelling of the network management scenarios assisting the local transport authority to fulfil its requirements as required by the Traffic Management Act 2004
2.2.4 The model has been developed with due cognisance of WebTAG on model form and development to accommodate major infrastructure improvements and the sensitivity analysis required to achieve central government funding.
2.2.5 The NSTM is built on a behavioural basis that determines the travel demand from the underlying characteristics of the transport supply and characteristics of the travellers in the area. Key features of the model are:
The input of detailed planning / land use assumptions
The generation of trips by all modes of travel for the different segments of the population
The choice of mode of travel
The distribution of the different trip types to the various destinations available
The choice of routes of travel
An accurate representation of the observed base year travel patterns
Realistic representation of the observed base year, congestion and queuing in the AM Peak and PM Peak periods
2.2.6 This list of requirements is a mixture of the features typically found in strategic transport models, focusing primarily on travel demand choices, and the features of a local highway model, representing the local road network in detail incorporating junction delays and queuing.
NSTM - LMVR Highway Model Version 1.0 7
2.2.7 Local highway models typically use highway demand matrices derived from survey data which can be calibrated to accurately match traffic counts in the base year. However, the lack of any behavioural basis in the derivation of these matrices means that a relatively crude approach is required to modify these matrices through time in order to produce future year matrices. This approach cannot take into account any fundamental changes in trip patterns arising through changing population and attraction opportunities.
2.2.8 Strategic travel demand models derive synthetic trip matrices through a series of behaviourally-based relationships using population, employment and trip rate information. Unless these synthetic matrices are subsequently manipulated to match some observed targets, it is unlikely that a validation of resulting traffic flows would be as accurate in the base year as those obtained in a local model using matrices built from survey data.
2.2.9 To produce a satisfactory model for this study it is important to bring the best aspects of the two types of model together into a single modelling framework; synthetic travel demand matrices are developed based on the choices facing travellers and observed matrices calibrated with observed origin and destination information from survey data. By making the two sets of matrices (synthetic and observed) comparable, the synthetic model is able to forecast changes in model matrices which can be applied to the observed highway matrices.
2.3 MODEL FORM AND STRUCTURE
2.3.1 The NSTM consists of two main models:
Observed assignment model
Synthetic or Demand model, incorporating the traditional four stages of trip generation, mode choice, trip distribution and assignment which uses the observed assignment model outputs
2.3.2 Of the two models, the observed model is the more accurate representation of the current (base year) conditions simply because it is based on the best significant volumes of directly observed data. However, the future will bring complex changes to land use and transport infrastructure that will have a significant impact on travel demand. In this case the observed model becomes less reliable if taken forward in its own right. The Demand Model uses the synthetic approach to develop the best estimate of changes in demand over time and as such is the ideal tool for forecasting as it considers so many of the complexities that the observed model cannot, such as destination choice and mode shift between all motorised and slow modes.

8 NSTM - LMVR Highway Model Version 1.0
2.3.3 Current guidance on model development indicates that one of the main decisions required at an early stage is the form of the forecast model. Namely whether they are implemented as incremental models or whether they are absolute models. WebTAG Unit 3.10.3 Section 1.5 sets out the three main types of the model form:
Absolute models that use a direct estimate of the numbers of trips in each category
Absolute models applied incrementally that use absolute model estimates to apply changes to a base matrix
Pivot point models that use cost changes to estimate the changes in the numbers of trips from a base matrix
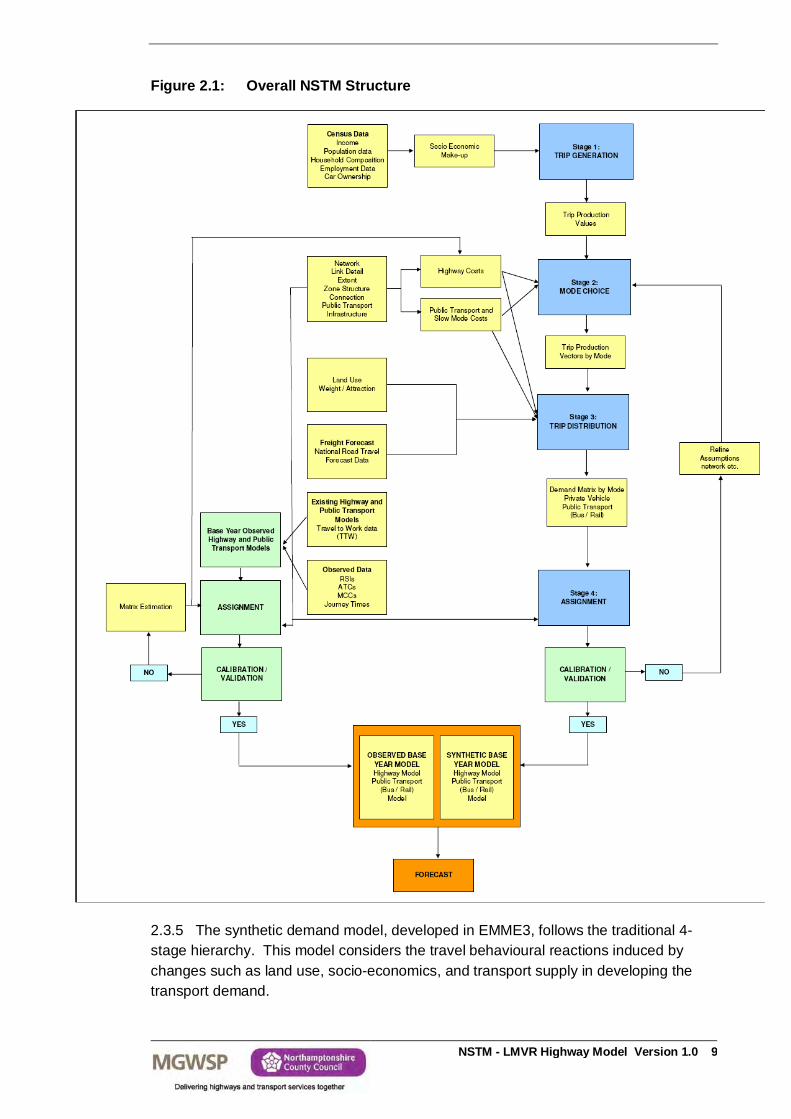
2.3.4 The Department for Transport (DfT) preference is for an incremental form of model whether pivot-point or based on incremental application of absolute estimates. The NSTM is an absolute model applied incrementally. The overall structure of the model is shown in Figure 2.1.
NSTM - LMVR Highway Model Version 1.0 9
Figure 2.1: Overall NSTM Structure
2.3.5 The synthetic demand model, developed in EMME3, follows the traditional 4-stage hierarchy. This model considers the travel behavioural reactions induced by changes such as land use, socio-economics, and transport supply in developing the transport demand.
10 NSTM - LMVR Highway Model Version 1.0
2.3.6 The base year and forecast trip patterns are produced by the synthetic demand model calibrated to fit as closely as possible to the known observed travel patterns. The absolute model estimates of the base and forecast trip patterns are then used to apply changes to a base observed matrix.
2.3.7 The base year synthetic model is validated to the known observed travel choices and is used to produce future forecasts. The changes, which take into account changes in generalised cost and zone attractiveness, between the base year and the future forecast in the synthetic model are then inputted into the base observed model to measure the actual change between the base year and the future forecast.
2.3.8 The Highway and Public Transport observed models are developed in SATURN 10.9.22 and EMME3 respectively in line with the Design Manual for Roads and Bridges (DMRB) Volume 12 standards.
2.3.9 Further information on the Public Transport Model is provided in the NSTM Local Model Validation Report – Public Transport Model, December 2009.
2.4 OBSERVED ASSIGNMENT MODEL
2008 BASE YEAR
2.4.1 AM peak (08:00-09:00) and PM peak (17:00-18:00) observed assignment models were developed for the base year. The observed base year matrices were developed for each existing mode type (i.e. bus, rail, and vehicles including private vehicle and goods vehicle). These matrices were partially developed from observed trip behaviour determined through a combination of Roadside Interviews (RSIs), Automatic Traffic Counts (ATC), Manual Classified Counts (MCC), Bus and Rail surveys. The unobserved trips were created using the previous version of the NSTM synthetic model to infill. All peak models have been calibrated and validated to the current acceptability criteria as detailed in the Design Manual for Roads and Bridges (DMRB) Volume 12.
OBSERVED MODEL DATA COLLECTION
2.4.2 The NSTM prior matrices were constructed from Roadside Interview (RSI) data used to create the previous two models. Original interviews were conducted in 2002 and 2005. To update the data to 2008, new information from Automatic Traffic Counts (ATCs) at the same sites was used. The updated ATCs were either undertaken as part of NCC’s rolling data collection programme, or were specially commissioned. There were a number of sites for which it was not possible to obtain new data; in these cases, TEMPRO was used to factor the original ATC to a 2008 total.
2.4.3 The 2011 update incorporated an additional 6 RSI sites surveyed in June 2009 for the A43 Corby Link Road model, and 5 RSI sites, also surveyed in June 2009, for the Atkins Isham Bypass model.
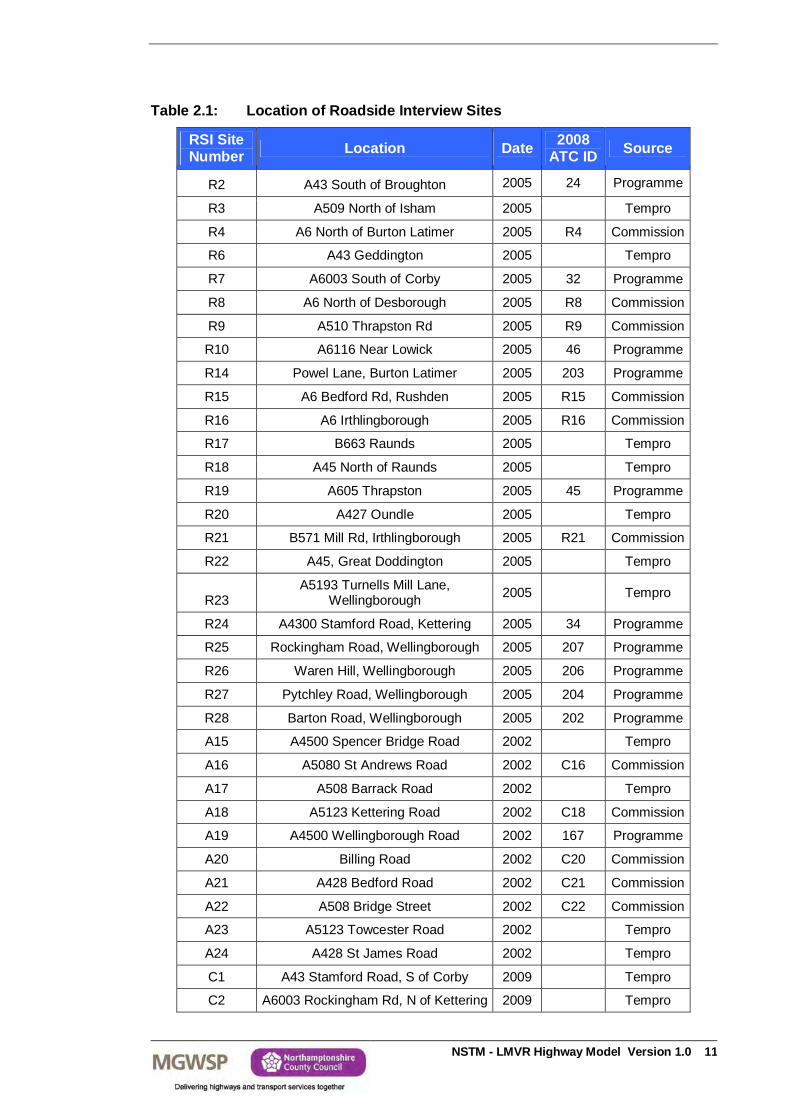
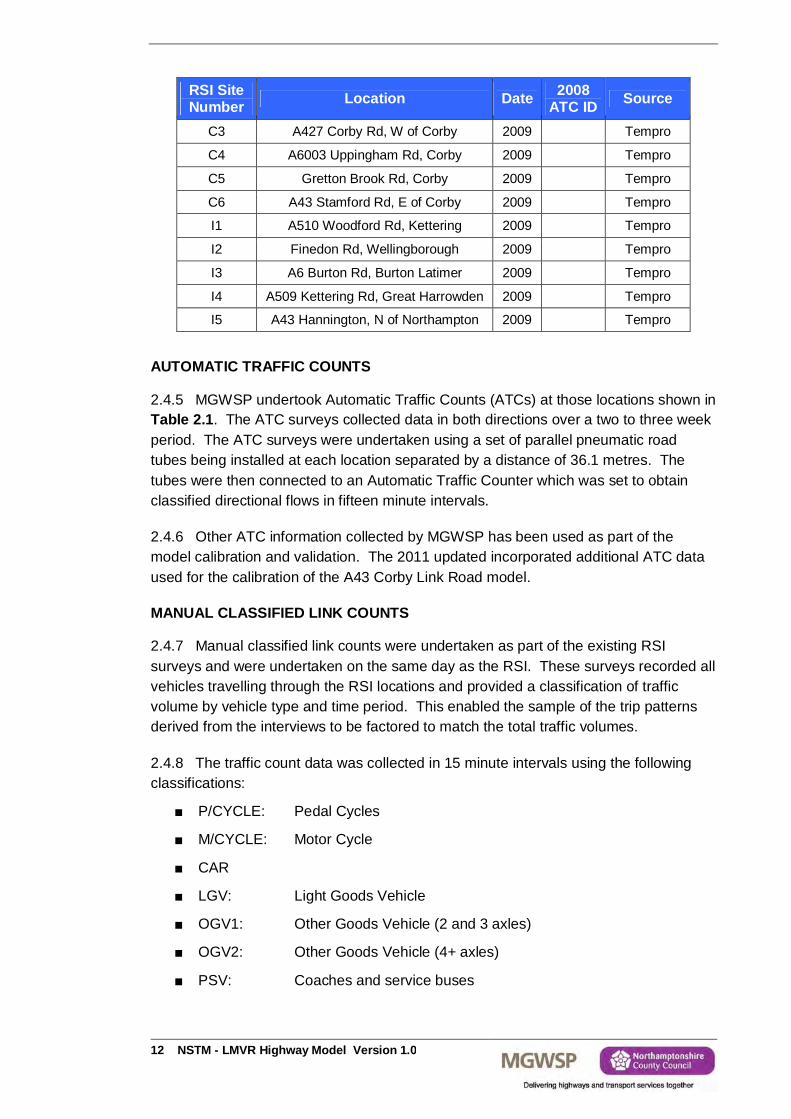
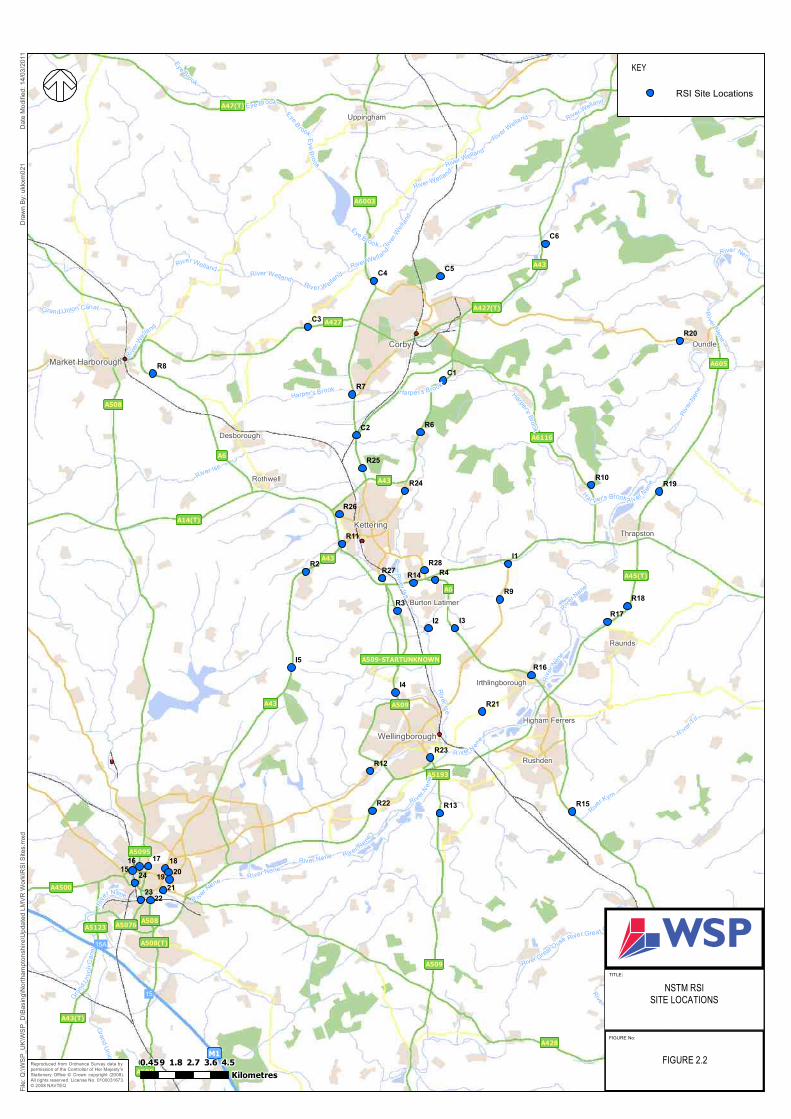
2.4.4 A total of 44 RSI sites were used to create the prior matrix. These are shown in Table 2.1 and Figure 2.2.
NSTM - LMVR Highway Model Version 1.0 11
Table 2.1: Location of Roadside Interview Sites
RSI Site Number Location Date 2008
ATC ID Source
R2 A43 South of Broughton 2005 24 Programme
R3 A509 North of Isham 2005 Tempro
R4 A6 North of Burton Latimer 2005 R4 Commission
R6 A43 Geddington 2005 Tempro
R7 A6003 South of Corby 2005 32 Programme
R8 A6 North of Desborough 2005 R8 Commission
R9 A510 Thrapston Rd 2005 R9 Commission
R10 A6116 Near Lowick 2005 46 Programme
R14 Powel Lane, Burton Latimer 2005 203 Programme
R15 A6 Bedford Rd, Rushden 2005 R15 Commission
R16 A6 Irthlingborough 2005 R16 Commission
R17 B663 Raunds 2005 Tempro
R18 A45 North of Raunds 2005 Tempro
R19 A605 Thrapston 2005 45 Programme
R20 A427 Oundle 2005 Tempro
R21 B571 Mill Rd, Irthlingborough 2005 R21 Commission
R22 A45, Great Doddington 2005 Tempro
R23 A5193 Turnells Mill Lane,
Wellingborough 2005 Tempro
R24 A4300 Stamford Road, Kettering 2005 34 Programme
R25 Rockingham Road, Wellingborough 2005 207 Programme
R26 Waren Hill, Wellingborough 2005 206 Programme
R27 Pytchley Road, Wellingborough 2005 204 Programme
R28 Barton Road, Wellingborough 2005 202 Programme
A15 A4500 Spencer Bridge Road 2002 Tempro
A16 A5080 St Andrews Road 2002 C16 Commission
A17 A508 Barrack Road 2002 Tempro
A18 A5123 Kettering Road 2002 C18 Commission
A19 A4500 Wellingborough Road 2002 167 Programme
A20 Billing Road 2002 C20 Commission
A21 A428 Bedford Road 2002 C21 Commission
A22 A508 Bridge Street 2002 C22 Commission
A23 A5123 Towcester Road 2002 Tempro
A24 A428 St James Road 2002 Tempro
C1 A43 Stamford Road, S of Corby 2009 Tempro
C2 A6003 Rockingham Rd, N of Kettering 2009 Tempro
12 NSTM - LMVR Highway Model Version 1.0
RSI Site Number Location Date 2008
ATC ID Source
C3 A427 Corby Rd, W of Corby 2009 Tempro
C4 A6003 Uppingham Rd, Corby 2009 Tempro
C5 Gretton Brook Rd, Corby 2009 Tempro
C6 A43 Stamford Rd, E of Corby 2009 Tempro
I1 A510 Woodford Rd, Kettering 2009 Tempro
I2 Finedon Rd, Wellingborough 2009 Tempro
I3 A6 Burton Rd, Burton Latimer 2009 Tempro
I4 A509 Kettering Rd, Great Harrowden 2009 Tempro
I5 A43 Hannington, N of Northampton 2009 Tempro
AUTOMATIC TRAFFIC COUNTS
2.4.5 MGWSP undertook Automatic Traffic Counts (ATCs) at those locations shown in Table 2.1. The ATC surveys collected data in both directions over a two to three week period. The ATC surveys were undertaken using a set of parallel pneumatic road tubes being installed at each location separated by a distance of 36.1 metres. The tubes were then connected to an Automatic Traffic Counter which was set to obtain classified directional flows in fifteen minute intervals.
2.4.6 Other ATC information collected by MGWSP has been used as part of the model calibration and validation. The 2011 updated incorporated additional ATC data used for the calibration of the A43 Corby Link Road model.
MANUAL CLASSIFIED LINK COUNTS
2.4.7 Manual classified link counts were undertaken as part of the existing RSI surveys and were undertaken on the same day as the RSI. These surveys recorded all vehicles travelling through the RSI locations and provided a classification of traffic volume by vehicle type and time period. This enabled the sample of the trip patterns derived from the interviews to be factored to match the total traffic volumes.
2.4.8 The traffic count data was collected in 15 minute intervals using the following classifications:
P/CYCLE: Pedal Cycles
M/CYCLE: Motor Cycle
CAR
LGV: Light Goods Vehicle
OGV1: Other Goods Vehicle (2 and 3 axles)
OGV2: Other Goods Vehicle (4+ axles)
PSV: Coaches and service buses
NSTM - LMVR Highway Model Version 1.0 13
MANUAL CLASSIFIED TURNING COUNTS
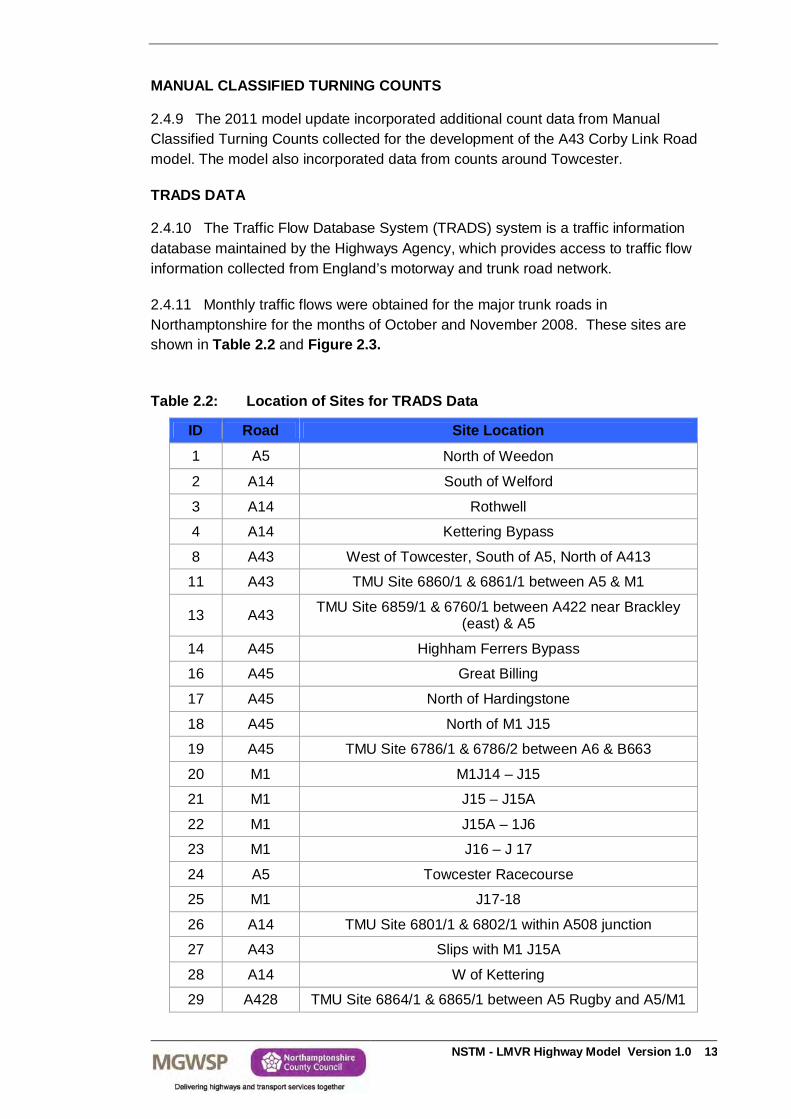
2.4.9 The 2011 model update incorporated additional count data from Manual Classified Turning Counts collected for the development of the A43 Corby Link Road model. The model also incorporated data from counts around Towcester.
TRADS DATA
2.4.10 The Traffic Flow Database System (TRADS) system is a traffic information database maintained by the Highways Agency, which provides access to traffic flow information collected from England’s motorway and trunk road network.
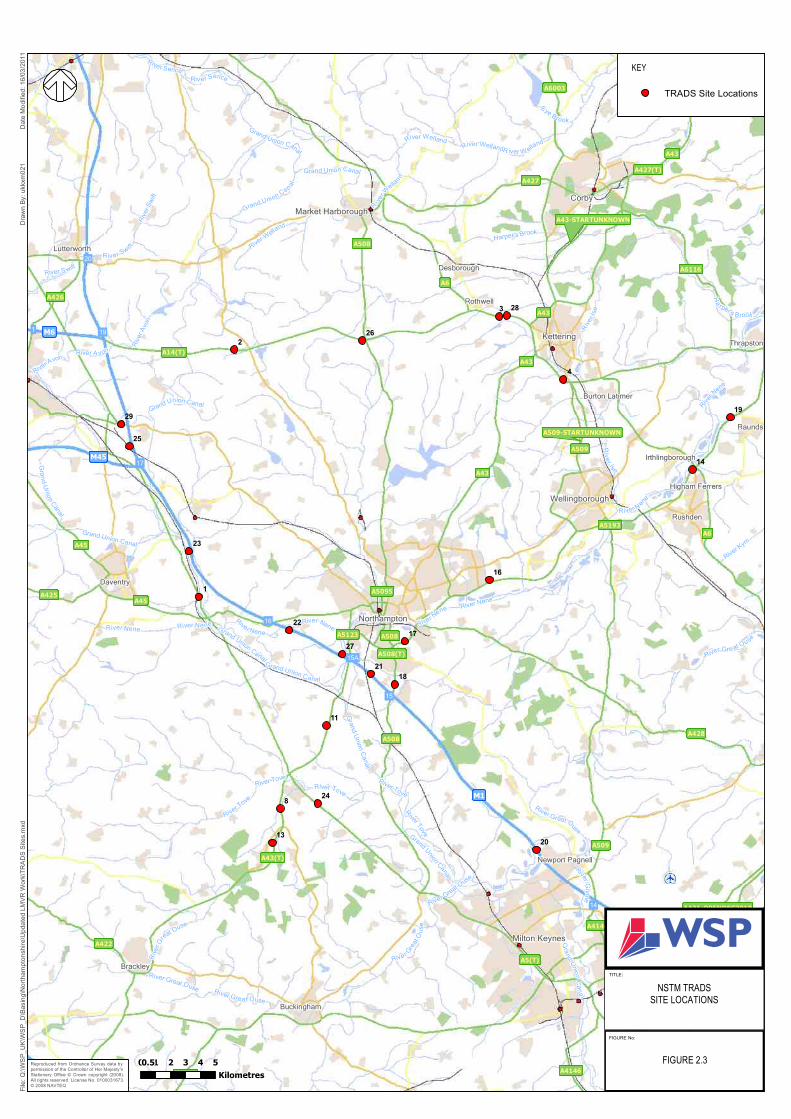
2.4.11 Monthly traffic flows were obtained for the major trunk roads in Northamptonshire for the months of October and November 2008. These sites are shown in Table 2.2 and Figure 2.3.
Table 2.2: Location of Sites for TRADS Data
ID Road Site Location
1 A5 North of Weedon
2 A14 South of Welford
3 A14 Rothwell
4 A14 Kettering Bypass
8 A43 West of Towcester, South of A5, North of A413
11 A43 TMU Site 6860/1 & 6861/1 between A5 & M1
13 A43 TMU Site 6859/1 & 6760/1 between A422 near Brackley (east) & A5
14 A45 Highham Ferrers Bypass
16 A45 Great Billing
17 A45 North of Hardingstone
18 A45 North of M1 J15
19 A45 TMU Site 6786/1 & 6786/2 between A6 & B663
20 M1 M1J14 – J15
21 M1 J15 – J15A
22 M1 J15A – 1J6
23 M1 J16 – J 17
24 A5 Towcester Racecourse
25 M1 J17-18
26 A14 TMU Site 6801/1 & 6802/1 within A508 junction
27 A43 Slips with M1 J15A
28 A14 W of Kettering
29 A428 TMU Site 6864/1 & 6865/1 between A5 Rugby and A5/M1
14 NSTM - LMVR Highway Model Version 1.0
2.4.12 The set of TRADS data was updated for the 2011 model update to resolve issues of double counting or conflicting counts arising from the inclusion of the other additional count data.
JOURNEY TIME SURVEYS
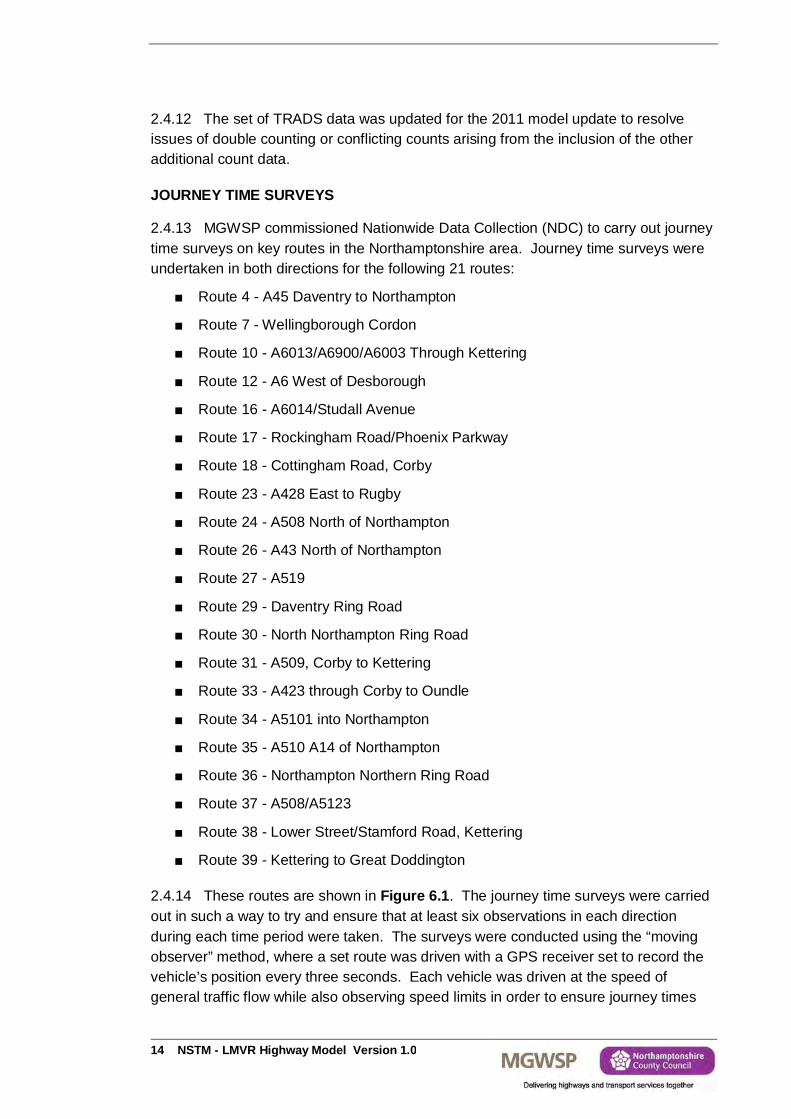
2.4.13 MGWSP commissioned Nationwide Data Collection (NDC) to carry out journey time surveys on key routes in the Northamptonshire area. Journey time surveys were undertaken in both directions for the following 21 routes:
Route 4 - A45 Daventry to Northampton
Route 7 - Wellingborough Cordon
Route 10 - A6013/A6900/A6003 Through Kettering
Route 12 - A6 West of Desborough
Route 16 - A6014/Studall Avenue
Route 17 - Rockingham Road/Phoenix Parkway
Route 18 - Cottingham Road, Corby
Route 23 - A428 East to Rugby
Route 24 - A508 North of Northampton
Route 26 - A43 North of Northampton
Route 27 - A519
Route 29 - Daventry Ring Road
Route 30 - North Northampton Ring Road
Route 31 - A509, Corby to Kettering
Route 33 - A423 through Corby to Oundle
Route 34 - A5101 into Northampton
Route 35 - A510 A14 of Northampton
Route 36 - Northampton Northern Ring Road
Route 37 - A508/A5123
Route 38 - Lower Street/Stamford Road, Kettering
Route 39 - Kettering to Great Doddington
2.4.14 These routes are shown in Figure 6.1. The journey time surveys were carried out in such a way to try and ensure that at least six observations in each direction during each time period were taken. The surveys were conducted using the “moving observer” method, where a set route was driven with a GPS receiver set to record the vehicle’s position every three seconds. Each vehicle was driven at the speed of general traffic flow while also observing speed limits in order to ensure journey times
NSTM - LMVR Highway Model Version 1.0 15
were representative of typical traffic conditions. The surveys were carried out between 4th-18th November 2008 for the 07:00-10:00 and 16:00-19:00 time periods.
BUS INTERVIEW SURVEYS
2.4.15 MGWSP commissioned Monisyst to carry out surveys on the main bus routes in and between Northampton, Kettering, Wellingborough, Corby and Daventry.
2.4.16 62 main bus routes throughout the county were surveyed during November and December 2008 over a twelve hour period (07:00-19:00) providing the following data:
Boarding and Alighting data on bus services
Face to face interviews on bus services and at Bus Depot
Self completion free post questionnaires given out on bus services, bus stops and bus depots
RAIL INTERVIEW SURVEYS
2.4.17 MGWSP commissioned Monisyst to carry out surveys at the three main Northamptonshire rail stations namely Kettering, Wellingborough and Northampton. The three train stations were surveyed between 17 November 2008 and 4 December 2008. The surveys were carried out over a 15 hour period between 06:00-21:00.
2.4.18 All services which stopped at these stations during the peak hours were included within the surveys.
2.4.19 The rail services which stop at these stations are:
Northampton: Milton Keynes, Watford Junction, London Euston, Rugby, Coventry and Birmingham New Street
Kettering & Wellingborough: Bedford, Luton, London St Pancras, Leicester, Nottingham, Derby, Sheffield and Manchester
2.4.20 Full detail of the data collection process can be found in the Northamptonshire Multi-Modal Transport Model Survey Report, March 2009.
2.5 SYNTHETIC DEMAND MODEL
2.5.1 A synthetic demand model has been developed for each peak period. Each demand model has been calibrated in accordance with WebTAG to represent travel movements based on socio-economic data. The synthetic demand model uses the same network and zoning system as the observed assignment model.
2.5.2 The guidance available from WebTAG contains advice on the most appropriate choice hierarchies to adopt for the mode and distribution stages within travel demand models. This guidance has been given significant weight in the design of this model.
16 NSTM - LMVR Highway Model Version 1.0
2.5.3 The WebTAG guidance states that the hierarchy of choice components, ranging from the choices at the top that are least sensitive to supply characteristics in the order of increasing sensitivity to the bottom, is as follows:
Trip frequency (or generation) which may be represented as inelastic if all modes of transport (i.e. walk and cycle) are included
Main mode choice (i.e. between car, public transport and walk/cycle) is an insensitive choice component
Destination Choice (or trip distribution) is a sensitive choice component as it is based upon the relative attractiveness and the travel cost to a destination zones
Route assignment is at the bottom of the choice hierarchy, being the most sensitive of all of the choices, to the measured cost and time characteristics of the route options available
2.5.4 Trip frequency and mode choice are significantly less sensitive than destination choice. The NSTM follows the hierarchy stated above for all trip purposes and is compliant with current guidance and advice. Further information on the synthetic model is provided in the NSTM Demand Model – Model Development and Validation Report, November 2009.
NSTM - LMVR Highway Model Version 1.0 17
3 Highway Network Development
3.1 INTRODUCTION
3.1.1 The highway network was developed in SATURN by combining North Northamptonshire and West Northamptonshire model networks. The combined network went through checks on link types, link speed and link lengths and it was extended so that the model covered the entire United Kingdom.
3.2 STUDY AREA
3.2.1 The NSTM study area is presented in Figure 3.1. It has been defined to allow for the robust testing of possible impacts on the local transport network of infrastructure schemes and development proposals. The traffic corridors influencing travel patterns within the county include major motorways and trunk roads. In order to reflect these movements the model area extends to include a representation of motorways and trunk roads to outlying areas of the UK which is shown in Figure 3.2.
3.2.2 The main area of interest is Northamptonshire, where the density of road links necessary to accurately model the movements intensifies. The main study area encompasses the major motorways of the M1 (junctions 14 to 19) and M45 (from Junction 17).
3.3 ZONING AND SECTORING SYSTEMS
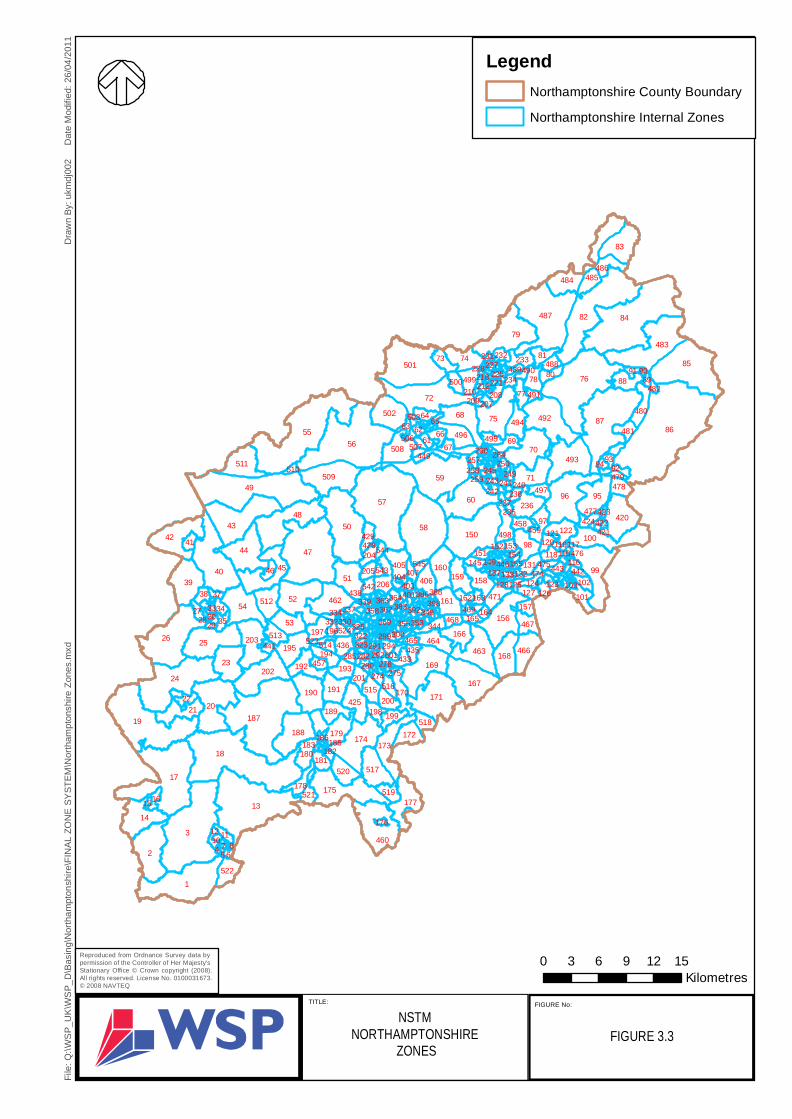
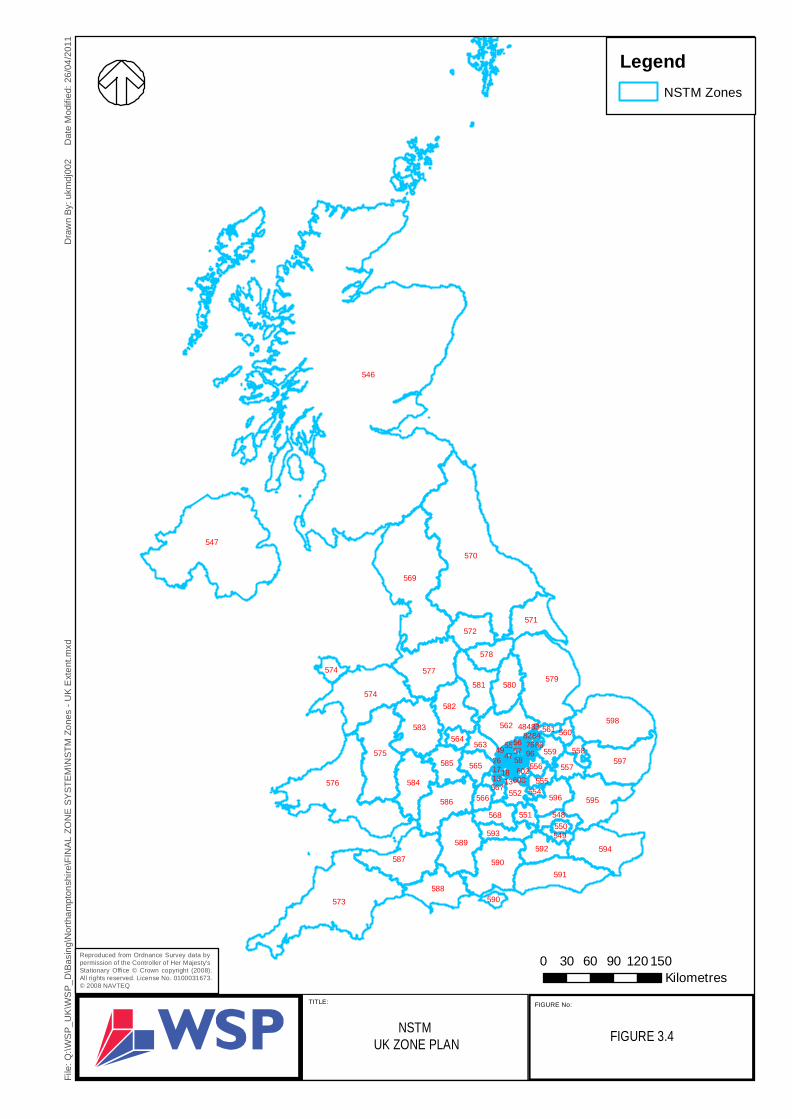
3.3.1 The zone system reproduced in Figure 3.3 and Figure 3.4 is based on the 2001 Census Output Areas (COA) and wards, ensuring compatibility with Census household data. The COAs were aggregated or disaggregated into different land uses within Northamptonshire to represent the county at the appropriate level of detail required for the study. The model zone system is sufficiently detailed so that all major trip movements within the study area can be identified to a level consistent with existing transport models covering the study area, as well as inter-urban movements across the county and wider strategic movements.
3.3.2 In total there are 614 zones in the NSTM, of which 548 are allocated to the Northamptonshire county area. A list of the zones is given in Appendix No 1.
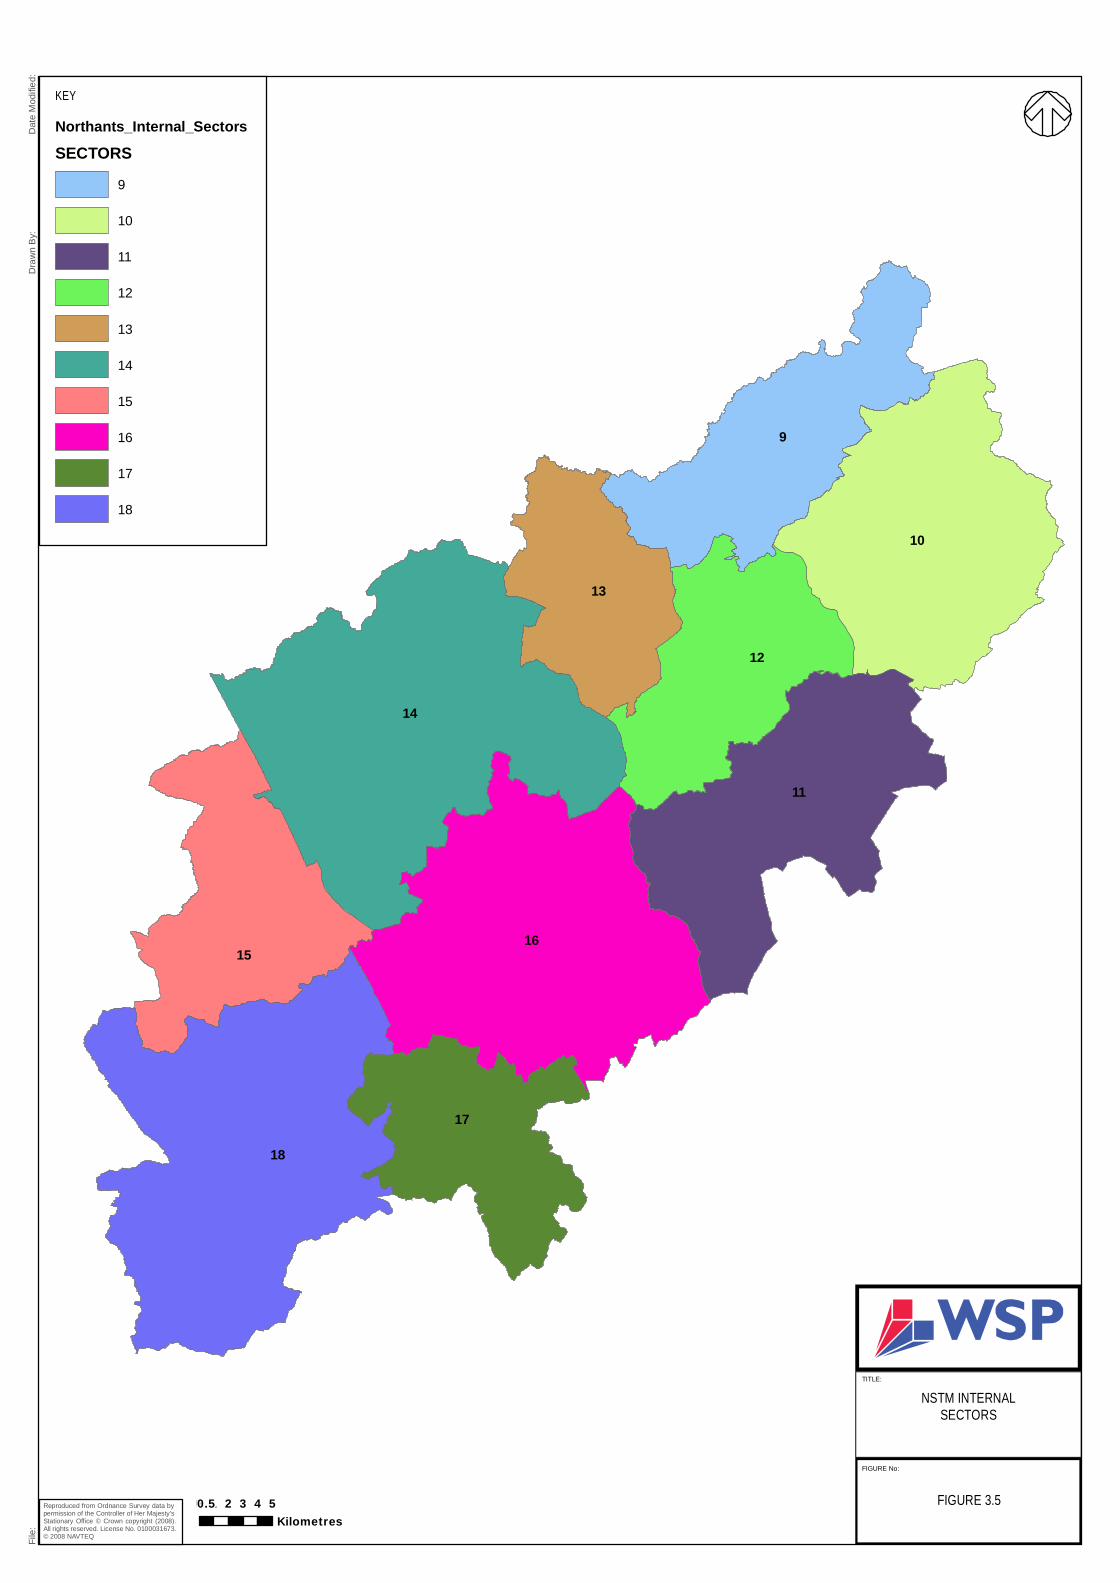
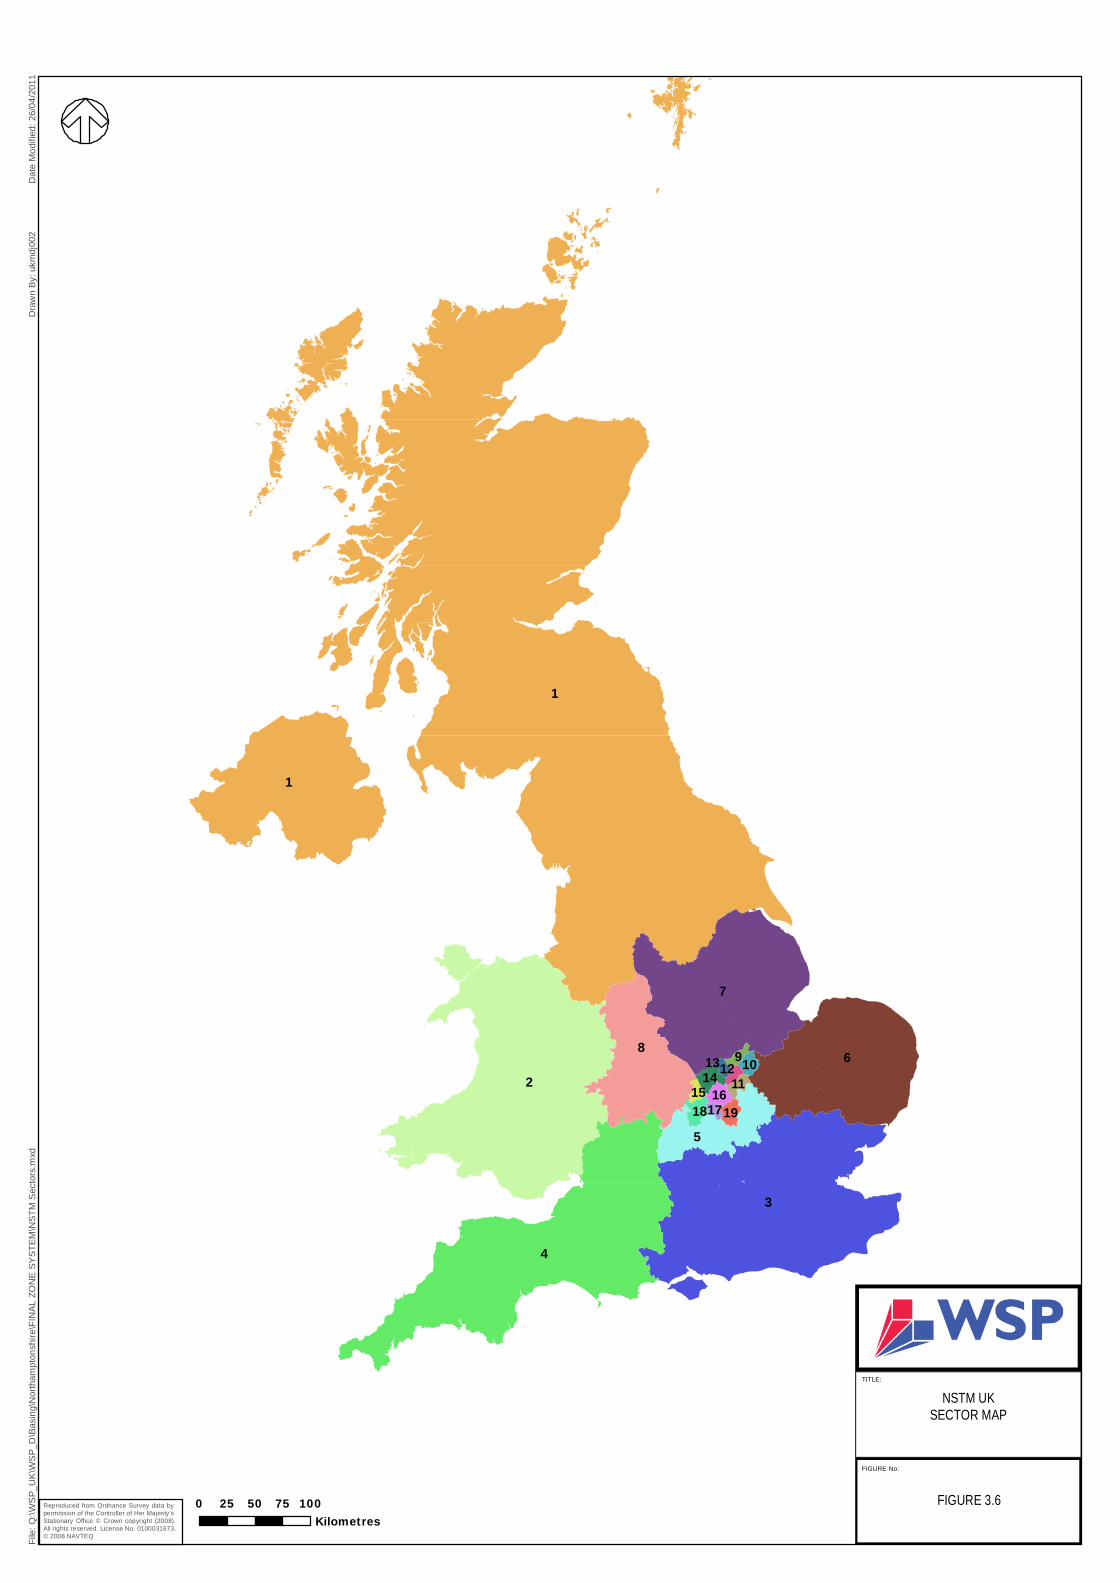
3.3.3 The public transport zone system is identical to that used in the highway model. The zones are categorised into 19 regional sectors presented in Figure 3.5 and Figure 3.6.

18 NSTM - LMVR Highway Model Version 1.0
3.4 NETWORK DEVELOPMENT
3.4.1 In drawing up the road network, the following principles were borne in mind so that:
All major and minor road links within the Northamptonshire area were included
Outside the town centres, links between suburbs and villages were included, where necessary, to ensure sensible routing of trips to and from these areas
3.4.2 In constructing the highway network the following highway link characteristics were considered for inclusion:
Link length
Speed/flow relationship
Link type
Link capacity
One way/two way operation
Vehicular restrictions
Provision of bus/cycle lanes
Traffic calming and its impact on speed/capacity
On street parking and its impact on speed/capacity
Number of (effective) lanes
Any observed turn delays/penalties
Location of public transport routes/bus stops
Location of taxi ranks
Car park locations
Access points
3.4.3 Link speeds were determined by the speed limits of each road. Link lengths were measured and checked using a GIS map based system and 1:25,000 scale maps.
3.4.4 Simulation modelling has been used throughout for the whole of the modelled road network within the study area. The external connections include an averaged distance for each longer distance zone.
3.4.5 In an urban area, the main delays to a journey result from the interaction of traffic at junctions. SATURN is structured to model these interactions, and it is usually assumed that traffic within the simulation network travels at a uniform speed between the nodes of the model, with delay occurring only at the junction.
NSTM - LMVR Highway Model Version 1.0 19
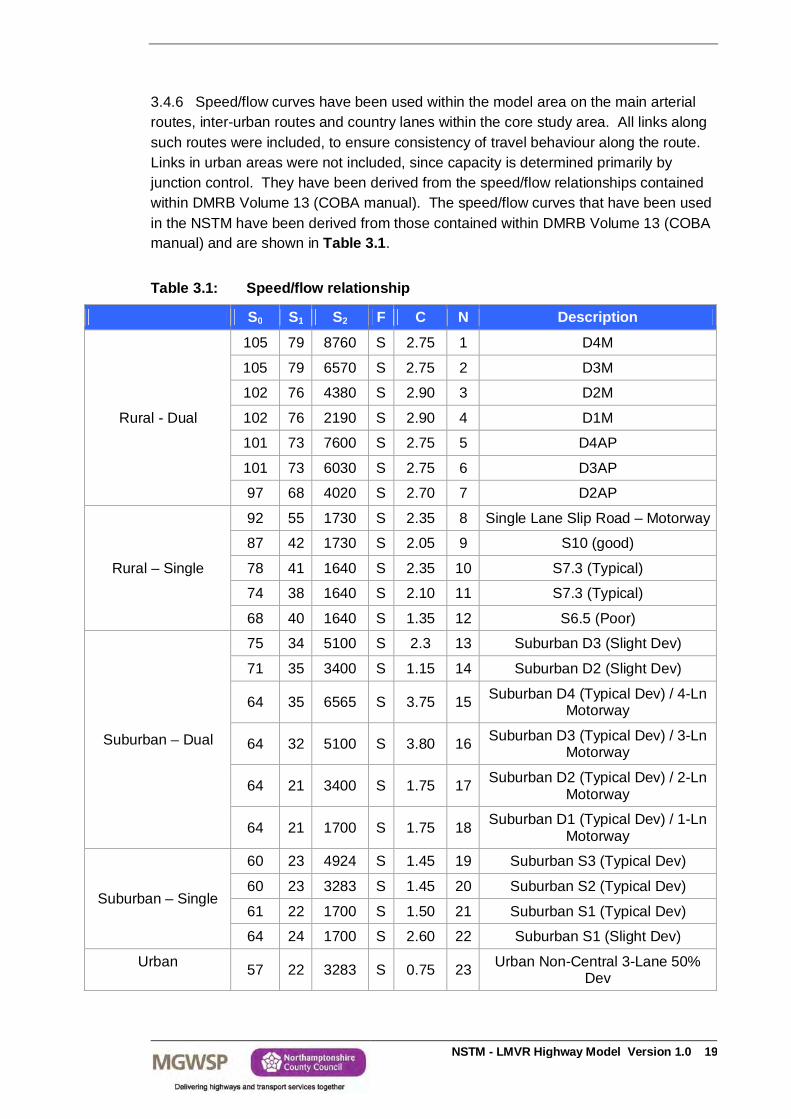
3.4.6 Speed/flow curves have been used within the model area on the main arterial routes, inter-urban routes and country lanes within the core study area. All links along such routes were included, to ensure consistency of travel behaviour along the route. Links in urban areas were not included, since capacity is determined primarily by junction control. They have been derived from the speed/flow relationships contained within DMRB Volume 13 (COBA manual). The speed/flow curves that have been used in the NSTM have been derived from those contained within DMRB Volume 13 (COBA manual) and are shown in Table 3.1. Table 3.1: Speed/flow relationship
S0 S1 S2 F C N Description
Rural - Dual
105 79 8760 S 2.75 1 D4M
105 79 6570 S 2.75 2 D3M
102 76 4380 S 2.90 3 D2M
102 76 2190 S 2.90 4 D1M
101 73 7600 S 2.75 5 D4AP
101 73 6030 S 2.75 6 D3AP
97 68 4020 S 2.70 7 D2AP
Rural – Single
92 55 1730 S 2.35 8 Single Lane Slip Road – Motorway
87 42 1730 S 2.05 9 S10 (good)
78 41 1640 S 2.35 10 S7.3 (Typical)
74 38 1640 S 2.10 11 S7.3 (Typical)
68 40 1640 S 1.35 12 S6.5 (Poor)
Suburban – Dual
75 34 5100 S 2.3 13 Suburban D3 (Slight Dev)
71 35 3400 S 1.15 14 Suburban D2 (Slight Dev)
64 35 6565 S 3.75 15 Suburban D4 (Typical Dev) / 4-Ln Motorway
64 32 5100 S 3.80 16 Suburban D3 (Typical Dev) / 3-Ln Motorway
64 21 3400 S 1.75 17 Suburban D2 (Typical Dev) / 2-Ln Motorway
64 21 1700 S 1.75 18 Suburban D1 (Typical Dev) / 1-Ln Motorway
Suburban – Single
60 23 4924 S 1.45 19 Suburban S3 (Typical Dev)
60 23 3283 S 1.45 20 Suburban S2 (Typical Dev)
61 22 1700 S 1.50 21 Suburban S1 (Typical Dev)
64 24 1700 S 2.60 22 Suburban S1 (Slight Dev)
Urban 57 22 3283 S 0.75 23 Urban Non-Central 3-Lane 50%
Dev
20 NSTM - LMVR Highway Model Version 1.0
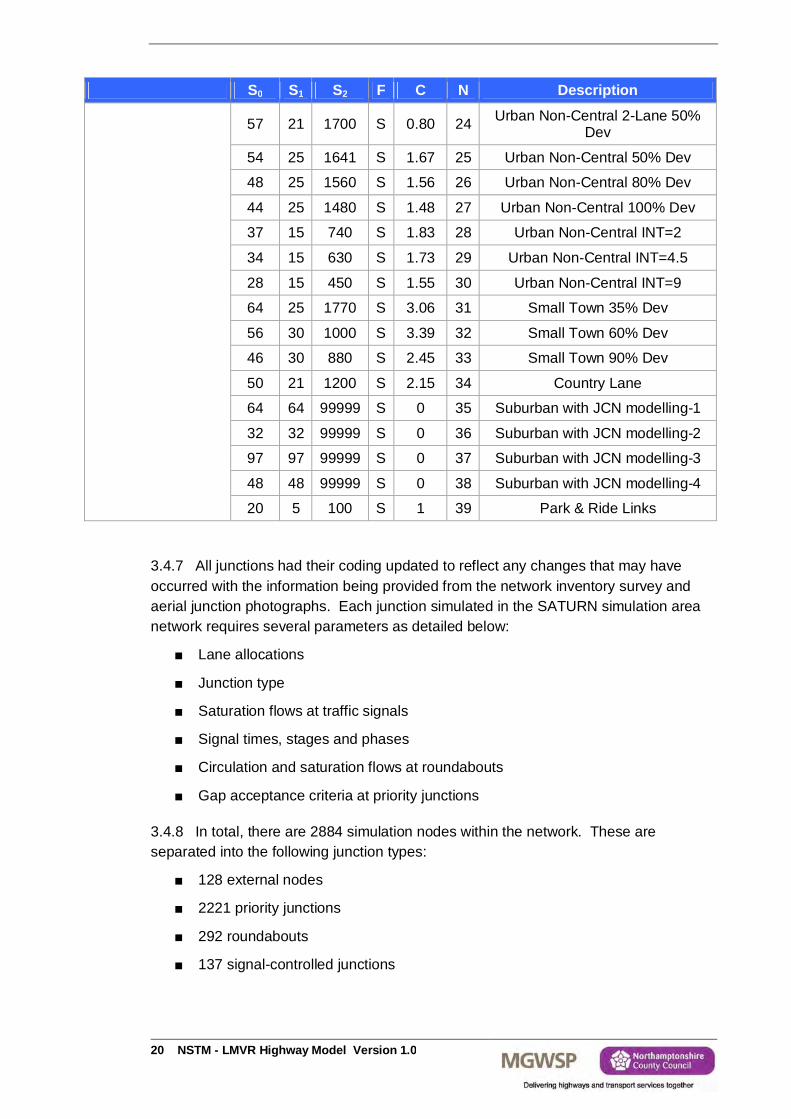
S0 S1 S2 F C N Description
57 21 1700 S 0.80 24 Urban Non-Central 2-Lane 50% Dev
54 25 1641 S 1.67 25 Urban Non-Central 50% Dev
48 25 1560 S 1.56 26 Urban Non-Central 80% Dev
44 25 1480 S 1.48 27 Urban Non-Central 100% Dev
37 15 740 S 1.83 28 Urban Non-Central INT=2
34 15 630 S 1.73 29 Urban Non-Central INT=4.5
28 15 450 S 1.55 30 Urban Non-Central INT=9
64 25 1770 S 3.06 31 Small Town 35% Dev
56 30 1000 S 3.39 32 Small Town 60% Dev
46 30 880 S 2.45 33 Small Town 90% Dev
50 21 1200 S 2.15 34 Country Lane
64 64 99999 S 0 35 Suburban with JCN modelling-1
32 32 99999 S 0 36 Suburban with JCN modelling-2
97 97 99999 S 0 37 Suburban with JCN modelling-3
48 48 99999 S 0 38 Suburban with JCN modelling-4
20 5 100 S 1 39 Park & Ride Links
3.4.7 All junctions had their coding updated to reflect any changes that may have occurred with the information being provided from the network inventory survey and aerial junction photographs. Each junction simulated in the SATURN simulation area network requires several parameters as detailed below:
Lane allocations
Junction type
Saturation flows at traffic signals
Signal times, stages and phases
Circulation and saturation flows at roundabouts
Gap acceptance criteria at priority junctions
3.4.8 In total, there are 2884 simulation nodes within the network. These are separated into the following junction types:
128 external nodes
2221 priority junctions
292 roundabouts
137 signal-controlled junctions
NSTM - LMVR Highway Model Version 1.0 21
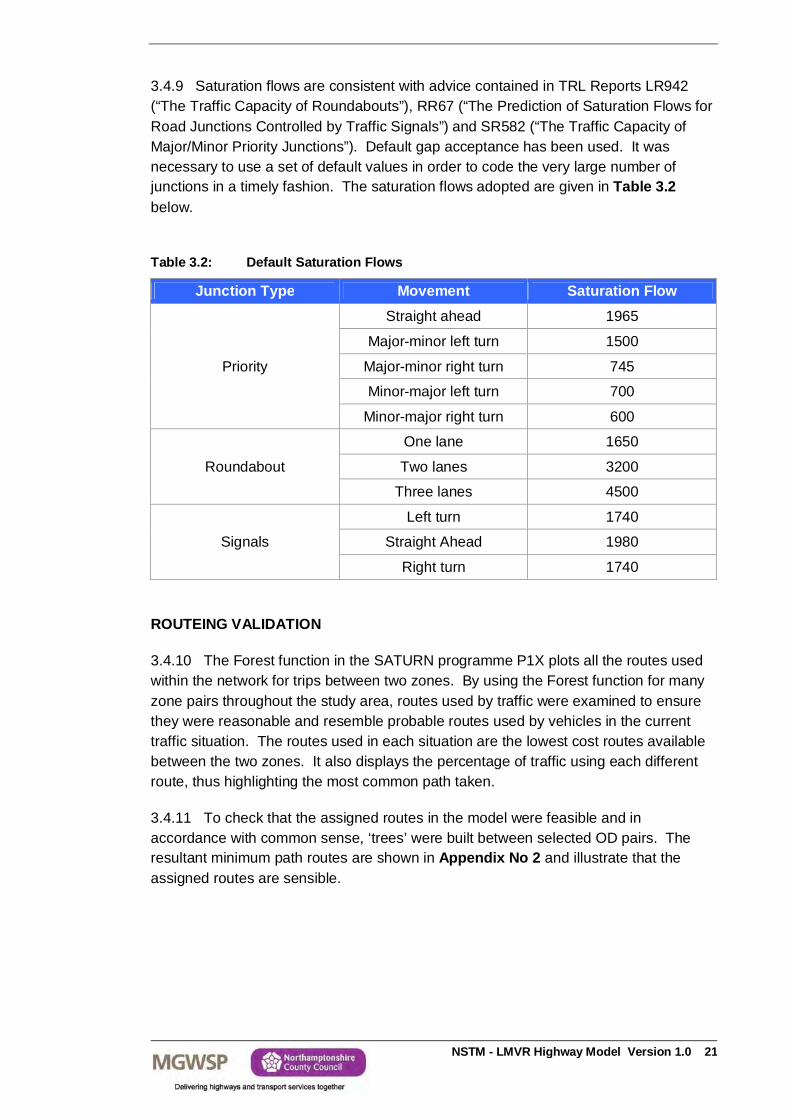
3.4.9 Saturation flows are consistent with advice contained in TRL Reports LR942 (“The Traffic Capacity of Roundabouts”), RR67 (“The Prediction of Saturation Flows for Road Junctions Controlled by Traffic Signals”) and SR582 (“The Traffic Capacity of Major/Minor Priority Junctions”). Default gap acceptance has been used. It was necessary to use a set of default values in order to code the very large number of junctions in a timely fashion. The saturation flows adopted are given in Table 3.2 below.
Table 3.2: Default Saturation Flows
Junction Type Movement Saturation Flow
Priority
Straight ahead 1965
Major-minor left turn 1500
Major-minor right turn 745
Minor-major left turn 700
Minor-major right turn 600
Roundabout
One lane 1650
Two lanes 3200
Three lanes 4500
Signals
Left turn 1740
Straight Ahead 1980
Right turn 1740
ROUTEING VALIDATION
3.4.10 The Forest function in the SATURN programme P1X plots all the routes used within the network for trips between two zones. By using the Forest function for many zone pairs throughout the study area, routes used by traffic were examined to ensure they were reasonable and resemble probable routes used by vehicles in the current traffic situation. The routes used in each situation are the lowest cost routes available between the two zones. It also displays the percentage of traffic using each different route, thus highlighting the most common path taken.
3.4.11 To check that the assigned routes in the model were feasible and in accordance with common sense, ‘trees’ were built between selected OD pairs. The resultant minimum path routes are shown in Appendix No 2 and illustrate that the assigned routes are sensible.
22 NSTM - LMVR Highway Model Version 1.0
NETWORK REVIEW AND UPDATE
3.4.12 A review of the previous model was carried out by MGWSP, which led to the key changes listed below:
Nodes in Northampton were coded with a gap acceptance parameter of 5 seconds, a legacy from the previous Northampton model which generated significant delays - the default was revised to 2 seconds;
Existing bus priority measures have been included;
Minor routing issues around Oundle have been fixed;
Centroid loading points have been reviewed;
Addition of minor links around the Weedon and Flore to allow future improvements to be tested;
Corrections to various nodes including changes to number of lanes, saturation flows, node ordering, and signal timings.
Following advice from NCC, schemes previously modelled as forecast improvements now included in the base as follows;
Black Lion Hill Interchange – The access to Northampton train station was altered to include a bus only access to Marefair and a signalised bus priority junction
A14 Kettering Bypass Widening – This is a Highways Agency scheme to carry out an online widening of the A14 around Kettering within the existing highway boundary. The scheme runs just east of Junction 7 (A43) to just west of Junction 9 (A509)
3.4.13 Applying the above changes to the network had a detrimental impact on the validation of the existing model, requiring a revalidation exercise to be undertaken to restore the model to its previous level of validation. This report sets out the results of the revalidation exercise.
3.5 SUMMARY
3.5.1 During the network building process the following activities have been undertaken:
Review of network coding warnings produced by the SATURN program SATNET
Network link distance checks
Review of junction saturation flows
Review of gap acceptance parameters
Detailed review of the coding of complex junctions
Checks on key traffic routings on the unloaded and loaded networks to check for consistency

NSTM - LMVR Highway Model Version 1.0 23
Check all-or-nothing routes – the network was thoroughly checked to ensure the sensible routes are allocated between zones. This check was undertaken to check general network coding or, where junction coding is extremely complex, that the correct allowable turning movements have been coded
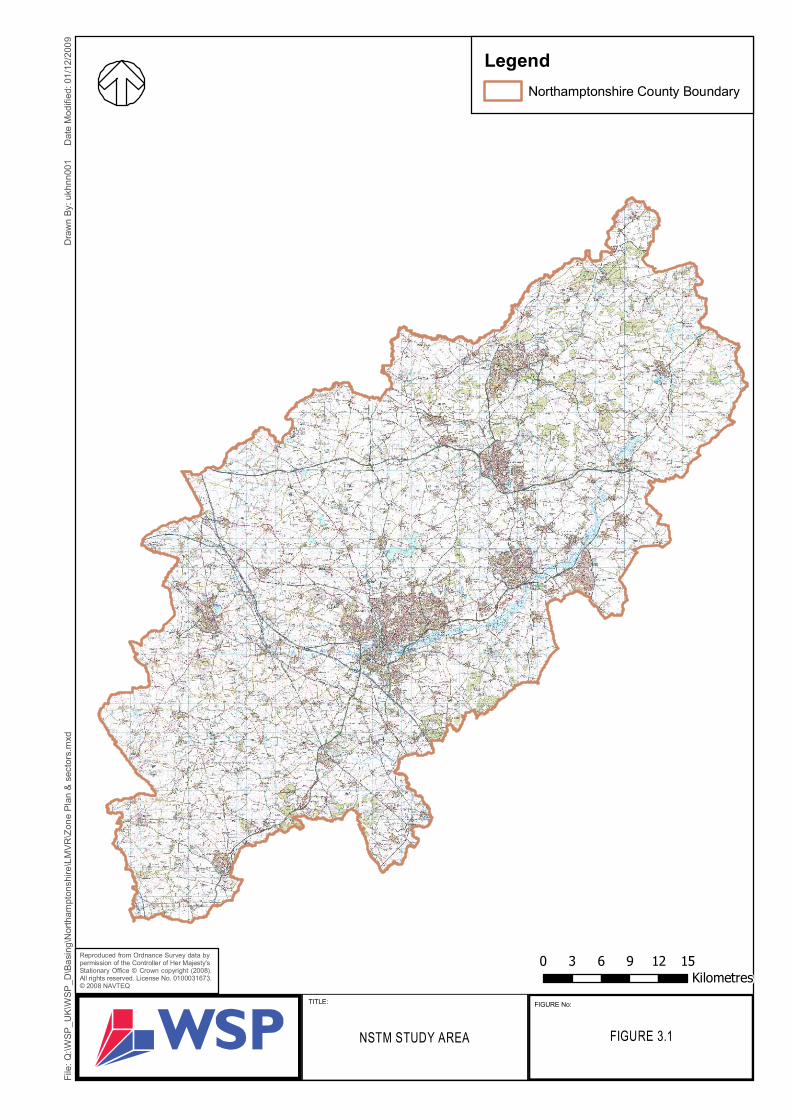
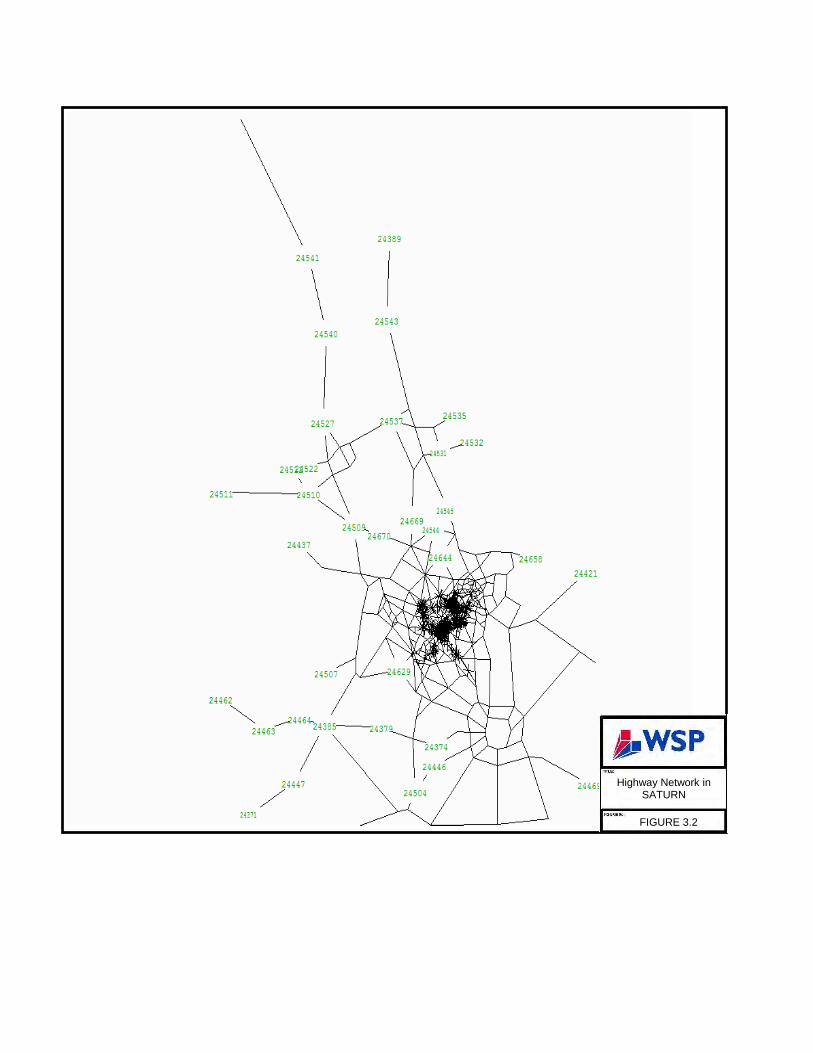
FIGURE 3.2
Highway Network in SATURN
3
86
1
18
84
55
57
56
13
49
76
17
19
47
2
82
87
187
58
24
85
50
59
26
40
43
72
487
48
96
20
79
99
501
60
483
150
25
52
4244
75
70
39
45
54
175
460
171
14
492
167
509
174
83
68
484
493
95
16923
156
51
71
202
100
463
188
21
420
203
74
462
511
502
190
177
173
53
179
517
98
168
508
160
195 466
88
97
425
236
512
191
405159
161
166
496
158
78
464
520
122
67
522
494
172
73
206
498
189
69
406
197
499
467
485
515
193
478
513
66
436
518
38
497
458
192
81
180
170
480
77
481
471
486
80
233
101
178
194
64
199
200
521
22
131
519
92
429
46
181
344
16
41
6
35
201
198
449
204
500
11
118
34 15727
205
488
127
424
162
433
495
516
102
63
145
196468
61
542
120
12
435
151
407124
208
232
457
93
62
91
123
274
294
37
165
514441
234
126
524
507
337364
491
242
163
89
8
65
443
285
474
153
465
238
257 94
544
475545
523
442
469
489
4
164
543116
207
490
249
403
282
479
250
237
506
7
510
5
322
125
258
29
115
186
30
10
300
209482
280
241
225
401
355
182
33
503
601
152
243
15
363
299
176
119
28
278
422
292
90
358
154
259
369
133128
212
404
155
264
386
323
132
423
362
325
218
353349
103
235
245
117
339
227
438
137
392383
260
330
231
446476
210
240
421459
149
291
275
183
398388
228
221
477
334
185
428121
332
TITLE: FIGURE No:
File
: Q:\W
SP_
UK
\WS
P_D
\Bas
ing\
Nor
tham
pton
shire
\FIN
AL Z
ON
E S
YST
EM\N
orth
ampt
onsh
ire Z
ones
.mxd
Reproduced from Ordnance Survey data by permission of the Controller of Her Majesty's Stationary Office © Crown copyright (2008).All rights reserved. License No. 0100031673.© 2008 NAVTEQ
Dra
wn
By: u
kmdj
002
Dat
e M
odifi
ed: 2
6/04
/201
1
NSTM NORTHAMPTONSHIRE
ZONESFIGURE 3.3
0 3 6 9 12 15Kilometres
LegendNorthamptonshire County Boundary
Northamptonshire Internal Zones
546
570
547
573
569
576
579
574
598
575
577
587594
590
597
591
595
583
589
586
584
582
588
581
571
562
580
572
585
592
596
578
568
593
565
563
557
559
552
574
566
551
564
556
548
558
567
560
555
549
590
550
561
554
6023
86
118
8455
5756
13
4976
17
47
82
58
603
2696
83484
TITLE: FIGURE No:
File
: Q:\W
SP_
UK
\WS
P_D
\Bas
ing\
Nor
tham
pton
shire
\FIN
AL Z
ON
E S
YST
EM\N
STM
Zon
es -
UK
Ext
ent.m
xd
Reproduced from Ordnance Survey data by permission of the Controller of Her Majesty's Stationary Office © Crown copyright (2008).All rights reserved. License No. 0100031673.© 2008 NAVTEQ
Dra
wn
By: u
kmdj
002
Dat
e M
odifi
ed: 2
6/04
/201
1
NSTM UK ZONE PLAN FIGURE 3.4
0 30 60 90 120 150Kilometres
LegendNSTM Zones
14
9
18
16
10
11
15
12
17
13
File
:D
raw
n B
y:D
ate
Mod
ified
:
Reproduced from Ordnance Survey data by permission of the Controller of Her Majesty's Stationary Office © Crown copyright (2008).All rights reserved. License No. 0100031673.© 2008 NAVTEQ
FIGURE No:
TITLE:
NSTM INTERNALSECTORS
FIGURE 3.5
KEY
Northants_Internal_SectorsSECTORS
9
10
11
12
13
14
15
16
17
18
0 1 2 3 4 50.5Kilometres
1
2
4
3
7
1
68
5
149
1816
19
101115
12
17
13
File
: Q:\W
SP_
UK
\WS
P_D
\Bas
ing\
Nor
tham
pton
shire
\FIN
AL Z
ON
E S
YST
EM\N
STM
Sec
tors
.mxd
Dra
wn
By: u
kmdj
002
Dat
e M
odifi
ed: 2
6/04
/201
1
Reproduced from Ordnance Survey data by permission of the Controller of Her Majesty's Stationary Office © Crown copyright (2008).All rights reserved. License No. 0100031673.© 2008 NAVTEQ
FIGURE No:
TITLE:
NSTM UKSECTOR MAP
FIGURE 3.60 25 50 75 100Kilometres
24 NSTM - LMVR Highway Model Version 1.0
4 Observed Highway Matrix Development
4.1 INTRODUCTION
4.1.1 The Prior matrices were developed using data from 44 Roadside Interview (RSI) sites, plus trips taken from the initial synthetic base model. The RSI data was used to create an initial matrix based fully on observed data which is known as the RSI Matrix. Data from the synthetic model was used to infill trip patterns missed by the RSI surveys and this is known as the Infill Matrix. The combined RSI Matrix and Infill Matrix is known as the Prior Matrix.
4.1.2 Highway matrices for Car/LGV (Light Matrix) and HGV (Heavy Matrix) vehicle classifications were developed separately. All Light Matrix and Heavy Matrix volumes presented in this report are in Passenger Car Units (PCUs) rather than vehicles unless where stated.
4.2 RSI EXPANSION FACTORS
4.2.1 Roadside Interview (RSI) data has been used to construct the Observed Matrix based upon fully observed data. The surveyed movements represent the interview direction (ID), whereas the non-interview direction (NID) trips were derived from the transpose of the opposite time period. The origins and destinations of the AM peak ID records were reversed to represent the PM NID trips and vice versa. The transposed trips were scaled to the appropriate count – e.g. the transposed AM peak interview records were expanded to match the PM peak non-interview count.
4.2.2 Expansion factors were calculated to scale the interview samples to observed counts. It is desirable to maintain a well-distributed matrix by expanding the surveys for the three-hour peak period and then factor to match peak hour counts. Expansion factors were typically between 3 and 8, and on most occasions were less than 10. Further information can be found in the RSI data collection report.
4.3 DOUBLE COUNTING
4.3.1 The RSI matrices were combined and the multiple observations of a trip at more than one RSI site were removed by applying the following process. All trips from Zone A to B at different sites were summed up and then divided by the number of sites they appear in. It is understood that this technique might produce overestimates for the ‘double counted’ movements, but it is felt that, in the absence of further information, this is the best technique available. The effect has been closely monitored and the movements on the parallel routes have been thoroughly checked.
NSTM - LMVR Highway Model Version 1.0 25
4.4 JOURNEY PURPOSE MATRICES
4.4.1 RSI Matrices were produced for each of the following journey purposes:
Cars: Home Based Work (HBW)
Cars: Home Based Employers Business (HBEB)
Cars: Home Based Other (HBO)
Cars: Non Home Based Employers Business (NHBEB)
Cars: Non Home Based Other (NHBO)
Light Goods Vehicles (LGV
Other Goods Vehicles 1 (OGV1)
Other Goods Vehicles 2 (OGV2)
4.4.2 The Car and Light Goods Vehicle (LGV) journey purposes (HBW, HBEB, HBO, NHBEB, NHBO and LGV) were combined to form a Lights Matrix. The OGV1 and OGV2 journey purposes were combined to form a Heavy Matrix.
4.5 PCU FACTORS
4.5.1 The RSI surveys produced data in vehicle totals. The journey purpose matrices were factored by the following Passenger Car Unit (PCU) factors:
Cars and LGV: 1.0
OGV1: 1.5
OGV2: 2.3
4.5.2 These factors were applied to data collected by the RSI surveys to convert the data from vehicles to PCUs. Factors derived from the MCC data were used to convert the average HGV totals obtained from the ATCs into PCUs, on a site by site basis. The peak hour time periods were chosen to coincide with times of maximum traffic flow on the majority of links in the network.
4.6 RSI MATRIX
4.6.1 The above data was combined to form an RSI matrix for each period, representing those trips captured by the RSI sites, with potential double-counting taken into account. This matrix was assigned to the network and subsequent sensitivity testing of traffic routings and comparisons between observed and modelled flows were undertaken.
4.6.2 Select links were undertaken at each RSI site and on competing routes to determine the routing of observed traffic. Routes were subsequently checked to ascertain whether the routes selected were valid, given the uncongested nature of the network, or whether there was a network error leading to unlikely route choice. This ensured that the best possible RSI matrix, producing the optimum fit to the observed flows, was progressed to the Prior Matrix development. A comparison of modelled and
26 NSTM - LMVR Highway Model Version 1.0
observed counts from assignment of the AM RSI matrix is given in Appendix No 11, with the PM peak given in Appendix No 12.
4.7 INFILL MATRIX
4.7.1 The NSTM is a multi-user class model with 2 levels within the matrix i.e. a Lights Matrix (formed of Cars & Light Goods Vehicles) and a Heavy Matrix (formed of Heavy Goods Vehicles (HGV)) which is the RSI Matrix. The RSI Matrix had trips infilled to account for the unobserved trips. Only trips between those OD pairs that did not pass through one of the 44 RSI sites were infilled e.g. trips between Zone 1 and Zone 25 where there were zero observed trips have been extracted from the synthetic matrix and infilled for a greater level of accuracy within the matrix.
4.7.2 No viable information to infill the HGV matrix was available. It was felt that a flat seed value would result in the matrix estimation process creating trips between unlikely origin-destination pairs. Since the large majority of unobserved HGV trips were long-distance strategic trips, the matrix was manually seeded to reflect observed through-trips.
4.8 PRIOR MATRIX
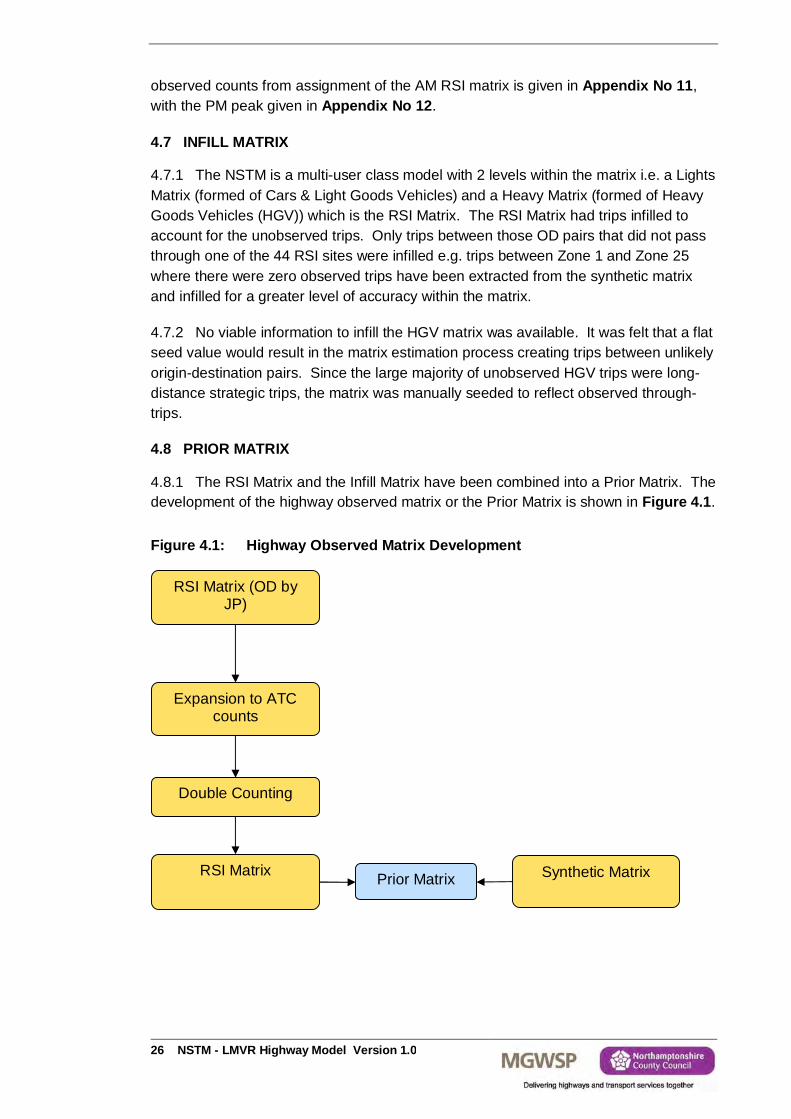
4.8.1 The RSI Matrix and the Infill Matrix have been combined into a Prior Matrix. The development of the highway observed matrix or the Prior Matrix is shown in Figure 4.1.
Figure 4.1: Highway Observed Matrix Development
RSI Matrix (OD by JP)
Expansion to ATC counts
Double Counting
Prior Matrix
RSI Matrix
Synthetic Matrix
NSTM - LMVR Highway Model Version 1.0 27
4.9 MATRIX ESTIMATION
4.9.1 The model calibration process has used matrix estimation procedures as contained in the SATME2 program. The basic operation of this uses the best estimate of trip movements as contained in the prior matrix and adjusts the pattern of trip distribution and volumes in order to match a file of input traffic flows.
4.9.2 The Prior Matrix was assigned to a network representing the current highway network. SATME2 requires a PIJA file which represents the proportion (P) of trips between a particular origin-destination pair (IJ) which uses the counted link (A). The PIJA data is obtained through the program SATPIJA following a SATURN assignment using the SAVEIT option. This produced a PIJA output files for LGV and HGV which were used by SATME2 along with the Prior Matrix to produce updated 2008 estimated Light Matrix and Heavy Matrix which were then combined into a ‘stacked’ estimated matrix for assignment. No cells were frozen and there were no zonal constraints applied. The default number of iterations i.e. 30 was allowed for the estimation process.
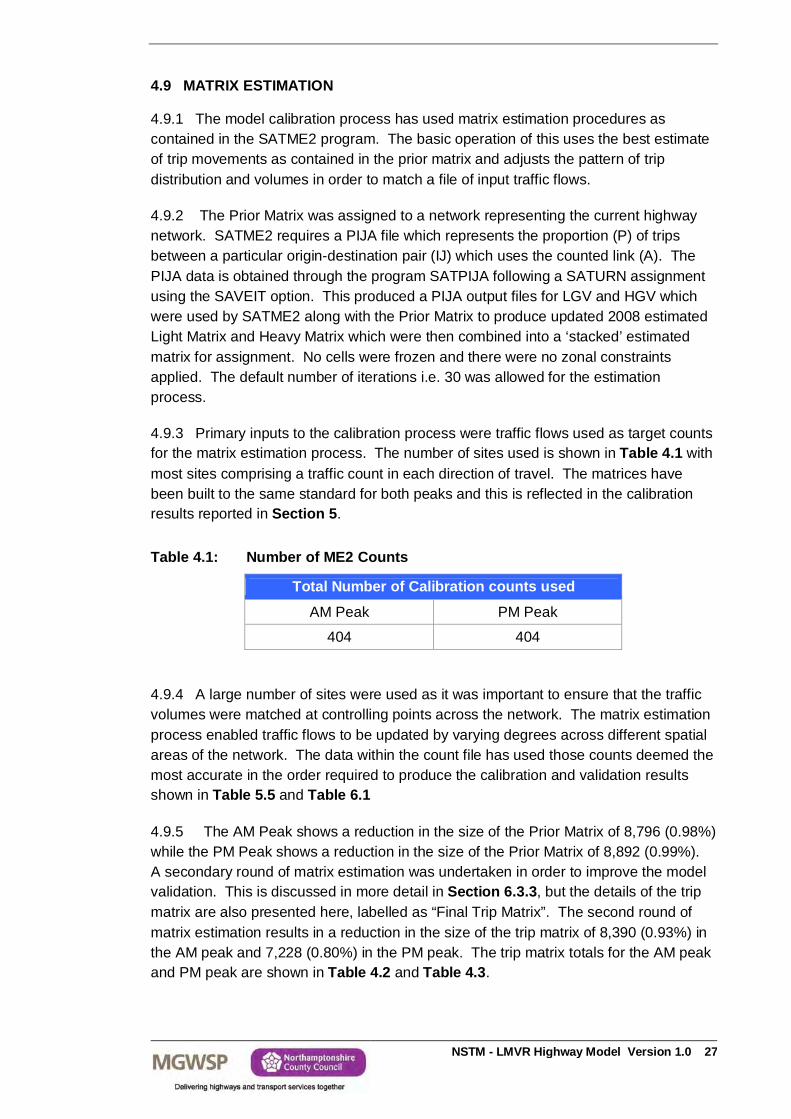
4.9.3 Primary inputs to the calibration process were traffic flows used as target counts for the matrix estimation process. The number of sites used is shown in Table 4.1 with most sites comprising a traffic count in each direction of travel. The matrices have been built to the same standard for both peaks and this is reflected in the calibration results reported in Section 5.
Table 4.1: Number of ME2 Counts
Total Number of Calibration counts used
AM Peak PM Peak
404 404
4.9.4 A large number of sites were used as it was important to ensure that the traffic volumes were matched at controlling points across the network. The matrix estimation process enabled traffic flows to be updated by varying degrees across different spatial areas of the network. The data within the count file has used those counts deemed the most accurate in the order required to produce the calibration and validation results shown in Table 5.5 and Table 6.1
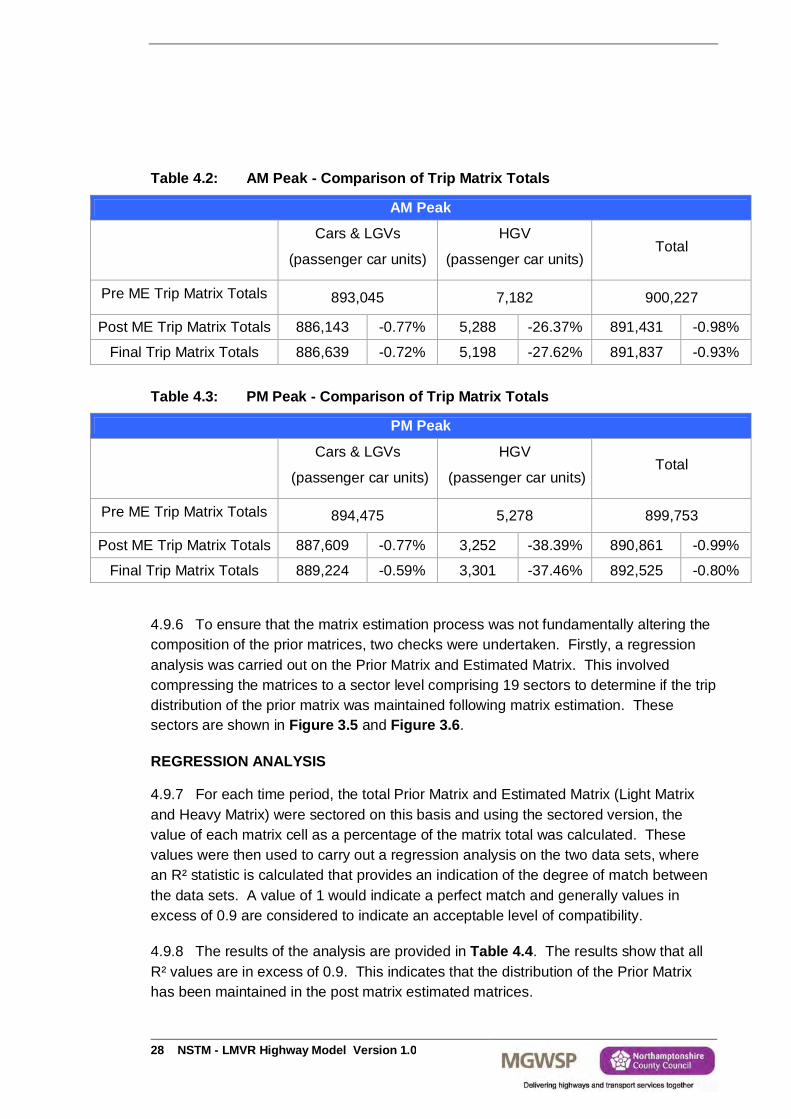
4.9.5 The AM Peak shows a reduction in the size of the Prior Matrix of 8,796 (0.98%) while the PM Peak shows a reduction in the size of the Prior Matrix of 8,892 (0.99%). A secondary round of matrix estimation was undertaken in order to improve the model validation. This is discussed in more detail in Section 6.3.3, but the details of the trip matrix are also presented here, labelled as “Final Trip Matrix”. The second round of matrix estimation results in a reduction in the size of the trip matrix of 8,390 (0.93%) in the AM peak and 7,228 (0.80%) in the PM peak. The trip matrix totals for the AM peak and PM peak are shown in Table 4.2 and Table 4.3.
28 NSTM - LMVR Highway Model Version 1.0
Table 4.2: AM Peak - Comparison of Trip Matrix Totals
AM Peak
Cars & LGVs
(passenger car units)
HGV
(passenger car units) Total
Pre ME Trip Matrix Totals 893,045 7,182 900,227
Post ME Trip Matrix Totals 886,143 -0.77% 5,288 -26.37% 891,431 -0.98%
Final Trip Matrix Totals 886,639 -0.72% 5,198 -27.62% 891,837 -0.93%
Table 4.3: PM Peak - Comparison of Trip Matrix Totals
PM Peak
Cars & LGVs
(passenger car units)
HGV
(passenger car units) Total
Pre ME Trip Matrix Totals 894,475 5,278 899,753
Post ME Trip Matrix Totals 887,609 -0.77% 3,252 -38.39% 890,861 -0.99%
Final Trip Matrix Totals 889,224 -0.59% 3,301 -37.46% 892,525 -0.80%
4.9.6 To ensure that the matrix estimation process was not fundamentally altering the composition of the prior matrices, two checks were undertaken. Firstly, a regression analysis was carried out on the Prior Matrix and Estimated Matrix. This involved compressing the matrices to a sector level comprising 19 sectors to determine if the trip distribution of the prior matrix was maintained following matrix estimation. These sectors are shown in Figure 3.5 and Figure 3.6.
REGRESSION ANALYSIS
4.9.7 For each time period, the total Prior Matrix and Estimated Matrix (Light Matrix and Heavy Matrix) were sectored on this basis and using the sectored version, the value of each matrix cell as a percentage of the matrix total was calculated. These values were then used to carry out a regression analysis on the two data sets, where an R² statistic is calculated that provides an indication of the degree of match between the data sets. A value of 1 would indicate a perfect match and generally values in excess of 0.9 are considered to indicate an acceptable level of compatibility.
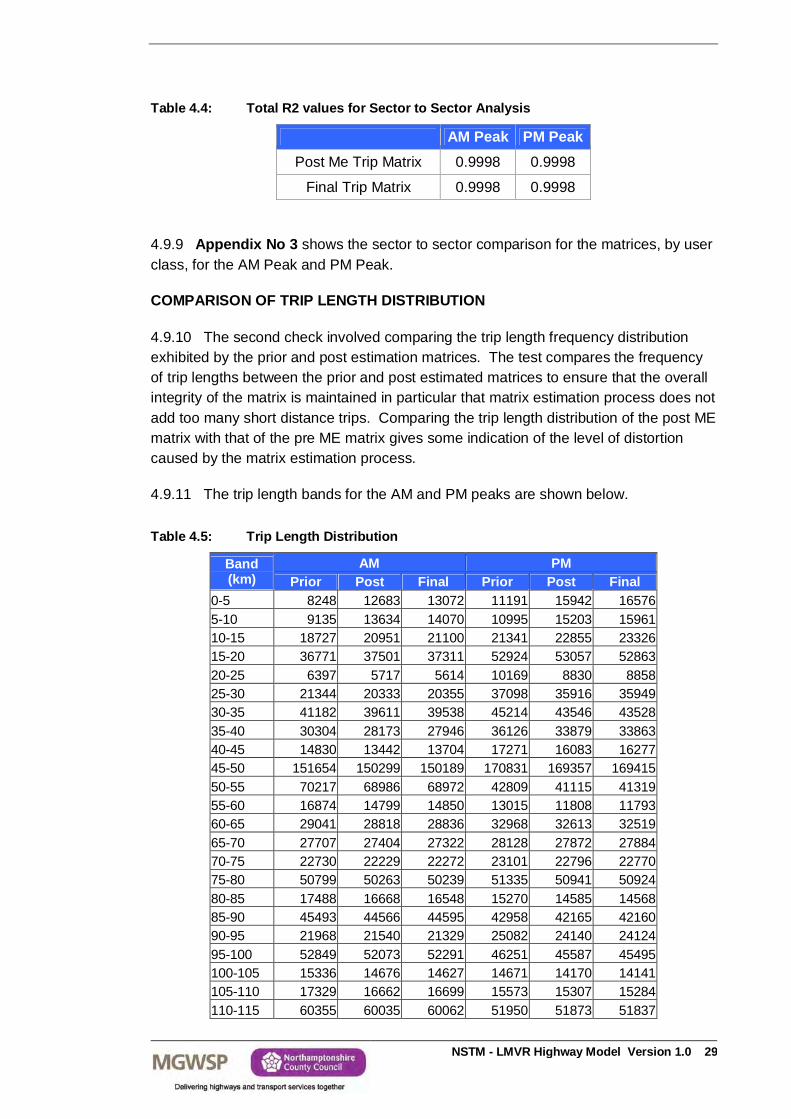
4.9.8 The results of the analysis are provided in Table 4.4. The results show that all R² values are in excess of 0.9. This indicates that the distribution of the Prior Matrix has been maintained in the post matrix estimated matrices.
NSTM - LMVR Highway Model Version 1.0 29
Table 4.4: Total R2 values for Sector to Sector Analysis
AM Peak PM Peak Post Me Trip Matrix 0.9998 0.9998
Final Trip Matrix 0.9998 0.9998
4.9.9 Appendix No 3 shows the sector to sector comparison for the matrices, by user class, for the AM Peak and PM Peak.
COMPARISON OF TRIP LENGTH DISTRIBUTION
4.9.10 The second check involved comparing the trip length frequency distribution exhibited by the prior and post estimation matrices. The test compares the frequency of trip lengths between the prior and post estimated matrices to ensure that the overall integrity of the matrix is maintained in particular that matrix estimation process does not add too many short distance trips. Comparing the trip length distribution of the post ME matrix with that of the pre ME matrix gives some indication of the level of distortion caused by the matrix estimation process.
4.9.11 The trip length bands for the AM and PM peaks are shown below. Table 4.5: Trip Length Distribution
Band (km)
AM PM Prior Post Final Prior Post Final
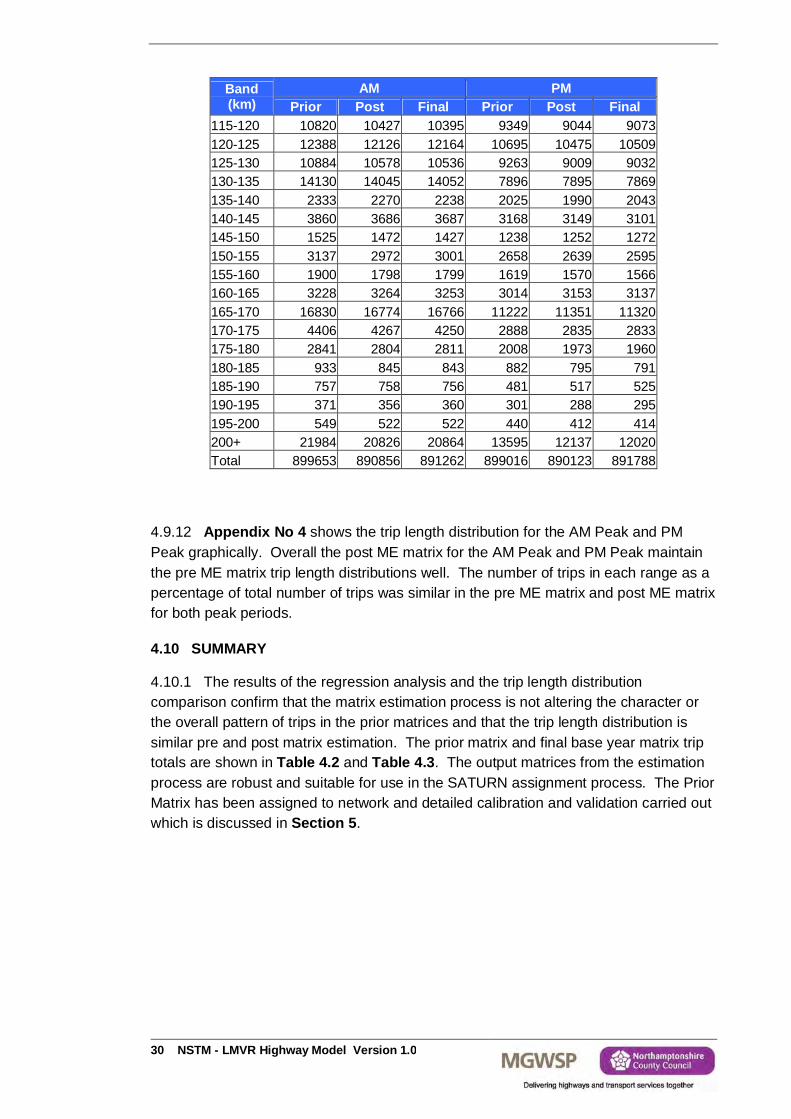
0-5 8248 12683 13072 11191 15942 16576 5-10 9135 13634 14070 10995 15203 15961 10-15 18727 20951 21100 21341 22855 23326 15-20 36771 37501 37311 52924 53057 52863 20-25 6397 5717 5614 10169 8830 8858 25-30 21344 20333 20355 37098 35916 35949 30-35 41182 39611 39538 45214 43546 43528 35-40 30304 28173 27946 36126 33879 33863 40-45 14830 13442 13704 17271 16083 16277 45-50 151654 150299 150189 170831 169357 169415 50-55 70217 68986 68972 42809 41115 41319 55-60 16874 14799 14850 13015 11808 11793 60-65 29041 28818 28836 32968 32613 32519 65-70 27707 27404 27322 28128 27872 27884 70-75 22730 22229 22272 23101 22796 22770 75-80 50799 50263 50239 51335 50941 50924 80-85 17488 16668 16548 15270 14585 14568 85-90 45493 44566 44595 42958 42165 42160 90-95 21968 21540 21329 25082 24140 24124 95-100 52849 52073 52291 46251 45587 45495 100-105 15336 14676 14627 14671 14170 14141 105-110 17329 16662 16699 15573 15307 15284 110-115 60355 60035 60062 51950 51873 51837
30 NSTM - LMVR Highway Model Version 1.0
Band (km)
AM PM Prior Post Final Prior Post Final
115-120 10820 10427 10395 9349 9044 9073 120-125 12388 12126 12164 10695 10475 10509 125-130 10884 10578 10536 9263 9009 9032 130-135 14130 14045 14052 7896 7895 7869 135-140 2333 2270 2238 2025 1990 2043 140-145 3860 3686 3687 3168 3149 3101 145-150 1525 1472 1427 1238 1252 1272 150-155 3137 2972 3001 2658 2639 2595 155-160 1900 1798 1799 1619 1570 1566 160-165 3228 3264 3253 3014 3153 3137 165-170 16830 16774 16766 11222 11351 11320 170-175 4406 4267 4250 2888 2835 2833 175-180 2841 2804 2811 2008 1973 1960 180-185 933 845 843 882 795 791 185-190 757 758 756 481 517 525 190-195 371 356 360 301 288 295 195-200 549 522 522 440 412 414 200+ 21984 20826 20864 13595 12137 12020 Total 899653 890856 891262 899016 890123 891788
4.9.12 Appendix No 4 shows the trip length distribution for the AM Peak and PM Peak graphically. Overall the post ME matrix for the AM Peak and PM Peak maintain the pre ME matrix trip length distributions well. The number of trips in each range as a percentage of total number of trips was similar in the pre ME matrix and post ME matrix for both peak periods.
4.10 SUMMARY
4.10.1 The results of the regression analysis and the trip length distribution comparison confirm that the matrix estimation process is not altering the character or the overall pattern of trips in the prior matrices and that the trip length distribution is similar pre and post matrix estimation. The prior matrix and final base year matrix trip totals are shown in Table 4.2 and Table 4.3. The output matrices from the estimation process are robust and suitable for use in the SATURN assignment process. The Prior Matrix has been assigned to network and detailed calibration and validation carried out which is discussed in Section 5.
NSTM - LMVR Highway Model Version 1.0 31
5 Calibration - Highway Assignment Model
5.1 INTRODUCTION
5.1.1 The process of model calibration is designed to ensure that the parameters that control the model’s calculation of route choices and the resulting delays lead to accurate replication of traffic patterns in the network. The calibration of a model crucially relies on traffic entering the detailed model area at the correct points and on the correct routes.
5.1.2 A number of key calibration checks were made between the modelled flows and observed flows:
Matrix Calibration
Checking assignment model convergence (See Section 5.3)
Comparison of modelled flows against observed flows that were used explicitly in the creation of the Prior Matrix which include those used for developing the RSI Matrix and those used in matrix estimation (See Section 5.4, Appendix No. 5 and Appendix No. 6)
Comparison of sector to sector movements between the Prior observed model and the Post observed model after the matrix estimation process (See Section 4.8)
Trip Length Distribution (See Section 4.8)
Network Calibration
Adjustment and checking of the network to ensure plausible and realistic routing of traffic in the model through monitoring RSI matrix assignments (See Section 3.4)
Comparison of observed and modelled traffic flows (See Section 5.4, Appendix No. 5 and Appendix No. 6)
5.2 ASSIGNMENT PARAMETERS
5.2.1 Part of the calibration process is the identification of the assignment parameters which form the generalised cost function i.e. PPK (pence per kilometre) and PPM (pence per minute) which control the assignment algorithm.
5.2.2 Generalised cost parameters were input to the model networks to determine the minimum cost routes by which traffic assigns itself onto the network. For the vehicle journeys modelled in the NSTM, generalised cost is a function of both the in-vehicle travel time and the operating costs (related to distance travelled).
32 NSTM - LMVR Highway Model Version 1.0
5.2.3 DfT WebTAG guidance on modelling states that:
“It is important for models of behaviour to use realistic measures of generalised cost” (WebTAG, Unit 3.1.2 paragraph 5.1.11)
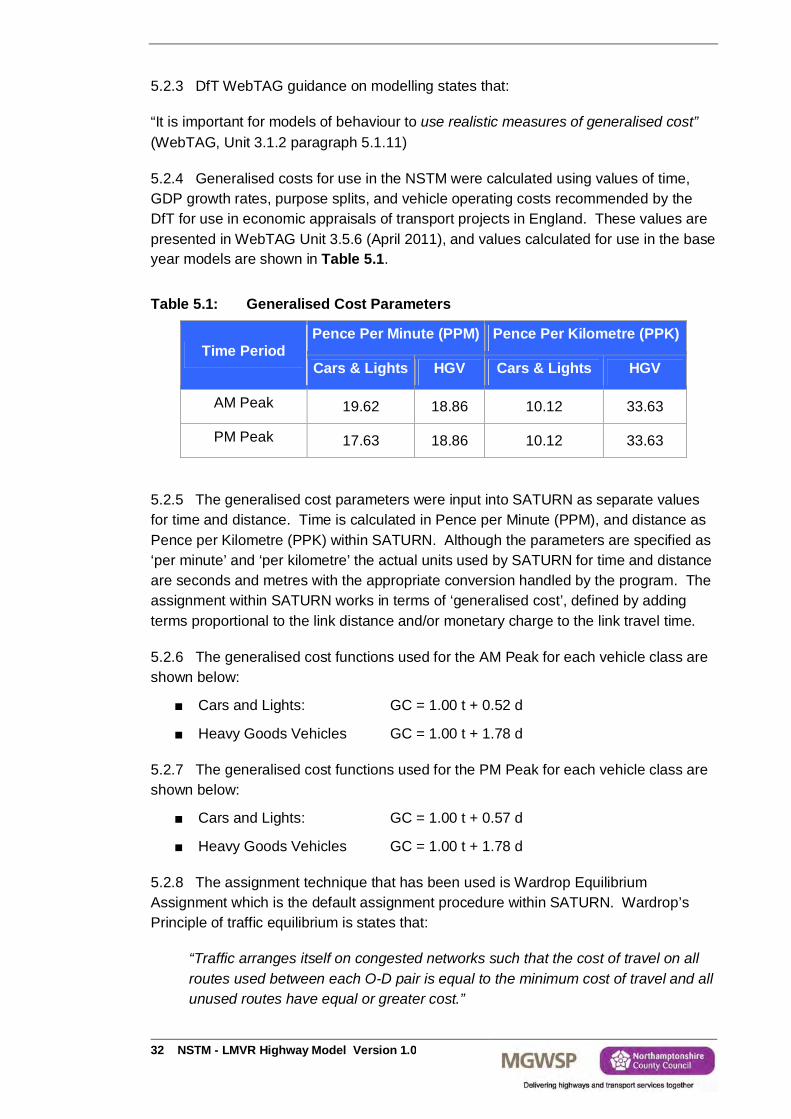
5.2.4 Generalised costs for use in the NSTM were calculated using values of time, GDP growth rates, purpose splits, and vehicle operating costs recommended by the DfT for use in economic appraisals of transport projects in England. These values are presented in WebTAG Unit 3.5.6 (April 2011), and values calculated for use in the base year models are shown in Table 5.1. Table 5.1: Generalised Cost Parameters
Time Period Pence Per Minute (PPM) Pence Per Kilometre (PPK)
Cars & Lights HGV Cars & Lights HGV
AM Peak 19.62 18.86 10.12 33.63
PM Peak 17.63 18.86 10.12 33.63
5.2.5 The generalised cost parameters were input into SATURN as separate values for time and distance. Time is calculated in Pence per Minute (PPM), and distance as Pence per Kilometre (PPK) within SATURN. Although the parameters are specified as ‘per minute’ and ‘per kilometre’ the actual units used by SATURN for time and distance are seconds and metres with the appropriate conversion handled by the program. The assignment within SATURN works in terms of ‘generalised cost’, defined by adding terms proportional to the link distance and/or monetary charge to the link travel time.
5.2.6 The generalised cost functions used for the AM Peak for each vehicle class are shown below:
Cars and Lights: GC = 1.00 t + 0.52 d
Heavy Goods Vehicles GC = 1.00 t + 1.78 d
5.2.7 The generalised cost functions used for the PM Peak for each vehicle class are shown below:
Cars and Lights: GC = 1.00 t + 0.57 d
Heavy Goods Vehicles GC = 1.00 t + 1.78 d
5.2.8 The assignment technique that has been used is Wardrop Equilibrium Assignment which is the default assignment procedure within SATURN. Wardrop’s Principle of traffic equilibrium is states that:
“Traffic arranges itself on congested networks such that the cost of travel on all routes used between each O-D pair is equal to the minimum cost of travel and all unused routes have equal or greater cost.”
NSTM - LMVR Highway Model Version 1.0 33
5.3 MODEL CONVERGENCE
5.3.1 An element of calibrating the model is ensuring a satisfactory convergence is achieved. Model convergence is needed to ensure traffic flows remain stable between successive iterations of the model.
5.3.2 In accordance with criteria set out in the DMRB, the parameters %Flow and Delta (d) have been monitored to determine the level of convergence. %Flow measures the proportion of links in the network with flows changing by less than 5% from the previous iteration and d is the difference between costs on chosen routes and costs on minimum cost paths.
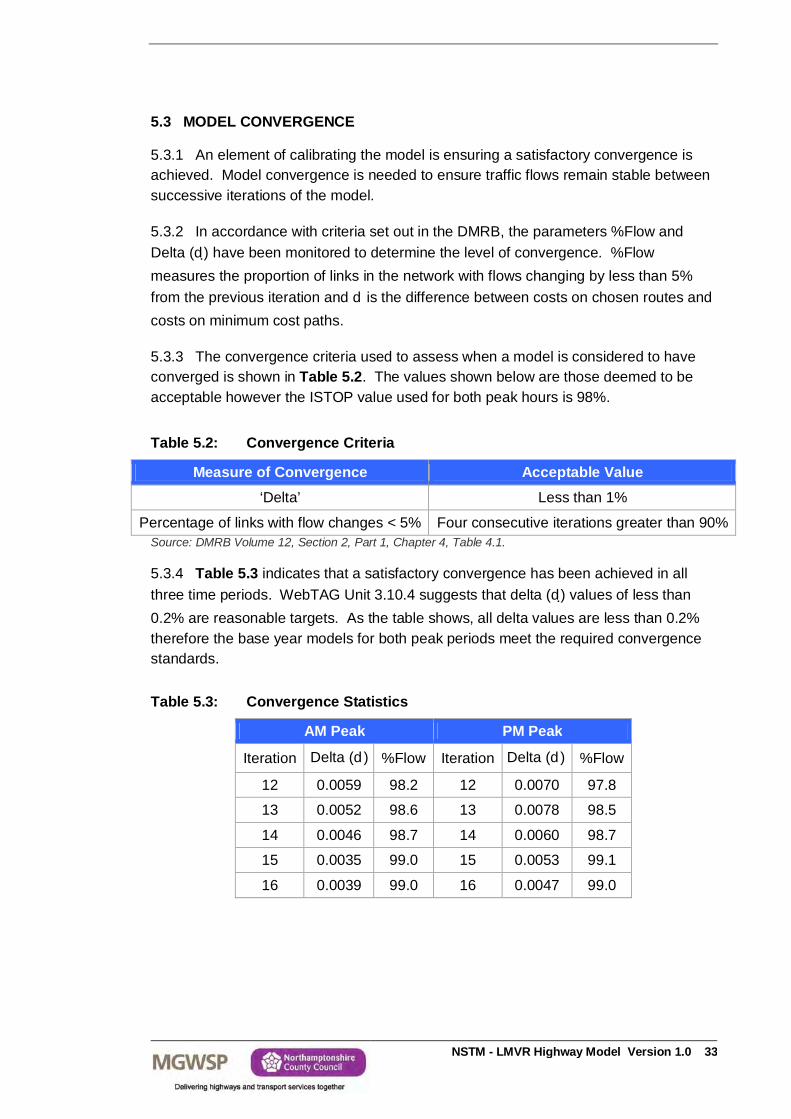
5.3.3 The convergence criteria used to assess when a model is considered to have converged is shown in Table 5.2. The values shown below are those deemed to be acceptable however the ISTOP value used for both peak hours is 98%.
Table 5.2: Convergence Criteria
Measure of Convergence Acceptable Value ‘Delta’ Less than 1%
Percentage of links with flow changes < 5% Four consecutive iterations greater than 90% Source: DMRB Volume 12, Section 2, Part 1, Chapter 4, Table 4.1.
5.3.4 Table 5.3 indicates that a satisfactory convergence has been achieved in all three time periods. WebTAG Unit 3.10.4 suggests that delta (d) values of less than 0.2% are reasonable targets. As the table shows, all delta values are less than 0.2% therefore the base year models for both peak periods meet the required convergence standards.
Table 5.3: Convergence Statistics
AM Peak PM Peak
Iteration Delta (d) %Flow Iteration Delta (d) %Flow
12 0.0059 98.2 12 0.0070 97.8
13 0.0052 98.6 13 0.0078 98.5
14 0.0046 98.7 14 0.0060 98.7
15 0.0035 99.0 15 0.0053 99.1
16 0.0039 99.0 16 0.0047 99.0
34 NSTM - LMVR Highway Model Version 1.0
5.4 CALIBRATION RESULTS
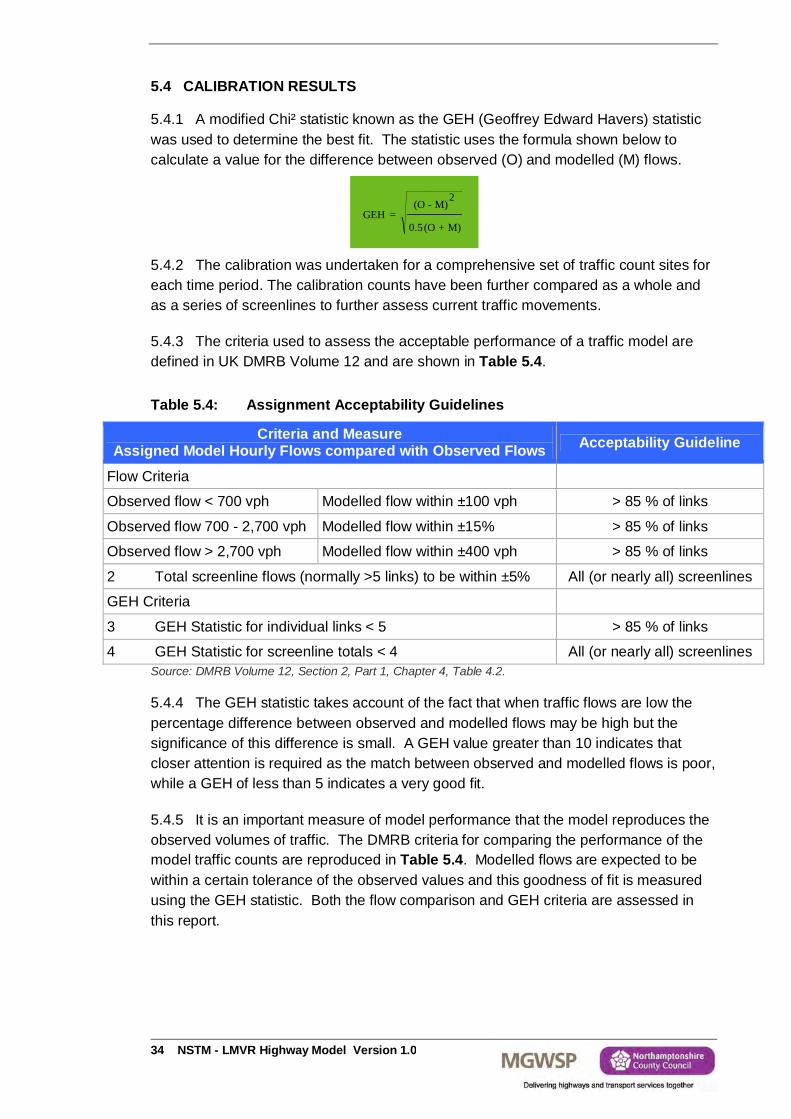
5.4.1 A modified Chi² statistic known as the GEH (Geoffrey Edward Havers) statistic was used to determine the best fit. The statistic uses the formula shown below to calculate a value for the difference between observed (O) and modelled (M) flows.
5.4.2 The calibration was undertaken for a comprehensive set of traffic count sites for each time period. The calibration counts have been further compared as a whole and as a series of screenlines to further assess current traffic movements.
5.4.3 The criteria used to assess the acceptable performance of a traffic model are defined in UK DMRB Volume 12 and are shown in Table 5.4.
Table 5.4: Assignment Acceptability Guidelines
Criteria and Measure Assigned Model Hourly Flows compared with Observed Flows Acceptability Guideline
Flow Criteria
Observed flow < 700 vph Modelled flow within ±100 vph > 85 % of links
Observed flow 700 - 2,700 vph Modelled flow within ±15% > 85 % of links
Observed flow > 2,700 vph Modelled flow within ±400 vph > 85 % of links
2 Total screenline flows (normally >5 links) to be within ±5% All (or nearly all) screenlines
GEH Criteria
3 GEH Statistic for individual links < 5 > 85 % of links
4 GEH Statistic for screenline totals < 4 All (or nearly all) screenlines Source: DMRB Volume 12, Section 2, Part 1, Chapter 4, Table 4.2.
5.4.4 The GEH statistic takes account of the fact that when traffic flows are low the percentage difference between observed and modelled flows may be high but the significance of this difference is small. A GEH value greater than 10 indicates that closer attention is required as the match between observed and modelled flows is poor, while a GEH of less than 5 indicates a very good fit.
5.4.5 It is an important measure of model performance that the model reproduces the observed volumes of traffic. The DMRB criteria for comparing the performance of the model traffic counts are reproduced in Table 5.4. Modelled flows are expected to be within a certain tolerance of the observed values and this goodness of fit is measured using the GEH statistic. Both the flow comparison and GEH criteria are assessed in this report.
M)+(O 0.5
2M)-(O
= GEH
NSTM - LMVR Highway Model Version 1.0 35
5.4.6 Either or both conditions are expected to be satisfied for 85% of the cases. Appendix No 5 details the calibration results for the AM Peak while Appendix No 6 details the calibration results for the PM Peak. The calibration counts are shown in purple on the diagrams while the validation counts are shown in red.
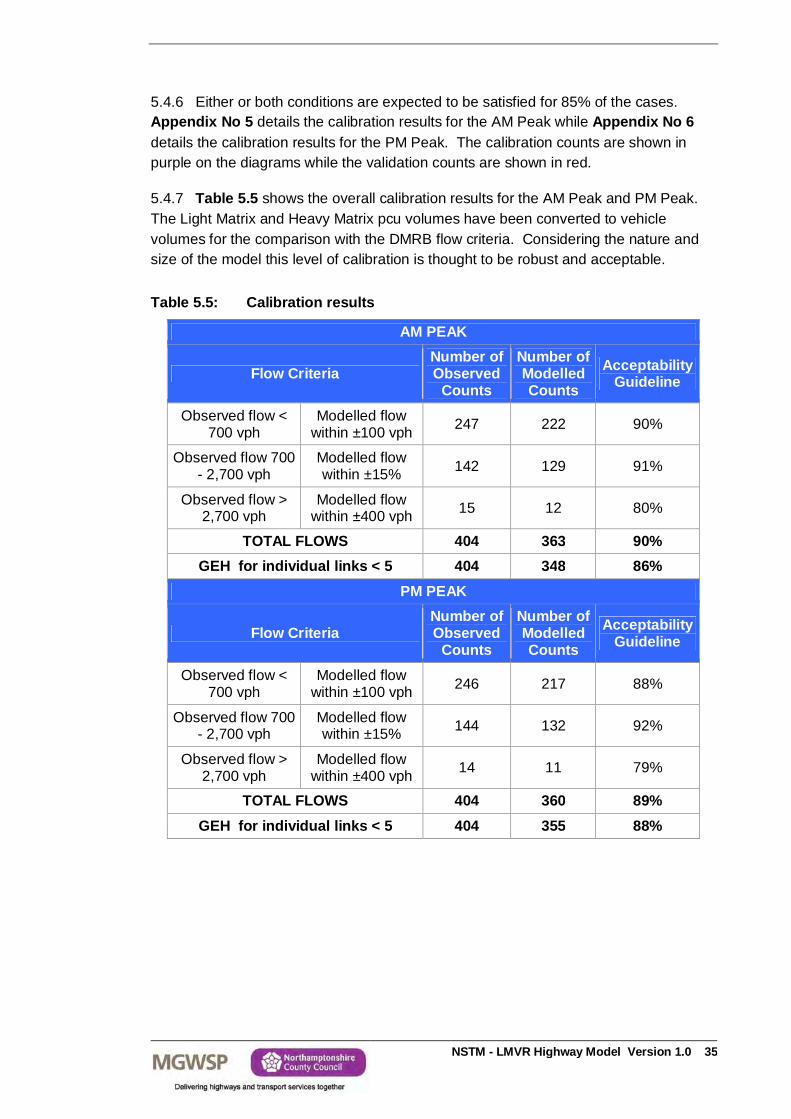
5.4.7 Table 5.5 shows the overall calibration results for the AM Peak and PM Peak. The Light Matrix and Heavy Matrix pcu volumes have been converted to vehicle volumes for the comparison with the DMRB flow criteria. Considering the nature and size of the model this level of calibration is thought to be robust and acceptable.
Table 5.5: Calibration results
AM PEAK
Flow Criteria Number of Observed
Counts
Number of Modelled Counts
Acceptability Guideline
Observed flow < 700 vph
Modelled flow within ±100 vph 247 222 90%
Observed flow 700 - 2,700 vph
Modelled flow within ±15% 142 129 91%
Observed flow > 2,700 vph
Modelled flow within ±400 vph 15 12 80%
TOTAL FLOWS 404 363 90% GEH for individual links < 5 404 348 86%
PM PEAK
Flow Criteria Number of Observed
Counts
Number of Modelled Counts
Acceptability Guideline
Observed flow < 700 vph
Modelled flow within ±100 vph 246 217 88%
Observed flow 700 - 2,700 vph
Modelled flow within ±15% 144 132 92%
Observed flow > 2,700 vph
Modelled flow within ±400 vph 14 11 79%
TOTAL FLOWS 404 360 89% GEH for individual links < 5 404 355 88%
36 NSTM - LMVR Highway Model Version 1.0
5.4.8 The calibration results for the AM Peak period meet the standards as stated in DMRB Volume 12a. Of the 404 counts analysed 348 counts, or 86%, have a GEH value under 5. 222 counts (90%) out of 247 have a flow of less than 700 while 129 counts, or 91%, out of 142 with a flow between 700 and 2,700 meet the standards. For counts with a flow of over 2,700 there are 12 counts (80%) out of 15 that meet the criteria.
5.4.9 The calibration results for the PM Peak period meet the standards as stated in DMRB Volume 12a. Of the 404 counts analysed, 355 counts or 88%, have a GEH value under 5. 217 counts (88%) out of the total 246 have a flow of less than 700, which meet the standards. 132 counts (92%), out of 144 have a flow of between 700 and 2,700, which meet the standards. For counts with a flow of over 2,700 there are 11 counts (79%) out of 14 that meet the criteria.
5.5 CALIBRATION CONCLUSIONS
5.5.1 The model calibration process was undertaken successfully and produced a high standard and quality of results for the modelled time periods. It has been shown that the prior trip matrices were improved by the use of matrix estimation techniques and that this process did not significantly alter the integrity of the prior trip matrices. Table 5.5 has shown that the criteria set out in Table 5.4 have been met for both the AM Peak and PM Peak. Considering the nature and size of the model this level of calibration is thought to be robust and acceptable.
NSTM - LMVR Highway Model Version 1.0 37
6 Validation - Highway Assignment Model
6.1 INTRODUCTION
6.1.1 A primary element of assessing the performance of a model is its ability to match an independent set of count data, which has not been used in the calibration process. For this purpose, a set of counts were identified that had not been used in the matrix estimation process.
6.1.2 A number of key validation checks were made between the modelled flows and observed flows:
Network Validation
Network validation, in terms of range checking and routing (See Section 3.4)
Checks to ensure that speed/flow calculations on network links and delay calculations at junctions were operating as expected (not covered in the report)
Matrix Validation
Comparison of modelled flows against independent observed flows which are those not used in the matrix building process (See Section 6.2, Appendix 7 and Appendix 8)
Comparison of observed and modelled journey time routes (See Section 6.2, Appendix 7 and Appendix 8)
6.1.3 The validation of the model has been assessed in a similar way to that of the calibration by the calculation of the GEH statistic. Acceptability guidelines on validation have been taken from DMRB Volume 12a and are as shown in Table 5.4. Validation has been carried out using modelled vehicle link flows extracted from an assignment and compared to observed vehicle link flows.
6.2 VALIDATION RESULTS
6.2.1 The validation of the network models has been conducted under three main headings:
Network validation (See Section 3.4)
Routeing validation (See Section 3.4)
Link flow validation
38 NSTM - LMVR Highway Model Version 1.0
6.2.2 A primary element of assessing the performance of a model is its ability to match an independent set of count data, which has not been used in the calibration matrix estimation process. For this purpose, a set of counts have been identified that had not been used in the matrix estimation process.
6.2.3 The validation of the model will be assessed in a similar way to that of the calibration by the calculation of the GEH statistic. Acceptability guidelines on validation have been taken from DMRB vol. 12a and are as shown in Table 5.4. Validation has been carried out using total modelled flows extracted from a stacked assignment and compared to observed light and heavy goods vehicle flows combined.
6.2.4 Model validation was undertaken against the following criteria:
Independent flow data
Journey time data
6.3 LINK FLOW VALIDATION
6.3.1 Tables detailing the calibration and validation results are included in Appendix No 5 for the AM Peak and Appendix No 6 for the PM Peak. The calibration counts are shown in purple on the diagrams while the validation counts are shown in red.
6.3.2 Table 6.1 shows the overall validation results for the AM Peak and PM Peak. The Light Matrix and Heavy Matrix pcu volumes have been converted to vehicle volumes for the comparison with the DMRB flow criteria. Considering the nature and size of the model this level of validation is thought to be robust and acceptable.
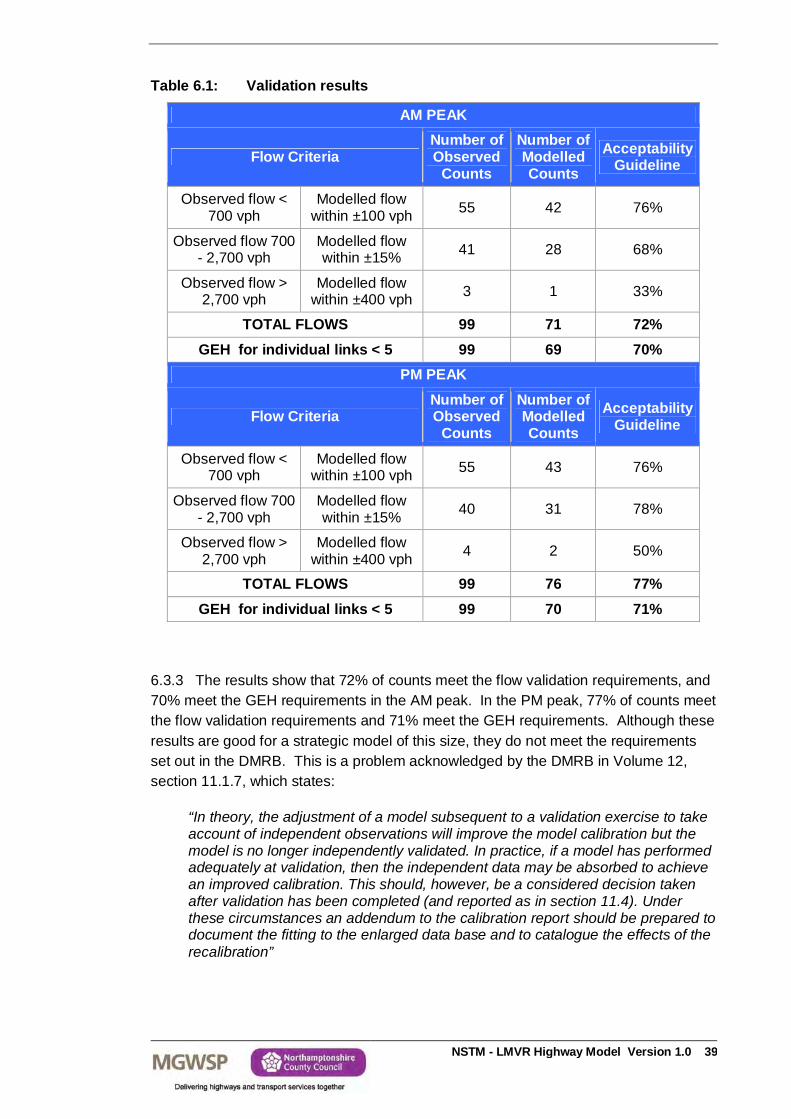
NSTM - LMVR Highway Model Version 1.0 39
Table 6.1: Validation results
AM PEAK
Flow Criteria Number of Observed
Counts
Number of Modelled Counts
Acceptability Guideline
Observed flow < 700 vph
Modelled flow within ±100 vph 55 42 76%
Observed flow 700 - 2,700 vph
Modelled flow within ±15% 41 28 68%
Observed flow > 2,700 vph
Modelled flow within ±400 vph 3 1 33%
TOTAL FLOWS 99 71 72% GEH for individual links < 5 99 69 70%
PM PEAK
Flow Criteria Number of Observed
Counts
Number of Modelled Counts
Acceptability Guideline
Observed flow < 700 vph
Modelled flow within ±100 vph 55 43 76%
Observed flow 700 - 2,700 vph
Modelled flow within ±15% 40 31 78%
Observed flow > 2,700 vph
Modelled flow within ±400 vph 4 2 50%
TOTAL FLOWS 99 76 77% GEH for individual links < 5 99 70 71%
6.3.3 The results show that 72% of counts meet the flow validation requirements, and 70% meet the GEH requirements in the AM peak. In the PM peak, 77% of counts meet the flow validation requirements and 71% meet the GEH requirements. Although these results are good for a strategic model of this size, they do not meet the requirements set out in the DMRB. This is a problem acknowledged by the DMRB in Volume 12, section 11.1.7, which states:
“In theory, the adjustment of a model subsequent to a validation exercise to take account of independent observations will improve the model calibration but the model is no longer independently validated. In practice, if a model has performed adequately at validation, then the independent data may be absorbed to achieve an improved calibration. This should, however, be a considered decision taken after validation has been completed (and reported as in section 11.4). Under these circumstances an addendum to the calibration report should be prepared to document the fitting to the enlarged data base and to catalogue the effects of the recalibration”
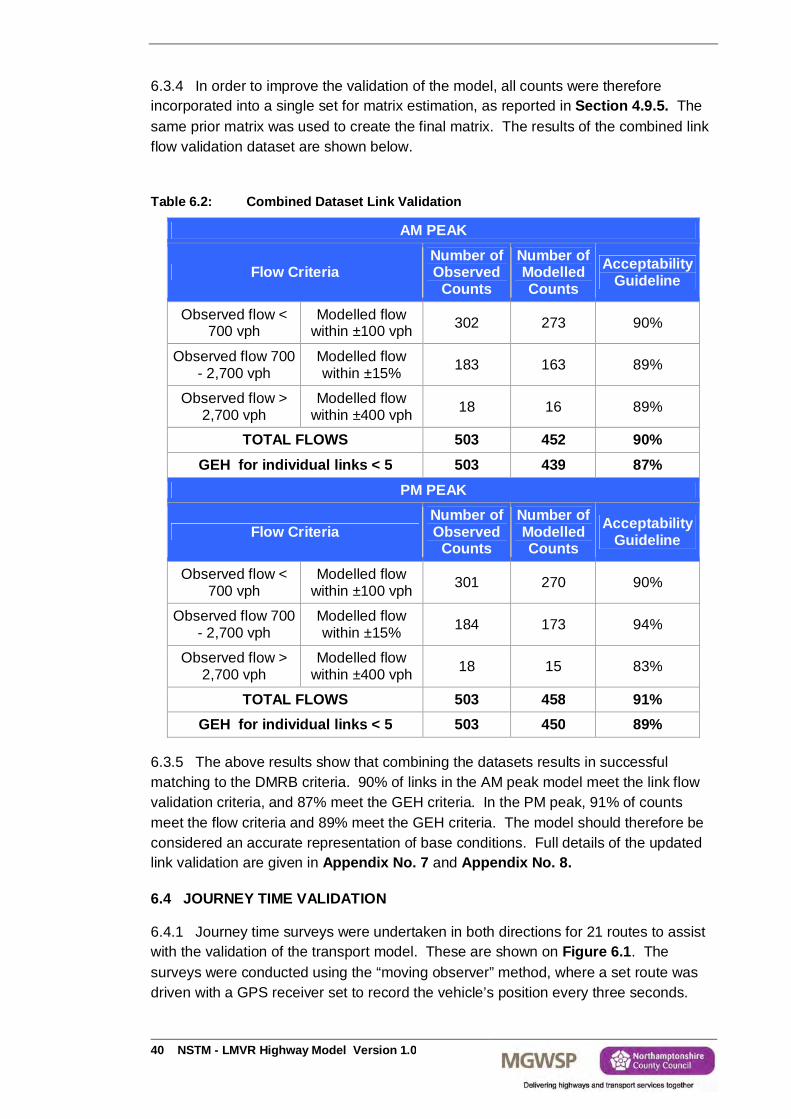
40 NSTM - LMVR Highway Model Version 1.0
6.3.4 In order to improve the validation of the model, all counts were therefore incorporated into a single set for matrix estimation, as reported in Section 4.9.5. The same prior matrix was used to create the final matrix. The results of the combined link flow validation dataset are shown below.
Table 6.2: Combined Dataset Link Validation
AM PEAK
Flow Criteria Number of Observed
Counts
Number of Modelled Counts
Acceptability Guideline
Observed flow < 700 vph
Modelled flow within ±100 vph 302 273 90%
Observed flow 700 - 2,700 vph
Modelled flow within ±15% 183 163 89%
Observed flow > 2,700 vph
Modelled flow within ±400 vph 18 16 89%
TOTAL FLOWS 503 452 90% GEH for individual links < 5 503 439 87%
PM PEAK
Flow Criteria Number of Observed
Counts
Number of Modelled Counts
Acceptability Guideline
Observed flow < 700 vph
Modelled flow within ±100 vph 301 270 90%
Observed flow 700 - 2,700 vph
Modelled flow within ±15% 184 173 94%
Observed flow > 2,700 vph
Modelled flow within ±400 vph 18 15 83%
TOTAL FLOWS 503 458 91% GEH for individual links < 5 503 450 89%
6.3.5 The above results show that combining the datasets results in successful matching to the DMRB criteria. 90% of links in the AM peak model meet the link flow validation criteria, and 87% meet the GEH criteria. In the PM peak, 91% of counts meet the flow criteria and 89% meet the GEH criteria. The model should therefore be considered an accurate representation of base conditions. Full details of the updated link validation are given in Appendix No. 7 and Appendix No. 8.
6.4 JOURNEY TIME VALIDATION
6.4.1 Journey time surveys were undertaken in both directions for 21 routes to assist with the validation of the transport model. These are shown on Figure 6.1. The surveys were conducted using the “moving observer” method, where a set route was driven with a GPS receiver set to record the vehicle’s position every three seconds.
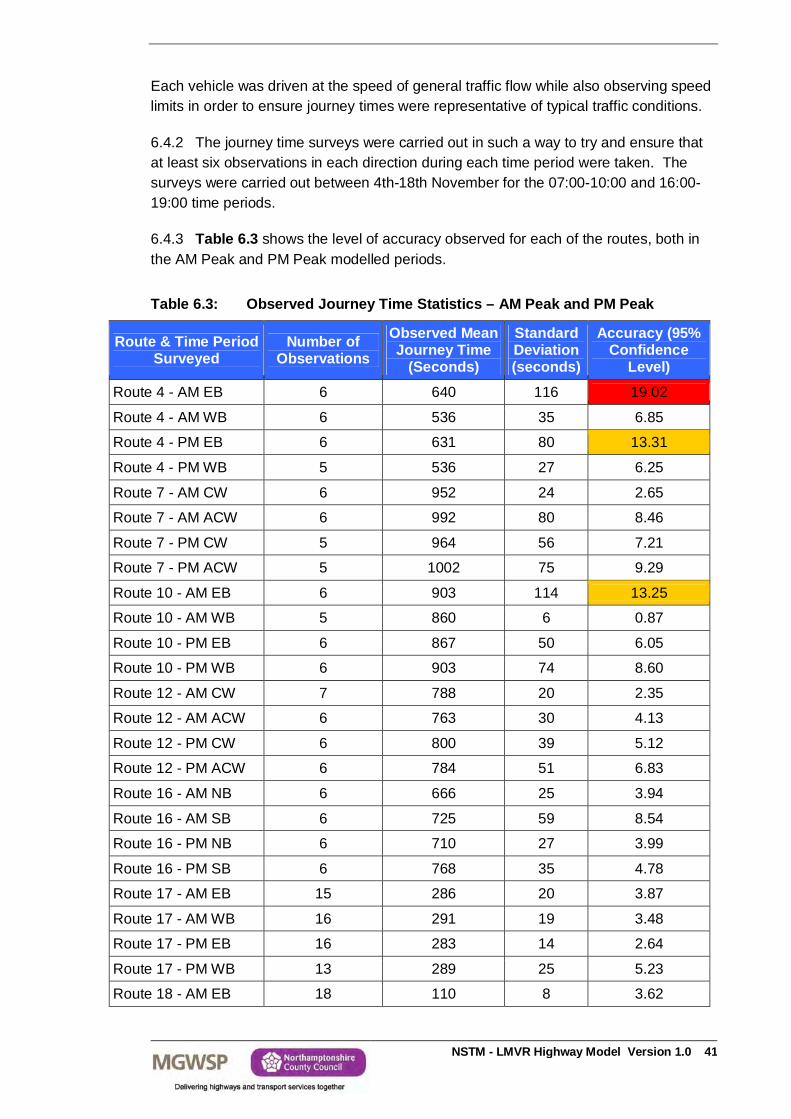
NSTM - LMVR Highway Model Version 1.0 41
Each vehicle was driven at the speed of general traffic flow while also observing speed limits in order to ensure journey times were representative of typical traffic conditions.
6.4.2 The journey time surveys were carried out in such a way to try and ensure that at least six observations in each direction during each time period were taken. The surveys were carried out between 4th-18th November for the 07:00-10:00 and 16:00-19:00 time periods.
6.4.3 Table 6.3 shows the level of accuracy observed for each of the routes, both in the AM Peak and PM Peak modelled periods. Table 6.3: Observed Journey Time Statistics – AM Peak and PM Peak
Route & Time Period Surveyed
Number of Observations
Observed Mean Journey Time
(Seconds)
Standard Deviation (seconds)
Accuracy (95% Confidence
Level) Route 4 - AM EB 6 640 116 19.02
Route 4 - AM WB 6 536 35 6.85
Route 4 - PM EB 6 631 80 13.31
Route 4 - PM WB 5 536 27 6.25
Route 7 - AM CW 6 952 24 2.65
Route 7 - AM ACW 6 992 80 8.46
Route 7 - PM CW 5 964 56 7.21
Route 7 - PM ACW 5 1002 75 9.29
Route 10 - AM EB 6 903 114 13.25
Route 10 - AM WB 5 860 6 0.87
Route 10 - PM EB 6 867 50 6.05
Route 10 - PM WB 6 903 74 8.60
Route 12 - AM CW 7 788 20 2.35
Route 12 - AM ACW 6 763 30 4.13
Route 12 - PM CW 6 800 39 5.12
Route 12 - PM ACW 6 784 51 6.83
Route 16 - AM NB 6 666 25 3.94
Route 16 - AM SB 6 725 59 8.54
Route 16 - PM NB 6 710 27 3.99
Route 16 - PM SB 6 768 35 4.78
Route 17 - AM EB 15 286 20 3.87
Route 17 - AM WB 16 291 19 3.48
Route 17 - PM EB 16 283 14 2.64
Route 17 - PM WB 13 289 25 5.23
Route 18 - AM EB 18 110 8 3.62
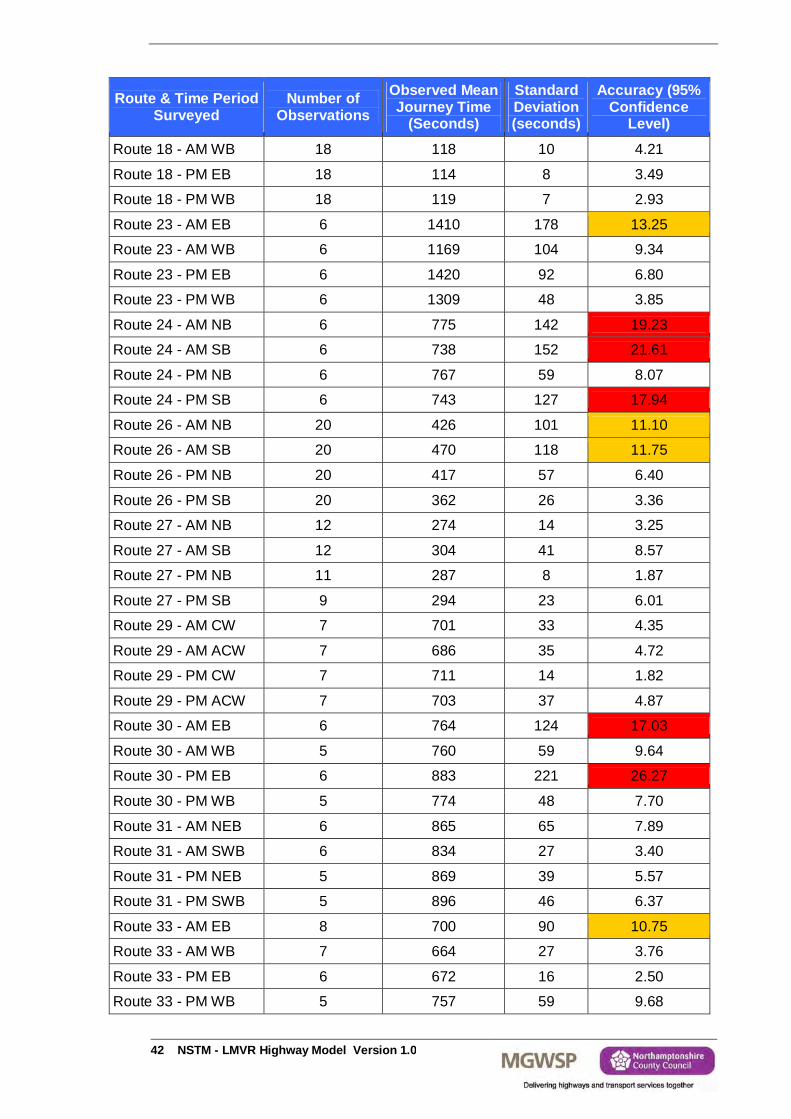
42 NSTM - LMVR Highway Model Version 1.0
Route & Time Period Surveyed
Number of Observations
Observed Mean Journey Time
(Seconds)
Standard Deviation (seconds)
Accuracy (95% Confidence
Level)
Route 18 - AM WB 18 118 10 4.21
Route 18 - PM EB 18 114 8 3.49
Route 18 - PM WB 18 119 7 2.93
Route 23 - AM EB 6 1410 178 13.25
Route 23 - AM WB 6 1169 104 9.34
Route 23 - PM EB 6 1420 92 6.80
Route 23 - PM WB 6 1309 48 3.85
Route 24 - AM NB 6 775 142 19.23
Route 24 - AM SB 6 738 152 21.61
Route 24 - PM NB 6 767 59 8.07
Route 24 - PM SB 6 743 127 17.94
Route 26 - AM NB 20 426 101 11.10
Route 26 - AM SB 20 470 118 11.75
Route 26 - PM NB 20 417 57 6.40
Route 26 - PM SB 20 362 26 3.36
Route 27 - AM NB 12 274 14 3.25
Route 27 - AM SB 12 304 41 8.57
Route 27 - PM NB 11 287 8 1.87
Route 27 - PM SB 9 294 23 6.01
Route 29 - AM CW 7 701 33 4.35
Route 29 - AM ACW 7 686 35 4.72
Route 29 - PM CW 7 711 14 1.82
Route 29 - PM ACW 7 703 37 4.87
Route 30 - AM EB 6 764 124 17.03
Route 30 - AM WB 5 760 59 9.64
Route 30 - PM EB 6 883 221 26.27
Route 30 - PM WB 5 774 48 7.70
Route 31 - AM NEB 6 865 65 7.89
Route 31 - AM SWB 6 834 27 3.40
Route 31 - PM NEB 5 869 39 5.57
Route 31 - PM SWB 5 896 46 6.37
Route 33 - AM EB 8 700 90 10.75
Route 33 - AM WB 7 664 27 3.76
Route 33 - PM EB 6 672 16 2.50
Route 33 - PM WB 5 757 59 9.68
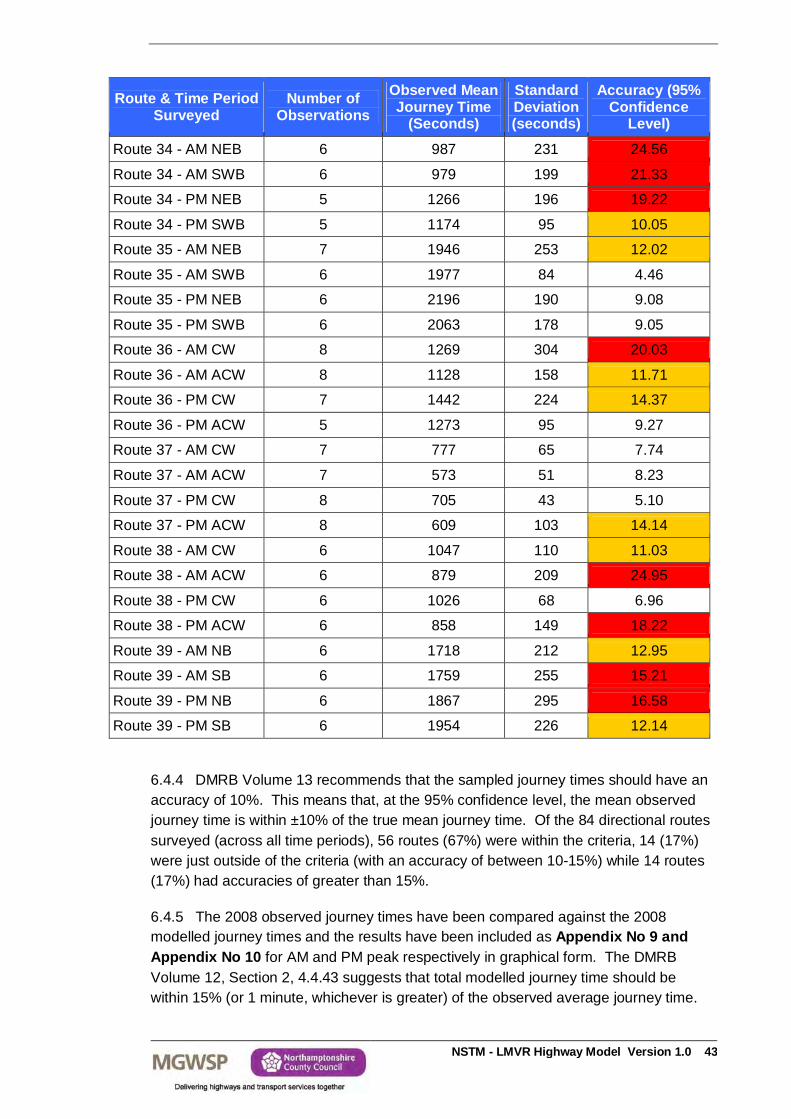
NSTM - LMVR Highway Model Version 1.0 43
Route & Time Period Surveyed
Number of Observations
Observed Mean Journey Time
(Seconds)
Standard Deviation (seconds)
Accuracy (95% Confidence
Level)
Route 34 - AM NEB 6 987 231 24.56
Route 34 - AM SWB 6 979 199 21.33
Route 34 - PM NEB 5 1266 196 19.22
Route 34 - PM SWB 5 1174 95 10.05
Route 35 - AM NEB 7 1946 253 12.02
Route 35 - AM SWB 6 1977 84 4.46
Route 35 - PM NEB 6 2196 190 9.08
Route 35 - PM SWB 6 2063 178 9.05
Route 36 - AM CW 8 1269 304 20.03
Route 36 - AM ACW 8 1128 158 11.71
Route 36 - PM CW 7 1442 224 14.37
Route 36 - PM ACW 5 1273 95 9.27
Route 37 - AM CW 7 777 65 7.74
Route 37 - AM ACW 7 573 51 8.23
Route 37 - PM CW 8 705 43 5.10
Route 37 - PM ACW 8 609 103 14.14
Route 38 - AM CW 6 1047 110 11.03
Route 38 - AM ACW 6 879 209 24.95
Route 38 - PM CW 6 1026 68 6.96
Route 38 - PM ACW 6 858 149 18.22
Route 39 - AM NB 6 1718 212 12.95
Route 39 - AM SB 6 1759 255 15.21
Route 39 - PM NB 6 1867 295 16.58
Route 39 - PM SB 6 1954 226 12.14
6.4.4 DMRB Volume 13 recommends that the sampled journey times should have an accuracy of 10%. This means that, at the 95% confidence level, the mean observed journey time is within ±10% of the true mean journey time. Of the 84 directional routes surveyed (across all time periods), 56 routes (67%) were within the criteria, 14 (17%) were just outside of the criteria (with an accuracy of between 10-15%) while 14 routes (17%) had accuracies of greater than 15%.
6.4.5 The 2008 observed journey times have been compared against the 2008 modelled journey times and the results have been included as Appendix No 9 and Appendix No 10 for AM and PM peak respectively in graphical form. The DMRB Volume 12, Section 2, 4.4.43 suggests that total modelled journey time should be within 15% (or 1 minute, whichever is greater) of the observed average journey time.
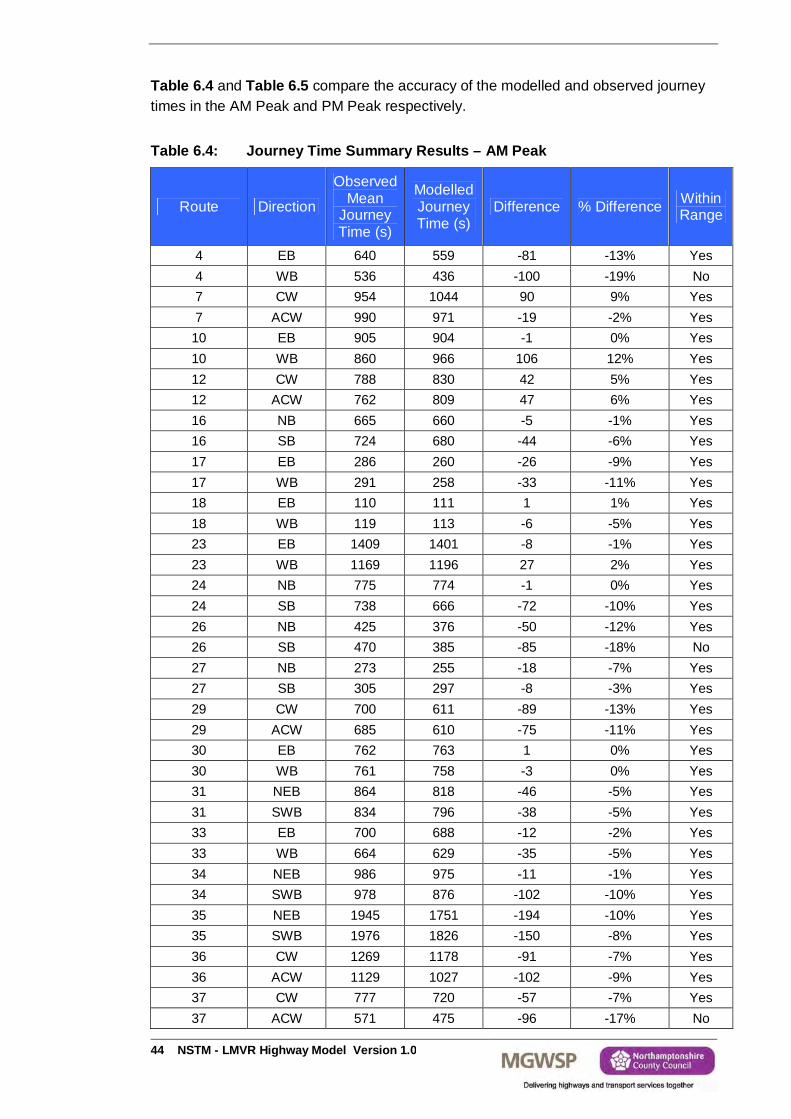
44 NSTM - LMVR Highway Model Version 1.0
Table 6.4 and Table 6.5 compare the accuracy of the modelled and observed journey times in the AM Peak and PM Peak respectively. Table 6.4: Journey Time Summary Results – AM Peak
Route Direction
Observed Mean
Journey Time (s)
Modelled Journey Time (s)
Difference % Difference Within Range
4 EB 640 559 -81 -13% Yes 4 WB 536 436 -100 -19% No 7 CW 954 1044 90 9% Yes 7 ACW 990 971 -19 -2% Yes
10 EB 905 904 -1 0% Yes 10 WB 860 966 106 12% Yes 12 CW 788 830 42 5% Yes 12 ACW 762 809 47 6% Yes 16 NB 665 660 -5 -1% Yes 16 SB 724 680 -44 -6% Yes 17 EB 286 260 -26 -9% Yes 17 WB 291 258 -33 -11% Yes 18 EB 110 111 1 1% Yes 18 WB 119 113 -6 -5% Yes 23 EB 1409 1401 -8 -1% Yes 23 WB 1169 1196 27 2% Yes 24 NB 775 774 -1 0% Yes 24 SB 738 666 -72 -10% Yes 26 NB 425 376 -50 -12% Yes 26 SB 470 385 -85 -18% No 27 NB 273 255 -18 -7% Yes 27 SB 305 297 -8 -3% Yes 29 CW 700 611 -89 -13% Yes 29 ACW 685 610 -75 -11% Yes 30 EB 762 763 1 0% Yes 30 WB 761 758 -3 0% Yes 31 NEB 864 818 -46 -5% Yes 31 SWB 834 796 -38 -5% Yes 33 EB 700 688 -12 -2% Yes 33 WB 664 629 -35 -5% Yes 34 NEB 986 975 -11 -1% Yes 34 SWB 978 876 -102 -10% Yes 35 NEB 1945 1751 -194 -10% Yes 35 SWB 1976 1826 -150 -8% Yes 36 CW 1269 1178 -91 -7% Yes 36 ACW 1129 1027 -102 -9% Yes 37 CW 777 720 -57 -7% Yes 37 ACW 571 475 -96 -17% No
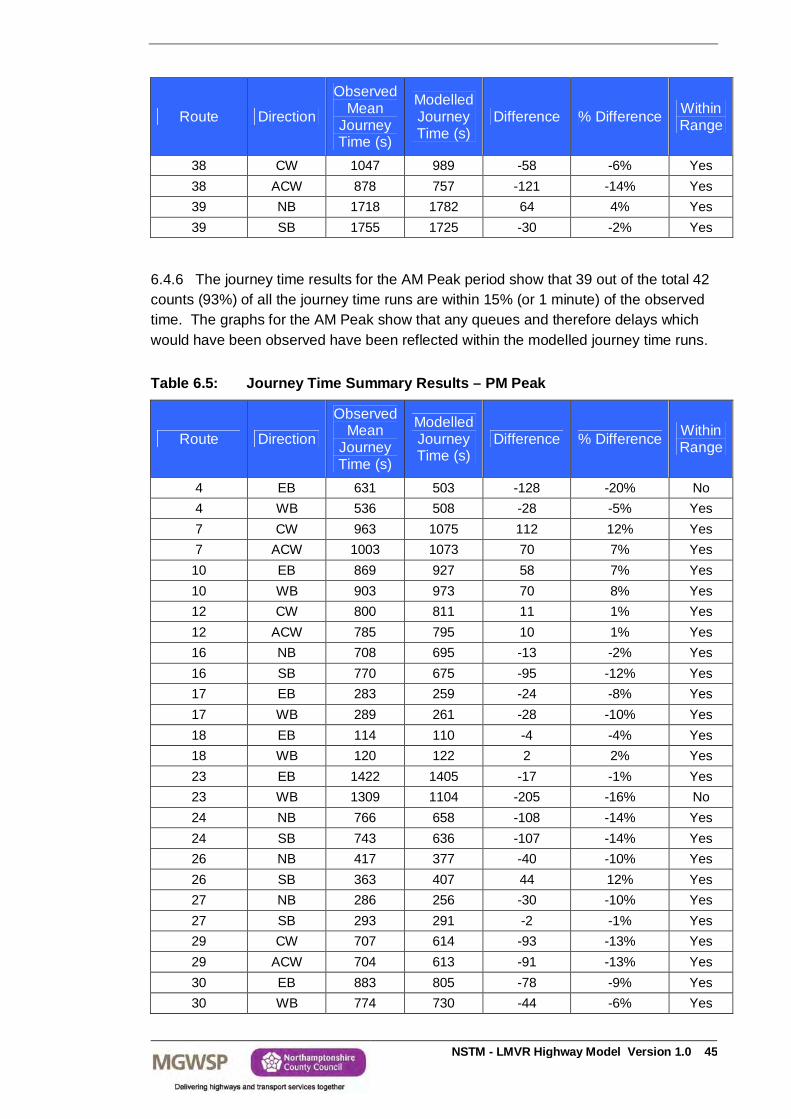
NSTM - LMVR Highway Model Version 1.0 45
Route Direction
Observed Mean
Journey Time (s)
Modelled Journey Time (s)
Difference % Difference Within Range
38 CW 1047 989 -58 -6% Yes 38 ACW 878 757 -121 -14% Yes 39 NB 1718 1782 64 4% Yes 39 SB 1755 1725 -30 -2% Yes
6.4.6 The journey time results for the AM Peak period show that 39 out of the total 42 counts (93%) of all the journey time runs are within 15% (or 1 minute) of the observed time. The graphs for the AM Peak show that any queues and therefore delays which would have been observed have been reflected within the modelled journey time runs.
Table 6.5: Journey Time Summary Results – PM Peak
Route Direction
Observed Mean
Journey Time (s)
Modelled Journey Time (s)
Difference % Difference Within Range
4 EB 631 503 -128 -20% No 4 WB 536 508 -28 -5% Yes 7 CW 963 1075 112 12% Yes 7 ACW 1003 1073 70 7% Yes
10 EB 869 927 58 7% Yes 10 WB 903 973 70 8% Yes 12 CW 800 811 11 1% Yes 12 ACW 785 795 10 1% Yes 16 NB 708 695 -13 -2% Yes 16 SB 770 675 -95 -12% Yes 17 EB 283 259 -24 -8% Yes 17 WB 289 261 -28 -10% Yes 18 EB 114 110 -4 -4% Yes 18 WB 120 122 2 2% Yes 23 EB 1422 1405 -17 -1% Yes 23 WB 1309 1104 -205 -16% No 24 NB 766 658 -108 -14% Yes 24 SB 743 636 -107 -14% Yes 26 NB 417 377 -40 -10% Yes 26 SB 363 407 44 12% Yes 27 NB 286 256 -30 -10% Yes 27 SB 293 291 -2 -1% Yes 29 CW 707 614 -93 -13% Yes 29 ACW 704 613 -91 -13% Yes 30 EB 883 805 -78 -9% Yes 30 WB 774 730 -44 -6% Yes
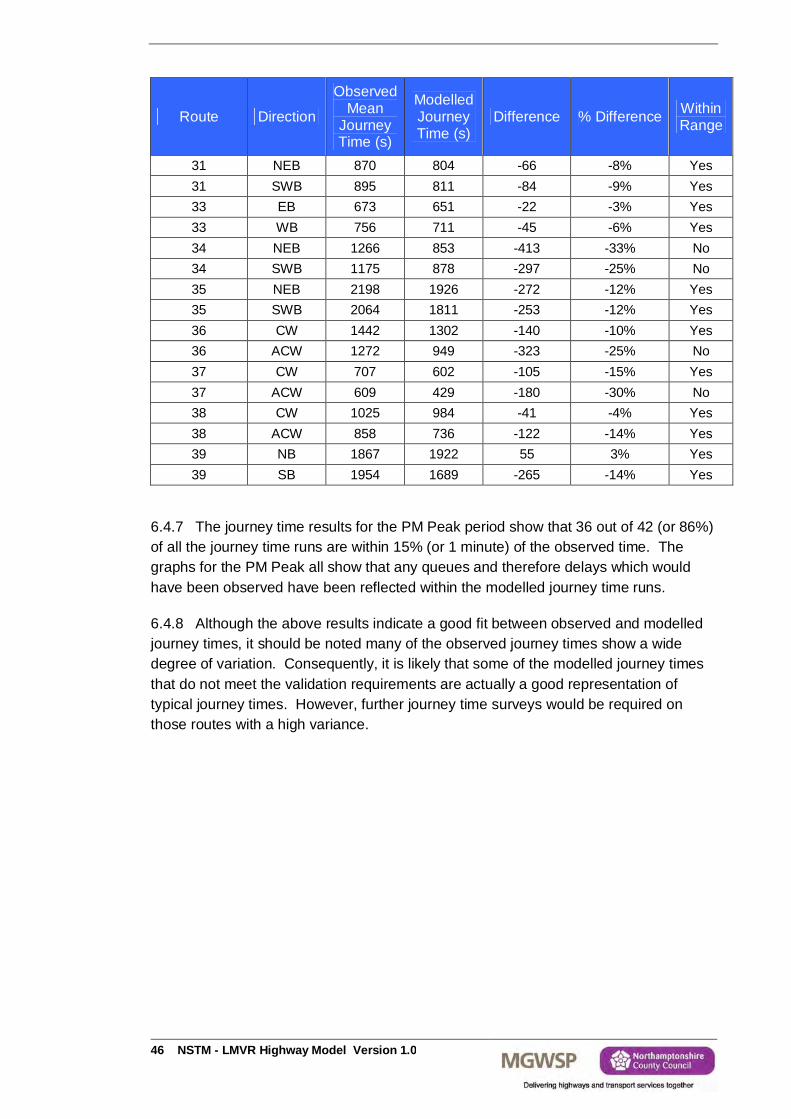
46 NSTM - LMVR Highway Model Version 1.0
Route Direction
Observed Mean
Journey Time (s)
Modelled Journey Time (s)
Difference % Difference Within Range
31 NEB 870 804 -66 -8% Yes 31 SWB 895 811 -84 -9% Yes 33 EB 673 651 -22 -3% Yes 33 WB 756 711 -45 -6% Yes 34 NEB 1266 853 -413 -33% No 34 SWB 1175 878 -297 -25% No 35 NEB 2198 1926 -272 -12% Yes 35 SWB 2064 1811 -253 -12% Yes 36 CW 1442 1302 -140 -10% Yes 36 ACW 1272 949 -323 -25% No 37 CW 707 602 -105 -15% Yes 37 ACW 609 429 -180 -30% No 38 CW 1025 984 -41 -4% Yes 38 ACW 858 736 -122 -14% Yes 39 NB 1867 1922 55 3% Yes 39 SB 1954 1689 -265 -14% Yes
6.4.7 The journey time results for the PM Peak period show that 36 out of 42 (or 86%) of all the journey time runs are within 15% (or 1 minute) of the observed time. The graphs for the PM Peak all show that any queues and therefore delays which would have been observed have been reflected within the modelled journey time runs.
6.4.8 Although the above results indicate a good fit between observed and modelled journey times, it should be noted many of the observed journey times show a wide degree of variation. Consequently, it is likely that some of the modelled journey times that do not meet the validation requirements are actually a good representation of typical journey times. However, further journey time surveys would be required on those routes with a high variance.
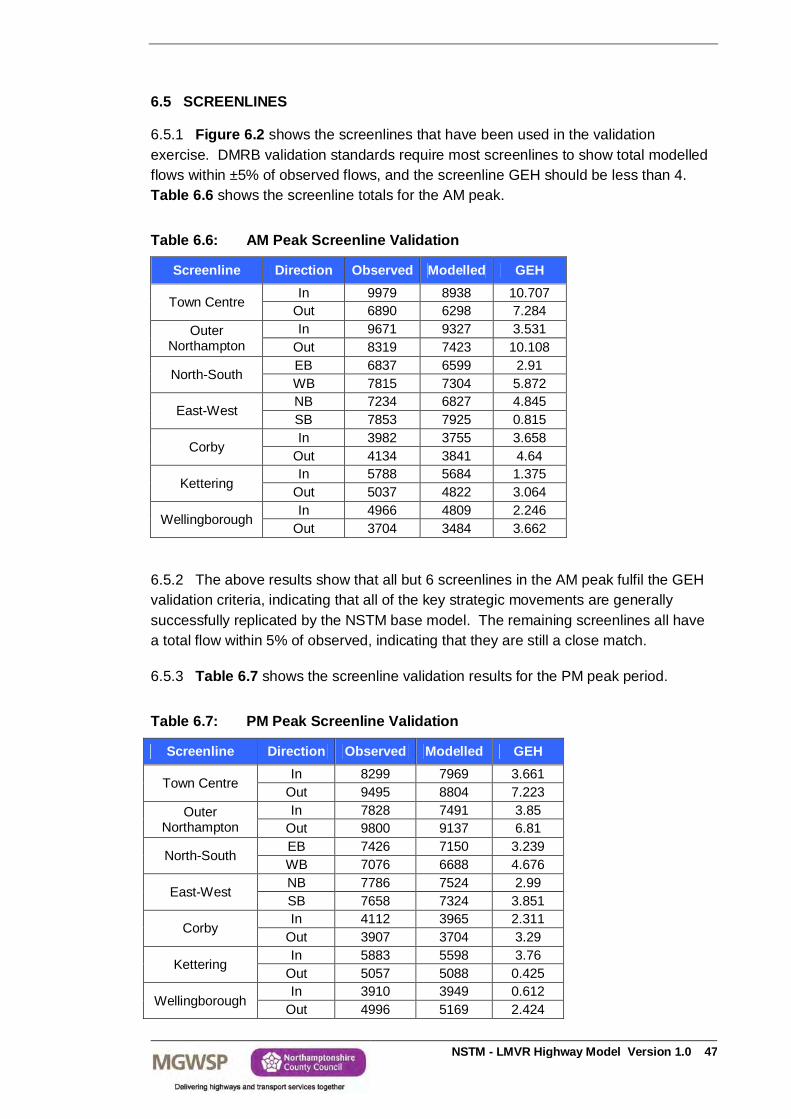
NSTM - LMVR Highway Model Version 1.0 47
6.5 SCREENLINES
6.5.1 Figure 6.2 shows the screenlines that have been used in the validation exercise. DMRB validation standards require most screenlines to show total modelled flows within ±5% of observed flows, and the screenline GEH should be less than 4. Table 6.6 shows the screenline totals for the AM peak. Table 6.6: AM Peak Screenline Validation
Screenline Direction Observed Modelled GEH
Town Centre In 9979 8938 10.707
Out 6890 6298 7.284 Outer
Northampton In 9671 9327 3.531
Out 8319 7423 10.108
North-South EB 6837 6599 2.91 WB 7815 7304 5.872
East-West NB 7234 6827 4.845 SB 7853 7925 0.815
Corby In 3982 3755 3.658
Out 4134 3841 4.64
Kettering In 5788 5684 1.375
Out 5037 4822 3.064
Wellingborough In 4966 4809 2.246
Out 3704 3484 3.662
6.5.2 The above results show that all but 6 screenlines in the AM peak fulfil the GEH validation criteria, indicating that all of the key strategic movements are generally successfully replicated by the NSTM base model. The remaining screenlines all have a total flow within 5% of observed, indicating that they are still a close match.
6.5.3 Table 6.7 shows the screenline validation results for the PM peak period. Table 6.7: PM Peak Screenline Validation
Screenline Direction Observed Modelled GEH
Town Centre In 8299 7969 3.661
Out 9495 8804 7.223 Outer
Northampton In 7828 7491 3.85
Out 9800 9137 6.81
North-South EB 7426 7150 3.239 WB 7076 6688 4.676
East-West NB 7786 7524 2.99 SB 7658 7324 3.851
Corby In 4112 3965 2.311
Out 3907 3704 3.29
Kettering In 5883 5598 3.76
Out 5057 5088 0.425
Wellingborough In 3910 3949 0.612
Out 4996 5169 2.424

48 NSTM - LMVR Highway Model Version 1.0
6.5.4 In the PM peak, all but 3 screenlines meet the GEH criteria. The outbound Town Centre screenline and the outbound Outer Northampton show significant deviation, with a GEH of 7.2 and 6.8 respectively. However, this is still within 8% of observed flows, indicating that overall traffic flows are well-represented.
6.5.5 Overall, the NSTM validates well for screenlines capturing all of the significant strategic movements within the study area.
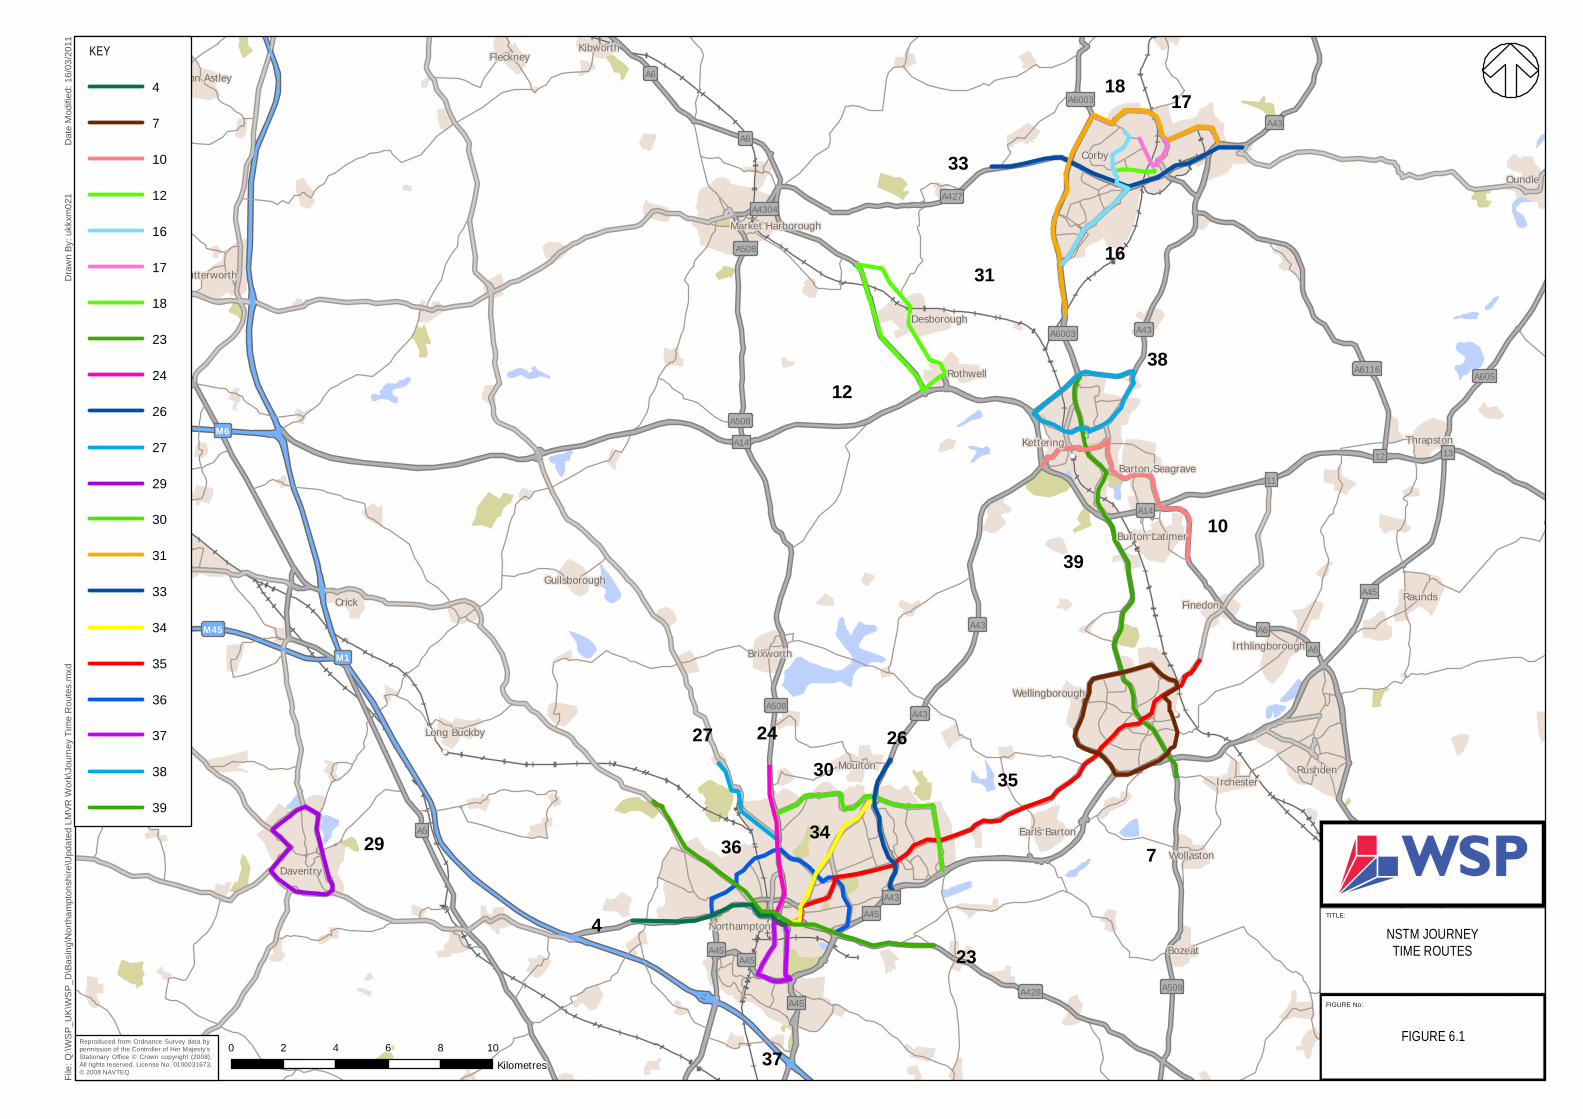
!!!(
!!!(
!!!(
!!!(
!!!(
!!!(
29
4
37
23
36 34
27 2430
2635
7
3910
3812
31
33
16
18 17
M1
M6
M45
A14
A5
A508
A45
A43
A6
A427
A509
A6116 A605
A428
A6003
A4304
11
1312
A6003
A6
A508
A45
A45
A45
A508 A43
A14
A43
A6
A6
A43
A43
A45
Corby
Rugby
Rushden
Daventry
Northampton
Kettering
Wellingborough
Market Harborough
Raunds
Oundle
Desborough
Lutterworth
Crick
Irthlingborough
Rothwell
Brixworth
Moulton
Barton Seagrave
Bozeat
Thrapston
Magna Park
Burton Latimer
Earls Barton
Irchester
Finedon
Broughton Astley
Wollaston
Fleckney Kibworth
Long Buckby
Guilsborough
File
: Q:\W
SP_
UK
\WS
P_D
\Bas
ing\
Nor
tham
pton
shire
\Upd
ated
LM
VR W
ork\
Jour
ney
Tim
e R
oute
s.m
xdD
raw
n By
: ukk
xm02
1D
ate
Mod
ified
: 16/
03/2
011
Reproduced from Ordnance Survey data by permission of the Controller of Her Majesty's Stationary Office © Crown copyright (2008).All rights reserved. License No. 0100031673.© 2008 NAVTEQ
FIGURE No:
TITLE:
NSTM JOURNEYTIME ROUTES
FIGURE 6.1
KEY
4
7
10
12
16
17
18
23
24
26
27
29
30
31
33
34
35
36
37
38
39
0 2 4 6 8 10Kilometres
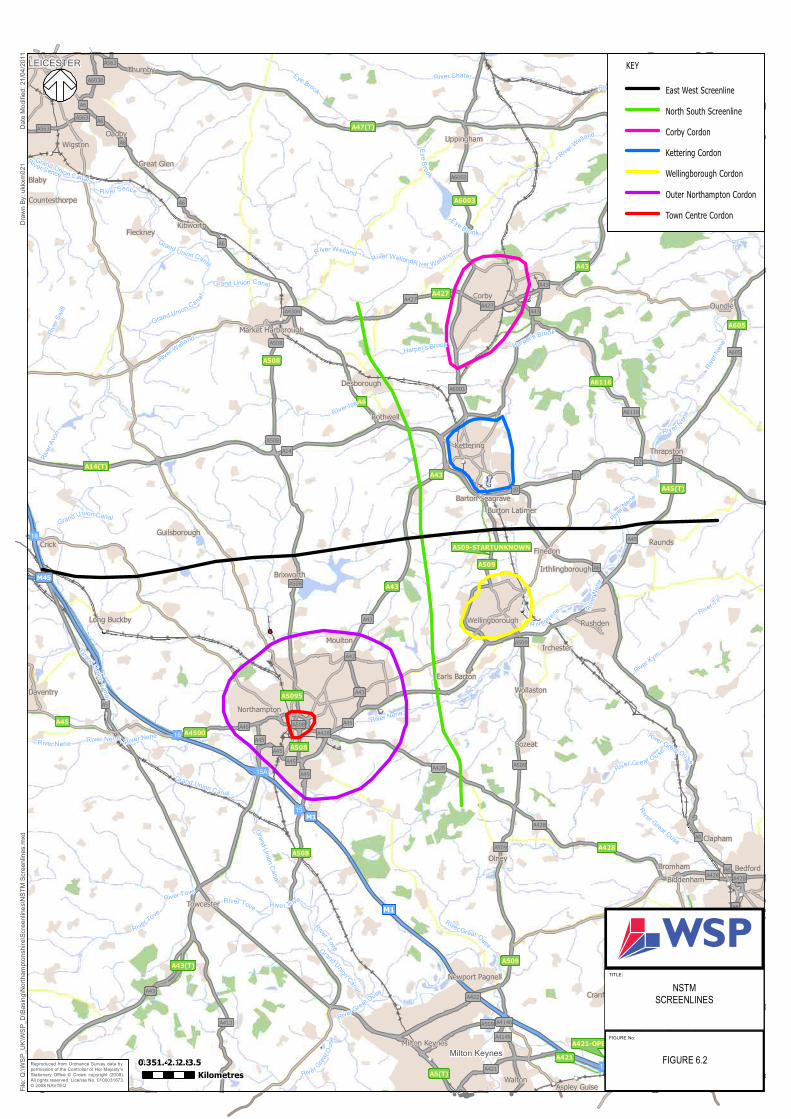
NSTM - LMVR Highway Model Version 1.0 49
7 Conclusions
7.1 MODEL DEVELOPMENT
7.1.1 A Highway Model has been developed using SATURN as a foundation for forecasting the effects and impacts of the proposed developments in and around Northamptonshire. The use of the SATURN modelling software with its detailed junction delay capabilities enables the accurate representation of the road network/junctions. This allows as accurate representation of the flows, speeds and delays on the road network as possible. This information has been used within the Demand Model and the Public Transport Model to allow their calibration and validation. The modelled modes included in the Highway assignment model include:
Lights Matrix (Car/LGV)
Heavy Matrix (HGV)
7.1.2 The models have been developed in accordance with DMRB and WebTAG standards and represent a weekday AM Peak (08:00-09:00) and PM Peak (17:00-18:00) hour in a typical neutral month in 2008.
7.1.3 Data collected for the Highway Model development includes comprehensive ATC surveys to allow the factoring of RSI trip distribution patterns to a 2008 Base Year, 2001 census data for journey to work trip distribution patterns for all modes, Manual Classified Link Counts and journey time surveys. This data has been used to develop the 2008 Base Year Highway Model in accordance with DMRB and WebTAG standards.
7.1.4 The Demand Model uses travel costs taken from the Highway Model, which is deemed more accurate in assignment than the Demand Model. These costs are used to generate the demand model matrices, elements of which are passed into the Highway Model. In turn new costs are calculated and so on until model validation is achieved.
7.2 MODEL VALIDATION / CALIBRATION
7.2.1 The robustness of the observed Highway Model as a forecasting tool has been measured by comparing link flows and journey times against observations. The comparisons were benchmarked against DMRB calibration and validation standards and have been found to be a suitable base for supplying information for the Demand Model.
7.3 MODEL APPROVAL & FIT FOR PURPOSE
The technical information presented in this report demonstrates that the NSTM is an accurate representation of base year traffic flows. As such, it is considered fit for the purposes of forecasting and scheme assessment.

50 NSTM - LMVR Highway Model Version 1.0
APPENDIX NO 1: Zone Correspondence Table
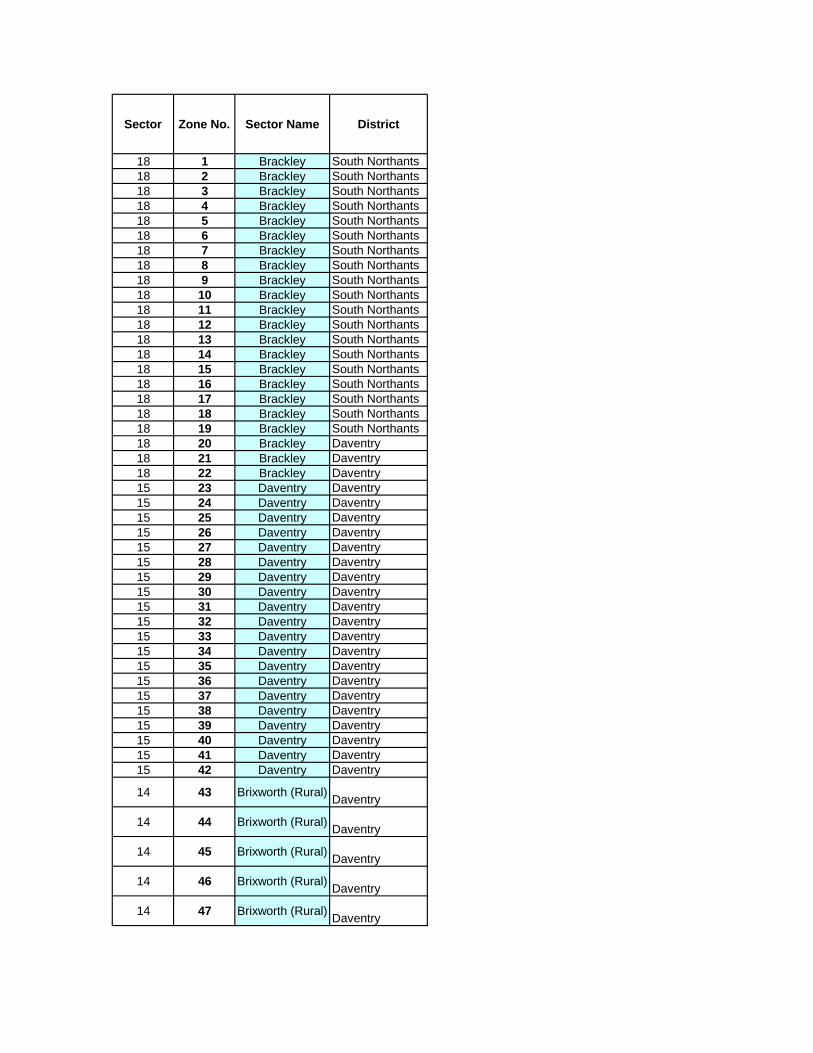
Sector Zone No. Sector Name District
18 1 Brackley South Northants18 2 Brackley South Northants18 3 Brackley South Northants18 4 Brackley South Northants18 5 Brackley South Northants18 6 Brackley South Northants18 7 Brackley South Northants18 8 Brackley South Northants18 9 Brackley South Northants18 10 Brackley South Northants18 11 Brackley South Northants18 12 Brackley South Northants18 13 Brackley South Northants18 14 Brackley South Northants18 15 Brackley South Northants18 16 Brackley South Northants18 17 Brackley South Northants18 18 Brackley South Northants18 19 Brackley South Northants18 20 Brackley Daventry18 21 Brackley Daventry18 22 Brackley Daventry15 23 Daventry Daventry15 24 Daventry Daventry15 25 Daventry Daventry15 26 Daventry Daventry15 27 Daventry Daventry15 28 Daventry Daventry15 29 Daventry Daventry15 30 Daventry Daventry15 31 Daventry Daventry15 32 Daventry Daventry15 33 Daventry Daventry15 34 Daventry Daventry15 35 Daventry Daventry15 36 Daventry Daventry15 37 Daventry Daventry15 38 Daventry Daventry15 39 Daventry Daventry15 40 Daventry Daventry15 41 Daventry Daventry15 42 Daventry Daventry
14 43 Brixworth (Rural) Daventry
14 44 Brixworth (Rural) Daventry
14 45 Brixworth (Rural) Daventry
14 46 Brixworth (Rural) Daventry
14 47 Brixworth (Rural) Daventry
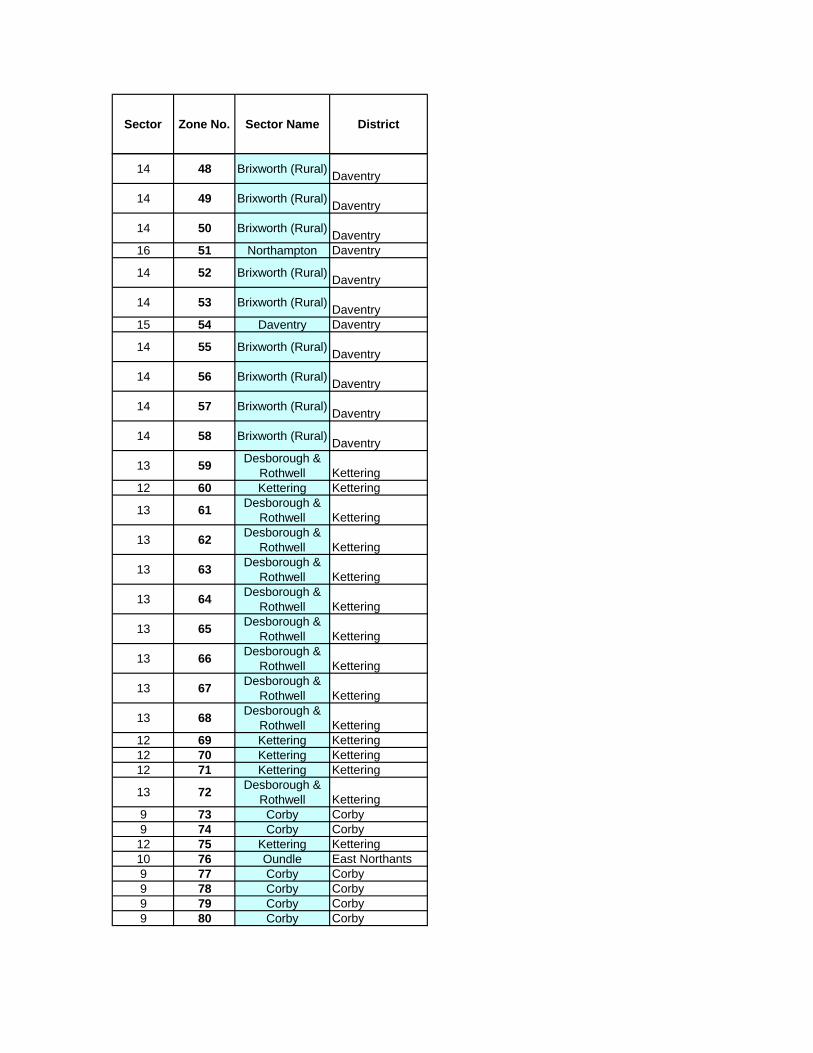
Sector Zone No. Sector Name District
14 48 Brixworth (Rural) Daventry
14 49 Brixworth (Rural) Daventry
14 50 Brixworth (Rural) Daventry16 51 Northampton Daventry
14 52 Brixworth (Rural) Daventry
14 53 Brixworth (Rural) Daventry15 54 Daventry Daventry
14 55 Brixworth (Rural) Daventry
14 56 Brixworth (Rural) Daventry
14 57 Brixworth (Rural) Daventry
14 58 Brixworth (Rural) Daventry
13 59 Desborough & Rothwell Kettering
12 60 Kettering Kettering
13 61 Desborough & Rothwell Kettering
13 62 Desborough & Rothwell Kettering
13 63 Desborough & Rothwell Kettering
13 64 Desborough & Rothwell Kettering
13 65 Desborough & Rothwell Kettering
13 66 Desborough & Rothwell Kettering
13 67 Desborough & Rothwell Kettering
13 68 Desborough & Rothwell Kettering
12 69 Kettering Kettering12 70 Kettering Kettering12 71 Kettering Kettering
13 72 Desborough & Rothwell Kettering
9 73 Corby Corby9 74 Corby Corby12 75 Kettering Kettering10 76 Oundle East Northants9 77 Corby Corby9 78 Corby Corby9 79 Corby Corby9 80 Corby Corby
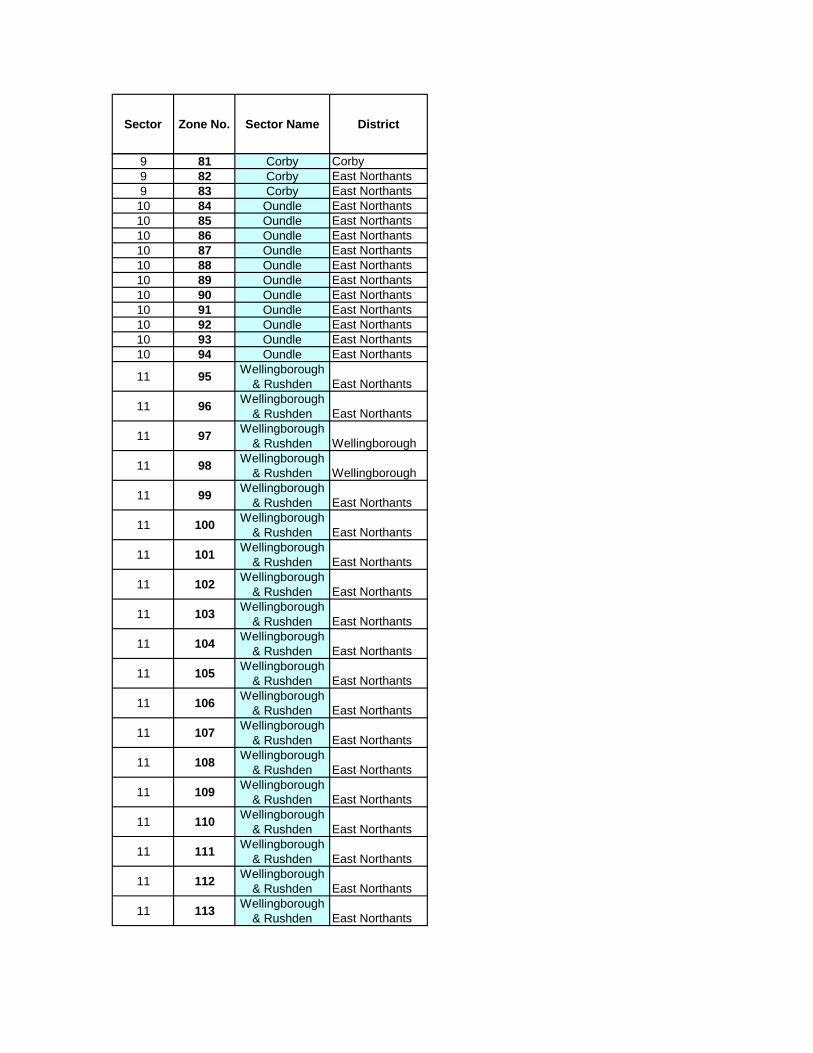
Sector Zone No. Sector Name District
9 81 Corby Corby9 82 Corby East Northants9 83 Corby East Northants10 84 Oundle East Northants10 85 Oundle East Northants10 86 Oundle East Northants10 87 Oundle East Northants10 88 Oundle East Northants10 89 Oundle East Northants10 90 Oundle East Northants10 91 Oundle East Northants10 92 Oundle East Northants10 93 Oundle East Northants10 94 Oundle East Northants
11 95 Wellingborough & Rushden East Northants
11 96 Wellingborough & Rushden East Northants
11 97 Wellingborough & Rushden Wellingborough
11 98 Wellingborough & Rushden Wellingborough
11 99 Wellingborough & Rushden East Northants
11 100 Wellingborough & Rushden East Northants
11 101 Wellingborough & Rushden East Northants
11 102 Wellingborough & Rushden East Northants
11 103 Wellingborough & Rushden East Northants
11 104 Wellingborough & Rushden East Northants
11 105 Wellingborough & Rushden East Northants
11 106 Wellingborough & Rushden East Northants
11 107 Wellingborough & Rushden East Northants
11 108 Wellingborough & Rushden East Northants
11 109 Wellingborough & Rushden East Northants
11 110 Wellingborough & Rushden East Northants
11 111 Wellingborough & Rushden East Northants
11 112 Wellingborough & Rushden East Northants
11 113 Wellingborough & Rushden East Northants
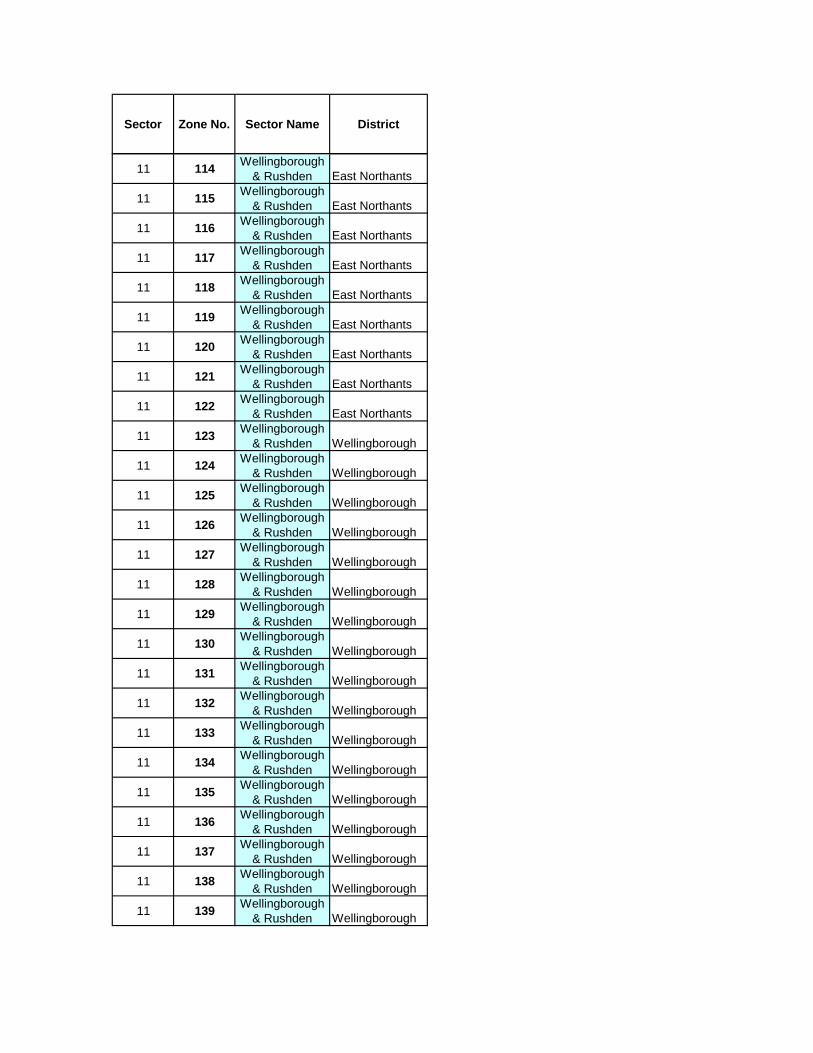
Sector Zone No. Sector Name District
11 114 Wellingborough & Rushden East Northants
11 115 Wellingborough & Rushden East Northants
11 116 Wellingborough & Rushden East Northants
11 117 Wellingborough & Rushden East Northants
11 118 Wellingborough & Rushden East Northants
11 119 Wellingborough & Rushden East Northants
11 120 Wellingborough & Rushden East Northants
11 121 Wellingborough & Rushden East Northants
11 122 Wellingborough & Rushden East Northants
11 123 Wellingborough & Rushden Wellingborough
11 124 Wellingborough & Rushden Wellingborough
11 125 Wellingborough & Rushden Wellingborough
11 126 Wellingborough & Rushden Wellingborough
11 127 Wellingborough & Rushden Wellingborough
11 128 Wellingborough & Rushden Wellingborough
11 129 Wellingborough & Rushden Wellingborough
11 130 Wellingborough & Rushden Wellingborough
11 131 Wellingborough & Rushden Wellingborough
11 132 Wellingborough & Rushden Wellingborough
11 133 Wellingborough & Rushden Wellingborough
11 134 Wellingborough & Rushden Wellingborough
11 135 Wellingborough & Rushden Wellingborough
11 136 Wellingborough & Rushden Wellingborough
11 137 Wellingborough & Rushden Wellingborough
11 138 Wellingborough & Rushden Wellingborough
11 139 Wellingborough & Rushden Wellingborough
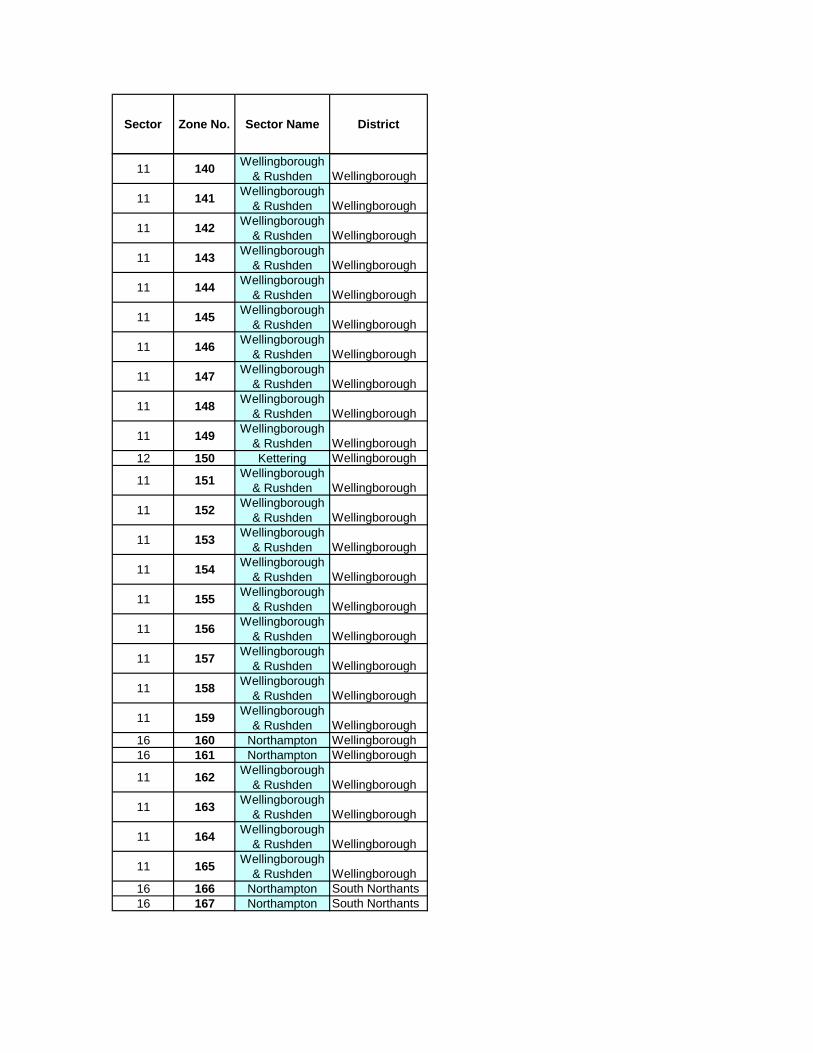
Sector Zone No. Sector Name District
11 140 Wellingborough & Rushden Wellingborough
11 141 Wellingborough & Rushden Wellingborough
11 142 Wellingborough & Rushden Wellingborough
11 143 Wellingborough & Rushden Wellingborough
11 144 Wellingborough & Rushden Wellingborough
11 145 Wellingborough & Rushden Wellingborough
11 146 Wellingborough & Rushden Wellingborough
11 147 Wellingborough & Rushden Wellingborough
11 148 Wellingborough & Rushden Wellingborough
11 149 Wellingborough & Rushden Wellingborough
12 150 Kettering Wellingborough
11 151 Wellingborough & Rushden Wellingborough
11 152 Wellingborough & Rushden Wellingborough
11 153 Wellingborough & Rushden Wellingborough
11 154 Wellingborough & Rushden Wellingborough
11 155 Wellingborough & Rushden Wellingborough
11 156 Wellingborough & Rushden Wellingborough
11 157 Wellingborough & Rushden Wellingborough
11 158 Wellingborough & Rushden Wellingborough
11 159 Wellingborough & Rushden Wellingborough
16 160 Northampton Wellingborough16 161 Northampton Wellingborough
11 162 Wellingborough & Rushden Wellingborough
11 163 Wellingborough & Rushden Wellingborough
11 164 Wellingborough & Rushden Wellingborough
11 165 Wellingborough & Rushden Wellingborough
16 166 Northampton South Northants16 167 Northampton South Northants
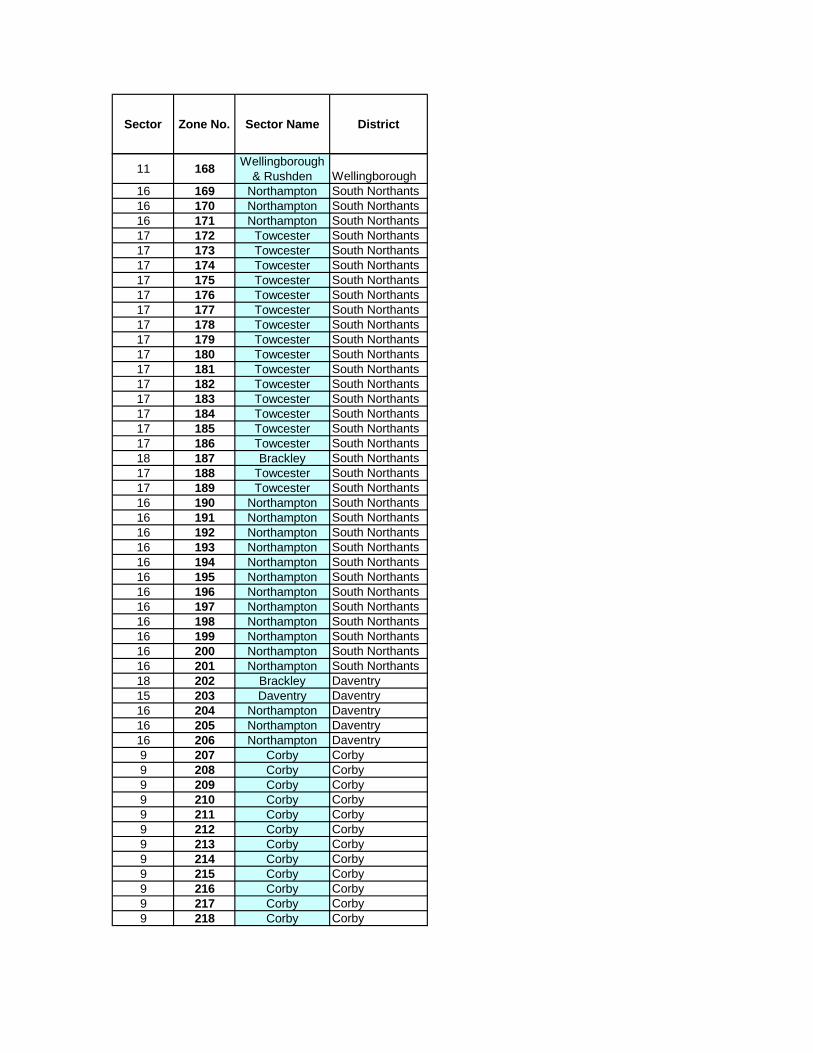
Sector Zone No. Sector Name District
11 168 Wellingborough & Rushden Wellingborough
16 169 Northampton South Northants16 170 Northampton South Northants16 171 Northampton South Northants17 172 Towcester South Northants17 173 Towcester South Northants17 174 Towcester South Northants17 175 Towcester South Northants17 176 Towcester South Northants17 177 Towcester South Northants17 178 Towcester South Northants17 179 Towcester South Northants17 180 Towcester South Northants17 181 Towcester South Northants17 182 Towcester South Northants17 183 Towcester South Northants17 184 Towcester South Northants17 185 Towcester South Northants17 186 Towcester South Northants18 187 Brackley South Northants17 188 Towcester South Northants17 189 Towcester South Northants16 190 Northampton South Northants16 191 Northampton South Northants16 192 Northampton South Northants16 193 Northampton South Northants16 194 Northampton South Northants16 195 Northampton South Northants16 196 Northampton South Northants16 197 Northampton South Northants16 198 Northampton South Northants16 199 Northampton South Northants16 200 Northampton South Northants16 201 Northampton South Northants18 202 Brackley Daventry15 203 Daventry Daventry16 204 Northampton Daventry16 205 Northampton Daventry16 206 Northampton Daventry9 207 Corby Corby9 208 Corby Corby9 209 Corby Corby9 210 Corby Corby9 211 Corby Corby9 212 Corby Corby9 213 Corby Corby9 214 Corby Corby9 215 Corby Corby9 216 Corby Corby9 217 Corby Corby9 218 Corby Corby
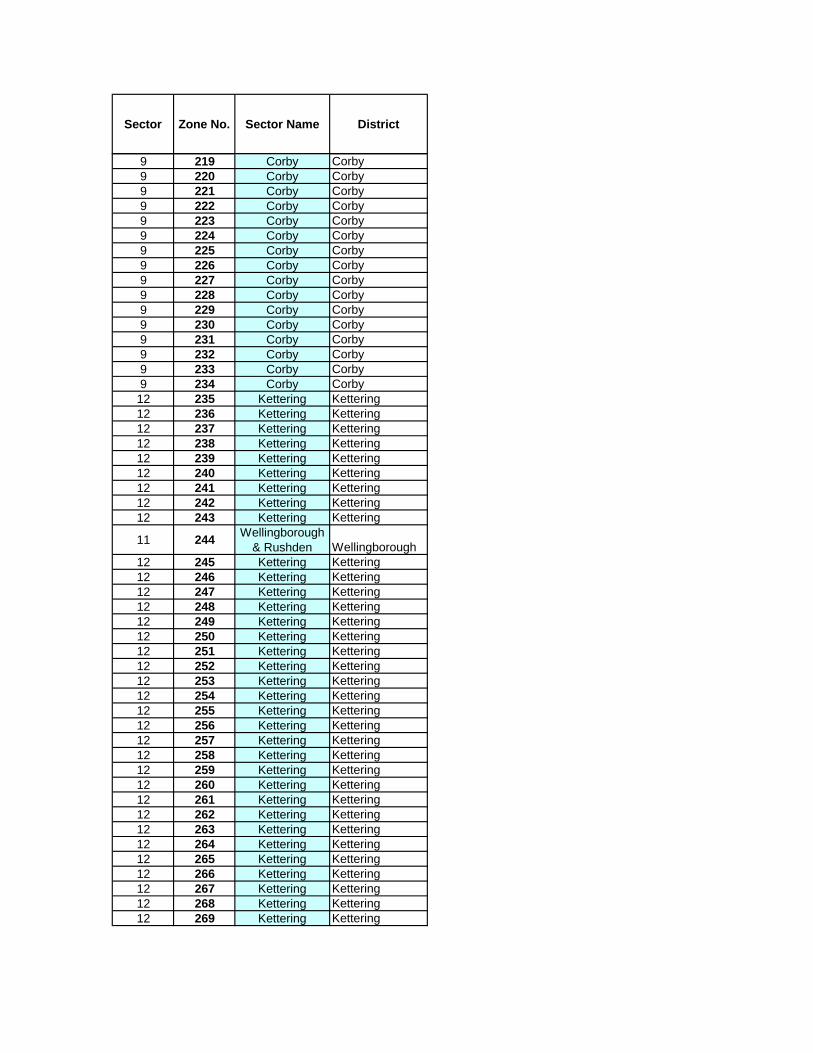
Sector Zone No. Sector Name District
9 219 Corby Corby9 220 Corby Corby9 221 Corby Corby9 222 Corby Corby9 223 Corby Corby9 224 Corby Corby9 225 Corby Corby9 226 Corby Corby9 227 Corby Corby9 228 Corby Corby9 229 Corby Corby9 230 Corby Corby9 231 Corby Corby9 232 Corby Corby9 233 Corby Corby9 234 Corby Corby12 235 Kettering Kettering12 236 Kettering Kettering12 237 Kettering Kettering12 238 Kettering Kettering12 239 Kettering Kettering12 240 Kettering Kettering12 241 Kettering Kettering12 242 Kettering Kettering12 243 Kettering Kettering
11 244 Wellingborough & Rushden Wellingborough
12 245 Kettering Kettering12 246 Kettering Kettering12 247 Kettering Kettering12 248 Kettering Kettering12 249 Kettering Kettering12 250 Kettering Kettering12 251 Kettering Kettering12 252 Kettering Kettering12 253 Kettering Kettering12 254 Kettering Kettering12 255 Kettering Kettering12 256 Kettering Kettering12 257 Kettering Kettering12 258 Kettering Kettering12 259 Kettering Kettering12 260 Kettering Kettering12 261 Kettering Kettering12 262 Kettering Kettering12 263 Kettering Kettering12 264 Kettering Kettering12 265 Kettering Kettering12 266 Kettering Kettering12 267 Kettering Kettering12 268 Kettering Kettering12 269 Kettering Kettering
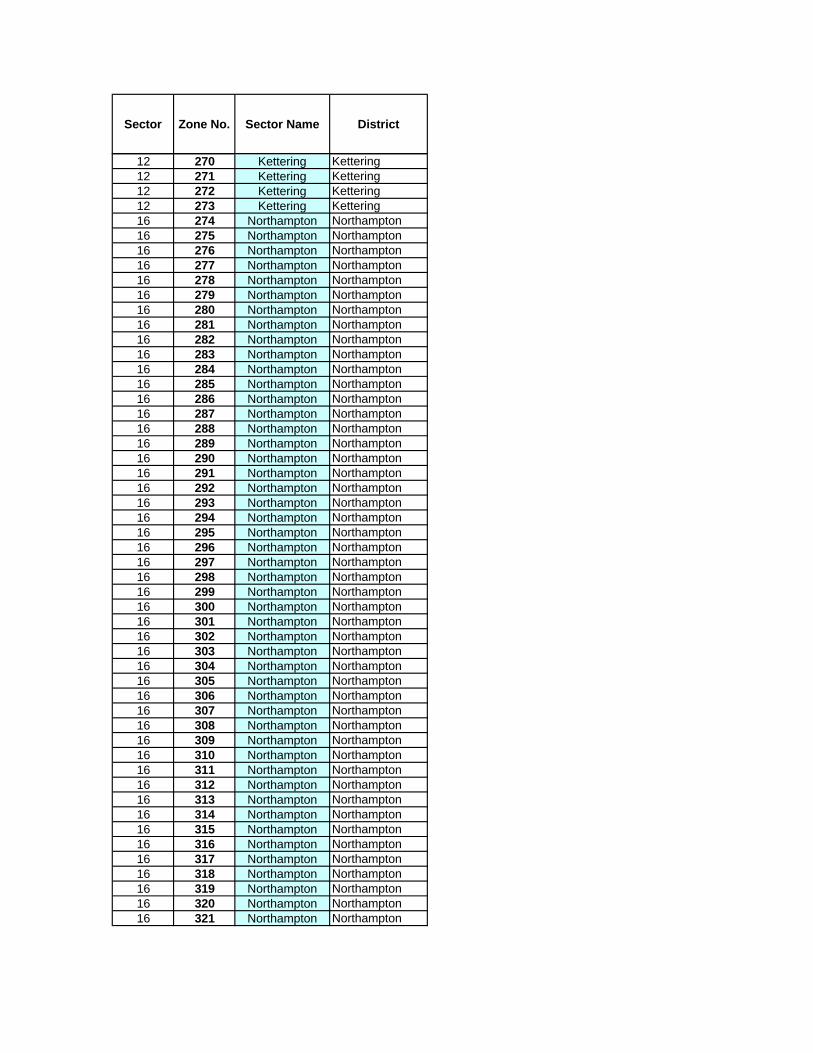
Sector Zone No. Sector Name District
12 270 Kettering Kettering12 271 Kettering Kettering12 272 Kettering Kettering12 273 Kettering Kettering16 274 Northampton Northampton16 275 Northampton Northampton16 276 Northampton Northampton16 277 Northampton Northampton16 278 Northampton Northampton16 279 Northampton Northampton16 280 Northampton Northampton16 281 Northampton Northampton16 282 Northampton Northampton16 283 Northampton Northampton16 284 Northampton Northampton16 285 Northampton Northampton16 286 Northampton Northampton16 287 Northampton Northampton16 288 Northampton Northampton16 289 Northampton Northampton16 290 Northampton Northampton16 291 Northampton Northampton16 292 Northampton Northampton16 293 Northampton Northampton16 294 Northampton Northampton16 295 Northampton Northampton16 296 Northampton Northampton16 297 Northampton Northampton16 298 Northampton Northampton16 299 Northampton Northampton16 300 Northampton Northampton16 301 Northampton Northampton16 302 Northampton Northampton16 303 Northampton Northampton16 304 Northampton Northampton16 305 Northampton Northampton16 306 Northampton Northampton16 307 Northampton Northampton16 308 Northampton Northampton16 309 Northampton Northampton16 310 Northampton Northampton16 311 Northampton Northampton16 312 Northampton Northampton16 313 Northampton Northampton16 314 Northampton Northampton16 315 Northampton Northampton16 316 Northampton Northampton16 317 Northampton Northampton16 318 Northampton Northampton16 319 Northampton Northampton16 320 Northampton Northampton16 321 Northampton Northampton
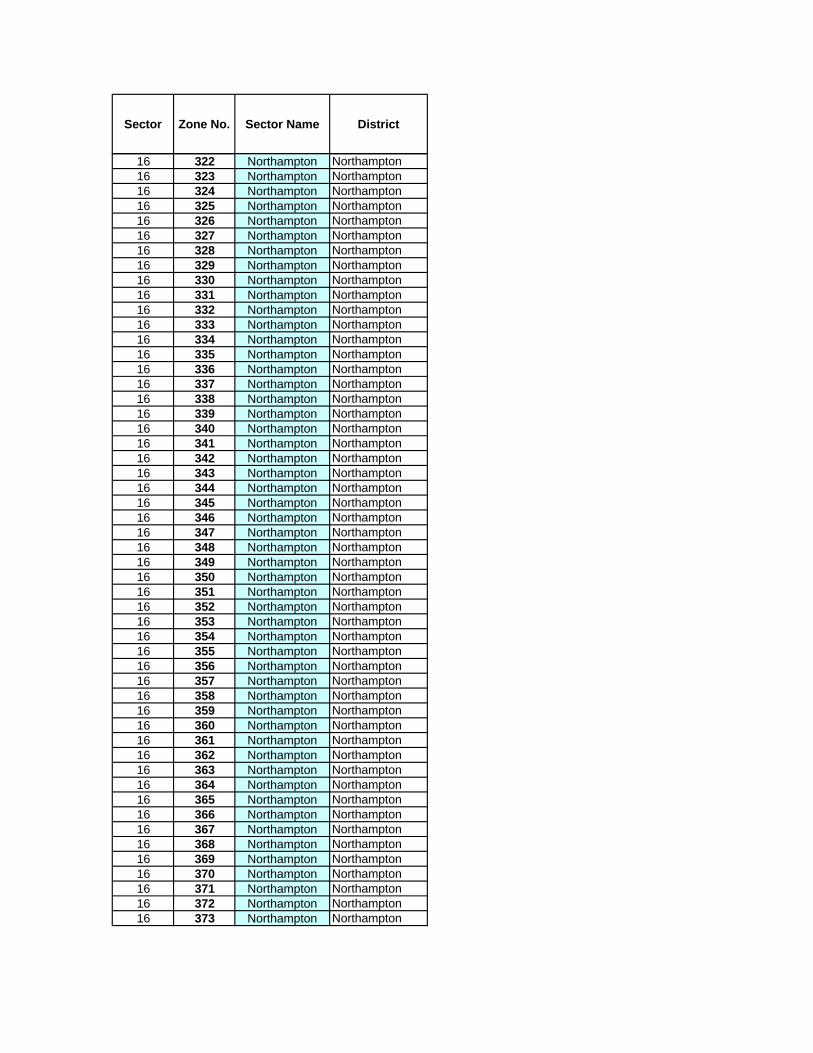
Sector Zone No. Sector Name District
16 322 Northampton Northampton16 323 Northampton Northampton16 324 Northampton Northampton16 325 Northampton Northampton16 326 Northampton Northampton16 327 Northampton Northampton16 328 Northampton Northampton16 329 Northampton Northampton16 330 Northampton Northampton16 331 Northampton Northampton16 332 Northampton Northampton16 333 Northampton Northampton16 334 Northampton Northampton16 335 Northampton Northampton16 336 Northampton Northampton16 337 Northampton Northampton16 338 Northampton Northampton16 339 Northampton Northampton16 340 Northampton Northampton16 341 Northampton Northampton16 342 Northampton Northampton16 343 Northampton Northampton16 344 Northampton Northampton16 345 Northampton Northampton16 346 Northampton Northampton16 347 Northampton Northampton16 348 Northampton Northampton16 349 Northampton Northampton16 350 Northampton Northampton16 351 Northampton Northampton16 352 Northampton Northampton16 353 Northampton Northampton16 354 Northampton Northampton16 355 Northampton Northampton16 356 Northampton Northampton16 357 Northampton Northampton16 358 Northampton Northampton16 359 Northampton Northampton16 360 Northampton Northampton16 361 Northampton Northampton16 362 Northampton Northampton16 363 Northampton Northampton16 364 Northampton Northampton16 365 Northampton Northampton16 366 Northampton Northampton16 367 Northampton Northampton16 368 Northampton Northampton16 369 Northampton Northampton16 370 Northampton Northampton16 371 Northampton Northampton16 372 Northampton Northampton16 373 Northampton Northampton
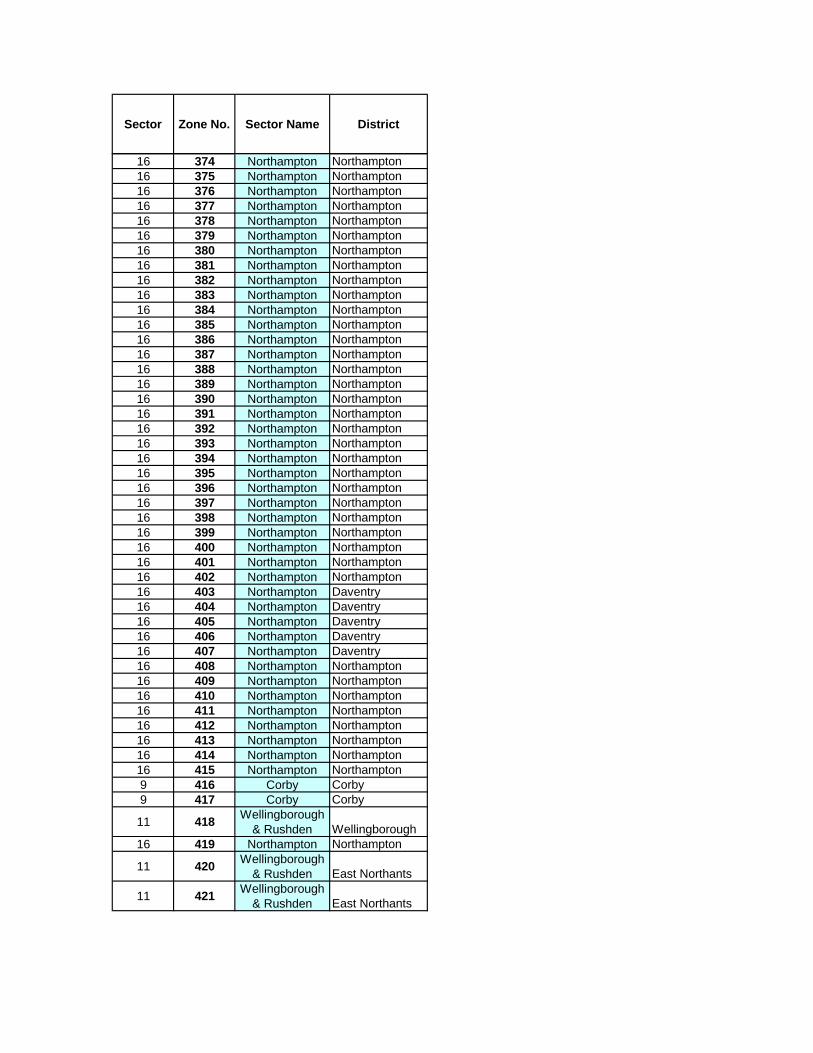
Sector Zone No. Sector Name District
16 374 Northampton Northampton16 375 Northampton Northampton16 376 Northampton Northampton16 377 Northampton Northampton16 378 Northampton Northampton16 379 Northampton Northampton16 380 Northampton Northampton16 381 Northampton Northampton16 382 Northampton Northampton16 383 Northampton Northampton16 384 Northampton Northampton16 385 Northampton Northampton16 386 Northampton Northampton16 387 Northampton Northampton16 388 Northampton Northampton16 389 Northampton Northampton16 390 Northampton Northampton16 391 Northampton Northampton16 392 Northampton Northampton16 393 Northampton Northampton16 394 Northampton Northampton16 395 Northampton Northampton16 396 Northampton Northampton16 397 Northampton Northampton16 398 Northampton Northampton16 399 Northampton Northampton16 400 Northampton Northampton16 401 Northampton Northampton16 402 Northampton Northampton16 403 Northampton Daventry16 404 Northampton Daventry16 405 Northampton Daventry16 406 Northampton Daventry16 407 Northampton Daventry16 408 Northampton Northampton16 409 Northampton Northampton16 410 Northampton Northampton16 411 Northampton Northampton16 412 Northampton Northampton16 413 Northampton Northampton16 414 Northampton Northampton16 415 Northampton Northampton9 416 Corby Corby9 417 Corby Corby
11 418 Wellingborough & Rushden Wellingborough
16 419 Northampton Northampton
11 420 Wellingborough & Rushden East Northants
11 421 Wellingborough & Rushden East Northants
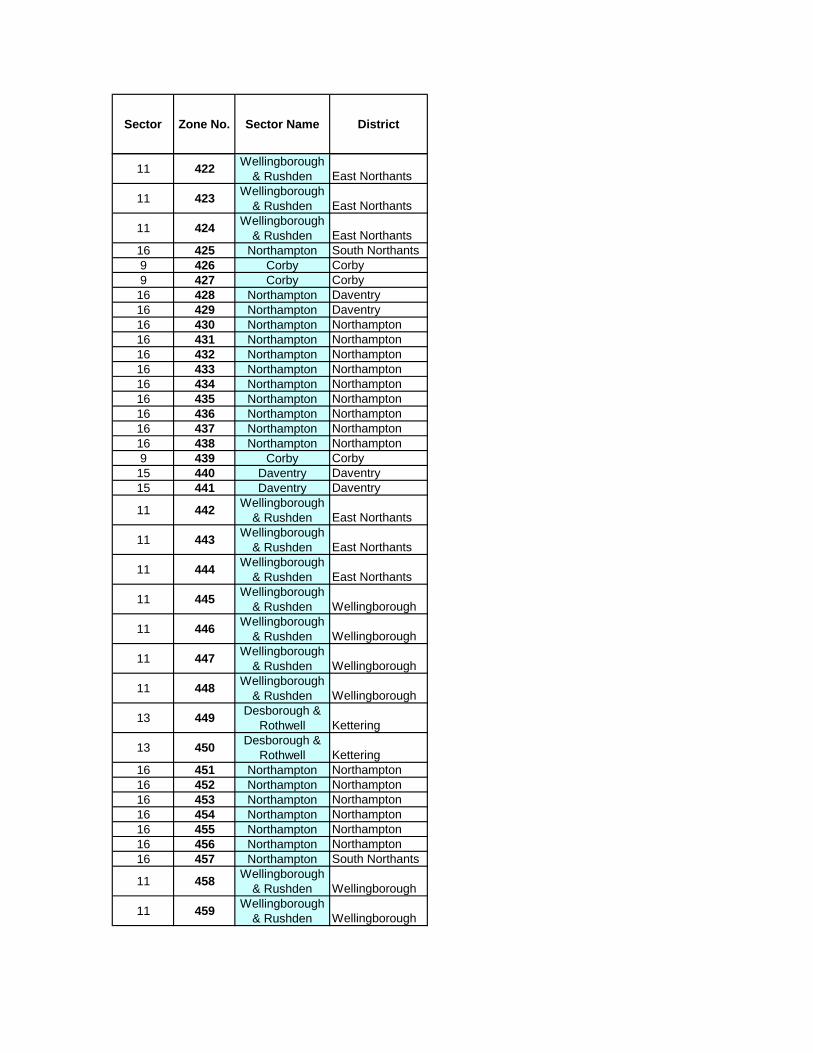
Sector Zone No. Sector Name District
11 422 Wellingborough & Rushden East Northants
11 423 Wellingborough & Rushden East Northants
11 424 Wellingborough & Rushden East Northants
16 425 Northampton South Northants9 426 Corby Corby9 427 Corby Corby16 428 Northampton Daventry16 429 Northampton Daventry16 430 Northampton Northampton16 431 Northampton Northampton16 432 Northampton Northampton16 433 Northampton Northampton16 434 Northampton Northampton16 435 Northampton Northampton16 436 Northampton Northampton16 437 Northampton Northampton16 438 Northampton Northampton9 439 Corby Corby15 440 Daventry Daventry15 441 Daventry Daventry
11 442 Wellingborough & Rushden East Northants
11 443 Wellingborough & Rushden East Northants
11 444 Wellingborough & Rushden East Northants
11 445 Wellingborough & Rushden Wellingborough
11 446 Wellingborough & Rushden Wellingborough
11 447 Wellingborough & Rushden Wellingborough
11 448 Wellingborough & Rushden Wellingborough
13 449 Desborough & Rothwell Kettering
13 450 Desborough & Rothwell Kettering
16 451 Northampton Northampton16 452 Northampton Northampton16 453 Northampton Northampton16 454 Northampton Northampton16 455 Northampton Northampton16 456 Northampton Northampton16 457 Northampton South Northants
11 458 Wellingborough & Rushden Wellingborough
11 459 Wellingborough & Rushden Wellingborough
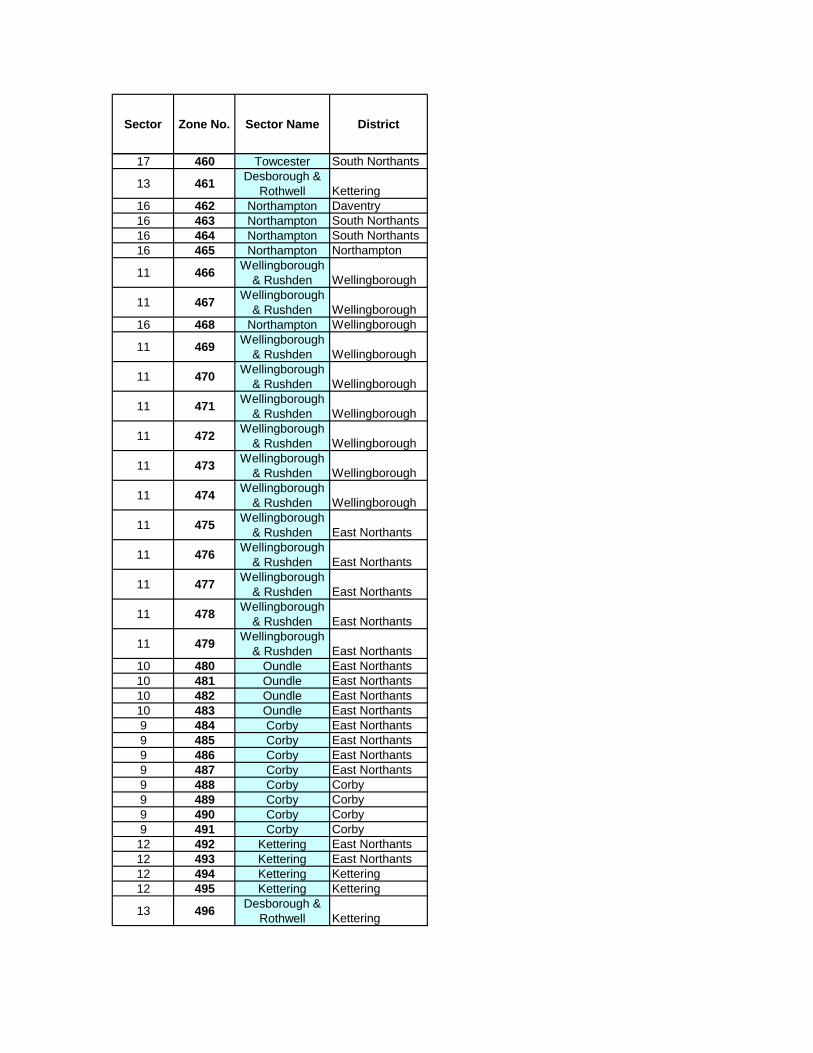
Sector Zone No. Sector Name District
17 460 Towcester South Northants
13 461 Desborough & Rothwell Kettering
16 462 Northampton Daventry16 463 Northampton South Northants16 464 Northampton South Northants16 465 Northampton Northampton
11 466 Wellingborough & Rushden Wellingborough
11 467 Wellingborough & Rushden Wellingborough
16 468 Northampton Wellingborough
11 469 Wellingborough & Rushden Wellingborough
11 470 Wellingborough & Rushden Wellingborough
11 471 Wellingborough & Rushden Wellingborough
11 472 Wellingborough & Rushden Wellingborough
11 473 Wellingborough & Rushden Wellingborough
11 474 Wellingborough & Rushden Wellingborough
11 475 Wellingborough & Rushden East Northants
11 476 Wellingborough & Rushden East Northants
11 477 Wellingborough & Rushden East Northants
11 478 Wellingborough & Rushden East Northants
11 479 Wellingborough & Rushden East Northants
10 480 Oundle East Northants10 481 Oundle East Northants10 482 Oundle East Northants10 483 Oundle East Northants9 484 Corby East Northants9 485 Corby East Northants9 486 Corby East Northants9 487 Corby East Northants9 488 Corby Corby9 489 Corby Corby9 490 Corby Corby9 491 Corby Corby12 492 Kettering East Northants12 493 Kettering East Northants12 494 Kettering Kettering12 495 Kettering Kettering
13 496 Desborough & Rothwell Kettering
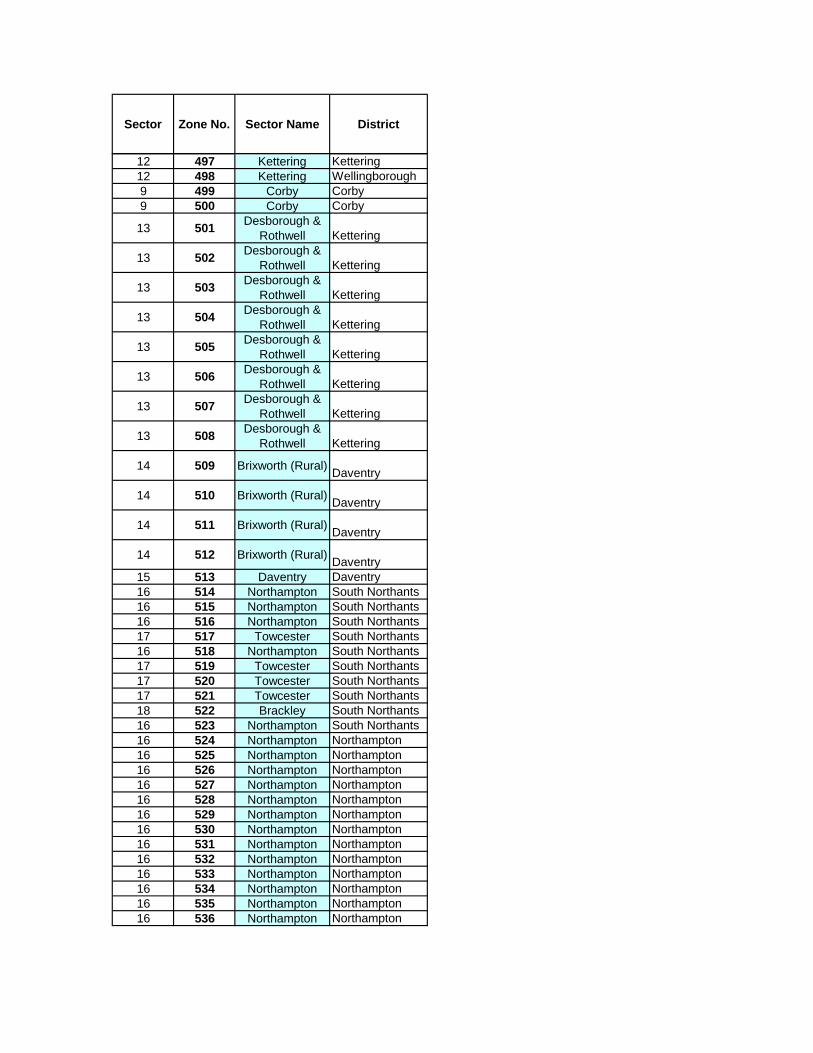
Sector Zone No. Sector Name District
12 497 Kettering Kettering12 498 Kettering Wellingborough9 499 Corby Corby9 500 Corby Corby
13 501 Desborough & Rothwell Kettering
13 502 Desborough & Rothwell Kettering
13 503 Desborough & Rothwell Kettering
13 504 Desborough & Rothwell Kettering
13 505 Desborough & Rothwell Kettering
13 506 Desborough & Rothwell Kettering
13 507 Desborough & Rothwell Kettering
13 508 Desborough & Rothwell Kettering
14 509 Brixworth (Rural) Daventry
14 510 Brixworth (Rural) Daventry
14 511 Brixworth (Rural) Daventry
14 512 Brixworth (Rural) Daventry15 513 Daventry Daventry16 514 Northampton South Northants16 515 Northampton South Northants16 516 Northampton South Northants17 517 Towcester South Northants16 518 Northampton South Northants17 519 Towcester South Northants17 520 Towcester South Northants17 521 Towcester South Northants18 522 Brackley South Northants16 523 Northampton South Northants16 524 Northampton Northampton16 525 Northampton Northampton16 526 Northampton Northampton16 527 Northampton Northampton16 528 Northampton Northampton16 529 Northampton Northampton16 530 Northampton Northampton16 531 Northampton Northampton16 532 Northampton Northampton16 533 Northampton Northampton16 534 Northampton Northampton16 535 Northampton Northampton16 536 Northampton Northampton
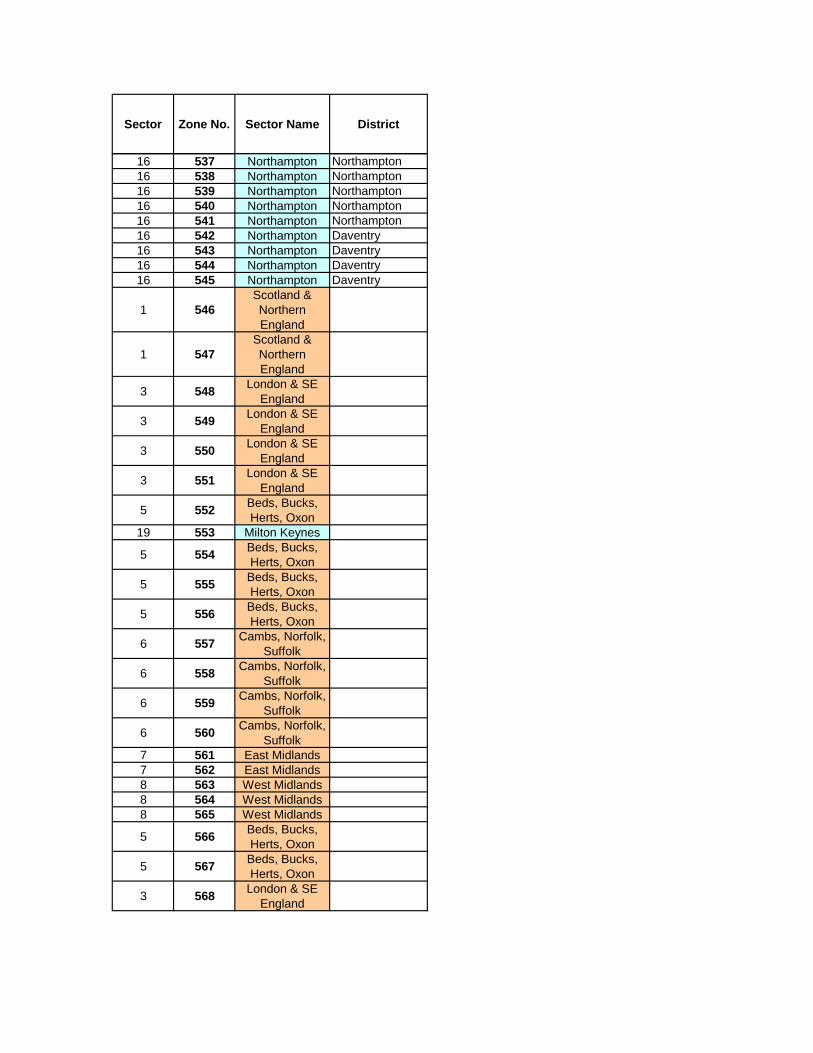
Sector Zone No. Sector Name District
16 537 Northampton Northampton16 538 Northampton Northampton16 539 Northampton Northampton16 540 Northampton Northampton16 541 Northampton Northampton16 542 Northampton Daventry16 543 Northampton Daventry16 544 Northampton Daventry16 545 Northampton Daventry
1 546Scotland & Northern England
1 547Scotland & Northern England
3 548 London & SE England
3 549 London & SE England
3 550 London & SE England
3 551 London & SE England
5 552 Beds, Bucks, Herts, Oxon
19 553 Milton Keynes
5 554 Beds, Bucks, Herts, Oxon
5 555 Beds, Bucks, Herts, Oxon
5 556 Beds, Bucks, Herts, Oxon
6 557 Cambs, Norfolk, Suffolk
6 558 Cambs, Norfolk, Suffolk
6 559 Cambs, Norfolk, Suffolk
6 560 Cambs, Norfolk, Suffolk
7 561 East Midlands7 562 East Midlands8 563 West Midlands8 564 West Midlands8 565 West Midlands
5 566 Beds, Bucks, Herts, Oxon
5 567 Beds, Bucks, Herts, Oxon
3 568 London & SE England
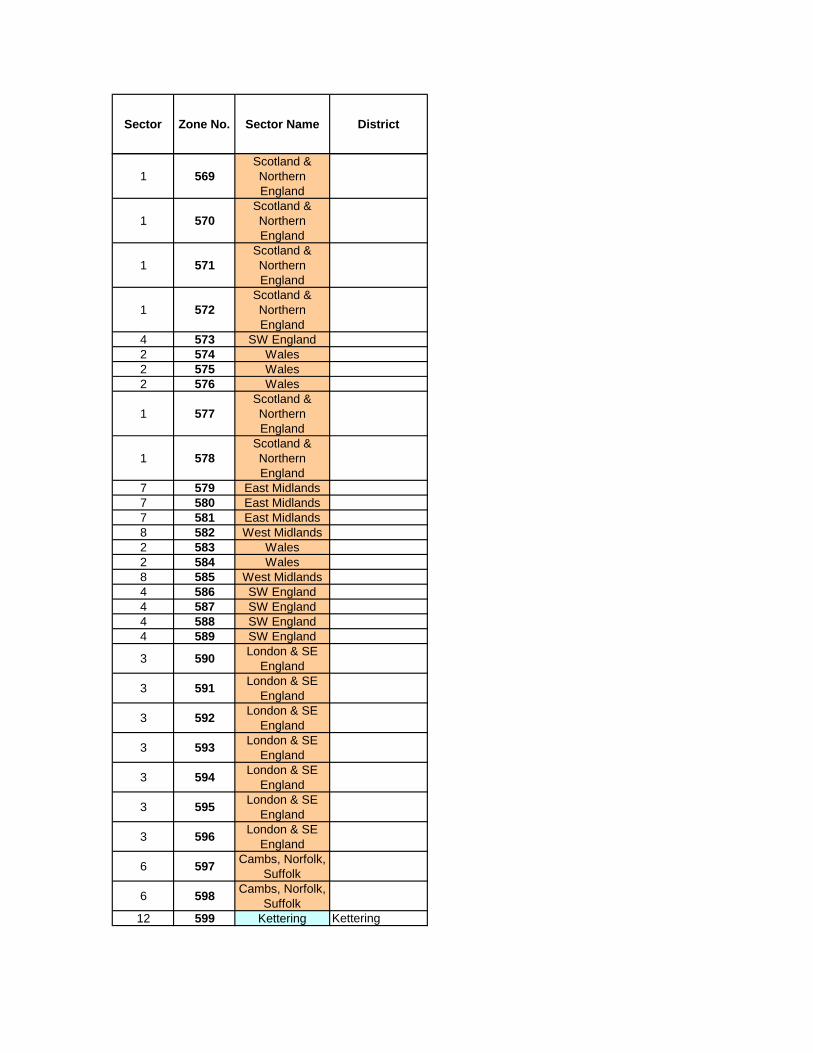
Sector Zone No. Sector Name District
1 569Scotland & Northern England
1 570Scotland & Northern England
1 571Scotland & Northern England
1 572Scotland & Northern England
4 573 SW England2 574 Wales2 575 Wales2 576 Wales
1 577Scotland & Northern England
1 578Scotland & Northern England
7 579 East Midlands7 580 East Midlands7 581 East Midlands8 582 West Midlands2 583 Wales2 584 Wales8 585 West Midlands4 586 SW England4 587 SW England4 588 SW England4 589 SW England
3 590 London & SE England
3 591 London & SE England
3 592 London & SE England
3 593 London & SE England
3 594 London & SE England
3 595 London & SE England
3 596 London & SE England
6 597 Cambs, Norfolk, Suffolk
6 598 Cambs, Norfolk, Suffolk
12 599 Kettering Kettering
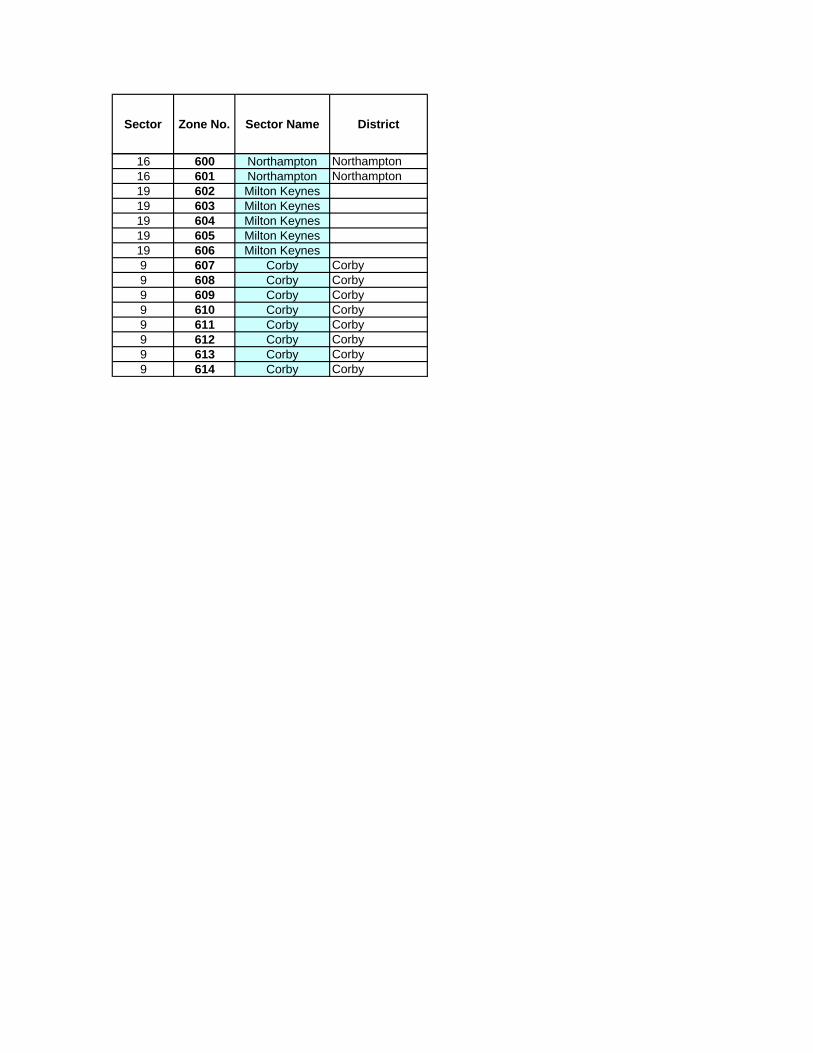
Sector Zone No. Sector Name District
16 600 Northampton Northampton16 601 Northampton Northampton19 602 Milton Keynes19 603 Milton Keynes19 604 Milton Keynes19 605 Milton Keynes19 606 Milton Keynes9 607 Corby Corby9 608 Corby Corby9 609 Corby Corby9 610 Corby Corby9 611 Corby Corby9 612 Corby Corby9 613 Corby Corby9 614 Corby Corby

NSTM - LMVR Highway Model Version 1.0 51
APPENDIX NO 2: Routeing Validation
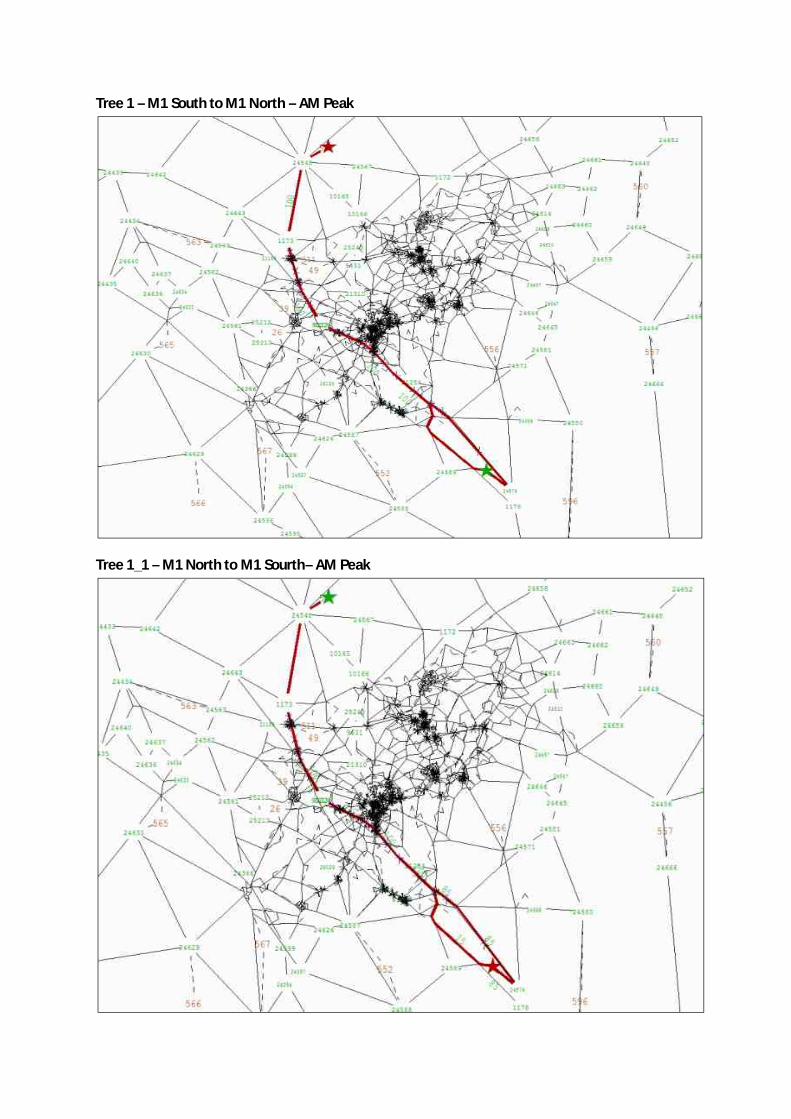
Tree 1 – M1 South to M1 North – AM Peak
Tree 1_1 – M1 North to M1 Sourth– AM Peak
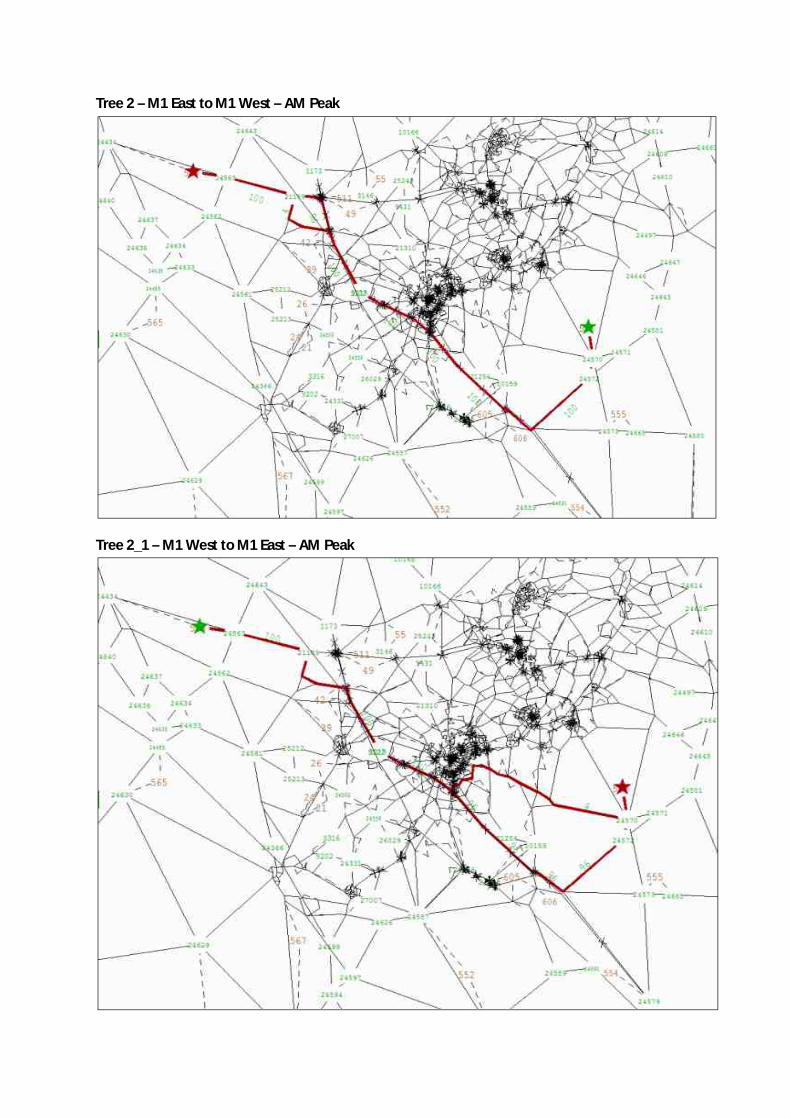
Tree 2 – M1 East to M1 West – AM Peak
Tree 2_1 – M1 West to M1 East – AM Peak
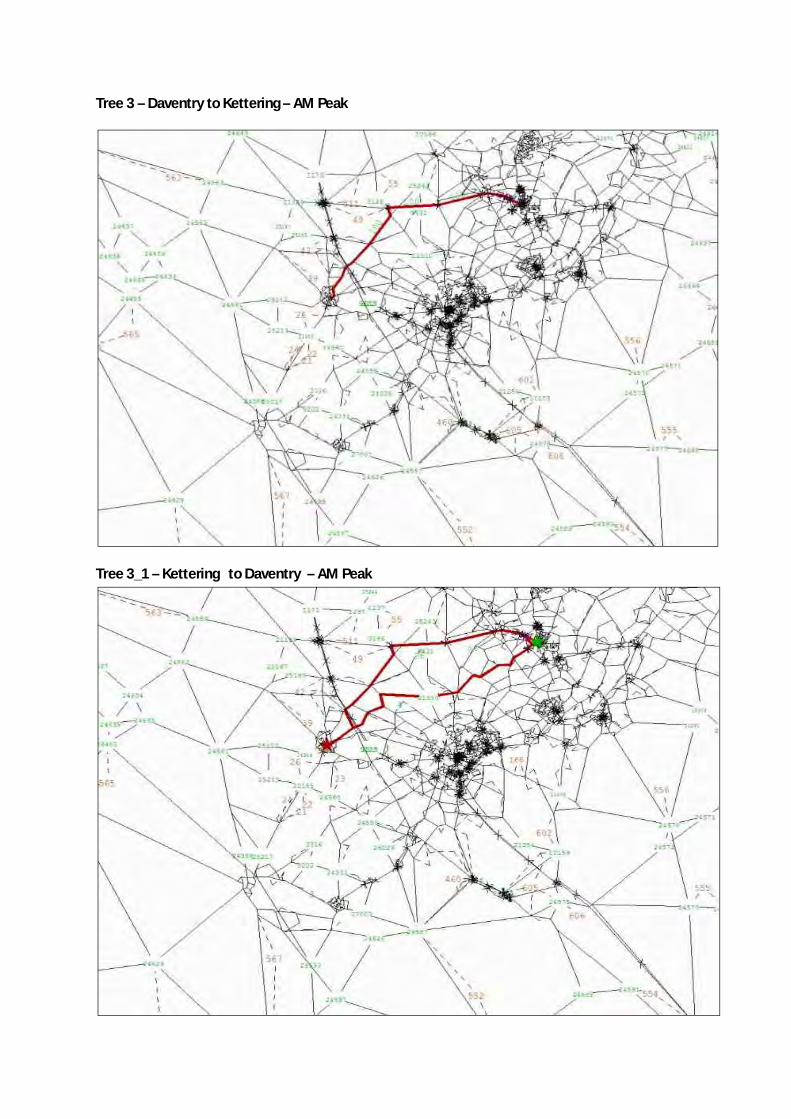
Tree 3 – Daventry to Kettering – AM Peak
Tree 3_1 – Kettering to Daventry – AM Peak
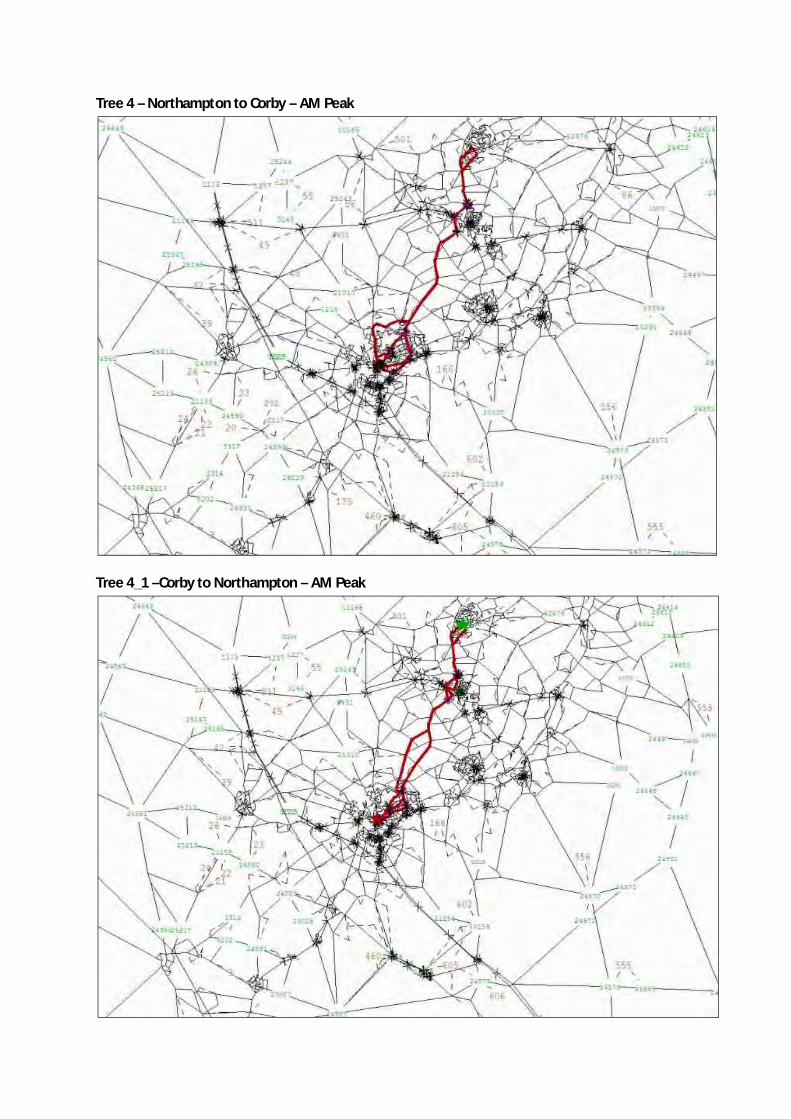
Tree 4 – Northampton to Corby – AM Peak
Tree 4_1 –Corby to Northampton – AM Peak
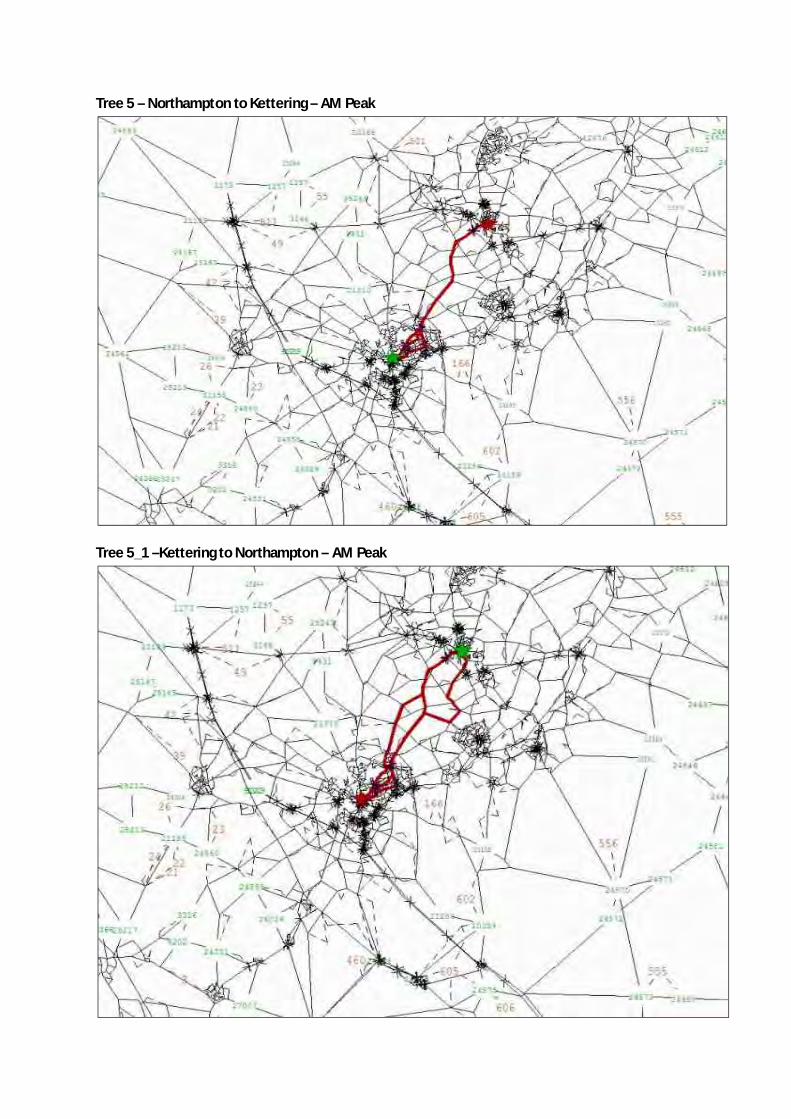
Tree 5 – Northampton to Kettering – AM Peak
Tree 5_1 –Kettering to Northampton – AM Peak
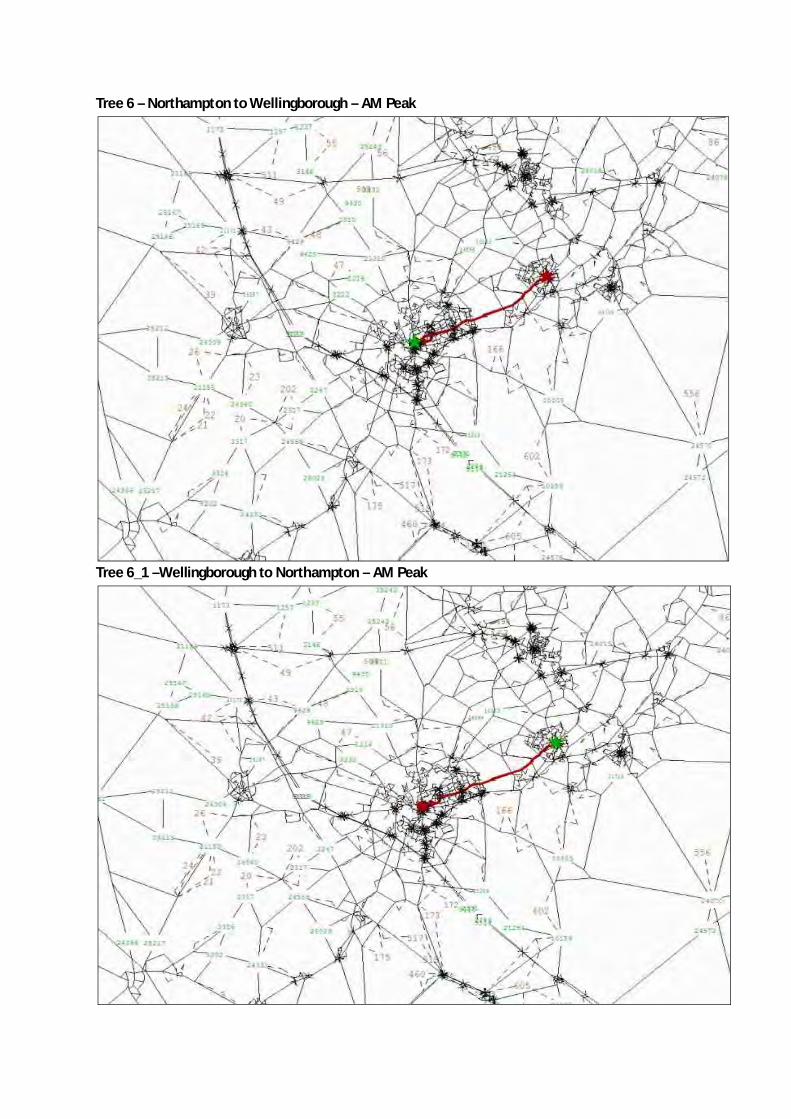
Tree 6 – Northampton to Wellingborough – AM Peak
Tree 6_1 –Wellingborough to Northampton – AM Peak
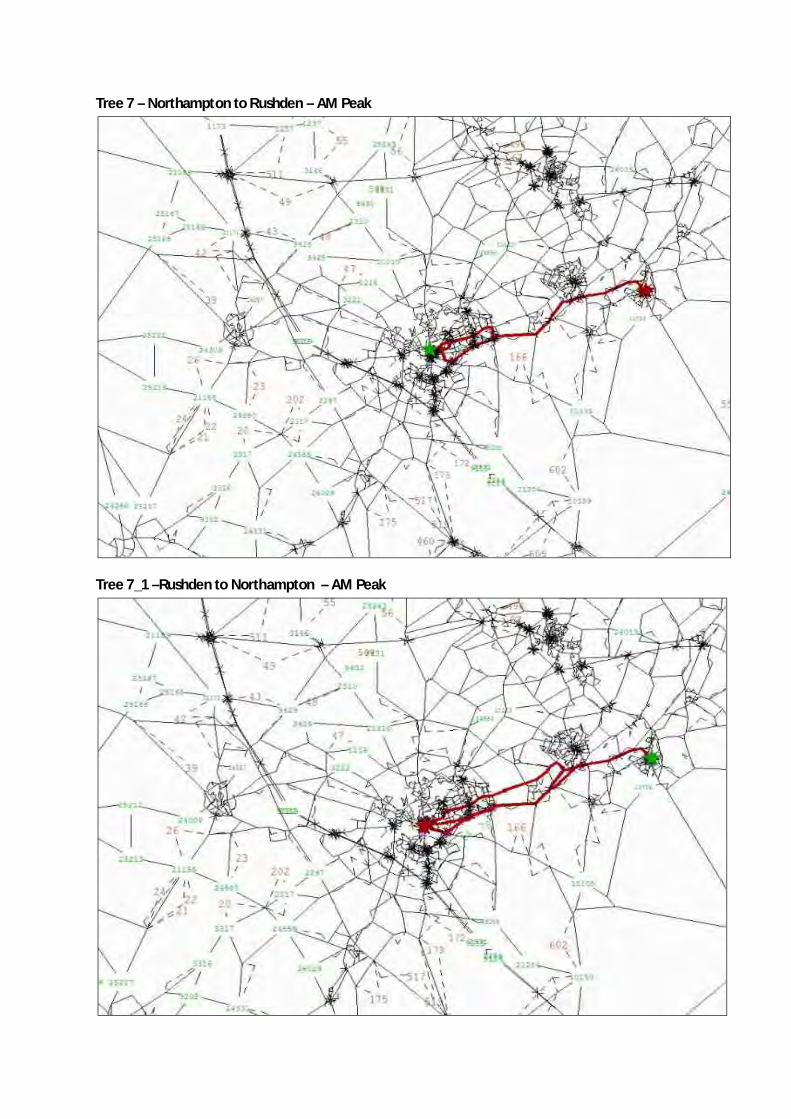
Tree 7 – Northampton to Rushden – AM Peak
Tree 7_1 –Rushden to Northampton – AM Peak
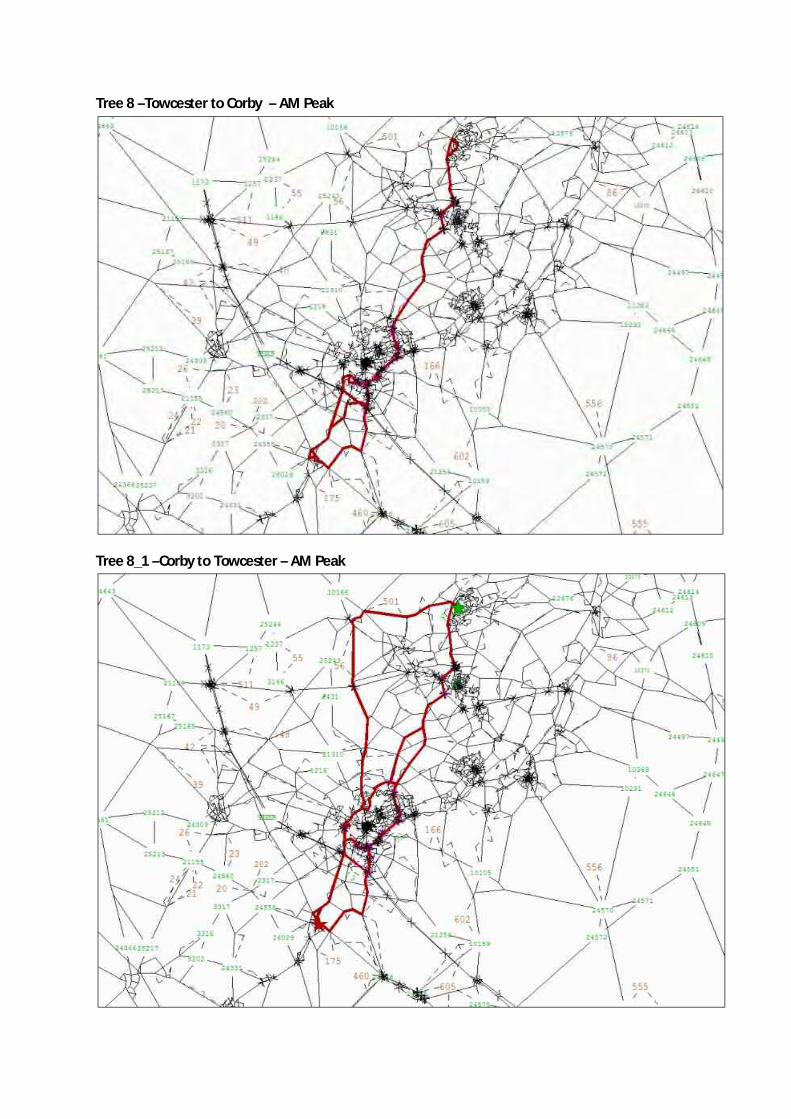
Tree 8 –Towcester to Corby – AM Peak
Tree 8_1 –Corby to Towcester – AM Peak
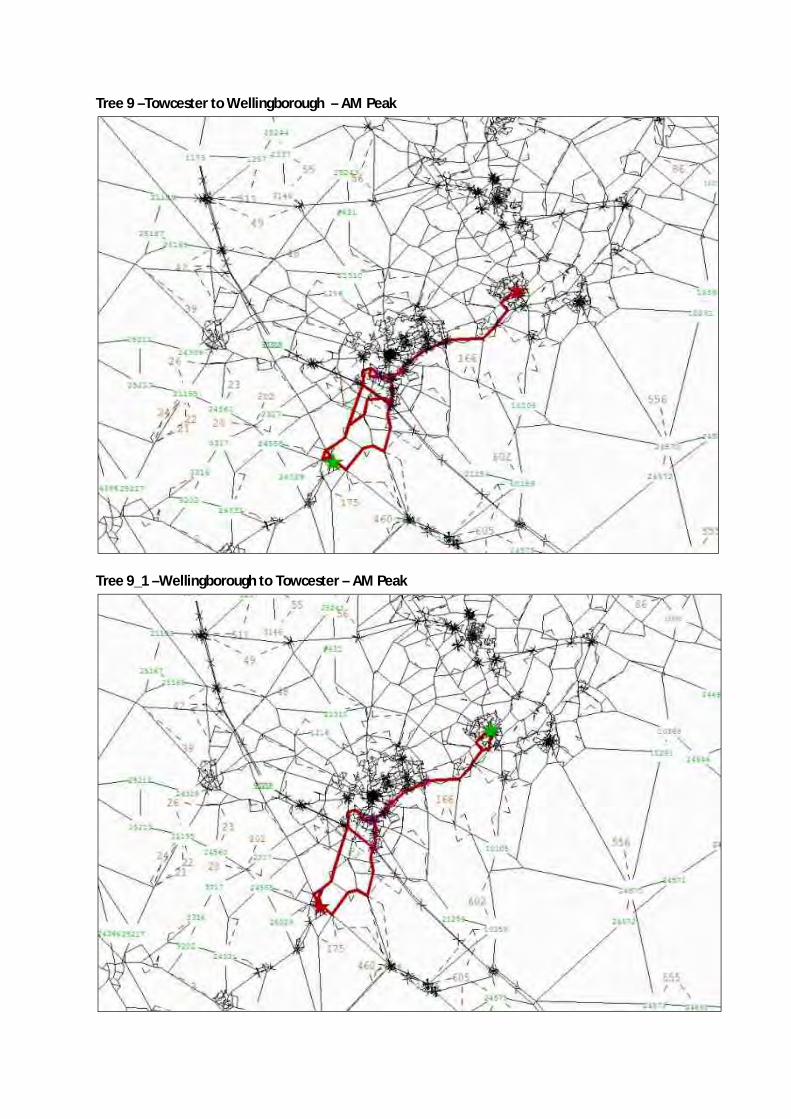
Tree 9 –Towcester to Wellingborough – AM Peak
Tree 9_1 –Wellingborough to Towcester – AM Peak
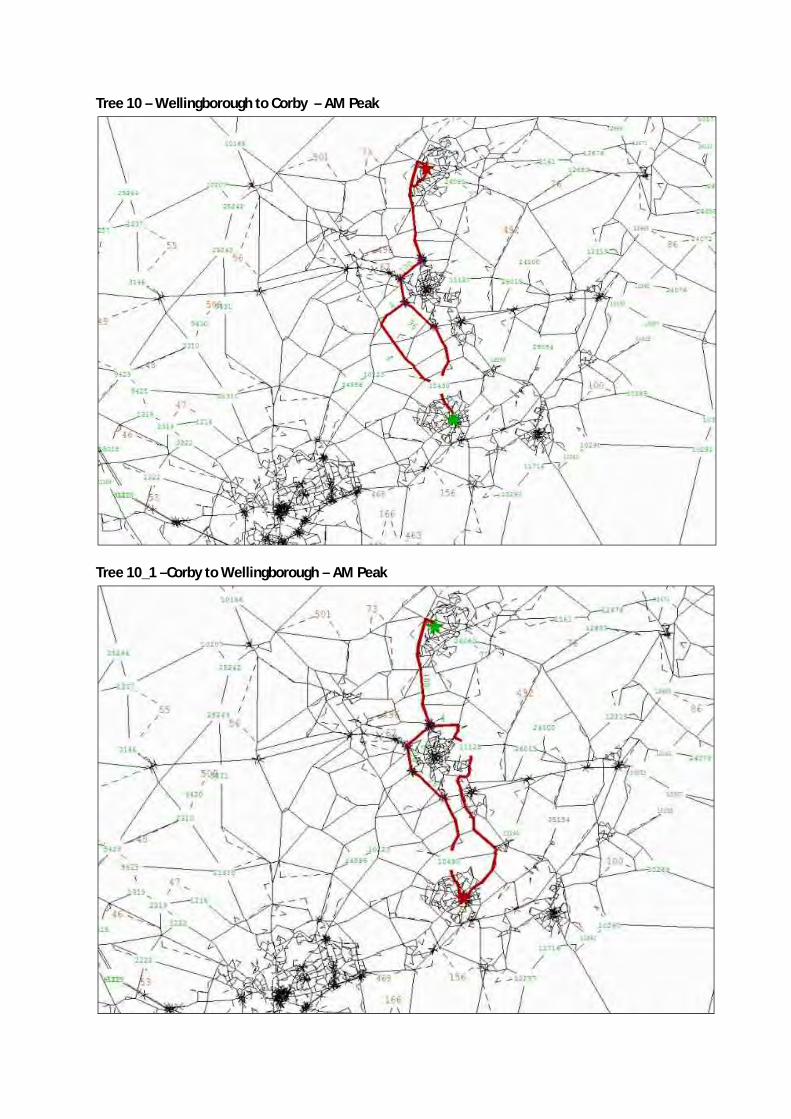
Tree 10 – Wellingborough to Corby – AM Peak
Tree 10_1 –Corby to Wellingborough – AM Peak
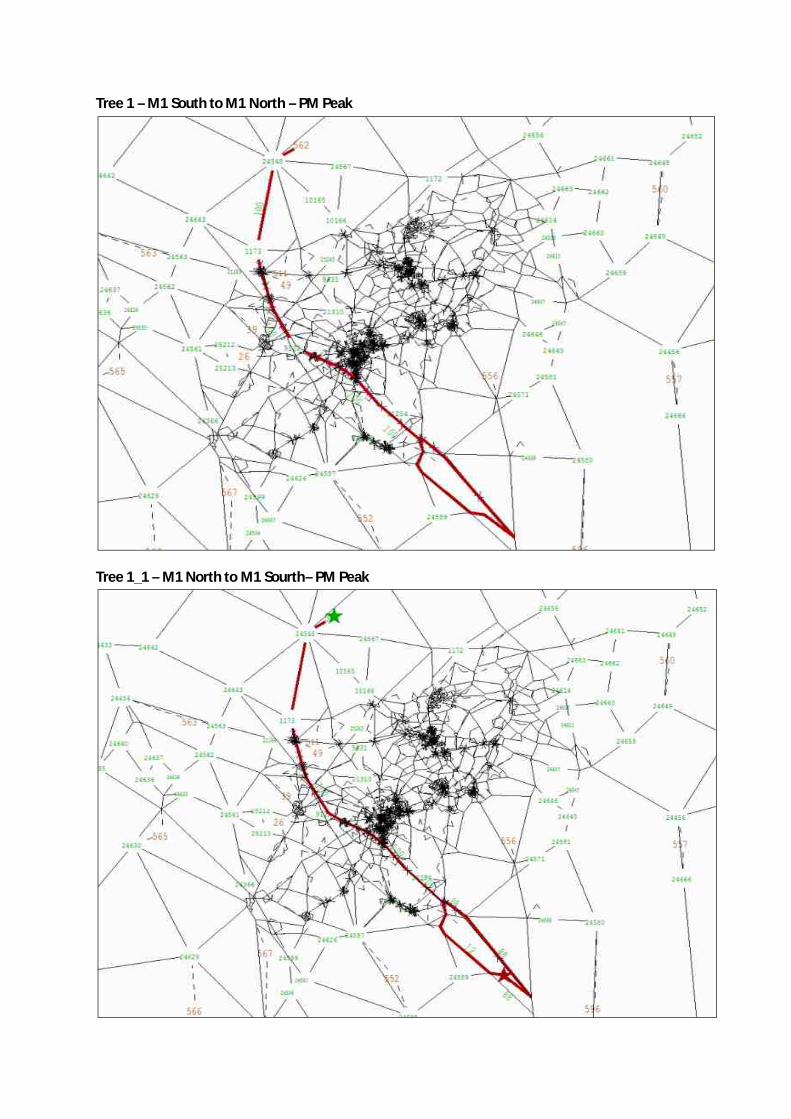
Tree 1 – M1 South to M1 North – PM Peak
Tree 1_1 – M1 North to M1 Sourth– PM Peak
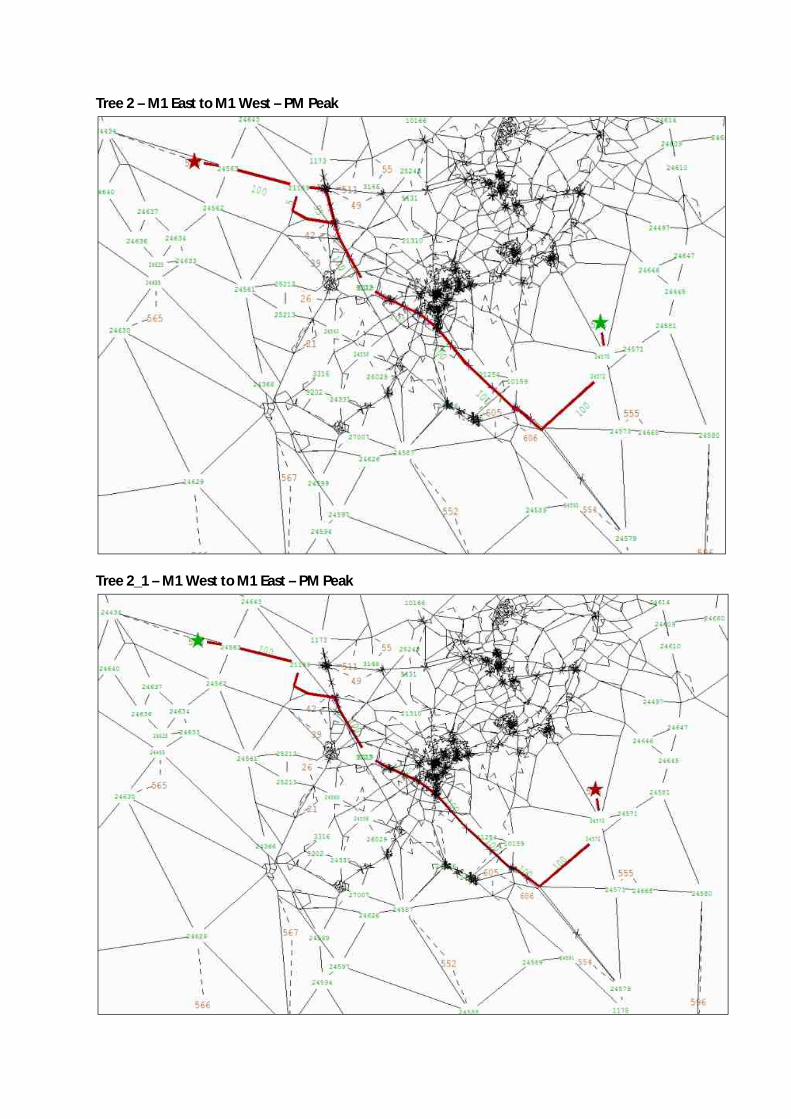
Tree 2 – M1 East to M1 West – PM Peak
Tree 2_1 – M1 West to M1 East – PM Peak
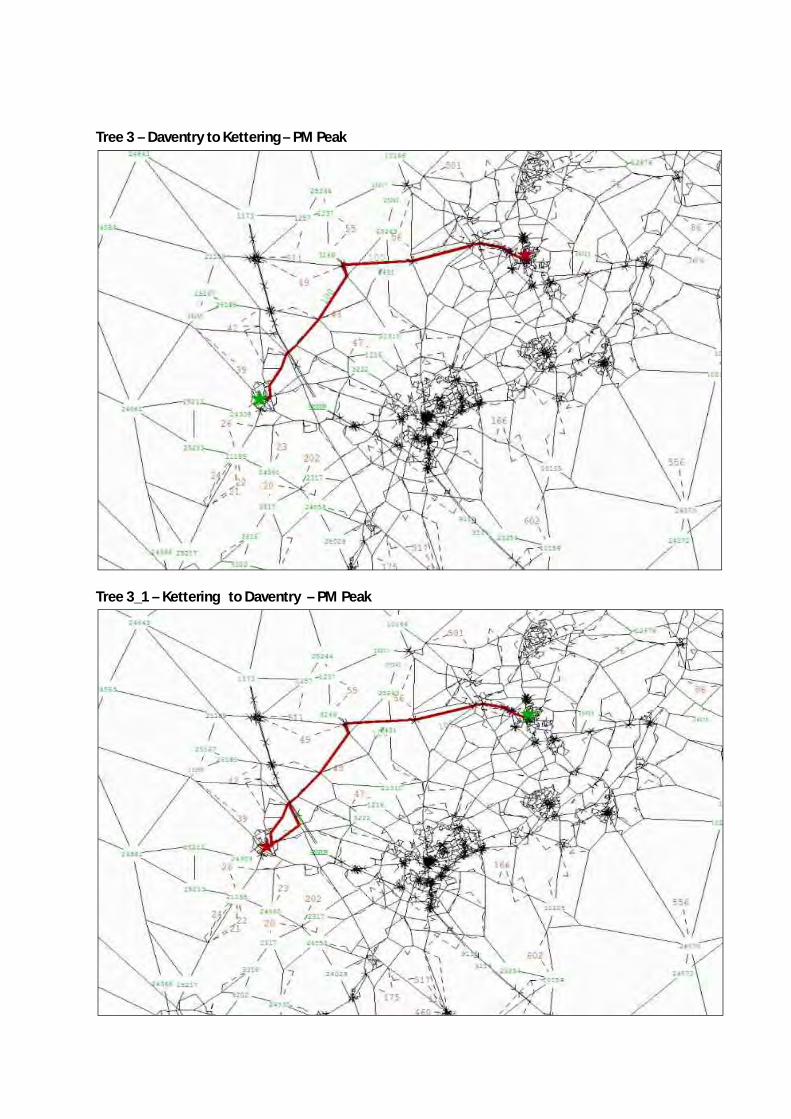
Tree 3 – Daventry to Kettering – PM Peak
Tree 3_1 – Kettering to Daventry – PM Peak
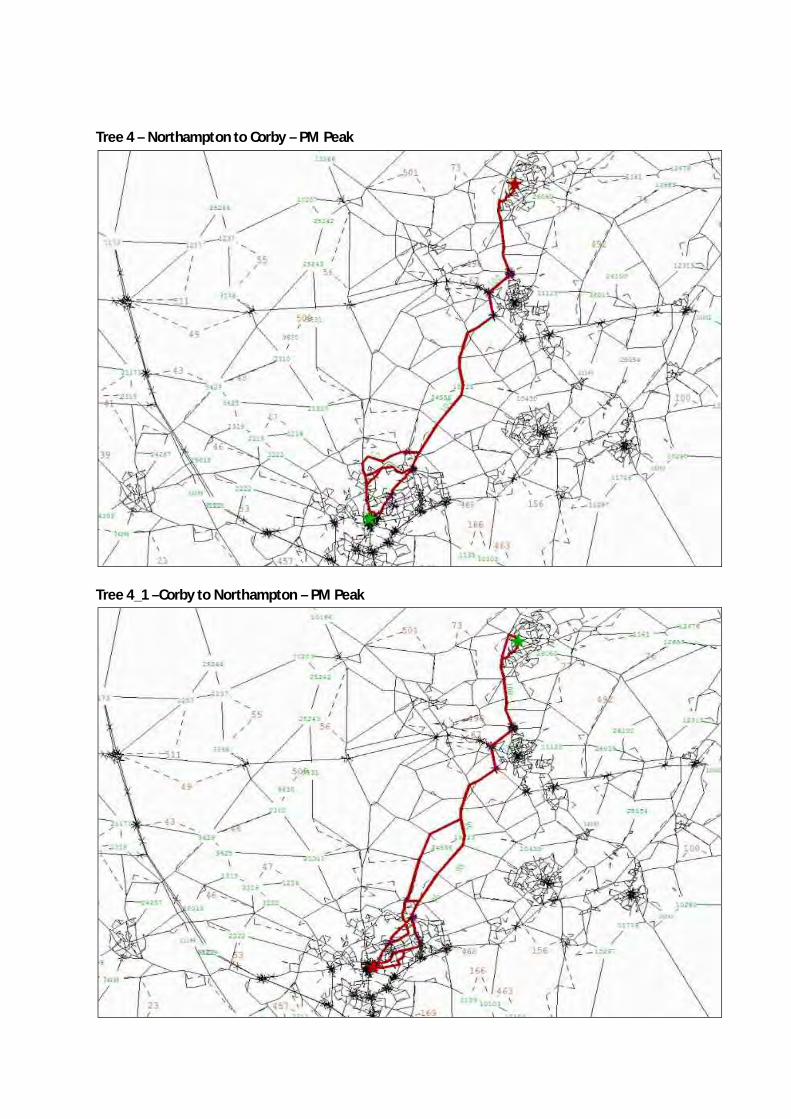
Tree 4 – Northampton to Corby – PM Peak
Tree 4_1 –Corby to Northampton – PM Peak
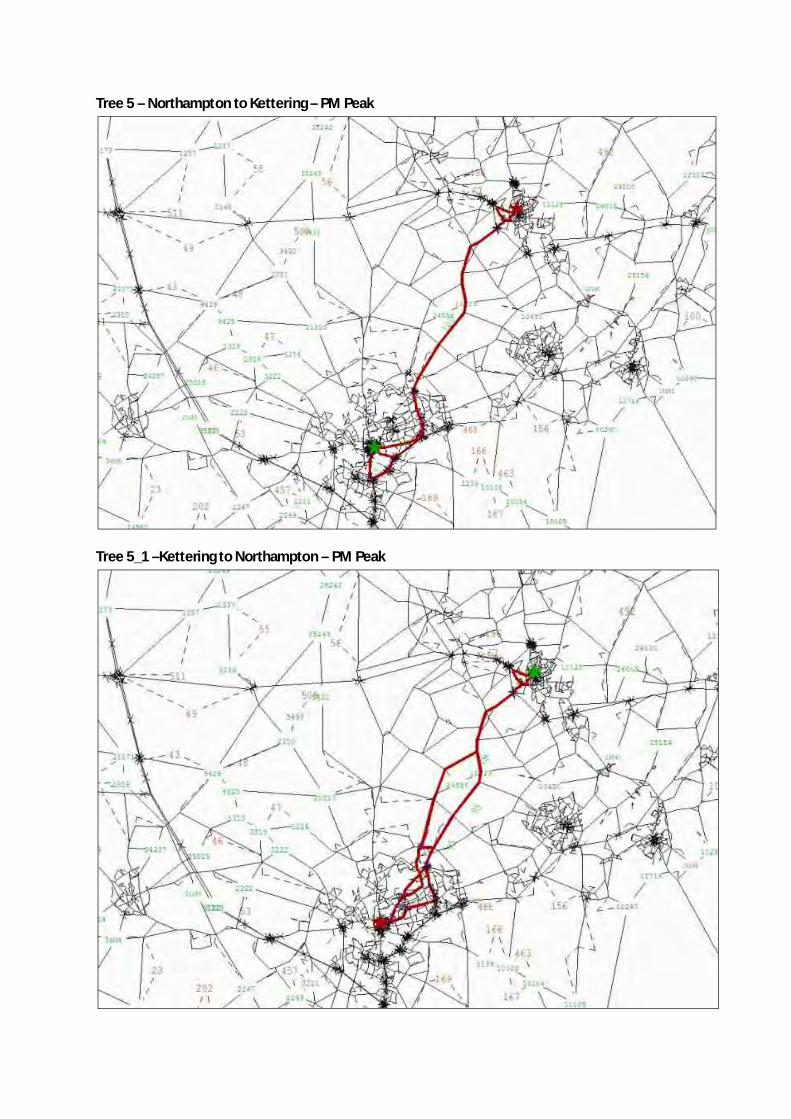
Tree 5 – Northampton to Kettering – PM Peak
Tree 5_1 –Kettering to Northampton – PM Peak
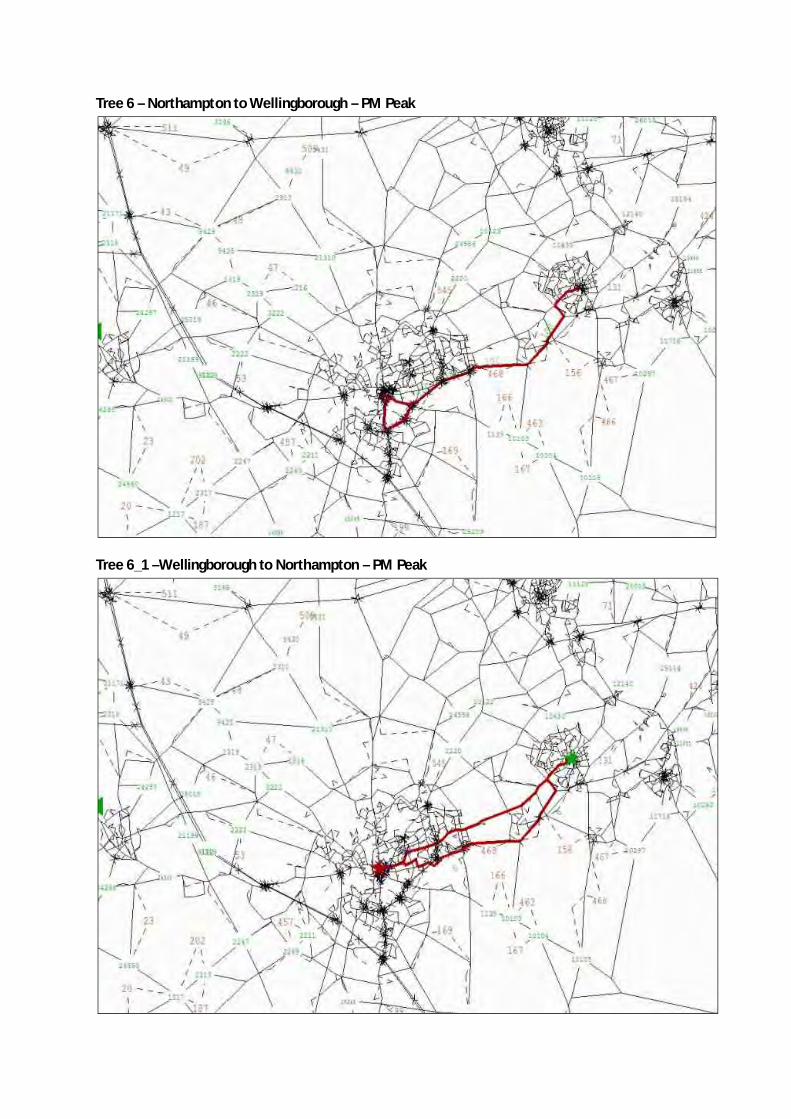
Tree 6 – Northampton to Wellingborough – PM Peak
Tree 6_1 –Wellingborough to Northampton – PM Peak
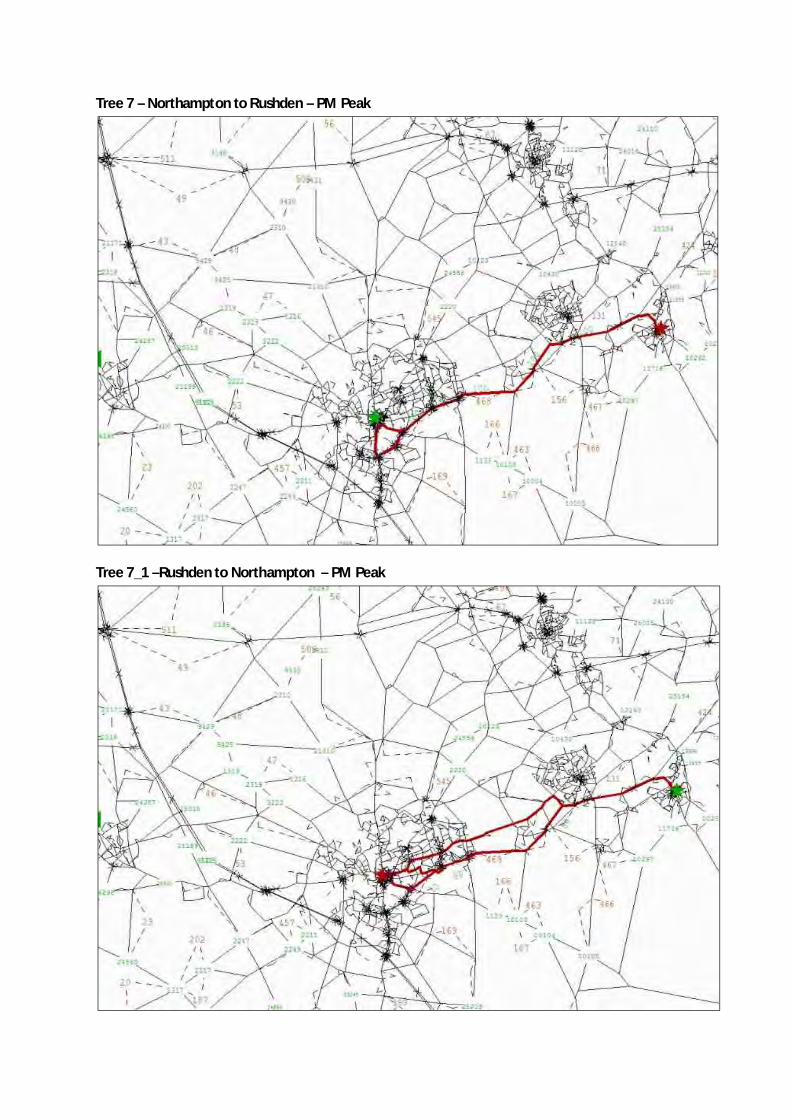
Tree 7 – Northampton to Rushden – PM Peak
Tree 7_1 –Rushden to Northampton – PM Peak
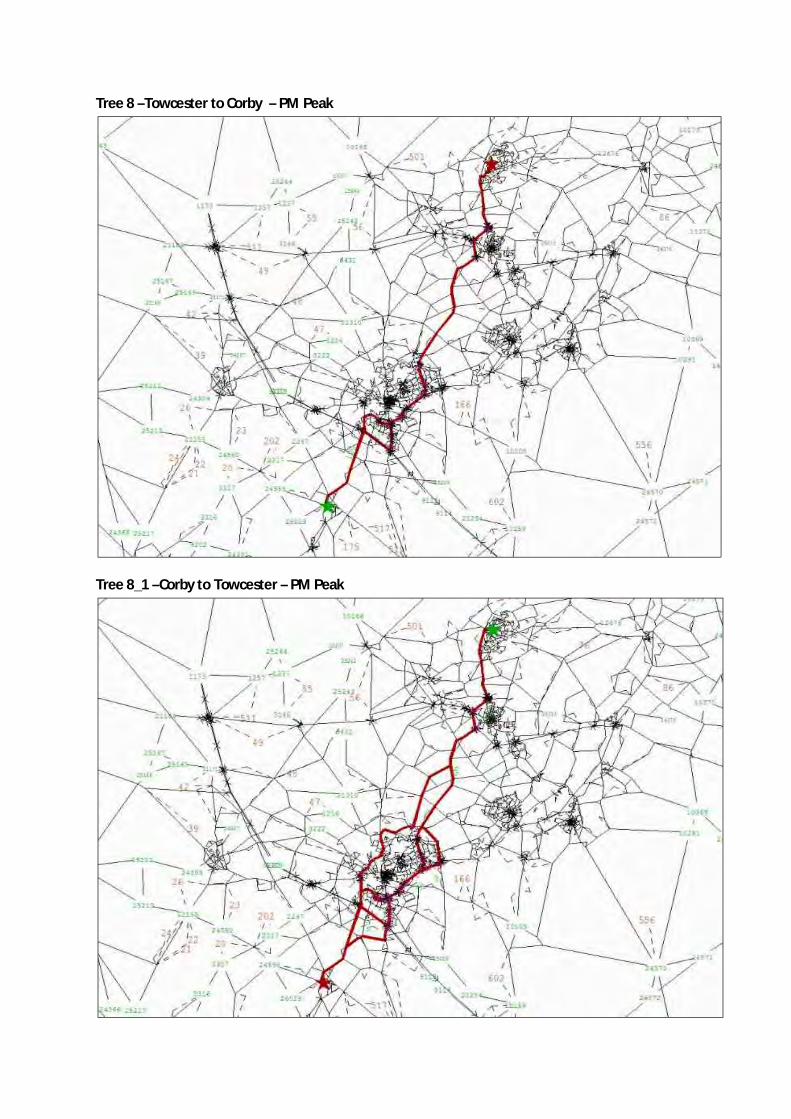
Tree 8 –Towcester to Corby – PM Peak
Tree 8_1 –Corby to Towcester – PM Peak
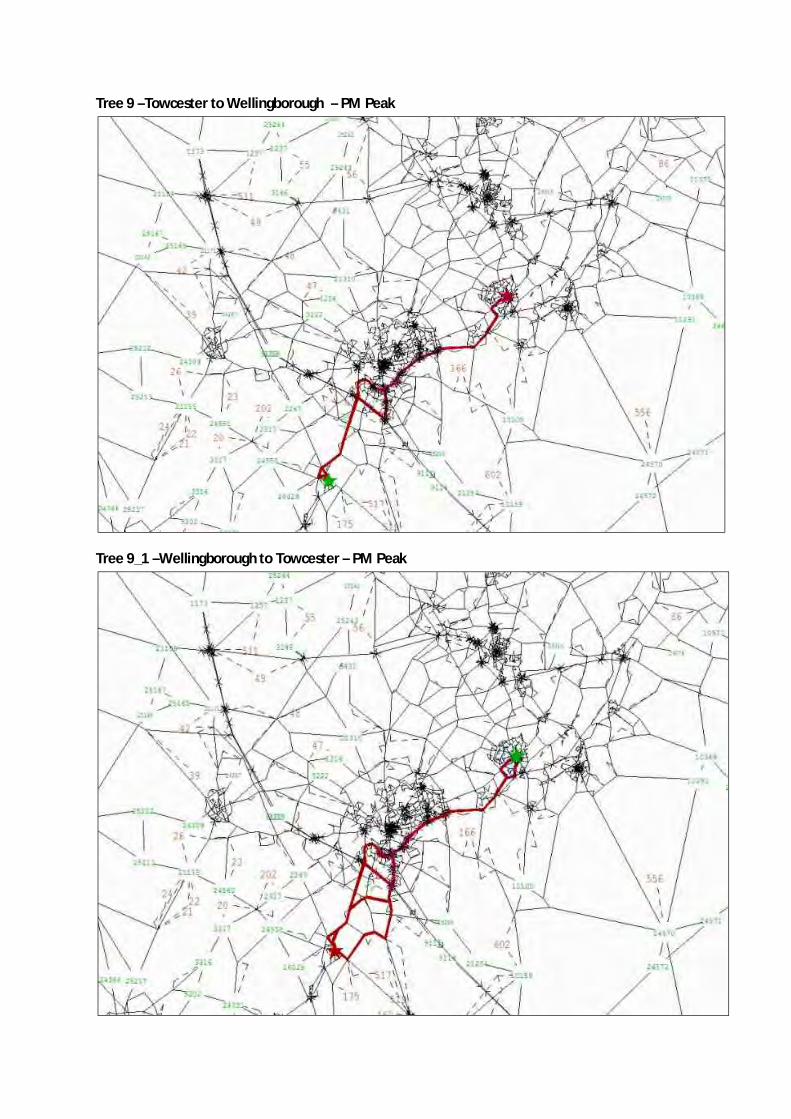
Tree 9 –Towcester to Wellingborough – PM Peak
Tree 9_1 –Wellingborough to Towcester – PM Peak
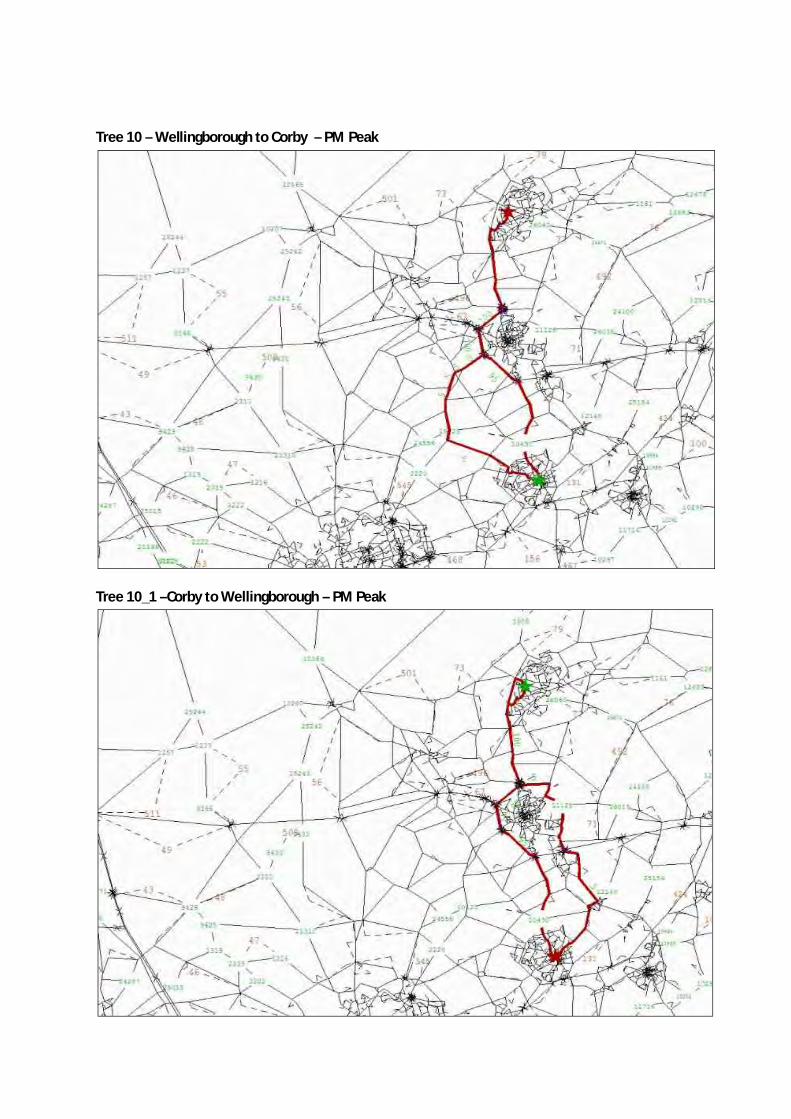
Tree 10 – Wellingborough to Corby – PM Peak
Tree 10_1 –Corby to Wellingborough – PM Peak

52 NSTM - LMVR Highway Model Version 1.0
APPENDIX NO 3: Matrix Sector Comparison
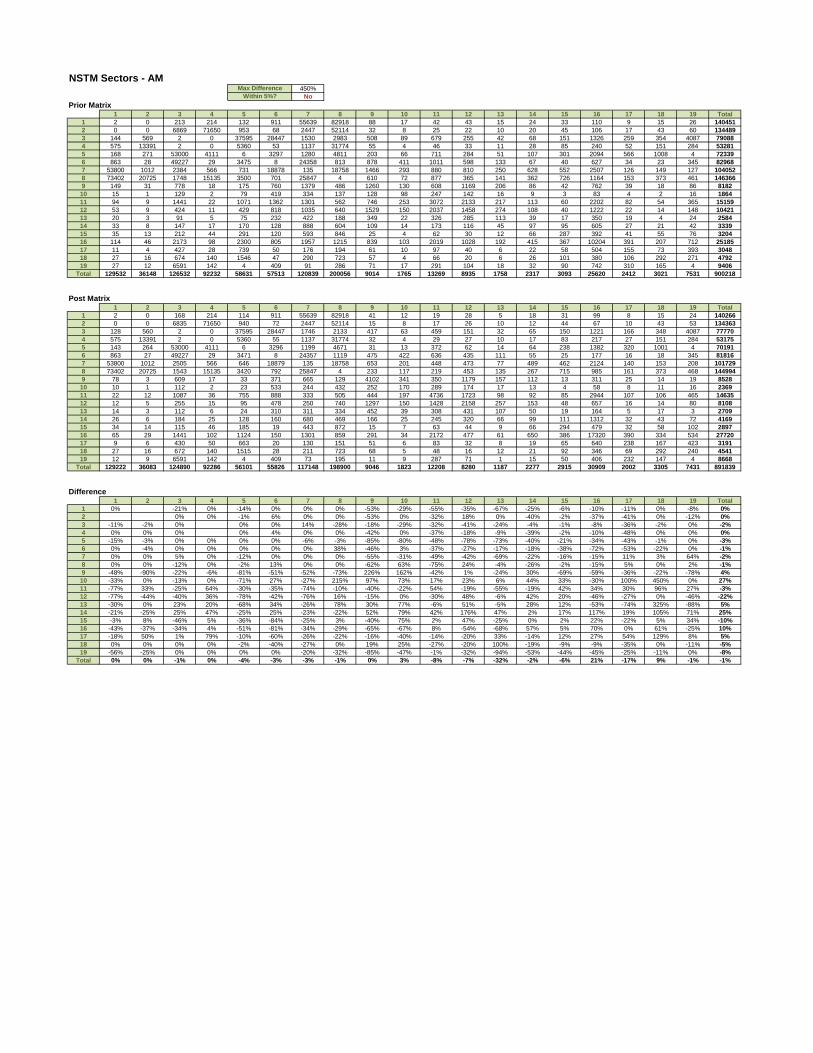
NSTM Sectors - AM450%
NoPrior Matrix
1 2 3 4 5 6 7 8 9 10 11 12 13 14 15 16 17 18 19 Total1 2 0 213 214 132 911 55639 82918 88 17 42 43 15 24 33 110 9 15 26 1404512 0 0 6869 71650 953 68 2447 52114 32 8 25 22 10 20 45 106 17 43 60 1344893 144 569 2 0 37595 28447 1530 2983 508 89 679 255 42 68 151 1326 259 354 4087 790884 575 13391 2 0 5360 53 1137 31774 55 4 46 33 11 28 85 240 52 151 284 532815 168 271 53000 4111 6 3297 1280 4811 203 66 711 284 51 107 301 2094 566 1008 4 723396 863 28 49227 29 3475 8 24358 813 878 411 1011 598 133 67 40 627 34 23 345 829687 53800 1012 2384 566 731 18878 135 18758 1466 293 880 810 250 628 552 2507 126 149 127 1040528 73402 20725 1748 15135 3500 701 25847 4 610 72 877 365 141 362 726 1164 153 373 461 1463669 149 31 778 18 175 760 1379 486 1260 130 608 1169 206 86 42 762 39 18 86 818210 15 1 129 2 79 419 334 137 128 98 247 142 16 9 3 83 4 2 16 186411 94 9 1441 22 1071 1362 1301 562 746 253 3072 2133 217 113 60 2202 82 54 365 1515912 53 9 424 11 429 818 1035 640 1529 150 2037 1458 274 108 40 1222 22 14 148 1042113 20 3 91 5 75 232 422 188 349 22 326 285 113 39 17 350 19 4 24 258414 33 8 147 17 170 128 888 604 109 14 173 116 45 97 95 605 27 21 42 333915 35 13 212 44 291 120 593 846 25 4 62 30 12 66 287 392 41 55 76 320416 114 46 2173 98 2300 805 1957 1215 839 103 2019 1028 192 415 367 10204 391 207 712 2518517 11 4 427 28 739 50 176 194 61 10 97 40 6 22 58 504 155 73 393 304818 27 16 674 140 1546 47 290 723 57 4 66 20 6 26 101 380 106 292 271 479219 27 12 6591 142 4 409 91 286 71 17 291 104 18 32 90 742 310 165 4 9406
Total 129532 36148 126532 92232 58631 57513 120839 200056 9014 1765 13269 8935 1758 2317 3093 25620 2412 3021 7531 900218
Post Matrix1 2 3 4 5 6 7 8 9 10 11 12 13 14 15 16 17 18 19 Total
1 2 0 168 214 114 911 55639 82918 41 12 19 28 5 18 31 99 8 15 24 1402662 0 0 6835 71650 940 72 2447 52114 15 8 17 26 10 12 44 67 10 43 53 1343633 128 560 2 0 37595 28447 1746 2133 417 63 459 151 32 65 150 1221 166 348 4087 777704 575 13391 2 0 5360 55 1137 31774 32 4 29 27 10 17 83 217 27 151 284 531755 143 264 53000 4111 6 3296 1199 4671 31 13 372 62 14 64 238 1382 320 1001 4 701916 863 27 49227 29 3471 8 24357 1119 475 422 636 435 111 55 25 177 16 18 345 818167 53800 1012 2505 566 646 18879 135 18758 653 201 448 473 77 489 462 2124 140 153 208 1017298 73402 20725 1543 15135 3420 792 25847 4 233 117 219 453 135 267 715 985 161 373 468 1449949 78 3 609 17 33 371 665 129 4102 341 350 1179 157 112 13 311 25 14 19 852810 10 1 112 2 23 533 244 432 252 170 289 174 17 13 4 58 8 11 16 236911 22 12 1087 36 755 888 333 505 444 197 4736 1723 98 92 85 2944 107 106 465 1463512 12 5 255 15 95 478 250 740 1297 150 1428 2158 257 153 48 657 16 14 80 810813 14 3 112 6 24 310 311 334 452 39 308 431 107 50 19 164 5 17 3 270914 26 6 184 25 128 160 680 469 166 25 245 320 66 99 111 1312 32 43 72 416915 34 14 115 46 185 19 443 872 15 7 63 44 9 66 294 479 32 58 102 289716 65 29 1441 102 1124 150 1301 859 291 34 2172 477 61 650 386 17320 390 334 534 2772017 9 6 430 50 663 20 130 151 51 6 83 32 8 19 65 640 238 167 423 319118 27 16 672 140 1515 28 211 723 68 5 48 16 12 21 92 346 69 292 240 454119 12 9 6591 142 4 409 73 195 11 9 287 71 1 15 50 406 232 147 4 8668
Total 129222 36083 124890 92286 56101 55826 117148 198900 9046 1823 12208 8280 1187 2277 2915 30909 2002 3305 7431 891839
Difference1 2 3 4 5 6 7 8 9 10 11 12 13 14 15 16 17 18 19 Total
1 0% -21% 0% -14% 0% 0% 0% -53% -29% -55% -35% -67% -25% -6% -10% -11% 0% -8% 0%2 0% 0% -1% 6% 0% 0% -53% 0% -32% 18% 0% -40% -2% -37% -41% 0% -12% 0%3 -11% -2% 0% 0% 0% 14% -28% -18% -29% -32% -41% -24% -4% -1% -8% -36% -2% 0% -2%4 0% 0% 0% 0% 4% 0% 0% -42% 0% -37% -18% -9% -39% -2% -10% -48% 0% 0% 0%5 -15% -3% 0% 0% 0% 0% -6% -3% -85% -80% -48% -78% -73% -40% -21% -34% -43% -1% 0% -3%6 0% -4% 0% 0% 0% 0% 0% 38% -46% 3% -37% -27% -17% -18% -38% -72% -53% -22% 0% -1%7 0% 0% 5% 0% -12% 0% 0% 0% -55% -31% -49% -42% -69% -22% -16% -15% 11% 3% 64% -2%8 0% 0% -12% 0% -2% 13% 0% 0% -62% 63% -75% 24% -4% -26% -2% -15% 5% 0% 2% -1%9 -48% -90% -22% -6% -81% -51% -52% -73% 226% 162% -42% 1% -24% 30% -69% -59% -36% -22% -78% 4%10 -33% 0% -13% 0% -71% 27% -27% 215% 97% 73% 17% 23% 6% 44% 33% -30% 100% 450% 0% 27%11 -77% 33% -25% 64% -30% -35% -74% -10% -40% -22% 54% -19% -55% -19% 42% 34% 30% 96% 27% -3%12 -77% -44% -40% 36% -78% -42% -76% 16% -15% 0% -30% 48% -6% 42% 20% -46% -27% 0% -46% -22%13 -30% 0% 23% 20% -68% 34% -26% 78% 30% 77% -6% 51% -5% 28% 12% -53% -74% 325% -88% 5%14 -21% -25% 25% 47% -25% 25% -23% -22% 52% 79% 42% 176% 47% 2% 17% 117% 19% 105% 71% 25%15 -3% 8% -46% 5% -36% -84% -25% 3% -40% 75% 2% 47% -25% 0% 2% 22% -22% 5% 34% -10%16 -43% -37% -34% 4% -51% -81% -34% -29% -65% -67% 8% -54% -68% 57% 5% 70% 0% 61% -25% 10%17 -18% 50% 1% 79% -10% -60% -26% -22% -16% -40% -14% -20% 33% -14% 12% 27% 54% 129% 8% 5%18 0% 0% 0% 0% -2% -40% -27% 0% 19% 25% -27% -20% 100% -19% -9% -9% -35% 0% -11% -5%19 -56% -25% 0% 0% 0% 0% -20% -32% -85% -47% -1% -32% -94% -53% -44% -45% -25% -11% 0% -8%
Total 0% 0% -1% 0% -4% -3% -3% -1% 0% 3% -8% -7% -32% -2% -6% 21% -17% 9% -1% -1%
Max DifferenceWithin 5%?
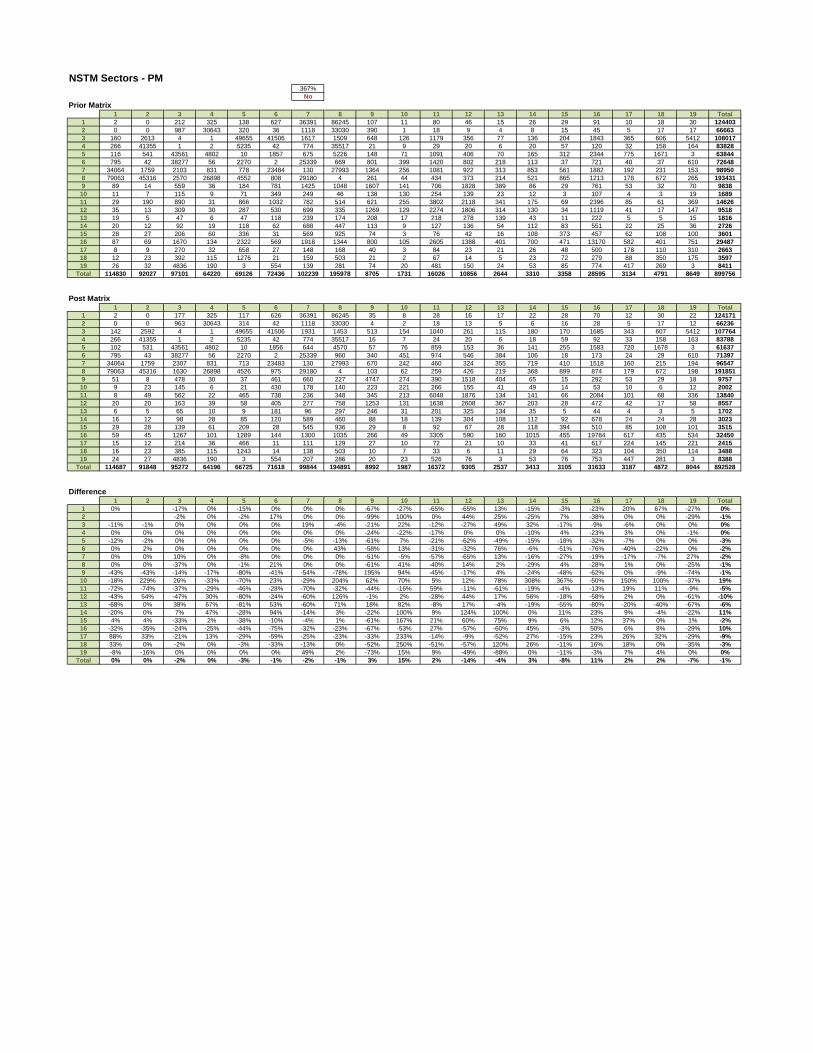
NSTM Sectors - PM367%
NoPrior Matrix
1 2 3 4 5 6 7 8 9 10 11 12 13 14 15 16 17 18 19 Total1 2 0 212 325 138 627 36391 86245 107 11 80 46 15 26 29 91 10 18 30 1244032 0 0 987 30643 320 36 1118 33030 390 1 18 9 4 8 15 45 5 17 17 666633 160 2613 4 1 49655 41506 1617 1509 648 126 1179 356 77 136 204 1843 365 606 5412 1080174 266 41355 1 2 5235 42 774 35517 21 9 29 20 6 20 57 120 32 158 164 838285 116 541 43561 4802 10 1857 675 5226 148 71 1091 406 70 165 312 2344 775 1671 3 638446 795 42 38277 56 2270 2 25339 669 801 399 1420 802 218 113 37 721 40 37 610 726487 34064 1759 2103 831 778 23484 130 27993 1364 256 1081 922 313 853 561 1882 192 231 153 989508 79063 45316 2570 26898 4552 808 29180 4 261 44 434 373 214 521 865 1213 178 672 265 1934319 89 14 559 36 184 781 1425 1048 1607 141 706 1828 389 86 29 761 53 32 70 983810 11 7 115 9 71 349 249 46 138 130 254 139 23 12 3 107 4 3 19 168911 29 190 890 31 866 1032 782 514 621 255 3802 2118 341 175 69 2396 85 61 369 1462612 35 13 309 30 287 530 699 335 1269 129 2274 1806 314 130 34 1119 41 17 147 951813 19 5 47 6 47 118 239 174 208 17 218 278 139 43 11 222 5 5 15 181614 20 12 92 19 118 62 688 447 113 9 127 136 54 112 83 551 22 25 36 272615 28 27 206 60 336 31 569 925 74 3 76 42 16 108 373 457 62 108 100 360116 87 69 1670 134 2322 569 1918 1344 800 105 2605 1388 401 700 471 13170 582 401 751 2948717 8 9 270 32 658 27 148 168 40 3 84 23 21 26 48 500 178 110 310 266318 12 23 392 115 1276 21 159 503 21 2 67 14 5 23 72 279 88 350 175 359719 26 32 4836 190 3 554 139 281 74 20 481 150 24 53 85 774 417 269 3 8411
Total 114830 92027 97101 64220 69126 72436 102239 195978 8705 1731 16026 10856 2644 3310 3358 28595 3134 4791 8649 899756
Post Matrix1 2 3 4 5 6 7 8 9 10 11 12 13 14 15 16 17 18 19 Total
1 2 0 177 325 117 626 36391 86245 35 8 28 16 17 22 28 70 12 30 22 1241712 0 0 963 30643 314 42 1118 33030 4 2 18 13 5 6 16 28 5 17 12 662363 142 2592 4 1 49655 41506 1931 1453 513 154 1040 261 115 180 170 1685 343 607 5412 1077644 266 41355 1 2 5235 42 774 35517 16 7 24 20 6 18 59 92 33 158 163 837885 102 531 43561 4802 10 1856 644 4570 57 76 859 153 36 141 255 1583 720 1678 3 616376 795 43 38277 56 2270 2 25339 960 340 451 974 546 384 106 18 173 24 29 610 713977 34064 1759 2307 831 713 23483 130 27993 670 242 460 324 355 719 410 1518 160 215 194 965478 79063 45316 1630 26898 4526 975 29180 4 103 62 259 426 219 368 899 874 179 672 198 1918519 51 8 478 30 37 461 660 227 4747 274 390 1518 404 65 15 292 53 29 18 975710 9 23 145 6 21 430 178 140 223 221 266 155 41 49 14 53 10 6 12 200211 8 49 562 22 465 738 236 348 345 213 6048 1876 134 141 66 2084 101 68 336 1384012 20 20 163 39 58 405 277 758 1253 131 1638 2608 367 203 28 472 42 17 58 855713 6 5 65 10 9 181 96 297 246 31 201 325 134 35 5 44 4 3 5 170214 16 12 98 28 85 120 589 460 88 18 139 304 108 112 92 678 24 24 28 302315 29 28 139 61 209 28 545 936 29 8 92 67 28 118 394 510 85 108 101 351516 59 45 1267 101 1289 144 1300 1035 266 49 3305 590 160 1015 455 19784 617 435 534 3245017 15 12 214 36 466 11 111 129 27 10 72 21 10 33 41 617 224 145 221 241518 16 23 385 115 1243 14 138 503 10 7 33 6 11 29 64 323 104 350 114 348819 24 27 4836 190 3 554 207 286 20 23 526 76 3 53 76 753 447 281 3 8388
Total 114687 91848 95272 64196 66725 71618 99844 194891 8992 1987 16372 9305 2537 3413 3105 31633 3187 4872 8044 892528
Difference1 2 3 4 5 6 7 8 9 10 11 12 13 14 15 16 17 18 19 Total
1 0% -17% 0% -15% 0% 0% 0% -67% -27% -65% -65% 13% -15% -3% -23% 20% 67% -27% 0%2 -2% 0% -2% 17% 0% 0% -99% 100% 0% 44% 25% -25% 7% -38% 0% 0% -29% -1%3 -11% -1% 0% 0% 0% 0% 19% -4% -21% 22% -12% -27% 49% 32% -17% -9% -6% 0% 0% 0%4 0% 0% 0% 0% 0% 0% 0% 0% -24% -22% -17% 0% 0% -10% 4% -23% 3% 0% -1% 0%5 -12% -2% 0% 0% 0% 0% -5% -13% -61% 7% -21% -62% -49% -15% -18% -32% -7% 0% 0% -3%6 0% 2% 0% 0% 0% 0% 0% 43% -58% 13% -31% -32% 76% -6% -51% -76% -40% -22% 0% -2%7 0% 0% 10% 0% -8% 0% 0% 0% -51% -5% -57% -65% 13% -16% -27% -19% -17% -7% 27% -2%8 0% 0% -37% 0% -1% 21% 0% 0% -61% 41% -40% 14% 2% -29% 4% -28% 1% 0% -25% -1%9 -43% -43% -14% -17% -80% -41% -54% -78% 195% 94% -45% -17% 4% -24% -48% -62% 0% -9% -74% -1%10 -18% 229% 26% -33% -70% 23% -29% 204% 62% 70% 5% 12% 78% 308% 367% -50% 150% 100% -37% 19%11 -72% -74% -37% -29% -46% -28% -70% -32% -44% -16% 59% -11% -61% -19% -4% -13% 19% 11% -9% -5%12 -43% 54% -47% 30% -80% -24% -60% 126% -1% 2% -28% 44% 17% 56% -18% -58% 2% 0% -61% -10%13 -68% 0% 38% 67% -81% 53% -60% 71% 18% 82% -8% 17% -4% -19% -55% -80% -20% -40% -67% -6%14 -20% 0% 7% 47% -28% 94% -14% 3% -22% 100% 9% 124% 100% 0% 11% 23% 9% -4% -22% 11%15 4% 4% -33% 2% -38% -10% -4% 1% -61% 167% 21% 60% 75% 9% 6% 12% 37% 0% 1% -2%16 -32% -35% -24% -25% -44% -75% -32% -23% -67% -53% 27% -57% -60% 45% -3% 50% 6% 8% -29% 10%17 88% 33% -21% 13% -29% -59% -25% -23% -33% 233% -14% -9% -52% 27% -15% 23% 26% 32% -29% -9%18 33% 0% -2% 0% -3% -33% -13% 0% -52% 250% -51% -57% 120% 26% -11% 16% 18% 0% -35% -3%19 -8% -16% 0% 0% 0% 0% 49% 2% -73% 15% 9% -49% -88% 0% -11% -3% 7% 4% 0% 0%
Total 0% 0% -2% 0% -3% -1% -2% -1% 3% 15% 2% -14% -4% 3% -8% 11% 2% 2% -7% -1%

NSTM - LMVR Highway Model Version 1.0 53
APPENDIX NO 4: Trip Length Distribution
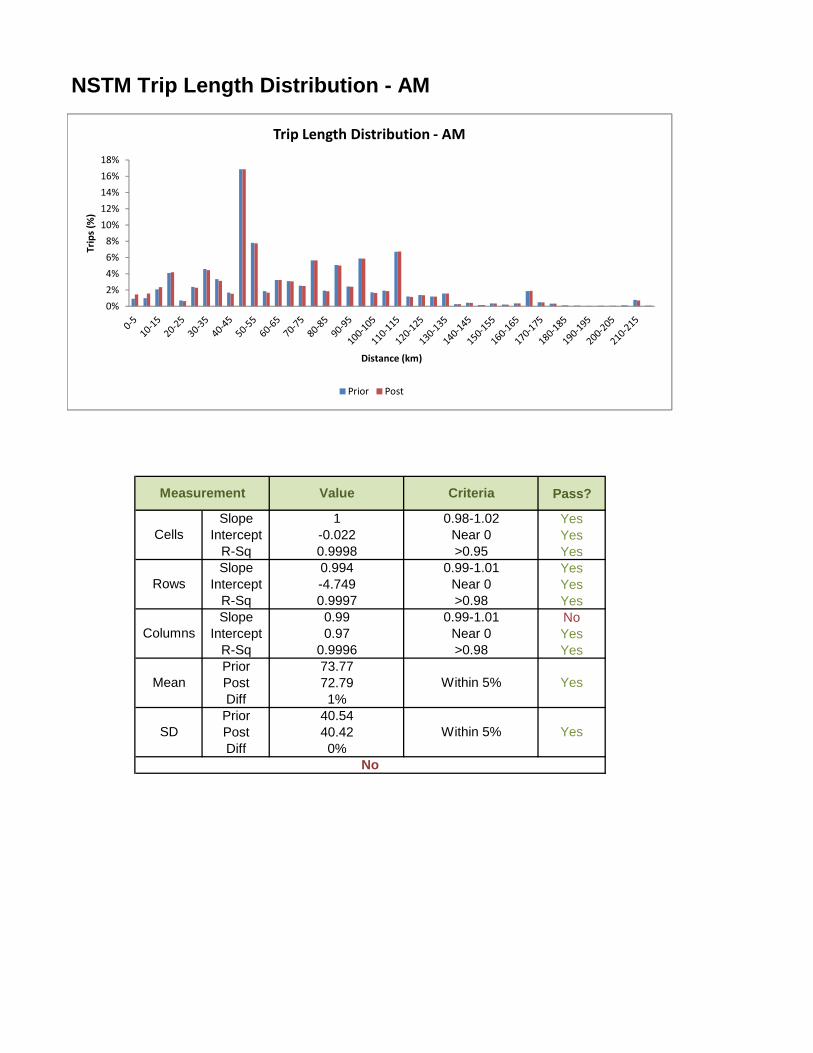
NSTM Trip Length Distribution - AM
Pass?
Slope YesIntercept Yes
R-Sq YesSlope Yes
Intercept YesR-Sq YesSlope No
Intercept YesR-Sq YesPriorPostDiff
PriorPostDiff
Measurement
No
0.99970.990.97
0.9996
Cells
Rows
Columns
>0.980.99-1.01
Near 0>0.98
Value
1-0.0220.99980.994-4.749
Criteria
0.98-1.02Near 0>0.95
0.99-1.01Near 0
Mean
SD
73.7772.791%
40.5440.42
Yes
Yes
Within 5%
Within 5%0%
��
��
��
��
��
���
���
���
���
���
���3���4
�
�����������
���3�(��5�1�������������� ��
2 �� 2�#�
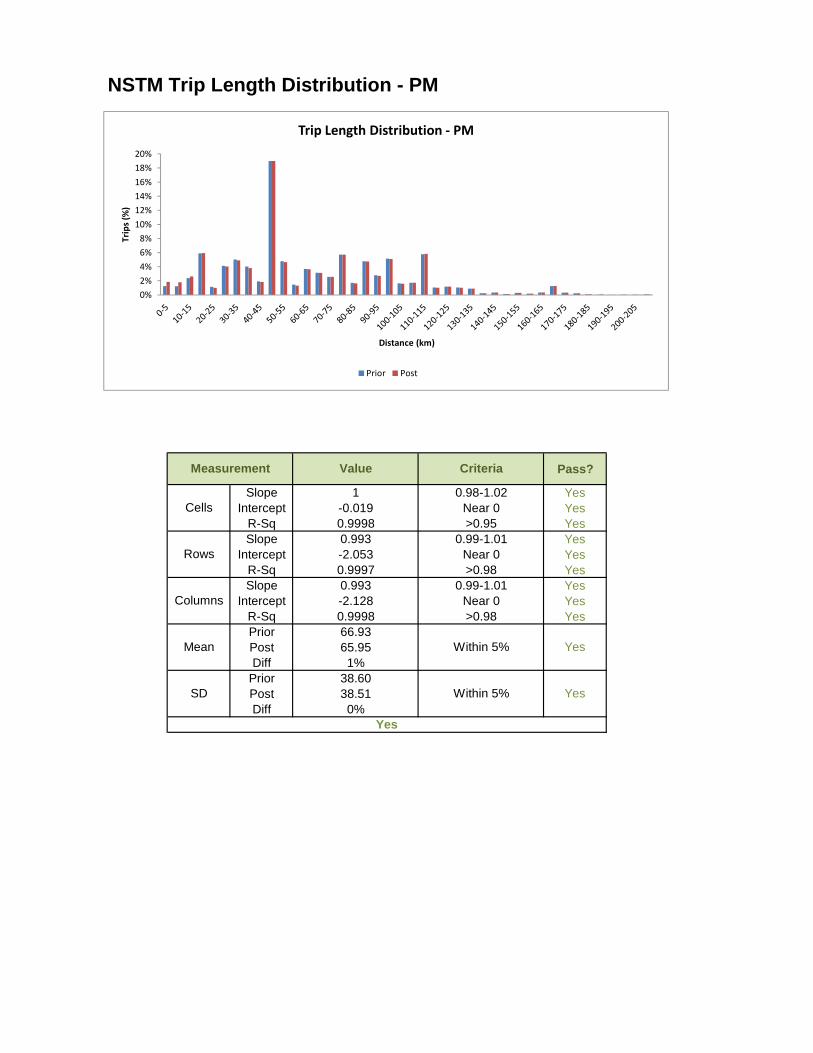
NSTM Trip Length Distribution - PM
Pass?
Slope YesIntercept Yes
R-Sq YesSlope Yes
Intercept YesR-Sq YesSlope Yes
Intercept YesR-Sq YesPriorPostDiff
PriorPostDiff
Measurement Value Criteria
Cells1 0.98-1.02
-0.019 Near 00.9998 >0.95
Rows0.993 0.99-1.01-2.053 Near 00.9997 >0.98
Columns0.993 0.99-1.01-2.128 Near 00.9998 >0.98
Mean66.93
Within 5% Yes65.951%
Yes
SD38.60
Within 5% Yes38.510%
��
��
��
��
��
���
���
���
���
���
���
���3���4
�
�����������
���3�(��5�1�������������� ��
2 �� 2�#�
54 NSTM - LMVR Highway Model Version 1.0
APPENDIX NO 5: AM Peak - Detailed Calibration/Validation Results
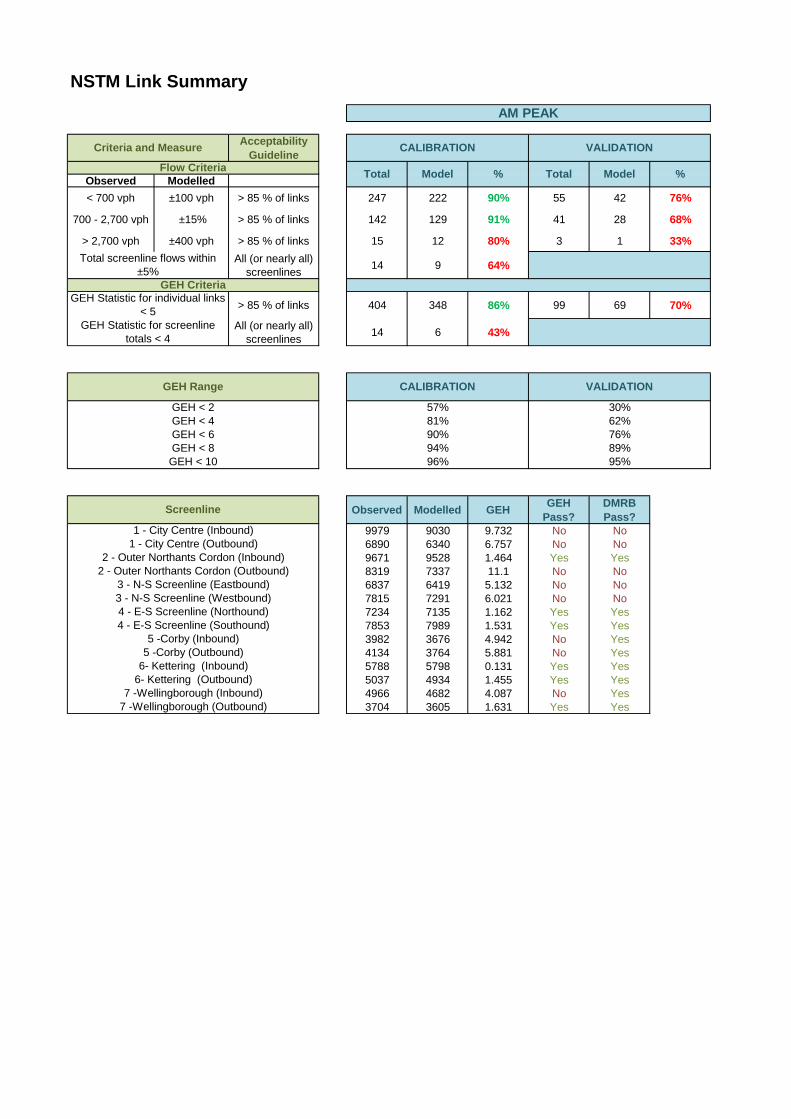
NSTM Link Summary
Acceptability Guideline
Observed Modelled< 700 vph ±100 vph > 85 % of links 247 222 90% 55 42 76%
700 - 2,700 vph ±15% > 85 % of links 142 129 91% 41 28 68%
> 2,700 vph ±400 vph > 85 % of links 15 12 80% 3 1 33%All (or nearly all)
screenlines 14 9 64%
> 85 % of links 404 348 86% 99 69 70%
All (or nearly all) screenlines 14 6 43%
Observed Modelled GEH GEH Pass?
DMRB Pass?
9979 9030 9.732 No No6890 6340 6.757 No No9671 9528 1.464 Yes Yes8319 7337 11.1 No No6837 6419 5.132 No No7815 7291 6.021 No No7234 7135 1.162 Yes Yes7853 7989 1.531 Yes Yes3982 3676 4.942 No Yes4134 3764 5.881 No Yes5788 5798 0.131 Yes Yes5037 4934 1.455 Yes Yes4966 4682 4.087 No Yes3704 3605 1.631 Yes Yes
1 - City Centre (Outbound)
Screenline
1 - City Centre (Inbound)
GEH CriteriaGEH Statistic for individual links
< 5GEH Statistic for screenline
totals < 4
GEH < 2GEH < 4GEH < 6GEH < 8GEH < 10
57%81%
Criteria and Measure
Flow Criteria Total Model %
CALIBRATION
Total screenline flows within ±5%
Total Model %
VALIDATION
AM PEAK
GEH Range CALIBRATION VALIDATION
90%94%96%
30%62%76%89%95%
2 - Outer Northants Cordon (Inbound)2 - Outer Northants Cordon (Outbound)
3 - N-S Screenline (Eastbound)3 - N-S Screenline (Westbound)4 - E-S Screenline (Northound)
7 -Wellingborough (Inbound)7 -Wellingborough (Outbound)
4 - E-S Screenline (Southound)5 -Corby (Inbound)
5 -Corby (Outbound)6- Kettering (Inbound)
6- Kettering (Outbound)
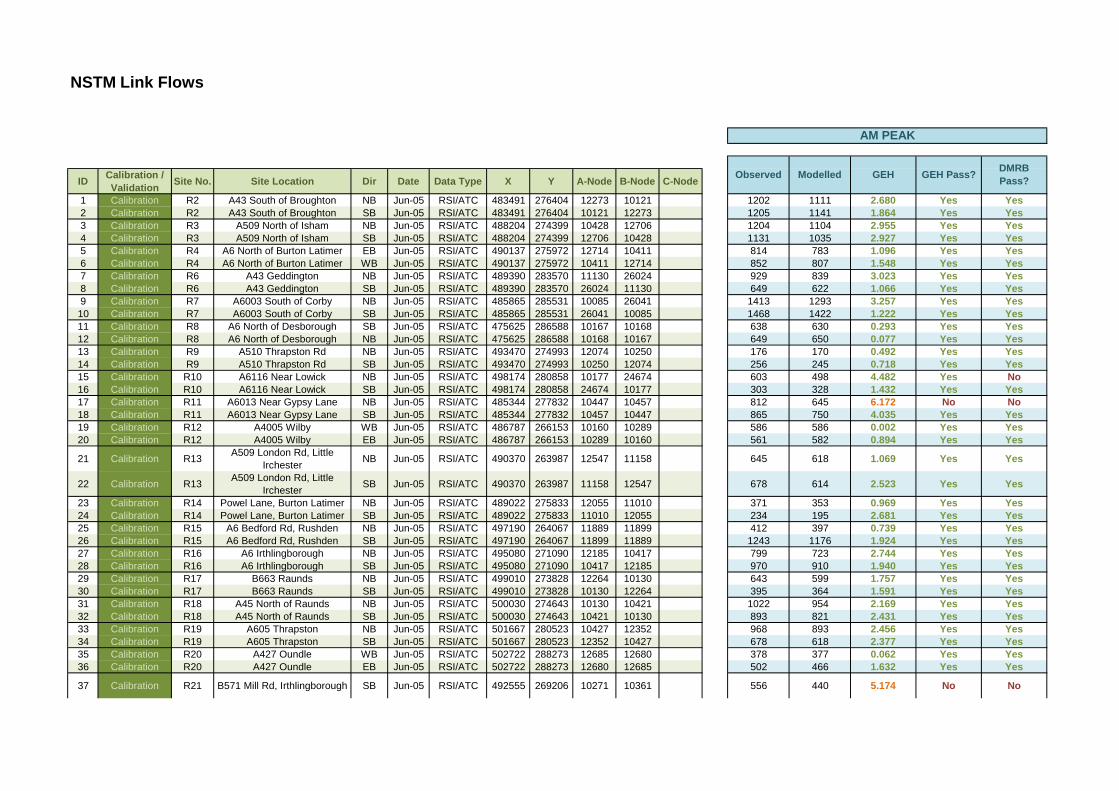
NSTM Link Flows
ID Calibration / Validation Site No. Site Location Dir Date Data Type X Y A-Node B-Node C-Node
1 Calibration R2 A43 South of Broughton NB Jun-05 RSI/ATC 483491 276404 12273 10121 1202 1111 2.680 Yes Yes2 Calibration R2 A43 South of Broughton SB Jun-05 RSI/ATC 483491 276404 10121 12273 1205 1141 1.864 Yes Yes3 Calibration R3 A509 North of Isham NB Jun-05 RSI/ATC 488204 274399 10428 12706 1204 1104 2.955 Yes Yes4 Calibration R3 A509 North of Isham SB Jun-05 RSI/ATC 488204 274399 12706 10428 1131 1035 2.927 Yes Yes5 Calibration R4 A6 North of Burton Latimer EB Jun-05 RSI/ATC 490137 275972 12714 10411 814 783 1.096 Yes Yes6 Calibration R4 A6 North of Burton Latimer WB Jun-05 RSI/ATC 490137 275972 10411 12714 852 807 1.548 Yes Yes7 Calibration R6 A43 Geddington NB Jun-05 RSI/ATC 489390 283570 11130 26024 929 839 3.023 Yes Yes8 Calibration R6 A43 Geddington SB Jun-05 RSI/ATC 489390 283570 26024 11130 649 622 1.066 Yes Yes9 Calibration R7 A6003 South of Corby NB Jun-05 RSI/ATC 485865 285531 10085 26041 1413 1293 3.257 Yes Yes10 Calibration R7 A6003 South of Corby SB Jun-05 RSI/ATC 485865 285531 26041 10085 1468 1422 1.222 Yes Yes11 Calibration R8 A6 North of Desborough SB Jun-05 RSI/ATC 475625 286588 10167 10168 638 630 0.293 Yes Yes12 Calibration R8 A6 North of Desborough NB Jun-05 RSI/ATC 475625 286588 10168 10167 649 650 0.077 Yes Yes13 Calibration R9 A510 Thrapston Rd NB Jun-05 RSI/ATC 493470 274993 12074 10250 176 170 0.492 Yes Yes14 Calibration R9 A510 Thrapston Rd SB Jun-05 RSI/ATC 493470 274993 10250 12074 256 245 0.718 Yes Yes15 Calibration R10 A6116 Near Lowick NB Jun-05 RSI/ATC 498174 280858 10177 24674 603 498 4.482 Yes No16 Calibration R10 A6116 Near Lowick SB Jun-05 RSI/ATC 498174 280858 24674 10177 303 328 1.432 Yes Yes17 Calibration R11 A6013 Near Gypsy Lane NB Jun-05 RSI/ATC 485344 277832 10447 10457 812 645 6.172 No No18 Calibration R11 A6013 Near Gypsy Lane SB Jun-05 RSI/ATC 485344 277832 10457 10447 865 750 4.035 Yes Yes19 Calibration R12 A4005 Wilby WB Jun-05 RSI/ATC 486787 266153 10160 10289 586 586 0.002 Yes Yes20 Calibration R12 A4005 Wilby EB Jun-05 RSI/ATC 486787 266153 10289 10160 561 582 0.894 Yes Yes
21 Calibration R13 A509 London Rd, Little Irchester NB Jun-05 RSI/ATC 490370 263987 12547 11158 645 618 1.069 Yes Yes
22 Calibration R13 A509 London Rd, Little Irchester SB Jun-05 RSI/ATC 490370 263987 11158 12547 678 614 2.523 Yes Yes
23 Calibration R14 Powel Lane, Burton Latimer NB Jun-05 RSI/ATC 489022 275833 12055 11010 371 353 0.969 Yes Yes24 Calibration R14 Powel Lane, Burton Latimer SB Jun-05 RSI/ATC 489022 275833 11010 12055 234 195 2.681 Yes Yes25 Calibration R15 A6 Bedford Rd, Rushden NB Jun-05 RSI/ATC 497190 264067 11889 11899 412 397 0.739 Yes Yes26 Calibration R15 A6 Bedford Rd, Rushden SB Jun-05 RSI/ATC 497190 264067 11899 11889 1243 1176 1.924 Yes Yes27 Calibration R16 A6 Irthlingborough NB Jun-05 RSI/ATC 495080 271090 12185 10417 799 723 2.744 Yes Yes28 Calibration R16 A6 Irthlingborough SB Jun-05 RSI/ATC 495080 271090 10417 12185 970 910 1.940 Yes Yes29 Calibration R17 B663 Raunds NB Jun-05 RSI/ATC 499010 273828 12264 10130 643 599 1.757 Yes Yes30 Calibration R17 B663 Raunds SB Jun-05 RSI/ATC 499010 273828 10130 12264 395 364 1.591 Yes Yes31 Calibration R18 A45 North of Raunds NB Jun-05 RSI/ATC 500030 274643 10130 10421 1022 954 2.169 Yes Yes32 Calibration R18 A45 North of Raunds SB Jun-05 RSI/ATC 500030 274643 10421 10130 893 821 2.431 Yes Yes33 Calibration R19 A605 Thrapston NB Jun-05 RSI/ATC 501667 280523 10427 12352 968 893 2.456 Yes Yes34 Calibration R19 A605 Thrapston SB Jun-05 RSI/ATC 501667 280523 12352 10427 678 618 2.377 Yes Yes35 Calibration R20 A427 Oundle WB Jun-05 RSI/ATC 502722 288273 12685 12680 378 377 0.062 Yes Yes36 Calibration R20 A427 Oundle EB Jun-05 RSI/ATC 502722 288273 12680 12685 502 466 1.632 Yes Yes
37 Calibration R21 B571 Mill Rd, Irthlingborough SB Jun-05 RSI/ATC 492555 269206 10271 10361 556 440 5.174 No No
AM PEAK
GEH GEH Pass? DMRB Pass?ModelledObserved
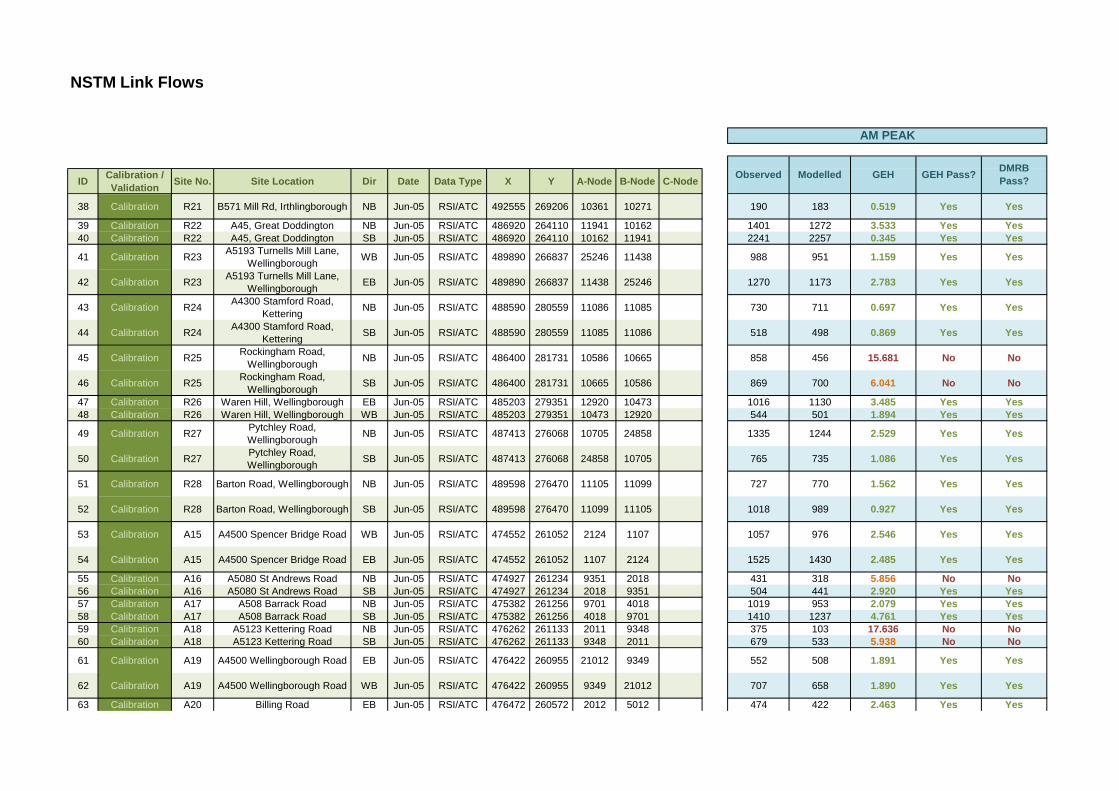
NSTM Link Flows
ID Calibration / Validation Site No. Site Location Dir Date Data Type X Y A-Node B-Node C-Node
AM PEAK
GEH GEH Pass? DMRB Pass?ModelledObserved
38 Calibration R21 B571 Mill Rd, Irthlingborough NB Jun-05 RSI/ATC 492555 269206 10361 10271 190 183 0.519 Yes Yes
39 Calibration R22 A45, Great Doddington NB Jun-05 RSI/ATC 486920 264110 11941 10162 1401 1272 3.533 Yes Yes40 Calibration R22 A45, Great Doddington SB Jun-05 RSI/ATC 486920 264110 10162 11941 2241 2257 0.345 Yes Yes
41 Calibration R23 A5193 Turnells Mill Lane, Wellingborough WB Jun-05 RSI/ATC 489890 266837 25246 11438 988 951 1.159 Yes Yes
42 Calibration R23 A5193 Turnells Mill Lane, Wellingborough EB Jun-05 RSI/ATC 489890 266837 11438 25246 1270 1173 2.783 Yes Yes
43 Calibration R24 A4300 Stamford Road, Kettering NB Jun-05 RSI/ATC 488590 280559 11086 11085 730 711 0.697 Yes Yes
44 Calibration R24 A4300 Stamford Road, Kettering SB Jun-05 RSI/ATC 488590 280559 11085 11086 518 498 0.869 Yes Yes
45 Calibration R25 Rockingham Road, Wellingborough NB Jun-05 RSI/ATC 486400 281731 10586 10665 858 456 15.681 No No
46 Calibration R25 Rockingham Road, Wellingborough SB Jun-05 RSI/ATC 486400 281731 10665 10586 869 700 6.041 No No
47 Calibration R26 Waren Hill, Wellingborough EB Jun-05 RSI/ATC 485203 279351 12920 10473 1016 1130 3.485 Yes Yes48 Calibration R26 Waren Hill, Wellingborough WB Jun-05 RSI/ATC 485203 279351 10473 12920 544 501 1.894 Yes Yes
49 Calibration R27 Pytchley Road, Wellingborough NB Jun-05 RSI/ATC 487413 276068 10705 24858 1335 1244 2.529 Yes Yes
50 Calibration R27 Pytchley Road, Wellingborough SB Jun-05 RSI/ATC 487413 276068 24858 10705 765 735 1.086 Yes Yes
51 Calibration R28 Barton Road, Wellingborough NB Jun-05 RSI/ATC 489598 276470 11105 11099 727 770 1.562 Yes Yes
52 Calibration R28 Barton Road, Wellingborough SB Jun-05 RSI/ATC 489598 276470 11099 11105 1018 989 0.927 Yes Yes
53 Calibration A15 A4500 Spencer Bridge Road WB Jun-05 RSI/ATC 474552 261052 2124 1107 1057 976 2.546 Yes Yes
54 Calibration A15 A4500 Spencer Bridge Road EB Jun-05 RSI/ATC 474552 261052 1107 2124 1525 1430 2.485 Yes Yes
55 Calibration A16 A5080 St Andrews Road NB Jun-05 RSI/ATC 474927 261234 9351 2018 431 318 5.856 No No56 Calibration A16 A5080 St Andrews Road SB Jun-05 RSI/ATC 474927 261234 2018 9351 504 441 2.920 Yes Yes57 Calibration A17 A508 Barrack Road NB Jun-05 RSI/ATC 475382 261256 9701 4018 1019 953 2.079 Yes Yes58 Calibration A17 A508 Barrack Road SB Jun-05 RSI/ATC 475382 261256 4018 9701 1410 1237 4.761 Yes Yes59 Calibration A18 A5123 Kettering Road NB Jun-05 RSI/ATC 476262 261133 2011 9348 375 103 17.636 No No60 Calibration A18 A5123 Kettering Road SB Jun-05 RSI/ATC 476262 261133 9348 2011 679 533 5.938 No No
61 Calibration A19 A4500 Wellingborough Road EB Jun-05 RSI/ATC 476422 260955 21012 9349 552 508 1.891 Yes Yes
62 Calibration A19 A4500 Wellingborough Road WB Jun-05 RSI/ATC 476422 260955 9349 21012 707 658 1.890 Yes Yes
63 Calibration A20 Billing Road EB Jun-05 RSI/ATC 476472 260572 2012 5012 474 422 2.463 Yes Yes
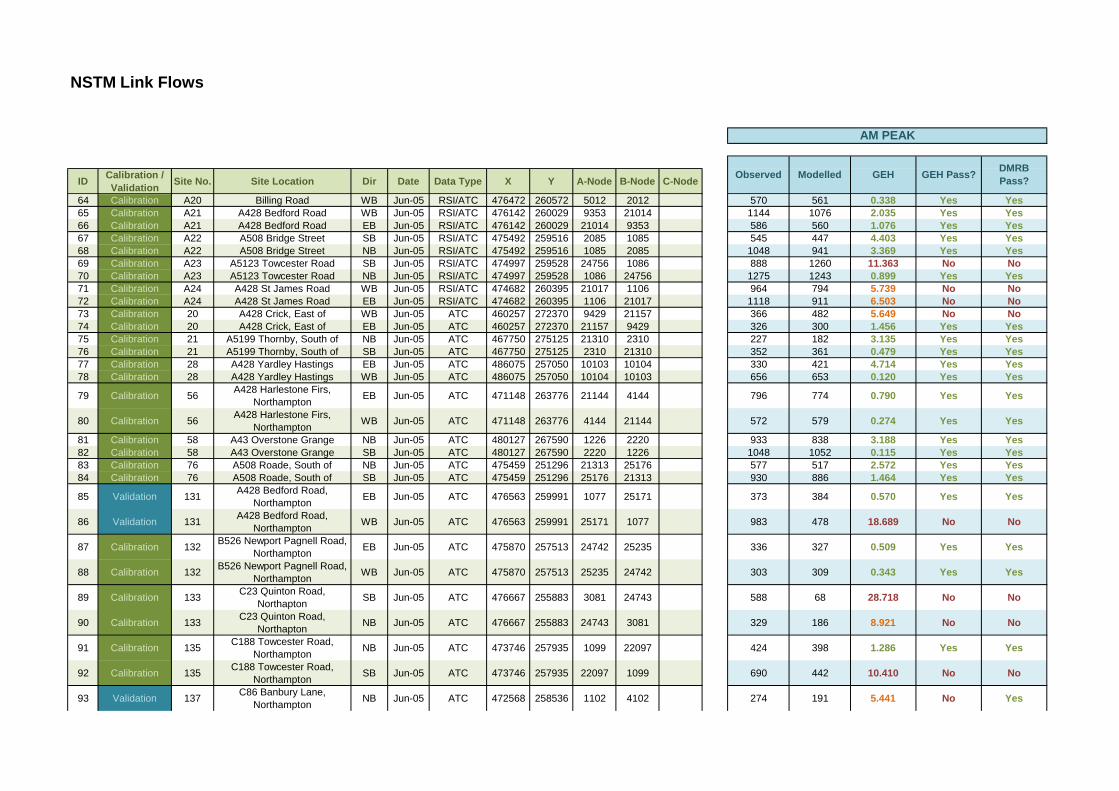
NSTM Link Flows
ID Calibration / Validation Site No. Site Location Dir Date Data Type X Y A-Node B-Node C-Node
AM PEAK
GEH GEH Pass? DMRB Pass?ModelledObserved
64 Calibration A20 Billing Road WB Jun-05 RSI/ATC 476472 260572 5012 2012 570 561 0.338 Yes Yes65 Calibration A21 A428 Bedford Road WB Jun-05 RSI/ATC 476142 260029 9353 21014 1144 1076 2.035 Yes Yes66 Calibration A21 A428 Bedford Road EB Jun-05 RSI/ATC 476142 260029 21014 9353 586 560 1.076 Yes Yes67 Calibration A22 A508 Bridge Street SB Jun-05 RSI/ATC 475492 259516 2085 1085 545 447 4.403 Yes Yes68 Calibration A22 A508 Bridge Street NB Jun-05 RSI/ATC 475492 259516 1085 2085 1048 941 3.369 Yes Yes69 Calibration A23 A5123 Towcester Road SB Jun-05 RSI/ATC 474997 259528 24756 1086 888 1260 11.363 No No70 Calibration A23 A5123 Towcester Road NB Jun-05 RSI/ATC 474997 259528 1086 24756 1275 1243 0.899 Yes Yes71 Calibration A24 A428 St James Road WB Jun-05 RSI/ATC 474682 260395 21017 1106 964 794 5.739 No No72 Calibration A24 A428 St James Road EB Jun-05 RSI/ATC 474682 260395 1106 21017 1118 911 6.503 No No73 Calibration 20 A428 Crick, East of WB Jun-05 ATC 460257 272370 9429 21157 366 482 5.649 No No74 Calibration 20 A428 Crick, East of EB Jun-05 ATC 460257 272370 21157 9429 326 300 1.456 Yes Yes75 Calibration 21 A5199 Thornby, South of NB Jun-05 ATC 467750 275125 21310 2310 227 182 3.135 Yes Yes76 Calibration 21 A5199 Thornby, South of SB Jun-05 ATC 467750 275125 2310 21310 352 361 0.479 Yes Yes77 Calibration 28 A428 Yardley Hastings EB Jun-05 ATC 486075 257050 10103 10104 330 421 4.714 Yes Yes78 Calibration 28 A428 Yardley Hastings WB Jun-05 ATC 486075 257050 10104 10103 656 653 0.120 Yes Yes
79 Calibration 56 A428 Harlestone Firs, Northampton EB Jun-05 ATC 471148 263776 21144 4144 796 774 0.790 Yes Yes
80 Calibration 56 A428 Harlestone Firs, Northampton WB Jun-05 ATC 471148 263776 4144 21144 572 579 0.274 Yes Yes
81 Calibration 58 A43 Overstone Grange NB Jun-05 ATC 480127 267590 1226 2220 933 838 3.188 Yes Yes82 Calibration 58 A43 Overstone Grange SB Jun-05 ATC 480127 267590 2220 1226 1048 1052 0.115 Yes Yes83 Calibration 76 A508 Roade, South of NB Jun-05 ATC 475459 251296 21313 25176 577 517 2.572 Yes Yes84 Calibration 76 A508 Roade, South of SB Jun-05 ATC 475459 251296 25176 21313 930 886 1.464 Yes Yes
85 Validation 131 A428 Bedford Road, Northampton EB Jun-05 ATC 476563 259991 1077 25171 373 384 0.570 Yes Yes
86 Validation 131 A428 Bedford Road, Northampton WB Jun-05 ATC 476563 259991 25171 1077 983 478 18.689 No No
87 Calibration 132 B526 Newport Pagnell Road, Northampton EB Jun-05 ATC 475870 257513 24742 25235 336 327 0.509 Yes Yes
88 Calibration 132 B526 Newport Pagnell Road, Northampton WB Jun-05 ATC 475870 257513 25235 24742 303 309 0.343 Yes Yes
89 Calibration 133 C23 Quinton Road, Northapton SB Jun-05 ATC 476667 255883 3081 24743 588 68 28.718 No No
90 Calibration 133 C23 Quinton Road, Northapton NB Jun-05 ATC 476667 255883 24743 3081 329 186 8.921 No No
91 Calibration 135 C188 Towcester Road, Northampton NB Jun-05 ATC 473746 257935 1099 22097 424 398 1.286 Yes Yes
92 Calibration 135 C188 Towcester Road, Northampton SB Jun-05 ATC 473746 257935 22097 1099 690 442 10.410 No No
93 Validation 137 C86 Banbury Lane, Northampton NB Jun-05 ATC 472568 258536 1102 4102 274 191 5.441 No Yes
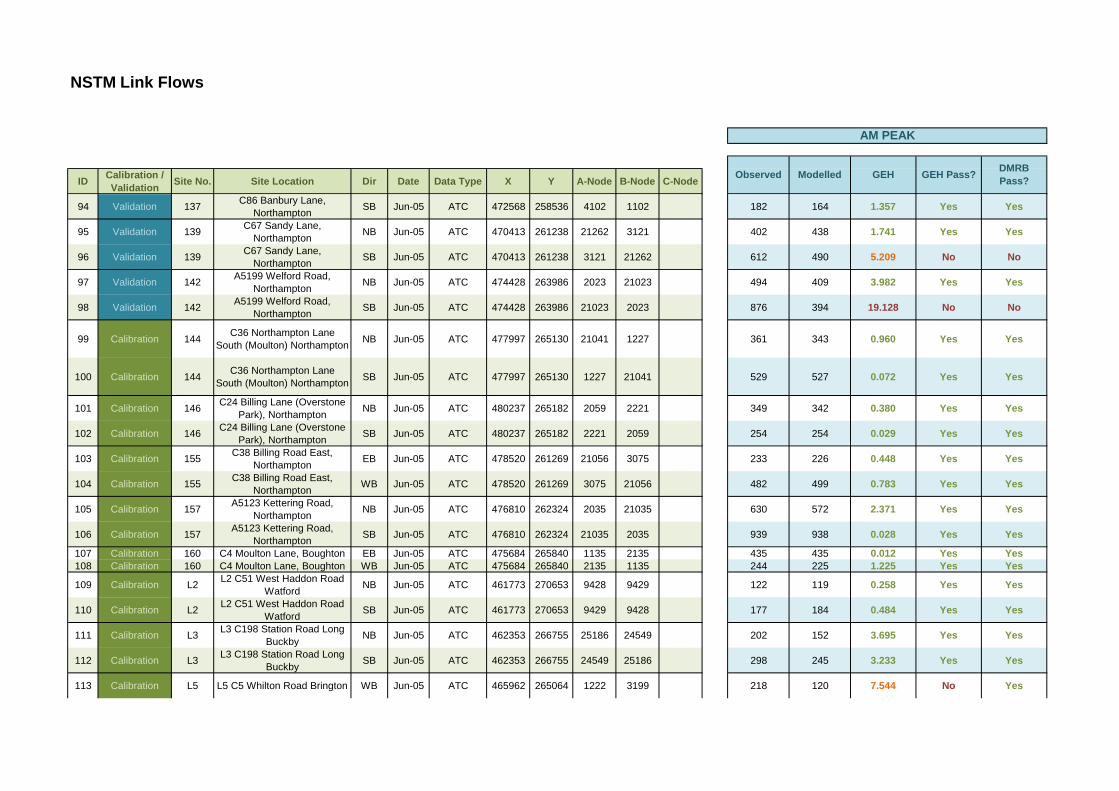
NSTM Link Flows
ID Calibration / Validation Site No. Site Location Dir Date Data Type X Y A-Node B-Node C-Node
AM PEAK
GEH GEH Pass? DMRB Pass?ModelledObserved
94 Validation 137 C86 Banbury Lane, Northampton SB Jun-05 ATC 472568 258536 4102 1102 182 164 1.357 Yes Yes
95 Validation 139 C67 Sandy Lane, Northampton NB Jun-05 ATC 470413 261238 21262 3121 402 438 1.741 Yes Yes
96 Validation 139 C67 Sandy Lane, Northampton SB Jun-05 ATC 470413 261238 3121 21262 612 490 5.209 No No
97 Validation 142 A5199 Welford Road, Northampton NB Jun-05 ATC 474428 263986 2023 21023 494 409 3.982 Yes Yes
98 Validation 142 A5199 Welford Road, Northampton SB Jun-05 ATC 474428 263986 21023 2023 876 394 19.128 No No
99 Calibration 144 C36 Northampton Lane South (Moulton) Northampton NB Jun-05 ATC 477997 265130 21041 1227 361 343 0.960 Yes Yes
100 Calibration 144 C36 Northampton Lane South (Moulton) Northampton SB Jun-05 ATC 477997 265130 1227 21041 529 527 0.072 Yes Yes
101 Calibration 146 C24 Billing Lane (Overstone Park), Northampton NB Jun-05 ATC 480237 265182 2059 2221 349 342 0.380 Yes Yes
102 Calibration 146 C24 Billing Lane (Overstone Park), Northampton SB Jun-05 ATC 480237 265182 2221 2059 254 254 0.029 Yes Yes
103 Calibration 155 C38 Billing Road East, Northampton EB Jun-05 ATC 478520 261269 21056 3075 233 226 0.448 Yes Yes
104 Calibration 155 C38 Billing Road East, Northampton WB Jun-05 ATC 478520 261269 3075 21056 482 499 0.783 Yes Yes
105 Calibration 157 A5123 Kettering Road, Northampton NB Jun-05 ATC 476810 262324 2035 21035 630 572 2.371 Yes Yes
106 Calibration 157 A5123 Kettering Road, Northampton SB Jun-05 ATC 476810 262324 21035 2035 939 938 0.028 Yes Yes
107 Calibration 160 C4 Moulton Lane, Boughton EB Jun-05 ATC 475684 265840 1135 2135 435 435 0.012 Yes Yes108 Calibration 160 C4 Moulton Lane, Boughton WB Jun-05 ATC 475684 265840 2135 1135 244 225 1.225 Yes Yes
109 Calibration L2 L2 C51 West Haddon Road Watford NB Jun-05 ATC 461773 270653 9428 9429 122 119 0.258 Yes Yes
110 Calibration L2 L2 C51 West Haddon Road Watford SB Jun-05 ATC 461773 270653 9429 9428 177 184 0.484 Yes Yes
111 Calibration L3 L3 C198 Station Road Long Buckby NB Jun-05 ATC 462353 266755 25186 24549 202 152 3.695 Yes Yes
112 Calibration L3 L3 C198 Station Road Long Buckby SB Jun-05 ATC 462353 266755 24549 25186 298 245 3.233 Yes Yes
113 Calibration L5 L5 C5 Whilton Road Brington WB Jun-05 ATC 465962 265064 1222 3199 218 120 7.544 No Yes
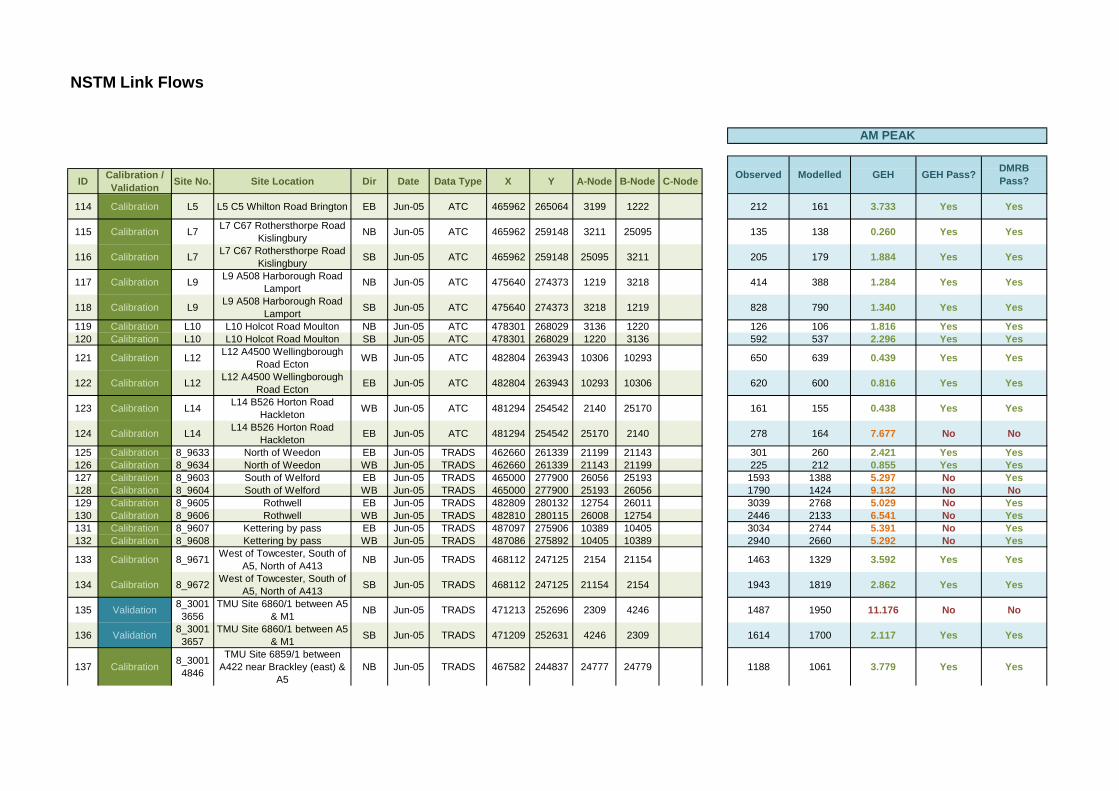
NSTM Link Flows
ID Calibration / Validation Site No. Site Location Dir Date Data Type X Y A-Node B-Node C-Node
AM PEAK
GEH GEH Pass? DMRB Pass?ModelledObserved
114 Calibration L5 L5 C5 Whilton Road Brington EB Jun-05 ATC 465962 265064 3199 1222 212 161 3.733 Yes Yes
115 Calibration L7 L7 C67 Rothersthorpe Road Kislingbury NB Jun-05 ATC 465962 259148 3211 25095 135 138 0.260 Yes Yes
116 Calibration L7 L7 C67 Rothersthorpe Road Kislingbury SB Jun-05 ATC 465962 259148 25095 3211 205 179 1.884 Yes Yes
117 Calibration L9 L9 A508 Harborough Road Lamport NB Jun-05 ATC 475640 274373 1219 3218 414 388 1.284 Yes Yes
118 Calibration L9 L9 A508 Harborough Road Lamport SB Jun-05 ATC 475640 274373 3218 1219 828 790 1.340 Yes Yes
119 Calibration L10 L10 Holcot Road Moulton NB Jun-05 ATC 478301 268029 3136 1220 126 106 1.816 Yes Yes120 Calibration L10 L10 Holcot Road Moulton SB Jun-05 ATC 478301 268029 1220 3136 592 537 2.296 Yes Yes
121 Calibration L12 L12 A4500 Wellingborough Road Ecton WB Jun-05 ATC 482804 263943 10306 10293 650 639 0.439 Yes Yes
122 Calibration L12 L12 A4500 Wellingborough Road Ecton EB Jun-05 ATC 482804 263943 10293 10306 620 600 0.816 Yes Yes
123 Calibration L14 L14 B526 Horton Road Hackleton WB Jun-05 ATC 481294 254542 2140 25170 161 155 0.438 Yes Yes
124 Calibration L14 L14 B526 Horton Road Hackleton EB Jun-05 ATC 481294 254542 25170 2140 278 164 7.677 No No
125 Calibration 8_9633 North of Weedon EB Jun-05 TRADS 462660 261339 21199 21143 301 260 2.421 Yes Yes126 Calibration 8_9634 North of Weedon WB Jun-05 TRADS 462660 261339 21143 21199 225 212 0.855 Yes Yes127 Calibration 8_9603 South of Welford EB Jun-05 TRADS 465000 277900 26056 25193 1593 1388 5.297 No Yes128 Calibration 8_9604 South of Welford WB Jun-05 TRADS 465000 277900 25193 26056 1790 1424 9.132 No No129 Calibration 8_9605 Rothwell EB Jun-05 TRADS 482809 280132 12754 26011 3039 2768 5.029 No Yes130 Calibration 8_9606 Rothwell WB Jun-05 TRADS 482810 280115 26008 12754 2446 2133 6.541 No Yes131 Calibration 8_9607 Kettering by pass EB Jun-05 TRADS 487097 275906 10389 10405 3034 2744 5.391 No Yes132 Calibration 8_9608 Kettering by pass WB Jun-05 TRADS 487086 275892 10405 10389 2940 2660 5.292 No Yes
133 Calibration 8_9671 West of Towcester, South of A5, North of A413 NB Jun-05 TRADS 468112 247125 2154 21154 1463 1329 3.592 Yes Yes
134 Calibration 8_9672 West of Towcester, South of A5, North of A413 SB Jun-05 TRADS 468112 247125 21154 2154 1943 1819 2.862 Yes Yes
135 Validation 8_30013656
TMU Site 6860/1 between A5 & M1 NB Jun-05 TRADS 471213 252696 2309 4246 1487 1950 11.176 No No
136 Validation 8_30013657
TMU Site 6860/1 between A5 & M1 SB Jun-05 TRADS 471209 252631 4246 2309 1614 1700 2.117 Yes Yes
137 Calibration 8_30014846
TMU Site 6859/1 between A422 near Brackley (east) &
A5NB Jun-05 TRADS 467582 244837 24777 24779 1188 1061 3.779 Yes Yes
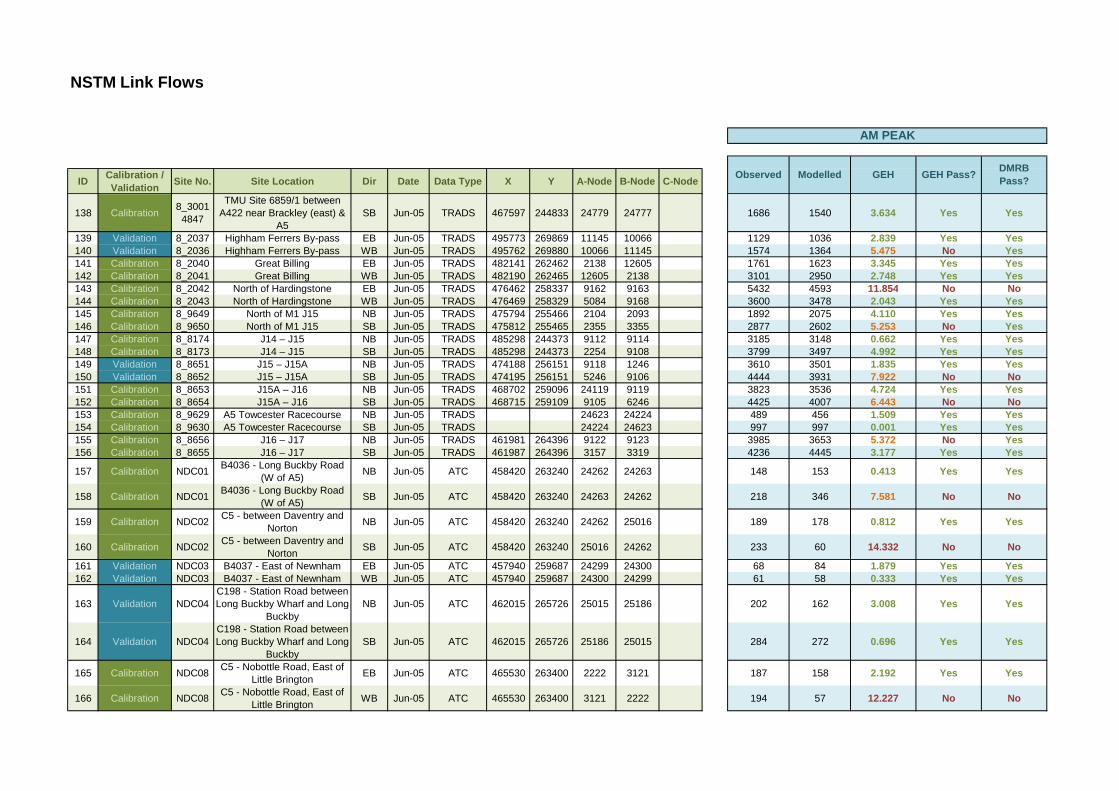
NSTM Link Flows
ID Calibration / Validation Site No. Site Location Dir Date Data Type X Y A-Node B-Node C-Node
AM PEAK
GEH GEH Pass? DMRB Pass?ModelledObserved
138 Calibration 8_30014847
TMU Site 6859/1 between A422 near Brackley (east) &
A5SB Jun-05 TRADS 467597 244833 24779 24777 1686 1540 3.634 Yes Yes
139 Validation 8_2037 Highham Ferrers By-pass EB Jun-05 TRADS 495773 269869 11145 10066 1129 1036 2.839 Yes Yes140 Validation 8_2036 Highham Ferrers By-pass WB Jun-05 TRADS 495762 269880 10066 11145 1574 1364 5.475 No Yes141 Calibration 8_2040 Great Billing EB Jun-05 TRADS 482141 262462 2138 12605 1761 1623 3.345 Yes Yes142 Calibration 8_2041 Great Billing WB Jun-05 TRADS 482190 262465 12605 2138 3101 2950 2.748 Yes Yes143 Calibration 8_2042 North of Hardingstone EB Jun-05 TRADS 476462 258337 9162 9163 5432 4593 11.854 No No144 Calibration 8_2043 North of Hardingstone WB Jun-05 TRADS 476469 258329 5084 9168 3600 3478 2.043 Yes Yes145 Calibration 8_9649 North of M1 J15 NB Jun-05 TRADS 475794 255466 2104 2093 1892 2075 4.110 Yes Yes146 Calibration 8_9650 North of M1 J15 SB Jun-05 TRADS 475812 255465 2355 3355 2877 2602 5.253 No Yes147 Calibration 8_8174 J14 – J15 NB Jun-05 TRADS 485298 244373 9112 9114 3185 3148 0.662 Yes Yes148 Calibration 8_8173 J14 – J15 SB Jun-05 TRADS 485298 244373 2254 9108 3799 3497 4.992 Yes Yes149 Validation 8_8651 J15 – J15A NB Jun-05 TRADS 474188 256151 9118 1246 3610 3501 1.835 Yes Yes150 Validation 8_8652 J15 – J15A SB Jun-05 TRADS 474195 256151 5246 9106 4444 3931 7.922 No No151 Calibration 8_8653 J15A – J16 NB Jun-05 TRADS 468702 259096 24119 9119 3823 3536 4.724 Yes Yes152 Calibration 8_8654 J15A – J16 SB Jun-05 TRADS 468715 259109 9105 6246 4425 4007 6.443 No No153 Calibration 8_9629 A5 Towcester Racecourse NB Jun-05 TRADS 24623 24224 489 456 1.509 Yes Yes154 Calibration 8_9630 A5 Towcester Racecourse SB Jun-05 TRADS 24224 24623 997 997 0.001 Yes Yes155 Calibration 8_8656 J16 – J17 NB Jun-05 TRADS 461981 264396 9122 9123 3985 3653 5.372 No Yes156 Calibration 8_8655 J16 – J17 SB Jun-05 TRADS 461987 264396 3157 3319 4236 4445 3.177 Yes Yes
157 Calibration NDC01 B4036 - Long Buckby Road (W of A5) NB Jun-05 ATC 458420 263240 24262 24263 148 153 0.413 Yes Yes
158 Calibration NDC01 B4036 - Long Buckby Road (W of A5) SB Jun-05 ATC 458420 263240 24263 24262 218 346 7.581 No No
159 Calibration NDC02 C5 - between Daventry and Norton NB Jun-05 ATC 458420 263240 24262 25016 189 178 0.812 Yes Yes
160 Calibration NDC02 C5 - between Daventry and Norton SB Jun-05 ATC 458420 263240 25016 24262 233 60 14.332 No No
161 Validation NDC03 B4037 - East of Newnham EB Jun-05 ATC 457940 259687 24299 24300 68 84 1.879 Yes Yes162 Validation NDC03 B4037 - East of Newnham WB Jun-05 ATC 457940 259687 24300 24299 61 58 0.333 Yes Yes
163 Validation NDC04C198 - Station Road between Long Buckby Wharf and Long
BuckbyNB Jun-05 ATC 462015 265726 25015 25186 202 162 3.008 Yes Yes
164 Validation NDC04C198 - Station Road between Long Buckby Wharf and Long
BuckbySB Jun-05 ATC 462015 265726 25186 25015 284 272 0.696 Yes Yes
165 Calibration NDC08 C5 - Nobottle Road, East of Little Brington EB Jun-05 ATC 465530 263400 2222 3121 187 158 2.192 Yes Yes
166 Calibration NDC08 C5 - Nobottle Road, East of Little Brington WB Jun-05 ATC 465530 263400 3121 2222 194 57 12.227 No No
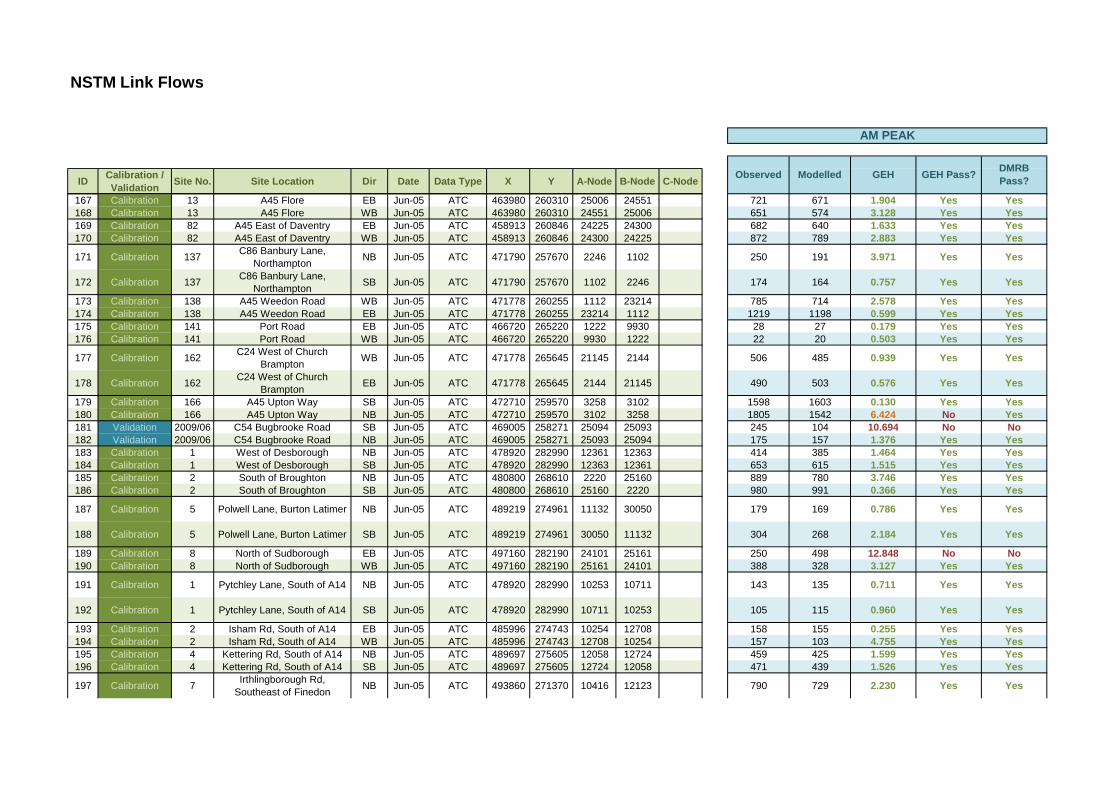
NSTM Link Flows
ID Calibration / Validation Site No. Site Location Dir Date Data Type X Y A-Node B-Node C-Node
AM PEAK
GEH GEH Pass? DMRB Pass?ModelledObserved
167 Calibration 13 A45 Flore EB Jun-05 ATC 463980 260310 25006 24551 721 671 1.904 Yes Yes168 Calibration 13 A45 Flore WB Jun-05 ATC 463980 260310 24551 25006 651 574 3.128 Yes Yes169 Calibration 82 A45 East of Daventry EB Jun-05 ATC 458913 260846 24225 24300 682 640 1.633 Yes Yes170 Calibration 82 A45 East of Daventry WB Jun-05 ATC 458913 260846 24300 24225 872 789 2.883 Yes Yes
171 Calibration 137 C86 Banbury Lane, Northampton NB Jun-05 ATC 471790 257670 2246 1102 250 191 3.971 Yes Yes
172 Calibration 137 C86 Banbury Lane, Northampton SB Jun-05 ATC 471790 257670 1102 2246 174 164 0.757 Yes Yes
173 Calibration 138 A45 Weedon Road WB Jun-05 ATC 471778 260255 1112 23214 785 714 2.578 Yes Yes174 Calibration 138 A45 Weedon Road EB Jun-05 ATC 471778 260255 23214 1112 1219 1198 0.599 Yes Yes175 Calibration 141 Port Road EB Jun-05 ATC 466720 265220 1222 9930 28 27 0.179 Yes Yes176 Calibration 141 Port Road WB Jun-05 ATC 466720 265220 9930 1222 22 20 0.503 Yes Yes
177 Calibration 162 C24 West of Church Brampton WB Jun-05 ATC 471778 265645 21145 2144 506 485 0.939 Yes Yes
178 Calibration 162 C24 West of Church Brampton EB Jun-05 ATC 471778 265645 2144 21145 490 503 0.576 Yes Yes
179 Calibration 166 A45 Upton Way SB Jun-05 ATC 472710 259570 3258 3102 1598 1603 0.130 Yes Yes180 Calibration 166 A45 Upton Way NB Jun-05 ATC 472710 259570 3102 3258 1805 1542 6.424 No Yes181 Validation 2009/06 C54 Bugbrooke Road SB Jun-05 ATC 469005 258271 25094 25093 245 104 10.694 No No182 Validation 2009/06 C54 Bugbrooke Road NB Jun-05 ATC 469005 258271 25093 25094 175 157 1.376 Yes Yes183 Calibration 1 West of Desborough NB Jun-05 ATC 478920 282990 12361 12363 414 385 1.464 Yes Yes184 Calibration 1 West of Desborough SB Jun-05 ATC 478920 282990 12363 12361 653 615 1.515 Yes Yes185 Calibration 2 South of Broughton NB Jun-05 ATC 480800 268610 2220 25160 889 780 3.746 Yes Yes186 Calibration 2 South of Broughton SB Jun-05 ATC 480800 268610 25160 2220 980 991 0.366 Yes Yes
187 Calibration 5 Polwell Lane, Burton Latimer NB Jun-05 ATC 489219 274961 11132 30050 179 169 0.786 Yes Yes
188 Calibration 5 Polwell Lane, Burton Latimer SB Jun-05 ATC 489219 274961 30050 11132 304 268 2.184 Yes Yes
189 Calibration 8 North of Sudborough EB Jun-05 ATC 497160 282190 24101 25161 250 498 12.848 No No190 Calibration 8 North of Sudborough WB Jun-05 ATC 497160 282190 25161 24101 388 328 3.127 Yes Yes
191 Calibration 1 Pytchley Lane, South of A14 NB Jun-05 ATC 478920 282990 10253 10711 143 135 0.711 Yes Yes
192 Calibration 1 Pytchley Lane, South of A14 SB Jun-05 ATC 478920 282990 10711 10253 105 115 0.960 Yes Yes
193 Calibration 2 Isham Rd, South of A14 EB Jun-05 ATC 485996 274743 10254 12708 158 155 0.255 Yes Yes194 Calibration 2 Isham Rd, South of A14 WB Jun-05 ATC 485996 274743 12708 10254 157 103 4.755 Yes Yes195 Calibration 4 Kettering Rd, South of A14 NB Jun-05 ATC 489697 275605 12058 12724 459 425 1.599 Yes Yes196 Calibration 4 Kettering Rd, South of A14 SB Jun-05 ATC 489697 275605 12724 12058 471 439 1.526 Yes Yes
197 Calibration 7 Irthlingborough Rd, Southeast of Finedon NB Jun-05 ATC 493860 271370 10416 12123 790 729 2.230 Yes Yes
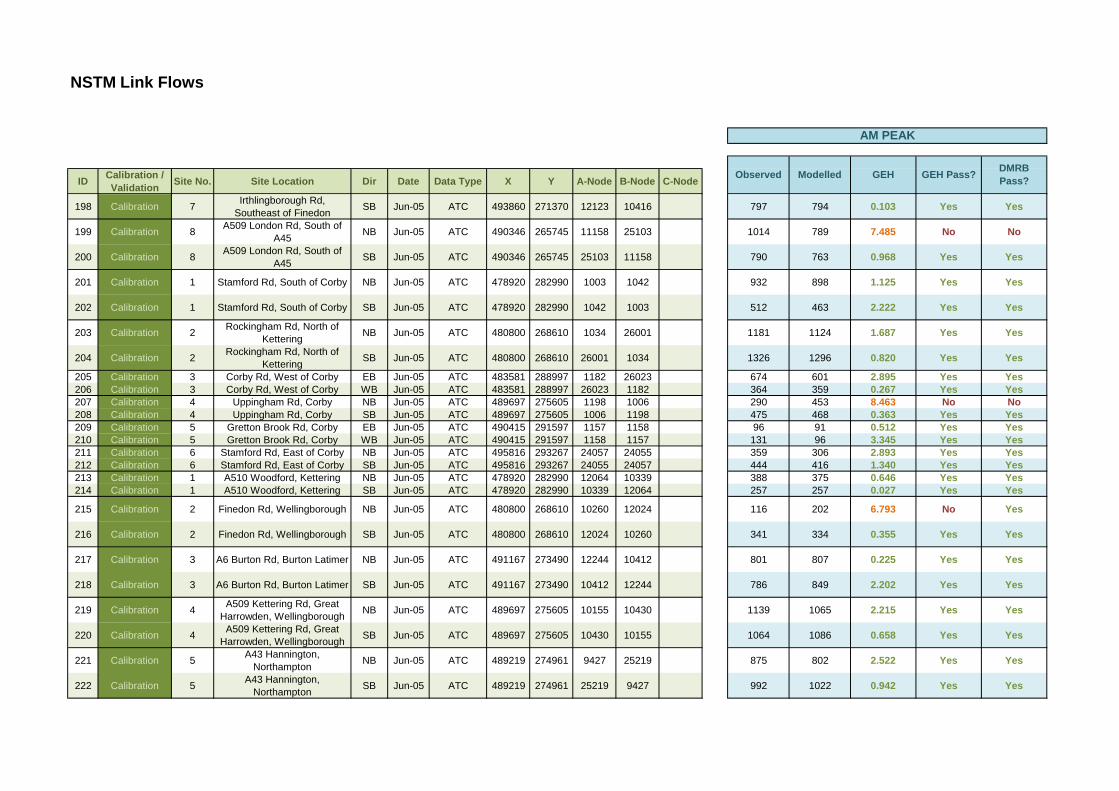
NSTM Link Flows
ID Calibration / Validation Site No. Site Location Dir Date Data Type X Y A-Node B-Node C-Node
AM PEAK
GEH GEH Pass? DMRB Pass?ModelledObserved
198 Calibration 7 Irthlingborough Rd, Southeast of Finedon SB Jun-05 ATC 493860 271370 12123 10416 797 794 0.103 Yes Yes
199 Calibration 8 A509 London Rd, South of A45 NB Jun-05 ATC 490346 265745 11158 25103 1014 789 7.485 No No
200 Calibration 8 A509 London Rd, South of A45 SB Jun-05 ATC 490346 265745 25103 11158 790 763 0.968 Yes Yes
201 Calibration 1 Stamford Rd, South of Corby NB Jun-05 ATC 478920 282990 1003 1042 932 898 1.125 Yes Yes
202 Calibration 1 Stamford Rd, South of Corby SB Jun-05 ATC 478920 282990 1042 1003 512 463 2.222 Yes Yes
203 Calibration 2 Rockingham Rd, North of Kettering NB Jun-05 ATC 480800 268610 1034 26001 1181 1124 1.687 Yes Yes
204 Calibration 2 Rockingham Rd, North of Kettering SB Jun-05 ATC 480800 268610 26001 1034 1326 1296 0.820 Yes Yes
205 Calibration 3 Corby Rd, West of Corby EB Jun-05 ATC 483581 288997 1182 26023 674 601 2.895 Yes Yes206 Calibration 3 Corby Rd, West of Corby WB Jun-05 ATC 483581 288997 26023 1182 364 359 0.267 Yes Yes207 Calibration 4 Uppingham Rd, Corby NB Jun-05 ATC 489697 275605 1198 1006 290 453 8.463 No No208 Calibration 4 Uppingham Rd, Corby SB Jun-05 ATC 489697 275605 1006 1198 475 468 0.363 Yes Yes209 Calibration 5 Gretton Brook Rd, Corby EB Jun-05 ATC 490415 291597 1157 1158 96 91 0.512 Yes Yes210 Calibration 5 Gretton Brook Rd, Corby WB Jun-05 ATC 490415 291597 1158 1157 131 96 3.345 Yes Yes211 Calibration 6 Stamford Rd, East of Corby NB Jun-05 ATC 495816 293267 24057 24055 359 306 2.893 Yes Yes212 Calibration 6 Stamford Rd, East of Corby SB Jun-05 ATC 495816 293267 24055 24057 444 416 1.340 Yes Yes213 Calibration 1 A510 Woodford, Kettering NB Jun-05 ATC 478920 282990 12064 10339 388 375 0.646 Yes Yes214 Calibration 1 A510 Woodford, Kettering SB Jun-05 ATC 478920 282990 10339 12064 257 257 0.027 Yes Yes
215 Calibration 2 Finedon Rd, Wellingborough NB Jun-05 ATC 480800 268610 10260 12024 116 202 6.793 No Yes
216 Calibration 2 Finedon Rd, Wellingborough SB Jun-05 ATC 480800 268610 12024 10260 341 334 0.355 Yes Yes
217 Calibration 3 A6 Burton Rd, Burton Latimer NB Jun-05 ATC 491167 273490 12244 10412 801 807 0.225 Yes Yes
218 Calibration 3 A6 Burton Rd, Burton Latimer SB Jun-05 ATC 491167 273490 10412 12244 786 849 2.202 Yes Yes
219 Calibration 4 A509 Kettering Rd, Great Harrowden, Wellingborough NB Jun-05 ATC 489697 275605 10155 10430 1139 1065 2.215 Yes Yes
220 Calibration 4 A509 Kettering Rd, Great Harrowden, Wellingborough SB Jun-05 ATC 489697 275605 10430 10155 1064 1086 0.658 Yes Yes
221 Calibration 5 A43 Hannington, Northampton NB Jun-05 ATC 489219 274961 9427 25219 875 802 2.522 Yes Yes
222 Calibration 5 A43 Hannington, Northampton SB Jun-05 ATC 489219 274961 25219 9427 992 1022 0.942 Yes Yes
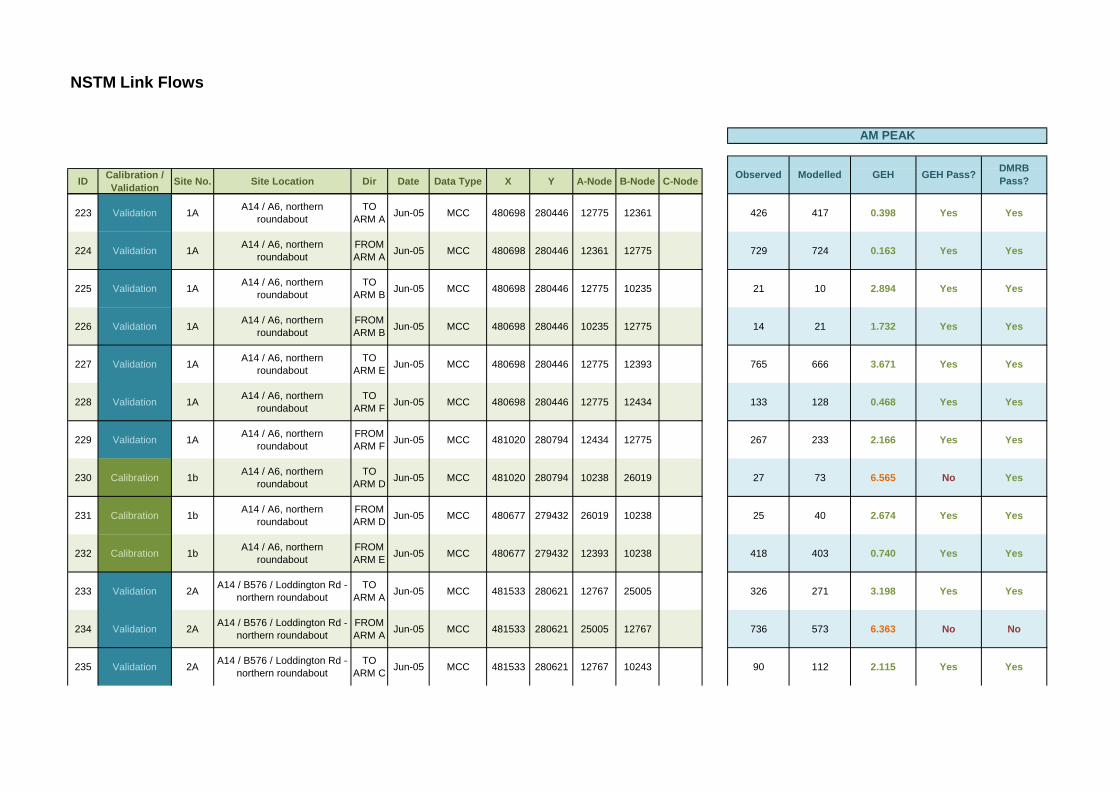
NSTM Link Flows
ID Calibration / Validation Site No. Site Location Dir Date Data Type X Y A-Node B-Node C-Node
AM PEAK
GEH GEH Pass? DMRB Pass?ModelledObserved
223 Validation 1A A14 / A6, northern roundabout
TO ARM A Jun-05 MCC 480698 280446 12775 12361 426 417 0.398 Yes Yes
224 Validation 1A A14 / A6, northern roundabout
FROM ARM A Jun-05 MCC 480698 280446 12361 12775 729 724 0.163 Yes Yes
225 Validation 1A A14 / A6, northern roundabout
TO ARM B Jun-05 MCC 480698 280446 12775 10235 21 10 2.894 Yes Yes
226 Validation 1A A14 / A6, northern roundabout
FROM ARM B Jun-05 MCC 480698 280446 10235 12775 14 21 1.732 Yes Yes
227 Validation 1A A14 / A6, northern roundabout
TO ARM E Jun-05 MCC 480698 280446 12775 12393 765 666 3.671 Yes Yes
228 Validation 1A A14 / A6, northern roundabout
TO ARM F Jun-05 MCC 480698 280446 12775 12434 133 128 0.468 Yes Yes
229 Validation 1A A14 / A6, northern roundabout
FROM ARM F Jun-05 MCC 481020 280794 12434 12775 267 233 2.166 Yes Yes
230 Calibration 1b A14 / A6, northern roundabout
TO ARM D Jun-05 MCC 481020 280794 10238 26019 27 73 6.565 No Yes
231 Calibration 1b A14 / A6, northern roundabout
FROM ARM D Jun-05 MCC 480677 279432 26019 10238 25 40 2.674 Yes Yes
232 Calibration 1b A14 / A6, northern roundabout
FROM ARM E Jun-05 MCC 480677 279432 12393 10238 418 403 0.740 Yes Yes
233 Validation 2A A14 / B576 / Loddington Rd - northern roundabout
TO ARM A Jun-05 MCC 481533 280621 12767 25005 326 271 3.198 Yes Yes
234 Validation 2A A14 / B576 / Loddington Rd - northern roundabout
FROM ARM A Jun-05 MCC 481533 280621 25005 12767 736 573 6.363 No No
235 Validation 2A A14 / B576 / Loddington Rd - northern roundabout
TO ARM C Jun-05 MCC 481533 280621 12767 10243 90 112 2.115 Yes Yes
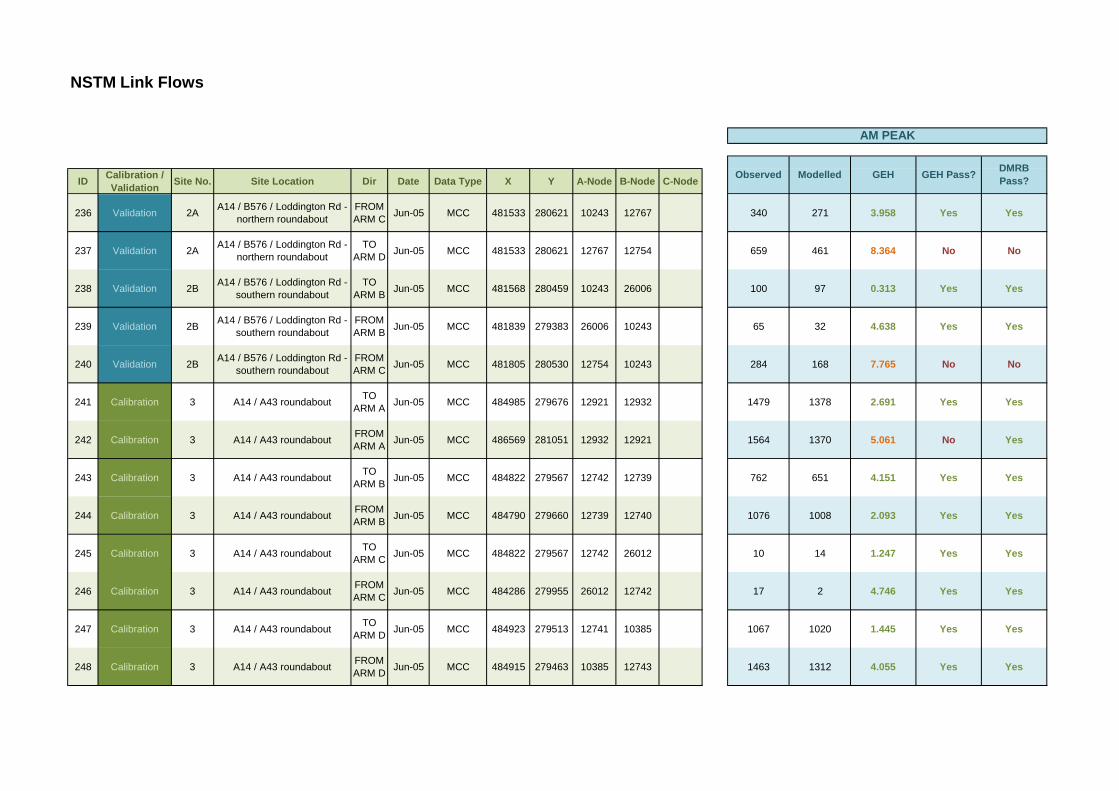
NSTM Link Flows
ID Calibration / Validation Site No. Site Location Dir Date Data Type X Y A-Node B-Node C-Node
AM PEAK
GEH GEH Pass? DMRB Pass?ModelledObserved
236 Validation 2A A14 / B576 / Loddington Rd - northern roundabout
FROM ARM C Jun-05 MCC 481533 280621 10243 12767 340 271 3.958 Yes Yes
237 Validation 2A A14 / B576 / Loddington Rd - northern roundabout
TO ARM D Jun-05 MCC 481533 280621 12767 12754 659 461 8.364 No No
238 Validation 2B A14 / B576 / Loddington Rd - southern roundabout
TO ARM B Jun-05 MCC 481568 280459 10243 26006 100 97 0.313 Yes Yes
239 Validation 2B A14 / B576 / Loddington Rd - southern roundabout
FROM ARM B Jun-05 MCC 481839 279383 26006 10243 65 32 4.638 Yes Yes
240 Validation 2B A14 / B576 / Loddington Rd - southern roundabout
FROM ARM C Jun-05 MCC 481805 280530 12754 10243 284 168 7.765 No No
241 Calibration 3 A14 / A43 roundabout TO ARM A Jun-05 MCC 484985 279676 12921 12932 1479 1378 2.691 Yes Yes
242 Calibration 3 A14 / A43 roundabout FROM ARM A Jun-05 MCC 486569 281051 12932 12921 1564 1370 5.061 No Yes
243 Calibration 3 A14 / A43 roundabout TO ARM B Jun-05 MCC 484822 279567 12742 12739 762 651 4.151 Yes Yes
244 Calibration 3 A14 / A43 roundabout FROM ARM B Jun-05 MCC 484790 279660 12739 12740 1076 1008 2.093 Yes Yes
245 Calibration 3 A14 / A43 roundabout TO ARM C Jun-05 MCC 484822 279567 12742 26012 10 14 1.247 Yes Yes
246 Calibration 3 A14 / A43 roundabout FROM ARM C Jun-05 MCC 484286 279955 26012 12742 17 2 4.746 Yes Yes
247 Calibration 3 A14 / A43 roundabout TO ARM D Jun-05 MCC 484923 279513 12741 10385 1067 1020 1.445 Yes Yes
248 Calibration 3 A14 / A43 roundabout FROM ARM D Jun-05 MCC 484915 279463 10385 12743 1463 1312 4.055 Yes Yes
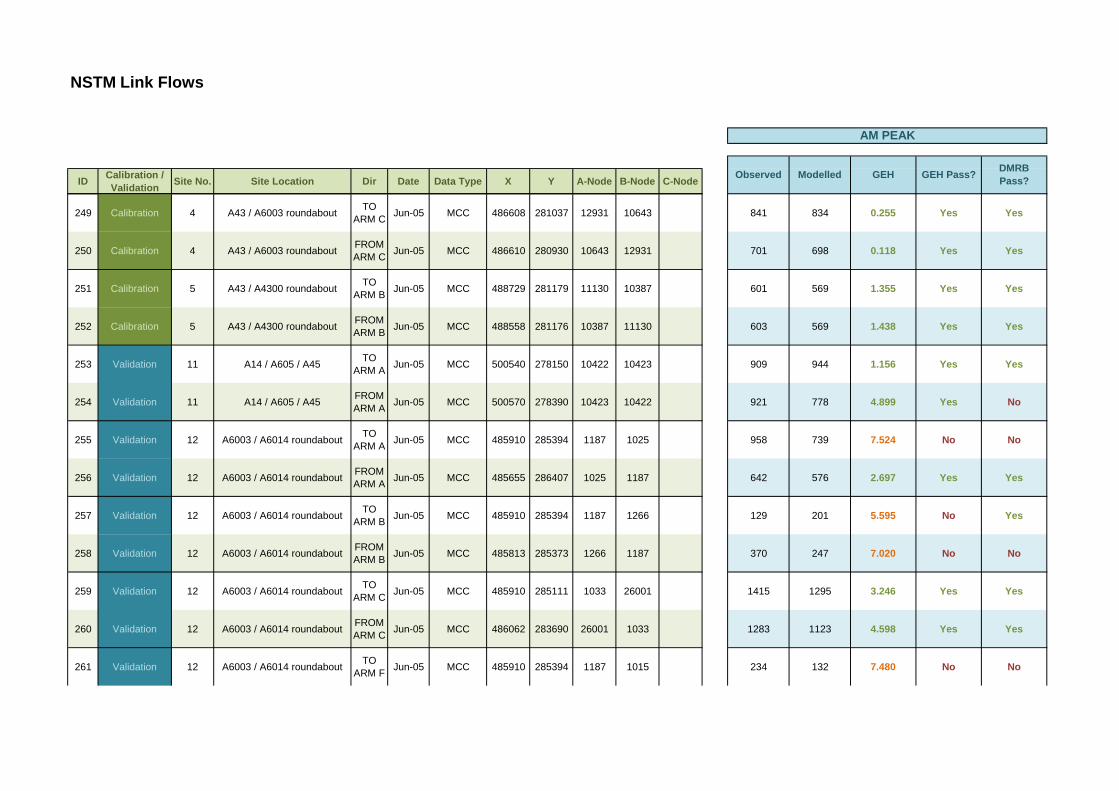
NSTM Link Flows
ID Calibration / Validation Site No. Site Location Dir Date Data Type X Y A-Node B-Node C-Node
AM PEAK
GEH GEH Pass? DMRB Pass?ModelledObserved
249 Calibration 4 A43 / A6003 roundabout TO ARM C Jun-05 MCC 486608 281037 12931 10643 841 834 0.255 Yes Yes
250 Calibration 4 A43 / A6003 roundabout FROM ARM C Jun-05 MCC 486610 280930 10643 12931 701 698 0.118 Yes Yes
251 Calibration 5 A43 / A4300 roundabout TO ARM B Jun-05 MCC 488729 281179 11130 10387 601 569 1.355 Yes Yes
252 Calibration 5 A43 / A4300 roundabout FROM ARM B Jun-05 MCC 488558 281176 10387 11130 603 569 1.438 Yes Yes
253 Validation 11 A14 / A605 / A45 TO ARM A Jun-05 MCC 500540 278150 10422 10423 909 944 1.156 Yes Yes
254 Validation 11 A14 / A605 / A45 FROM ARM A Jun-05 MCC 500570 278390 10423 10422 921 778 4.899 Yes No
255 Validation 12 A6003 / A6014 roundabout TO ARM A Jun-05 MCC 485910 285394 1187 1025 958 739 7.524 No No
256 Validation 12 A6003 / A6014 roundabout FROM ARM A Jun-05 MCC 485655 286407 1025 1187 642 576 2.697 Yes Yes
257 Validation 12 A6003 / A6014 roundabout TO ARM B Jun-05 MCC 485910 285394 1187 1266 129 201 5.595 No Yes
258 Validation 12 A6003 / A6014 roundabout FROM ARM B Jun-05 MCC 485813 285373 1266 1187 370 247 7.020 No No
259 Validation 12 A6003 / A6014 roundabout TO ARM C Jun-05 MCC 485910 285111 1033 26001 1415 1295 3.246 Yes Yes
260 Validation 12 A6003 / A6014 roundabout FROM ARM C Jun-05 MCC 486062 283690 26001 1033 1283 1123 4.598 Yes Yes
261 Validation 12 A6003 / A6014 roundabout TO ARM F Jun-05 MCC 485910 285394 1187 1015 234 132 7.480 No No
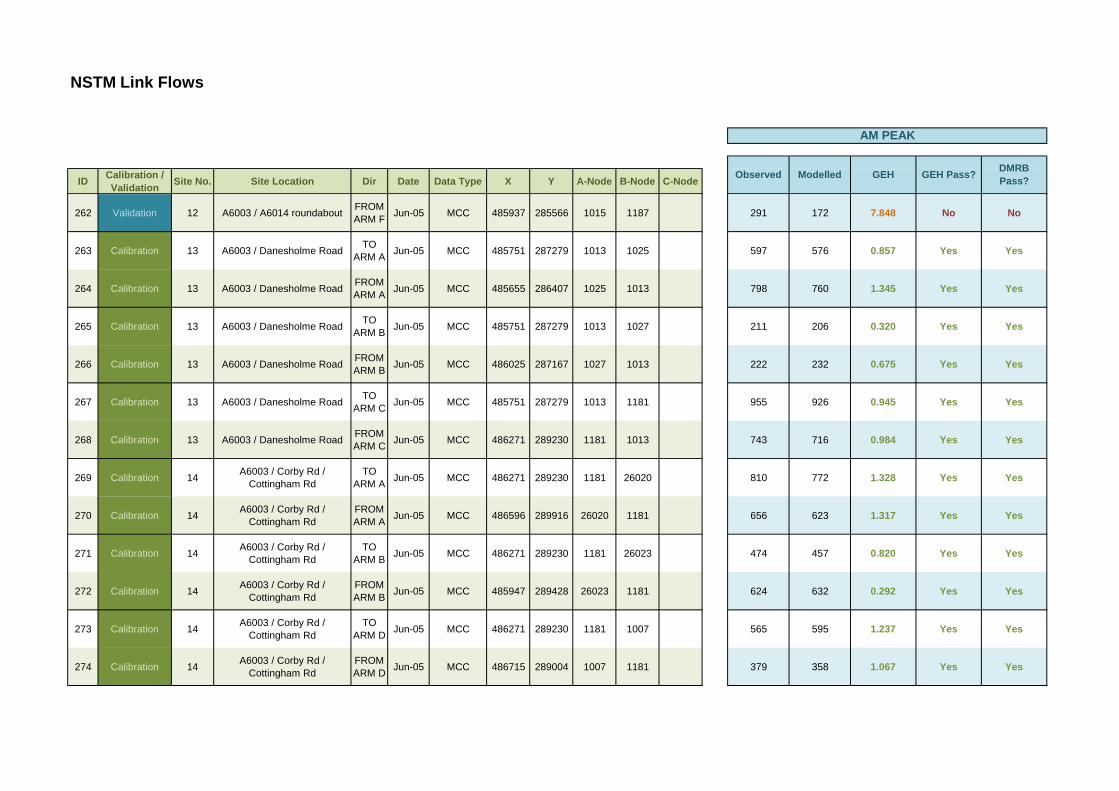
NSTM Link Flows
ID Calibration / Validation Site No. Site Location Dir Date Data Type X Y A-Node B-Node C-Node
AM PEAK
GEH GEH Pass? DMRB Pass?ModelledObserved
262 Validation 12 A6003 / A6014 roundabout FROM ARM F Jun-05 MCC 485937 285566 1015 1187 291 172 7.848 No No
263 Calibration 13 A6003 / Danesholme Road TO ARM A Jun-05 MCC 485751 287279 1013 1025 597 576 0.857 Yes Yes
264 Calibration 13 A6003 / Danesholme Road FROM ARM A Jun-05 MCC 485655 286407 1025 1013 798 760 1.345 Yes Yes
265 Calibration 13 A6003 / Danesholme Road TO ARM B Jun-05 MCC 485751 287279 1013 1027 211 206 0.320 Yes Yes
266 Calibration 13 A6003 / Danesholme Road FROM ARM B Jun-05 MCC 486025 287167 1027 1013 222 232 0.675 Yes Yes
267 Calibration 13 A6003 / Danesholme Road TO ARM C Jun-05 MCC 485751 287279 1013 1181 955 926 0.945 Yes Yes
268 Calibration 13 A6003 / Danesholme Road FROM ARM C Jun-05 MCC 486271 289230 1181 1013 743 716 0.984 Yes Yes
269 Calibration 14 A6003 / Corby Rd / Cottingham Rd
TO ARM A Jun-05 MCC 486271 289230 1181 26020 810 772 1.328 Yes Yes
270 Calibration 14 A6003 / Corby Rd / Cottingham Rd
FROM ARM A Jun-05 MCC 486596 289916 26020 1181 656 623 1.317 Yes Yes
271 Calibration 14 A6003 / Corby Rd / Cottingham Rd
TO ARM B Jun-05 MCC 486271 289230 1181 26023 474 457 0.820 Yes Yes
272 Calibration 14 A6003 / Corby Rd / Cottingham Rd
FROM ARM B Jun-05 MCC 485947 289428 26023 1181 624 632 0.292 Yes Yes
273 Calibration 14 A6003 / Corby Rd / Cottingham Rd
TO ARM D Jun-05 MCC 486271 289230 1181 1007 565 595 1.237 Yes Yes
274 Calibration 14 A6003 / Corby Rd / Cottingham Rd
FROM ARM D Jun-05 MCC 486715 289004 1007 1181 379 358 1.067 Yes Yes
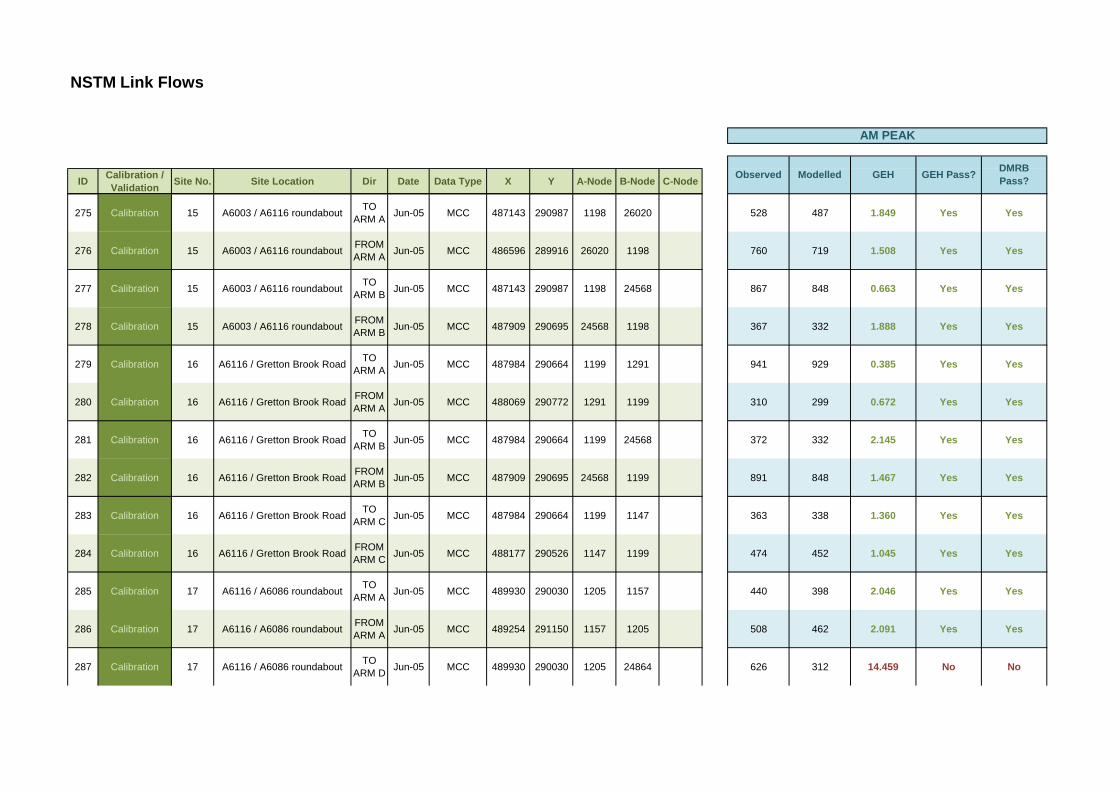
NSTM Link Flows
ID Calibration / Validation Site No. Site Location Dir Date Data Type X Y A-Node B-Node C-Node
AM PEAK
GEH GEH Pass? DMRB Pass?ModelledObserved
275 Calibration 15 A6003 / A6116 roundabout TO ARM A Jun-05 MCC 487143 290987 1198 26020 528 487 1.849 Yes Yes
276 Calibration 15 A6003 / A6116 roundabout FROM ARM A Jun-05 MCC 486596 289916 26020 1198 760 719 1.508 Yes Yes
277 Calibration 15 A6003 / A6116 roundabout TO ARM B Jun-05 MCC 487143 290987 1198 24568 867 848 0.663 Yes Yes
278 Calibration 15 A6003 / A6116 roundabout FROM ARM B Jun-05 MCC 487909 290695 24568 1198 367 332 1.888 Yes Yes
279 Calibration 16 A6116 / Gretton Brook Road TO ARM A Jun-05 MCC 487984 290664 1199 1291 941 929 0.385 Yes Yes
280 Calibration 16 A6116 / Gretton Brook Road FROM ARM A Jun-05 MCC 488069 290772 1291 1199 310 299 0.672 Yes Yes
281 Calibration 16 A6116 / Gretton Brook Road TO ARM B Jun-05 MCC 487984 290664 1199 24568 372 332 2.145 Yes Yes
282 Calibration 16 A6116 / Gretton Brook Road FROM ARM B Jun-05 MCC 487909 290695 24568 1199 891 848 1.467 Yes Yes
283 Calibration 16 A6116 / Gretton Brook Road TO ARM C Jun-05 MCC 487984 290664 1199 1147 363 338 1.360 Yes Yes
284 Calibration 16 A6116 / Gretton Brook Road FROM ARM C Jun-05 MCC 488177 290526 1147 1199 474 452 1.045 Yes Yes
285 Calibration 17 A6116 / A6086 roundabout TO ARM A Jun-05 MCC 489930 290030 1205 1157 440 398 2.046 Yes Yes
286 Calibration 17 A6116 / A6086 roundabout FROM ARM A Jun-05 MCC 489254 291150 1157 1205 508 462 2.091 Yes Yes
287 Calibration 17 A6116 / A6086 roundabout TO ARM D Jun-05 MCC 489930 290030 1205 24864 626 312 14.459 No No
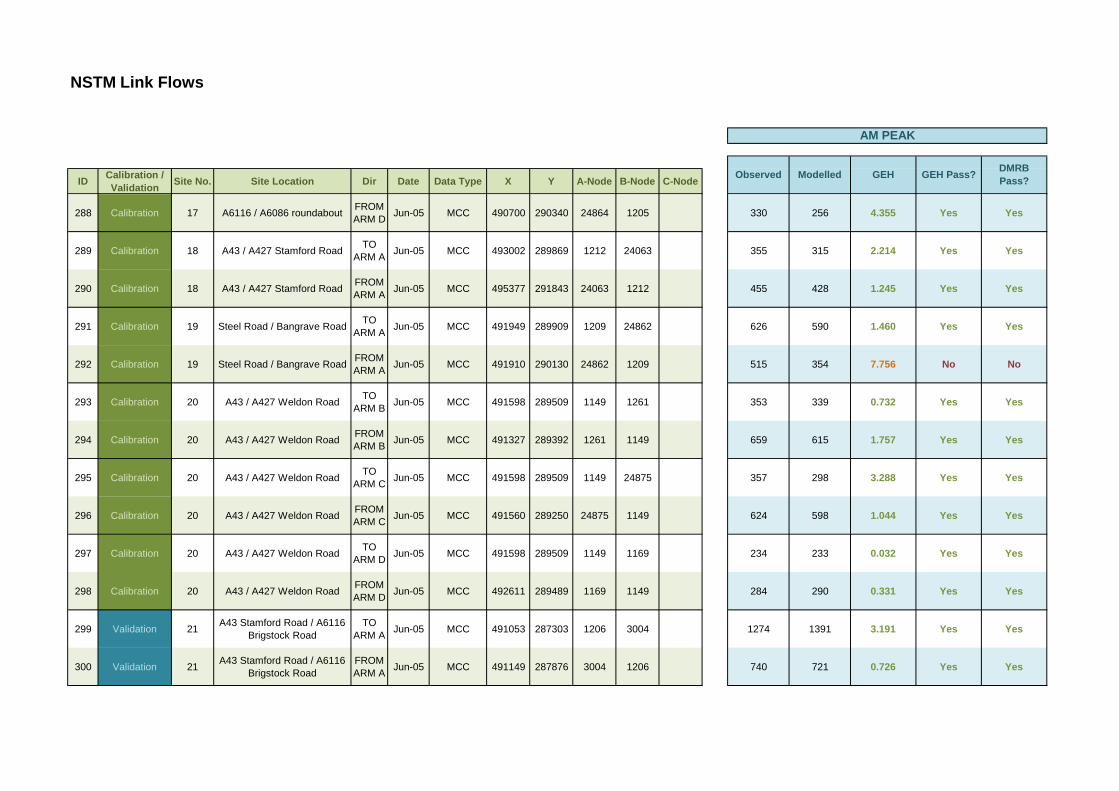
NSTM Link Flows
ID Calibration / Validation Site No. Site Location Dir Date Data Type X Y A-Node B-Node C-Node
AM PEAK
GEH GEH Pass? DMRB Pass?ModelledObserved
288 Calibration 17 A6116 / A6086 roundabout FROM ARM D Jun-05 MCC 490700 290340 24864 1205 330 256 4.355 Yes Yes
289 Calibration 18 A43 / A427 Stamford Road TO ARM A Jun-05 MCC 493002 289869 1212 24063 355 315 2.214 Yes Yes
290 Calibration 18 A43 / A427 Stamford Road FROM ARM A Jun-05 MCC 495377 291843 24063 1212 455 428 1.245 Yes Yes
291 Calibration 19 Steel Road / Bangrave Road TO ARM A Jun-05 MCC 491949 289909 1209 24862 626 590 1.460 Yes Yes
292 Calibration 19 Steel Road / Bangrave Road FROM ARM A Jun-05 MCC 491910 290130 24862 1209 515 354 7.756 No No
293 Calibration 20 A43 / A427 Weldon Road TO ARM B Jun-05 MCC 491598 289509 1149 1261 353 339 0.732 Yes Yes
294 Calibration 20 A43 / A427 Weldon Road FROM ARM B Jun-05 MCC 491327 289392 1261 1149 659 615 1.757 Yes Yes
295 Calibration 20 A43 / A427 Weldon Road TO ARM C Jun-05 MCC 491598 289509 1149 24875 357 298 3.288 Yes Yes
296 Calibration 20 A43 / A427 Weldon Road FROM ARM C Jun-05 MCC 491560 289250 24875 1149 624 598 1.044 Yes Yes
297 Calibration 20 A43 / A427 Weldon Road TO ARM D Jun-05 MCC 491598 289509 1149 1169 234 233 0.032 Yes Yes
298 Calibration 20 A43 / A427 Weldon Road FROM ARM D Jun-05 MCC 492611 289489 1169 1149 284 290 0.331 Yes Yes
299 Validation 21 A43 Stamford Road / A6116 Brigstock Road
TO ARM A Jun-05 MCC 491053 287303 1206 3004 1274 1391 3.191 Yes Yes
300 Validation 21 A43 Stamford Road / A6116 Brigstock Road
FROM ARM A Jun-05 MCC 491149 287876 3004 1206 740 721 0.726 Yes Yes
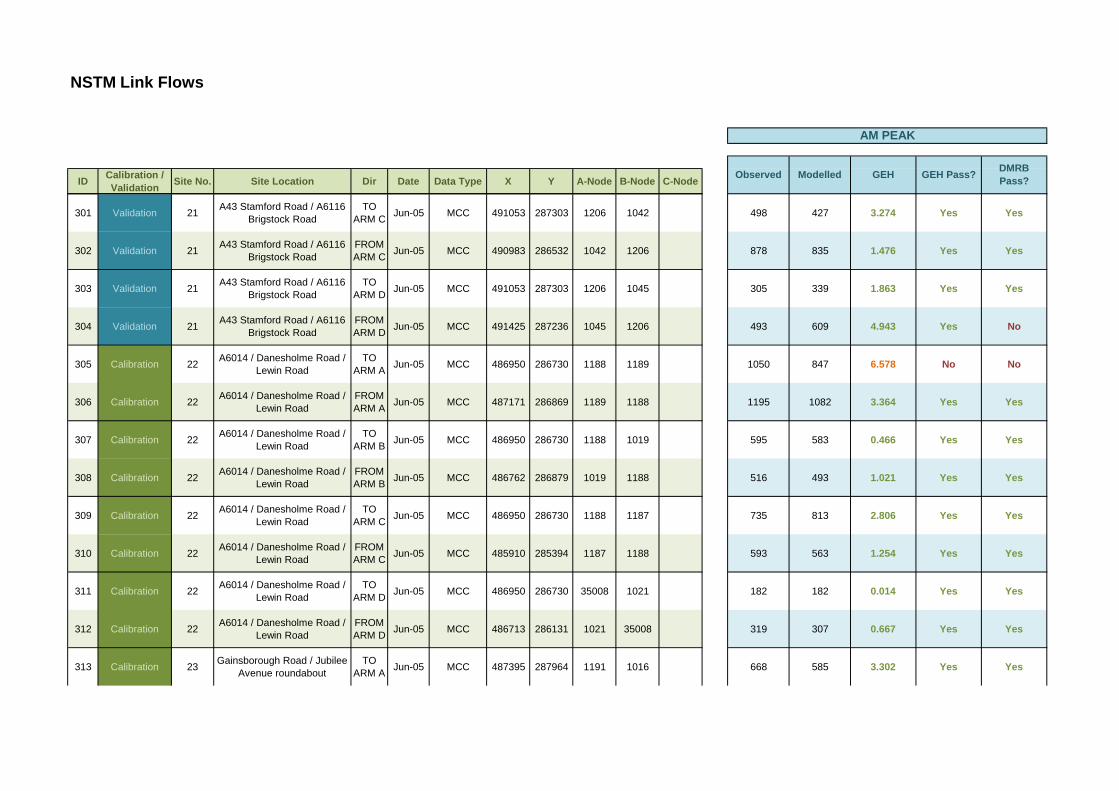
NSTM Link Flows
ID Calibration / Validation Site No. Site Location Dir Date Data Type X Y A-Node B-Node C-Node
AM PEAK
GEH GEH Pass? DMRB Pass?ModelledObserved
301 Validation 21 A43 Stamford Road / A6116 Brigstock Road
TO ARM C Jun-05 MCC 491053 287303 1206 1042 498 427 3.274 Yes Yes
302 Validation 21 A43 Stamford Road / A6116 Brigstock Road
FROM ARM C Jun-05 MCC 490983 286532 1042 1206 878 835 1.476 Yes Yes
303 Validation 21 A43 Stamford Road / A6116 Brigstock Road
TO ARM D Jun-05 MCC 491053 287303 1206 1045 305 339 1.863 Yes Yes
304 Validation 21 A43 Stamford Road / A6116 Brigstock Road
FROM ARM D Jun-05 MCC 491425 287236 1045 1206 493 609 4.943 Yes No
305 Calibration 22 A6014 / Danesholme Road / Lewin Road
TO ARM A Jun-05 MCC 486950 286730 1188 1189 1050 847 6.578 No No
306 Calibration 22 A6014 / Danesholme Road / Lewin Road
FROM ARM A Jun-05 MCC 487171 286869 1189 1188 1195 1082 3.364 Yes Yes
307 Calibration 22 A6014 / Danesholme Road / Lewin Road
TO ARM B Jun-05 MCC 486950 286730 1188 1019 595 583 0.466 Yes Yes
308 Calibration 22 A6014 / Danesholme Road / Lewin Road
FROM ARM B Jun-05 MCC 486762 286879 1019 1188 516 493 1.021 Yes Yes
309 Calibration 22 A6014 / Danesholme Road / Lewin Road
TO ARM C Jun-05 MCC 486950 286730 1188 1187 735 813 2.806 Yes Yes
310 Calibration 22 A6014 / Danesholme Road / Lewin Road
FROM ARM C Jun-05 MCC 485910 285394 1187 1188 593 563 1.254 Yes Yes
311 Calibration 22 A6014 / Danesholme Road / Lewin Road
TO ARM D Jun-05 MCC 486950 286730 35008 1021 182 182 0.014 Yes Yes
312 Calibration 22 A6014 / Danesholme Road / Lewin Road
FROM ARM D Jun-05 MCC 486713 286131 1021 35008 319 307 0.667 Yes Yes
313 Calibration 23 Gainsborough Road / Jubilee Avenue roundabout
TO ARM A Jun-05 MCC 487395 287964 1191 1016 668 585 3.302 Yes Yes
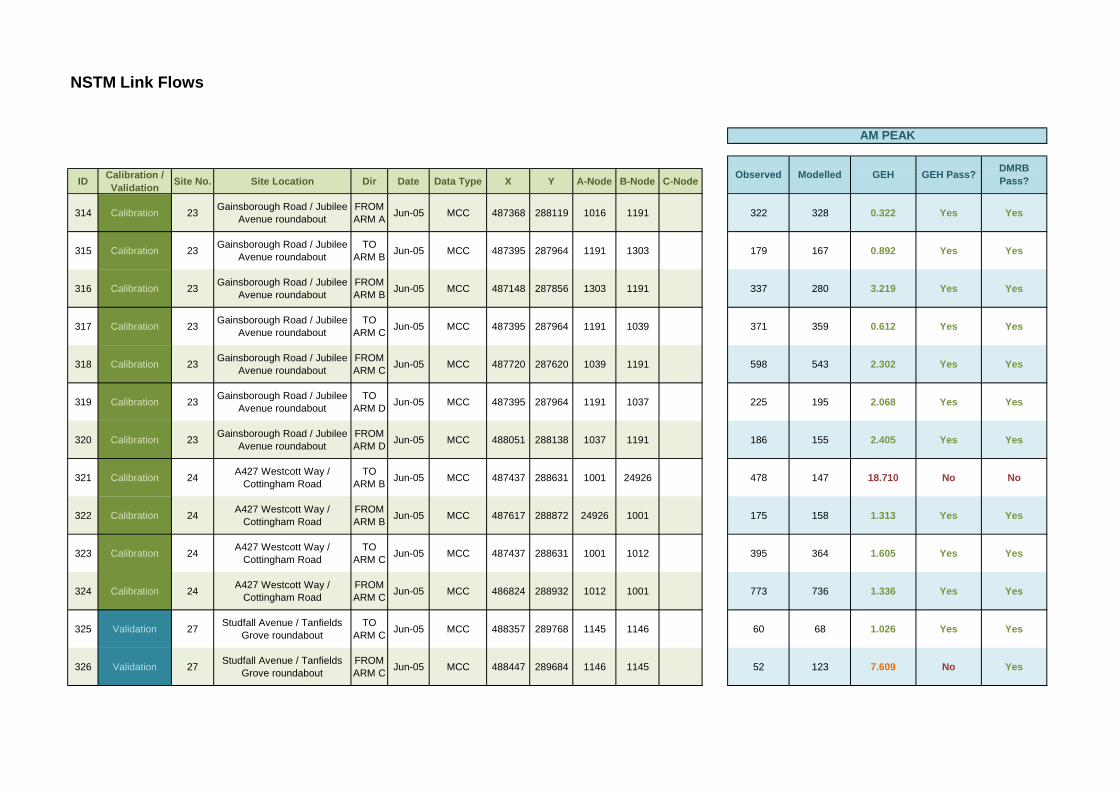
NSTM Link Flows
ID Calibration / Validation Site No. Site Location Dir Date Data Type X Y A-Node B-Node C-Node
AM PEAK
GEH GEH Pass? DMRB Pass?ModelledObserved
314 Calibration 23 Gainsborough Road / Jubilee Avenue roundabout
FROM ARM A Jun-05 MCC 487368 288119 1016 1191 322 328 0.322 Yes Yes
315 Calibration 23 Gainsborough Road / Jubilee Avenue roundabout
TO ARM B Jun-05 MCC 487395 287964 1191 1303 179 167 0.892 Yes Yes
316 Calibration 23 Gainsborough Road / Jubilee Avenue roundabout
FROM ARM B Jun-05 MCC 487148 287856 1303 1191 337 280 3.219 Yes Yes
317 Calibration 23 Gainsborough Road / Jubilee Avenue roundabout
TO ARM C Jun-05 MCC 487395 287964 1191 1039 371 359 0.612 Yes Yes
318 Calibration 23 Gainsborough Road / Jubilee Avenue roundabout
FROM ARM C Jun-05 MCC 487720 287620 1039 1191 598 543 2.302 Yes Yes
319 Calibration 23 Gainsborough Road / Jubilee Avenue roundabout
TO ARM D Jun-05 MCC 487395 287964 1191 1037 225 195 2.068 Yes Yes
320 Calibration 23 Gainsborough Road / Jubilee Avenue roundabout
FROM ARM D Jun-05 MCC 488051 288138 1037 1191 186 155 2.405 Yes Yes
321 Calibration 24 A427 Westcott Way / Cottingham Road
TO ARM B Jun-05 MCC 487437 288631 1001 24926 478 147 18.710 No No
322 Calibration 24 A427 Westcott Way / Cottingham Road
FROM ARM B Jun-05 MCC 487617 288872 24926 1001 175 158 1.313 Yes Yes
323 Calibration 24 A427 Westcott Way / Cottingham Road
TO ARM C Jun-05 MCC 487437 288631 1001 1012 395 364 1.605 Yes Yes
324 Calibration 24 A427 Westcott Way / Cottingham Road
FROM ARM C Jun-05 MCC 486824 288932 1012 1001 773 736 1.336 Yes Yes
325 Validation 27 Studfall Avenue / Tanfields Grove roundabout
TO ARM C Jun-05 MCC 488357 289768 1145 1146 60 68 1.026 Yes Yes
326 Validation 27 Studfall Avenue / Tanfields Grove roundabout
FROM ARM C Jun-05 MCC 488447 289684 1146 1145 52 123 7.609 No Yes
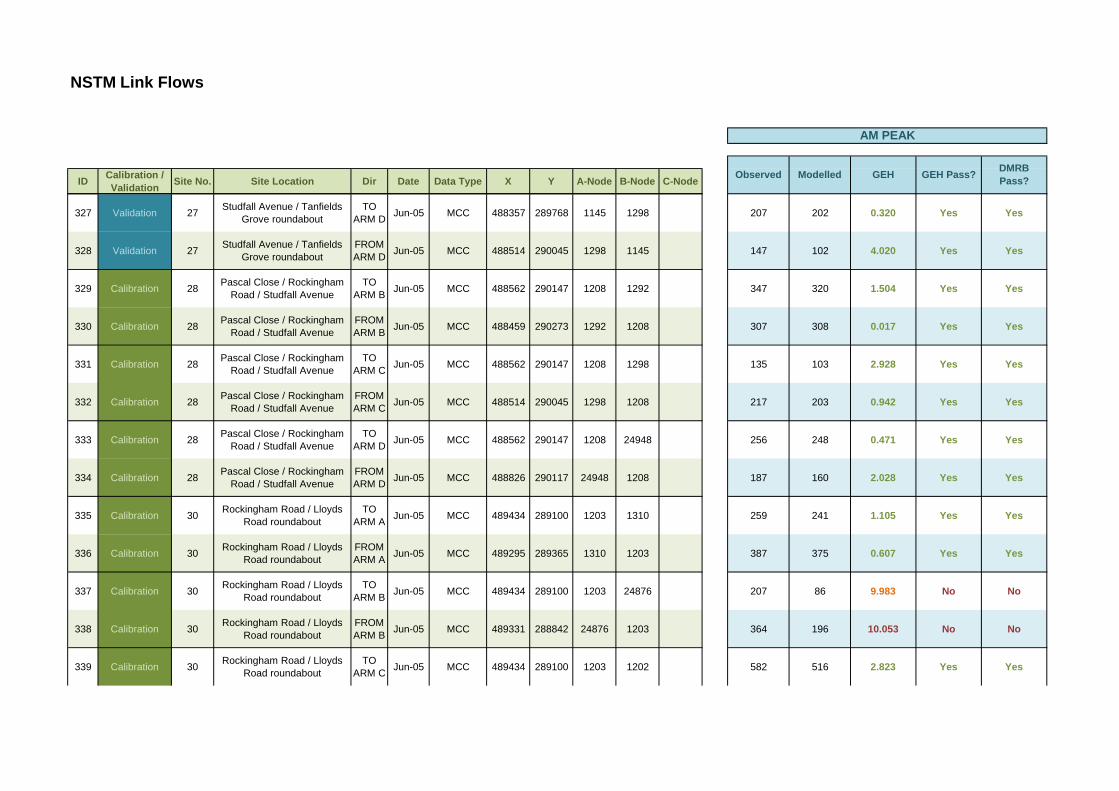
NSTM Link Flows
ID Calibration / Validation Site No. Site Location Dir Date Data Type X Y A-Node B-Node C-Node
AM PEAK
GEH GEH Pass? DMRB Pass?ModelledObserved
327 Validation 27 Studfall Avenue / Tanfields Grove roundabout
TO ARM D Jun-05 MCC 488357 289768 1145 1298 207 202 0.320 Yes Yes
328 Validation 27 Studfall Avenue / Tanfields Grove roundabout
FROM ARM D Jun-05 MCC 488514 290045 1298 1145 147 102 4.020 Yes Yes
329 Calibration 28 Pascal Close / Rockingham Road / Studfall Avenue
TO ARM B Jun-05 MCC 488562 290147 1208 1292 347 320 1.504 Yes Yes
330 Calibration 28 Pascal Close / Rockingham Road / Studfall Avenue
FROM ARM B Jun-05 MCC 488459 290273 1292 1208 307 308 0.017 Yes Yes
331 Calibration 28 Pascal Close / Rockingham Road / Studfall Avenue
TO ARM C Jun-05 MCC 488562 290147 1208 1298 135 103 2.928 Yes Yes
332 Calibration 28 Pascal Close / Rockingham Road / Studfall Avenue
FROM ARM C Jun-05 MCC 488514 290045 1298 1208 217 203 0.942 Yes Yes
333 Calibration 28 Pascal Close / Rockingham Road / Studfall Avenue
TO ARM D Jun-05 MCC 488562 290147 1208 24948 256 248 0.471 Yes Yes
334 Calibration 28 Pascal Close / Rockingham Road / Studfall Avenue
FROM ARM D Jun-05 MCC 488826 290117 24948 1208 187 160 2.028 Yes Yes
335 Calibration 30 Rockingham Road / Lloyds Road roundabout
TO ARM A Jun-05 MCC 489434 289100 1203 1310 259 241 1.105 Yes Yes
336 Calibration 30 Rockingham Road / Lloyds Road roundabout
FROM ARM A Jun-05 MCC 489295 289365 1310 1203 387 375 0.607 Yes Yes
337 Calibration 30 Rockingham Road / Lloyds Road roundabout
TO ARM B Jun-05 MCC 489434 289100 1203 24876 207 86 9.983 No No
338 Calibration 30 Rockingham Road / Lloyds Road roundabout
FROM ARM B Jun-05 MCC 489331 288842 24876 1203 364 196 10.053 No No
339 Calibration 30 Rockingham Road / Lloyds Road roundabout
TO ARM C Jun-05 MCC 489434 289100 1203 1202 582 516 2.823 Yes Yes
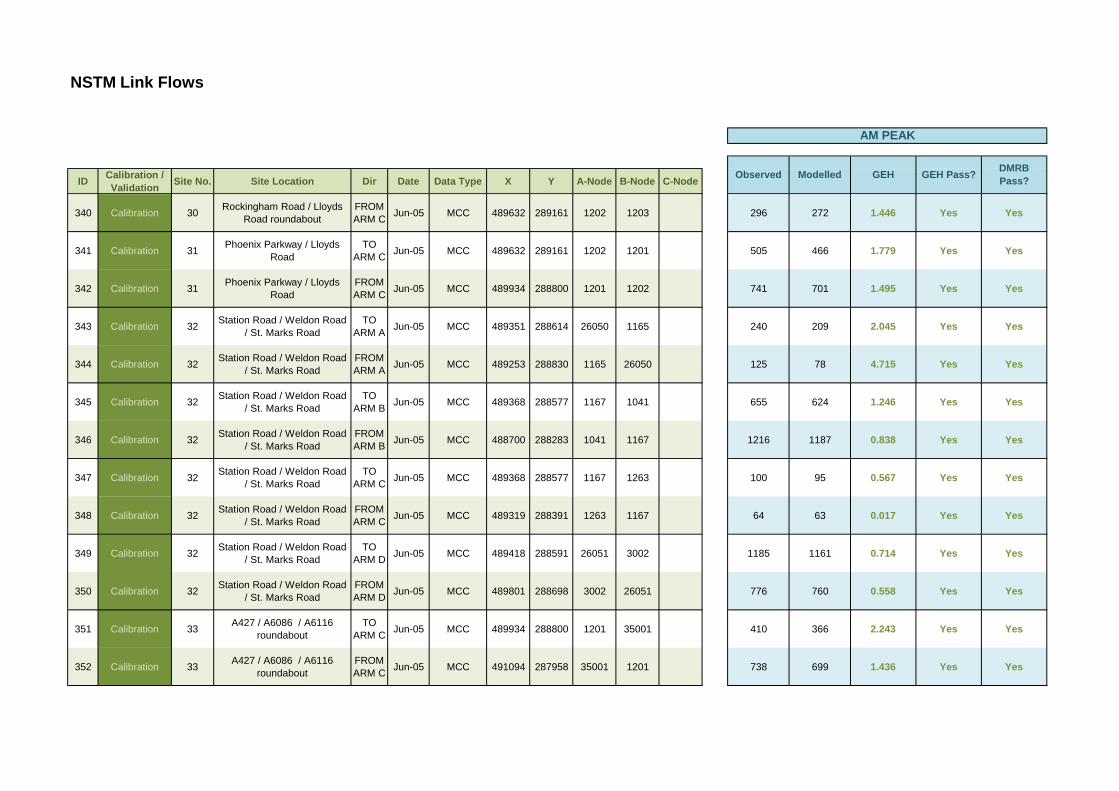
NSTM Link Flows
ID Calibration / Validation Site No. Site Location Dir Date Data Type X Y A-Node B-Node C-Node
AM PEAK
GEH GEH Pass? DMRB Pass?ModelledObserved
340 Calibration 30 Rockingham Road / Lloyds Road roundabout
FROM ARM C Jun-05 MCC 489632 289161 1202 1203 296 272 1.446 Yes Yes
341 Calibration 31 Phoenix Parkway / Lloyds Road
TO ARM C Jun-05 MCC 489632 289161 1202 1201 505 466 1.779 Yes Yes
342 Calibration 31 Phoenix Parkway / Lloyds Road
FROM ARM C Jun-05 MCC 489934 288800 1201 1202 741 701 1.495 Yes Yes
343 Calibration 32 Station Road / Weldon Road / St. Marks Road
TO ARM A Jun-05 MCC 489351 288614 26050 1165 240 209 2.045 Yes Yes
344 Calibration 32 Station Road / Weldon Road / St. Marks Road
FROM ARM A Jun-05 MCC 489253 288830 1165 26050 125 78 4.715 Yes Yes
345 Calibration 32 Station Road / Weldon Road / St. Marks Road
TO ARM B Jun-05 MCC 489368 288577 1167 1041 655 624 1.246 Yes Yes
346 Calibration 32 Station Road / Weldon Road / St. Marks Road
FROM ARM B Jun-05 MCC 488700 288283 1041 1167 1216 1187 0.838 Yes Yes
347 Calibration 32 Station Road / Weldon Road / St. Marks Road
TO ARM C Jun-05 MCC 489368 288577 1167 1263 100 95 0.567 Yes Yes
348 Calibration 32 Station Road / Weldon Road / St. Marks Road
FROM ARM C Jun-05 MCC 489319 288391 1263 1167 64 63 0.017 Yes Yes
349 Calibration 32 Station Road / Weldon Road / St. Marks Road
TO ARM D Jun-05 MCC 489418 288591 26051 3002 1185 1161 0.714 Yes Yes
350 Calibration 32 Station Road / Weldon Road / St. Marks Road
FROM ARM D Jun-05 MCC 489801 288698 3002 26051 776 760 0.558 Yes Yes
351 Calibration 33 A427 / A6086 / A6116 roundabout
TO ARM C Jun-05 MCC 489934 288800 1201 35001 410 366 2.243 Yes Yes
352 Calibration 33 A427 / A6086 / A6116 roundabout
FROM ARM C Jun-05 MCC 491094 287958 35001 1201 738 699 1.436 Yes Yes
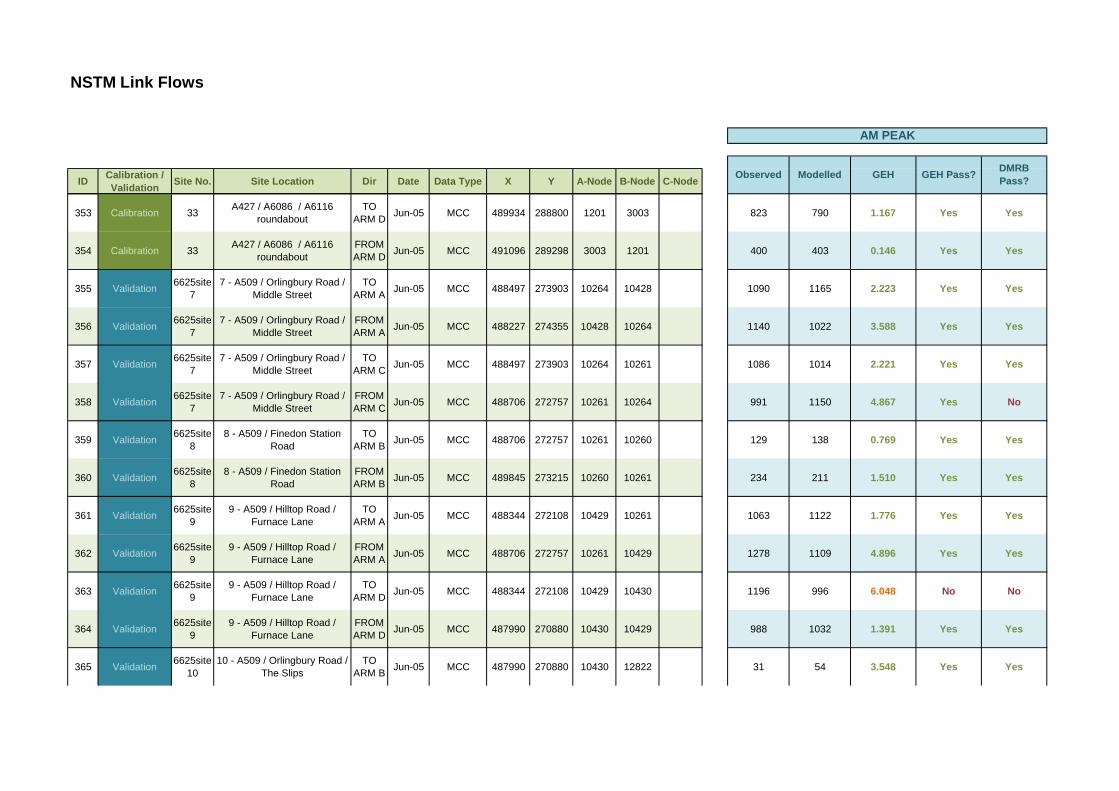
NSTM Link Flows
ID Calibration / Validation Site No. Site Location Dir Date Data Type X Y A-Node B-Node C-Node
AM PEAK
GEH GEH Pass? DMRB Pass?ModelledObserved
353 Calibration 33 A427 / A6086 / A6116 roundabout
TO ARM D Jun-05 MCC 489934 288800 1201 3003 823 790 1.167 Yes Yes
354 Calibration 33 A427 / A6086 / A6116 roundabout
FROM ARM D Jun-05 MCC 491096 289298 3003 1201 400 403 0.146 Yes Yes
355 Validation 6625site7
7 - A509 / Orlingbury Road / Middle Street
TO ARM A Jun-05 MCC 488497 273903 10264 10428 1090 1165 2.223 Yes Yes
356 Validation 6625site7
7 - A509 / Orlingbury Road / Middle Street
FROM ARM A Jun-05 MCC 488227 274355 10428 10264 1140 1022 3.588 Yes Yes
357 Validation 6625site7
7 - A509 / Orlingbury Road / Middle Street
TO ARM C Jun-05 MCC 488497 273903 10264 10261 1086 1014 2.221 Yes Yes
358 Validation 6625site7
7 - A509 / Orlingbury Road / Middle Street
FROM ARM C Jun-05 MCC 488706 272757 10261 10264 991 1150 4.867 Yes No
359 Validation 6625site8
8 - A509 / Finedon Station Road
TO ARM B Jun-05 MCC 488706 272757 10261 10260 129 138 0.769 Yes Yes
360 Validation 6625site8
8 - A509 / Finedon Station Road
FROM ARM B Jun-05 MCC 489845 273215 10260 10261 234 211 1.510 Yes Yes
361 Validation 6625site9
9 - A509 / Hilltop Road / Furnace Lane
TO ARM A Jun-05 MCC 488344 272108 10429 10261 1063 1122 1.776 Yes Yes
362 Validation 6625site9
9 - A509 / Hilltop Road / Furnace Lane
FROM ARM A Jun-05 MCC 488706 272757 10261 10429 1278 1109 4.896 Yes Yes
363 Validation 6625site9
9 - A509 / Hilltop Road / Furnace Lane
TO ARM D Jun-05 MCC 488344 272108 10429 10430 1196 996 6.048 No No
364 Validation 6625site9
9 - A509 / Hilltop Road / Furnace Lane
FROM ARM D Jun-05 MCC 487990 270880 10430 10429 988 1032 1.391 Yes Yes
365 Validation 6625site10
10 - A509 / Orlingbury Road / The Slips
TO ARM B Jun-05 MCC 487990 270880 10430 12822 31 54 3.548 Yes Yes
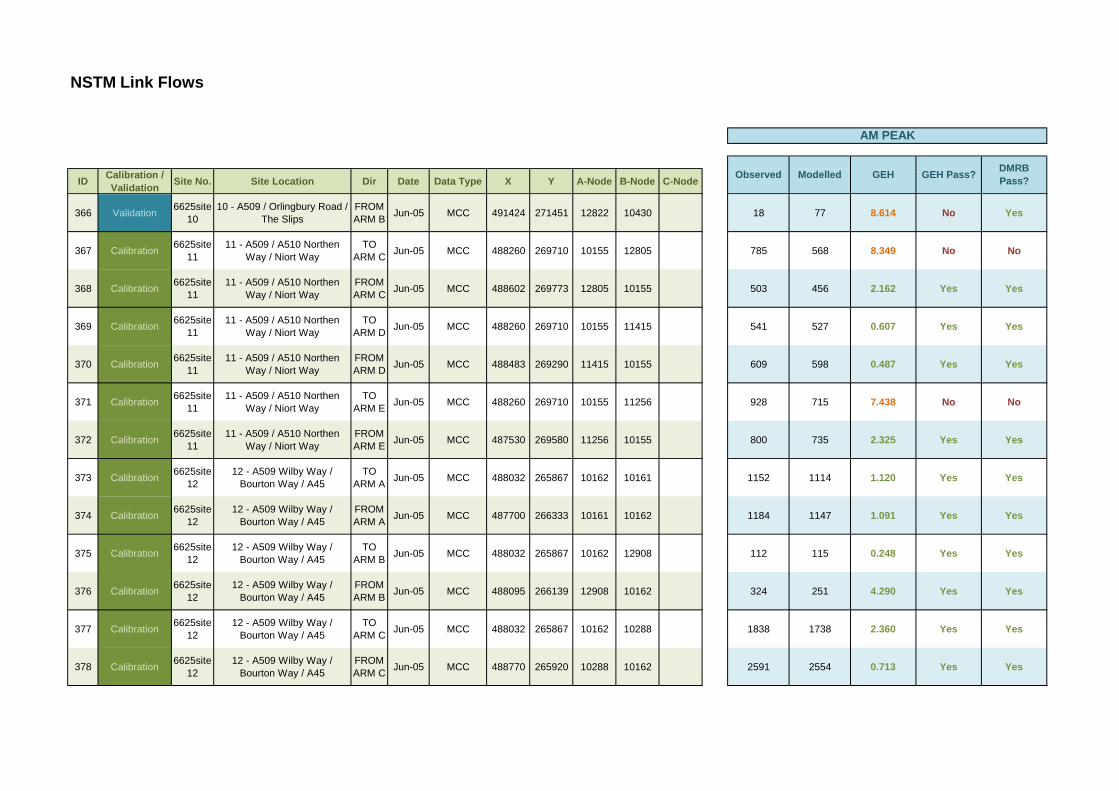
NSTM Link Flows
ID Calibration / Validation Site No. Site Location Dir Date Data Type X Y A-Node B-Node C-Node
AM PEAK
GEH GEH Pass? DMRB Pass?ModelledObserved
366 Validation 6625site10
10 - A509 / Orlingbury Road / The Slips
FROM ARM B Jun-05 MCC 491424 271451 12822 10430 18 77 8.614 No Yes
367 Calibration 6625site11
11 - A509 / A510 Northen Way / Niort Way
TO ARM C Jun-05 MCC 488260 269710 10155 12805 785 568 8.349 No No
368 Calibration 6625site11
11 - A509 / A510 Northen Way / Niort Way
FROM ARM C Jun-05 MCC 488602 269773 12805 10155 503 456 2.162 Yes Yes
369 Calibration 6625site11
11 - A509 / A510 Northen Way / Niort Way
TO ARM D Jun-05 MCC 488260 269710 10155 11415 541 527 0.607 Yes Yes
370 Calibration 6625site11
11 - A509 / A510 Northen Way / Niort Way
FROM ARM D Jun-05 MCC 488483 269290 11415 10155 609 598 0.487 Yes Yes
371 Calibration 6625site11
11 - A509 / A510 Northen Way / Niort Way
TO ARM E Jun-05 MCC 488260 269710 10155 11256 928 715 7.438 No No
372 Calibration 6625site11
11 - A509 / A510 Northen Way / Niort Way
FROM ARM E Jun-05 MCC 487530 269580 11256 10155 800 735 2.325 Yes Yes
373 Calibration 6625site12
12 - A509 Wilby Way / Bourton Way / A45
TO ARM A Jun-05 MCC 488032 265867 10162 10161 1152 1114 1.120 Yes Yes
374 Calibration 6625site12
12 - A509 Wilby Way / Bourton Way / A45
FROM ARM A Jun-05 MCC 487700 266333 10161 10162 1184 1147 1.091 Yes Yes
375 Calibration 6625site12
12 - A509 Wilby Way / Bourton Way / A45
TO ARM B Jun-05 MCC 488032 265867 10162 12908 112 115 0.248 Yes Yes
376 Calibration 6625site12
12 - A509 Wilby Way / Bourton Way / A45
FROM ARM B Jun-05 MCC 488095 266139 12908 10162 324 251 4.290 Yes Yes
377 Calibration 6625site12
12 - A509 Wilby Way / Bourton Way / A45
TO ARM C Jun-05 MCC 488032 265867 10162 10288 1838 1738 2.360 Yes Yes
378 Calibration 6625site12
12 - A509 Wilby Way / Bourton Way / A45
FROM ARM C Jun-05 MCC 488770 265920 10288 10162 2591 2554 0.713 Yes Yes
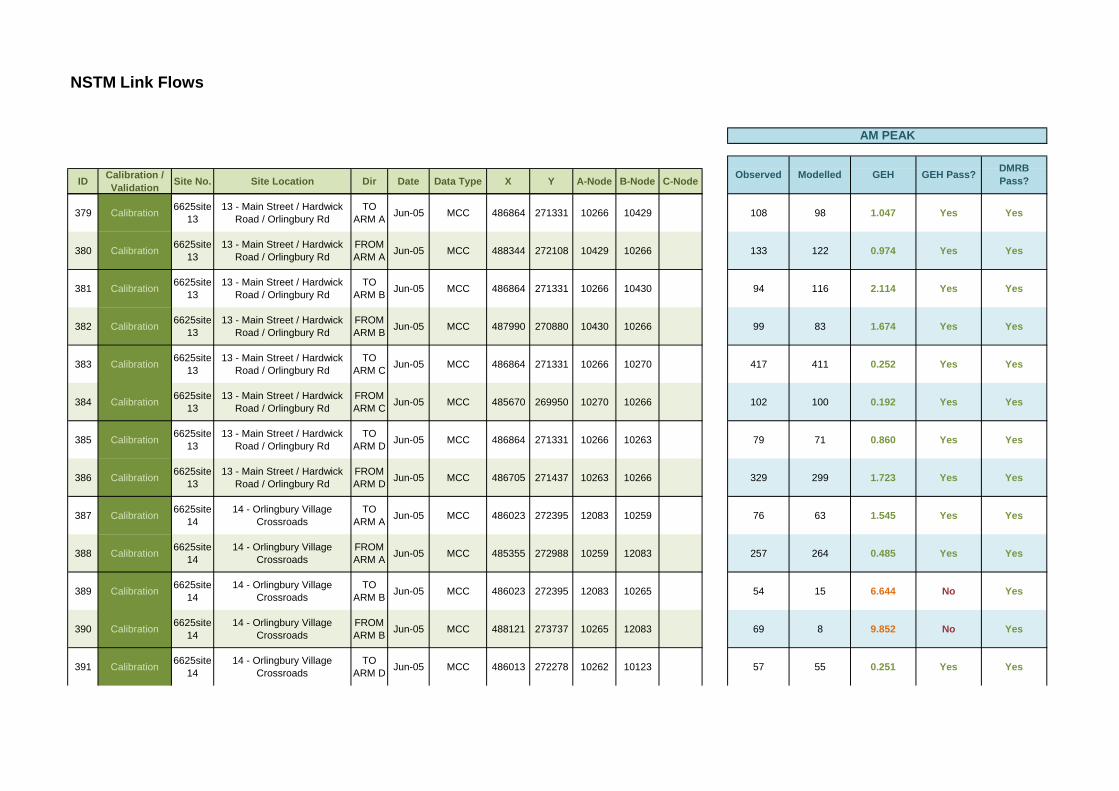
NSTM Link Flows
ID Calibration / Validation Site No. Site Location Dir Date Data Type X Y A-Node B-Node C-Node
AM PEAK
GEH GEH Pass? DMRB Pass?ModelledObserved
379 Calibration 6625site13
13 - Main Street / Hardwick Road / Orlingbury Rd
TO ARM A Jun-05 MCC 486864 271331 10266 10429 108 98 1.047 Yes Yes
380 Calibration 6625site13
13 - Main Street / Hardwick Road / Orlingbury Rd
FROM ARM A Jun-05 MCC 488344 272108 10429 10266 133 122 0.974 Yes Yes
381 Calibration 6625site13
13 - Main Street / Hardwick Road / Orlingbury Rd
TO ARM B Jun-05 MCC 486864 271331 10266 10430 94 116 2.114 Yes Yes
382 Calibration 6625site13
13 - Main Street / Hardwick Road / Orlingbury Rd
FROM ARM B Jun-05 MCC 487990 270880 10430 10266 99 83 1.674 Yes Yes
383 Calibration 6625site13
13 - Main Street / Hardwick Road / Orlingbury Rd
TO ARM C Jun-05 MCC 486864 271331 10266 10270 417 411 0.252 Yes Yes
384 Calibration 6625site13
13 - Main Street / Hardwick Road / Orlingbury Rd
FROM ARM C Jun-05 MCC 485670 269950 10270 10266 102 100 0.192 Yes Yes
385 Calibration 6625site13
13 - Main Street / Hardwick Road / Orlingbury Rd
TO ARM D Jun-05 MCC 486864 271331 10266 10263 79 71 0.860 Yes Yes
386 Calibration 6625site13
13 - Main Street / Hardwick Road / Orlingbury Rd
FROM ARM D Jun-05 MCC 486705 271437 10263 10266 329 299 1.723 Yes Yes
387 Calibration 6625site14
14 - Orlingbury Village Crossroads
TO ARM A Jun-05 MCC 486023 272395 12083 10259 76 63 1.545 Yes Yes
388 Calibration 6625site14
14 - Orlingbury Village Crossroads
FROM ARM A Jun-05 MCC 485355 272988 10259 12083 257 264 0.485 Yes Yes
389 Calibration 6625site14
14 - Orlingbury Village Crossroads
TO ARM B Jun-05 MCC 486023 272395 12083 10265 54 15 6.644 No Yes
390 Calibration 6625site14
14 - Orlingbury Village Crossroads
FROM ARM B Jun-05 MCC 488121 273737 10265 12083 69 8 9.852 No Yes
391 Calibration 6625site14
14 - Orlingbury Village Crossroads
TO ARM D Jun-05 MCC 486013 272278 10262 10123 57 55 0.251 Yes Yes
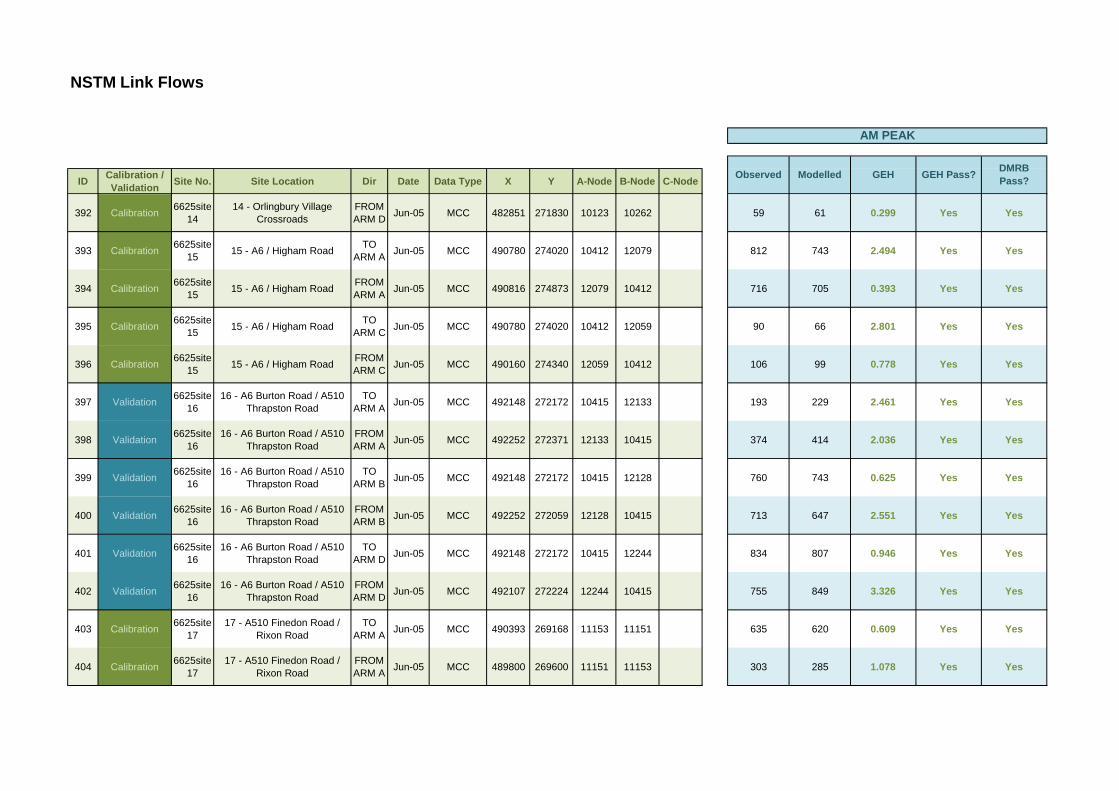
NSTM Link Flows
ID Calibration / Validation Site No. Site Location Dir Date Data Type X Y A-Node B-Node C-Node
AM PEAK
GEH GEH Pass? DMRB Pass?ModelledObserved
392 Calibration 6625site14
14 - Orlingbury Village Crossroads
FROM ARM D Jun-05 MCC 482851 271830 10123 10262 59 61 0.299 Yes Yes
393 Calibration 6625site15 15 - A6 / Higham Road TO
ARM A Jun-05 MCC 490780 274020 10412 12079 812 743 2.494 Yes Yes
394 Calibration 6625site15 15 - A6 / Higham Road FROM
ARM A Jun-05 MCC 490816 274873 12079 10412 716 705 0.393 Yes Yes
395 Calibration 6625site15 15 - A6 / Higham Road TO
ARM C Jun-05 MCC 490780 274020 10412 12059 90 66 2.801 Yes Yes
396 Calibration 6625site15 15 - A6 / Higham Road FROM
ARM C Jun-05 MCC 490160 274340 12059 10412 106 99 0.778 Yes Yes
397 Validation 6625site16
16 - A6 Burton Road / A510 Thrapston Road
TO ARM A Jun-05 MCC 492148 272172 10415 12133 193 229 2.461 Yes Yes
398 Validation 6625site16
16 - A6 Burton Road / A510 Thrapston Road
FROM ARM A Jun-05 MCC 492252 272371 12133 10415 374 414 2.036 Yes Yes
399 Validation 6625site16
16 - A6 Burton Road / A510 Thrapston Road
TO ARM B Jun-05 MCC 492148 272172 10415 12128 760 743 0.625 Yes Yes
400 Validation 6625site16
16 - A6 Burton Road / A510 Thrapston Road
FROM ARM B Jun-05 MCC 492252 272059 12128 10415 713 647 2.551 Yes Yes
401 Validation 6625site16
16 - A6 Burton Road / A510 Thrapston Road
TO ARM D Jun-05 MCC 492148 272172 10415 12244 834 807 0.946 Yes Yes
402 Validation 6625site16
16 - A6 Burton Road / A510 Thrapston Road
FROM ARM D Jun-05 MCC 492107 272224 12244 10415 755 849 3.326 Yes Yes
403 Calibration 6625site17
17 - A510 Finedon Road / Rixon Road
TO ARM A Jun-05 MCC 490393 269168 11153 11151 635 620 0.609 Yes Yes
404 Calibration 6625site17
17 - A510 Finedon Road / Rixon Road
FROM ARM A Jun-05 MCC 489800 269600 11151 11153 303 285 1.078 Yes Yes
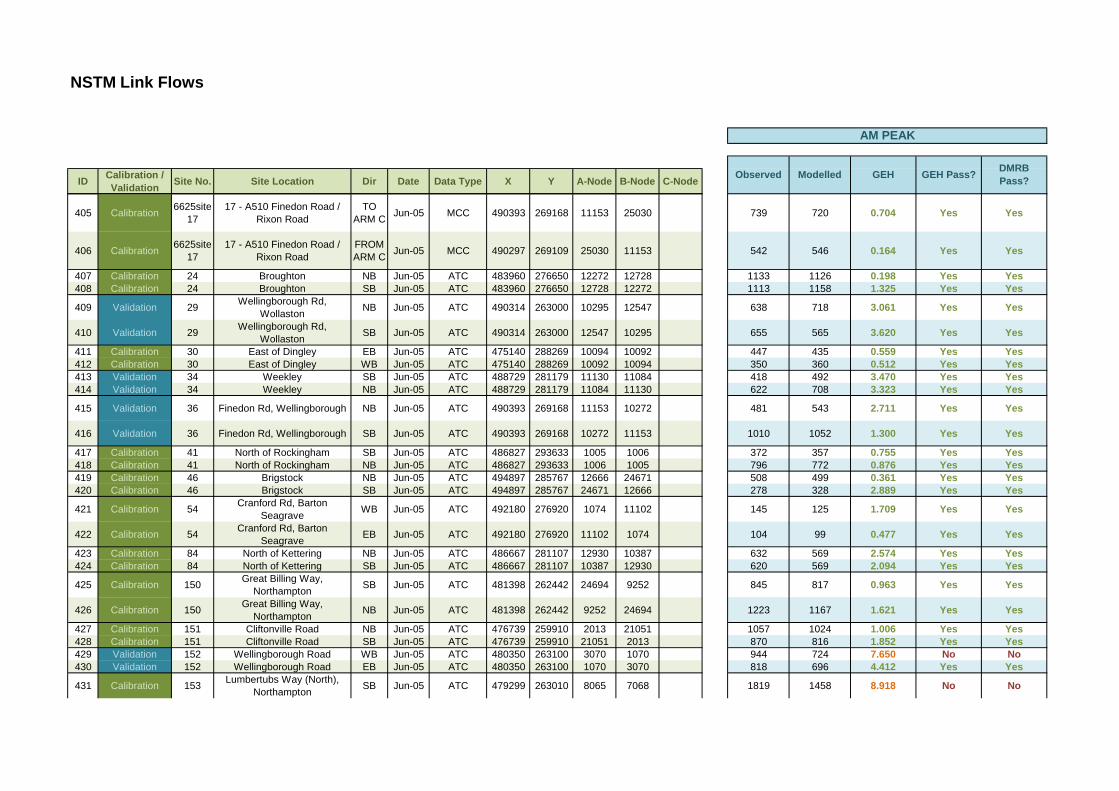
NSTM Link Flows
ID Calibration / Validation Site No. Site Location Dir Date Data Type X Y A-Node B-Node C-Node
AM PEAK
GEH GEH Pass? DMRB Pass?ModelledObserved
405 Calibration 6625site17
17 - A510 Finedon Road / Rixon Road
TO ARM C Jun-05 MCC 490393 269168 11153 25030 739 720 0.704 Yes Yes
406 Calibration 6625site17
17 - A510 Finedon Road / Rixon Road
FROM ARM C Jun-05 MCC 490297 269109 25030 11153 542 546 0.164 Yes Yes
407 Calibration 24 Broughton NB Jun-05 ATC 483960 276650 12272 12728 1133 1126 0.198 Yes Yes408 Calibration 24 Broughton SB Jun-05 ATC 483960 276650 12728 12272 1113 1158 1.325 Yes Yes
409 Validation 29 Wellingborough Rd, Wollaston NB Jun-05 ATC 490314 263000 10295 12547 638 718 3.061 Yes Yes
410 Validation 29 Wellingborough Rd, Wollaston SB Jun-05 ATC 490314 263000 12547 10295 655 565 3.620 Yes Yes
411 Calibration 30 East of Dingley EB Jun-05 ATC 475140 288269 10094 10092 447 435 0.559 Yes Yes412 Calibration 30 East of Dingley WB Jun-05 ATC 475140 288269 10092 10094 350 360 0.512 Yes Yes413 Validation 34 Weekley SB Jun-05 ATC 488729 281179 11130 11084 418 492 3.470 Yes Yes414 Validation 34 Weekley NB Jun-05 ATC 488729 281179 11084 11130 622 708 3.323 Yes Yes
415 Validation 36 Finedon Rd, Wellingborough NB Jun-05 ATC 490393 269168 11153 10272 481 543 2.711 Yes Yes
416 Validation 36 Finedon Rd, Wellingborough SB Jun-05 ATC 490393 269168 10272 11153 1010 1052 1.300 Yes Yes
417 Calibration 41 North of Rockingham SB Jun-05 ATC 486827 293633 1005 1006 372 357 0.755 Yes Yes418 Calibration 41 North of Rockingham NB Jun-05 ATC 486827 293633 1006 1005 796 772 0.876 Yes Yes419 Calibration 46 Brigstock NB Jun-05 ATC 494897 285767 12666 24671 508 499 0.361 Yes Yes420 Calibration 46 Brigstock SB Jun-05 ATC 494897 285767 24671 12666 278 328 2.889 Yes Yes
421 Calibration 54 Cranford Rd, Barton Seagrave WB Jun-05 ATC 492180 276920 1074 11102 145 125 1.709 Yes Yes
422 Calibration 54 Cranford Rd, Barton Seagrave EB Jun-05 ATC 492180 276920 11102 1074 104 99 0.477 Yes Yes
423 Calibration 84 North of Kettering NB Jun-05 ATC 486667 281107 12930 10387 632 569 2.574 Yes Yes424 Calibration 84 North of Kettering SB Jun-05 ATC 486667 281107 10387 12930 620 569 2.094 Yes Yes
425 Calibration 150 Great Billing Way, Northampton SB Jun-05 ATC 481398 262442 24694 9252 845 817 0.963 Yes Yes
426 Calibration 150 Great Billing Way, Northampton NB Jun-05 ATC 481398 262442 9252 24694 1223 1167 1.621 Yes Yes
427 Calibration 151 Cliftonville Road NB Jun-05 ATC 476739 259910 2013 21051 1057 1024 1.006 Yes Yes428 Calibration 151 Cliftonville Road SB Jun-05 ATC 476739 259910 21051 2013 870 816 1.852 Yes Yes429 Validation 152 Wellingborough Road WB Jun-05 ATC 480350 263100 3070 1070 944 724 7.650 No No430 Validation 152 Wellingborough Road EB Jun-05 ATC 480350 263100 1070 3070 818 696 4.412 Yes Yes
431 Calibration 153 Lumbertubs Way (North), Northampton SB Jun-05 ATC 479299 263010 8065 7068 1819 1458 8.918 No No
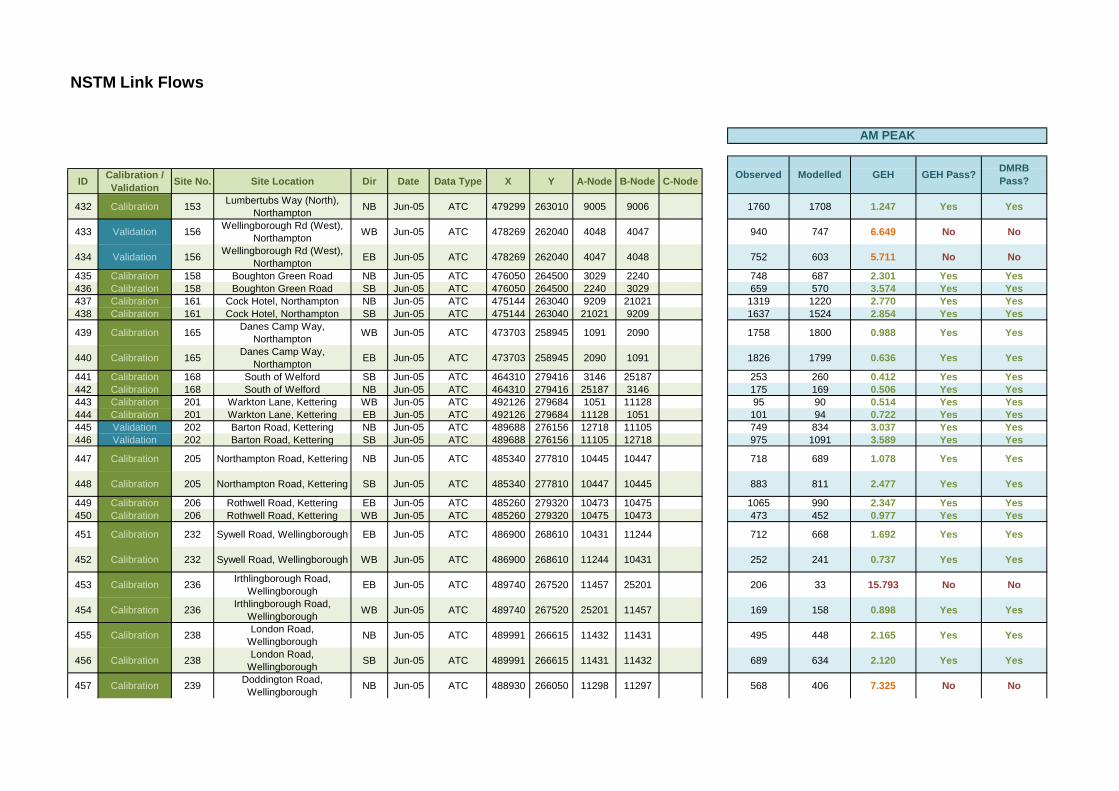
NSTM Link Flows
ID Calibration / Validation Site No. Site Location Dir Date Data Type X Y A-Node B-Node C-Node
AM PEAK
GEH GEH Pass? DMRB Pass?ModelledObserved
432 Calibration 153 Lumbertubs Way (North), Northampton NB Jun-05 ATC 479299 263010 9005 9006 1760 1708 1.247 Yes Yes
433 Validation 156 Wellingborough Rd (West), Northampton WB Jun-05 ATC 478269 262040 4048 4047 940 747 6.649 No No
434 Validation 156 Wellingborough Rd (West), Northampton EB Jun-05 ATC 478269 262040 4047 4048 752 603 5.711 No No
435 Calibration 158 Boughton Green Road NB Jun-05 ATC 476050 264500 3029 2240 748 687 2.301 Yes Yes436 Calibration 158 Boughton Green Road SB Jun-05 ATC 476050 264500 2240 3029 659 570 3.574 Yes Yes437 Calibration 161 Cock Hotel, Northampton NB Jun-05 ATC 475144 263040 9209 21021 1319 1220 2.770 Yes Yes438 Calibration 161 Cock Hotel, Northampton SB Jun-05 ATC 475144 263040 21021 9209 1637 1524 2.854 Yes Yes
439 Calibration 165 Danes Camp Way, Northampton WB Jun-05 ATC 473703 258945 1091 2090 1758 1800 0.988 Yes Yes
440 Calibration 165 Danes Camp Way, Northampton EB Jun-05 ATC 473703 258945 2090 1091 1826 1799 0.636 Yes Yes
441 Calibration 168 South of Welford SB Jun-05 ATC 464310 279416 3146 25187 253 260 0.412 Yes Yes442 Calibration 168 South of Welford NB Jun-05 ATC 464310 279416 25187 3146 175 169 0.506 Yes Yes443 Calibration 201 Warkton Lane, Kettering WB Jun-05 ATC 492126 279684 1051 11128 95 90 0.514 Yes Yes444 Calibration 201 Warkton Lane, Kettering EB Jun-05 ATC 492126 279684 11128 1051 101 94 0.722 Yes Yes445 Validation 202 Barton Road, Kettering NB Jun-05 ATC 489688 276156 12718 11105 749 834 3.037 Yes Yes446 Validation 202 Barton Road, Kettering SB Jun-05 ATC 489688 276156 11105 12718 975 1091 3.589 Yes Yes
447 Calibration 205 Northampton Road, Kettering NB Jun-05 ATC 485340 277810 10445 10447 718 689 1.078 Yes Yes
448 Calibration 205 Northampton Road, Kettering SB Jun-05 ATC 485340 277810 10447 10445 883 811 2.477 Yes Yes
449 Calibration 206 Rothwell Road, Kettering EB Jun-05 ATC 485260 279320 10473 10475 1065 990 2.347 Yes Yes450 Calibration 206 Rothwell Road, Kettering WB Jun-05 ATC 485260 279320 10475 10473 473 452 0.977 Yes Yes
451 Calibration 232 Sywell Road, Wellingborough EB Jun-05 ATC 486900 268610 10431 11244 712 668 1.692 Yes Yes
452 Calibration 232 Sywell Road, Wellingborough WB Jun-05 ATC 486900 268610 11244 10431 252 241 0.737 Yes Yes
453 Calibration 236 Irthlingborough Road, Wellingborough EB Jun-05 ATC 489740 267520 11457 25201 206 33 15.793 No No
454 Calibration 236 Irthlingborough Road, Wellingborough WB Jun-05 ATC 489740 267520 25201 11457 169 158 0.898 Yes Yes
455 Calibration 238 London Road, Wellingborough NB Jun-05 ATC 489991 266615 11432 11431 495 448 2.165 Yes Yes
456 Calibration 238 London Road, Wellingborough SB Jun-05 ATC 489991 266615 11431 11432 689 634 2.120 Yes Yes
457 Calibration 239 Doddington Road, Wellingborough NB Jun-05 ATC 488930 266050 11298 11297 568 406 7.325 No No
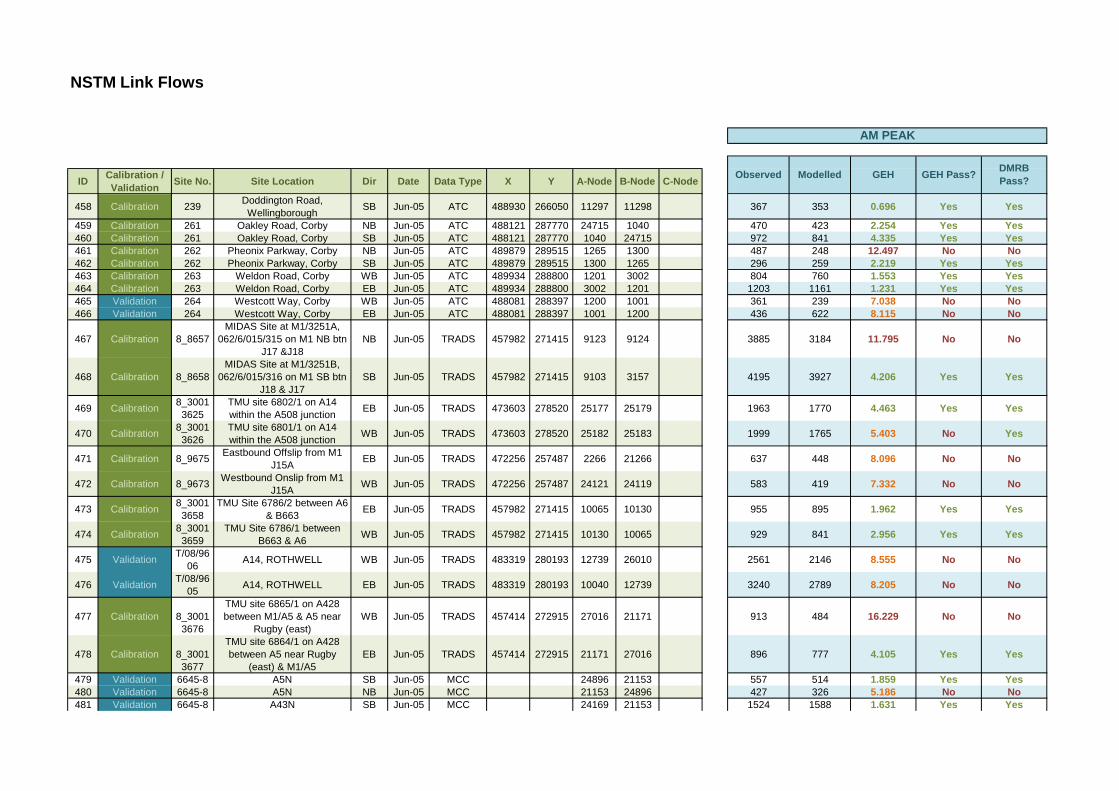
NSTM Link Flows
ID Calibration / Validation Site No. Site Location Dir Date Data Type X Y A-Node B-Node C-Node
AM PEAK
GEH GEH Pass? DMRB Pass?ModelledObserved
458 Calibration 239 Doddington Road, Wellingborough SB Jun-05 ATC 488930 266050 11297 11298 367 353 0.696 Yes Yes
459 Calibration 261 Oakley Road, Corby NB Jun-05 ATC 488121 287770 24715 1040 470 423 2.254 Yes Yes460 Calibration 261 Oakley Road, Corby SB Jun-05 ATC 488121 287770 1040 24715 972 841 4.335 Yes Yes461 Calibration 262 Pheonix Parkway, Corby NB Jun-05 ATC 489879 289515 1265 1300 487 248 12.497 No No462 Calibration 262 Pheonix Parkway, Corby SB Jun-05 ATC 489879 289515 1300 1265 296 259 2.219 Yes Yes463 Calibration 263 Weldon Road, Corby WB Jun-05 ATC 489934 288800 1201 3002 804 760 1.553 Yes Yes464 Calibration 263 Weldon Road, Corby EB Jun-05 ATC 489934 288800 3002 1201 1203 1161 1.231 Yes Yes465 Validation 264 Westcott Way, Corby WB Jun-05 ATC 488081 288397 1200 1001 361 239 7.038 No No466 Validation 264 Westcott Way, Corby EB Jun-05 ATC 488081 288397 1001 1200 436 622 8.115 No No
467 Calibration 8_8657MIDAS Site at M1/3251A,
062/6/015/315 on M1 NB btn J17 &J18
NB Jun-05 TRADS 457982 271415 9123 9124 3885 3184 11.795 No No
468 Calibration 8_8658MIDAS Site at M1/3251B,
062/6/015/316 on M1 SB btn J18 & J17
SB Jun-05 TRADS 457982 271415 9103 3157 4195 3927 4.206 Yes Yes
469 Calibration 8_30013625
TMU site 6802/1 on A14 within the A508 junction EB Jun-05 TRADS 473603 278520 25177 25179 1963 1770 4.463 Yes Yes
470 Calibration 8_30013626
TMU site 6801/1 on A14 within the A508 junction WB Jun-05 TRADS 473603 278520 25182 25183 1999 1765 5.403 No Yes
471 Calibration 8_9675 Eastbound Offslip from M1 J15A EB Jun-05 TRADS 472256 257487 2266 21266 637 448 8.096 No No
472 Calibration 8_9673 Westbound Onslip from M1 J15A WB Jun-05 TRADS 472256 257487 24121 24119 583 419 7.332 No No
473 Calibration 8_30013658
TMU Site 6786/2 between A6 & B663 EB Jun-05 TRADS 457982 271415 10065 10130 955 895 1.962 Yes Yes
474 Calibration 8_30013659
TMU Site 6786/1 between B663 & A6 WB Jun-05 TRADS 457982 271415 10130 10065 929 841 2.956 Yes Yes
475 Validation T/08/9606 A14, ROTHWELL WB Jun-05 TRADS 483319 280193 12739 26010 2561 2146 8.555 No No
476 Validation T/08/9605 A14, ROTHWELL EB Jun-05 TRADS 483319 280193 10040 12739 3240 2789 8.205 No No
477 Calibration
8_30013676
TMU site 6865/1 on A428 between M1/A5 & A5 near
Rugby (east)WB Jun-05 TRADS 457414 272915 27016 21171 913 484 16.229 No No
478 Calibration
8_30013677
TMU site 6864/1 on A428 between A5 near Rugby
(east) & M1/A5EB Jun-05 TRADS 457414 272915 21171 27016 896 777 4.105 Yes Yes
479 Validation 6645-8 A5N SB Jun-05 MCC 24896 21153 557 514 1.859 Yes Yes480 Validation 6645-8 A5N NB Jun-05 MCC 21153 24896 427 326 5.186 No No481 Validation 6645-8 A43N SB Jun-05 MCC 24169 21153 1524 1588 1.631 Yes Yes
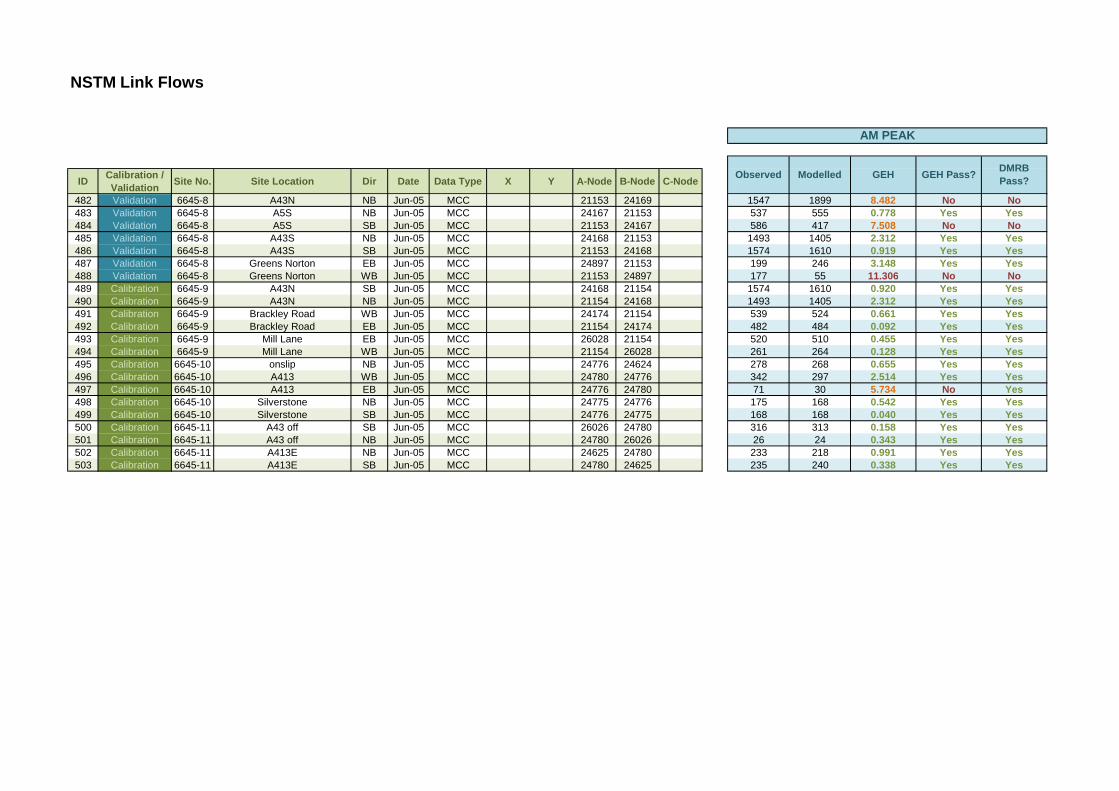
NSTM Link Flows
ID Calibration / Validation Site No. Site Location Dir Date Data Type X Y A-Node B-Node C-Node
AM PEAK
GEH GEH Pass? DMRB Pass?ModelledObserved
482 Validation 6645-8 A43N NB Jun-05 MCC 21153 24169 1547 1899 8.482 No No483 Validation 6645-8 A5S NB Jun-05 MCC 24167 21153 537 555 0.778 Yes Yes484 Validation 6645-8 A5S SB Jun-05 MCC 21153 24167 586 417 7.508 No No485 Validation 6645-8 A43S NB Jun-05 MCC 24168 21153 1493 1405 2.312 Yes Yes486 Validation 6645-8 A43S SB Jun-05 MCC 21153 24168 1574 1610 0.919 Yes Yes487 Validation 6645-8 Greens Norton EB Jun-05 MCC 24897 21153 199 246 3.148 Yes Yes488 Validation 6645-8 Greens Norton WB Jun-05 MCC 21153 24897 177 55 11.306 No No489 Calibration 6645-9 A43N SB Jun-05 MCC 24168 21154 1574 1610 0.920 Yes Yes490 Calibration 6645-9 A43N NB Jun-05 MCC 21154 24168 1493 1405 2.312 Yes Yes491 Calibration 6645-9 Brackley Road WB Jun-05 MCC 24174 21154 539 524 0.661 Yes Yes492 Calibration 6645-9 Brackley Road EB Jun-05 MCC 21154 24174 482 484 0.092 Yes Yes493 Calibration 6645-9 Mill Lane EB Jun-05 MCC 26028 21154 520 510 0.455 Yes Yes494 Calibration 6645-9 Mill Lane WB Jun-05 MCC 21154 26028 261 264 0.128 Yes Yes495 Calibration 6645-10 onslip NB Jun-05 MCC 24776 24624 278 268 0.655 Yes Yes496 Calibration 6645-10 A413 WB Jun-05 MCC 24780 24776 342 297 2.514 Yes Yes497 Calibration 6645-10 A413 EB Jun-05 MCC 24776 24780 71 30 5.734 No Yes498 Calibration 6645-10 Silverstone NB Jun-05 MCC 24775 24776 175 168 0.542 Yes Yes499 Calibration 6645-10 Silverstone SB Jun-05 MCC 24776 24775 168 168 0.040 Yes Yes500 Calibration 6645-11 A43 off SB Jun-05 MCC 26026 24780 316 313 0.158 Yes Yes501 Calibration 6645-11 A43 off NB Jun-05 MCC 24780 26026 26 24 0.343 Yes Yes502 Calibration 6645-11 A413E NB Jun-05 MCC 24625 24780 233 218 0.991 Yes Yes503 Calibration 6645-11 A413E SB Jun-05 MCC 24780 24625 235 240 0.338 Yes Yes
56 NSTM - LMVR Highway Model Version 1.0
APPENDIX NO 6: PM Peak - Detailed Calibration/Validation Results
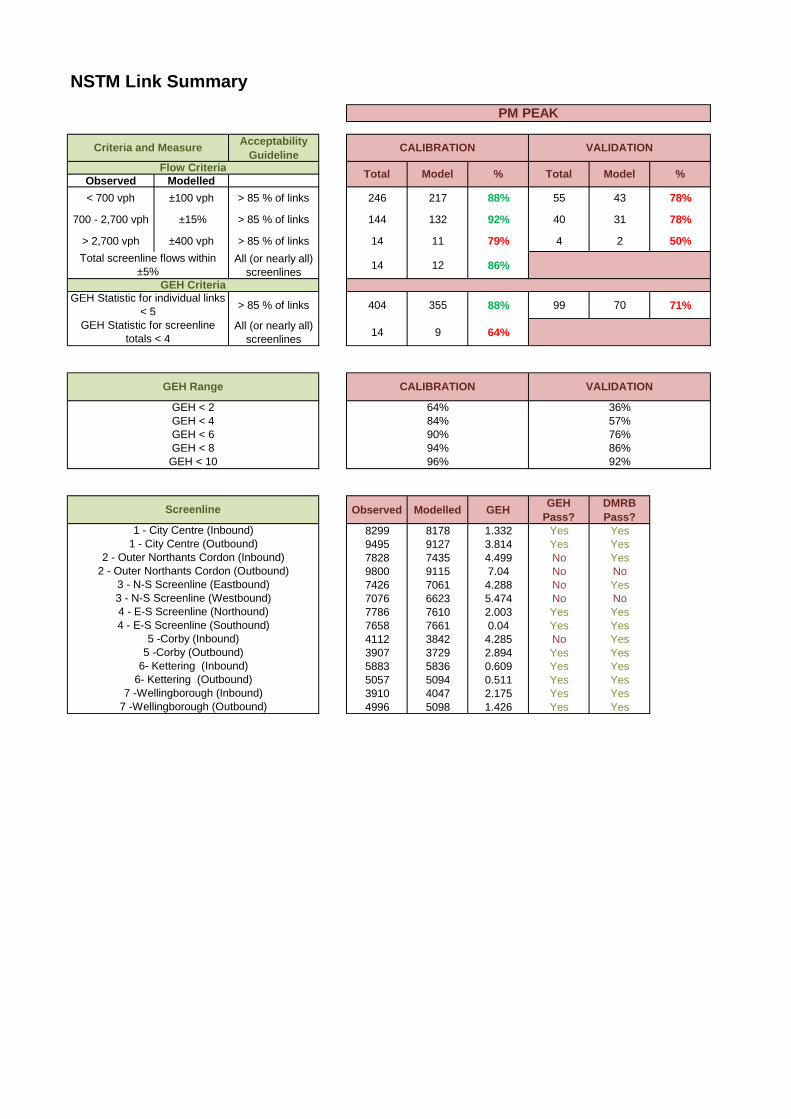
NSTM Link Summary
Acceptability Guideline
Observed Modelled< 700 vph ±100 vph > 85 % of links 246 217 88% 55 43 78%
700 - 2,700 vph ±15% > 85 % of links 144 132 92% 40 31 78%
> 2,700 vph ±400 vph > 85 % of links 14 11 79% 4 2 50%All (or nearly all)
screenlines 14 12 86%
> 85 % of links 404 355 88% 99 70 71%
All (or nearly all) screenlines 14 9 64%
Observed Modelled GEH GEH Pass?
DMRB Pass?
8299 8178 1.332 Yes Yes9495 9127 3.814 Yes Yes7828 7435 4.499 No Yes9800 9115 7.04 No No7426 7061 4.288 No Yes7076 6623 5.474 No No7786 7610 2.003 Yes Yes7658 7661 0.04 Yes Yes4112 3842 4.285 No Yes3907 3729 2.894 Yes Yes5883 5836 0.609 Yes Yes5057 5094 0.511 Yes Yes3910 4047 2.175 Yes Yes4996 5098 1.426 Yes Yes
1 - City Centre (Outbound)
Screenline
1 - City Centre (Inbound)
GEH CriteriaGEH Statistic for individual links
< 5GEH Statistic for screenline
totals < 4
GEH < 2GEH < 4GEH < 6GEH < 8GEH < 10
Criteria and Measure
Flow Criteria
Total screenline flows within ±5%
%
CALIBRATION
PM PEAK
GEH Range VALIDATION
VALIDATION
Total Model % Total Model
CALIBRATION
64%
94% 86%96% 92%
36%84% 57%90% 76%
2 - Outer Northants Cordon (Inbound)2 - Outer Northants Cordon (Outbound)
3 - N-S Screenline (Eastbound)3 - N-S Screenline (Westbound)4 - E-S Screenline (Northound)
7 -Wellingborough (Inbound)7 -Wellingborough (Outbound)
4 - E-S Screenline (Southound)5 -Corby (Inbound)
5 -Corby (Outbound)6- Kettering (Inbound)
6- Kettering (Outbound)
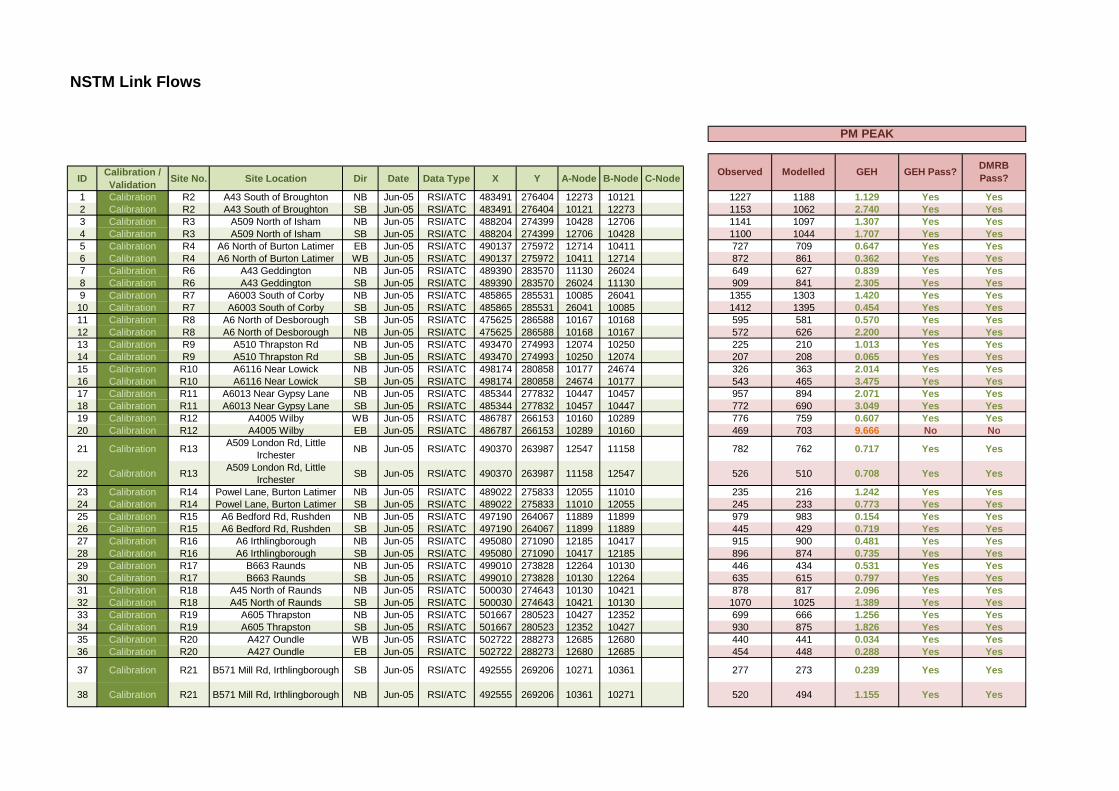
NSTM Link Flows
ID Calibration / Validation Site No. Site Location Dir Date Data Type X Y A-Node B-Node C-Node
1 Calibration R2 A43 South of Broughton NB Jun-05 RSI/ATC 483491 276404 12273 10121 1227 1188 1.129 Yes Yes2 Calibration R2 A43 South of Broughton SB Jun-05 RSI/ATC 483491 276404 10121 12273 1153 1062 2.740 Yes Yes3 Calibration R3 A509 North of Isham NB Jun-05 RSI/ATC 488204 274399 10428 12706 1141 1097 1.307 Yes Yes4 Calibration R3 A509 North of Isham SB Jun-05 RSI/ATC 488204 274399 12706 10428 1100 1044 1.707 Yes Yes5 Calibration R4 A6 North of Burton Latimer EB Jun-05 RSI/ATC 490137 275972 12714 10411 727 709 0.647 Yes Yes6 Calibration R4 A6 North of Burton Latimer WB Jun-05 RSI/ATC 490137 275972 10411 12714 872 861 0.362 Yes Yes7 Calibration R6 A43 Geddington NB Jun-05 RSI/ATC 489390 283570 11130 26024 649 627 0.839 Yes Yes8 Calibration R6 A43 Geddington SB Jun-05 RSI/ATC 489390 283570 26024 11130 909 841 2.305 Yes Yes9 Calibration R7 A6003 South of Corby NB Jun-05 RSI/ATC 485865 285531 10085 26041 1355 1303 1.420 Yes Yes10 Calibration R7 A6003 South of Corby SB Jun-05 RSI/ATC 485865 285531 26041 10085 1412 1395 0.454 Yes Yes11 Calibration R8 A6 North of Desborough SB Jun-05 RSI/ATC 475625 286588 10167 10168 595 581 0.570 Yes Yes12 Calibration R8 A6 North of Desborough NB Jun-05 RSI/ATC 475625 286588 10168 10167 572 626 2.200 Yes Yes13 Calibration R9 A510 Thrapston Rd NB Jun-05 RSI/ATC 493470 274993 12074 10250 225 210 1.013 Yes Yes14 Calibration R9 A510 Thrapston Rd SB Jun-05 RSI/ATC 493470 274993 10250 12074 207 208 0.065 Yes Yes15 Calibration R10 A6116 Near Lowick NB Jun-05 RSI/ATC 498174 280858 10177 24674 326 363 2.014 Yes Yes16 Calibration R10 A6116 Near Lowick SB Jun-05 RSI/ATC 498174 280858 24674 10177 543 465 3.475 Yes Yes17 Calibration R11 A6013 Near Gypsy Lane NB Jun-05 RSI/ATC 485344 277832 10447 10457 957 894 2.071 Yes Yes18 Calibration R11 A6013 Near Gypsy Lane SB Jun-05 RSI/ATC 485344 277832 10457 10447 772 690 3.049 Yes Yes19 Calibration R12 A4005 Wilby WB Jun-05 RSI/ATC 486787 266153 10160 10289 776 759 0.607 Yes Yes20 Calibration R12 A4005 Wilby EB Jun-05 RSI/ATC 486787 266153 10289 10160 469 703 9.666 No No
21 Calibration R13 A509 London Rd, Little Irchester NB Jun-05 RSI/ATC 490370 263987 12547 11158 782 762 0.717 Yes Yes
22 Calibration R13 A509 London Rd, Little Irchester SB Jun-05 RSI/ATC 490370 263987 11158 12547 526 510 0.708 Yes Yes
23 Calibration R14 Powel Lane, Burton Latimer NB Jun-05 RSI/ATC 489022 275833 12055 11010 235 216 1.242 Yes Yes24 Calibration R14 Powel Lane, Burton Latimer SB Jun-05 RSI/ATC 489022 275833 11010 12055 245 233 0.773 Yes Yes25 Calibration R15 A6 Bedford Rd, Rushden NB Jun-05 RSI/ATC 497190 264067 11889 11899 979 983 0.154 Yes Yes26 Calibration R15 A6 Bedford Rd, Rushden SB Jun-05 RSI/ATC 497190 264067 11899 11889 445 429 0.719 Yes Yes27 Calibration R16 A6 Irthlingborough NB Jun-05 RSI/ATC 495080 271090 12185 10417 915 900 0.481 Yes Yes28 Calibration R16 A6 Irthlingborough SB Jun-05 RSI/ATC 495080 271090 10417 12185 896 874 0.735 Yes Yes29 Calibration R17 B663 Raunds NB Jun-05 RSI/ATC 499010 273828 12264 10130 446 434 0.531 Yes Yes30 Calibration R17 B663 Raunds SB Jun-05 RSI/ATC 499010 273828 10130 12264 635 615 0.797 Yes Yes31 Calibration R18 A45 North of Raunds NB Jun-05 RSI/ATC 500030 274643 10130 10421 878 817 2.096 Yes Yes32 Calibration R18 A45 North of Raunds SB Jun-05 RSI/ATC 500030 274643 10421 10130 1070 1025 1.389 Yes Yes33 Calibration R19 A605 Thrapston NB Jun-05 RSI/ATC 501667 280523 10427 12352 699 666 1.256 Yes Yes34 Calibration R19 A605 Thrapston SB Jun-05 RSI/ATC 501667 280523 12352 10427 930 875 1.826 Yes Yes35 Calibration R20 A427 Oundle WB Jun-05 RSI/ATC 502722 288273 12685 12680 440 441 0.034 Yes Yes36 Calibration R20 A427 Oundle EB Jun-05 RSI/ATC 502722 288273 12680 12685 454 448 0.288 Yes Yes
37 Calibration R21 B571 Mill Rd, Irthlingborough SB Jun-05 RSI/ATC 492555 269206 10271 10361 277 273 0.239 Yes Yes
38 Calibration R21 B571 Mill Rd, Irthlingborough NB Jun-05 RSI/ATC 492555 269206 10361 10271 520 494 1.155 Yes Yes
Modelled GEH GEH Pass? DMRB Pass?
PM PEAK
Observed

NSTM Link Flows
ID Calibration / Validation Site No. Site Location Dir Date Data Type X Y A-Node B-Node C-Node Modelled GEH GEH Pass? DMRB
Pass?
PM PEAK
Observed
39 Calibration R22 A45, Great Doddington NB Jun-05 RSI/ATC 486920 264110 11941 10162 1397 1280 3.213 Yes Yes40 Calibration R22 A45, Great Doddington SB Jun-05 RSI/ATC 486920 264110 10162 11941 1716 1706 0.251 Yes Yes
41 Calibration R23 A5193 Turnells Mill Lane, Wellingborough WB Jun-05 RSI/ATC 489890 266837 25246 11438 1375 1327 1.312 Yes Yes
42 Calibration R23 A5193 Turnells Mill Lane, Wellingborough EB Jun-05 RSI/ATC 489890 266837 11438 25246 921 814 3.632 Yes Yes
43 Calibration R24 A4300 Stamford Road, Kettering NB Jun-05 RSI/ATC 488590 280559 11086 11085 529 536 0.304 Yes Yes
44 Calibration R24 A4300 Stamford Road, Kettering SB Jun-05 RSI/ATC 488590 280559 11085 11086 711 681 1.131 Yes Yes
45 Calibration R25 Rockingham Road, Wellingborough NB Jun-05 RSI/ATC 486400 281731 10586 10665 771 627 5.429 No No
46 Calibration R25 Rockingham Road, Wellingborough SB Jun-05 RSI/ATC 486400 281731 10665 10586 961 701 9.029 No No
47 Calibration R26 Waren Hill, Wellingborough EB Jun-05 RSI/ATC 485203 279351 12920 10473 710 646 2.458 Yes Yes48 Calibration R26 Waren Hill, Wellingborough WB Jun-05 RSI/ATC 485203 279351 10473 12920 674 691 0.642 Yes Yes
49 Calibration R27 Pytchley Road, Wellingborough NB Jun-05 RSI/ATC 487413 276068 10705 24858 1151 1109 1.238 Yes Yes
50 Calibration R27 Pytchley Road, Wellingborough SB Jun-05 RSI/ATC 487413 276068 24858 10705 1248 1228 0.555 Yes Yes
51 Calibration R28 Barton Road, Wellingborough NB Jun-05 RSI/ATC 489598 276470 11105 11099 1053 1069 0.502 Yes Yes
52 Calibration R28 Barton Road, Wellingborough SB Jun-05 RSI/ATC 489598 276470 11099 11105 702 682 0.768 Yes Yes
53 Calibration A15 A4500 Spencer Bridge Road WB Jun-05 RSI/ATC 474552 261052 2124 1107 1592 1512 2.047 Yes Yes
54 Calibration A15 A4500 Spencer Bridge Road EB Jun-05 RSI/ATC 474552 261052 1107 2124 1297 1285 0.347 Yes Yes
55 Calibration A16 A5080 St Andrews Road NB Jun-05 RSI/ATC 474927 261234 9351 2018 512 504 0.336 Yes Yes56 Calibration A16 A5080 St Andrews Road SB Jun-05 RSI/ATC 474927 261234 2018 9351 452 403 2.348 Yes Yes57 Calibration A17 A508 Barrack Road NB Jun-05 RSI/ATC 475382 261256 9701 4018 1476 1465 0.263 Yes Yes58 Calibration A17 A508 Barrack Road SB Jun-05 RSI/ATC 475382 261256 4018 9701 979 959 0.622 Yes Yes59 Calibration A18 A5123 Kettering Road NB Jun-05 RSI/ATC 476262 261133 2011 9348 703 342 15.754 No No60 Calibration A18 A5123 Kettering Road SB Jun-05 RSI/ATC 476262 261133 9348 2011 523 529 0.295 Yes Yes
61 Calibration A19 A4500 Wellingborough Road EB Jun-05 RSI/ATC 476422 260955 21012 9349 806 762 1.554 Yes Yes
62 Calibration A19 A4500 Wellingborough Road WB Jun-05 RSI/ATC 476422 260955 9349 21012 623 563 2.456 Yes Yes
63 Calibration A20 Billing Road EB Jun-05 RSI/ATC 476472 260572 2012 5012 482 496 0.635 Yes Yes64 Calibration A20 Billing Road WB Jun-05 RSI/ATC 476472 260572 5012 2012 510 512 0.098 Yes Yes65 Calibration A21 A428 Bedford Road WB Jun-05 RSI/ATC 476142 260029 9353 21014 965 1032 2.138 Yes Yes66 Calibration A21 A428 Bedford Road EB Jun-05 RSI/ATC 476142 260029 21014 9353 876 835 1.396 Yes Yes
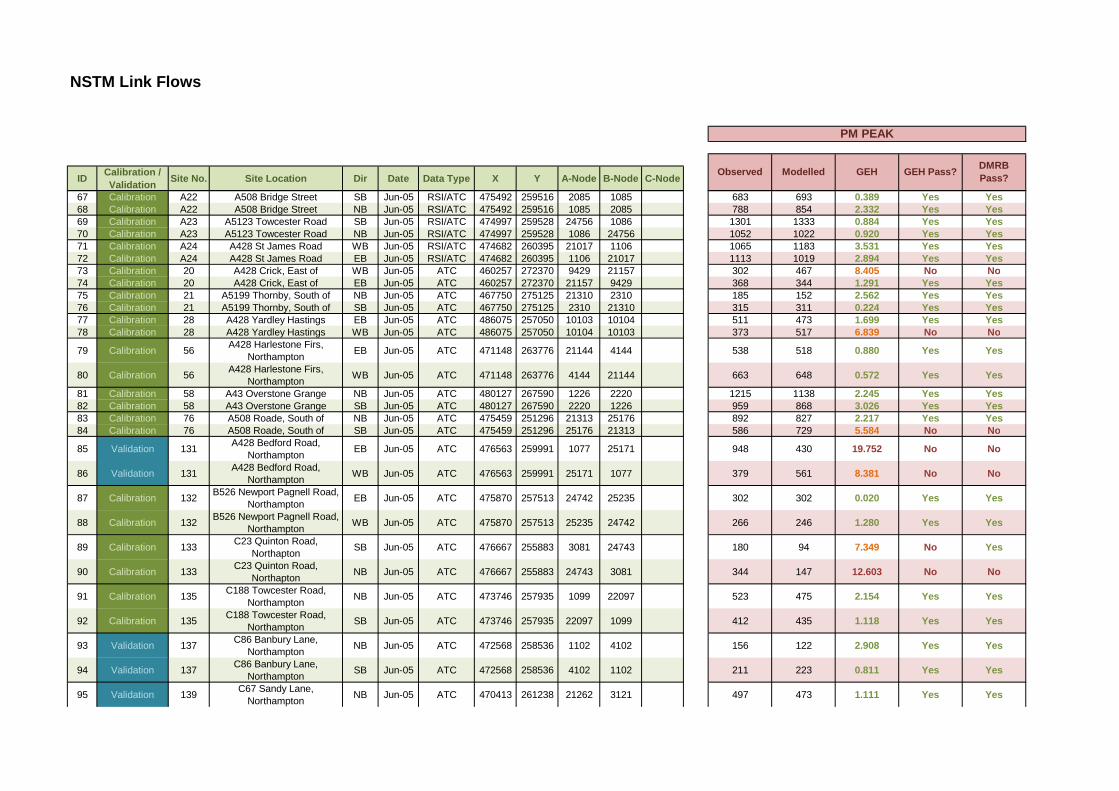
NSTM Link Flows
ID Calibration / Validation Site No. Site Location Dir Date Data Type X Y A-Node B-Node C-Node Modelled GEH GEH Pass? DMRB
Pass?
PM PEAK
Observed
67 Calibration A22 A508 Bridge Street SB Jun-05 RSI/ATC 475492 259516 2085 1085 683 693 0.389 Yes Yes68 Calibration A22 A508 Bridge Street NB Jun-05 RSI/ATC 475492 259516 1085 2085 788 854 2.332 Yes Yes69 Calibration A23 A5123 Towcester Road SB Jun-05 RSI/ATC 474997 259528 24756 1086 1301 1333 0.884 Yes Yes70 Calibration A23 A5123 Towcester Road NB Jun-05 RSI/ATC 474997 259528 1086 24756 1052 1022 0.920 Yes Yes71 Calibration A24 A428 St James Road WB Jun-05 RSI/ATC 474682 260395 21017 1106 1065 1183 3.531 Yes Yes72 Calibration A24 A428 St James Road EB Jun-05 RSI/ATC 474682 260395 1106 21017 1113 1019 2.894 Yes Yes73 Calibration 20 A428 Crick, East of WB Jun-05 ATC 460257 272370 9429 21157 302 467 8.405 No No74 Calibration 20 A428 Crick, East of EB Jun-05 ATC 460257 272370 21157 9429 368 344 1.291 Yes Yes75 Calibration 21 A5199 Thornby, South of NB Jun-05 ATC 467750 275125 21310 2310 185 152 2.562 Yes Yes76 Calibration 21 A5199 Thornby, South of SB Jun-05 ATC 467750 275125 2310 21310 315 311 0.224 Yes Yes77 Calibration 28 A428 Yardley Hastings EB Jun-05 ATC 486075 257050 10103 10104 511 473 1.699 Yes Yes78 Calibration 28 A428 Yardley Hastings WB Jun-05 ATC 486075 257050 10104 10103 373 517 6.839 No No
79 Calibration 56 A428 Harlestone Firs, Northampton EB Jun-05 ATC 471148 263776 21144 4144 538 518 0.880 Yes Yes
80 Calibration 56 A428 Harlestone Firs, Northampton WB Jun-05 ATC 471148 263776 4144 21144 663 648 0.572 Yes Yes
81 Calibration 58 A43 Overstone Grange NB Jun-05 ATC 480127 267590 1226 2220 1215 1138 2.245 Yes Yes82 Calibration 58 A43 Overstone Grange SB Jun-05 ATC 480127 267590 2220 1226 959 868 3.026 Yes Yes83 Calibration 76 A508 Roade, South of NB Jun-05 ATC 475459 251296 21313 25176 892 827 2.217 Yes Yes84 Calibration 76 A508 Roade, South of SB Jun-05 ATC 475459 251296 25176 21313 586 729 5.584 No No
85 Validation 131 A428 Bedford Road, Northampton EB Jun-05 ATC 476563 259991 1077 25171 948 430 19.752 No No
86 Validation 131 A428 Bedford Road, Northampton WB Jun-05 ATC 476563 259991 25171 1077 379 561 8.381 No No
87 Calibration 132 B526 Newport Pagnell Road, Northampton EB Jun-05 ATC 475870 257513 24742 25235 302 302 0.020 Yes Yes
88 Calibration 132 B526 Newport Pagnell Road, Northampton WB Jun-05 ATC 475870 257513 25235 24742 266 246 1.280 Yes Yes
89 Calibration 133 C23 Quinton Road, Northapton SB Jun-05 ATC 476667 255883 3081 24743 180 94 7.349 No Yes
90 Calibration 133 C23 Quinton Road, Northapton NB Jun-05 ATC 476667 255883 24743 3081 344 147 12.603 No No
91 Calibration 135 C188 Towcester Road, Northampton NB Jun-05 ATC 473746 257935 1099 22097 523 475 2.154 Yes Yes
92 Calibration 135 C188 Towcester Road, Northampton SB Jun-05 ATC 473746 257935 22097 1099 412 435 1.118 Yes Yes
93 Validation 137 C86 Banbury Lane, Northampton NB Jun-05 ATC 472568 258536 1102 4102 156 122 2.908 Yes Yes
94 Validation 137 C86 Banbury Lane, Northampton SB Jun-05 ATC 472568 258536 4102 1102 211 223 0.811 Yes Yes
95 Validation 139 C67 Sandy Lane, Northampton NB Jun-05 ATC 470413 261238 21262 3121 497 473 1.111 Yes Yes
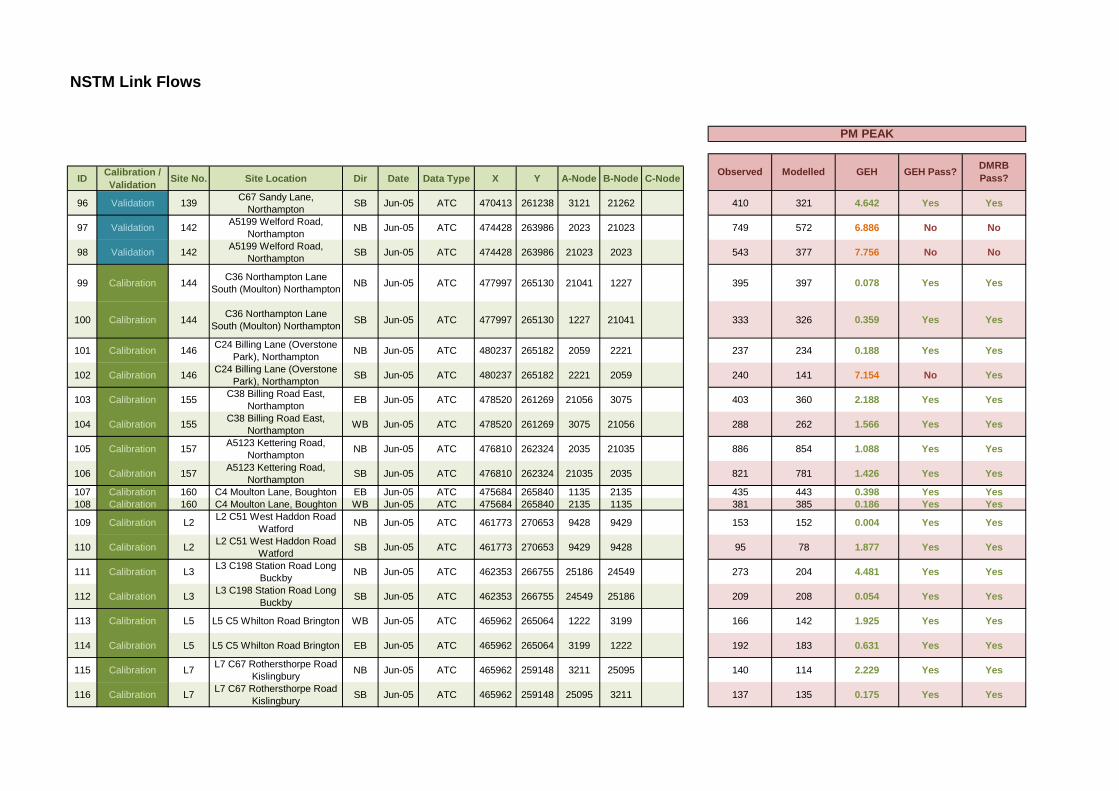
NSTM Link Flows
ID Calibration / Validation Site No. Site Location Dir Date Data Type X Y A-Node B-Node C-Node Modelled GEH GEH Pass? DMRB
Pass?
PM PEAK
Observed
96 Validation 139 C67 Sandy Lane, Northampton SB Jun-05 ATC 470413 261238 3121 21262 410 321 4.642 Yes Yes
97 Validation 142 A5199 Welford Road, Northampton NB Jun-05 ATC 474428 263986 2023 21023 749 572 6.886 No No
98 Validation 142 A5199 Welford Road, Northampton SB Jun-05 ATC 474428 263986 21023 2023 543 377 7.756 No No
99 Calibration 144 C36 Northampton Lane South (Moulton) Northampton NB Jun-05 ATC 477997 265130 21041 1227 395 397 0.078 Yes Yes
100 Calibration 144 C36 Northampton Lane South (Moulton) Northampton SB Jun-05 ATC 477997 265130 1227 21041 333 326 0.359 Yes Yes
101 Calibration 146 C24 Billing Lane (Overstone Park), Northampton NB Jun-05 ATC 480237 265182 2059 2221 237 234 0.188 Yes Yes
102 Calibration 146 C24 Billing Lane (Overstone Park), Northampton SB Jun-05 ATC 480237 265182 2221 2059 240 141 7.154 No Yes
103 Calibration 155 C38 Billing Road East, Northampton EB Jun-05 ATC 478520 261269 21056 3075 403 360 2.188 Yes Yes
104 Calibration 155 C38 Billing Road East, Northampton WB Jun-05 ATC 478520 261269 3075 21056 288 262 1.566 Yes Yes
105 Calibration 157 A5123 Kettering Road, Northampton NB Jun-05 ATC 476810 262324 2035 21035 886 854 1.088 Yes Yes
106 Calibration 157 A5123 Kettering Road, Northampton SB Jun-05 ATC 476810 262324 21035 2035 821 781 1.426 Yes Yes
107 Calibration 160 C4 Moulton Lane, Boughton EB Jun-05 ATC 475684 265840 1135 2135 435 443 0.398 Yes Yes108 Calibration 160 C4 Moulton Lane, Boughton WB Jun-05 ATC 475684 265840 2135 1135 381 385 0.186 Yes Yes
109 Calibration L2 L2 C51 West Haddon Road Watford NB Jun-05 ATC 461773 270653 9428 9429 153 152 0.004 Yes Yes
110 Calibration L2 L2 C51 West Haddon Road Watford SB Jun-05 ATC 461773 270653 9429 9428 95 78 1.877 Yes Yes
111 Calibration L3 L3 C198 Station Road Long Buckby NB Jun-05 ATC 462353 266755 25186 24549 273 204 4.481 Yes Yes
112 Calibration L3 L3 C198 Station Road Long Buckby SB Jun-05 ATC 462353 266755 24549 25186 209 208 0.054 Yes Yes
113 Calibration L5 L5 C5 Whilton Road Brington WB Jun-05 ATC 465962 265064 1222 3199 166 142 1.925 Yes Yes
114 Calibration L5 L5 C5 Whilton Road Brington EB Jun-05 ATC 465962 265064 3199 1222 192 183 0.631 Yes Yes
115 Calibration L7 L7 C67 Rothersthorpe Road Kislingbury NB Jun-05 ATC 465962 259148 3211 25095 140 114 2.229 Yes Yes
116 Calibration L7 L7 C67 Rothersthorpe Road Kislingbury SB Jun-05 ATC 465962 259148 25095 3211 137 135 0.175 Yes Yes
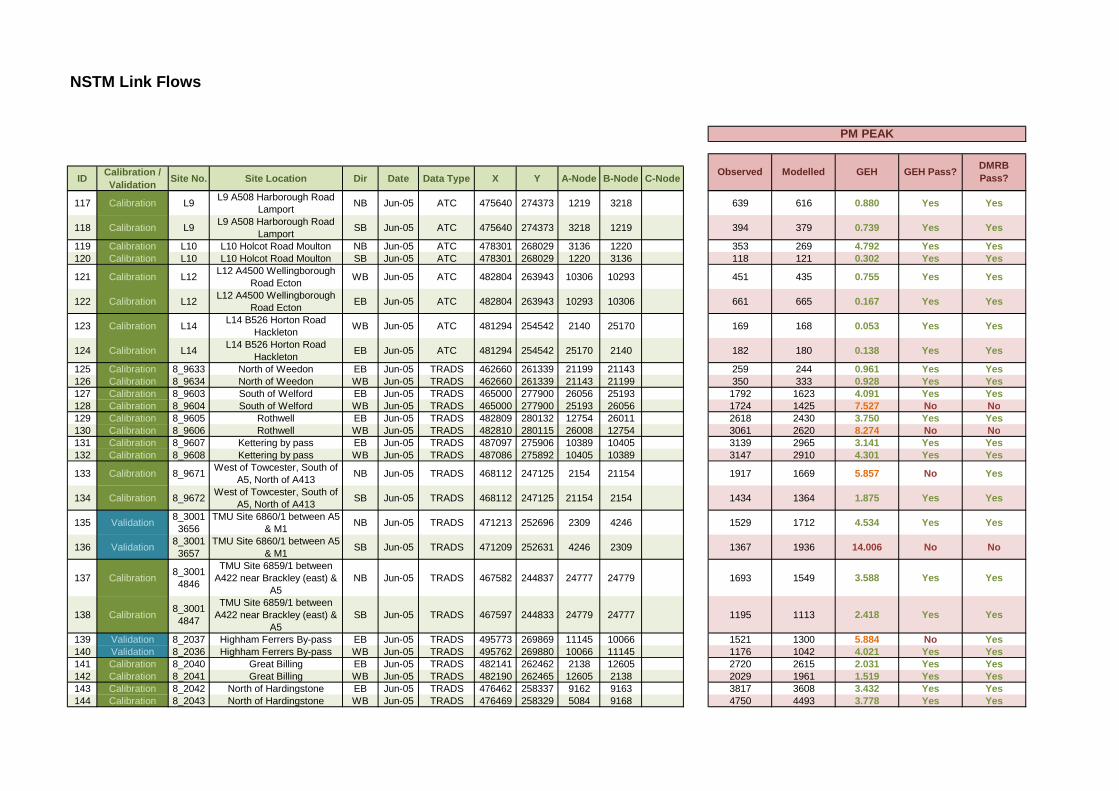
NSTM Link Flows
ID Calibration / Validation Site No. Site Location Dir Date Data Type X Y A-Node B-Node C-Node Modelled GEH GEH Pass? DMRB
Pass?
PM PEAK
Observed
117 Calibration L9 L9 A508 Harborough Road Lamport NB Jun-05 ATC 475640 274373 1219 3218 639 616 0.880 Yes Yes
118 Calibration L9 L9 A508 Harborough Road Lamport SB Jun-05 ATC 475640 274373 3218 1219 394 379 0.739 Yes Yes
119 Calibration L10 L10 Holcot Road Moulton NB Jun-05 ATC 478301 268029 3136 1220 353 269 4.792 Yes Yes120 Calibration L10 L10 Holcot Road Moulton SB Jun-05 ATC 478301 268029 1220 3136 118 121 0.302 Yes Yes
121 Calibration L12 L12 A4500 Wellingborough Road Ecton WB Jun-05 ATC 482804 263943 10306 10293 451 435 0.755 Yes Yes
122 Calibration L12 L12 A4500 Wellingborough Road Ecton EB Jun-05 ATC 482804 263943 10293 10306 661 665 0.167 Yes Yes
123 Calibration L14 L14 B526 Horton Road Hackleton WB Jun-05 ATC 481294 254542 2140 25170 169 168 0.053 Yes Yes
124 Calibration L14 L14 B526 Horton Road Hackleton EB Jun-05 ATC 481294 254542 25170 2140 182 180 0.138 Yes Yes
125 Calibration 8_9633 North of Weedon EB Jun-05 TRADS 462660 261339 21199 21143 259 244 0.961 Yes Yes126 Calibration 8_9634 North of Weedon WB Jun-05 TRADS 462660 261339 21143 21199 350 333 0.928 Yes Yes127 Calibration 8_9603 South of Welford EB Jun-05 TRADS 465000 277900 26056 25193 1792 1623 4.091 Yes Yes128 Calibration 8_9604 South of Welford WB Jun-05 TRADS 465000 277900 25193 26056 1724 1425 7.527 No No129 Calibration 8_9605 Rothwell EB Jun-05 TRADS 482809 280132 12754 26011 2618 2430 3.750 Yes Yes130 Calibration 8_9606 Rothwell WB Jun-05 TRADS 482810 280115 26008 12754 3061 2620 8.274 No No131 Calibration 8_9607 Kettering by pass EB Jun-05 TRADS 487097 275906 10389 10405 3139 2965 3.141 Yes Yes132 Calibration 8_9608 Kettering by pass WB Jun-05 TRADS 487086 275892 10405 10389 3147 2910 4.301 Yes Yes
133 Calibration 8_9671 West of Towcester, South of A5, North of A413 NB Jun-05 TRADS 468112 247125 2154 21154 1917 1669 5.857 No Yes
134 Calibration 8_9672 West of Towcester, South of A5, North of A413 SB Jun-05 TRADS 468112 247125 21154 2154 1434 1364 1.875 Yes Yes
135 Validation 8_30013656
TMU Site 6860/1 between A5 & M1 NB Jun-05 TRADS 471213 252696 2309 4246 1529 1712 4.534 Yes Yes
136 Validation 8_30013657
TMU Site 6860/1 between A5 & M1 SB Jun-05 TRADS 471209 252631 4246 2309 1367 1936 14.006 No No
137 Calibration 8_30014846
TMU Site 6859/1 between A422 near Brackley (east) &
A5NB Jun-05 TRADS 467582 244837 24777 24779 1693 1549 3.588 Yes Yes
138 Calibration 8_30014847
TMU Site 6859/1 between A422 near Brackley (east) &
A5SB Jun-05 TRADS 467597 244833 24779 24777 1195 1113 2.418 Yes Yes
139 Validation 8_2037 Highham Ferrers By-pass EB Jun-05 TRADS 495773 269869 11145 10066 1521 1300 5.884 No Yes140 Validation 8_2036 Highham Ferrers By-pass WB Jun-05 TRADS 495762 269880 10066 11145 1176 1042 4.021 Yes Yes141 Calibration 8_2040 Great Billing EB Jun-05 TRADS 482141 262462 2138 12605 2720 2615 2.031 Yes Yes142 Calibration 8_2041 Great Billing WB Jun-05 TRADS 482190 262465 12605 2138 2029 1961 1.519 Yes Yes143 Calibration 8_2042 North of Hardingstone EB Jun-05 TRADS 476462 258337 9162 9163 3817 3608 3.432 Yes Yes144 Calibration 8_2043 North of Hardingstone WB Jun-05 TRADS 476469 258329 5084 9168 4750 4493 3.778 Yes Yes
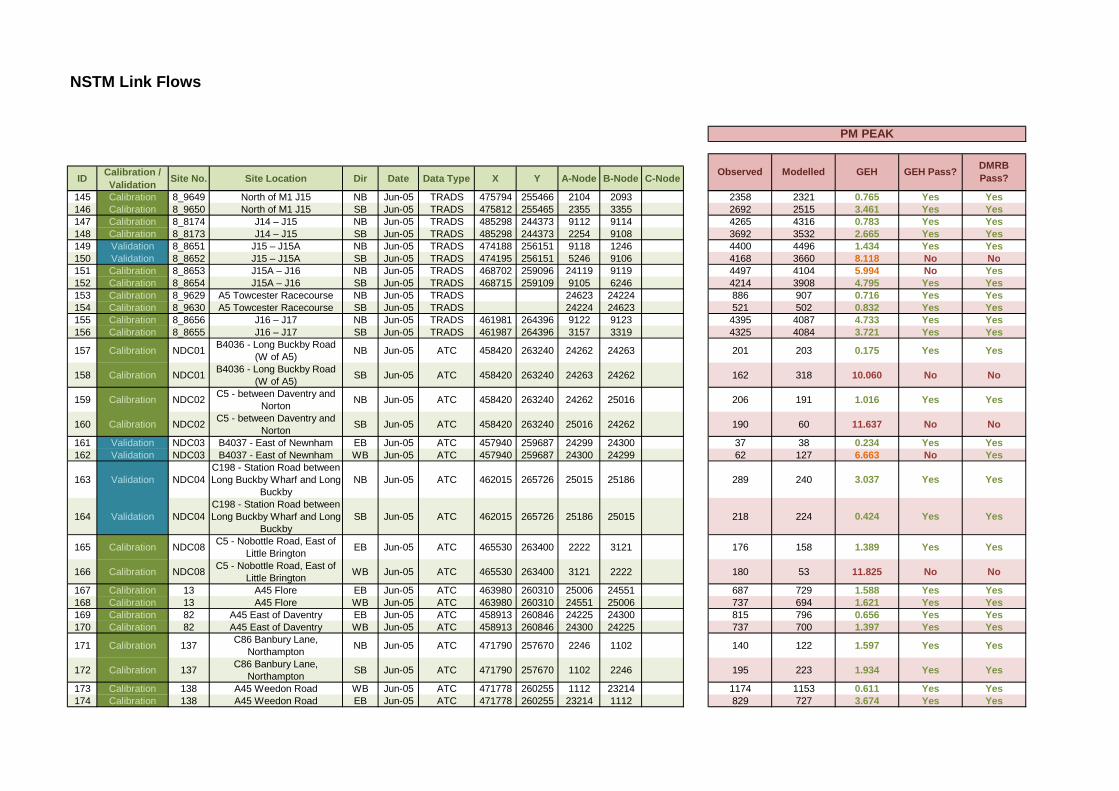
NSTM Link Flows
ID Calibration / Validation Site No. Site Location Dir Date Data Type X Y A-Node B-Node C-Node Modelled GEH GEH Pass? DMRB
Pass?
PM PEAK
Observed
145 Calibration 8_9649 North of M1 J15 NB Jun-05 TRADS 475794 255466 2104 2093 2358 2321 0.765 Yes Yes146 Calibration 8_9650 North of M1 J15 SB Jun-05 TRADS 475812 255465 2355 3355 2692 2515 3.461 Yes Yes147 Calibration 8_8174 J14 – J15 NB Jun-05 TRADS 485298 244373 9112 9114 4265 4316 0.783 Yes Yes148 Calibration 8_8173 J14 – J15 SB Jun-05 TRADS 485298 244373 2254 9108 3692 3532 2.665 Yes Yes149 Validation 8_8651 J15 – J15A NB Jun-05 TRADS 474188 256151 9118 1246 4400 4496 1.434 Yes Yes150 Validation 8_8652 J15 – J15A SB Jun-05 TRADS 474195 256151 5246 9106 4168 3660 8.118 No No151 Calibration 8_8653 J15A – J16 NB Jun-05 TRADS 468702 259096 24119 9119 4497 4104 5.994 No Yes152 Calibration 8_8654 J15A – J16 SB Jun-05 TRADS 468715 259109 9105 6246 4214 3908 4.795 Yes Yes153 Calibration 8_9629 A5 Towcester Racecourse NB Jun-05 TRADS 24623 24224 886 907 0.716 Yes Yes154 Calibration 8_9630 A5 Towcester Racecourse SB Jun-05 TRADS 24224 24623 521 502 0.832 Yes Yes155 Calibration 8_8656 J16 – J17 NB Jun-05 TRADS 461981 264396 9122 9123 4395 4087 4.733 Yes Yes156 Calibration 8_8655 J16 – J17 SB Jun-05 TRADS 461987 264396 3157 3319 4325 4084 3.721 Yes Yes
157 Calibration NDC01 B4036 - Long Buckby Road (W of A5) NB Jun-05 ATC 458420 263240 24262 24263 201 203 0.175 Yes Yes
158 Calibration NDC01 B4036 - Long Buckby Road (W of A5) SB Jun-05 ATC 458420 263240 24263 24262 162 318 10.060 No No
159 Calibration NDC02 C5 - between Daventry and Norton NB Jun-05 ATC 458420 263240 24262 25016 206 191 1.016 Yes Yes
160 Calibration NDC02 C5 - between Daventry and Norton SB Jun-05 ATC 458420 263240 25016 24262 190 60 11.637 No No
161 Validation NDC03 B4037 - East of Newnham EB Jun-05 ATC 457940 259687 24299 24300 37 38 0.234 Yes Yes162 Validation NDC03 B4037 - East of Newnham WB Jun-05 ATC 457940 259687 24300 24299 62 127 6.663 No Yes
163 Validation NDC04C198 - Station Road between Long Buckby Wharf and Long
BuckbyNB Jun-05 ATC 462015 265726 25015 25186 289 240 3.037 Yes Yes
164 Validation NDC04C198 - Station Road between Long Buckby Wharf and Long
BuckbySB Jun-05 ATC 462015 265726 25186 25015 218 224 0.424 Yes Yes
165 Calibration NDC08 C5 - Nobottle Road, East of Little Brington EB Jun-05 ATC 465530 263400 2222 3121 176 158 1.389 Yes Yes
166 Calibration NDC08 C5 - Nobottle Road, East of Little Brington WB Jun-05 ATC 465530 263400 3121 2222 180 53 11.825 No No
167 Calibration 13 A45 Flore EB Jun-05 ATC 463980 260310 25006 24551 687 729 1.588 Yes Yes168 Calibration 13 A45 Flore WB Jun-05 ATC 463980 260310 24551 25006 737 694 1.621 Yes Yes169 Calibration 82 A45 East of Daventry EB Jun-05 ATC 458913 260846 24225 24300 815 796 0.656 Yes Yes170 Calibration 82 A45 East of Daventry WB Jun-05 ATC 458913 260846 24300 24225 737 700 1.397 Yes Yes
171 Calibration 137 C86 Banbury Lane, Northampton NB Jun-05 ATC 471790 257670 2246 1102 140 122 1.597 Yes Yes
172 Calibration 137 C86 Banbury Lane, Northampton SB Jun-05 ATC 471790 257670 1102 2246 195 223 1.934 Yes Yes
173 Calibration 138 A45 Weedon Road WB Jun-05 ATC 471778 260255 1112 23214 1174 1153 0.611 Yes Yes174 Calibration 138 A45 Weedon Road EB Jun-05 ATC 471778 260255 23214 1112 829 727 3.674 Yes Yes
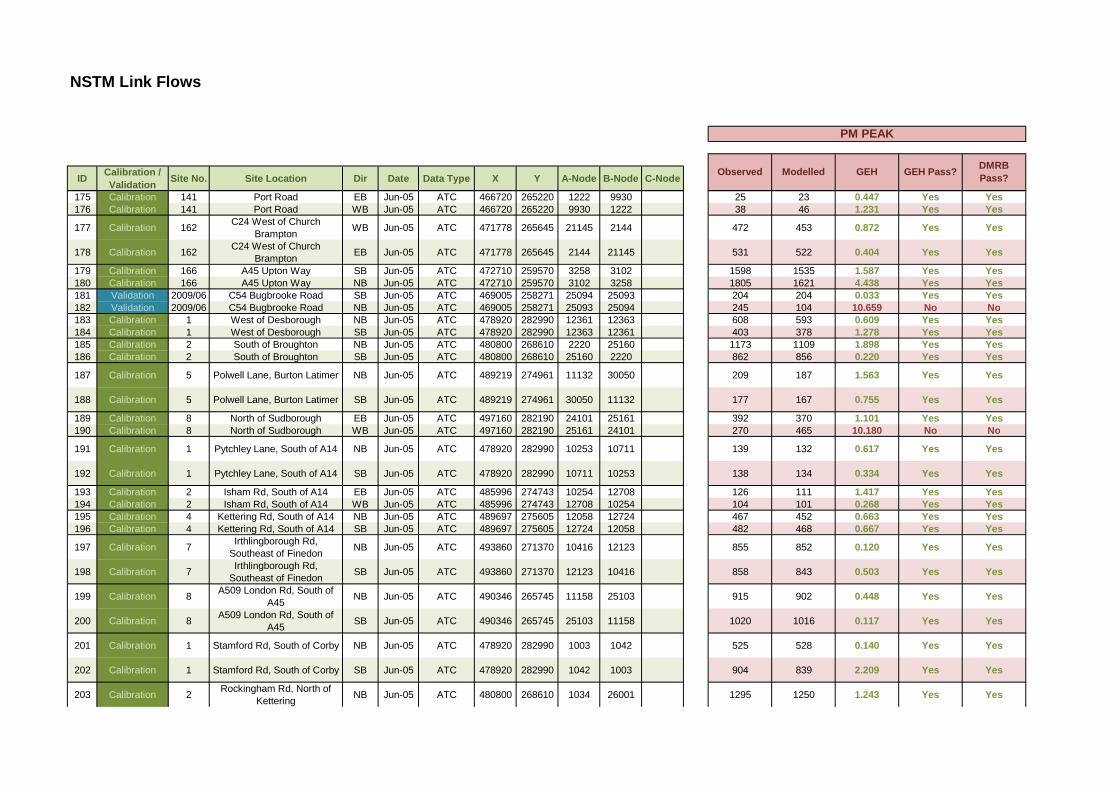
NSTM Link Flows
ID Calibration / Validation Site No. Site Location Dir Date Data Type X Y A-Node B-Node C-Node Modelled GEH GEH Pass? DMRB
Pass?
PM PEAK
Observed
175 Calibration 141 Port Road EB Jun-05 ATC 466720 265220 1222 9930 25 23 0.447 Yes Yes176 Calibration 141 Port Road WB Jun-05 ATC 466720 265220 9930 1222 38 46 1.231 Yes Yes
177 Calibration 162 C24 West of Church Brampton WB Jun-05 ATC 471778 265645 21145 2144 472 453 0.872 Yes Yes
178 Calibration 162 C24 West of Church Brampton EB Jun-05 ATC 471778 265645 2144 21145 531 522 0.404 Yes Yes
179 Calibration 166 A45 Upton Way SB Jun-05 ATC 472710 259570 3258 3102 1598 1535 1.587 Yes Yes180 Calibration 166 A45 Upton Way NB Jun-05 ATC 472710 259570 3102 3258 1805 1621 4.438 Yes Yes181 Validation 2009/06 C54 Bugbrooke Road SB Jun-05 ATC 469005 258271 25094 25093 204 204 0.033 Yes Yes182 Validation 2009/06 C54 Bugbrooke Road NB Jun-05 ATC 469005 258271 25093 25094 245 104 10.659 No No183 Calibration 1 West of Desborough NB Jun-05 ATC 478920 282990 12361 12363 608 593 0.609 Yes Yes184 Calibration 1 West of Desborough SB Jun-05 ATC 478920 282990 12363 12361 403 378 1.278 Yes Yes185 Calibration 2 South of Broughton NB Jun-05 ATC 480800 268610 2220 25160 1173 1109 1.898 Yes Yes186 Calibration 2 South of Broughton SB Jun-05 ATC 480800 268610 25160 2220 862 856 0.220 Yes Yes
187 Calibration 5 Polwell Lane, Burton Latimer NB Jun-05 ATC 489219 274961 11132 30050 209 187 1.563 Yes Yes
188 Calibration 5 Polwell Lane, Burton Latimer SB Jun-05 ATC 489219 274961 30050 11132 177 167 0.755 Yes Yes
189 Calibration 8 North of Sudborough EB Jun-05 ATC 497160 282190 24101 25161 392 370 1.101 Yes Yes190 Calibration 8 North of Sudborough WB Jun-05 ATC 497160 282190 25161 24101 270 465 10.180 No No
191 Calibration 1 Pytchley Lane, South of A14 NB Jun-05 ATC 478920 282990 10253 10711 139 132 0.617 Yes Yes
192 Calibration 1 Pytchley Lane, South of A14 SB Jun-05 ATC 478920 282990 10711 10253 138 134 0.334 Yes Yes
193 Calibration 2 Isham Rd, South of A14 EB Jun-05 ATC 485996 274743 10254 12708 126 111 1.417 Yes Yes194 Calibration 2 Isham Rd, South of A14 WB Jun-05 ATC 485996 274743 12708 10254 104 101 0.268 Yes Yes195 Calibration 4 Kettering Rd, South of A14 NB Jun-05 ATC 489697 275605 12058 12724 467 452 0.663 Yes Yes196 Calibration 4 Kettering Rd, South of A14 SB Jun-05 ATC 489697 275605 12724 12058 482 468 0.667 Yes Yes
197 Calibration 7 Irthlingborough Rd, Southeast of Finedon NB Jun-05 ATC 493860 271370 10416 12123 855 852 0.120 Yes Yes
198 Calibration 7 Irthlingborough Rd, Southeast of Finedon SB Jun-05 ATC 493860 271370 12123 10416 858 843 0.503 Yes Yes
199 Calibration 8 A509 London Rd, South of A45 NB Jun-05 ATC 490346 265745 11158 25103 915 902 0.448 Yes Yes
200 Calibration 8 A509 London Rd, South of A45 SB Jun-05 ATC 490346 265745 25103 11158 1020 1016 0.117 Yes Yes
201 Calibration 1 Stamford Rd, South of Corby NB Jun-05 ATC 478920 282990 1003 1042 525 528 0.140 Yes Yes
202 Calibration 1 Stamford Rd, South of Corby SB Jun-05 ATC 478920 282990 1042 1003 904 839 2.209 Yes Yes
203 Calibration 2 Rockingham Rd, North of Kettering NB Jun-05 ATC 480800 268610 1034 26001 1295 1250 1.243 Yes Yes
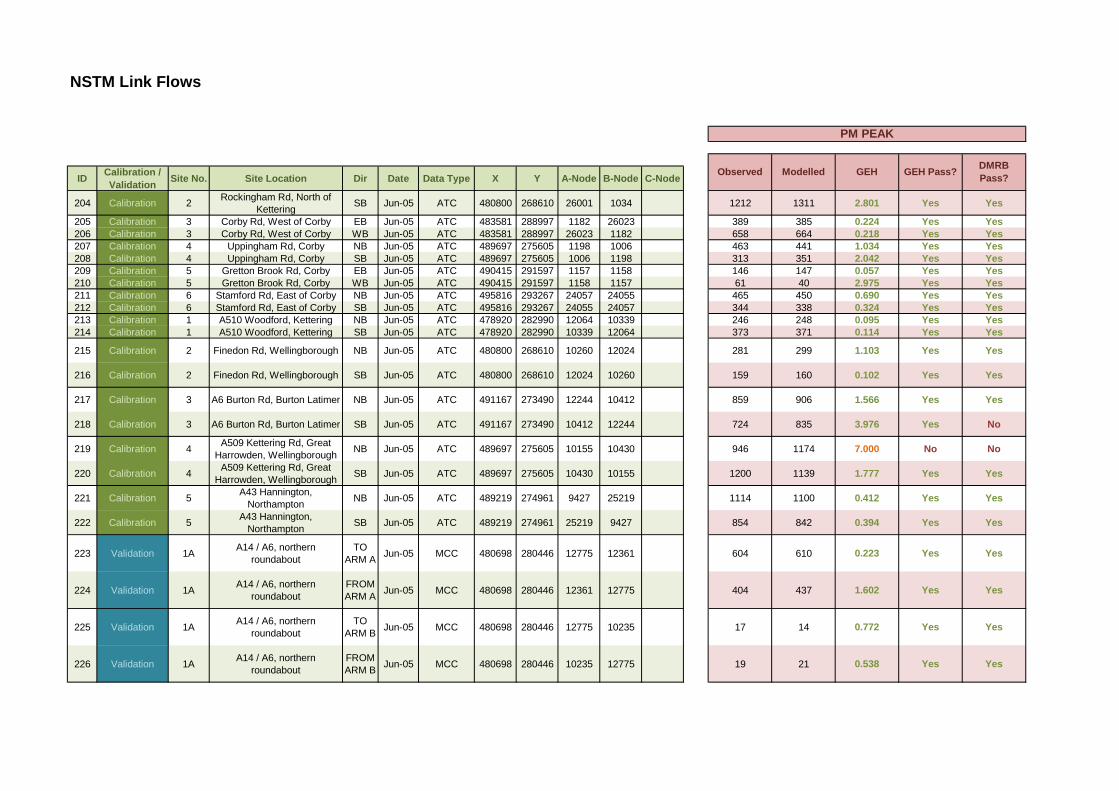
NSTM Link Flows
ID Calibration / Validation Site No. Site Location Dir Date Data Type X Y A-Node B-Node C-Node Modelled GEH GEH Pass? DMRB
Pass?
PM PEAK
Observed
204 Calibration 2 Rockingham Rd, North of Kettering SB Jun-05 ATC 480800 268610 26001 1034 1212 1311 2.801 Yes Yes
205 Calibration 3 Corby Rd, West of Corby EB Jun-05 ATC 483581 288997 1182 26023 389 385 0.224 Yes Yes206 Calibration 3 Corby Rd, West of Corby WB Jun-05 ATC 483581 288997 26023 1182 658 664 0.218 Yes Yes207 Calibration 4 Uppingham Rd, Corby NB Jun-05 ATC 489697 275605 1198 1006 463 441 1.034 Yes Yes208 Calibration 4 Uppingham Rd, Corby SB Jun-05 ATC 489697 275605 1006 1198 313 351 2.042 Yes Yes209 Calibration 5 Gretton Brook Rd, Corby EB Jun-05 ATC 490415 291597 1157 1158 146 147 0.057 Yes Yes210 Calibration 5 Gretton Brook Rd, Corby WB Jun-05 ATC 490415 291597 1158 1157 61 40 2.975 Yes Yes211 Calibration 6 Stamford Rd, East of Corby NB Jun-05 ATC 495816 293267 24057 24055 465 450 0.690 Yes Yes212 Calibration 6 Stamford Rd, East of Corby SB Jun-05 ATC 495816 293267 24055 24057 344 338 0.324 Yes Yes213 Calibration 1 A510 Woodford, Kettering NB Jun-05 ATC 478920 282990 12064 10339 246 248 0.095 Yes Yes214 Calibration 1 A510 Woodford, Kettering SB Jun-05 ATC 478920 282990 10339 12064 373 371 0.114 Yes Yes
215 Calibration 2 Finedon Rd, Wellingborough NB Jun-05 ATC 480800 268610 10260 12024 281 299 1.103 Yes Yes
216 Calibration 2 Finedon Rd, Wellingborough SB Jun-05 ATC 480800 268610 12024 10260 159 160 0.102 Yes Yes
217 Calibration 3 A6 Burton Rd, Burton Latimer NB Jun-05 ATC 491167 273490 12244 10412 859 906 1.566 Yes Yes
218 Calibration 3 A6 Burton Rd, Burton Latimer SB Jun-05 ATC 491167 273490 10412 12244 724 835 3.976 Yes No
219 Calibration 4 A509 Kettering Rd, Great Harrowden, Wellingborough NB Jun-05 ATC 489697 275605 10155 10430 946 1174 7.000 No No
220 Calibration 4 A509 Kettering Rd, Great Harrowden, Wellingborough SB Jun-05 ATC 489697 275605 10430 10155 1200 1139 1.777 Yes Yes
221 Calibration 5 A43 Hannington, Northampton NB Jun-05 ATC 489219 274961 9427 25219 1114 1100 0.412 Yes Yes
222 Calibration 5 A43 Hannington, Northampton SB Jun-05 ATC 489219 274961 25219 9427 854 842 0.394 Yes Yes
223 Validation 1A A14 / A6, northern roundabout
TO ARM A Jun-05 MCC 480698 280446 12775 12361 604 610 0.223 Yes Yes
224 Validation 1A A14 / A6, northern roundabout
FROM ARM A Jun-05 MCC 480698 280446 12361 12775 404 437 1.602 Yes Yes
225 Validation 1A A14 / A6, northern roundabout
TO ARM B Jun-05 MCC 480698 280446 12775 10235 17 14 0.772 Yes Yes
226 Validation 1A A14 / A6, northern roundabout
FROM ARM B Jun-05 MCC 480698 280446 10235 12775 19 21 0.538 Yes Yes
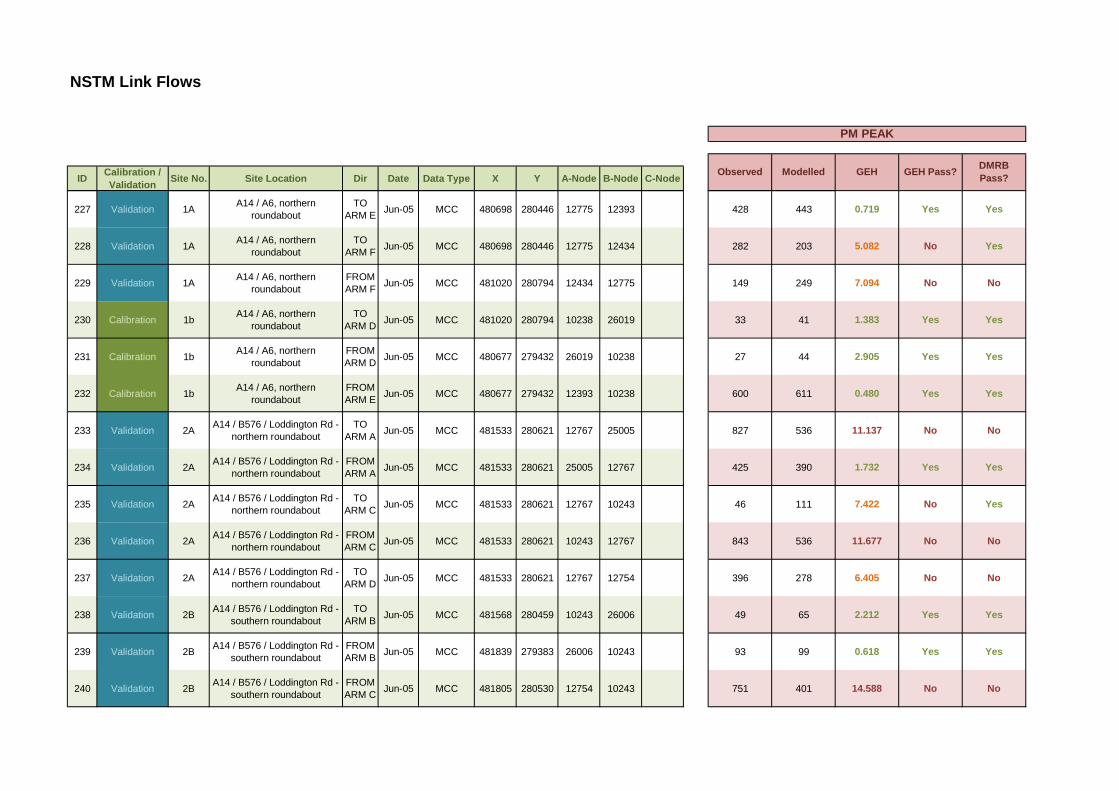
NSTM Link Flows
ID Calibration / Validation Site No. Site Location Dir Date Data Type X Y A-Node B-Node C-Node Modelled GEH GEH Pass? DMRB
Pass?
PM PEAK
Observed
227 Validation 1A A14 / A6, northern roundabout
TO ARM E Jun-05 MCC 480698 280446 12775 12393 428 443 0.719 Yes Yes
228 Validation 1A A14 / A6, northern roundabout
TO ARM F Jun-05 MCC 480698 280446 12775 12434 282 203 5.082 No Yes
229 Validation 1A A14 / A6, northern roundabout
FROM ARM F Jun-05 MCC 481020 280794 12434 12775 149 249 7.094 No No
230 Calibration 1b A14 / A6, northern roundabout
TO ARM D Jun-05 MCC 481020 280794 10238 26019 33 41 1.383 Yes Yes
231 Calibration 1b A14 / A6, northern roundabout
FROM ARM D Jun-05 MCC 480677 279432 26019 10238 27 44 2.905 Yes Yes
232 Calibration 1b A14 / A6, northern roundabout
FROM ARM E Jun-05 MCC 480677 279432 12393 10238 600 611 0.480 Yes Yes
233 Validation 2A A14 / B576 / Loddington Rd - northern roundabout
TO ARM A Jun-05 MCC 481533 280621 12767 25005 827 536 11.137 No No
234 Validation 2A A14 / B576 / Loddington Rd - northern roundabout
FROM ARM A Jun-05 MCC 481533 280621 25005 12767 425 390 1.732 Yes Yes
235 Validation 2A A14 / B576 / Loddington Rd - northern roundabout
TO ARM C Jun-05 MCC 481533 280621 12767 10243 46 111 7.422 No Yes
236 Validation 2A A14 / B576 / Loddington Rd - northern roundabout
FROM ARM C Jun-05 MCC 481533 280621 10243 12767 843 536 11.677 No No
237 Validation 2A A14 / B576 / Loddington Rd - northern roundabout
TO ARM D Jun-05 MCC 481533 280621 12767 12754 396 278 6.405 No No
238 Validation 2B A14 / B576 / Loddington Rd - southern roundabout
TO ARM B Jun-05 MCC 481568 280459 10243 26006 49 65 2.212 Yes Yes
239 Validation 2B A14 / B576 / Loddington Rd - southern roundabout
FROM ARM B Jun-05 MCC 481839 279383 26006 10243 93 99 0.618 Yes Yes
240 Validation 2B A14 / B576 / Loddington Rd - southern roundabout
FROM ARM C Jun-05 MCC 481805 280530 12754 10243 751 401 14.588 No No
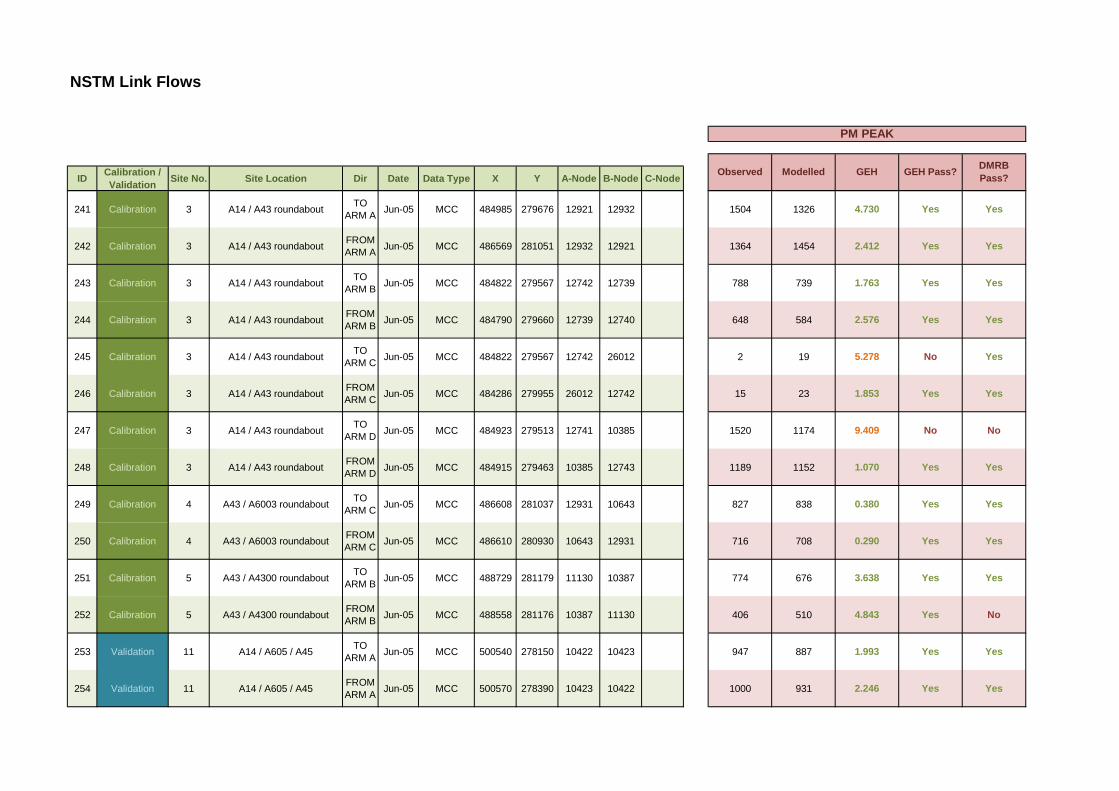
NSTM Link Flows
ID Calibration / Validation Site No. Site Location Dir Date Data Type X Y A-Node B-Node C-Node Modelled GEH GEH Pass? DMRB
Pass?
PM PEAK
Observed
241 Calibration 3 A14 / A43 roundabout TO ARM A Jun-05 MCC 484985 279676 12921 12932 1504 1326 4.730 Yes Yes
242 Calibration 3 A14 / A43 roundabout FROM ARM A Jun-05 MCC 486569 281051 12932 12921 1364 1454 2.412 Yes Yes
243 Calibration 3 A14 / A43 roundabout TO ARM B Jun-05 MCC 484822 279567 12742 12739 788 739 1.763 Yes Yes
244 Calibration 3 A14 / A43 roundabout FROM ARM B Jun-05 MCC 484790 279660 12739 12740 648 584 2.576 Yes Yes
245 Calibration 3 A14 / A43 roundabout TO ARM C Jun-05 MCC 484822 279567 12742 26012 2 19 5.278 No Yes
246 Calibration 3 A14 / A43 roundabout FROM ARM C Jun-05 MCC 484286 279955 26012 12742 15 23 1.853 Yes Yes
247 Calibration 3 A14 / A43 roundabout TO ARM D Jun-05 MCC 484923 279513 12741 10385 1520 1174 9.409 No No
248 Calibration 3 A14 / A43 roundabout FROM ARM D Jun-05 MCC 484915 279463 10385 12743 1189 1152 1.070 Yes Yes
249 Calibration 4 A43 / A6003 roundabout TO ARM C Jun-05 MCC 486608 281037 12931 10643 827 838 0.380 Yes Yes
250 Calibration 4 A43 / A6003 roundabout FROM ARM C Jun-05 MCC 486610 280930 10643 12931 716 708 0.290 Yes Yes
251 Calibration 5 A43 / A4300 roundabout TO ARM B Jun-05 MCC 488729 281179 11130 10387 774 676 3.638 Yes Yes
252 Calibration 5 A43 / A4300 roundabout FROM ARM B Jun-05 MCC 488558 281176 10387 11130 406 510 4.843 Yes No
253 Validation 11 A14 / A605 / A45 TO ARM A Jun-05 MCC 500540 278150 10422 10423 947 887 1.993 Yes Yes
254 Validation 11 A14 / A605 / A45 FROM ARM A Jun-05 MCC 500570 278390 10423 10422 1000 931 2.246 Yes Yes
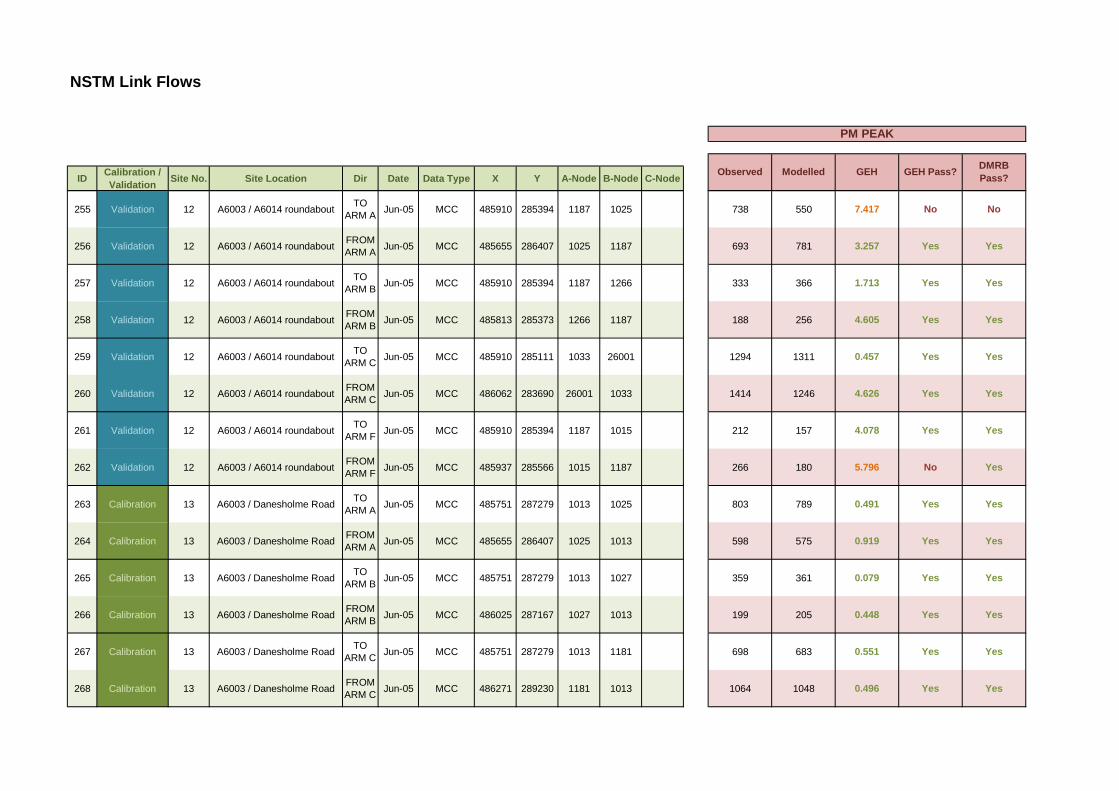
NSTM Link Flows
ID Calibration / Validation Site No. Site Location Dir Date Data Type X Y A-Node B-Node C-Node Modelled GEH GEH Pass? DMRB
Pass?
PM PEAK
Observed
255 Validation 12 A6003 / A6014 roundabout TO ARM A Jun-05 MCC 485910 285394 1187 1025 738 550 7.417 No No
256 Validation 12 A6003 / A6014 roundabout FROM ARM A Jun-05 MCC 485655 286407 1025 1187 693 781 3.257 Yes Yes
257 Validation 12 A6003 / A6014 roundabout TO ARM B Jun-05 MCC 485910 285394 1187 1266 333 366 1.713 Yes Yes
258 Validation 12 A6003 / A6014 roundabout FROM ARM B Jun-05 MCC 485813 285373 1266 1187 188 256 4.605 Yes Yes
259 Validation 12 A6003 / A6014 roundabout TO ARM C Jun-05 MCC 485910 285111 1033 26001 1294 1311 0.457 Yes Yes
260 Validation 12 A6003 / A6014 roundabout FROM ARM C Jun-05 MCC 486062 283690 26001 1033 1414 1246 4.626 Yes Yes
261 Validation 12 A6003 / A6014 roundabout TO ARM F Jun-05 MCC 485910 285394 1187 1015 212 157 4.078 Yes Yes
262 Validation 12 A6003 / A6014 roundabout FROM ARM F Jun-05 MCC 485937 285566 1015 1187 266 180 5.796 No Yes
263 Calibration 13 A6003 / Danesholme Road TO ARM A Jun-05 MCC 485751 287279 1013 1025 803 789 0.491 Yes Yes
264 Calibration 13 A6003 / Danesholme Road FROM ARM A Jun-05 MCC 485655 286407 1025 1013 598 575 0.919 Yes Yes
265 Calibration 13 A6003 / Danesholme Road TO ARM B Jun-05 MCC 485751 287279 1013 1027 359 361 0.079 Yes Yes
266 Calibration 13 A6003 / Danesholme Road FROM ARM B Jun-05 MCC 486025 287167 1027 1013 199 205 0.448 Yes Yes
267 Calibration 13 A6003 / Danesholme Road TO ARM C Jun-05 MCC 485751 287279 1013 1181 698 683 0.551 Yes Yes
268 Calibration 13 A6003 / Danesholme Road FROM ARM C Jun-05 MCC 486271 289230 1181 1013 1064 1048 0.496 Yes Yes

NSTM Link Flows
ID Calibration / Validation Site No. Site Location Dir Date Data Type X Y A-Node B-Node C-Node Modelled GEH GEH Pass? DMRB
Pass?
PM PEAK
Observed
269 Calibration 14 A6003 / Corby Rd / Cottingham Rd
TO ARM A Jun-05 MCC 486271 289230 1181 26020 496 469 1.232 Yes Yes
270 Calibration 14 A6003 / Corby Rd / Cottingham Rd
FROM ARM A Jun-05 MCC 486596 289916 26020 1181 1063 1001 1.941 Yes Yes
271 Calibration 14 A6003 / Corby Rd / Cottingham Rd
TO ARM B Jun-05 MCC 486271 289230 1181 26023 644 694 1.936 Yes Yes
272 Calibration 14 A6003 / Corby Rd / Cottingham Rd
FROM ARM B Jun-05 MCC 485947 289428 26023 1181 440 437 0.122 Yes Yes
273 Calibration 14 A6003 / Corby Rd / Cottingham Rd
TO ARM D Jun-05 MCC 486271 289230 1181 1007 512 511 0.064 Yes Yes
274 Calibration 14 A6003 / Corby Rd / Cottingham Rd
FROM ARM D Jun-05 MCC 486715 289004 1007 1181 492 595 4.405 Yes No
275 Calibration 15 A6003 / A6116 roundabout TO ARM A Jun-05 MCC 487143 290987 1198 26020 808 736 2.584 Yes Yes
276 Calibration 15 A6003 / A6116 roundabout FROM ARM A Jun-05 MCC 486596 289916 26020 1198 512 481 1.414 Yes Yes
277 Calibration 15 A6003 / A6116 roundabout TO ARM B Jun-05 MCC 487143 290987 1198 24568 402 374 1.402 Yes Yes
278 Calibration 15 A6003 / A6116 roundabout FROM ARM B Jun-05 MCC 487909 290695 24568 1198 856 800 1.922 Yes Yes
279 Calibration 16 A6116 / Gretton Brook Road TO ARM A Jun-05 MCC 487984 290664 1199 1291 248 238 0.681 Yes Yes
280 Calibration 16 A6116 / Gretton Brook Road FROM ARM A Jun-05 MCC 488069 290772 1291 1199 929 913 0.522 Yes Yes
281 Calibration 16 A6116 / Gretton Brook Road TO ARM B Jun-05 MCC 487984 290664 1199 24568 871 800 2.462 Yes Yes
282 Calibration 16 A6116 / Gretton Brook Road FROM ARM B Jun-05 MCC 487909 290695 24568 1199 370 374 0.214 Yes Yes

NSTM Link Flows
ID Calibration / Validation Site No. Site Location Dir Date Data Type X Y A-Node B-Node C-Node Modelled GEH GEH Pass? DMRB
Pass?
PM PEAK
Observed
283 Calibration 16 A6116 / Gretton Brook Road TO ARM C Jun-05 MCC 487984 290664 1199 1147 560 606 1.904 Yes Yes
284 Calibration 16 A6116 / Gretton Brook Road FROM ARM C Jun-05 MCC 488177 290526 1147 1199 380 356 1.257 Yes Yes
285 Calibration 17 A6116 / A6086 roundabout TO ARM A Jun-05 MCC 489930 290030 1205 1157 703 645 2.227 Yes Yes
286 Calibration 17 A6116 / A6086 roundabout FROM ARM A Jun-05 MCC 489254 291150 1157 1205 380 300 4.371 Yes Yes
287 Calibration 17 A6116 / A6086 roundabout TO ARM D Jun-05 MCC 489930 290030 1205 24864 299 235 3.902 Yes Yes
288 Calibration 17 A6116 / A6086 roundabout FROM ARM D Jun-05 MCC 490700 290340 24864 1205 619 474 6.211 No No
289 Calibration 18 A43 / A427 Stamford Road TO ARM A Jun-05 MCC 493002 289869 1212 24063 470 469 0.050 Yes Yes
290 Calibration 18 A43 / A427 Stamford Road FROM ARM A Jun-05 MCC 495377 291843 24063 1212 336 326 0.568 Yes Yes
291 Calibration 19 Steel Road / Bangrave Road TO ARM A Jun-05 MCC 491949 289909 1209 24862 201 182 1.385 Yes Yes
292 Calibration 19 Steel Road / Bangrave Road FROM ARM A Jun-05 MCC 491910 290130 24862 1209 572 512 2.585 Yes Yes
293 Calibration 20 A43 / A427 Weldon Road TO ARM B Jun-05 MCC 491598 289509 1149 1261 656 562 3.824 Yes Yes
294 Calibration 20 A43 / A427 Weldon Road FROM ARM B Jun-05 MCC 491327 289392 1261 1149 480 496 0.699 Yes Yes
295 Calibration 20 A43 / A427 Weldon Road TO ARM C Jun-05 MCC 491598 289509 1149 24875 622 561 2.530 Yes Yes
296 Calibration 20 A43 / A427 Weldon Road FROM ARM C Jun-05 MCC 491560 289250 24875 1149 391 361 1.524 Yes Yes
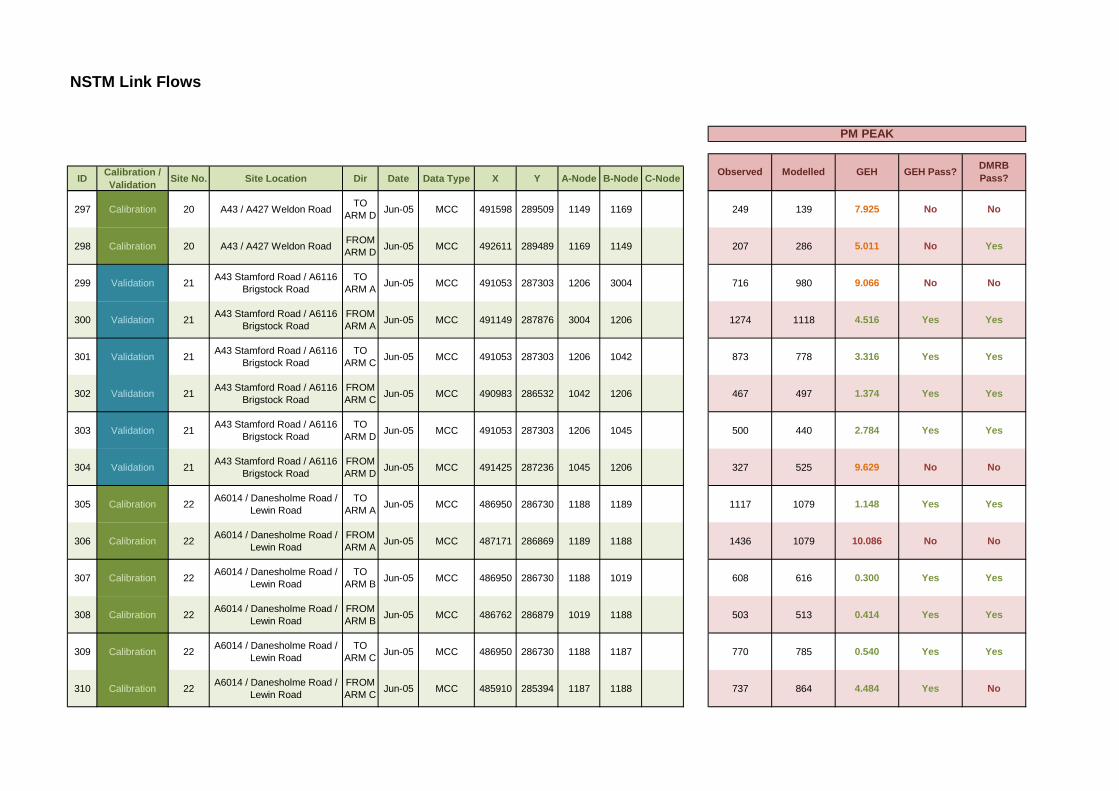
NSTM Link Flows
ID Calibration / Validation Site No. Site Location Dir Date Data Type X Y A-Node B-Node C-Node Modelled GEH GEH Pass? DMRB
Pass?
PM PEAK
Observed
297 Calibration 20 A43 / A427 Weldon Road TO ARM D Jun-05 MCC 491598 289509 1149 1169 249 139 7.925 No No
298 Calibration 20 A43 / A427 Weldon Road FROM ARM D Jun-05 MCC 492611 289489 1169 1149 207 286 5.011 No Yes
299 Validation 21 A43 Stamford Road / A6116 Brigstock Road
TO ARM A Jun-05 MCC 491053 287303 1206 3004 716 980 9.066 No No
300 Validation 21 A43 Stamford Road / A6116 Brigstock Road
FROM ARM A Jun-05 MCC 491149 287876 3004 1206 1274 1118 4.516 Yes Yes
301 Validation 21 A43 Stamford Road / A6116 Brigstock Road
TO ARM C Jun-05 MCC 491053 287303 1206 1042 873 778 3.316 Yes Yes
302 Validation 21 A43 Stamford Road / A6116 Brigstock Road
FROM ARM C Jun-05 MCC 490983 286532 1042 1206 467 497 1.374 Yes Yes
303 Validation 21 A43 Stamford Road / A6116 Brigstock Road
TO ARM D Jun-05 MCC 491053 287303 1206 1045 500 440 2.784 Yes Yes
304 Validation 21 A43 Stamford Road / A6116 Brigstock Road
FROM ARM D Jun-05 MCC 491425 287236 1045 1206 327 525 9.629 No No
305 Calibration 22 A6014 / Danesholme Road / Lewin Road
TO ARM A Jun-05 MCC 486950 286730 1188 1189 1117 1079 1.148 Yes Yes
306 Calibration 22 A6014 / Danesholme Road / Lewin Road
FROM ARM A Jun-05 MCC 487171 286869 1189 1188 1436 1079 10.086 No No
307 Calibration 22 A6014 / Danesholme Road / Lewin Road
TO ARM B Jun-05 MCC 486950 286730 1188 1019 608 616 0.300 Yes Yes
308 Calibration 22 A6014 / Danesholme Road / Lewin Road
FROM ARM B Jun-05 MCC 486762 286879 1019 1188 503 513 0.414 Yes Yes
309 Calibration 22 A6014 / Danesholme Road / Lewin Road
TO ARM C Jun-05 MCC 486950 286730 1188 1187 770 785 0.540 Yes Yes
310 Calibration 22 A6014 / Danesholme Road / Lewin Road
FROM ARM C Jun-05 MCC 485910 285394 1187 1188 737 864 4.484 Yes No
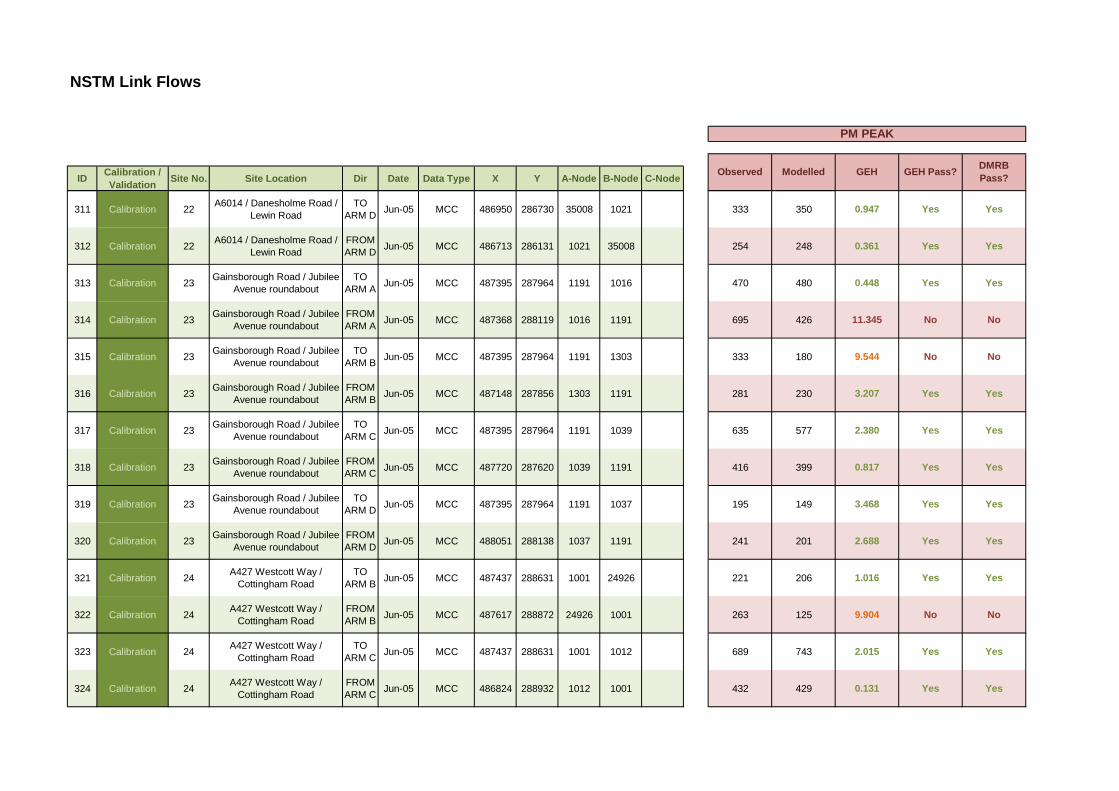
NSTM Link Flows
ID Calibration / Validation Site No. Site Location Dir Date Data Type X Y A-Node B-Node C-Node Modelled GEH GEH Pass? DMRB
Pass?
PM PEAK
Observed
311 Calibration 22 A6014 / Danesholme Road / Lewin Road
TO ARM D Jun-05 MCC 486950 286730 35008 1021 333 350 0.947 Yes Yes
312 Calibration 22 A6014 / Danesholme Road / Lewin Road
FROM ARM D Jun-05 MCC 486713 286131 1021 35008 254 248 0.361 Yes Yes
313 Calibration 23 Gainsborough Road / Jubilee Avenue roundabout
TO ARM A Jun-05 MCC 487395 287964 1191 1016 470 480 0.448 Yes Yes
314 Calibration 23 Gainsborough Road / Jubilee Avenue roundabout
FROM ARM A Jun-05 MCC 487368 288119 1016 1191 695 426 11.345 No No
315 Calibration 23 Gainsborough Road / Jubilee Avenue roundabout
TO ARM B Jun-05 MCC 487395 287964 1191 1303 333 180 9.544 No No
316 Calibration 23 Gainsborough Road / Jubilee Avenue roundabout
FROM ARM B Jun-05 MCC 487148 287856 1303 1191 281 230 3.207 Yes Yes
317 Calibration 23 Gainsborough Road / Jubilee Avenue roundabout
TO ARM C Jun-05 MCC 487395 287964 1191 1039 635 577 2.380 Yes Yes
318 Calibration 23 Gainsborough Road / Jubilee Avenue roundabout
FROM ARM C Jun-05 MCC 487720 287620 1039 1191 416 399 0.817 Yes Yes
319 Calibration 23 Gainsborough Road / Jubilee Avenue roundabout
TO ARM D Jun-05 MCC 487395 287964 1191 1037 195 149 3.468 Yes Yes
320 Calibration 23 Gainsborough Road / Jubilee Avenue roundabout
FROM ARM D Jun-05 MCC 488051 288138 1037 1191 241 201 2.688 Yes Yes
321 Calibration 24 A427 Westcott Way / Cottingham Road
TO ARM B Jun-05 MCC 487437 288631 1001 24926 221 206 1.016 Yes Yes
322 Calibration 24 A427 Westcott Way / Cottingham Road
FROM ARM B Jun-05 MCC 487617 288872 24926 1001 263 125 9.904 No No
323 Calibration 24 A427 Westcott Way / Cottingham Road
TO ARM C Jun-05 MCC 487437 288631 1001 1012 689 743 2.015 Yes Yes
324 Calibration 24 A427 Westcott Way / Cottingham Road
FROM ARM C Jun-05 MCC 486824 288932 1012 1001 432 429 0.131 Yes Yes
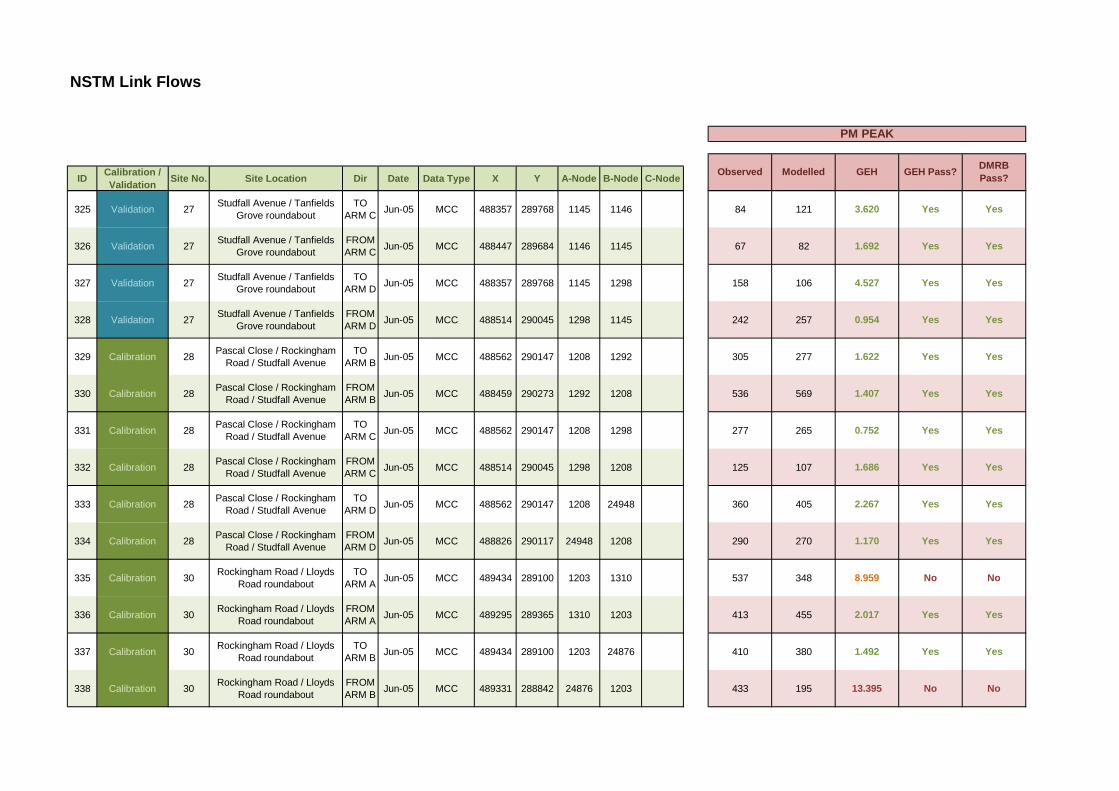
NSTM Link Flows
ID Calibration / Validation Site No. Site Location Dir Date Data Type X Y A-Node B-Node C-Node Modelled GEH GEH Pass? DMRB
Pass?
PM PEAK
Observed
325 Validation 27 Studfall Avenue / Tanfields Grove roundabout
TO ARM C Jun-05 MCC 488357 289768 1145 1146 84 121 3.620 Yes Yes
326 Validation 27 Studfall Avenue / Tanfields Grove roundabout
FROM ARM C Jun-05 MCC 488447 289684 1146 1145 67 82 1.692 Yes Yes
327 Validation 27 Studfall Avenue / Tanfields Grove roundabout
TO ARM D Jun-05 MCC 488357 289768 1145 1298 158 106 4.527 Yes Yes
328 Validation 27 Studfall Avenue / Tanfields Grove roundabout
FROM ARM D Jun-05 MCC 488514 290045 1298 1145 242 257 0.954 Yes Yes
329 Calibration 28 Pascal Close / Rockingham Road / Studfall Avenue
TO ARM B Jun-05 MCC 488562 290147 1208 1292 305 277 1.622 Yes Yes
330 Calibration 28 Pascal Close / Rockingham Road / Studfall Avenue
FROM ARM B Jun-05 MCC 488459 290273 1292 1208 536 569 1.407 Yes Yes
331 Calibration 28 Pascal Close / Rockingham Road / Studfall Avenue
TO ARM C Jun-05 MCC 488562 290147 1208 1298 277 265 0.752 Yes Yes
332 Calibration 28 Pascal Close / Rockingham Road / Studfall Avenue
FROM ARM C Jun-05 MCC 488514 290045 1298 1208 125 107 1.686 Yes Yes
333 Calibration 28 Pascal Close / Rockingham Road / Studfall Avenue
TO ARM D Jun-05 MCC 488562 290147 1208 24948 360 405 2.267 Yes Yes
334 Calibration 28 Pascal Close / Rockingham Road / Studfall Avenue
FROM ARM D Jun-05 MCC 488826 290117 24948 1208 290 270 1.170 Yes Yes
335 Calibration 30 Rockingham Road / Lloyds Road roundabout
TO ARM A Jun-05 MCC 489434 289100 1203 1310 537 348 8.959 No No
336 Calibration 30 Rockingham Road / Lloyds Road roundabout
FROM ARM A Jun-05 MCC 489295 289365 1310 1203 413 455 2.017 Yes Yes
337 Calibration 30 Rockingham Road / Lloyds Road roundabout
TO ARM B Jun-05 MCC 489434 289100 1203 24876 410 380 1.492 Yes Yes
338 Calibration 30 Rockingham Road / Lloyds Road roundabout
FROM ARM B Jun-05 MCC 489331 288842 24876 1203 433 195 13.395 No No
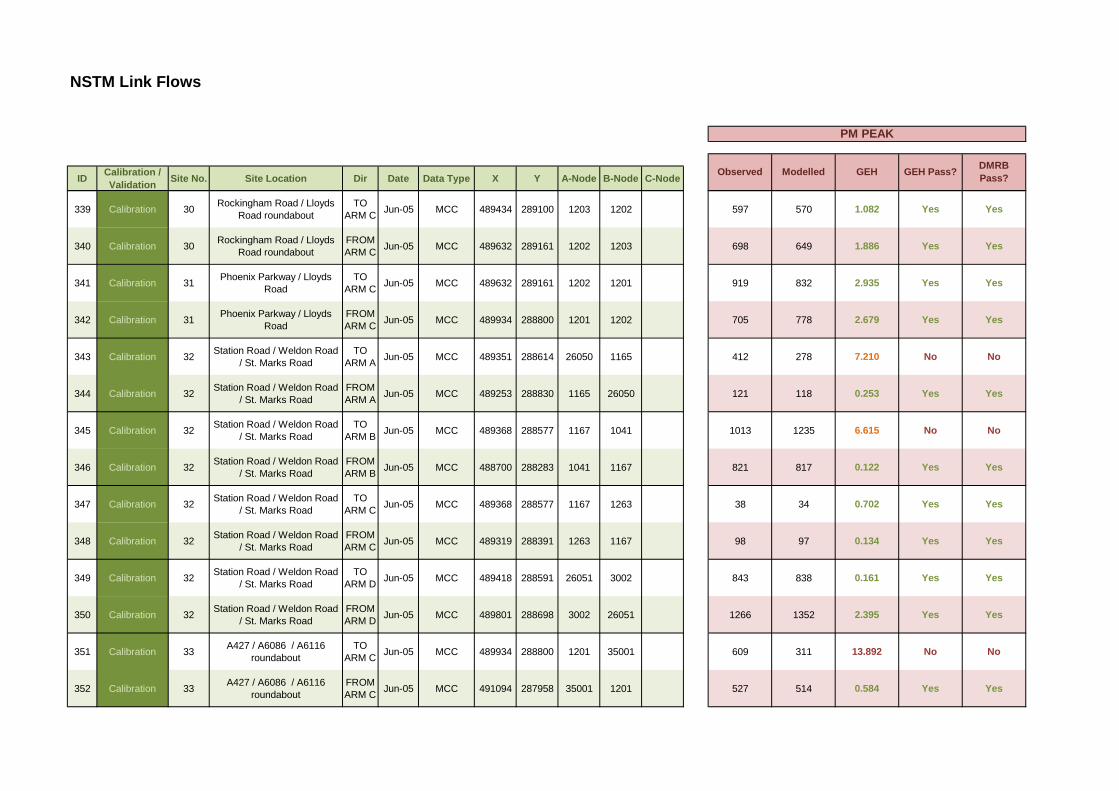
NSTM Link Flows
ID Calibration / Validation Site No. Site Location Dir Date Data Type X Y A-Node B-Node C-Node Modelled GEH GEH Pass? DMRB
Pass?
PM PEAK
Observed
339 Calibration 30 Rockingham Road / Lloyds Road roundabout
TO ARM C Jun-05 MCC 489434 289100 1203 1202 597 570 1.082 Yes Yes
340 Calibration 30 Rockingham Road / Lloyds Road roundabout
FROM ARM C Jun-05 MCC 489632 289161 1202 1203 698 649 1.886 Yes Yes
341 Calibration 31 Phoenix Parkway / Lloyds Road
TO ARM C Jun-05 MCC 489632 289161 1202 1201 919 832 2.935 Yes Yes
342 Calibration 31 Phoenix Parkway / Lloyds Road
FROM ARM C Jun-05 MCC 489934 288800 1201 1202 705 778 2.679 Yes Yes
343 Calibration 32 Station Road / Weldon Road / St. Marks Road
TO ARM A Jun-05 MCC 489351 288614 26050 1165 412 278 7.210 No No
344 Calibration 32 Station Road / Weldon Road / St. Marks Road
FROM ARM A Jun-05 MCC 489253 288830 1165 26050 121 118 0.253 Yes Yes
345 Calibration 32 Station Road / Weldon Road / St. Marks Road
TO ARM B Jun-05 MCC 489368 288577 1167 1041 1013 1235 6.615 No No
346 Calibration 32 Station Road / Weldon Road / St. Marks Road
FROM ARM B Jun-05 MCC 488700 288283 1041 1167 821 817 0.122 Yes Yes
347 Calibration 32 Station Road / Weldon Road / St. Marks Road
TO ARM C Jun-05 MCC 489368 288577 1167 1263 38 34 0.702 Yes Yes
348 Calibration 32 Station Road / Weldon Road / St. Marks Road
FROM ARM C Jun-05 MCC 489319 288391 1263 1167 98 97 0.134 Yes Yes
349 Calibration 32 Station Road / Weldon Road / St. Marks Road
TO ARM D Jun-05 MCC 489418 288591 26051 3002 843 838 0.161 Yes Yes
350 Calibration 32 Station Road / Weldon Road / St. Marks Road
FROM ARM D Jun-05 MCC 489801 288698 3002 26051 1266 1352 2.395 Yes Yes
351 Calibration 33 A427 / A6086 / A6116 roundabout
TO ARM C Jun-05 MCC 489934 288800 1201 35001 609 311 13.892 No No
352 Calibration 33 A427 / A6086 / A6116 roundabout
FROM ARM C Jun-05 MCC 491094 287958 35001 1201 527 514 0.584 Yes Yes
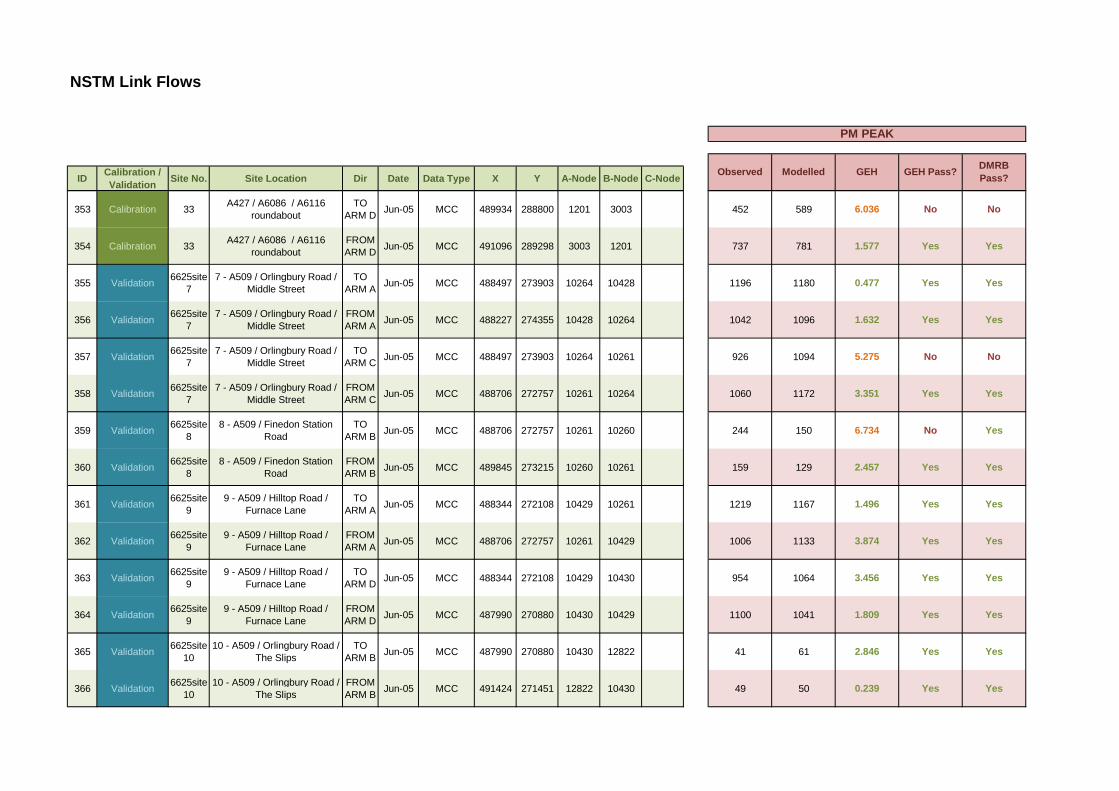
NSTM Link Flows
ID Calibration / Validation Site No. Site Location Dir Date Data Type X Y A-Node B-Node C-Node Modelled GEH GEH Pass? DMRB
Pass?
PM PEAK
Observed
353 Calibration 33 A427 / A6086 / A6116 roundabout
TO ARM D Jun-05 MCC 489934 288800 1201 3003 452 589 6.036 No No
354 Calibration 33 A427 / A6086 / A6116 roundabout
FROM ARM D Jun-05 MCC 491096 289298 3003 1201 737 781 1.577 Yes Yes
355 Validation 6625site7
7 - A509 / Orlingbury Road / Middle Street
TO ARM A Jun-05 MCC 488497 273903 10264 10428 1196 1180 0.477 Yes Yes
356 Validation 6625site7
7 - A509 / Orlingbury Road / Middle Street
FROM ARM A Jun-05 MCC 488227 274355 10428 10264 1042 1096 1.632 Yes Yes
357 Validation 6625site7
7 - A509 / Orlingbury Road / Middle Street
TO ARM C Jun-05 MCC 488497 273903 10264 10261 926 1094 5.275 No No
358 Validation 6625site7
7 - A509 / Orlingbury Road / Middle Street
FROM ARM C Jun-05 MCC 488706 272757 10261 10264 1060 1172 3.351 Yes Yes
359 Validation 6625site8
8 - A509 / Finedon Station Road
TO ARM B Jun-05 MCC 488706 272757 10261 10260 244 150 6.734 No Yes
360 Validation 6625site8
8 - A509 / Finedon Station Road
FROM ARM B Jun-05 MCC 489845 273215 10260 10261 159 129 2.457 Yes Yes
361 Validation 6625site9
9 - A509 / Hilltop Road / Furnace Lane
TO ARM A Jun-05 MCC 488344 272108 10429 10261 1219 1167 1.496 Yes Yes
362 Validation 6625site9
9 - A509 / Hilltop Road / Furnace Lane
FROM ARM A Jun-05 MCC 488706 272757 10261 10429 1006 1133 3.874 Yes Yes
363 Validation 6625site9
9 - A509 / Hilltop Road / Furnace Lane
TO ARM D Jun-05 MCC 488344 272108 10429 10430 954 1064 3.456 Yes Yes
364 Validation 6625site9
9 - A509 / Hilltop Road / Furnace Lane
FROM ARM D Jun-05 MCC 487990 270880 10430 10429 1100 1041 1.809 Yes Yes
365 Validation 6625site10
10 - A509 / Orlingbury Road / The Slips
TO ARM B Jun-05 MCC 487990 270880 10430 12822 41 61 2.846 Yes Yes
366 Validation 6625site10
10 - A509 / Orlingbury Road / The Slips
FROM ARM B Jun-05 MCC 491424 271451 12822 10430 49 50 0.239 Yes Yes

NSTM Link Flows
ID Calibration / Validation Site No. Site Location Dir Date Data Type X Y A-Node B-Node C-Node Modelled GEH GEH Pass? DMRB
Pass?
PM PEAK
Observed
367 Calibration 6625site11
11 - A509 / A510 Northen Way / Niort Way
TO ARM C Jun-05 MCC 488260 269710 10155 12805 550 526 1.024 Yes Yes
368 Calibration 6625site11
11 - A509 / A510 Northen Way / Niort Way
FROM ARM C Jun-05 MCC 488602 269773 12805 10155 902 789 3.884 Yes Yes
369 Calibration 6625site11
11 - A509 / A510 Northen Way / Niort Way
TO ARM D Jun-05 MCC 488260 269710 10155 11415 617 623 0.229 Yes Yes
370 Calibration 6625site11
11 - A509 / A510 Northen Way / Niort Way
FROM ARM D Jun-05 MCC 488483 269290 11415 10155 561 562 0.043 Yes Yes
371 Calibration 6625site11
11 - A509 / A510 Northen Way / Niort Way
TO ARM E Jun-05 MCC 488260 269710 10155 11256 910 861 1.655 Yes Yes
372 Calibration 6625site11
11 - A509 / A510 Northen Way / Niort Way
FROM ARM E Jun-05 MCC 487530 269580 11256 10155 905 694 7.470 No No
373 Calibration 6625site12
12 - A509 Wilby Way / Bourton Way / A45
TO ARM A Jun-05 MCC 488032 265867 10162 10161 913 877 1.217 Yes Yes
374 Calibration 6625site12
12 - A509 Wilby Way / Bourton Way / A45
FROM ARM A Jun-05 MCC 487700 266333 10161 10162 1085 1122 1.104 Yes Yes
375 Calibration 6625site12
12 - A509 Wilby Way / Bourton Way / A45
TO ARM B Jun-05 MCC 488032 265867 10162 12908 196 196 0.007 Yes Yes
376 Calibration 6625site12
12 - A509 Wilby Way / Bourton Way / A45
FROM ARM B Jun-05 MCC 488095 266139 12908 10162 199 200 0.079 Yes Yes
377 Calibration 6625site12
12 - A509 Wilby Way / Bourton Way / A45
TO ARM C Jun-05 MCC 488032 265867 10162 10288 1955 1892 1.436 Yes Yes
378 Calibration 6625site12
12 - A509 Wilby Way / Bourton Way / A45
FROM ARM C Jun-05 MCC 488770 265920 10288 10162 2148 2070 1.688 Yes Yes
379 Calibration 6625site13
13 - Main Street / Hardwick Road / Orlingbury Rd
TO ARM A Jun-05 MCC 486864 271331 10266 10429 135 132 0.252 Yes Yes
380 Calibration 6625site13
13 - Main Street / Hardwick Road / Orlingbury Rd
FROM ARM A Jun-05 MCC 488344 272108 10429 10266 73 78 0.524 Yes Yes

NSTM Link Flows
ID Calibration / Validation Site No. Site Location Dir Date Data Type X Y A-Node B-Node C-Node Modelled GEH GEH Pass? DMRB
Pass?
PM PEAK
Observed
381 Calibration 6625site13
13 - Main Street / Hardwick Road / Orlingbury Rd
TO ARM B Jun-05 MCC 486864 271331 10266 10430 48 73 3.253 Yes Yes
382 Calibration 6625site13
13 - Main Street / Hardwick Road / Orlingbury Rd
FROM ARM B Jun-05 MCC 487990 270880 10430 10266 142 120 1.903 Yes Yes
383 Calibration 6625site13
13 - Main Street / Hardwick Road / Orlingbury Rd
TO ARM C Jun-05 MCC 486864 271331 10266 10270 300 308 0.467 Yes Yes
384 Calibration 6625site13
13 - Main Street / Hardwick Road / Orlingbury Rd
FROM ARM C Jun-05 MCC 485670 269950 10270 10266 117 124 0.645 Yes Yes
385 Calibration 6625site13
13 - Main Street / Hardwick Road / Orlingbury Rd
TO ARM D Jun-05 MCC 486864 271331 10266 10263 89 73 1.851 Yes Yes
386 Calibration 6625site13
13 - Main Street / Hardwick Road / Orlingbury Rd
FROM ARM D Jun-05 MCC 486705 271437 10263 10266 277 267 0.587 Yes Yes
387 Calibration 6625site14
14 - Orlingbury Village Crossroads
TO ARM A Jun-05 MCC 486023 272395 12083 10259 66 86 2.331 Yes Yes
388 Calibration 6625site14
14 - Orlingbury Village Crossroads
FROM ARM A Jun-05 MCC 485355 272988 10259 12083 8 268 22.131 No No
389 Calibration 6625site14
14 - Orlingbury Village Crossroads
TO ARM B Jun-05 MCC 486023 272395 12083 10265 22 8 3.721 Yes Yes
390 Calibration 6625site14
14 - Orlingbury Village Crossroads
FROM ARM B Jun-05 MCC 488121 273737 10265 12083 13 2 4.062 Yes Yes
391 Calibration 6625site14
14 - Orlingbury Village Crossroads
TO ARM D Jun-05 MCC 486013 272278 10262 10123 13 14 0.244 Yes Yes
392 Calibration 6625site14
14 - Orlingbury Village Crossroads
FROM ARM D Jun-05 MCC 482851 271830 10123 10262 19 23 0.810 Yes Yes
393 Calibration 6625site15 15 - A6 / Higham Road TO
ARM A Jun-05 MCC 490780 274020 10412 12079 816 781 1.233 Yes Yes
394 Calibration 6625site15 15 - A6 / Higham Road FROM
ARM A Jun-05 MCC 490816 274873 12079 10412 728 722 0.191 Yes Yes
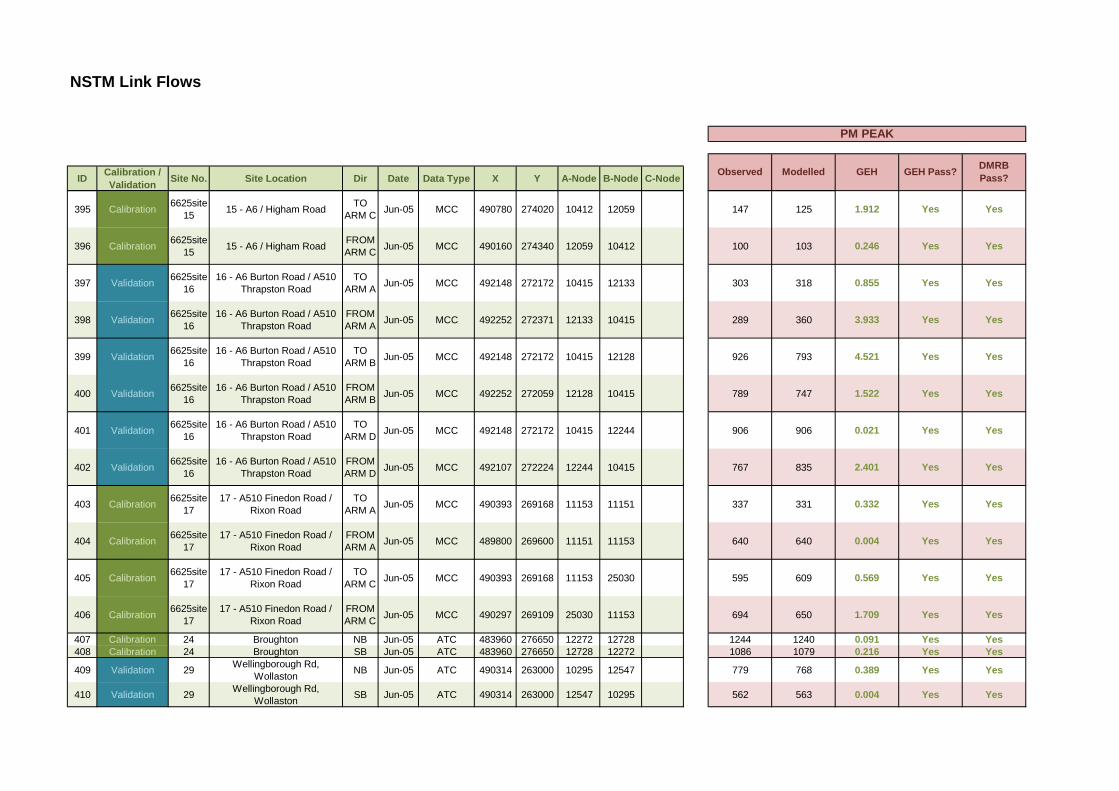
NSTM Link Flows
ID Calibration / Validation Site No. Site Location Dir Date Data Type X Y A-Node B-Node C-Node Modelled GEH GEH Pass? DMRB
Pass?
PM PEAK
Observed
395 Calibration 6625site15 15 - A6 / Higham Road TO
ARM C Jun-05 MCC 490780 274020 10412 12059 147 125 1.912 Yes Yes
396 Calibration 6625site15 15 - A6 / Higham Road FROM
ARM C Jun-05 MCC 490160 274340 12059 10412 100 103 0.246 Yes Yes
397 Validation 6625site16
16 - A6 Burton Road / A510 Thrapston Road
TO ARM A Jun-05 MCC 492148 272172 10415 12133 303 318 0.855 Yes Yes
398 Validation 6625site16
16 - A6 Burton Road / A510 Thrapston Road
FROM ARM A Jun-05 MCC 492252 272371 12133 10415 289 360 3.933 Yes Yes
399 Validation 6625site16
16 - A6 Burton Road / A510 Thrapston Road
TO ARM B Jun-05 MCC 492148 272172 10415 12128 926 793 4.521 Yes Yes
400 Validation 6625site16
16 - A6 Burton Road / A510 Thrapston Road
FROM ARM B Jun-05 MCC 492252 272059 12128 10415 789 747 1.522 Yes Yes
401 Validation 6625site16
16 - A6 Burton Road / A510 Thrapston Road
TO ARM D Jun-05 MCC 492148 272172 10415 12244 906 906 0.021 Yes Yes
402 Validation 6625site16
16 - A6 Burton Road / A510 Thrapston Road
FROM ARM D Jun-05 MCC 492107 272224 12244 10415 767 835 2.401 Yes Yes
403 Calibration 6625site17
17 - A510 Finedon Road / Rixon Road
TO ARM A Jun-05 MCC 490393 269168 11153 11151 337 331 0.332 Yes Yes
404 Calibration 6625site17
17 - A510 Finedon Road / Rixon Road
FROM ARM A Jun-05 MCC 489800 269600 11151 11153 640 640 0.004 Yes Yes
405 Calibration 6625site17
17 - A510 Finedon Road / Rixon Road
TO ARM C Jun-05 MCC 490393 269168 11153 25030 595 609 0.569 Yes Yes
406 Calibration 6625site17
17 - A510 Finedon Road / Rixon Road
FROM ARM C Jun-05 MCC 490297 269109 25030 11153 694 650 1.709 Yes Yes
407 Calibration 24 Broughton NB Jun-05 ATC 483960 276650 12272 12728 1244 1240 0.091 Yes Yes408 Calibration 24 Broughton SB Jun-05 ATC 483960 276650 12728 12272 1086 1079 0.216 Yes Yes
409 Validation 29 Wellingborough Rd, Wollaston NB Jun-05 ATC 490314 263000 10295 12547 779 768 0.389 Yes Yes
410 Validation 29 Wellingborough Rd, Wollaston SB Jun-05 ATC 490314 263000 12547 10295 562 563 0.004 Yes Yes
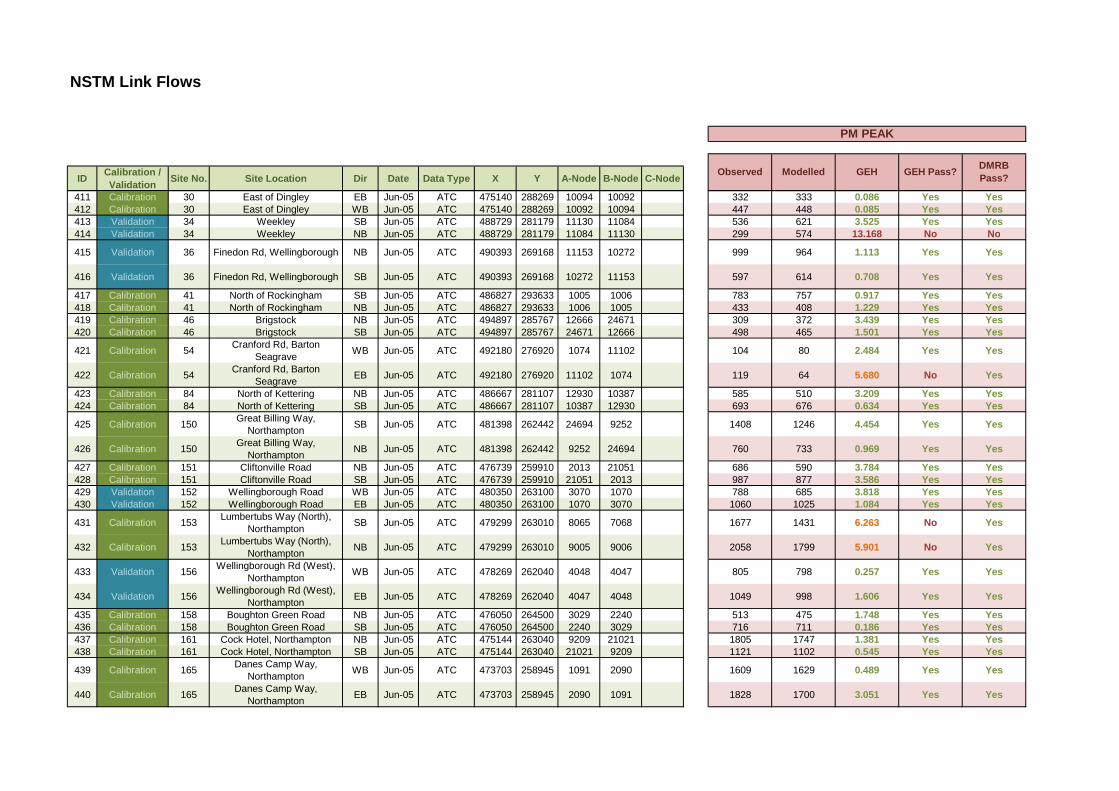
NSTM Link Flows
ID Calibration / Validation Site No. Site Location Dir Date Data Type X Y A-Node B-Node C-Node Modelled GEH GEH Pass? DMRB
Pass?
PM PEAK
Observed
411 Calibration 30 East of Dingley EB Jun-05 ATC 475140 288269 10094 10092 332 333 0.086 Yes Yes412 Calibration 30 East of Dingley WB Jun-05 ATC 475140 288269 10092 10094 447 448 0.085 Yes Yes413 Validation 34 Weekley SB Jun-05 ATC 488729 281179 11130 11084 536 621 3.525 Yes Yes414 Validation 34 Weekley NB Jun-05 ATC 488729 281179 11084 11130 299 574 13.168 No No
415 Validation 36 Finedon Rd, Wellingborough NB Jun-05 ATC 490393 269168 11153 10272 999 964 1.113 Yes Yes
416 Validation 36 Finedon Rd, Wellingborough SB Jun-05 ATC 490393 269168 10272 11153 597 614 0.708 Yes Yes
417 Calibration 41 North of Rockingham SB Jun-05 ATC 486827 293633 1005 1006 783 757 0.917 Yes Yes418 Calibration 41 North of Rockingham NB Jun-05 ATC 486827 293633 1006 1005 433 408 1.229 Yes Yes419 Calibration 46 Brigstock NB Jun-05 ATC 494897 285767 12666 24671 309 372 3.439 Yes Yes420 Calibration 46 Brigstock SB Jun-05 ATC 494897 285767 24671 12666 498 465 1.501 Yes Yes
421 Calibration 54 Cranford Rd, Barton Seagrave WB Jun-05 ATC 492180 276920 1074 11102 104 80 2.484 Yes Yes
422 Calibration 54 Cranford Rd, Barton Seagrave EB Jun-05 ATC 492180 276920 11102 1074 119 64 5.680 No Yes
423 Calibration 84 North of Kettering NB Jun-05 ATC 486667 281107 12930 10387 585 510 3.209 Yes Yes424 Calibration 84 North of Kettering SB Jun-05 ATC 486667 281107 10387 12930 693 676 0.634 Yes Yes
425 Calibration 150 Great Billing Way, Northampton SB Jun-05 ATC 481398 262442 24694 9252 1408 1246 4.454 Yes Yes
426 Calibration 150 Great Billing Way, Northampton NB Jun-05 ATC 481398 262442 9252 24694 760 733 0.969 Yes Yes
427 Calibration 151 Cliftonville Road NB Jun-05 ATC 476739 259910 2013 21051 686 590 3.784 Yes Yes428 Calibration 151 Cliftonville Road SB Jun-05 ATC 476739 259910 21051 2013 987 877 3.586 Yes Yes429 Validation 152 Wellingborough Road WB Jun-05 ATC 480350 263100 3070 1070 788 685 3.818 Yes Yes430 Validation 152 Wellingborough Road EB Jun-05 ATC 480350 263100 1070 3070 1060 1025 1.084 Yes Yes
431 Calibration 153 Lumbertubs Way (North), Northampton SB Jun-05 ATC 479299 263010 8065 7068 1677 1431 6.263 No Yes
432 Calibration 153 Lumbertubs Way (North), Northampton NB Jun-05 ATC 479299 263010 9005 9006 2058 1799 5.901 No Yes
433 Validation 156 Wellingborough Rd (West), Northampton WB Jun-05 ATC 478269 262040 4048 4047 805 798 0.257 Yes Yes
434 Validation 156 Wellingborough Rd (West), Northampton EB Jun-05 ATC 478269 262040 4047 4048 1049 998 1.606 Yes Yes
435 Calibration 158 Boughton Green Road NB Jun-05 ATC 476050 264500 3029 2240 513 475 1.748 Yes Yes436 Calibration 158 Boughton Green Road SB Jun-05 ATC 476050 264500 2240 3029 716 711 0.186 Yes Yes437 Calibration 161 Cock Hotel, Northampton NB Jun-05 ATC 475144 263040 9209 21021 1805 1747 1.381 Yes Yes438 Calibration 161 Cock Hotel, Northampton SB Jun-05 ATC 475144 263040 21021 9209 1121 1102 0.545 Yes Yes
439 Calibration 165 Danes Camp Way, Northampton WB Jun-05 ATC 473703 258945 1091 2090 1609 1629 0.489 Yes Yes
440 Calibration 165 Danes Camp Way, Northampton EB Jun-05 ATC 473703 258945 2090 1091 1828 1700 3.051 Yes Yes
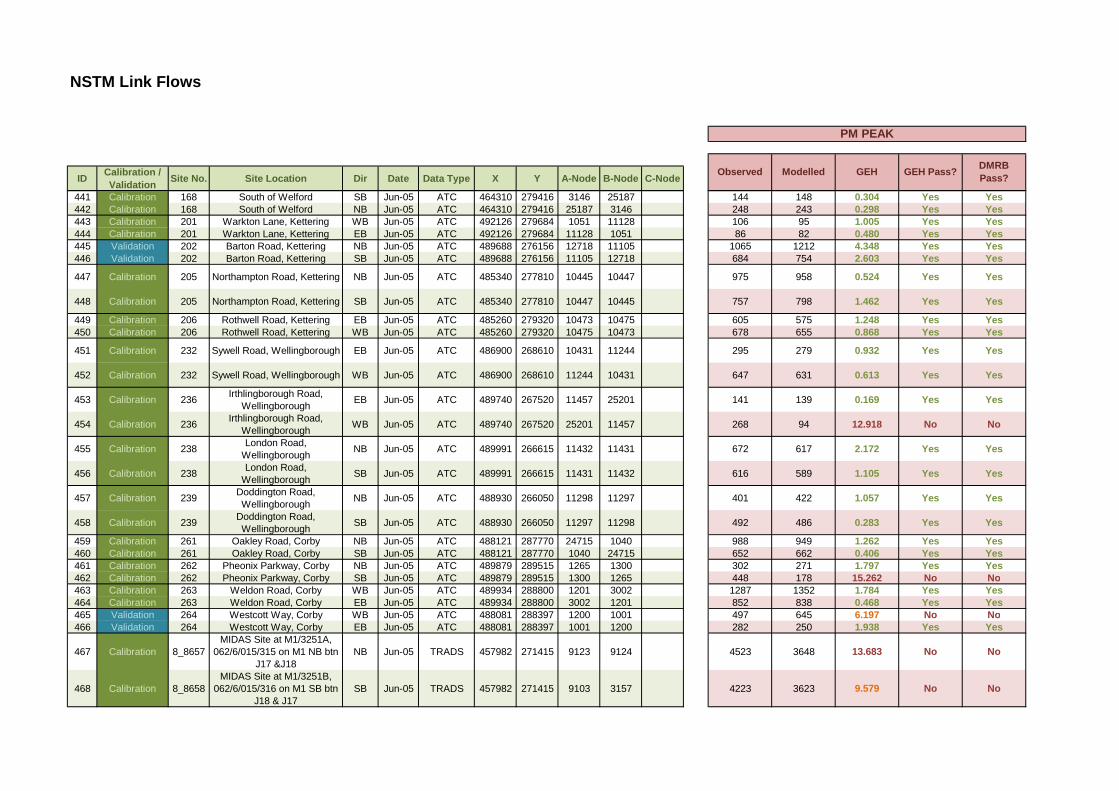
NSTM Link Flows
ID Calibration / Validation Site No. Site Location Dir Date Data Type X Y A-Node B-Node C-Node Modelled GEH GEH Pass? DMRB
Pass?
PM PEAK
Observed
441 Calibration 168 South of Welford SB Jun-05 ATC 464310 279416 3146 25187 144 148 0.304 Yes Yes442 Calibration 168 South of Welford NB Jun-05 ATC 464310 279416 25187 3146 248 243 0.298 Yes Yes443 Calibration 201 Warkton Lane, Kettering WB Jun-05 ATC 492126 279684 1051 11128 106 95 1.005 Yes Yes444 Calibration 201 Warkton Lane, Kettering EB Jun-05 ATC 492126 279684 11128 1051 86 82 0.480 Yes Yes445 Validation 202 Barton Road, Kettering NB Jun-05 ATC 489688 276156 12718 11105 1065 1212 4.348 Yes Yes446 Validation 202 Barton Road, Kettering SB Jun-05 ATC 489688 276156 11105 12718 684 754 2.603 Yes Yes
447 Calibration 205 Northampton Road, Kettering NB Jun-05 ATC 485340 277810 10445 10447 975 958 0.524 Yes Yes
448 Calibration 205 Northampton Road, Kettering SB Jun-05 ATC 485340 277810 10447 10445 757 798 1.462 Yes Yes
449 Calibration 206 Rothwell Road, Kettering EB Jun-05 ATC 485260 279320 10473 10475 605 575 1.248 Yes Yes450 Calibration 206 Rothwell Road, Kettering WB Jun-05 ATC 485260 279320 10475 10473 678 655 0.868 Yes Yes
451 Calibration 232 Sywell Road, Wellingborough EB Jun-05 ATC 486900 268610 10431 11244 295 279 0.932 Yes Yes
452 Calibration 232 Sywell Road, Wellingborough WB Jun-05 ATC 486900 268610 11244 10431 647 631 0.613 Yes Yes
453 Calibration 236 Irthlingborough Road, Wellingborough EB Jun-05 ATC 489740 267520 11457 25201 141 139 0.169 Yes Yes
454 Calibration 236 Irthlingborough Road, Wellingborough WB Jun-05 ATC 489740 267520 25201 11457 268 94 12.918 No No
455 Calibration 238 London Road, Wellingborough NB Jun-05 ATC 489991 266615 11432 11431 672 617 2.172 Yes Yes
456 Calibration 238 London Road, Wellingborough SB Jun-05 ATC 489991 266615 11431 11432 616 589 1.105 Yes Yes
457 Calibration 239 Doddington Road, Wellingborough NB Jun-05 ATC 488930 266050 11298 11297 401 422 1.057 Yes Yes
458 Calibration 239 Doddington Road, Wellingborough SB Jun-05 ATC 488930 266050 11297 11298 492 486 0.283 Yes Yes
459 Calibration 261 Oakley Road, Corby NB Jun-05 ATC 488121 287770 24715 1040 988 949 1.262 Yes Yes460 Calibration 261 Oakley Road, Corby SB Jun-05 ATC 488121 287770 1040 24715 652 662 0.406 Yes Yes461 Calibration 262 Pheonix Parkway, Corby NB Jun-05 ATC 489879 289515 1265 1300 302 271 1.797 Yes Yes462 Calibration 262 Pheonix Parkway, Corby SB Jun-05 ATC 489879 289515 1300 1265 448 178 15.262 No No463 Calibration 263 Weldon Road, Corby WB Jun-05 ATC 489934 288800 1201 3002 1287 1352 1.784 Yes Yes464 Calibration 263 Weldon Road, Corby EB Jun-05 ATC 489934 288800 3002 1201 852 838 0.468 Yes Yes465 Validation 264 Westcott Way, Corby WB Jun-05 ATC 488081 288397 1200 1001 497 645 6.197 No No466 Validation 264 Westcott Way, Corby EB Jun-05 ATC 488081 288397 1001 1200 282 250 1.938 Yes Yes
467 Calibration 8_8657MIDAS Site at M1/3251A,
062/6/015/315 on M1 NB btn J17 &J18
NB Jun-05 TRADS 457982 271415 9123 9124 4523 3648 13.683 No No
468 Calibration 8_8658MIDAS Site at M1/3251B,
062/6/015/316 on M1 SB btn J18 & J17
SB Jun-05 TRADS 457982 271415 9103 3157 4223 3623 9.579 No No
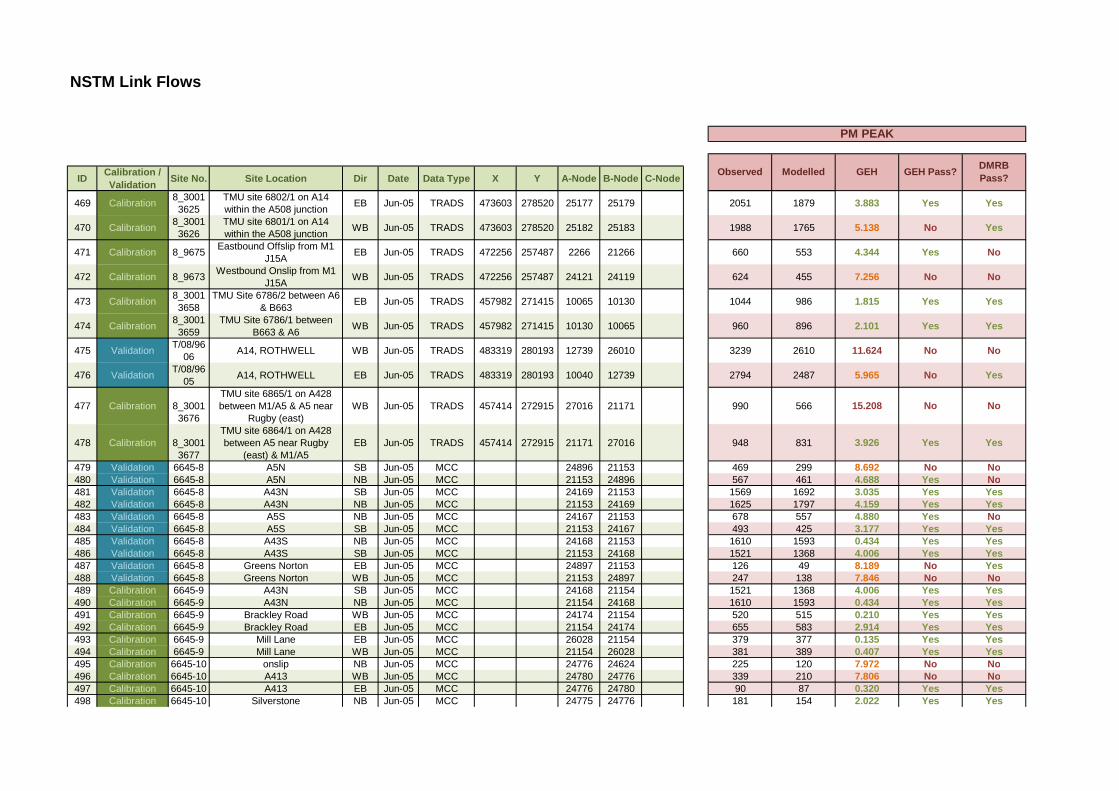
NSTM Link Flows
ID Calibration / Validation Site No. Site Location Dir Date Data Type X Y A-Node B-Node C-Node Modelled GEH GEH Pass? DMRB
Pass?
PM PEAK
Observed
469 Calibration 8_30013625
TMU site 6802/1 on A14 within the A508 junction EB Jun-05 TRADS 473603 278520 25177 25179 2051 1879 3.883 Yes Yes
470 Calibration 8_30013626
TMU site 6801/1 on A14 within the A508 junction WB Jun-05 TRADS 473603 278520 25182 25183 1988 1765 5.138 No Yes
471 Calibration 8_9675 Eastbound Offslip from M1 J15A EB Jun-05 TRADS 472256 257487 2266 21266 660 553 4.344 Yes No
472 Calibration 8_9673 Westbound Onslip from M1 J15A WB Jun-05 TRADS 472256 257487 24121 24119 624 455 7.256 No No
473 Calibration 8_30013658
TMU Site 6786/2 between A6 & B663 EB Jun-05 TRADS 457982 271415 10065 10130 1044 986 1.815 Yes Yes
474 Calibration 8_30013659
TMU Site 6786/1 between B663 & A6 WB Jun-05 TRADS 457982 271415 10130 10065 960 896 2.101 Yes Yes
475 Validation T/08/9606 A14, ROTHWELL WB Jun-05 TRADS 483319 280193 12739 26010 3239 2610 11.624 No No
476 Validation T/08/9605 A14, ROTHWELL EB Jun-05 TRADS 483319 280193 10040 12739 2794 2487 5.965 No Yes
477 Calibration
8_30013676
TMU site 6865/1 on A428 between M1/A5 & A5 near
Rugby (east)WB Jun-05 TRADS 457414 272915 27016 21171 990 566 15.208 No No
478 Calibration
8_30013677
TMU site 6864/1 on A428 between A5 near Rugby
(east) & M1/A5EB Jun-05 TRADS 457414 272915 21171 27016 948 831 3.926 Yes Yes
479 Validation 6645-8 A5N SB Jun-05 MCC 24896 21153 469 299 8.692 No No480 Validation 6645-8 A5N NB Jun-05 MCC 21153 24896 567 461 4.688 Yes No481 Validation 6645-8 A43N SB Jun-05 MCC 24169 21153 1569 1692 3.035 Yes Yes482 Validation 6645-8 A43N NB Jun-05 MCC 21153 24169 1625 1797 4.159 Yes Yes483 Validation 6645-8 A5S NB Jun-05 MCC 24167 21153 678 557 4.880 Yes No484 Validation 6645-8 A5S SB Jun-05 MCC 21153 24167 493 425 3.177 Yes Yes485 Validation 6645-8 A43S NB Jun-05 MCC 24168 21153 1610 1593 0.434 Yes Yes486 Validation 6645-8 A43S SB Jun-05 MCC 21153 24168 1521 1368 4.006 Yes Yes487 Validation 6645-8 Greens Norton EB Jun-05 MCC 24897 21153 126 49 8.189 No Yes488 Validation 6645-8 Greens Norton WB Jun-05 MCC 21153 24897 247 138 7.846 No No489 Calibration 6645-9 A43N SB Jun-05 MCC 24168 21154 1521 1368 4.006 Yes Yes490 Calibration 6645-9 A43N NB Jun-05 MCC 21154 24168 1610 1593 0.434 Yes Yes491 Calibration 6645-9 Brackley Road WB Jun-05 MCC 24174 21154 520 515 0.210 Yes Yes492 Calibration 6645-9 Brackley Road EB Jun-05 MCC 21154 24174 655 583 2.914 Yes Yes493 Calibration 6645-9 Mill Lane EB Jun-05 MCC 26028 21154 379 377 0.135 Yes Yes494 Calibration 6645-9 Mill Lane WB Jun-05 MCC 21154 26028 381 389 0.407 Yes Yes495 Calibration 6645-10 onslip NB Jun-05 MCC 24776 24624 225 120 7.972 No No496 Calibration 6645-10 A413 WB Jun-05 MCC 24780 24776 339 210 7.806 No No497 Calibration 6645-10 A413 EB Jun-05 MCC 24776 24780 90 87 0.320 Yes Yes498 Calibration 6645-10 Silverstone NB Jun-05 MCC 24775 24776 181 154 2.022 Yes Yes

NSTM Link Flows
ID Calibration / Validation Site No. Site Location Dir Date Data Type X Y A-Node B-Node C-Node Modelled GEH GEH Pass? DMRB
Pass?
PM PEAK
Observed
499 Calibration 6645-10 Silverstone SB Jun-05 MCC 24776 24775 205 157 3.609 Yes Yes500 Calibration 6645-11 A43 off SB Jun-05 MCC 26026 24780 321 285 2.039 Yes Yes501 Calibration 6645-11 A43 off NB Jun-05 MCC 24780 26026 69 82 1.485 Yes Yes502 Calibration 6645-11 A413E NB Jun-05 MCC 24625 24780 214 109 8.297 No No503 Calibration 6645-11 A413E SB Jun-05 MCC 24780 24625 224 189 2.471 Yes Yes
NSTM - LMVR Highway Model Version 1.0 57
APPENDIX NO 7: AM Peak – Combined Dataset Calibration Results

NSTM Link Summary
Acceptability Guideline
Observed Modelled< 700 vph ±100 vph > 85 % of links 302 273 90% 0 0 100%
700 - 2,700 vph ±15% > 85 % of links 183 163 89% 0 0 100%
> 2,700 vph ±400 vph > 85 % of links 18 16 89% 0 0 100%All (or nearly all)
screenlines 14 9 64%
> 85 % of links 503 439 87% 0 0 100%
All (or nearly all) screenlines 14 8 57%
Observed Modelled GEH GEH Pass?
DMRB Pass?
9979 8938 10.707 No No6890 6298 7.284 No No9671 9327 3.531 Yes Yes8319 7423 10.108 No No6837 6599 2.91 Yes Yes7815 7304 5.872 No No7234 6827 4.845 No No7853 7925 0.815 Yes Yes3982 3755 3.658 Yes Yes4134 3841 4.64 No Yes5788 5684 1.375 Yes Yes5037 4822 3.064 Yes Yes4966 4809 2.246 Yes Yes3704 3484 3.662 Yes Yes
7 -Wellingborough (Inbound)7 -Wellingborough (Outbound)
4 - E-S Screenline (Southound)5 -Corby (Inbound)
5 -Corby (Outbound)6- Kettering (Inbound)
6- Kettering (Outbound)
2 - Outer Northants Cordon (Inbound)2 - Outer Northants Cordon (Outbound)
3 - N-S Screenline (Eastbound)3 - N-S Screenline (Westbound)4 - E-S Screenline (Northound)
90%95%97%
#DIV/0!#DIV/0!#DIV/0!#DIV/0!#DIV/0!
GEH Range CALIBRATION VALIDATION
Total Model %
VALIDATION
AM PEAK
Criteria and Measure
Flow Criteria Total Model %
CALIBRATION
Total screenline flows within ±5%
1 - City Centre (Outbound)
Screenline
1 - City Centre (Inbound)
GEH CriteriaGEH Statistic for individual links
< 5GEH Statistic for screenline
totals < 4
GEH < 2GEH < 4GEH < 6GEH < 8GEH < 10
60%82%

NSTM Link Flows
ID Calibration / Validation Site No. Site Location Dir Date Data Type X Y A-Node B-Node C-Node
1 Calibration R2 A43 South of Broughton NB Jun-05 RSI/ATC 483491 276404 12273 10121 1202 1121 2.381 Yes Yes2 Calibration R2 A43 South of Broughton SB Jun-05 RSI/ATC 483491 276404 10121 12273 1205 1159 1.349 Yes Yes3 Calibration R3 A509 North of Isham NB Jun-05 RSI/ATC 488204 274399 10428 12706 1204 928 8.481 No No4 Calibration R3 A509 North of Isham SB Jun-05 RSI/ATC 488204 274399 12706 10428 1131 982 4.594 Yes Yes5 Calibration R4 A6 North of Burton Latimer EB Jun-05 RSI/ATC 490137 275972 12714 10411 814 804 0.318 Yes Yes6 Calibration R4 A6 North of Burton Latimer WB Jun-05 RSI/ATC 490137 275972 10411 12714 852 821 1.084 Yes Yes7 Calibration R6 A43 Geddington NB Jun-05 RSI/ATC 489390 283570 11130 26024 929 851 2.586 Yes Yes8 Calibration R6 A43 Geddington SB Jun-05 RSI/ATC 489390 283570 26024 11130 649 618 1.238 Yes Yes9 Calibration R7 A6003 South of Corby NB Jun-05 RSI/ATC 485865 285531 10085 26041 1413 1306 2.889 Yes Yes10 Calibration R7 A6003 South of Corby SB Jun-05 RSI/ATC 485865 285531 26041 10085 1468 1438 0.783 Yes Yes11 Calibration R8 A6 North of Desborough SB Jun-05 RSI/ATC 475625 286588 10167 10168 638 649 0.466 Yes Yes12 Calibration R8 A6 North of Desborough NB Jun-05 RSI/ATC 475625 286588 10168 10167 649 655 0.239 Yes Yes13 Calibration R9 A510 Thrapston Rd NB Jun-05 RSI/ATC 493470 274993 12074 10250 176 171 0.402 Yes Yes14 Calibration R9 A510 Thrapston Rd SB Jun-05 RSI/ATC 493470 274993 10250 12074 256 236 1.252 Yes Yes15 Calibration R10 A6116 Near Lowick NB Jun-05 RSI/ATC 498174 280858 10177 24674 603 487 4.958 Yes No16 Calibration R10 A6116 Near Lowick SB Jun-05 RSI/ATC 498174 280858 24674 10177 303 271 1.876 Yes Yes17 Calibration R11 A6013 Near Gypsy Lane NB Jun-05 RSI/ATC 485344 277832 10447 10457 812 641 6.350 No No18 Calibration R11 A6013 Near Gypsy Lane SB Jun-05 RSI/ATC 485344 277832 10457 10447 865 746 4.192 Yes Yes19 Calibration R12 A4005 Wilby WB Jun-05 RSI/ATC 486787 266153 10160 10289 586 593 0.279 Yes Yes20 Calibration R12 A4005 Wilby EB Jun-05 RSI/ATC 486787 266153 10289 10160 561 600 1.623 Yes Yes
21 Calibration R13 A509 London Rd, Little Irchester NB Jun-05 RSI/ATC 490370 263987 12547 11158 645 629 0.616 Yes Yes
22 Calibration R13 A509 London Rd, Little Irchester SB Jun-05 RSI/ATC 490370 263987 11158 12547 678 635 1.659 Yes Yes
23 Calibration R14 Powel Lane, Burton Latimer NB Jun-05 RSI/ATC 489022 275833 12055 11010 371 356 0.774 Yes Yes24 Calibration R14 Powel Lane, Burton Latimer SB Jun-05 RSI/ATC 489022 275833 11010 12055 234 213 1.405 Yes Yes25 Calibration R15 A6 Bedford Rd, Rushden NB Jun-05 RSI/ATC 497190 264067 11889 11899 412 389 1.130 Yes Yes26 Calibration R15 A6 Bedford Rd, Rushden SB Jun-05 RSI/ATC 497190 264067 11899 11889 1243 1169 2.127 Yes Yes27 Calibration R16 A6 Irthlingborough NB Jun-05 RSI/ATC 495080 271090 12185 10417 799 760 1.379 Yes Yes28 Calibration R16 A6 Irthlingborough SB Jun-05 RSI/ATC 495080 271090 10417 12185 970 913 1.831 Yes Yes29 Calibration R17 B663 Raunds NB Jun-05 RSI/ATC 499010 273828 12264 10130 643 597 1.835 Yes Yes30 Calibration R17 B663 Raunds SB Jun-05 RSI/ATC 499010 273828 10130 12264 395 365 1.535 Yes Yes31 Calibration R18 A45 North of Raunds NB Jun-05 RSI/ATC 500030 274643 10130 10421 1022 955 2.118 Yes Yes32 Calibration R18 A45 North of Raunds SB Jun-05 RSI/ATC 500030 274643 10421 10130 893 830 2.127 Yes Yes33 Calibration R19 A605 Thrapston NB Jun-05 RSI/ATC 501667 280523 10427 12352 968 901 2.181 Yes Yes34 Calibration R19 A605 Thrapston SB Jun-05 RSI/ATC 501667 280523 12352 10427 678 611 2.629 Yes Yes35 Calibration R20 A427 Oundle WB Jun-05 RSI/ATC 502722 288273 12685 12680 378 334 2.298 Yes Yes36 Calibration R20 A427 Oundle EB Jun-05 RSI/ATC 502722 288273 12680 12685 502 471 1.398 Yes Yes
37 Calibration R21 B571 Mill Rd, Irthlingborough SB Jun-05 RSI/ATC 492555 269206 10271 10361 556 444 4.969 Yes No
AM PEAK
GEH GEH Pass? DMRB Pass?ModelledObserved
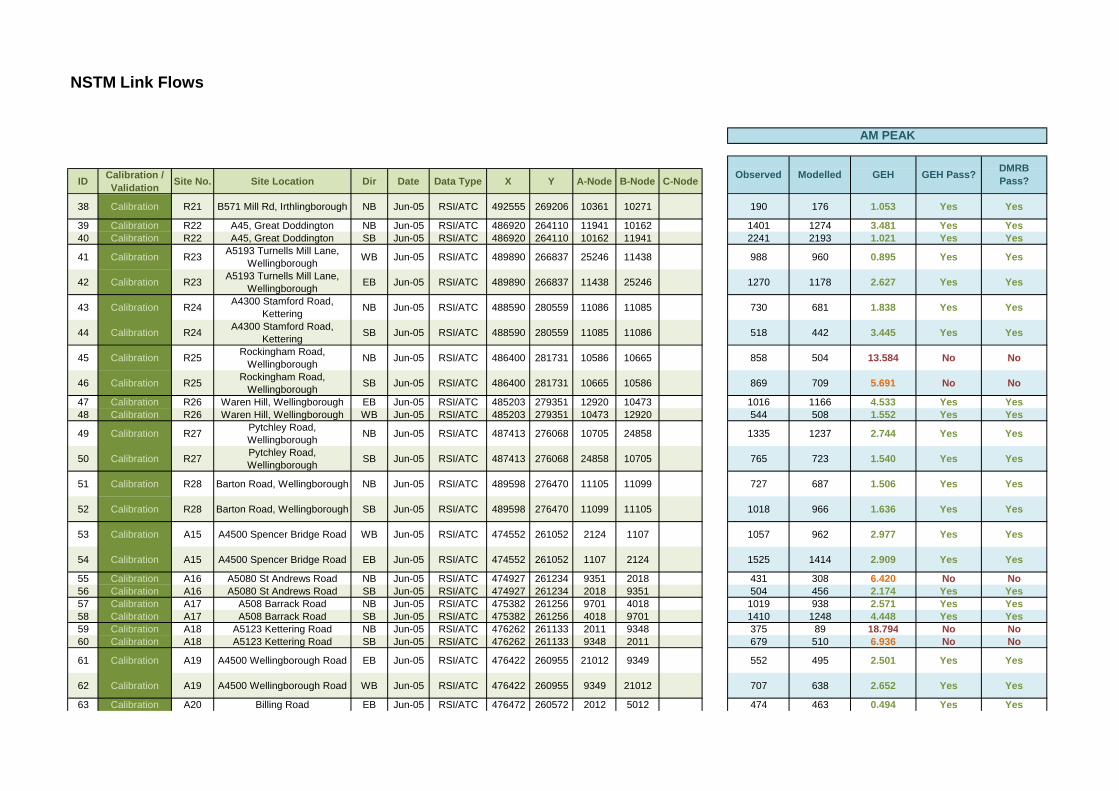
NSTM Link Flows
ID Calibration / Validation Site No. Site Location Dir Date Data Type X Y A-Node B-Node C-Node
AM PEAK
GEH GEH Pass? DMRB Pass?ModelledObserved
38 Calibration R21 B571 Mill Rd, Irthlingborough NB Jun-05 RSI/ATC 492555 269206 10361 10271 190 176 1.053 Yes Yes
39 Calibration R22 A45, Great Doddington NB Jun-05 RSI/ATC 486920 264110 11941 10162 1401 1274 3.481 Yes Yes40 Calibration R22 A45, Great Doddington SB Jun-05 RSI/ATC 486920 264110 10162 11941 2241 2193 1.021 Yes Yes
41 Calibration R23 A5193 Turnells Mill Lane, Wellingborough WB Jun-05 RSI/ATC 489890 266837 25246 11438 988 960 0.895 Yes Yes
42 Calibration R23 A5193 Turnells Mill Lane, Wellingborough EB Jun-05 RSI/ATC 489890 266837 11438 25246 1270 1178 2.627 Yes Yes
43 Calibration R24 A4300 Stamford Road, Kettering NB Jun-05 RSI/ATC 488590 280559 11086 11085 730 681 1.838 Yes Yes
44 Calibration R24 A4300 Stamford Road, Kettering SB Jun-05 RSI/ATC 488590 280559 11085 11086 518 442 3.445 Yes Yes
45 Calibration R25 Rockingham Road, Wellingborough NB Jun-05 RSI/ATC 486400 281731 10586 10665 858 504 13.584 No No
46 Calibration R25 Rockingham Road, Wellingborough SB Jun-05 RSI/ATC 486400 281731 10665 10586 869 709 5.691 No No
47 Calibration R26 Waren Hill, Wellingborough EB Jun-05 RSI/ATC 485203 279351 12920 10473 1016 1166 4.533 Yes Yes48 Calibration R26 Waren Hill, Wellingborough WB Jun-05 RSI/ATC 485203 279351 10473 12920 544 508 1.552 Yes Yes
49 Calibration R27 Pytchley Road, Wellingborough NB Jun-05 RSI/ATC 487413 276068 10705 24858 1335 1237 2.744 Yes Yes
50 Calibration R27 Pytchley Road, Wellingborough SB Jun-05 RSI/ATC 487413 276068 24858 10705 765 723 1.540 Yes Yes
51 Calibration R28 Barton Road, Wellingborough NB Jun-05 RSI/ATC 489598 276470 11105 11099 727 687 1.506 Yes Yes
52 Calibration R28 Barton Road, Wellingborough SB Jun-05 RSI/ATC 489598 276470 11099 11105 1018 966 1.636 Yes Yes
53 Calibration A15 A4500 Spencer Bridge Road WB Jun-05 RSI/ATC 474552 261052 2124 1107 1057 962 2.977 Yes Yes
54 Calibration A15 A4500 Spencer Bridge Road EB Jun-05 RSI/ATC 474552 261052 1107 2124 1525 1414 2.909 Yes Yes
55 Calibration A16 A5080 St Andrews Road NB Jun-05 RSI/ATC 474927 261234 9351 2018 431 308 6.420 No No56 Calibration A16 A5080 St Andrews Road SB Jun-05 RSI/ATC 474927 261234 2018 9351 504 456 2.174 Yes Yes57 Calibration A17 A508 Barrack Road NB Jun-05 RSI/ATC 475382 261256 9701 4018 1019 938 2.571 Yes Yes58 Calibration A17 A508 Barrack Road SB Jun-05 RSI/ATC 475382 261256 4018 9701 1410 1248 4.448 Yes Yes59 Calibration A18 A5123 Kettering Road NB Jun-05 RSI/ATC 476262 261133 2011 9348 375 89 18.794 No No60 Calibration A18 A5123 Kettering Road SB Jun-05 RSI/ATC 476262 261133 9348 2011 679 510 6.936 No No
61 Calibration A19 A4500 Wellingborough Road EB Jun-05 RSI/ATC 476422 260955 21012 9349 552 495 2.501 Yes Yes
62 Calibration A19 A4500 Wellingborough Road WB Jun-05 RSI/ATC 476422 260955 9349 21012 707 638 2.652 Yes Yes
63 Calibration A20 Billing Road EB Jun-05 RSI/ATC 476472 260572 2012 5012 474 463 0.494 Yes Yes
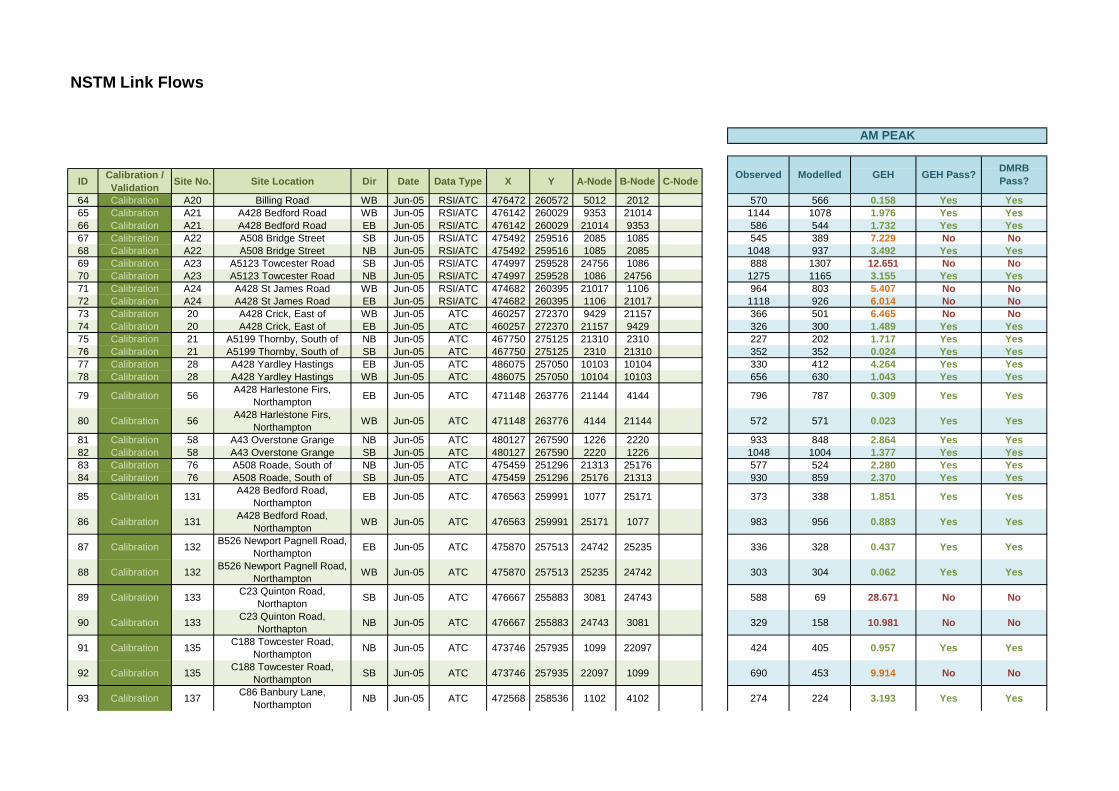
NSTM Link Flows
ID Calibration / Validation Site No. Site Location Dir Date Data Type X Y A-Node B-Node C-Node
AM PEAK
GEH GEH Pass? DMRB Pass?ModelledObserved
64 Calibration A20 Billing Road WB Jun-05 RSI/ATC 476472 260572 5012 2012 570 566 0.158 Yes Yes65 Calibration A21 A428 Bedford Road WB Jun-05 RSI/ATC 476142 260029 9353 21014 1144 1078 1.976 Yes Yes66 Calibration A21 A428 Bedford Road EB Jun-05 RSI/ATC 476142 260029 21014 9353 586 544 1.732 Yes Yes67 Calibration A22 A508 Bridge Street SB Jun-05 RSI/ATC 475492 259516 2085 1085 545 389 7.229 No No68 Calibration A22 A508 Bridge Street NB Jun-05 RSI/ATC 475492 259516 1085 2085 1048 937 3.492 Yes Yes69 Calibration A23 A5123 Towcester Road SB Jun-05 RSI/ATC 474997 259528 24756 1086 888 1307 12.651 No No70 Calibration A23 A5123 Towcester Road NB Jun-05 RSI/ATC 474997 259528 1086 24756 1275 1165 3.155 Yes Yes71 Calibration A24 A428 St James Road WB Jun-05 RSI/ATC 474682 260395 21017 1106 964 803 5.407 No No72 Calibration A24 A428 St James Road EB Jun-05 RSI/ATC 474682 260395 1106 21017 1118 926 6.014 No No73 Calibration 20 A428 Crick, East of WB Jun-05 ATC 460257 272370 9429 21157 366 501 6.465 No No74 Calibration 20 A428 Crick, East of EB Jun-05 ATC 460257 272370 21157 9429 326 300 1.489 Yes Yes75 Calibration 21 A5199 Thornby, South of NB Jun-05 ATC 467750 275125 21310 2310 227 202 1.717 Yes Yes76 Calibration 21 A5199 Thornby, South of SB Jun-05 ATC 467750 275125 2310 21310 352 352 0.024 Yes Yes77 Calibration 28 A428 Yardley Hastings EB Jun-05 ATC 486075 257050 10103 10104 330 412 4.264 Yes Yes78 Calibration 28 A428 Yardley Hastings WB Jun-05 ATC 486075 257050 10104 10103 656 630 1.043 Yes Yes
79 Calibration 56 A428 Harlestone Firs, Northampton EB Jun-05 ATC 471148 263776 21144 4144 796 787 0.309 Yes Yes
80 Calibration 56 A428 Harlestone Firs, Northampton WB Jun-05 ATC 471148 263776 4144 21144 572 571 0.023 Yes Yes
81 Calibration 58 A43 Overstone Grange NB Jun-05 ATC 480127 267590 1226 2220 933 848 2.864 Yes Yes82 Calibration 58 A43 Overstone Grange SB Jun-05 ATC 480127 267590 2220 1226 1048 1004 1.377 Yes Yes83 Calibration 76 A508 Roade, South of NB Jun-05 ATC 475459 251296 21313 25176 577 524 2.280 Yes Yes84 Calibration 76 A508 Roade, South of SB Jun-05 ATC 475459 251296 25176 21313 930 859 2.370 Yes Yes
85 Calibration 131 A428 Bedford Road, Northampton EB Jun-05 ATC 476563 259991 1077 25171 373 338 1.851 Yes Yes
86 Calibration 131 A428 Bedford Road, Northampton WB Jun-05 ATC 476563 259991 25171 1077 983 956 0.883 Yes Yes
87 Calibration 132 B526 Newport Pagnell Road, Northampton EB Jun-05 ATC 475870 257513 24742 25235 336 328 0.437 Yes Yes
88 Calibration 132 B526 Newport Pagnell Road, Northampton WB Jun-05 ATC 475870 257513 25235 24742 303 304 0.062 Yes Yes
89 Calibration 133 C23 Quinton Road, Northapton SB Jun-05 ATC 476667 255883 3081 24743 588 69 28.671 No No
90 Calibration 133 C23 Quinton Road, Northapton NB Jun-05 ATC 476667 255883 24743 3081 329 158 10.981 No No
91 Calibration 135 C188 Towcester Road, Northampton NB Jun-05 ATC 473746 257935 1099 22097 424 405 0.957 Yes Yes
92 Calibration 135 C188 Towcester Road, Northampton SB Jun-05 ATC 473746 257935 22097 1099 690 453 9.914 No No
93 Calibration 137 C86 Banbury Lane, Northampton NB Jun-05 ATC 472568 258536 1102 4102 274 224 3.193 Yes Yes
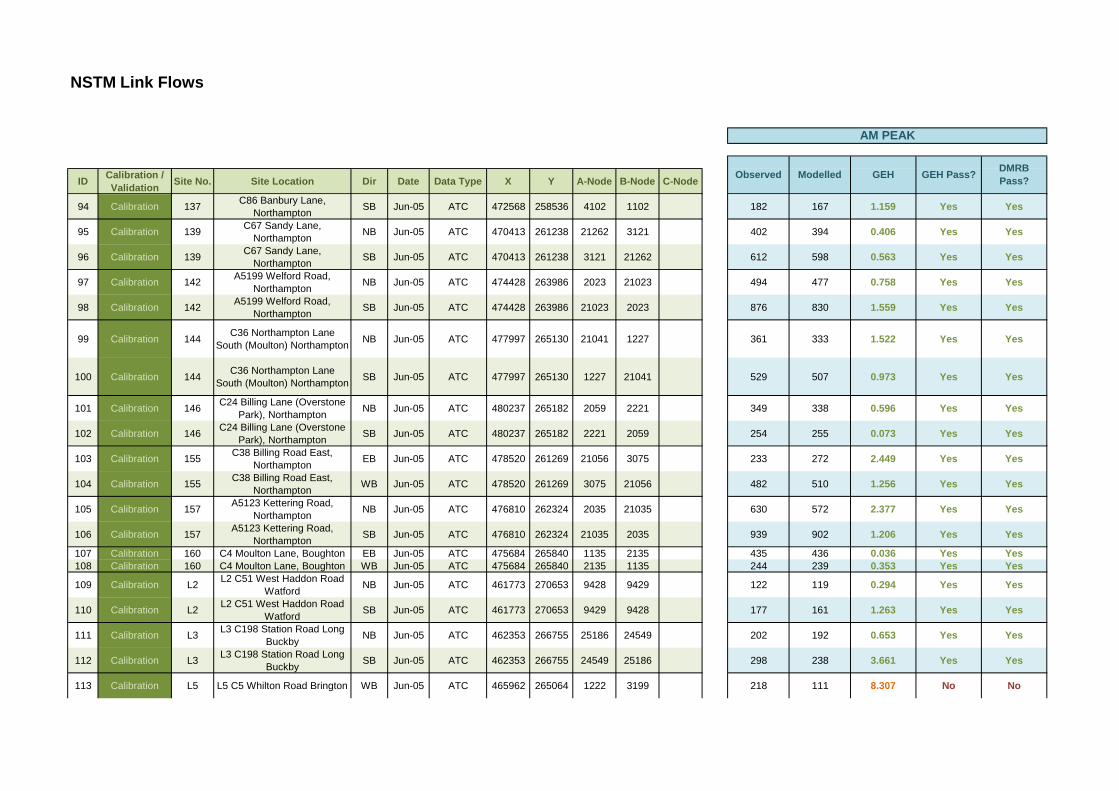
NSTM Link Flows
ID Calibration / Validation Site No. Site Location Dir Date Data Type X Y A-Node B-Node C-Node
AM PEAK
GEH GEH Pass? DMRB Pass?ModelledObserved
94 Calibration 137 C86 Banbury Lane, Northampton SB Jun-05 ATC 472568 258536 4102 1102 182 167 1.159 Yes Yes
95 Calibration 139 C67 Sandy Lane, Northampton NB Jun-05 ATC 470413 261238 21262 3121 402 394 0.406 Yes Yes
96 Calibration 139 C67 Sandy Lane, Northampton SB Jun-05 ATC 470413 261238 3121 21262 612 598 0.563 Yes Yes
97 Calibration 142 A5199 Welford Road, Northampton NB Jun-05 ATC 474428 263986 2023 21023 494 477 0.758 Yes Yes
98 Calibration 142 A5199 Welford Road, Northampton SB Jun-05 ATC 474428 263986 21023 2023 876 830 1.559 Yes Yes
99 Calibration 144 C36 Northampton Lane South (Moulton) Northampton NB Jun-05 ATC 477997 265130 21041 1227 361 333 1.522 Yes Yes
100 Calibration 144 C36 Northampton Lane South (Moulton) Northampton SB Jun-05 ATC 477997 265130 1227 21041 529 507 0.973 Yes Yes
101 Calibration 146 C24 Billing Lane (Overstone Park), Northampton NB Jun-05 ATC 480237 265182 2059 2221 349 338 0.596 Yes Yes
102 Calibration 146 C24 Billing Lane (Overstone Park), Northampton SB Jun-05 ATC 480237 265182 2221 2059 254 255 0.073 Yes Yes
103 Calibration 155 C38 Billing Road East, Northampton EB Jun-05 ATC 478520 261269 21056 3075 233 272 2.449 Yes Yes
104 Calibration 155 C38 Billing Road East, Northampton WB Jun-05 ATC 478520 261269 3075 21056 482 510 1.256 Yes Yes
105 Calibration 157 A5123 Kettering Road, Northampton NB Jun-05 ATC 476810 262324 2035 21035 630 572 2.377 Yes Yes
106 Calibration 157 A5123 Kettering Road, Northampton SB Jun-05 ATC 476810 262324 21035 2035 939 902 1.206 Yes Yes
107 Calibration 160 C4 Moulton Lane, Boughton EB Jun-05 ATC 475684 265840 1135 2135 435 436 0.036 Yes Yes108 Calibration 160 C4 Moulton Lane, Boughton WB Jun-05 ATC 475684 265840 2135 1135 244 239 0.353 Yes Yes
109 Calibration L2 L2 C51 West Haddon Road Watford NB Jun-05 ATC 461773 270653 9428 9429 122 119 0.294 Yes Yes
110 Calibration L2 L2 C51 West Haddon Road Watford SB Jun-05 ATC 461773 270653 9429 9428 177 161 1.263 Yes Yes
111 Calibration L3 L3 C198 Station Road Long Buckby NB Jun-05 ATC 462353 266755 25186 24549 202 192 0.653 Yes Yes
112 Calibration L3 L3 C198 Station Road Long Buckby SB Jun-05 ATC 462353 266755 24549 25186 298 238 3.661 Yes Yes
113 Calibration L5 L5 C5 Whilton Road Brington WB Jun-05 ATC 465962 265064 1222 3199 218 111 8.307 No No
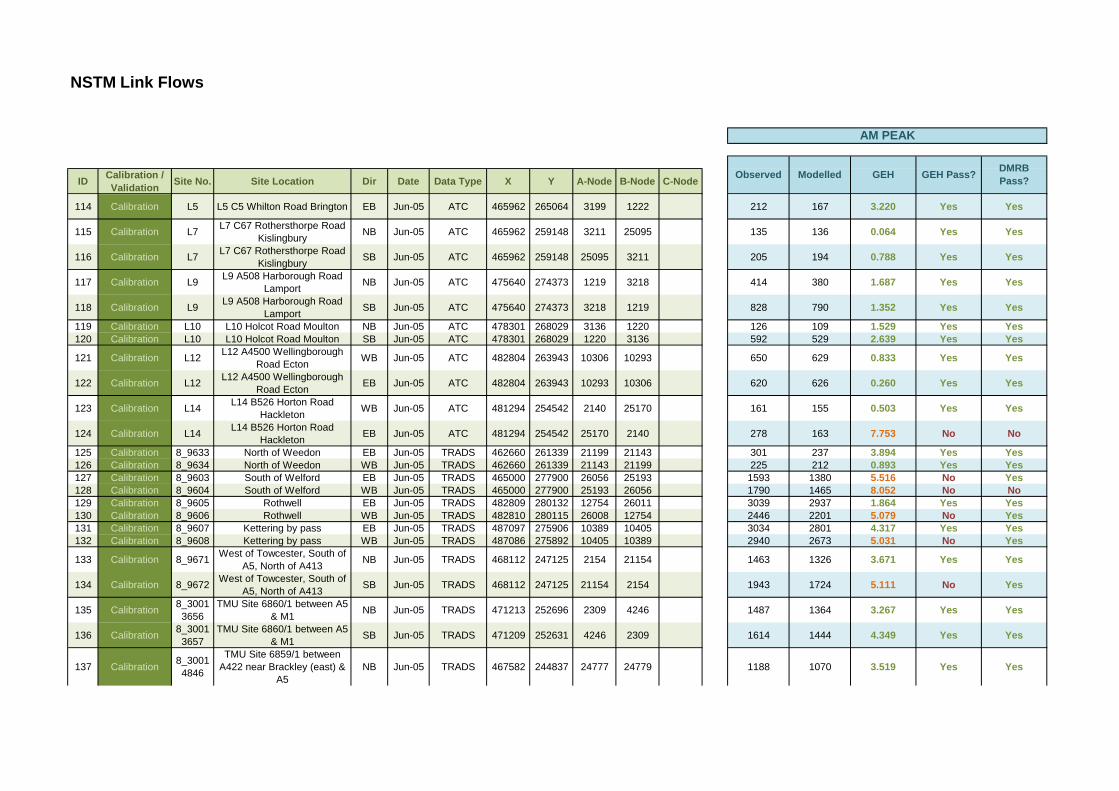
NSTM Link Flows
ID Calibration / Validation Site No. Site Location Dir Date Data Type X Y A-Node B-Node C-Node
AM PEAK
GEH GEH Pass? DMRB Pass?ModelledObserved
114 Calibration L5 L5 C5 Whilton Road Brington EB Jun-05 ATC 465962 265064 3199 1222 212 167 3.220 Yes Yes
115 Calibration L7 L7 C67 Rothersthorpe Road Kislingbury NB Jun-05 ATC 465962 259148 3211 25095 135 136 0.064 Yes Yes
116 Calibration L7 L7 C67 Rothersthorpe Road Kislingbury SB Jun-05 ATC 465962 259148 25095 3211 205 194 0.788 Yes Yes
117 Calibration L9 L9 A508 Harborough Road Lamport NB Jun-05 ATC 475640 274373 1219 3218 414 380 1.687 Yes Yes
118 Calibration L9 L9 A508 Harborough Road Lamport SB Jun-05 ATC 475640 274373 3218 1219 828 790 1.352 Yes Yes
119 Calibration L10 L10 Holcot Road Moulton NB Jun-05 ATC 478301 268029 3136 1220 126 109 1.529 Yes Yes120 Calibration L10 L10 Holcot Road Moulton SB Jun-05 ATC 478301 268029 1220 3136 592 529 2.639 Yes Yes
121 Calibration L12 L12 A4500 Wellingborough Road Ecton WB Jun-05 ATC 482804 263943 10306 10293 650 629 0.833 Yes Yes
122 Calibration L12 L12 A4500 Wellingborough Road Ecton EB Jun-05 ATC 482804 263943 10293 10306 620 626 0.260 Yes Yes
123 Calibration L14 L14 B526 Horton Road Hackleton WB Jun-05 ATC 481294 254542 2140 25170 161 155 0.503 Yes Yes
124 Calibration L14 L14 B526 Horton Road Hackleton EB Jun-05 ATC 481294 254542 25170 2140 278 163 7.753 No No
125 Calibration 8_9633 North of Weedon EB Jun-05 TRADS 462660 261339 21199 21143 301 237 3.894 Yes Yes126 Calibration 8_9634 North of Weedon WB Jun-05 TRADS 462660 261339 21143 21199 225 212 0.893 Yes Yes127 Calibration 8_9603 South of Welford EB Jun-05 TRADS 465000 277900 26056 25193 1593 1380 5.516 No Yes128 Calibration 8_9604 South of Welford WB Jun-05 TRADS 465000 277900 25193 26056 1790 1465 8.052 No No129 Calibration 8_9605 Rothwell EB Jun-05 TRADS 482809 280132 12754 26011 3039 2937 1.864 Yes Yes130 Calibration 8_9606 Rothwell WB Jun-05 TRADS 482810 280115 26008 12754 2446 2201 5.079 No Yes131 Calibration 8_9607 Kettering by pass EB Jun-05 TRADS 487097 275906 10389 10405 3034 2801 4.317 Yes Yes132 Calibration 8_9608 Kettering by pass WB Jun-05 TRADS 487086 275892 10405 10389 2940 2673 5.031 No Yes
133 Calibration 8_9671 West of Towcester, South of A5, North of A413 NB Jun-05 TRADS 468112 247125 2154 21154 1463 1326 3.671 Yes Yes
134 Calibration 8_9672 West of Towcester, South of A5, North of A413 SB Jun-05 TRADS 468112 247125 21154 2154 1943 1724 5.111 No Yes
135 Calibration 8_30013656
TMU Site 6860/1 between A5 & M1 NB Jun-05 TRADS 471213 252696 2309 4246 1487 1364 3.267 Yes Yes
136 Calibration 8_30013657
TMU Site 6860/1 between A5 & M1 SB Jun-05 TRADS 471209 252631 4246 2309 1614 1444 4.349 Yes Yes
137 Calibration 8_30014846
TMU Site 6859/1 between A422 near Brackley (east) &
A5NB Jun-05 TRADS 467582 244837 24777 24779 1188 1070 3.519 Yes Yes
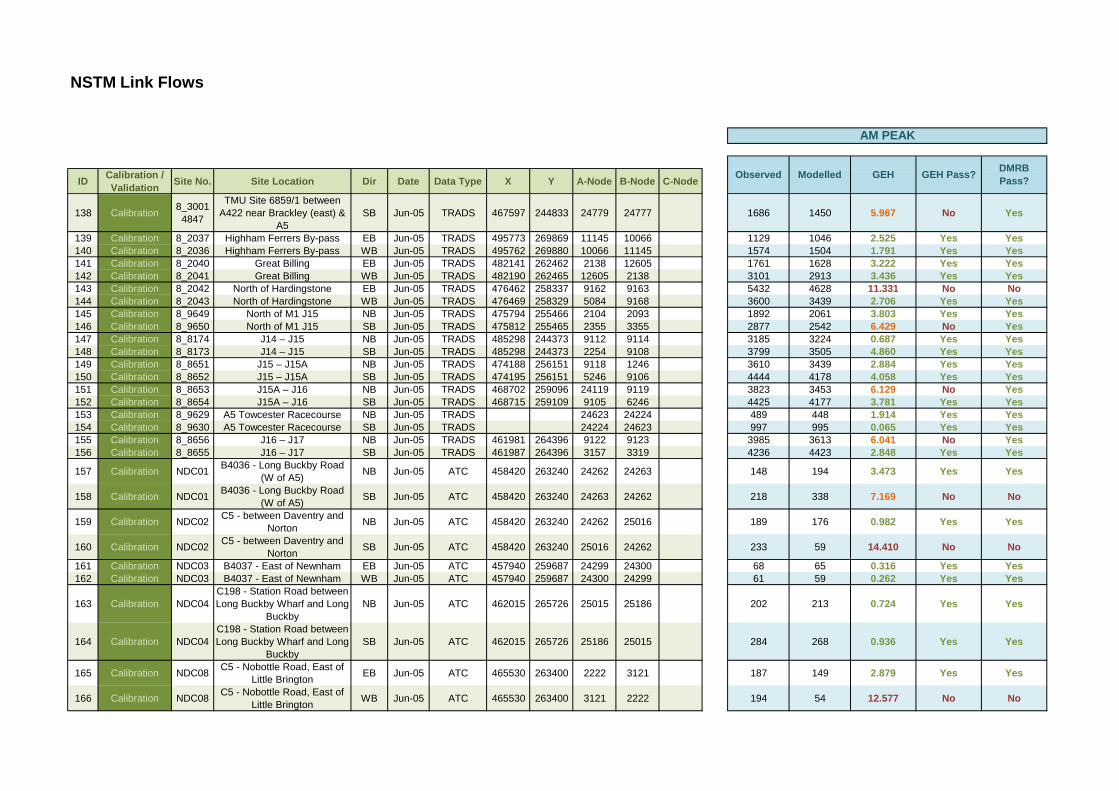
NSTM Link Flows
ID Calibration / Validation Site No. Site Location Dir Date Data Type X Y A-Node B-Node C-Node
AM PEAK
GEH GEH Pass? DMRB Pass?ModelledObserved
138 Calibration 8_30014847
TMU Site 6859/1 between A422 near Brackley (east) &
A5SB Jun-05 TRADS 467597 244833 24779 24777 1686 1450 5.967 No Yes
139 Calibration 8_2037 Highham Ferrers By-pass EB Jun-05 TRADS 495773 269869 11145 10066 1129 1046 2.525 Yes Yes140 Calibration 8_2036 Highham Ferrers By-pass WB Jun-05 TRADS 495762 269880 10066 11145 1574 1504 1.791 Yes Yes141 Calibration 8_2040 Great Billing EB Jun-05 TRADS 482141 262462 2138 12605 1761 1628 3.222 Yes Yes142 Calibration 8_2041 Great Billing WB Jun-05 TRADS 482190 262465 12605 2138 3101 2913 3.436 Yes Yes143 Calibration 8_2042 North of Hardingstone EB Jun-05 TRADS 476462 258337 9162 9163 5432 4628 11.331 No No144 Calibration 8_2043 North of Hardingstone WB Jun-05 TRADS 476469 258329 5084 9168 3600 3439 2.706 Yes Yes145 Calibration 8_9649 North of M1 J15 NB Jun-05 TRADS 475794 255466 2104 2093 1892 2061 3.803 Yes Yes146 Calibration 8_9650 North of M1 J15 SB Jun-05 TRADS 475812 255465 2355 3355 2877 2542 6.429 No Yes147 Calibration 8_8174 J14 – J15 NB Jun-05 TRADS 485298 244373 9112 9114 3185 3224 0.687 Yes Yes148 Calibration 8_8173 J14 – J15 SB Jun-05 TRADS 485298 244373 2254 9108 3799 3505 4.860 Yes Yes149 Calibration 8_8651 J15 – J15A NB Jun-05 TRADS 474188 256151 9118 1246 3610 3439 2.884 Yes Yes150 Calibration 8_8652 J15 – J15A SB Jun-05 TRADS 474195 256151 5246 9106 4444 4178 4.058 Yes Yes151 Calibration 8_8653 J15A – J16 NB Jun-05 TRADS 468702 259096 24119 9119 3823 3453 6.129 No Yes152 Calibration 8_8654 J15A – J16 SB Jun-05 TRADS 468715 259109 9105 6246 4425 4177 3.781 Yes Yes153 Calibration 8_9629 A5 Towcester Racecourse NB Jun-05 TRADS 24623 24224 489 448 1.914 Yes Yes154 Calibration 8_9630 A5 Towcester Racecourse SB Jun-05 TRADS 24224 24623 997 995 0.065 Yes Yes155 Calibration 8_8656 J16 – J17 NB Jun-05 TRADS 461981 264396 9122 9123 3985 3613 6.041 No Yes156 Calibration 8_8655 J16 – J17 SB Jun-05 TRADS 461987 264396 3157 3319 4236 4423 2.848 Yes Yes
157 Calibration NDC01 B4036 - Long Buckby Road (W of A5) NB Jun-05 ATC 458420 263240 24262 24263 148 194 3.473 Yes Yes
158 Calibration NDC01 B4036 - Long Buckby Road (W of A5) SB Jun-05 ATC 458420 263240 24263 24262 218 338 7.169 No No
159 Calibration NDC02 C5 - between Daventry and Norton NB Jun-05 ATC 458420 263240 24262 25016 189 176 0.982 Yes Yes
160 Calibration NDC02 C5 - between Daventry and Norton SB Jun-05 ATC 458420 263240 25016 24262 233 59 14.410 No No
161 Calibration NDC03 B4037 - East of Newnham EB Jun-05 ATC 457940 259687 24299 24300 68 65 0.316 Yes Yes162 Calibration NDC03 B4037 - East of Newnham WB Jun-05 ATC 457940 259687 24300 24299 61 59 0.262 Yes Yes
163 Calibration NDC04C198 - Station Road between Long Buckby Wharf and Long
BuckbyNB Jun-05 ATC 462015 265726 25015 25186 202 213 0.724 Yes Yes
164 Calibration NDC04C198 - Station Road between Long Buckby Wharf and Long
BuckbySB Jun-05 ATC 462015 265726 25186 25015 284 268 0.936 Yes Yes
165 Calibration NDC08 C5 - Nobottle Road, East of Little Brington EB Jun-05 ATC 465530 263400 2222 3121 187 149 2.879 Yes Yes
166 Calibration NDC08 C5 - Nobottle Road, East of Little Brington WB Jun-05 ATC 465530 263400 3121 2222 194 54 12.577 No No

NSTM Link Flows
ID Calibration / Validation Site No. Site Location Dir Date Data Type X Y A-Node B-Node C-Node
AM PEAK
GEH GEH Pass? DMRB Pass?ModelledObserved
167 Calibration 13 A45 Flore EB Jun-05 ATC 463980 260310 25006 24551 721 666 2.100 Yes Yes168 Calibration 13 A45 Flore WB Jun-05 ATC 463980 260310 24551 25006 651 594 2.290 Yes Yes169 Calibration 82 A45 East of Daventry EB Jun-05 ATC 458913 260846 24225 24300 682 629 2.053 Yes Yes170 Calibration 82 A45 East of Daventry WB Jun-05 ATC 458913 260846 24300 24225 872 808 2.203 Yes Yes
171 Calibration 137 C86 Banbury Lane, Northampton NB Jun-05 ATC 471790 257670 2246 1102 250 224 1.713 Yes Yes
172 Calibration 137 C86 Banbury Lane, Northampton SB Jun-05 ATC 471790 257670 1102 2246 174 167 0.559 Yes Yes
173 Calibration 138 A45 Weedon Road WB Jun-05 ATC 471778 260255 1112 23214 785 742 1.545 Yes Yes174 Calibration 138 A45 Weedon Road EB Jun-05 ATC 471778 260255 23214 1112 1219 1112 3.145 Yes Yes175 Calibration 141 Port Road EB Jun-05 ATC 466720 265220 1222 9930 28 30 0.327 Yes Yes176 Calibration 141 Port Road WB Jun-05 ATC 466720 265220 9930 1222 22 20 0.335 Yes Yes
177 Calibration 162 C24 West of Church Brampton WB Jun-05 ATC 471778 265645 21145 2144 506 498 0.350 Yes Yes
178 Calibration 162 C24 West of Church Brampton EB Jun-05 ATC 471778 265645 2144 21145 490 492 0.088 Yes Yes
179 Calibration 166 A45 Upton Way SB Jun-05 ATC 472710 259570 3258 3102 1598 1435 4.183 Yes Yes180 Calibration 166 A45 Upton Way NB Jun-05 ATC 472710 259570 3102 3258 1805 1502 7.454 No No181 Calibration 2009/06 C54 Bugbrooke Road SB Jun-05 ATC 469005 258271 25094 25093 245 221 1.597 Yes Yes182 Calibration 2009/06 C54 Bugbrooke Road NB Jun-05 ATC 469005 258271 25093 25094 175 154 1.644 Yes Yes183 Calibration 1 West of Desborough NB Jun-05 ATC 478920 282990 12361 12363 414 402 0.600 Yes Yes184 Calibration 1 West of Desborough SB Jun-05 ATC 478920 282990 12363 12361 653 639 0.561 Yes Yes185 Calibration 2 South of Broughton NB Jun-05 ATC 480800 268610 2220 25160 889 813 2.611 Yes Yes186 Calibration 2 South of Broughton SB Jun-05 ATC 480800 268610 25160 2220 980 927 1.709 Yes Yes
187 Calibration 5 Polwell Lane, Burton Latimer NB Jun-05 ATC 489219 274961 11132 30050 179 173 0.424 Yes Yes
188 Calibration 5 Polwell Lane, Burton Latimer SB Jun-05 ATC 489219 274961 30050 11132 304 282 1.320 Yes Yes
189 Calibration 8 North of Sudborough EB Jun-05 ATC 497160 282190 24101 25161 250 488 12.388 No No190 Calibration 8 North of Sudborough WB Jun-05 ATC 497160 282190 25161 24101 388 271 6.412 No No
191 Calibration 1 Pytchley Lane, South of A14 NB Jun-05 ATC 478920 282990 10253 10711 143 128 1.283 Yes Yes
192 Calibration 1 Pytchley Lane, South of A14 SB Jun-05 ATC 478920 282990 10711 10253 105 104 0.093 Yes Yes
193 Calibration 2 Isham Rd, South of A14 EB Jun-05 ATC 485996 274743 10254 12708 158 160 0.122 Yes Yes194 Calibration 2 Isham Rd, South of A14 WB Jun-05 ATC 485996 274743 12708 10254 157 113 3.814 Yes Yes195 Calibration 4 Kettering Rd, South of A14 NB Jun-05 ATC 489697 275605 12058 12724 459 408 2.438 Yes Yes196 Calibration 4 Kettering Rd, South of A14 SB Jun-05 ATC 489697 275605 12724 12058 471 429 1.988 Yes Yes
197 Calibration 7 Irthlingborough Rd, Southeast of Finedon NB Jun-05 ATC 493860 271370 10416 12123 790 766 0.859 Yes Yes
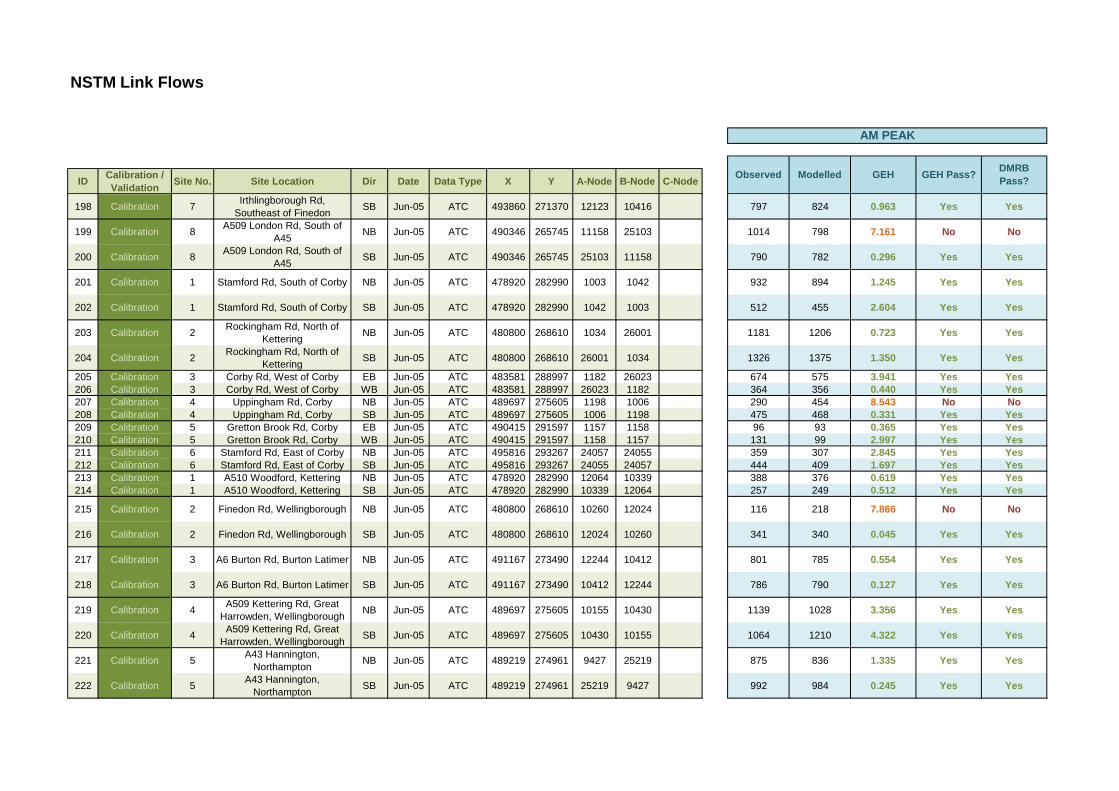
NSTM Link Flows
ID Calibration / Validation Site No. Site Location Dir Date Data Type X Y A-Node B-Node C-Node
AM PEAK
GEH GEH Pass? DMRB Pass?ModelledObserved
198 Calibration 7 Irthlingborough Rd, Southeast of Finedon SB Jun-05 ATC 493860 271370 12123 10416 797 824 0.963 Yes Yes
199 Calibration 8 A509 London Rd, South of A45 NB Jun-05 ATC 490346 265745 11158 25103 1014 798 7.161 No No
200 Calibration 8 A509 London Rd, South of A45 SB Jun-05 ATC 490346 265745 25103 11158 790 782 0.296 Yes Yes
201 Calibration 1 Stamford Rd, South of Corby NB Jun-05 ATC 478920 282990 1003 1042 932 894 1.245 Yes Yes
202 Calibration 1 Stamford Rd, South of Corby SB Jun-05 ATC 478920 282990 1042 1003 512 455 2.604 Yes Yes
203 Calibration 2 Rockingham Rd, North of Kettering NB Jun-05 ATC 480800 268610 1034 26001 1181 1206 0.723 Yes Yes
204 Calibration 2 Rockingham Rd, North of Kettering SB Jun-05 ATC 480800 268610 26001 1034 1326 1375 1.350 Yes Yes
205 Calibration 3 Corby Rd, West of Corby EB Jun-05 ATC 483581 288997 1182 26023 674 575 3.941 Yes Yes206 Calibration 3 Corby Rd, West of Corby WB Jun-05 ATC 483581 288997 26023 1182 364 356 0.440 Yes Yes207 Calibration 4 Uppingham Rd, Corby NB Jun-05 ATC 489697 275605 1198 1006 290 454 8.543 No No208 Calibration 4 Uppingham Rd, Corby SB Jun-05 ATC 489697 275605 1006 1198 475 468 0.331 Yes Yes209 Calibration 5 Gretton Brook Rd, Corby EB Jun-05 ATC 490415 291597 1157 1158 96 93 0.365 Yes Yes210 Calibration 5 Gretton Brook Rd, Corby WB Jun-05 ATC 490415 291597 1158 1157 131 99 2.997 Yes Yes211 Calibration 6 Stamford Rd, East of Corby NB Jun-05 ATC 495816 293267 24057 24055 359 307 2.845 Yes Yes212 Calibration 6 Stamford Rd, East of Corby SB Jun-05 ATC 495816 293267 24055 24057 444 409 1.697 Yes Yes213 Calibration 1 A510 Woodford, Kettering NB Jun-05 ATC 478920 282990 12064 10339 388 376 0.619 Yes Yes214 Calibration 1 A510 Woodford, Kettering SB Jun-05 ATC 478920 282990 10339 12064 257 249 0.512 Yes Yes
215 Calibration 2 Finedon Rd, Wellingborough NB Jun-05 ATC 480800 268610 10260 12024 116 218 7.866 No No
216 Calibration 2 Finedon Rd, Wellingborough SB Jun-05 ATC 480800 268610 12024 10260 341 340 0.045 Yes Yes
217 Calibration 3 A6 Burton Rd, Burton Latimer NB Jun-05 ATC 491167 273490 12244 10412 801 785 0.554 Yes Yes
218 Calibration 3 A6 Burton Rd, Burton Latimer SB Jun-05 ATC 491167 273490 10412 12244 786 790 0.127 Yes Yes
219 Calibration 4 A509 Kettering Rd, Great Harrowden, Wellingborough NB Jun-05 ATC 489697 275605 10155 10430 1139 1028 3.356 Yes Yes
220 Calibration 4 A509 Kettering Rd, Great Harrowden, Wellingborough SB Jun-05 ATC 489697 275605 10430 10155 1064 1210 4.322 Yes Yes
221 Calibration 5 A43 Hannington, Northampton NB Jun-05 ATC 489219 274961 9427 25219 875 836 1.335 Yes Yes
222 Calibration 5 A43 Hannington, Northampton SB Jun-05 ATC 489219 274961 25219 9427 992 984 0.245 Yes Yes

NSTM Link Flows
ID Calibration / Validation Site No. Site Location Dir Date Data Type X Y A-Node B-Node C-Node
AM PEAK
GEH GEH Pass? DMRB Pass?ModelledObserved
223 Calibration 1A A14 / A6, northern roundabout
TO ARM A Jun-05 MCC 480698 280446 12775 12361 426 428 0.128 Yes Yes
224 Calibration 1A A14 / A6, northern roundabout
FROM ARM A Jun-05 MCC 480698 280446 12361 12775 729 737 0.293 Yes Yes
225 Calibration 1A A14 / A6, northern roundabout
TO ARM B Jun-05 MCC 480698 280446 12775 10235 21 20 0.214 Yes Yes
226 Calibration 1A A14 / A6, northern roundabout
FROM ARM B Jun-05 MCC 480698 280446 10235 12775 14 14 0.097 Yes Yes
227 Calibration 1A A14 / A6, northern roundabout
TO ARM E Jun-05 MCC 480698 280446 12775 12393 765 767 0.083 Yes Yes
228 Calibration 1A A14 / A6, northern roundabout
TO ARM F Jun-05 MCC 480698 280446 12775 12434 133 132 0.076 Yes Yes
229 Calibration 1A A14 / A6, northern roundabout
FROM ARM F Jun-05 MCC 481020 280794 12434 12775 267 265 0.178 Yes Yes
230 Calibration 1b A14 / A6, northern roundabout
TO ARM D Jun-05 MCC 481020 280794 10238 26019 27 83 7.532 No Yes
231 Calibration 1b A14 / A6, northern roundabout
FROM ARM D Jun-05 MCC 480677 279432 26019 10238 25 90 8.594 No Yes
232 Calibration 1b A14 / A6, northern roundabout
FROM ARM E Jun-05 MCC 480677 279432 12393 10238 418 389 1.418 Yes Yes
233 Calibration 2A A14 / B576 / Loddington Rd - northern roundabout
TO ARM A Jun-05 MCC 481533 280621 12767 25005 326 326 0.013 Yes Yes
234 Calibration 2A A14 / B576 / Loddington Rd - northern roundabout
FROM ARM A Jun-05 MCC 481533 280621 25005 12767 736 771 1.295 Yes Yes
235 Calibration 2A A14 / B576 / Loddington Rd - northern roundabout
TO ARM C Jun-05 MCC 481533 280621 12767 10243 90 84 0.648 Yes Yes
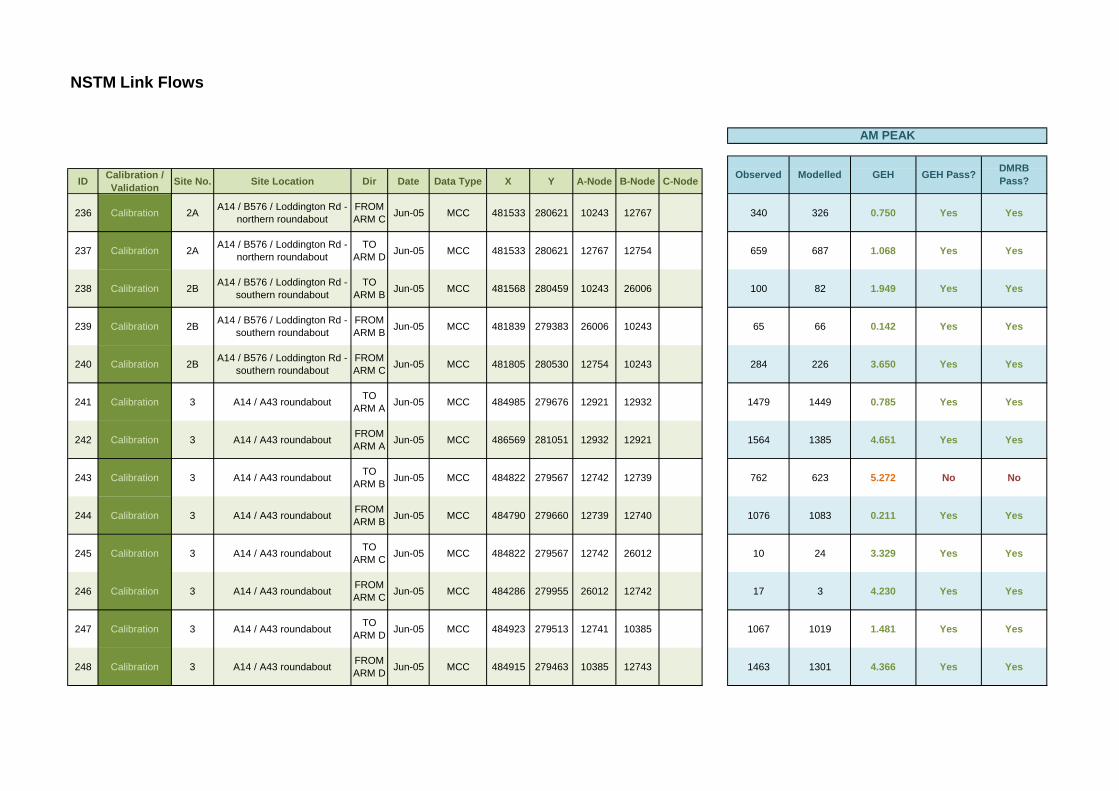
NSTM Link Flows
ID Calibration / Validation Site No. Site Location Dir Date Data Type X Y A-Node B-Node C-Node
AM PEAK
GEH GEH Pass? DMRB Pass?ModelledObserved
236 Calibration 2A A14 / B576 / Loddington Rd - northern roundabout
FROM ARM C Jun-05 MCC 481533 280621 10243 12767 340 326 0.750 Yes Yes
237 Calibration 2A A14 / B576 / Loddington Rd - northern roundabout
TO ARM D Jun-05 MCC 481533 280621 12767 12754 659 687 1.068 Yes Yes
238 Calibration 2B A14 / B576 / Loddington Rd - southern roundabout
TO ARM B Jun-05 MCC 481568 280459 10243 26006 100 82 1.949 Yes Yes
239 Calibration 2B A14 / B576 / Loddington Rd - southern roundabout
FROM ARM B Jun-05 MCC 481839 279383 26006 10243 65 66 0.142 Yes Yes
240 Calibration 2B A14 / B576 / Loddington Rd - southern roundabout
FROM ARM C Jun-05 MCC 481805 280530 12754 10243 284 226 3.650 Yes Yes
241 Calibration 3 A14 / A43 roundabout TO ARM A Jun-05 MCC 484985 279676 12921 12932 1479 1449 0.785 Yes Yes
242 Calibration 3 A14 / A43 roundabout FROM ARM A Jun-05 MCC 486569 281051 12932 12921 1564 1385 4.651 Yes Yes
243 Calibration 3 A14 / A43 roundabout TO ARM B Jun-05 MCC 484822 279567 12742 12739 762 623 5.272 No No
244 Calibration 3 A14 / A43 roundabout FROM ARM B Jun-05 MCC 484790 279660 12739 12740 1076 1083 0.211 Yes Yes
245 Calibration 3 A14 / A43 roundabout TO ARM C Jun-05 MCC 484822 279567 12742 26012 10 24 3.329 Yes Yes
246 Calibration 3 A14 / A43 roundabout FROM ARM C Jun-05 MCC 484286 279955 26012 12742 17 3 4.230 Yes Yes
247 Calibration 3 A14 / A43 roundabout TO ARM D Jun-05 MCC 484923 279513 12741 10385 1067 1019 1.481 Yes Yes
248 Calibration 3 A14 / A43 roundabout FROM ARM D Jun-05 MCC 484915 279463 10385 12743 1463 1301 4.366 Yes Yes
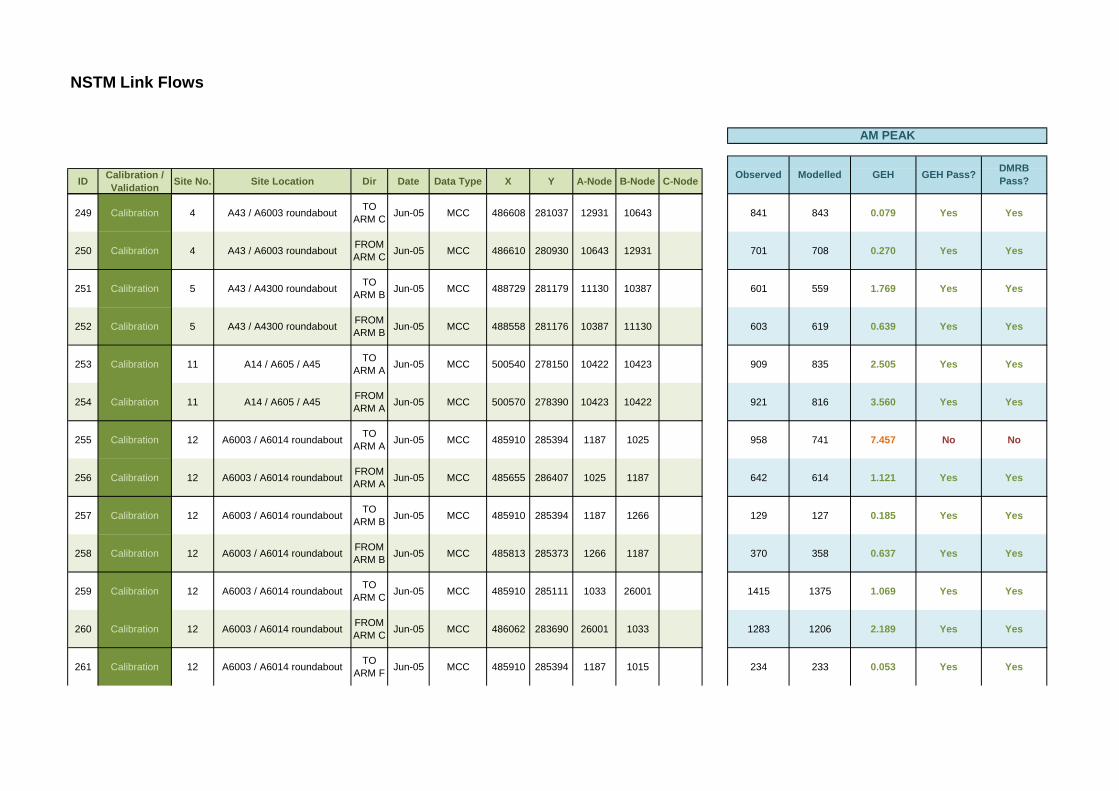
NSTM Link Flows
ID Calibration / Validation Site No. Site Location Dir Date Data Type X Y A-Node B-Node C-Node
AM PEAK
GEH GEH Pass? DMRB Pass?ModelledObserved
249 Calibration 4 A43 / A6003 roundabout TO ARM C Jun-05 MCC 486608 281037 12931 10643 841 843 0.079 Yes Yes
250 Calibration 4 A43 / A6003 roundabout FROM ARM C Jun-05 MCC 486610 280930 10643 12931 701 708 0.270 Yes Yes
251 Calibration 5 A43 / A4300 roundabout TO ARM B Jun-05 MCC 488729 281179 11130 10387 601 559 1.769 Yes Yes
252 Calibration 5 A43 / A4300 roundabout FROM ARM B Jun-05 MCC 488558 281176 10387 11130 603 619 0.639 Yes Yes
253 Calibration 11 A14 / A605 / A45 TO ARM A Jun-05 MCC 500540 278150 10422 10423 909 835 2.505 Yes Yes
254 Calibration 11 A14 / A605 / A45 FROM ARM A Jun-05 MCC 500570 278390 10423 10422 921 816 3.560 Yes Yes
255 Calibration 12 A6003 / A6014 roundabout TO ARM A Jun-05 MCC 485910 285394 1187 1025 958 741 7.457 No No
256 Calibration 12 A6003 / A6014 roundabout FROM ARM A Jun-05 MCC 485655 286407 1025 1187 642 614 1.121 Yes Yes
257 Calibration 12 A6003 / A6014 roundabout TO ARM B Jun-05 MCC 485910 285394 1187 1266 129 127 0.185 Yes Yes
258 Calibration 12 A6003 / A6014 roundabout FROM ARM B Jun-05 MCC 485813 285373 1266 1187 370 358 0.637 Yes Yes
259 Calibration 12 A6003 / A6014 roundabout TO ARM C Jun-05 MCC 485910 285111 1033 26001 1415 1375 1.069 Yes Yes
260 Calibration 12 A6003 / A6014 roundabout FROM ARM C Jun-05 MCC 486062 283690 26001 1033 1283 1206 2.189 Yes Yes
261 Calibration 12 A6003 / A6014 roundabout TO ARM F Jun-05 MCC 485910 285394 1187 1015 234 233 0.053 Yes Yes

NSTM Link Flows
ID Calibration / Validation Site No. Site Location Dir Date Data Type X Y A-Node B-Node C-Node
AM PEAK
GEH GEH Pass? DMRB Pass?ModelledObserved
262 Calibration 12 A6003 / A6014 roundabout FROM ARM F Jun-05 MCC 485937 285566 1015 1187 291 205 5.483 No Yes
263 Calibration 13 A6003 / Danesholme Road TO ARM A Jun-05 MCC 485751 287279 1013 1025 597 581 0.656 Yes Yes
264 Calibration 13 A6003 / Danesholme Road FROM ARM A Jun-05 MCC 485655 286407 1025 1013 798 758 1.421 Yes Yes
265 Calibration 13 A6003 / Danesholme Road TO ARM B Jun-05 MCC 485751 287279 1013 1027 211 206 0.340 Yes Yes
266 Calibration 13 A6003 / Danesholme Road FROM ARM B Jun-05 MCC 486025 287167 1027 1013 222 239 1.137 Yes Yes
267 Calibration 13 A6003 / Danesholme Road TO ARM C Jun-05 MCC 485751 287279 1013 1181 955 926 0.937 Yes Yes
268 Calibration 13 A6003 / Danesholme Road FROM ARM C Jun-05 MCC 486271 289230 1181 1013 743 717 0.943 Yes Yes
269 Calibration 14 A6003 / Corby Rd / Cottingham Rd
TO ARM A Jun-05 MCC 486271 289230 1181 26020 810 777 1.147 Yes Yes
270 Calibration 14 A6003 / Corby Rd / Cottingham Rd
FROM ARM A Jun-05 MCC 486596 289916 26020 1181 656 627 1.165 Yes Yes
271 Calibration 14 A6003 / Corby Rd / Cottingham Rd
TO ARM B Jun-05 MCC 486271 289230 1181 26023 474 454 0.952 Yes Yes
272 Calibration 14 A6003 / Corby Rd / Cottingham Rd
FROM ARM B Jun-05 MCC 485947 289428 26023 1181 624 612 0.509 Yes Yes
273 Calibration 14 A6003 / Corby Rd / Cottingham Rd
TO ARM D Jun-05 MCC 486271 289230 1181 1007 565 572 0.289 Yes Yes
274 Calibration 14 A6003 / Corby Rd / Cottingham Rd
FROM ARM D Jun-05 MCC 486715 289004 1007 1181 379 356 1.205 Yes Yes
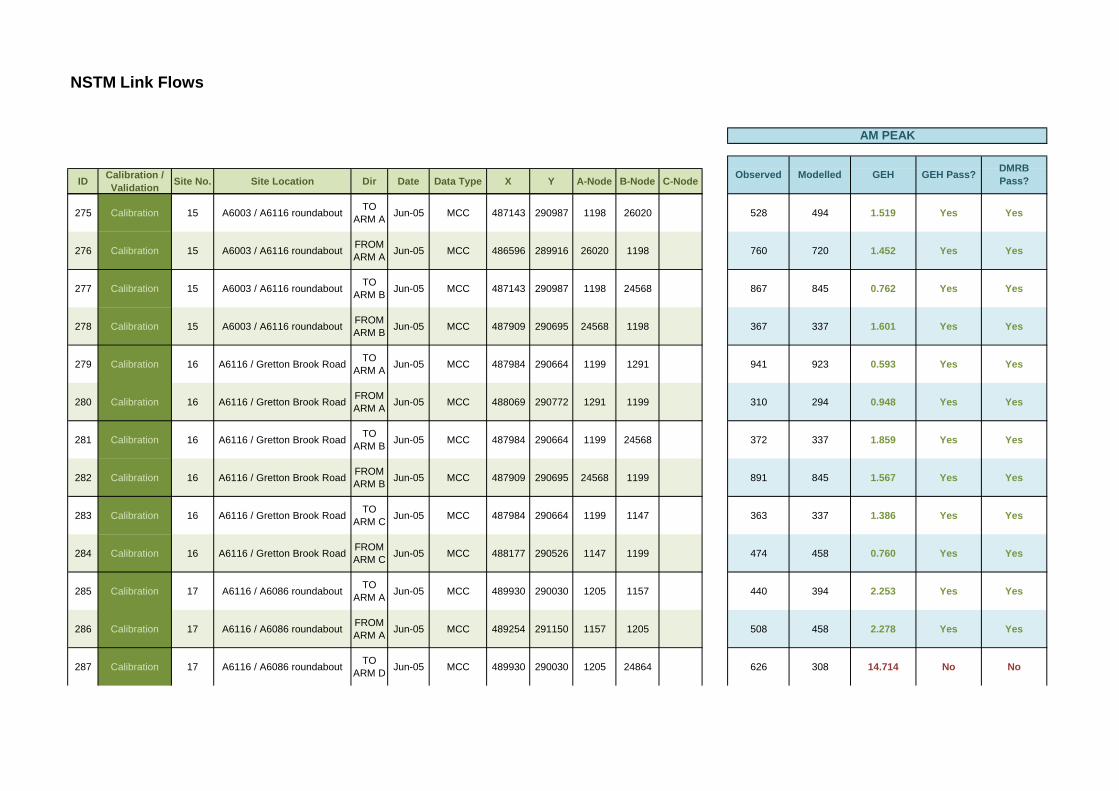
NSTM Link Flows
ID Calibration / Validation Site No. Site Location Dir Date Data Type X Y A-Node B-Node C-Node
AM PEAK
GEH GEH Pass? DMRB Pass?ModelledObserved
275 Calibration 15 A6003 / A6116 roundabout TO ARM A Jun-05 MCC 487143 290987 1198 26020 528 494 1.519 Yes Yes
276 Calibration 15 A6003 / A6116 roundabout FROM ARM A Jun-05 MCC 486596 289916 26020 1198 760 720 1.452 Yes Yes
277 Calibration 15 A6003 / A6116 roundabout TO ARM B Jun-05 MCC 487143 290987 1198 24568 867 845 0.762 Yes Yes
278 Calibration 15 A6003 / A6116 roundabout FROM ARM B Jun-05 MCC 487909 290695 24568 1198 367 337 1.601 Yes Yes
279 Calibration 16 A6116 / Gretton Brook Road TO ARM A Jun-05 MCC 487984 290664 1199 1291 941 923 0.593 Yes Yes
280 Calibration 16 A6116 / Gretton Brook Road FROM ARM A Jun-05 MCC 488069 290772 1291 1199 310 294 0.948 Yes Yes
281 Calibration 16 A6116 / Gretton Brook Road TO ARM B Jun-05 MCC 487984 290664 1199 24568 372 337 1.859 Yes Yes
282 Calibration 16 A6116 / Gretton Brook Road FROM ARM B Jun-05 MCC 487909 290695 24568 1199 891 845 1.567 Yes Yes
283 Calibration 16 A6116 / Gretton Brook Road TO ARM C Jun-05 MCC 487984 290664 1199 1147 363 337 1.386 Yes Yes
284 Calibration 16 A6116 / Gretton Brook Road FROM ARM C Jun-05 MCC 488177 290526 1147 1199 474 458 0.760 Yes Yes
285 Calibration 17 A6116 / A6086 roundabout TO ARM A Jun-05 MCC 489930 290030 1205 1157 440 394 2.253 Yes Yes
286 Calibration 17 A6116 / A6086 roundabout FROM ARM A Jun-05 MCC 489254 291150 1157 1205 508 458 2.278 Yes Yes
287 Calibration 17 A6116 / A6086 roundabout TO ARM D Jun-05 MCC 489930 290030 1205 24864 626 308 14.714 No No
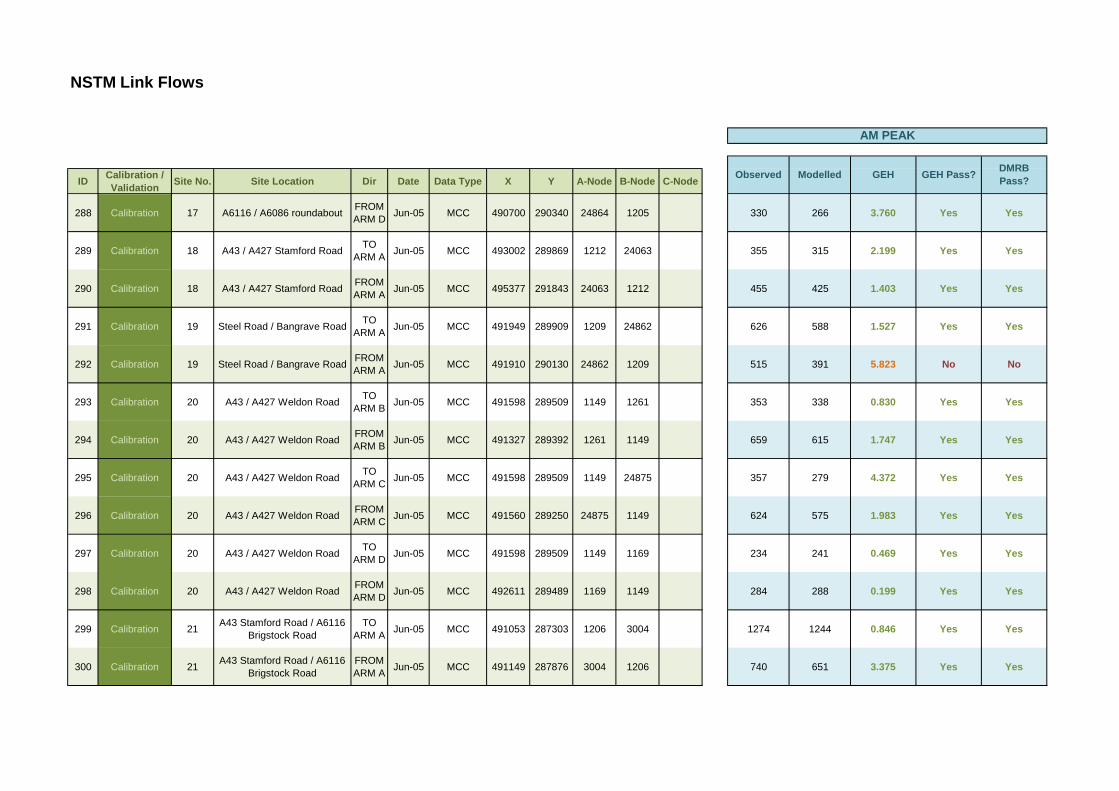
NSTM Link Flows
ID Calibration / Validation Site No. Site Location Dir Date Data Type X Y A-Node B-Node C-Node
AM PEAK
GEH GEH Pass? DMRB Pass?ModelledObserved
288 Calibration 17 A6116 / A6086 roundabout FROM ARM D Jun-05 MCC 490700 290340 24864 1205 330 266 3.760 Yes Yes
289 Calibration 18 A43 / A427 Stamford Road TO ARM A Jun-05 MCC 493002 289869 1212 24063 355 315 2.199 Yes Yes
290 Calibration 18 A43 / A427 Stamford Road FROM ARM A Jun-05 MCC 495377 291843 24063 1212 455 425 1.403 Yes Yes
291 Calibration 19 Steel Road / Bangrave Road TO ARM A Jun-05 MCC 491949 289909 1209 24862 626 588 1.527 Yes Yes
292 Calibration 19 Steel Road / Bangrave Road FROM ARM A Jun-05 MCC 491910 290130 24862 1209 515 391 5.823 No No
293 Calibration 20 A43 / A427 Weldon Road TO ARM B Jun-05 MCC 491598 289509 1149 1261 353 338 0.830 Yes Yes
294 Calibration 20 A43 / A427 Weldon Road FROM ARM B Jun-05 MCC 491327 289392 1261 1149 659 615 1.747 Yes Yes
295 Calibration 20 A43 / A427 Weldon Road TO ARM C Jun-05 MCC 491598 289509 1149 24875 357 279 4.372 Yes Yes
296 Calibration 20 A43 / A427 Weldon Road FROM ARM C Jun-05 MCC 491560 289250 24875 1149 624 575 1.983 Yes Yes
297 Calibration 20 A43 / A427 Weldon Road TO ARM D Jun-05 MCC 491598 289509 1149 1169 234 241 0.469 Yes Yes
298 Calibration 20 A43 / A427 Weldon Road FROM ARM D Jun-05 MCC 492611 289489 1169 1149 284 288 0.199 Yes Yes
299 Calibration 21 A43 Stamford Road / A6116 Brigstock Road
TO ARM A Jun-05 MCC 491053 287303 1206 3004 1274 1244 0.846 Yes Yes
300 Calibration 21 A43 Stamford Road / A6116 Brigstock Road
FROM ARM A Jun-05 MCC 491149 287876 3004 1206 740 651 3.375 Yes Yes
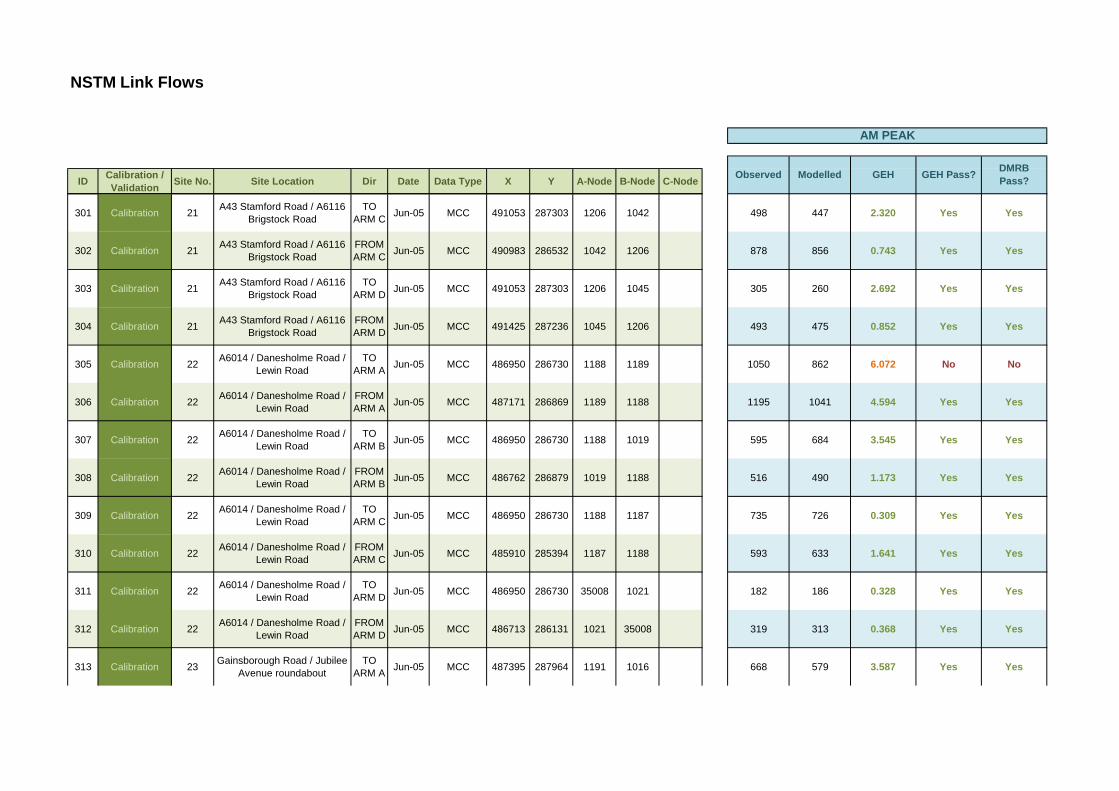
NSTM Link Flows
ID Calibration / Validation Site No. Site Location Dir Date Data Type X Y A-Node B-Node C-Node
AM PEAK
GEH GEH Pass? DMRB Pass?ModelledObserved
301 Calibration 21 A43 Stamford Road / A6116 Brigstock Road
TO ARM C Jun-05 MCC 491053 287303 1206 1042 498 447 2.320 Yes Yes
302 Calibration 21 A43 Stamford Road / A6116 Brigstock Road
FROM ARM C Jun-05 MCC 490983 286532 1042 1206 878 856 0.743 Yes Yes
303 Calibration 21 A43 Stamford Road / A6116 Brigstock Road
TO ARM D Jun-05 MCC 491053 287303 1206 1045 305 260 2.692 Yes Yes
304 Calibration 21 A43 Stamford Road / A6116 Brigstock Road
FROM ARM D Jun-05 MCC 491425 287236 1045 1206 493 475 0.852 Yes Yes
305 Calibration 22 A6014 / Danesholme Road / Lewin Road
TO ARM A Jun-05 MCC 486950 286730 1188 1189 1050 862 6.072 No No
306 Calibration 22 A6014 / Danesholme Road / Lewin Road
FROM ARM A Jun-05 MCC 487171 286869 1189 1188 1195 1041 4.594 Yes Yes
307 Calibration 22 A6014 / Danesholme Road / Lewin Road
TO ARM B Jun-05 MCC 486950 286730 1188 1019 595 684 3.545 Yes Yes
308 Calibration 22 A6014 / Danesholme Road / Lewin Road
FROM ARM B Jun-05 MCC 486762 286879 1019 1188 516 490 1.173 Yes Yes
309 Calibration 22 A6014 / Danesholme Road / Lewin Road
TO ARM C Jun-05 MCC 486950 286730 1188 1187 735 726 0.309 Yes Yes
310 Calibration 22 A6014 / Danesholme Road / Lewin Road
FROM ARM C Jun-05 MCC 485910 285394 1187 1188 593 633 1.641 Yes Yes
311 Calibration 22 A6014 / Danesholme Road / Lewin Road
TO ARM D Jun-05 MCC 486950 286730 35008 1021 182 186 0.328 Yes Yes
312 Calibration 22 A6014 / Danesholme Road / Lewin Road
FROM ARM D Jun-05 MCC 486713 286131 1021 35008 319 313 0.368 Yes Yes
313 Calibration 23 Gainsborough Road / Jubilee Avenue roundabout
TO ARM A Jun-05 MCC 487395 287964 1191 1016 668 579 3.587 Yes Yes
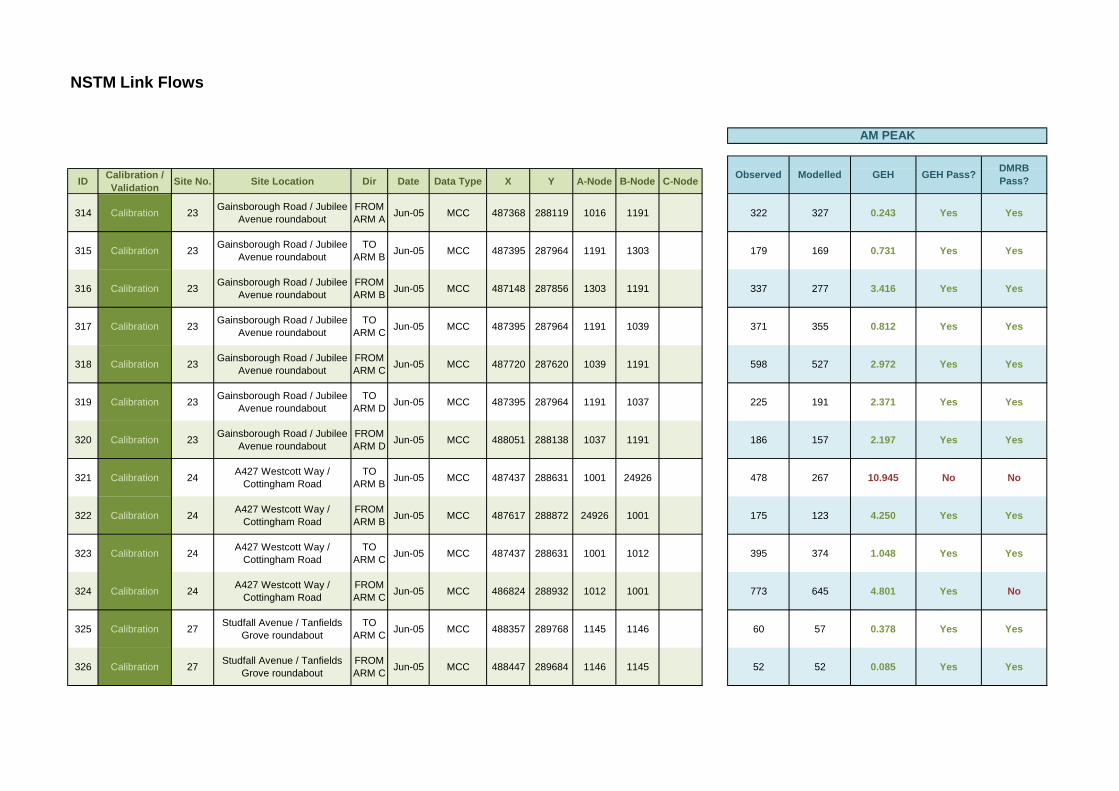
NSTM Link Flows
ID Calibration / Validation Site No. Site Location Dir Date Data Type X Y A-Node B-Node C-Node
AM PEAK
GEH GEH Pass? DMRB Pass?ModelledObserved
314 Calibration 23 Gainsborough Road / Jubilee Avenue roundabout
FROM ARM A Jun-05 MCC 487368 288119 1016 1191 322 327 0.243 Yes Yes
315 Calibration 23 Gainsborough Road / Jubilee Avenue roundabout
TO ARM B Jun-05 MCC 487395 287964 1191 1303 179 169 0.731 Yes Yes
316 Calibration 23 Gainsborough Road / Jubilee Avenue roundabout
FROM ARM B Jun-05 MCC 487148 287856 1303 1191 337 277 3.416 Yes Yes
317 Calibration 23 Gainsborough Road / Jubilee Avenue roundabout
TO ARM C Jun-05 MCC 487395 287964 1191 1039 371 355 0.812 Yes Yes
318 Calibration 23 Gainsborough Road / Jubilee Avenue roundabout
FROM ARM C Jun-05 MCC 487720 287620 1039 1191 598 527 2.972 Yes Yes
319 Calibration 23 Gainsborough Road / Jubilee Avenue roundabout
TO ARM D Jun-05 MCC 487395 287964 1191 1037 225 191 2.371 Yes Yes
320 Calibration 23 Gainsborough Road / Jubilee Avenue roundabout
FROM ARM D Jun-05 MCC 488051 288138 1037 1191 186 157 2.197 Yes Yes
321 Calibration 24 A427 Westcott Way / Cottingham Road
TO ARM B Jun-05 MCC 487437 288631 1001 24926 478 267 10.945 No No
322 Calibration 24 A427 Westcott Way / Cottingham Road
FROM ARM B Jun-05 MCC 487617 288872 24926 1001 175 123 4.250 Yes Yes
323 Calibration 24 A427 Westcott Way / Cottingham Road
TO ARM C Jun-05 MCC 487437 288631 1001 1012 395 374 1.048 Yes Yes
324 Calibration 24 A427 Westcott Way / Cottingham Road
FROM ARM C Jun-05 MCC 486824 288932 1012 1001 773 645 4.801 Yes No
325 Calibration 27 Studfall Avenue / Tanfields Grove roundabout
TO ARM C Jun-05 MCC 488357 289768 1145 1146 60 57 0.378 Yes Yes
326 Calibration 27 Studfall Avenue / Tanfields Grove roundabout
FROM ARM C Jun-05 MCC 488447 289684 1146 1145 52 52 0.085 Yes Yes

NSTM Link Flows
ID Calibration / Validation Site No. Site Location Dir Date Data Type X Y A-Node B-Node C-Node
AM PEAK
GEH GEH Pass? DMRB Pass?ModelledObserved
327 Calibration 27 Studfall Avenue / Tanfields Grove roundabout
TO ARM D Jun-05 MCC 488357 289768 1145 1298 207 203 0.275 Yes Yes
328 Calibration 27 Studfall Avenue / Tanfields Grove roundabout
FROM ARM D Jun-05 MCC 488514 290045 1298 1145 147 115 2.817 Yes Yes
329 Calibration 28 Pascal Close / Rockingham Road / Studfall Avenue
TO ARM B Jun-05 MCC 488562 290147 1208 1292 347 337 0.568 Yes Yes
330 Calibration 28 Pascal Close / Rockingham Road / Studfall Avenue
FROM ARM B Jun-05 MCC 488459 290273 1292 1208 307 319 0.690 Yes Yes
331 Calibration 28 Pascal Close / Rockingham Road / Studfall Avenue
TO ARM C Jun-05 MCC 488562 290147 1208 1298 135 115 1.796 Yes Yes
332 Calibration 28 Pascal Close / Rockingham Road / Studfall Avenue
FROM ARM C Jun-05 MCC 488514 290045 1298 1208 217 204 0.854 Yes Yes
333 Calibration 28 Pascal Close / Rockingham Road / Studfall Avenue
TO ARM D Jun-05 MCC 488562 290147 1208 24948 256 251 0.308 Yes Yes
334 Calibration 28 Pascal Close / Rockingham Road / Studfall Avenue
FROM ARM D Jun-05 MCC 488826 290117 24948 1208 187 179 0.627 Yes Yes
335 Calibration 30 Rockingham Road / Lloyds Road roundabout
TO ARM A Jun-05 MCC 489434 289100 1203 1310 259 247 0.726 Yes Yes
336 Calibration 30 Rockingham Road / Lloyds Road roundabout
FROM ARM A Jun-05 MCC 489295 289365 1310 1203 387 377 0.480 Yes Yes
337 Calibration 30 Rockingham Road / Lloyds Road roundabout
TO ARM B Jun-05 MCC 489434 289100 1203 24876 207 87 9.935 No No
338 Calibration 30 Rockingham Road / Lloyds Road roundabout
FROM ARM B Jun-05 MCC 489331 288842 24876 1203 364 201 9.678 No No
339 Calibration 30 Rockingham Road / Lloyds Road roundabout
TO ARM C Jun-05 MCC 489434 289100 1203 1202 582 523 2.493 Yes Yes

NSTM Link Flows
ID Calibration / Validation Site No. Site Location Dir Date Data Type X Y A-Node B-Node C-Node
AM PEAK
GEH GEH Pass? DMRB Pass?ModelledObserved
340 Calibration 30 Rockingham Road / Lloyds Road roundabout
FROM ARM C Jun-05 MCC 489632 289161 1202 1203 296 278 1.086 Yes Yes
341 Calibration 31 Phoenix Parkway / Lloyds Road
TO ARM C Jun-05 MCC 489632 289161 1202 1201 505 463 1.909 Yes Yes
342 Calibration 31 Phoenix Parkway / Lloyds Road
FROM ARM C Jun-05 MCC 489934 288800 1201 1202 741 697 1.631 Yes Yes
343 Calibration 32 Station Road / Weldon Road / St. Marks Road
TO ARM A Jun-05 MCC 489351 288614 26050 1165 240 210 2.001 Yes Yes
344 Calibration 32 Station Road / Weldon Road / St. Marks Road
FROM ARM A Jun-05 MCC 489253 288830 1165 26050 125 83 4.156 Yes Yes
345 Calibration 32 Station Road / Weldon Road / St. Marks Road
TO ARM B Jun-05 MCC 489368 288577 1167 1041 655 630 0.991 Yes Yes
346 Calibration 32 Station Road / Weldon Road / St. Marks Road
FROM ARM B Jun-05 MCC 488700 288283 1041 1167 1216 1190 0.747 Yes Yes
347 Calibration 32 Station Road / Weldon Road / St. Marks Road
TO ARM C Jun-05 MCC 489368 288577 1167 1263 100 99 0.119 Yes Yes
348 Calibration 32 Station Road / Weldon Road / St. Marks Road
FROM ARM C Jun-05 MCC 489319 288391 1263 1167 64 63 0.059 Yes Yes
349 Calibration 32 Station Road / Weldon Road / St. Marks Road
TO ARM D Jun-05 MCC 489418 288591 26051 3002 1185 1163 0.647 Yes Yes
350 Calibration 32 Station Road / Weldon Road / St. Marks Road
FROM ARM D Jun-05 MCC 489801 288698 3002 26051 776 766 0.349 Yes Yes
351 Calibration 33 A427 / A6086 / A6116 roundabout
TO ARM C Jun-05 MCC 489934 288800 1201 35001 410 357 2.702 Yes Yes
352 Calibration 33 A427 / A6086 / A6116 roundabout
FROM ARM C Jun-05 MCC 491094 287958 35001 1201 738 700 1.420 Yes Yes
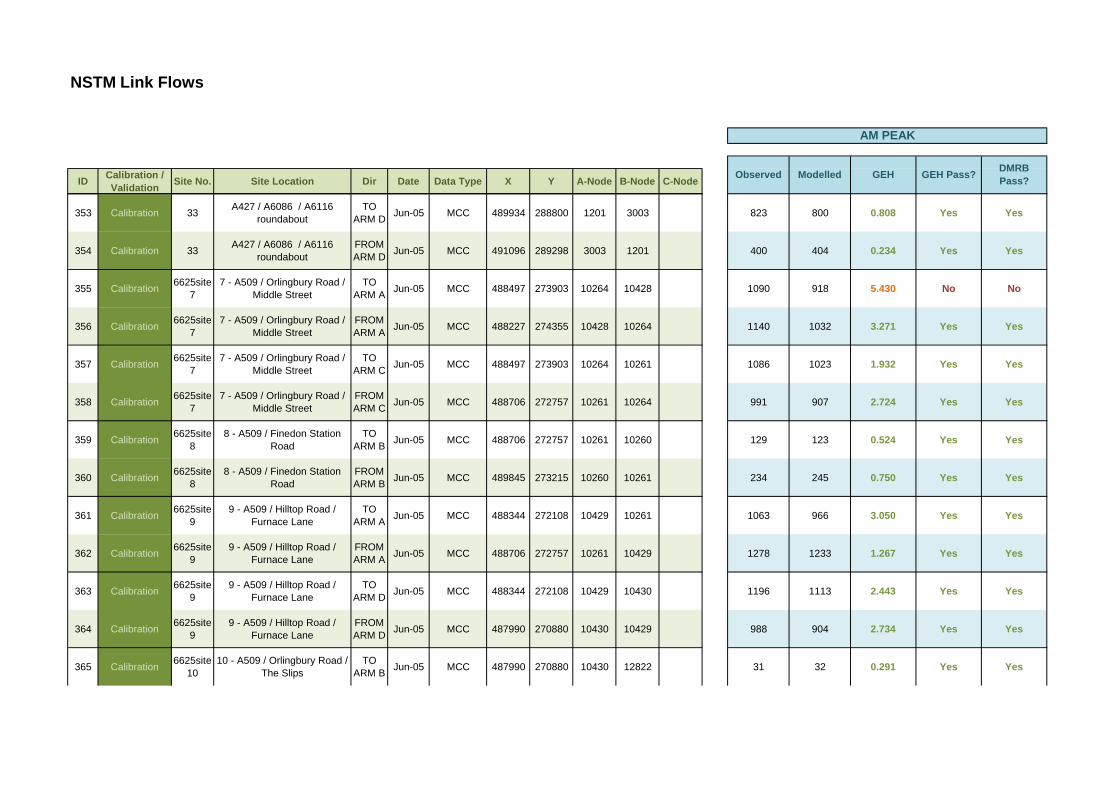
NSTM Link Flows
ID Calibration / Validation Site No. Site Location Dir Date Data Type X Y A-Node B-Node C-Node
AM PEAK
GEH GEH Pass? DMRB Pass?ModelledObserved
353 Calibration 33 A427 / A6086 / A6116 roundabout
TO ARM D Jun-05 MCC 489934 288800 1201 3003 823 800 0.808 Yes Yes
354 Calibration 33 A427 / A6086 / A6116 roundabout
FROM ARM D Jun-05 MCC 491096 289298 3003 1201 400 404 0.234 Yes Yes
355 Calibration 6625site7
7 - A509 / Orlingbury Road / Middle Street
TO ARM A Jun-05 MCC 488497 273903 10264 10428 1090 918 5.430 No No
356 Calibration 6625site7
7 - A509 / Orlingbury Road / Middle Street
FROM ARM A Jun-05 MCC 488227 274355 10428 10264 1140 1032 3.271 Yes Yes
357 Calibration 6625site7
7 - A509 / Orlingbury Road / Middle Street
TO ARM C Jun-05 MCC 488497 273903 10264 10261 1086 1023 1.932 Yes Yes
358 Calibration 6625site7
7 - A509 / Orlingbury Road / Middle Street
FROM ARM C Jun-05 MCC 488706 272757 10261 10264 991 907 2.724 Yes Yes
359 Calibration 6625site8
8 - A509 / Finedon Station Road
TO ARM B Jun-05 MCC 488706 272757 10261 10260 129 123 0.524 Yes Yes
360 Calibration 6625site8
8 - A509 / Finedon Station Road
FROM ARM B Jun-05 MCC 489845 273215 10260 10261 234 245 0.750 Yes Yes
361 Calibration 6625site9
9 - A509 / Hilltop Road / Furnace Lane
TO ARM A Jun-05 MCC 488344 272108 10429 10261 1063 966 3.050 Yes Yes
362 Calibration 6625site9
9 - A509 / Hilltop Road / Furnace Lane
FROM ARM A Jun-05 MCC 488706 272757 10261 10429 1278 1233 1.267 Yes Yes
363 Calibration 6625site9
9 - A509 / Hilltop Road / Furnace Lane
TO ARM D Jun-05 MCC 488344 272108 10429 10430 1196 1113 2.443 Yes Yes
364 Calibration 6625site9
9 - A509 / Hilltop Road / Furnace Lane
FROM ARM D Jun-05 MCC 487990 270880 10430 10429 988 904 2.734 Yes Yes
365 Calibration 6625site10
10 - A509 / Orlingbury Road / The Slips
TO ARM B Jun-05 MCC 487990 270880 10430 12822 31 32 0.291 Yes Yes

NSTM Link Flows
ID Calibration / Validation Site No. Site Location Dir Date Data Type X Y A-Node B-Node C-Node
AM PEAK
GEH GEH Pass? DMRB Pass?ModelledObserved
366 Calibration 6625site10
10 - A509 / Orlingbury Road / The Slips
FROM ARM B Jun-05 MCC 491424 271451 12822 10430 18 17 0.216 Yes Yes
367 Calibration 6625site11
11 - A509 / A510 Northen Way / Niort Way
TO ARM C Jun-05 MCC 488260 269710 10155 12805 785 629 5.850 No No
368 Calibration 6625site11
11 - A509 / A510 Northen Way / Niort Way
FROM ARM C Jun-05 MCC 488602 269773 12805 10155 503 462 1.904 Yes Yes
369 Calibration 6625site11
11 - A509 / A510 Northen Way / Niort Way
TO ARM D Jun-05 MCC 488260 269710 10155 11415 541 549 0.345 Yes Yes
370 Calibration 6625site11
11 - A509 / A510 Northen Way / Niort Way
FROM ARM D Jun-05 MCC 488483 269290 11415 10155 609 612 0.104 Yes Yes
371 Calibration 6625site11
11 - A509 / A510 Northen Way / Niort Way
TO ARM E Jun-05 MCC 488260 269710 10155 11256 928 830 3.288 Yes Yes
372 Calibration 6625site11
11 - A509 / A510 Northen Way / Niort Way
FROM ARM E Jun-05 MCC 487530 269580 11256 10155 800 753 1.661 Yes Yes
373 Calibration 6625site12
12 - A509 Wilby Way / Bourton Way / A45
TO ARM A Jun-05 MCC 488032 265867 10162 10161 1152 1107 1.326 Yes Yes
374 Calibration 6625site12
12 - A509 Wilby Way / Bourton Way / A45
FROM ARM A Jun-05 MCC 487700 266333 10161 10162 1184 1153 0.925 Yes Yes
375 Calibration 6625site12
12 - A509 Wilby Way / Bourton Way / A45
TO ARM B Jun-05 MCC 488032 265867 10162 12908 112 112 0.007 Yes Yes
376 Calibration 6625site12
12 - A509 Wilby Way / Bourton Way / A45
FROM ARM B Jun-05 MCC 488095 266139 12908 10162 324 240 4.990 Yes Yes
377 Calibration 6625site12
12 - A509 Wilby Way / Bourton Way / A45
TO ARM C Jun-05 MCC 488032 265867 10162 10288 1838 1752 2.042 Yes Yes
378 Calibration 6625site12
12 - A509 Wilby Way / Bourton Way / A45
FROM ARM C Jun-05 MCC 488770 265920 10288 10162 2591 2497 1.852 Yes Yes
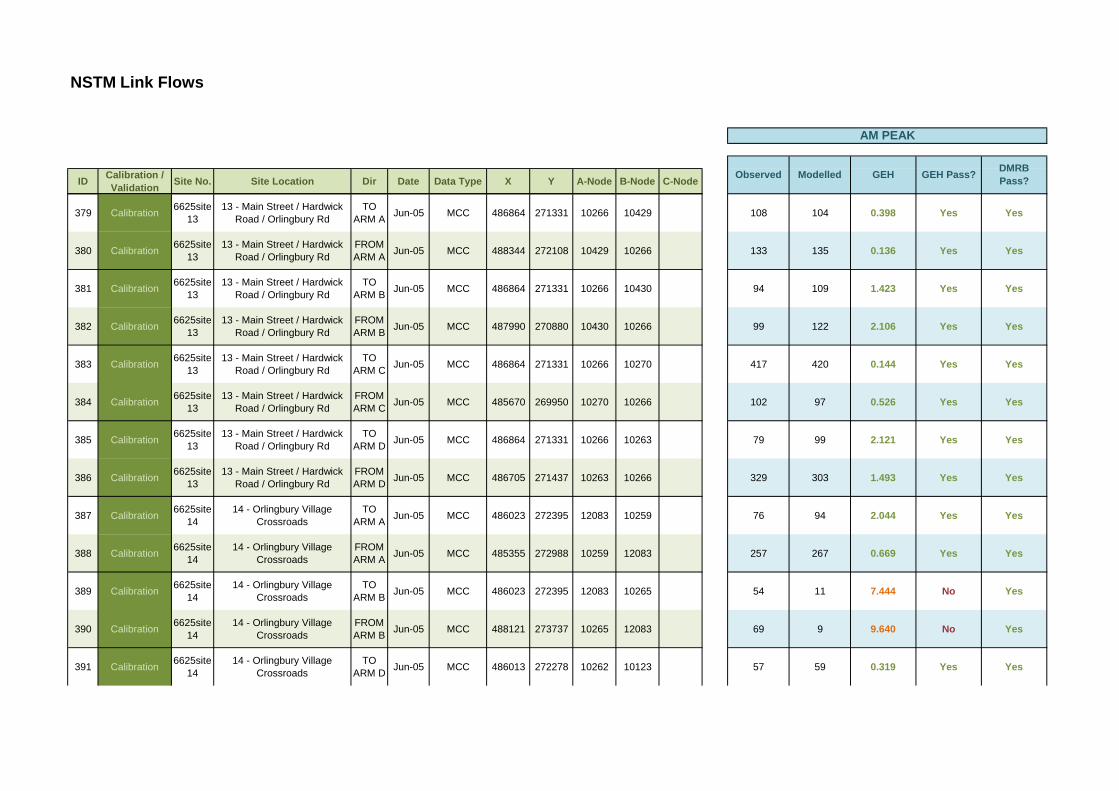
NSTM Link Flows
ID Calibration / Validation Site No. Site Location Dir Date Data Type X Y A-Node B-Node C-Node
AM PEAK
GEH GEH Pass? DMRB Pass?ModelledObserved
379 Calibration 6625site13
13 - Main Street / Hardwick Road / Orlingbury Rd
TO ARM A Jun-05 MCC 486864 271331 10266 10429 108 104 0.398 Yes Yes
380 Calibration 6625site13
13 - Main Street / Hardwick Road / Orlingbury Rd
FROM ARM A Jun-05 MCC 488344 272108 10429 10266 133 135 0.136 Yes Yes
381 Calibration 6625site13
13 - Main Street / Hardwick Road / Orlingbury Rd
TO ARM B Jun-05 MCC 486864 271331 10266 10430 94 109 1.423 Yes Yes
382 Calibration 6625site13
13 - Main Street / Hardwick Road / Orlingbury Rd
FROM ARM B Jun-05 MCC 487990 270880 10430 10266 99 122 2.106 Yes Yes
383 Calibration 6625site13
13 - Main Street / Hardwick Road / Orlingbury Rd
TO ARM C Jun-05 MCC 486864 271331 10266 10270 417 420 0.144 Yes Yes
384 Calibration 6625site13
13 - Main Street / Hardwick Road / Orlingbury Rd
FROM ARM C Jun-05 MCC 485670 269950 10270 10266 102 97 0.526 Yes Yes
385 Calibration 6625site13
13 - Main Street / Hardwick Road / Orlingbury Rd
TO ARM D Jun-05 MCC 486864 271331 10266 10263 79 99 2.121 Yes Yes
386 Calibration 6625site13
13 - Main Street / Hardwick Road / Orlingbury Rd
FROM ARM D Jun-05 MCC 486705 271437 10263 10266 329 303 1.493 Yes Yes
387 Calibration 6625site14
14 - Orlingbury Village Crossroads
TO ARM A Jun-05 MCC 486023 272395 12083 10259 76 94 2.044 Yes Yes
388 Calibration 6625site14
14 - Orlingbury Village Crossroads
FROM ARM A Jun-05 MCC 485355 272988 10259 12083 257 267 0.669 Yes Yes
389 Calibration 6625site14
14 - Orlingbury Village Crossroads
TO ARM B Jun-05 MCC 486023 272395 12083 10265 54 11 7.444 No Yes
390 Calibration 6625site14
14 - Orlingbury Village Crossroads
FROM ARM B Jun-05 MCC 488121 273737 10265 12083 69 9 9.640 No Yes
391 Calibration 6625site14
14 - Orlingbury Village Crossroads
TO ARM D Jun-05 MCC 486013 272278 10262 10123 57 59 0.319 Yes Yes
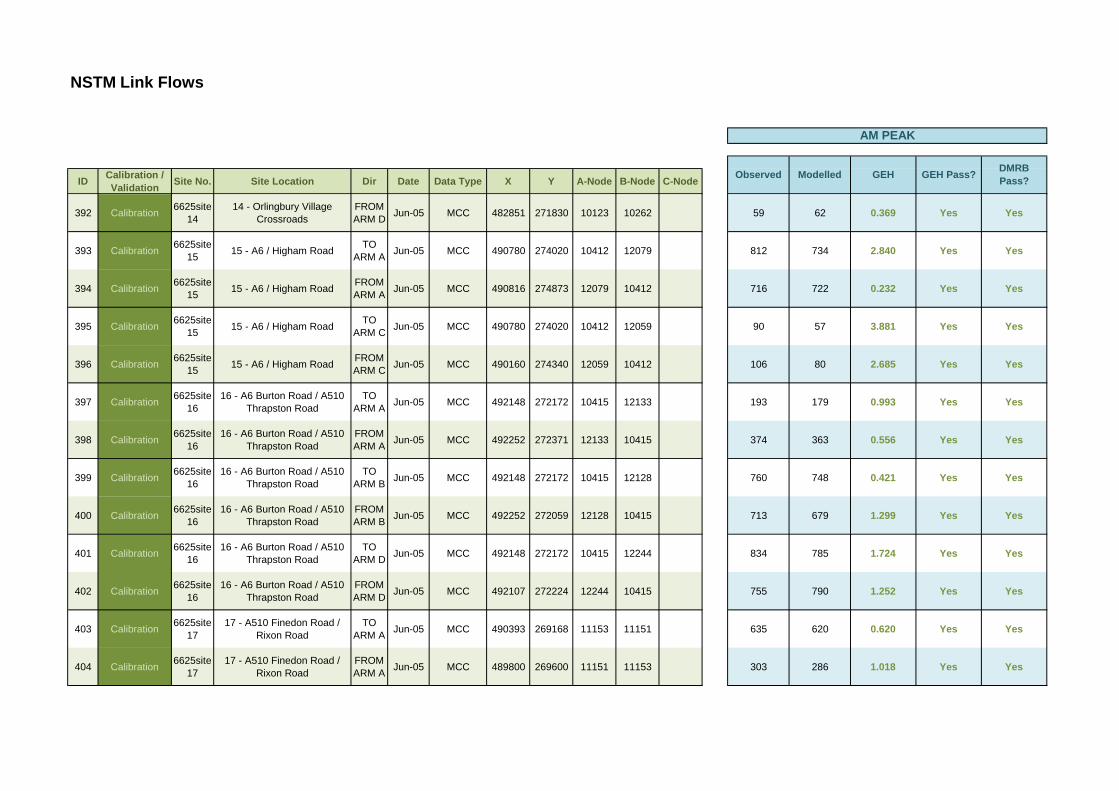
NSTM Link Flows
ID Calibration / Validation Site No. Site Location Dir Date Data Type X Y A-Node B-Node C-Node
AM PEAK
GEH GEH Pass? DMRB Pass?ModelledObserved
392 Calibration 6625site14
14 - Orlingbury Village Crossroads
FROM ARM D Jun-05 MCC 482851 271830 10123 10262 59 62 0.369 Yes Yes
393 Calibration 6625site15 15 - A6 / Higham Road TO
ARM A Jun-05 MCC 490780 274020 10412 12079 812 734 2.840 Yes Yes
394 Calibration 6625site15 15 - A6 / Higham Road FROM
ARM A Jun-05 MCC 490816 274873 12079 10412 716 722 0.232 Yes Yes
395 Calibration 6625site15 15 - A6 / Higham Road TO
ARM C Jun-05 MCC 490780 274020 10412 12059 90 57 3.881 Yes Yes
396 Calibration 6625site15 15 - A6 / Higham Road FROM
ARM C Jun-05 MCC 490160 274340 12059 10412 106 80 2.685 Yes Yes
397 Calibration 6625site16
16 - A6 Burton Road / A510 Thrapston Road
TO ARM A Jun-05 MCC 492148 272172 10415 12133 193 179 0.993 Yes Yes
398 Calibration 6625site16
16 - A6 Burton Road / A510 Thrapston Road
FROM ARM A Jun-05 MCC 492252 272371 12133 10415 374 363 0.556 Yes Yes
399 Calibration 6625site16
16 - A6 Burton Road / A510 Thrapston Road
TO ARM B Jun-05 MCC 492148 272172 10415 12128 760 748 0.421 Yes Yes
400 Calibration 6625site16
16 - A6 Burton Road / A510 Thrapston Road
FROM ARM B Jun-05 MCC 492252 272059 12128 10415 713 679 1.299 Yes Yes
401 Calibration 6625site16
16 - A6 Burton Road / A510 Thrapston Road
TO ARM D Jun-05 MCC 492148 272172 10415 12244 834 785 1.724 Yes Yes
402 Calibration 6625site16
16 - A6 Burton Road / A510 Thrapston Road
FROM ARM D Jun-05 MCC 492107 272224 12244 10415 755 790 1.252 Yes Yes
403 Calibration 6625site17
17 - A510 Finedon Road / Rixon Road
TO ARM A Jun-05 MCC 490393 269168 11153 11151 635 620 0.620 Yes Yes
404 Calibration 6625site17
17 - A510 Finedon Road / Rixon Road
FROM ARM A Jun-05 MCC 489800 269600 11151 11153 303 286 1.018 Yes Yes
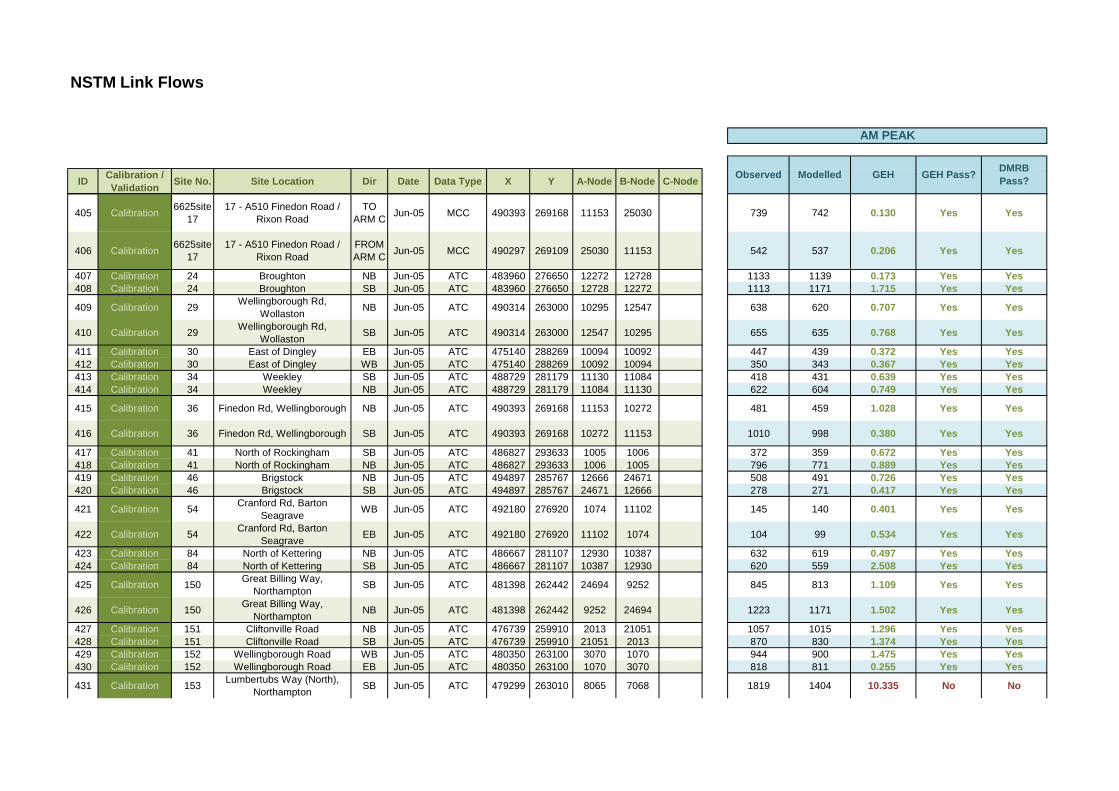
NSTM Link Flows
ID Calibration / Validation Site No. Site Location Dir Date Data Type X Y A-Node B-Node C-Node
AM PEAK
GEH GEH Pass? DMRB Pass?ModelledObserved
405 Calibration 6625site17
17 - A510 Finedon Road / Rixon Road
TO ARM C Jun-05 MCC 490393 269168 11153 25030 739 742 0.130 Yes Yes
406 Calibration 6625site17
17 - A510 Finedon Road / Rixon Road
FROM ARM C Jun-05 MCC 490297 269109 25030 11153 542 537 0.206 Yes Yes
407 Calibration 24 Broughton NB Jun-05 ATC 483960 276650 12272 12728 1133 1139 0.173 Yes Yes408 Calibration 24 Broughton SB Jun-05 ATC 483960 276650 12728 12272 1113 1171 1.715 Yes Yes
409 Calibration 29 Wellingborough Rd, Wollaston NB Jun-05 ATC 490314 263000 10295 12547 638 620 0.707 Yes Yes
410 Calibration 29 Wellingborough Rd, Wollaston SB Jun-05 ATC 490314 263000 12547 10295 655 635 0.768 Yes Yes
411 Calibration 30 East of Dingley EB Jun-05 ATC 475140 288269 10094 10092 447 439 0.372 Yes Yes412 Calibration 30 East of Dingley WB Jun-05 ATC 475140 288269 10092 10094 350 343 0.367 Yes Yes413 Calibration 34 Weekley SB Jun-05 ATC 488729 281179 11130 11084 418 431 0.639 Yes Yes414 Calibration 34 Weekley NB Jun-05 ATC 488729 281179 11084 11130 622 604 0.749 Yes Yes
415 Calibration 36 Finedon Rd, Wellingborough NB Jun-05 ATC 490393 269168 11153 10272 481 459 1.028 Yes Yes
416 Calibration 36 Finedon Rd, Wellingborough SB Jun-05 ATC 490393 269168 10272 11153 1010 998 0.380 Yes Yes
417 Calibration 41 North of Rockingham SB Jun-05 ATC 486827 293633 1005 1006 372 359 0.672 Yes Yes418 Calibration 41 North of Rockingham NB Jun-05 ATC 486827 293633 1006 1005 796 771 0.889 Yes Yes419 Calibration 46 Brigstock NB Jun-05 ATC 494897 285767 12666 24671 508 491 0.726 Yes Yes420 Calibration 46 Brigstock SB Jun-05 ATC 494897 285767 24671 12666 278 271 0.417 Yes Yes
421 Calibration 54 Cranford Rd, Barton Seagrave WB Jun-05 ATC 492180 276920 1074 11102 145 140 0.401 Yes Yes
422 Calibration 54 Cranford Rd, Barton Seagrave EB Jun-05 ATC 492180 276920 11102 1074 104 99 0.534 Yes Yes
423 Calibration 84 North of Kettering NB Jun-05 ATC 486667 281107 12930 10387 632 619 0.497 Yes Yes424 Calibration 84 North of Kettering SB Jun-05 ATC 486667 281107 10387 12930 620 559 2.508 Yes Yes
425 Calibration 150 Great Billing Way, Northampton SB Jun-05 ATC 481398 262442 24694 9252 845 813 1.109 Yes Yes
426 Calibration 150 Great Billing Way, Northampton NB Jun-05 ATC 481398 262442 9252 24694 1223 1171 1.502 Yes Yes
427 Calibration 151 Cliftonville Road NB Jun-05 ATC 476739 259910 2013 21051 1057 1015 1.296 Yes Yes428 Calibration 151 Cliftonville Road SB Jun-05 ATC 476739 259910 21051 2013 870 830 1.374 Yes Yes429 Calibration 152 Wellingborough Road WB Jun-05 ATC 480350 263100 3070 1070 944 900 1.475 Yes Yes430 Calibration 152 Wellingborough Road EB Jun-05 ATC 480350 263100 1070 3070 818 811 0.255 Yes Yes
431 Calibration 153 Lumbertubs Way (North), Northampton SB Jun-05 ATC 479299 263010 8065 7068 1819 1404 10.335 No No
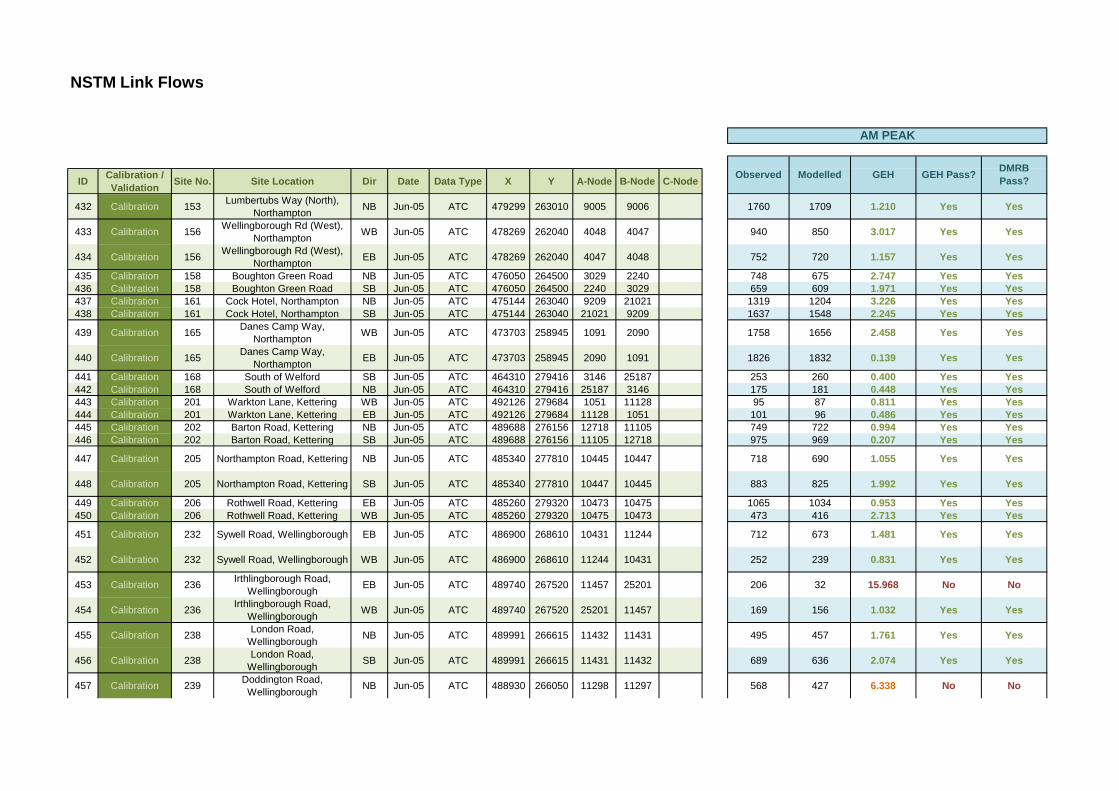
NSTM Link Flows
ID Calibration / Validation Site No. Site Location Dir Date Data Type X Y A-Node B-Node C-Node
AM PEAK
GEH GEH Pass? DMRB Pass?ModelledObserved
432 Calibration 153 Lumbertubs Way (North), Northampton NB Jun-05 ATC 479299 263010 9005 9006 1760 1709 1.210 Yes Yes
433 Calibration 156 Wellingborough Rd (West), Northampton WB Jun-05 ATC 478269 262040 4048 4047 940 850 3.017 Yes Yes
434 Calibration 156 Wellingborough Rd (West), Northampton EB Jun-05 ATC 478269 262040 4047 4048 752 720 1.157 Yes Yes
435 Calibration 158 Boughton Green Road NB Jun-05 ATC 476050 264500 3029 2240 748 675 2.747 Yes Yes436 Calibration 158 Boughton Green Road SB Jun-05 ATC 476050 264500 2240 3029 659 609 1.971 Yes Yes437 Calibration 161 Cock Hotel, Northampton NB Jun-05 ATC 475144 263040 9209 21021 1319 1204 3.226 Yes Yes438 Calibration 161 Cock Hotel, Northampton SB Jun-05 ATC 475144 263040 21021 9209 1637 1548 2.245 Yes Yes
439 Calibration 165 Danes Camp Way, Northampton WB Jun-05 ATC 473703 258945 1091 2090 1758 1656 2.458 Yes Yes
440 Calibration 165 Danes Camp Way, Northampton EB Jun-05 ATC 473703 258945 2090 1091 1826 1832 0.139 Yes Yes
441 Calibration 168 South of Welford SB Jun-05 ATC 464310 279416 3146 25187 253 260 0.400 Yes Yes442 Calibration 168 South of Welford NB Jun-05 ATC 464310 279416 25187 3146 175 181 0.448 Yes Yes443 Calibration 201 Warkton Lane, Kettering WB Jun-05 ATC 492126 279684 1051 11128 95 87 0.811 Yes Yes444 Calibration 201 Warkton Lane, Kettering EB Jun-05 ATC 492126 279684 11128 1051 101 96 0.486 Yes Yes445 Calibration 202 Barton Road, Kettering NB Jun-05 ATC 489688 276156 12718 11105 749 722 0.994 Yes Yes446 Calibration 202 Barton Road, Kettering SB Jun-05 ATC 489688 276156 11105 12718 975 969 0.207 Yes Yes
447 Calibration 205 Northampton Road, Kettering NB Jun-05 ATC 485340 277810 10445 10447 718 690 1.055 Yes Yes
448 Calibration 205 Northampton Road, Kettering SB Jun-05 ATC 485340 277810 10447 10445 883 825 1.992 Yes Yes
449 Calibration 206 Rothwell Road, Kettering EB Jun-05 ATC 485260 279320 10473 10475 1065 1034 0.953 Yes Yes450 Calibration 206 Rothwell Road, Kettering WB Jun-05 ATC 485260 279320 10475 10473 473 416 2.713 Yes Yes
451 Calibration 232 Sywell Road, Wellingborough EB Jun-05 ATC 486900 268610 10431 11244 712 673 1.481 Yes Yes
452 Calibration 232 Sywell Road, Wellingborough WB Jun-05 ATC 486900 268610 11244 10431 252 239 0.831 Yes Yes
453 Calibration 236 Irthlingborough Road, Wellingborough EB Jun-05 ATC 489740 267520 11457 25201 206 32 15.968 No No
454 Calibration 236 Irthlingborough Road, Wellingborough WB Jun-05 ATC 489740 267520 25201 11457 169 156 1.032 Yes Yes
455 Calibration 238 London Road, Wellingborough NB Jun-05 ATC 489991 266615 11432 11431 495 457 1.761 Yes Yes
456 Calibration 238 London Road, Wellingborough SB Jun-05 ATC 489991 266615 11431 11432 689 636 2.074 Yes Yes
457 Calibration 239 Doddington Road, Wellingborough NB Jun-05 ATC 488930 266050 11298 11297 568 427 6.338 No No
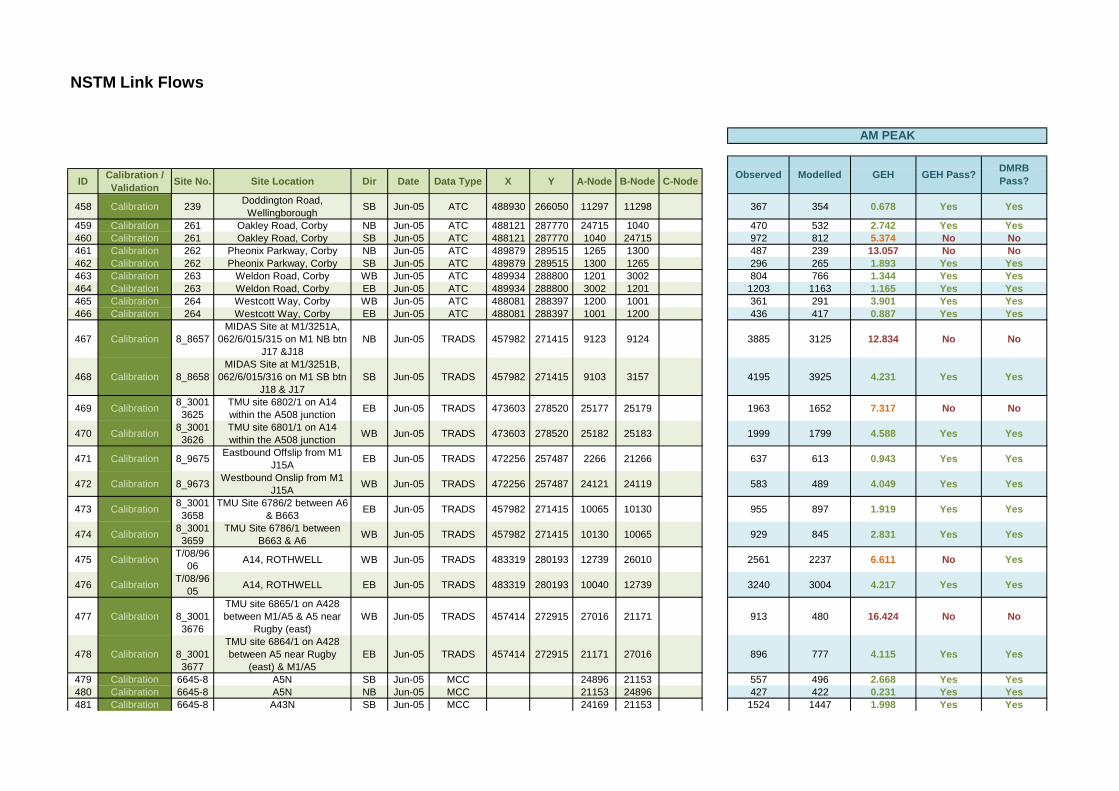
NSTM Link Flows
ID Calibration / Validation Site No. Site Location Dir Date Data Type X Y A-Node B-Node C-Node
AM PEAK
GEH GEH Pass? DMRB Pass?ModelledObserved
458 Calibration 239 Doddington Road, Wellingborough SB Jun-05 ATC 488930 266050 11297 11298 367 354 0.678 Yes Yes
459 Calibration 261 Oakley Road, Corby NB Jun-05 ATC 488121 287770 24715 1040 470 532 2.742 Yes Yes460 Calibration 261 Oakley Road, Corby SB Jun-05 ATC 488121 287770 1040 24715 972 812 5.374 No No461 Calibration 262 Pheonix Parkway, Corby NB Jun-05 ATC 489879 289515 1265 1300 487 239 13.057 No No462 Calibration 262 Pheonix Parkway, Corby SB Jun-05 ATC 489879 289515 1300 1265 296 265 1.893 Yes Yes463 Calibration 263 Weldon Road, Corby WB Jun-05 ATC 489934 288800 1201 3002 804 766 1.344 Yes Yes464 Calibration 263 Weldon Road, Corby EB Jun-05 ATC 489934 288800 3002 1201 1203 1163 1.165 Yes Yes465 Calibration 264 Westcott Way, Corby WB Jun-05 ATC 488081 288397 1200 1001 361 291 3.901 Yes Yes466 Calibration 264 Westcott Way, Corby EB Jun-05 ATC 488081 288397 1001 1200 436 417 0.887 Yes Yes
467 Calibration 8_8657MIDAS Site at M1/3251A,
062/6/015/315 on M1 NB btn J17 &J18
NB Jun-05 TRADS 457982 271415 9123 9124 3885 3125 12.834 No No
468 Calibration 8_8658MIDAS Site at M1/3251B,
062/6/015/316 on M1 SB btn J18 & J17
SB Jun-05 TRADS 457982 271415 9103 3157 4195 3925 4.231 Yes Yes
469 Calibration 8_30013625
TMU site 6802/1 on A14 within the A508 junction EB Jun-05 TRADS 473603 278520 25177 25179 1963 1652 7.317 No No
470 Calibration 8_30013626
TMU site 6801/1 on A14 within the A508 junction WB Jun-05 TRADS 473603 278520 25182 25183 1999 1799 4.588 Yes Yes
471 Calibration 8_9675 Eastbound Offslip from M1 J15A EB Jun-05 TRADS 472256 257487 2266 21266 637 613 0.943 Yes Yes
472 Calibration 8_9673 Westbound Onslip from M1 J15A WB Jun-05 TRADS 472256 257487 24121 24119 583 489 4.049 Yes Yes
473 Calibration 8_30013658
TMU Site 6786/2 between A6 & B663 EB Jun-05 TRADS 457982 271415 10065 10130 955 897 1.919 Yes Yes
474 Calibration 8_30013659
TMU Site 6786/1 between B663 & A6 WB Jun-05 TRADS 457982 271415 10130 10065 929 845 2.831 Yes Yes
475 Calibration T/08/9606 A14, ROTHWELL WB Jun-05 TRADS 483319 280193 12739 26010 2561 2237 6.611 No Yes
476 Calibration T/08/9605 A14, ROTHWELL EB Jun-05 TRADS 483319 280193 10040 12739 3240 3004 4.217 Yes Yes
477 Calibration
8_30013676
TMU site 6865/1 on A428 between M1/A5 & A5 near
Rugby (east)WB Jun-05 TRADS 457414 272915 27016 21171 913 480 16.424 No No
478 Calibration
8_30013677
TMU site 6864/1 on A428 between A5 near Rugby
(east) & M1/A5EB Jun-05 TRADS 457414 272915 21171 27016 896 777 4.115 Yes Yes
479 Calibration 6645-8 A5N SB Jun-05 MCC 24896 21153 557 496 2.668 Yes Yes480 Calibration 6645-8 A5N NB Jun-05 MCC 21153 24896 427 422 0.231 Yes Yes481 Calibration 6645-8 A43N SB Jun-05 MCC 24169 21153 1524 1447 1.998 Yes Yes
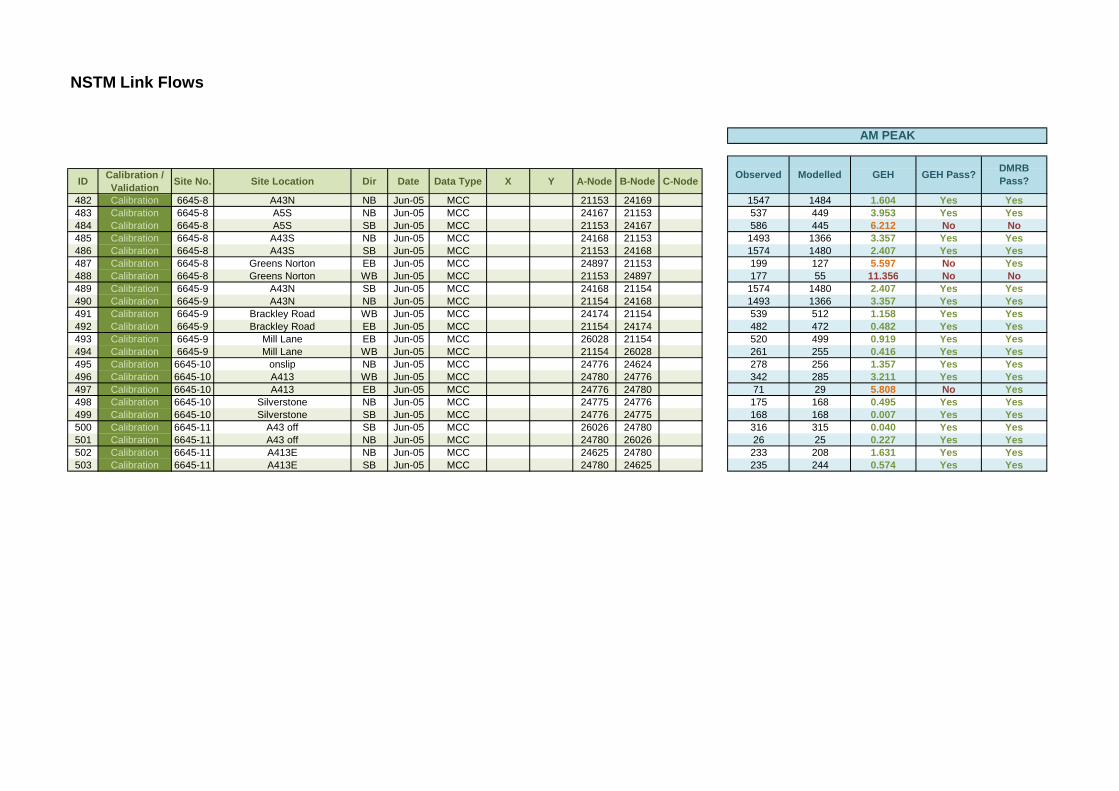
NSTM Link Flows
ID Calibration / Validation Site No. Site Location Dir Date Data Type X Y A-Node B-Node C-Node
AM PEAK
GEH GEH Pass? DMRB Pass?ModelledObserved
482 Calibration 6645-8 A43N NB Jun-05 MCC 21153 24169 1547 1484 1.604 Yes Yes483 Calibration 6645-8 A5S NB Jun-05 MCC 24167 21153 537 449 3.953 Yes Yes484 Calibration 6645-8 A5S SB Jun-05 MCC 21153 24167 586 445 6.212 No No485 Calibration 6645-8 A43S NB Jun-05 MCC 24168 21153 1493 1366 3.357 Yes Yes486 Calibration 6645-8 A43S SB Jun-05 MCC 21153 24168 1574 1480 2.407 Yes Yes487 Calibration 6645-8 Greens Norton EB Jun-05 MCC 24897 21153 199 127 5.597 No Yes488 Calibration 6645-8 Greens Norton WB Jun-05 MCC 21153 24897 177 55 11.356 No No489 Calibration 6645-9 A43N SB Jun-05 MCC 24168 21154 1574 1480 2.407 Yes Yes490 Calibration 6645-9 A43N NB Jun-05 MCC 21154 24168 1493 1366 3.357 Yes Yes491 Calibration 6645-9 Brackley Road WB Jun-05 MCC 24174 21154 539 512 1.158 Yes Yes492 Calibration 6645-9 Brackley Road EB Jun-05 MCC 21154 24174 482 472 0.482 Yes Yes493 Calibration 6645-9 Mill Lane EB Jun-05 MCC 26028 21154 520 499 0.919 Yes Yes494 Calibration 6645-9 Mill Lane WB Jun-05 MCC 21154 26028 261 255 0.416 Yes Yes495 Calibration 6645-10 onslip NB Jun-05 MCC 24776 24624 278 256 1.357 Yes Yes496 Calibration 6645-10 A413 WB Jun-05 MCC 24780 24776 342 285 3.211 Yes Yes497 Calibration 6645-10 A413 EB Jun-05 MCC 24776 24780 71 29 5.808 No Yes498 Calibration 6645-10 Silverstone NB Jun-05 MCC 24775 24776 175 168 0.495 Yes Yes499 Calibration 6645-10 Silverstone SB Jun-05 MCC 24776 24775 168 168 0.007 Yes Yes500 Calibration 6645-11 A43 off SB Jun-05 MCC 26026 24780 316 315 0.040 Yes Yes501 Calibration 6645-11 A43 off NB Jun-05 MCC 24780 26026 26 25 0.227 Yes Yes502 Calibration 6645-11 A413E NB Jun-05 MCC 24625 24780 233 208 1.631 Yes Yes503 Calibration 6645-11 A413E SB Jun-05 MCC 24780 24625 235 244 0.574 Yes Yes

58 NSTM - LMVR Highway Model Version 1.0
APPENDIX NO 8: PM Peak – Combined Dataset Calibration Results

NSTM Link Summary
Acceptability Guideline
Observed Modelled< 700 vph ±100 vph > 85 % of links 301 270 90% 0 0 100%
700 - 2,700 vph ±15% > 85 % of links 184 173 94% 0 0 100%
> 2,700 vph ±400 vph > 85 % of links 18 15 83% 0 0 100%All (or nearly all)
screenlines 14 12 86%
> 85 % of links 503 450 89% 0 0 100%
All (or nearly all) screenlines 14 11 79%
Observed Modelled GEH GEH Pass?
DMRB Pass?
8299 7969 3.661 Yes Yes9495 8804 7.223 No No7828 7491 3.85 Yes Yes9800 9137 6.81 No No7426 7150 3.239 Yes Yes7076 6688 4.676 No Yes7786 7524 2.99 Yes Yes7658 7324 3.851 Yes Yes4112 3965 2.311 Yes Yes3907 3704 3.29 Yes Yes5883 5598 3.76 Yes Yes5057 5088 0.425 Yes Yes3910 3949 0.612 Yes Yes4996 5169 2.424 Yes Yes
1 - City Centre (Outbound)
Screenline
1 - City Centre (Inbound)
GEH CriteriaGEH Statistic for individual links
< 5GEH Statistic for screenline
totals < 4
GEH < 2GEH < 4GEH < 6GEH < 8GEH < 10
Criteria and Measure
Flow Criteria
Total screenline flows within ±5%
%
CALIBRATION
PM PEAK
GEH Range VALIDATION
VALIDATION
Total Model % Total Model
CALIBRATION
69%
94% #DIV/0!96% #DIV/0!
#DIV/0!86% #DIV/0!92% #DIV/0!
2 - Outer Northants Cordon (Inbound)2 - Outer Northants Cordon (Outbound)
3 - N-S Screenline (Eastbound)3 - N-S Screenline (Westbound)4 - E-S Screenline (Northound)
7 -Wellingborough (Inbound)7 -Wellingborough (Outbound)
4 - E-S Screenline (Southound)5 -Corby (Inbound)
5 -Corby (Outbound)6- Kettering (Inbound)
6- Kettering (Outbound)

NSTM Link Flows
ID Calibration / Validation Site No. Site Location Dir Date Data Type X Y A-Node B-Node C-Node
1 Calibration R2 A43 South of Broughton NB Jun-05 RSI/ATC 483491 276404 12273 10121 1227 1188 1.135 Yes Yes2 Calibration R2 A43 South of Broughton SB Jun-05 RSI/ATC 483491 276404 10121 12273 1153 1042 3.345 Yes Yes3 Calibration R3 A509 North of Isham NB Jun-05 RSI/ATC 488204 274399 10428 12706 1141 1103 1.139 Yes Yes4 Calibration R3 A509 North of Isham SB Jun-05 RSI/ATC 488204 274399 12706 10428 1100 984 3.607 Yes Yes5 Calibration R4 A6 North of Burton Latimer EB Jun-05 RSI/ATC 490137 275972 12714 10411 727 692 1.291 Yes Yes6 Calibration R4 A6 North of Burton Latimer WB Jun-05 RSI/ATC 490137 275972 10411 12714 872 839 1.104 Yes Yes7 Calibration R6 A43 Geddington NB Jun-05 RSI/ATC 489390 283570 11130 26024 649 639 0.393 Yes Yes8 Calibration R6 A43 Geddington SB Jun-05 RSI/ATC 489390 283570 26024 11130 909 817 3.136 Yes Yes9 Calibration R7 A6003 South of Corby NB Jun-05 RSI/ATC 485865 285531 10085 26041 1355 1421 1.764 Yes Yes10 Calibration R7 A6003 South of Corby SB Jun-05 RSI/ATC 485865 285531 26041 10085 1412 1316 2.611 Yes Yes11 Calibration R8 A6 North of Desborough SB Jun-05 RSI/ATC 475625 286588 10167 10168 595 586 0.335 Yes Yes12 Calibration R8 A6 North of Desborough NB Jun-05 RSI/ATC 475625 286588 10168 10167 572 598 1.057 Yes Yes13 Calibration R9 A510 Thrapston Rd NB Jun-05 RSI/ATC 493470 274993 12074 10250 225 219 0.395 Yes Yes14 Calibration R9 A510 Thrapston Rd SB Jun-05 RSI/ATC 493470 274993 10250 12074 207 204 0.177 Yes Yes15 Calibration R10 A6116 Near Lowick NB Jun-05 RSI/ATC 498174 280858 10177 24674 326 300 1.443 Yes Yes16 Calibration R10 A6116 Near Lowick SB Jun-05 RSI/ATC 498174 280858 24674 10177 543 463 3.568 Yes Yes17 Calibration R11 A6013 Near Gypsy Lane NB Jun-05 RSI/ATC 485344 277832 10447 10457 957 870 2.886 Yes Yes18 Calibration R11 A6013 Near Gypsy Lane SB Jun-05 RSI/ATC 485344 277832 10457 10447 772 703 2.522 Yes Yes19 Calibration R12 A4005 Wilby WB Jun-05 RSI/ATC 486787 266153 10160 10289 776 769 0.246 Yes Yes20 Calibration R12 A4005 Wilby EB Jun-05 RSI/ATC 486787 266153 10289 10160 469 690 9.174 No No
21 Calibration R13 A509 London Rd, Little Irchester NB Jun-05 RSI/ATC 490370 263987 12547 11158 782 756 0.954 Yes Yes
22 Calibration R13 A509 London Rd, Little Irchester SB Jun-05 RSI/ATC 490370 263987 11158 12547 526 510 0.702 Yes Yes
23 Calibration R14 Powel Lane, Burton Latimer NB Jun-05 RSI/ATC 489022 275833 12055 11010 235 201 2.290 Yes Yes24 Calibration R14 Powel Lane, Burton Latimer SB Jun-05 RSI/ATC 489022 275833 11010 12055 245 234 0.688 Yes Yes25 Calibration R15 A6 Bedford Rd, Rushden NB Jun-05 RSI/ATC 497190 264067 11889 11899 979 981 0.082 Yes Yes26 Calibration R15 A6 Bedford Rd, Rushden SB Jun-05 RSI/ATC 497190 264067 11899 11889 445 431 0.625 Yes Yes27 Calibration R16 A6 Irthlingborough NB Jun-05 RSI/ATC 495080 271090 12185 10417 915 861 1.787 Yes Yes28 Calibration R16 A6 Irthlingborough SB Jun-05 RSI/ATC 495080 271090 10417 12185 896 871 0.853 Yes Yes29 Calibration R17 B663 Raunds NB Jun-05 RSI/ATC 499010 273828 12264 10130 446 440 0.267 Yes Yes30 Calibration R17 B663 Raunds SB Jun-05 RSI/ATC 499010 273828 10130 12264 635 620 0.612 Yes Yes31 Calibration R18 A45 North of Raunds NB Jun-05 RSI/ATC 500030 274643 10130 10421 878 821 1.949 Yes Yes32 Calibration R18 A45 North of Raunds SB Jun-05 RSI/ATC 500030 274643 10421 10130 1070 1028 1.302 Yes Yes33 Calibration R19 A605 Thrapston NB Jun-05 RSI/ATC 501667 280523 10427 12352 699 668 1.193 Yes Yes34 Calibration R19 A605 Thrapston SB Jun-05 RSI/ATC 501667 280523 12352 10427 930 879 1.689 Yes Yes35 Calibration R20 A427 Oundle WB Jun-05 RSI/ATC 502722 288273 12685 12680 440 441 0.058 Yes Yes36 Calibration R20 A427 Oundle EB Jun-05 RSI/ATC 502722 288273 12680 12685 454 446 0.381 Yes Yes
37 Calibration R21 B571 Mill Rd, Irthlingborough SB Jun-05 RSI/ATC 492555 269206 10271 10361 277 250 1.684 Yes Yes
38 Calibration R21 B571 Mill Rd, Irthlingborough NB Jun-05 RSI/ATC 492555 269206 10361 10271 520 510 0.440 Yes Yes
Modelled GEH GEH Pass? DMRB Pass?
PM PEAK
Observed
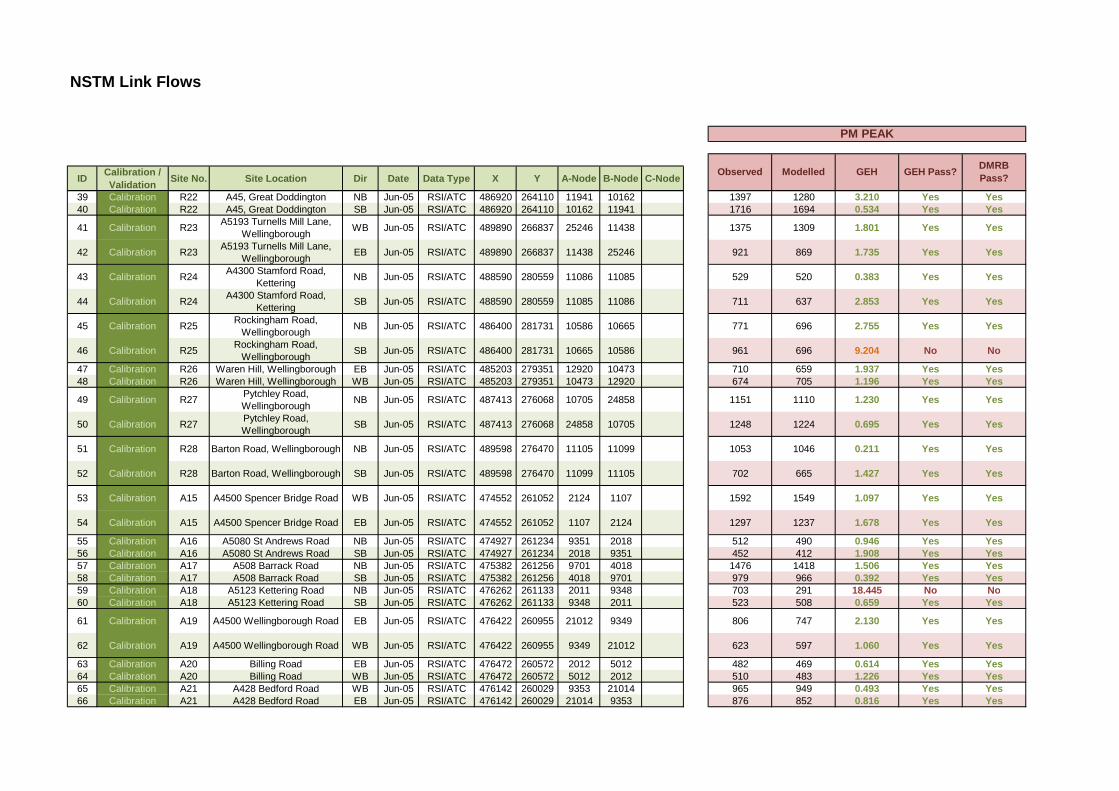
NSTM Link Flows
ID Calibration / Validation Site No. Site Location Dir Date Data Type X Y A-Node B-Node C-Node Modelled GEH GEH Pass? DMRB
Pass?
PM PEAK
Observed
39 Calibration R22 A45, Great Doddington NB Jun-05 RSI/ATC 486920 264110 11941 10162 1397 1280 3.210 Yes Yes40 Calibration R22 A45, Great Doddington SB Jun-05 RSI/ATC 486920 264110 10162 11941 1716 1694 0.534 Yes Yes
41 Calibration R23 A5193 Turnells Mill Lane, Wellingborough WB Jun-05 RSI/ATC 489890 266837 25246 11438 1375 1309 1.801 Yes Yes
42 Calibration R23 A5193 Turnells Mill Lane, Wellingborough EB Jun-05 RSI/ATC 489890 266837 11438 25246 921 869 1.735 Yes Yes
43 Calibration R24 A4300 Stamford Road, Kettering NB Jun-05 RSI/ATC 488590 280559 11086 11085 529 520 0.383 Yes Yes
44 Calibration R24 A4300 Stamford Road, Kettering SB Jun-05 RSI/ATC 488590 280559 11085 11086 711 637 2.853 Yes Yes
45 Calibration R25 Rockingham Road, Wellingborough NB Jun-05 RSI/ATC 486400 281731 10586 10665 771 696 2.755 Yes Yes
46 Calibration R25 Rockingham Road, Wellingborough SB Jun-05 RSI/ATC 486400 281731 10665 10586 961 696 9.204 No No
47 Calibration R26 Waren Hill, Wellingborough EB Jun-05 RSI/ATC 485203 279351 12920 10473 710 659 1.937 Yes Yes48 Calibration R26 Waren Hill, Wellingborough WB Jun-05 RSI/ATC 485203 279351 10473 12920 674 705 1.196 Yes Yes
49 Calibration R27 Pytchley Road, Wellingborough NB Jun-05 RSI/ATC 487413 276068 10705 24858 1151 1110 1.230 Yes Yes
50 Calibration R27 Pytchley Road, Wellingborough SB Jun-05 RSI/ATC 487413 276068 24858 10705 1248 1224 0.695 Yes Yes
51 Calibration R28 Barton Road, Wellingborough NB Jun-05 RSI/ATC 489598 276470 11105 11099 1053 1046 0.211 Yes Yes
52 Calibration R28 Barton Road, Wellingborough SB Jun-05 RSI/ATC 489598 276470 11099 11105 702 665 1.427 Yes Yes
53 Calibration A15 A4500 Spencer Bridge Road WB Jun-05 RSI/ATC 474552 261052 2124 1107 1592 1549 1.097 Yes Yes
54 Calibration A15 A4500 Spencer Bridge Road EB Jun-05 RSI/ATC 474552 261052 1107 2124 1297 1237 1.678 Yes Yes
55 Calibration A16 A5080 St Andrews Road NB Jun-05 RSI/ATC 474927 261234 9351 2018 512 490 0.946 Yes Yes56 Calibration A16 A5080 St Andrews Road SB Jun-05 RSI/ATC 474927 261234 2018 9351 452 412 1.908 Yes Yes57 Calibration A17 A508 Barrack Road NB Jun-05 RSI/ATC 475382 261256 9701 4018 1476 1418 1.506 Yes Yes58 Calibration A17 A508 Barrack Road SB Jun-05 RSI/ATC 475382 261256 4018 9701 979 966 0.392 Yes Yes59 Calibration A18 A5123 Kettering Road NB Jun-05 RSI/ATC 476262 261133 2011 9348 703 291 18.445 No No60 Calibration A18 A5123 Kettering Road SB Jun-05 RSI/ATC 476262 261133 9348 2011 523 508 0.659 Yes Yes
61 Calibration A19 A4500 Wellingborough Road EB Jun-05 RSI/ATC 476422 260955 21012 9349 806 747 2.130 Yes Yes
62 Calibration A19 A4500 Wellingborough Road WB Jun-05 RSI/ATC 476422 260955 9349 21012 623 597 1.060 Yes Yes
63 Calibration A20 Billing Road EB Jun-05 RSI/ATC 476472 260572 2012 5012 482 469 0.614 Yes Yes64 Calibration A20 Billing Road WB Jun-05 RSI/ATC 476472 260572 5012 2012 510 483 1.226 Yes Yes65 Calibration A21 A428 Bedford Road WB Jun-05 RSI/ATC 476142 260029 9353 21014 965 949 0.493 Yes Yes66 Calibration A21 A428 Bedford Road EB Jun-05 RSI/ATC 476142 260029 21014 9353 876 852 0.816 Yes Yes
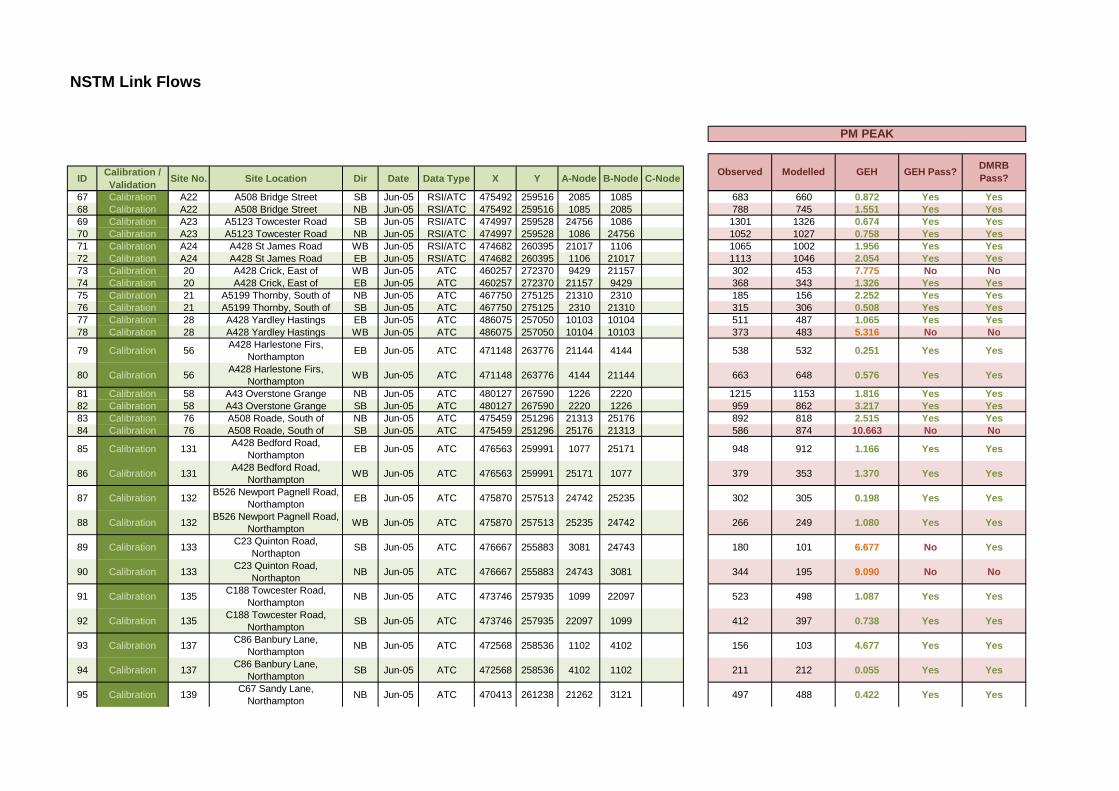
NSTM Link Flows
ID Calibration / Validation Site No. Site Location Dir Date Data Type X Y A-Node B-Node C-Node Modelled GEH GEH Pass? DMRB
Pass?
PM PEAK
Observed
67 Calibration A22 A508 Bridge Street SB Jun-05 RSI/ATC 475492 259516 2085 1085 683 660 0.872 Yes Yes68 Calibration A22 A508 Bridge Street NB Jun-05 RSI/ATC 475492 259516 1085 2085 788 745 1.551 Yes Yes69 Calibration A23 A5123 Towcester Road SB Jun-05 RSI/ATC 474997 259528 24756 1086 1301 1326 0.674 Yes Yes70 Calibration A23 A5123 Towcester Road NB Jun-05 RSI/ATC 474997 259528 1086 24756 1052 1027 0.758 Yes Yes71 Calibration A24 A428 St James Road WB Jun-05 RSI/ATC 474682 260395 21017 1106 1065 1002 1.956 Yes Yes72 Calibration A24 A428 St James Road EB Jun-05 RSI/ATC 474682 260395 1106 21017 1113 1046 2.054 Yes Yes73 Calibration 20 A428 Crick, East of WB Jun-05 ATC 460257 272370 9429 21157 302 453 7.775 No No74 Calibration 20 A428 Crick, East of EB Jun-05 ATC 460257 272370 21157 9429 368 343 1.326 Yes Yes75 Calibration 21 A5199 Thornby, South of NB Jun-05 ATC 467750 275125 21310 2310 185 156 2.252 Yes Yes76 Calibration 21 A5199 Thornby, South of SB Jun-05 ATC 467750 275125 2310 21310 315 306 0.508 Yes Yes77 Calibration 28 A428 Yardley Hastings EB Jun-05 ATC 486075 257050 10103 10104 511 487 1.065 Yes Yes78 Calibration 28 A428 Yardley Hastings WB Jun-05 ATC 486075 257050 10104 10103 373 483 5.316 No No
79 Calibration 56 A428 Harlestone Firs, Northampton EB Jun-05 ATC 471148 263776 21144 4144 538 532 0.251 Yes Yes
80 Calibration 56 A428 Harlestone Firs, Northampton WB Jun-05 ATC 471148 263776 4144 21144 663 648 0.576 Yes Yes
81 Calibration 58 A43 Overstone Grange NB Jun-05 ATC 480127 267590 1226 2220 1215 1153 1.816 Yes Yes82 Calibration 58 A43 Overstone Grange SB Jun-05 ATC 480127 267590 2220 1226 959 862 3.217 Yes Yes83 Calibration 76 A508 Roade, South of NB Jun-05 ATC 475459 251296 21313 25176 892 818 2.515 Yes Yes84 Calibration 76 A508 Roade, South of SB Jun-05 ATC 475459 251296 25176 21313 586 874 10.663 No No
85 Calibration 131 A428 Bedford Road, Northampton EB Jun-05 ATC 476563 259991 1077 25171 948 912 1.166 Yes Yes
86 Calibration 131 A428 Bedford Road, Northampton WB Jun-05 ATC 476563 259991 25171 1077 379 353 1.370 Yes Yes
87 Calibration 132 B526 Newport Pagnell Road, Northampton EB Jun-05 ATC 475870 257513 24742 25235 302 305 0.198 Yes Yes
88 Calibration 132 B526 Newport Pagnell Road, Northampton WB Jun-05 ATC 475870 257513 25235 24742 266 249 1.080 Yes Yes
89 Calibration 133 C23 Quinton Road, Northapton SB Jun-05 ATC 476667 255883 3081 24743 180 101 6.677 No Yes
90 Calibration 133 C23 Quinton Road, Northapton NB Jun-05 ATC 476667 255883 24743 3081 344 195 9.090 No No
91 Calibration 135 C188 Towcester Road, Northampton NB Jun-05 ATC 473746 257935 1099 22097 523 498 1.087 Yes Yes
92 Calibration 135 C188 Towcester Road, Northampton SB Jun-05 ATC 473746 257935 22097 1099 412 397 0.738 Yes Yes
93 Calibration 137 C86 Banbury Lane, Northampton NB Jun-05 ATC 472568 258536 1102 4102 156 103 4.677 Yes Yes
94 Calibration 137 C86 Banbury Lane, Northampton SB Jun-05 ATC 472568 258536 4102 1102 211 212 0.055 Yes Yes
95 Calibration 139 C67 Sandy Lane, Northampton NB Jun-05 ATC 470413 261238 21262 3121 497 488 0.422 Yes Yes
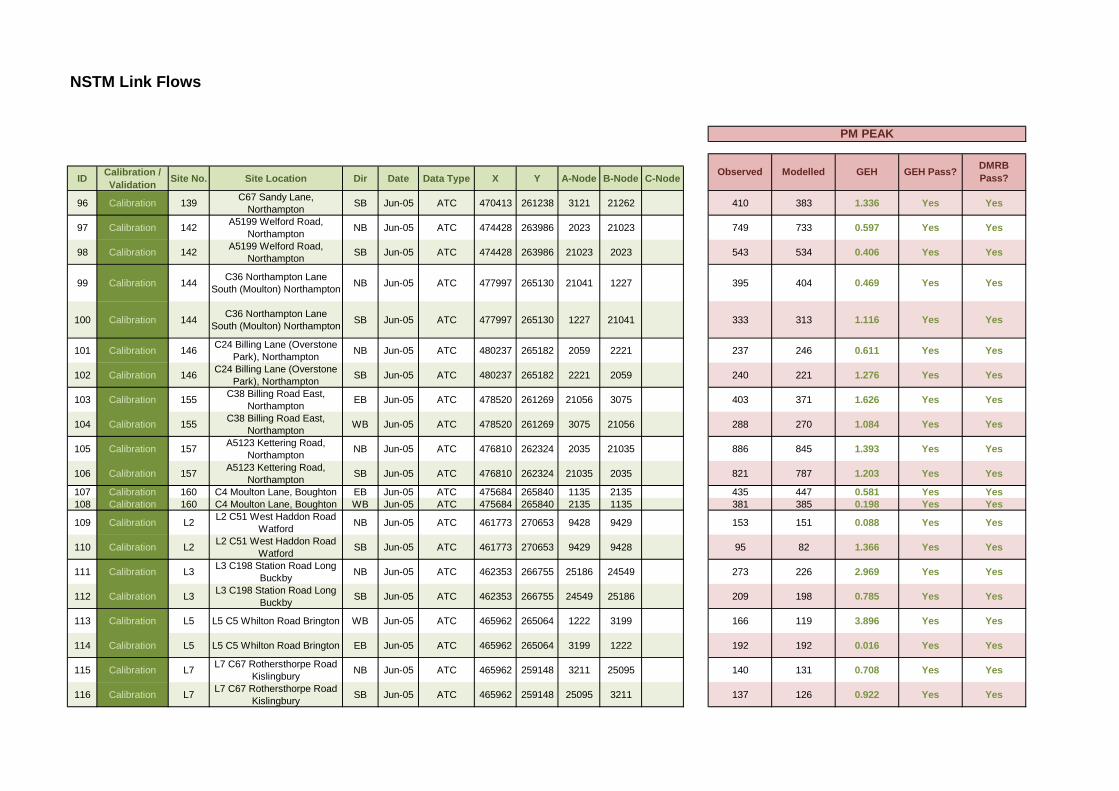
NSTM Link Flows
ID Calibration / Validation Site No. Site Location Dir Date Data Type X Y A-Node B-Node C-Node Modelled GEH GEH Pass? DMRB
Pass?
PM PEAK
Observed
96 Calibration 139 C67 Sandy Lane, Northampton SB Jun-05 ATC 470413 261238 3121 21262 410 383 1.336 Yes Yes
97 Calibration 142 A5199 Welford Road, Northampton NB Jun-05 ATC 474428 263986 2023 21023 749 733 0.597 Yes Yes
98 Calibration 142 A5199 Welford Road, Northampton SB Jun-05 ATC 474428 263986 21023 2023 543 534 0.406 Yes Yes
99 Calibration 144 C36 Northampton Lane South (Moulton) Northampton NB Jun-05 ATC 477997 265130 21041 1227 395 404 0.469 Yes Yes
100 Calibration 144 C36 Northampton Lane South (Moulton) Northampton SB Jun-05 ATC 477997 265130 1227 21041 333 313 1.116 Yes Yes
101 Calibration 146 C24 Billing Lane (Overstone Park), Northampton NB Jun-05 ATC 480237 265182 2059 2221 237 246 0.611 Yes Yes
102 Calibration 146 C24 Billing Lane (Overstone Park), Northampton SB Jun-05 ATC 480237 265182 2221 2059 240 221 1.276 Yes Yes
103 Calibration 155 C38 Billing Road East, Northampton EB Jun-05 ATC 478520 261269 21056 3075 403 371 1.626 Yes Yes
104 Calibration 155 C38 Billing Road East, Northampton WB Jun-05 ATC 478520 261269 3075 21056 288 270 1.084 Yes Yes
105 Calibration 157 A5123 Kettering Road, Northampton NB Jun-05 ATC 476810 262324 2035 21035 886 845 1.393 Yes Yes
106 Calibration 157 A5123 Kettering Road, Northampton SB Jun-05 ATC 476810 262324 21035 2035 821 787 1.203 Yes Yes
107 Calibration 160 C4 Moulton Lane, Boughton EB Jun-05 ATC 475684 265840 1135 2135 435 447 0.581 Yes Yes108 Calibration 160 C4 Moulton Lane, Boughton WB Jun-05 ATC 475684 265840 2135 1135 381 385 0.198 Yes Yes
109 Calibration L2 L2 C51 West Haddon Road Watford NB Jun-05 ATC 461773 270653 9428 9429 153 151 0.088 Yes Yes
110 Calibration L2 L2 C51 West Haddon Road Watford SB Jun-05 ATC 461773 270653 9429 9428 95 82 1.366 Yes Yes
111 Calibration L3 L3 C198 Station Road Long Buckby NB Jun-05 ATC 462353 266755 25186 24549 273 226 2.969 Yes Yes
112 Calibration L3 L3 C198 Station Road Long Buckby SB Jun-05 ATC 462353 266755 24549 25186 209 198 0.785 Yes Yes
113 Calibration L5 L5 C5 Whilton Road Brington WB Jun-05 ATC 465962 265064 1222 3199 166 119 3.896 Yes Yes
114 Calibration L5 L5 C5 Whilton Road Brington EB Jun-05 ATC 465962 265064 3199 1222 192 192 0.016 Yes Yes
115 Calibration L7 L7 C67 Rothersthorpe Road Kislingbury NB Jun-05 ATC 465962 259148 3211 25095 140 131 0.708 Yes Yes
116 Calibration L7 L7 C67 Rothersthorpe Road Kislingbury SB Jun-05 ATC 465962 259148 25095 3211 137 126 0.922 Yes Yes
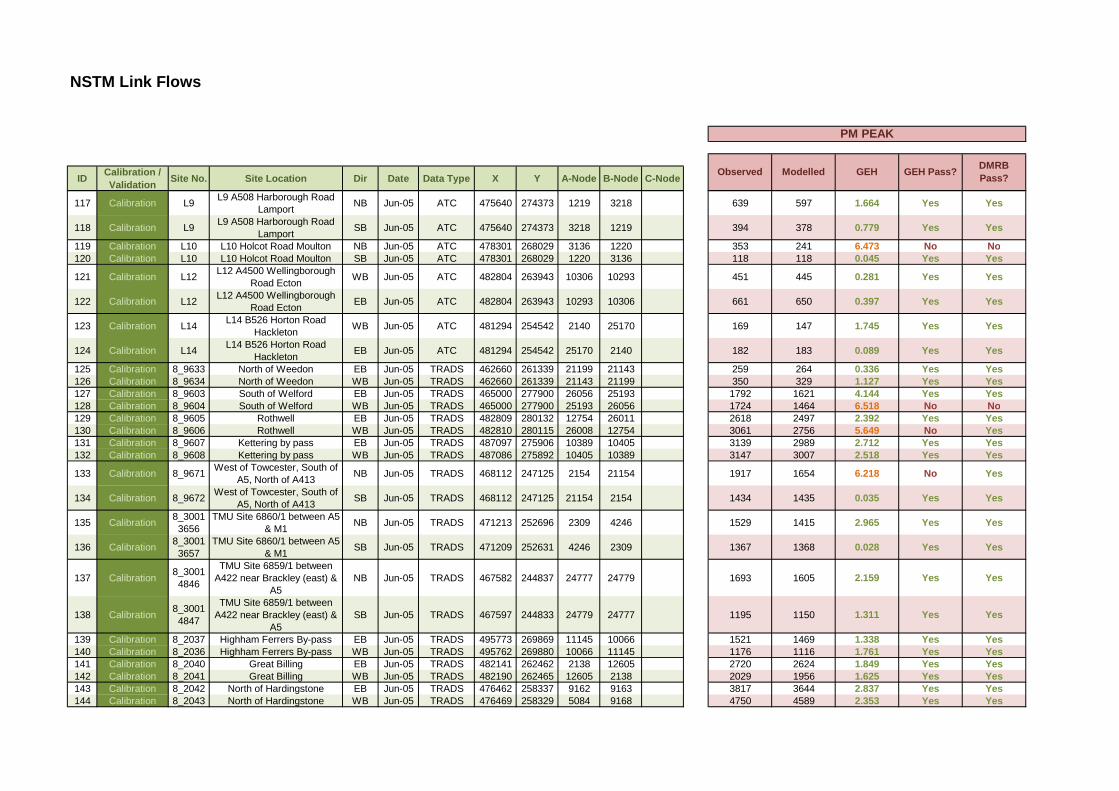
NSTM Link Flows
ID Calibration / Validation Site No. Site Location Dir Date Data Type X Y A-Node B-Node C-Node Modelled GEH GEH Pass? DMRB
Pass?
PM PEAK
Observed
117 Calibration L9 L9 A508 Harborough Road Lamport NB Jun-05 ATC 475640 274373 1219 3218 639 597 1.664 Yes Yes
118 Calibration L9 L9 A508 Harborough Road Lamport SB Jun-05 ATC 475640 274373 3218 1219 394 378 0.779 Yes Yes
119 Calibration L10 L10 Holcot Road Moulton NB Jun-05 ATC 478301 268029 3136 1220 353 241 6.473 No No120 Calibration L10 L10 Holcot Road Moulton SB Jun-05 ATC 478301 268029 1220 3136 118 118 0.045 Yes Yes
121 Calibration L12 L12 A4500 Wellingborough Road Ecton WB Jun-05 ATC 482804 263943 10306 10293 451 445 0.281 Yes Yes
122 Calibration L12 L12 A4500 Wellingborough Road Ecton EB Jun-05 ATC 482804 263943 10293 10306 661 650 0.397 Yes Yes
123 Calibration L14 L14 B526 Horton Road Hackleton WB Jun-05 ATC 481294 254542 2140 25170 169 147 1.745 Yes Yes
124 Calibration L14 L14 B526 Horton Road Hackleton EB Jun-05 ATC 481294 254542 25170 2140 182 183 0.089 Yes Yes
125 Calibration 8_9633 North of Weedon EB Jun-05 TRADS 462660 261339 21199 21143 259 264 0.336 Yes Yes126 Calibration 8_9634 North of Weedon WB Jun-05 TRADS 462660 261339 21143 21199 350 329 1.127 Yes Yes127 Calibration 8_9603 South of Welford EB Jun-05 TRADS 465000 277900 26056 25193 1792 1621 4.144 Yes Yes128 Calibration 8_9604 South of Welford WB Jun-05 TRADS 465000 277900 25193 26056 1724 1464 6.518 No No129 Calibration 8_9605 Rothwell EB Jun-05 TRADS 482809 280132 12754 26011 2618 2497 2.392 Yes Yes130 Calibration 8_9606 Rothwell WB Jun-05 TRADS 482810 280115 26008 12754 3061 2756 5.649 No Yes131 Calibration 8_9607 Kettering by pass EB Jun-05 TRADS 487097 275906 10389 10405 3139 2989 2.712 Yes Yes132 Calibration 8_9608 Kettering by pass WB Jun-05 TRADS 487086 275892 10405 10389 3147 3007 2.518 Yes Yes
133 Calibration 8_9671 West of Towcester, South of A5, North of A413 NB Jun-05 TRADS 468112 247125 2154 21154 1917 1654 6.218 No Yes
134 Calibration 8_9672 West of Towcester, South of A5, North of A413 SB Jun-05 TRADS 468112 247125 21154 2154 1434 1435 0.035 Yes Yes
135 Calibration 8_30013656
TMU Site 6860/1 between A5 & M1 NB Jun-05 TRADS 471213 252696 2309 4246 1529 1415 2.965 Yes Yes
136 Calibration 8_30013657
TMU Site 6860/1 between A5 & M1 SB Jun-05 TRADS 471209 252631 4246 2309 1367 1368 0.028 Yes Yes
137 Calibration 8_30014846
TMU Site 6859/1 between A422 near Brackley (east) &
A5NB Jun-05 TRADS 467582 244837 24777 24779 1693 1605 2.159 Yes Yes
138 Calibration 8_30014847
TMU Site 6859/1 between A422 near Brackley (east) &
A5SB Jun-05 TRADS 467597 244833 24779 24777 1195 1150 1.311 Yes Yes
139 Calibration 8_2037 Highham Ferrers By-pass EB Jun-05 TRADS 495773 269869 11145 10066 1521 1469 1.338 Yes Yes140 Calibration 8_2036 Highham Ferrers By-pass WB Jun-05 TRADS 495762 269880 10066 11145 1176 1116 1.761 Yes Yes141 Calibration 8_2040 Great Billing EB Jun-05 TRADS 482141 262462 2138 12605 2720 2624 1.849 Yes Yes142 Calibration 8_2041 Great Billing WB Jun-05 TRADS 482190 262465 12605 2138 2029 1956 1.625 Yes Yes143 Calibration 8_2042 North of Hardingstone EB Jun-05 TRADS 476462 258337 9162 9163 3817 3644 2.837 Yes Yes144 Calibration 8_2043 North of Hardingstone WB Jun-05 TRADS 476469 258329 5084 9168 4750 4589 2.353 Yes Yes
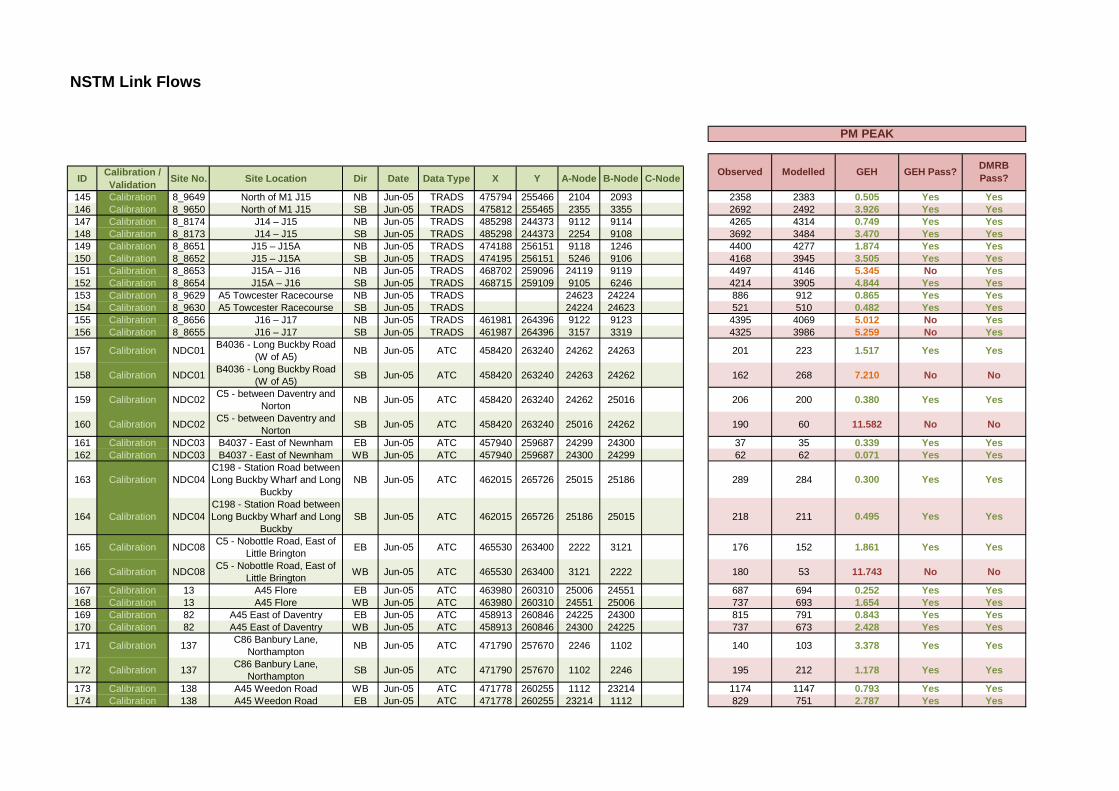
NSTM Link Flows
ID Calibration / Validation Site No. Site Location Dir Date Data Type X Y A-Node B-Node C-Node Modelled GEH GEH Pass? DMRB
Pass?
PM PEAK
Observed
145 Calibration 8_9649 North of M1 J15 NB Jun-05 TRADS 475794 255466 2104 2093 2358 2383 0.505 Yes Yes146 Calibration 8_9650 North of M1 J15 SB Jun-05 TRADS 475812 255465 2355 3355 2692 2492 3.926 Yes Yes147 Calibration 8_8174 J14 – J15 NB Jun-05 TRADS 485298 244373 9112 9114 4265 4314 0.749 Yes Yes148 Calibration 8_8173 J14 – J15 SB Jun-05 TRADS 485298 244373 2254 9108 3692 3484 3.470 Yes Yes149 Calibration 8_8651 J15 – J15A NB Jun-05 TRADS 474188 256151 9118 1246 4400 4277 1.874 Yes Yes150 Calibration 8_8652 J15 – J15A SB Jun-05 TRADS 474195 256151 5246 9106 4168 3945 3.505 Yes Yes151 Calibration 8_8653 J15A – J16 NB Jun-05 TRADS 468702 259096 24119 9119 4497 4146 5.345 No Yes152 Calibration 8_8654 J15A – J16 SB Jun-05 TRADS 468715 259109 9105 6246 4214 3905 4.844 Yes Yes153 Calibration 8_9629 A5 Towcester Racecourse NB Jun-05 TRADS 24623 24224 886 912 0.865 Yes Yes154 Calibration 8_9630 A5 Towcester Racecourse SB Jun-05 TRADS 24224 24623 521 510 0.482 Yes Yes155 Calibration 8_8656 J16 – J17 NB Jun-05 TRADS 461981 264396 9122 9123 4395 4069 5.012 No Yes156 Calibration 8_8655 J16 – J17 SB Jun-05 TRADS 461987 264396 3157 3319 4325 3986 5.259 No Yes
157 Calibration NDC01 B4036 - Long Buckby Road (W of A5) NB Jun-05 ATC 458420 263240 24262 24263 201 223 1.517 Yes Yes
158 Calibration NDC01 B4036 - Long Buckby Road (W of A5) SB Jun-05 ATC 458420 263240 24263 24262 162 268 7.210 No No
159 Calibration NDC02 C5 - between Daventry and Norton NB Jun-05 ATC 458420 263240 24262 25016 206 200 0.380 Yes Yes
160 Calibration NDC02 C5 - between Daventry and Norton SB Jun-05 ATC 458420 263240 25016 24262 190 60 11.582 No No
161 Calibration NDC03 B4037 - East of Newnham EB Jun-05 ATC 457940 259687 24299 24300 37 35 0.339 Yes Yes162 Calibration NDC03 B4037 - East of Newnham WB Jun-05 ATC 457940 259687 24300 24299 62 62 0.071 Yes Yes
163 Calibration NDC04C198 - Station Road between Long Buckby Wharf and Long
BuckbyNB Jun-05 ATC 462015 265726 25015 25186 289 284 0.300 Yes Yes
164 Calibration NDC04C198 - Station Road between Long Buckby Wharf and Long
BuckbySB Jun-05 ATC 462015 265726 25186 25015 218 211 0.495 Yes Yes
165 Calibration NDC08 C5 - Nobottle Road, East of Little Brington EB Jun-05 ATC 465530 263400 2222 3121 176 152 1.861 Yes Yes
166 Calibration NDC08 C5 - Nobottle Road, East of Little Brington WB Jun-05 ATC 465530 263400 3121 2222 180 53 11.743 No No
167 Calibration 13 A45 Flore EB Jun-05 ATC 463980 260310 25006 24551 687 694 0.252 Yes Yes168 Calibration 13 A45 Flore WB Jun-05 ATC 463980 260310 24551 25006 737 693 1.654 Yes Yes169 Calibration 82 A45 East of Daventry EB Jun-05 ATC 458913 260846 24225 24300 815 791 0.843 Yes Yes170 Calibration 82 A45 East of Daventry WB Jun-05 ATC 458913 260846 24300 24225 737 673 2.428 Yes Yes
171 Calibration 137 C86 Banbury Lane, Northampton NB Jun-05 ATC 471790 257670 2246 1102 140 103 3.378 Yes Yes
172 Calibration 137 C86 Banbury Lane, Northampton SB Jun-05 ATC 471790 257670 1102 2246 195 212 1.178 Yes Yes
173 Calibration 138 A45 Weedon Road WB Jun-05 ATC 471778 260255 1112 23214 1174 1147 0.793 Yes Yes174 Calibration 138 A45 Weedon Road EB Jun-05 ATC 471778 260255 23214 1112 829 751 2.787 Yes Yes
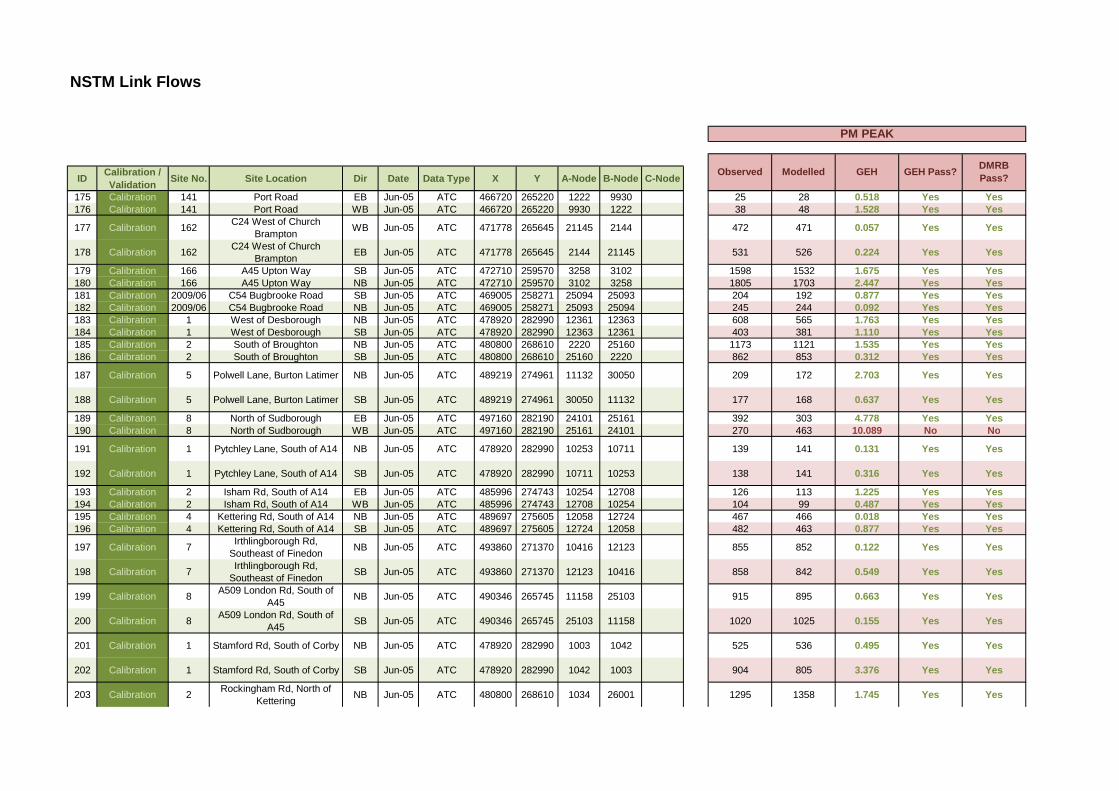
NSTM Link Flows
ID Calibration / Validation Site No. Site Location Dir Date Data Type X Y A-Node B-Node C-Node Modelled GEH GEH Pass? DMRB
Pass?
PM PEAK
Observed
175 Calibration 141 Port Road EB Jun-05 ATC 466720 265220 1222 9930 25 28 0.518 Yes Yes176 Calibration 141 Port Road WB Jun-05 ATC 466720 265220 9930 1222 38 48 1.528 Yes Yes
177 Calibration 162 C24 West of Church Brampton WB Jun-05 ATC 471778 265645 21145 2144 472 471 0.057 Yes Yes
178 Calibration 162 C24 West of Church Brampton EB Jun-05 ATC 471778 265645 2144 21145 531 526 0.224 Yes Yes
179 Calibration 166 A45 Upton Way SB Jun-05 ATC 472710 259570 3258 3102 1598 1532 1.675 Yes Yes180 Calibration 166 A45 Upton Way NB Jun-05 ATC 472710 259570 3102 3258 1805 1703 2.447 Yes Yes181 Calibration 2009/06 C54 Bugbrooke Road SB Jun-05 ATC 469005 258271 25094 25093 204 192 0.877 Yes Yes182 Calibration 2009/06 C54 Bugbrooke Road NB Jun-05 ATC 469005 258271 25093 25094 245 244 0.092 Yes Yes183 Calibration 1 West of Desborough NB Jun-05 ATC 478920 282990 12361 12363 608 565 1.763 Yes Yes184 Calibration 1 West of Desborough SB Jun-05 ATC 478920 282990 12363 12361 403 381 1.110 Yes Yes185 Calibration 2 South of Broughton NB Jun-05 ATC 480800 268610 2220 25160 1173 1121 1.535 Yes Yes186 Calibration 2 South of Broughton SB Jun-05 ATC 480800 268610 25160 2220 862 853 0.312 Yes Yes
187 Calibration 5 Polwell Lane, Burton Latimer NB Jun-05 ATC 489219 274961 11132 30050 209 172 2.703 Yes Yes
188 Calibration 5 Polwell Lane, Burton Latimer SB Jun-05 ATC 489219 274961 30050 11132 177 168 0.637 Yes Yes
189 Calibration 8 North of Sudborough EB Jun-05 ATC 497160 282190 24101 25161 392 303 4.778 Yes Yes190 Calibration 8 North of Sudborough WB Jun-05 ATC 497160 282190 25161 24101 270 463 10.089 No No
191 Calibration 1 Pytchley Lane, South of A14 NB Jun-05 ATC 478920 282990 10253 10711 139 141 0.131 Yes Yes
192 Calibration 1 Pytchley Lane, South of A14 SB Jun-05 ATC 478920 282990 10711 10253 138 141 0.316 Yes Yes
193 Calibration 2 Isham Rd, South of A14 EB Jun-05 ATC 485996 274743 10254 12708 126 113 1.225 Yes Yes194 Calibration 2 Isham Rd, South of A14 WB Jun-05 ATC 485996 274743 12708 10254 104 99 0.487 Yes Yes195 Calibration 4 Kettering Rd, South of A14 NB Jun-05 ATC 489697 275605 12058 12724 467 466 0.018 Yes Yes196 Calibration 4 Kettering Rd, South of A14 SB Jun-05 ATC 489697 275605 12724 12058 482 463 0.877 Yes Yes
197 Calibration 7 Irthlingborough Rd, Southeast of Finedon NB Jun-05 ATC 493860 271370 10416 12123 855 852 0.122 Yes Yes
198 Calibration 7 Irthlingborough Rd, Southeast of Finedon SB Jun-05 ATC 493860 271370 12123 10416 858 842 0.549 Yes Yes
199 Calibration 8 A509 London Rd, South of A45 NB Jun-05 ATC 490346 265745 11158 25103 915 895 0.663 Yes Yes
200 Calibration 8 A509 London Rd, South of A45 SB Jun-05 ATC 490346 265745 25103 11158 1020 1025 0.155 Yes Yes
201 Calibration 1 Stamford Rd, South of Corby NB Jun-05 ATC 478920 282990 1003 1042 525 536 0.495 Yes Yes
202 Calibration 1 Stamford Rd, South of Corby SB Jun-05 ATC 478920 282990 1042 1003 904 805 3.376 Yes Yes
203 Calibration 2 Rockingham Rd, North of Kettering NB Jun-05 ATC 480800 268610 1034 26001 1295 1358 1.745 Yes Yes
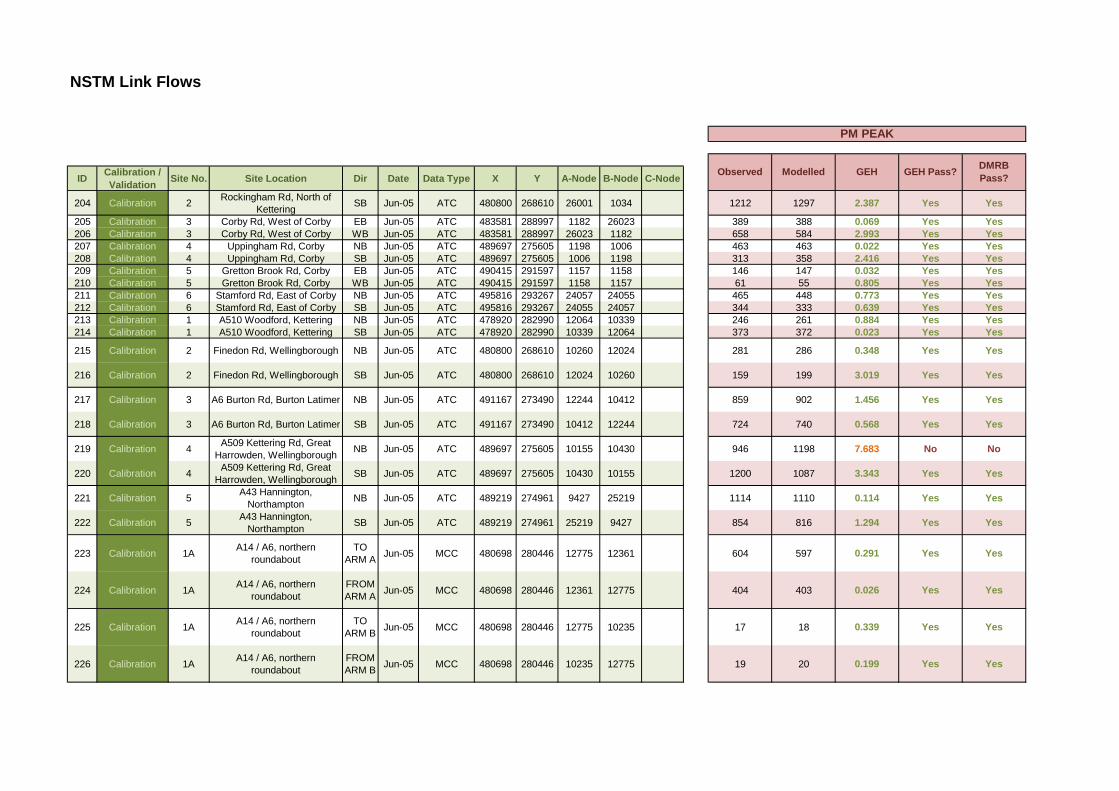
NSTM Link Flows
ID Calibration / Validation Site No. Site Location Dir Date Data Type X Y A-Node B-Node C-Node Modelled GEH GEH Pass? DMRB
Pass?
PM PEAK
Observed
204 Calibration 2 Rockingham Rd, North of Kettering SB Jun-05 ATC 480800 268610 26001 1034 1212 1297 2.387 Yes Yes
205 Calibration 3 Corby Rd, West of Corby EB Jun-05 ATC 483581 288997 1182 26023 389 388 0.069 Yes Yes206 Calibration 3 Corby Rd, West of Corby WB Jun-05 ATC 483581 288997 26023 1182 658 584 2.993 Yes Yes207 Calibration 4 Uppingham Rd, Corby NB Jun-05 ATC 489697 275605 1198 1006 463 463 0.022 Yes Yes208 Calibration 4 Uppingham Rd, Corby SB Jun-05 ATC 489697 275605 1006 1198 313 358 2.416 Yes Yes209 Calibration 5 Gretton Brook Rd, Corby EB Jun-05 ATC 490415 291597 1157 1158 146 147 0.032 Yes Yes210 Calibration 5 Gretton Brook Rd, Corby WB Jun-05 ATC 490415 291597 1158 1157 61 55 0.805 Yes Yes211 Calibration 6 Stamford Rd, East of Corby NB Jun-05 ATC 495816 293267 24057 24055 465 448 0.773 Yes Yes212 Calibration 6 Stamford Rd, East of Corby SB Jun-05 ATC 495816 293267 24055 24057 344 333 0.639 Yes Yes213 Calibration 1 A510 Woodford, Kettering NB Jun-05 ATC 478920 282990 12064 10339 246 261 0.884 Yes Yes214 Calibration 1 A510 Woodford, Kettering SB Jun-05 ATC 478920 282990 10339 12064 373 372 0.023 Yes Yes
215 Calibration 2 Finedon Rd, Wellingborough NB Jun-05 ATC 480800 268610 10260 12024 281 286 0.348 Yes Yes
216 Calibration 2 Finedon Rd, Wellingborough SB Jun-05 ATC 480800 268610 12024 10260 159 199 3.019 Yes Yes
217 Calibration 3 A6 Burton Rd, Burton Latimer NB Jun-05 ATC 491167 273490 12244 10412 859 902 1.456 Yes Yes
218 Calibration 3 A6 Burton Rd, Burton Latimer SB Jun-05 ATC 491167 273490 10412 12244 724 740 0.568 Yes Yes
219 Calibration 4 A509 Kettering Rd, Great Harrowden, Wellingborough NB Jun-05 ATC 489697 275605 10155 10430 946 1198 7.683 No No
220 Calibration 4 A509 Kettering Rd, Great Harrowden, Wellingborough SB Jun-05 ATC 489697 275605 10430 10155 1200 1087 3.343 Yes Yes
221 Calibration 5 A43 Hannington, Northampton NB Jun-05 ATC 489219 274961 9427 25219 1114 1110 0.114 Yes Yes
222 Calibration 5 A43 Hannington, Northampton SB Jun-05 ATC 489219 274961 25219 9427 854 816 1.294 Yes Yes
223 Calibration 1A A14 / A6, northern roundabout
TO ARM A Jun-05 MCC 480698 280446 12775 12361 604 597 0.291 Yes Yes
224 Calibration 1A A14 / A6, northern roundabout
FROM ARM A Jun-05 MCC 480698 280446 12361 12775 404 403 0.026 Yes Yes
225 Calibration 1A A14 / A6, northern roundabout
TO ARM B Jun-05 MCC 480698 280446 12775 10235 17 18 0.339 Yes Yes
226 Calibration 1A A14 / A6, northern roundabout
FROM ARM B Jun-05 MCC 480698 280446 10235 12775 19 20 0.199 Yes Yes
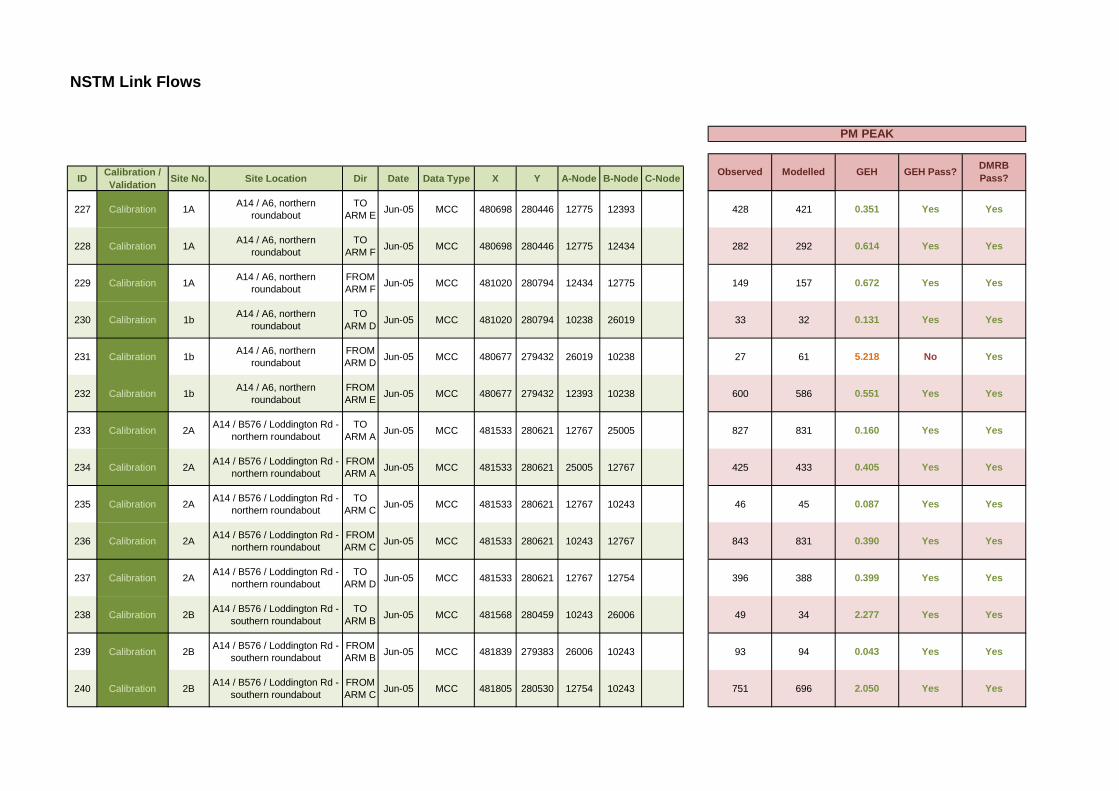
NSTM Link Flows
ID Calibration / Validation Site No. Site Location Dir Date Data Type X Y A-Node B-Node C-Node Modelled GEH GEH Pass? DMRB
Pass?
PM PEAK
Observed
227 Calibration 1A A14 / A6, northern roundabout
TO ARM E Jun-05 MCC 480698 280446 12775 12393 428 421 0.351 Yes Yes
228 Calibration 1A A14 / A6, northern roundabout
TO ARM F Jun-05 MCC 480698 280446 12775 12434 282 292 0.614 Yes Yes
229 Calibration 1A A14 / A6, northern roundabout
FROM ARM F Jun-05 MCC 481020 280794 12434 12775 149 157 0.672 Yes Yes
230 Calibration 1b A14 / A6, northern roundabout
TO ARM D Jun-05 MCC 481020 280794 10238 26019 33 32 0.131 Yes Yes
231 Calibration 1b A14 / A6, northern roundabout
FROM ARM D Jun-05 MCC 480677 279432 26019 10238 27 61 5.218 No Yes
232 Calibration 1b A14 / A6, northern roundabout
FROM ARM E Jun-05 MCC 480677 279432 12393 10238 600 586 0.551 Yes Yes
233 Calibration 2A A14 / B576 / Loddington Rd - northern roundabout
TO ARM A Jun-05 MCC 481533 280621 12767 25005 827 831 0.160 Yes Yes
234 Calibration 2A A14 / B576 / Loddington Rd - northern roundabout
FROM ARM A Jun-05 MCC 481533 280621 25005 12767 425 433 0.405 Yes Yes
235 Calibration 2A A14 / B576 / Loddington Rd - northern roundabout
TO ARM C Jun-05 MCC 481533 280621 12767 10243 46 45 0.087 Yes Yes
236 Calibration 2A A14 / B576 / Loddington Rd - northern roundabout
FROM ARM C Jun-05 MCC 481533 280621 10243 12767 843 831 0.390 Yes Yes
237 Calibration 2A A14 / B576 / Loddington Rd - northern roundabout
TO ARM D Jun-05 MCC 481533 280621 12767 12754 396 388 0.399 Yes Yes
238 Calibration 2B A14 / B576 / Loddington Rd - southern roundabout
TO ARM B Jun-05 MCC 481568 280459 10243 26006 49 34 2.277 Yes Yes
239 Calibration 2B A14 / B576 / Loddington Rd - southern roundabout
FROM ARM B Jun-05 MCC 481839 279383 26006 10243 93 94 0.043 Yes Yes
240 Calibration 2B A14 / B576 / Loddington Rd - southern roundabout
FROM ARM C Jun-05 MCC 481805 280530 12754 10243 751 696 2.050 Yes Yes
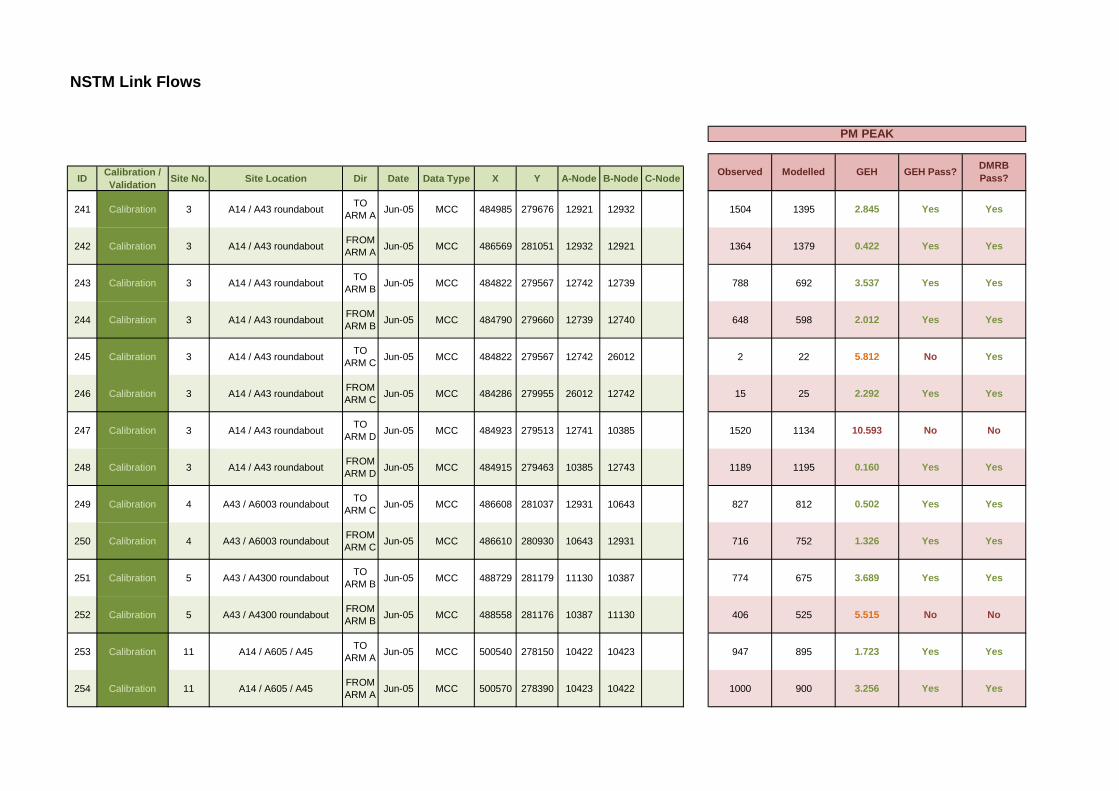
NSTM Link Flows
ID Calibration / Validation Site No. Site Location Dir Date Data Type X Y A-Node B-Node C-Node Modelled GEH GEH Pass? DMRB
Pass?
PM PEAK
Observed
241 Calibration 3 A14 / A43 roundabout TO ARM A Jun-05 MCC 484985 279676 12921 12932 1504 1395 2.845 Yes Yes
242 Calibration 3 A14 / A43 roundabout FROM ARM A Jun-05 MCC 486569 281051 12932 12921 1364 1379 0.422 Yes Yes
243 Calibration 3 A14 / A43 roundabout TO ARM B Jun-05 MCC 484822 279567 12742 12739 788 692 3.537 Yes Yes
244 Calibration 3 A14 / A43 roundabout FROM ARM B Jun-05 MCC 484790 279660 12739 12740 648 598 2.012 Yes Yes
245 Calibration 3 A14 / A43 roundabout TO ARM C Jun-05 MCC 484822 279567 12742 26012 2 22 5.812 No Yes
246 Calibration 3 A14 / A43 roundabout FROM ARM C Jun-05 MCC 484286 279955 26012 12742 15 25 2.292 Yes Yes
247 Calibration 3 A14 / A43 roundabout TO ARM D Jun-05 MCC 484923 279513 12741 10385 1520 1134 10.593 No No
248 Calibration 3 A14 / A43 roundabout FROM ARM D Jun-05 MCC 484915 279463 10385 12743 1189 1195 0.160 Yes Yes
249 Calibration 4 A43 / A6003 roundabout TO ARM C Jun-05 MCC 486608 281037 12931 10643 827 812 0.502 Yes Yes
250 Calibration 4 A43 / A6003 roundabout FROM ARM C Jun-05 MCC 486610 280930 10643 12931 716 752 1.326 Yes Yes
251 Calibration 5 A43 / A4300 roundabout TO ARM B Jun-05 MCC 488729 281179 11130 10387 774 675 3.689 Yes Yes
252 Calibration 5 A43 / A4300 roundabout FROM ARM B Jun-05 MCC 488558 281176 10387 11130 406 525 5.515 No No
253 Calibration 11 A14 / A605 / A45 TO ARM A Jun-05 MCC 500540 278150 10422 10423 947 895 1.723 Yes Yes
254 Calibration 11 A14 / A605 / A45 FROM ARM A Jun-05 MCC 500570 278390 10423 10422 1000 900 3.256 Yes Yes
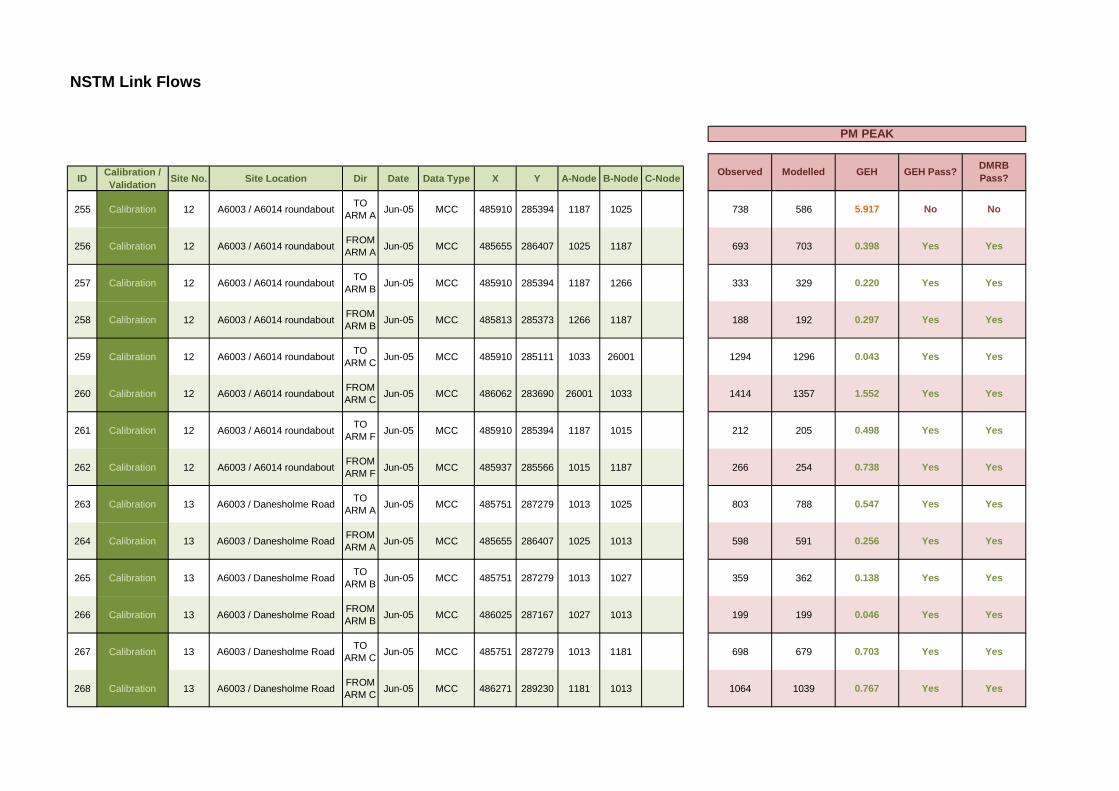
NSTM Link Flows
ID Calibration / Validation Site No. Site Location Dir Date Data Type X Y A-Node B-Node C-Node Modelled GEH GEH Pass? DMRB
Pass?
PM PEAK
Observed
255 Calibration 12 A6003 / A6014 roundabout TO ARM A Jun-05 MCC 485910 285394 1187 1025 738 586 5.917 No No
256 Calibration 12 A6003 / A6014 roundabout FROM ARM A Jun-05 MCC 485655 286407 1025 1187 693 703 0.398 Yes Yes
257 Calibration 12 A6003 / A6014 roundabout TO ARM B Jun-05 MCC 485910 285394 1187 1266 333 329 0.220 Yes Yes
258 Calibration 12 A6003 / A6014 roundabout FROM ARM B Jun-05 MCC 485813 285373 1266 1187 188 192 0.297 Yes Yes
259 Calibration 12 A6003 / A6014 roundabout TO ARM C Jun-05 MCC 485910 285111 1033 26001 1294 1296 0.043 Yes Yes
260 Calibration 12 A6003 / A6014 roundabout FROM ARM C Jun-05 MCC 486062 283690 26001 1033 1414 1357 1.552 Yes Yes
261 Calibration 12 A6003 / A6014 roundabout TO ARM F Jun-05 MCC 485910 285394 1187 1015 212 205 0.498 Yes Yes
262 Calibration 12 A6003 / A6014 roundabout FROM ARM F Jun-05 MCC 485937 285566 1015 1187 266 254 0.738 Yes Yes
263 Calibration 13 A6003 / Danesholme Road TO ARM A Jun-05 MCC 485751 287279 1013 1025 803 788 0.547 Yes Yes
264 Calibration 13 A6003 / Danesholme Road FROM ARM A Jun-05 MCC 485655 286407 1025 1013 598 591 0.256 Yes Yes
265 Calibration 13 A6003 / Danesholme Road TO ARM B Jun-05 MCC 485751 287279 1013 1027 359 362 0.138 Yes Yes
266 Calibration 13 A6003 / Danesholme Road FROM ARM B Jun-05 MCC 486025 287167 1027 1013 199 199 0.046 Yes Yes
267 Calibration 13 A6003 / Danesholme Road TO ARM C Jun-05 MCC 485751 287279 1013 1181 698 679 0.703 Yes Yes
268 Calibration 13 A6003 / Danesholme Road FROM ARM C Jun-05 MCC 486271 289230 1181 1013 1064 1039 0.767 Yes Yes
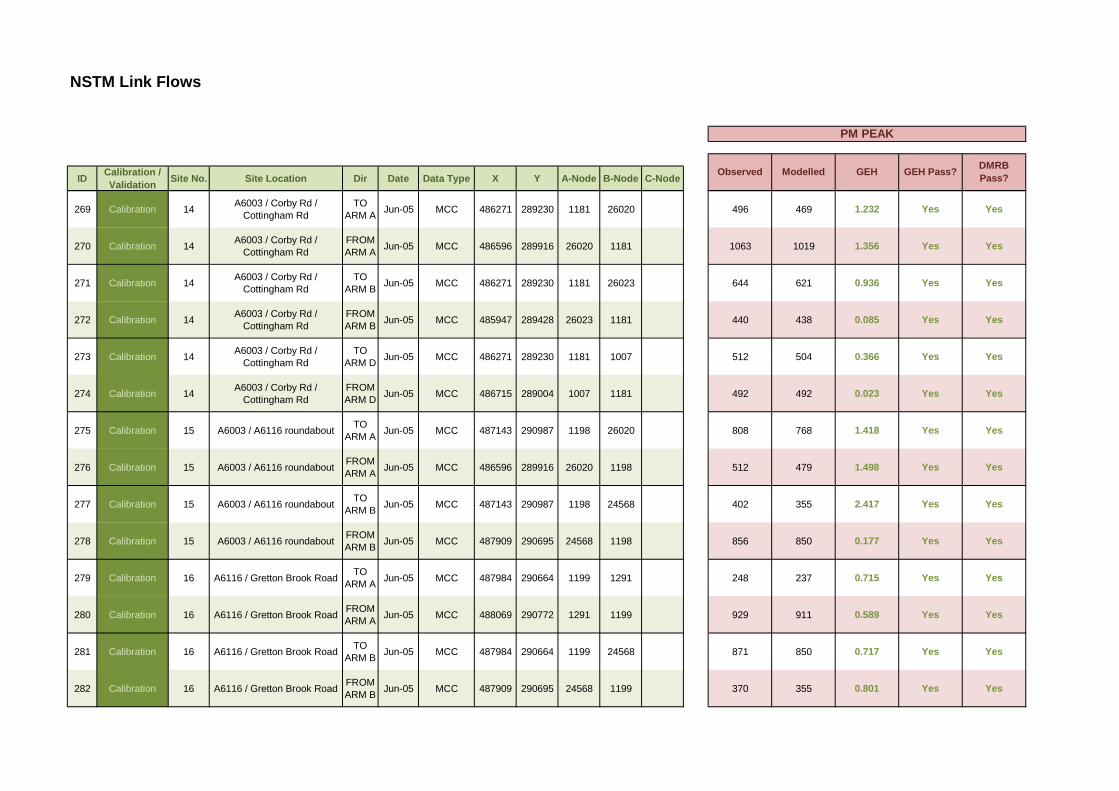
NSTM Link Flows
ID Calibration / Validation Site No. Site Location Dir Date Data Type X Y A-Node B-Node C-Node Modelled GEH GEH Pass? DMRB
Pass?
PM PEAK
Observed
269 Calibration 14 A6003 / Corby Rd / Cottingham Rd
TO ARM A Jun-05 MCC 486271 289230 1181 26020 496 469 1.232 Yes Yes
270 Calibration 14 A6003 / Corby Rd / Cottingham Rd
FROM ARM A Jun-05 MCC 486596 289916 26020 1181 1063 1019 1.356 Yes Yes
271 Calibration 14 A6003 / Corby Rd / Cottingham Rd
TO ARM B Jun-05 MCC 486271 289230 1181 26023 644 621 0.936 Yes Yes
272 Calibration 14 A6003 / Corby Rd / Cottingham Rd
FROM ARM B Jun-05 MCC 485947 289428 26023 1181 440 438 0.085 Yes Yes
273 Calibration 14 A6003 / Corby Rd / Cottingham Rd
TO ARM D Jun-05 MCC 486271 289230 1181 1007 512 504 0.366 Yes Yes
274 Calibration 14 A6003 / Corby Rd / Cottingham Rd
FROM ARM D Jun-05 MCC 486715 289004 1007 1181 492 492 0.023 Yes Yes
275 Calibration 15 A6003 / A6116 roundabout TO ARM A Jun-05 MCC 487143 290987 1198 26020 808 768 1.418 Yes Yes
276 Calibration 15 A6003 / A6116 roundabout FROM ARM A Jun-05 MCC 486596 289916 26020 1198 512 479 1.498 Yes Yes
277 Calibration 15 A6003 / A6116 roundabout TO ARM B Jun-05 MCC 487143 290987 1198 24568 402 355 2.417 Yes Yes
278 Calibration 15 A6003 / A6116 roundabout FROM ARM B Jun-05 MCC 487909 290695 24568 1198 856 850 0.177 Yes Yes
279 Calibration 16 A6116 / Gretton Brook Road TO ARM A Jun-05 MCC 487984 290664 1199 1291 248 237 0.715 Yes Yes
280 Calibration 16 A6116 / Gretton Brook Road FROM ARM A Jun-05 MCC 488069 290772 1291 1199 929 911 0.589 Yes Yes
281 Calibration 16 A6116 / Gretton Brook Road TO ARM B Jun-05 MCC 487984 290664 1199 24568 871 850 0.717 Yes Yes
282 Calibration 16 A6116 / Gretton Brook Road FROM ARM B Jun-05 MCC 487909 290695 24568 1199 370 355 0.801 Yes Yes

NSTM Link Flows
ID Calibration / Validation Site No. Site Location Dir Date Data Type X Y A-Node B-Node C-Node Modelled GEH GEH Pass? DMRB
Pass?
PM PEAK
Observed
283 Calibration 16 A6116 / Gretton Brook Road TO ARM C Jun-05 MCC 487984 290664 1199 1147 560 552 0.326 Yes Yes
284 Calibration 16 A6116 / Gretton Brook Road FROM ARM C Jun-05 MCC 488177 290526 1147 1199 380 373 0.348 Yes Yes
285 Calibration 17 A6116 / A6086 roundabout TO ARM A Jun-05 MCC 489930 290030 1205 1157 703 684 0.721 Yes Yes
286 Calibration 17 A6116 / A6086 roundabout FROM ARM A Jun-05 MCC 489254 291150 1157 1205 380 357 1.218 Yes Yes
287 Calibration 17 A6116 / A6086 roundabout TO ARM D Jun-05 MCC 489930 290030 1205 24864 299 251 2.891 Yes Yes
288 Calibration 17 A6116 / A6086 roundabout FROM ARM D Jun-05 MCC 490700 290340 24864 1205 619 502 4.966 Yes No
289 Calibration 18 A43 / A427 Stamford Road TO ARM A Jun-05 MCC 493002 289869 1212 24063 470 465 0.242 Yes Yes
290 Calibration 18 A43 / A427 Stamford Road FROM ARM A Jun-05 MCC 495377 291843 24063 1212 336 315 1.181 Yes Yes
291 Calibration 19 Steel Road / Bangrave Road TO ARM A Jun-05 MCC 491949 289909 1209 24862 201 185 1.180 Yes Yes
292 Calibration 19 Steel Road / Bangrave Road FROM ARM A Jun-05 MCC 491910 290130 24862 1209 572 542 1.269 Yes Yes
293 Calibration 20 A43 / A427 Weldon Road TO ARM B Jun-05 MCC 491598 289509 1149 1261 656 537 4.859 Yes No
294 Calibration 20 A43 / A427 Weldon Road FROM ARM B Jun-05 MCC 491327 289392 1261 1149 480 529 2.142 Yes Yes
295 Calibration 20 A43 / A427 Weldon Road TO ARM C Jun-05 MCC 491598 289509 1149 24875 622 595 1.125 Yes Yes
296 Calibration 20 A43 / A427 Weldon Road FROM ARM C Jun-05 MCC 491560 289250 24875 1149 391 217 10.005 No No
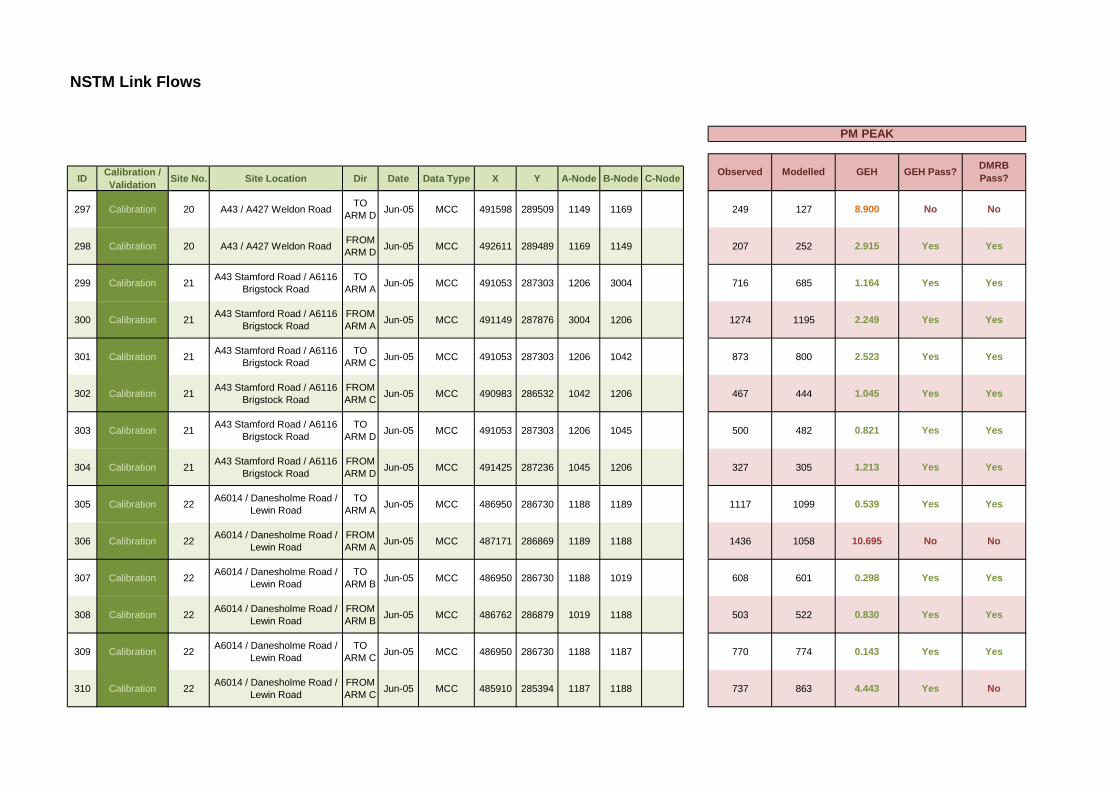
NSTM Link Flows
ID Calibration / Validation Site No. Site Location Dir Date Data Type X Y A-Node B-Node C-Node Modelled GEH GEH Pass? DMRB
Pass?
PM PEAK
Observed
297 Calibration 20 A43 / A427 Weldon Road TO ARM D Jun-05 MCC 491598 289509 1149 1169 249 127 8.900 No No
298 Calibration 20 A43 / A427 Weldon Road FROM ARM D Jun-05 MCC 492611 289489 1169 1149 207 252 2.915 Yes Yes
299 Calibration 21 A43 Stamford Road / A6116 Brigstock Road
TO ARM A Jun-05 MCC 491053 287303 1206 3004 716 685 1.164 Yes Yes
300 Calibration 21 A43 Stamford Road / A6116 Brigstock Road
FROM ARM A Jun-05 MCC 491149 287876 3004 1206 1274 1195 2.249 Yes Yes
301 Calibration 21 A43 Stamford Road / A6116 Brigstock Road
TO ARM C Jun-05 MCC 491053 287303 1206 1042 873 800 2.523 Yes Yes
302 Calibration 21 A43 Stamford Road / A6116 Brigstock Road
FROM ARM C Jun-05 MCC 490983 286532 1042 1206 467 444 1.045 Yes Yes
303 Calibration 21 A43 Stamford Road / A6116 Brigstock Road
TO ARM D Jun-05 MCC 491053 287303 1206 1045 500 482 0.821 Yes Yes
304 Calibration 21 A43 Stamford Road / A6116 Brigstock Road
FROM ARM D Jun-05 MCC 491425 287236 1045 1206 327 305 1.213 Yes Yes
305 Calibration 22 A6014 / Danesholme Road / Lewin Road
TO ARM A Jun-05 MCC 486950 286730 1188 1189 1117 1099 0.539 Yes Yes
306 Calibration 22 A6014 / Danesholme Road / Lewin Road
FROM ARM A Jun-05 MCC 487171 286869 1189 1188 1436 1058 10.695 No No
307 Calibration 22 A6014 / Danesholme Road / Lewin Road
TO ARM B Jun-05 MCC 486950 286730 1188 1019 608 601 0.298 Yes Yes
308 Calibration 22 A6014 / Danesholme Road / Lewin Road
FROM ARM B Jun-05 MCC 486762 286879 1019 1188 503 522 0.830 Yes Yes
309 Calibration 22 A6014 / Danesholme Road / Lewin Road
TO ARM C Jun-05 MCC 486950 286730 1188 1187 770 774 0.143 Yes Yes
310 Calibration 22 A6014 / Danesholme Road / Lewin Road
FROM ARM C Jun-05 MCC 485910 285394 1187 1188 737 863 4.443 Yes No

NSTM Link Flows
ID Calibration / Validation Site No. Site Location Dir Date Data Type X Y A-Node B-Node C-Node Modelled GEH GEH Pass? DMRB
Pass?
PM PEAK
Observed
311 Calibration 22 A6014 / Danesholme Road / Lewin Road
TO ARM D Jun-05 MCC 486950 286730 35008 1021 333 346 0.721 Yes Yes
312 Calibration 22 A6014 / Danesholme Road / Lewin Road
FROM ARM D Jun-05 MCC 486713 286131 1021 35008 254 254 0.008 Yes Yes
313 Calibration 23 Gainsborough Road / Jubilee Avenue roundabout
TO ARM A Jun-05 MCC 487395 287964 1191 1016 470 453 0.797 Yes Yes
314 Calibration 23 Gainsborough Road / Jubilee Avenue roundabout
FROM ARM A Jun-05 MCC 487368 288119 1016 1191 695 444 10.493 No No
315 Calibration 23 Gainsborough Road / Jubilee Avenue roundabout
TO ARM B Jun-05 MCC 487395 287964 1191 1303 333 195 8.448 No No
316 Calibration 23 Gainsborough Road / Jubilee Avenue roundabout
FROM ARM B Jun-05 MCC 487148 287856 1303 1191 281 258 1.395 Yes Yes
317 Calibration 23 Gainsborough Road / Jubilee Avenue roundabout
TO ARM C Jun-05 MCC 487395 287964 1191 1039 635 582 2.148 Yes Yes
318 Calibration 23 Gainsborough Road / Jubilee Avenue roundabout
FROM ARM C Jun-05 MCC 487720 287620 1039 1191 416 388 1.391 Yes Yes
319 Calibration 23 Gainsborough Road / Jubilee Avenue roundabout
TO ARM D Jun-05 MCC 487395 287964 1191 1037 195 168 1.998 Yes Yes
320 Calibration 23 Gainsborough Road / Jubilee Avenue roundabout
FROM ARM D Jun-05 MCC 488051 288138 1037 1191 241 205 2.392 Yes Yes
321 Calibration 24 A427 Westcott Way / Cottingham Road
TO ARM B Jun-05 MCC 487437 288631 1001 24926 221 208 0.901 Yes Yes
322 Calibration 24 A427 Westcott Way / Cottingham Road
FROM ARM B Jun-05 MCC 487617 288872 24926 1001 263 149 7.971 No No
323 Calibration 24 A427 Westcott Way / Cottingham Road
TO ARM C Jun-05 MCC 487437 288631 1001 1012 689 582 4.246 Yes No
324 Calibration 24 A427 Westcott Way / Cottingham Road
FROM ARM C Jun-05 MCC 486824 288932 1012 1001 432 424 0.355 Yes Yes
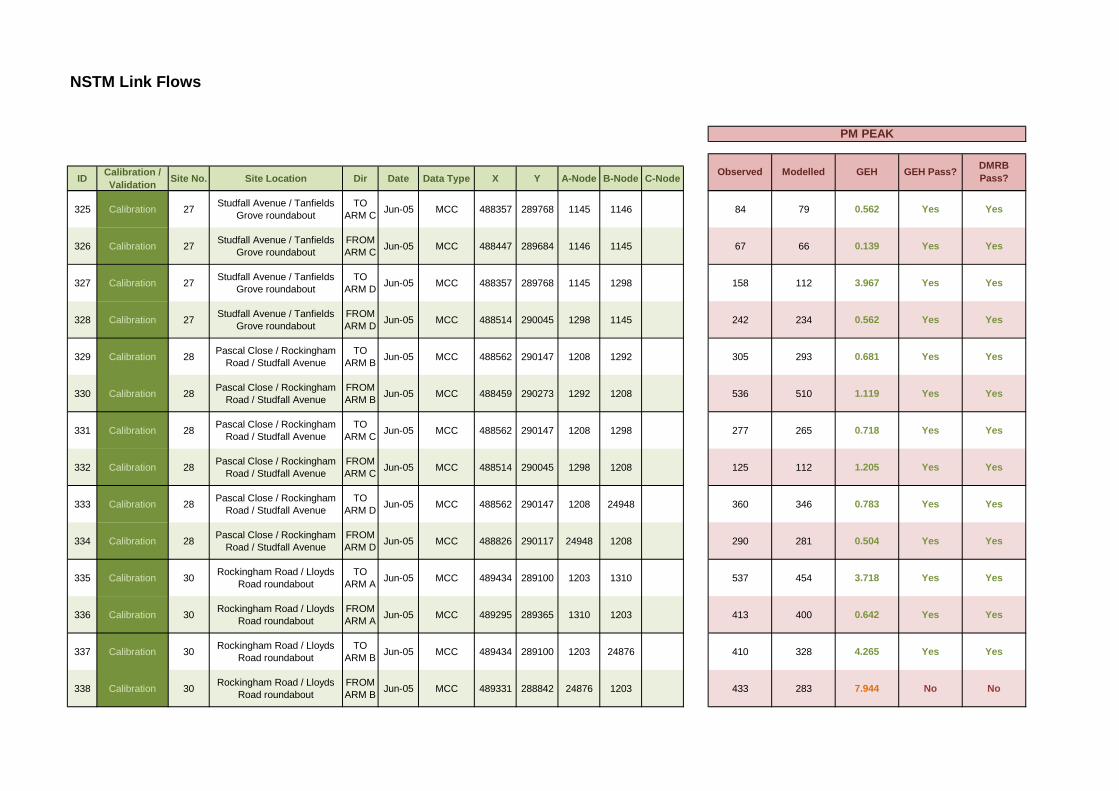
NSTM Link Flows
ID Calibration / Validation Site No. Site Location Dir Date Data Type X Y A-Node B-Node C-Node Modelled GEH GEH Pass? DMRB
Pass?
PM PEAK
Observed
325 Calibration 27 Studfall Avenue / Tanfields Grove roundabout
TO ARM C Jun-05 MCC 488357 289768 1145 1146 84 79 0.562 Yes Yes
326 Calibration 27 Studfall Avenue / Tanfields Grove roundabout
FROM ARM C Jun-05 MCC 488447 289684 1146 1145 67 66 0.139 Yes Yes
327 Calibration 27 Studfall Avenue / Tanfields Grove roundabout
TO ARM D Jun-05 MCC 488357 289768 1145 1298 158 112 3.967 Yes Yes
328 Calibration 27 Studfall Avenue / Tanfields Grove roundabout
FROM ARM D Jun-05 MCC 488514 290045 1298 1145 242 234 0.562 Yes Yes
329 Calibration 28 Pascal Close / Rockingham Road / Studfall Avenue
TO ARM B Jun-05 MCC 488562 290147 1208 1292 305 293 0.681 Yes Yes
330 Calibration 28 Pascal Close / Rockingham Road / Studfall Avenue
FROM ARM B Jun-05 MCC 488459 290273 1292 1208 536 510 1.119 Yes Yes
331 Calibration 28 Pascal Close / Rockingham Road / Studfall Avenue
TO ARM C Jun-05 MCC 488562 290147 1208 1298 277 265 0.718 Yes Yes
332 Calibration 28 Pascal Close / Rockingham Road / Studfall Avenue
FROM ARM C Jun-05 MCC 488514 290045 1298 1208 125 112 1.205 Yes Yes
333 Calibration 28 Pascal Close / Rockingham Road / Studfall Avenue
TO ARM D Jun-05 MCC 488562 290147 1208 24948 360 346 0.783 Yes Yes
334 Calibration 28 Pascal Close / Rockingham Road / Studfall Avenue
FROM ARM D Jun-05 MCC 488826 290117 24948 1208 290 281 0.504 Yes Yes
335 Calibration 30 Rockingham Road / Lloyds Road roundabout
TO ARM A Jun-05 MCC 489434 289100 1203 1310 537 454 3.718 Yes Yes
336 Calibration 30 Rockingham Road / Lloyds Road roundabout
FROM ARM A Jun-05 MCC 489295 289365 1310 1203 413 400 0.642 Yes Yes
337 Calibration 30 Rockingham Road / Lloyds Road roundabout
TO ARM B Jun-05 MCC 489434 289100 1203 24876 410 328 4.265 Yes Yes
338 Calibration 30 Rockingham Road / Lloyds Road roundabout
FROM ARM B Jun-05 MCC 489331 288842 24876 1203 433 283 7.944 No No

NSTM Link Flows
ID Calibration / Validation Site No. Site Location Dir Date Data Type X Y A-Node B-Node C-Node Modelled GEH GEH Pass? DMRB
Pass?
PM PEAK
Observed
339 Calibration 30 Rockingham Road / Lloyds Road roundabout
TO ARM C Jun-05 MCC 489434 289100 1203 1202 597 515 3.477 Yes Yes
340 Calibration 30 Rockingham Road / Lloyds Road roundabout
FROM ARM C Jun-05 MCC 489632 289161 1202 1203 698 614 3.258 Yes Yes
341 Calibration 31 Phoenix Parkway / Lloyds Road
TO ARM C Jun-05 MCC 489632 289161 1202 1201 919 938 0.613 Yes Yes
342 Calibration 31 Phoenix Parkway / Lloyds Road
FROM ARM C Jun-05 MCC 489934 288800 1201 1202 705 660 1.696 Yes Yes
343 Calibration 32 Station Road / Weldon Road / St. Marks Road
TO ARM A Jun-05 MCC 489351 288614 26050 1165 412 407 0.247 Yes Yes
344 Calibration 32 Station Road / Weldon Road / St. Marks Road
FROM ARM A Jun-05 MCC 489253 288830 1165 26050 121 139 1.557 Yes Yes
345 Calibration 32 Station Road / Weldon Road / St. Marks Road
TO ARM B Jun-05 MCC 489368 288577 1167 1041 1013 1178 4.981 Yes No
346 Calibration 32 Station Road / Weldon Road / St. Marks Road
FROM ARM B Jun-05 MCC 488700 288283 1041 1167 821 839 0.642 Yes Yes
347 Calibration 32 Station Road / Weldon Road / St. Marks Road
TO ARM C Jun-05 MCC 489368 288577 1167 1263 38 35 0.485 Yes Yes
348 Calibration 32 Station Road / Weldon Road / St. Marks Road
FROM ARM C Jun-05 MCC 489319 288391 1263 1167 98 96 0.263 Yes Yes
349 Calibration 32 Station Road / Weldon Road / St. Marks Road
TO ARM D Jun-05 MCC 489418 288591 26051 3002 843 792 1.766 Yes Yes
350 Calibration 32 Station Road / Weldon Road / St. Marks Road
FROM ARM D Jun-05 MCC 489801 288698 3002 26051 1266 1338 2.019 Yes Yes
351 Calibration 33 A427 / A6086 / A6116 roundabout
TO ARM C Jun-05 MCC 489934 288800 1201 35001 609 304 14.275 No No
352 Calibration 33 A427 / A6086 / A6116 roundabout
FROM ARM C Jun-05 MCC 491094 287958 35001 1201 527 514 0.551 Yes Yes
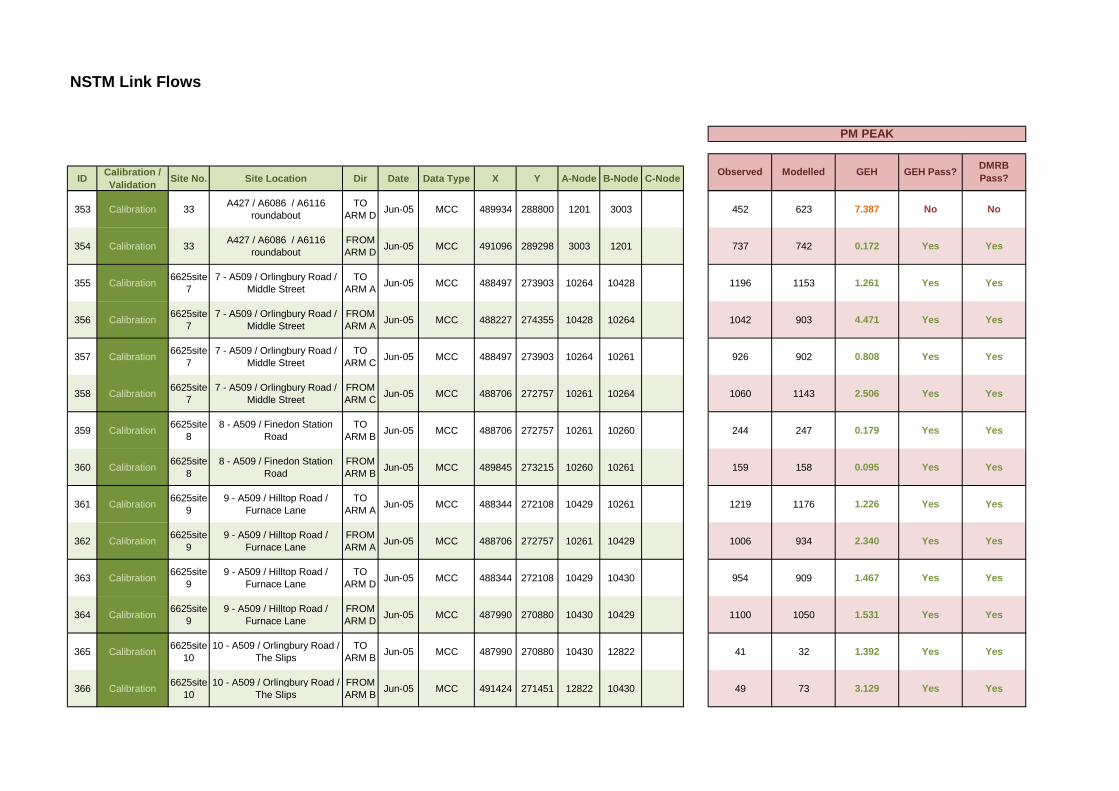
NSTM Link Flows
ID Calibration / Validation Site No. Site Location Dir Date Data Type X Y A-Node B-Node C-Node Modelled GEH GEH Pass? DMRB
Pass?
PM PEAK
Observed
353 Calibration 33 A427 / A6086 / A6116 roundabout
TO ARM D Jun-05 MCC 489934 288800 1201 3003 452 623 7.387 No No
354 Calibration 33 A427 / A6086 / A6116 roundabout
FROM ARM D Jun-05 MCC 491096 289298 3003 1201 737 742 0.172 Yes Yes
355 Calibration 6625site7
7 - A509 / Orlingbury Road / Middle Street
TO ARM A Jun-05 MCC 488497 273903 10264 10428 1196 1153 1.261 Yes Yes
356 Calibration 6625site7
7 - A509 / Orlingbury Road / Middle Street
FROM ARM A Jun-05 MCC 488227 274355 10428 10264 1042 903 4.471 Yes Yes
357 Calibration 6625site7
7 - A509 / Orlingbury Road / Middle Street
TO ARM C Jun-05 MCC 488497 273903 10264 10261 926 902 0.808 Yes Yes
358 Calibration 6625site7
7 - A509 / Orlingbury Road / Middle Street
FROM ARM C Jun-05 MCC 488706 272757 10261 10264 1060 1143 2.506 Yes Yes
359 Calibration 6625site8
8 - A509 / Finedon Station Road
TO ARM B Jun-05 MCC 488706 272757 10261 10260 244 247 0.179 Yes Yes
360 Calibration 6625site8
8 - A509 / Finedon Station Road
FROM ARM B Jun-05 MCC 489845 273215 10260 10261 159 158 0.095 Yes Yes
361 Calibration 6625site9
9 - A509 / Hilltop Road / Furnace Lane
TO ARM A Jun-05 MCC 488344 272108 10429 10261 1219 1176 1.226 Yes Yes
362 Calibration 6625site9
9 - A509 / Hilltop Road / Furnace Lane
FROM ARM A Jun-05 MCC 488706 272757 10261 10429 1006 934 2.340 Yes Yes
363 Calibration 6625site9
9 - A509 / Hilltop Road / Furnace Lane
TO ARM D Jun-05 MCC 488344 272108 10429 10430 954 909 1.467 Yes Yes
364 Calibration 6625site9
9 - A509 / Hilltop Road / Furnace Lane
FROM ARM D Jun-05 MCC 487990 270880 10430 10429 1100 1050 1.531 Yes Yes
365 Calibration 6625site10
10 - A509 / Orlingbury Road / The Slips
TO ARM B Jun-05 MCC 487990 270880 10430 12822 41 32 1.392 Yes Yes
366 Calibration 6625site10
10 - A509 / Orlingbury Road / The Slips
FROM ARM B Jun-05 MCC 491424 271451 12822 10430 49 73 3.129 Yes Yes

NSTM Link Flows
ID Calibration / Validation Site No. Site Location Dir Date Data Type X Y A-Node B-Node C-Node Modelled GEH GEH Pass? DMRB
Pass?
PM PEAK
Observed
367 Calibration 6625site11
11 - A509 / A510 Northen Way / Niort Way
TO ARM C Jun-05 MCC 488260 269710 10155 12805 550 556 0.267 Yes Yes
368 Calibration 6625site11
11 - A509 / A510 Northen Way / Niort Way
FROM ARM C Jun-05 MCC 488602 269773 12805 10155 902 814 3.002 Yes Yes
369 Calibration 6625site11
11 - A509 / A510 Northen Way / Niort Way
TO ARM D Jun-05 MCC 488260 269710 10155 11415 617 617 0.020 Yes Yes
370 Calibration 6625site11
11 - A509 / A510 Northen Way / Niort Way
FROM ARM D Jun-05 MCC 488483 269290 11415 10155 561 569 0.334 Yes Yes
371 Calibration 6625site11
11 - A509 / A510 Northen Way / Niort Way
TO ARM E Jun-05 MCC 488260 269710 10155 11256 910 830 2.733 Yes Yes
372 Calibration 6625site11
11 - A509 / A510 Northen Way / Niort Way
FROM ARM E Jun-05 MCC 487530 269580 11256 10155 905 759 5.070 No No
373 Calibration 6625site12
12 - A509 Wilby Way / Bourton Way / A45
TO ARM A Jun-05 MCC 488032 265867 10162 10161 913 885 0.927 Yes Yes
374 Calibration 6625site12
12 - A509 Wilby Way / Bourton Way / A45
FROM ARM A Jun-05 MCC 487700 266333 10161 10162 1085 1114 0.870 Yes Yes
375 Calibration 6625site12
12 - A509 Wilby Way / Bourton Way / A45
TO ARM B Jun-05 MCC 488032 265867 10162 12908 196 198 0.152 Yes Yes
376 Calibration 6625site12
12 - A509 Wilby Way / Bourton Way / A45
FROM ARM B Jun-05 MCC 488095 266139 12908 10162 199 200 0.100 Yes Yes
377 Calibration 6625site12
12 - A509 Wilby Way / Bourton Way / A45
TO ARM C Jun-05 MCC 488032 265867 10162 10288 1955 1890 1.487 Yes Yes
378 Calibration 6625site12
12 - A509 Wilby Way / Bourton Way / A45
FROM ARM C Jun-05 MCC 488770 265920 10288 10162 2148 2074 1.598 Yes Yes
379 Calibration 6625site13
13 - Main Street / Hardwick Road / Orlingbury Rd
TO ARM A Jun-05 MCC 486864 271331 10266 10429 135 131 0.366 Yes Yes
380 Calibration 6625site13
13 - Main Street / Hardwick Road / Orlingbury Rd
FROM ARM A Jun-05 MCC 488344 272108 10429 10266 73 67 0.788 Yes Yes
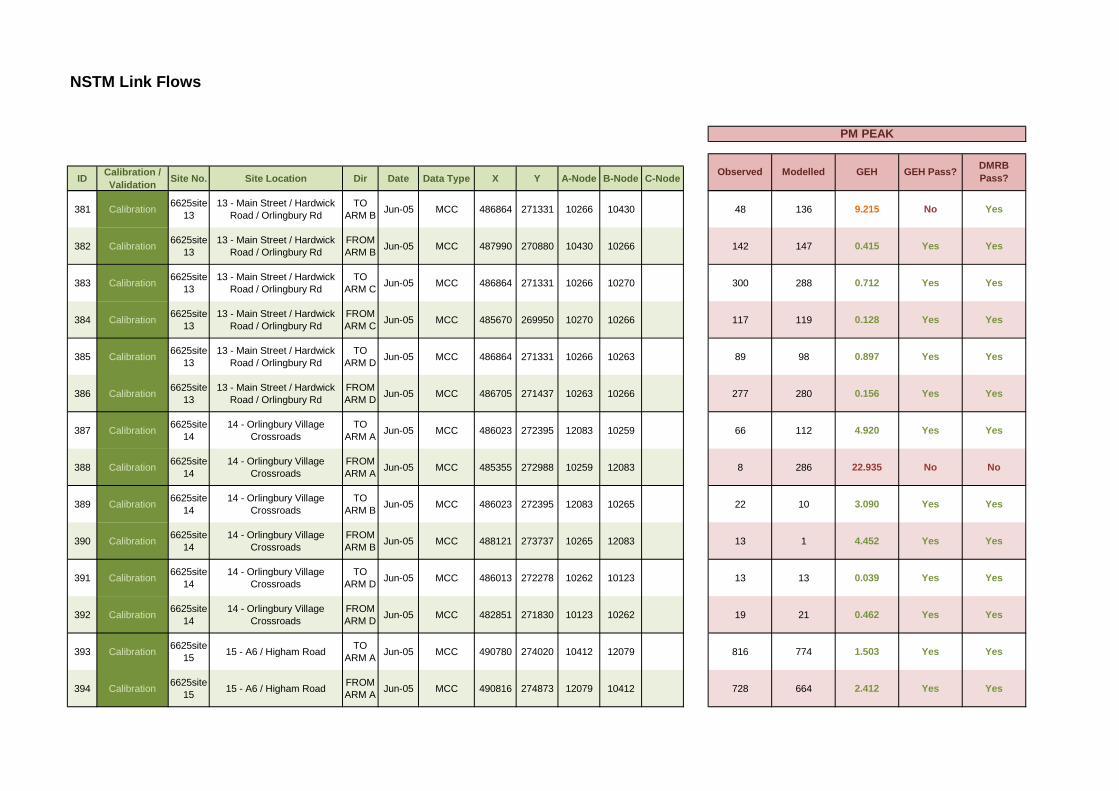
NSTM Link Flows
ID Calibration / Validation Site No. Site Location Dir Date Data Type X Y A-Node B-Node C-Node Modelled GEH GEH Pass? DMRB
Pass?
PM PEAK
Observed
381 Calibration 6625site13
13 - Main Street / Hardwick Road / Orlingbury Rd
TO ARM B Jun-05 MCC 486864 271331 10266 10430 48 136 9.215 No Yes
382 Calibration 6625site13
13 - Main Street / Hardwick Road / Orlingbury Rd
FROM ARM B Jun-05 MCC 487990 270880 10430 10266 142 147 0.415 Yes Yes
383 Calibration 6625site13
13 - Main Street / Hardwick Road / Orlingbury Rd
TO ARM C Jun-05 MCC 486864 271331 10266 10270 300 288 0.712 Yes Yes
384 Calibration 6625site13
13 - Main Street / Hardwick Road / Orlingbury Rd
FROM ARM C Jun-05 MCC 485670 269950 10270 10266 117 119 0.128 Yes Yes
385 Calibration 6625site13
13 - Main Street / Hardwick Road / Orlingbury Rd
TO ARM D Jun-05 MCC 486864 271331 10266 10263 89 98 0.897 Yes Yes
386 Calibration 6625site13
13 - Main Street / Hardwick Road / Orlingbury Rd
FROM ARM D Jun-05 MCC 486705 271437 10263 10266 277 280 0.156 Yes Yes
387 Calibration 6625site14
14 - Orlingbury Village Crossroads
TO ARM A Jun-05 MCC 486023 272395 12083 10259 66 112 4.920 Yes Yes
388 Calibration 6625site14
14 - Orlingbury Village Crossroads
FROM ARM A Jun-05 MCC 485355 272988 10259 12083 8 286 22.935 No No
389 Calibration 6625site14
14 - Orlingbury Village Crossroads
TO ARM B Jun-05 MCC 486023 272395 12083 10265 22 10 3.090 Yes Yes
390 Calibration 6625site14
14 - Orlingbury Village Crossroads
FROM ARM B Jun-05 MCC 488121 273737 10265 12083 13 1 4.452 Yes Yes
391 Calibration 6625site14
14 - Orlingbury Village Crossroads
TO ARM D Jun-05 MCC 486013 272278 10262 10123 13 13 0.039 Yes Yes
392 Calibration 6625site14
14 - Orlingbury Village Crossroads
FROM ARM D Jun-05 MCC 482851 271830 10123 10262 19 21 0.462 Yes Yes
393 Calibration 6625site15 15 - A6 / Higham Road TO
ARM A Jun-05 MCC 490780 274020 10412 12079 816 774 1.503 Yes Yes
394 Calibration 6625site15 15 - A6 / Higham Road FROM
ARM A Jun-05 MCC 490816 274873 12079 10412 728 664 2.412 Yes Yes

NSTM Link Flows
ID Calibration / Validation Site No. Site Location Dir Date Data Type X Y A-Node B-Node C-Node Modelled GEH GEH Pass? DMRB
Pass?
PM PEAK
Observed
395 Calibration 6625site15 15 - A6 / Higham Road TO
ARM C Jun-05 MCC 490780 274020 10412 12059 147 147 0.025 Yes Yes
396 Calibration 6625site15 15 - A6 / Higham Road FROM
ARM C Jun-05 MCC 490160 274340 12059 10412 100 99 0.122 Yes Yes
397 Calibration 6625site16
16 - A6 Burton Road / A510 Thrapston Road
TO ARM A Jun-05 MCC 492148 272172 10415 12133 303 304 0.069 Yes Yes
398 Calibration 6625site16
16 - A6 Burton Road / A510 Thrapston Road
FROM ARM A Jun-05 MCC 492252 272371 12133 10415 289 290 0.040 Yes Yes
399 Calibration 6625site16
16 - A6 Burton Road / A510 Thrapston Road
TO ARM B Jun-05 MCC 492148 272172 10415 12128 926 827 3.362 Yes Yes
400 Calibration 6625site16
16 - A6 Burton Road / A510 Thrapston Road
FROM ARM B Jun-05 MCC 492252 272059 12128 10415 789 790 0.033 Yes Yes
401 Calibration 6625site16
16 - A6 Burton Road / A510 Thrapston Road
TO ARM D Jun-05 MCC 492148 272172 10415 12244 906 902 0.131 Yes Yes
402 Calibration 6625site16
16 - A6 Burton Road / A510 Thrapston Road
FROM ARM D Jun-05 MCC 492107 272224 12244 10415 767 740 1.008 Yes Yes
403 Calibration 6625site17
17 - A510 Finedon Road / Rixon Road
TO ARM A Jun-05 MCC 490393 269168 11153 11151 337 314 1.281 Yes Yes
404 Calibration 6625site17
17 - A510 Finedon Road / Rixon Road
FROM ARM A Jun-05 MCC 489800 269600 11151 11153 640 677 1.420 Yes Yes
405 Calibration 6625site17
17 - A510 Finedon Road / Rixon Road
TO ARM C Jun-05 MCC 490393 269168 11153 25030 595 630 1.442 Yes Yes
406 Calibration 6625site17
17 - A510 Finedon Road / Rixon Road
FROM ARM C Jun-05 MCC 490297 269109 25030 11153 694 672 0.823 Yes Yes
407 Calibration 24 Broughton NB Jun-05 ATC 483960 276650 12272 12728 1244 1236 0.210 Yes Yes408 Calibration 24 Broughton SB Jun-05 ATC 483960 276650 12728 12272 1086 1061 0.767 Yes Yes
409 Calibration 29 Wellingborough Rd, Wollaston NB Jun-05 ATC 490314 263000 10295 12547 779 749 1.075 Yes Yes
410 Calibration 29 Wellingborough Rd, Wollaston SB Jun-05 ATC 490314 263000 12547 10295 562 550 0.534 Yes Yes
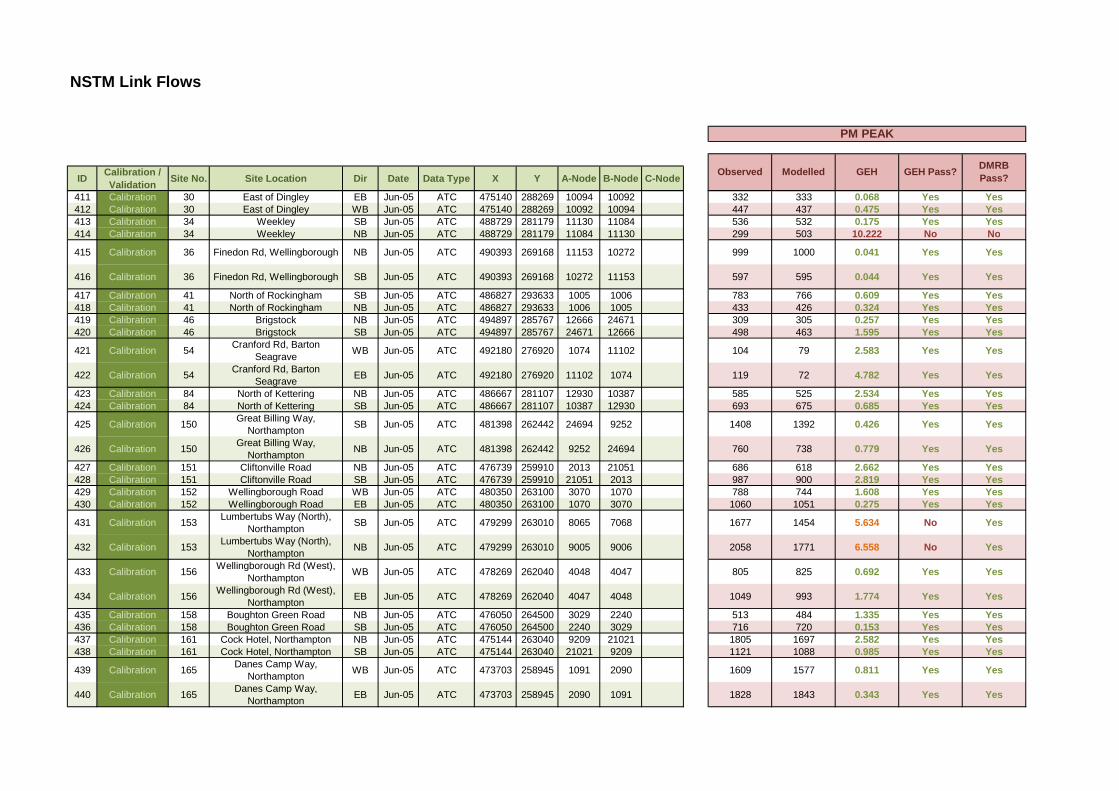
NSTM Link Flows
ID Calibration / Validation Site No. Site Location Dir Date Data Type X Y A-Node B-Node C-Node Modelled GEH GEH Pass? DMRB
Pass?
PM PEAK
Observed
411 Calibration 30 East of Dingley EB Jun-05 ATC 475140 288269 10094 10092 332 333 0.068 Yes Yes412 Calibration 30 East of Dingley WB Jun-05 ATC 475140 288269 10092 10094 447 437 0.475 Yes Yes413 Calibration 34 Weekley SB Jun-05 ATC 488729 281179 11130 11084 536 532 0.175 Yes Yes414 Calibration 34 Weekley NB Jun-05 ATC 488729 281179 11084 11130 299 503 10.222 No No
415 Calibration 36 Finedon Rd, Wellingborough NB Jun-05 ATC 490393 269168 11153 10272 999 1000 0.041 Yes Yes
416 Calibration 36 Finedon Rd, Wellingborough SB Jun-05 ATC 490393 269168 10272 11153 597 595 0.044 Yes Yes
417 Calibration 41 North of Rockingham SB Jun-05 ATC 486827 293633 1005 1006 783 766 0.609 Yes Yes418 Calibration 41 North of Rockingham NB Jun-05 ATC 486827 293633 1006 1005 433 426 0.324 Yes Yes419 Calibration 46 Brigstock NB Jun-05 ATC 494897 285767 12666 24671 309 305 0.257 Yes Yes420 Calibration 46 Brigstock SB Jun-05 ATC 494897 285767 24671 12666 498 463 1.595 Yes Yes
421 Calibration 54 Cranford Rd, Barton Seagrave WB Jun-05 ATC 492180 276920 1074 11102 104 79 2.583 Yes Yes
422 Calibration 54 Cranford Rd, Barton Seagrave EB Jun-05 ATC 492180 276920 11102 1074 119 72 4.782 Yes Yes
423 Calibration 84 North of Kettering NB Jun-05 ATC 486667 281107 12930 10387 585 525 2.534 Yes Yes424 Calibration 84 North of Kettering SB Jun-05 ATC 486667 281107 10387 12930 693 675 0.685 Yes Yes
425 Calibration 150 Great Billing Way, Northampton SB Jun-05 ATC 481398 262442 24694 9252 1408 1392 0.426 Yes Yes
426 Calibration 150 Great Billing Way, Northampton NB Jun-05 ATC 481398 262442 9252 24694 760 738 0.779 Yes Yes
427 Calibration 151 Cliftonville Road NB Jun-05 ATC 476739 259910 2013 21051 686 618 2.662 Yes Yes428 Calibration 151 Cliftonville Road SB Jun-05 ATC 476739 259910 21051 2013 987 900 2.819 Yes Yes429 Calibration 152 Wellingborough Road WB Jun-05 ATC 480350 263100 3070 1070 788 744 1.608 Yes Yes430 Calibration 152 Wellingborough Road EB Jun-05 ATC 480350 263100 1070 3070 1060 1051 0.275 Yes Yes
431 Calibration 153 Lumbertubs Way (North), Northampton SB Jun-05 ATC 479299 263010 8065 7068 1677 1454 5.634 No Yes
432 Calibration 153 Lumbertubs Way (North), Northampton NB Jun-05 ATC 479299 263010 9005 9006 2058 1771 6.558 No Yes
433 Calibration 156 Wellingborough Rd (West), Northampton WB Jun-05 ATC 478269 262040 4048 4047 805 825 0.692 Yes Yes
434 Calibration 156 Wellingborough Rd (West), Northampton EB Jun-05 ATC 478269 262040 4047 4048 1049 993 1.774 Yes Yes
435 Calibration 158 Boughton Green Road NB Jun-05 ATC 476050 264500 3029 2240 513 484 1.335 Yes Yes436 Calibration 158 Boughton Green Road SB Jun-05 ATC 476050 264500 2240 3029 716 720 0.153 Yes Yes437 Calibration 161 Cock Hotel, Northampton NB Jun-05 ATC 475144 263040 9209 21021 1805 1697 2.582 Yes Yes438 Calibration 161 Cock Hotel, Northampton SB Jun-05 ATC 475144 263040 21021 9209 1121 1088 0.985 Yes Yes
439 Calibration 165 Danes Camp Way, Northampton WB Jun-05 ATC 473703 258945 1091 2090 1609 1577 0.811 Yes Yes
440 Calibration 165 Danes Camp Way, Northampton EB Jun-05 ATC 473703 258945 2090 1091 1828 1843 0.343 Yes Yes
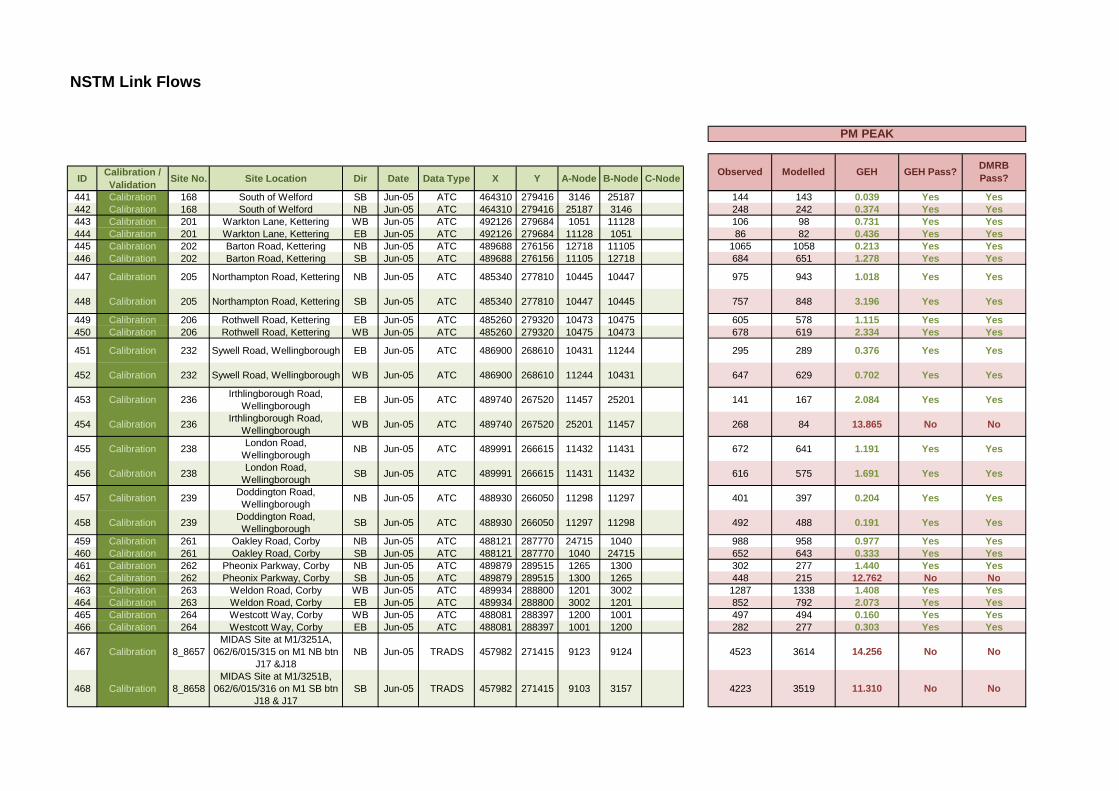
NSTM Link Flows
ID Calibration / Validation Site No. Site Location Dir Date Data Type X Y A-Node B-Node C-Node Modelled GEH GEH Pass? DMRB
Pass?
PM PEAK
Observed
441 Calibration 168 South of Welford SB Jun-05 ATC 464310 279416 3146 25187 144 143 0.039 Yes Yes442 Calibration 168 South of Welford NB Jun-05 ATC 464310 279416 25187 3146 248 242 0.374 Yes Yes443 Calibration 201 Warkton Lane, Kettering WB Jun-05 ATC 492126 279684 1051 11128 106 98 0.731 Yes Yes444 Calibration 201 Warkton Lane, Kettering EB Jun-05 ATC 492126 279684 11128 1051 86 82 0.436 Yes Yes445 Calibration 202 Barton Road, Kettering NB Jun-05 ATC 489688 276156 12718 11105 1065 1058 0.213 Yes Yes446 Calibration 202 Barton Road, Kettering SB Jun-05 ATC 489688 276156 11105 12718 684 651 1.278 Yes Yes
447 Calibration 205 Northampton Road, Kettering NB Jun-05 ATC 485340 277810 10445 10447 975 943 1.018 Yes Yes
448 Calibration 205 Northampton Road, Kettering SB Jun-05 ATC 485340 277810 10447 10445 757 848 3.196 Yes Yes
449 Calibration 206 Rothwell Road, Kettering EB Jun-05 ATC 485260 279320 10473 10475 605 578 1.115 Yes Yes450 Calibration 206 Rothwell Road, Kettering WB Jun-05 ATC 485260 279320 10475 10473 678 619 2.334 Yes Yes
451 Calibration 232 Sywell Road, Wellingborough EB Jun-05 ATC 486900 268610 10431 11244 295 289 0.376 Yes Yes
452 Calibration 232 Sywell Road, Wellingborough WB Jun-05 ATC 486900 268610 11244 10431 647 629 0.702 Yes Yes
453 Calibration 236 Irthlingborough Road, Wellingborough EB Jun-05 ATC 489740 267520 11457 25201 141 167 2.084 Yes Yes
454 Calibration 236 Irthlingborough Road, Wellingborough WB Jun-05 ATC 489740 267520 25201 11457 268 84 13.865 No No
455 Calibration 238 London Road, Wellingborough NB Jun-05 ATC 489991 266615 11432 11431 672 641 1.191 Yes Yes
456 Calibration 238 London Road, Wellingborough SB Jun-05 ATC 489991 266615 11431 11432 616 575 1.691 Yes Yes
457 Calibration 239 Doddington Road, Wellingborough NB Jun-05 ATC 488930 266050 11298 11297 401 397 0.204 Yes Yes
458 Calibration 239 Doddington Road, Wellingborough SB Jun-05 ATC 488930 266050 11297 11298 492 488 0.191 Yes Yes
459 Calibration 261 Oakley Road, Corby NB Jun-05 ATC 488121 287770 24715 1040 988 958 0.977 Yes Yes460 Calibration 261 Oakley Road, Corby SB Jun-05 ATC 488121 287770 1040 24715 652 643 0.333 Yes Yes461 Calibration 262 Pheonix Parkway, Corby NB Jun-05 ATC 489879 289515 1265 1300 302 277 1.440 Yes Yes462 Calibration 262 Pheonix Parkway, Corby SB Jun-05 ATC 489879 289515 1300 1265 448 215 12.762 No No463 Calibration 263 Weldon Road, Corby WB Jun-05 ATC 489934 288800 1201 3002 1287 1338 1.408 Yes Yes464 Calibration 263 Weldon Road, Corby EB Jun-05 ATC 489934 288800 3002 1201 852 792 2.073 Yes Yes465 Calibration 264 Westcott Way, Corby WB Jun-05 ATC 488081 288397 1200 1001 497 494 0.160 Yes Yes466 Calibration 264 Westcott Way, Corby EB Jun-05 ATC 488081 288397 1001 1200 282 277 0.303 Yes Yes
467 Calibration 8_8657MIDAS Site at M1/3251A,
062/6/015/315 on M1 NB btn J17 &J18
NB Jun-05 TRADS 457982 271415 9123 9124 4523 3614 14.256 No No
468 Calibration 8_8658MIDAS Site at M1/3251B,
062/6/015/316 on M1 SB btn J18 & J17
SB Jun-05 TRADS 457982 271415 9103 3157 4223 3519 11.310 No No
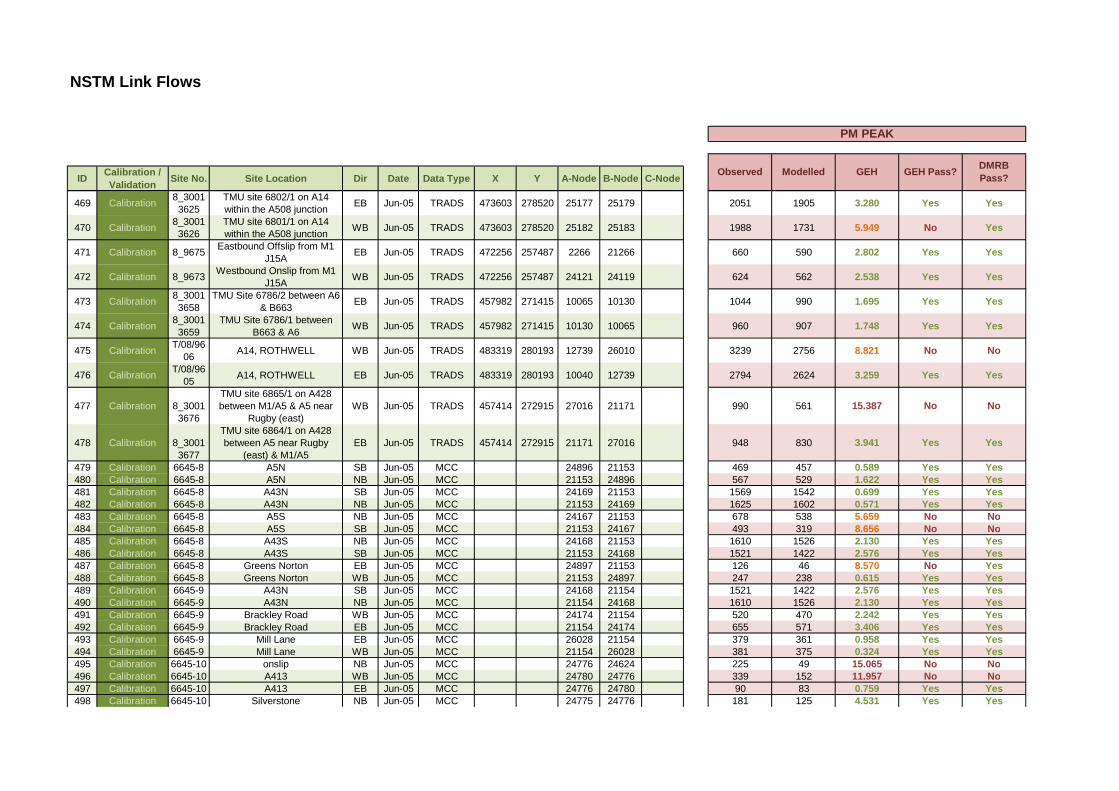
NSTM Link Flows
ID Calibration / Validation Site No. Site Location Dir Date Data Type X Y A-Node B-Node C-Node Modelled GEH GEH Pass? DMRB
Pass?
PM PEAK
Observed
469 Calibration 8_30013625
TMU site 6802/1 on A14 within the A508 junction EB Jun-05 TRADS 473603 278520 25177 25179 2051 1905 3.280 Yes Yes
470 Calibration 8_30013626
TMU site 6801/1 on A14 within the A508 junction WB Jun-05 TRADS 473603 278520 25182 25183 1988 1731 5.949 No Yes
471 Calibration 8_9675 Eastbound Offslip from M1 J15A EB Jun-05 TRADS 472256 257487 2266 21266 660 590 2.802 Yes Yes
472 Calibration 8_9673 Westbound Onslip from M1 J15A WB Jun-05 TRADS 472256 257487 24121 24119 624 562 2.538 Yes Yes
473 Calibration 8_30013658
TMU Site 6786/2 between A6 & B663 EB Jun-05 TRADS 457982 271415 10065 10130 1044 990 1.695 Yes Yes
474 Calibration 8_30013659
TMU Site 6786/1 between B663 & A6 WB Jun-05 TRADS 457982 271415 10130 10065 960 907 1.748 Yes Yes
475 Calibration T/08/9606 A14, ROTHWELL WB Jun-05 TRADS 483319 280193 12739 26010 3239 2756 8.821 No No
476 Calibration T/08/9605 A14, ROTHWELL EB Jun-05 TRADS 483319 280193 10040 12739 2794 2624 3.259 Yes Yes
477 Calibration
8_30013676
TMU site 6865/1 on A428 between M1/A5 & A5 near
Rugby (east)WB Jun-05 TRADS 457414 272915 27016 21171 990 561 15.387 No No
478 Calibration
8_30013677
TMU site 6864/1 on A428 between A5 near Rugby
(east) & M1/A5EB Jun-05 TRADS 457414 272915 21171 27016 948 830 3.941 Yes Yes
479 Calibration 6645-8 A5N SB Jun-05 MCC 24896 21153 469 457 0.589 Yes Yes480 Calibration 6645-8 A5N NB Jun-05 MCC 21153 24896 567 529 1.622 Yes Yes481 Calibration 6645-8 A43N SB Jun-05 MCC 24169 21153 1569 1542 0.699 Yes Yes482 Calibration 6645-8 A43N NB Jun-05 MCC 21153 24169 1625 1602 0.571 Yes Yes483 Calibration 6645-8 A5S NB Jun-05 MCC 24167 21153 678 538 5.659 No No484 Calibration 6645-8 A5S SB Jun-05 MCC 21153 24167 493 319 8.656 No No485 Calibration 6645-8 A43S NB Jun-05 MCC 24168 21153 1610 1526 2.130 Yes Yes486 Calibration 6645-8 A43S SB Jun-05 MCC 21153 24168 1521 1422 2.576 Yes Yes487 Calibration 6645-8 Greens Norton EB Jun-05 MCC 24897 21153 126 46 8.570 No Yes488 Calibration 6645-8 Greens Norton WB Jun-05 MCC 21153 24897 247 238 0.615 Yes Yes489 Calibration 6645-9 A43N SB Jun-05 MCC 24168 21154 1521 1422 2.576 Yes Yes490 Calibration 6645-9 A43N NB Jun-05 MCC 21154 24168 1610 1526 2.130 Yes Yes491 Calibration 6645-9 Brackley Road WB Jun-05 MCC 24174 21154 520 470 2.242 Yes Yes492 Calibration 6645-9 Brackley Road EB Jun-05 MCC 21154 24174 655 571 3.406 Yes Yes493 Calibration 6645-9 Mill Lane EB Jun-05 MCC 26028 21154 379 361 0.958 Yes Yes494 Calibration 6645-9 Mill Lane WB Jun-05 MCC 21154 26028 381 375 0.324 Yes Yes495 Calibration 6645-10 onslip NB Jun-05 MCC 24776 24624 225 49 15.065 No No496 Calibration 6645-10 A413 WB Jun-05 MCC 24780 24776 339 152 11.957 No No497 Calibration 6645-10 A413 EB Jun-05 MCC 24776 24780 90 83 0.759 Yes Yes498 Calibration 6645-10 Silverstone NB Jun-05 MCC 24775 24776 181 125 4.531 Yes Yes
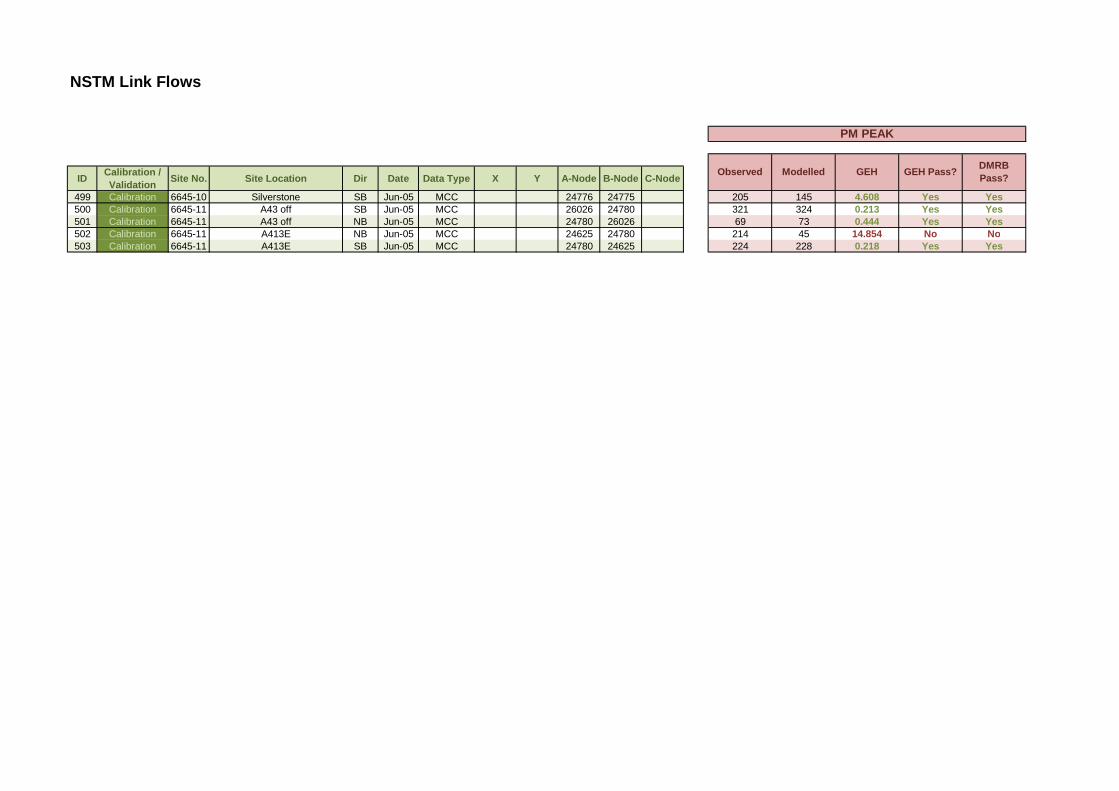
NSTM Link Flows
ID Calibration / Validation Site No. Site Location Dir Date Data Type X Y A-Node B-Node C-Node Modelled GEH GEH Pass? DMRB
Pass?
PM PEAK
Observed
499 Calibration 6645-10 Silverstone SB Jun-05 MCC 24776 24775 205 145 4.608 Yes Yes500 Calibration 6645-11 A43 off SB Jun-05 MCC 26026 24780 321 324 0.213 Yes Yes501 Calibration 6645-11 A43 off NB Jun-05 MCC 24780 26026 69 73 0.444 Yes Yes502 Calibration 6645-11 A413E NB Jun-05 MCC 24625 24780 214 45 14.854 No No503 Calibration 6645-11 A413E SB Jun-05 MCC 24780 24625 224 228 0.218 Yes Yes

NSTM - LMVR Highway Model Version 1.0 59
APPENDIX NO 9: Journey Time Graphs – AM Peak
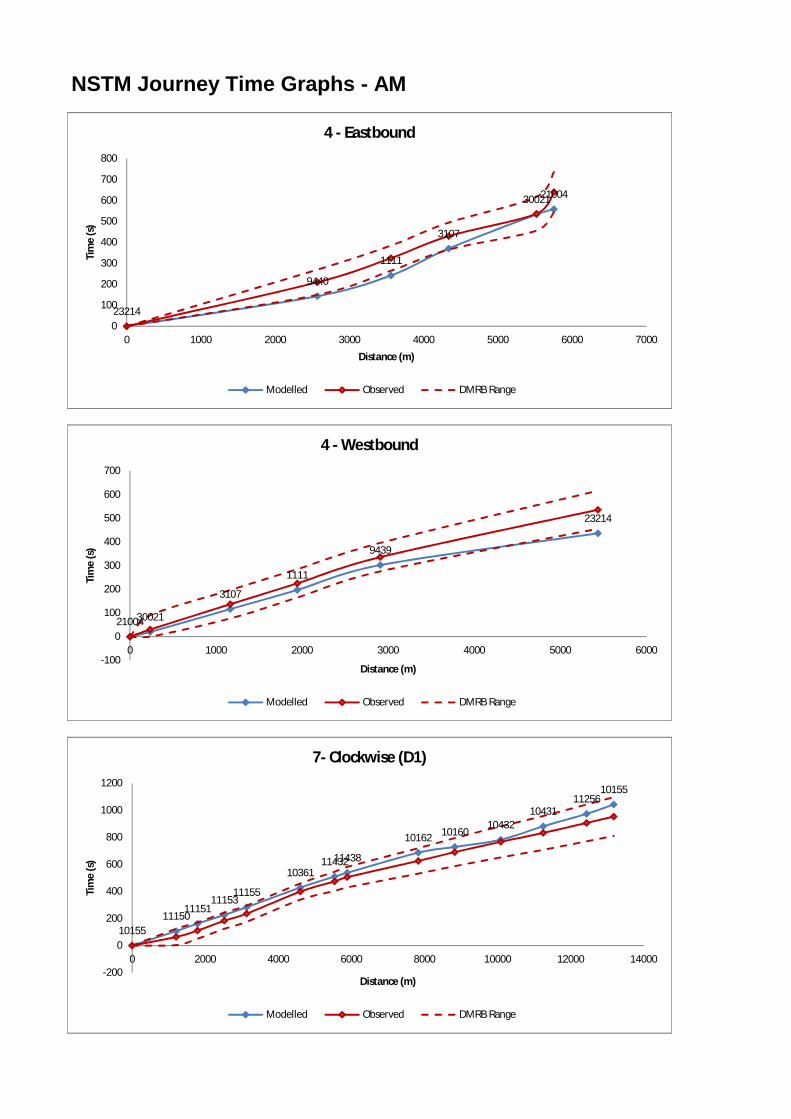
NSTM Journey Time Graphs - AM
23214
9440
1111
3107
3002121004
0
100
200
300
400
500
600
700
800
0 1000 2000 3000 4000 5000 6000 7000
Tim
e (s
)
Distance (m)
4 - Eastbound
Modelled Observed DMRB Range
2100430021
3107
1111
9439
23214
-100
0
100
200
300
400
500
600
700
0 1000 2000 3000 4000 5000 6000
Tim
e (s
)
Distance (m)
4 - Westbound
Modelled Observed DMRB Range
1015511150
1115111153
11155
103611143211438
10162 1016010432
1043111256
10155
-200
0
200
400
600
800
1000
1200
0 2000 4000 6000 8000 10000 12000 14000
Tim
e (s
)
Distance (m)
7- Clockwise (D1)
Modelled Observed DMRB Range
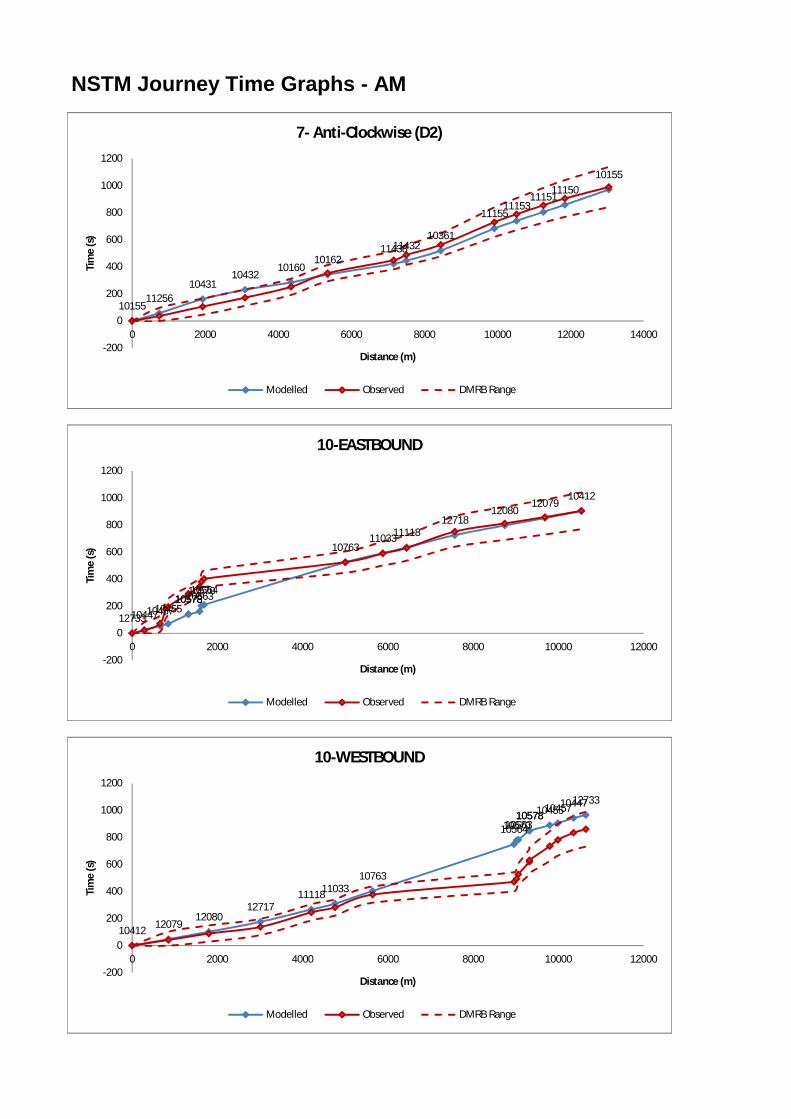
NSTM Journey Time Graphs - AM
1015511256
1043110432
1016010162
114381143210361
1115511153
1115111150
10155
-200
0
200
400
600
800
1000
1200
0 2000 4000 6000 8000 10000 12000 14000
Tim
e (s
)
Distance (m)
7- Anti-Clockwise (D2)
Modelled Observed DMRB Range
127331044710457104551057810578105631057010564
107631103311118
1271812080
1207910412
-200
0
200
400
600
800
1000
1200
0 2000 4000 6000 8000 10000 12000
Tim
e (s
)
Distance (m)
10-EASTBOUND
Modelled Observed DMRB Range
10412 1207912080
127171111811033
10763
105641057010563105781057810455104571044712733
-200
0
200
400
600
800
1000
1200
0 2000 4000 6000 8000 10000 12000
Tim
e (s
)
Distance (m)
10-WESTBOUND
Modelled Observed DMRB Range
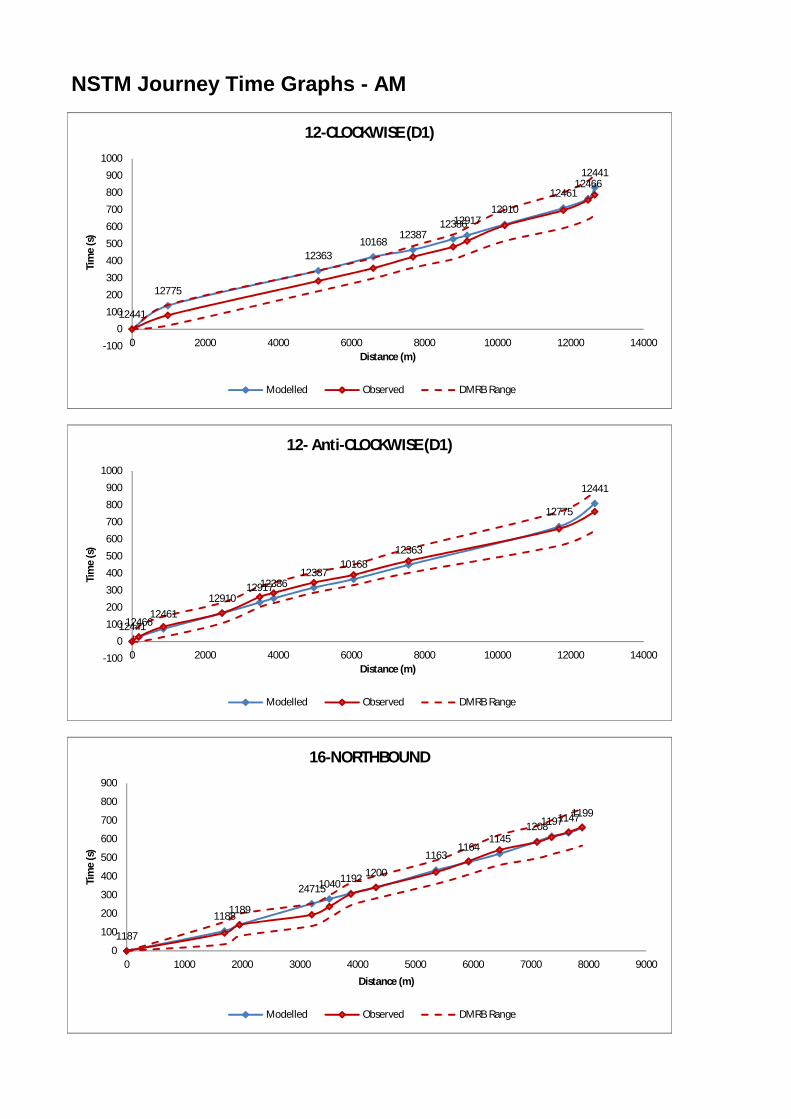
NSTM Journey Time Graphs - AM
12441
12775
1236310168
123871238612917
1291012461
1246612441
-100
0100
200
300
400
500
600
700
800
900
1000
0 2000 4000 6000 8000 10000 12000 14000
Tim
e (s
)
Distance (m)
12-CLOCKWISE (D1)
Modelled Observed DMRB Range
124411246612461
129101291712386
1238710168
12363
12775
12441
-100
0100
200
300
400
500
600
700
800
900
1000
0 2000 4000 6000 8000 10000 12000 14000
Tim
e (s
)
Distance (m)
12- Anti-CLOCKWISE (D1)
Modelled Observed DMRB Range
1187
11881189
2471510401192 1200
11631164
11451208119711471199
0
100
200
300
400
500
600
700
800
900
0 1000 2000 3000 4000 5000 6000 7000 8000 9000
Tim
e (s
)
Distance (m)
16-NORTHBOUND
Modelled Observed DMRB Range
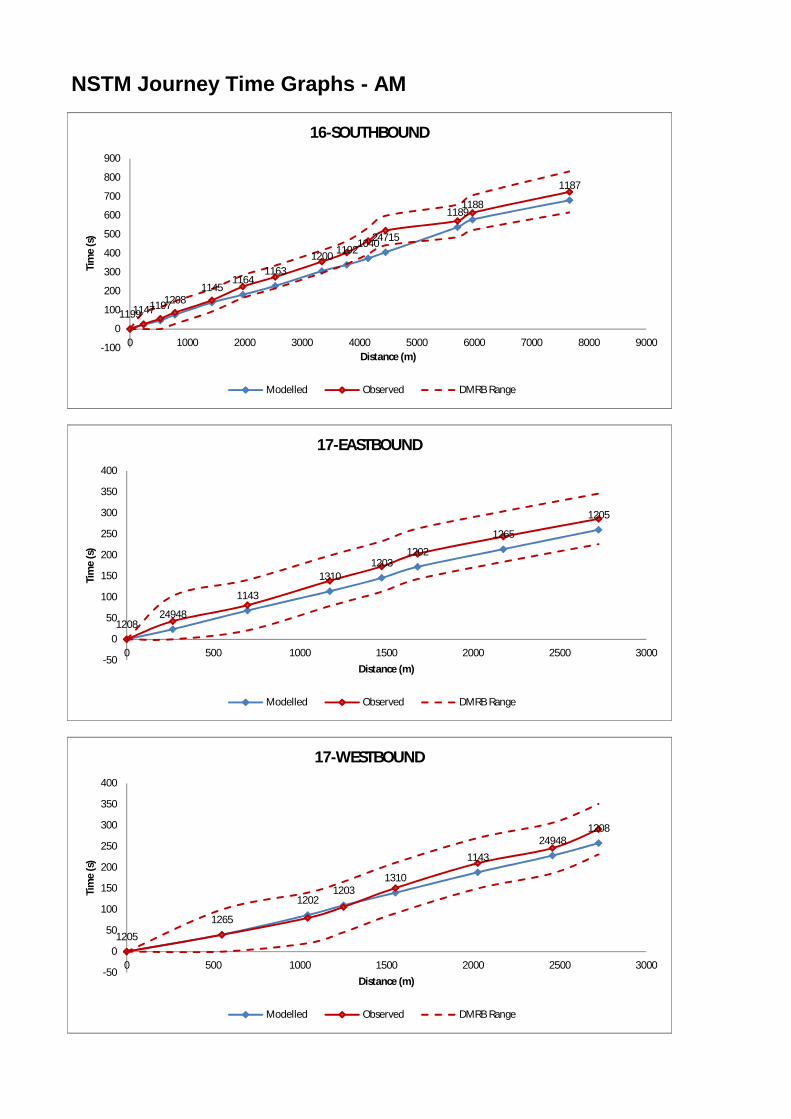
NSTM Journey Time Graphs - AM
11991147119712081145
11641163
1200 1192104024715
11891188
1187
-100
0
100
200
300
400
500
600
700
800
900
0 1000 2000 3000 4000 5000 6000 7000 8000 9000
Tim
e (s
)
Distance (m)
16-SOUTHBOUND
Modelled Observed DMRB Range
120824948
1143
13101203
1202
1265
1205
-50
0
50
100
150
200
250
300
350
400
0 500 1000 1500 2000 2500 3000
Tim
e (s
)
Distance (m)
17-EASTBOUND
Modelled Observed DMRB Range
1205
1265
12021203
1310
114324948
1208
-50
0
50
100
150
200
250
300
350
400
0 500 1000 1500 2000 2500 3000
Tim
e (s
)
Distance (m)
17-WESTBOUND
Modelled Observed DMRB Range
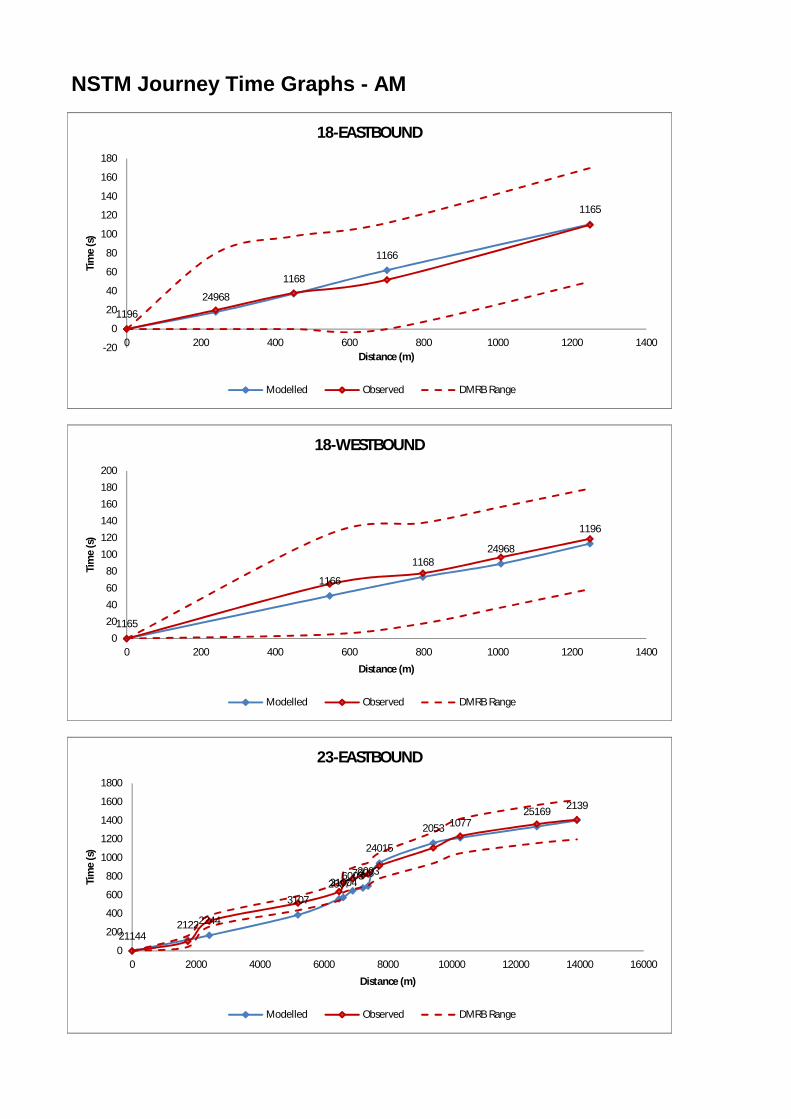
NSTM Journey Time Graphs - AM
1196
24968
1168
1166
1165
-20
0
20
40
60
80
100
120
140
160
180
0 200 400 600 800 1000 1200 1400
Tim
e (s
)
Distance (m)
18-EASTBOUND
Modelled Observed DMRB Range
1165
1166
116824968
1196
020406080
100120140160180200
0 200 400 600 800 1000 1200 1400
Tim
e (s
)
Distance (m)
18-WESTBOUND
Modelled Observed DMRB Range
2114421222244
3107200721004600370032003
24015
2053 107725169 2139
0
200
400
600
800
1000
1200
1400
1600
1800
0 2000 4000 6000 8000 10000 12000 14000 16000
Tim
e (s
)
Distance (m)
23-EASTBOUND
Modelled Observed DMRB Range
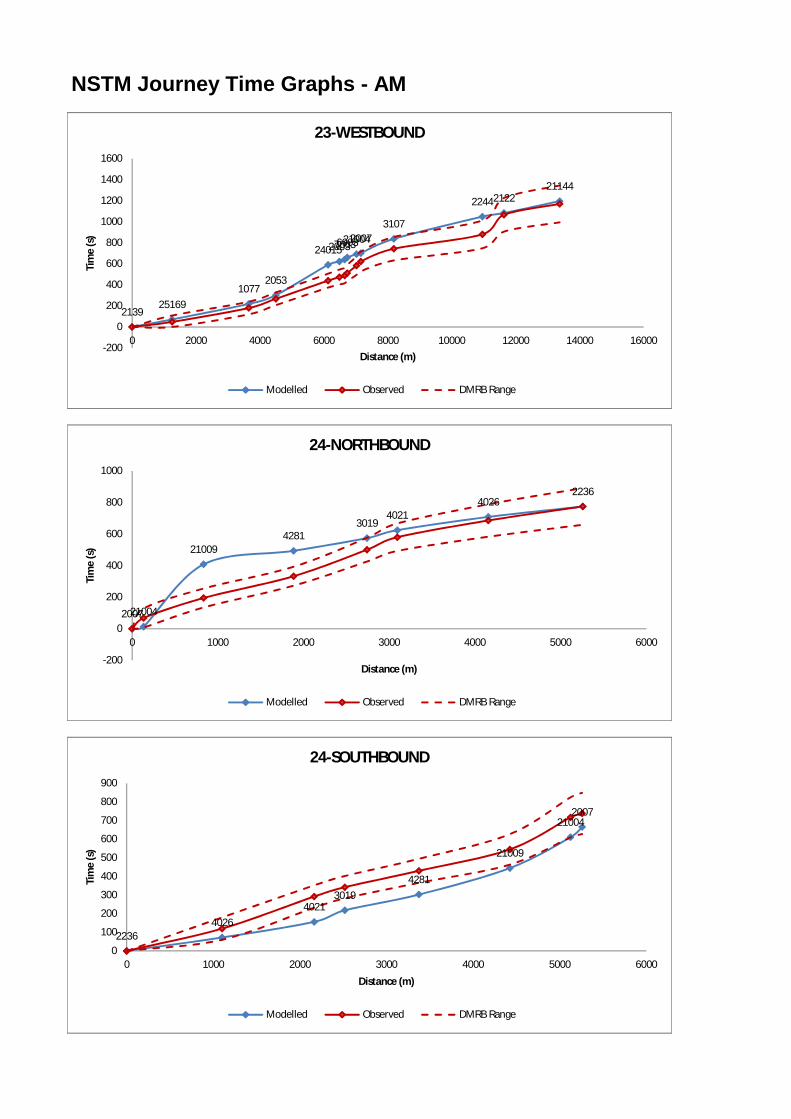
NSTM Journey Time Graphs - AM
213925169
10772053
240152003700360032100420073107
2244212221144
-200
0
200
400
600
800
1000
1200
1400
1600
0 2000 4000 6000 8000 10000 12000 14000 16000
Tim
e (s
)
Distance (m)
23-WESTBOUND
Modelled Observed DMRB Range
200721004
210094281
30194021
40262236
-200
0
200
400
600
800
1000
0 1000 2000 3000 4000 5000 6000
Tim
e (s
)
Distance (m)
24-NORTHBOUND
Modelled Observed DMRB Range
22364026
40213019
4281
21009
210042007
0
100
200
300
400
500
600
700
800
900
0 1000 2000 3000 4000 5000 6000
Tim
e (s
)
Distance (m)
24-SOUTHBOUND
Modelled Observed DMRB Range
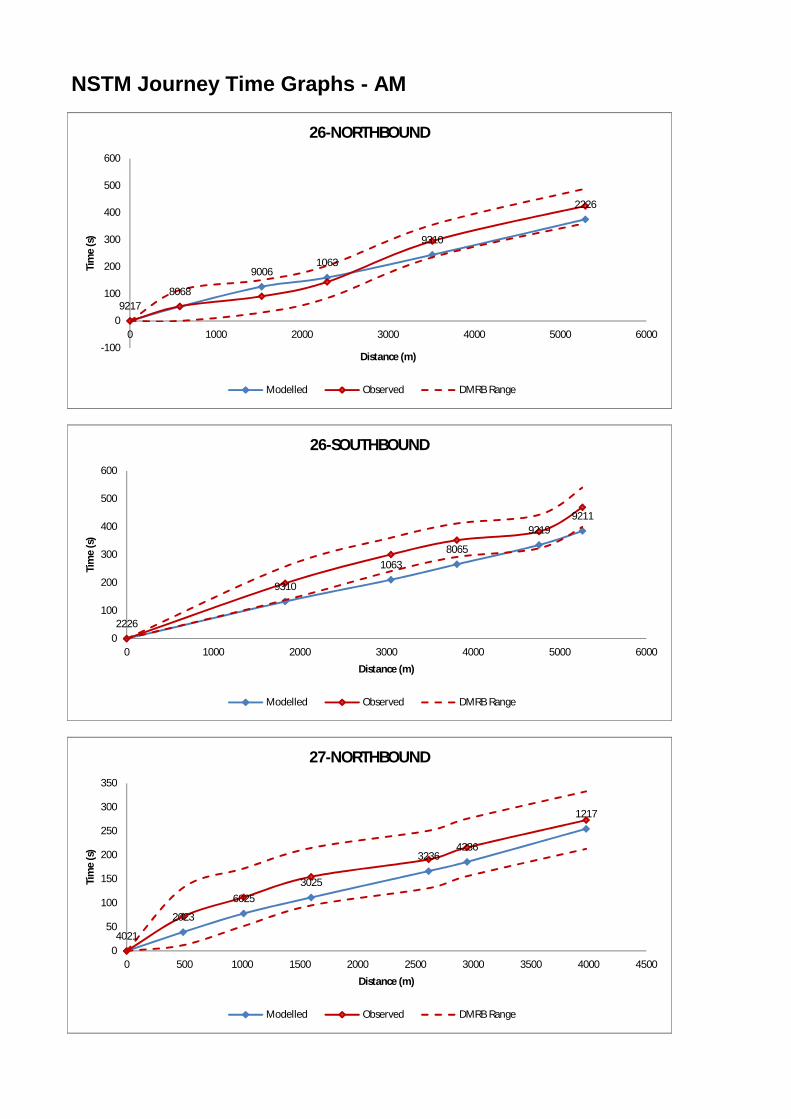
NSTM Journey Time Graphs - AM
92178068
90061063
9310
2226
-100
0
100
200
300
400
500
600
0 1000 2000 3000 4000 5000 6000
Tim
e (s
)
Distance (m)
26-NORTHBOUND
Modelled Observed DMRB Range
2226
9310
10638065
92199211
0
100
200
300
400
500
600
0 1000 2000 3000 4000 5000 6000
Tim
e (s
)
Distance (m)
26-SOUTHBOUND
Modelled Observed DMRB Range
4021
2023
60253025
32364236
1217
0
50
100
150
200
250
300
350
0 500 1000 1500 2000 2500 3000 3500 4000 4500
Tim
e (s
)
Distance (m)
27-NORTHBOUND
Modelled Observed DMRB Range
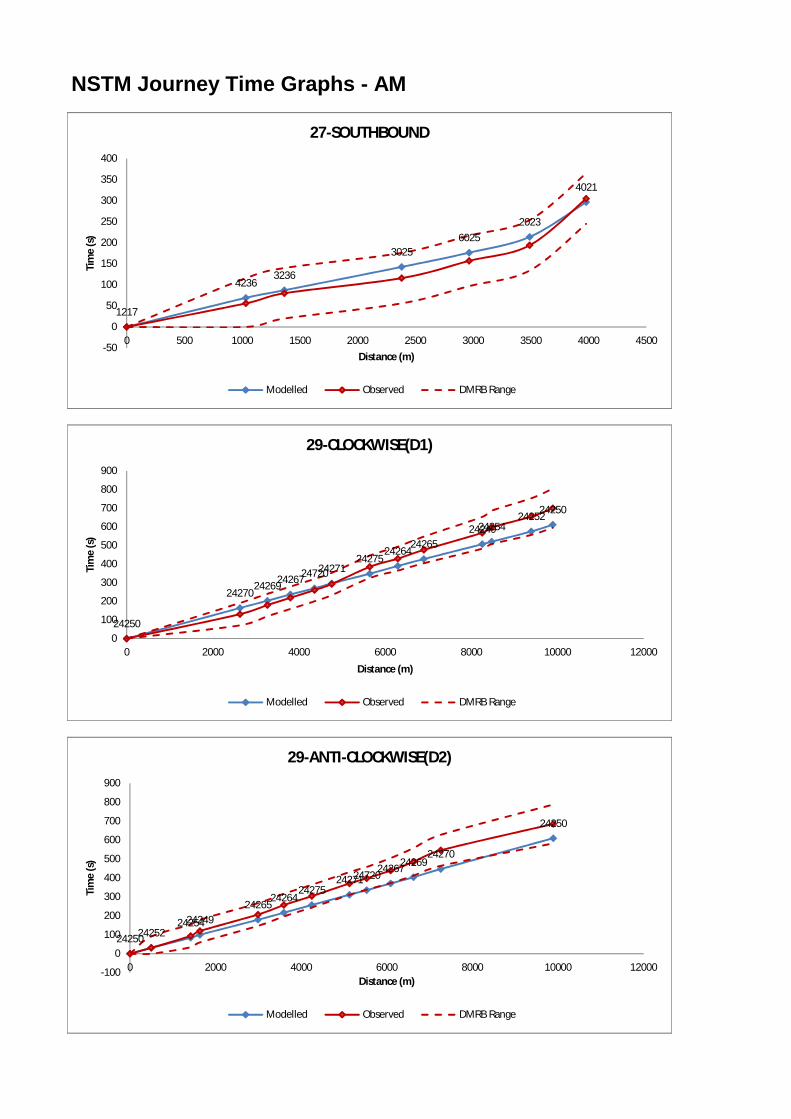
NSTM Journey Time Graphs - AM
1217
42363236
30256025
2023
4021
-50
0
50
100
150
200
250
300
350
400
0 500 1000 1500 2000 2500 3000 3500 4000 4500
Tim
e (s
)
Distance (m)
27-SOUTHBOUND
Modelled Observed DMRB Range
24250
2427024269242672472024271
2427524264
242652424924254
2425224250
0
100
200
300
400
500
600
700
800
900
0 2000 4000 6000 8000 10000 12000
Tim
e (s
)
Distance (m)
29-CLOCKWISE(D1)
Modelled Observed DMRB Range
24250242522425424249
2426524264
2427524271247202426724269
24270
24250
-100
0
100
200
300
400
500
600
700
800
900
0 2000 4000 6000 8000 10000 12000
Tim
e (s
)
Distance (m)
29-ANTI-CLOCKWISE(D2)
Modelled Observed DMRB Range
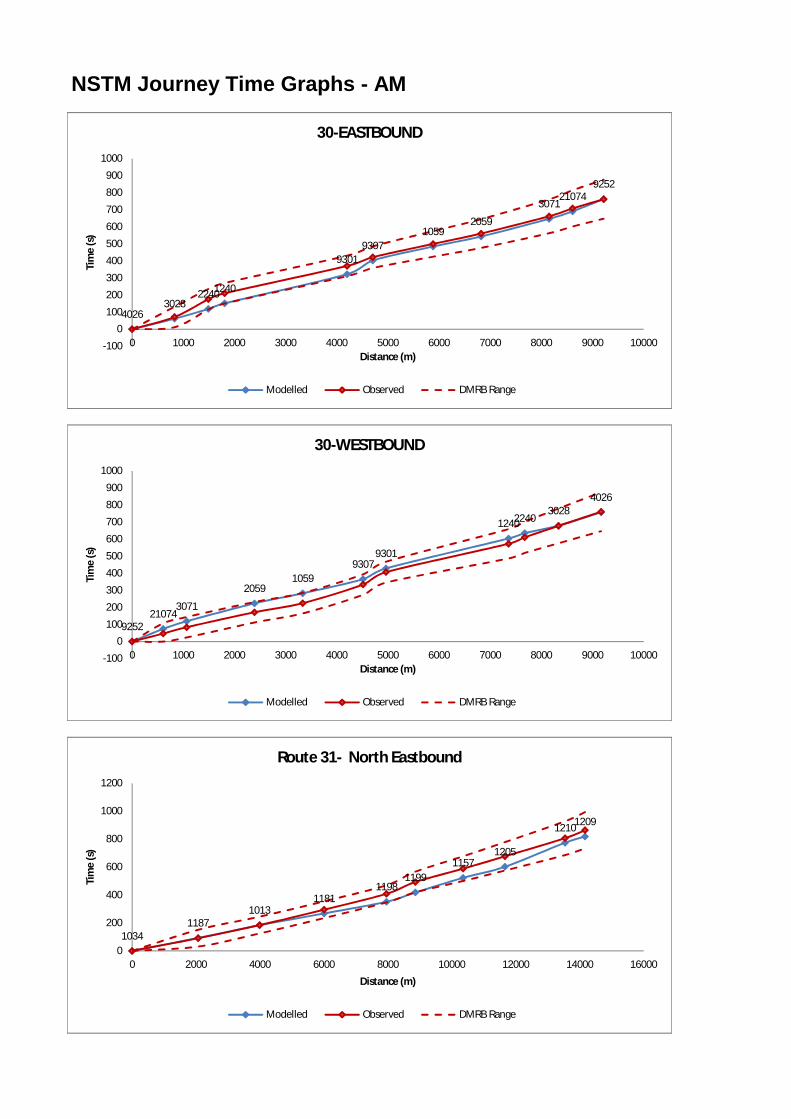
NSTM Journey Time Graphs - AM
40263028
22401240
93019307
10592059
307121074
9252
-100
0100
200
300
400
500
600
700
800
900
1000
0 1000 2000 3000 4000 5000 6000 7000 8000 9000 10000
Tim
e (s
)
Distance (m)
30-EASTBOUND
Modelled Observed DMRB Range
925221074
3071
20591059
93079301
124022403028
4026
-100
0100
200
300
400
500
600
700
800
900
1000
0 1000 2000 3000 4000 5000 6000 7000 8000 9000 10000
Tim
e (s
)
Distance (m)
30-WESTBOUND
Modelled Observed DMRB Range
10341187
10131181
11981199
11571205
12101209
0
200
400
600
800
1000
1200
0 2000 4000 6000 8000 10000 12000 14000 16000
Tim
e (s
)
Distance (m)
Route 31- North Eastbound
Modelled Observed DMRB Range
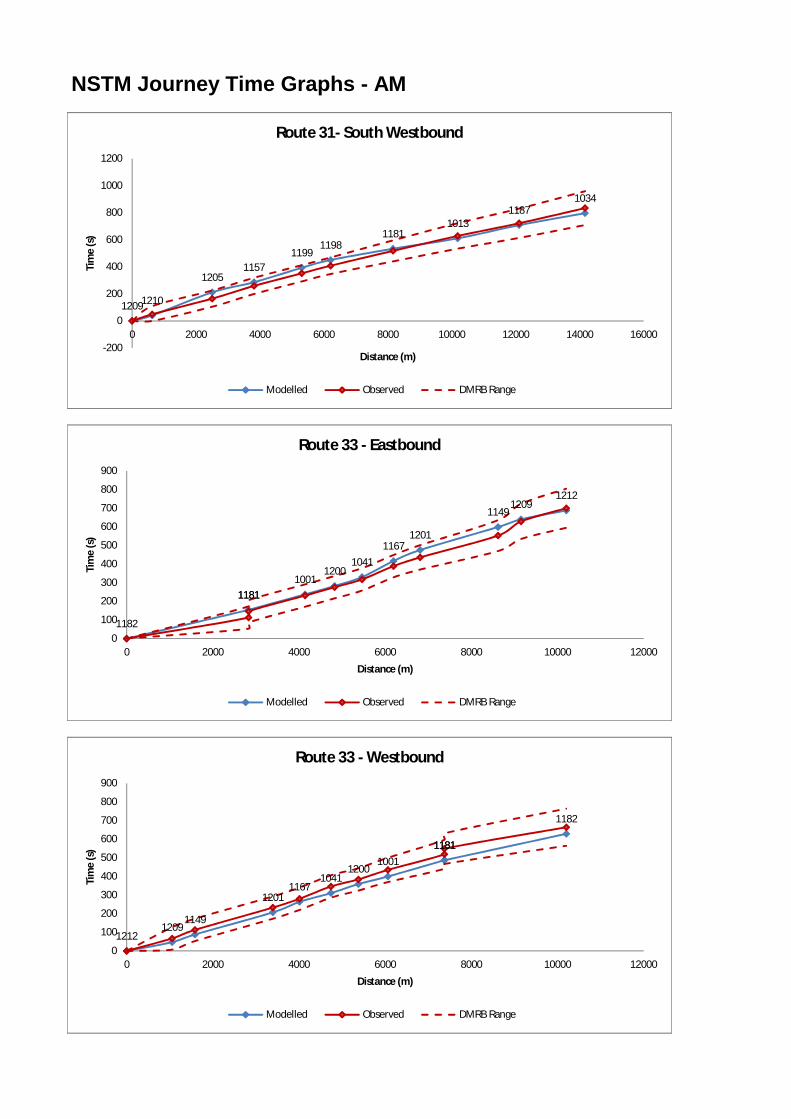
NSTM Journey Time Graphs - AM
12091210
12051157
11991198
11811013
11871034
-200
0
200
400
600
800
1000
1200
0 2000 4000 6000 8000 10000 12000 14000 16000
Tim
e (s
)
Distance (m)
Route 31- South Westbound
Modelled Observed DMRB Range
1182
118111811001
12001041
11671201
11491209
1212
0
100
200
300
400
500
600
700
800
900
0 2000 4000 6000 8000 10000 12000
Tim
e (s
)
Distance (m)
Route 33 - Eastbound
Modelled Observed DMRB Range
12121209
1149
12011167
10411200
100111811181
1182
0
100
200
300
400
500
600
700
800
900
0 2000 4000 6000 8000 10000 12000
Tim
e (s
)
Distance (m)
Route 33 - Westbound
Modelled Observed DMRB Range
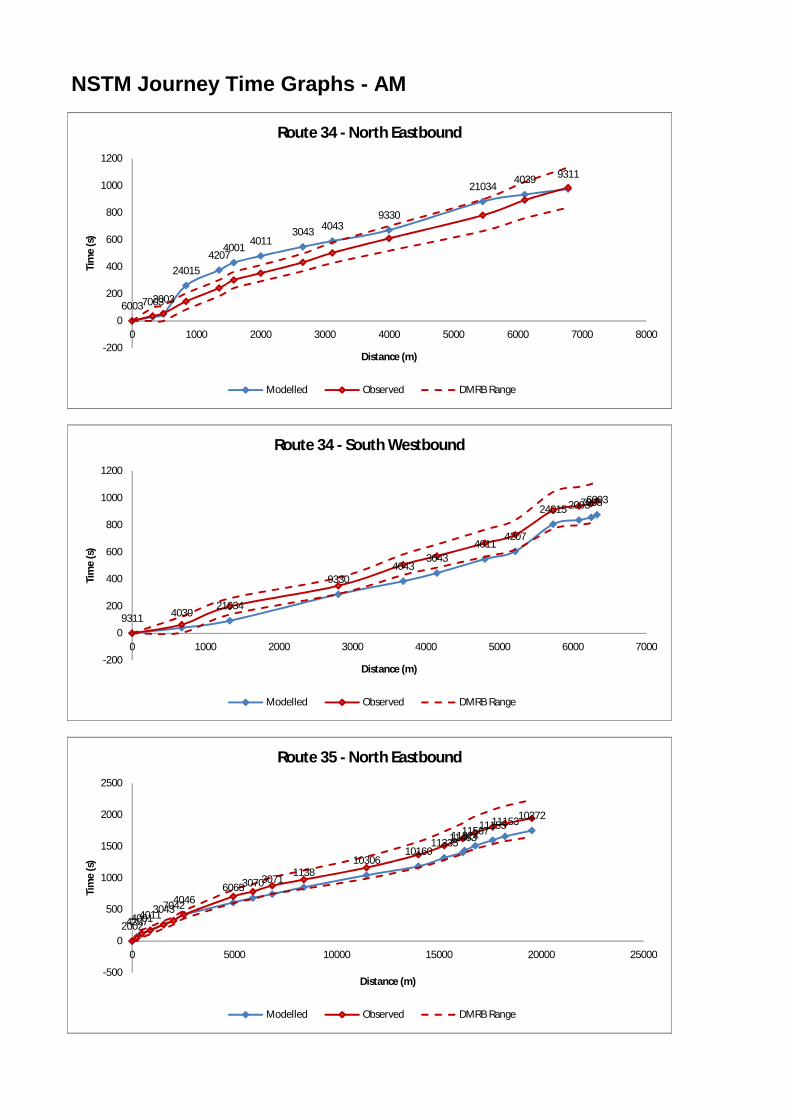
NSTM Journey Time Graphs - AM
600370032003
240154207
4001 40113043 4043
9330
210344039 9311
-200
0
200
400
600
800
1000
1200
0 1000 2000 3000 4000 5000 6000 7000 8000
Tim
e (s
)
Distance (m)
Route 34 - North Eastbound
Modelled Observed DMRB Range
9311 403921034
93304043
30434011
4207
24015 200370036003
-200
0
200
400
600
800
1000
1200
0 1000 2000 3000 4000 5000 6000 7000
Tim
e (s
)
Distance (m)
Route 34 - South Westbound
Modelled Observed DMRB Range
2002420740014011304370424046606530703071
113810306
1016011335114631132411567111551115310272
-500
0
500
1000
1500
2000
2500
0 5000 10000 15000 20000 25000
Tim
e (s
)
Distance (m)
Route 35 - North Eastbound
Modelled Observed DMRB Range
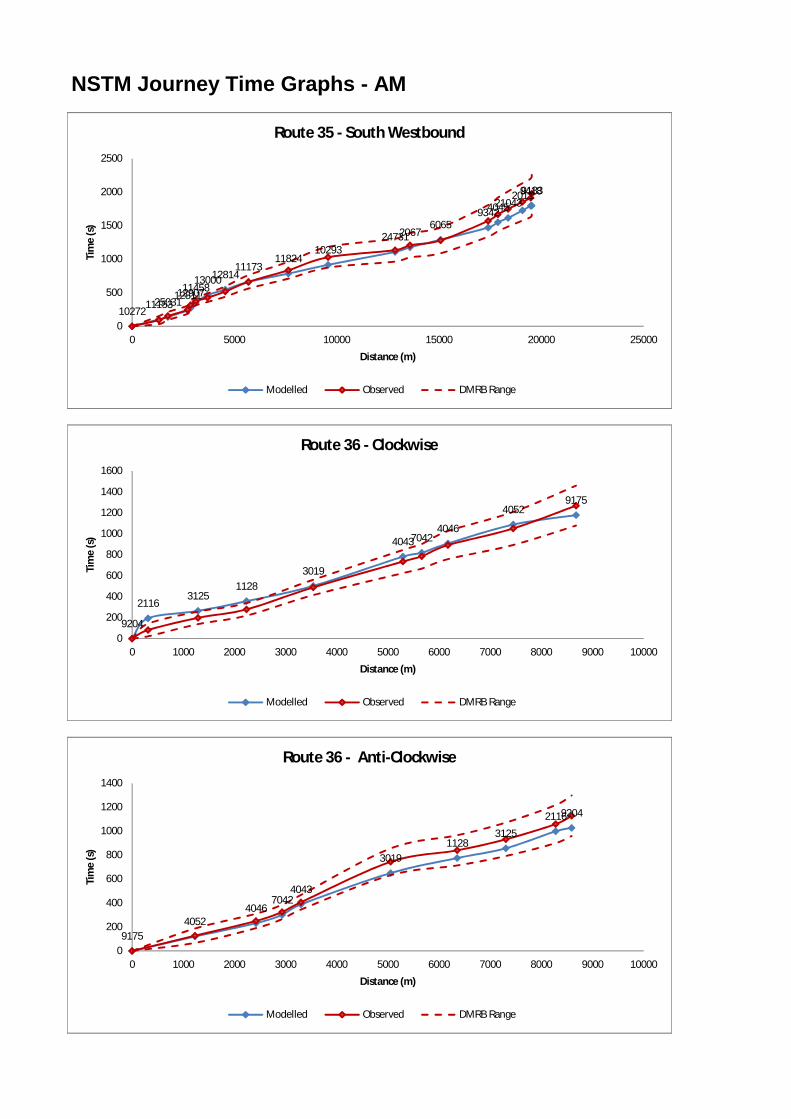
NSTM Journey Time Graphs - AM
102721115325031128111290711458
130001281411173
1182410293
2473120676065
9342404521043201194189183
0
500
1000
1500
2000
2500
0 5000 10000 15000 20000 25000
Tim
e (s
)
Distance (m)
Route 35 - South Westbound
Modelled Observed DMRB Range
9204
21163125
11283019
404370424046
40529175
0
200
400
600
800
1000
1200
1400
1600
0 1000 2000 3000 4000 5000 6000 7000 8000 9000 10000
Tim
e (s
)
Distance (m)
Route 36 - Clockwise
Modelled Observed DMRB Range
91754052
40467042
4043
30191128
3125
21169204
0
200
400
600
800
1000
1200
1400
0 1000 2000 3000 4000 5000 6000 7000 8000 9000 10000
Tim
e (s
)
Distance (m)
Route 36 - Anti-Clockwise
Modelled Observed DMRB Range
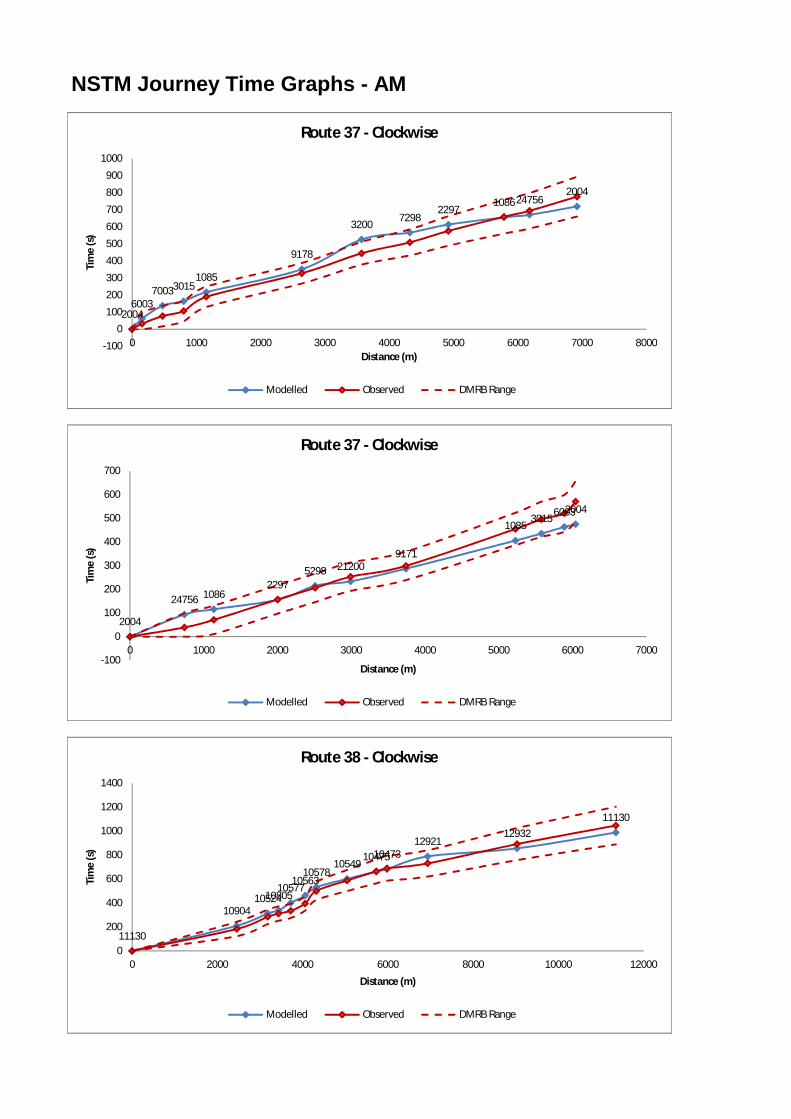
NSTM Journey Time Graphs - AM
20046003
700330151085
9178
32007298
2297108624756
2004
-100
0100
200
300
400
500
600
700
800
900
1000
0 1000 2000 3000 4000 5000 6000 7000 8000
Tim
e (s
)
Distance (m)
Route 37 - Clockwise
Modelled Observed DMRB Range
2004
24756 10862297
5298 212009171
1085301560032004
-100
0
100
200
300
400
500
600
700
0 1000 2000 3000 4000 5000 6000 7000
Tim
e (s
)
Distance (m)
Route 37 - Clockwise
Modelled Observed DMRB Range
11130
109041052410805
1057710563
1057810549
104751047312921
1293211130
0
200
400
600
800
1000
1200
1400
0 2000 4000 6000 8000 10000 12000
Tim
e (s
)
Distance (m)
Route 38 - Clockwise
Modelled Observed DMRB Range
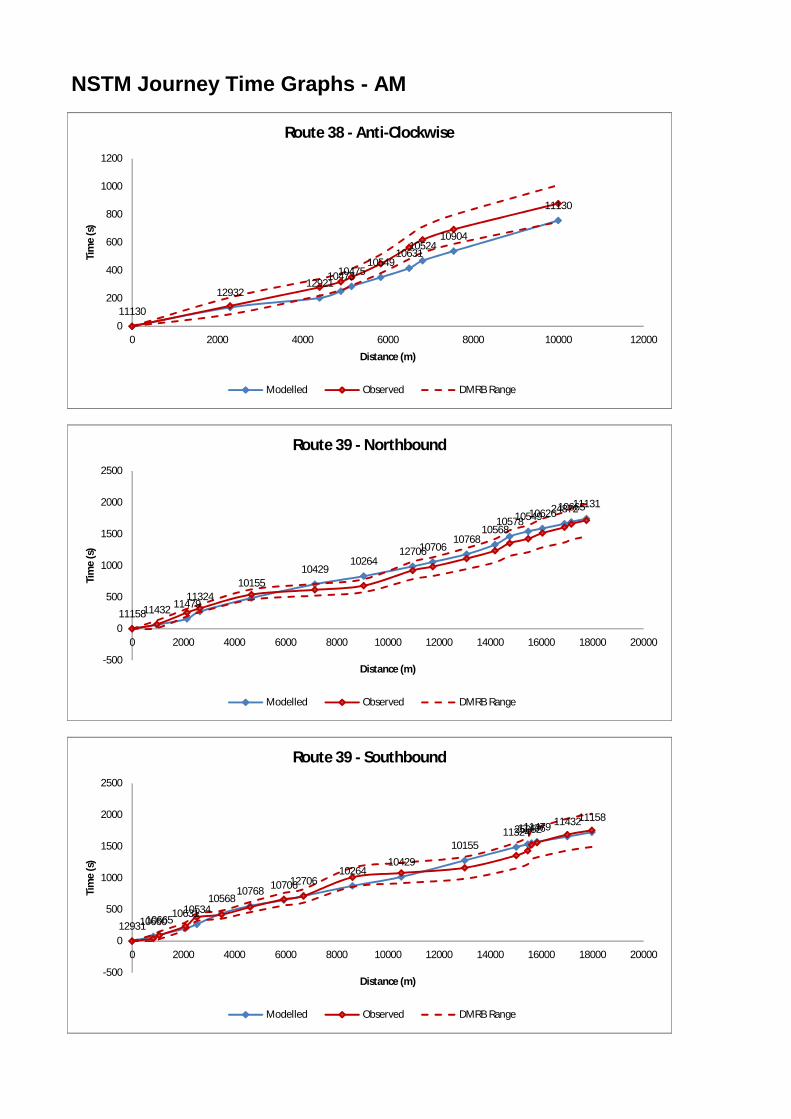
NSTM Journey Time Graphs - AM
11130
1293212921
104731047510549
1063110524
10904
11130
0
200
400
600
800
1000
1200
0 2000 4000 6000 8000 10000 12000
Tim
e (s
)
Distance (m)
Route 38 - Anti-Clockwise
Modelled Observed DMRB Range
1115811432 1147911324
1015510429
102641270610706
1076810568
105781054910626248721066511131
-500
0
500
1000
1500
2000
2500
0 2000 4000 6000 8000 10000 12000 14000 16000 18000 20000
Tim
e (s
)
Distance (m)
Route 39 - Northbound
Modelled Observed DMRB Range
129311066010665106311053410568
10768 107061270610264
1042910155
11324250521147611479 1143211158
-500
0
500
1000
1500
2000
2500
0 2000 4000 6000 8000 10000 12000 14000 16000 18000 20000
Tim
e (s
)
Distance (m)
Route 39 - Southbound
Modelled Observed DMRB Range

60 NSTM - LMVR Highway Model Version 1.0
APPENDIX NO 10: Journey Time Graphs – PM Peak
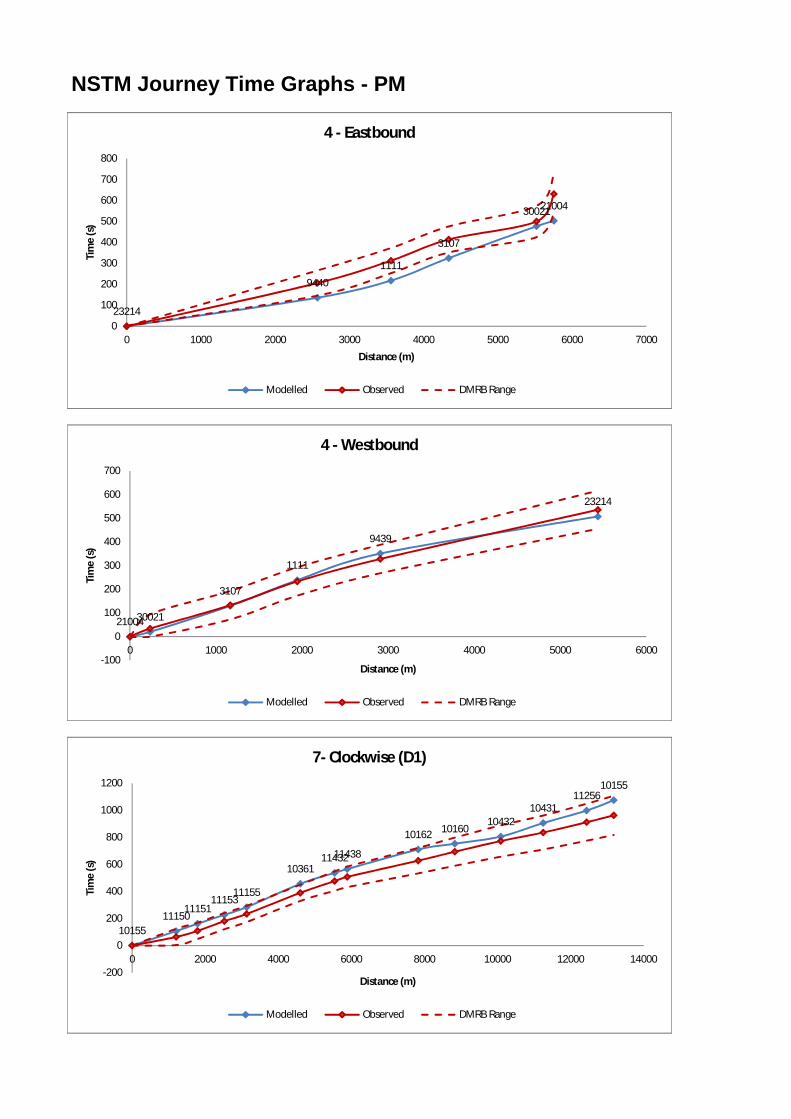
NSTM Journey Time Graphs - PM
23214
9440
1111
3107
3002121004
0
100
200
300
400
500
600
700
800
0 1000 2000 3000 4000 5000 6000 7000
Tim
e (s
)
Distance (m)
4 - Eastbound
Modelled Observed DMRB Range
2100430021
3107
1111
9439
23214
-100
0
100
200
300
400
500
600
700
0 1000 2000 3000 4000 5000 6000
Tim
e (s
)
Distance (m)
4 - Westbound
Modelled Observed DMRB Range
1015511150
1115111153
11155
103611143211438
10162 1016010432
1043111256
10155
-200
0
200
400
600
800
1000
1200
0 2000 4000 6000 8000 10000 12000 14000
Tim
e (s
)
Distance (m)
7- Clockwise (D1)
Modelled Observed DMRB Range
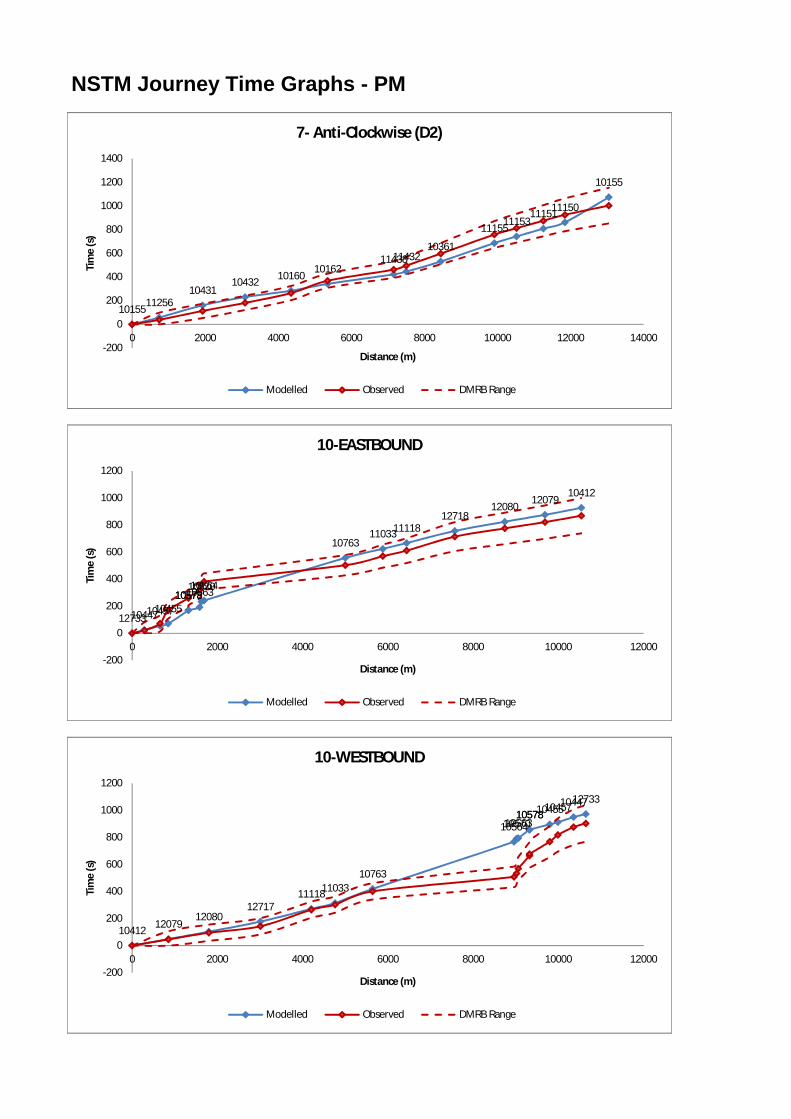
NSTM Journey Time Graphs - PM
101551125610431
10432 1016010162
114381143210361
11155111531115111150
10155
-200
0
200
400
600
800
1000
1200
1400
0 2000 4000 6000 8000 10000 12000 14000
Tim
e (s
)
Distance (m)
7- Anti-Clockwise (D2)
Modelled Observed DMRB Range
127331044710457104551057810578105631057010564
107631103311118
1271812080
1207910412
-200
0
200
400
600
800
1000
1200
0 2000 4000 6000 8000 10000 12000
Tim
e (s
)
Distance (m)
10-EASTBOUND
Modelled Observed DMRB Range
10412 1207912080
127171111811033
10763
105641057010563105781057810455104571044712733
-200
0
200
400
600
800
1000
1200
0 2000 4000 6000 8000 10000 12000
Tim
e (s
)
Distance (m)
10-WESTBOUND
Modelled Observed DMRB Range
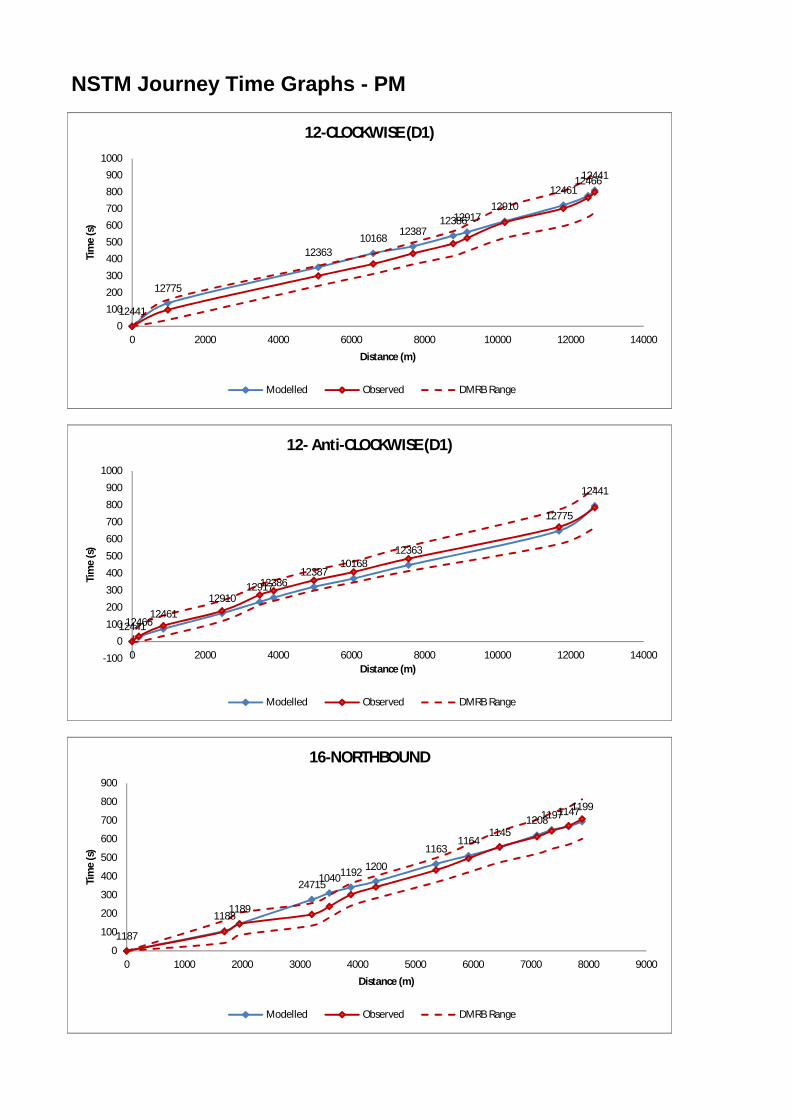
NSTM Journey Time Graphs - PM
12441
12775
1236310168
123871238612917
1291012461
1246612441
0100200300400500600700800900
1000
0 2000 4000 6000 8000 10000 12000 14000
Tim
e (s
)
Distance (m)
12-CLOCKWISE (D1)
Modelled Observed DMRB Range
124411246612461
129101291712386
1238710168
12363
12775
12441
-100
0100
200
300
400
500
600
700
800
900
1000
0 2000 4000 6000 8000 10000 12000 14000
Tim
e (s
)
Distance (m)
12- Anti-CLOCKWISE (D1)
Modelled Observed DMRB Range
1187
11881189
2471510401192 1200
11631164
11451208119711471199
0
100
200
300
400
500
600
700
800
900
0 1000 2000 3000 4000 5000 6000 7000 8000 9000
Tim
e (s
)
Distance (m)
16-NORTHBOUND
Modelled Observed DMRB Range
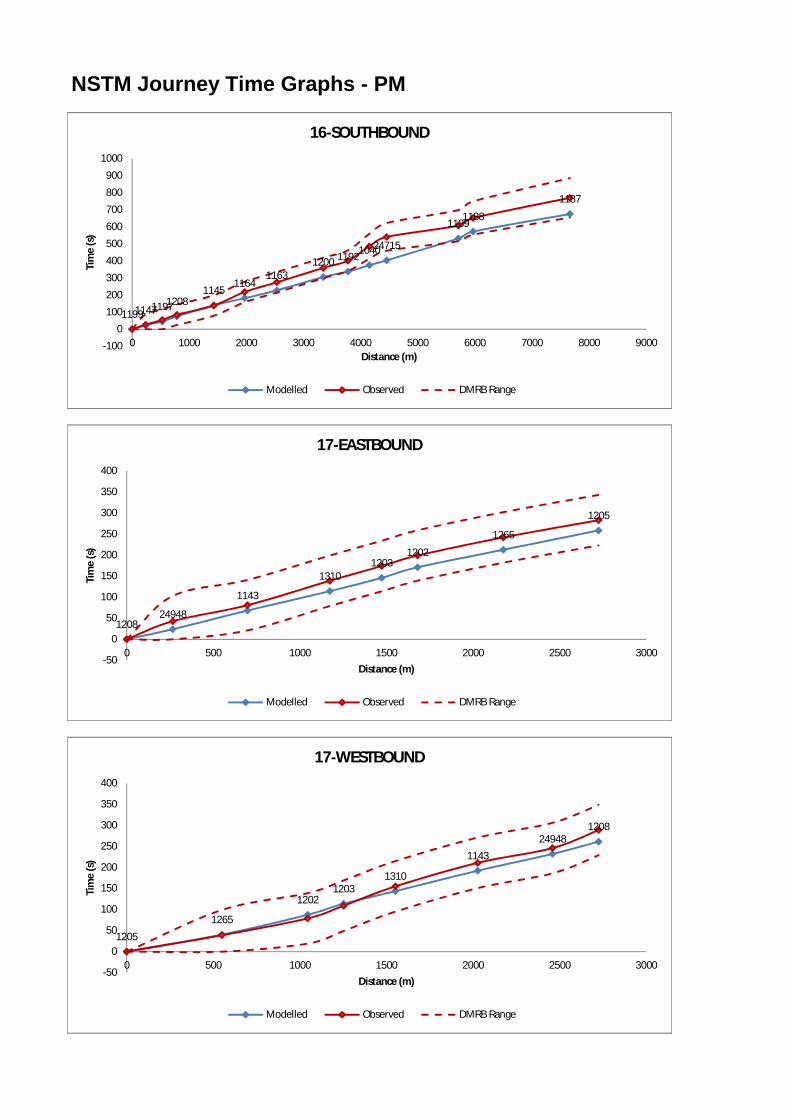
NSTM Journey Time Graphs - PM
11991147119712081145
11641163
1200 1192104024715
11891188
1187
-100
0100
200
300
400
500
600
700
800
900
1000
0 1000 2000 3000 4000 5000 6000 7000 8000 9000
Tim
e (s
)
Distance (m)
16-SOUTHBOUND
Modelled Observed DMRB Range
120824948
1143
13101203
1202
1265
1205
-50
0
50
100
150
200
250
300
350
400
0 500 1000 1500 2000 2500 3000
Tim
e (s
)
Distance (m)
17-EASTBOUND
Modelled Observed DMRB Range
1205
1265
12021203
1310
114324948
1208
-50
0
50
100
150
200
250
300
350
400
0 500 1000 1500 2000 2500 3000
Tim
e (s
)
Distance (m)
17-WESTBOUND
Modelled Observed DMRB Range
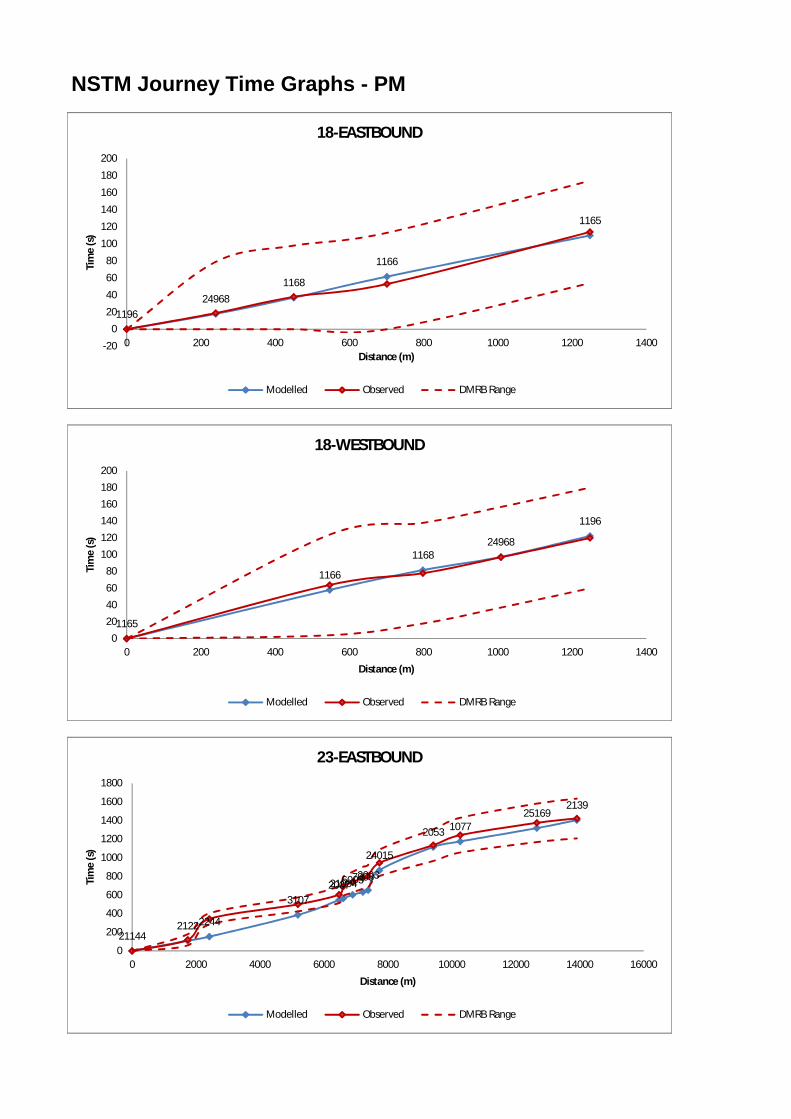
NSTM Journey Time Graphs - PM
119624968
1168
1166
1165
-20
020
40
60
80
100
120
140
160
180
200
0 200 400 600 800 1000 1200 1400
Tim
e (s
)
Distance (m)
18-EASTBOUND
Modelled Observed DMRB Range
1165
1166
116824968
1196
020406080
100120140160180200
0 200 400 600 800 1000 1200 1400
Tim
e (s
)
Distance (m)
18-WESTBOUND
Modelled Observed DMRB Range
2114421222244
3107200721004600370032003
24015
2053 107725169
2139
0
200
400
600
800
1000
1200
1400
1600
1800
0 2000 4000 6000 8000 10000 12000 14000 16000
Tim
e (s
)
Distance (m)
23-EASTBOUND
Modelled Observed DMRB Range
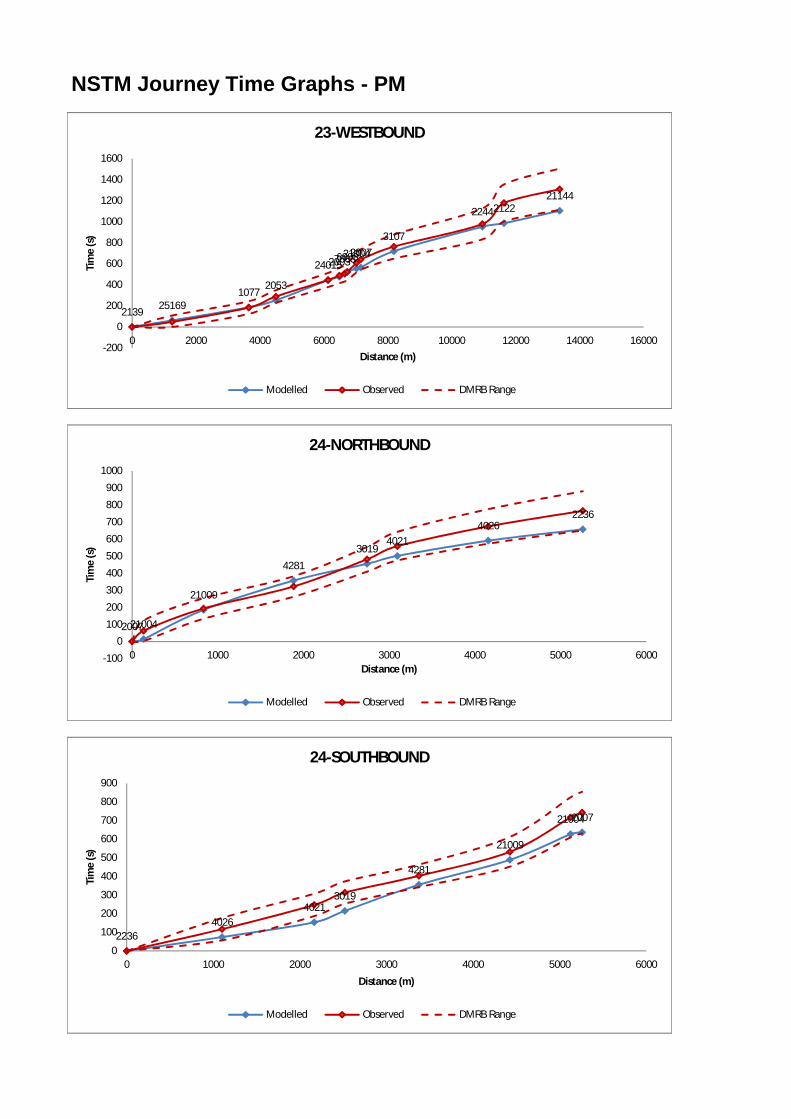
NSTM Journey Time Graphs - PM
2139 251691077
2053
240152003700360032100420073107
2244212221144
-200
0
200
400
600
800
1000
1200
1400
1600
0 2000 4000 6000 8000 10000 12000 14000 16000
Tim
e (s
)
Distance (m)
23-WESTBOUND
Modelled Observed DMRB Range
200721004
21009
42813019
40214026
2236
-100
0100
200
300
400
500
600
700
800
900
1000
0 1000 2000 3000 4000 5000 6000
Tim
e (s
)
Distance (m)
24-NORTHBOUND
Modelled Observed DMRB Range
22364026
40213019
4281
21009
210042007
0
100
200
300
400
500
600
700
800
900
0 1000 2000 3000 4000 5000 6000
Tim
e (s
)
Distance (m)
24-SOUTHBOUND
Modelled Observed DMRB Range
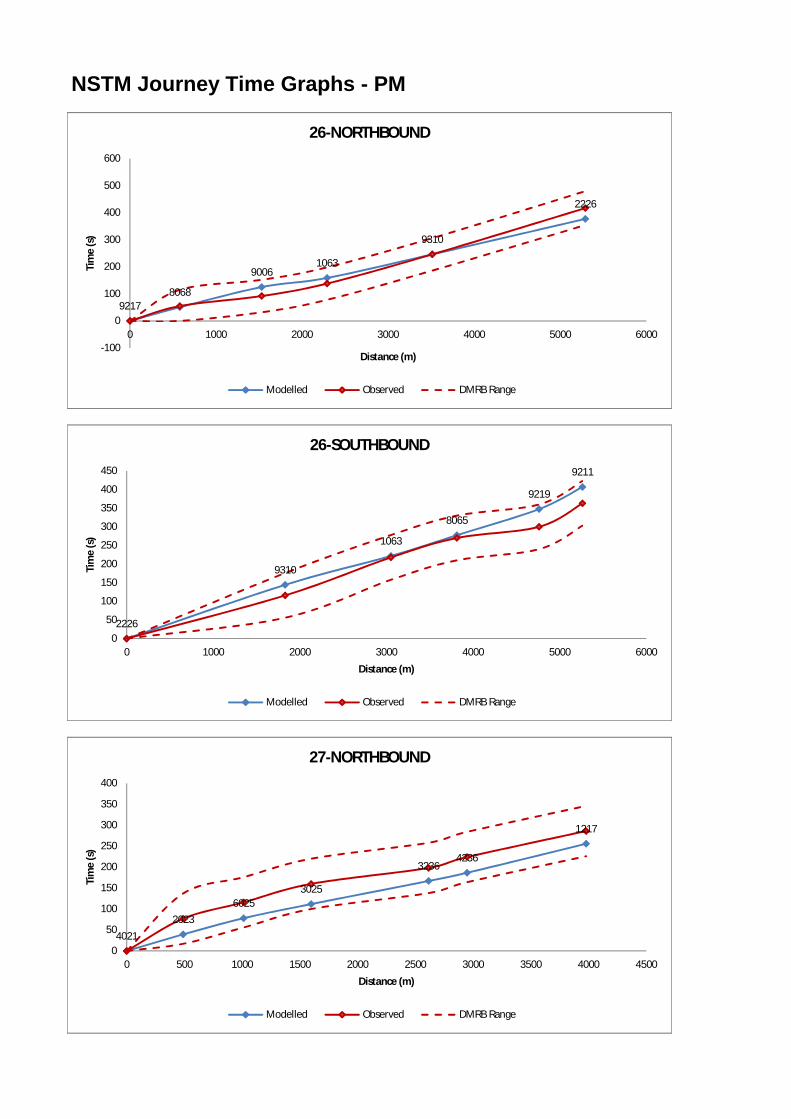
NSTM Journey Time Graphs - PM
92178068
90061063
9310
2226
-100
0
100
200
300
400
500
600
0 1000 2000 3000 4000 5000 6000
Tim
e (s
)
Distance (m)
26-NORTHBOUND
Modelled Observed DMRB Range
2226
9310
1063
8065
9219
9211
0
50
100
150
200
250
300
350
400
450
0 1000 2000 3000 4000 5000 6000
Tim
e (s
)
Distance (m)
26-SOUTHBOUND
Modelled Observed DMRB Range
40212023
60253025
32364236
1217
0
50
100
150
200
250
300
350
400
0 500 1000 1500 2000 2500 3000 3500 4000 4500
Tim
e (s
)
Distance (m)
27-NORTHBOUND
Modelled Observed DMRB Range
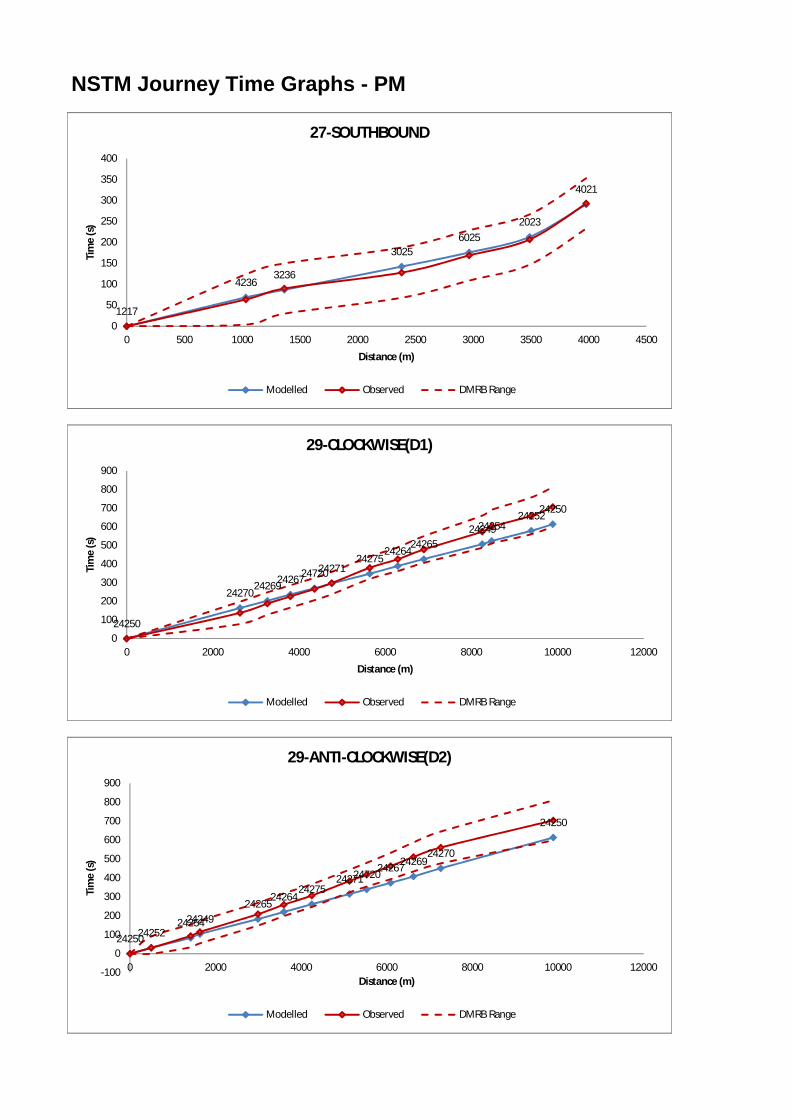
NSTM Journey Time Graphs - PM
1217
42363236
30256025
2023
4021
0
50
100
150
200
250
300
350
400
0 500 1000 1500 2000 2500 3000 3500 4000 4500
Tim
e (s
)
Distance (m)
27-SOUTHBOUND
Modelled Observed DMRB Range
24250
2427024269242672472024271
2427524264
242652424924254
2425224250
0
100
200
300
400
500
600
700
800
900
0 2000 4000 6000 8000 10000 12000
Tim
e (s
)
Distance (m)
29-CLOCKWISE(D1)
Modelled Observed DMRB Range
24250242522425424249
2426524264
2427524271247202426724269
24270
24250
-100
0
100
200
300
400
500
600
700
800
900
0 2000 4000 6000 8000 10000 12000
Tim
e (s
)
Distance (m)
29-ANTI-CLOCKWISE(D2)
Modelled Observed DMRB Range
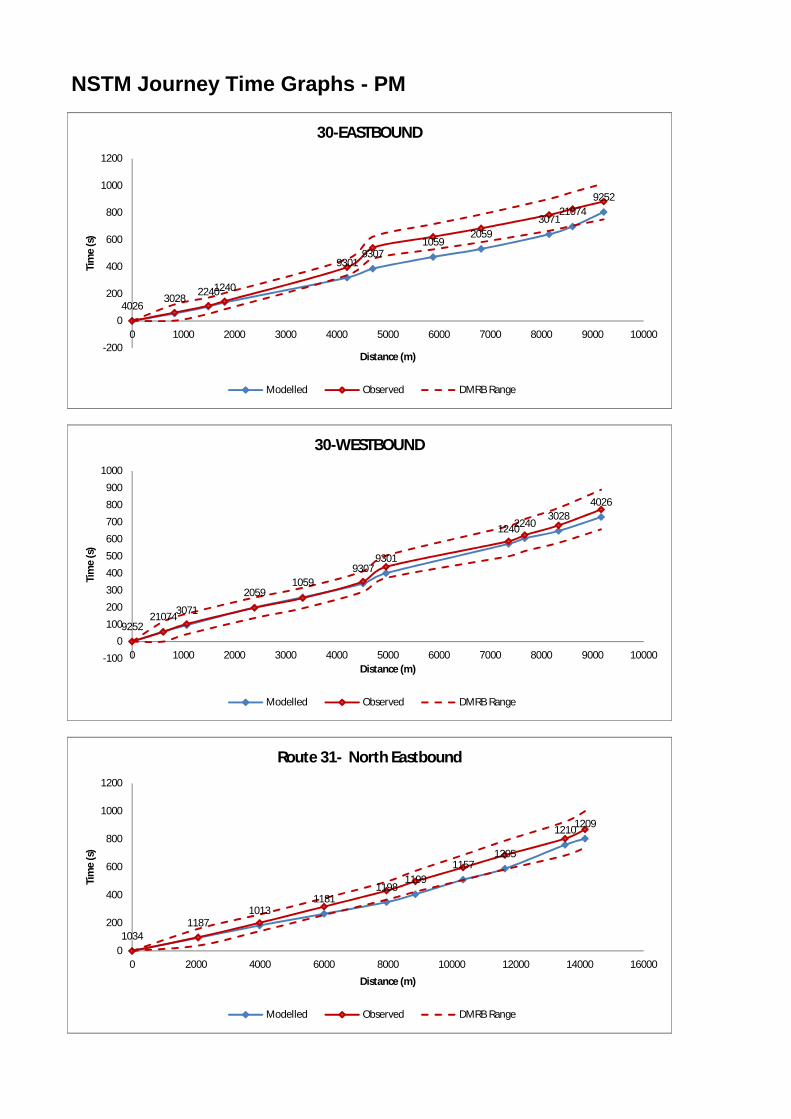
NSTM Journey Time Graphs - PM
40263028 22401240
93019307
10592059
307121074
9252
-200
0
200
400
600
800
1000
1200
0 1000 2000 3000 4000 5000 6000 7000 8000 9000 10000
Tim
e (s
)
Distance (m)
30-EASTBOUND
Modelled Observed DMRB Range
9252210743071
20591059
93079301
124022403028
4026
-100
0100
200
300
400
500
600
700
800
900
1000
0 1000 2000 3000 4000 5000 6000 7000 8000 9000 10000
Tim
e (s
)
Distance (m)
30-WESTBOUND
Modelled Observed DMRB Range
10341187
10131181
11981199
11571205
12101209
0
200
400
600
800
1000
1200
0 2000 4000 6000 8000 10000 12000 14000 16000
Tim
e (s
)
Distance (m)
Route 31- North Eastbound
Modelled Observed DMRB Range
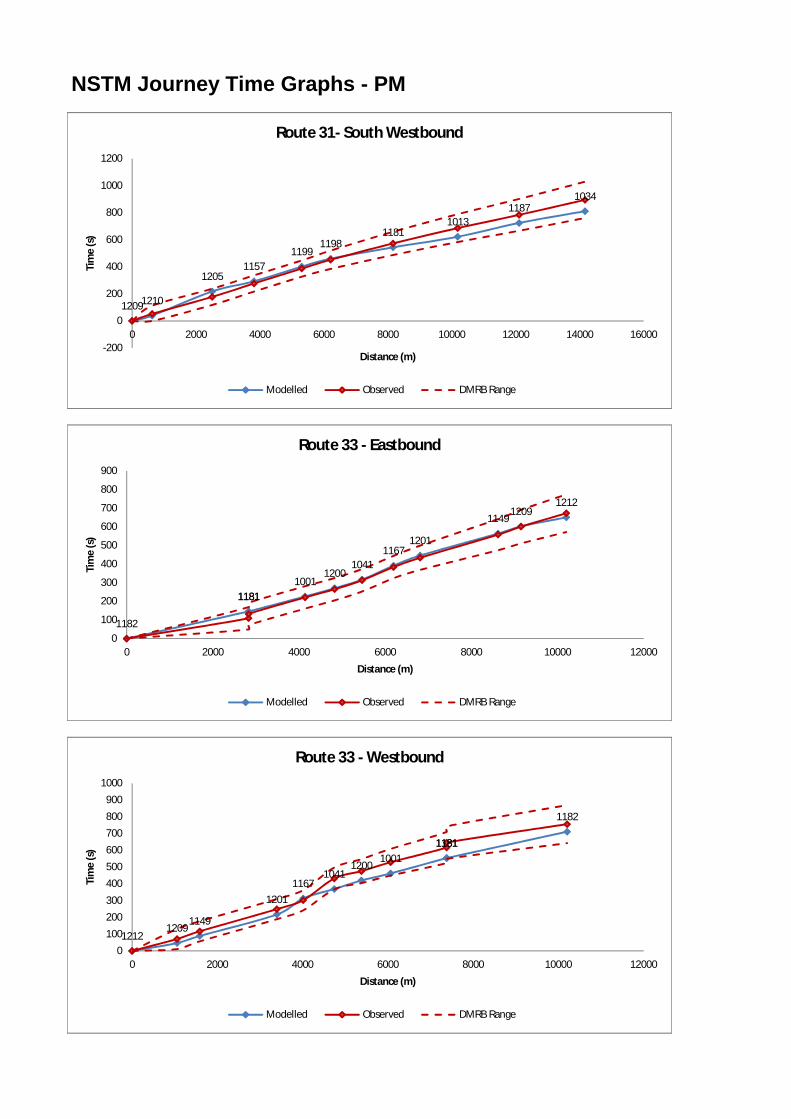
NSTM Journey Time Graphs - PM
12091210
12051157
11991198
11811013
11871034
-200
0
200
400
600
800
1000
1200
0 2000 4000 6000 8000 10000 12000 14000 16000
Tim
e (s
)
Distance (m)
Route 31- South Westbound
Modelled Observed DMRB Range
1182
118111811001
12001041
11671201
11491209
1212
0
100
200
300
400
500
600
700
800
900
0 2000 4000 6000 8000 10000 12000
Tim
e (s
)
Distance (m)
Route 33 - Eastbound
Modelled Observed DMRB Range
12121209
1149
12011167
10411200
100111811181
1182
0100200300400500600700800900
1000
0 2000 4000 6000 8000 10000 12000
Tim
e (s
)
Distance (m)
Route 33 - Westbound
Modelled Observed DMRB Range
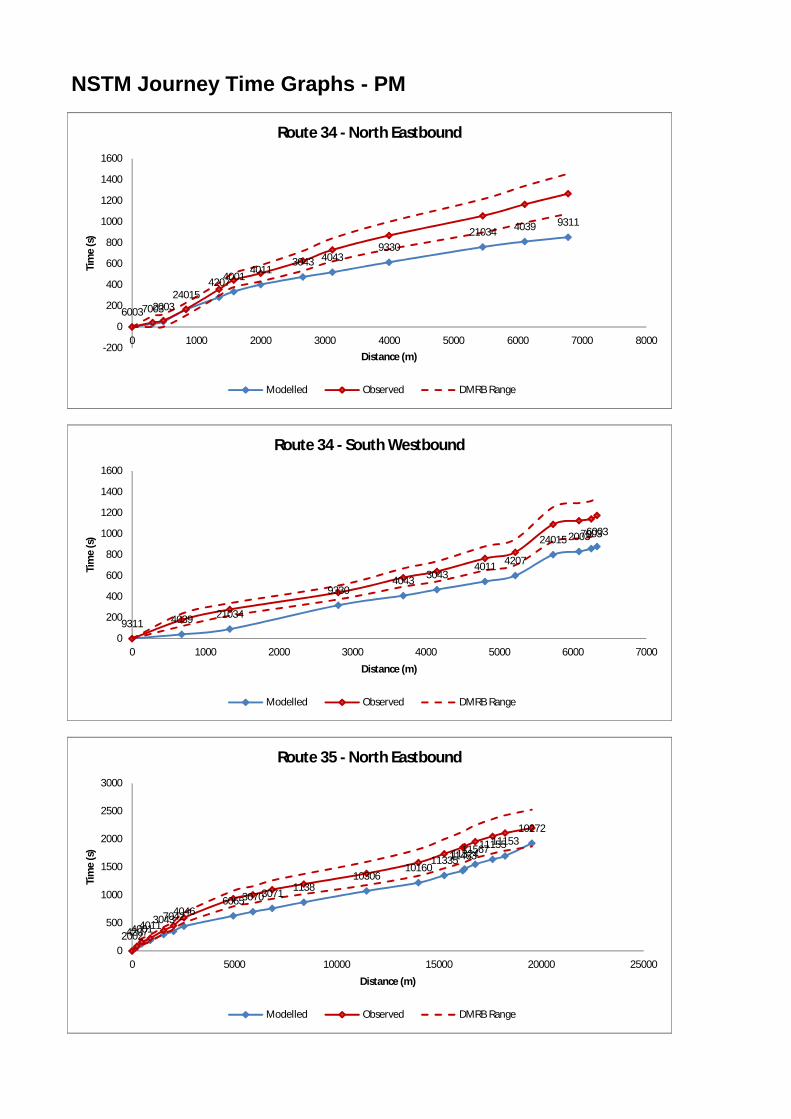
NSTM Journey Time Graphs - PM
60037003200324015
420740014011
3043 40439330
21034 4039 9311
-200
0
200
400
600
800
1000
1200
1400
1600
0 1000 2000 3000 4000 5000 6000 7000 8000
Tim
e (s
)
Distance (m)
Route 34 - North Eastbound
Modelled Observed DMRB Range
9311 4039 21034
93304043 3043
4011 4207
24015 200370036003
0
200
400
600
800
1000
1200
1400
1600
0 1000 2000 3000 4000 5000 6000 7000
Tim
e (s
)
Distance (m)
Route 34 - South Westbound
Modelled Observed DMRB Range
2002420740014011304370424046606530703071 1138
1030610160
11335114631132411567111551115310272
0
500
1000
1500
2000
2500
3000
0 5000 10000 15000 20000 25000
Tim
e (s
)
Distance (m)
Route 35 - North Eastbound
Modelled Observed DMRB Range
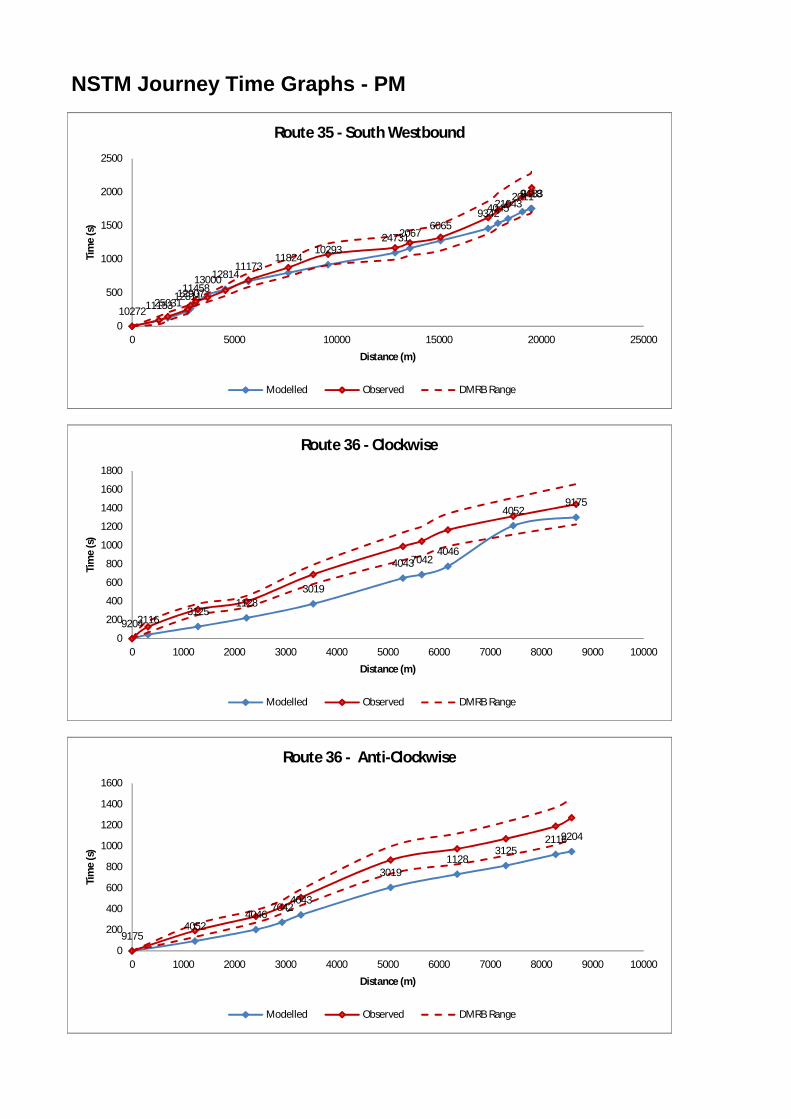
NSTM Journey Time Graphs - PM
1027211153250311281112907114581300012814
1117311824
10293247312067
60659342404521043
201194189183
0
500
1000
1500
2000
2500
0 5000 10000 15000 20000 25000
Tim
e (s
)
Distance (m)
Route 35 - South Westbound
Modelled Observed DMRB Range
920421163125
11283019
404370424046
40529175
0
200
400
600
800
1000
1200
1400
1600
1800
0 1000 2000 3000 4000 5000 6000 7000 8000 9000 10000
Tim
e (s
)
Distance (m)
Route 36 - Clockwise
Modelled Observed DMRB Range
91754052
40467042
4043
30191128
312521169204
0
200
400
600
800
1000
1200
1400
1600
0 1000 2000 3000 4000 5000 6000 7000 8000 9000 10000
Tim
e (s
)
Distance (m)
Route 36 - Anti-Clockwise
Modelled Observed DMRB Range
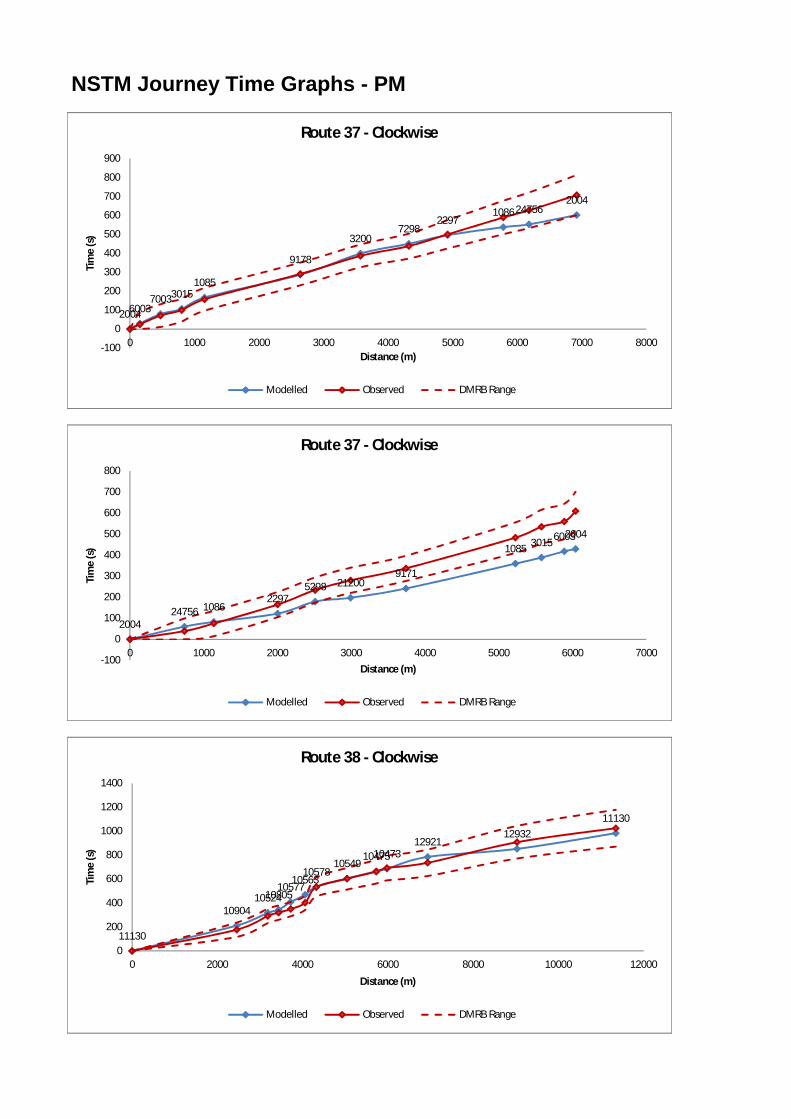
NSTM Journey Time Graphs - PM
2004600370033015
1085
9178
32007298
22971086 24756
2004
-100
0
100
200
300
400
500
600
700
800
900
0 1000 2000 3000 4000 5000 6000 7000 8000
Tim
e (s
)
Distance (m)
Route 37 - Clockwise
Modelled Observed DMRB Range
200424756 1086
22975298 21200
9171
1085 301560032004
-100
0
100
200
300
400
500
600
700
800
0 1000 2000 3000 4000 5000 6000 7000
Tim
e (s
)
Distance (m)
Route 37 - Clockwise
Modelled Observed DMRB Range
11130
109041052410805
1057710563
1057810549
104751047312921
1293211130
0
200
400
600
800
1000
1200
1400
0 2000 4000 6000 8000 10000 12000
Tim
e (s
)
Distance (m)
Route 38 - Clockwise
Modelled Observed DMRB Range
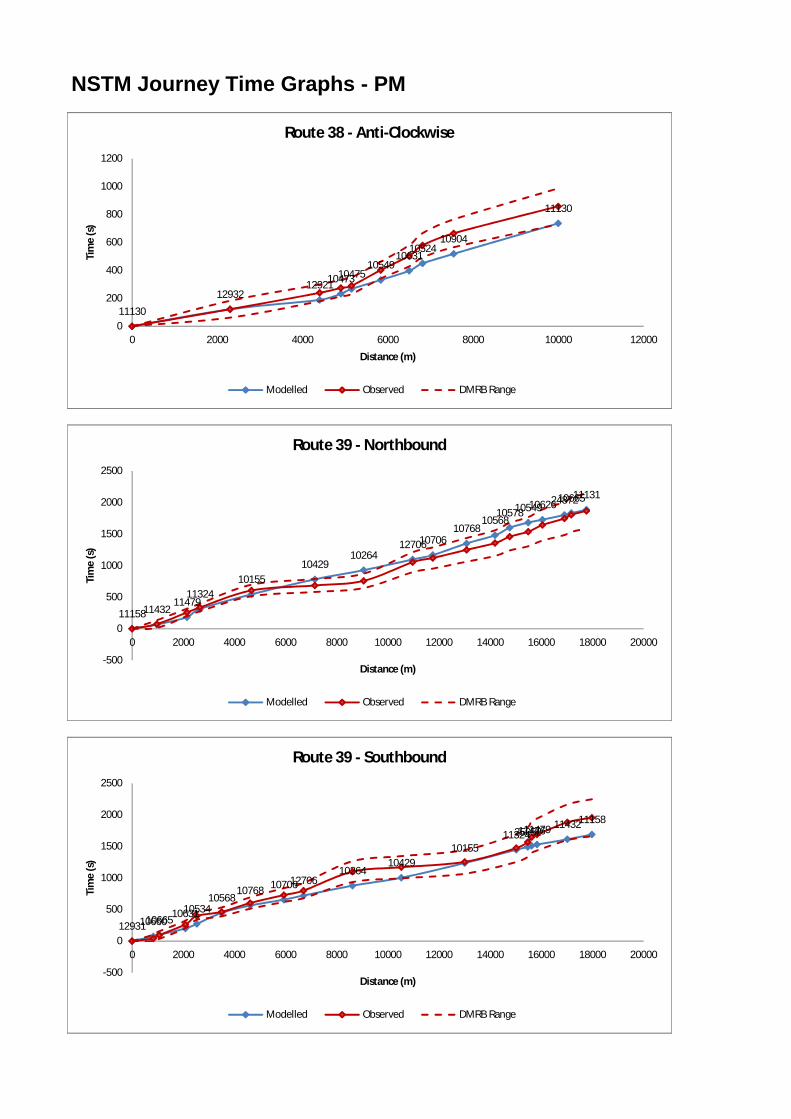
NSTM Journey Time Graphs - PM
11130
12932129211047310475
1054910631
1052410904
11130
0
200
400
600
800
1000
1200
0 2000 4000 6000 8000 10000 12000
Tim
e (s
)
Distance (m)
Route 38 - Anti-Clockwise
Modelled Observed DMRB Range
111581143211479
1132410155
1042910264
127061070610768
10568105781054910626248721066511131
-500
0
500
1000
1500
2000
2500
0 2000 4000 6000 8000 10000 12000 14000 16000 18000 20000
Tim
e (s
)
Distance (m)
Route 39 - Northbound
Modelled Observed DMRB Range
129311066010665106311053410568
10768 107061270610264
1042910155
11324250521147611479 1143211158
-500
0
500
1000
1500
2000
2500
0 2000 4000 6000 8000 10000 12000 14000 16000 18000 20000
Tim
e (s
)
Distance (m)
Route 39 - Southbound
Modelled Observed DMRB Range

62 NSTM - LMVR Highway Model Version 1.0
APPENDIX NO 11: RSI Matrix Assignment – AM Peak
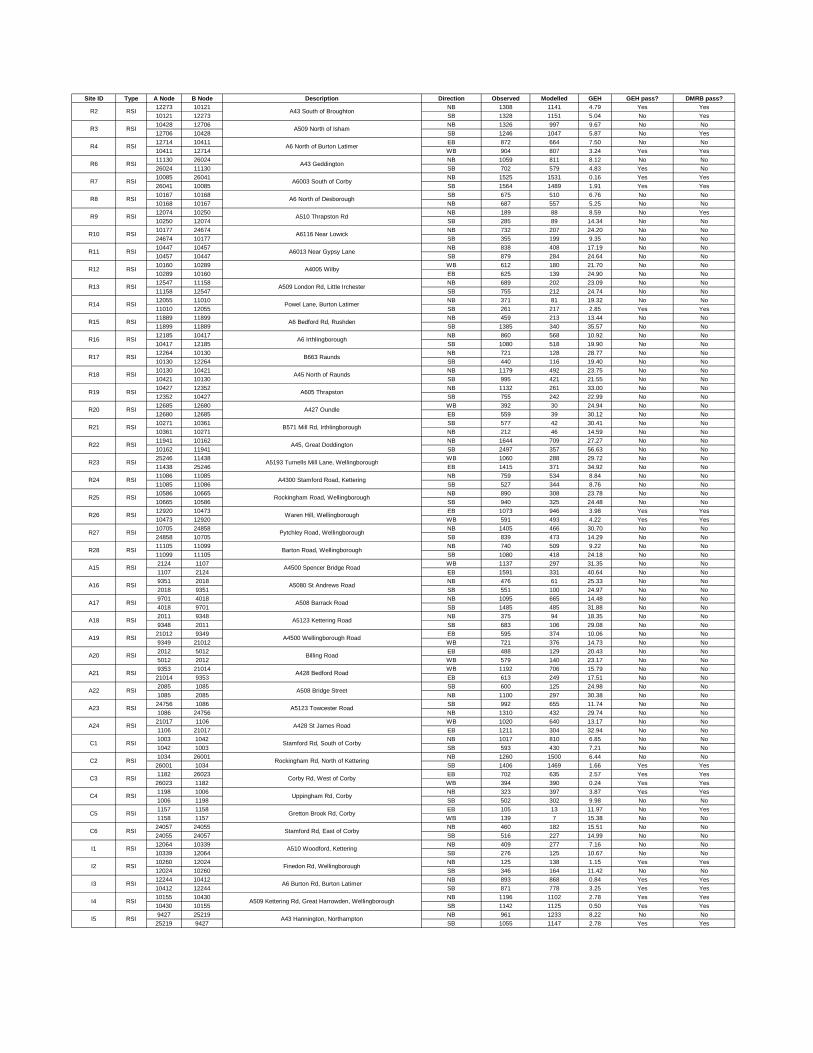
Site ID Type A Node B Node Description Direction Observed Modelled GEH GEH pass? DMRB pass?12273 10121 NB 1308 1141 4.79 Yes Yes10121 12273 SB 1328 1151 5.04 No Yes10428 12706 NB 1326 997 9.67 No No12706 10428 SB 1246 1047 5.87 No Yes12714 10411 EB 872 664 7.50 No No10411 12714 WB 904 807 3.24 Yes Yes11130 26024 NB 1059 811 8.12 No No26024 11130 SB 702 579 4.83 Yes No10085 26041 NB 1525 1531 0.16 Yes Yes26041 10085 SB 1564 1489 1.91 Yes Yes10167 10168 SB 675 510 6.76 No No10168 10167 NB 687 557 5.25 No No12074 10250 NB 189 88 8.59 No Yes10250 12074 SB 285 89 14.34 No No10177 24674 NB 732 207 24.20 No No24674 10177 SB 355 199 9.35 No No10447 10457 NB 838 408 17.19 No No10457 10447 SB 879 284 24.64 No No10160 10289 WB 612 180 21.70 No No10289 10160 EB 625 139 24.90 No No12547 11158 NB 689 202 23.09 No No11158 12547 SB 755 212 24.74 No No12055 11010 NB 371 81 19.32 No No11010 12055 SB 261 217 2.85 Yes Yes11889 11899 NB 459 213 13.44 No No11899 11889 SB 1385 340 35.57 No No12185 10417 NB 860 568 10.92 No No10417 12185 SB 1080 518 19.90 No No12264 10130 NB 721 128 28.77 No No10130 12264 SB 440 116 19.40 No No10130 10421 NB 1179 492 23.75 No No10421 10130 SB 995 421 21.55 No No10427 12352 NB 1132 261 33.00 No No12352 10427 SB 755 242 22.99 No No12685 12680 WB 392 30 24.94 No No12680 12685 EB 559 39 30.12 No No10271 10361 SB 577 42 30.41 No No10361 10271 NB 212 46 14.59 No No11941 10162 NB 1644 709 27.27 No No10162 11941 SB 2497 357 56.63 No No25246 11438 WB 1060 288 29.72 No No11438 25246 EB 1415 371 34.92 No No11086 11085 NB 759 534 8.84 No No11085 11086 SB 527 344 8.76 No No10586 10665 NB 890 308 23.78 No No10665 10586 SB 940 325 24.48 No No12920 10473 EB 1073 946 3.98 Yes Yes10473 12920 WB 591 493 4.22 Yes Yes10705 24858 NB 1405 466 30.70 No No24858 10705 SB 839 473 14.29 No No11105 11099 NB 740 509 9.22 No No11099 11105 SB 1080 418 24.18 No No2124 1107 WB 1137 297 31.35 No No1107 2124 EB 1591 331 40.64 No No9351 2018 NB 476 61 25.33 No No2018 9351 SB 551 100 24.97 No No9701 4018 NB 1095 665 14.48 No No4018 9701 SB 1485 485 31.88 No No2011 9348 NB 375 94 18.35 No No9348 2011 SB 683 106 29.08 No No21012 9349 EB 595 374 10.06 No No9349 21012 WB 721 376 14.73 No No2012 5012 EB 488 129 20.43 No No5012 2012 WB 579 140 23.17 No No9353 21014 WB 1192 706 15.79 No No21014 9353 EB 613 249 17.51 No No2085 1085 SB 600 125 24.98 No No1085 2085 NB 1100 297 30.38 No No24756 1086 SB 992 655 11.74 No No1086 24756 NB 1310 432 29.74 No No21017 1106 WB 1020 640 13.17 No No1106 21017 EB 1211 304 32.94 No No1003 1042 NB 1017 810 6.85 No No1042 1003 SB 593 430 7.21 No No1034 26001 NB 1260 1500 6.44 No No
26001 1034 SB 1406 1469 1.66 Yes Yes1182 26023 EB 702 635 2.57 Yes Yes
26023 1182 WB 394 390 0.24 Yes Yes1198 1006 NB 323 397 3.87 Yes Yes1006 1198 SB 502 302 9.98 No No1157 1158 EB 105 13 11.97 No Yes1158 1157 WB 139 7 15.38 No No
24057 24055 NB 460 182 15.51 No No24055 24057 SB 516 227 14.99 No No12064 10339 NB 409 277 7.16 No No10339 12064 SB 276 125 10.67 No No10260 12024 NB 125 138 1.15 Yes Yes12024 10260 SB 346 164 11.42 No No12244 10412 NB 893 868 0.84 Yes Yes10412 12244 SB 871 778 3.25 Yes Yes10155 10430 NB 1196 1102 2.78 Yes Yes10430 10155 SB 1142 1125 0.50 Yes Yes9427 25219 NB 961 1233 8.22 No No
25219 9427 SB 1055 1147 2.78 Yes Yes
A4500 Wellingborough Road
Billing Road
A428 Bedford Road
A508 Bridge Street
A5123 Towcester Road
A428 St James Road
Pytchley Road, Wellingborough
Barton Road, Wellingborough
A4500 Spencer Bridge Road
A5080 St Andrews Road
A508 Barrack Road
A5123 Kettering Road
B571 Mill Rd, Irthlingborough
A45, Great Doddington
A5193 Turnells Mill Lane, Wellingborough
A4300 Stamford Road, Kettering
Rockingham Road, Wellingborough
Waren Hill, Wellingborough
A6 Bedford Rd, Rushden
A6 Irthlingborough
B663 Raunds
A45 North of Raunds
A605 Thrapston
A427 Oundle
A510 Thrapston Rd
A6116 Near Lowick
A6013 Near Gypsy Lane
A4005 Wilby
A509 London Rd, Little Irchester
Powel Lane, Burton Latimer
RSI
RSI
RSI
RSI
A43 South of Broughton
A509 North of Isham
A6 North of Burton Latimer
A43 Geddington
A6003 South of Corby
A6 North of Desborough
RSI
RSI
RSI
RSI
RSI
RSI
RSI
RSI
RSI
RSI
RSI
RSI
A21
A22
A23
A24
RSI
RSI
RSI
RSI
RSI
RSI
A15
A16
A17
A18
A19
A20
R23
R24
R25
R26
R27
R28
R17
R18
R19
R20
R21
R22
RSI
RSI
RSI
RSI
R13
R14
R15
R16
R10
R11
R12
RSI
RSI
RSI
R2
R3
R4
R6
R7
R8
RSI
RSI
RSI
RSI
RSI
RSI
R9 RSI
I4 A509 Kettering Rd, Great Harrowden, Wellingborough
I5 A43 Hannington, Northampton
RSI
RSI
I2 Finedon Rd, Wellingborough
I3 A6 Burton Rd, Burton Latimer
RSI
RSI
C6 Stamford Rd, East of Corby
I1 A510 Woodford, Kettering
RSI
RSI
C4 Uppingham Rd, Corby
C5 Gretton Brook Rd, Corby
RSI
RSI
C2 Rockingham Rd, North of Kettering
C3 Corby Rd, West of Corby
RSI
RSI
C1 Stamford Rd, South of CorbyRSI

64 NSTM - LMVR Highway Model Version 1.0
APPENDIX NO 12: RSI Matrix Assignment – PM Peak

Site ID Type A Node B Node Description Direction Observed Modelled GEH GEH pass? DMRB pass?12273 10121 NB 1281 1341 1.66 Yes Yes10121 12273 SB 1216 930 8.73 No No10428 12706 NB 1214 802 12.98 No No12706 10428 SB 1163 995 5.12 No Yes12714 10411 EB 753 736 0.62 Yes Yes10411 12714 WB 906 730 6.14 No No11130 26024 NB 702 478 9.22 No No26024 11130 SB 1009 650 12.48 No No10085 26041 NB 1435 1637 5.15 No Yes26041 10085 SB 1478 1542 1.65 Yes Yes10167 10168 SB 613 603 0.43 Yes Yes10168 10167 NB 591 452 6.08 No No12074 10250 NB 243 83 12.56 No No10250 12074 SB 217 85 10.75 No No10177 24674 NB 361 256 5.98 No Yes24674 10177 SB 650 259 18.31 No No10447 10457 NB 961 396 21.69 No No10457 10447 SB 775 304 20.29 No No10160 10289 WB 794 170 28.42 No No10289 10160 EB 492 160 18.41 No No12547 11158 NB 814 134 31.26 No No11158 12547 SB 552 262 14.35 No No12055 11010 NB 236 155 5.83 No Yes11010 12055 SB 257 148 7.65 No No11889 11899 NB 999 314 26.74 No No11899 11889 SB 466 213 13.74 No No12185 10417 NB 950 596 12.76 No No10417 12185 SB 940 547 14.39 No No12264 10130 NB 463 145 18.20 No No10130 12264 SB 666 143 25.98 No No10130 10421 NB 983 472 18.95 No No10421 10130 SB 1122 478 22.78 No No10427 12352 NB 786 268 22.57 No No12352 10427 SB 975 250 29.31 No No12685 12680 WB 444 37 26.24 No No12680 12685 EB 476 43 26.88 No No10271 10361 SB 283 33 19.92 No No10361 10271 NB 545 28 30.55 No No11941 10162 NB 1598 528 32.83 No No10162 11941 SB 1922 491 41.20 No No25246 11438 WB 1425 127 46.56 No No11438 25246 EB 966 211 31.12 No No11086 11085 NB 542 343 9.47 No No11085 11086 SB 739 553 7.32 No No10586 10665 NB 789 287 21.67 No No10665 10586 SB 983 328 25.61 No No12920 10473 EB 733 493 9.70 No No10473 12920 WB 678 826 5.39 No No10705 24858 NB 1197 473 25.03 No No24858 10705 SB 1287 506 26.06 No No11105 11099 NB 1063 396 24.70 No No11099 11105 SB 702 480 9.15 No No2124 1107 WB 1627 310 42.31 No No1107 2124 EB 1326 335 34.38 No No9351 2018 NB 530 46 28.51 No No2018 9351 SB 468 102 21.66 No No9701 4018 NB 1534 777 22.28 No No4018 9701 SB 1008 500 18.49 No No2011 9348 NB 703 41 34.32 No No9348 2011 SB 523 222 15.60 No No21012 9349 EB 814 316 20.95 No No9349 21012 WB 645 369 12.27 No No2012 5012 EB 498 216 14.90 No No5012 2012 WB 516 137 20.94 No No9353 21014 WB 977 572 14.56 No No21014 9353 EB 905 498 15.38 No No2085 1085 SB 698 248 20.71 No No1085 2085 NB 825 308 21.74 No No24756 1086 SB 1334 624 22.68 No No1086 24756 NB 1075 445 22.85 No No21017 1106 WB 1101 425 24.45 No No1106 21017 EB 1155 325 30.50 No No1003 1042 NB 552 382 7.86 No No1042 1003 SB 967 779 6.35 No No1034 26001 NB 1339 1598 6.74 No No
26001 1034 SB 1260 1531 7.24 No No1182 26023 EB 403 379 1.23 Yes Yes
26023 1182 WB 663 618 1.79 Yes Yes1198 1006 NB 472 337 6.75 No No1006 1198 SB 327 258 4.03 Yes Yes1157 1158 EB 148 8 15.78 No No1158 1157 WB 66 9 9.46 No Yes
24057 24055 NB 508 213 15.55 No No24055 24057 SB 397 196 11.66 No No12064 10339 NB 252 144 7.69 No No10339 12064 SB 385 226 9.08 No No10260 12024 NB 282 106 12.64 No No12024 10260 SB 160 188 2.16 Yes Yes12244 10412 NB 922 819 3.48 Yes Yes10412 12244 SB 770 804 1.23 Yes Yes10155 10430 NB 954 988 1.08 Yes Yes10430 10155 SB 1276 1092 5.33 No Yes9427 25219 NB 1146 1464 8.79 No No
25219 9427 SB 900 1035 4.33 Yes Yes
I4 RSI A509 Kettering Rd, Great Harrowden, Wellingborough
I5 RSI A43 Hannington, Northampton
I2 RSI Finedon Rd, Wellingborough
I3 RSI A6 Burton Rd, Burton Latimer
C6 RSI Stamford Rd, East of Corby
I1 RSI A510 Woodford, Kettering
C4 RSI Uppingham Rd, Corby
C5 RSI Gretton Brook Rd, Corby
C2 RSI Rockingham Rd, North of Kettering
C3 RSI Corby Rd, West of Corby
C1 RSI Stamford Rd, South of Corby
A23 RSI A5123 Towcester Road
A24 RSI A428 St James Road
A21 RSI A428 Bedford Road
A22 RSI A508 Bridge Street
A19 RSI A4500 Wellingborough Road
A20 RSI Billing Road
A17 RSI A508 Barrack Road
A18 RSI A5123 Kettering Road
A15 RSI A4500 Spencer Bridge Road
A16 RSI A5080 St Andrews Road
R27 RSI Pytchley Road, Wellingborough
R28 RSI Barton Road, Wellingborough
R25 RSI Rockingham Road, Wellingborough
R26 RSI Waren Hill, Wellingborough
R23 RSI A5193 Turnells Mill Lane, Wellingborough
R24 RSI A4300 Stamford Road, Kettering
R21 RSI B571 Mill Rd, Irthlingborough
R22 RSI A45, Great Doddington
R19 RSI A605 Thrapston
R20 RSI A427 Oundle
R17 RSI B663 Raunds
R18 RSI A45 North of Raunds
R15 RSI A6 Bedford Rd, Rushden
R16 RSI A6 Irthlingborough
R13 RSI A509 London Rd, Little Irchester
R14 RSI Powel Lane, Burton Latimer
R11 RSI A6013 Near Gypsy Lane
R12 RSI A4005 Wilby
R9 RSI A510 Thrapston Rd
R10 RSI A6116 Near Lowick
R7 RSI A6003 South of Corby
R8 RSI A6 North of Desborough
R4 RSI A6 North of Burton Latimer
R6 RSI A43 Geddington
R2 RSI A43 South of Broughton
R3 RSI A509 North of Isham

Transport Assessment – Issue 2.1 Northampton South SUE
J:\28015 Collingtree\word\Reports\Transport\Transport Assessment\28015 Transport Assessment 140430 - Issue 2.1 - Planning Application.docx
161
Appendix 12.2 - Peter Brett Associates’ NSTM Transport Modelling Scoping – Issue 4
J:\28015 Collingtree\word\Reports\Transport\Scoping Note\130618 - NSTM Modelling Scoping Note Issue 4 - issued to NCC - HA.doc - 1 -
PETER BRETT ASSOCIATES LLP
28015 – NORTHAMPTON SOUTH SUE (MAPLE FARM COLLINGTREE DEVELOPMENT)
NSTM TRANSPORT MODELLING SCOPING - DO MINIMUM AND DO SOMETHING
TESTS - ISSUE 4 – June 18 th, 2013
1 Introduction 1.1 This Scoping Note has been prepared to set out the scope of the proposed runs of
the Northamptonshire Strategic Transport Model (NSTM) to support transport technical work for the forthcoming outline planning application for the Northampton South SUE Development (NSSUE – to be progressed as the Maple Farm Development, Collingtree). It will be updated as further information is sought / made available to contain a current summary of the work instruction.
1.2 Maple Farm Collingtree, the NSSUE, is one of the sites identified within the West
Northamptonshire Pre Submission Joint Core Strategy for residential development of 1,000 units, and forms the strategic urban extension for South Northampton. It is located on land to the north of the M1, west of the A45, east of Towcester Road and the rail line, and south of Rowtree Road. It is being promoted by Bovis Homes Ltd.
1.3 Peter Brett Associates LLP has been appointed by Bovis Homes Ltd to resolve all transport and access matters, to enable an outline planning application to be submitted in Spring 2013 supported with all necessary transport work.
1.4 Peter Brett Associates has undertaken initial discussions with Northamptonshire
County Council (NCC), the Highways Agency and MGWSP Northamptonshire Highways to work together to set the context for this work; the Notes of the relevant meeting held on Friday 25th January 2013 are attached in Appendix 1.
1.5 Further clarity was sought by Northamptonshire Highways by email on April 8th. This email, and Peter Brett Associates’ response is included in Appendix 1. This resulted in Issue 3.
1.6 Following discussions with Northamptonshire Highways seeking further clarity to the on-site infrastructure and trip rate generation in May / June, a further version of this Note has been prepared. This is referred to as Issue 4. Relevant correspondence is also included in Appendix 1.
1.7 It is acknowledged that further iterations of this instruction may be required following the discussions with NCC and MGWSP Northamptonshire Highways. Similarly, further iterations of the model are likely - with differing levels of infrastructure and development to respond to issues identified in the initial testing.
1.8 Issue 1 of this Note contained details of the NSSUE and the associated highway
infrastructure within this document along with the proposed work stages. Issue 1 of the Scoping Note was issued to: i) seek agreement from NCC / MGWSP Northamptonshire Highways to the
proposed scope of works;
ii) inform NCC / MGWSP Northamptonshire Highways of the likely future work commitments;
iii) to seek an initial fee proposal from NCC and MGWSP Northamptonshire Highways for this work;
iv) to clarify work timescales; and v) to obtain client confirmation to this process.
Deleted: 3
Deleted: May 3 rd
Deleted: early
Deleted: at this stage
J:\28015 Collingtree\word\Reports\Transport\Scoping Note\130618 - NSTM Modelling Scoping Note Issue 4 - issued to NCC - HA.doc - 2 -
1.9 Issue 2 of the Scoping Note contained: i) the updated development masterplan;
ii) a minor amendment to the the land-use budget to reflect the available
information;
iii) further clarity on the development junction and access arrangements; iv) the output from the junction capacity assessments for the site accesses and
local junctions; v) further clarity on how the TEMPRO growth factors are to be amended and
applied. 1.10 Issue 3 of the Scoping Note contained:
i) In Appendix 7 (now 8), details of the vehicle trip generation from this
development to be included in the NSTM NSSUE Development option tests (para 5.3 (x));
ii) inclusion of a request for 2012 Base traffic flows (para 5.3 (xv)); iii) inclusion of a request that alternative Future Year Mitigated Do Something
traffic flows be allowed for at a later date (para 5.3 (xv)); iv) identifying that the future Mitigated Do Something work would include
modelling of the mode shift from single occupancy vehicles at a later date (para 5.3 (xii)).
1.11 Issue 4 of the Scoping Note contains:
i) a Node - Link diagram (Appendix 3);
ii) revised Rowtree Road Roundabout Site Access plan (para 3.3(i)), a further
design evolution;
iii) revised Windingbrook Lane Site Access Priority Junction plan (para 3.3(ii)); iv) internal link road network design speed, amended to reflect NCC’s comments
(para 3.3(iii)); v) clarity of the Phase 1 link road network (para 3.4); vi) clarity of the Phase 1 modelling sought, and renumbering of Section 5 to
provide easier reference;
vii) revised Appendix 8, a spreadsheet containing the details of the vehicle trip generation from this development to be included in the NSTM NSSUE Development option tests (para 5.3 (x));
viii) definition of the area for which model information is sought in Appendix 9.
2 NSSUE Development details 2.1 The details of the NSSUE Phase 1 and Full Development are summarised in Table 1.
2.2 The Working Draft Development Framework Plan prepared by David Lock Associates
(reference BHL/005 D) is enclosed as Appendix 2, but will be the subject of evolution and amendment as the masterplan develops.
Deleted: s
Deleted: a copy of Transport Technical Note 2 – containing
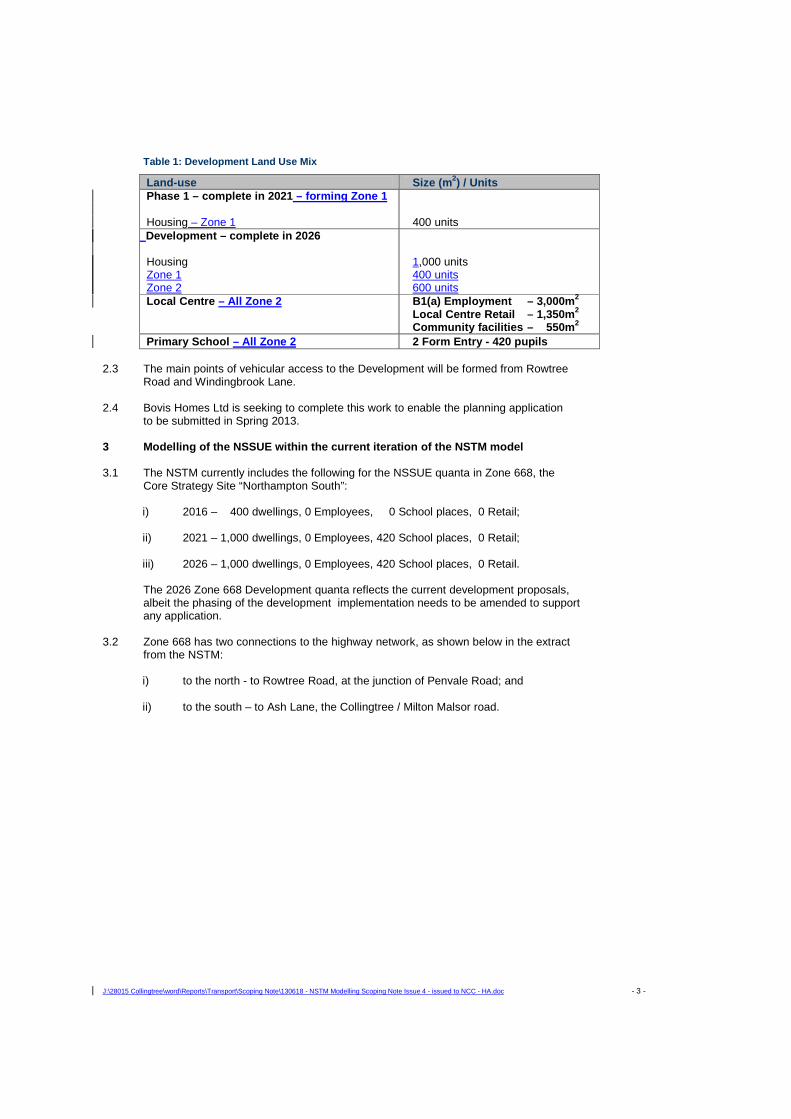
J:\28015 Collingtree\word\Reports\Transport\Scoping Note\130618 - NSTM Modelling Scoping Note Issue 4 - issued to NCC - HA.doc - 3 -
Table 1: Development Land Use Mix
Land-use Size (m2) / Units Phase 1 – complete in 2021 – forming Zone 1 Housing – Zone 1
400 units
Development – complete in 2026
Housing Zone 1 Zone 2
1,000 units 400 units 600 units
Local Centre – All Zone 2 B1(a) Employment – 3,000m 2 Local Centre Retail – 1,350m 2 Community facilities – 550m 2
Primary School – All Zone 2 2 Form Entry - 420 pupils 2.3 The main points of vehicular access to the Development will be formed from Rowtree
Road and Windingbrook Lane.
2.4 Bovis Homes Ltd is seeking to complete this work to enable the planning application to be submitted in Spring 2013.
3 Modelling of the NSSUE within the current iteration of the NSTM model
3.1 The NSTM currently includes the following for the NSSUE quanta in Zone 668, the Core Strategy Site “Northampton South”: i) 2016 – 400 dwellings, 0 Employees, 0 School places, 0 Retail;
ii) 2021 – 1,000 dwellings, 0 Employees, 420 School places, 0 Retail; iii) 2026 – 1,000 dwellings, 0 Employees, 420 School places, 0 Retail.
The 2026 Zone 668 Development quanta reflects the current development proposals, albeit the phasing of the development implementation needs to be amended to support any application.
3.2 Zone 668 has two connections to the highway network, as shown below in the extract from the NSTM:
i) to the north - to Rowtree Road, at the junction of Penvale Road; and
ii) to the south – to Ash Lane, the Collingtree / Milton Malsor road.
J:\28015 Collingtree\word\Reports\Transport\Scoping Note\130618 - NSTM Modelling Scoping Note Issue 4 - issued to NCC - HA.doc - 4 -
3.3 The NSTM NSSUE primary link road arrangement for the Full Development is to be
as follows – see Appendix 3 for an indicative Node – Link diagram: i) to provide a worst case for any junction capacity assessment at this location,
a new four-arm roundabout, replacing the existing three arm Rowtree Road / Lichfield Road priority junction. This is shown on PBA drawing 28015/002 contained in Appendix 4;
ii) a new priority junction on Windingbrook Lane shown on PBA drawing 28015/001 contained in Appendix 4;
iii) the alignment of the internal primary link road network is to be modelled as
shown on the masterplan in Appendix 2. For the purposes of the modelling this road is assumed to be 6.5m, and designed to 30mph;
iv) the Zone 1 and Zone 2 residential development zone loaders are to be
connected to the primary link road / secondary link road junctions shown on the masterplan;
v) the existing vehicular link to the south towards Ash Lane in Collingtree village shown in the model is to be deleted.
3.4 The NSTM NSSUE primary link road arrangement for the Phase 1 Development (the
area identified as “1” to the south-east of the site shown on the plan in Appendix 2, consisting of 400 units) is to be as follows:
i) Phase 1 will be accessed only by the Windingbrook Lane priority junction
shown on PBA drawing 28015/001 contained in Appendix 4 - the Rowtree Rd Site Access Rbt will not be provided as part of Phase 1;
ii) the alignment of the internal primary link road network is to be modelled as
shown on the masterplan in Appendix 2. The internal site road for Phase 1 will be provided from the Windingbrook Lane access to the completion of the internal loop – it will not continue past the public footpath until Phase 2. For the purposes of the modelling this road is assumed to be 6.5m, and designed to 30mph;
iii) the Phase 1 residential development zone loaders are to be connected to the
primary link road / secondary link road junctions shown on the masterplan;
Deleted: 1/001
Deleted: 3
Deleted: four arm roundabout
Deleted: (the two new arms being the site access roads – the two roads being implemented to provide security of access to the new development). This is
Deleted: 2
Deleted: 1/002
Deleted: 3
Deleted: 2
Deleted: Phase
Deleted: Phase
J:\28015 Collingtree\word\Reports\Transport\Scoping Note\130618 - NSTM Modelling Scoping Note Issue 4 - issued to NCC - HA.doc - 5 -
iv) the existing vehicular link to the south towards Ash Lane in Collingtree village shown in the model is to be deleted.
3.5 The junction figure plans, contained in Appendix 4, are work-in-progress, and
represent the best available information at this stage. These have been submitted for the purposes of the modelling only.
3.6 Output from the JUNCTIONS8 ARCADY junction capacity assessments for these two junctions are contained in Appendix 5.
4 Work Stages undertaken
4.1 At the Transport Scoping Meeting with the Highways Agency and Northamptonshire County Council, Peter Brett Associates agreed to prepare Technical Note 1 to inform the discussions over the extent of the of the Transport Assessment Study Area. This Note is contained in Appendix 6.
4.2 The assignment of the trips within Technical Note 1, hence the Study Area, was informed by a Select Zone Analysis of the NSSUE zone from the Northamptonshire Strategic Transport SATURN model for both the AM and PM peaks, as provided by NCC / MGWSP Northamptonshire Highways.
4.3 Technical Note 1 summarised existing traffic count data sources, and informed the need and extent of further traffic count data. All of this traffic count data will be made available to NCC and their consultants for the purposes of the NSTM modelling.
5 Future work to be undertaken
5.1 To enable the application of the NSTM to support transport assessment work and planning applications for individual developments within the County, the following work stages have been identified.
5.2 We would be grateful for costs from NCC and MGWSP for the following model work. We require this work to be undertaken as soon as possible.
5.3 In the interests of expediency, further details of some of the work elements may need to follow at a later stage.
5.4 Base Model 2012
i) local validation of the Base Model by NCC / MGWSP Northamptonshire Highways using the traffic count data obtained or commissioned by the client. Any necessary amendments to the Base Model to be undertaken by NCC / MGWSP Northamptonshire Highways;
ii) provision of a written report of the validation exercise by NCC / MGWSP Northamptonshire Highways to Northamptonshire County Council, the Highways Agency and Peter Brett Associates LLP, and confirmation that the validation is acceptable;
iii) output from the ARCADY and PICADY junction capacity assessments for local
junctions has been requested by MGWSP Northamptonshire Highways. This is included in Appendix 7;
5.5 2026 Future Year Do Minimum Model
i) in the 2026 Do Minimum test, the following numbers of houses allocated to all the seven Northampton Related Development Area SUE are to be deducted from the TEMPRO total of 50,193 for 2026:
Deleted: 3
Deleted: 4
Deleted: recent
Deleted: 5
Deleted: Base Model - 2012¶¶
Deleted: 6
J:\28015 Collingtree\word\Reports\Transport\Scoping Note\130618 - NSTM Modelling Scoping Note Issue 4 - issued to NCC - HA.doc - 6 -
Development: Quanta Northampton South SUE 1,000 Northampton Upton Park SUE 979 Northampton Kings Heath SUE – Dallington Grange 3,000 Northampton North – SUE 2,000 Northampton West – SUE 1,500 Northampton South of Brackmills SUE 1,000 Northampton – North of Whitehills SUE 1,000 Remaining total across West Northamptonshire 39,714
ii) no further allowance should be made for the Northampton South SUE in the Do
Minimum assessment;
iii) vehicle flows associated with the six other SUE households (a total of 9,479 households - ie, not the NSSUE) within the Northampton Related Development Area are to be loaded onto the network at the approximate location of these developments;
iv) unless Northamptonshire Highways has better information relating to the location
of the remaining development, the remaining general growth in household numbers for Northampton is to be applied across the town, the development associated with SNDC, DDC etc is to be focussed at these areas. The total households in the West Northamptonshire Area in the Do Minimum test is to be set at 49,193.
v) confirmation by NCC / MGWSP Northamptonshire Highways that the modelled
surrounding transport network infrastructure and transport enhancements by all parties - the HA, NCC and other developers - reflects the current position, and if necessary, updating the model;
5.6 2026 Future Year Do Something Model
i) NCC / MGWSP Northamptonshire Highways to amend the model network to
reflect the NSSUE proposed infrastructure. This includes dividing the NSSUE zone into 2 zones to reflect the proposed phasing with the necessary zone connectors – see Section 3;
ii) Peter Brett Associates has reviewed the external vehicle trip generation of the
Full Development NSSUE development. The output from the spreadsheet is contained in Appendix 8. The person trip assessment is informed by national trip generation and mode share data, and reflects the development location, development land use areas and mix, and proposed transport linkages and provision. This was submitted for agreement with NCC and MGWSP Northamptonshire Highways to Peter Brett Associates’ analysis of the NSSUE Full Development vehicle trip generation movements;
iii) substitution by NCC / MGWSP Northamptonshire Highways of the Full
Development vehicle flows contained within the NSTM model for the vehicle trip generation;
5.7 2026 Future Year Mitigated Do Something
i) agreement between NCC, MGWSP Northamptonshire Highways and Peter Brett Associates to the necessary infrastructure mitigation measures. For the purposes of establishing NCC / MGWSP Northamptonshire Highways’ fees, it is to be assumed that this would include mode shift from the number of Base vehicle trips, as well as enhancements to be coded at eight junctions;
ii) re-run of the model by NCC / MGWSP Northamptonshire Highways incorporating
these changes.
Deleted: Phase 1 and
Deleted: , prepared with reference to a person trip assessment and appropriate mode shift analysis for the development
Deleted: assessment is
Deleted: in Technical Note 2, included in
Deleted: 7
Deleted: local data - where available - or
Deleted: i
Deleted: Phase 1 and
Deleted: he Phase 1 and
Deleted: ¶Future Year Mitigated Do Something 
J:\28015 Collingtree\word\Reports\Transport\Scoping Note\130618 - NSTM Modelling Scoping Note Issue 4 - issued to NCC - HA.doc - 7 -
5.8 2021 Future Year Do Minimum
i) as per the 2026 Do Minimum test, the numbers of houses allocated to the seven Northampton Related Development Area SUE in the 2021 Do Minimum test are to be deducted from the TEMPRO total;
ii) no further allowance should be made for the Northampton South SUE in the Do Minimum assessment;
iii) vehicle flows associated with the six other SUE households within the Northampton Related Development Area are to be loaded onto the network at the approximate location of these developments;
iv) unless Northamptonshire Highways has better information relating to the location
of the remaining development, the remaining general growth in household numbers for Northampton is to be applied across the town, the development associated with SNDC, DDC etc is to be focussed at these areas;
v) confirmation by NCC / MGWSP Northamptonshire Highways that the modelled
surrounding transport network infrastructure and transport enhancements by all parties - the HA, NCC and other developers - reflects the current position, and if necessary, updating the model;
5.9 2021 Future Year Do Something Model
i) NCC / MGWSP Northamptonshire Highways to amend the model network to
reflect the NSSUE proposed infrastructure. This includes modelling the NSSUE Phase 1 to reflect the proposed phasing with the necessary zone connectors – see Section 3;
ii) Peter Brett Associates has reviewed the external vehicle trip generation of the
Phase 1 NSSUE development. This assessment is included in Appendix 8. The person trip assessment is informed by national trip generation and mode share data, and reflects the development location, development land use areas and mix, and proposed transport linkages and provision. This was submitted for agreement with NCC and MGWSP Northamptonshire Highways to Peter Brett Associates’ analysis of the NSSUE Phase 1 vehicle trip generation movements;
iii) substitution by NCC / MGWSP Northamptonshire Highways of the Phase 1
vehicle flows contained within the NSTM model for the vehicle trip generation;
5.10 Data to be provided i) as well as the standard Forecasting Modelling reports, Peter Brett Associates’
initial requirements for information to be provided by the NSTM are as follows -we may need to specify further work once we understand the overall initial impacts;
ii) provision of initial model output information by NCC / MGWSP Northamptonshire
Highways across the area shown in Appendix 9 for:
• 2012 Base
• 2021 Do Minimum; • 2021 Do Something - Phase 1; • 2026 Do Minimum; and • 2026 Do Something - Full Development
• 2026 Mitigated Do Something – Full Development;
J:\28015 Collingtree\word\Reports\Transport\Scoping Note\130618 - NSTM Modelling Scoping Note Issue 4 - issued to NCC - HA.doc - 8 -
iii) for all option runs, PDF copies of the following plots, showing i) figures and (ii)
figures and bandwidths:
• actual AM / PM link flows for this area;
• AM / PM v/c plots for this area;
• AM / PM queue plots for this area;
• AM / PM delay plots for this area;
• AM / PM plot of the select zone analysis origin and destination flows for the NSSUE Development through the same area, assuming Actual flows;
• full Junction Turning Movements (AM / PM) (identifying the origin / destination of all movements through up to 15 junctions) including:
- Rowtree Road Site Access; - Windingbrook Lane Site Access; - Wooldale Road / Berry Lane Roundabout; - Bridge Meadow Way / A45 southbound Off Slip / southbound On
Slip Roundabout; - Wooldale Road / London Road / Rowtree Road / A45 northbound
Off Slip Roundabout; - Rowtree Road / Windingbrook Lane / Butts Road Roundabout; - Rowtree Road / Penvale Road Mini Roundabout; - Towcester Road / Clannell Road Priority Junction; - Mereway / Towcester Road / Danes Camp Way (Tesco) Rbt; - Towcester Road / Rowtree Road Priority Junction; - Wooldale Road / Quinton Road Roundabout.
5.11 After a review of the results of the initial model tests, further tests are likely to commissioned at a later stage, but will be discussed and agreed with the highway authorities in advance.
6 Programme
6.1 A draft programme is requested from NCC and MGWSP Northamptonshire Highways
to enable the client to comment and agree to the proposed programme.
APPENDIX 1 – NOTES OF SCOPING MEETING – FRIDAY 25TH JANUARY 2013 AND SUBSEQUENT LIAISON
APPENDIX 2 – DRAFT DEVELOPMENT FRAMEWORK PLAN APPENDIX 3 - NODE – LINK DIAGRAM APPENDIX 4 – PLANS OF THE SITE ACCESS JUNCTIONS APPENDIX 5 – ARCADY / PICADY OUTPUTS FOR THE SITE ACCESS JUNCTIONS APPENDIX 6 – PBA TRANSPORT TECHNICAL NOTE 1 - NSTM ASSIGNMENT AND TRAFFIC SURVEY STRATEGY APPENDIX 7 – ARCADY / PICADY OUTPUTS FOR THE LOCAL JUNCTIONS APPENDIX 8 – EXTRACTS FROM THE VEHICLE TRIP CALCULATION SPREADSHEET APPENDIX 9 – MODEL AREA FROM WHICH INFORMATION IS SOUGHT
28015/NTN/RSH/SND/JPH June 18th, 2013
Deleted: 3
Deleted: 4
Deleted: 5
Deleted: 6
Deleted: 7
Deleted: TRANSPORT TECHNICAL NOTE 2 – PERSON TRIP ASSESSMENT
Deleted: May 3rd
J:\28015 Collingtree\word\Reports\Transport\Scoping Note\130618 - NSTM Modelling Scoping Note Issue 4 - issued to NCC - HA.doc - 9 -
APPENDIX 1 – NOTES OF SCOPING MEETING - FRIDAY 25TH JANUARY 2013 AND SUBSEQUENT LIAISON Meeting Title: Maple Farm Development, Collingtree (the Northampton South SUE), Northampton Pre-Application Transport Scoping Consultation Meeting Attendees: Rob Sim Jones - Northamptonshire County Council (NCC) Lou Mason Walsh - MG-WSP Northamptonshire Highways (MG-WSP) Jonathan Price - Highways Agency (HA) Simon Davis - Peter Brett Associates (PBA) John Hopkins - Peter Brett Associates Date of Meeting: Friday 25th January, 2013 - 15.00 – 16.00 Location: Riverside House, Bedford Road, Northampton Job Number: 28015
Item Subject
1 1.1 1.2
Introduction. This meeting was arranged to discuss the scoping for the transport assessment work necessary to support the emerging Northamptonshire South SUE (Maple Farm, Collingtree) development through the planning process, leading to a planning application. MG-WSP requested the Site be referred to as the “NSSUE” for clarity.
2 2.1 2.2 2.3
Details of the Maple Farm Collingtree Development Maple Farm, a residential development of 1,000 units, forms the strategic urban extension for South Northampton. It is located on land to the north of the M1, west of the A45, east of Towcester Road and the rail line, and south of Rowtree Road. It is being promoted by Bovis Homes Ltd. Post Meeting Note – the masterplan quantum referred to during the meeting has been amended following a review of the masterplan to that within the West Northants Pre Submission Joint Core Strategy.To avoid subsequent confusion, no references are made to the previous proposals discussed at this meeting. Bovis Homes Ltd‘s preference is to submit a planning application for the end of March 2013. NCC cautioned that it would be unlikely that sufficient progress would have been made with the necessary supporting NSTM and transport assessment work to achieve this deadline. A first phase of development is being proposed. A further assessment, based on an earlier timescale, will also be submitted.
3 3.1 3.2 3.3
HA comments - A45 proposals and the Northampton Growth Management Strategy. The HA has developed, jointly with the other authorities in the area, the Northampton Growth Management Strategy, to provide the vehicle for ringmaster contributions to be accepted from the SUE to fund the necessary trunk road highway infrastructure to mitigate all strategic development. This NGMS work was supported by DIAMOND modelling of Northampton, incorporating the West Northants Pre-Submission Joint Core Strategy document development quanta. The NSSUE was modelled as a 1,000 unit development. A series of junction and link enhancements and measures were considered based on this modelling, and a per capita contribution will be sought. HA confirmed that once the appropriate contributions were paid for the NGMS that development could proceed without hinderance from them. All authorities that sign up to the NGMS Memorandum of Understanding can hold contributions as ring-master
J:\28015 Collingtree\word\Reports\Transport\Scoping Note\130618 - NSTM Modelling Scoping Note Issue 4 - issued to NCC - HA.doc - 10 -
3.4
(including Northampton Borough Council), the County Council would deliver the works. Should alternative development quanta be sought by a SUE promoter, further runs of the DIAMOND modelling would be required to reassess the impact, and confirm that increased contributions are not required. With the currently proposed development quanta (1,000 units), this is not applicable.
4. 4.1 4.2 4.3 4.4 4.5 4.6 4.7 4.8 4.9 4.10 4.11
NCC comments NCC agreed that the Northamptonshire Strategic Transport Model (NSTM) is an appropriate tool to assess the development vehicle impact on local links, and to confirm cumulative impacts in the context of committed development. MG-WSP commented that their intial review suggested that the assessment study area would need to include Towcester Road up to the Gas Street Roundabout, possibly around St James and Bedford Road. Before the NSTM can be used to consider the NSSUE, the model would need to be subjected to a local model validation exercise, this process supported with more recent traffic count data. MG-WSP has already provided PBA with select zone analysis output for the NSSUE from the 2026 NSTM model. PBA is to submit a review of this select zone analysis provided by MG-WSP to confirm the extent of the Study Area and the traffic survey requirements, and to ascertain what counts are already held by NCC. NCC will not accept traffic count data collected during half term. PBA to contact NCC prior to commissioning surveys to confirm the programme for future road works in this area.MG-WSP to liaise with their modelling team to ascertain whether ATC or MCC at junctions are required. With respect to the NSSUE trip generation, PBA would need to submit and agree the development external vehicle trip quantum with NCC. These agreed vehicle trips for the development would be fixed in the model, then assigned from the NSSUE zone in the NSTM. These vehicle trips would be established by a person trip analysis prepared by Peter Brett Associates, and would include consideration of internalisation, and appropriate mode share and mode shift for the location, transport infrastructure and development quanta. The NSSUE zone is currently one zone. PBA to discuss with MG-WSP the need to split this into smaller zones better to respond to the proposed land uses. NCC is developing a strategy for Towcester Road and the Southern Inner Ring Road informed with a further, VISSIM, model of the town centre (hence why further survey work may be available in this area). This Study includes consideration of various options to deal with the Gas Street Roundabout and Plough Gyratory. This work is to enable ringmaster contributions to be accepted from the SUE to fund the necessary trunk road highway infrastructure along these corridors in a town-wide manner. The VISSIM model also incorporated the West Northants Pre-Submission Joint Core Strategy document development quanta. MG-WSP confirmed that they would be able to start the model validation process upon receipt of the traffic count data. MG-WSP advised that the 2031 option test is being worked on now, and will be available shortly. Following agreement to the traffic count surveys, further Notes will be issued by PBA to the joint highway authorities to scope the transport assessment work for submission and agreement.
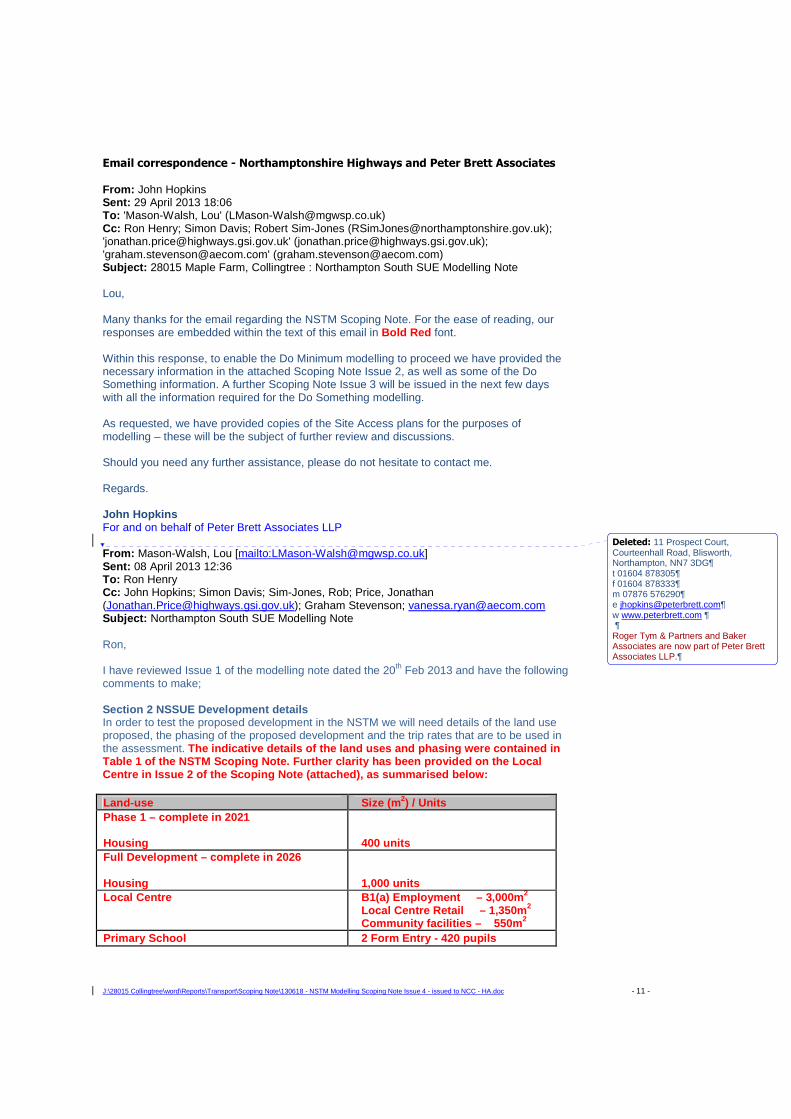
J:\28015 Collingtree\word\Reports\Transport\Scoping Note\130618 - NSTM Modelling Scoping Note Issue 4 - issued to NCC - HA.doc - 11 -
Email correspondence - Northamptonshire Highways and Peter Brett Associates From: John Hopkins Sent: 29 April 2013 18:06 To: 'Mason-Walsh, Lou' ([email protected]) Cc: Ron Henry; Simon Davis; Robert Sim-Jones ([email protected]); '[email protected]' ([email protected]); '[email protected]' ([email protected]) Subject: 28015 Maple Farm, Collingtree : Northampton South SUE Modelling Note Lou, Many thanks for the email regarding the NSTM Scoping Note. For the ease of reading, our responses are embedded within the text of this email in Bold Red font. Within this response, to enable the Do Minimum modelling to proceed we have provided the necessary information in the attached Scoping Note Issue 2, as well as some of the Do Something information. A further Scoping Note Issue 3 will be issued in the next few days with all the information required for the Do Something modelling. As requested, we have provided copies of the Site Access plans for the purposes of modelling – these will be the subject of further review and discussions. Should you need any further assistance, please do not hesitate to contact me. Regards. John Hopkins For and on behalf of Peter Brett Associates LLP From: Mason-Walsh, Lou [mailto:[email protected]] Sent: 08 April 2013 12:36 To: Ron Henry Cc: John Hopkins; Simon Davis; Sim-Jones, Rob; Price, Jonathan ([email protected]); Graham Stevenson; [email protected] Subject: Northampton South SUE Modelling Note Ron, I have reviewed Issue 1 of the modelling note dated the 20th Feb 2013 and have the following comments to make; Section 2 NSSUE Development details In order to test the proposed development in the NSTM we will need details of the land use proposed, the phasing of the proposed development and the trip rates that are to be used in the assessment. The indicative details of the land uses and phasing we re contained in Table 1 of the NSTM Scoping Note. Further clarity has been provided on the Local Centre in Issue 2 of the Scoping Note (attached), as summarised below: Land-use Size (m2) / Units Phase 1 – complete in 2021 Housing
400 units
Full Development – complete in 2026 Housing
1,000 units
Local Centre B1(a) Employment – 3,000m 2 Local Centre Retail – 1,350m 2 Community facilities – 550m 2
Primary School 2 Form Entry - 420 pupils
Deleted: 11 Prospect Court, Courteenhall Road, Blisworth, Northampton, NN7 3DG¶t 01604 878305¶f 01604 878333¶m 07876 576290¶e [email protected]¶w www.peterbrett.com ¶ ¶Roger Tym & Partners and Baker Associates are now part of Peter Brett Associates LLP.

J:\28015 Collingtree\word\Reports\Transport\Scoping Note\130618 - NSTM Modelling Scoping Note Issue 4 - issued to NCC - HA.doc - 12 -
The revised Scoping Note Issue 2 contains more details of the land-use proposals, and the development phasing. The Person Trip Analysis, which leads to the Development vehicle trip generation, will be included in the next Issue 3 of the Scoping Note, to be issued within the next few days. Section 3: Modelling of the NSSUE within the current iteration of the NSTM model The modelling of the NSSUE in the current version of the NSTM is in line with the Emerging Core Spatial Strategy for West Northamptonshire and does not include any internal road structure but simply indicates which link the development is expected to access the local road network. To ensure that the modelling reflects the emerging mas terplan, Peter Brett Associates has confirmed within Issue 2 of the Scoping Note where the proposed Development is to be connected to the surrounding highway network – the NSSUE Development link already in the NSTM to the south towards Ash Lane / Collingtree Village is to be removed. Para 3.3: In order to undertake the required testing of the proposed development the current assumptions will be removed and replaced with the site specific trip rates, it will also be necessary to code the proposed internal road network into the NSTM, this should include the assumed link type and junction arrangements. Details of the proposed Development lin k and indicative junction type arrangements are included in the attached Issue 2 of the Scoping Note. Details of the NSSUE vehicle trip generation are contained in Issue 3 of the Scoping Note, shortly to be issued. To aid the modelling of the internal road network we will need to see the junction assessment models so that these can be agreed and the relevant information such as sat flows extracted and input into the NSTM. The Site Access junction assessment ARCADY output file s (obtained from the JUNCTIONS8 suite) are contained in Issue 2 of the Scoping Note. Section 5: Further Work to be undertaken Base Model The revalidation exercise of the NSTM will mean that the base year for the model will be 2012. Noted, thanks. The local model validation exercise includes not just the inclusion of the new count data but also checking of the local road network to ensure that any changes to the local road network since the previous base validation are included. This process will be informed by the individual junction models to be used in the preparation of the TA for the above scheme, these should be submitted as soon as possible to enable the models to be agreed. As requested, the ARCADY and PICADY assessment files for the adjacent junctions are included in Issue 2 of the Scoping Note. Future Year Do Minimum Model The NSTM is constrained to TEMPRO. Noted, thanks. We comment: With respect to the number of households modelled within this area:
i) we agree, the total Do Something number of households within the model should be constrained to that in TEMPRO;
ii) at present, TEMPRO 6.2 assumes growth in the West Northamptonshire area (South Northants, Northampton Borough and Daventry Districts) of 50,193 households between 2001 and 2026. This is essentially the same as the housing projections that support the Pre-Submission West Northamptonshire Joint Core Strategy which assumes 50,150 completions to 2026 (TEMPRO assumes a further 43 households). Based on the information set out above, it is assumed that modelled growth in this area is constrained to the TEMPRO figures of 50,193 set out above;
iii) further clarity regarding the number of homes proposed over the period to 2026 in the Pre-Submission West Northamptonshire Joint Core Strategy is set out in West Northamptonshire JPU’s ‘Housing Technical Paper Update’ dated July 2012. This paper confirms that the growth of 50,150 households
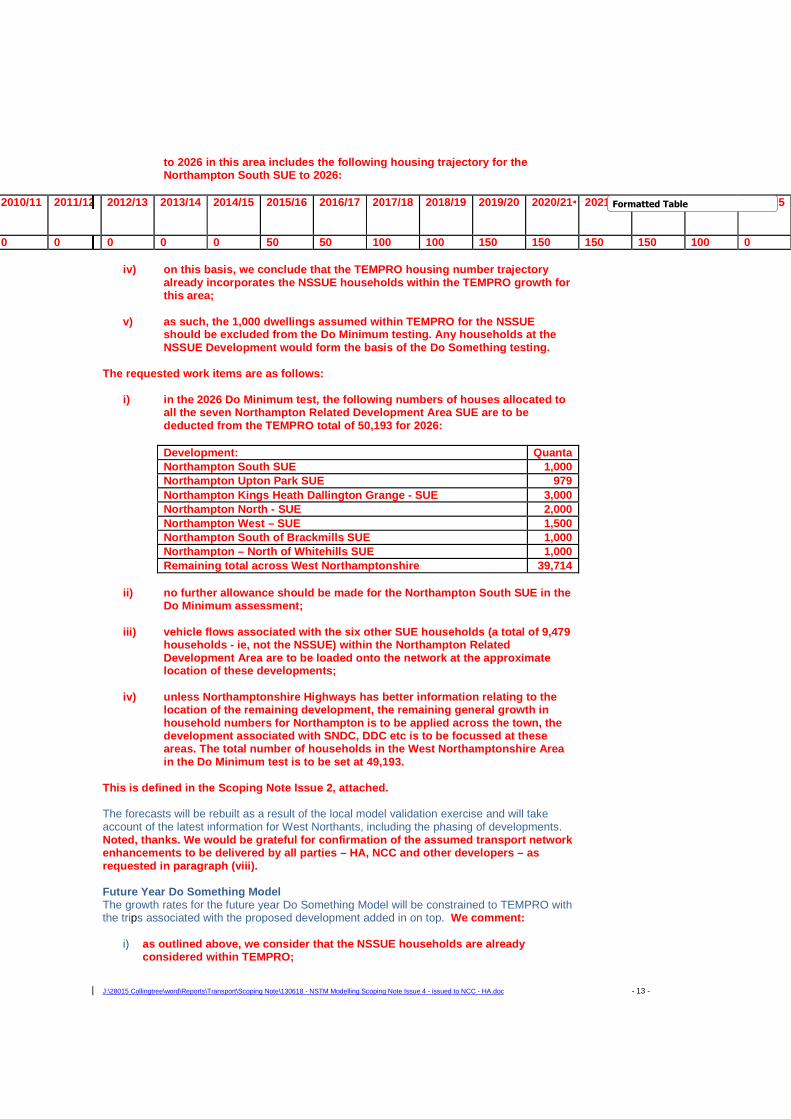
J:\28015 Collingtree\word\Reports\Transport\Scoping Note\130618 - NSTM Modelling Scoping Note Issue 4 - issued to NCC - HA.doc - 13 -
to 2026 in this area includes the following housing trajectory for the Northampton South SUE to 2026:
2010/11 2011/12 2012/13 2013/14 2014/15 2015/16 2016/17 2017/18 2018/19 2019/20 2020/21 2021/22 2022/23 2023/24 2024/25
0 0 0 0 0 50 50 100 100 150 150 150 150 100 0
iv) on this basis, we conclude that the TEMPRO housing number trajectory already incorporates the NSSUE households within the TEMPRO growth for this area;
v) as such, the 1,000 dwellings assumed within TEMPRO for the NSSUE should be excluded from the Do Minimum testing. Any households at the NSSUE Development would form the basis of the Do Something testing.
The requested work items are as follows:
i) in the 2026 Do Minimum test, the following numbers of houses allocated to all the seven Northampton Related Development Area SUE are to be deducted from the TEMPRO total of 50,193 for 2026: Development: Quanta Northampton South SUE 1,000 Northampton Upton Park SUE 979 Northampton Kings Heath Dallington Grange - SUE 3,000 Northampton North - SUE 2,000 Northampton West – SUE 1,500 Northampton South of Brackmills SUE 1,000 Northampton – North of Whitehills SUE 1,000 Remaining total across West Northamptonshire 39,714
ii) no further allowance should be made for the Northampton South SUE in the Do Minimum assessment;
iii) vehicle flows associated with the six other SUE households (a total of 9,479 households - ie, not the NSSUE) within the Northampton Related Development Area are to be loaded onto the network at the approximate location of these developments;
iv) unless Northamptonshire Highways has better information relating to the location of the remaining development, the remaining general growth in household numbers for Northampton is to be applied across the town, the development associated with SNDC, DDC etc is to be focussed at these areas. The total number of households in the West Northamptonshire Area in the Do Minimum test is to be set at 49,193.
This is defined in the Scoping Note Issue 2, attached. The forecasts will be rebuilt as a result of the local model validation exercise and will take account of the latest information for West Northants, including the phasing of developments. Noted, thanks. We would be grateful for confirmation o f the assumed transport network enhancements to be delivered by all parties – HA, NCC and other developers – as requested in paragraph (viii). Future Year Do Something Model The growth rates for the future year Do Something Model will be constrained to TEMPRO with the trips associated with the proposed development added in on top. We comment:
i) as outlined above, we consider that the NSSUE househol ds are already considered within TEMPRO;
Formatted Table

J:\28015 Collingtree\word\Reports\Transport\Scoping Note\130618 - NSTM Modelling Scoping Note Issue 4 - issued to NCC - HA.doc - 14 -
ii) as such, the Do Minimum test should reflect 49,193 uni ts (ie “TEMPRO minus
1,000 units for NSSUE”); iii) the trip generation defined by Peter Brett Associates for the additional 1,000
units within NSSUE is to added to the Do Something model – see below for methodology.
The phasing of the proposed development will need to be confirmed to ensure that the future year accurately reflects the desired development form. Confirmation of the phasing is con tained in Table 1 of the attached Scoping Note. The trip rates for the proposed development should be vehicle trip rates with the same level of detail as previously agreed for the East of Kettering development. To respond in full to Nor thamptonshire Highways’ request, we will shortly be issuing a further Technical Note detailing the Person Trip Analysis with source data which leads to the Development vehicle trip generation by plot in Issue 3 of the Scoping Note. All previous details of the Site in the NSTM will be removed and replaced with site specific information. Noted, thanks – we request that this includes the prop osed site links as well as the development quanta as stated in Issue 2 of the Scoping Note. Future Year Mitigated Do-Something The level of retesting as a result of mitigation required will be determined once the results of the initial tests are complete. The costs and programme for this element will be agreed prior to any work being undertaken. Noted, thanks. Data to be provided The revised modelling note needs to set out the details of the area for which data is required and a list of junctions for which specific turning movements is required. A list is included in the attached Issue 2 of the Scoping Note. Whilst we have endeavoured to accommodate Northamptonshire Highways to the best of our ability, this is an iterative pro cess and the list may require some amendment during this work. Section 6: Programme As previously stated the programme for the post validation elements will be agreed once the local model validation exercise is complete and the HA have confirmed that they are content with the results of the revalidated model. Acknowledging that there will be the need for li aison and agreement with third parties, it would be most advantageous to our client to have a “Most Informed” estimate of the programme, reflecting Northamptonshire Highways current commitments, and accepting that this programme may need to be revised at a later date should third party approvals etc affect the programme.
Regards
Lou
Lou Mason-Walsh BA (Hons) MCIHT Senior Transport Planner Northamptonshire Highways
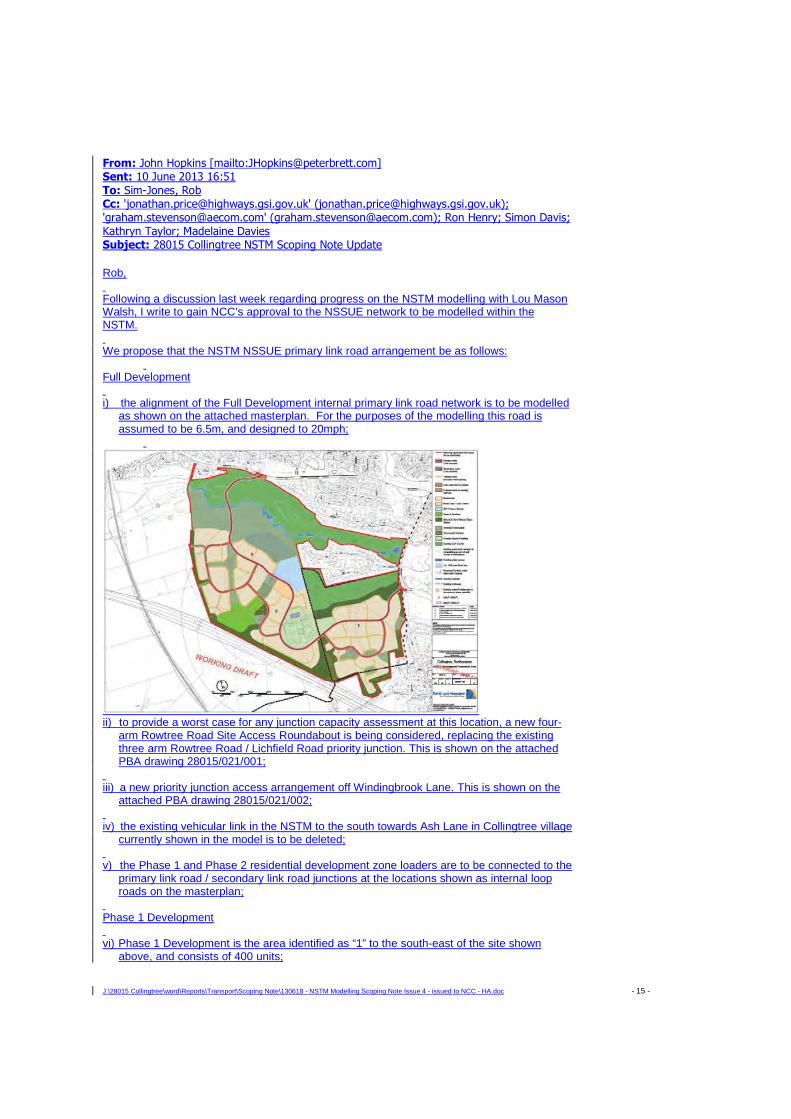
J:\28015 Collingtree\word\Reports\Transport\Scoping Note\130618 - NSTM Modelling Scoping Note Issue 4 - issued to NCC - HA.doc - 15 -
From: John Hopkins [mailto:[email protected]] Sent: 10 June 2013 16:51
To: Sim-Jones, Rob Cc: '[email protected]' ([email protected]); '[email protected]' ([email protected]); Ron Henry; Simon Davis;
Kathryn Taylor; Madelaine Davies Subject: 28015 Collingtree NSTM Scoping Note Update
Rob, Following a discussion last week regarding progress on the NSTM modelling with Lou Mason Walsh, I write to gain NCC’s approval to the NSSUE network to be modelled within the NSTM. We propose that the NSTM NSSUE primary link road arrangement be as follows:
Full Development i) the alignment of the Full Development internal primary link road network is to be modelled
as shown on the attached masterplan. For the purposes of the modelling this road is assumed to be 6.5m, and designed to 20mph;
ii) to provide a worst case for any junction capacity assessment at this location, a new four-
arm Rowtree Road Site Access Roundabout is being considered, replacing the existing three arm Rowtree Road / Lichfield Road priority junction. This is shown on the attached PBA drawing 28015/021/001;
iii) a new priority junction access arrangement off Windingbrook Lane. This is shown on the
attached PBA drawing 28015/021/002; iv) the existing vehicular link in the NSTM to the south towards Ash Lane in Collingtree village
currently shown in the model is to be deleted; v) the Phase 1 and Phase 2 residential development zone loaders are to be connected to the
primary link road / secondary link road junctions at the locations shown as internal loop roads on the masterplan;
Phase 1 Development vi) Phase 1 Development is the area identified as “1” to the south-east of the site shown
above, and consists of 400 units;

J:\28015 Collingtree\word\Reports\Transport\Scoping Note\130618 - NSTM Modelling Scoping Note Issue 4 - issued to NCC - HA.doc - 16 -
vii) Phase 1 will be accessed by the Windingbrook Lane priority junction and Windingbrook
Lane only, the Rowtree Rd Site Access Rbt will not be provided as part of Phase 1; viii)the internal site road for Phase 1 will be provided from the Windingbrook Lane access to
the completion of the internal loop – it will not continue passed the public footpath until Phase 2.
These two junction figure plans are work-in-progress, and represent the best available information at this stage. These have been circulated to those involved in the agreement to the modelling, for the purposes of informing this modelling only. Whilst the detail of the junction designs still needs to be agreed, we suggest that these plans are sufficient and acceptable for the purposes of modelling. I trust that this is sufficient, but if you should need any further data please do not hesitate to contact me. Regards, John Hopkins For and on behalf of Peter Brett Associates LLP
From: Sim-Jones, Rob [mailto:[email protected]] Sent: 11 June 2013 09:16
To: John Hopkins
Cc: '[email protected]' ([email protected]); '[email protected]' ([email protected]); Ron Henry; Simon Davis;
Kathryn Taylor; Madelaine Davies; [email protected] Subject: RE: 28015 Collingtree NSTM Scoping Note Update
Dear John, Thank you for the information. I am generally content with the information provided on the basis that it is to progress with the modelling work only at this stage. We will clearly comment in detail on the access proposals, impacts on the Public Rights of Way, walking and cycling links, and public transport provision etc., as the scheme progresses. The only comment I have at this stage, is that the 6.5m primary road through the site will have a design speed of 30mph, and not the 20mph proposed, as it will be the bus route and in reality it will be very difficult to control speeds below 30mph. As such, the junction and forward visibility splays will be based on a y-distance of 43m. The primary road network should therefore by modelled with a 30mph design speed. I trust this assists. Kind regards, Rob Rob Sim-Jones Principal Engineer – Development Management Northamptonshire Highways Riverside House, Riverside Way, Bedford Road, Northampton, NN1 5NX DDI: +44(0)1604 364338 Web: www.mgwsp.co.uk;
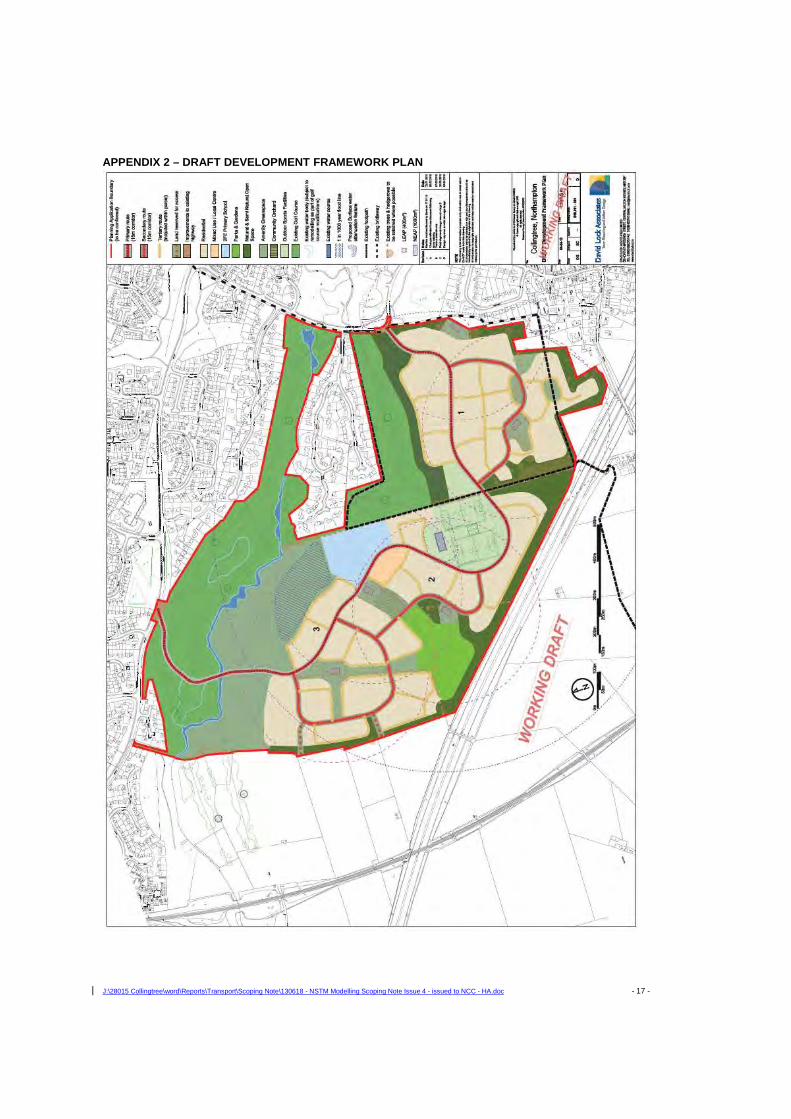
J:\28015 Collingtree\word\Reports\Transport\Scoping Note\130618 - NSTM Modelling Scoping Note Issue 4 - issued to NCC - HA.doc - 17 -
APPENDIX 2 – DRAFT DEVELOPMENT FRAMEWORK PLAN
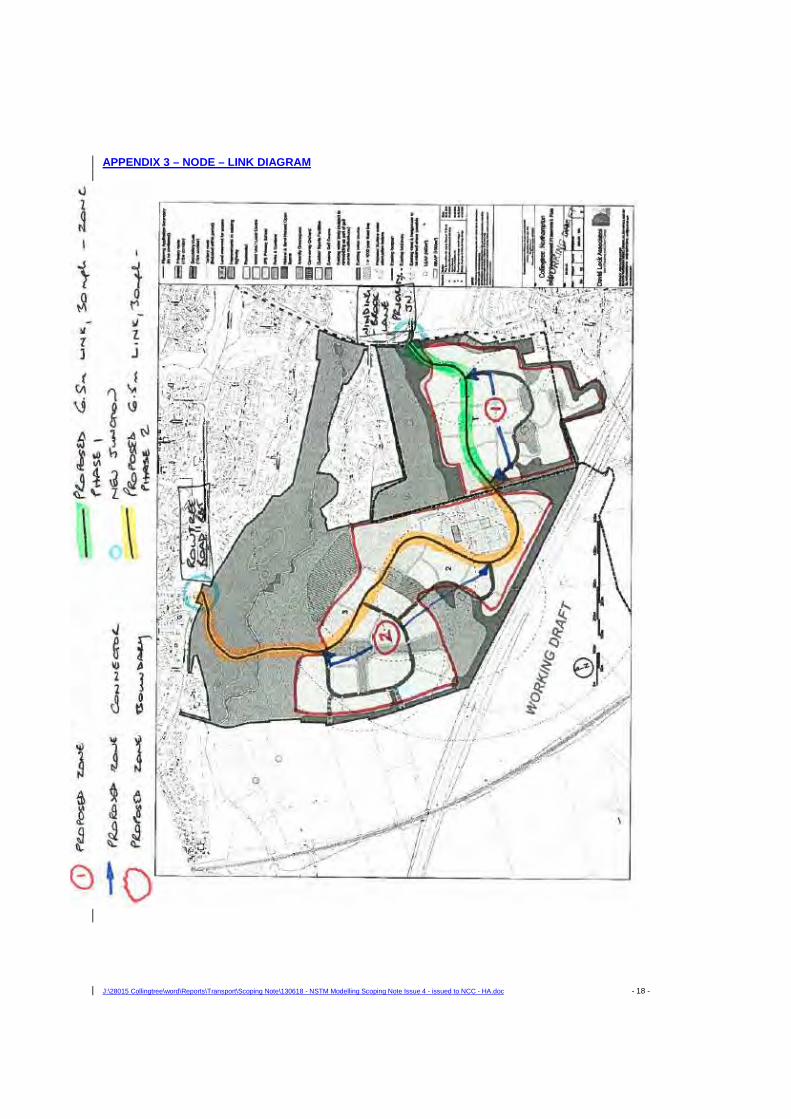
J:\28015 Collingtree\word\Reports\Transport\Scoping Note\130618 - NSTM Modelling Scoping Note Issue 4 - issued to NCC - HA.doc - 18 -
APPENDIX 3 – NODE – LINK DIAGRAM

J:\28015 Collingtree\word\Reports\Transport\Scoping Note\130618 - NSTM Modelling Scoping Note Issue 4 - issued to NCC - HA.doc - 19 -
APPENDIX 4 – PLANS OF THE SITE ACCESS JUNCTIONS Deleted: 3

J:\28015 Collingtree\word\Reports\Transport\Scoping Note\130618 - NSTM Modelling Scoping Note Issue 4 - issued to NCC - HA.doc - 20 -
APPENDIX 5 – ARCADY / PICADY OUTPUTS FOR THE SITE ACCESS JUNCTIO NS Deleted: 4
J:\28015 Collingtree\word\Reports\Transport\Scoping Note\130618 - NSTM Modelling Scoping Note Issue 4 - issued to NCC - HA.doc - 21 -
APPENDIX 6 – PBA TRANSPORT TECHNICAL NOTE 1 Job Name: Northampton South SUE (Maple Farm, Collingtree) Peter Brett Associates LLP
11 Prospect Court
Job No: 28015 Courteenhall Road,
Blisworth
Note No: Transport Techncial Note 1 T: +44 (0)1604 878 300
F: +44 (0)1604 878 333
Date: 31/01/2013 E: [email protected]
Website: www.peterbrett.com
Prepared By: Philip Hazelwood / John Hopkins
Subject: NSTM assignment and traffic survey strategy
1. Introduction
1.1 This Technical Note has been prepared by Peter Brett Associates LLP to support the
forthcoming Northampton South SUE (NSSUE - Maple Farm Development, Collingtree) application for outline planning consent.
1.2 At the recent Transport Scoping Meeting with the Highways Agency and Northamptonshire County Council, Peter Brett Associates agreed to prepare this Note to inform the discussions of the Transport Assessment Study area, hence the requirement to obtain existing and commission further traffic count data.
1.3 The County Council has provided Select Zone Analysis SATURN model of the NSSUE zone from the Northamptonshire Transport Strategic Model for both the AM and PM peaks. The assignment of these trips summarised below informs this assessment.
1.4 The SATURN model shows a connection to the south, towards Collingtree. This link
does not form part of the current proposals, flows to this direction have been reassigned, and are assumed to pass along either the A43 (west) or A45 (south). Along both corridors surveys and analysis is being proposed.
2. Summary of NSTM Results 2.1 The NSSUE has been assessed in the NSTM with the Joint Core Strategy proposal for
1,000 dwellings. This shows that the NSTM assumes that there are total NSSUE Development two-way flows of:
i) 282 vehicles in the AM Peak; and
ii) 288 vehicles in the PM Peak.
2.2 For the purposes of establishing the initial Study area, it is assumed that junctions and links with more than 20 two-way trips in either peak generated by the NSSUE should be considered as:
i) the model shows a trip rate of around 0.3 trips per dwelling - it is likely that further work would establish a trip rate around 50% higher (ie, a reported modelled flow of 20 trips would increase to 30 two-way trips);
ii) whilst it is acknowledged that the Highways Agency’s “A Protocol for Dealing
with Planning Applications” applies to trunk roads, it provides a reasonable threshold requirement for link and junction assessments where there are more than 30 No. two-way trips generated by the Development.
2.3 The reassignment of trips as a consequence of the removal of the Collingtree link are
included in this table as the “+ xx” figures.The following assumptions have been made for these trips that have been assigned to the highway network:
Deleted: 5
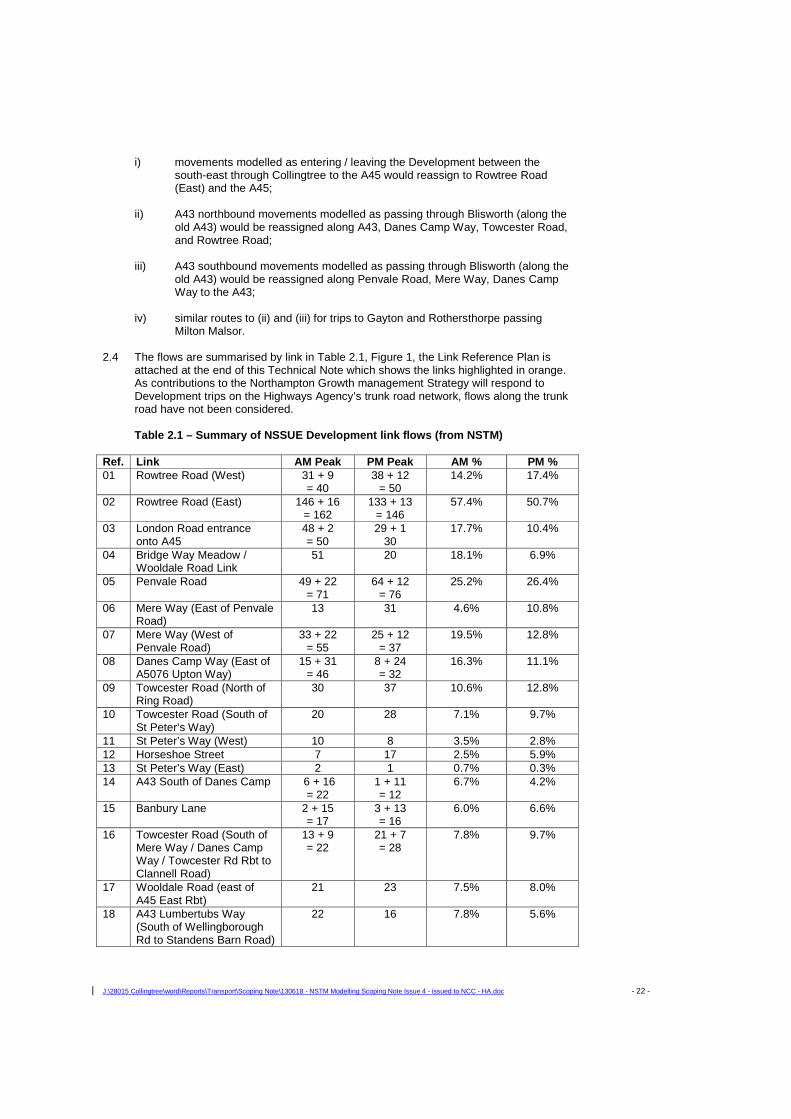
J:\28015 Collingtree\word\Reports\Transport\Scoping Note\130618 - NSTM Modelling Scoping Note Issue 4 - issued to NCC - HA.doc - 22 -
i) movements modelled as entering / leaving the Development between the south-east through Collingtree to the A45 would reassign to Rowtree Road (East) and the A45;
ii) A43 northbound movements modelled as passing through Blisworth (along the
old A43) would be reassigned along A43, Danes Camp Way, Towcester Road, and Rowtree Road;
iii) A43 southbound movements modelled as passing through Blisworth (along the
old A43) would be reassigned along Penvale Road, Mere Way, Danes Camp Way to the A43;
iv) similar routes to (ii) and (iii) for trips to Gayton and Rothersthorpe passing
Milton Malsor. 2.4 The flows are summarised by link in Table 2.1, Figure 1, the Link Reference Plan is
attached at the end of this Technical Note which shows the links highlighted in orange. As contributions to the Northampton Growth management Strategy will respond to Development trips on the Highways Agency’s trunk road network, flows along the trunk road have not been considered. Table 2.1 – Summary of NSSUE Development link flows (from NSTM)
Ref. Link AM Peak PM Peak AM % PM % 01 Rowtree Road (West)
31 + 9 = 40
38 + 12 = 50
14.2% 17.4%
02 Rowtree Road (East)
146 + 16 = 162
133 + 13 = 146
57.4% 50.7%
03 London Road entrance onto A45
48 + 2 = 50
29 + 1 30
17.7% 10.4%
04 Bridge Way Meadow / Wooldale Road Link
51 20 18.1% 6.9%
05 Penvale Road
49 + 22 = 71
64 + 12 = 76
25.2% 26.4%
06 Mere Way (East of Penvale Road)
13 31 4.6% 10.8%
07 Mere Way (West of Penvale Road)
33 + 22 = 55
25 + 12 = 37
19.5% 12.8%
08 Danes Camp Way (East of A5076 Upton Way)
15 + 31 = 46
8 + 24 = 32
16.3% 11.1%
09 Towcester Road (North of Ring Road)
30 37 10.6% 12.8%
10 Towcester Road (South of St Peter’s Way)
20 28 7.1% 9.7%
11 St Peter’s Way (West) 10 8 3.5% 2.8% 12 Horseshoe Street 7 17 2.5% 5.9% 13 St Peter’s Way (East) 2 1 0.7% 0.3% 14 A43 South of Danes Camp 6 + 16
= 22 1 + 11 = 12
6.7% 4.2%
15 Banbury Lane 2 + 15 = 17
3 + 13 = 16
6.0% 6.6%
16
Towcester Road (South of Mere Way / Danes Camp Way / Towcester Rd Rbt to Clannell Road)
13 + 9 = 22
21 + 7 = 28
7.8% 9.7%
17 Wooldale Road (east of A45 East Rbt)
21 23 7.5% 8.0%
18 A43 Lumbertubs Way (South of Wellingborough Rd to Standens Barn Road)
22 16 7.8% 5.6%
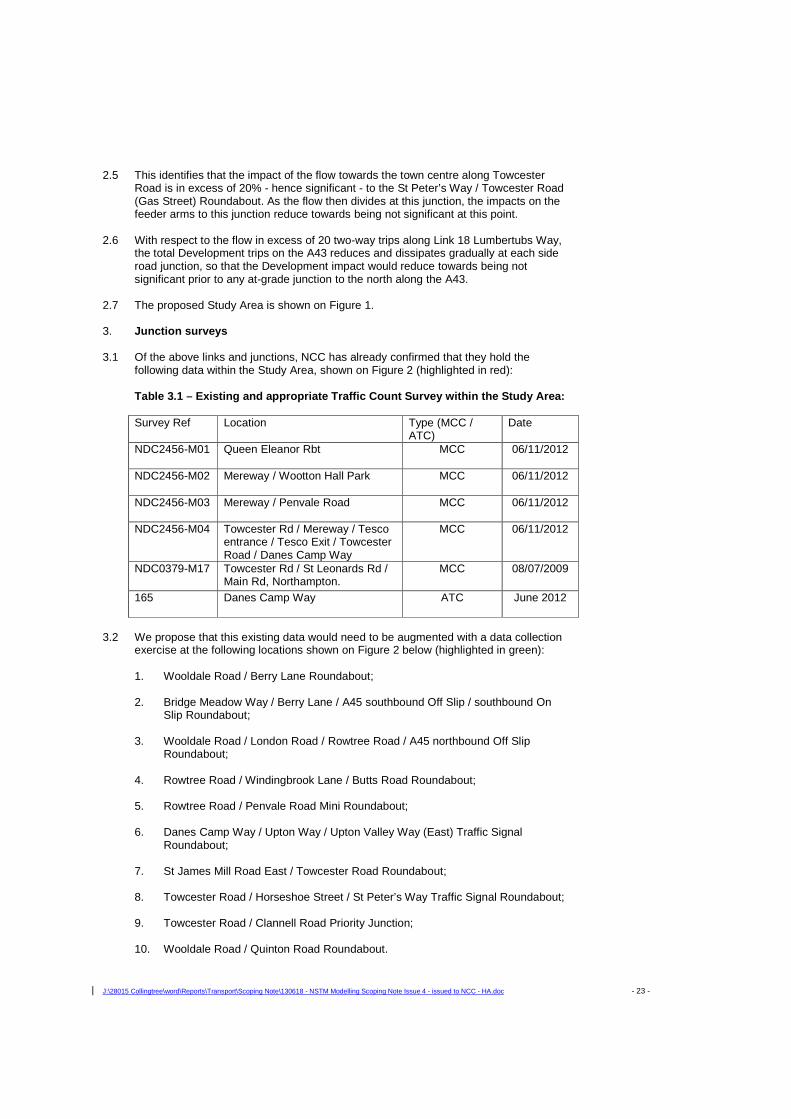
J:\28015 Collingtree\word\Reports\Transport\Scoping Note\130618 - NSTM Modelling Scoping Note Issue 4 - issued to NCC - HA.doc - 23 -
2.5 This identifies that the impact of the flow towards the town centre along Towcester
Road is in excess of 20% - hence significant - to the St Peter’s Way / Towcester Road (Gas Street) Roundabout. As the flow then divides at this junction, the impacts on the feeder arms to this junction reduce towards being not significant at this point.
2.6 With respect to the flow in excess of 20 two-way trips along Link 18 Lumbertubs Way, the total Development trips on the A43 reduces and dissipates gradually at each side road junction, so that the Development impact would reduce towards being not significant prior to any at-grade junction to the north along the A43.
2.7 The proposed Study Area is shown on Figure 1.
3. Junction surveys
3.1 Of the above links and junctions, NCC has already confirmed that they hold the
following data within the Study Area, shown on Figure 2 (highlighted in red): Table 3.1 – Existing and appropriate Traffic Count Survey within the Study Area: Survey Ref Location Type (MCC /
ATC) Date
NDC2456-M01 Queen Eleanor Rbt
MCC 06/11/2012
NDC2456-M02 Mereway / Wootton Hall Park
MCC 06/11/2012
NDC2456-M03 Mereway / Penvale Road
MCC 06/11/2012
NDC2456-M04 Towcester Rd / Mereway / Tesco entrance / Tesco Exit / Towcester Road / Danes Camp Way
MCC 06/11/2012
NDC0379-M17 Towcester Rd / St Leonards Rd / Main Rd, Northampton.
MCC 08/07/2009
165 Danes Camp Way ATC June 2012
3.2 We propose that this existing data would need to be augmented with a data collection
exercise at the following locations shown on Figure 2 below (highlighted in green): 1. Wooldale Road / Berry Lane Roundabout; 2. Bridge Meadow Way / Berry Lane / A45 southbound Off Slip / southbound On
Slip Roundabout; 3. Wooldale Road / London Road / Rowtree Road / A45 northbound Off Slip
Roundabout; 4. Rowtree Road / Windingbrook Lane / Butts Road Roundabout; 5. Rowtree Road / Penvale Road Mini Roundabout; 6. Danes Camp Way / Upton Way / Upton Valley Way (East) Traffic Signal
Roundabout; 7. St James Mill Road East / Towcester Road Roundabout;
8. Towcester Road / Horseshoe Street / St Peter’s Way Traffic Signal Roundabout;
9. Towcester Road / Clannell Road Priority Junction;
10. Wooldale Road / Quinton Road Roundabout.
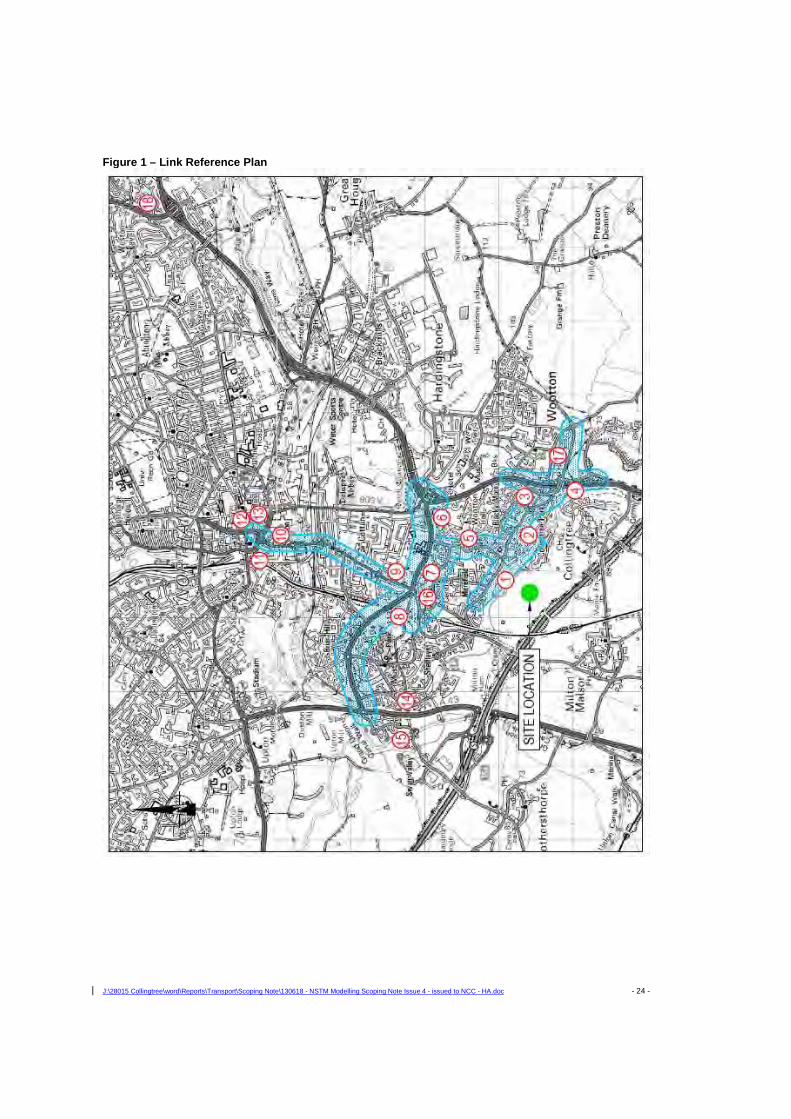
J:\28015 Collingtree\word\Reports\Transport\Scoping Note\130618 - NSTM Modelling Scoping Note Issue 4 - issued to NCC - HA.doc - 24 -
Figure 1 – Link Reference Plan
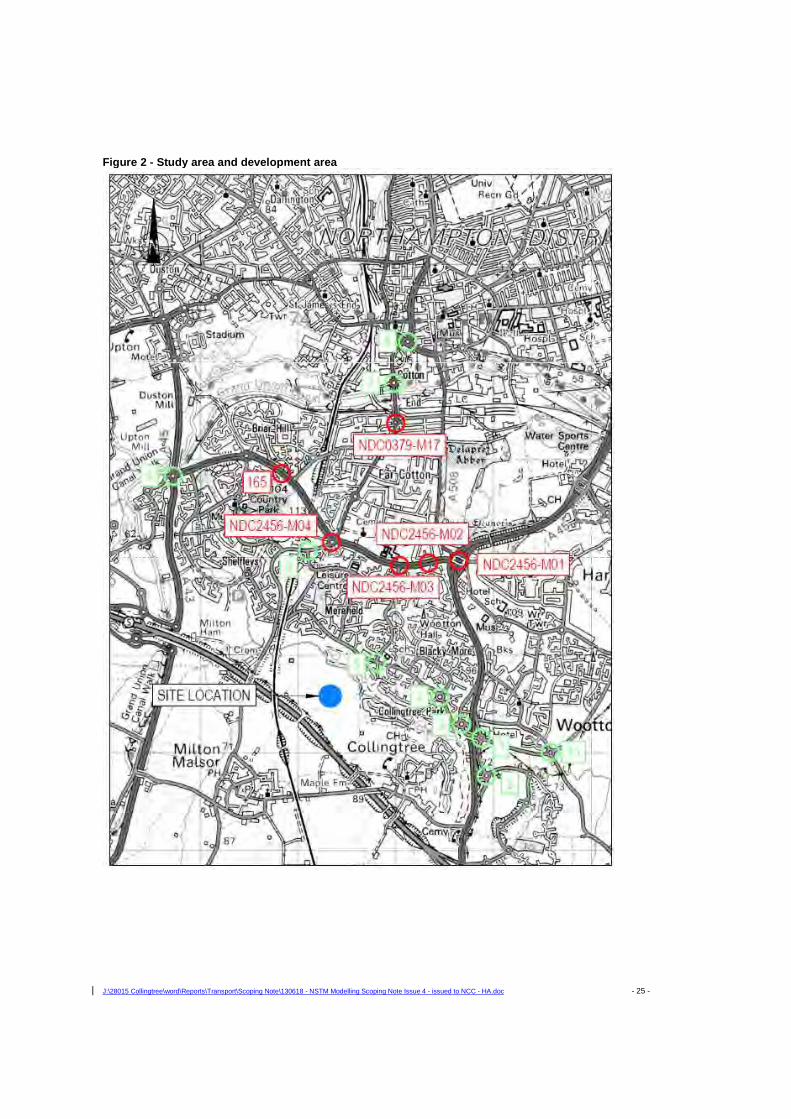
J:\28015 Collingtree\word\Reports\Transport\Scoping Note\130618 - NSTM Modelling Scoping Note Issue 4 - issued to NCC - HA.doc - 25 -
Figure 2 - Study area and development area

J:\28015 Collingtree\word\Reports\Transport\Scoping Note\130618 - NSTM Modelling Scoping Note Issue 4 - issued to NCC - HA.doc - 26 -
APPENDIX 7 – ARCADY / PICADY OUTPUTS FOR THE LOCAL JUNCTIONS (Previously provided in Issue 3, not resent with Issue 4)
Deleted: 6

J:\28015 Collingtree\word\Reports\Transport\Scoping Note\130618 - NSTM Modelling Scoping Note Issue 4 - issued to NCC - HA.doc - 27 -
APPENDIX 8 – EXTRACTS FROM THE VEHICLE TRIP CALCULATION Deleted: 7
Deleted: TRANSPORT TECHNICAL NOTE 2 – PERSON TRIP ASSESSMENT
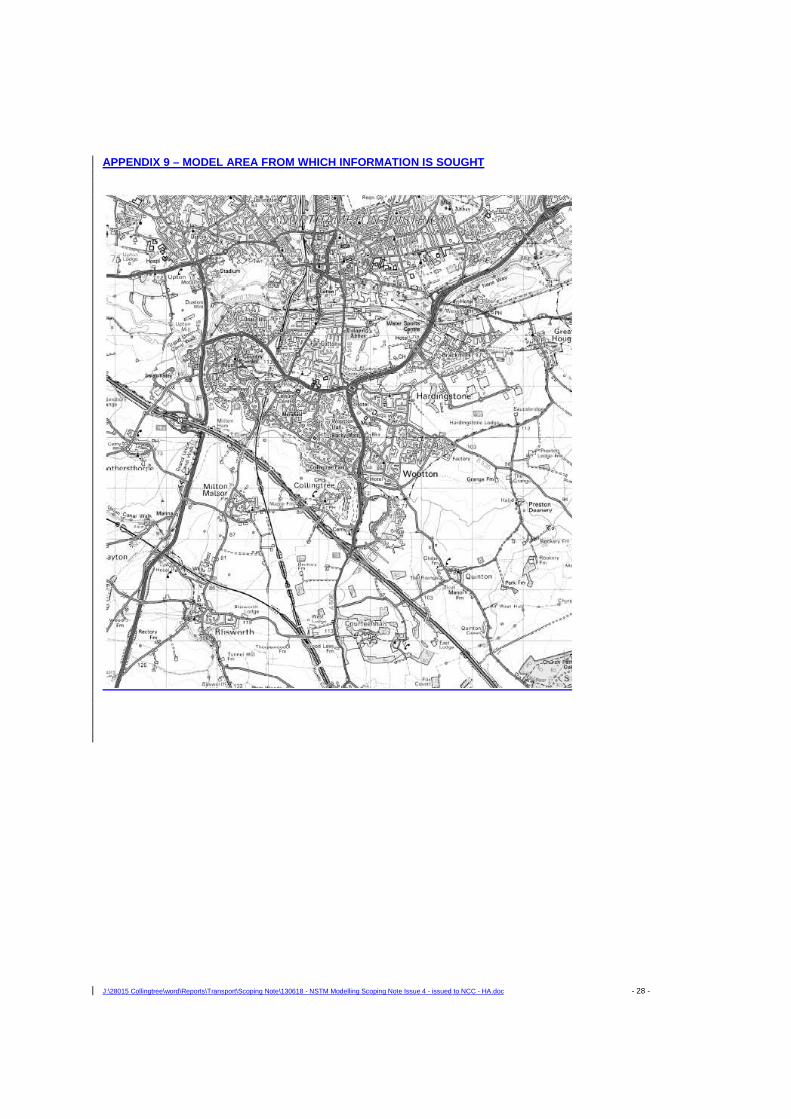
J:\28015 Collingtree\word\Reports\Transport\Scoping Note\130618 - NSTM Modelling Scoping Note Issue 4 - issued to NCC - HA.doc - 28 -
APPENDIX 9 – MODEL AREA FROM WHICH INFORMATION IS SOUGHT