Embed Size (px)
Citation preview

Appendix 10:
SiC High Temperature Oxidation Tests
1
HighTemperatureOxidationandQuenchStudiesofAccidentTolerantLWRFuels–SiC/SiCCMCTubeSamples
Final Report
September 23, 2015
by Gregory Daines & Pierre Guenoun, Research Assistants, MIT
Prof. Mujid Kazimi Director, Center for Advanced Nuclear Energy Systems (CANES) TEPCO Professor of Nuclear Engineering – posthumously authored
Director, Kuwait MIT Center for Natural Resources and the Environment MIT Nuclear Science and Engineering Department
Dr. Thomas McKrell Director, CANES Experimental Laboratory Research Scientist MIT Nuclear Science and Engineering Department
Dr. Edward Lahoda Westinghouse Technical Lead Dr. Frank Boylan Westinghouse Project Manager
MIT Project # 6926954
MIT Massachusetts Institute of Technology

2
Contents
I. Executive summary ............................................................................................................................... 8
II. Introduction ........................................................................................................................................ 10
1. Test Matrix ...................................................................................................................................... 10
2. Description of the samples ............................................................................................................. 11
i. Westinghouse samples ............................................................................................................... 11
ii. GA samples .................................................................................................................................. 12
III. As‐Received Sample Characterization ............................................................................................ 14
1. Procedure ........................................................................................................................................ 14
2. Inner Pressure vs Displacement ...................................................................................................... 14
3. Optical and SEM Analysis ................................................................................................................ 16
4. Mechanical Model .......................................................................................................................... 18
5. Mechanical Results ......................................................................................................................... 20
i. Series 196 .................................................................................................................................... 21
ii. Series 198 .................................................................................................................................... 22
iii. Series 200 .................................................................................................................................... 23
iv. Series GAOE ................................................................................................................................. 24
v. Series GACE‐A.............................................................................................................................. 25
vi. Series GACE‐B .............................................................................................................................. 26
6. Failure Characteristics ..................................................................................................................... 27
7. Conclusion ....................................................................................................................................... 29
8. Discussion ........................................................................................................................................ 30
IV. Thermal Shock Experiments............................................................................................................ 32
1. Procedure & Results ........................................................................................................................ 32
2. Thermal‐Hydraulic Analysis ............................................................................................................. 32
3. Optical & SEM analyses ................................................................................................................... 34
i. Westinghouse Samples ............................................................................................................... 34
ii. GA Samples ................................................................................................................................. 35
iii. Observations ............................................................................................................................... 36
4. Mechanical Results ......................................................................................................................... 37
i. Series 196 .................................................................................................................................... 38

3
ii. Series 198 .................................................................................................................................... 39
iii. Series 200 .................................................................................................................................... 40
iv. Series GAOE ................................................................................................................................. 41
v. Series GACE‐A.............................................................................................................................. 42
vi. Series GACE‐B .............................................................................................................................. 43
5. Quenched Failure Characteristics ................................................................................................... 44
6. Conclusion ....................................................................................................................................... 46
7. Discussion ........................................................................................................................................ 49
V. High Temperature Oxidation Experiments ......................................................................................... 50
1. Procedure ........................................................................................................................................ 50
2. Optical and SEM Analysis ................................................................................................................ 51
i. Westinghouse Samples ............................................................................................................... 51
ii. GA Samples ................................................................................................................................. 52
iii. Observations ............................................................................................................................... 53
3. Mechanical Results ......................................................................................................................... 59
i. Series 196 .................................................................................................................................... 60
ii. Series 198 .................................................................................................................................... 61
iii. Series 200 .................................................................................................................................... 62
iv. Series GAOE ................................................................................................................................. 63
v. Series GACE‐A.............................................................................................................................. 64
vi. Series GACE‐B .............................................................................................................................. 65
4. Oxidized Failure Characteristics ...................................................................................................... 66
5. Conclusion ....................................................................................................................................... 68
6. Discussion ........................................................................................................................................ 69
VI. Series Comparison .......................................................................................................................... 70
1. Series 196 ........................................................................................................................................ 70
2. Series 198 ........................................................................................................................................ 70
3. Series 200 ........................................................................................................................................ 71
4. Series GAOE..................................................................................................................................... 71
5. Series GACE‐A ................................................................................................................................. 72
6. Series GACE‐B .................................................................................................................................. 72
7. Overall ............................................................................................................................................. 72

4
VII. Conclusion ....................................................................................................................................... 75
1. As‐Received Analysis ....................................................................................................................... 75
2. Influence of Quenching ................................................................................................................... 76
3. Influence of Oxidation ..................................................................................................................... 78
4. Recommendations for design ......................................................................................................... 79
VIII. Bibliography .................................................................................................................................... 81
5
List of Figures Figure 1: Test Matrix ................................................................................................................................... 10
Figure 2: Optical view of the different WEC Designs .................................................................................. 11
Figure 3: As‐received SEM views of 198.1.23 Top: cross‐section Bottom: lateral view ............................. 12
Figure 4: Architectures of GACE samples .................................................................................................... 13
Figure 5: SEM cross section of GAOE6 ........................................................................................................ 13
Figure 6: Schematic of the burst test .......................................................................................................... 14
Figure 7: As‐Received Samples, Inner Pressure vs Displacement ............................................................... 15
Figure 8: Optical and SEM analysis of the failure modes for the Westinghouse samples and GAOE 2 a)
Lateral View As‐Received (scale: 1.5 cm) b) Post Burst Lateral view c) Lateral SEM view d) Top SEM view
of the crack ................................................................................................................................................. 16
Figure 9: Illustration of the two steps loading regimes .............................................................................. 17
Figure 10: GA endplug pushout test set‐up ................................................................................................ 20
Figure 11: Internal Pressure vs Displacement curves for as‐received sample 196.1.27 ............................ 21
Figure 12: Internal Pressure vs Displacement curve for as‐received sample 198.1.24 .............................. 22
Figure 13: Stress‐Strain curve for outer surface of sample 200.1.25 (slopes of elastic regions indicated on
curve) .......................................................................................................................................................... 23
Figure 14: Stress‐Strain curve for outer surface of sample GAOE2 (slopes of elastic regions indicated) .. 24
Figure 15: Pushrod load versus displacement curve for GACE 2 pushout test ........................................... 25
Figure 16: Pushrod load versus displacement curve for GACE 6 pushout test ........................................... 26
Figure 17: Comparison of Failure Characteristics of GAOE 2 (left) and 196.1.27 (right) ............................ 28
Figure 18: Detached Fragment of GAOE 2 .................................................................................................. 28
Figure 19: Endplug failure characteristics of as‐received samples GACE 2 (left) and GACE 6 (right) ......... 28
Figure 20 (right): Schematic of Thermal Shock Facility ............................................................................... 32
Figure 21: Quench of 1200°C 196.1.26 into 90°C water, quench from is first seen at t = 11.36 seconds .. 33
Figure 22: Optical and SEM analysis of quench characteristics of Westinghouse samples a) as‐received
lateral view b) post quench lateral view c) crack after quench & burst d) SEM images of the sample
198.1.23: cross section as‐received and views of the post burst test crack ............................................... 34
Figure 23: Optical and SEM analysis of quench characteristics of GA samples a) as‐received lateral view
b) post quench lateral view c) crack after quench & burst d) SEM images of the GAOE samples: cross
section as‐received and view of the post burst test crack ......................................................................... 35
Figure 24: SEM comparison of as‐received and quenched sample 196.1.20 a) as‐received b) quenched 36
Figure 25: Internal pressure vs Displacement for quench samples ............................................................ 37
Figure 26: Internal Pressure vs Displacement curves for as‐received and quenched series 196 ............... 38
Figure 27: Internal Pressure vs Displacement curves for as‐received and quenched series 198 ............... 39
Figure 28: Stress‐strain curve for as‐received and quench series 200 ....................................................... 40
Figure 29: Stress‐ Strain Curve Series GAOE, OD ........................................................................................ 41
Figure 30: Pushrod load versus displacement curves for GACE‐A series pushout test .............................. 42
Figure 31: Pushrod load versus displacement curve for GACE‐B series pushout test ................................ 43
6
Figure 32: Comparison of cracking behavior between pairs of quenched samples (left half of paired
pictures) and as‐received samples (right half of paired pictures) A) Series 196, B) Series 200, C) Series
198, D) Series GAOE .................................................................................................................................... 44
Figure 33: Failure mode of GAOE 5 a) top view b) lateral view .................................................................. 44
Figure 34: SEM comparison of 196.1.20 (top) and 198.1.16 (bottom) Lateral: lateral view of the crack;
Cross sectional: upper view of the crack .................................................................................................... 45
Figure 35: Endplug joint failure comparison for GACE‐A and GACE‐B series ............................................. 46
Figure 36: XCT scans of the joint region in GACE 5 (before quenching) (left) and GACE 6 (tested as‐
received) (right) showing more voids in the joint of GACE 5 ...................................................................... 49
Figure 37: Optical and SEM analysis of oxidation characteristics of Westinghouse samples .................... 51
Figure 38: Optical and SEM analysis of oxidation characteristics of GA samples ....................................... 52
Figure 39: As‐received cross‐sectional SEM images of various oxidized samples ...................................... 53
Figure 40: SEM images of sample 200.1.23 showing what is believed to be silica‐coated fibers (left) and
corrosion cracking of fiber (right) ............................................................................................................... 54
Figure 41: SEM image of sample 200.1.23 prior to oxidation showing as‐received fiber structure and fiber
texture ......................................................................................................................................................... 54
Figure 42: SEM lateral view of A) As‐received sample and B) Oxidized sample ......................................... 55
Figure 43: EDS analysis of silica coating on lateral surface of oxidized sample GAOE 3 (top) and 198.1.25
(bottom) showing Oxygen to Silicon ratio of approximately 2 to 1 ............................................................ 56
Figure 44: EDS analysis of irregular formations on lateral face of oxidized sample 200.1.23 showing silica
(area 1) and silicon‐carbide (area 2). Similar deposits were observed in the cross‐section of the oxidized
samples ....................................................................................................................................................... 57
Figure 45: Deposit believed to be silica in the void between fiber tows in the cross‐section of oxidized
sample GAOE 4 ............................................................................................................................................ 57
Figure 46: EDS analysis showing silica in the endplug joint but not in surrounding CMC layer (top) and
silica buildup on the inside‐facing surface of the endplug (bottom) .......................................................... 58
Figure 47: Internal pressure vs displacement for oxidized samples ........................................................... 59
Figure 48: Internal Pressure vs Displacement Curve Comparison for Series 196 ....................................... 60
Figure 49: Stress‐Strain Curve for OD of Oxidized Sample 198.1.25 (Left, Slope of Elastic Region
Indicated) Internal Pressure vs Displacement Curve Comparison for Series 198 (Right) ........................... 61
Figure 50: Stress‐Strain Curve Comparison for OD of Series 200 (Slopes of Elastic Regions Indicated) .... 62
Figure 51: Stress‐Strain Curve Comparison for OD of Series GAOE (Slopes of Elastic Regions Indicated) . 63
Figure 52: Pushrod load versus displacement curves for GACE‐A series pushout tests ............................. 64
Figure 53: Pushrod load versus displacement curves for GACE‐B series pushout tests ............................. 65
Figure 54: Comparison of cracking behavior between pairs of oxidized samples (left half of paired
pictures) and as‐received samples (right half of paired pictures) .............................................................. 66
Figure 55: Endplug joint failure comparison for GACE‐A and GACE‐B series ............................................. 67
Figure 56: SEM lateral view of endplug showing silica‐coated fibers on the endplug after pushout ........ 67
Figure 57: Comparison of monolith failure stress ...................................................................................... 73
Figure 58: Comparison of fiber failure stress (note that the range of possible values is reflected by the
split bars) ..................................................................................................................................................... 74
Figure 59: Comparison of endplug joint burst strength ............................................................................. 74
7
List of Tables Table 1: Designs, dimensions, and nomenclature of the specimens .......................................................... 13
Table 2: Mechanical characteristics of sample 196.1.27 ............................................................................ 21
Table 3: Mechanical characteristics of as‐received sample 198.1.24 ......................................................... 22
Table 4: Mechanical Characteristics of 200.1.25 ........................................................................................ 23
Table 5: Mechanical characteristics of GAOE2 ........................................................................................... 24
Table 6: Mechanical characteristics of endplug joint for GACE 2 ............................................................... 25
Table 7: Mechanical characteristics of endplug joint for GACE 6 ............................................................... 26
Table 8: As‐received strength testing ......................................................................................................... 29
Table 9: Fiber yield stress for as‐received samples .................................................................................... 29
Table 10: Mechanical properties of series 196 ........................................................................................... 38
Table 11: Mechanical properties of series 198 ........................................................................................... 39
Table 12: Mechanical properties of series 200 ........................................................................................... 40
Table 13: Mechanical properties of GAOE series ........................................................................................ 41
Table 14: Mechanical properties of endplug joint for GACE‐A series ......................................................... 42
Table 15: Mechanical properties of endplug joint for GACE‐B series ......................................................... 43
Table 16: Mechanical properties of as‐received and quenched samples ................................................... 48
Table 17: Table of Westinghouse sample oxidation characteristics ........................................................... 51
Table 18: Table of oxidation characteristics of GA samples ....................................................................... 52
Table 19: Mechanical Characteristics for Series 196 .................................................................................. 60
Table 20: Mechanical Characteristics of Series 198 .................................................................................... 61
Table 21: Mechanical Characteristics of Series 200 .................................................................................... 62
Table 22: Mechanical Characteristics of Series GAOE ................................................................................ 63
Table 23: Mechanical properties of endplug joint for GACE‐A series ......................................................... 64
Table 24: Mechanical properties of endplug joint for GACE‐B series ......................................................... 65
Table 25: Table showing results of oxidized sample burst testing (Note: the GA samples are treated as
without a monolith) .................................................................................................................................... 68
Table 26: Mechanical results for series 196 ............................................................................................... 70
Table 27: Mechanical results for series 198 ............................................................................................... 70
Table 28: Mechanical results for series 200 ............................................................................................... 71
Table 29: Mechanical results for series GAOE ............................................................................................ 71
Table 30: Mechanical results for series GACE‐A ......................................................................................... 72
Table 31: Mechanical results for series GACE‐B ......................................................................................... 72
Table 32: Comparison of Results between Series ....................................................................................... 73
Table 33: As‐Received Sum up Mechanical Table ....................................................................................... 76
Table 34: Thermal Shock Summary table ................................................................................................... 77
Table 35: Oxidation Mechanical results ...................................................................................................... 79

8
I. ExecutivesummaryIn this work, five different series of Silicon Carbide (SiC) SiC/SiC ceramic matrix composite (CMC)
cladding architectures are assessed under simulated loss‐of‐coolant accident (LOCA) conditions. The five
series are denominated WEC101 196, WEC01 198, WEC01 200, GAOE2 and GACE3. For each series,
sample performance is assessed under high temperature steam oxidation (oxidation at 1,400ᵒC for 48
hours under a steam flow rate of 6 g/min) and thermal shock (quenching from 1,200ᵒC into 100ᵒC and
90ᵒC water). Finally, the strength and ductility of the samples were evaluated and compared against
control samples. Performance is quantified by a regimen of weight measurement, optical analysis,
scanning electron microscopy (SEM) analysis, energy dispersive spectroscopy (EDS) analysis and
mechanical strength analysis (yield stress, failure stresses, elastic moduli, and failure strain).
Section VI provides a summary comparison of the samples performance. Detailed conclusions are
provided in section VII. Briefly, those conclusions are as follows:
1. The thermal shock was observed to only have a small impact on the mechanical and
microstructural characteristics of all samples. Strength testing revealed that the failure
stresses of the cladding samples was scattered but was not significantly influenced by
thermal shock. Furthermore, SEM analysis failed to detect microcracks or other signs of
material degradation following thermal shock. Overall, multilayer SiC composite cladding
was observed to be resilient to thermal shock.
2. High temperature steam oxidation led to silica buildup in the inner voids of the CMC layer of
all samples resulting in a net weight gain of the samples and in the embrittlement of the
SiC/SiC CMC region. For all oxidized Westinghouse samples, sudden and catastrophic failure
was observed as the CMC layer failed immediately upon inner monolith failure. Post
oxidation, those samples showed a reduction in strength from 250 MPa to 180 MPa while
the absence of pseudo‐ductility resulted in the failure strain dropping from 0.3% to 0.03%.
For the GA samples, failure stress fell from 580MPa as‐received to 230MPa post oxidation,
and these samples also experienced a ten times reduction in strain at failure. SiC/SiC
composites achieved much better performance than typical Zr or steel claddings as the
oxidative embrittlement was non‐frangible in nature thereby maintaining a coolable
geometry after failure. Additionally, zirconium alloys are nearly completely consumed after
15 minutes at 1200C and here we are comparing to SiC that has seen 1400C for 48 hours.
3. The GAOE series (composed of a CMC layer with thin 200 µm outer monolith layer) offered
the best performance with a failure hoop stress reaching 600 MPa as‐received and higher
than 200 MPa after oxidation.
4. The three Westinghouse series (with an inner monolith/CMC/outer EBC) all behaved in a
similar way with an inner monolith failure hoop stress reaching 250 MPa as‐received.
However, the CMC layers behaved differently. Series 196 and 200 exhibited pseudo ductility
while monolith and CMC layers of series 198 failed simultaneously in a brittle manner. It
1 WEC: Westinghouse Electric Company 2 GAOE: General Atomics Open Ended 3 GACE: General Atomics Closed One End

9
cannot be correlated to the weaving pattern since series 198 and 200 have a similar weaving
pattern (three tows) while series 196 is made of two tows.
5. Endplug joining appears as a possible limitation. Endplug joint burst strength was estimated
by uniaxial loading to approximately 30 MPa as‐received. The GACE‐B endplug
sample/architecture performed poorly compared to the GACE‐A. The GACE‐B endplug
strength drops after quenching (by more than 50%) and less severely after oxidation (by
25%). While the GACE‐A endplug strength was largely unaffected. It appears as though fiber
weave/architecture could play a role in this trend. Looking at the typical 14 MPa plenum
pressure limit for a LWR, the SiC monolithic endplug joint withstanding 30 MPa seems
satisfactory. However, plenum pressure could be much higher with SiC cladding as the
absence of creep closing the fuel‐cladding gap, the radial swelling of SiC and its low thermal
conductivity will raise the plenum temperature, and hence the pressure.
A limited number of samples, one or two per each test condition, were tested in this work. Accordingly,
it is strongly suggested that more samples be tested to strengthen these conclusions. Also, differences in
sample fabrication could also be influencing the results.
Additionally, performance under irradiation must be assessed before drawing conclusive judgement on
SiC/SiC composites’ potential as fuel cladding material. This work is in progress under a separate project.
10
II. Introduction
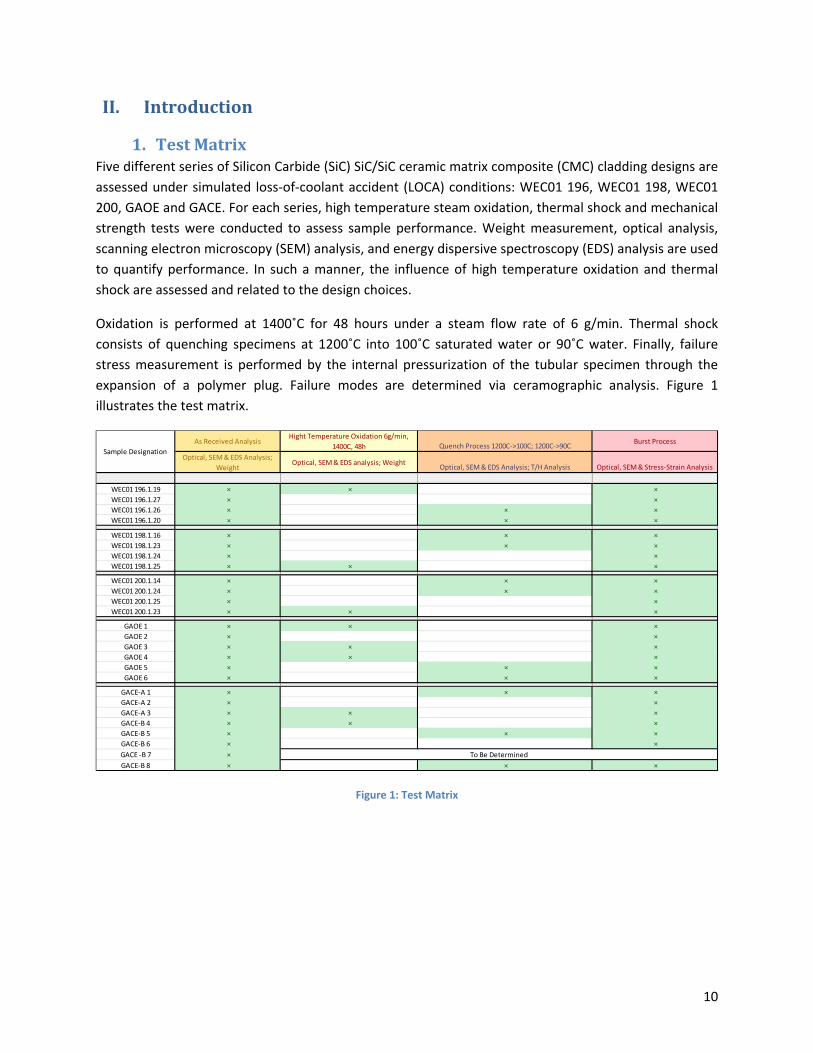
1. TestMatrixFive different series of Silicon Carbide (SiC) SiC/SiC ceramic matrix composite (CMC) cladding designs are
assessed under simulated loss‐of‐coolant accident (LOCA) conditions: WEC01 196, WEC01 198, WEC01
200, GAOE and GACE. For each series, high temperature steam oxidation, thermal shock and mechanical
strength tests were conducted to assess sample performance. Weight measurement, optical analysis,
scanning electron microscopy (SEM) analysis, and energy dispersive spectroscopy (EDS) analysis are used
to quantify performance. In such a manner, the influence of high temperature oxidation and thermal
shock are assessed and related to the design choices.
Oxidation is performed at 1400˚C for 48 hours under a steam flow rate of 6 g/min. Thermal shock
consists of quenching specimens at 1200˚C into 100˚C saturated water or 90˚C water. Finally, failure
stress measurement is performed by the internal pressurization of the tubular specimen through the
expansion of a polymer plug. Failure modes are determined via ceramographic analysis. Figure 1
illustrates the test matrix.
Figure 1: Test Matrix
As Received AnalysisHight Temperature Oxidation 6g/min,
1400C, 48h Quench Process 1200C‐>100C; 1200C‐>90CBurst Process
Optical, SEM & EDS Analysis;
WeightOptical, SEM & EDS analysis; Weight
Optical, SEM & EDS Analysis; T/H Analysis Optical, SEM & Stress‐Strain Analysis
WEC01 196.1.19 × × ×
WEC01 196.1.27 × ×
WEC01 196.1.26 × × ×
WEC01 196.1.20 × × ×
WEC01 198.1.16 × × ×
WEC01 198.1.23 × × ×
WEC01 198.1.24 × ×
WEC01 198.1.25 × × ×
WEC01 200.1.14 × × ×
WEC01 200.1.24 × × ×
WEC01 200.1.25 × ×
WEC01 200.1.23 × × ×
GAOE 1 × × ×
GAOE 2 × ×
GAOE 3 × × ×
GAOE 4 × × ×
GAOE 5 × × ×
GAOE 6 × × ×
GACE‐A 1 × × ×
GACE‐A 2 × ×
GACE‐A 3 × × ×
GACE‐B 4 × × ×
GACE‐B 5 × × ×
GACE‐B 6 × ×
GACE ‐B 7 ×
GACE‐B 8 × × ×
Sample Designation
To Be Determined

11
2. DescriptionofthesamplesThe SiC cladding sample designs explored in this work fall into two categories: The WEC01 designation
refers to three‐layered SiC specimens while the GA designation describes two‐layered SiC specimens.
i. WestinghousesamplesThe Westinghouse (WEC01) samples consist of three layers: an inner monolith layer, a fibrous layer, and
an outer SiC environmental barrier coating (EBC) layer. High purity beta‐phase SiC forms the inner
monolith layer whose role is to contain fission gases and retain hermeticity of the fuel rod. It is
synthetized by chemical vapor deposition (CVD) and represents 1/6 of the total wall thickness of the
samples.
The next layer is a SiC/SiC Ceramic Matrix Composite (CMC) that accounts for 2/3 of the total wall
thickness of the samples. Tows consisting of around 500 mono‐filament beta silicon carbide fibers are
wrapped around the inner monolith layer to add tensile strength to the sample and allow for pseudo‐
ductility. For the WEC01 samples, the tows used are Hi‐Nicalon Type S with a single layer of pyrolytic
carbon added at the fiber/matrix interphase for decoupling. Beta silicon carbide was added to fill the
voids between the tows by the chemical vapor infiltration (CVI) process.
The outermost 1/6 of the total wall thickness is made of another monolith layer. This EBC layer
contributes to hermeticity and mainly prevents corrosion of the CMC layer. Westinghouse constructed
the EBC overcoat using high‐purity beta‐phase deposited via CVD. Additionally, because the samples
were cut from a longer tube stock, the ends of the samples were CVD coated with SiC in an attempt to
seal the cut faces. This thin (~ 60µm thick) layer would not be present in service.
Three WEC01 architectures are investigated for this report. First, the weaving pattern of the CMC layer
of series 196 differs from weaving pattern in both series 198 and 200. Indeed, series 196 is arranged in a
herringbone pattern, sometimes referred as plain‐weave pattern, where two sets of tows are interlaced
with an angle of about 90º. However, the CMC layer for series 198 & 200 is made of three distinct sets of
tows: one running axially and two crossing each other symmetrically (+/‐ 60 degree angle). Series 198
and 200 differ based on dimensions, with series 200 being thicker and of a larger diameter than series
198. Additionally, the sample architectures differ in tow spacing, as shown by “D” in Figure 2.
Table 1 below provides the details of the WEC01 architectures and Figure 2 illustrates the differences.
Figure 2: Optical view of the different WEC Designs
12
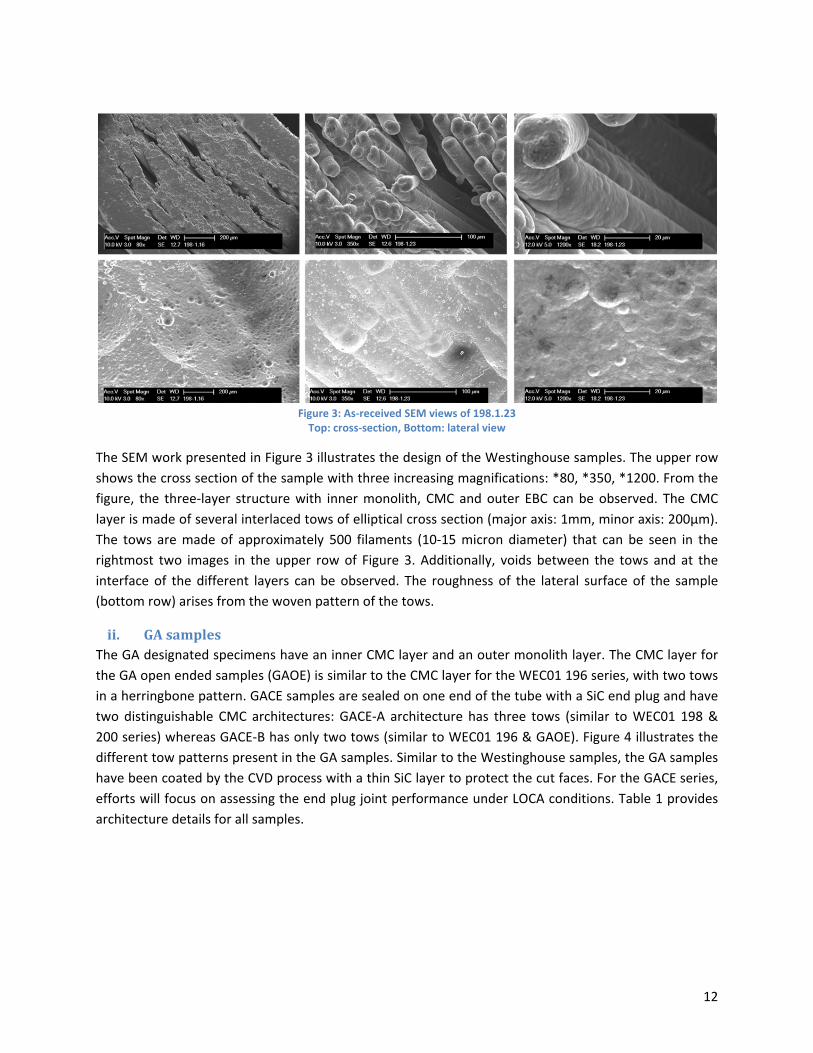
Figure 3: As‐received SEM views of 198.1.23 Top: cross‐section, Bottom: lateral view
The SEM work presented in Figure 3 illustrates the design of the Westinghouse samples. The upper row
shows the cross section of the sample with three increasing magnifications: *80, *350, *1200. From the
figure, the three‐layer structure with inner monolith, CMC and outer EBC can be observed. The CMC
layer is made of several interlaced tows of elliptical cross section (major axis: 1mm, minor axis: 200µm).
The tows are made of approximately 500 filaments (10‐15 micron diameter) that can be seen in the
rightmost two images in the upper row of Figure 3. Additionally, voids between the tows and at the
interface of the different layers can be observed. The roughness of the lateral surface of the sample
(bottom row) arises from the woven pattern of the tows.
ii. GAsamplesThe GA designated specimens have an inner CMC layer and an outer monolith layer. The CMC layer for
the GA open ended samples (GAOE) is similar to the CMC layer for the WEC01 196 series, with two tows
in a herringbone pattern. GACE samples are sealed on one end of the tube with a SiC end plug and have
two distinguishable CMC architectures: GACE‐A architecture has three tows (similar to WEC01 198 &
200 series) whereas GACE‐B has only two tows (similar to WEC01 196 & GAOE). Figure 4 illustrates the
different tow patterns present in the GA samples. Similar to the Westinghouse samples, the GA samples
have been coated by the CVD process with a thin SiC layer to protect the cut faces. For the GACE series,
efforts will focus on assessing the end plug joint performance under LOCA conditions. Table 1 provides
architecture details for all samples.

13
Figure 4: Architectures of GACE samples
Figure 5: SEM cross section of GAOE6
Figure 5 is a cross‐sectional view of sample GAOE6, representative of GAOE series. From the SEM
analysis, it appears that the GAOE samples are less porous than Westinghouse samples and also have a
higher SiC‐matrix density. A fine pebble structure constitutes the SiC CVD overcoat. The nomenclature
used to describe the samples in future publications are presented in Table 1. The summary of all the
results is presented in Section VI.
Table 1: Designs, dimensions, and nomenclature of the specimens
General Architecture Dimensions
Global CMC layer Geometry Ratio of the Different Layers
Structure Weaving Pattern
Helicoidal Pitch (mm)
Interlace Angle
Unit Distance D between //
tows
OD (mm)
ID (mm)
Inner Monolith
CMC EBC
WEC
196 Tri‐layer Herringbone / Plain weave
25 90˚ 0.96 mm 13.6 8.4 0.16 0.67 0.17
198 Tri‐layer Three Tows 35 110˚ 2.66 mm 11.7 8.1 0.16 0.67 0.17
200 Tri‐layer Three Tows 40 100˚ 3.18 mm 12.8 8.3 0.16 0.67 0.17
GA
GAOE Duplex Herringbone / Plain weave
15 120˚ 1.47 mm 10.8 9.4 0 0.83 0.17
GACE‐A Duplex + End Plug Three Tows 30 100˚ 1.80 mm 10.5 7.8 0 0.83 0.17
GACE‐B Duplex + End Plug Herringbone / Plain weave
6 150˚ 1.22 mm 10.4 7.8 0 0.83 0.17
Current Nomenclature Publication Nomenclature (XY‐Z) Where X=#Layers, Y=Weave, Z= Thin CMC or Sealed
WEC01‐196 Tri‐Layer Plain (TP)
WEC01‐198 Tri‐Layer Axial Thin (TA‐T)
WEC01‐200 Tri‐Layer Axial (TA)
GAOE Bi‐Layer Plain (BP)
GACE‐A Bi‐Layer Axial Sealed (BA‐S)
GACE‐B Bi‐Layer Plain Sealed (BP‐S)
14
III. As‐ReceivedSampleCharacterization
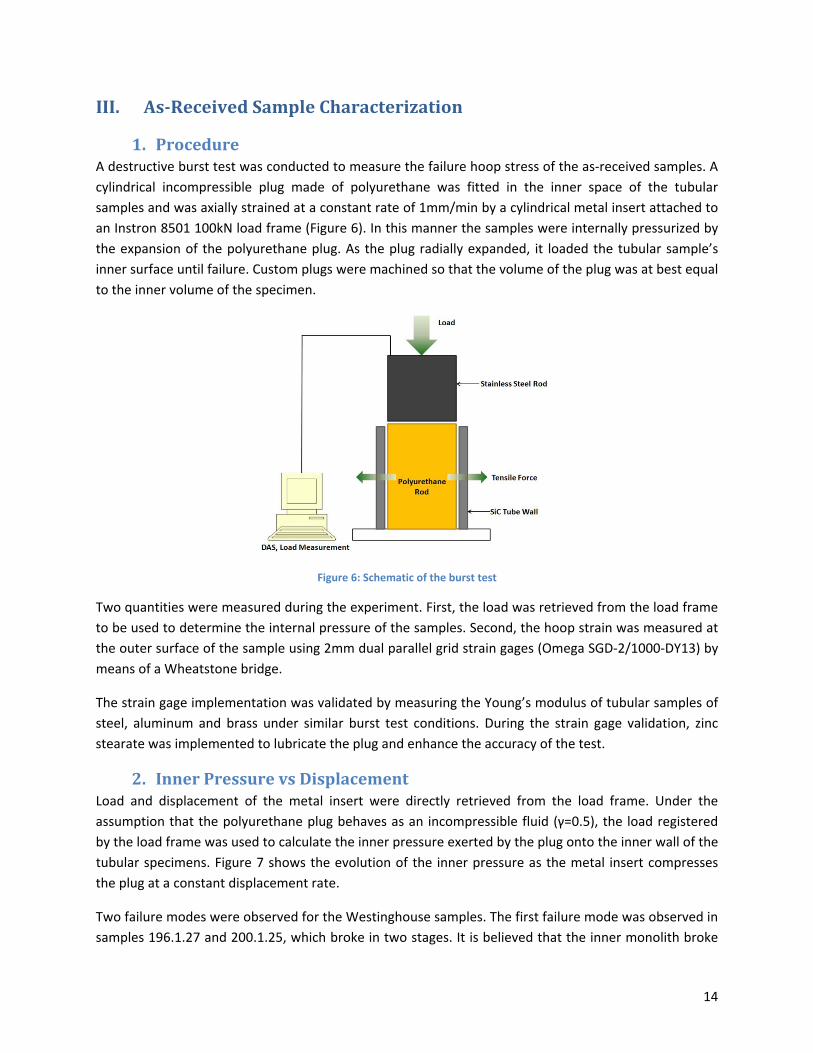
1. ProcedureA destructive burst test was conducted to measure the failure hoop stress of the as‐received samples. A
cylindrical incompressible plug made of polyurethane was fitted in the inner space of the tubular
samples and was axially strained at a constant rate of 1mm/min by a cylindrical metal insert attached to
an Instron 8501 100kN load frame (Figure 6). In this manner the samples were internally pressurized by
the expansion of the polyurethane plug. As the plug radially expanded, it loaded the tubular sample’s
inner surface until failure. Custom plugs were machined so that the volume of the plug was at best equal
to the inner volume of the specimen.
Figure 6: Schematic of the burst test
Two quantities were measured during the experiment. First, the load was retrieved from the load frame
to be used to determine the internal pressure of the samples. Second, the hoop strain was measured at
the outer surface of the sample using 2mm dual parallel grid strain gages (Omega SGD‐2/1000‐DY13) by
means of a Wheatstone bridge.
The strain gage implementation was validated by measuring the Young’s modulus of tubular samples of
steel, aluminum and brass under similar burst test conditions. During the strain gage validation, zinc
stearate was implemented to lubricate the plug and enhance the accuracy of the test.
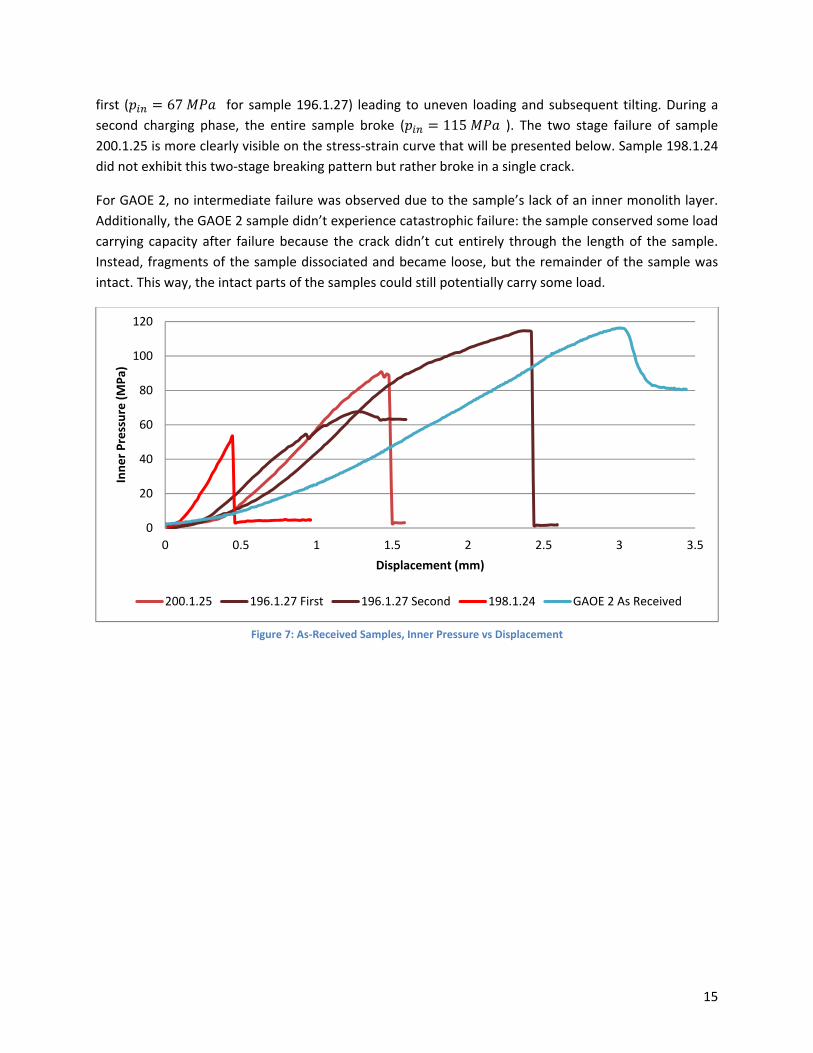
2. InnerPressurevsDisplacementLoad and displacement of the metal insert were directly retrieved from the load frame. Under the
assumption that the polyurethane plug behaves as an incompressible fluid (γ=0.5), the load registered
by the load frame was used to calculate the inner pressure exerted by the plug onto the inner wall of the
tubular specimens. Figure 7 shows the evolution of the inner pressure as the metal insert compresses
the plug at a constant displacement rate.
Two failure modes were observed for the Westinghouse samples. The first failure mode was observed in
samples 196.1.27 and 200.1.25, which broke in two stages. It is believed that the inner monolith broke
15
first ( 67 for sample 196.1.27) leading to uneven loading and subsequent tilting. During a
second charging phase, the entire sample broke ( 115 ). The two stage failure of sample
200.1.25 is more clearly visible on the stress‐strain curve that will be presented below. Sample 198.1.24
did not exhibit this two‐stage breaking pattern but rather broke in a single crack.
For GAOE 2, no intermediate failure was observed due to the sample’s lack of an inner monolith layer.
Additionally, the GAOE 2 sample didn’t experience catastrophic failure: the sample conserved some load
carrying capacity after failure because the crack didn’t cut entirely through the length of the sample.
Instead, fragments of the sample dissociated and became loose, but the remainder of the sample was
intact. This way, the intact parts of the samples could still potentially carry some load.
Figure 7: As‐Received Samples, Inner Pressure vs Displacement
0
20
40
60
80
100
120
0 0.5 1 1.5 2 2.5 3 3.5
Inner Pressure (MPa)
Displacement (mm)
200.1.25 196.1.27 First 196.1.27 Second 198.1.24 GAOE 2 As Received
16
3. OpticalandSEMAnalysis
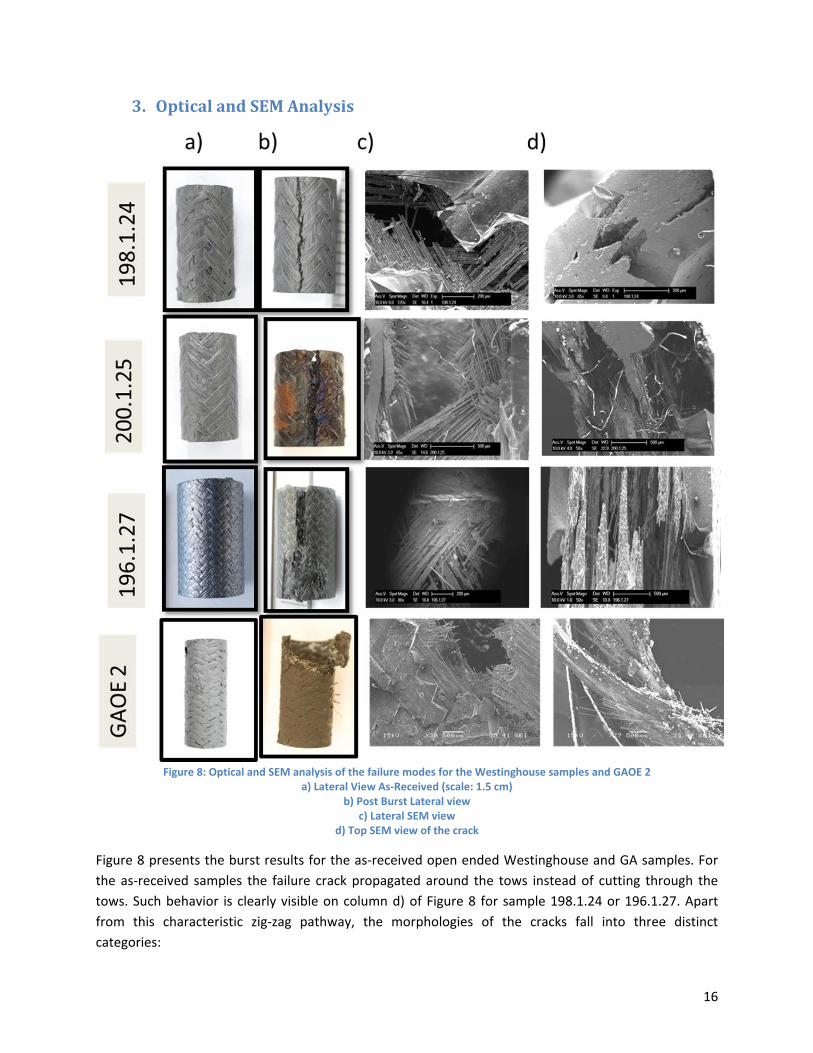
Figure 8: Optical and SEM analysis of the failure modes for the Westinghouse samples and GAOE 2
a) Lateral View As‐Received (scale: 1.5 cm) b) Post Burst Lateral view
c) Lateral SEM view d) Top SEM view of the crack
Figure 8 presents the burst results for the as‐received open ended Westinghouse and GA samples. For
the as‐received samples the failure crack propagated around the tows instead of cutting through the
tows. Such behavior is clearly visible on column d) of Figure 8 for sample 198.1.24 or 196.1.27. Apart
from this characteristic zig‐zag pathway, the morphologies of the cracks fall into three distinct
categories:

17
0
20
40
60
80
100
120
0 0.5 1 1.5 2 2.5
Inner Pressure M
Pa
Displacement (mm)
196.1.26
1. Sample 198.1.24 has a sharp, narrow crack. The inner monolith and CMC layers remained
united and both layers catastrophically failed in a single crack (first row of Figure 8).
Fracture is typically brittle and non‐frangible. 2. Samples 196.1.27 and 200.1.25 showed wider cracks with more shearing. The inner
monolith detached while the CMC region lost its matrix. As a result, opened tows are clearly
visible on the SEM images (2nd and 3rd row of Figure 8). Presumably, micro cracks
propagated in the CMC and stopped at the fiber‐matrix interface, breaking the matrix into
pieces. As a result, fibers disassembled from both the matrix and e bundles. The crack is
wider than the crack observed in sample 198.1.24 (above). In this case the samples exhibit
pseudo‐ductility.
3. Finally, the failure mode of GAOE 2 was different from the WEC01 samples because GAOE 2
was made of almost only fibers (with only a thin 200 µm EBC layer on the outer surface).
Upon failure, a piece of the sample detached from the sample and the contours of the crack
loosely followed the direction of the weaving pattern. Presumably, the matrix was
destroyed between the tows, thereby allowing for easier gliding of the tows and final
rupture of the sample. The sample experienced pseudo‐ductility.
It is believed that two possible loading regimes occurred. As long as the monolith was intact, both inner
monolith and CMC layers shared the load (for the Westinghouse samples). With a strong interface
bonding between the CMC and monolith layers, the CMC was able to share the load with the monolith.
This mode is qualified as the shared‐loading regime. Then, once the monolith failed, the CMC must
withstand the load without contribution from the monolith. This regime, characterized by the inability of
the monolith to share the load, is the fiber‐loading regime. As will be discussed below, it is believed that
the fracture will be either brittle or pseudo‐ductile depending on the stress level at which the transition
from shared‐loading to fiber‐loading occurs. This differentiates the behavior of 198.1.24 from failure of
both 196.1.27 and 200.1.25. Those two loading regimes are also visible when looking at the evolution of
the inner pressure as a function of
displacement (analogous to time) as
shown on Figure 9. On the loading
curve of sample 196.1.26 (Figure 9),
this shared‐loading regime is
observable for a metal insert
position between approximately 0
and 0.75 mm. After monolith
failure, characterized by a sudden
drop in internal pressure, the fiber‐
only loading regime can be
observed until complete failure of
the sample.
Figure 9: Illustration of the two steps loading regimes

18
4. MechanicalModelThis section presents the two modelling approaches to describe the shared‐loading and fiber‐loading
regimes as can be observed on Figure 9 (above). Because the strain gages are positioned on the outer
surface of the sample, it is necessary to relate the hoop stress on the outer surface to the internal
pressure measured from the load frame by the mean of mechanical modelling.
From the observation of the failure modes, two models were developed: the shared‐loading regime and
the fiber‐only loading regime. The first one intends to describe the behavior of a specimen when both
the inner monolith and the CMC layer contribute to the load. On the other hand, the second model
(fiber‐only regime) assumes that the monolith layer does not contribute to the loading. That is, only the
CMC layer is modelled. This second model is used for the GAOE samples since they don’t have inner
monolith but also for the Westinghouse samples once their inner monolith failed.
For the shared‐loading regime, the sample is treated as a two layer structure (monolith layer and CMC layer, the EBC is treated as an extension of the CMC layer) with a perfectly bonded interface. As such, stress and strain at any point in the two concentric tubes can be calculated as a function of the internal pressure , the external pressure and the interfacial pressure using Hooke’s law and the thick cylinder equation in each region.
The general form of the thick cylinder equation is:
4.1
With , , , the inner and outer pressure and the inner and outer radii respectively for a general thick wall. In our system, the boundary conditions of the system are:
No external pressurization: 0 Internal pressure known (calculated from the load frame output) Ideally bonded interface until monolith failure (strain is continuous)
Internal pressure is calculated through the load frame output. To start, where Σ π is the
inner cross section of the tubular sample and F the force recorded by the load frame. Treating the plug as an incompressible fluid leads to .
It should be noted that is the inner radius, is the position of the interface and is the outer radius. The compatibility equation (continuous strain at the interface) will allow for the back calculation of the internal pressure. The thick wall equation in each layer yields for :
, 4.2
, 4.3
Hooke’s law coupled with continuity of hoop strain yields at the interface ( : 4.4
19
1 1
4.5
From where can be deduced:
2 4.6
Once is known, the hoop stress at any generic position can be expressed:
4.7 for
4.8 for
Hoop strain is then back calculated using Hooke’s law:
4.9
To perform those calculi, it is necessary to know the elastic moduli of the monolith and the CMC layers. The value of the monolith modulus was taken from (1):
460
An initial guess for the fiber modulus was also made based on the same reference (1):220
Fed with those moduli values, this model allows the estimation of the hoop stress at the OD knowing the inner pressure of the sample (equations (4.6) and (4.8)). Independently, strain is also measured. Accordingly, it is possible to use this estimated stress (derived from ) with the experimental strain to determine a fiber elastic modulus.
As a precaution, one must insure that the fiber elastic modulus observed on the stress‐strain curve (post modeling) equals the modulus that fed the mechanical model (pre‐modeling, equation (4.6)). That way, the mechanical model remains consistent with the experimental Hooke’s law observed. To do so, iterations on the fiber elastic modulus were implemented until convergence (no more than three iterative steps were needed).
For the fibers only charging region
When the model presented above is not relevant (GAOE samples or failed monolith), the thick wall
model was simply implemented to describe the CMC layer.
In the case of the GAOE samples, the thick wall cylinder equation directly applies and yields:
4.10
Since 0, we get:
4.11
In this case, there is no need for an initial guess for the fiber elastic modulus. It is directly measured on
the stress strain‐curve.
20
For the Westinghouse samples, this model applies when the inner monolith breaks. The inner radius
becomes and the pressure: .
4.12
At last, it is necessary to define how failure is calculated. Because strain was measured on the OD, all the
stress‐stain curves are plotted at that point with a perceived failure hoop stress at that point. However,
levels of stresses are higher in the ID than in the OD. Therefore, the failure must initiate at the ID and
the failure stress is the stress at this point (ID). As such, we calculated the failure stress as the stress in
the ID at the moment of failure. The energy and momentum released by the local failure at the ID
position triggers the failure of the outer layers (up to the OD) even if the stress levels at those points
were slightly below the failure hoop stress.
5. MechanicalResultsAlthough the burst tests of the as‐received samples 196.1.27 and 198.1.24 were performed prior to the
implementation of strain gages, the burst tests of the as‐received samples 200.1.25 and GAOE 2 were
performed with strain gages implemented. The strain gages were implemented such that they measured
the hoop strain on the outermost surface of the sample.
Because the strain gages were implemented on the outer surface of the samples, the stress‐strain
curves presented in the work represent the outer surface. However, the failure stresses presented in
this work reflect the peak calculated stresses in the samples, which occur on the inner surfaces of the
sample layers. Therefore, the failure stresses observed in the stress‐strain curves are always lower than
the peak failure stresses experienced by the samples as reported in the tabulated data.
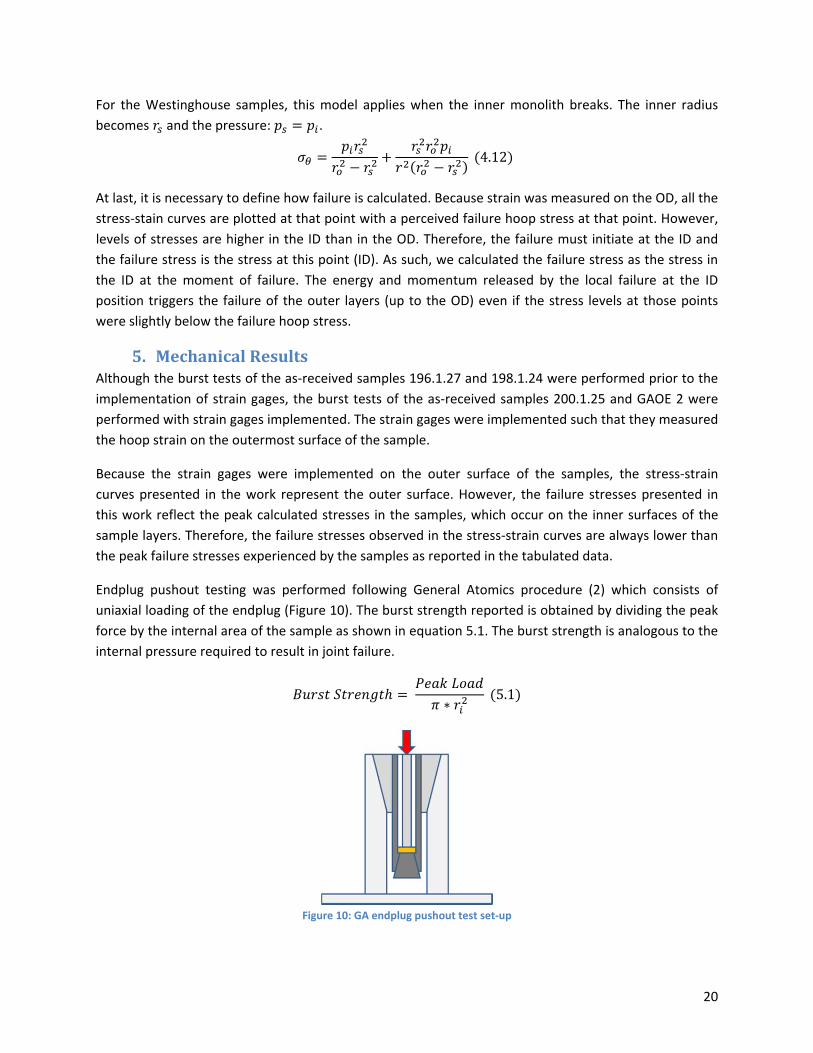
Endplug pushout testing was performed following General Atomics procedure (2) which consists of
uniaxial loading of the endplug (Figure 10). The burst strength reported is obtained by dividing the peak
force by the internal area of the sample as shown in equation 5.1. The burst strength is analogous to the
internal pressure required to result in joint failure.
∗
5.1
Figure 10: GA endplug pushout test set‐up

21
i. Series196Figure 11 presents the internal pressure versus displacement curves obtained for the as‐received sample
196.1.27. The first loading curve experienced monolith failure but was terminated prior to fiber failure
due to plug leakage. The plug leakage can be observed from the first loading curve by the substantial
increase in displacement with negligible increase in internal pressure. For the second loading curve, the
sample was loaded until complete sample failure.
Table 2 presents the mechanical properties gathered from the burst testing of sample 196.1.27. The
failure plenum pressure is defined at the inner monolith failure, as the sample losses hermeticity once it
the monolith fails. In parenthesis is the pressure at total failure.
Figure 11: Internal Pressure vs Displacement curves for as‐received sample 196.1.27
Table 2: Mechanical characteristics of sample 196.1.27
196.1.27 As‐Received
Failure Hoop Stress ID Monolith
249 MPa
Failure Hoop Stress ID Fibers
267 MPa
Failure Plenum Pressure (Total Failure)
64 MPa (107 MPa)
0
20
40
60
80
100
120
0 1 2 3 4 5 6
Internal Pressure (Mpa)
Displacement (mm)
First Loading Second Loading

22
ii. Series198Figure 12 presents the internal pressure versus displacement curve for the burst test of the as‐received
sample 198.1.24. From the curve, only one distinct loading regime can be identified. Furthermore, the
steep slope of the loading curve indicates a stiff sample with little yielding.
Table 3 presents the mechanical characteristics obtained for the as‐received sample 198.1.24. Because
the fiber region failed simultaneously as the monolith region, the precise failure stress for the fiber
region could not be determined. However, the limits for the failure stress of the fiber region were
determined based on the stress of the fibers during shared loading with the monolith and the stress of
the fibers during fiber‐only loading at the moment of sample failure.
Figure 12: Internal Pressure vs Displacement curve for as‐received sample 198.1.24
Table 3: Mechanical characteristics of as‐received sample 198.1.24
198.1.24 As‐Received
Failure Hoop Stress ID Monolith
267 MPa
Failure Hoop Stress ID Fibers
115‐232 MPa
Failure Plenum Pressure (Total Failure)
54 MPa (54 MPa)
0
10
20
30
40
50
60
0 0.5 1 1.5 2 2.5 3 3.5
Internal Pressure (Mpa)
Displacement (mm)

23
iii. Series200Multiple tests were performed on sample 200.1.25. Test 1 loaded the sample with the monolith intact
and was terminated at plug leakage from the bottom. Test 2 loaded the sample with the monolith
intact, but experienced monolith failure and the transition to fiber‐only loading before being
terminated. Test 3 loaded the sample with the failed monolith until complete failure of the sample.
The mechanical model previously described was used to calculate stress for the stress‐strain curves. The
stress indicated is the calculated stress at the OD of the sample (the location of the strain gage). The
resulting stress‐strain curve for the outer surface of the sample is shown in Figure 13. Table 4 presents
the mechanical characteristics gathered from the stress‐strain behavior of sample 200.1.25. The change
in elastic modulus of the sample with increasing yielding can be observed.
Figure 13: Stress‐Strain curve for outer surface of sample 200.1.25 (slopes of elastic regions indicated on curve)
Table 4: Mechanical Characteristics of 200.1.25
200.1.25
Test 1 Test 2 Test 3
Elastic Modulus 201 GPa 118 GPa 55 GPa
Yield Stress (ID of fibers)
105 – 175 MPa
Failure Hoop Stress ID Monolith
243 MPa
Failure Hoop Stress ID Fibers
242 MPa
Failure Strain 3466 µ‐strain
Failure Plenum Pressure (Total Failure)
60 MPa (82 MPa)
0
20
40
60
80
100
120
140
160
180
0 500 1000 1500 2000 2500 3000 3500 4000
Hoop Stress OD (MPa)
Microstrain
Test 3 Test 2 Test 1
201 GPa
118 GPa
55 GPa

24
iv. SeriesGAOEOne burst test was performed on sample GAOE 2 which loaded the sample to failure. Sample GAOE 2
was treated as a thick‐wall cylinder with only one layer (in contrast to the multilayer mechanical model
of the Westinghouse samples). Using the thick wall cylinder stress equations, the stress‐strain curve was
constructed for sample GAOE 2 and is presented in Figure 14. The stress indicated is the stress on the
OD of the sample.
Table 5 presents the mechanical properties of sample GAOE 2 gathered from the stress‐strain curve. A
change in slope can be observed in the GAOE 2 sample. A large increase in strain from 300 to 600
microstrain signalizes the onset of pseudo‐ductility in the sample and defines the yielding stress of the
fiber region (although the calculated stress at the ID is tabulated).
Figure 14: Stress‐Strain curve for outer surface of sample GAOE2 (slopes of elastic regions indicated)
Table 5: Mechanical characteristics of GAOE2
GAOE 2 As‐Received
Elastic Modulus 721 GPa
Yield Stress (ID) 304 MPa
Failure Hoop Stress ID 581 MPa
Failure Strain 2851 µ‐strain
Failure Plenum Pressure
76 MPa
0
100
200
300
400
500
600
0 500 1000 1500 2000 2500 3000
Stress (OD) (Mpa)
Microstrain
Stress vs Strain GAOE 2
721 GPa 184 GPa
25
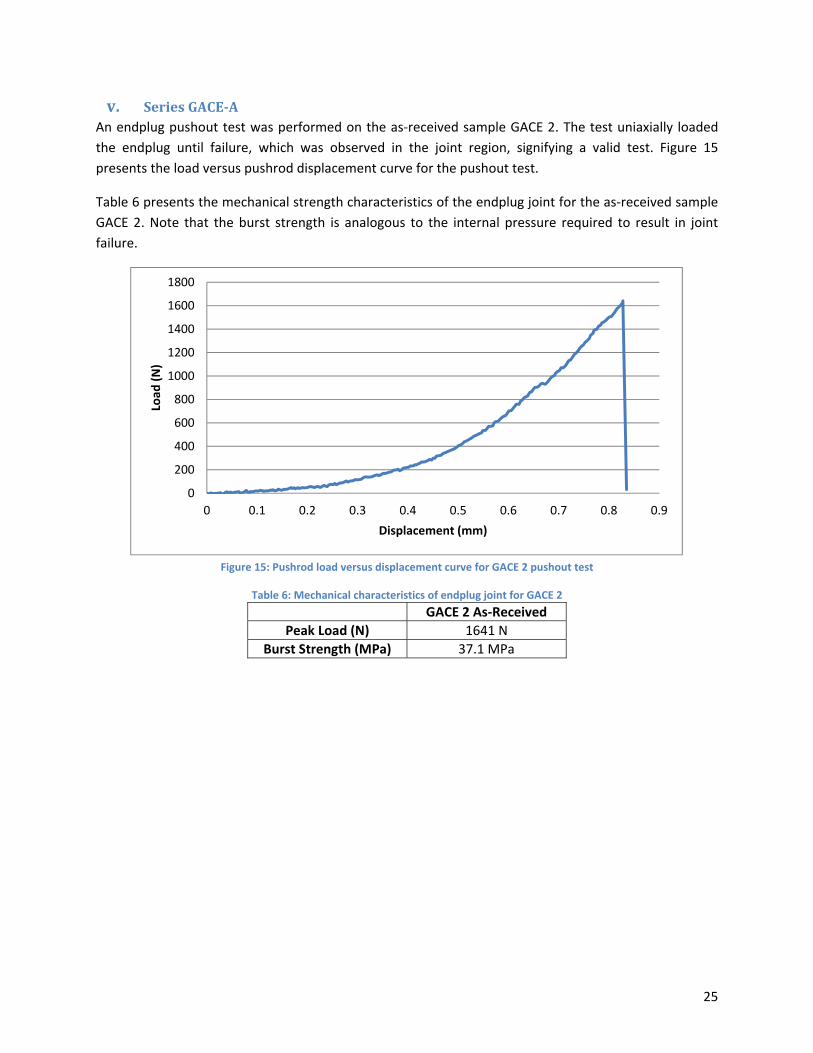
v. SeriesGACE‐AAn endplug pushout test was performed on the as‐received sample GACE 2. The test uniaxially loaded
the endplug until failure, which was observed in the joint region, signifying a valid test. Figure 15
presents the load versus pushrod displacement curve for the pushout test.
Table 6 presents the mechanical strength characteristics of the endplug joint for the as‐received sample
GACE 2. Note that the burst strength is analogous to the internal pressure required to result in joint
failure.
Figure 15: Pushrod load versus displacement curve for GACE 2 pushout test
Table 6: Mechanical characteristics of endplug joint for GACE 2
GACE 2 As‐Received
Peak Load (N) 1641 N
Burst Strength (MPa) 37.1 MPa
0
200
400
600
800
1000
1200
1400
1600
1800
0 0.1 0.2 0.3 0.4 0.5 0.6 0.7 0.8 0.9
Load
(N)
Displacement (mm)
26
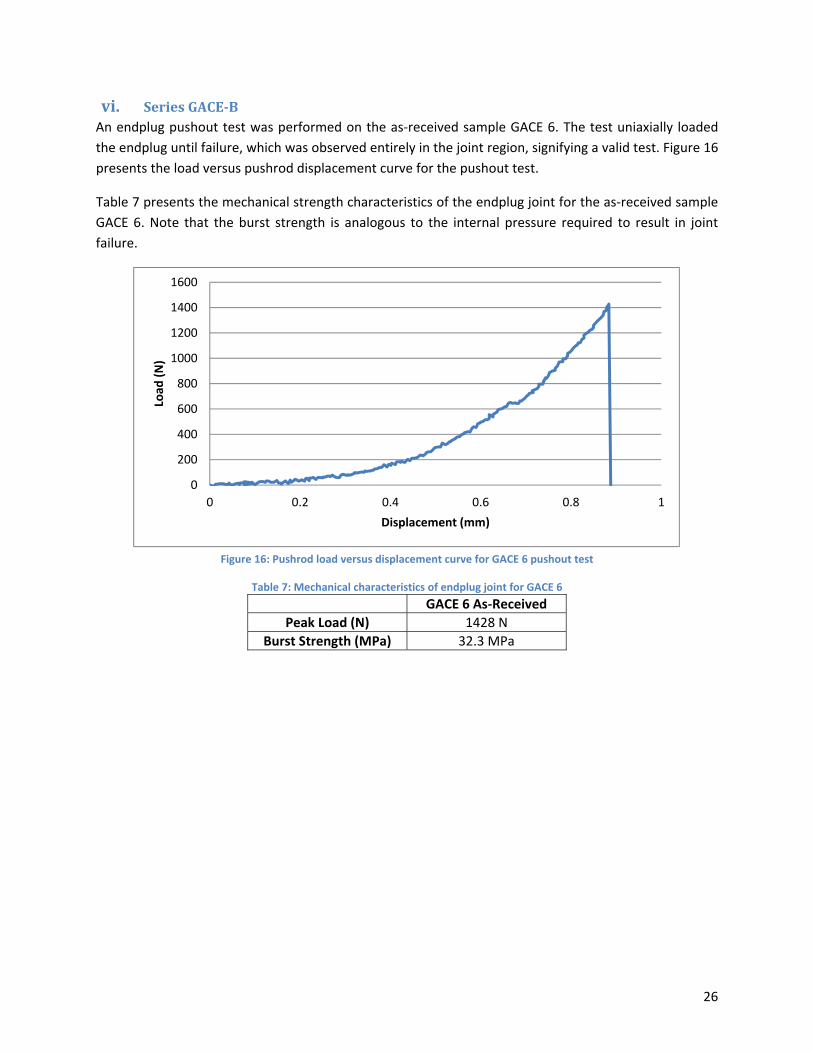
vi. SeriesGACE‐BAn endplug pushout test was performed on the as‐received sample GACE 6. The test uniaxially loaded
the endplug until failure, which was observed entirely in the joint region, signifying a valid test. Figure 16
presents the load versus pushrod displacement curve for the pushout test.
Table 7 presents the mechanical strength characteristics of the endplug joint for the as‐received sample
GACE 6. Note that the burst strength is analogous to the internal pressure required to result in joint
failure.
Figure 16: Pushrod load versus displacement curve for GACE 6 pushout test
Table 7: Mechanical characteristics of endplug joint for GACE 6
GACE 6 As‐Received
Peak Load (N) 1428 N
Burst Strength (MPa) 32.3 MPa
0
200
400
600
800
1000
1200
1400
1600
0 0.2 0.4 0.6 0.8 1
Load
(N)
Displacement (mm)
27
6. FailureCharacteristicsFor the Westinghouse samples, during the initial monolith charging, the samples behaved elastically and
were characterized by the monolith and fibers loading simultaneously (as outlined in the mechanical
model section above). However once the failure stress of the monolith was exceeded, the monolith
failed by suddenly cracking entirely through. Additionally, after the monolith failed small pieces of
monolith were observed to detach from the sample. The detachment of small pieces of monolith is
attributable to the proliferation of cracking around the initial failure crack and the evident destruction of
the interface between the monolith and the fiber region. This was confirmed in tests where loading was
reversed shortly after yielding and the samples showed a destroyed inner monolith and an intact CMC.
After monolith failure, some samples could offer resistance to further loading, as observed in the fiber‐
only loading regions of series 200 or for GAOE 2 (Figure 17). It is also believed from the pressure vs
displacement curve that series 196 (Figure 17) had a fiber‐only loading regime even though no strain
measurements were obtained. During this fiber‐only loading stage, the fiber region resisted the load
with negligible contribution from the failed monolith. Below the fiber region yield stress, the fiber region
behaved linearly‐elastically and was characterized by the stretching of the CMC layer without slipping of
fibers or destruction of the matrix. However once the fiber region yield stress was exceeded the fibers
began to slip across one another as the matrix between the fibers was gradually destroyed. This fiber
slipping behavior can be observed in the sudden increases in strain with negligible increases in stress for
the stress‐strain curve obtained for sample 200.1.25. As the stress increased more of the CVI matrix was
destroyed resulting in more fiber slippage. This behavior can be observed in the changing elastic
modulus for the stress‐strain curve obtained for sample 200.1.25.
Sample failure occurred when the fibers’ matrix had been thoroughly destroyed and the fibers, stressed
too high, finally fractured. The fiber failure region was characterized by a crack fully penetrating the
sample at the radial location of the monolith failure. However, the fiber region did not fail
catastrophically and instead only failed at one angular location. Except at the angular location of failure,
the fibers were still intact and maintained a geometry very similar to the original geometry of the
sample. The stress‐strain curve obtained for sample 200.1.25 demonstrates that after complete sample
failure, when the stress was relaxed to zero, the sample was only 0.07% strained when compared to
0.28% failure strain.
For sample series 198 the fiber region failed almost immediately after the monolith failed and could not
withstand higher internal pressures than those which caused the monolith failure. This behavior is
attributable to the cracks formed during monolith failure penetrating through the fibers immediately
without crack‐blunting. The cracks cause the fibers to fail before the fibers have a chance to exhibit
pseudo‐ductility, resulting in complete failure of the sample in series 198 upon failure of the internal
monolith layer.
28
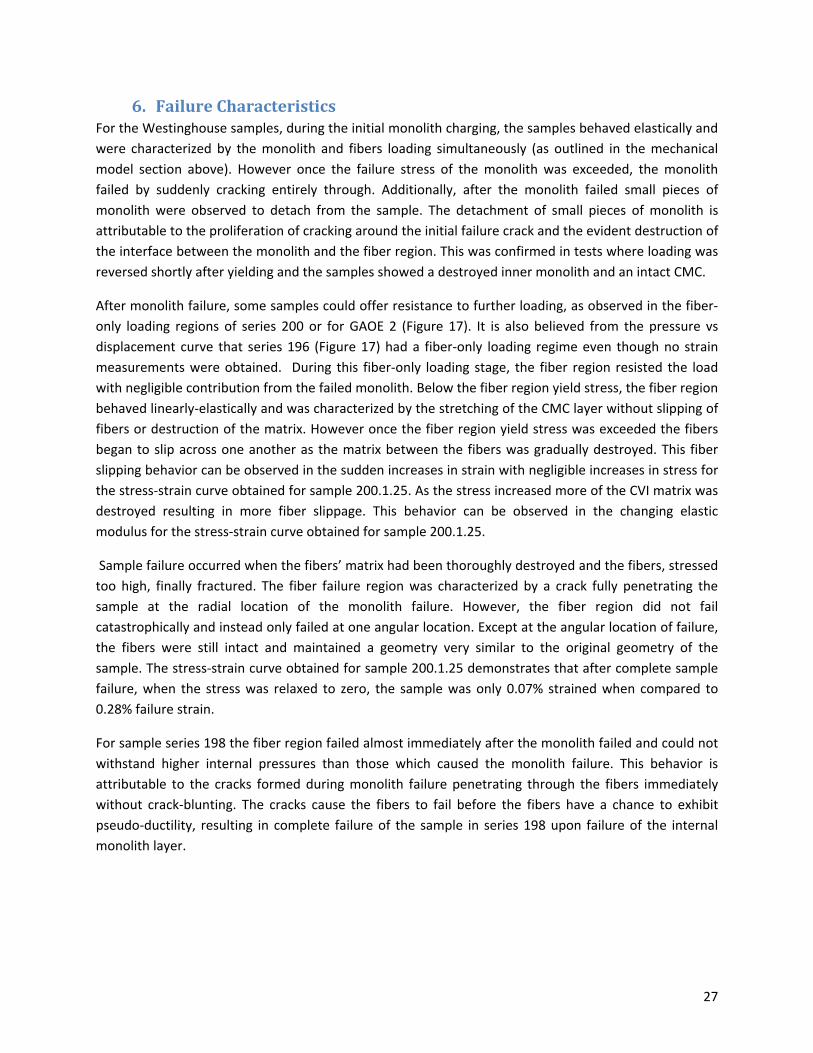
Figure 17: Comparison of Failure Characteristics of GAOE 2 (left) and 196.1.27 (right)
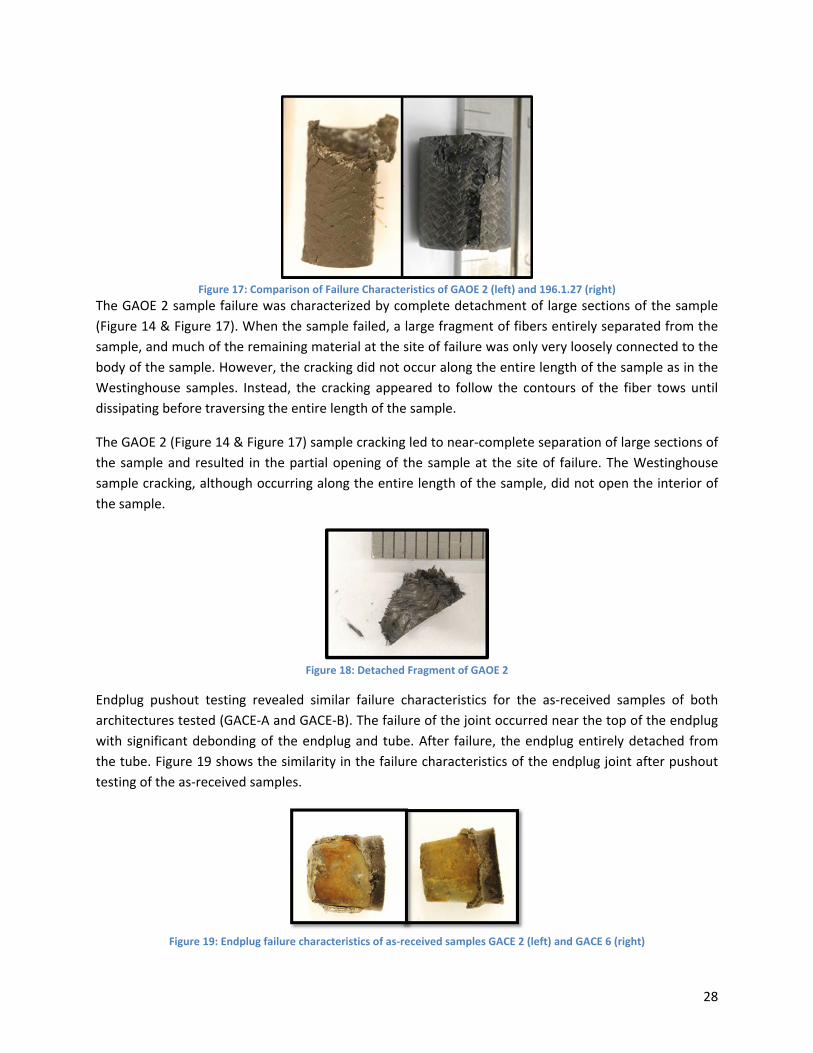
The GAOE 2 sample failure was characterized by complete detachment of large sections of the sample
(Figure 14 & Figure 17). When the sample failed, a large fragment of fibers entirely separated from the
sample, and much of the remaining material at the site of failure was only very loosely connected to the
body of the sample. However, the cracking did not occur along the entire length of the sample as in the
Westinghouse samples. Instead, the cracking appeared to follow the contours of the fiber tows until
dissipating before traversing the entire length of the sample.
The GAOE 2 (Figure 14 & Figure 17) sample cracking led to near‐complete separation of large sections of
the sample and resulted in the partial opening of the sample at the site of failure. The Westinghouse
sample cracking, although occurring along the entire length of the sample, did not open the interior of
the sample.
Figure 18: Detached Fragment of GAOE 2
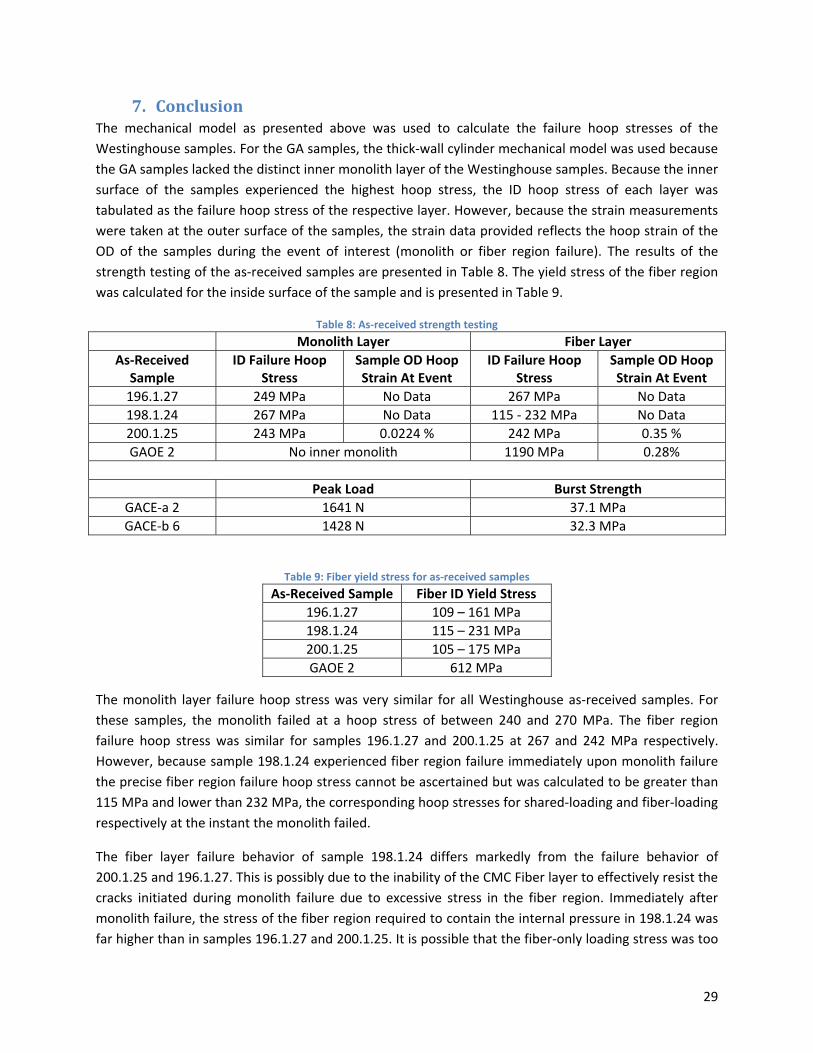
Endplug pushout testing revealed similar failure characteristics for the as‐received samples of both
architectures tested (GACE‐A and GACE‐B). The failure of the joint occurred near the top of the endplug
with significant debonding of the endplug and tube. After failure, the endplug entirely detached from
the tube. Figure 19 shows the similarity in the failure characteristics of the endplug joint after pushout
testing of the as‐received samples.
Figure 19: Endplug failure characteristics of as‐received samples GACE 2 (left) and GACE 6 (right)
29
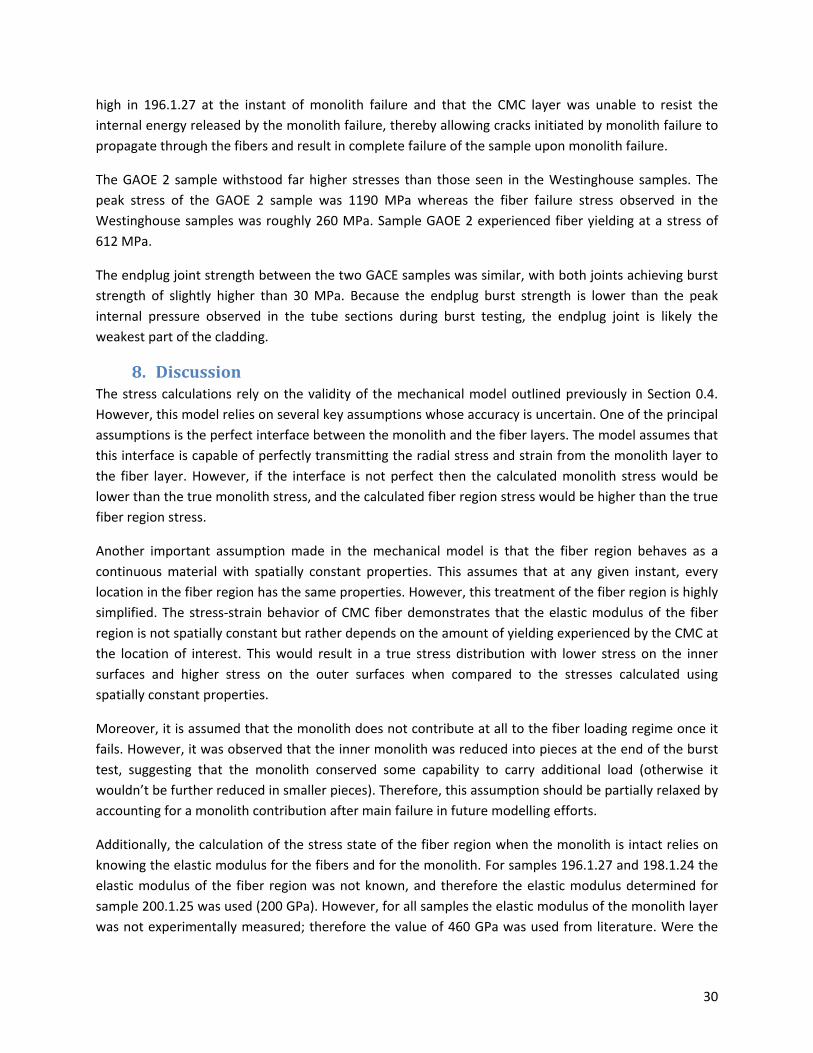
7. ConclusionThe mechanical model as presented above was used to calculate the failure hoop stresses of the
Westinghouse samples. For the GA samples, the thick‐wall cylinder mechanical model was used because
the GA samples lacked the distinct inner monolith layer of the Westinghouse samples. Because the inner
surface of the samples experienced the highest hoop stress, the ID hoop stress of each layer was
tabulated as the failure hoop stress of the respective layer. However, because the strain measurements
were taken at the outer surface of the samples, the strain data provided reflects the hoop strain of the
OD of the samples during the event of interest (monolith or fiber region failure). The results of the
strength testing of the as‐received samples are presented in Table 8. The yield stress of the fiber region
was calculated for the inside surface of the sample and is presented in Table 9.
Table 8: As‐received strength testing
Monolith Layer Fiber Layer
As‐Received Sample
ID Failure Hoop Stress
Sample OD Hoop Strain At Event
ID Failure Hoop Stress
Sample OD Hoop Strain At Event
196.1.27 249 MPa No Data 267 MPa No Data
198.1.24 267 MPa No Data 115 ‐ 232 MPa No Data
200.1.25 243 MPa 0.0224 % 242 MPa 0.35 %
GAOE 2 No inner monolith 1190 MPa 0.28%
Peak Load Burst Strength
GACE‐a 2 1641 N 37.1 MPa
GACE‐b 6 1428 N 32.3 MPa
Table 9: Fiber yield stress for as‐received samples
As‐Received Sample Fiber ID Yield Stress
196.1.27 109 – 161 MPa
198.1.24 115 – 231 MPa
200.1.25 105 – 175 MPa
GAOE 2 612 MPa
The monolith layer failure hoop stress was very similar for all Westinghouse as‐received samples. For
these samples, the monolith failed at a hoop stress of between 240 and 270 MPa. The fiber region
failure hoop stress was similar for samples 196.1.27 and 200.1.25 at 267 and 242 MPa respectively.
However, because sample 198.1.24 experienced fiber region failure immediately upon monolith failure
the precise fiber region failure hoop stress cannot be ascertained but was calculated to be greater than
115 MPa and lower than 232 MPa, the corresponding hoop stresses for shared‐loading and fiber‐loading
respectively at the instant the monolith failed.
The fiber layer failure behavior of sample 198.1.24 differs markedly from the failure behavior of
200.1.25 and 196.1.27. This is possibly due to the inability of the CMC Fiber layer to effectively resist the
cracks initiated during monolith failure due to excessive stress in the fiber region. Immediately after
monolith failure, the stress of the fiber region required to contain the internal pressure in 198.1.24 was
far higher than in samples 196.1.27 and 200.1.25. It is possible that the fiber‐only loading stress was too
30
high in 196.1.27 at the instant of monolith failure and that the CMC layer was unable to resist the
internal energy released by the monolith failure, thereby allowing cracks initiated by monolith failure to
propagate through the fibers and result in complete failure of the sample upon monolith failure.
The GAOE 2 sample withstood far higher stresses than those seen in the Westinghouse samples. The
peak stress of the GAOE 2 sample was 1190 MPa whereas the fiber failure stress observed in the
Westinghouse samples was roughly 260 MPa. Sample GAOE 2 experienced fiber yielding at a stress of
612 MPa.
The endplug joint strength between the two GACE samples was similar, with both joints achieving burst
strength of slightly higher than 30 MPa. Because the endplug burst strength is lower than the peak
internal pressure observed in the tube sections during burst testing, the endplug joint is likely the
weakest part of the cladding.
8. DiscussionThe stress calculations rely on the validity of the mechanical model outlined previously in Section 0.4.
However, this model relies on several key assumptions whose accuracy is uncertain. One of the principal
assumptions is the perfect interface between the monolith and the fiber layers. The model assumes that
this interface is capable of perfectly transmitting the radial stress and strain from the monolith layer to
the fiber layer. However, if the interface is not perfect then the calculated monolith stress would be
lower than the true monolith stress, and the calculated fiber region stress would be higher than the true
fiber region stress.
Another important assumption made in the mechanical model is that the fiber region behaves as a
continuous material with spatially constant properties. This assumes that at any given instant, every
location in the fiber region has the same properties. However, this treatment of the fiber region is highly
simplified. The stress‐strain behavior of CMC fiber demonstrates that the elastic modulus of the fiber
region is not spatially constant but rather depends on the amount of yielding experienced by the CMC at
the location of interest. This would result in a true stress distribution with lower stress on the inner
surfaces and higher stress on the outer surfaces when compared to the stresses calculated using
spatially constant properties.
Moreover, it is assumed that the monolith does not contribute at all to the fiber loading regime once it
fails. However, it was observed that the inner monolith was reduced into pieces at the end of the burst
test, suggesting that the monolith conserved some capability to carry additional load (otherwise it
wouldn’t be further reduced in smaller pieces). Therefore, this assumption should be partially relaxed by
accounting for a monolith contribution after main failure in future modelling efforts.
Additionally, the calculation of the stress state of the fiber region when the monolith is intact relies on
knowing the elastic modulus for the fibers and for the monolith. For samples 196.1.27 and 198.1.24 the
elastic modulus of the fiber region was not known, and therefore the elastic modulus determined for
sample 200.1.25 was used (200 GPa). However, for all samples the elastic modulus of the monolith layer
was not experimentally measured; therefore the value of 460 GPa was used from literature. Were the
31
true elastic moduli different from those used in the calculations, the true stress distributions would be
different from those presented.
Finally, edge effects of the experimental set‐up should be accounted for. In particular, plug leakage on
the upper end of the samples leads to stress concentration at that position, resulting in preferential
failure from the top.
Because only one sample in each Westinghouse series (196, 198, and 200), only one sample in the GAOE
series, and only one sample in each GACE architecture series were tested as‐received, there are too few
samples to provide meaningful statistics on the distribution of true population as‐received mechanical
properties. Only by testing more samples could the population’s true distribution of mechanical
properties be determined.
32
IV. ThermalShockExperiments
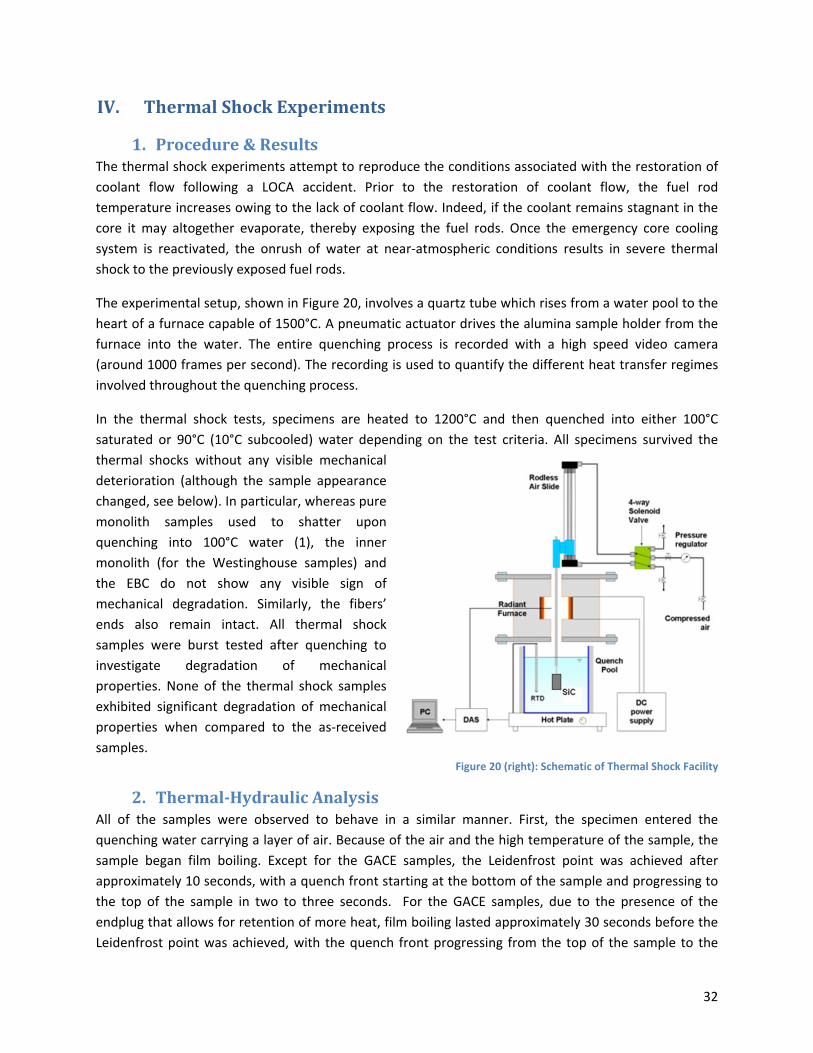
1. Procedure&ResultsThe thermal shock experiments attempt to reproduce the conditions associated with the restoration of
coolant flow following a LOCA accident. Prior to the restoration of coolant flow, the fuel rod
temperature increases owing to the lack of coolant flow. Indeed, if the coolant remains stagnant in the
core it may altogether evaporate, thereby exposing the fuel rods. Once the emergency core cooling
system is reactivated, the onrush of water at near‐atmospheric conditions results in severe thermal
shock to the previously exposed fuel rods.
The experimental setup, shown in Figure 20, involves a quartz tube which rises from a water pool to the
heart of a furnace capable of 1500°C. A pneumatic actuator drives the alumina sample holder from the
furnace into the water. The entire quenching process is recorded with a high speed video camera
(around 1000 frames per second). The recording is used to quantify the different heat transfer regimes
involved throughout the quenching process.
In the thermal shock tests, specimens are heated to 1200°C and then quenched into either 100°C
saturated or 90°C (10°C subcooled) water depending on the test criteria. All specimens survived the
thermal shocks without any visible mechanical
deterioration (although the sample appearance
changed, see below). In particular, whereas pure
monolith samples used to shatter upon
quenching into 100°C water (1), the inner
monolith (for the Westinghouse samples) and
the EBC do not show any visible sign of
mechanical degradation. Similarly, the fibers’
ends also remain intact. All thermal shock
samples were burst tested after quenching to
investigate degradation of mechanical
properties. None of the thermal shock samples
exhibited significant degradation of mechanical
properties when compared to the as‐received
samples. Figure 20 (right): Schematic of Thermal Shock Facility
2. Thermal‐HydraulicAnalysisAll of the samples were observed to behave in a similar manner. First, the specimen entered the
quenching water carrying a layer of air. Because of the air and the high temperature of the sample, the
sample began film boiling. Except for the GACE samples, the Leidenfrost point was achieved after
approximately 10 seconds, with a quench front starting at the bottom of the sample and progressing to
the top of the sample in two to three seconds. For the GACE samples, due to the presence of the
endplug that allows for retention of more heat, film boiling lasted approximately 30 seconds before the
Leidenfrost point was achieved, with the quench front progressing from the top of the sample to the

33
bottom (this results from the latent heat associated with the end plug at the bottom). As the sample
rewetted, heat was transferred by nucleate boiling until complete cooling. Also, no major difference was
observed between 100°C and 90°C thermal shocks. Figure 21 illustrates this behavior for sample
196.1.26 quenched from 1200°C into 90°C water.
Figure 21: Quench of 1200°C 196.1.26 into 90°C water, quench from is first seen at t = 11.36 seconds
34
3. Optical&SEManalyses
i. WestinghouseSamples
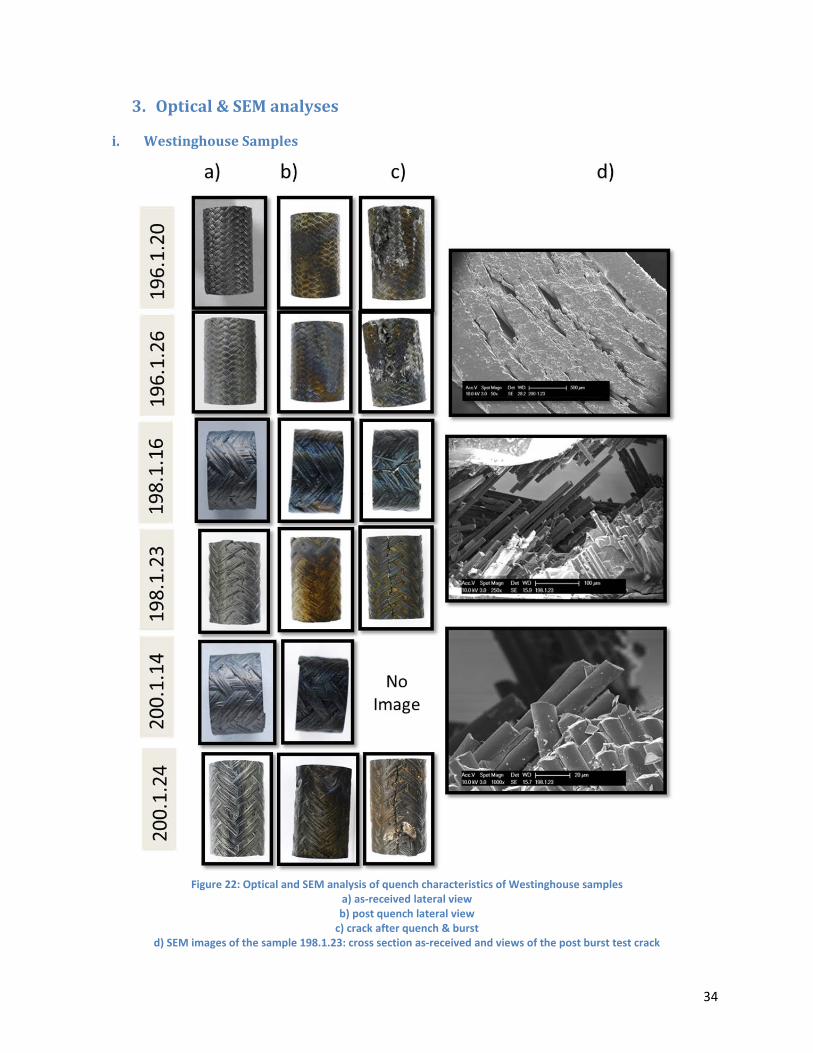
Figure 22: Optical and SEM analysis of quench characteristics of Westinghouse samples
a) as‐received lateral view b) post quench lateral view c) crack after quench & burst
d) SEM images of the sample 198.1.23: cross section as‐received and views of the post burst test crack
35
Following quenching, surfaces of the samples exhibited discoloration (Figure 22 columns a and b),
betraying the presence of an oxide layer. Oxide layers with a thickness similar to the wavelength of
visible light can create such a discoloration: therefore, the oxide layer was likely about 0.5 microns thick.
SEM analysis (see Figure 22 column d as an illustration) revealed that the underlying structure of the
sample was unaffected by the quenching, with no signs of failure or breaking detected.
ii. GASamples
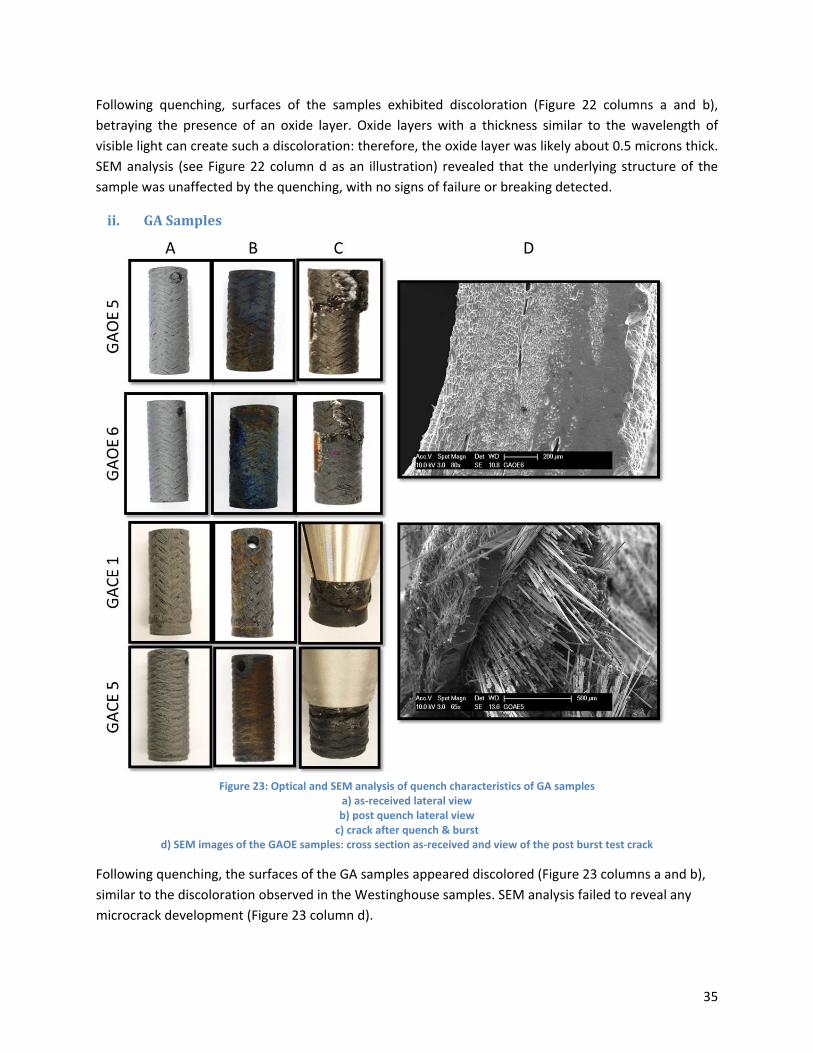
Figure 23: Optical and SEM analysis of quench characteristics of GA samples
a) as‐received lateral view b) post quench lateral view c) crack after quench & burst
d) SEM images of the GAOE samples: cross section as‐received and view of the post burst test crack
Following quenching, the surfaces of the GA samples appeared discolored (Figure 23 columns a and b),
similar to the discoloration observed in the Westinghouse samples. SEM analysis failed to reveal any
microcrack development (Figure 23 column d).

36
iii. ObservationsFollowing the thermal shock, the samples exhibited the same failure modes as for the non‐quenched
samples. Series 196 failure involved fiber yielding and destruction of the matrix, leading to large strains
at failure and a reduction of matrix and EBC to pieces. Similarly, series 198 quenched samples behaved
similar to the as‐received sample: the three layers failed simultaneously in a clear and sharp crack with
very little fiber yielding. Column d) illustrates the failure mode of sample 198. Looking into the crack,
fibers tows broke at the same position as the matrix. Also, the crack does not extend more than 200 µm.
Finally, series 200 quenched samples exhibited the same characteristics as the as‐received samples.
However, the burst of 200.1.14 was unsuccessful (partly attributable to the sample’s small size): the
inner monolith broke on one side leading to leaking of the plug. With this leaking, it was impossible to
reach internal pressure high enough to break the sample thoroughly.
Figure 24: SEM comparison of as‐received and quenched sample 196.1.20
a) as‐received b) quenched
No micro crack development was visible after the thermal shock treatment. Figure 24 compares sample
196.1.20 as‐received (top row) and after quenching (bottom row). Even the tip of the fibers that were
entirely exposed to the water didn’t develop visible cracks. This leads to the conclusion that the SiC
composites used in the samples are relatively insensitive to quenching. This could explain why the same
failure modes were observed regardless of whether the samples underwent thermal shock.

37
4. MechanicalResultsThis section discusses the influence of the thermal shock on the mechanical properties of the various
series of samples. For all series except GACE‐B, quenching in either 90°C or 100°C water has not shown
significant influence on the mechanical properties of the samples (yield or ultimate failure strength).
The data, presented in Figure 25, shows that samples quenched in 90°C versus 100°C water behave
similarly. For instance, samples 196.1.26 (light blue) and 196.1.20 (dark blue) failed at similar internal
pressures (110‐120 MPa) and their inner monolith failed at similar pressures (50 MPa) despite different
quenching temperatures. However, the GAOE samples did exhibit variation in the failure strength at
different quench temperatures. Despite these observations, the small number of samples doesn’t allow
for more statistically quantitative conclusions. The singular behavior of Sample 198.1.16 (light red) likely
comes from its small height (6 mm as compared to 20 mm for the other samples): less than 1/4 of the
unit cell of the weaving pattern is contained in this short sample, the significance of this data point is
questionable.
Additionally, the characteristics of each series can still be captured after the quench. Indeed, from the
quench testing it was observed that series 198 behaved the closest to a monolith SiC sample (exhibiting
stiff loading and little strain) while series 200 was the closest to the full CMC behavior of the GAOE
samples. These results are similar to the observations made during the as‐received testing and indicate
that the quenching process has little impact on the mechanical properties of the samples.
Figure 25: Internal pressure vs Displacement for quench samples
0
20
40
60
80
100
120
140
160
180
0 0.5 1 1.5 2 2.5 3
INTERNAL PRESSU
RE (M
PA)
DISPLACEMENT (MM)
QUENCH COMPARISON
198.1.16 Quench 90°C
198.1.23 Quench 100°C
196.1.26 Quench 90°C
196.1.20 Quench 100°C
200.1.24 Quench 100C
200.1.24 Quench 100C
GAOE5 Quench 100°C
GAOE6 Quench 90°C

38
i. Series196Figure 26 presents the internal pressure versus displacement curves for the as‐received and quenched
samples in the series 196. Similar behavior was observed for the samples, although the sample
quenched at 90°C failed at a slightly lower internal pressure than the sample quenched at 100°C.
Table 10 presents the mechanical results of the quench testing for series 196. No significant difference
in mechanical properties was observed between the as‐received sample and the quenched samples.
Figure 26: Internal Pressure vs Displacement curves for as‐received and quenched series 196
Table 10: Mechanical properties of series 196
196.1.27 As‐Received 196.1.20 Quench 100°C 196.1.26 Quench 90°C
Failure Hoop Stress ID Monolith
249 MPa 193 MPa 207 MPa
Failure Hoop Stress ID Fibers
267 MPa 279 MPa 260 MPa
Failure Plenum Pressure (Total)
64 (107) MPa 49 (110) MPa 53 (102) MPa
0
20
40
60
80
100
120
140
0 0.5 1 1.5 2 2.5 3
Internal Pressure (Mpa)
Displacement (mm)
196.1.27 As‐Received 196.1.20 Quench 100C 196.1.26 Quench 90C
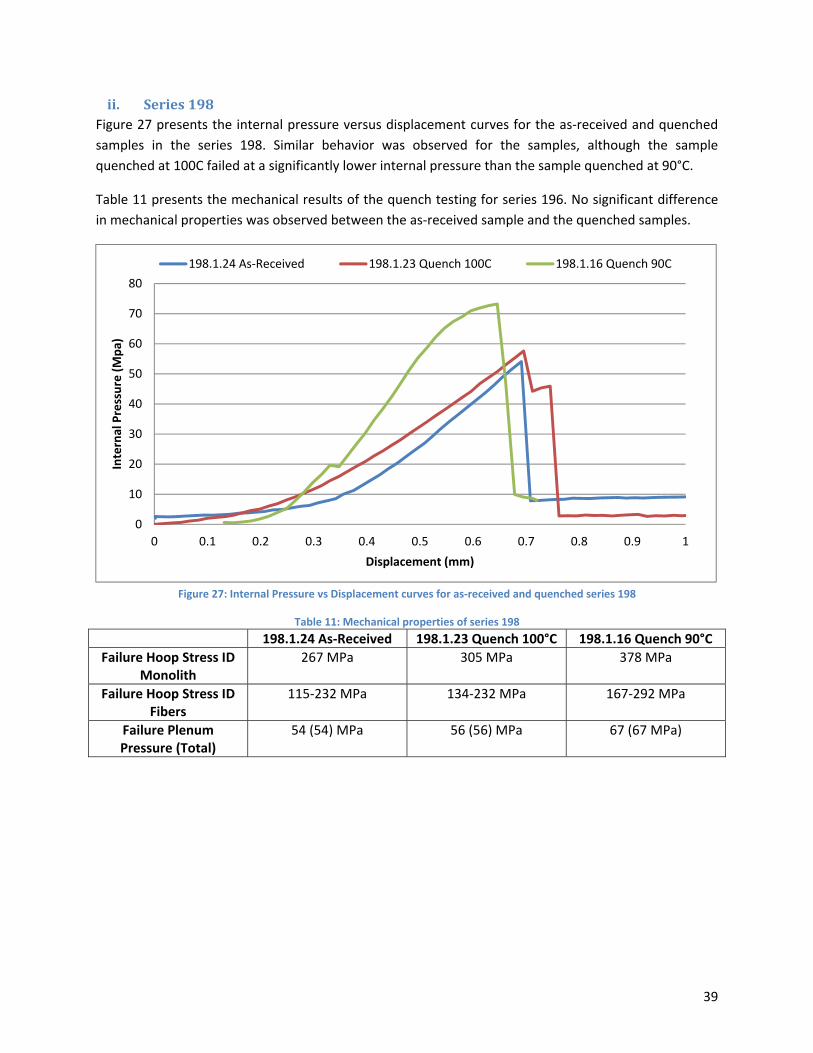
39
ii. Series198Figure 27 presents the internal pressure versus displacement curves for the as‐received and quenched
samples in the series 198. Similar behavior was observed for the samples, although the sample
quenched at 100C failed at a significantly lower internal pressure than the sample quenched at 90°C.
Table 11 presents the mechanical results of the quench testing for series 196. No significant difference
in mechanical properties was observed between the as‐received sample and the quenched samples.
Figure 27: Internal Pressure vs Displacement curves for as‐received and quenched series 198
Table 11: Mechanical properties of series 198
198.1.24 As‐Received 198.1.23 Quench 100°C 198.1.16 Quench 90°C
Failure Hoop Stress ID Monolith
267 MPa 305 MPa 378 MPa
Failure Hoop Stress ID Fibers
115‐232 MPa 134‐232 MPa 167‐292 MPa
Failure Plenum Pressure (Total)
54 (54) MPa 56 (56) MPa 67 (67 MPa)
0
10
20
30
40
50
60
70
80
0 0.1 0.2 0.3 0.4 0.5 0.6 0.7 0.8 0.9 1
Internal Pressure (Mpa)
Displacement (mm)
198.1.24 As‐Received 198.1.23 Quench 100C 198.1.16 Quench 90C
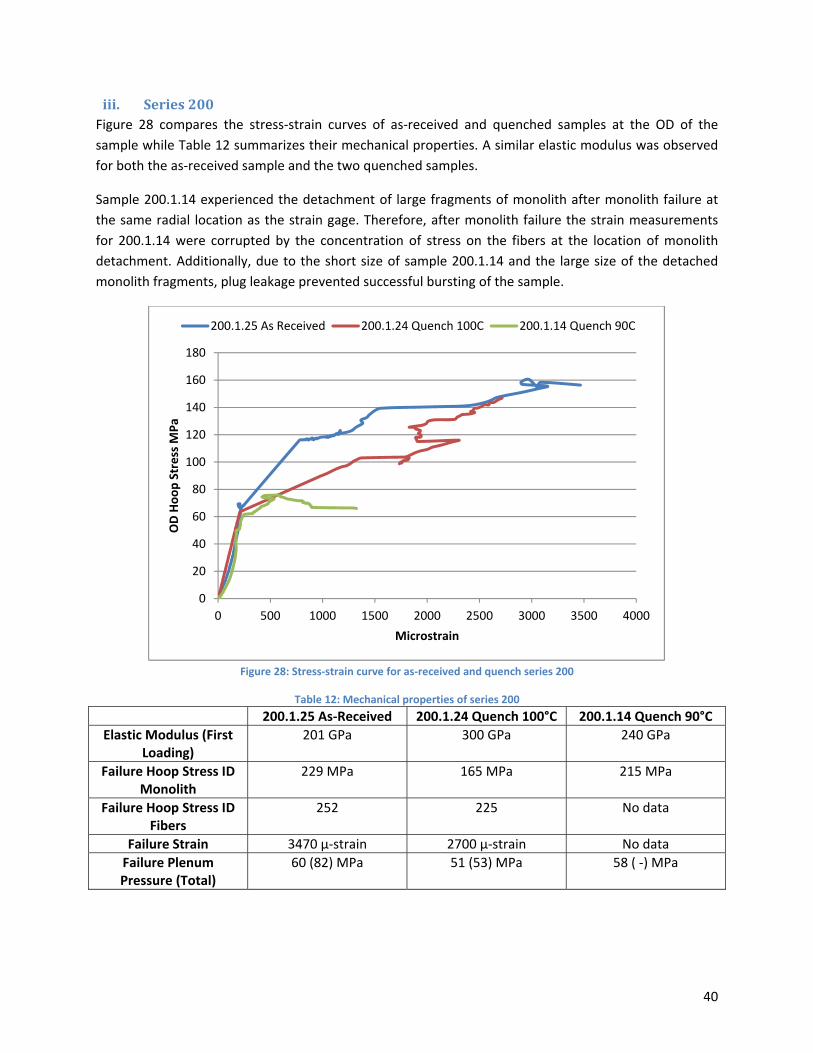
40
iii. Series200Figure 28 compares the stress‐strain curves of as‐received and quenched samples at the OD of the
sample while Table 12 summarizes their mechanical properties. A similar elastic modulus was observed
for both the as‐received sample and the two quenched samples.
Sample 200.1.14 experienced the detachment of large fragments of monolith after monolith failure at
the same radial location as the strain gage. Therefore, after monolith failure the strain measurements
for 200.1.14 were corrupted by the concentration of stress on the fibers at the location of monolith
detachment. Additionally, due to the short size of sample 200.1.14 and the large size of the detached
monolith fragments, plug leakage prevented successful bursting of the sample.
Figure 28: Stress‐strain curve for as‐received and quench series 200
Table 12: Mechanical properties of series 200
200.1.25 As‐Received 200.1.24 Quench 100°C 200.1.14 Quench 90°C
Elastic Modulus (First Loading)
201 GPa 300 GPa 240 GPa
Failure Hoop Stress ID Monolith
229 MPa 165 MPa 215 MPa
Failure Hoop Stress ID Fibers
252 225 No data
Failure Strain 3470 µ‐strain 2700 µ‐strain No data
Failure Plenum Pressure (Total)
60 (82) MPa 51 (53) MPa 58 ( ‐) MPa
0
20
40
60
80
100
120
140
160
180
0 500 1000 1500 2000 2500 3000 3500 4000
OD Hoop Stress M
Pa
Microstrain
200.1.25 As Received 200.1.24 Quench 100C 200.1.14 Quench 90C

41
Similar to the GAOE samples, the initial elastic modulus and the yield stress showed little dependence
on the thermal shock. Furthermore, the pseudo‐ductile behavior is also observed.
iv. SeriesGAOEFigure 29 presents the stress‐strain curve at the OD of the sample for the GAOE series. Sample GAOE 2
was burst as‐received and is used as a reference case for the two quenched samples, GAOE 5 & 6 (the
analysis of GAOE 2 was presented above). The effect of quenching on the elastic modulus is difficult to
evaluate because significant variation was observed in the moduli of the quenched samples (Table 13).
The yield stress was observed to decrease by 7% for both quenched samples. However, this difference
cannot be attributed to the thermal shock because of the lack of repeated results. Finally, as for all
stress‐strain curves obtained, a slight decrease in strain at a constant load can be observed just before
the first large crack nucleates (signaled by the large jump in strain).
Figure 29: Stress‐ Strain Curve Series GAOE, OD
Table 13: Mechanical properties of GAOE series
GAOE 2 As‐Received GAOE 5 Quench 100C GAOE 6 Quench 90C
Elastic Modulus 721 GPa 679 GPa 1159 GPa
Yield Stress (ID) 304 MPa 283 MPa 282 MPa
Failure Hoop Stress ID 473 MPa 572 MPa 492 MPa
Failure Strain 2375 µ‐strain 2966 µ‐strain 1945 µ‐strain
Failure Plenum Pressure
76 MPa 86 MPa 73 MPa
0
100
200
300
400
500
600
0 500 1000 1500 2000 2500 3000 3500
Stress (MPa) OD
Microstrain
GAOE 2 As Received GAOE 5 Quench 100C GAOE 6 Quench 90C

42
v. SeriesGACE‐AFigure 30 presents the load versus pushrod displacement curves for the pushout tests of the GACE‐A
series. Sample GACE 2 underwent pushout testing as‐received and is used as the reference case for the
pushout test of the quenched sample GACE 1.
Table 14 presents the mechanical strength characteristics of the endplug joint for the GACE‐A series.
Note that the burst strength is analogous to the internal pressure required to result in joint failure.
Although the observed burst strength of the quenched sample was 8% lower than that of the as‐
received sample, the burst strengths are similar and the difference cannot be attributed to quenching
due to the lack of a large dataset.
Figure 30: Pushrod load versus displacement curves for GACE‐A series pushout test
Table 14: Mechanical properties of endplug joint for GACE‐A series
GACE 2 As‐Received GACE 1 Quench 100C
Peak Load 1641 N 1513 N
Burst Strength 37.1 MPa 34.2 MPa
0
200
400
600
800
1000
1200
1400
1600
1800
0 0.2 0.4 0.6 0.8 1
Load
(N)
Displacement (mm)
GACE 2 ARS GACE 1 Quench 100C

43
vi. SeriesGACE‐BFigure 31 presents the load versus pushrod displacement curves for the pushout tests of the GACE‐B
series. Sample GACE 6 underwent pushout testing as‐received and is used as the reference case for the
pushout test of the quenched sample GACE 5.
Table 15 presents the mechanical strength characteristics of the endplug joint for the GACE‐B series.
Note that the burst strength is analogous to the internal pressure required to result in joint failure. The
observed burst strength of the quenched sample was 78% lower than that of the as‐received sample,
suggesting that quenching may lead to mechanical degradation of the joint for the GACE‐B series.
However, X‐Ray Computed Tomography (XCT) analysis revealed that the as‐received joint in the GACE 5
sample was weaker than the joint in the GACE 6 sample due to the presence of voids in the joint region.
XCT analysis is further discussed in section IV.7.
Figure 31: Pushrod load versus displacement curve for GACE‐B series pushout test
Table 15: Mechanical properties of endplug joint for GACE‐B series
GACE 6 As‐Received GACE 5 Quench 100C GACE 8 Quench 100C
Peak Load 1428 N 318 N 617 N
Burst Strength 32.3 MPa 7.2 MPa 14 MPa
0
200
400
600
800
1000
1200
1400
1600
0 0.1 0.2 0.3 0.4 0.5 0.6 0.7 0.8 0.9 1
Load
N
Displacement (mm)
GACE 6 ARS GACE 5 Quench 100°C GACE 8 Quench 100°C

44
5. QuenchedFailureCharacteristicsAll of the quenched samples, with the exception of the GACE‐B series, behaved very similarly to the as‐
received samples and did not show significant mechanical degradation due to the quenching. Burst
failure strength for quenched samples occurred at stresses comparable to the failure stresses observed
in the as‐received samples, and the failure modes for the quenched samples were similar to the as‐
received failure modes. Figure 32 shows the comparison between the cracking characteristics of the
quenched and the as‐received samples for the different series.
Figure 32: Comparison of cracking behavior between pairs of quenched samples (left half of paired pictures) and as‐received
samples (right half of paired pictures) A) Series 196, B) Series 200, C) Series 198, D) Series GAOE
Figure 33 shows top (row a) and lateral (row b) views of GAOE 5’s crack. Tows and individual fibers
decouple from their matrix and become independent from it as the matrix falls apart. Tows are then
able to glide and an important amount of yielding is observed. SEM images for sample GAOE 6 are
similar and not reported here.
Figure 33: Failure mode of GAOE 5 a) top view b) lateral view
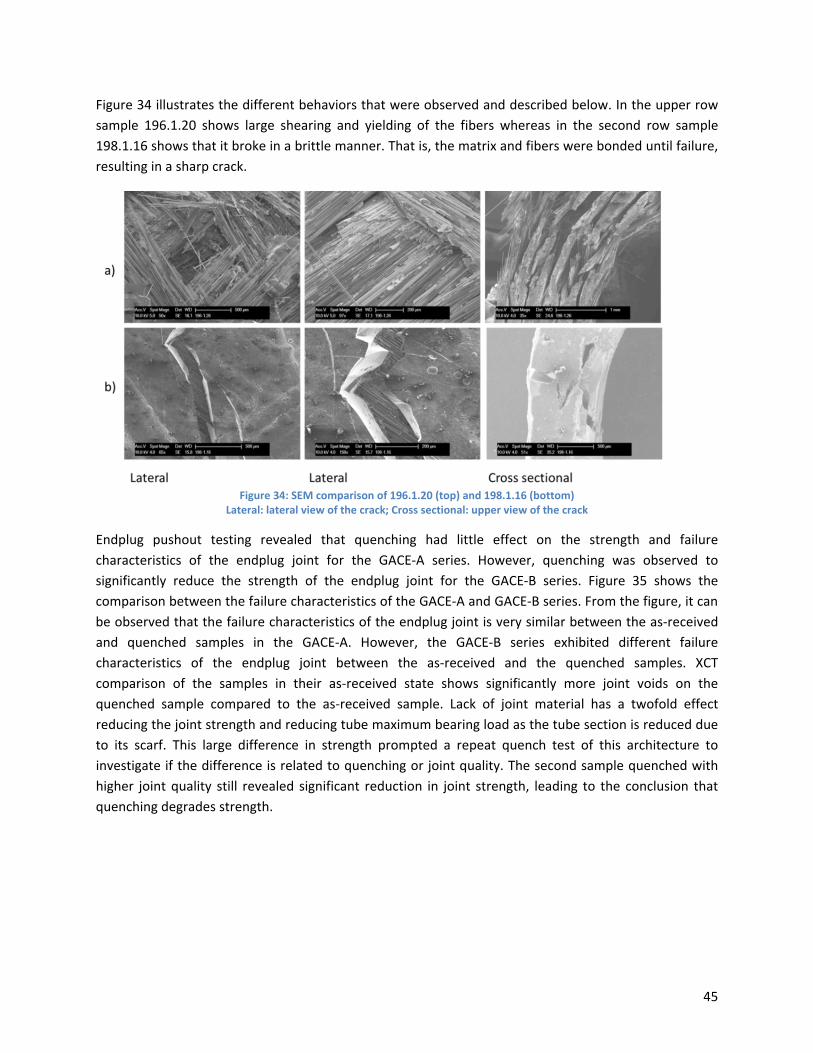
45
Figure 34 illustrates the different behaviors that were observed and described below. In the upper row
sample 196.1.20 shows large shearing and yielding of the fibers whereas in the second row sample
198.1.16 shows that it broke in a brittle manner. That is, the matrix and fibers were bonded until failure,
resulting in a sharp crack.
Figure 34: SEM comparison of 196.1.20 (top) and 198.1.16 (bottom)
Lateral: lateral view of the crack; Cross sectional: upper view of the crack
Endplug pushout testing revealed that quenching had little effect on the strength and failure
characteristics of the endplug joint for the GACE‐A series. However, quenching was observed to
significantly reduce the strength of the endplug joint for the GACE‐B series. Figure 35 shows the
comparison between the failure characteristics of the GACE‐A and GACE‐B series. From the figure, it can
be observed that the failure characteristics of the endplug joint is very similar between the as‐received
and quenched samples in the GACE‐A. However, the GACE‐B series exhibited different failure
characteristics of the endplug joint between the as‐received and the quenched samples. XCT
comparison of the samples in their as‐received state shows significantly more joint voids on the
quenched sample compared to the as‐received sample. Lack of joint material has a twofold effect
reducing the joint strength and reducing tube maximum bearing load as the tube section is reduced due
to its scarf. This large difference in strength prompted a repeat quench test of this architecture to
investigate if the difference is related to quenching or joint quality. The second sample quenched with
higher joint quality still revealed significant reduction in joint strength, leading to the conclusion that
quenching degrades strength.

46
Figure 35: Endplug joint failure comparison for GACE‐A and GACE‐B series
6. ConclusionThe thermal shock experiments were conducted to simulate the rewetting of the fuel rods following a
LOCA accident. Samples heated to 1200°C were quenched into 100°C water and 90°C water to explore
possible quenching conditions.
All samples survived the thermal shock and, despite their observed discoloration (revealing the
development of an oxide layer), no significant degradation of mechanical properties was observed
except with the GACE‐B series. Furthermore, SEM analysis of the open‐ended samples showed no crack
development in either the monolith or the CMC (both matrix and fibers) layers. As a result, all quenched
samples except in the GACE‐B series exhibited the same failure characteristics as the as‐received
samples. Series 196, 200, and GAOE failure involved fiber yielding while for series 198 the three layers
failed simultaneously in a sharp crack.
For all the samples except the GACE‐B series, the thermal shock experiment results were similar to the
as‐received results. The negligible impact of quenching conditions on the mechanical properties could
stem from the film boiling heat transfer mechanism. Video analysis revealed that samples undergo
almost exclusively film boiling. The development of the film layer protects the samples from thermal
gradients and limits thermal stresses. Therefore, the development of the film layer helped protect the
integrity of the samples during the thermal shock experiments.
The difference in the effects of quenching between the GACE‐A and GACE‐B series demonstrates that
the sample architecture likely is an important factor in the resilience of the sample’s endplug joint to
quenching. Furthermore, quenching behavior is different for the cladding samples near the endplug
joint because the large latent heat of the endplug prolongs boiling at the joint location. This mechanism
may enhance the thermal stresses at the joint location and result in the weakening of sample at the
endplug region.
Table 16 presents the mechanical properties for the as‐received and quenched samples. For the samples
of the WEC01 series, the failure hoop stress was calculated using the mechanical model presented
previously. The failure hoop stress of the monolith layer was calculated in the shared‐load regime
whereas fiber layer failure occurs in the fiber‐only loading regime. Note that strain data was not

47
gathered for many of the samples as the strain measurement technique was not yet in place. Because
the GA samples don’t have an inner monolith they are modelled as single thick wall cylinders.
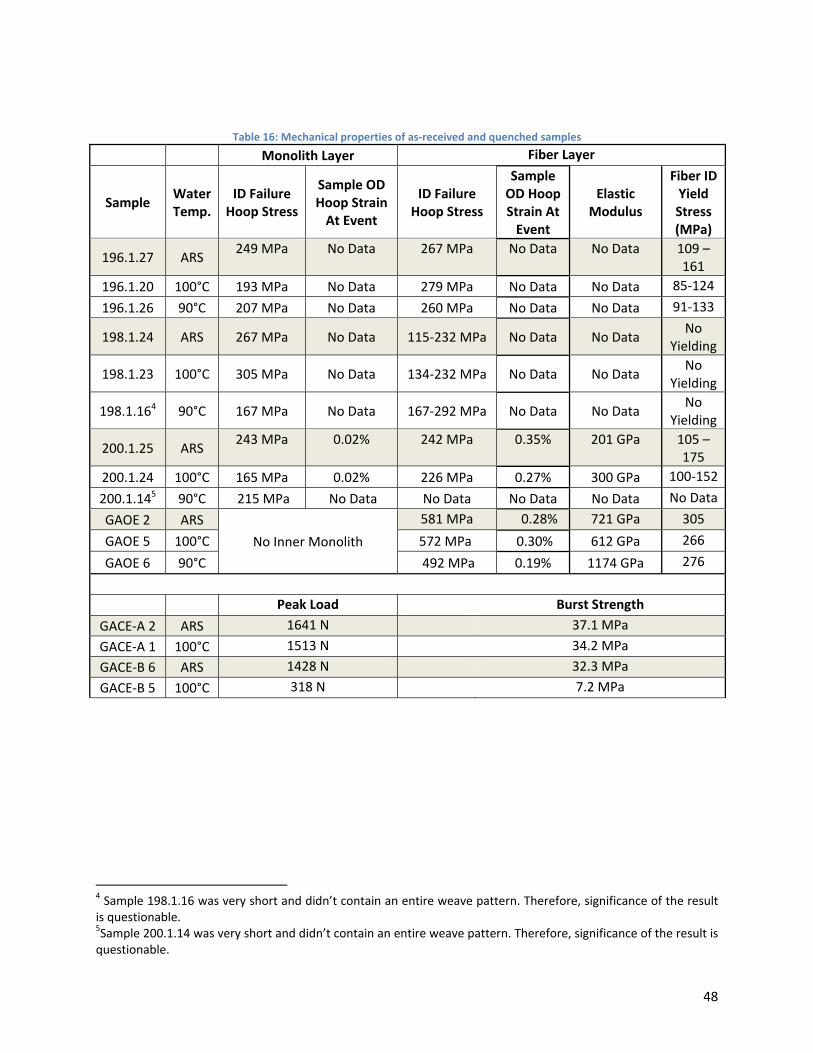
48
Table 16: Mechanical properties of as‐received and quenched samples
Monolith Layer Fiber Layer
Sample Water Temp.
ID Failure Hoop Stress
Sample OD Hoop Strain At Event
ID Failure Hoop Stress
Sample OD Hoop Strain At Event
Elastic Modulus
Fiber ID Yield Stress (MPa)
196.1.27 ARS 249 MPa No Data 267 MPa No Data No Data 109 –
161
196.1.20 100°C 193 MPa No Data 279 MPa No Data No Data 85‐124
196.1.26 90°C 207 MPa No Data 260 MPa No Data No Data 91‐133
198.1.24 ARS 267 MPa No Data 115‐232 MPa No Data No Data No
Yielding
198.1.23 100°C 305 MPa No Data 134‐232 MPa No Data No Data No
Yielding
198.1.164 90°C 167 MPa No Data 167‐292 MPa No Data No Data No
Yielding
200.1.25 ARS 243 MPa 0.02% 242 MPa 0.35% 201 GPa 105 –
175
200.1.24 100°C 165 MPa 0.02% 226 MPa 0.27% 300 GPa 100‐152
200.1.145 90°C 215 MPa No Data No Data No Data No Data No Data
GAOE 2 ARS
No Inner Monolith
581 MPa 0.28% 721 GPa 305
GAOE 5 100°C 572 MPa 0.30% 612 GPa 266
GAOE 6 90°C 492 MPa 0.19% 1174 GPa 276
Peak Load Burst Strength
GACE‐A 2 ARS 1641 N 37.1 MPa
GACE‐A 1 100°C 1513 N 34.2 MPa
GACE‐B 6 ARS 1428 N 32.3 MPa
GACE‐B 5 100°C 318 N 7.2 MPa
4 Sample 198.1.16 was very short and didn’t contain an entire weave pattern. Therefore, significance of the result is questionable. 5Sample 200.1.14 was very short and didn’t contain an entire weave pattern. Therefore, significance of the result is questionable.

49
7. DiscussionThe stress calculations rely on the validity of the mechanical model outlined previously. Therefore, as
outlined in the as‐received section, assumptions are made regarding the monolith‐fiber interface and
mechanical properties of the monolith and fiber regions.
Because only two samples in each Westinghouse series (196, 198, and 200), only two samples in the
GAOE series, only two samples in the GACE‐B series, and only one sample in the GACE‐A series were
quench tested, there are too few samples to provide meaningful statistics on the distribution of true
population as‐received mechanical properties. Only by testing more samples could the population’s true
distribution of mechanical properties be determined, but the testing does show suggest that quenching
has a minimal impact on the mechanical strength of most samples, and only the GACE‐B endplug joint
strength showed a significant impact of quenching
The results of the pushout test of the quenched sample GACE 5 suggested a severely weakened joint.
However, XCT analysis of the samples prior to testing suggested that the joint in GACE 5 was inherently
weaker than the joint of GACE 6, as shown in Figure 36. Therefore, the inherent weakness of the GACE 5
joint confounds the results of the quench testing and makes it difficult to determine the extent of the
mechanical degradation due to the quenching.
Figure 36: XCT scans of the joint region in GACE 5 (before quenching) (left) and GACE 6 (tested as‐received) (right) showing
more voids in the joint of GACE 5
50
V. HighTemperatureOxidationExperiments
1. ProcedureThe facility used to perform high‐temperature steam oxidation tests of the samples consists of a sealed
pool of boiling water feeding steam inside a quartz tube through a succession of heaters with the
ultimate temperature reaching 1400˚C. The steam then passes across a sample, with the steam flow
rate, sample oxidation time, and oxidation temperature predetermined based on the testing criteria.
Thermocouples measure the temperature of the heating stages and the temperature of the steam
flowing across the sample. The furnaces at each heating stage have closed‐loop temperature control and
the steam generator is powered by a DC power supply, thereby allowing for accurate control of the
steam flow rate. This facility was built specifically for this project.
Testing was performed by suspending the sample in the high‐temperature sample furnace as the steam
was passed across the sample surface. The sample was positioned vertically in the center of the quartz
tube and steam was allowed to pass across both the inner and outer surfaces for all samples. Although
the close ended samples had their plug facing the steam flow, steam could enter from the top open end
of the sample. After the oxidation test the sample was removed and allowed to air‐cool. The sample
weight was taken prior to oxidation, and the weight was again taken after oxidation. Additionally, after
testing, the burst strength of the open ended samples was measured, and the samples were examined
via SEM both before and after oxidation.

51
2. OpticalandSEMAnalysis
i. WestinghouseSamples
Figure 37 compares optical (columns A and B) and SEM views (columns C and D) of pre and post oxidized
Westinghouse samples. Discoloration was observed on the surfaces of the samples after oxidation. The
oxidation characteristics for the Westinghouse samples are outlined in Table 17.
Figure 37: Optical and SEM analysis of oxidation characteristics of Westinghouse samples
A) Lateral view of as‐received samples B) Lateral view of oxidized samples (Note: for 198.1.25 ruler divisions are 1/16”)
C) Cross Section SEM view of as‐received samples D) Cross Section SEM view of oxidized samples
Table 17: Table of Westinghouse sample oxidation characteristics
Sample Steam Flow Rate Oxidation Temperature
Oxidation Period
Weight Change
196.1.19 6.1 g/min 1400°C 48 hours +0.65 mg/cm2
198.1.25 3.9 g/min 1400°C 48 hours ‐0.12 mg/cm2
200.1.23 6.0 g/min 1400°C 48 hours +0.73 mg/cm2

52
ii. GASamplesFigure 38 compares optical (columns A and B) and SEM views (columns C and D) of pre and post oxidized
Westinghouse samples. Discoloration was observed on the surfaces of the samples after oxidation.
Figure 38: Optical and SEM analysis of oxidation characteristics of GA samples
A) Lateral view of as‐received samples B) Lateral view of oxidized samples
C) Cross Section (GAOE) and Lateral view of plug joint (GACE) SEM view of as‐received samples D) Cross Section (GAOE) and Lateral (GACE) SEM images of oxidized samples showing silica formations
The oxidation characteristics of the GA samples are outlined in Table 18.
Table 18: Table of oxidation characteristics of GA samples
Sample Steam Flow Rate Oxidation Temperature Weight Change
GAOE 3 6.1 g/min 1400°C +0.66 mg/cm2
GAOE 4 6.1 g/min 1400°C ‐0.13 mg/cm2
GACE‐A 3 6.1 g/min 1400°C 0.00 mg/cm2
GACE‐B 4 6.0 g/min 1400°C 0.01 mg/cm2
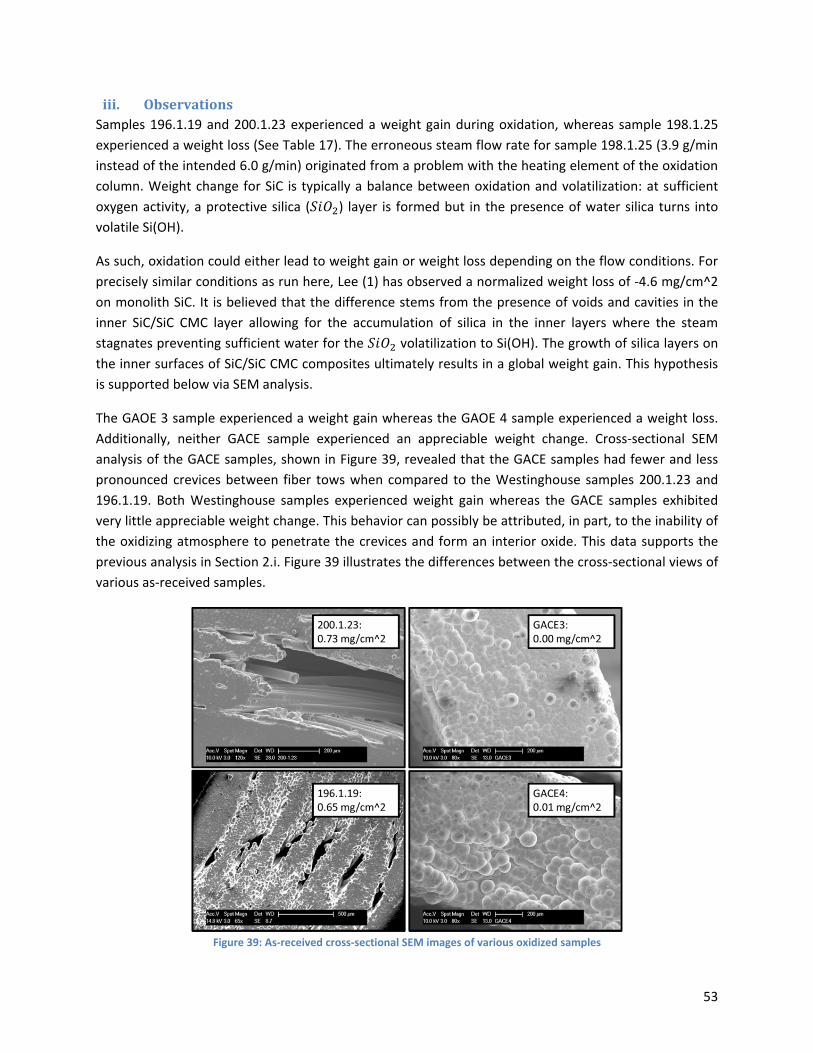
53
iii. ObservationsSamples 196.1.19 and 200.1.23 experienced a weight gain during oxidation, whereas sample 198.1.25
experienced a weight loss (See Table 17). The erroneous steam flow rate for sample 198.1.25 (3.9 g/min
instead of the intended 6.0 g/min) originated from a problem with the heating element of the oxidation
column. Weight change for SiC is typically a balance between oxidation and volatilization: at sufficient
oxygen activity, a protective silica ( ) layer is formed but in the presence of water silica turns into
volatile Si(OH).
As such, oxidation could either lead to weight gain or weight loss depending on the flow conditions. For
precisely similar conditions as run here, Lee (1) has observed a normalized weight loss of ‐4.6 mg/cm^2
on monolith SiC. It is believed that the difference stems from the presence of voids and cavities in the
inner SiC/SiC CMC layer allowing for the accumulation of silica in the inner layers where the steam
stagnates preventing sufficient water for the volatilization to Si(OH). The growth of silica layers on
the inner surfaces of SiC/SiC CMC composites ultimately results in a global weight gain. This hypothesis
is supported below via SEM analysis.
The GAOE 3 sample experienced a weight gain whereas the GAOE 4 sample experienced a weight loss.
Additionally, neither GACE sample experienced an appreciable weight change. Cross‐sectional SEM
analysis of the GACE samples, shown in Figure 39, revealed that the GACE samples had fewer and less
pronounced crevices between fiber tows when compared to the Westinghouse samples 200.1.23 and
196.1.19. Both Westinghouse samples experienced weight gain whereas the GACE samples exhibited
very little appreciable weight change. This behavior can possibly be attributed, in part, to the inability of
the oxidizing atmosphere to penetrate the crevices and form an interior oxide. This data supports the
previous analysis in Section 2.i. Figure 39 illustrates the differences between the cross‐sectional views of
various as‐received samples.
Figure 39: As‐received cross‐sectional SEM images of various oxidized samples

54
Despite the difference in weight changes between the samples, the optical and SEM analysis revealed
similar characteristics among the samples. Optically, the oxidized samples all appear much darker and
less lustrous than the as‐received samples. SEM analysis of the sample cross section exposed to the
steam (Figure 40, note that this was the as‐received cut face) revealed that, during oxidation, the
exposed fibers were coated with what is believed to be silica. Because the deposits observed in the cross
section were recessed, EDS was unable to be performed on them. However, the deposits observed in
the cross‐section views are morphologically similar to deposits observed on the lateral faces that were
analyzed by EDS (see below). Silica deposits similar to those seen in Figure 40 were analyzed by EDS in
Figure 43. The deposition of a smooth silica layer softened many of the rough features of the fiber
region observed in the pre‐oxidation samples. The silica layer blankets the fibers, effectively binding
them together. Additionally, fibers directly exposed to the steam flow exhibited severe cracking and
corrosion.
Figure 40: SEM images of sample 200.1.23 showing what is believed to be silica‐coated fibers (left) and corrosion cracking of fiber (right)
SEM analysis of the as‐received samples (Figure 41) did not reveal any of the blanketing material on the
fibers nor did it reveal cracking along the fibers as observed in the oxidized samples. The as‐received
fibers are bound only by the SiC matrix and the surface of the fibers is rough and lacks the cracks
observed in the oxidized samples.
Figure 41: SEM image of sample 200.1.23 prior to oxidation showing as‐received fiber structure and fiber texture

55 Draft
Figure 42: SEM lateral view of A) As‐received sample and B) Oxidized sample
SEM analysis of the lateral view of the samples also revealed dispersed and speckled localized
microstructural changes during oxidation. The as‐received samples exhibited a rough texture with
characteristic round bumps that can be found covering almost the entire surface (Figure 42 column A).
However the oxidized samples revealed speckled points with a flatter texture whereby the bumps were
softened or altogether erased by large flat, smooth, or blocky areas (Figure 42 column B). This behavior
is attributable to the formation of a silica layer on the surface of the sample and the oxidation of the SiC
directly exposed to the oxidizing atmosphere. EDS analysis performed on the oxidized samples revealed
the presence of oxygen in the oxidized samples indicative of silica (Figure 43). The oxygen is attributed
to the formation of silica induced by the oxidation of the SiC.

56 Draft
Figure 43: EDS analysis of silica coating on lateral surface of oxidized sample GAOE 3 (top) and 198.1.25 (bottom) showing oxygen to silicon ratio of approximately 2 to 1
Silica was observed to cover sections of the lateral surface of the oxidized samples. The silica formed
either a smooth layer (Figure 43, top) or a pitted and cracked layer (Figure 43, bottom). Similar silica
morphology was observed in the cross‐section of the oxidized samples, as seen in Figure 40 above.
Although the silica was observed to produce a relatively homogenous coating over the samples as
shown in Figure 43, it was also observed to form irregular scales and block‐like formations on the
exposed surfaces of the samples (Figure 44). Although EDS analysis was unable to be performed on the
deposit observed in between fiber tows in cross‐section of the sample, similar deposits were observed
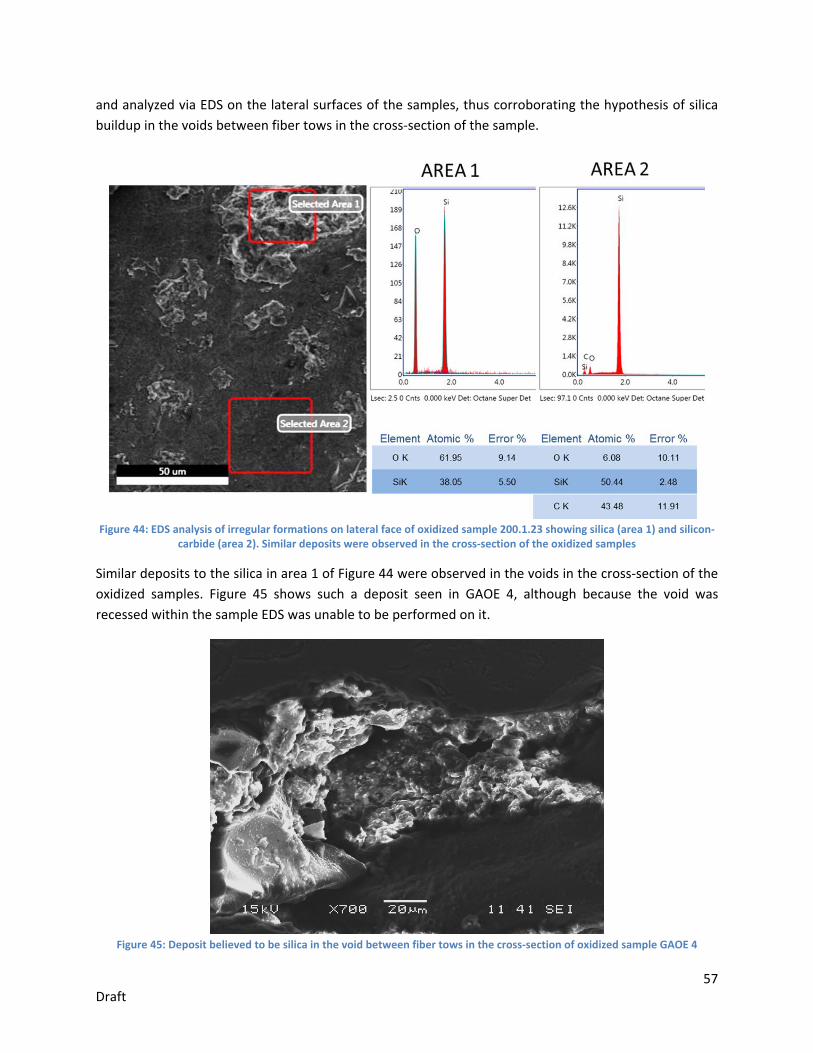
57 Draft
and analyzed via EDS on the lateral surfaces of the samples, thus corroborating the hypothesis of silica
buildup in the voids between fiber tows in the cross‐section of the sample.
Figure 44: EDS analysis of irregular formations on lateral face of oxidized sample 200.1.23 showing silica (area 1) and silicon‐
carbide (area 2). Similar deposits were observed in the cross‐section of the oxidized samples
Similar deposits to the silica in area 1 of Figure 44 were observed in the voids in the cross‐section of the
oxidized samples. Figure 45 shows such a deposit seen in GAOE 4, although because the void was
recessed within the sample EDS was unable to be performed on it.
Figure 45: Deposit believed to be silica in the void between fiber tows in the cross‐section of oxidized sample GAOE 4

58 Draft
Silica was observed to form in the endplug joint of the close‐ended samples (Figure 46, top). However,
silica was also observed on the inward‐facing side of the endplug (Figure 46, bottom), indicating that the
sample was oxidized from the inside as well as from outside (due to the fact that only one end of the
GACE samples is closed).
Figure 46: EDS analysis showing silica in the endplug joint but not in surrounding CMC layer (top) and silica buildup on the
inside‐facing surface of the endplug (bottom)

59 Draft
3. MechanicalResultsThe influence of high‐temperature steam oxidation on the mechanical behavior of the samples is
investigated in this section. From the results, oxidation does impact the mechanical properties of the
samples and results in brittle samples that do not exhibit the pseudo‐ductility of the as‐received and
quenched samples.
The raw data for all oxidized samples is shown in Figure 47 and demonstrates that the oxidized sample
behave similarly with only one distinct loading regime and complete sample failure upon termination of
the first loading regime. Additionally, the slopes of all curves are similarly steep when compared to the
fiber‐only loading regimes observed in the as‐received samples. Sample 200.1.23 failed at the highest
pressure, with sample 196.1.19 failing at the next highest pressure and sample 198.1.25 failing at the
lowest pressure. This behavior can be attributed to the difference between wall thickness and diameter
between the sample series.
Figure 47: Internal pressure vs displacement for oxidized samples
0
10
20
30
40
50
60
70
0 0.5 1 1.5 2 2.5 3 3.5 4
INTERNAL PRESSU
RE (M
PA)
DISPLACEMENT (MM)
Oxidation Comparison
196.1.19 198.1.25 200.1.23 GAOE 3 GAOE 4
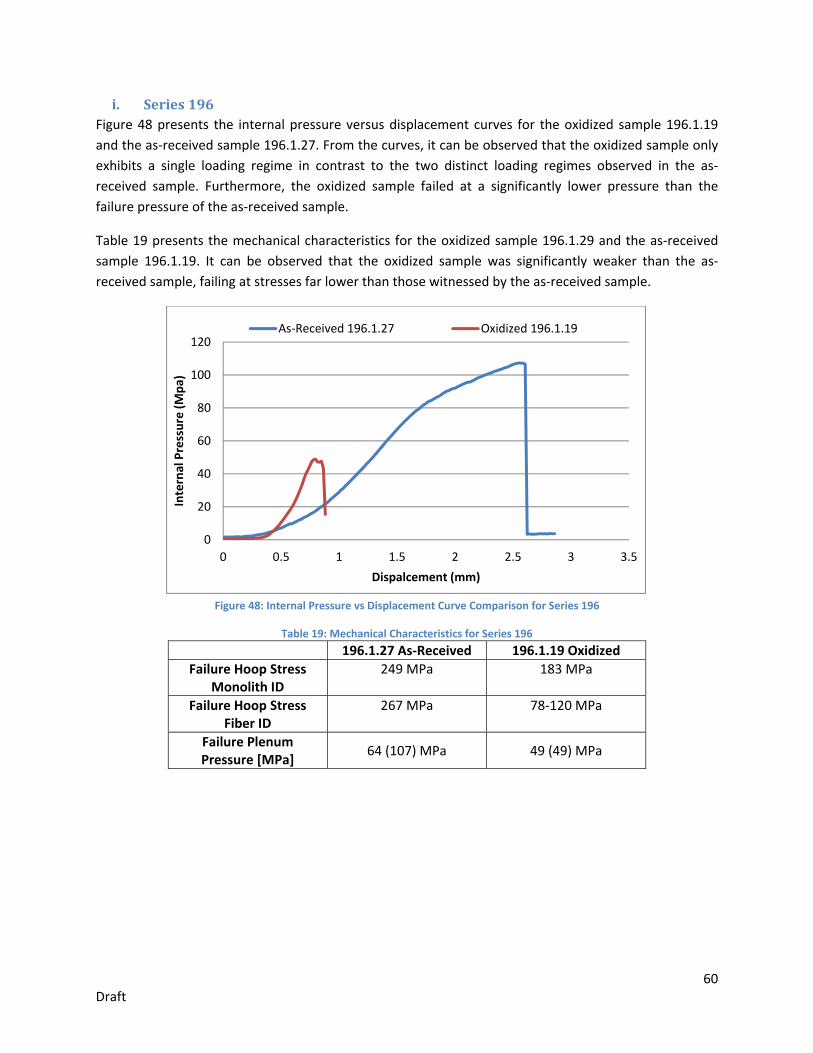
60 Draft
i. Series196Figure 48 presents the internal pressure versus displacement curves for the oxidized sample 196.1.19
and the as‐received sample 196.1.27. From the curves, it can be observed that the oxidized sample only
exhibits a single loading regime in contrast to the two distinct loading regimes observed in the as‐
received sample. Furthermore, the oxidized sample failed at a significantly lower pressure than the
failure pressure of the as‐received sample.
Table 19 presents the mechanical characteristics for the oxidized sample 196.1.29 and the as‐received
sample 196.1.19. It can be observed that the oxidized sample was significantly weaker than the as‐
received sample, failing at stresses far lower than those witnessed by the as‐received sample.
Figure 48: Internal Pressure vs Displacement Curve Comparison for Series 196
Table 19: Mechanical Characteristics for Series 196
196.1.27 As‐Received 196.1.19 Oxidized
Failure Hoop Stress Monolith ID
249 MPa 183 MPa
Failure Hoop Stress Fiber ID
267 MPa 78‐120 MPa
Failure Plenum Pressure [MPa]
64 (107) MPa 49 (49) MPa
0
20
40
60
80
100
120
0 0.5 1 1.5 2 2.5 3 3.5
Internal Pressure (Mpa)
Dispalcement (mm)
As‐Received 196.1.27 Oxidized 196.1.19
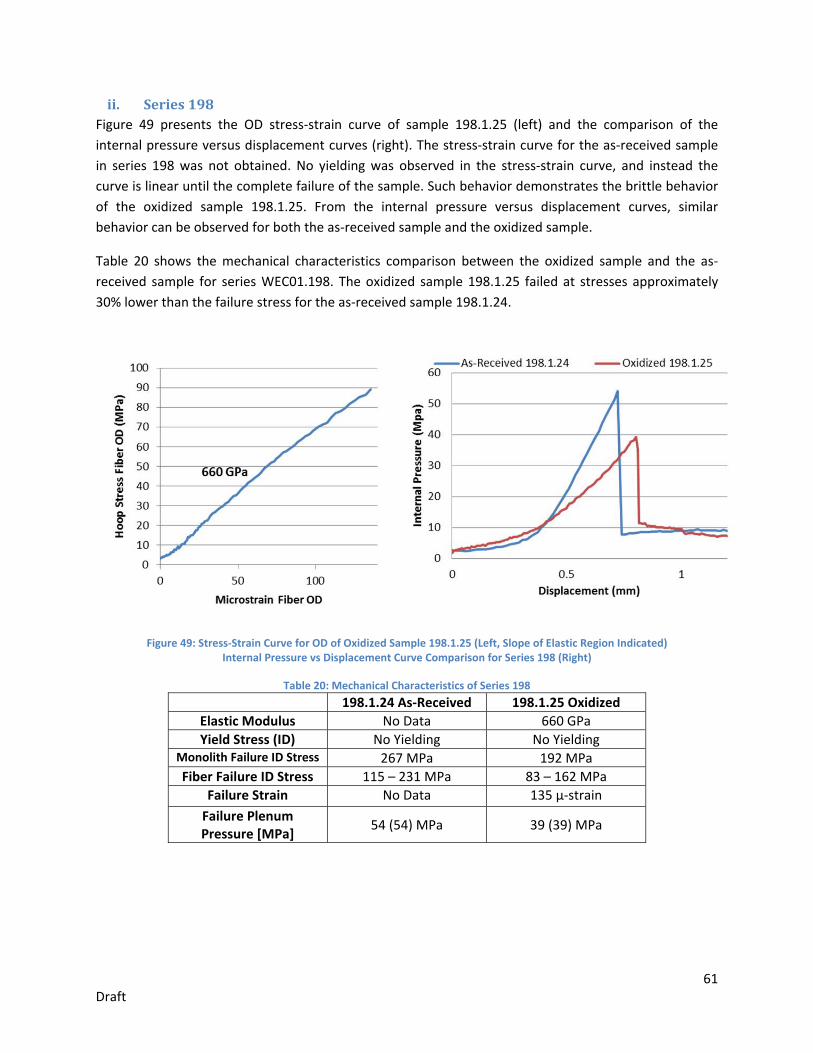
61 Draft
ii. Series198Figure 49 presents the OD stress‐strain curve of sample 198.1.25 (left) and the comparison of the
internal pressure versus displacement curves (right). The stress‐strain curve for the as‐received sample
in series 198 was not obtained. No yielding was observed in the stress‐strain curve, and instead the
curve is linear until the complete failure of the sample. Such behavior demonstrates the brittle behavior
of the oxidized sample 198.1.25. From the internal pressure versus displacement curves, similar
behavior can be observed for both the as‐received sample and the oxidized sample.
Table 20 shows the mechanical characteristics comparison between the oxidized sample and the as‐
received sample for series WEC01.198. The oxidized sample 198.1.25 failed at stresses approximately
30% lower than the failure stress for the as‐received sample 198.1.24.
Figure 49: Stress‐Strain Curve for OD of Oxidized Sample 198.1.25 (Left, Slope of Elastic Region Indicated) Internal Pressure vs Displacement Curve Comparison for Series 198 (Right)
Table 20: Mechanical Characteristics of Series 198
198.1.24 As‐Received 198.1.25 Oxidized
Elastic Modulus No Data 660 GPa
Yield Stress (ID) No Yielding No Yielding Monolith Failure ID Stress 267 MPa 192 MPa
Fiber Failure ID Stress 115 – 231 MPa 83 – 162 MPa
Failure Strain No Data 135 µ‐strain
Failure Plenum Pressure [MPa]
54 (54) MPa 39 (39) MPa

62 Draft
iii. Series200Figure 50 presents the OD stress‐strain behavior comparison between the oxidized sample 200.1.23 and
the as‐received sample 200.1.25. For the stress‐strain curve for sample 200.1.23, the strain gage failed
before the termination of the burst test due to cracking of the glue bonding the strain gage to the
sample. Therefore, the stress‐strain curve for sample 200.1.23 is estimated after the point of strain gage
failure based on observation of the stress‐strain behavior for other oxidized samples. The estimation is
based on the measured elastic modulus for the sample 200.1.23 when the strain gage was functional
and the brittle, non‐yielding behavior observed in other oxidized samples. The estimated stress‐strain
curve terminates at the stress of sample failed.
Table 21 shows the comparison of mechanical properties between the oxidized sample 200.1.23 and the
as‐received sample 200.1.25. It can be observed that the oxidized sample failed at a stress 48% lower
than the failure stress for the as‐received sample. The elastic modulus for the oxidized sample was
steeper than the modulus of the as‐received sample, although the moduli were fairly similar.
Figure 50: Stress‐Strain Curve Comparison for OD of Series 200 (Slopes of Elastic Regions Indicated)
Table 21: Mechanical Characteristics of Series 200
200.1.25 As‐Received 200.1.23 Oxidized
Initial Elastic Modulus 201 GPa 291 GPa
Yield Stress (ID) 105‐175 MPa No Yielding Monolith Failure ID Stress 243 MPa 169 MPa
Fiber Failure ID Stress 242 MPa 90 – 145 MPa
Failure Strain (OD) 3466 µ‐strain Estimated at 286 µ‐strain
Failure Plenum Pressure [MPa]
60 (82) MPa 68 (68) MPa
0
20
40
60
80
100
120
140
160
180
0 500 1000 1500 2000 2500 3000 3500 4000
Stress OD (MPa)
Microstrain
200.1.25 As‐Received 200.1.23 Oxidized, Measured 200.1.23 Oxidized, Estimated
291 GPa
201 GPa
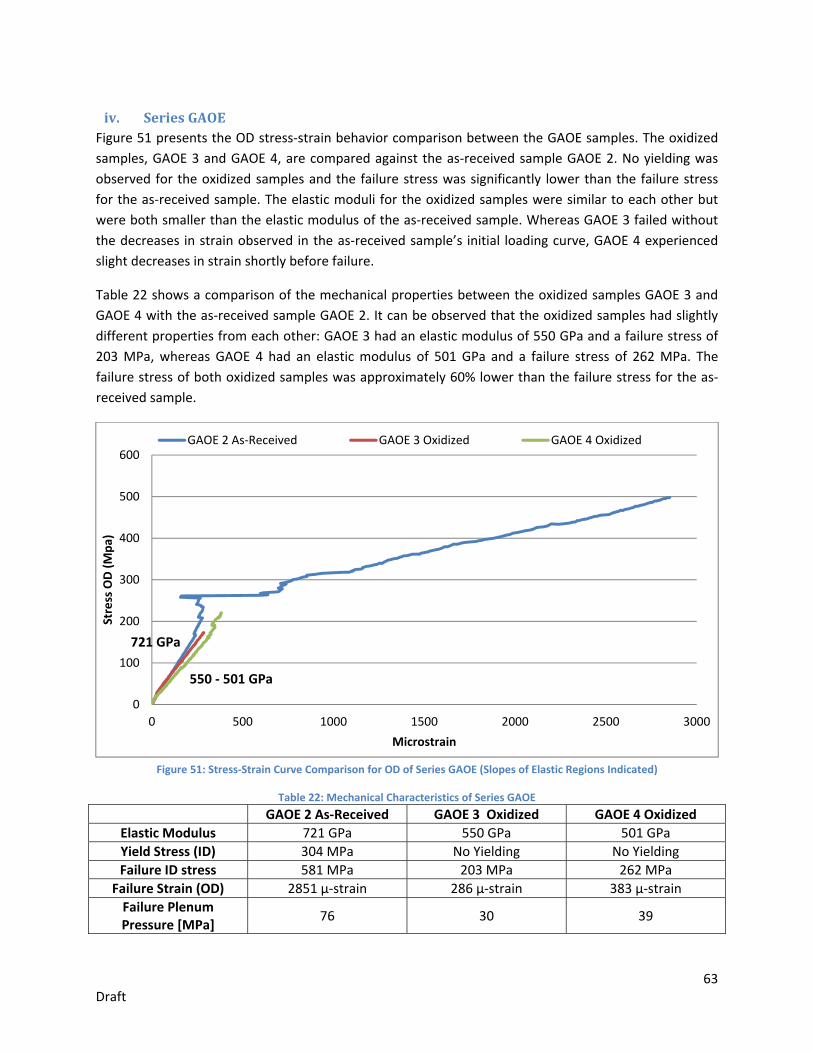
63 Draft
iv. SeriesGAOEFigure 51 presents the OD stress‐strain behavior comparison between the GAOE samples. The oxidized
samples, GAOE 3 and GAOE 4, are compared against the as‐received sample GAOE 2. No yielding was
observed for the oxidized samples and the failure stress was significantly lower than the failure stress
for the as‐received sample. The elastic moduli for the oxidized samples were similar to each other but
were both smaller than the elastic modulus of the as‐received sample. Whereas GAOE 3 failed without
the decreases in strain observed in the as‐received sample’s initial loading curve, GAOE 4 experienced
slight decreases in strain shortly before failure.
Table 22 shows a comparison of the mechanical properties between the oxidized samples GAOE 3 and
GAOE 4 with the as‐received sample GAOE 2. It can be observed that the oxidized samples had slightly
different properties from each other: GAOE 3 had an elastic modulus of 550 GPa and a failure stress of
203 MPa, whereas GAOE 4 had an elastic modulus of 501 GPa and a failure stress of 262 MPa. The
failure stress of both oxidized samples was approximately 60% lower than the failure stress for the as‐
received sample.
Figure 51: Stress‐Strain Curve Comparison for OD of Series GAOE (Slopes of Elastic Regions Indicated)
Table 22: Mechanical Characteristics of Series GAOE
GAOE 2 As‐Received GAOE 3 Oxidized GAOE 4 Oxidized
Elastic Modulus 721 GPa 550 GPa 501 GPa
Yield Stress (ID) 304 MPa No Yielding No Yielding
Failure ID stress 581 MPa 203 MPa 262 MPa
Failure Strain (OD) 2851 µ‐strain 286 µ‐strain 383 µ‐strain
Failure Plenum Pressure [MPa]
76 30 39
0
100
200
300
400
500
600
0 500 1000 1500 2000 2500 3000
Stress OD (Mpa)
Microstrain
GAOE 2 As‐Received GAOE 3 Oxidized GAOE 4 Oxidized
550 ‐ 501 GPa
721 GPa

64 Draft
v. SeriesGACE‐AFigure 52 presents the load versus pushrod displacement curves for the pushout tests of the GACE‐A
series. Sample GACE 2 underwent pushout testing as‐received and is used as the as the reference case
for the pushout test of the oxidized sample GACE 3.
Table 23 presents the mechanical strength characteristics of the endplug joint for the GACE‐A series.
Note that the burst strength is analogous to the internal pressure required to result in joint failure.
Although the observed burst strength of the oxidized sample was 9% lower than that of the as‐received
sample, the burst strengths are similar and the difference cannot be attributed to oxidation due to the
lack of a large dataset.
Figure 52: Pushrod load versus displacement curves for GACE‐A series pushout tests
Table 23: Mechanical properties of endplug joint for GACE‐A series
GACE 2 As‐Received GACE 3 Oxidized
Peak Load 1641 N 1490 N
Burst Strength 37.1 MPa 33.7 MPa
0
200
400
600
800
1000
1200
1400
1600
1800
0 0.2 0.4 0.6 0.8 1
Load
(N)
Displacement (mm)
GACE 2 ARS GACE 3 Oxidized

65 Draft
vi. SeriesGACE‐BFigure 53 presents the load versus pushrod displacement curves for the pushout tests of the GACE‐B
series. Sample GACE 6 underwent pushout testing as‐received and is used as the as the reference case
for the pushout test of the oxidized sample GACE 4.
Table 24 presents the mechanical strength characteristics of the endplug joint for the GACE‐B series.
Note that the burst strength is analogous to the internal pressure required to result in joint failure. The
observed burst strength of the oxidized sample was 32% lower than that of the as‐received sample,
suggesting that oxidation results in significant mechanical degradation of the joint for the GACE‐B series.
Figure 53: Pushrod load versus displacement curves for GACE‐B series pushout tests
Table 24: Mechanical properties of endplug joint for GACE‐B series
GACE 6 As‐Received GACE 4 Oxidized
Peak Load 1423 N 972 N
Burst Strength 32.3 MPa 22.0 MPa
0
200
400
600
800
1000
1200
1400
1600
0 0.2 0.4 0.6 0.8 1
Load
(N)
Displacement (mm)
GACE 6 As‐Received GACE 4 Oxidized

66 Draft
4. OxidizedFailureCharacteristicsFor the oxidized Westinghouse samples, during the initial monolith charging, the samples behaved
elastically and were characterized by the monolith and fibers loading simultaneously as outlined in the
mechanical model section (see Section 0.4 above). However, once the failure stress of the sample was
exceeded, the monolith and the fiber region both failed by suddenly cracking entirely through the
sample’s thickness. The cracking behavior betrays the non‐frangible embrittlement of the CMC layer.
When the samples failed, both the monolith and fiber regions failed simultaneously. The fiber region did
not exhibit pseudo‐ductility, and the failure strain was very low compared to the as‐received samples.
Sample failure was characterized by a single crack running along the entire length of the sample without
large deformation of the sample. Whereas the as‐received samples, when burst, exhibited deformation
of the fiber tows and a wider crack, the oxidized samples displayed almost no deformation of the fibers
and had a very narrow crack. Figure 54 presents the comparison between the cracking behavior for the
as‐received samples and the oxidized samples.
Figure 54: Comparison of cracking behavior between pairs of oxidized samples (left half of paired pictures) and as‐received
samples (right half of paired pictures) A) Series 196, B) Series 200, C) Series 198, D) Series GAOE
Note the wider crack for the as‐received samples.
Oxidation was not observed to have a significant impact on the mechanical strength of the endplug
joint for the GACE‐A series, but oxidation was observed to weaken the endplug joint for the GACE‐B
series. The failure characteristics of the endplug joint for the oxidized samples were different from those
of the as‐received samples, with the debonded surface of the oxidized samples showing remains of the
fiber structure still attached to the endplug in contrast to the relatively smooth debonded surface for
the as‐received samples. The different failure characteristics observed between the as‐received and the
oxidized samples may be attributable to failure occurring within the CMC region, allowing for the

67 Draft
retention of fragments of the CMC region on the surface of the endplug. The characteristics of the
debonded region for the oxidized GACE‐B sample were especially different from the as‐received
debonded region, exhibiting pronounced texture similar to the weave pattern of the CMC layer. It is
important to keep in mind that the scarf joint significantly reduces the load bearing section of the tube
in the joint region.
Figure 55: Endplug joint failure comparison for GACE‐A and GACE‐B series
SEM analysis of the lateral view of the endplug for the oxidized sample GACE 4 revealed that the
endplug carried oxidized fibers with it during the pushout, as shown in Figure 56. This suggests that the
oxidation weakened the CMC and failure occurred within the CMC region instead of within the joint.
Figure 56: SEM lateral view of endplug showing silica‐coated fibers on the endplug after pushout
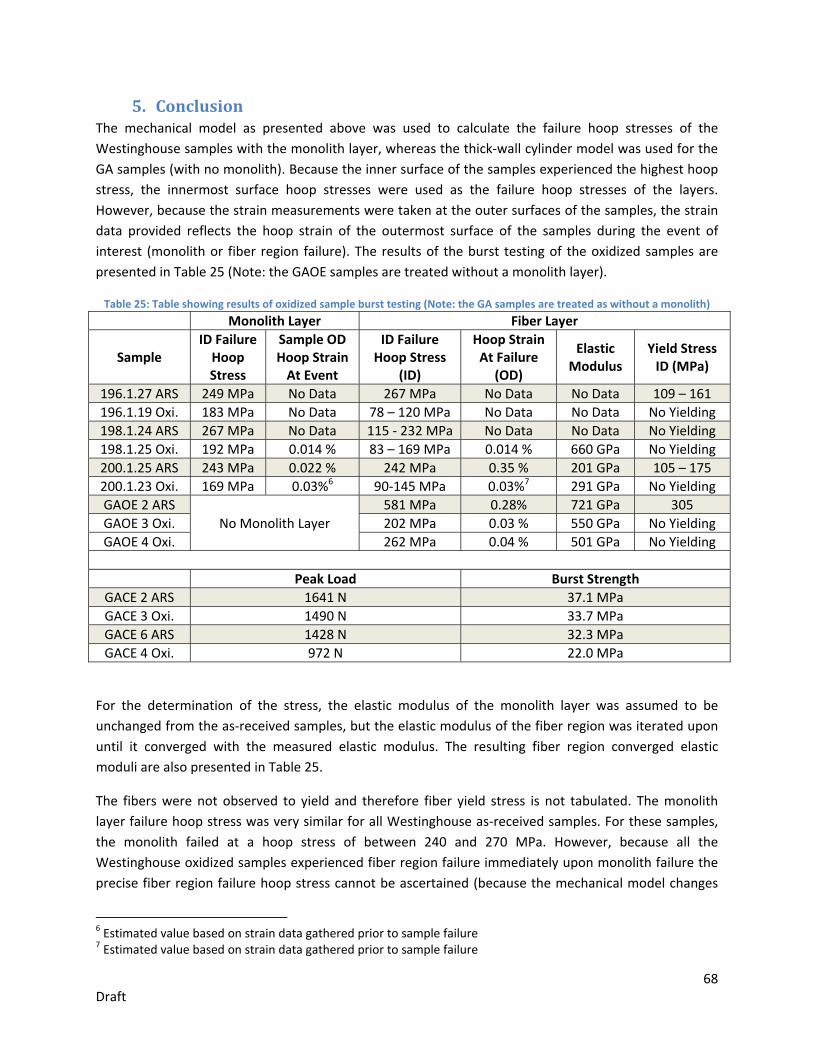
68 Draft
5. ConclusionThe mechanical model as presented above was used to calculate the failure hoop stresses of the
Westinghouse samples with the monolith layer, whereas the thick‐wall cylinder model was used for the
GA samples (with no monolith). Because the inner surface of the samples experienced the highest hoop
stress, the innermost surface hoop stresses were used as the failure hoop stresses of the layers.
However, because the strain measurements were taken at the outer surfaces of the samples, the strain
data provided reflects the hoop strain of the outermost surface of the samples during the event of
interest (monolith or fiber region failure). The results of the burst testing of the oxidized samples are
presented in Table 25 (Note: the GAOE samples are treated without a monolith layer).
Table 25: Table showing results of oxidized sample burst testing (Note: the GA samples are treated as without a monolith)
Monolith Layer Fiber Layer
Sample ID Failure Hoop Stress
Sample OD Hoop Strain At Event
ID Failure Hoop Stress
(ID)
Hoop Strain At Failure
(OD)
Elastic Modulus
Yield Stress ID (MPa)
196.1.27 ARS 249 MPa No Data 267 MPa No Data No Data 109 – 161
196.1.19 Oxi. 183 MPa No Data 78 – 120 MPa No Data No Data No Yielding
198.1.24 ARS 267 MPa No Data 115 ‐ 232 MPa No Data No Data No Yielding
198.1.25 Oxi. 192 MPa 0.014 % 83 – 169 MPa 0.014 % 660 GPa No Yielding
200.1.25 ARS 243 MPa 0.022 % 242 MPa 0.35 % 201 GPa 105 – 175
200.1.23 Oxi. 169 MPa 0.03%6 90‐145 MPa 0.03%7 291 GPa No Yielding
GAOE 2 ARS
No Monolith Layer
581 MPa 0.28% 721 GPa 305
GAOE 3 Oxi. 202 MPa 0.03 % 550 GPa No Yielding
GAOE 4 Oxi. 262 MPa 0.04 % 501 GPa No Yielding
Peak Load Burst Strength
GACE 2 ARS 1641 N 37.1 MPa
GACE 3 Oxi. 1490 N 33.7 MPa
GACE 6 ARS 1428 N 32.3 MPa
GACE 4 Oxi. 972 N 22.0 MPa
For the determination of the stress, the elastic modulus of the monolith layer was assumed to be
unchanged from the as‐received samples, but the elastic modulus of the fiber region was iterated upon
until it converged with the measured elastic modulus. The resulting fiber region converged elastic
moduli are also presented in Table 25.
The fibers were not observed to yield and therefore fiber yield stress is not tabulated. The monolith
layer failure hoop stress was very similar for all Westinghouse as‐received samples. For these samples,
the monolith failed at a hoop stress of between 240 and 270 MPa. However, because all the
Westinghouse oxidized samples experienced fiber region failure immediately upon monolith failure the
precise fiber region failure hoop stress cannot be ascertained (because the mechanical model changes
6 Estimated value based on strain data gathered prior to sample failure 7 Estimated value based on strain data gathered prior to sample failure

69 Draft
from shared‐loading to fiber‐only loading) but was calculated to be greater than 115 MPa and less than
232 MPa, the corresponding hoop stresses for monolith‐fiber and fiber‐only loading respectively at the
instant the monolith failed.
The fiber region failure behavior of the oxidized samples differs markedly from the fiber region failure of
the as‐received samples. This is likely due to the buildup of silica on the fiber region, thus binding the
fibers together and preventing the fibers from gliding and exhibiting pseudo‐ductility. Immediately after
monolith failure, the stress of the fiber region required to contain the internal pressure in the oxidized
samples coupled with the shock of the sudden failure of the monolith layer resulted in sudden failure of
the fiber region without the characteristic pseudo‐ductility observed in the as‐received samples.
Oxidizing the samples causes the fibers to remain bound in the matrix and results in a brittle but non‐
frangible fiber region.
6. DiscussionThe stress calculations rely on the validity of the mechanical model outlined previously. Therefore, as
outlined in the as‐received section, assumptions are made regarding the monolith‐fiber interface and
mechanical properties of the monolith and fiber regions.
An important aspect of the calculation of the stresses of the oxidized samples is knowledge of the elastic
modulus for the fibers and for the monolith. The stress distribution is dependent on the elastic moduli
for the different layers in the sample. For the as‐received samples and quenched samples, the elastic
modulus of the fiber region was measured from the stress‐strain curves and, corresponded well with
published data (3), was used in the mechanical model along with the published modulus for the
monolith (4). However, because the stress‐strain behavior for the oxidized samples is markedly different
from the behavior of as‐received and quenched samples, the elastic moduli for the monolith and fiber
regions were unknown. For calculation of the stresses, the elastic modulus for the monolith layer was
assumed to be unchanged from the as‐received elastic moduli. To validate this assumption, pure
monolith elastic modulus was measured on as‐received and oxidized samples. No change in the modulus
was observed. However, the elastic modulus of the fiber region was iterated until it converged with the
measured elastic modulus of the fiber region.
Because only one sample in each Westinghouse series (196, 198, and 200), only two samples in the
GAOE series, and only one sample in each GACE series were oxidized, there are too few samples to
provide meaningful statistics on the distribution of true population as‐received mechanical properties.
Only by testing more samples could the population’s true distribution of mechanical properties be
determined. However, oxidation does appear to have a significant impact on the mechanical properties
of all of the sample series except the GACE‐A endplug joint strength.

70 Draft
VI. SeriesComparison
1. Series196Table 26: Mechanical results for series 196
Monolith Failure Fiber Failure Failure Plenum
Pressure
ID Hoop Stress
OD Hoop Strain
ID Yield Hoop Stress
ID Ultimate Hoop Stress
OD Ultimate Hoop Strain
Monolith (Total)
As‐Received 1 Sample Tested
249 MPa No Data 109 – 161
MPa 267 MPa No Data 64 (107) MPa
Quenched 2 Samples Tested
200 MPa8
No Data 88 – 129 MPa8
270 MPa8 No Data 51 (106) MPa
Oxidized 1 Sample Tested
183 MPa No Data No
Yielding 78 – 120 MPa
No Data 49 (49) MPa
2. Series198Table 27: Mechanical results for series 198
Monolith Failure Fiber Failure Failure Plenum Pressure
ID Hoop Stress
OD Hoop Strain
ID Yield Hoop Stress
ID Ultimate Hoop Stress
OD Ultimate Hoop Strain
Monolith (Total)
As‐Received 1 Sample Tested
267 MPa No Data No
Yielding 115 – 231
MPa No Data 54 (54) MPa
Quenched 2 Samples Tested
2368 No Data No
Yielding 151 ‐ 262 MPa8
No Data 62 (62) MPa
Oxidized 1 Sample Tested
192 MPa 0.02% No
Yielding 83 – 169 MPa
0.02% 39 (39) MPa
8 Value based on average of all quenched samples in series
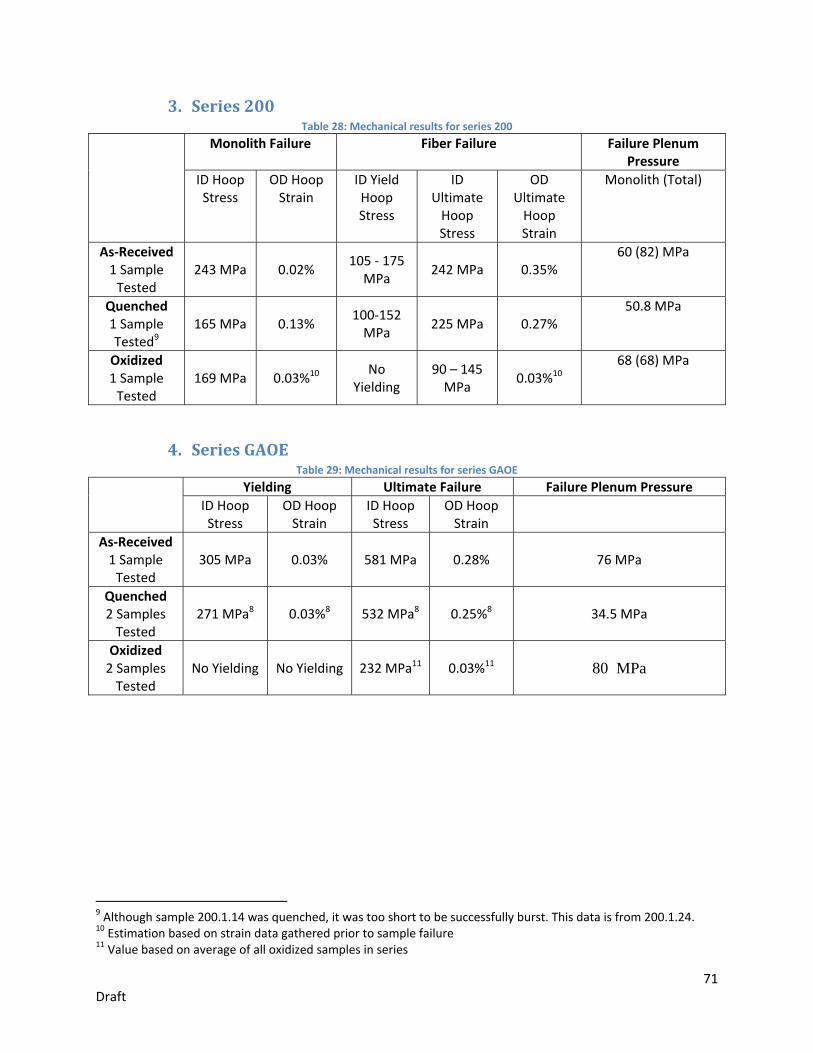
71 Draft
3. Series200Table 28: Mechanical results for series 200
Monolith Failure Fiber Failure Failure Plenum Pressure
ID Hoop Stress
OD Hoop Strain
ID Yield Hoop Stress
ID Ultimate Hoop Stress
OD Ultimate Hoop Strain
Monolith (Total)
As‐Received 1 Sample Tested
243 MPa 0.02% 105 ‐ 175 MPa
242 MPa 0.35% 60 (82) MPa
Quenched 1 Sample Tested9
165 MPa 0.13% 100‐152 MPa
225 MPa 0.27% 50.8 MPa
Oxidized 1 Sample Tested
169 MPa 0.03%10 No
Yielding 90 – 145 MPa
0.03%10 68 (68) MPa
4. SeriesGAOETable 29: Mechanical results for series GAOE
Yielding Ultimate Failure Failure Plenum Pressure
ID Hoop Stress
OD Hoop Strain
ID Hoop Stress
OD Hoop Strain
As‐Received 1 Sample Tested
305 MPa 0.03% 581 MPa 0.28% 76 MPa
Quenched 2 Samples Tested
271 MPa8 0.03%8 532 MPa8 0.25%8 34.5 MPa
Oxidized 2 Samples Tested
No Yielding No Yielding 232 MPa11 0.03%11 80 MPa
9 Although sample 200.1.14 was quenched, it was too short to be successfully burst. This data is from 200.1.24. 10 Estimation based on strain data gathered prior to sample failure 11 Value based on average of all oxidized samples in series

72 Draft
5. SeriesGACE‐ATable 30: Mechanical results for series GACE‐A
Peak Load Burst Strength
As‐Received 1 Sample Tested
1641 N 37.1 MPa
Quenched 1 Sample Tested
1513 N 34.2 MPa
Oxidized 1 Sample Tested
1490 N 33.7 MPa
6. SeriesGACE‐BTable 31: Mechanical results for series GACE‐B
Peak Load Burst Strength
As‐Received 1 Sample Tested
1428 N 32.3 MPa
Quenched 2 Sample Tested
468 N 10.6 MPa
Oxidized 1 Sample Tested
972 N 22.0 MPa
7. OverallTable 32 presents the comparison of the mechanical properties between the different series tested.
From the results, the monolith failure strength was observed to decrease during quenching, although
there is variation in the exact decrease in failure stress. However, the monolith was observed to weaken
by approximately 30% during the oxidation testing. Similarly, there is variation in the effect of the
quenching on the fiber failure strength, although the fibers were observed to weaken by approximately
60% during oxidation (except for series 198 where the fibers weakened by approximately 30%).
Performance of the endplug was observed to be dependent on sample architecture, with GACE‐A series
being more resistant to the corrosion tests than the GACE‐B series.

73 Draft
Table 32: Comparison of Results between Series
Series 196 Series 198 Series 200 GAOE Monolith
Ultimate Failure Hoop Stress12
249 MPa 267 MPa 243 MPa ‐
Reduction in Strength, Quench13
‐20% ‐12% ‐22% ‐
Reduction in Strength, Oxidation14
‐27% ‐28% ‐30% ‐
Fiber
Ultimate Failure Hoop Stress12
267 MPa 115 to 231 MPa 242 MPa 581 MPa
Reduction in Strength, Quench13
+1% +13% to +31% ‐11% ‐8%
Reduction in Strength, Oxidation14
‐55% to ‐71% ‐28% ‐40% to ‐63% ‐60%
GACE‐A GACE‐B
Endplug Joint Burst Strength12
37.1 MPa 32.3 MPa
Reduction in Strength, Quench
‐8% ‐78%
Reduction in Strength, Oxidation
‐9% ‐32%
Figure 57 presents the observed monolith ultimate failure stresses for the three Westinghouse sample
series. Both quenching and oxidation were observed to decrease the monolith failure stress. Note the
GA samples are not shown because they do not have an inner monolith layer.
Figure 57: Comparison of monolith failure stress
12 For as‐received sample 13 Value based on average of all quenched samples in series 14 Value based on average of all oxidized samples in series
0
50
100
150
200
250
300
Series 196 Series 198 Series 200
Monolith Failure Stress (MPa)
As‐Received Quench Oxidation
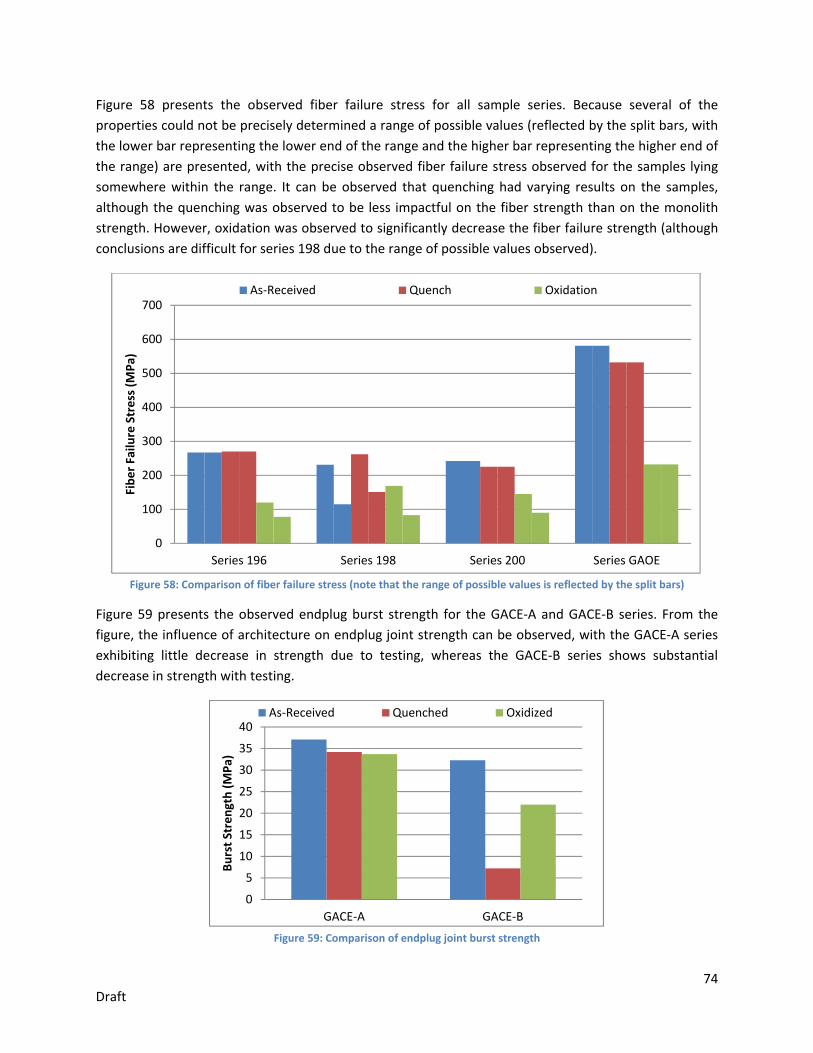
74 Draft
Figure 58 presents the observed fiber failure stress for all sample series. Because several of the
properties could not be precisely determined a range of possible values (reflected by the split bars, with
the lower bar representing the lower end of the range and the higher bar representing the higher end of
the range) are presented, with the precise observed fiber failure stress observed for the samples lying
somewhere within the range. It can be observed that quenching had varying results on the samples,
although the quenching was observed to be less impactful on the fiber strength than on the monolith
strength. However, oxidation was observed to significantly decrease the fiber failure strength (although
conclusions are difficult for series 198 due to the range of possible values observed).
Figure 58: Comparison of fiber failure stress (note that the range of possible values is reflected by the split bars)
Figure 59 presents the observed endplug burst strength for the GACE‐A and GACE‐B series. From the
figure, the influence of architecture on endplug joint strength can be observed, with the GACE‐A series
exhibiting little decrease in strength due to testing, whereas the GACE‐B series shows substantial
decrease in strength with testing.
Figure 59: Comparison of endplug joint burst strength
0
100
200
300
400
500
600
700
Series 196 Series 198 Series 200 Series GAOE
Fiber Failu
re Stress (MPa)
As‐Received Quench Oxidation
0
5
10
15
20
25
30
35
40
GACE‐A GACE‐B
Burst Strength (MPa)
As‐Received Quenched Oxidized
75 Draft
VII. ConclusionThe preliminary results presented in this study do not involve irradiation. Therefore, no definitive
conclusion can be drawn yet regarding the potential of SiC/SiC composites for nuclear fuel cladding. It
must also be noted that these conclusions are being drawn on a limited number of samples, typically
one or two per test condition. Additionally, differences in sample fabrication could also be influencing
the results.
1. As‐ReceivedAnalysisThe behavior of the as‐received samples fall into two categories: the behavior observed in the
Westinghouse and the behavior observed in the GAOE samples. For all of the Westinghouse samples,
the inner monolith layer failed for similar stresses (around 250 MPa) while the CMC layer failed below
270 MPa (Table 33). However variation was observed in the behavior of the CMC layer: sample 198 –
because of its geometry‐ experienced stresses in the fiber region sufficient to result in the simultaneous
failure of both the fiber layer and the inner monolith, whereas series 196 and 200 layers had more de‐
correlated fiber and monolith failure behavior. In that sense, series 198 didn’t exhibit any pseudo‐
ductility while series 196 had the closest behavior to a fiber‐only specimen. The differences observed
between the three series are more attributable to the differences in the samples’ dimensions rather
than the differences in design, and all three series fall under the same general behavioral category; with
the monoliths failing at a similar stress. Because hermeticity is lost when the inner monolith breaks, the
inner monolith failure should be seen as a critical event that decreases the performance of such
samples. However, the failure resulting in a single crack allows for maintaining a coolable geometry.
Series GAOE was observed to be much stronger than the Westinghouse series. Sample GAOE 2 reached
more than twice the failure stress of the Westinghouse samples and the fibers yielded at 300 MPa,
compared to around 150MPa for the Westinghouse samples. However, as the GAOE 2 failure was
characterized by the detachment of relatively large fiber fragments, its failure mode is not compatible
with the conditions of a primary coolant loop because debris would be released into the core which
might block coolant channels.
Both as‐received endplug joint tests revealed similar burst strengths of slightly more than 30 MPa.
Withstanding such a plenum pressure seems satisfactory looking at the current 14 MPa plenum pressure
limit. However, since fuel temperature will be higher with SiC cladding (lower thermal conductivity than
Zr, no creep to close the fuel‐cladding gap and radial selling emphasizing this gap), fuel rods will likely be
expected to withstand higher pressures, making the endplug join a central question.

76 Draft
Table 33: As‐Received Sum up Mechanical Table
Monolith Layer Fiber Layer
As‐Received Sample
ID Failure Hoop Stress
Sample OD Hoop Strain At Event
ID Failure Hoop Stress
Sample OD Hoop Strain At Event
Fiber ID Yield Stress
196.1.27 249 MPa No Data 267 MPa No Data 109 – 161 MPa
198.1.24 267 MPa No Data 115 ‐ 232 MPa
No Data 115 – 231 MPa
200.1.25 243 MPa 0.0224 % 242 MPa 0.35 % 105 – 175 MPa
GAOE 2 No Inner Monolith 581 MPa 0.28% 305 MPa
Peak Load Burst Strength
GACE 2 1641 N 37.1 MPa
GACE 6 1428 N 32.3 MPa
2. InfluenceofQuenchingAll samples that underwent thermal shock survived, even when harsher conditions were tested (90°C
water). In particular, no quench‐induced micro cracks could be detected during the SEM analysis.
Moreover, non‐frangible failure mode was still observed which satisfies the NRC requirement of
maintaining coolable rod geometry.
The lack of repetition of the tests prevents definitive conclusions on the impact of quenching on the
monolith and CMC layer failure hoop stress. However, from the samples that were tested, fiber yield
stress was observed to decrease by 10‐20% with quenching whereas the failure hoop stress was
observed to be more stable. From the stress‐strain curves in Section IV, quenching appears to have a
slight impact on the overall mechanical behavior of the samples.
The design of the GAOE series seems more promising as the failure stress of the fiber region was around
twice that of the strongest of the Westinghouse design. The series also exhibits a more predictable
behavior with quenching and would allow for more confidence in potential predictive models. However,
the GAOE fragmentation failure mode would potentially release debris in the primary coolant loop,
possibly restricting subchannel flow.
The endplug joint strength in the GACE‐A series was not observed to be significantly affected by the
quenching. However, the endplug joint strength in the GACE‐B series was observed to decrease by 78%
and 55 % after quenching. This suggests that architecture may have an important influence on the
resilience of the endplug joint.
Because only one as‐received and two quench sample in each Westinghouse series (196, 198, and 200),
only two samples in the GAOE series, and only one sample in each GACE series were tested both as‐
received and quenched, there are too few samples to provide meaningful statistics on the distribution of
mechanical properties. Only by testing more samples could the population’s true distribution of
mechanical properties be determined.

77 Draft
Table 34: Thermal Shock Summary table
Monolith Layer Fiber Layer
Sample Water Temp
.
ID Failure Hoop Stress
Sample OD Hoop Strain At Event
ID Failure Hoop Stress
Sample OD Hoop Strain At Event
Elastic Modulus
Fiber ID Yield Stress (MPa)
196.1.27 ARS 249 MPa No Data 267 MPa No Data No Data 109 – 161
196.1.20 100°C 193 MPa No Data 279 MPa No Data No Data 85‐124
196.1.26 90°C 207 MPa No Data 260 MPa No Data No Data 91‐133
198.1.24 ARS 267 MPa No Data 115‐232 MPa No Data No Data No
Yielding
198.1.23 100°C 305 MPa No Data 134‐232 MPa No Data No Data No
Yielding
198.1.1615
90°C 167 MPa No Data 167‐292 MPa No Data No Data No
Yielding
200.1.25 ARS 243 MPa 0.02% 242 MPa 0.35% 201 GPa 105 – 175
200.1.24 100°C 165 MPa 0.02% 226 MPa 0.27% 300 GPa 100‐152
200.1.1416
90°C 215 MPa No Data No Data No Data No Data No Data
GAOE 2 ARS
No Inner Monolith
581 MPa 0.28% 721 GPa 305
GAOE 5 100°C 572 MPa 0.30% 612 GPa 266
GAOE 6 90°C 492 MPa 0.19% 1174 GPa 276
Peak Load Burst Strength
GACE 2 ARS 1641 N 37.1 MPa
GACE 1 100°C 1513 N 34.2 MPa
GACE 6 ARS 1428 N 32.3 MPa
GACE 5 100°C 318 N 7.2 MPa
GACE 8 100°C 617 N 14.0 MPa
15 Sample 198.1.16 was very short and didn’t contain a complete weave pattern unit cell. Therefore, significance of the result is questionable. 16Sample 200.1.14 was very short and didn’t contain a complete weave pattern unit cell. Therefore, significance of the result is questionable.
78 Draft
3. InfluenceofOxidationOxidation was shown to result in the formation of silica on the exterior surfaces of the specimens and
also in the inner voids of the CMC (as has been shown on the optical and SEM images). As a result, a
normalized weight change from 0 to 0.7 mg/cm2 (likely depending on sample porosity) was observed.
This chemical change reduced the hoop stress of the monolith layer for the Westinghouse samples from
around 250 MPa for the as‐received samples to roughly 180MPa after oxidation. Still, those
performances largely surpass those of actual Zr cladding under oxidation. Moreover, coolable geometry
is still guaranteed after oxidation.
Additionally, all the Westinghouse oxidized samples experienced fiber region failure immediately upon
monolith failure. The precise fiber failure hoop stress cannot be measured (due to the simultaneous
failure of the monolith) but the two models previously described (monolith‐fiber and fiber‐only
loadings) give respectively minimum and maximum estimations of this hoop stress. Table 35 reports
those values and shows a drop in strength of up to a 60%. Because the CMC failed right after the inner
monolith, no yielding is observed. Similarly, whereas the as‐received 196, 200 and GAOE series samples
would experience up to 0.3% strain at failure, after oxidation only a 0.03% strain at failure was observed.
The absence of pure fiber region loading is likely due to the buildup of silica on the fiber matrix
interface, thus binding the fibers and preventing the fibers from gliding and exhibiting pseudo‐ductility.
Immediately after monolith failure, the stress of the fiber region required to contain the internal
pressure in the oxidized samples coupled with the shock of the sudden failure of the monolith layer
resulted in sudden failure of the fiber region without the characteristic pseudo‐ductility observed in the
as‐received samples. Oxidizing the samples caused the fibers to remain bound in the matrix and resulted
in a brittle fiber region.
The endplug joint strength testing revealed that sample architecture has an impact on the corrosion
resistance of the joint. The GACE‐A series showed little decrease in the strength of the joint due to
oxidation, whereas the GACE‐B series showed significant weakening of the joint due to oxidation.
Because only one sample in each Westinghouse series (196, 198, and 200), only two samples in the
GAOE series, and only one sample in each GACE series were tested both as‐received and oxidized, there
are too few samples to provide meaningful statistics on the distribution of mechanical properties. Only
by testing more samples could the population’s true distribution of mechanical properties be
determined.
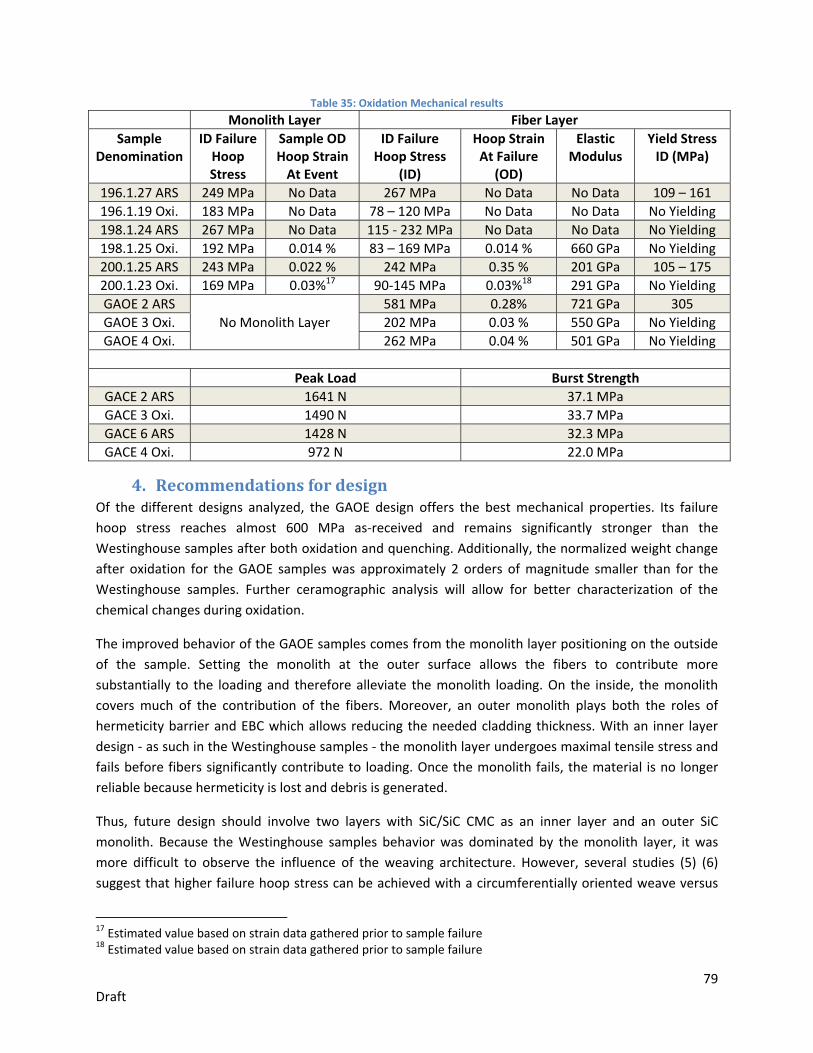
79 Draft
Table 35: Oxidation Mechanical results
Monolith Layer Fiber Layer
Sample Denomination
ID Failure Hoop Stress
Sample OD Hoop Strain At Event
ID Failure Hoop Stress
(ID)
Hoop Strain At Failure
(OD)
Elastic Modulus
Yield Stress ID (MPa)
196.1.27 ARS 249 MPa No Data 267 MPa No Data No Data 109 – 161
196.1.19 Oxi. 183 MPa No Data 78 – 120 MPa No Data No Data No Yielding
198.1.24 ARS 267 MPa No Data 115 ‐ 232 MPa No Data No Data No Yielding
198.1.25 Oxi. 192 MPa 0.014 % 83 – 169 MPa 0.014 % 660 GPa No Yielding
200.1.25 ARS 243 MPa 0.022 % 242 MPa 0.35 % 201 GPa 105 – 175
200.1.23 Oxi. 169 MPa 0.03%17 90‐145 MPa 0.03%18 291 GPa No Yielding
GAOE 2 ARS
No Monolith Layer
581 MPa 0.28% 721 GPa 305
GAOE 3 Oxi. 202 MPa 0.03 % 550 GPa No Yielding
GAOE 4 Oxi. 262 MPa 0.04 % 501 GPa No Yielding
Peak Load Burst Strength
GACE 2 ARS 1641 N 37.1 MPa
GACE 3 Oxi. 1490 N 33.7 MPa
GACE 6 ARS 1428 N 32.3 MPa
GACE 4 Oxi. 972 N 22.0 MPa
4. RecommendationsfordesignOf the different designs analyzed, the GAOE design offers the best mechanical properties. Its failure
hoop stress reaches almost 600 MPa as‐received and remains significantly stronger than the
Westinghouse samples after both oxidation and quenching. Additionally, the normalized weight change
after oxidation for the GAOE samples was approximately 2 orders of magnitude smaller than for the
Westinghouse samples. Further ceramographic analysis will allow for better characterization of the
chemical changes during oxidation.
The improved behavior of the GAOE samples comes from the monolith layer positioning on the outside
of the sample. Setting the monolith at the outer surface allows the fibers to contribute more
substantially to the loading and therefore alleviate the monolith loading. On the inside, the monolith
covers much of the contribution of the fibers. Moreover, an outer monolith plays both the roles of
hermeticity barrier and EBC which allows reducing the needed cladding thickness. With an inner layer
design ‐ as such in the Westinghouse samples ‐ the monolith layer undergoes maximal tensile stress and
fails before fibers significantly contribute to loading. Once the monolith fails, the material is no longer
reliable because hermeticity is lost and debris is generated.
Thus, future design should involve two layers with SiC/SiC CMC as an inner layer and an outer SiC
monolith. Because the Westinghouse samples behavior was dominated by the monolith layer, it was
more difficult to observe the influence of the weaving architecture. However, several studies (5) (6)
suggest that higher failure hoop stress can be achieved with a circumferentially oriented weave versus
17 Estimated value based on strain data gathered prior to sample failure 18 Estimated value based on strain data gathered prior to sample failure
80 Draft
an axial weave. Therefore, a plain weave pattern with a 60°‐70° angle from the axial direction is
suggested. However, axial tows would allow the tubing and the joint to withstand higher axial stress, so
more investigation would need to be performed on the axial strength of the tubing and the joint to
identify an optimal architecture.
Endplug joint testing revealed that the endplug joint fails at an internal pressure far lower than that
which was observed to cause failure of the open‐ended samples. This suggests that the endplug could
be the weakest part of the SiC cladding and that the joint strength should be enhanced. Furthermore,
because architecture was observed to influence the joint strength, more architectures should be
investigated to determine the best weave pattern for endplug joint performance.
81 Draft
VIII. Bibliography1. Lee, Y., McKrell, T. and Kazimi, M. Safety of Light Water Reactor Fuel with Silicon Carbide Cladding.
Cambridge : CANES, 2014. MIT‐ANP‐TR‐150.
2. Fabrication and characterization of joined silicon carbide cylindrical components for nuclear
applications. Khalifa, H., C. Deck, O. Gutierrez, G. Jacobsen, and C. Back. s.l. : Journal of Nuclear
Materials, 2014, Vol. 457, pp. 227‐240.
3. Shinavski, R., Katoh, Y. and Snead, L. Mechanical, Thermal and Electrical Properties of Nuclear Graded
Silicon Carbide Composites. Oak Ridge, Tennessee : Oak Ridge National Laboratory, 2008. pp. 14‐18.
DOE‐ER‐0313/44 .
4. Handbook of SiC properties for fuel performance modeling. Snead, L. L., Nozawa, T., Katoh, Y., Byun,
T.‐S., Kondo, S., & Petti, D. A. s.l. : Journal of Nuclear Materials, 2007, Vol. 371.
5. Fabrication and measurement of hoop strength of SiC triplex tube for nuclear fuel cladding
applications. D. Kim, , HG. Lee, JY Park, WJ. Kim. s.l. : Journal of Nuclear Materials, 2015, Vol. 458.
6. Ingluence of winding angle on the strength and deformation of filament‐wound composite tubes
subjected to uniaxial and biaxial loads. P. D. Soden, R. Kitching, P. C. Tse, Y. Tsavalas. Manchester :
Composites Science and Technology, 1993.