Embed Size (px)
Citation preview

Farm Service Agency Final Report Organizational Assessment
Page 2 of 105 May 30, 2008
APPENDIX 1: STRATEGIC HUMAN CAPITAL MANAGEMENT REPORTS 1. WORKFORCE PROFILE The Workforce Profile includes a variety of demographic and trend data regarding the Farm Service Agency (FSA) workforce to serve as a starting point for identifying skills gaps and possible solutions for these workforce planning challenges. This section includes two primary analyses:
A. Current Workforce Profile: The current FSA workforce was examined for the following categories: Workforce Dispersion, Work Status, Appointment Type, Supervisory Status, Grade Dispersion, Age, Gender, and Race & National Origin (RNO).
B. Staffing Trends and Five-Year Projection Models: This section provides the following trends and forecasting information: Staffing Level Trends, Separation Trends, and Retirement Trends and Projections.
Data used to analyze the FSA workforce were provided by the Human Resources Division. Workforce demographics were analyzed using a dataset recent as of January 2008. Workforce trends were analyzed using a dataset recent as of September 2007. This dataset includes FY 2002-2007 employee information, updated at the end of each fiscal year. Finally, separation trends, accession trends, and retirement projections were determined using a dataset recent as of January 2008. For each of the categories, specific focus was given to:
• The FSA workforce as a whole, as compared to the USDA workforce and the Federal government workforce
• The Office of the Administrator (OA) and each of the FSA deputy areas: Deputy Administrator for Commodity Operations (DACO), Deputy Administrator for Field Operations (DAFO), Deputy Administrator for Farm Loan Programs (DAFLP), Deputy Administrator for Farm Programs (DAFP), and Deputy Administrator for Management (DAM)
• Individual offices or divisions of interest to the Organizational Assessment: Information Technology Services Division (ITSD), Human Resources Division (HRD), Office of Budget and Finance (OBF), Office of Business and Program Integration (OBPI), and the State Offices (STO)
• Mission Critical Occupations (MCOs), with specific attention to those with the most employees: Program Technicians (1101), Agricultural Program Specialists (1145), Loan Specialists (1165), and Information Technology (IT) Specialists (2210)
• Metropolitan areas with the largest FSA populations: Washington, DC metro area; Kansas City, MO; St. Louis, MO; and Salt Lake City, UT

Farm Service Agency Final Report Organizational Assessment
Page 3 of 105 May 30, 2008
1.1. Current Workforce Profile
This section provides an overview of the current FSA federal employee workforce profile (not including the contractor workforce):
• Workforce Dispersion • Work Status • Appointment Type • Grade Dispersion
• Age • Gender • Race & National Origin (RNO) • Supervisory Status
As of February 1, 2008, FSA has 5,079 employees which are geographically dispersed in five major business units throughout the United States. FSA employs an additional 8,000+ people in the County offices, but these are not federal employees and are thus beyond the scope of this study. The largest business unit is DAFO, with 3,474 employees, most of which are located in state offices. Approximately 98% of the FSA federal workforce is full-time permanent. Over the past five years, FSA has been trending towards a smaller overall workforce. There have been a few reorganizations over the past five years which have affected the current state of the FSA workforce. First, the Kansas City Administrative Office was completely dissolved between FY 2005-2007. Additionally, USDA formed the Information Technology Services (ITS) organization in 2004 to serve as an in-house provider of IT service and support for USDA employees. Approximately 160 FSA IT Specialists from state offices, the KC Administration office, and ITSD were moved into USDA ITS at that time. In addition, the DAM organizations of Budget (BD) and Financial Management (FMD) were combined in FY 2007 and moved into the Office of the Administrator and renamed the Office of Budget and Finance (OBF). FSA has employees in 73 different occupational series, with ten different occupations designated as MCOs. Approximately 60% of FSA employees are in the GS-11 to GS-13 grade range and another 30 % are in the GS-5 to GS-10 grade range. The FSA workforce is diverse in terms of gender, with women comprising 55% of the total population and men comprising 45% of the population. The FSA population is primarily comprised of Whites and African Americans, making up 83% and 11% of the workforce, respectively. The average age of a FSA employee is 48.6.

Farm Service Agency Final Report Organizational Assessment
Page 4 of 105 May 30, 2008
1.1.1. Workforce Dispersion A. FSA-Wide FSA ended FY07 with 5,147 employees on board. As shown in the figure below, the total FSA population peaked in 2003 with a total of 5,980 employees, and then steadily declined, resulting in a 14% decrease in overall staff over the past five years. The shrinking population is due to decreases in available funds. The Department of Agriculture overall has received budget cuts over the past five years, although there has only been a 9% decrease in FTE at the Department level.
FSA-Wide Five-Year Population Trend
5520
52255147
59165980
4600
4800
5000
5200
5400
5600
5800
6000
6200
FY 2003 FY 2004 FY 2005 FY 2006 FY 2007
USDA-Wide Five-Year Population Trend
112,084
109,344
105,488104,126
113,155
93,000
98,000
103,000
108,000
113,000
118,000
FY 2003 FY 2004 FY 2005 FY 2006 FY 2007

Farm Service Agency Final Report Organizational Assessment
Page 5 of 105 May 30, 2008
B. Business Unit The FSA workforce is dispersed into six major business units, which reside in a multitude of cities across the United States. These business units include the Office of the Administrator and the five Deputy Areas listed below:
• Office of the Administrator (OA) • Deputy Administrator for Commodity Operations (DACO) • Deputy Administrator for Field Operations (DAFO) • Deputy Administrator for Farm Loan Programs (DAFLP) • Deputy Administrator for Farm Programs (DAFP) • Deputy Administrator for Management (DAM)
The largest business unit is DAFO, comprising approximately 70% of the current workforce. DAFO is comprised of approximately 3,500 employees, most of which are located in state and county offices. In addition to the Deputy Areas, there are five offices/divisions included in the Workforce Profile, as they are included as focus areas in the FSA Organizational Assessment. These include:
• Information Technology Services Division (ITSD): Resides in the Deputy Administrator for Management (DAM) • Human Resources Division (HRD): Resides in the Deputy Administrator for Management (DAM) • Office of Budget and Finance (OBF): Resides in Office of the Administrator (OA) • Office of Business and Program Integration (OBPI): Resides in Office of the Administrator (OA) • State Offices (STO): Reside in the Deputy Administrator for Field Operations (DAFO), with offices in all 51 states (including
Puerto Rico)

Farm Service Agency Final Report Organizational Assessment
Page 6 of 105 May 30, 2008
FSA Population by Deputy Area
9.0%
12.1%
3.4%
1.2%
68.4%
5.8%
0% 10% 20% 30% 40% 50% 60% 70% 80%
OA
DAM
DAFP
DAFLP
DAFO
DACO
FSA Population by Office/Division of Interest
27.3%
0.8%
6.1%
2.8%
7.0%
0% 5% 10% 15% 20% 25% 30% 35%
STO
OBPI
OBF
HRD
ITSD
Farm Service Agency Final Report Organizational Assessment
Page 7 of 105 May 30, 2008
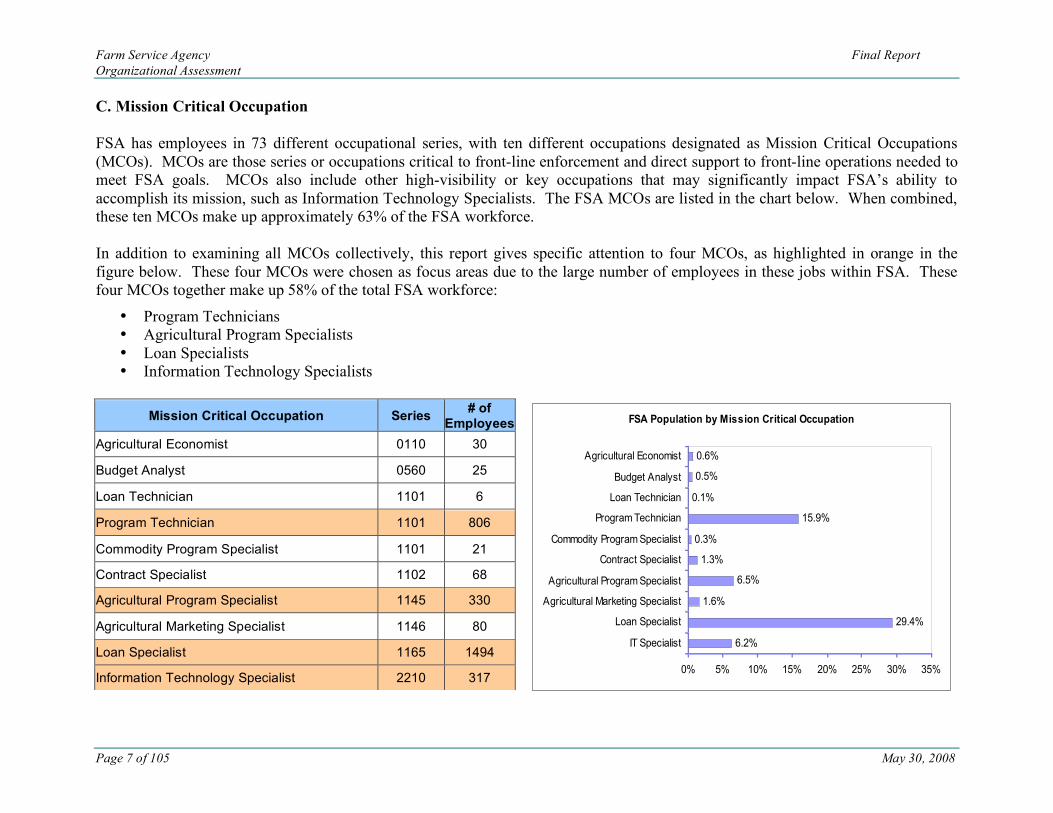
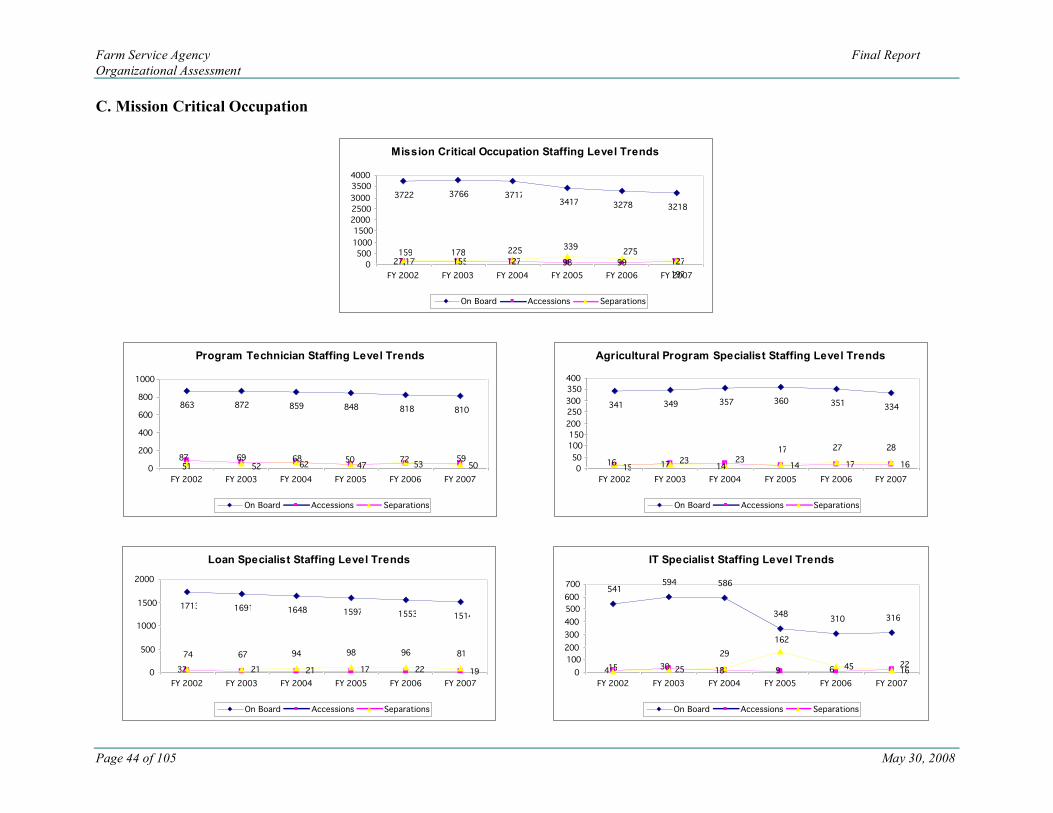
C. Mission Critical Occupation FSA has employees in 73 different occupational series, with ten different occupations designated as Mission Critical Occupations (MCOs). MCOs are those series or occupations critical to front-line enforcement and direct support to front-line operations needed to meet FSA goals. MCOs also include other high-visibility or key occupations that may significantly impact FSA’s ability to accomplish its mission, such as Information Technology Specialists. The FSA MCOs are listed in the chart below. When combined, these ten MCOs make up approximately 63% of the FSA workforce. In addition to examining all MCOs collectively, this report gives specific attention to four MCOs, as highlighted in orange in the figure below. These four MCOs were chosen as focus areas due to the large number of employees in these jobs within FSA. These four MCOs together make up 58% of the total FSA workforce:
• Program Technicians • Agricultural Program Specialists • Loan Specialists • Information Technology Specialists
FSA Population by Mission Critical Occupation
6.2%
29.4%
1.6%
6.5%
1.3%
0.3%
15.9%
0.1%
0.5%
0.6%
0% 5% 10% 15% 20% 25% 30% 35%
IT Specialist
Loan Specialist
Agricultural Marketing Specialist
Agricultural Program Specialist
Contract Specialist
Commodity Program Specialist
Program Technician
Loan Technician
Budget Analyst
Agricultural Economist
Mission Critical Occupation Series # of Employees
Agricultural Economist 0110 30
Budget Analyst 0560 25
Loan Technician 1101 6
Program Technician 1101 806
Commodity Program Specialist 1101 21
Contract Specialist 1102 68
Agricultural Program Specialist 1145 330
Agricultural Marketing Specialist 1146 80
Loan Specialist 1165 1494
Information Technology Specialist 2210 317

Farm Service Agency Final Report Organizational Assessment
Page 8 of 105 May 30, 2008
D. Metropolitan Area Thirty one percent of FSA’s total population resides in four major U.S. metropolitan areas. Below are the raw numbers of employees located in those areas.
FSA Population by Metropolitan Area
602
771
103
82
0 200 400 600 800 1000
Washington DC
Area
Kansas City
St. Louis
Salt Lake City
1.1.2. Work Status As shown in the figure below, approximately 98% of the FSA federal workforce is full-time permanent, with the other 2% split between part-time permanent and full-time temporary. These ratios have not changed over the last five years.
FSA-Wide Work Status for FY07
Permanent
Full-Time
98%
Permanent
Part-Time
1%
Temporary
Full-Time
1%

Farm Service Agency Final Report Organizational Assessment
Page 9 of 105 May 30, 2008
1.1.3. Appointment Type As shown in the figure below, approximately 96% of the FSA federal workforce was appointed to the competitive service, and 4% was appointed to the excepted service. These ratios have not changed over the last five years.
FSA-Wide Appointment Type
Excepted
6%
Competitiv e
94%
1.1.4. Supervisory Status
A. FSA-Wide Approximately 25% of FSA employees are classified as Supervisors. The number of supervisors has increased slightly over the last five years, while the number of non-supervisors has decreased slightly in this time period.
FSA-Wide Supervisory Status Trend
78.2% 78.3% 76.8% 76.6% 76.5%
23.5%23.4%23.2%21.7%21.8%0%
20%
40%
60%
80%
100%
FY 2003 FY 2004 FY 2005 FY 2006 FY 2007
Nonsupervisory Supervisory
FSA-Wide Supervisory Status
Non-supervisory 75.5%
Supervisory 24.5
%

Farm Service Agency Final Report Organizational Assessment
Page 10 of 105 May 30, 2008
B. Business Unit The ratio of supervisors to non-supervisors differs slightly between FSA business units. All Deputy Areas except for DAFO are below the FSA average for percentage of supervisors. DAFO is above the FSA average, as 30% of their positions are supervisory. This high supervisory ratio in DAFO can be attributed to the State Offices, where 36% of the positions are supervisory. This is most likely due to the fact that in each state office, there may only be a few employees. As each of these locations will have at least one supervisor to manage the staff there, the supervisor-employee ratio may be very high in some locations. Since DAFO makes up the majority of the organization, this supervisory ratio skews the average of the rest of the organization. When DAFO is not included in this analysis, the FSA average of supervisory positions is 13%. OBPI and DAFLP have a relatively high amount of supervisors, with 20% and 18%, respectively. HRD, on the other hand, has the lowest supervisor-employee ratio, with only 9% of their positions as supervisory.
Supervisory Status by Deputy Area
89.4%
70.1%
82.1%86.0% 87.6%
84.4%
10.6%
29.9%
17.9%14.0%
12.4%15.6%
0%
20%
40%
60%
80%
100%
DACO DAFO DAFLP DAFP DAM OA
Nonsupervisory Supervisory
Supervisory Status by Office/Division of Interest
88.0% 86.2%79.7%
64.4%
90.8%
20.3%13.8%
9.2%12.0%
35.6%
0%
20%
40%
60%
80%
100%
ITSD HRD OBF OBPI STO
Nonsupervisory Supervisory
Farm Service Agency Final Report Organizational Assessment
Page 11 of 105 May 30, 2008
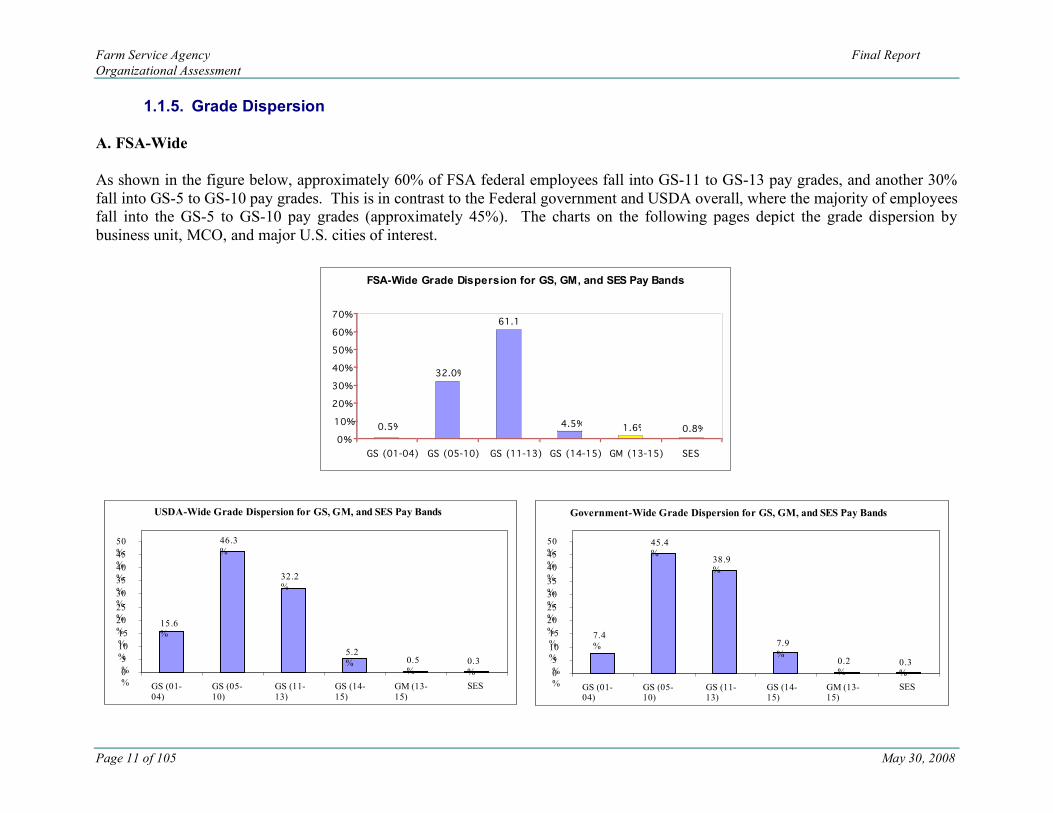
1.1.5. Grade Dispersion A. FSA-Wide As shown in the figure below, approximately 60% of FSA federal employees fall into GS-11 to GS-13 pay grades, and another 30% fall into GS-5 to GS-10 pay grades. This is in contrast to the Federal government and USDA overall, where the majority of employees fall into the GS-5 to GS-10 pay grades (approximately 45%). The charts on the following pages depict the grade dispersion by business unit, MCO, and major U.S. cities of interest.
FSA-Wide Grade Dispersion for GS, GM, and SES Pay Bands
0.8%1.6%4.5%
61.1%
0.5%
32.0%
0%
10%
20%
30%
40%
50%
60%
70%
GS (01-04) GS (05-10) GS (11-13) GS (14-15) GM (13-15) SES
USDA-Wide Grade Dispersion for GS, GM, and SES Pay Bands
0.3%
0.5%
5.2%
32.2%
15.6%
46.3%
0% 5%
10% 15% 20% 25% 30% 35% 40% 45% 50%
GS (01-04)
GS (05-10)
GS (11-13)
GS (14-15)
GM (13-15)
SES
Government-Wide Grade Dispersion for GS, GM, and SES Pay Bands
45.4%
7.4%
38.9%
7.9%
0.2% 0.3
% 0% 5%
10% 15% 20% 25% 30% 35% 40% 45% 50%
GS (01-04) GS (05-
10) GS (11-13) GS (14-
15) GM (13-15)
SES

Farm Service Agency Final Report Organizational Assessment
Page 12 of 105 May 30, 2008
B.1. Business Unit- Deputy Area For most Deputy Areas, the majority of employees fall into GS 11-13 pay grades, with the second highest percentage of employees falling in the GS 05-10 pay grades. DAFP has a higher percentage of GS 14-15’s than the other business units, with 21%.
DAFLP Grade Dispersion for GS, GM, and SES Pay Bands
0.0%
15.9%
58.7%
12.7% 9.5
% 3.2% 0
%
10% 20%
30% 40%
50% 60%
70%
GS (01-04)
GS (05-10)
GS (11-13)
GS (14-15)
GM (13-15)
SES
DAFP Grade Dispersion for GS, GM, and SES Pay Bands
1.7%
0.6%
21.1%
46.3%
30.3%
0.0% 0
%
10%
20%
30%
40%
50%
GS (01-04)
GS (05-10)
GS (11-13)
GS (14-15)
GM (13-15)
SES
DACO Grade Dispersion for GS, GM, and SES Pay Bands
0.7%
3.0%
6.1%
68.9%
20.9%
0.3% 0
% 10% 20% 30% 40% 50% 60% 70% 80%
GS (01-04) GS (05-
10) GS (11-13) GS (14-
15) GM (13-15)
SES
DAFO Grade Dispersion for GS, GM, and SES Pay Bands
0.5%
36.5%
59.7%
1.7% 1.6
% 0.0% 0
%
10%
20% 30% 40% 50%
60%
70%
GS (01-04)
GS (05-10)
GS (11-13)
GS (14-15)
GM (13-15)
SES

Farm Service Agency Final Report Organizational Assessment
Page 13 of 105 May 30, 2008
OA Grade Dispersion for GS, GM, and SES Pay Bands
0.2%
24.3%
56.4%
15.8%
2.2% 1.1%
0%
10%
20%
30%
40%
50%
60%
GS (01-04) GS (05-10) GS (11-13)GS (14-15) GM (13-15) SES
B.2. Business Unit- Division/Office of Interest The divisions/offices of interest are similar in terms of grade make-up, with roughly 60% of employees falling into GS 11-13 pay grades and 33% of employees falling in the GS 05-10 pay grades. ITSD has a very large number of GS 11-13 employees, with 83% falling into this category. OBPI has a higher percentage of GS 14-15 positions and GM positions than the other business units, with 33% and 5%, respectively.
ITSD Grade Dispersion for GS, GM, and SES Pay Bands
0.3%0.6%6.5%
83.4%
8.7%0.6%
0%
20%
40%
60%
80%
100%
GS (01-04) GS (05-10) GS (11-13)GS (14-15)GM (13-15) SES
HRD Grade Dispersion for GS, GM, and SES Pay Bands
0.0%0.0%6.4%
59.3%
33.6%
0.7%
0%
10%
20%
30%
40%
50%
60%
70%
GS (01-04) GS (05-10) GS (11-13) GS (14-15)GM (13-15) SES
DAM Grade Dispersion for GS, GM, and SES Pay Bands
0.3%
6.0%
73.5%
19.5%
0.5% 0.2
% 0%
10% 20% 30% 40% 50% 60% 70% 80%
GS (01-04)
GS (05-10)
GS (11-13)
GS (14-15)
GM (13-15)
SES

Farm Service Agency Final Report Organizational Assessment
Page 14 of 105 May 30, 2008
STO Grade Dispersion for GS, GM, and SES Pay Bands
0.0%3.9%3.7%
65.2%
26.4%
0.8%
0%
10%
20%
30%
40%
50%
60%
70%
GS (01-04) GS (05-10) GS (11-13) GS (14-15) GM (13-15) SES
OBPI Grade Dispersion for GS, GM, and SES Pay Bands
0.0%
5.0%
32.5%
47.5%
15.0%
0.0% 0
%
10%
20%
30%
40%
50%
GS (01-04)
GS (05-10)
GS (11-13)
GS (14-15)
GM (13-15)
SES
OBF Grade Dispersion for GS, GM, and SES Pay Bands
0.3%
1.6%
8.8%
60.1%
29.2%
0.0% 0
% 10% 20% 30% 40% 50% 60% 70%
GS (01-04) GS (05-
10) GS (11-13) GS (14-
15) GM (13-15)
SES

Farm Service Agency Final Report Organizational Assessment
Page 15 of 105 May 30, 2008
C. Mission Critical Occupation For all MCOs combined, the average percentage of GS-11 to GS-13 employees is 66%, and the average percentage of GS-05 to GS-10 employees is 30%. Agricultural Program Specialists, Loan Specialists, and IT Specialists have the vast majority of their staff in the GS-11 to GS-13 range (at least 80%). All Program Technicians, on the other hand, fall in the GS-5 to GS-10 range.
Prog Technician Dispersion for GS, GM, and SES Pay
Bands
100.0%
0.0% 0.0% 0.0% 0.0% 0.0%0%
10%20%30%40%50%60%70%80%90%
100%
GS (01-04) GS (05-10) GS (11-13)GS (14-15)GM (03-15) SES
Ag Prog Specialist Grade Dispersion for GS, GM, and
SES Pay Bands
0.0% 3.9%
81.2%
7.6% 7.3% 0.0%0%
20%
40%
60%
80%
100%
GS (01-04) GS (05-10) GS (11-13) GS (14-15)GM (13-15) SES
Mission Critical Occupation Grade Dispersion for GS, GM and SES Pay Bands
0.0%
1.4%
3.0%
66.0%
29.6%
0.0% 0
% 10% 20% 30% 40% 50% 60% 70%
GS (01-04)
GS (05-10)
GS (11-13)
GS (14-15)
GM (13-15)
SES

Farm Service Agency Final Report Organizational Assessment
Page 16 of 105 May 30, 2008
Loan Specialist Grade Dispersion for GS, GM, and SES
Pay Bands
0.0%6.4%
92.4%
0.5% 0.7% 0.0%0%
20%
40%
60%
80%
100%
GS (01-04) GS (05-10) GS (11-13) GS (14-15)GM (13-15) SES
IT Specialist Grade Dispersion for GS, GM, and SES
Pay Bands
0.0% 1.3%
91.5%
6.3% 0.6% 0.3%0%
20%
40%
60%
80%
100%
GS (01-04) GS (05-10) GS (11-13) GS (14-15)GM (13-15) SES
D. Metropolitan Area When examining grade dispersion by metropolitan area, Kansas City and St. Louis tend to have a similar grade dispersion to that of FSA overall. Most employees in Salt Lake City fall in the GS-5 to GS-10 range at 51%, with the GS-11 to GS-13 range coming in a close second at 46%. The Washington DC area, on the other hand, has a higher majority of employees falling in the GS 14-15 category than the norm, with 23%.
Washington, DC Area Grade Dispersion for GS, GM,
and SES Pay Bands
0.3%
16.9%23.4%
3.0% 2.2%
54.2%
0%
10%
20%
30%
40%
50%
60%
GS (01-04) GS (05-10) GS (11-13)GS (14-15) GM (13-15) SES
Kansas City Grade Dispersion for GS, GM, and SES Pay
Bands
0.4%
22.8%
4.2% 1.4% 0.1%
71.1%
0%
20%
40%
60%
80%
GS (01-04) GS (05-10) GS (11-13)GS (14-15) GM (13-15) SES

Farm Service Agency Final Report Organizational Assessment
Page 17 of 105 May 30, 2008
St. Louis Grade Dispersion for GS, GM, and SES Pay
Bands
0.0%
31.1%
66.0%
2.9% 0.0% 0.0%0%
10%
20%
30%40%
50%
60%
70%
GS (01-04) GS (05-10) GS (11-13)GS (14-15) GM (13-15) SES
Salt Lake City Grade Dispersion for GS, GM, and SES
Pay Bands
0.0%
51.2%46.3%
2.4%0.0% 0.0%
0%
10%
20%
30%
40%
50%
60%
GS (01-04) GS (05-10) GS (11-13)GS (14-15) GM (13-15) SES

Farm Service Agency Final Report Organizational Assessment
Page 18 of 105 May 30, 2008
1.1.6. Age Dispersion A. FSA-Wide At the end of 2007, the average age of the FSA workforce was 46.8 years. FSA employees tend to be older than employees in the Federal government and USDA overall, with 46% of FSA employees over the age of 50 (as opposed to approximately 36% for all others). In addition, only 20% of FSA employees are under the age of 40, where the rest of the government has over 30% of its workforce in this age category. The charts on the following pages depict the average age by business unit, MCO, and major U.S. cities of interest.
FSA-Wide Age Dispersion
11.8%
34.3%
39.0%
6.7%
0.4%
7.6%
0.2%0%
5%
10%
15%
20%
25%
30%
35%
40%
45%
<20 20-29 30-39 40-49 50-59 60-69 70-79
Average Age: 46.8

Farm Service Agency Final Report Organizational Assessment
Page 19 of 105 May 30, 2008
USDA-Wide Age Dispersion
20.0%
29.1%27.2%
6.7%
1.2%
14.8%
1.0%0%
5%
10%
15%
20%
25%
30%
35%
<20 20-29 30-39 40-49 50-59 60-69 70-79
Government-Wide Age Dispersion
20.1%
32.1%
29.3%
7.0%
0.7%
10.3%
0.5%0%
5%
10%
15%
20%
25%
30%
35%
<20 20-29 30-39 40-49 50-59 60-69 70-79

Farm Service Agency Final Report Organizational Assessment
Page 20 of 105 May 30, 2008
B.1. Business Unit- Deputy Area The average age of each Deputy Area does not deviate far from the average age of FSA overall. DACO has a slightly older workforce, with an average of 48.5.
DACO Age Dispersion
8.1%
21.3%
48.3%
10.5%
0.3%
10.5%
1.0%0%
10%
20%
30%
40%
50%
60%
<20 20-29 30-39 40-49 50-59 60-69 70-79
Average Age: 48.5
DAFO Age Dispersion
10.4%
38.5%
6.4%0.5%
8.0%0.1%
36.1%
0%
5%
10%
15%
20%
25%
30%
35%
40%
45%
<20 20-29 30-39 40-49 50-59 60-69 70-79
Average Age: 46.8

Farm Service Agency Final Report Organizational Assessment
Page 21 of 105 May 30, 2008
DAFLP Age Dispersion
0.0%
7.9%11.1%
39.7%36.5%
4.8%0.0%0%
5%
10%
15%
20%
25%
30%
35%
40%
45%
<20 20-29 30-39 40-49 50-59 60-69 70-79
Average Age: 46.1
DAFP Age Dispersion
4.0%
19.4%
34.9%
4.6%0.0%
37.1%
0.0%0%
5%
10%
15%
20%
25%
30%
35%
40%
<20 20-29 30-39 40-49 50-59 60-69 70-79
Average Age: 46.1
DAM Age Dispersion
4.9%
16.7%
37.4%
8.1%
0.2% 0.2%
32.5%
0%
5%
10%
15%
20%
25%
30%
35%
40%
<20 20-29 30-39 40-49 50-59 60-69 70-79
Average Age: 46.9
OA Age Dispersion
16.0%
30.0%
41.0%
5.3%
0.0%
7.7%
0.0%0%
5%
10%
15%
20%
25%
30%
35%
40%
45%
<20 20-29 30-39 40-49 50-59 60-69 70-79
Average Age: 46.4

Farm Service Agency Final Report Organizational Assessment
Page 22 of 105 May 30, 2008
B.2. Business Unit- Division/Office of Interest HRD is by far the youngest organization within FSA, with an average age of 43, followed by OBPI, with an average age of 45.4. The average age of OBF mirrors that of FSA as a whole, while STO and ITSD have a slightly older workforce, with an average age of 48.5 and 48.3, respectively.
ITSD Age Dispersion
2.8%
12.4%
40.8%
9.0%
0.3%
34.4%
0.3%0%
5%
10%
15%
20%
25%
30%
35%
40%
45%
<20 20-29 30-39 40-49 50-59 60-69 70-79
Average Age: 48.3
HRD Age Dispersion
8.6%
27.9%
0.0%
28.6%
32.1%
2.9%0.0%
0%
5%
10%
15%
20%
25%
30%
35%
<20 20-29 30-39 40-49 50-59 60-69 70-79
Average Age: 43.0
OBF Age Dispersion
6.8% 6.2%
33.4%
0.0% 0.0%
37.7%
15.9%
0%
5%
10%
15%
20%
25%
30%
35%
40%
<20 20-29 30-39 40-49 50-59 60-69 70-79
Average Age: 46.8
OBPI Age Dispersion
12.5%
17.5%
25.0%
40.0%
5.0%0.0% 0.0%
0%
5%
10%
15%
20%
25%
30%
35%
40%
45%
<20 20-29 30-39 40-49 50-59 60-69 70-79
Average Age: 45.4

Farm Service Agency Final Report Organizational Assessment
Page 23 of 105 May 30, 2008
STO Age Dispersion
8.1%
33.9%
44.5%
0.7% 4.9% 0.4%
7.6%
0%
10%
20%
30%
40%
50%
<20 20-29 30-39 40-49 50-59 60-69 70-79
Average Age: 48.5
C. Mission Critical Occupation
The average age of all MCOs combined does not deviate far from the average age of FSA overall. For the specific MCOs of interest, IT Specialists and Agricultural Program Specialists have the oldest employees, with average ages of 47.9 and 47.5, respectively. Loan Specialists are the youngest, with an average age of 46.0.
Mission Critical Occupation Age
Dispersion
7.3%
38.0%
0.1%
5.8%
37.1%
11.8%
0.0%0%
5%
10%
15%
20%
25%
30%
35%
40%
< 20 20-29 30-39 40-49 50-59 60-69 70-79
Average Age: 46.7

Farm Service Agency Final Report Organizational Assessment
Page 24 of 105 May 30, 2008
Program Technician Age Dispersion
13.4%
34.9%
7.6%0.0% 5.6%
38.5%
0.0%0%
10%
20%
30%
40%
50%
<20 20-29 30-39 40-49 50-59 60-69 70-79
Average Age: 46.9
Ag Program Specialist Age Dispersion
10.0%
41.5%
0.0% 0.0%
38.5%
4.8%5.2%
0%
10%
20%
30%
40%
50%
<20 20-29 30-39 40-49 50-59 60-69 70-79
Average Age: 47.5
Loan Specialist Age Dispersion
10.9%
36.9%
0.0% 0.0%4.3%9.4%
38.5%
0%
10%
20%
30%
40%
50%
<20 20-29 30-39 40-49 50-59 60-69 70-79
Average Age: 46.0
IT Specialist Age Dispersion
2.2%
12.6%
38.8%
7.3%0.0% 0.6%
38.5%
0%
10%
20%
30%
40%
50%
<20 20-29 30-39 40-49 50-59 60-69 70-79
Average Age: 47.9
D. Metropolitan Area When examining average age by metropolitan area, Kansas City, St. Louis, and Salt Lake City are slightly above the norm, with average ages of 48.1, 48.3, and 47.9, respectively. By contrast, the Washington, DC area is below the FSA norm, with an average age of 45.2.

Farm Service Agency Final Report Organizational Assessment
Page 25 of 105 May 30, 2008
Washington, DC Area Age Dispersion
7.5%
20.4%
35.9%
0.2% 0.0%
31.2%
4.8%
0%
5%
10%
15%
20%
25%
30%
35%
40%
<20 20-29 30-39 40-49 50-59 60-69 70-79
Average Age: 45.2
Kansas City Age Dispersion
11.8%
30.6%
42.7%
8.9%5.6% 0.3%0.1%
0%
10%
20%
30%
40%
50%
<20 20-29 30-39 40-49 50-59 60-69 70-79
Average Age: 48.1
St. Louis Age Dispersion
11.7%
32.0%
41.7%
7.8%1.0%0.0% 5.8%
0%
10%
20%
30%
40%
50%
<20 20-29 30-39 40-49 50-59 60-69 70-79
Average Age: 48.3
Salt Lake City Age Dispersion
13.4%
42.7%
0.0% 1.2%3.7%
0.0%
39.0%
0%
10%
20%
30%
40%
50%
<20 20-29 30-39 40-49 50-59 60-69 70-79
Average Age: 47.9

Farm Service Agency Final Report Organizational Assessment
Page 26 of 105 May 30, 2008
1.1.7. Gender A. FSA-Wide At 56%, the FSA workforce participation rate for females far exceeds the Government-wide and USDA average, which is 44%. This ratio has remained very consistent over the past five years.
USDA-Wide Gender Mix
Male 56%
Female 44%
FSA-Wide Gender Mix
Female 56%
Male 44%

Farm Service Agency Final Report Organizational Assessment
Page 27 of 105 May 30, 2008
Government-Wide Gender Mix
Male
56%
Female
44%

Farm Service Agency Final Report Organizational Assessment
Page 28 of 105 May 30, 2008
B. Business Unit At 56%, the FSA workforce participation rate for females far exceeds the Government-wide and USDA average, which is 44%. This ratio has remained very consistent over the past five years. There are more females than males in all of the business units. Most business units have a fairly close male-female ratio, with the exceptions of HRD and OBF, which are 82% and 66% female, respectively.
Gender Mix by Deputy Area
36.0%
39.0%
48.3%
46.3%
44.8%
48.8%
64.0%
61.0%
51.7%
53.7%
55.2%
51.2%
0% 10% 20% 30% 40% 50% 60% 70%
OA
DAM
DAFP
DAFLP
DAFO
DACO
Male Female
Gender Mix by MCO
51.2%
46.8%
32.4%
17.7%
46.2%
48.8%
53.2%
67.6%
53.8%
82.3%
0% 20% 40% 60% 80% 100%
STO
OBPI
OBF
HRD
ITSD
Male Female

Farm Service Agency Final Report Organizational Assessment
Page 29 of 105 May 30, 2008
C. Mission Critical Occupation When examining MCO by gender, Agricultural Program Specialists and IT Specialists have a fairly close male-female ratio. However, Program Technicians are 97% female, and Loan Specialists are 64% female.
Gender Mix by MCO
50.0%
35.9%
51.8%
2.7%
50.0%
64.1%
48.2%
97.3%
0% 20% 40% 60% 80% 100%
Information
Technology
Specialist
Loan Specialist
Agricultural Program
Specialist
Program Technician
Male Female
D. Supervisory Status Gender was also examined by supervisory status to determine if differences exist between males and females. Females primarily hold non-supervisory positions, with only 11% of females in supervisory positions. Males, on the other hand, are more evenly distributed between supervisory and non-supervisory positions, with 42% of males classified as supervisors.

Farm Service Agency Final Report Organizational Assessment
Page 30 of 105 May 30, 2008
FSA-Wide Supervisory Status by Gender
88.8%
58.3%
11.2%
41.7%
0%
20%
40%
60%
80%
100%
Females Males
Non-supervisory Supervisor
y

Farm Service Agency Final Report Organizational Assessment
Page 31 of 105 May 30, 2008
1.1.8. Race & National Origin
A. FSA-Wide As shown in the figures on the following pages, FSA, in general, is less diverse in terms of Race and National Origin (RNO) than the Federal government and USDA as a whole. Only 17% of the FSA workforce are minority employees, which is lower than the 22% in USDA and much lower than the 32% in the government overall. This distribution has remained constant over the past five years.
FSA-Wide RNO Statistics
Native American
2%
Hispanic
4%
African
American
11%
Asian/
Pacific Islander
1%
White
83%
USDA-Wide RNO Statistics
White
78%
Asian/
Pacific Islander
3%
African
American
11%
Hispanic
6%
Native American
2%
Government-Wide RNO Statistics
Other
1%
White
68%
Asian/
Pacific Islander
5%
African
American
17%
Hispanic
7%
Native American
2%

Farm Service Agency Final Report Organizational Assessment
Page 32 of 105 May 30, 2008
B.1. Business Unit-Deputy Area Within the business units, DAFLP, DAM, and OA currently have the largest minority populations, each with roughly 35% minority employees. DAFO is the least diverse business unit, with only 12% minorities. Since DAFO is by far the largest business unit within FSA, most of the lack of diversity within FSA can be attributed to this business unit.
DACO RNO Statistics
White
80%
Asian/
Pacific Islander
1%
African
American
12%
Hispanic
5%
Native American
2%
DAFO RNO Statistics
Native American
2%
Hispanic
4%
African
American
5%
Asian/
Pacific Islander
1%
White
89%
DAFLP RNO Statistics
Asian/
Pacific Islander
1%
African
American
32%
Native American
3%
White
64%
DAFP RNO Statistics
White
75%
Asian/
Pacific Islander
3%
African
American
18%
Hispanic
2%
Native American
2%

Farm Service Agency Final Report Organizational Assessment
Page 33 of 105 May 30, 2008
DAM RNO Statistics
White
64%
Asian/
Pacific Islander
3%
African
American
29%
Hispanic
3%Native American
1%
OA RNO Statistics
Native American 0%
Hispanic 3%
African America
n 25%
Asian/ Pacific Islande
r 4% White 68%

Farm Service Agency Final Report Organizational Assessment
Page 34 of 105 May 30, 2008
B.2 Business Unit-Office/Division of Interest All of the offices and divisions of interest, with exception of the State Offices, have more diverse workforces than FSA as a whole. HRD, OBPI, and OBF currently have the largest minority populations, with 49%, 32%, and 29% minorities, respectively.
ITSD RNO Statistics
White
76%
Asian/
Pacific Islander
5%
African
American
16%
Hispanic
2%
Native American
1%
HRD RNO Statistics
White
51%
Asian/
Pacific Islander
0%
African
American
44%
Hispanic
4%
Native American
1%
OBF RNO Statistics
White
71%
Asian/
Pacific Islander
4%
African
American
22%
Hispanic
2%
Native American
1%
OBPI RNO Statistics
White
68%
Asian/
Pacific Islander
5%
African
American
20%
Hispanic
5%
Native American
2%

Farm Service Agency Final Report Organizational Assessment
Page 35 of 105 May 30, 2008
STO RNO Statistics
Native American
1%
Hispanic
4%
African
American
5%
Asian/
Pacific Islander
1%
White
88%

Farm Service Agency Final Report Organizational Assessment
Page 36 of 105 May 30, 2008
C. Mission Critical Occupation As shown in the following figures, all four of the MCOs of interest are composed of a less diverse workforce than the FSA average, with the exception of the IT Specialist occupation, which has a 22% minority population.
Mission Critical Occupation RNO Statistics
White
87%
Asian/
Pacific Islander
1%
African
American
6% Hispanic
4%
Native American
2%
Program Technician RNO Statistics
Native American
2%
Hispanic
5%
African
American
3%
Asian/
Pacific Islander
1%
White
89%
Ag Program Specialist RNO Statistics
White
85%
African American
8%
Native American
1%
Hispanic
4%
Asian/
Pacific Islander
2%

Farm Service Agency Final Report Organizational Assessment
Page 37 of 105 May 30, 2008
Loan Specialist RNO Statistics
White
89%
Native American
2%
African
American
5%
Asian/
Pacific Islander
1%Hispanic
3%
IT Specialist RNO Statistics
White
78%
Native American
1%
Hispanic
3%
African American
14%Asian/Pacific
Islander
5%

Farm Service Agency Final Report Organizational Assessment
Page 38 of 105 May 30, 2008
D. Metropolitan Area When examining RNO by metropolitan area, the Washington, DC area has the most diverse workforce, composed of a 46% minority population. St. Louis is also more diverse than FSA as a whole, as 35% of their workforce is African American. The make-up of Kansas City and Salt Lake City is similar to that of FSA overall.
Washington, DC Area RNO Statistics
African American
35%
Hispanic
4%Native American
1%
Asian/Pacific
Islander
4%
White
56%
Kansas City RNO Statistics
White
79%
Native American
1%
African American
15%
Hispanic
3%
Asian/Pacific
Islander
2%
St. Louis RNO Statistics
Asian/Pacific
Islander
2%
African American
33%
White
65%
Salt Lake City RNO Statistics
White
85%
Native American
1%
African
American
4%
Asian/
Pacific Islander
4% Hispanic
6%

Farm Service Agency Final Report Organizational Assessment
Page 39 of 105 May 30, 2008
1.2. Staffing Trends and Five-Year Projection Models This section provides the following staffing trends and forecasting information: • Staffing Level Trends • Separation Trends • Retirement Trends and Projections
1.2.1. Staffing Level Trends Staffing level trends were analyzed using data from two separate data sets. The number of employees on board for each fiscal year was determined using a dataset as of September 2007. This dataset includes FY 2002-2007 employee information, updated at the end of each fiscal year. Separation and accession trends were determined using a dataset recent as of January 2008. To provide the most comprehensive analysis of the FSA workforce possible, trend analyses were conducted using the most recent data available. Since FY 2002 was the first year for which enough data was available to do all trend analyses, FY 2002 was the year chosen for the starting point. Thus, all trend analyses go back six years. Note: Since two separate datasets were used for staffing levels and accessions/separations, the time period at which the on board levels were recorded may differ from the time period at which the accessions/separations were recorded. Thus, the number of accessions/separations in a given year may not match up perfectly with changes in headcount for that year. Separations exceed external hires across FSA. As shown on the following page, hires actually exceeded separations in 2002 and 2003. However, the downward hiring trend began in 2005 and continued though 2007, a decrease of 14% since 2003. Although accessions increased in 2007, they were still exceeded by separations. Many factors have influenced the downward trend in the past few years, including an increase in retirements, a decrease in hiring, and the movement of positions to the Department. FSA staffing level trends are comparable to those of USDA as a whole. USDA has also seen a gradual decrease in staff over the last few years, although it is less dramatic than that of FSA, with a 9% decrease since 2003. USDA separations have exceeded accessions for the last five years, although the number of separations has been decreasing each year. Staffing levels across the government as a whole have not significantly changed since 2003. Within the business units, attrition is outpacing hiring across the board. OBPI and HRD are the only business units that have seen growth in the past five years.

Farm Service Agency Final Report Organizational Assessment
Page 40 of 105 May 30, 2008
Note: The Office of Budget and Finance (OBF) was formed in 2007 by combining the DAM divisions of Financial Management (FMD) and Budget (BD). Historical trends for OBF were analyzed by combining FMD and BD data for FY 2002-2007. Trends for the DAM organization include the Budget and Financial Management Divisions from 2002-2007. A. FSA-Wide
FSA-Wide Staffing Level Trends
5520 55255147
300 361
453 634 616 449
591659805966
324364415416 401
3310
1000
2000
3000
4000
5000
6000
7000
FY 2002 FY 2003 FY 2004 FY 2005 FY 2006 FY 2007
On Board Accessions Separations
USDA-Wide Staffing Level Trends
113,155 112,084 109,344 105,488 104,126
19,08322,06927,171 22,67124,819
22,61025,32926,87126,00129,276
0
20,000
40,000
60,000
80,000
100,000
120,000
FY 2003 FY 2004 FY 2005 FY 2006 FY 2007
On Board Accessions Separations
Government-Wide Staffing Level Trends
1,848,378 1,856,441 1,860,949 1,852,825 1,862,404
235,969 234,116
216,336 219,891 232,426240,763237,525
257,925250,779245,254
0
200,000
400,000
600,000
800,000
1,000,000
1,200,000
1,400,000
1,600,000
1,800,000
2,000,000
FY 2003 FY 2004 FY 2005 FY 2006 FY 2007
On Board Accessions Separations
FY On-Board Accessions Separations
2002 5966 415 331
2003 5980 415 411
2004 5916 364 453
2005 5520 324 634
2006 5525 300 616
2007 5147 361 449
Farm Service Agency Final Report Organizational Assessment
Page 41 of 105 May 30, 2008
B.1. Business Unit-Deputy Area
DACO Staffing Level Trends
347 350 353 342315 303
27 18 17 15
28 29 5024
262419150
100
200
300
400
FY 2002 FY 2003 FY 2004 FY 2005 FY 2006 FY 2007
On Board Accessions Separations
DAFO Staffing Level Trends
247
283 356 333 285
350935553702390139443944
203218256262293
2522290
1000
2000
3000
4000
5000
FY 2002 FY 2003 FY 2004 FY 2005 FY 2006 FY 2007
On Board Accessions Separations
DAFLP Staffing Level Trends
69 70 68 6863
5 3 6 2 1 3
5 4 8 5 4 6
76
0
20
40
60
80
FY 2002 FY 2003 FY 2004 FY 2005 FY 2006 FY 2007
On Board Accessions Separations
DAFP Staffing Level Trends
6 9 11 13
9 15 17 18
178187194204
208209
1316 14100
50
100
150
200
250
FY 2002 FY 2003 FY 2004 FY 2005 FY 2006 FY 2007
On Board Accessions Separations
DAM Staffing Level Trends
1233 1231 12101036
934 933
83 71 83 86
103210 175
86
97 10559 980
200
400
600
800
1000
1200
1400
FY 2002 FY 2003 FY 2004 FY 2005 FY 2006 FY 2007
On Board Accessions Separations
OA Staffing Level Trends
157178 178 178
166 157
22
15 1427 19 13 14
1237
22 3019
0
50
100
150
200
FY 2002 FY 2003 FY 2004 FY 2005 FY 2006 FY 2007
On Board Accessions Separations

Farm Service Agency Final Report Organizational Assessment
Page 42 of 105 May 30, 2008
B.2 Business Unit-Office/Division of Interest
HRD Staffing Level Trends
98 101
1227
141139
148
99
1420
13 2010
166 13 16
30
020
4060
80100
120140
160
FY 2002 FY 2003 FY 2004 FY 2005 FY 2006 FY 2007
On Board Accessions Separations
OBF Staffing Level Trends
363 358 353 339 321 312
34 42 48 35
35 2827 31 37 2720 270
50
100150
200250
300350
400
FY 2002 FY 2003 FY 2004 FY 2005 FY 2006 FY 2007
On Board Accessions Separations
OBPI Staffing Level Trends
39
77 78 80 75 79
14 91 5
191083 11
4 750
20
40
60
80
100
FY 2002 FY 2003 FY 2004 FY 2005 FY 2006 FY 2007
On Board Accessions Separations
ITSD Staffing Level Trends
492 496 489 411
352 357
26 17 34
121 25 30 16 28 21 27 73
12 0 100 200 300 400 500 600
FY 2002 FY 2003 FY 2004 FY 2005 FY 2006 FY 2007 On Board Accessions Separation
s

Farm Service Agency Final Report Organizational Assessment
Page 43 of 105 May 30, 2008
STO Staffing Level Trends
134
1,3981,4221,4931,6261,6201622
1197797125 122131
194
152129 1691120
500
1000
1500
2000
FY 2002 FY 2003 FY 2004 FY 2005 FY 2006 FY 2007
On Board Accessions Separations
Farm Service Agency Final Report Organizational Assessment
Page 44 of 105 May 30, 2008
C. Mission Critical Occupation
Mission Critical Occupation Staffing Level Trends
3722 3766 37173417 3278 3218
127
197
999827,171 127155275
339225178159
0
500
1000
1500
2000
2500
3000
3500
4000
FY 2002 FY 2003 FY 2004 FY 2005 FY 2006 FY 2007
On Board Accessions Separations
Program Technician Staffing Level Trends
863 872 859 848 818 810
5987 6962
5053 50475251
68 720
200
400
600
800
1000
FY 2002 FY 2003 FY 2004 FY 2005 FY 2006 FY 2007
On Board Accessions Separations
Agricultural Program Specialist Staffing Level Trends
341 349 357 360 351 334
14 17 16
17 27 28
232315 141716
0
50
100
150
200
250
300
350
400
FY 2002 FY 2003 FY 2004 FY 2005 FY 2006 FY 2007
On Board Accessions Separations
Loan Specialist Staffing Level Trends
1713 1691 1648 1597 1553 1514
19
74 67 94 98 96 81
32 21 21 17 220
500
1000
1500
2000
FY 2002 FY 2003 FY 2004 FY 2005 FY 2006 FY 2007
On Board Accessions Separations
IT Specialist Staffing Level Trends
541594 586
348310 316
29
226930 1815
162
1625 4540
100
200
300
400
500
600
700
FY 2002 FY 2003 FY 2004 FY 2005 FY 2006 FY 2007
On Board Accessions Separations

Farm Service Agency Final Report Organizational Assessment
Page 45 of 105 May 30, 2008
1.2.2. Separations
A. FSA-Wide As shown in the figures below, retirements are the primary reason for attrition in FSA, followed by terminations and resignations. Based on a six-year average, approximately 3.5% of the FSA employee population retires annually. However, the percentage of the employee population who retires annually has been growing from approximately 1.9% in 2002 to 5.6% in 2006. There was a sudden decrease in the number of retirements in 2007 (3.8%), although the general trend over time has still been an increase in the retirement rate. Although varying from year to year, the numbers of terminations and resignations has also increased in the past six years. The number of USDA reassignments is variable, as it depends on USDA reorganization initiatives. These increased in 2005 and 2006 due to the movement of IT specialists from ITSD and State Offices to USDA ITS. In contrast to FSA, terminations and resignations are the primary causes of attrition in USDA and the government as a whole. Retirements only make up approximately one third of separations in USDA and the government. However, as with FSA, the number of retirements has been increasing over the last few years.
FSA-Wide Separation Trends
13
127
295
171
141081611
147116138122
91
223200
156112
1039811080106
88 3562
175
27
1
290
50
100
150
200
250
300
350
FY 2002 FY 2003 FY 2004 FY 2005 FY 2006 FY 2007
Other Resignation Retirement
Termination USDA Reassignment

Farm Service Agency Final Report Organizational Assessment
Page 46 of 105 May 30, 2008
USDA-Wide Separation Trends
9,981
3,208
1,1201,122 1,277 1,209
9,228 9,0099,451 9,404
7,973
2,586
2,9264,193
3,123 3,447
11,52512,54712,727
14,031
0
2,000
4,000
6,000
8,000
10,000
12,000
14,000
16,000
FY 2003 FY 2004 FY 2005 FY 2006 FY 2007
Other Resignation Retirement Termination
Government-Wide Separation Trends
4,1685,1795,2045,2355,386
88,67390,326
82,377
89,882
83,688
62,24460,24661,685
55,76952,058
66,30270,12175,655
75,19976,515
0
20,000
40,000
60,000
80,000
100,000
FY 2003 FY 2004 FY 2005 FY 2006 FY 2007
Other Resignation Retirement Termination

Farm Service Agency Final Report Organizational Assessment
Page 47 of 105 May 30, 2008
B. Business Unit-Deputy Area The primary cause of attrition for each FSA business units is retirements. The retirement pattern for each business unit follows that of FSA as a whole, with a steady increase in retirements since 2002, with a sudden decrease in 2007.
DACO Separation Trends
0 0 1 1
87
18
28
01
119899
14
9
37
24
22 32
010
5
10
15
20
25
30
FY 2002 FY 2003 FY 2004 FY 2005 FY 2006 FY 2007
Other Resignation Retirement
Termination USDA Reassignment
DAFO Separation Trends
7
70 77 82
102121
152
120
59 62
576610
88 7797
76
134
63 5363 64
0
1514
74
1420
020
4060
80100
120140
160
FY 2002 FY 2003 FY 2004 FY 2005 FY 2006 FY 2007
Other Resignation Retirement
Termination USDA Reassignment
DAFLP Separation Trends
0 0 0
11 1
3
1
2
3
1
0
4
1
0
1
0
1
0 0
2
1 1
0
1
2
3
4
5
FY 2002 FY 2003 FY 2004 FY 2005 FY 2006 FY 2007
Other Resignation Retirement
Termination USDA Reassignment
DAFP Separation Trends
01
0 00
12
3
12
00
31 2
432
43
1
46
10
54
3
2
0
2
4
6
8
10
12
14
FY 2002 FY 2003 FY 2004 FY 2005 FY 2006 FY 2007
Other Resignation Retirement
Termination USDA Reassignment

Farm Service Agency Final Report Organizational Assessment
Page 48 of 105 May 30, 2008
DAM Separation Trends
0 1
81
94
913 2 613
25
33
26 25 21
5352
3219
15
35 2936
2316
38
34
00
20
40
60
80
100
FY 2002 FY 2003 FY 2004 FY 2005 FY 2006 FY 2007
Other Resignation Retirement
Termination USDA Reassignment
OA Separation Trends
1
108
6
1 1112
2
6
3
9
66
45
19
3
10
6
33 4 4
0
5
10
15
20
FY 2002 FY 2003 FY 2004 FY 2005 FY 2006 FY 2007
Other Resignation Retirement
Termination USDA Reassignment

Farm Service Agency Final Report Organizational Assessment
Page 49 of 105 May 30, 2008
B.2. Business Unit-Office/Division of Interest
Note: OBF was formed in 2007 by combining the DAM divisions of Financial Management (FMD) and Budget (BD). Historical trends for OBF were analyzed by combining FMD and BD data for FY 2002-2007.
ITSD Separation Trends
1 1 20 0 03 4
10 9 11 8
85
1522 18 10
30
58 2 3
50
20
40
60
80
100
FY 2002 FY 2003 FY 2004 FY 2005 FY 2006 FY 2007
Other Resignation Retirement
Termination USDA Reassignment
HRD Separation Trends
0 0 01
0
5 5
2
7
10
21
11
14
01
3
6 6
3
1
7
25
6
3
00
24
68
10
1214
16
FY 2002 FY 2003 FY 2004 FY 2005 FY 2006 FY 2007
Other Resignation Retirement
Termination USDA Reassignment
OBF Separation Trends
1 0 0 02
4 46
8
19
28
1213
0 15
811
7
13
5
14 13
89
313
62
0
5
10
15
20
25
30
FY 2002 FY 2003 FY 2004 FY 2005 FY 2006 FY 2007
Other Resignation Retirement
Termination USDA Reassignment
OBPI Separation Trends
01
01
00 0
334
10
3
0 0 0
23
0 01
0111
5
12 2
0
2
4
6
8
10
12
FY 2002 FY 2003 FY 2004 FY 2005 FY 2006 FY 2007
Other Resignation Retirement
Termination USDA Reassignment

Farm Service Agency Final Report Organizational Assessment
Page 50 of 105 May 30, 2008
STO Separation Trends
15
1 3 2 4 4 2
22
41
27
38
32
43
32
5852
46
59
71
3339
363636
39
13 13
73
20
0
10
20
30
40
50
60
70
80
FY 2002 FY 2003 FY 2004 FY 2005 FY 2006 FY 2007
Other Resignation Retirement
Termination USDA Reassignment

Farm Service Agency Final Report Organizational Assessment
Page 51 of 105 May 30, 2008
C. Mission Critical Occupation Retirements are also the number one cause of attrition for each of the MCOs of interest. The only exception is IT Specialists in 2005 and 2006, many of which moved to USDA ITS at that time. The number of retirements has also tended to increase over time for each MCO.
Mission Critical Occupation Separation Trends
6 5 8
41 3857
35 45 43
98119 128
156
32 28 24 2939
9 015
147
42
79 73
100
68
35
0
50
100
150
200
FY 2002 FY 2003 FY 2004 FY 2005 FY 2006 FY 2007
Other Resignation Retirement
Termination USDA Reassignment
Program Technician Separation Trends
0
13
20
15
27
21
37
13
0 234
32
4
16
11
17
23
17 16
1213
9 13
14
22
5 6
05
1015
2025
3035
40
FY 2002 FY 2003 FY 2004 FY 2005 FY 2006 FY 2007
Other Resignation Retirement
Termination USDA Reassignment
Agricultural Program Specialist Separation Trends
1 0 02
19
00 0 0 02 1
31
19
15
1112
8
43422
12
0
5
10
15
20
FY 2002 FY 2003 FY 2004 FY 2005 FY 2006 FY 2007
Other Resignation Retirement
Termination USDA Reassignment

Farm Service Agency Final Report Organizational Assessment
Page 52 of 105 May 30, 2008
Loan Specialist Separation Trends
1 3 0
19
48 48
11
0 3 24
2215 19
3023
6560
4334
87136
51
4 560
10
20
30
40
50
60
70
FY 2002 FY 2003 FY 2004 FY 2005 FY 2006 FY 2007
Other Resignation Retirement
Termination USDA Reassignment
IT Specialist Separation Trends
1 1 0 0 0 00 4 4 1
314 23 14 9
0 10 0 0
140
5 4193246
23
0
2040
60
80
100120
140
160
FY 2002 FY 2003 FY 2004 FY 2005 FY 2006 FY 2007
Other Resignation Retirement
Termination USDA Reassignment

Farm Service Agency Final Report Organizational Assessment
Page 53 of 105 May 30, 2008
1.2.3. Retirement Eligibility Estimations and Retirement Projections
Retirement eligibility estimations and retirement projections were calculated for 2008-2012 using average values based on past FSA retirement behavior. To perform these calculations, data for 2002 through 2007 were used as the basis for projections. To provide the most comprehensive basis for retirement projections, trend analyses were conducted using the most data available. Since FY 2002 was the first year for which enough data was available to do all trend analyses, FY 2002 was the year chosen for the starting point. Thus, all trend analyses go back six years. The percentage of those eligible to retire that actually did retire was calculated for fiscal years 2002 through 2007. These percentages were averaged and served as the basis for the retirement projections. This percentage is presented under each chart for the area in question. In order to project the retirement eligible population for future years, 2007 eligibility levels were used as the baseline, newly eligible employees were added, and projected retirements were subtracted for each projected fiscal year. The projected percentages were multiplied by the projected on-board staffing levels to calculate the number of predicted retirements for years 2008 through 2012. Retirement trends and projections will first be presented for all types of positions FSA-wide, by business unit, and by MCO. Then trends and projections will be presented for FSA supervisors FSA-wide and by business unit. Supervisory projections will not be made for MCO, since supervisors might be coded under a different series than the employees they manage. There are a few caveats that need to be made before interpreting the retirement projections:
• Only voluntary retirements were used as the basis for future retirement projections. This is because other categories of retirements (e.g. disability, early-out incentives, etc.) depend less on retirement eligibility, and more on unpredictable external factors.
• These projections are made under the assumption that past behavior is the best predictor of future behavior. However, there are other external factors that may influence the FSA retirement rate. Things such as the job market, the housing market, change of administration, etc. can all impact an employee’s choice to retire, but these cannot be taken into account in calculating these retirement projections.
• For some business units, retirement projections are made using very small sample sizes, which tend to be unreliable. Thus, retirement projections for some of these areas should be interpreted with caution. This is especially true for the supervisory projections.
• In the retirement projection bar charts, the bars showing the retirements numbers are the result of rounding. So some bars might show up as different heights for the same value. E.g. two bars representing “3” might be different heights because they actually represent 2.96 and 3.43.

Farm Service Agency Final Report Organizational Assessment
Page 54 of 105 May 30, 2008
1.2.3.1. Retirement Projections for FSA Employees
A. FSA-Wide In the next few years, the number of FSA employees who are eligible to retire will be greater than the past few years. In addition, the percentage of retirement eligible employees who actually retire has been steadily increasing since 2002. Taking these two trends into account, FSA can expect to see an increase in retirements over the next few years. These retirement projections estimate that approximately 900 FSA employees will retire in the next five years, which is 19% of the current workforce. A table displaying these retirement trends is presented below, and retirement projections are made for FSA as a whole, each business unit, and each MCO of interest.
FSA-Wide Retirement Projections
97 138 169 196 226150 169 182 195 203 210
10751185
1245 1227 1204
13931268
13661464 1524 1581
0
200
400
600
800
1000
1200
1400
1600
1800
FY
2002
FY
2003
FY
2004
FY
2005
FY
2006
FY
2007
FY
2008
FY
2009
FY
2010
FY
2011
FY
2012
As seen in the tables on the following page, OBPI and HRD, on average, have the highest amount of retirement-eligible employees who actually leave. DACO, DAFO, DAFP, and ITSD have a lower amount of retirement-eligible employees who actually leave than the FSA average. DACO seems to be the business unit that will be most affected by retirements in the next five years, with 24% of their current workforce estimated to retire by 2012. DAFP and HRD are predicted to be the least affected, with approximately 16% of employees estimated to retire by 2012. This is most likely due to a large amount of retirees in 2004 and 2005.
Actual Retirements Number Eligible to Retire Projected Retirements

Farm Service Agency Final Report Organizational Assessment
Page 55 of 105 May 30, 2008
Percentage of Retirement Eligible Employees and Actual Retirements 2002 2003 2004 2005 2006 2007 AVERAGE
Organization
% Eligible
to Retire
% of Eligible
Who Actually Retire
% Eligible
to Retire
% of Eligible
Who Actually Retire
% Eligible
to Retire
% of Eligible
Who Actually Retire
% Eligible
to Retire
% of Eligible
Who Actually Retire
% Eligible
to Retire
% of Eligible
Who Actually Retire
% Eligible
to Retire
% of Eligible
Who Actually Retire
% of Eligible Who
Actually Retire
FSA-Wide 18.0% 9.0% 19.8% 11.6% 21.0% 13.6% 22.2% 16.0% 23.0% 18.8% 27.1% 10.8% 13.3% DACO 24.8% 10.5% 28.6% 7.0% 29.5% 11.5% 30.4% 16.3% 31.4% 19.2% 38.6% 7.7% 12.0% DAFO 16.8% 9.8% 18.1% 12.2% 19.3% 13.1% 20.9% 14.6% 22.3% 15.0% 25.9% 11.4% 12.7% DAFLP 14.5% 9.1% 18.8% 7.7% 17.1% 8.3% 13.2% 22.2% 10.3% 42.9% 15.9% 10.0% 16.7% DAFP 20.1% 2.4% 21.2% 13.6% 21.6% 9.1% 22.2% 23.3% 23.0% 23.3% 28.7% 7.8% 13.2% DAM 19.7% 6.6% 22.5% 11.9% 23.6% 17.2% 24.6% 18.8% 24.1% 25.3% 28.4% 10.2% 15.0% OA 18.5% 17.2% 20.8% 10.8% 25.8% 8.7% 24.7% 13.6% 23.5% 46.2% 26.1% 12.2% 18.1%
ITSD 19.9% 2.0% 24.6% 12.3% 22.9% 18.8% 26.3% 16.7% 29.0% 20.6% 33.6% 7.5% 13.0% HRD 16.3% 0% 17.8% 11.1% 14.1% 50.0% 15.5% 26.1% 12.9% 27.8% 15.6% 9.1% 20.7% OBF 17.1% 9.7% 19.0% 10.3% 22.9% 16.0% 24.8% 19.0% 22.4% 27.8% 25.6% 12.5% 15.9% OBPI 20.5% 12.5% 24.7% 15.8% 30.8% 4.2% 23.8% 21.1% 21.3% 56.3% 26.6% 14.3% 20.7% STO 19.5% 9.1% 21.0% 11.8% 22.6% 13.1% 25.1% 13.6% 26.5% 15.6% 31.4% 11.6% 12.5%
Five-Year Retirement Projections
Organization 2008 2009 2010 2011 2012 Five-Year Total
% of Current Business Unit
FSA-Wide 169 182 195 203 210 957 19% DACO 12 13 15 15 15 70 24% DAFO 106 115 126 132 138 616 18% DAFLP 2 2 2 3 3 12 19% DAFP 5 6 6 6 6 29 16% DAM 26 26 26 26 27 131 21% OA 20 22 21 22 23 108 24%
ITSD 14 14 15 15 16 74 21% HRD 4 4 5 5 5 23 17% OBF 12 13 13 13 13 64 21% OBPI 2 2 2 2 2 10 22% STO 49 53 58 61 63 284 20%

Farm Service Agency Final Report Organizational Assessment
Page 56 of 105 May 30, 2008
B. Business Unit- Deputy Area
DACO Retirement Projections
9 7 12 17 199 12 13 15 15 15
86100 104 104 99
117
98110
126 122 122
0
20
40
60
80
100
120
140
FY
2002
FY
2003
FY
2004
FY
2005
FY
2006
FY
2007
FY
2008
FY
2009
FY
2010
FY
2011
FY
2012
DAFO Retirement Projections
65 87 99 113 119 104 106 115 126 132 138
664714
754 772 791
909834
904988
10861039
0
200
400
600
800
1000
1200
FY
2002
FY
2003
FY
2004
FY
2005
FY
2006
FY
2007
FY
2008
FY
2009
FY
2010
FY
2011
FY
2012
* Average six-year actual retirement is 12.0% of those eligible. * Average six-year actual retirement is 12.7% of those eligible.
DAFLP Retirement Projections
1 1 12
3
12 2 2 3 3
11
1312
9
7
10
1213
171515
0
2
4
6
8
10
12
14
16
18
FY
2002
FY
2003
FY
2004
FY
2005
FY
2006
FY
2007
FY
2008
FY
2009
FY
2010
FY
2011
FY
2012
DAFP Retirement Projections
16 4
10 10
4 5 6 6 6 6
4244 44 43 43
51
3843 42
47 46
0
10
20
30
40
50
60
FY
2002
FY
2003
FY
2004
FY
2005
FY
2006
FY
2007
FY
2008
FY
2009
FY
2010
FY
2011
FY
2012
* Average six-year actual retirement is 16.7% of those eligible. * Average six-year actual retirement is 13.2% of those eligible.

Farm Service Agency Final Report Organizational Assessment
Page 57 of 105 May 30, 2008
DAM Retirement Projections
1633
49 48 5727 26 26 26 26 27
285
225
265
175 173 172 175 177
243
255277
0
50
100
150
200
250
300
FY
2002
FY
2003
FY
2004
FY
2005
FY
2006
FY
2007
FY
2008
FY
2009
FY
2010
FY
2011
FY
2012
OA Retirement Projections
4 4 6 5
20 22 21 22 2318
5
2937
46 44 39 41
111 116
121 121 126
0
20
40
60
80
100
120
140
FY
2002
FY
2003
FY
2004
FY
2005
FY
2006
FY
2007
FY
2008
FY
2009
FY
2010
FY
2011
FY
2012
* Average six-year actual retirement is 15.0% of those eligible. * Average six-year actual retirement is 18.1% of those eligible.
Actual Retirements Number Eligible to Retire Projected Retirements

Farm Service Agency Final Report Organizational Assessment
Page 58 of 105 May 30, 2008
B.2. Business Unit- Division/Office of Interest ITSD Retirement Projections
215
21 18 219 14 14 15 15 16
98112 108
102107
120117113111
120122
0
20
40
60
80
100
120
140
FY
2002
FY
2003
FY
2004
FY
2005
FY
2006
FY
2007
FY
2008
FY
2009
FY
2010
FY
2011
FY
2012
HRD Retirement Projections
02
7 6 5
24 4 5 5 5
1618
14
23
18
2221
19
23 2525
0
5
10
15
20
25
30
FY
2002
FY
2003
FY
2004
FY
2005
FY
2006
FY
2007
FY
2008
FY
2009
FY
2010
FY
2011
FY
2012
Average six-year actual retirement is 13.0% of those eligible. * Average six-year actual retirement is 20.7% of those eligible.
OBF Retirement Projections
6 713 16
20
10 12 13 13 13 13
6268
81 8480
85 82 81 8378
72
0
10
20
30
40
50
60
70
80
90
FY
2002
FY
2003
FY
2004
FY
2005
FY
2006
FY
2007
FY
2008
FY
2009
FY
2010
FY
2011
FY
2012
OBPI Retirement Projections
13
1
4
9
32 2 2 2 2
8
19
24
19
16
21
8 8 8 8
11
0
5
10
15
20
25
30
FY
2002
FY
2003
FY
2004
FY
2005
FY
2006
FY
2007
FY
2008
FY
2009
FY
2010
FY
2011
FY
2012 Average six-year actual retirement is 16.9% of those eligible * Average six-year actual retirement is 20.7% of those eligible.
STO Retirement Projections
29 40 48 51 59 51 49 53 58 61 63
317 340367 375 377
439396
429461 507487
0
100
200
300
400
500
600
FY
2002
FY
2003
FY
2004
FY
2005
FY
2006
FY
2007
FY
2008
FY
2009
FY
2010
FY
2011
FY
2012
* Average six-year actual retirement is 12.5% of those eligible.
Actual Retirements Number Eligible to Retire Projected Retirements

Farm Service Agency Final Report Organizational Assessment
Page 59 of 105 May 30, 2008
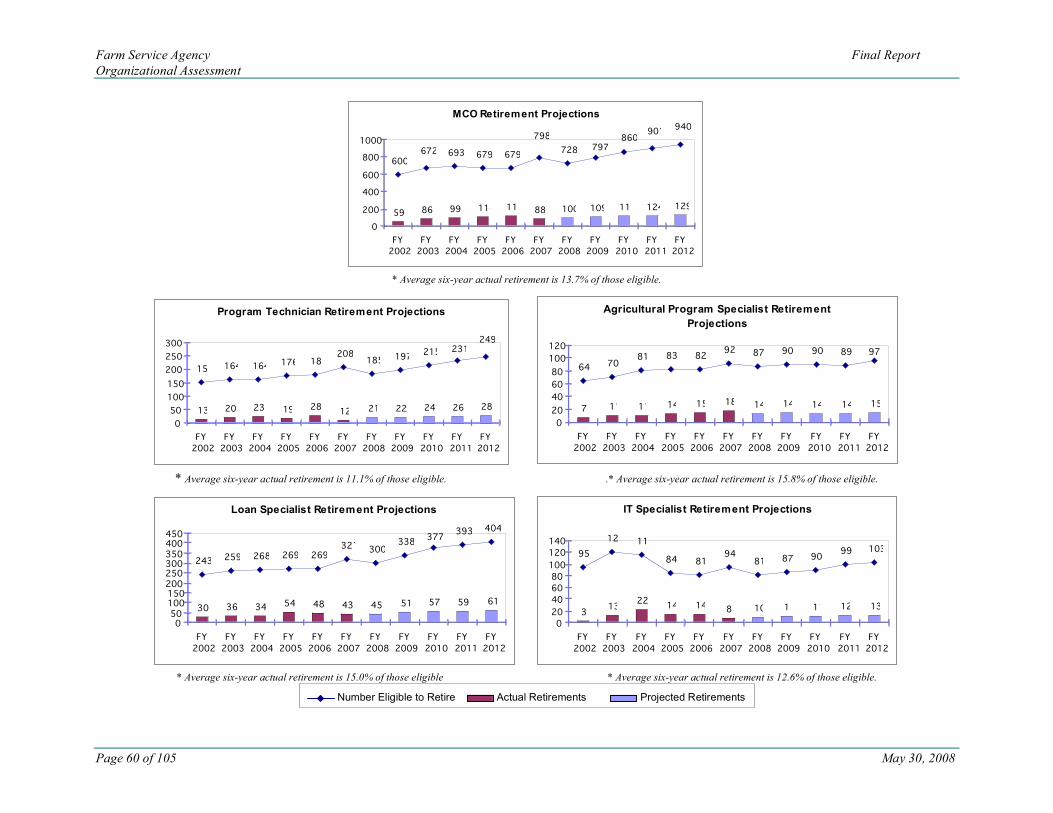
C. Mission Critical Occupation
As seen in the tables below, Agricultural Program Specialists and Loan Specialists, on average, are more likely to leave if they are retirement eligible. Program Technicians are less likely to leave if they are retirement eligible than the average FSA employee. The Agricultural Program Specialist series is predicted to be the most affected by retirements in the next five years. The rest of the MCOs will be less affected than the rest of FSA, on average.
Percentage of Retirement Eligible Employees and Actual Retirements
2002 2003 2004 2005 2006 2007 AVERAGE
Organization
% Eligible
to Retire
% of Eligible
Who Actually Retire
% Eligible
to Retire
% of Eligible
Who Actually Retire
% Eligible
to Retire
% of Eligible
Who Actually Retire
% Eligible
to Retire
% of Eligible
Who Actually Retire
% Eligible
to Retire
% of Eligible
Who Actually Retire
% Eligible
to Retire
% of Eligible
Who Actually Retire
% of Eligible Who
Actually Retire
FSA-Wide 18.0% 9.0% 19.8% 11.6% 21.0% 13.6% 22.2% 16.0% 23.0% 18.8% 27.1% 10.8% 13.3% All MCO 16.1% 9.8% 17.8% 12.8% 18.6% 14.3% 19.9% 16.8% 20.7% 17.5% 24.8% 11.0% 13.7% Program
Technician 17.5% 18.6% 18.8% 12.2.% 19.1% 14.0% 20.8% 10.8% 22.1% 15.5% 25.7% 5.8% 11.1%
Ag Program Specialist 18.8% 10.9% 20.1% 15.7% 22.7% 13.6% 23.1% 16.9% 23.4% 18.3% 27.5% 19.6% 15.8%
Loan Specialist 14.2% 12.3% 15.3% 13.9% 16.3% 12.7% 16.8% 21.0% 17.3% 17.8% 21.2% 13.4% 15.0%
IT Specialist 17.6% 3.2% 20.4% 10.7% 19.6% 19.1% 24.1% 16.7% 26.1% 17.3% 29.7% 8.5% 12.6%
Five-Year Retirement Projections
Organization 2008 2009 2010 2011 2012 Five-Year Total
% of Current MCO
FSA-Wide 169 182 195 203 210 957 19%
All MCO 100 109 118 124 129 579 18%
Program Technician 21 22 24 26 28 121 15% Ag Program Specialist 14 14 14 14 15 71 22%
Loan Specialist 45 51 57 59 61 273 18%
IT Specialist 10 11 11 12 13 58 18%
Farm Service Agency Final Report Organizational Assessment
Page 60 of 105 May 30, 2008
MCO Retirement Projections
59 86 99 114 119 88 100 109 118 124 129
600693 679 679
728672
798
797
860901
940
0
200
400
600
800
1000
FY
2002
FY
2003
FY
2004
FY
2005
FY
2006
FY
2007
FY
2008
FY
2009
FY
2010
FY
2011
FY
2012
* Average six-year actual retirement is 13.7% of those eligible.
Program Technician Retirement Projections
13 20 23 19 2812 21 22 24 26 28
151 164 164176 181
208185
197215
249
231
0
50
100
150
200
250
300
FY
2002
FY
2003
FY
2004
FY
2005
FY
2006
FY
2007
FY
2008
FY
2009
FY
2010
FY
2011
FY
2012
Agricultural Program Specialist Retirement
Projections
7 11 11 14 15 18 14 14 14 14 15
6470
81 83 8292 87 90 90 89 97
0
20
40
60
80
100
120
FY
2002
FY
2003
FY
2004
FY
2005
FY
2006
FY
2007
FY
2008
FY
2009
FY
2010
FY
2011
FY
2012
* Average six-year actual retirement is 11.1% of those eligible. .* Average six-year actual retirement is 15.8% of those eligible.
Loan Specialist Retirement Projections
30 36 3454 48 43 45 51 57 59 61
243259 268 269 269
321300
338
393 404377
0
50
100
150
200
250
300
350
400
450
FY
2002
FY
2003
FY
2004
FY
2005
FY
2006
FY
2007
FY
2008
FY
2009
FY
2010
FY
2011
FY
2012
IT Specialist Retirement Projections
313
2214 14
8 10 11 11 12 13
95
121 115
84 8194
81 87 9099 103
0
20
40
60
80
100
120
140
FY
2002
FY
2003
FY
2004
FY
2005
FY
2006
FY
2007
FY
2008
FY
2009
FY
2010
FY
2011
FY
2012
* Average six-year actual retirement is 15.0% of those eligible * Average six-year actual retirement is 12.6% of those eligible.
Actual Retirements Number Eligible to Retire Projected Retirements

Farm Service Agency Final Report Organizational Assessment
Page 61 of 105 May 30, 2008
1.2.3.2. Retirement Projections for FSA Supervisors A. FSA-Wide Retirement projections were also made for FSA supervisors, as some business units are particularly concerned with the number of managers they are likely to see retire in the next few years. The datasets provided by HRD used for these analyses coded each position as Supervisory or Non-supervisory. Supervisory projections were not made for MCOs, since supervisors may be coded under a different series than the employees they manage. These retirement projections estimate that approximately 350 FSA supervisors will retire in the next five years, which is 27% of the current supervisory workforce. Tables displaying these retirement trends are presented below, followed by charts for each area of interest.
FSA-Wide Retirement Projections for Supervisors
2543
59 63 70 62 60 64 69 72 72
282
320336
352 350
399 386413 443
461461
0
50
100
150
200
250
300
350
400
450
500
FY
2002
FY
2003
FY
2004
FY
2005
FY
2006
FY
2007
FY
2008
FY
2009
FY
2010
FY
2011
FY
2012
As seen in the tables on the following page, supervisors are more likely to leave when retirement eligible than are FSA employees as a whole. This could partly be due to the fact that supervisors are in a higher pay grade than non-supervisors, and thus may be in a better position financially to retire than non-supervisory employees. DAFLP and HRD, on average, have the highest amount of retirement-
Actual Retirements Number Eligible to Retire Projected Retirements

Farm Service Agency Final Report Organizational Assessment
Page 62 of 105 May 30, 2008
eligible supervisors who actually leave. DAFO has the lowest amount of retirement-eligible employees who actually leave. DACO, OBPI, and DAFLP seem to be the business units that will be most affected by retirements in the next five years, with 53%, 46%, and 45% of their current workforce estimated to retire by 2012. DAFP and HRD are predicted to be the least affected, with approximately 16% of employees estimated to retire by 2012, respectively. All supervisory positions will be more affected by potential retirements in the next five years than FSA as a whole. As previously stated, the retirement projections for supervisors were made using very small sample sizes and are thus less reliable than those made when all employees were taken into account.
Percentage of Retirement Eligible Employees and Actual Retirements for FSA Supervisors
2002 2003 2004 2005 2006 2007 AVERAGE
Organization
% Eligible
to Retire
% of Eligible
Who Actually Retire
% Eligible
to Retire
% of Eligible
Who Actually Retire
% Eligible
to Retire
% of Eligible
Who Actually Retire
% Eligible
to Retire
% of Eligible
Who Actually Retire
% Eligible
to Retire
% of Eligible
Who Actually Retire
% Eligible
to Retire
% of Eligible
Who Actually Retire
% of Eligible Who
Actually Retire
FSA-Wide 18.0% 9.0% 19.8% 11.6% 21.0% 13.6% 22.2% 16.0% 23.0% 18.8% 27.1% 10.8% 13.3% All Supervrs 21.0% 8.9% 23.7% 13.4% 25.2% 17.6% 26.3% 17.9% 27.4% 20.0% 31.6% 15.5% 15.6%
DACO 10.5% 50.0% 12.5% 0.0% 15.2% 0.0% 13.5% 60.0% 17.1% 33.3% 37.5% 16.7% 26.7% DAFO 21.0% 7.9% 23.6% 12.7% 24.9% 15.9% 26.5% 15.4% 27.8% 17.3% 31.6% 15.7% 14.1% DAFLP 23.1% 0.0% 25.0% 0.0% 27.3% 0.0% 10.0% 200.0% 9.1% 100.0% 8.3% 0.0% 50.0% DAFP 17.2% 0.0% 13.8% 50.0% 14.3% 25.0% 21.2% 14.3% 29.6% 25.0% 32.0% 12.5% 21.1.% DAM 22.4% 12.1% 26.7% 12.8% 29.5% 30.2% 28.3% 33.3% 27.8% 28.1% 30.2% 17.1% 22.3% OA 28.6% 12.5% 37.0% 30.0% 38.5% 20.0% 39.3% 0.0% 30.8% 62.5% 39.3% 9.1% 22.4%
ITSD 25.0% 0.0% 36.0% 16.7% 30.9% 41.2% 38.6% 23.5% 39.5% 20.0% 39.5% 17.6% 19.8% HRD 37.5% 0.0% 37.5% 33.3% 28.6% 100.0% 25.0% 0.0% 14.3% 50.0% 7.7% 100.0% 47.2% OBF 12.0% 33.3% 11.8% 0.0% 17.3% 11.1% 12.2% 66.7% 18.2% 12.5% 12.6% 12.5% 22.7% OBPI 40.0% 0.0% 26.7% 50.0% 33.3% 0.0% 25.0% 0.0% 21.4% 100.0% 37.5% 16.7% 27.8% STO 25.5% 8.0% 28.6% 13.2% 31.3% 15.2% 35.2% 12.0% 36.0% 17.6% 41.2% 15.3% 13.5%
Five-Year Retirement Projections for FSA Supervisors
Organization 2008 2009 2010 2011 2012 5-Year Total % of Current Business Unit
FSA-Wide 169 182 195 203 210 957 19%

Farm Service Agency Final Report Organizational Assessment
Page 63 of 105 May 30, 2008
All Supervisors 60 64 69 72 72 336 27% DACO 3 3 4 4 3 17 53% DAFO 46 50 54 55 56 261 25% DAFLP 1 2 1 1 1 5 45% DAFP 1 2 2 1 2 7 27% DAM 4 4 4 5 4 22 32% OA 4 4 4 5 6 23 34%
ITSD 3 3 3 3 3 15 32% HRD 0 1 1 1 1 4 30% OBF 2 3 2 3 2 13 30% OBPI 1 1 0 1 1 4 46% STO 26 28 29 29 30 330 29%
B. Business Unit-Deputy Area
DACO Retirement Projections for Supervisors
2
0 0
32 2
3 34 4 3
45 5 5
6
12 12
15
131313
0
2
4
6
8
10
12
14
16
FY
2002
FY
2003
FY
2004
FY
2005
FY
2006
FY
2007
FY
2008
FY
2009
FY
2010
FY
2011
FY
2012
DAFO Retirement Projections for Supervisors
18 33 43 45 51 52 46 50 54 55 56
229259 271
292 295332 327
351
392 395
379
0
50
100
150
200
250
300
350
400
450
FY
2002
FY
2003
FY
2004
FY
2005
FY
2006
FY
2007
FY
2008
FY
2009
FY
2010
FY
2011
FY
2012
* Average six-year actual retirement is 26.7% of those eligible. Average six-year actual retirement is 14.1% of those eligible.

Farm Service Agency Final Report Organizational Assessment
Page 64 of 105 May 30, 2008
DAFLP Retirement Projections for Supervisors
0 0 0
2
1
0
1
21 1
1
3 3 3
1 1
2
3
32
1
0
0.5
1
1.5
2
2.5
3
3.5
FY
2002
FY
2003
FY
2004
FY
2005
FY
2006
FY
2007
FY
2008
FY
2009
FY
2010
FY
2011
FY
2012
DAFP Retirement Projections for Supervisors
0
21 1
21 1
2 2 1 2
4
8 8
4
78
78
5
7
4
0
2
4
6
8
10
FY
2002
FY
2003
FY
2004
FY
2005
FY
2006
FY
2007
FY
2008
FY
2009
FY
2010
FY
2011
FY
2012
* Average 6-year actual retirement is 50.0% of those eligible * Average six-year actual retirement is 21.1% of those eligible
DAM Retirement Projections for Supervisors
4 5
13 129
6 4 4 4 5 4
43
3235
20 20 1922
19
39 36
33
0
10
20
30
40
50
FY
2002
FY
2003
FY
2004
FY
2005
FY
2006
FY
2007
FY
2008
FY
2009
FY
2010
FY
2011
FY
2012
OA Retirement Projections for Supervisors
3 20 1
4 4 45 6
1
5
810 10 11
811
2624
20
1820
0
5
10
15
20
25
30
FY
2002
FY
2003
FY
2004
FY
2005
FY
2006
FY
2007
FY
2008
FY
2009
FY
2010
FY
2011
FY
2012
* Average six-year actual retirement is 22.3% of those eligible * Average six-year actual retirement is 22.4% of those eligible
Actual Retirements Number Eligible to Retire Projected Retirements

Farm Service Agency Final Report Organizational Assessment
Page 65 of 105 May 30, 2008
B.2. Business Unit- Division/Office of Interest
ITSD Retirement Projections for Supervisors
3
7
43 3 3 3 3 33
0
13
1817 17
1517
14 1413
16
14
0
5
10
15
20
FY
2002
FY
2003
FY
2004
FY
2005
FY
2006
FY
2007
FY
2008
FY
2009
FY
2010
FY
2011
FY
2012
HRD Retirement Projections for Supervisors
0
1
2
0
1 11
1
1
1
1
1
22
22
3333
0
0.5
1
1.5
2
2.5
3
3.5
FY
2002
FY
2003
FY
2004
FY
2005
FY
2006
FY
2007
FY
2008
FY
2009
FY
2010
FY
2011
FY
2012
* Average six-year actual retirement is 19.8% of those eligible. Average six-year actual retirement is 47.2% of those eligible.
OBF Retirement Projections for Supervisors
01 1
2 3 2 3 24
12
6 6
9
6
8 8
11 11
12 12
11
0
2
4
6
8
10
12
14
FY
2002
FY
2003
FY
2004
FY
2005
FY
2006
FY
2007
FY
2008
FY
2009
FY
2010
FY
2011
FY
2012
OBPI Retirement Projections for Supervisors
2
0 0
11 1 0 1
1
3
0
4 4
5
4
6
22
2 2
5
0
1
2
3
4
5
6
7
FY
2002
FY
2003
FY
2004
FY
2005
FY
2006
FY
2007
FY
2008
FY
2009
FY
2010
FY
2011
FY
2012
* Average six-year actual retirement is 22.7% of those eligible * Average six-year actual retirement is 27.8% of those eligible

Farm Service Agency Final Report Organizational Assessment
Page 66 of 105 May 30, 2008
STO Retirement Projections for Supervisors
11 20 25 2232 31 26 28 29 29 30 29
137152
164184 182
207194203
213 213 218 216
0
50
100
150
200
250
FY
2002
FY
2003
FY
2004
FY
2005
FY
2006
FY
2007
FY
2008
FY
2009
FY
2010
FY
2011
FY
2012
FY
2013
* Average six-year actual retirement is 13.5% of those eligible