Embed Size (px)
Citation preview

380
Appendix 1Model Of The Interview Schedule and AwarenessQuery
INTERVIEW SCHEDULE TO ELICIT INFORMATION REGARDINGSOCIO-ECONOMIC, LIFE STYLE, HEALTH, CLINICALAND DIETARY
PATTERN OF DIABETIC PATIENTS.
Interviewer: Suni Mary Varghese Date: ------------- Sl: No:--------
SOCIO-ECONOMIC INFORMATION.1. Name And Address :
2. Age :
3. Sex : F / M
4. Religion : Hindu /Muslim / Christian
5. Domicile : Rural/ Urban /Semi-Urban
6. Marital Status : Married/Unmarried Widower/
Widow/Divorce
7. Educational Qualification : Illiterate/UP School/High School/+2/
Graduate/PG/Professionals/Others ____
8. Occupation : Govt:/Private/Business /Others ________
9. Respondent’s Monthly Income : Below 2000/Between 2000-10,000/
Above10,000
10. Family Monthly Income : Below 2000/Between 2000-10,000/
Above10,000
11. Family Composition
Sl Name ofFamilyMembers
Relation totherespondent
Age Sex Qualification Occupation Income
1
2
3
4
5
381
12. Approximate Monthly Expenditure on:a. Food :
b. Housing :
c. Clothing :
d. Others :
LIFE STYLE INFORMATION
13. Do you Smoke Chew Drink NA ()
If yes answer the following
Type Amount of consumption per Brand
Day Week Month Year
Alcohol
Smoke/Cigar
Chewing Tobacco
14. Do you exercise Yes No ()
If yes answer the following
TypeDuration perDay Week
Sports
Yoga
Walking
Other
15. Household chores done without the help of machines/Servants: ()
Washing Grinding Sweeping Wiping Cooking
16. Mental strain during the last three months
Anxiety Fear Tension Sleeplessness Worries Stress
Family Problem Financial Problem Death of dear ones
382
17. How many hours do you sleep? __________________
18. How many hours do you work in the office? __________________
19. How many hours do you spend at home? __________________
20. How many hours do you spend for leisure? __________________
HEALTH AND CLINICAL INFORMATION
21. The respondent is NIDDM IDDM Non Diabetic ()
22. The Age at which diabetic was first identified
23. Do you have any Family history of diabetic? Y/N (If YES Appropriate Boxes)
Father Mother Grand Parents Uncle/Aunt Siblings
24. Present System of Treatment
Allopathy Ayurveda Naturopathy Homeopathy Others
25. Measures taken to control Diabetic
Diet Exercise Drugs All
26. Do you have Diabetic Associated Complications? If Yes answer the following
Retinopathy Neuropathy Nephropathy
Diabetic Gangreen Diabetic Foot Renal Infections
27. Other illnesses
Heart Disease Hyper Tension Hyper Cholesterolemia Asthma
Arthritis Peptic Ulcer Cancer Migraine Stroke
ANTHROPOMETRIC DATA28. Height : _____________ Cms
29. Weight : ______________ Kg
30. Body Frame : Small/Large/Medium
31. Hip Measurement : ________________Cms
32. Waist Measurement :_________________Cms
383
33. Mid Arm Circumference :_________________ Cms
34. Skin Fold Thickness :__________________Cms
BIOCHEMICAL DATA
ParticularSugar
mg/100mlHb
mg/100ml
Pressuremm of
Hg
TotalCholesterol
mg/dl
HDLmg/dl
LDLmg/dl
VLDLmg/dl
TGmg/dl
Blood
Urine
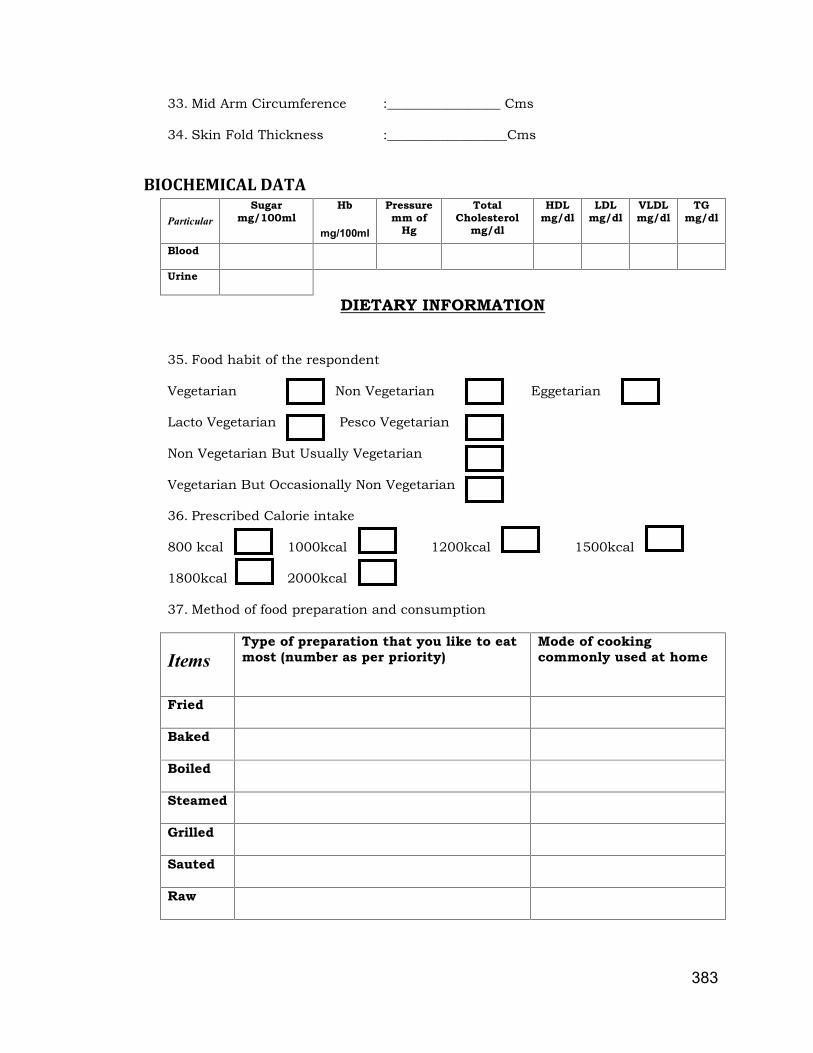
DIETARY INFORMATION
35. Food habit of the respondent
Vegetarian Non Vegetarian Eggetarian
Lacto Vegetarian Pesco Vegetarian
Non Vegetarian But Usually Vegetarian
Vegetarian But Occasionally Non Vegetarian
36. Prescribed Calorie intake
800 kcal 1000kcal 1200kcal 1500kcal
1800kcal 2000kcal
37. Method of food preparation and consumption
ItemsType of preparation that you like to eatmost (number as per priority)
Mode of cookingcommonly used at home
Fried
Baked
Boiled
Steamed
Grilled
Sauted
Raw

384
38. Do you consume Diabetic Sugar/Sugar substitutes? Yes No
If yes specify the brand ______________________________________________ .
39. Special Foods taken due to diabetics ___________________________________
40. Special foods taken during Festivals ____________________________________
41. Do you fast (Yes/No)? If Yes How many hours a day?_____________________.
42. Do you feast (Yes/No)? If Yes How often a week? ________________________.
EXPENDITURE PATTERN, AMOUNT AND FREQUENCY OF CONSUMPTION OFFOOD
Food Stuffs Monthly Consumption Frequency AmountConsumed
ExpenditurePattern in RupeesNumber of Days per Month
30 20 10 5 0 Gm Tsp Tbsp Cups No Daily Weekly MonthlyCEREALSRaw RiceParboiled RiceRagiWheat whole /FlourRawaNoodlesVermicelliCereal ProductsPULSESSprouted Pulses likeGreen gramBengal gramSoya beanCowpeaDry Pulses LikeGreen gramBengal gramSoya beanCowpeaAny otherLEAFY VEGETABLESAmaranthusAmaranth SpinedAgathiAraikeeraDrum stick leavesCoriander leaves

385
Food StuffsMonthly Consumption Frequency
Amount Consumed Expenditure Pattern in Rupees
Number of Days per Month
30 20 10 5 0 Gm Tsp Tbsp Cups No: Daily Weekly Monthly
Curry LeavesMint leavesROOTS AND TUBERSTapiocaCarrotPotatoYamCola cassiaSweet PotatoBeetrootVEGETABLESAsh gourdBitter GourdBrinjalCauliflowerCluster beansCucumberDrumstickFrench BeansJack TenderLadies FingerPlantain GreenPlantain StemPlantain FlowerSnake gourdTomato GreenMango GreenOnion StalksPumpkinFRUITSAmlaAppleBread FruitCashew AppleGrapesJack Fruit

386
Food StuffsMonthly Consumption Frequency
Amount Consumed Expenditure Pattern in Rupees
Number of Days per Month
30 20 10 5 0 Gm Tsp Tbsp Cups No: Daily Weekly MonthlyLemonMangoWater MelonOrangePineapplePlumPassion FruitTomato RipeAny Other
FISH AND SEA FOODS
Herring IndianTunaMackerlSardineAnchovyAny Other
MEAT EGG AND POULTRY
BeefDuckChickenMuttonPorkLiverEgg HenEgg DuckEgg QuailMILK AND MILK PRODUCTSCow’s MilkGoat’s MilkBuffalo’s MilkCurdCheeseButterPanneerAny Other

387
Food Stuffs
Monthly Consumption Frequency Amount Consumed Expenditure Pattern in RupeesNumber of Days per Month30 20 10 5 0 Gm Tsp Tbsp Cups No Daily Weekly Monthly
FATS AND OILSCoconut OilSunflower OilGroundnut OilPalm OilGingely OilMustard OilVanaspathiGheeBEVERAGESCarbonated DrinksSoupsFruit JuicesAlcoholWineTEA/COFFEEWith MilkWithout MilkWith SugarWithout SugarNUTS AND OILSEEDSCashew NutGround NutCoconutGingely SeedAlmondsPROCESSED /PRESERVED FOODSJam/JellyPappadsPicklesCONFECIONARY AND BAKERY ITEMSCakeBiscuitsDessertsNUTRACUTICAL PRODUCTSHealth DrinkNutrient enrichedproducts LikeSpirullina

388
43. Assessment of Dietary Pattern by 24 Hour recall MethodTime Meal Menu Ingredients Amount
Gm Cup Tsp Tbsp No:

389
45. Awareness regarding management of diabetics(put tick mark)
Statements Agree Disagree Don’tknow
1 Diabetic person’s can consume coffee or tea withsugar
2 It is not very essential to maintain normal bloodand urine sugar level
3 High fiber diet reduces blood sugar level4 Uncontrolled diabetics lead to complications from
head to toe5 Consumption of diabetic sugar is not harmfull to
the body6 Diabetic patients must reduced/avoid
consumption of fat rich food7 Optimum production of insulin maintains blood
sugar level8 There is no need of regular health check ups for a
diabetic patients9 Diabetic means faulty functioning of the pancreas
and low insulin level10 Vegetables can be consumed in plenty11 Consumption of complex carbohydrates are bad to
health12 The causes of diabetics can be obesity, infection
in pancreas, lack of exercise13 Diabetics can be well maintained by proper
exercise, controlled diet and drugs14 Fasting and feasting are good15 Daily intake of vitamins and minerals are not
required16 High calorie diet is good17 Personal hygiene is important in diabetics18 Fruits can be consumed in plenty19 Sprouted pulses should not be consumed20 Intra-uterine growth retardation don't lead to
diabetics21 Consumption of Omega-3 fatty acids are essential22 We should maintain low levels of LDL and high
levels of HDL cholesterol23 Leafy vegetables are not rich in fiber24 Central obesity is not good for health25 Maintaining ideal body weight is essential26 Smoking is not injurious to diabetic27 Antioxidants protects our body from diseases28 Deficiency of nutrients don't affect diabetic
subjects29 Hypoglycemia leads to coma and death30 Early symptoms of diabetes are excessive thirst,
hunger and frequent urination

390
Appendix 2.
Model Of The Schedule For Weighment SurveyTime Meal Menu Ingredients
Amount of(Gm, Cup, Tsp, Tbsp, No:)
Cooked food Raw food Left over

391
Appendix 3.
Score Card To Measure The Organoleptic QualityPreferences Of Technical Experts
Sl. No Characteristics Score Variation I Variation II Variation III1. Appearance
a. Excellent 5b. Good 4c. Fair 3d. Poor 2e. Very Poor 1
2. Coloura. Green 5b. Greenish Brown 4c. Brown 3d. Coffee Brown 2e. Black 1
3. Donenessa. Well Cooked 5b. Cooked 4c. Partly Cooked 3d. Uncooked 2e. Burnt 1
4. Flavoura. Excellent 5b. Good 4c. Fair 3d. Poor 2e. Very Poor 1
5. Texturea. Crispy 5b. Brittle 4c. Soft 3d. Gummy 2e. Very Hard 1
6. Tastea. Excellent 5b. Good 4c. Fair 3d. Poor 2e. Very Bad 1TOTAL 35
392
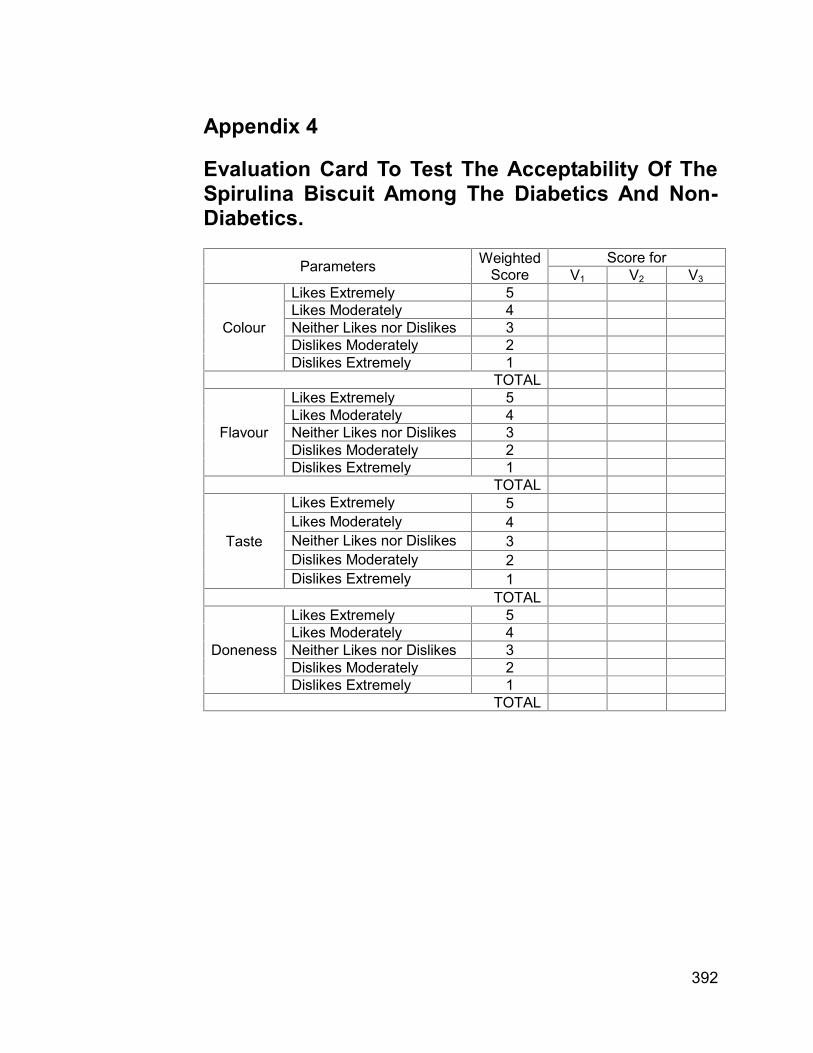
Appendix 4
Evaluation Card To Test The Acceptability Of TheSpirulina Biscuit Among The Diabetics And Non-Diabetics.
Parameters WeightedScore
Score forV1 V2 V3
Colour
Likes Extremely 5Likes Moderately 4Neither Likes nor Dislikes 3Dislikes Moderately 2Dislikes Extremely 1
TOTAL
Flavour
Likes Extremely 5Likes Moderately 4Neither Likes nor Dislikes 3Dislikes Moderately 2Dislikes Extremely 1
TOTAL
Taste
Likes Extremely 5Likes Moderately 4Neither Likes nor Dislikes 3Dislikes Moderately 2Dislikes Extremely 1
TOTAL
Doneness
Likes Extremely 5Likes Moderately 4Neither Likes nor Dislikes 3Dislikes Moderately 2Dislikes Extremely 1
TOTAL
393
Appendix 5
Serial Dilution Techniques-Estimation of TotalMicrobial Counts :Bacterial and Fungal Colonies
Storage stability of a product depends on the ability of the
supplement to remain edible during the storage period without bacterial or
fungal invasion and without change in colour, texture, flavour, odour,
appearance and taste. Since the supplement has to be stored for future
use it is always necessary to test the shelf life period/microbial activity of
the spirulina biscuits. It has been suggested by Gahalawat and Sehgal
(1993) that supplementary foods should have a shelf life of six months.
For testing the shelf life of the developed supplement it was packed
in poly propylene covers and was stored in an air tight container at room
temperature for a period of six months. After the storage period the total
microbial counts i.e. both the number of bacterial and fungal colonies was
determined by Serial Dilution Technique.
Plate count method is based on the principle that when material
containing bacteria or fungus is cultured, every viable bacteria develops
into a visible colony on a nutrient agar medium and every viable fungus
develops into a visible colony on a Saboaurd Dextrose Agar (SDA)
medium. The numbers of colonies are the same as the number of
organisms contained in the sample. In this experiment, a small measured
volume (or weighed) is mixed with a large volume of sterile water or saline
called diluents or dilution blank. Dilutions are usually made in multiples of
ten. A sample dilution is calculated by dividing volume of sample by total
volume of sample and the diluents.
Serial dilutions are later prepared by transferring a known volume of
the dilution to a second dilution blank and so on. Once diluted, the
specified volume of the dilution sample from various dilutions is added to a
sterile petri plates to which molten or cooled suitable agar medium is
394
added. The number of organisms developed on the plates after an
incubation period of 24-28 hours for bacteria and 72 hours for fungi per ml
is obtained by multiplying the number of colonies obtained per plate by
dilution factor, which is the reciprocal of the dilution. The number of cells
per ml is calculated by dividing the product of number of colonies and
dilution factor by amount plated.
The requirements are sample, 9ml dilution blanks, sterile petri dishes,
sterile 1ml pipettes, nutrient agar medium (200ml), Saboaurd Dextrose
Agar medium (200ml) and colony counter. At first label the dilution blanks
as 10-1, 10-2, 10-3 and 10-4. Prepare the initial dilution by adding 1ml or
1mg sample into a 9ml dilution blank labeled 10-1 thus diluting the original
sample 10 times. Mix the contents by rolling the tube back and forth
between the hands to obtain uniform distribution of organisms (cells).
From the first dilution transfer 1ml of the suspension while in motion, to the
dilution blank 10-2 with a sterile and fresh 1ml pipette, diluting the original
specimen or suspension to 100 times. From the 10-2 suspension, transfer
1ml of suspension to 10-3 dilution blank with a fresh sterile, pipette, thus
diluting the original sample to 1000 times.
Repeat this procedure till the original sample has been diluted to
10,000 i.e. 10-4 times using every time a fresh sterile pipette. From the
dilution of 10-4 transfer 1ml of the suspension while in motion, with the
respective pipette to sterile petri dishes. Add approximately 15ml of the
nutrient agar medium and 15ml of Saboaurd Dextrose Agar medium
melted and cooled to 450C separately to each petri dish containing the
diluted sample. Mix the contents of each dish by rotating gently to
distribute the cells throughout the medium. For each sample a replica was
also kept. Allow the plates to solidify. Incubate these plates in an inverted
position for 24-48 hours at 300C for obtaining the bacterial colonies and for
72 hours at 300C to obtain the fungal colonies.
395
All the laboratory experiments were done at the National Institute of
Interdisciplianary Science and Technology (NIIST) formerly termed as the
Regional Research Laboratory (RRL) located at Pappanamcode.
Appendix 6
Procedure Of The Estimation Of Bio-ChemicalParameters In Blood- Blood-Sugar, Lipid Profile,Hb, Enzymatic And Non-Enzymatic AntioxidantStatus.
Biochemical tests can be conducted on easily accessible body
fluids such as blood and urine that help to diagnose disease at the sub-
clinical stage and confirm clinical diagnosis at the disease stage as the
clinical signs and symptoms being often non specific (Bamji 1999). Blood
samples were assessed for its glucose, lipid profile, hemoglobin level,
activities of enzymatic antioxidants like Cu-Zn super oxide dismutase and
catalase and non enzymatic antioxidants like Vitamin A, Vitamin E and
Vitamin C of diabetic and non diabetic subjects and also before and after
the supplementation.
3.8.1 Preparation of Blood Samples.The venous blood samples were collected in heparinised tubes
between 7.30am and 9am from the diabetic and non diabetic samples.
Depending on the procedure adopted 0.5ml of blood sample was stored
separately from each sample and the rest were centrifuged at 3200rpm
for15 minutes and separated the plasma. The erythrocytes were carefully
sampled from the bottom of the tube to minimize contamination with
leucocytes, and then the precipitate was washed three times with isotonic
saline solution and lysed by addition of double distilled water containing
5ml/L Trition x-100, followed by vigorous vortex-mixing and stored on ice
for 10 minutes. Membrane free hemolysate was obtained by
centrifugation at 10,000xgm rpm for five minutes. Assay of enzymatic and
non enzymatic antioxidants were done within the same day of collecting
396
the blood samples. Enzyme assays of each sample were performed in
duplicate.
3.8.2 Estimation of Glucose in Blood PlasmaEstimation of plasma blood glucose level was based on Glucose
Oxidase-Peroxidase method (GOD/POD method); where glucose is
oxidized by glucose oxidase to gluconic acid and hydrogen peroxide. In
subsequent peroxidase catalysed reaction, the oxygen liberated is
accepted by the chromogen system to give a red coloured qunine- amine
compound that is stable for one hour and is read colorimetrically at 505
nm
The reagents used were glucose enzyme reagent, glucose
diluents and glucose standard. Working glucose reagent was prepared by
reconstituting glucose enzyme reagent with glucose diluent. Standard(S)
was prepared by mixing 0.02ml of glucose standard 100mg% with 1.5ml
working glucose reagent and 1.5ml purified water. The Test (T) contains
0.02ml blood plasma, 1.5ml working glucose reagent and 1.5ml purified
water. For reading the Optical Density (OD) calorimetrically Blank (B),
Standard(S) and Test (T) were separately mixed well and incubated at
370 Celsius for 10 minutes, and read the colour intensity against Blank-
1.5ml working glucose reagent and 1.5ml purified water. The plasma
glucose in mg/100ml was calculated from the formula [OD Test- OD
Blank /OD Standard- OD Blank] x100. The criteria for the diagnosis of
diabetes by WHO is fasting plasma glucose (FPG) ≥ 126mg/dl and 2
hours post glucose value ≥ 200mg/dl (Deepa,2002). The normal fasting
plasma glucose level is 70-110mg/dl.
3.8.3 Estimation of Total Cholesterol, HDL and LDLRegulation of Total Cholesterol, HDL (High Density Lipoproteins)
and LDL (Low Density Lipoproteins) plays a central role in disease
development. According to the Kit provided by BioVision, Cholesterol
Oxidase recognizes free cholesterol and produce products to react with
probe to generate colour at 570nm. A large portion of the cholesterol in
397
blood is in the form of cholesteryl esters, cholesterol esterase hydrolizes
cholesteryl esters into cholesterol. Cholesterol is then oxidize by
cholesterol oxidase to yield H2O2 which interacts with a sensitive
cholesterol probe to produce resorufin which can be detected by
spectrophotometrically. The kit contained Cholesterol reaction buffer,
2XLDL/VLDL precipitation buffer, Cholesterol Probe (lyophilised),
Dimethylsulfoxide (DMSO anhydrous), Enzyme Mix (lyophilised),
Cholesterol Esterase (lyophilised), Cholesterol Standard (5µg/µl). The
reagent prepared are Cholesterol Probe, Cholesterol Esterase and
Enzyme Mix; cholesterol probe- to the cholesterol probe in the kit
dissolve in 220µl DMSO prior to use, store at -20oc,protect from light and
use within two months; cholesterol esterase- to the cholesterol esterase
in the kit dissolve in 220µl cholesterol reaction buffer prior to use, store at
-20oc, protect from light and use within two months; enzyme mix- to the
enzyme mix provided in the kit dissolve in 220µl cholesterol reaction
buffer prior to use, store at -20oc, protect from light and use within two
months.
Estimation of Total Cholesterol- For colorimetric assay dilute
cholesterol standard to 0.5µg/µl by adding 20µl of cholesterol standard to
180µl of cholesterol reaction buffer and mix well. Add 0, 4, 8, 12, 16, 20 µl
into each well individually. Adjust volume to 50µl/well with cholesterol
reaction buffer to generate 0, 2, 4, 6, 8, 10 µg/well of the cholesterol
standard. Prepare test samples in 50 µl/well with cholesterol reaction
buffer. 0.5-2µl of serum is required per assay and can be directly diluted
in the cholesterol reaction buffer.
The reaction mix is prepared by mixing enough reagents for the
number of assays performed, for each assay prepare a total of 50µl
containing, 44µl Cholesterol Reaction Buffer, 2µl Cholesterol Probe, 2µl
Enzyme Mix, 2µl Cholesterol Esterase. Add 50µl of the reaction mix to
each well containing the cholesterol standard and/or test sample and mix

398
well. Incubate the reaction for 60 minutes at 370c, protect from light and
measure the OD at 570nm in a micro-titer plate reader.
Measure the OD of no-cholesterol control (blank) and correct the
background by subtracting the value from all samples, then calculate the
cholesterol concentrations of the test samples based on the standard
curve drawn with standard cholesterol µg/well along the X-axis and OD
along the Y-axis. The desirable serum cholesterol level is less than
200mg/dl
Estimation of HDL and LDL- For the separation of HDL,
LDL/VLDL, mix 100µl of 2X precipitation buffer with 100µl of serum
sample in a micro centrifuge tube. After 10 minutes of incubation at room
temperature centrifuge at 2000xg for 10 minutes. Transfer the
supernatant into labeled new tubes and this is the HDL fraction. The
precipitates are the LDL/VLDL fraction. To measure the LDL/VLDL
fraction the precipitates are spun again and the trace amount of HDL
supernatants are carefully removed then dissolved the precipitate in
200µl Precipitation Buffer. This is LDL/VLDL fraction. If the supernatant is
cloudy the sample should be re-centrifuged. If the sample still remains
cloudy, dilute the serum sample 1:1 with Precipitation Buffer and repeat
the separation procedure. Precipitation for longer time and
precipitation/centrifugation temperature do not affect the result
significantly.
For the colorimetric assay dilute cholesterol standard to 0.5µg/µl
by adding 20µl of cholesterol standard to 180µl of cholesterol reaction
buffer and mix well. Add 0, 4, 8, 12, 16, 20 µl into each well individually.
Adjust volume to 50µl/well with cholesterol reaction buffer to generate 0,
2, 4, 6, 8, 10 µg/well of the cholesterol standard. Prepare test samples in
50 µl/well with cholesterol reaction buffer. 0.5-2µl of serum is required per
assay and can be directly diluted in the cholesterol reaction buffer.
The reaction mix is prepared by mixing enough reagents for the
number of assays performed, for each assay prepare a total of 50µl
399
containing, 44µl Cholesterol Reaction Buffer, 2µl Cholesterol Probe, 2µl
Enzyme Mix, 2µl Cholesterol Esterase. Add 50µl of the reaction mix to
each well containing the cholesterol standard and/or test sample and mix
well. Incubate the reaction for 60 minutes at 370c, protect from light and
measure the OD at 570nm in a micro-titer plate reader.
Measure the OD of no-cholesterol control (blank) and correct the
background by subtracting the value from all samples or correct the OD
to 00 with the blank, then apply the specific sample readings to the
standard curve to calculate the sample cholesterol concentrations. The
standard curve is drawn with standard cholesterol µg/ µl along the X-axis
and OD along the Y-axis. The concentration of the HDL, LDL/VLDL
fraction is calculated from the formulae C=A/V µg/µl (1µg/µl=100mg/dl)
where A is the sample cholesterol amount from the standard curve, V is
original sample volume added in the sample well.
Since HDL–cholesterol level is inversely related to the tendency of
heart disease, its estimation is useful. Serum levels lower than 45mg/dl in
males and 55mg/dl in females indicate increased risk of heart disease.
The HDL level may be increased to up to 60mg/dl for males and up to
75mg/dl for females, which indicate the safe margin. The LDL cholesterol
level may be maintained to the value less than 150mg/dl and treatment is
required if it exceeds this value. Increase in LDL level indicates increased
risk of heart disease. The safe limit of LDL fraction is 60-90mg/dl and
increased risk if the range is between 150-200mg/dl.
3.8.4 Estimation of HemoglobinEstimation of Hemoglobin is based on the Cyanmethemoglobin
Method. In solution ferrous ions (Fe2+) of the hemoglobin are oxidized to
the ferric state (Fe3+) by potassium ferric cyanide to form methemoglobin.
In turn, methemoglobin reacts with cyanide ions provided by potassium
cyanide to form cyanmethemoglobin, which has an absorbance at 540
nm.

400
The reagents used for the estimation were Cyanmethemoglobin
solution (Drabkin’s solution) prepared from dissolving 0.05gm of
potassium cyanide, 0.20gm of potassium ferric cyanide and 1.4gm of
dihydrogen potassium phosphate in one liter of distilled water and add
1ml Trition X-100 to it; the mix is stable for six months. Another reagent is
hemoglobin standard prepared from lypophilized human methemoglobin
(supplied by Sigma USA) and each vial is equivalent to hemoglobin
concentration of 18gm/dl whole blood. When re-constituted in 50ml of
Drabkin’s solution it is stable for six months at 2-6o Celsius.
Estimation starts by transferring 0.02ml of blood using a
caliberated hemoglobin pipette in to a tube containing 5.0ml of Drabkin’s
reagent and was allowed to stand at least five minutes to develop colour.
The absorbance of the Unknown sample (A UnK) and Standard the
known hemoglobin content (A Std) was measured at 530-550nm against
the reagent blank. The Hemoglobin thus measured is calculated by
dividing the OD of unknown (A UnK) by the OD of Standard the known
hemoglobin content (A Std) and multiplying it with the concentration of
hemoglobin standard (gm/dl). After every use rinse the pipette several
times with the Drabkins Reagent.
According to WHO diagnosis of anemia is confirmed if the hemoglobin
value is less than 12gm/dl for adult men and women. The normal blood
hemoglobin level is between 14-16g/dl for males and 13-15g/dl for
females
3.8.5 Estimation of Vitamin A and Beta CaroteneVitamin A and carotene are extracted into petroleum ether after
protein precipitation with ethanol. The intensity of the yellow colour of the
carotenes is measured directly. The petroleum ether is evaporated off
and the residue is taken up in chloroform. Carr-Price reagent (SbCl3) is
added and the amount of blue colour produced is read
spectrophotometrically at 460nm and correction applied for the colour
401
due to carotenes to obtain the level of vitamin A present at 520nm
(Winsten,S.,Dalal, E R 1972)
The reagents required are 95% ethanol, petroleum ether,
chloroform, acetic anhydride, 22%antimony trichloride solution prepared
from 22g antimony trichloride in 50ml chloroform and diluted to 100ml,
artificial beta-carotene standard prepared by dissolving 20mg of
potassium dichromate in water and dilute to 100ml of which the colour is
equivalent to 5.6 µg of betacarotene/5ml of petroleum ether extract,
artificial vitamin A standard obtained by dissolving 5g of cupric sulphate
in water and dilute to 100ml and the colour developed is equivalent to 2.8
µg vitamin A/5ml of the solution. It is important that all glass wares be
perfectly dry as it may cause cloudiness and interfere with the test.
Pipette out 5ml of specimen in 30ml glass stoppered tube. Add
5ml of 95% ethanol and mix vigorously for 1 minute on a vortex mixer.
Add 10ml of petroleum ether, stopper the tube and shake well for 5
minutes. Centrifuge and pipette 5ml of the clear petroleum ether layer
into a cuvette. Read absorbance of the sample at 450nm against a
petroleum ether blank in suitable colorimeter or spectrophotometer.
Similarly read absorbance of the artificial beta carotene standard at
450nm against a water blank. Place the cuvette containing the petroleum
ether extract of the sample in a water bath at 50oC and evaporate the
contents to dryness. The evaporation may be accelerated by means of a
stream of nitrogen delivered by a capillary pipette. Dissolve the residue in
0.5 ml of chloroform and add 2 drops of acetic anhydride to remove all
traces of moisture. Zero the colorimeter at 620 nm with a cuvette
containing 0.5 ml chloroform, 2 drops of acetic anhydride, and 4.5 ml
antimony trichloride reagent. While the sample cuvette is in the
colorimeter add 4.5 ml of antimony trichloride reagent very rapidly. Read
the peak absorbance at 620 nm. The reading is transitory but
unmistakable. The absorbency will rapidly decrease as the color fades.
402
Determine the absorbance of the artificial vitamin A standard at 620 nm
against water blank.
Calculation of Betacarotene is based on the formula: optical
density of test/specimen at 450nm divided by optical density of artificial
carotene standard at 450nm multiplied by 5.6 and 40 gives the beta-
carotenes content in µg/100 ml and is marked as X. Calculation of
Vitamin A is based on the formula: optical density of test/specimen at
620nm divided by optical density of artificial vitamin A standard at 620nm
multiplied by 2.8 and 40 gives the total amount of vitamin A and
carotenes in µg/100 ml and is marked as Y and on subtracting X from Y
the serum vitamin A in µg/100 ml is obtained.
One International Unit (IU) of Vitamin A is defined as having the
activity of 0.344 µg of vitamin A acetate. The blood level is greatly
influenced by dietary carotenes. The normal range for vitamin A has been
reported as 30 to 60 ug/100 ml in the U.S. and 20 to 50 ug/100 ml in
England. It may be assumed that there is no deficiency when the serum
level above 20 ug/100 ml. Below a serum concentration of 10 ug/100 ml
dark adaptation is impaired.
3.8.6 Estimation of Tocopherol (Vitamin E)Vitamin E estimation is based on the reduction of ferric ions to
ferrous ions by tocopherols after xylene extraction of blood samples. The
ferrous ions react with α-ά dipyridyl to give a red colour which is
measured at 520 nm (Winsten,S.,Dalal, E R 1972).
The reagents required are Absolute ethanol, Xylene; α-ά
Dipyridyl reagent is prepared by dissolving 120 mg of α-ά-dipyridyl in n-
propanol and making up to 100 ml with the same solvent. Ferric chloride
reagent is obtained by dissolve 120 mg of ferric chloride hexahydrate
(FeCl3· 6H2O) in absolute ethanol and make up to 100 ml with the same
solvent. Vitamin E stock is prepared by dissolving 91 mg of DL-a-
tocopherol in absolute ethanol and made up to 100 ml with the same

403
solvent. Vitamin E standard is made by diluting 2 ml of stock solution to
100 ml with absolute alcohol.
Procedure for the estimation of the vitamin E begins by pipetting
0.5 ml of serum or plasma, 0.5 ml of Vitamin E standard, and 0.5 ml of
water in three 15 ml glass-stoppered centrifuge tubes marked “test”,
“standard”, and “blank” respectively. Added 0.5 ml of absolute ethanol to
tubes marked “test” and “blank” and 0.5 ml of water to tube marked
“standard”, stoppered and mix. Add 0.5 ml of xylene to all tubes. Stopper
and mix on Vortex mixer for 2 min. Centrifuge all tubes for 10 min.
Carefully withdrawn 0.34 ml of the upper xylene layer from each
centrifuge tube, taking care to avoid all traces of alcohol or protein, and
transfered into fresh, appropriately labeled, stoppered tubes. Added
0.34ml of α-α’-dipyridyl reagent to all tubes. Stoppered and mix. Transfer
0.5 ml of the mixture from each tube to suitably marked cuvettes and
read the absorbance of the “test” and “standard” at 460 mm in a suitable
colorimeter or spectrophotometer using the “bank” to zero the instrument.
If the colorimeter used is incapable of measuring absorbance on 0.5 ml
aliquots, increase volumes of all samples, standard, and reagents
proportionately. Add 0.11 ml of ferric chloride reagent to the
“blank”cuvette and mix for 30 sec. Place the cuvette in the colorimeter
and adjust the instrument to zero at 520 nm exactly 1 1/2 min after
addition of the reagent. Add 0.11 ml of ferric chloride reagent to the
“standard” cuvette, mix for 30 sec, and read the absorbance of the
mixture exactly 1½ min after addition of reagent. Repeat the process
exactly with the “test” cuvette.
Calculation of vitamine E content is based on of the formula
Absorbance of Test at 520nm–(0.29xAbsorbance of Test at
460nm)/Absorbance of Standard at 520nm–(0.29xAbsorbance of
Standard at 460nm)x2 = mg DL-α-tocopherol acetate (Vitamin E). If pure
standards are used Abs S 460 should be zero. Normal values for Vitamin
E in serum are considered to be 0.8 to 1.2mg%.

404
3.8.7 Estimation of Ascorbic Acid (Vitamin C)Ascorbic acid is oxidized to dehydroascorbate by the action of 2,6-
dichlorophinolindophenol. The dehydroascorbate is hydrolyzed to
diketogulonic acid in the strong acid medium. This form an osazone with
2-4 dinitrophenyl hydrazine. The osazone rearranges to a stable reddish-
brown product which can be measured photometrically. The estimation is
based on the methods stated by Winsten S.,and Dalal E R (1972).
Reagent needed for the estimation are Trichloroacetic acid (TCA),
5% (w/v) prepared by dissolving 5 g TCA crystals in water and made up
to 100 ml or dilute 100% TCA to 5% with water and store in a refrigerator;
Indophenol Reagent is prepared by dissolving 100 mg of 2,6-
dichlorophenolindophenol, Na salt in 40 ml of hot water and is made up to
50 ml; to prepare 9N Sulfuric Acid, carefully add 25 ml of concentrated
sulfuric acid to 75 ml of water, with constant mixing; DNP-thiourea
reagent is prepared by dissolving 2gm of 2,4-dinitrophenylhydrazine
(DNP) and 1gm of thiourea in 100 ml of 9N sulfuric acid and filter, if
excessive precipitate is formed in the reagent prepare fresh. Sulfuric acid,
85%(w/v) is prepared by mixing 85 ml of concentrated sulfuric acid into13
ml of water carefully with constant stirring. The Ascorbic acid stock is
prepared by dissolving 50mg of ascorbic acid in 5% TCA and make up to
100 ml with 5% TCA and Store in a refrigerator. Ascorbic acid working
standard was prepared by diluting 1ml of the stock solution to 100 ml with
5% TCA; this solution must be prepared fresh with each run. Vitamin C
levels can be determined serum, plasma, urine, or leukocytes.
Procedure for serum or plasma- pipette 2.0 ml of serum or plasma
into a centrifuge tube. Add 1.5 ml of 5% TCA and mix thoroughly.
Centrifuge and use the protein-free supernatant for estimation. Pipette
0.5 ml of supernatant from each sample into tubes marked “sample”. Also
pipette 0.5 ml of working ascorbic acid standard into tube marked
“standard” and 2 ml of 5% TCA into a tube marked “standard blank”. Add
0.025 ml of indophenol reagent to all tubes and mix well. Add 0.125 ml of

405
DNP-thiourea reagent to the samples. Do not treat any blanks at this
point. Incubate all tubes for 1 hr in a 600 C water bath. Cool in ice water.
Add 0.125 ml of DNP-thiourea to standard-blank and all sample blanks.
While all the tubes remain in ice water, slowly add 0.625 ml of 85%
sulfuric acid to all tubes and mix well. Read absorbance of standard at
500 nm in a suitable colorimeter or spectrophotometer, using the
standard-blank to zero the instrument. Similarly read absorbance of each
sample, zeroing the instrument with the corresponding sample-blank.
Calculation of vitamin content in Serum or plasma is based on the
formula Absorbance of Test/Absorbance of Standardx2 = mg of total
ascorbate/100 ml. Protein-free supernatants obtained in step 1 of the
procedure are stable for at least two months if kept frozen. Untreated
samples cannot be kept frozen for more han two weeks. Normal values
for human plasma or serum is 0.4 to 1.5 mg/100 ml.
3.8.8 Estimation of Super oxide dismutaseSuper oxide dismutase (SOD) activity was determined based on
the method prescribed by Stefan Marklund and Gudrun Marklund (1974);
were the ability of the enzyme to inhibit the autooxidation of pyrogallol is
measured. One unit of SOD is the amount of enzyme that inhibits 50% of
the autooxidation of pyrogallol. The activity was measured using a
spectrophotometer at 420 nm for 3minutes. The reagents required for the
estimation are Tris HCl 83.3mM(pH 8.2), Diethylene Triamine Penta
Acetic Acid 5mM(DETPA), Tris-Ethylene Diamine Tetra Acetic Acid
5mM(EDTA) pH7.4, 0.01N HCl, Standard Pyrogallol(0.504mg/ml)
The processed RBC’s is diluted with stabilizing solution (30mM
neutralized EDTA and 0.71mM mercaptoethanol) and the sample is
subjected to freezing and thawing for 3-4 times for the RBC to lyse and
release the enzyme that has to be estimated. For monitoring pyrogallol
auto-oxidation, pipette out 20 to 80 µl of pyrogallol and make up the
volume to 100ml with 0.01N HCL. To this add 600 µl of tris HCL buffer
and add 100 µl of (DETPA) then add about 100 µl of Tris-Ethylene
406
Diamine Tetra Acetic Acid 5mM (EDTA) pH7.4, also add 100 µl of glass
distilled water. For the sample assay (dilution 1:20) add about 50 µl of
pyrogallol and 50 µl of the enzymes or the RBC lysate and analyse the
reaction at 420nm at a constant temperature of 250C. The superoxide
dismutase activity is then measured by the degree of inhibition of this
reaction. All diluted sample rates were converted into percentages of the
sample diluents rate, and subtracted from 100%to give a percentage of
inhibition. The unit of activity is defined as the amount of enzyme that
inhibit the rate of formation of dye by 50%
SOD units were obtained from standard curve using percentage
inhibition of the sample. SOD units/ml of whole blood is absolute activity
and was converted to SOD units/gram of hemoglobin which is the specific
activity. The reference value established by Bogdanska etal (2003) for
superoxide dismutase-absolute value 122.4-333.9±2SD U/ml and for
specific value 884.2-2119±2SD U/gHb
3.8.9 Estimation of CatalaseCatalase assay was done as explained in the method of Aebi
(1974) by decomposing hydrogen peroxide into water and oxygen and
the rate of decomposition of H2O2 by catalase was measured
spectrophotometrically at 240 nm for 3 minutes. It can be expressed as:
The reagents required for the assay are 50mM Sodium Phosphate
Buffer pH 7.2 and 33mM hydrogen peroxide. The processed RBC’s is
diluted with stabilizing solution (30mM neutralized EDTA and 0.71mM
mercaptoethanol) and the sample is subjected to freezing and thawing for
3-4 times for the RBC to lyse and release the enzyme that has to be
estimated. For the enzyme assay pipette out about 1.95ml of sodium
phosphate buffer, 1ml of hydrogen peroxide and 50 µl of the sample
(dilution 1:500). The assay is carried out at 250C. The degradation of
hydrogen peroxide into water and oxygen is measured at 240nm
Absolute activity was expressed as k-rate constant of first order
reaction defined by Aebi (1974) and k/g hemoglobin is the specific
407
gravity. The reference value established by Bogdanska etal (2003) for
Catalase-absolute value 17.9-41.1 ±2SD k and for specific value 118.8-
222.0 ±2SD k/g Hb.
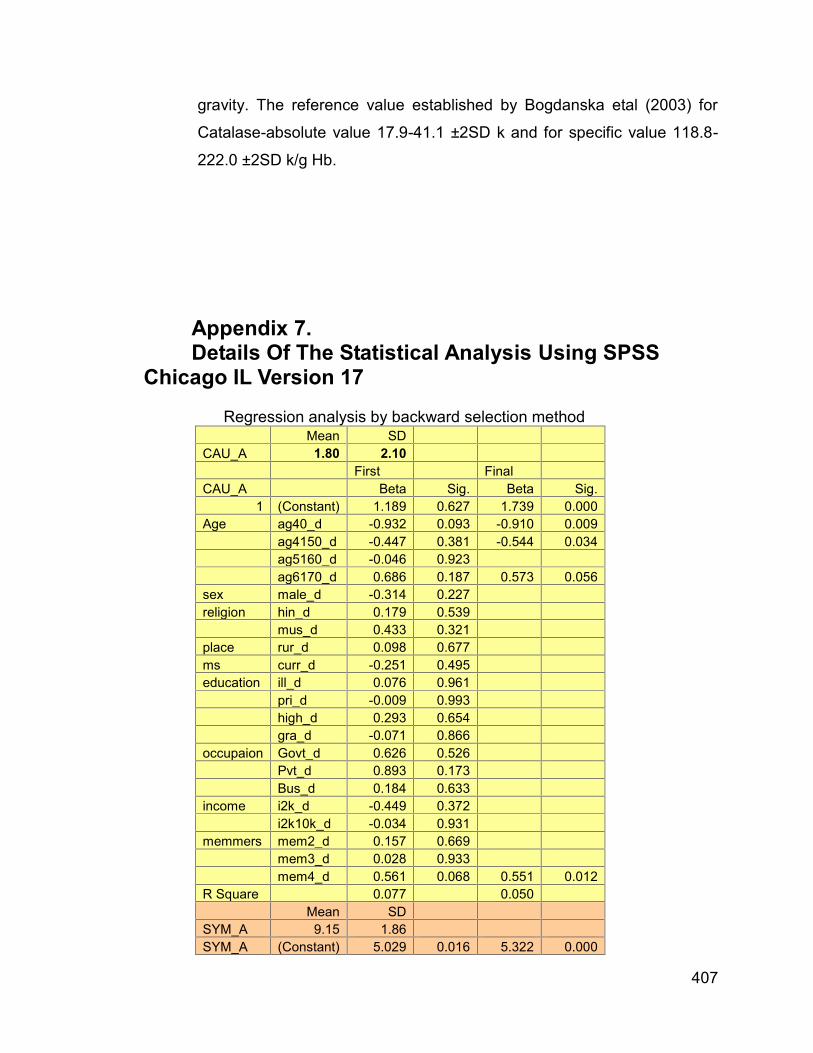
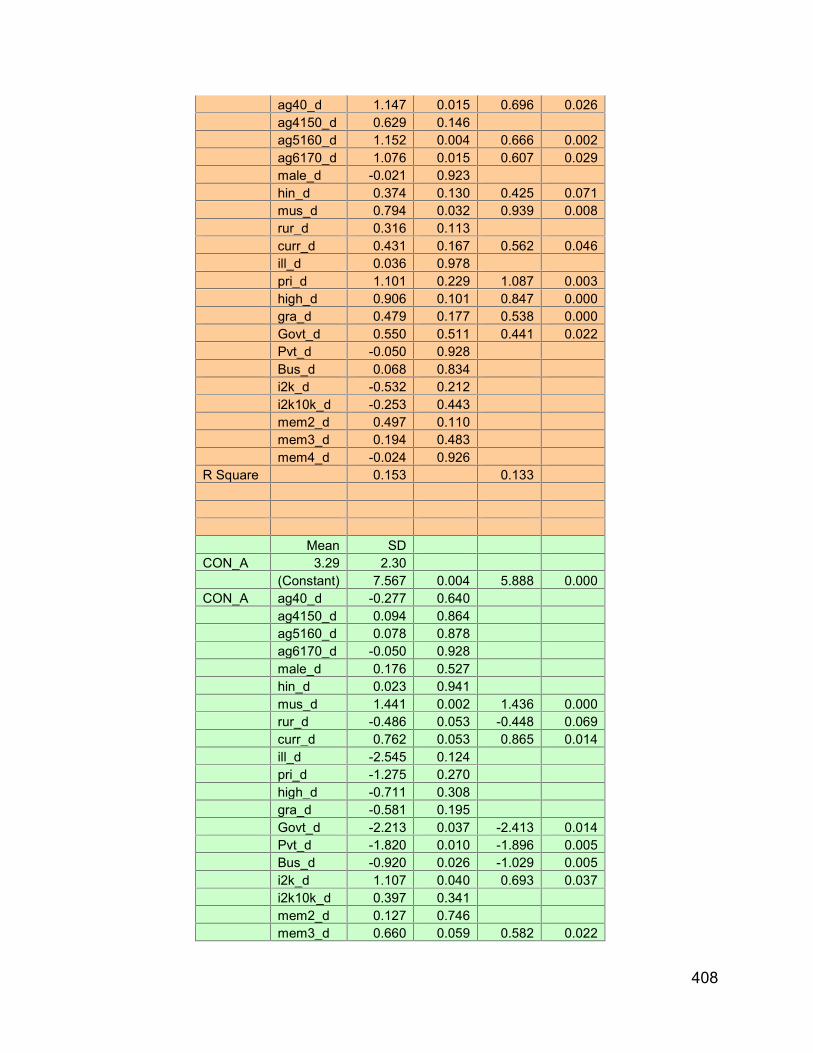
Appendix 7.Details Of The Statistical Analysis Using SPSS
Chicago IL Version 17
Regression analysis by backward selection methodMean SD
CAU_A 1.80 2.10First Final
CAU_A Beta Sig. Beta Sig.1 (Constant) 1.189 0.627 1.739 0.000
Age ag40_d -0.932 0.093 -0.910 0.009ag4150_d -0.447 0.381 -0.544 0.034ag5160_d -0.046 0.923ag6170_d 0.686 0.187 0.573 0.056
sex male_d -0.314 0.227religion hin_d 0.179 0.539
mus_d 0.433 0.321place rur_d 0.098 0.677ms curr_d -0.251 0.495education ill_d 0.076 0.961
pri_d -0.009 0.993high_d 0.293 0.654gra_d -0.071 0.866
occupaion Govt_d 0.626 0.526Pvt_d 0.893 0.173Bus_d 0.184 0.633
income i2k_d -0.449 0.372i2k10k_d -0.034 0.931
memmers mem2_d 0.157 0.669mem3_d 0.028 0.933mem4_d 0.561 0.068 0.551 0.012
R Square 0.077 0.050Mean SD
SYM_A 9.15 1.86SYM_A (Constant) 5.029 0.016 5.322 0.000
408
ag40_d 1.147 0.015 0.696 0.026ag4150_d 0.629 0.146ag5160_d 1.152 0.004 0.666 0.002ag6170_d 1.076 0.015 0.607 0.029male_d -0.021 0.923hin_d 0.374 0.130 0.425 0.071mus_d 0.794 0.032 0.939 0.008rur_d 0.316 0.113curr_d 0.431 0.167 0.562 0.046ill_d 0.036 0.978pri_d 1.101 0.229 1.087 0.003high_d 0.906 0.101 0.847 0.000gra_d 0.479 0.177 0.538 0.000Govt_d 0.550 0.511 0.441 0.022Pvt_d -0.050 0.928Bus_d 0.068 0.834i2k_d -0.532 0.212i2k10k_d -0.253 0.443mem2_d 0.497 0.110mem3_d 0.194 0.483mem4_d -0.024 0.926
R Square 0.153 0.133
Mean SDCON_A 3.29 2.30
(Constant) 7.567 0.004 5.888 0.000CON_A ag40_d -0.277 0.640
ag4150_d 0.094 0.864ag5160_d 0.078 0.878ag6170_d -0.050 0.928male_d 0.176 0.527hin_d 0.023 0.941mus_d 1.441 0.002 1.436 0.000rur_d -0.486 0.053 -0.448 0.069curr_d 0.762 0.053 0.865 0.014ill_d -2.545 0.124pri_d -1.275 0.270high_d -0.711 0.308gra_d -0.581 0.195Govt_d -2.213 0.037 -2.413 0.014Pvt_d -1.820 0.010 -1.896 0.005Bus_d -0.920 0.026 -1.029 0.005i2k_d 1.107 0.040 0.693 0.037i2k10k_d 0.397 0.341mem2_d 0.127 0.746mem3_d 0.660 0.059 0.582 0.022

409
mem4_d 0.206 0.531R Square 0.116 0.099
Mean SDANT_A -1.22 1.52ANT_A (Constant) -5.889 0.001 -4.620 0.000
ag40_d -0.771 0.043 -0.638 0.007ag4150_d -0.205 0.558ag5160_d -0.137 0.674ag6170_d -0.148 0.678male_d 0.215 0.228hin_d 0.375 0.061 0.419 0.030mus_d 0.775 0.010 0.826 0.004rur_d -0.034 0.831curr_d -0.053 0.834ill_d 2.151 0.043 1.309 0.000pri_d 1.512 0.042 0.887 0.001high_d 0.828 0.065 0.484 0.006gra_d 0.233 0.418Govt_d 1.930 0.005 1.700 0.007Pvt_d 0.986 0.029 0.854 0.046Bus_d 0.802 0.003 0.675 0.004i2k_d -0.134 0.697i2k10k_d -0.082 0.761mem2_d 0.044 0.860mem3_d 0.431 0.054 0.387 0.036mem4_d 0.519 0.014 0.472 0.005
R Square 0.166 0.160
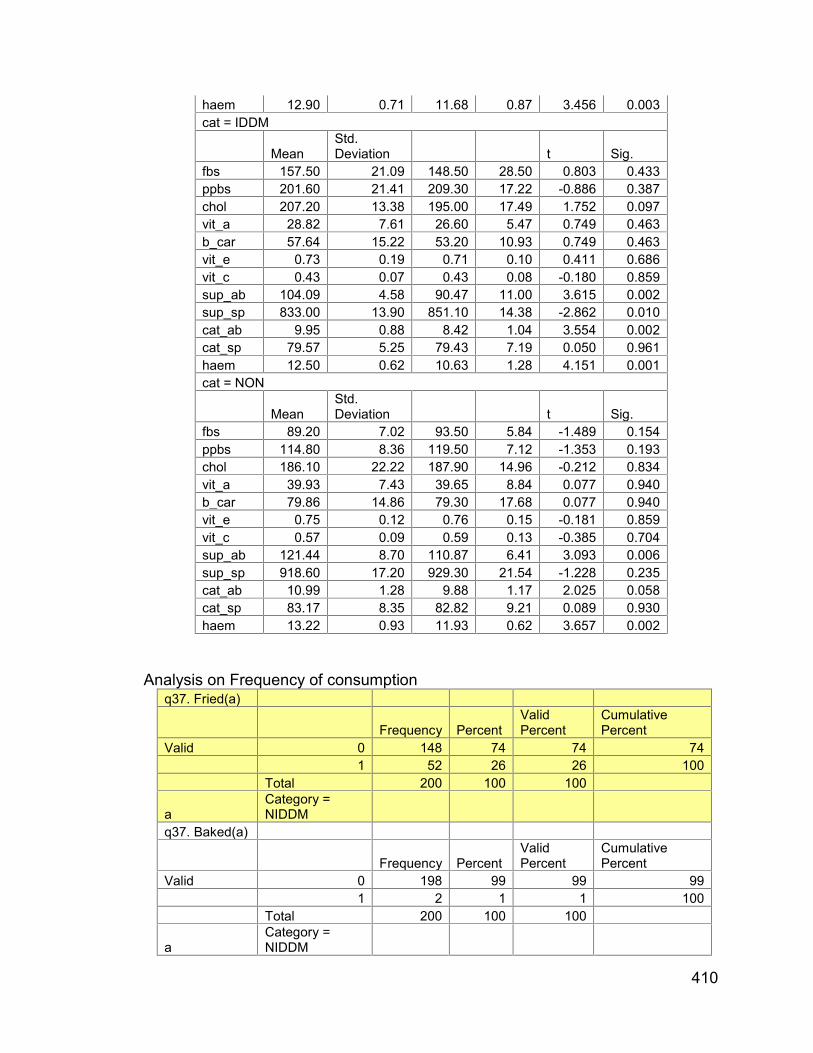
Analysis on the blood profile
cat = NIDDM
MeanStd.Deviation t Sig.
fbs 115.50 15.59 115.00 10.97 0.083 0.935ppbs 187.90 53.65 190.30 69.45 -0.086 0.932chol 225.90 41.15 212.20 31.70 0.834 0.415vit_a 25.32 5.50 29.50 9.09 -1.244 0.229b_car 50.64 10.99 59.00 18.18 -1.244 0.229vit_e 0.71 0.11 0.78 0.20 -0.890 0.385vit_c 0.41 0.06 0.40 0.09 0.258 0.799sup_ab 108.93 6.93 97.57 7.77 3.452 0.003sup_sp 844.30 19.89 835.30 19.25 1.028 0.317cat_ab 9.86 0.94 9.52 1.32 0.659 0.518cat_sp 76.31 4.37 81.45 8.81 -1.653 0.116
410
haem 12.90 0.71 11.68 0.87 3.456 0.003cat = IDDM
MeanStd.Deviation t Sig.
fbs 157.50 21.09 148.50 28.50 0.803 0.433ppbs 201.60 21.41 209.30 17.22 -0.886 0.387chol 207.20 13.38 195.00 17.49 1.752 0.097vit_a 28.82 7.61 26.60 5.47 0.749 0.463b_car 57.64 15.22 53.20 10.93 0.749 0.463vit_e 0.73 0.19 0.71 0.10 0.411 0.686vit_c 0.43 0.07 0.43 0.08 -0.180 0.859sup_ab 104.09 4.58 90.47 11.00 3.615 0.002sup_sp 833.00 13.90 851.10 14.38 -2.862 0.010cat_ab 9.95 0.88 8.42 1.04 3.554 0.002cat_sp 79.57 5.25 79.43 7.19 0.050 0.961haem 12.50 0.62 10.63 1.28 4.151 0.001cat = NON
MeanStd.Deviation t Sig.
fbs 89.20 7.02 93.50 5.84 -1.489 0.154ppbs 114.80 8.36 119.50 7.12 -1.353 0.193chol 186.10 22.22 187.90 14.96 -0.212 0.834vit_a 39.93 7.43 39.65 8.84 0.077 0.940b_car 79.86 14.86 79.30 17.68 0.077 0.940vit_e 0.75 0.12 0.76 0.15 -0.181 0.859vit_c 0.57 0.09 0.59 0.13 -0.385 0.704sup_ab 121.44 8.70 110.87 6.41 3.093 0.006sup_sp 918.60 17.20 929.30 21.54 -1.228 0.235cat_ab 10.99 1.28 9.88 1.17 2.025 0.058cat_sp 83.17 8.35 82.82 9.21 0.089 0.930haem 13.22 0.93 11.93 0.62 3.657 0.002
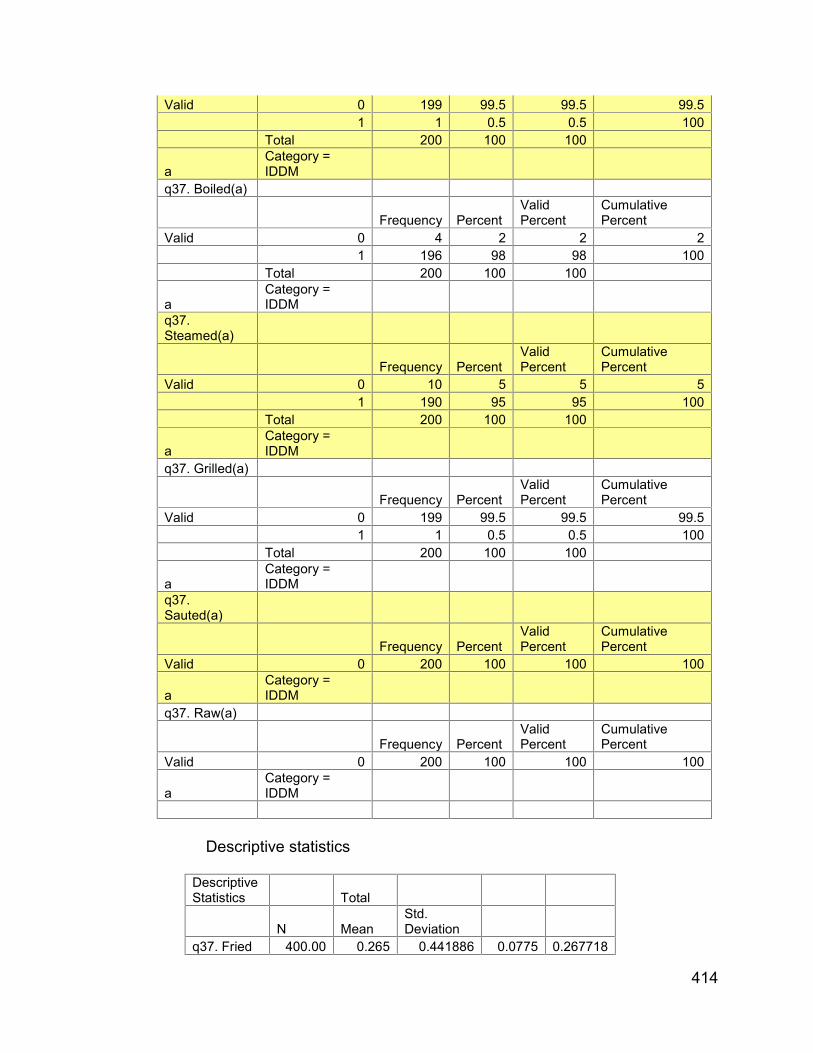
Analysis on Frequency of consumptionq37. Fried(a)
Frequency PercentValidPercent
CumulativePercent
Valid 0 148 74 74 741 52 26 26 100
Total 200 100 100
aCategory =NIDDM
q37. Baked(a)
Frequency PercentValidPercent
CumulativePercent
Valid 0 198 99 99 991 2 1 1 100
Total 200 100 100
aCategory =NIDDM
411
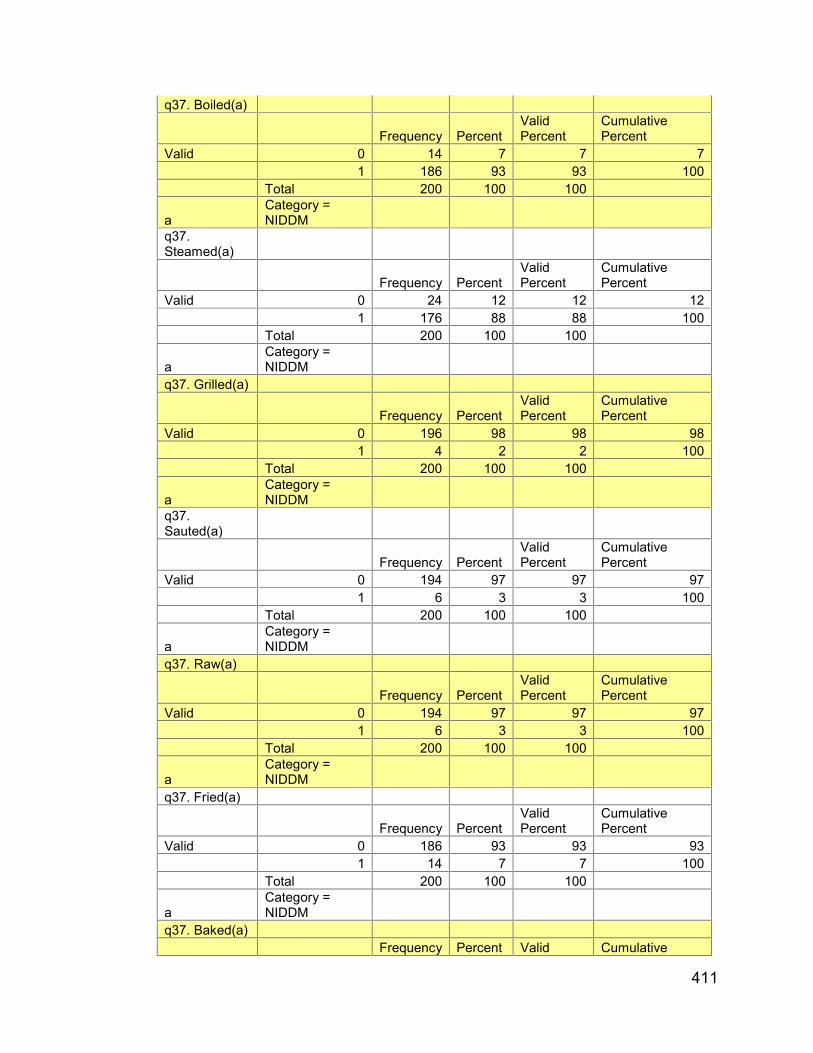
q37. Boiled(a)
Frequency PercentValidPercent
CumulativePercent
Valid 0 14 7 7 71 186 93 93 100
Total 200 100 100
aCategory =NIDDM
q37.Steamed(a)
Frequency PercentValidPercent
CumulativePercent
Valid 0 24 12 12 121 176 88 88 100
Total 200 100 100
aCategory =NIDDM
q37. Grilled(a)
Frequency PercentValidPercent
CumulativePercent
Valid 0 196 98 98 981 4 2 2 100
Total 200 100 100
aCategory =NIDDM
q37.Sauted(a)
Frequency PercentValidPercent
CumulativePercent
Valid 0 194 97 97 971 6 3 3 100
Total 200 100 100
aCategory =NIDDM
q37. Raw(a)
Frequency PercentValidPercent
CumulativePercent
Valid 0 194 97 97 971 6 3 3 100
Total 200 100 100
aCategory =NIDDM
q37. Fried(a)
Frequency PercentValidPercent
CumulativePercent
Valid 0 186 93 93 931 14 7 7 100
Total 200 100 100
aCategory =NIDDM
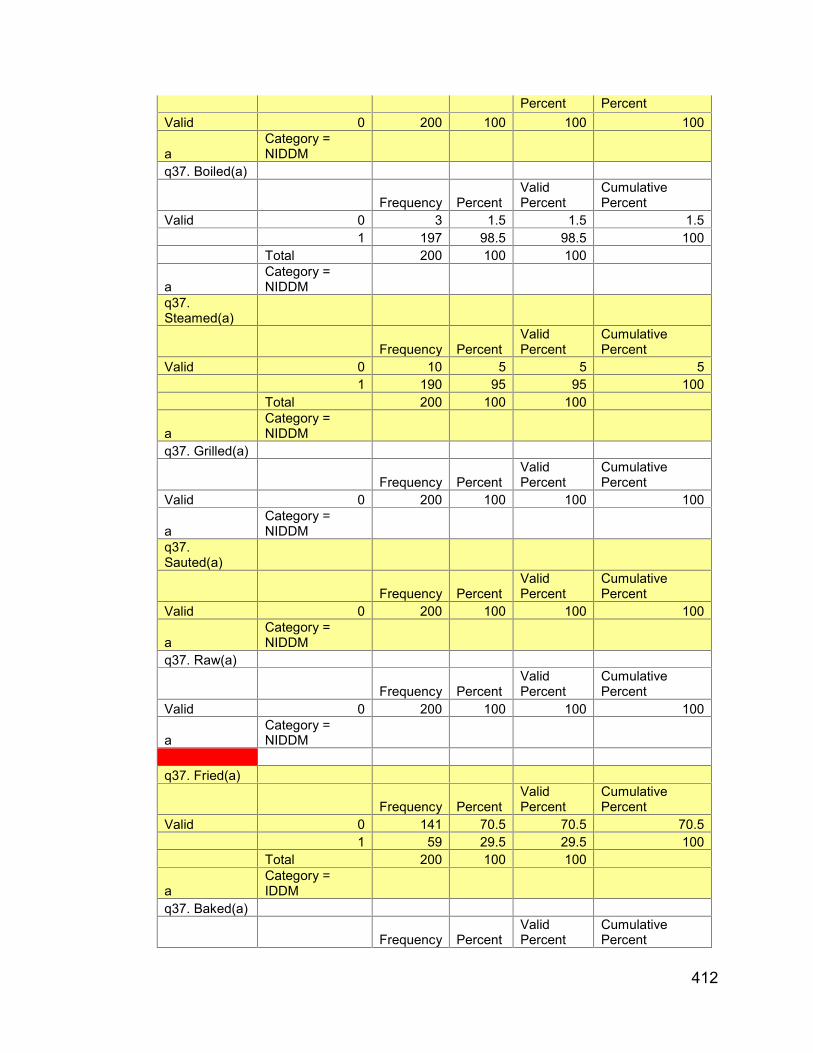
q37. Baked(a)Frequency Percent Valid Cumulative
412
Percent PercentValid 0 200 100 100 100
aCategory =NIDDM
q37. Boiled(a)
Frequency PercentValidPercent
CumulativePercent
Valid 0 3 1.5 1.5 1.51 197 98.5 98.5 100
Total 200 100 100
aCategory =NIDDM
q37.Steamed(a)
Frequency PercentValidPercent
CumulativePercent
Valid 0 10 5 5 51 190 95 95 100
Total 200 100 100
aCategory =NIDDM
q37. Grilled(a)
Frequency PercentValidPercent
CumulativePercent
Valid 0 200 100 100 100
aCategory =NIDDM
q37.Sauted(a)
Frequency PercentValidPercent
CumulativePercent
Valid 0 200 100 100 100
aCategory =NIDDM
q37. Raw(a)
Frequency PercentValidPercent
CumulativePercent
Valid 0 200 100 100 100
aCategory =NIDDM
q37. Fried(a)
Frequency PercentValidPercent
CumulativePercent
Valid 0 141 70.5 70.5 70.51 59 29.5 29.5 100
Total 200 100 100
aCategory =IDDM
q37. Baked(a)
Frequency PercentValidPercent
CumulativePercent

413
Valid 0 200 100 100 100
aCategory =IDDM
q37. Boiled(a)
Frequency PercentValidPercent
CumulativePercent
Valid 0 19 9.5 9.5 9.51 181 90.5 90.5 100
Total 200 100 100
aCategory =IDDM
q37.Steamed(a)
Frequency PercentValidPercent
CumulativePercent
Valid 0 29 14.5 14.5 14.51 171 85.5 85.5 100
Total 200 100 100
aCategory =IDDM
q37. Grilled(a)
Frequency PercentValidPercent
CumulativePercent
Valid 0 200 100 100 100
aCategory =IDDM
q37.Sauted(a)
Frequency PercentValidPercent
CumulativePercent
Valid 0 200 100 100 100
aCategory =IDDM
q37. Raw(a)
Frequency PercentValidPercent
CumulativePercent
Valid 0 191 95.5 95.5 95.51 9 4.5 4.5 100
Total 200 100 100
aCategory =IDDM
q37. Fried(a)
Frequency PercentValidPercent
CumulativePercent
Valid 0 183 91.5 91.5 91.51 17 8.5 8.5 100
Total 200 100 100
aCategory =IDDM
q37. Baked(a)
Frequency PercentValidPercent
CumulativePercent
414
Valid 0 199 99.5 99.5 99.51 1 0.5 0.5 100
Total 200 100 100
aCategory =IDDM
q37. Boiled(a)
Frequency PercentValidPercent
CumulativePercent
Valid 0 4 2 2 21 196 98 98 100
Total 200 100 100
aCategory =IDDM
q37.Steamed(a)
Frequency PercentValidPercent
CumulativePercent
Valid 0 10 5 5 51 190 95 95 100
Total 200 100 100
aCategory =IDDM
q37. Grilled(a)
Frequency PercentValidPercent
CumulativePercent
Valid 0 199 99.5 99.5 99.51 1 0.5 0.5 100
Total 200 100 100
aCategory =IDDM
q37.Sauted(a)
Frequency PercentValidPercent
CumulativePercent
Valid 0 200 100 100 100
aCategory =IDDM
q37. Raw(a)
Frequency PercentValidPercent
CumulativePercent
Valid 0 200 100 100 100
aCategory =IDDM
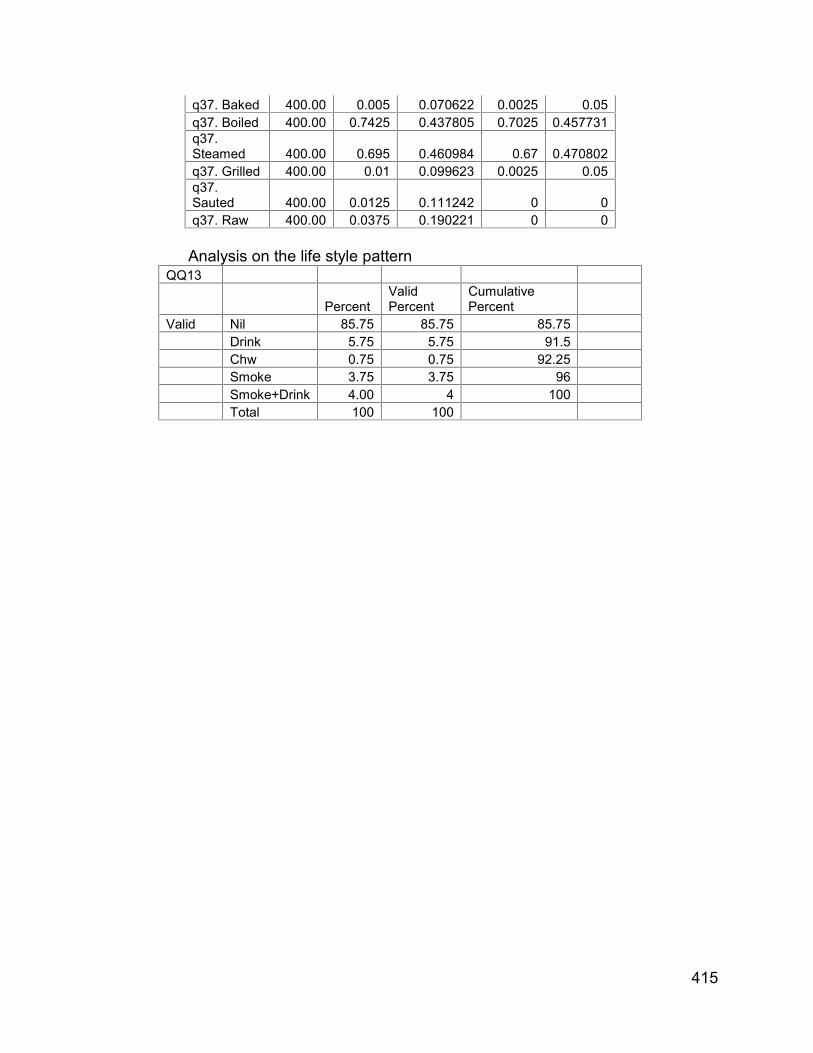
Descriptive statistics
DescriptiveStatistics Total
N MeanStd.Deviation
q37. Fried 400.00 0.265 0.441886 0.0775 0.267718
415
q37. Baked 400.00 0.005 0.070622 0.0025 0.05q37. Boiled 400.00 0.7425 0.437805 0.7025 0.457731q37.Steamed 400.00 0.695 0.460984 0.67 0.470802q37. Grilled 400.00 0.01 0.099623 0.0025 0.05q37.Sauted 400.00 0.0125 0.111242 0 0q37. Raw 400.00 0.0375 0.190221 0 0
Analysis on the life style patternQQ13
PercentValidPercent
CumulativePercent
Valid Nil 85.75 85.75 85.75Drink 5.75 5.75 91.5Chw 0.75 0.75 92.25Smoke 3.75 3.75 96Smoke+Drink 4.00 4 100Total 100 100
416
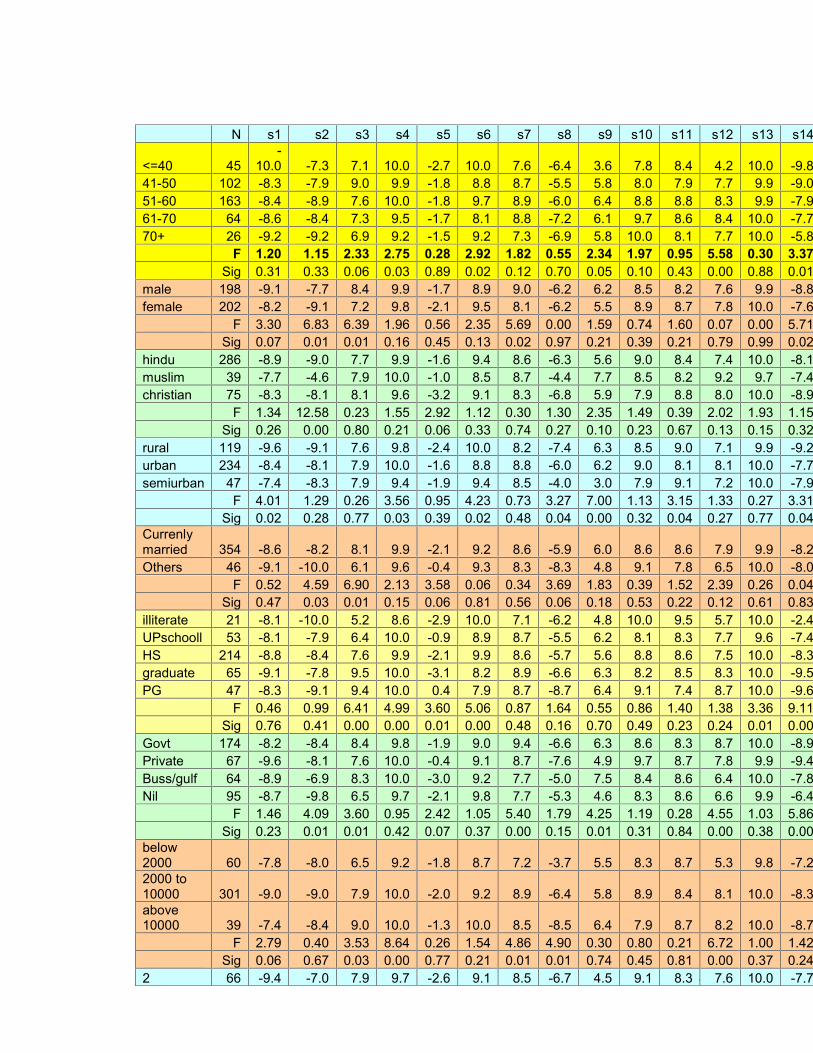
N s1 s2 s3 s4 s5 s6 s7 s8 s9 s10 s11 s12 s13 s14 s15 s16 s17 s18 s19 s20 s21 s22 s23 s24 s25 s26 s27 s28 s29 s30
<=40 45-
10.0 -7.3 7.1 10.0 -2.7 10.0 7.6 -6.4 3.6 7.8 8.4 4.2 10.0 -9.8 -4.0 -9.8 10.0 -7.3 -7.3 -3.1 4.2 1.1 -8.2 0.9 9.6 -9.1 0.0 -1.3 8.7 9.341-50 102 -8.3 -7.9 9.0 9.9 -1.8 8.8 8.7 -5.5 5.8 8.0 7.9 7.7 9.9 -9.0 -3.7 -8.4 9.8 -8.1 -7.3 -7.1 2.7 1.1 -3.5 4.4 9.3 -7.9 -0.2 0.0 9.0 7.851-60 163 -8.4 -8.9 7.6 10.0 -1.8 9.7 8.9 -6.0 6.4 8.8 8.8 8.3 9.9 -7.9 -2.3 -9.3 10.0 -8.8 -6.6 -5.3 3.7 1.3 -5.3 3.1 9.9 -7.6 0.1 -0.1 9.2 9.161-70 64 -8.6 -8.4 7.3 9.5 -1.7 8.1 8.8 -7.2 6.1 9.7 8.6 8.4 10.0 -7.7 -4.4 -8.4 10.0 -7.3 -5.0 -4.2 4.7 2.7 -6.3 3.6 9.4 -7.5 -0.8 0.0 8.3 9.470+ 26 -9.2 -9.2 6.9 9.2 -1.5 9.2 7.3 -6.9 5.8 10.0 8.1 7.7 10.0 -5.8 -3.8 -9.6 10.0 -8.5 -5.8 -5.4 3.5 1.9 -3.5 4.6 9.6 -8.1 1.2 0.0 8.1 7.3
F 1.20 1.15 2.33 2.75 0.28 2.92 1.82 0.55 2.34 1.97 0.95 5.58 0.30 3.37 0.99 3.10 0.73 1.19 1.47 6.13 1.56 2.27 3.36 2.15 0.95 0.90 4.12 9.15 1.27 2.82Sig 0.31 0.33 0.06 0.03 0.89 0.02 0.12 0.70 0.05 0.10 0.43 0.00 0.88 0.01 0.42 0.02 0.57 0.32 0.21 0.00 0.18 0.06 0.01 0.07 0.43 0.47 0.00 0.00 0.28 0.02
male 198 -9.1 -7.7 8.4 9.9 -1.7 8.9 9.0 -6.2 6.2 8.5 8.2 7.6 9.9 -8.8 -3.3 -8.8 10.0 -8.9 -6.3 -6.0 3.2 1.4 -4.8 3.6 9.6 -7.7 -0.2 -0.3 8.9 9.1female 202 -8.2 -9.1 7.2 9.8 -2.1 9.5 8.1 -6.2 5.5 8.9 8.7 7.8 10.0 -7.6 -3.3 -9.3 9.9 -7.5 -6.7 -4.8 4.1 1.6 -5.6 3.1 9.6 -8.0 0.0 -0.1 8.8 8.4
F 3.30 6.83 6.39 1.96 0.56 2.35 5.69 0.00 1.59 0.74 1.60 0.07 0.00 5.71 0.01 2.51 0.98 7.56 0.42 5.68 2.83 0.36 1.11 0.61 0.13 0.34 1.33 0.55 0.14 2.99Sig 0.07 0.01 0.01 0.16 0.45 0.13 0.02 0.97 0.21 0.39 0.21 0.79 0.99 0.02 0.94 0.11 0.32 0.01 0.52 0.02 0.09 0.55 0.29 0.43 0.72 0.56 0.25 0.46 0.71 0.08
hindu 286 -8.9 -9.0 7.7 9.9 -1.6 9.4 8.6 -6.3 5.6 9.0 8.4 7.4 10.0 -8.1 -3.2 -9.0 9.9 -8.6 -6.2 -5.0 4.1 1.6 -4.8 2.8 9.6 -8.1 0.1 -0.2 9.1 8.6muslim 39 -7.7 -4.6 7.9 10.0 -1.0 8.5 8.7 -4.4 7.7 8.5 8.2 9.2 9.7 -7.4 -1.0 -8.2 10.0 -6.4 -5.9 -6.7 2.6 1.3 -4.4 4.1 9.5 -5.1 -0.3 0.0 9.0 9.5christian 75 -8.3 -8.1 8.1 9.6 -3.2 9.1 8.3 -6.8 5.9 7.9 8.8 8.0 10.0 -8.9 -4.9 -9.6 10.0 -7.7 -8.1 -6.0 2.5 1.1 -7.3 4.9 9.6 -8.4 -0.7 -0.4 7.9 8.9
F 1.34 12.58 0.23 1.55 2.92 1.12 0.30 1.30 2.35 1.49 0.39 2.02 1.93 1.15 2.94 2.94 0.20 3.15 2.89 2.61 3.79 0.70 3.26 2.76 0.04 6.73 3.92 1.21 4.00 0.94Sig 0.26 0.00 0.80 0.21 0.06 0.33 0.74 0.27 0.10 0.23 0.67 0.13 0.15 0.32 0.05 0.05 0.82 0.04 0.06 0.07 0.02 0.50 0.04 0.06 0.96 0.00 0.02 0.30 0.02 0.39
rural 119 -9.6 -9.1 7.6 9.8 -2.4 10.0 8.2 -7.4 6.3 8.5 9.0 7.1 9.9 -9.2 -1.3 -9.2 10.0 -8.7 -6.6 -5.6 4.4 1.9 -4.6 4.1 10.0 -8.7 0.0 0.0 9.3 8.8urban 234 -8.4 -8.1 7.9 10.0 -1.6 8.8 8.8 -6.0 6.2 9.0 8.1 8.1 10.0 -7.7 -4.3 -9.1 9.9 -8.1 -6.8 -5.5 2.9 1.5 -5.6 3.5 9.3 -7.9 -0.1 -0.3 8.6 8.8semiurban 47 -7.4 -8.3 7.9 9.4 -1.9 9.4 8.5 -4.0 3.0 7.9 9.1 7.2 10.0 -7.9 -3.4 -8.3 10.0 -7.7 -4.7 -3.8 6.0 0.0 -4.9 0.9 10.0 -5.7 -0.2 0.0 9.1 8.3
F 4.01 1.29 0.26 3.56 0.95 4.23 0.73 3.27 7.00 1.13 3.15 1.33 0.27 3.31 4.95 1.62 0.35 0.73 2.19 2.41 8.68 4.80 0.63 3.54 3.62 6.13 0.17 2.92 1.96 0.28Sig 0.02 0.28 0.77 0.03 0.39 0.02 0.48 0.04 0.00 0.32 0.04 0.27 0.77 0.04 0.01 0.20 0.70 0.48 0.11 0.09 0.00 0.01 0.54 0.03 0.03 0.00 0.85 0.06 0.14 0.75
Currenlymarried 354 -8.6 -8.2 8.1 9.9 -2.1 9.2 8.6 -5.9 6.0 8.6 8.6 7.9 9.9 -8.2 -3.4 -9.2 9.9 -8.2 -6.4 -5.6 3.4 1.4 -5.5 3.3 9.7 -7.9 -0.1 -0.2 8.9 8.9Others 46 -9.1 -10.0 6.1 9.6 -0.4 9.3 8.3 -8.3 4.8 9.1 7.8 6.5 10.0 -8.0 -2.6 -8.0 10.0 -7.8 -7.6 -3.5 5.9 2.0 -3.0 3.5 8.5 -7.6 0.2 0.0 8.7 7.2
F 0.52 4.59 6.90 2.13 3.58 0.06 0.34 3.69 1.83 0.39 1.52 2.39 0.26 0.04 0.36 5.74 0.13 0.25 1.45 7.13 9.36 0.89 3.86 0.02 10.54 0.15 0.93 1.06 0.14 7.19Sig 0.47 0.03 0.01 0.15 0.06 0.81 0.56 0.06 0.18 0.53 0.22 0.12 0.61 0.83 0.55 0.02 0.72 0.62 0.23 0.01 0.00 0.35 0.05 0.90 0.00 0.70 0.33 0.30 0.71 0.01
illiterate 21 -8.1 -10.0 5.2 8.6 -2.9 10.0 7.1 -6.2 4.8 10.0 9.5 5.7 10.0 -2.4 -2.9 -9.0 10.0 -4.3 -1.4 -3.3 5.7 0.5 -6.2 3.3 9.5 -5.7 0.0 0.0 7.1 6.2UPschooll 53 -8.1 -7.9 6.4 10.0 -0.9 8.9 8.7 -5.5 6.2 8.1 8.3 7.7 9.6 -7.4 -0.2 -8.7 9.6 -7.5 -4.2 -5.5 3.8 1.3 -3.6 1.3 9.4 -5.8 -0.4 0.0 8.9 7.9HS 214 -8.8 -8.4 7.6 9.9 -2.1 9.9 8.6 -5.7 5.6 8.8 8.6 7.5 10.0 -8.3 -2.5 -9.1 10.0 -8.4 -7.2 -5.0 3.8 1.7 -4.8 3.6 9.9 -8.2 -0.1 -0.1 9.2 9.0graduate 65 -9.1 -7.8 9.5 10.0 -3.1 8.2 8.9 -6.6 6.3 8.2 8.5 8.3 10.0 -9.5 -6.3 -9.1 10.0 -8.8 -8.0 -6.6 2.5 1.1 -6.8 3.8 9.7 -8.5 0.0 -0.5 8.5 8.3PG 47 -8.3 -9.1 9.4 10.0 0.4 7.9 8.7 -8.7 6.4 9.1 7.4 8.7 10.0 -9.6 -6.6 -9.1 10.0 -9.1 -6.4 -5.7 3.8 1.5 -6.6 3.6 8.3 -8.9 0.4 -0.4 8.9 10.0
F 0.46 0.99 6.41 4.99 3.60 5.06 0.87 1.64 0.55 0.86 1.40 1.38 3.36 9.11 6.67 0.21 1.65 3.68 6.77 2.12 1.73 0.85 1.76 1.22 4.14 4.19 0.95 1.35 1.92 4.01Sig 0.76 0.41 0.00 0.00 0.01 0.00 0.48 0.16 0.70 0.49 0.23 0.24 0.01 0.00 0.00 0.93 0.16 0.01 0.00 0.08 0.14 0.49 0.14 0.30 0.00 0.00 0.44 0.25 0.11 0.00
Govt 174 -8.2 -8.4 8.4 9.8 -1.9 9.0 9.4 -6.6 6.3 8.6 8.3 8.7 10.0 -8.9 -4.7 -8.6 10.0 -8.5 -6.5 -5.8 3.8 1.7 -4.7 3.1 9.3 -8.3 -0.1 -0.1 9.3 9.4Private 67 -9.6 -8.1 7.6 10.0 -0.4 9.1 8.7 -7.6 4.9 9.7 8.7 7.8 9.9 -9.4 -4.5 -9.6 10.0 -9.1 -8.1 -4.5 4.3 1.8 -5.2 2.8 10.0 -7.6 -0.3 -0.4 8.2 8.2Buss/gulf 64 -8.9 -6.9 8.3 10.0 -3.0 9.2 7.7 -5.0 7.5 8.4 8.6 6.4 10.0 -7.8 -2.2 -9.4 10.0 -8.6 -8.4 -6.3 1.1 1.4 -6.7 5.8 9.7 -7.7 -0.5 -0.5 8.0 9.5Nil 95 -8.7 -9.8 6.5 9.7 -2.1 9.8 7.7 -5.3 4.6 8.3 8.6 6.6 9.9 -6.4 -0.7 -9.2 9.8 -6.7 -4.2 -4.5 4.7 0.8 -5.2 2.5 9.8 -7.5 0.3 0.0 9.2 7.4
F 1.46 4.09 3.60 0.95 2.42 1.05 5.40 1.79 4.25 1.19 0.28 4.55 1.03 5.86 5.51 2.16 1.07 3.35 7.45 2.64 7.21 1.37 0.97 3.04 1.54 0.67 1.96 2.36 3.47 5.99Sig 0.23 0.01 0.01 0.42 0.07 0.37 0.00 0.15 0.01 0.31 0.84 0.00 0.38 0.00 0.00 0.09 0.36 0.02 0.00 0.05 0.00 0.25 0.40 0.03 0.20 0.57 0.12 0.07 0.02 0.00
below2000 60 -7.8 -8.0 6.5 9.2 -1.8 8.7 7.2 -3.7 5.5 8.3 8.7 5.3 9.8 -7.2 -1.7 -8.7 10.0 -7.7 -5.0 -4.5 4.2 0.8 -4.7 2.3 9.5 -6.7 -0.3 -0.2 8.3 8.02000 to10000 301 -9.0 -9.0 7.9 10.0 -2.0 9.2 8.9 -6.4 5.8 8.9 8.4 8.1 10.0 -8.3 -3.3 -9.0 9.9 -8.3 -6.7 -5.4 3.6 1.6 -5.0 3.6 9.6 -8.0 -0.1 -0.2 9.0 8.7above10000 39 -7.4 -8.4 9.0 10.0 -1.3 10.0 8.5 -8.5 6.4 7.9 8.7 8.2 10.0 -8.7 -5.6
-10.0 10.0 -7.9 -7.4 -5.9 3.3 1.8 -7.7 2.8 9.5 -8.7 0.3 -0.3 8.5 10.0
F 2.79 0.40 3.53 8.64 0.26 1.54 4.86 4.90 0.30 0.80 0.21 6.72 1.00 1.42 2.70 2.61 0.16 0.44 2.17 1.12 0.36 1.14 2.09 0.91 0.11 2.40 0.87 0.05 1.34 2.71Sig 0.06 0.67 0.03 0.00 0.77 0.21 0.01 0.01 0.74 0.45 0.81 0.00 0.37 0.24 0.07 0.07 0.85 0.65 0.12 0.33 0.70 0.32 0.12 0.40 0.89 0.09 0.42 0.95 0.26 0.07
2 66 -9.4 -7.0 7.9 9.7 -2.6 9.1 8.5 -6.7 4.5 9.1 8.3 7.6 10.0 -7.7 -4.2 -9.5 10.0 -9.1 -5.8 -3.9 4.1 1.5 -6.8 0.6 9.7 -7.3 -0.2 -0.8 9.7 9.1
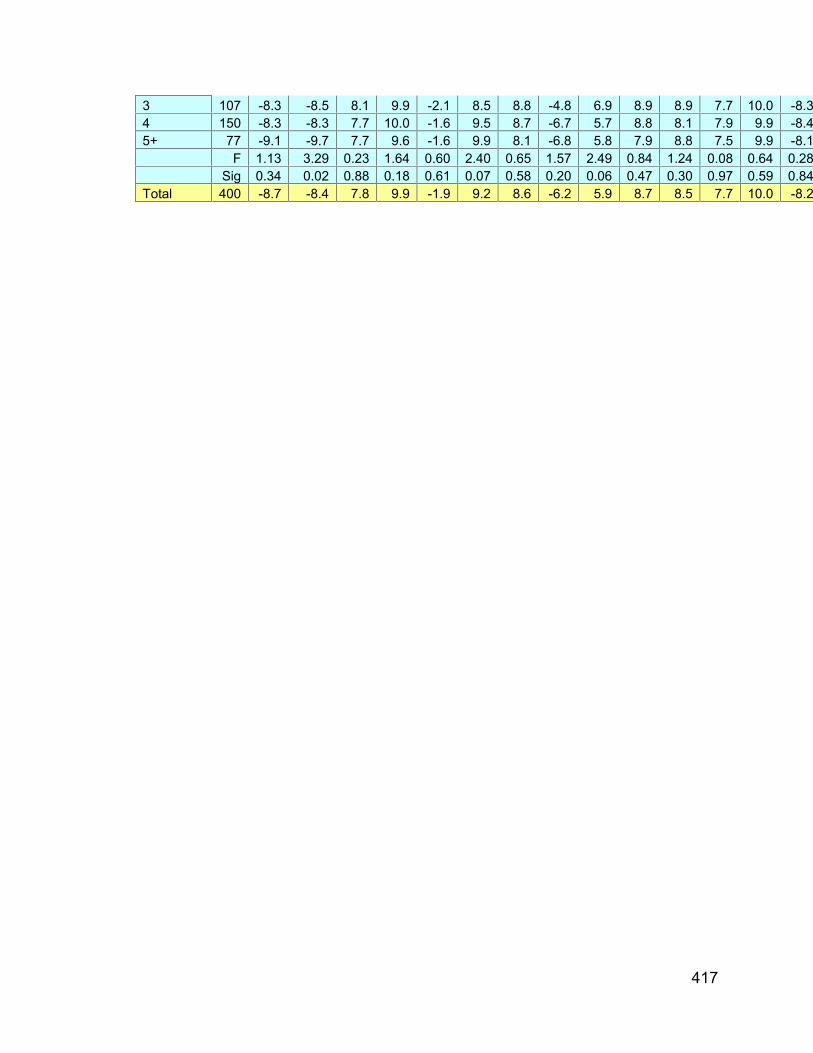
417
3 107 -8.3 -8.5 8.1 9.9 -2.1 8.5 8.8 -4.8 6.9 8.9 8.9 7.7 10.0 -8.3 -3.0 -8.9 10.0 -7.5 -6.9 -6.2 2.8 1.6 -5.2 4.2 9.1 -8.1 -0.7 -0.1 9.3 8.64 150 -8.3 -8.3 7.7 10.0 -1.6 9.5 8.7 -6.7 5.7 8.8 8.1 7.9 9.9 -8.4 -2.9 -8.7 9.9 -7.9 -6.5 -5.4 4.0 1.7 -4.5 4.0 9.9 -7.9 0.2 0.0 8.5 8.95+ 77 -9.1 -9.7 7.7 9.6 -1.6 9.9 8.1 -6.8 5.8 7.9 8.8 7.5 9.9 -8.1 -3.6 -9.4 10.0 -9.0 -6.6 -5.3 3.9 0.9 -5.2 3.2 9.7 -8.1 0.3 -0.3 8.4 8.3
F 1.13 3.29 0.23 1.64 0.60 2.40 0.65 1.57 2.49 0.84 1.24 0.08 0.64 0.28 0.46 1.56 0.55 1.90 0.44 2.65 1.37 0.77 1.24 4.16 2.30 0.44 4.03 4.89 2.79 0.50Sig 0.34 0.02 0.88 0.18 0.61 0.07 0.58 0.20 0.06 0.47 0.30 0.97 0.59 0.84 0.71 0.20 0.65 0.13 0.72 0.05 0.25 0.51 0.30 0.01 0.08 0.73 0.01 0.00 0.04 0.68
Total 400 -8.7 -8.4 7.8 9.9 -1.9 9.2 8.6 -6.2 5.9 8.7 8.5 7.7 10.0 -8.2 -3.3 -9.0 10.0 -8.2 -6.5 -5.4 3.7 1.5 -5.2 3.4 9.6 -7.9 -0.1 -0.2 8.9 8.7

418
Appendix 8.Sample Diabetic Menu
Diet -1300KCalsTime Meal Menu Measure6.30 Early Morning Tea/Coffee with out sugar Using 50ml Milk8.30 Break Fast Iddly,
Sambar,Guava
2 iddlies½ cup100 g
10.30 Mid Morning Vegetable Soup ! Cup12.30 Lunch Boiled Rice,
Dhal-Amaranth curry,Beans Pugath,Orange
1 cup½ cup½ cup100g
4.30 Evening Tea Spirulina BiscuitTea/Coffee with out sugar
2 Nos.Using 50ml Milk
8.30 Dinner Chapathi,Egg Curry,Vegetable Salad
2 (6”dia)1 egg1Cup
10.30 Bed Time Oats Using 50ml MilkOil for the days diet-20ml
Diet -1500KCalsTime Meal Menu Measure6.30 Early Morning Tea/Coffee with out sugar Using 50ml Milk8.30 Break Fast Dosa,
Sambar,Ground Nut chutneyGuava
2 Nos.½ cup25g nuts100 g
10.30 Mid Morning Vegetable Salads ! Cup12.30 Lunch Vegetable Rice,
Chicken CurryAmaranth curry,Butter milkAssorted Fruits
2 cup1 portion½ cup1 Cup100g
4.30 Evening Tea Spirulina BiscuitTea/Coffee with out sugar
2 Nos.Using 50ml Milk
8.30 Dinner Chapathi,Dhal Curry,Vegetable Salad
2 (6”dia)1 Cup1Cup
10.30 Bed Time Oats Using 50ml MilkOil for the days diet-25ml

419
Diet -1700KCalsTime Meal Menu Measure6.30 Early Morning Tea/Coffee with out sugar Using 50ml Milk8.30 Break Fast Iddly,
Boiled EggSambar,Assorted Fruits
3 iddlies1Egg1 cup100 g
10.30 Mid Morning Thick Vegetable Soup ! Cup12.30 Lunch Boiled Rice,
Dhal-Amaranth curry,Assorted VegetablesCurdFruit Cup
3 cup½ cup1 cup1Cup100g
4.30 Evening Tea Spirulina BiscuitTea/Coffee with out sugar
3 Nos.Using 50ml Milk
6.30 Mid Evening BreadVegetable Soup
2 Slices1 Cup
8.30 Dinner Potato Stuffed Chapathi,Chicken Curry,Vegetable Salad
3 (6”dia)1 Portion1 Cup
10.30 Bed Time Oats Using 50ml MilkOil for the days diet-30ml
Diet -1900KCalsTime Meal Menu Measure6.30 Early Morning Tea/Coffee with out sugar
Corn FlakesUsing 50ml MilkUsing 75ml Milk
8.30 Break Fast Appam,Meat Curry,Assorted Fruits
4 Nos.1 Portion100 g
10.30 Mid Morning Thick Vegetable SoupVegetable Sandwich
! Cup2 Slice of Bread
12.30 Lunch Vegetable Rice,Mint ChutneyEgg Curry,CurdAssorted Vegetables
3 cup25g½ egg1 cup1Cup
4.30 Evening Tea Spirulina BiscuitTea/Coffee with out sugar
4 Nos.Using 50ml Milk
6.30 Mid Evening Bread rollsVegetable Soup
1 Nos.1 Cup
8.30 Dinner Paratha,Palak-Paneer Curry,Vegetable Salad
3 (6”dia)1 Portion1 Cup
10.30 Bed Time Oats Using 50ml MilkOil for the days diet-35ml

420
Appendix 9.Score Card for the evaluation of the spirulina basedproducts
RECIPE No:ANDNAME OF RECIPES
STANDARD(S) /VARIATONS(V)
SCORES OBTAINED (MAX SCORE = 100)Total Score(MAX=600)
PercentageScore (%)APPEARANCE COLOUR FLAVOUR DONENESS TASTE TEXTURE
R1SPIRULINA IDLY
S1 80 75 90 75 80 80 480 80.00V1 75 60 85 75 82 75 452 75.30
R2SPIRULINA IDIAPPAM
S2 63 75 76 65 69 65 413 68.80V2 70 71 80 75 73 63 432 72.00
R3SPIRULINA UPPUMAVU
S3 75 80 90 76 80 76 477 79.50V3 85 83 79 80 85 81 493 82.10
R4SPIRULINA PUTTU
S4 70 73 79 58 60 69 409 68.10V4 63 80 83 65 65 75 431 71.80
R5SPIRULINAGODHUMBU DOSAI
S5 60 63 69 70 65 60 387 64.50
V5 63 65 60 65 60 65 378 63.00
R6SPIRULINA DOSA
S6 70 73 75 79 70 71 438 73.00V6 65 63 65 62 60 62 377 62.80
R7SPIRULINA WHEAT-CURD
S7 70 73 75 71 70 69 428 71.30
V7 75 78 80 82 73 75 463 77.10
R8SPIRULINA BEANSTHORAN
S8 65 63 90 80 83 74 455 75.80
V8 61 70 72 69 73 75 420 70 .00
R9SPIRULINA CHUTNEY
S9 70 72 69 73 70 65 419 69.80V9 65 67 73 75 75 70 425 70.80
R10SPIRULINA SAMBAR
S10 65 74 75 73 72 65 424 70.60V10 60 67 63 55 61 59 365 60.80
R11SPIRULINA CABBAGETHORAN
S11 70 83 72 78 73 70 446 74.30
V11 73 75 79 69 70 65 431 71.80
R12SPIRULINA GREENSALAD
S12 73 75 75 70 73 69 435 72.50
V12 65 69 60 67 68 60 389 64.80
R13SPIRULINA BITTERGOURD JUICE
S13 80 82 75 69 60 72 438 73.00
V13 75 80 81 65 55 70 426 71.00
R14SPIRULINA TEA
S14 75 73 69 75 77 75 444 74.00V14 69 70 79 73 79 65 435 72.50
421
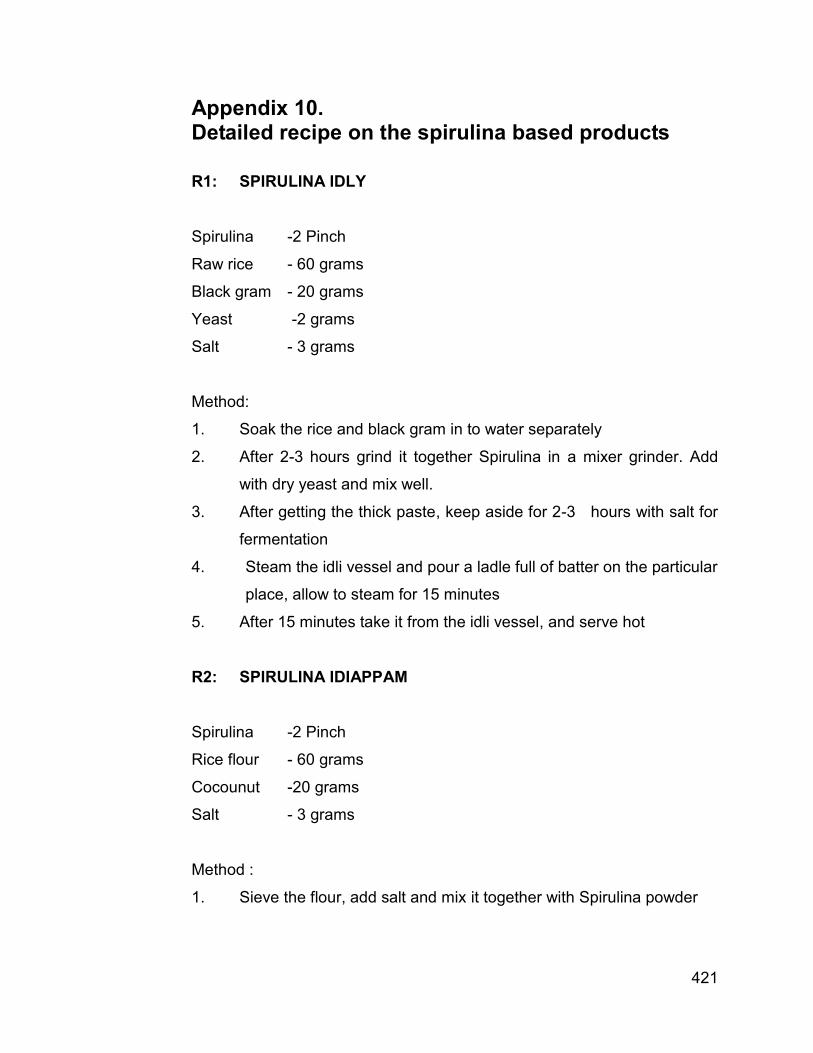
Appendix 10.Detailed recipe on the spirulina based products
R1: SPIRULINA IDLY
Spirulina -2 Pinch
Raw rice - 60 grams
Black gram - 20 grams
Yeast -2 grams
Salt - 3 grams
Method:
1. Soak the rice and black gram in to water separately
2. After 2-3 hours grind it together Spirulina in a mixer grinder. Add
with dry yeast and mix well.
3. After getting the thick paste, keep aside for 2-3 hours with salt for
fermentation
4. Steam the idli vessel and pour a ladle full of batter on the particular
place, allow to steam for 15 minutes
5. After 15 minutes take it from the idli vessel, and serve hot
R2: SPIRULINA IDIAPPAM
Spirulina -2 Pinch
Rice flour - 60 grams
Cocounut -20 grams
Salt - 3 grams
Method :
1. Sieve the flour, add salt and mix it together with Spirulina powder
422
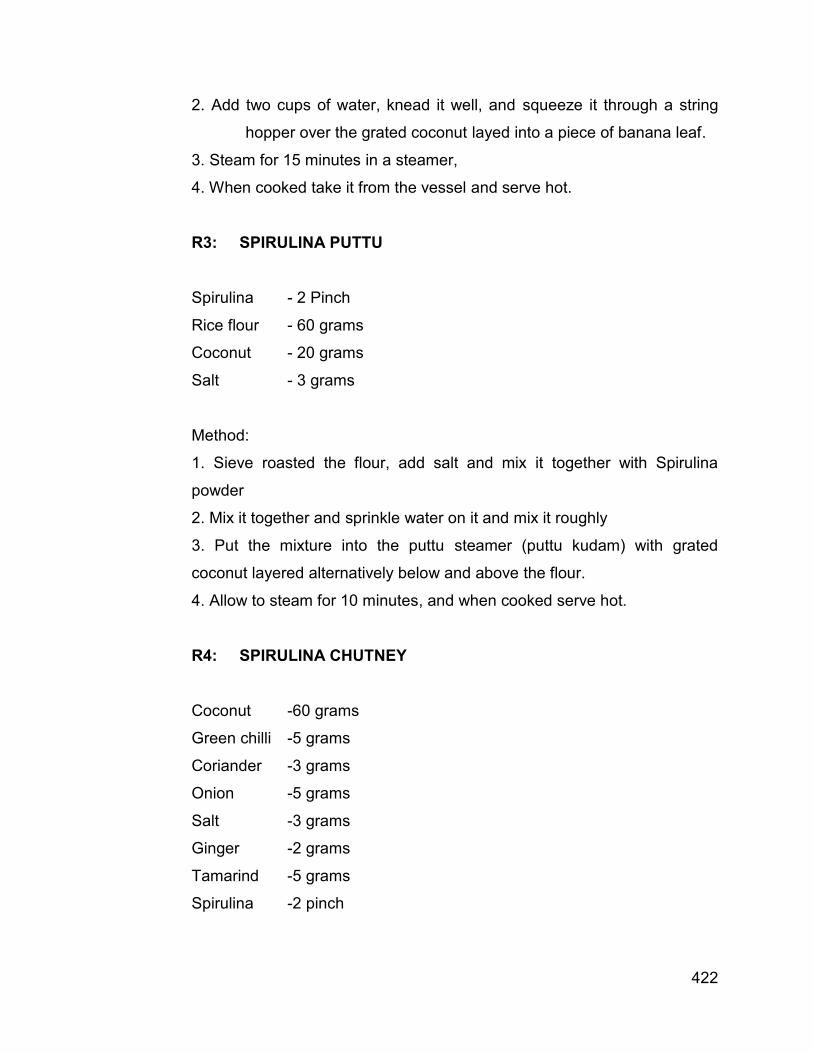
2. Add two cups of water, knead it well, and squeeze it through a string
hopper over the grated coconut layed into a piece of banana leaf.
3. Steam for 15 minutes in a steamer,
4. When cooked take it from the vessel and serve hot.
R3: SPIRULINA PUTTU
Spirulina - 2 Pinch
Rice flour - 60 grams
Coconut - 20 grams
Salt - 3 grams
Method:
1. Sieve roasted the flour, add salt and mix it together with Spirulina
powder
2. Mix it together and sprinkle water on it and mix it roughly
3. Put the mixture into the puttu steamer (puttu kudam) with grated
coconut layered alternatively below and above the flour.
4. Allow to steam for 10 minutes, and when cooked serve hot.
R4: SPIRULINA CHUTNEY
Coconut -60 grams
Green chilli -5 grams
Coriander -3 grams
Onion -5 grams
Salt -3 grams
Ginger -2 grams
Tamarind -5 grams
Spirulina -2 pinch
423
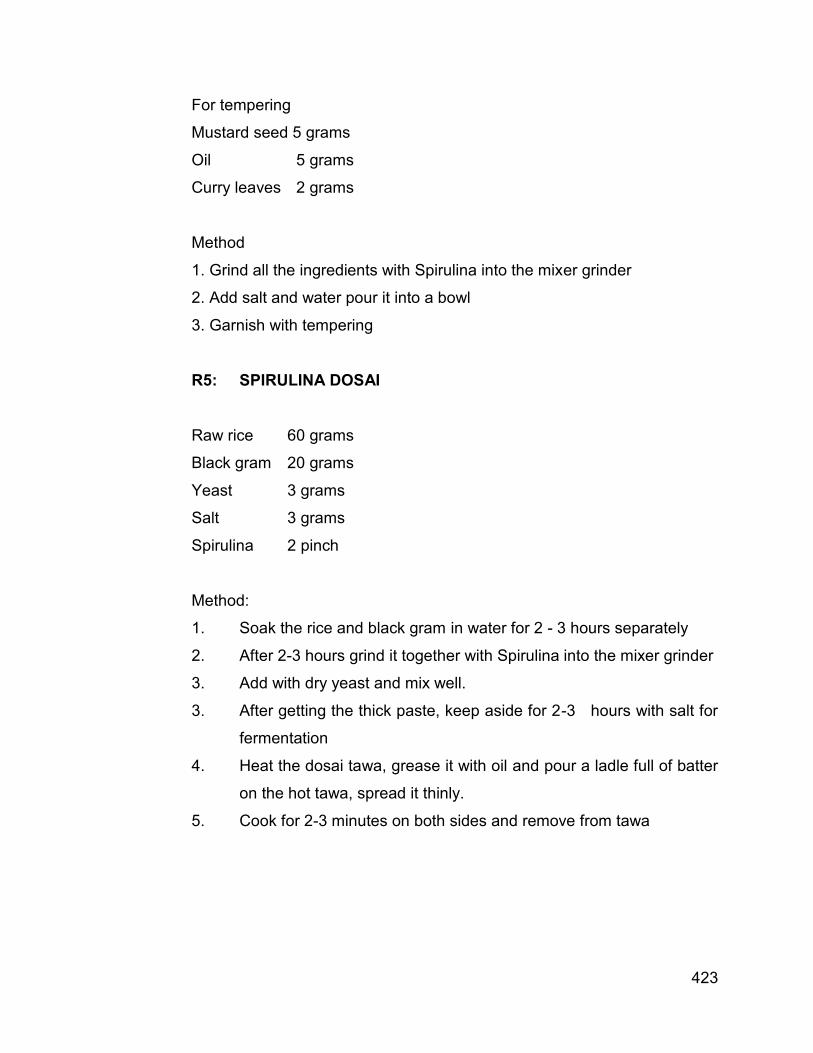
For tempering
Mustard seed 5 grams
Oil 5 grams
Curry leaves 2 grams
Method
1. Grind all the ingredients with Spirulina into the mixer grinder
2. Add salt and water pour it into a bowl
3. Garnish with tempering
R5: SPIRULINA DOSAI
Raw rice 60 grams
Black gram 20 grams
Yeast 3 grams
Salt 3 grams
Spirulina 2 pinch
Method:
1. Soak the rice and black gram in water for 2 - 3 hours separately
2. After 2-3 hours grind it together with Spirulina into the mixer grinder
3. Add with dry yeast and mix well.
3. After getting the thick paste, keep aside for 2-3 hours with salt for
fermentation
4. Heat the dosai tawa, grease it with oil and pour a ladle full of batter
on the hot tawa, spread it thinly.
5. Cook for 2-3 minutes on both sides and remove from tawa
424
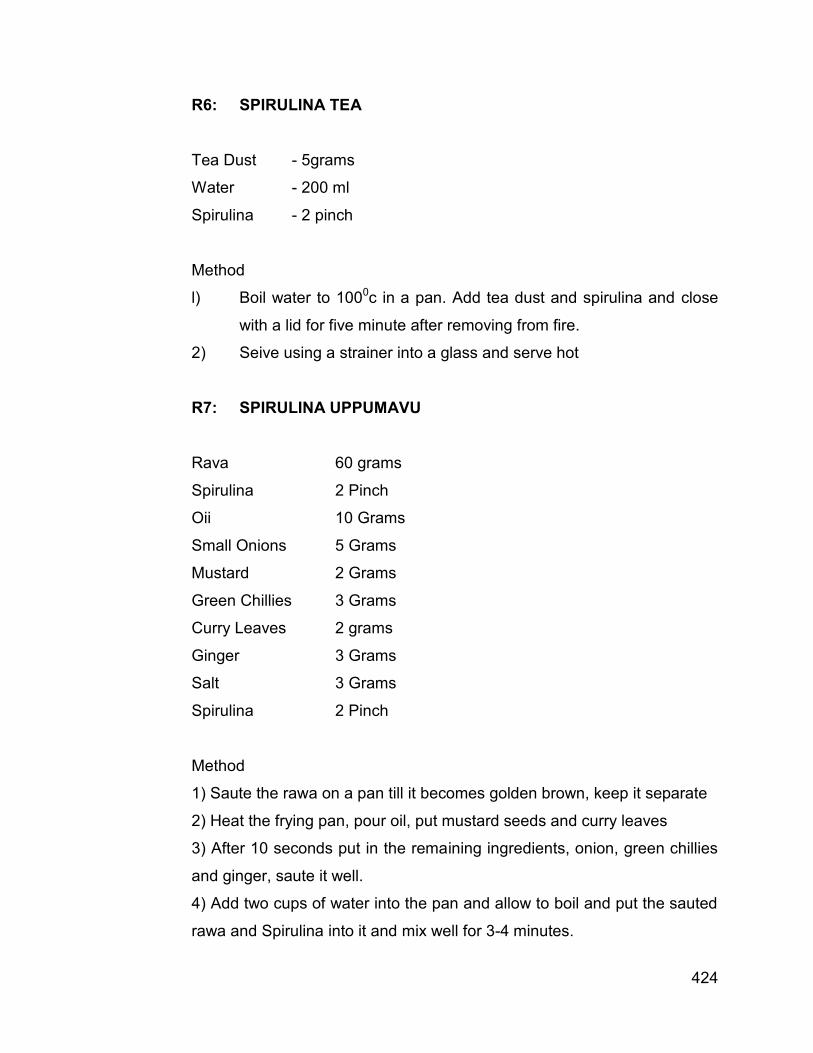
R6: SPIRULINA TEA
Tea Dust - 5grams
Water - 200 ml
Spirulina - 2 pinch
Method
l) Boil water to 1000c in a pan. Add tea dust and spirulina and close
with a lid for five minute after removing from fire.
2) Seive using a strainer into a glass and serve hot
R7: SPIRULINA UPPUMAVU
Rava 60 grams
Spirulina 2 Pinch
Oii 10 Grams
Small Onions 5 Grams
Mustard 2 Grams
Green Chillies 3 Grams
Curry Leaves 2 grams
Ginger 3 Grams
Salt 3 Grams
Spirulina 2 Pinch
Method
1) Saute the rawa on a pan till it becomes golden brown, keep it separate
2) Heat the frying pan, pour oil, put mustard seeds and curry leaves
3) After 10 seconds put in the remaining ingredients, onion, green chillies
and ginger, saute it well.
4) Add two cups of water into the pan and allow to boil and put the sauted
rawa and Spirulina into it and mix well for 3-4 minutes.
425
5) Keep it closed for two minutes. Mix well again, remove from fire and
serve hot
R8: SPIRULINA BEANS THORAN
Beans chopped 70 grams
Coconut 20 grams
Green chillies 5 grams
Garlic 2 grams
Onions 5 grams
Salt 3 grams
Turmeric 2 grams
spirulina 2 pinch
Tempering
Mustard 2 grams
Oil 10 grams
Curry leaves 2 grams
Red chilli 2 grams
Method:
I) Wash and chop the beans. Grate the coconut.
2) Chop the green chilies, onion and garlic.
3) Crush coconut, turmeric, green chilies, and garlic together.
4) Cook beans with salt and water for 3-4 minutes
5) Add coconut mixture, chillies, onions, garlic and curry leaves
6) Allow to steam it for 3-4 minutes and stir with handle of a wooden
spoon
7) After 4 minutes add spirulina mix well and remove from the fire,
8) For tempering heat oil, add mustard, curry leave and chopped
onion. Saute till is golden brown colour

426
9) Put the tempering into the beans thoran and serve hot
R9: SPIRULINA SAMBAR
Lentil 30 grams
Coriander 10 grams
Red chilies 3 grams
Split Bengal gram 3 grams
Split black gram 2 grams
Fenugreek 2 grams
Asafetida 5 grams
Ladies Finger 5 grams
Onion small 15 grams
Brinjal 10 grams
Drumstick 10 grams
Potato 5 grams
Turmeric 2 grams
Tamarind 3 grams
Salt 4 grams
Spirulina 2 pinch
For tempering
Curry leaves 2 grams
Red chillies 2 grams
Mustard seeds 2 grams
Fenugreek 2 grams
Oil 10 ml
Onion 10 grams
Method
1) Boil dal, cut the vegetables into even sized pieces

427
2) Add it into dal along with powdered spices, allow to cook till the
vegetables are tender
3) Add tamarind juice extracts and bring to boil, add spirulina mix well
and remove from fire.
4) Heat the oil in a frying pan, add mustard seeds, sliced onions,
broken red chilies, curry leaves and fenugreek
5) When onions are brown pour over sambar, stir well.
R10: SPIRULINA BITTER GOURD JUICE
Bitter gourd 70 grams
Salt 3 grams
Water 30 ml
Spirulina 2 pinch
Method
l) Grind the bitter gourd together with salt and water on a mixer
grinder
2) After sometime put the Spirulina into it and again blend it together
for 4-5 minutes.
3) Seive and then pour it into a glass and serve.
R11: SPIRULINA GREEN SALAD
Tomato 25 grams
Cucumber 25 grams
Carrot 25 grams
Onion 20 grams
Salt 3 grams
Pepper 3 grams
Oil 5 ml

428
spirulina 2 pinch
Method
1) Cut all the vegetables into square shape. Mix it together with Spirulina
2) Crush the pepper and mix it with salt and oil into the vegetables and
place it into a white plate and serve.
R12: SPIRULINA GODHUMBU DOSAI
Wheat flour 60 grams
Oil 5 grams
Salt 2 grams
Water 120 ml
Spirulina 2 pinch
Method
1) Mix all the ingredients including spirulina together with the
exception of oil and make a thick paste
2) An iron tawa is heated, add little oil, pour a ladle full of batter into
the tawa, spread it widely in round shape.
3) Cook for 2-3 minutes on both sides and remove from the tawa
R13: SPIRULINA CABBAGE THORAN
Cabbage 70 grams
Coconut 20 grams
Green chilies 5 grams
Garlic 2 grams
Onions 5 grams
Salt 3 grams
Turmeric 2 grams
429
Spirulina 2 pinch
Tempering
Mustard 2 grams
Oil 10 grams
Curry leaves 2 grams
Red chilly flake 2 grams
Method
1) Wash and shred the cabbage to thin pieces, then grate the coconut
2) Chop the green chilies, onion and garlic
3) Add coconut and turmeric mix together and grind well
4) Cook cabbage and salt and water for 3-4 minutes
5) Add coconut mixture, chilies, onions garlic and curry leaves
6) Allow to steam it for 3-4 minutes and stir with handle of a wooden
spoon
7) After 4 minutes add spirulina mix well and remove from fire.
8) Heat oil, add mustard, curry leaves and chopped onions, saute till it
gets golden brown colour
9) Put the tempering into the cabbage thoran and serve hot.
R14: SPIRULINA WHEAT-CURD
Wheat 50 grams
Curd half cup
Salt 2 grams
Spirulina 2 pinch
Small Onions 5 Grams
Mustard 2 Grams
Green Chillies 3 Grams
Curry Leaves 2 grams

430
Ginger 3 Grams
Salt 3 Grams
Spirulina 2 Pinch
Method
1) Cook wheat and keep it aside.
2) Heat the frying pan, pour oil, put mustard seeds and curry leaves
3) After 10 seconds put in the remaining ingredients, onion, green
chillies and ginger, saute it well and remove from fire. Add spirulina
and mix well.
4) Add it to the cooked wheat and mix and serve hot.
431
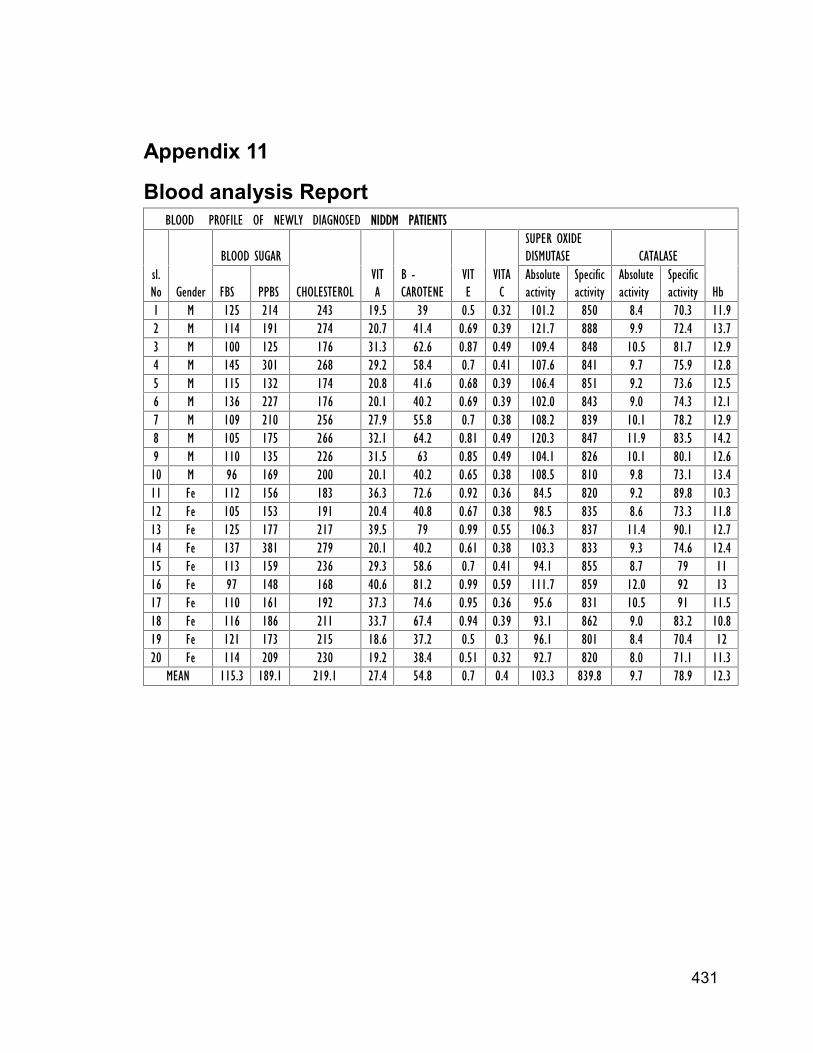
Appendix 11
Blood analysis ReportBLOOD PROFILE OF NEWLY DIAGNOSED NIDDM PATIENTS
sl.No Gender
BLOOD SUGAR
CHOLESTEROLVITA
B -CAROTENE
VITE
VITAC
SUPER OXIDEDISMUTASE CATALASE
HbFBS PPBSAbsoluteactivity
Specificactivity
Absoluteactivity
Specificactivity
1 M 125 214 243 19.5 39 0.5 0.32 101.2 850 8.4 70.3 11.92 M 114 191 274 20.7 41.4 0.69 0.39 121.7 888 9.9 72.4 13.73 M 100 125 176 31.3 62.6 0.87 0.49 109.4 848 10.5 81.7 12.94 M 145 301 268 29.2 58.4 0.7 0.41 107.6 841 9.7 75.9 12.85 M 115 132 174 20.8 41.6 0.68 0.39 106.4 851 9.2 73.6 12.56 M 136 227 176 20.1 40.2 0.69 0.39 102.0 843 9.0 74.3 12.17 M 109 210 256 27.9 55.8 0.7 0.38 108.2 839 10.1 78.2 12.98 M 105 175 266 32.1 64.2 0.81 0.49 120.3 847 11.9 83.5 14.29 M 110 135 226 31.5 63 0.85 0.49 104.1 826 10.1 80.1 12.610 M 96 169 200 20.1 40.2 0.65 0.38 108.5 810 9.8 73.1 13.411 Fe 112 156 183 36.3 72.6 0.92 0.36 84.5 820 9.2 89.8 10.312 Fe 105 153 191 20.4 40.8 0.67 0.38 98.5 835 8.6 73.3 11.813 Fe 125 177 217 39.5 79 0.99 0.55 106.3 837 11.4 90.1 12.714 Fe 137 381 279 20.1 40.2 0.61 0.38 103.3 833 9.3 74.6 12.415 Fe 113 159 236 29.3 58.6 0.7 0.41 94.1 855 8.7 79 1116 Fe 97 148 168 40.6 81.2 0.99 0.59 111.7 859 12.0 92 1317 Fe 110 161 192 37.3 74.6 0.95 0.36 95.6 831 10.5 91 11.518 Fe 116 186 211 33.7 67.4 0.94 0.39 93.1 862 9.0 83.2 10.819 Fe 121 173 215 18.6 37.2 0.5 0.3 96.1 801 8.4 70.4 1220 Fe 114 209 230 19.2 38.4 0.51 0.32 92.7 820 8.0 71.1 11.3
MEAN 115.3 189.1 219.1 27.4 54.8 0.7 0.4 103.3 839.8 9.7 78.9 12.3

432
BLOOD PROFILE OF IDDM SUBJECTS
SlNo Gender
BLOOD SUGAR
CHOLESTEROL VIT Ab-carotene
VITIE VITA C
SUPER OXIDEDISMUTASE CATALASE
HbFBS PPBSAbsoluteActivity
Specificactivity
AbsoluteActivity
Specificactivity
1 M 170 201 200 20 40 0.75 0.45 99.1 840 9.7 82.1 11.82 M 165 218 189 31.5 63 1.1 0.39 110.0 815 10.2 75.6 13.53 M 159 198 199 35 70 0.8 0.33 102.1 851 8.5 70.5 124 M 145 200 220 22.5 45 0.5 0.41 107.4 826 11.1 85.2 135 M 150 175 197 21 42 0.6 0.46 106.6 846 10.1 79.9 12.66 M 123 165 200 25.6 51.2 0.55 0.5 105.2 822 11.4 89.4 12.87 M 130 189 207 22.5 45 0.61 0.32 104.9 839 10.0 80.3 12.58 M 190 220 230 34.1 68.2 0.79 0.52 109.6 837 10.0 76.7 13.19 M 181 215 225 33 66 0.65 0.51 98.0 810 9.3 77.1 12.110 M 162 235 205 43 86 0.99 0.38 97.9 844 9.2 78.9 11.611 Fe 173 223 211 27 54 0.67 0.49 86.8 868 9.0 90.2 1012 Fe 156 231 215 21.2 42.4 0.66 0.36 100.9 827 8.9 72.8 12.213 Fe 192 229 170 26.1 52.2 0.8 0.37 76.1 855 6.5 72.5 8.914 Fe 144 210 212 39 78 0.9 0.43 99.0 861 9.4 81.8 11.515 Fe 135 208 197 23.5 47 0.54 0.53 81.6 833 7.0 71.1 9.816 Fe 188 212 165 28.1 56.2 0.69 0.34 101.5 860 8.8 74.6 11.817 Fe 114 184 183 20 40 0.68 0.47 78.2 859 7.9 86.3 9.118 Fe 146 219 205 29.4 58.8 0.75 0.55 101.4 852 8.8 73.9 11.919 Fe 117 186 200 22.6 45.2 0.67 0.35 79.2 834 8.3 87.4 9.520 Fe 120 191 192 29.1 58.2 0.7 0.44 100.0 862 9.7 83.7 11.6
MEAN 153.00 205.45 201.10 27.71 55.42 0.72 0.43 97.28 842.05 9.18 79.50 11.57
433
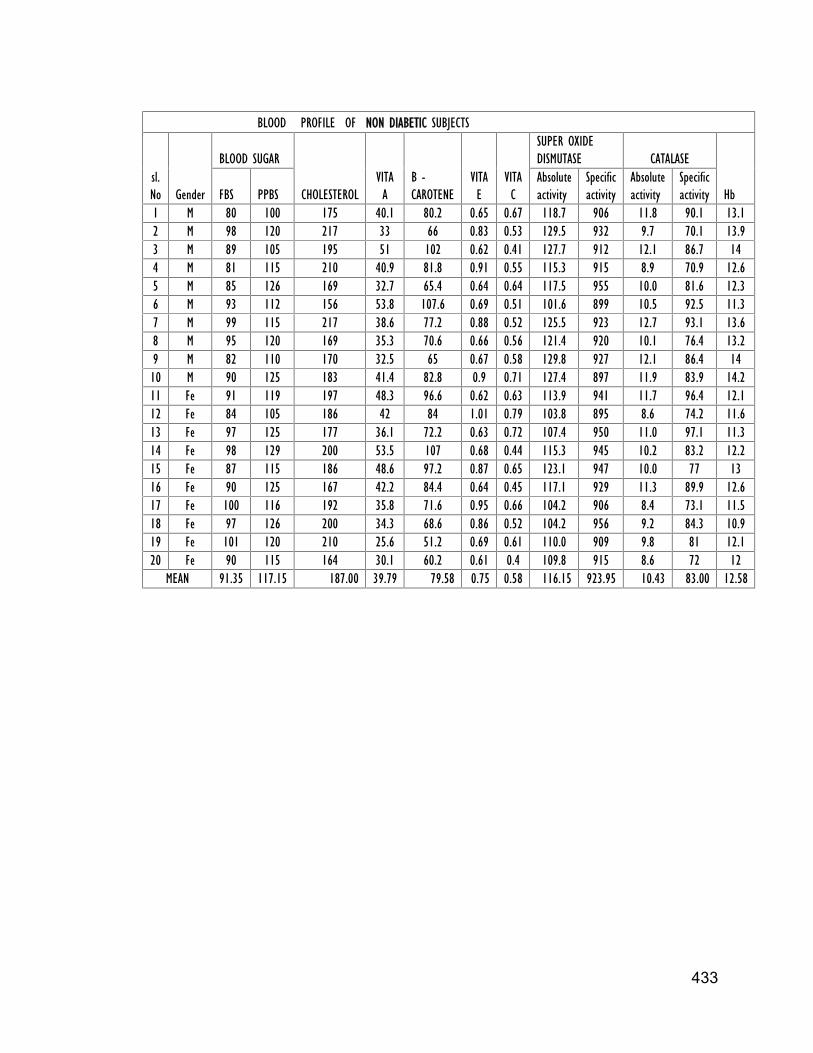
BLOOD PROFILE OF NON DIABETIC SUBJECTS
sl.No Gender
BLOOD SUGAR
CHOLESTEROLVITAA
B -CAROTENE
VITAE
VITAC
SUPER OXIDEDISMUTASE CATALASE
HbFBS PPBSAbsoluteactivity
Specificactivity
Absoluteactivity
Specificactivity
1 M 80 100 175 40.1 80.2 0.65 0.67 118.7 906 11.8 90.1 13.12 M 98 120 217 33 66 0.83 0.53 129.5 932 9.7 70.1 13.93 M 89 105 195 51 102 0.62 0.41 127.7 912 12.1 86.7 144 M 81 115 210 40.9 81.8 0.91 0.55 115.3 915 8.9 70.9 12.65 M 85 126 169 32.7 65.4 0.64 0.64 117.5 955 10.0 81.6 12.36 M 93 112 156 53.8 107.6 0.69 0.51 101.6 899 10.5 92.5 11.37 M 99 115 217 38.6 77.2 0.88 0.52 125.5 923 12.7 93.1 13.68 M 95 120 169 35.3 70.6 0.66 0.56 121.4 920 10.1 76.4 13.29 M 82 110 170 32.5 65 0.67 0.58 129.8 927 12.1 86.4 1410 M 90 125 183 41.4 82.8 0.9 0.71 127.4 897 11.9 83.9 14.211 Fe 91 119 197 48.3 96.6 0.62 0.63 113.9 941 11.7 96.4 12.112 Fe 84 105 186 42 84 1.01 0.79 103.8 895 8.6 74.2 11.613 Fe 97 125 177 36.1 72.2 0.63 0.72 107.4 950 11.0 97.1 11.314 Fe 98 129 200 53.5 107 0.68 0.44 115.3 945 10.2 83.2 12.215 Fe 87 115 186 48.6 97.2 0.87 0.65 123.1 947 10.0 77 1316 Fe 90 125 167 42.2 84.4 0.64 0.45 117.1 929 11.3 89.9 12.617 Fe 100 116 192 35.8 71.6 0.95 0.66 104.2 906 8.4 73.1 11.518 Fe 97 126 200 34.3 68.6 0.86 0.52 104.2 956 9.2 84.3 10.919 Fe 101 120 210 25.6 51.2 0.69 0.61 110.0 909 9.8 81 12.120 Fe 90 115 164 30.1 60.2 0.61 0.4 109.8 915 8.6 72 12
MEAN 91.35 117.15 187.00 39.79 79.58 0.75 0.58 116.15 923.95 10.43 83.00 12.58

434
BLOOD PROFILE OF NON INSULIN DEPENDENT DIABETIC SUBJECTS BEFORE AND AFTER SUPPLEMENTATION
SL.NO GEND
BLOOD SUGAR LIPID PROFIE VITAMIN-A B- CAROTENE VITAMIN-E VITAMIN-C SUPER OXIDE DISMUTASE CATALASE HAEMOGLOBIN
FBS PPBS TC HDL LDL
BE AFT BEF AF BEF AF BEE AFT
AbsoluteActivity
SpecificActivity
AbsoluteActivity
SpecificActivity
BEF AFTBE AF BE AFT BEF AFT BEF AFT BE AFT BEF AFT BEF AFT BEFO AFT BEFO AFT
1 M 125 100 214 156 243 220 36 42 155 149 19.5 30 48.1 69.1 0.5 0.75 0.32 0.78 101.2 107.9 850 863 8.4 9.8 70.3 78 11.9 12.5
2 M 114 91 191 130 274 232 39 49 156 143 20.7 32 53.7 75.1 0.69 0.81 0.39 0.89 121.7 133.9 888 905 9.9 12.0 72.4 81.2 13.7 14.8
3 M 100 85 135 115 176 163 48 51 145 132 31.3 40 70.3 96.2 0.87 0.99 0.49 0.98 109.4 118.5 848 865 10.5 12.6 81.7 92 12.9 13.7
4 M 145 105 301 165 268 219 40 47 159 140 29.2 40 62.7 83.7 0.7 0.95 0.41 0.91 107.6 116.0 841 859 9.7 11.4 75.9 84.3 12.8 13.5
5 M 115 95 132 120 174 152 49 54 146 130 20.8 30 52 72 0.68 0.85 0.39 0.91 106.4 119.0 851 875 9.2 11.7 73.6 85.7 12.5 13.6
6 M 136 106 227 151 176 155 47 55 149 125 20.1 34 55.6 76 0.69 0.82 0.39 0.88 102.0 110.7 843 858 9.0 10.3 74.3 80.1 12.1 12.9
7 M 109 92 210 160 256 215 42 59 151 139 27.9 35 63.3 85 0.7 0.91 0.38 0.87 108.2 118.8 839 867 10.1 12.3 78.2 90.1 12.9 13.7
8 M 105 98 175 127 266 221 39 46 158 141 32.1 40 74 99 0.81 0.99 0.49 0.98 120.3 131.3 847 875 11.9 14.1 83.5 94 14.2 15
9 M 110 84 135 120 226 199 41 49 160 139 31.5 44 79.2 110.4 0.85 0.98 0.49 0.95 104.1 111.0 826 854 10.1 12.0 80.1 92.1 12.6 13
10 M 96 81 169 123 200 163 44 50 153 131 20.1 30 51.4 80.6 0.65 0.81 0.38 0.91 108.5 120.4 810 866 9.8 12.4 73.1 89.1 13.4 13.9
11 Fe 112 99 156 126 183 154 35 42 148 133 36.3 47 83.8 116 0.92 1.01 0.36 0.9 84.5 96.6 820 870 9.2 10.7 89.8 96 10.3 11.1
12 Fe 105 83 123 100 191 155 39 48 147 125 20.4 32 50 73.8 0.67 0.8 0.38 0.85 98.5 104.0 835 867 8.6 10.6 73.3 88 11.8 12
13 Fe 125 96 177 105 217 200 35 43 154 136 39.5 50 90 121.5 0.99 1.1 0.55 1 106.3 114.0 837 877 11.4 12.8 90.1 98.2 12.7 13
14 Fe 137 110 381 165 279 229 37 44 159 147 20.1 35 54.9 78 0.61 0.8 0.38 0.81 103.3 115.1 833 899 9.3 11.2 74.6 87.6 12.4 12.8
15 Fe 113 94 159 120 236 210 43 52 157 143 29.3 38 67.1 89.9 0.7 0.91 0.41 0.91 94.1 106.7 855 889 8.7 10.8 79 90.1 11 12
16 Fe 97 80 148 109 168 150 45 52 150 136 40.6 56 96.1 129.7 0.99 1.05 0.59 1.1 111.7 119.2 859 910 12.0 12.5 92 95.1 13 13.1
17 Fe 110 98 161 125 192 162 42 54 144 133 37.3 46 76.2 115 0.95 1.09 0.36 0.84 95.6 102.7 831 863 10.5 11.2 91 93.8 11.5 11.9
18 Fe 116 99 186 107 211 167 35 43 157 140 33.7 43 73.8 100.1 0.94 1.06 0.39 0.88 93.1 104.3 862 907 9.0 10.9 83.2 94.5 10.8 11.5
19 Fe 121 100 173 111 215 192 40 46 161 142 18.6 28 48.6 67 0.5 0.79 0.3 0.71 96.1 106.4 801 851 8.4 12.2 70.4 97.5 12 12.5
20 Fe 114 102 209 150 230 205 39 44 159 157 19.2 30 48.1 64.3 0.51 0.79 0.32 0.75 92.7 102.2 820 852 8.0 11.2 71.1 93.2 11.3 12
Mean ~ 115 94.9 188 129 219 188.2 40.8 48.5 153.4 138.1 27.4 38 64.9 90.12 0.746 0.913 0.409 0.8905 103.254 112.93 839.8 873.6 9.687 11.62 78.88 90.03 12.29 12.925

435