Embed Size (px)
Citation preview
i
Apolipoprotein E isoforms differentially regulate amyloid-β stimulated inflammation in rat and
mouse astrocytes.
The thesis presented to
The Faculty of Graduate and Post-Doctoral Studies
Of
University of Ottawa
By Evan Dorey
This thesis is submitted as a partial fulfillment of the
Master Degree of Science in Cellular and Molecular Medicine
September 2012
Thesis Advisor
Dr. Wandong Zhang
© Evan Dorey, Ottawa, Canada, 2012
ii
Abstract
Neuroinflammation occurs in Alzheimer’s disease (AD) brain, and plays a role in
neurodegeneration. The main aim of this study was to determine how treatments with exogenous
apolipoprotein E (ApoE2, E3 and E4 isoforms), a genetic risk factor for AD, affects the amyloid-
β (Aβ) induced inflammatory response in vitro in astrocytes. Recombinant, lipid-free ApoE4 was
found not to affect Aβ-induced inflammation in rat astrocytes, while ApoE2 showed a protective
effect. Mouse cells expressing human ApoE isoforms, which have similar lipidation and
modification to native human ApoE, showed ApoE4 promoting inflammation, and no ApoE2
protective effect upon Aβ treatment. A Protein/DNA array was used to screen 345 transcription
factors in rat astrocytes treated with Aβ and/or ApoE isoforms, in order to determine which
contribute to the observed ApoE2 protection. Some candidates were validated by Western Blot
or EMSA and/or by inhibition or activation. The findings suggest ApoE isoforms differentially
regulate Aβ-induced inflammation, and multiple signalling pathways are involved in the process.
iii
Table of Contents
List of Figures ................................................................................................................................ v
List of Tables ................................................................................................................................ vi Abbreviations Used ..................................................................................................................... vii Acknowledgements ...................................................................................................................... ix Introduction ................................................................................................................................... 1
1.1. Alzheimer’s disease and Aβ ................................................................................................ 1
1.1.1. Amyloid-β as an inducer of inflammation and neurodegeneration .............................. 5 1.2. Apolipoprotein E as an AD risk factor ................................................................................ 6
1.2.1. Differential AD risk between ApoE isoforms .............................................................. 9 1.2.2 Structural and functional differences between ApoE isoforms ................................... 10
1.2.3. ApoE and Aβ .............................................................................................................. 12 1.2.4. ApoE’s role in neuroinflammation ............................................................................. 17
1.3. Research Proposal .............................................................................................................. 19 1.4. Hypothesis.......................................................................................................................... 20
Materials and Methods ............................................................................................................... 21 2.1. Chemical Reagents............................................................................................................. 21 2.2. Cell Culture ........................................................................................................................ 22
2.3. Aβ, ApoE and inhibitor treatments .................................................................................... 22 2.4. RNA isolation, reverse-transcriptase (RT) and quantitative PCR ..................................... 23
2.5. Protein isolation and Enzyme-linked immunosorbent assay (ELISA) .............................. 26 2.6. Isolation of nuclear extract and Protein/DNA array .......................................................... 28 2.7. Whole cell protein isolation and Western Blotting ............................................................ 30
2.8. Electrophoretic mobility shift assay (EMSA) .................................................................... 31
2.9. Statistical analysis .............................................................................................................. 32 Results .......................................................................................................................................... 33
3.1. Aβ1-42 peptides induce an inflammatory response in NRA cells ....................................... 33
3.1.1. mRNA levels of inflammatory markers are increased upon Aβ treatment, as measured
by RT-PCR and qPCR .......................................................................................................... 33
3.2. ApoE isoforms differentially modulate the Aβ-induced inflammatory response .............. 34 3.2.1. mRNA expression of inflammatory markers changes upon treatment with exogenous
ApoE in combination with Aβ .............................................................................................. 34 3.2.2. Treatment with exogenous ApoE isoforms independent of Aβ did not affect
inflammatory gene expression .............................................................................................. 37 3.2.3. Inflammatory protein levels change along with mRNA expression ........................... 39
3.3. A Protein/DNA array identifies a wide number of signalling pathways that are
differentially activated by ApoE isoforms and Aβ combination treatments............................. 41 3.3.1. Identification and screening of TFs changing between treatments ............................. 41
3.3.2. Validation of protein/DNA array results by Western blot .......................................... 44 3.3.3. Validation of identified signalling pathways by EMSA ............................................. 45
3.4. The effects of signalling modulation on Aβ-induced inflammatory response ................... 50 3.4.1. Inhibition of NF-κB with a general proteosome inhibitor (MG-132) potentiates the
Aβ-induced inflammatory response ...................................................................................... 50
iv
3.4.2. Inhibition of NF-κB with a specific inhibitor (BAY-11-7082) altered the ApoE
isoform-specific effect on Aβ-induced inflammation at one concentration ......................... 52 3.4.3. Activation of VDR with 1α, 25-Dihydroxyvitamin D3............................................... 54 3.4.4. Inhibition of STAT-3 with a specific inhibitor (S3I-201) .......................................... 56
3.5. Aβ treatment of mouse astrocytes expressing human ApoE isoforms .............................. 58 3.5.1. Aβ induces inflammation in astrocytes expressing human ApoE .............................. 58 3.5.2. The effect of signalling pathway modulation on Aβ-induced inflammation in ApoE
expressing mouse astrocytes ................................................................................................. 60 Discussion..................................................................................................................................... 65
4.1 ApoE isoforms differentially affect the Aβ-induced inflammatory response in NRA cells 65 4.2 Effect of Aβ on ApoE isoform expressing murine astrocytes ............................................ 68 4.3 Signalling pathways thought to mediate Aβ-induced inflammation .................................. 69
4.3.1 Signalling pathways found to be activated in higher inflammatory conditions ........... 70
4.3.1.1 NF-κB ................................................................................................................... 70 4.3.1.2 Peroxisome proliferator-activated receptor (PPAR) ............................................. 73
4.3.2 Signalling pathways found to be activated in lesser inflammatory conditions ............ 74 4.3.2.1 VDR ...................................................................................................................... 74
4.3.2.2 Estrogen receptor (ER) ......................................................................................... 75 4.3.3 Signalling pathways unchanged between ApoE2 + Aβ and ApoE3 + Aβ treatments . 76
4.3.3.1 Signal transducer and activator of transcription-3 ................................................ 76
4.3.3.2 c-Jun/Activator protein-1 ...................................................................................... 77 4.3.3.3 p38 MAPK ............................................................................................................ 79
4.4 Conclusion .......................................................................................................................... 79 References .................................................................................................................................... 82
v
List of Figures
Figure 1: Pathways of APP processing. ----------------------------------------------------------------- 3
Figure 2: Proposed structure for apolipoprotein E. -------------------------------------------------- 8
Figure 3: Proposed structural effects of apoE polymorphisms.----------------------------------- 11
Figure 4: ApoE isoforms’ interaction with Aβ. ------------------------------------------------------- 17
Figure 5: The effect of A1-42 peptides on inflammatory gene expression in NRA cells. ---- 35
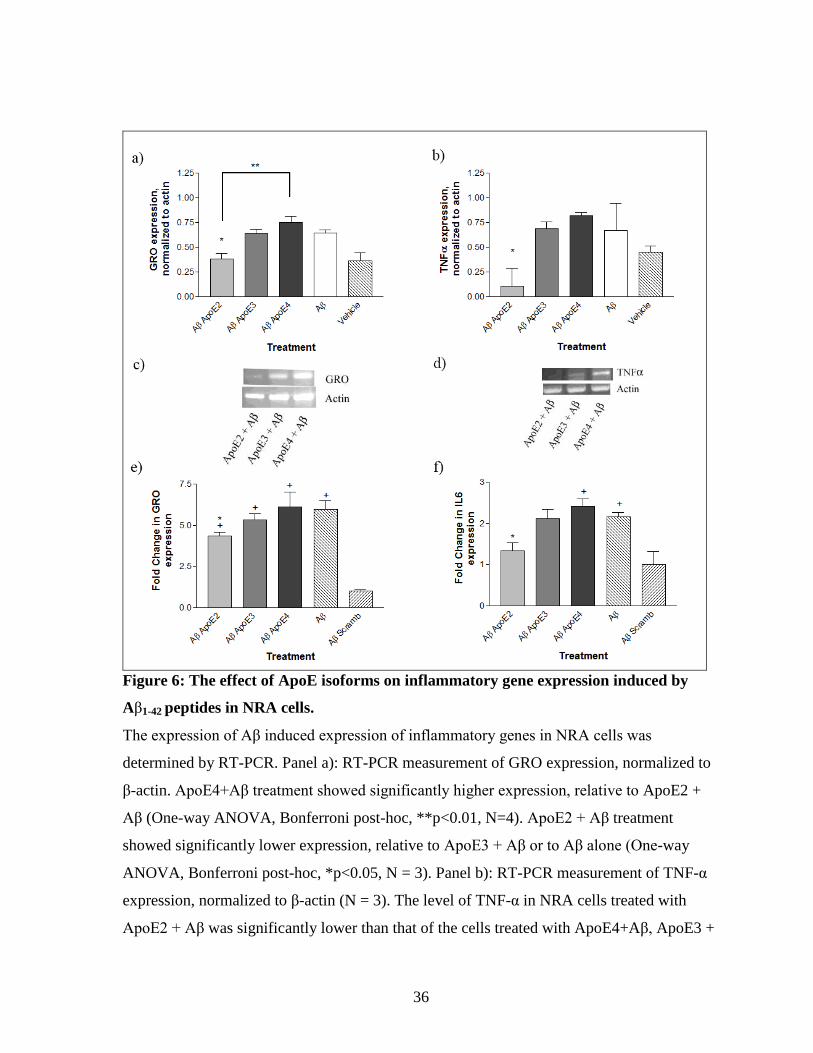
Figure 6: The effect of apoE isoforms on inflammatory gene expression induced by Aβ1-42
peptides in NRA cells. -------------------------------------------------------------------------------------- 36
Figure 7: The effect of human ApoE isoforms on the expression of inflammatory markers
in the absence of Aβ challenge. --------------------------------------------------------------------------- 38
Figure 8: Changes in protein levels of inflammatory markers upon Aβ treatment are
differentially modulated by human apoE isoforms. ------------------------------------------------- 40
Figure 9: Protein/DNA arrays, treated with nuclear extract from treated cells. -------------- 42
Figure 10: Validation of Protein/DNA array results through Western blot detection of
phosphorylatyed c-Jun and p38 MAPK. --------------------------------------------------------------- 46
Figure 11: EMSA validation of NF-κB activation. --------------------------------------------------- 48
Figure 12: EMSA validation of VDR activation. ----------------------------------------------------- 48
Figure 13: EMSA validation of STAT-3 activation. ------------------------------------------------- 49
Figure 14: qPCR measurement of inflammatory gene expression, normalized to GAPDH,
upon challenge with Aβ and proteosome inhibitor MG-132. -------------------------------------- 51
Figure 15: qPCR measurement of inflammatory gene expression, normalized to GAPDH,
upon challenge with Aβ and NF-κB inhibitor Bay-11-7082. --------------------------------------- 53
Figure 16: qPCR measurement of inflammatory gene expression, normalized to GAPDH,
upon challenge with Aβ and VDR agonist 1α, 25-Dihydroxyvitamin D3. ----------------------- 55
Figure 17: qPCR measurement of inflammatory gene expression, normalized to GAPDH,
upon challenge with Aβ and STAT-3 inhibitor S3I-201. ------------------------------------------- 57
Figure 18: Measurement of inflammatory markers in mouse apoE knock-out, human ApoE
knock-in astrocytes upon challenge with Aβ1-42. ----------------------------------------------------- 60
Figure 19: Effect of VDR agonist 1α, 25-Dihydroxyvitamin D3 and NF-ΚB inhibitor BAY-
11-7082 on the expression of inflammatory markers in mouse apoE knockout, human
ApoE isoform knock-in astrocytes upon challenge with Aβ1-42. ----------------------------------- 63
vi
List of Tables
Table 1. Amino acid sequences of Aβ1-42 normal and scrambled peptides. ........................... 22
Table 2. RT-PCR primer sequences .......................................................................................... 25
Table 3. RT-PCR reaction protocols ......................................................................................... 25
Table 4. qPCR primer sequences .............................................................................................. 26
Table 5. DNA probe sequences for EMSA reactions ............................................................... 31
Table 6. TFs found to increase in the ApoE2 + Aβ treatment, relative to the ApoE3 + Aβ
treatment, as determined by Protein/DNA arrays ................................................................... 42
Table 7. TFs found to decrease in the ApoE2 + Aβ treatment, relative to the ApoE3 + Aβ
treatment, as determined by Protein/DNA arrays ................................................................... 43
Table 8. TFs found to change between ApoE3 + Aβ and ApoE2+Aβ treatments and to have
links to AD/inflammation after literature search. ................................................................... 43
Table 9. Summary of other AD related TFs found to change between ApoE3 + Aβ and
ApoE2 + Aβ treatments. ............................................................................................................. 71
vii
Abbreviations Used
Aβ Amyloid-β
ABCA1 ATP-binding cassette A1
AD Alzheimer’s disease
ApoE Apolipoprotein E
AP-1 Activator protein-1
APP Amyloid-β precursor protein
BACE1 Beta-site APP cleaving enzyme 1
BBB Blood-brain barrier
CNS Central nervous system
DMEM Dulbecco’s modified Eagle’s medium
DMSO Dimethyl sulfoxide
ELISA Enzyme-linked immunosorbent assay
EMSA Electrophoretic mobility shift assay
ER Estrogen receptor
ERE Estrogen response element
FBS Fetal bovine serum
GRO Growth-related oncogene
HDL High density lipoprotein
i.c.v. Intracerebroventricular
IDE Insulin degrading enzyme
IκB Inhibitor of κ B
IKK IκB kinase
viii
IL-1 Interleukin-1
IL-6 Interleukin-6
JAK Janus kinase
JNK c-Jun N-terminal kinases
LDL Low density lipoprotein
LDLR Low density lipoprotein receptor
LPS Lipopolysaccharide
LRP1 LDL receptor related protein 1
MAPK Mitogen-activated protein kinase
MAPKK MAPK kinase
NF-κB Nuclear factor-κB
NO Nitric oxide
NRA Neonatal rat astrocyte
PCR Polymerase chain reaction
PPAR Peroxisome proliferator-activated receptor
ROS Reactive oxygen species
STAT-3 Signal transducer and activator of transcription-3
TF Transcription factor
TLR Toll-like receptor
TNF-α Tumor necrosis factor-α
VDR Vitamin D receptor
VDRE Vitamin D response elements
VLDL Very low density lipoprotein

ix
Acknowledgements
First, thanks to my supervisor, Dr. Wandong Zhang, who gave me the opportunity to
work on this exciting project, and brought me to work and train at the NRC. Also thanks to my
advisory committee, Dr. Xia Zhang and Dr. John Woulfe, for their feedback and suggestions
during our meetings. To all NRC employees who were glad to provide a helping hand with
training and advice, especially the members of our lab: Dr. Huaqi Xiong, Dr. Hong Liu and
Debbie Callaghan. Their willingness to help and train me, as well as their patience with my
questions is deeply appreciated. Thanks to Dr. Michelle Bamji-Mirza for her work editing and
commenting on the thesis itself; her assistance was invaluable and the thesis is much the better
for it. Thanks to my fellow students, Shaad and Dema for their friendship and companionship.
Thanks to my friends and family for their support over these two years. Finally, thanks to my
parents for their love and unwavering belief in me.
This study is supported by a CIHR grant to Dr. W. Zhang (#106886) and by an admission
scholarship from the University of Ottawa to Evan Dorey.
1
Introduction
Alzheimer’s disease (AD) is the leading cause of dementia in the elderly and a
substantial burden on health-care systems worldwide. It is a neurodegenerative disease,
featuring progressive synaptic loss and neuronal death, which over time manifests in a loss of
memory and cognition. It can gradually build in severity until patients can no longer
recognize family members or perform basic day-to-day tasks, and may eventually result in a
loss of the ability to control basic bodily functions, potentially leading to death. The majority
of AD patients suffer from the late-onset form of the disease; familial and early-onset forms
exist as well, though at much lower prevalence. AD was initially described by Alois
Alzheimer in 1906, upon examining the brain of a 51-year-old woman who had died from
early-onset dementia. His examination revealed a pair of important features that are still the
primary basis for pathological diagnosis today: the build-up of intracellular neurofibrillary
tangles (aggregates of hyperphosphorylated tau protein) and the formation of extracellular
amyloid plaques [protein aggregates consisting principally of amyloid-beta (Aβ) peptides)]
(McKee et al., 1991).
1.1. Alzheimer’s disease and Aβ
Aβ is a short peptide which comes in two common lengths: a more abundant 40-
amino acid peptide, Aβ1-40, and a 42-amino acid form, Aβ1-42, which is closely associated
with AD (Scheuner et al., 1996). Aβ is produced through two-step cleavage of Aβ precursor
protein (APP). This first step is mediated by a β-secretase, beta-site APP cleaving enzyme 1
(BACE1), which creates a large soluble protein and a 99-amino acid, membrane-bound C-
terminal stub. This 99-amino acid fragment is then further processed by a γ-secretase to
2
produce Aβ in either its 40 or 42-amino acid incarnations (Vassar et al., 1999). It is not
known what mechanism determines which length of Aβ is produced, but increases in the
ratio of Aβ1-42 to Aβ1-40 are associated with AD, as well as increased neurotoxicity and
memory deficits in some animal models (Pauwels et al., 2012).
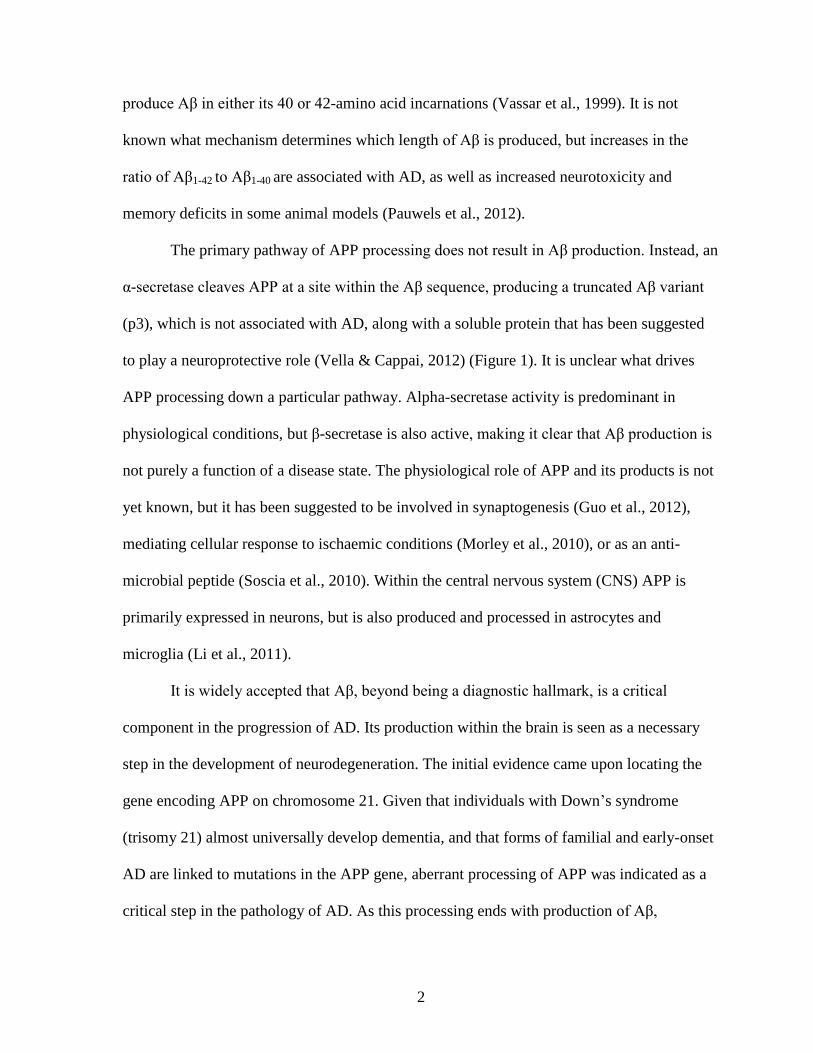
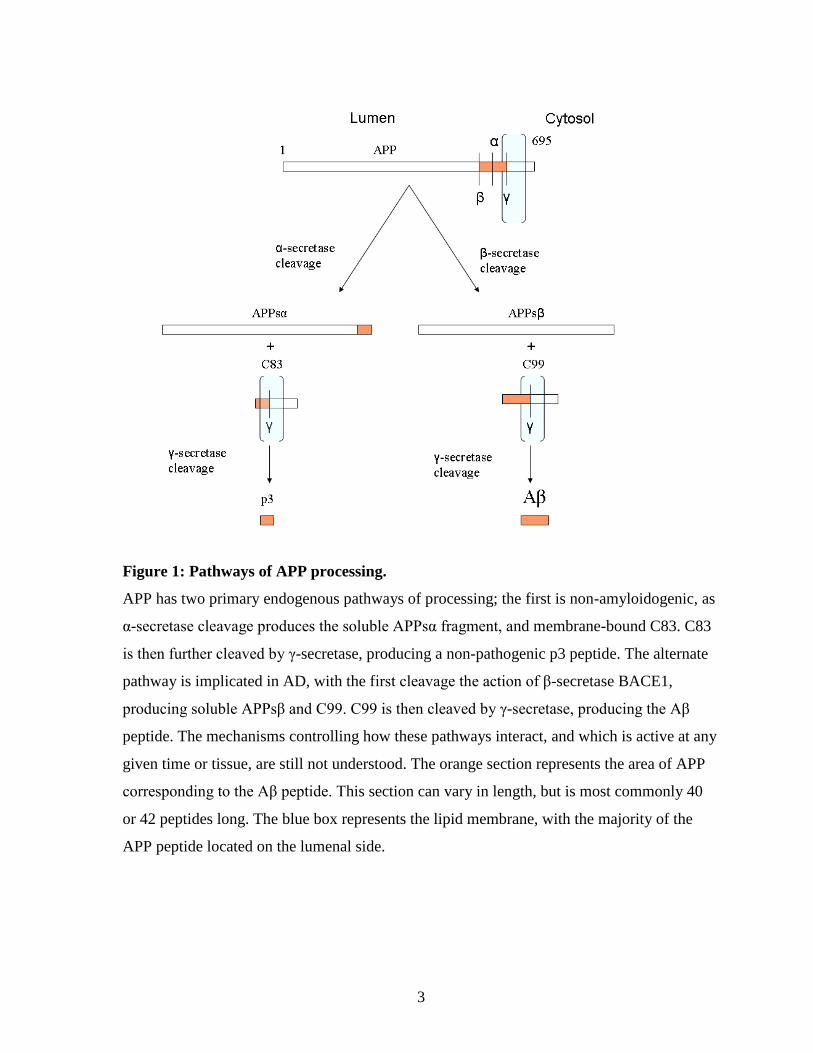
The primary pathway of APP processing does not result in Aβ production. Instead, an
α-secretase cleaves APP at a site within the Aβ sequence, producing a truncated Aβ variant
(p3), which is not associated with AD, along with a soluble protein that has been suggested
to play a neuroprotective role (Vella & Cappai, 2012) (Figure 1). It is unclear what drives
APP processing down a particular pathway. Alpha-secretase activity is predominant in
physiological conditions, but β-secretase is also active, making it clear that Aβ production is
not purely a function of a disease state. The physiological role of APP and its products is not
yet known, but it has been suggested to be involved in synaptogenesis (Guo et al., 2012),
mediating cellular response to ischaemic conditions (Morley et al., 2010), or as an anti-
microbial peptide (Soscia et al., 2010). Within the central nervous system (CNS) APP is
primarily expressed in neurons, but is also produced and processed in astrocytes and
microglia (Li et al., 2011).
It is widely accepted that Aβ, beyond being a diagnostic hallmark, is a critical
component in the progression of AD. Its production within the brain is seen as a necessary
step in the development of neurodegeneration. The initial evidence came upon locating the
gene encoding APP on chromosome 21. Given that individuals with Down’s syndrome
(trisomy 21) almost universally develop dementia, and that forms of familial and early-onset
AD are linked to mutations in the APP gene, aberrant processing of APP was indicated as a
critical step in the pathology of AD. As this processing ends with production of Aβ,
3
Figure 1: Pathways of APP processing.
APP has two primary endogenous pathways of processing; the first is non-amyloidogenic, as
α-secretase cleavage produces the soluble APPsα fragment, and membrane-bound C83. C83
is then further cleaved by γ-secretase, producing a non-pathogenic p3 peptide. The alternate
pathway is implicated in AD, with the first cleavage the action of β-secretase BACE1,
producing soluble APPsβ and C99. C99 is then cleaved by γ-secretase, producing the Aβ
peptide. The mechanisms controlling how these pathways interact, and which is active at any
given time or tissue, are still not understood. The orange section represents the area of APP
corresponding to the Aβ peptide. This section can vary in length, but is most commonly 40
or 42 peptides long. The blue box represents the lipid membrane, with the majority of the
APP peptide located on the lumenal side.
4
amyloid plaques were proposed as primary causative factors in AD (Hardy & Selkoe, 2002).
Further evidence comes from the fact that some mutations in APP processing pathways are
sufficient to cause AD, and that transgenic mice expressing mutant human APP genes show
Aβ pathology and AD-like memory and behavioural deficits (Irvine et al., 2008). A recent
study showed that a particular APP mutation found in Icelanders, which leads to decreased
APP processing and Aβ production, provides protection against AD and decreases cognitive
decline (Jonsson et al., 2012).
Plaques were the first identified deposition of Aβ peptides, but the situation in the
AD brain is much more diverse; there are a wide variety of assemblages of Aβ, and it is not
well understood how they combine and interact to contribute to AD pathology. In fact, one
early criticism of the amyloid hypothesis was that plaque density did not correlate with
disease progression, calling into question Aβ’s causative role in AD (Aizenstein et al., 2008).
This was answered to some degree with the discovery of oligomeric species of Aβ, which
self-associate from monomeric forms of the peptide and demonstrate significant
neurotoxicity and a clear association with cognitive decline (McLean et al., 1999; Walsh et
al., 2002). Plaque aggregation still appears to be an important step in AD development, as
evidence suggests that neurotoxic oligomers strongly associate with plaques, and may be
necessary for the seeding and development of new plaques (Gaspar et al., 2010). In addition,
the time frame of Aβ build-up relative to disease progression is an important factor to
consider. It is now suggested that Aβ levels may increase decades before any cognitive
deficit or plaque deposition can be observed, which would make therapeutic intervention
with anti-amyloid treatments very difficult to time correctly (Jack et al., 2010).
5
1.1.1. Amyloid-β as an inducer of inflammation and neurodegeneration
One of the main pathological consequences of Aβ aggregation and plaque formation
is the development of neuroinflammation. Aβ peptides are associated with the activation of
microglia and astrocytes, which surround amyloid plaques and mediate the release of pro-
inflammatory signals (Kitazawa et al., 2004). Multiple studies have implicated members of
the toll-like receptor (TLR) family and CD14, membrane receptors responsible for
recognizing foreign substances and activating the immune system, in mediating the
inflammatory activation of astrocytes and microglia in response to Aβ. Groups have reported
that blockade of TLR2 or TLR4 with specific antibodies decreased the degree of microglial
activation upon Aβ challenge (Jana et al., 2008; Udan et al., 2008). TLR2- and TLR4-
knockout microglia also showed decreased inflammatory response to Aβ (Reed-Geaghan et
al., 2009; Walter et al., 2007). A recent study showed that expressing TLR2 in HEK293 cells
triggered an inflammatory response to Aβ that did not exist in unaltered cells (Liu et al.,
2012). Knockout of CD14, a co-receptor of TLRs 2 and 4, increased inflammatory
signalling, commensurate with its role as a repressor of TLR signalling (Reed-Geaghan et al.,
2010).
Astrocytes were classically considered to be primarily regulatory cells, serving as
cellular ‘janitors’, delivering necessary nutrients to neurons and maintaining balance of ions,
pH and neurotransmitters, along with taking up compounds released by neurons in signalling
and maintaining the status quo of the extracellular milieu. It is now understood that they play
an important active role as well, mediating the response of the brain to acute injury. This
activated state, when left unchecked in chronic forms of injury, ultimately becomes harmful,
contributing to neurodegeneration. The mechanisms which control the balance between
6
astrocytes’ protective role and the long-term development of self-induced inflammatory
damage are critical to understanding their role in neurodegenerative diseases.
Activated astrocytes and microglia produce a number of neurotoxic molecules,
including reactive oxygen species (ROS) (Atamna & Boyle, 2006; Craft et al., 2006). Aβ has
been shown to induce neuronal cell death through the activation of astrocytes with a potential
mechanism involving release of nitric oxide (NO) (Hu et al., 1997; Jana & Pahan, 2010).
Astrocytes also release a wide range of cytokines and chemokines, including interleukin-6
(IL-6), tumour necrosis factor-α (TNF-α) and growth-related oncogene (GRO). These
cytokines serve to further promote the activation of astroglia, along with caspases, which
contribute to cell death (Garwood et al., 2011). Other evidence suggests that cytokines can
stimulate Aβ synthesis through modulating APP processing, and aid the oligomeric
association of Aβ by upregulating particular pro-oligomeric pathways (Blasko et al., 2004).
This could lead to a vicious cycle of inflammatory activation, with increased Aβ levels
triggering further inflammation, cytokine release and neuronal death.
The nature and extent of the link between neuroinflammation and cognitive
impairment in AD patients is not yet entirely clear, but multiple studies have shown that
inflammatory markers are associated with decline in cognitive function, both in transgenic
mouse models (Schwab et al., 2010) and in human patients (Parachikova et al., 2007),
making neuroinflammation a potentially attractive therapeutic target in AD patients.
1.2. Apolipoprotein E as an AD risk factor
One important protein in meditating this inflammatory response is apolipoprotein E
(ApoE). ApoE is one of the major human apolipoproteins, and plays an important role in
mediating lipid uptake into cells through the low-density lipoprotein (LDL) receptor, in order
7
to regulate intracellular cholesterol levels (Mahley, 1988). ApoE is highly expressed in both
the brain and liver, and is the major protein in the CNS mediating lipid transport and
distribution. Peripherally, ApoE combines with other apolipoproteins, phospholipids and
cholesterol in very low density lipoprotein (VLDL) particles, while in CNS, where VLDL is
not present, ApoE forms high density lipoprotein (HDL)-like lipid particles (Bu, 2009). The
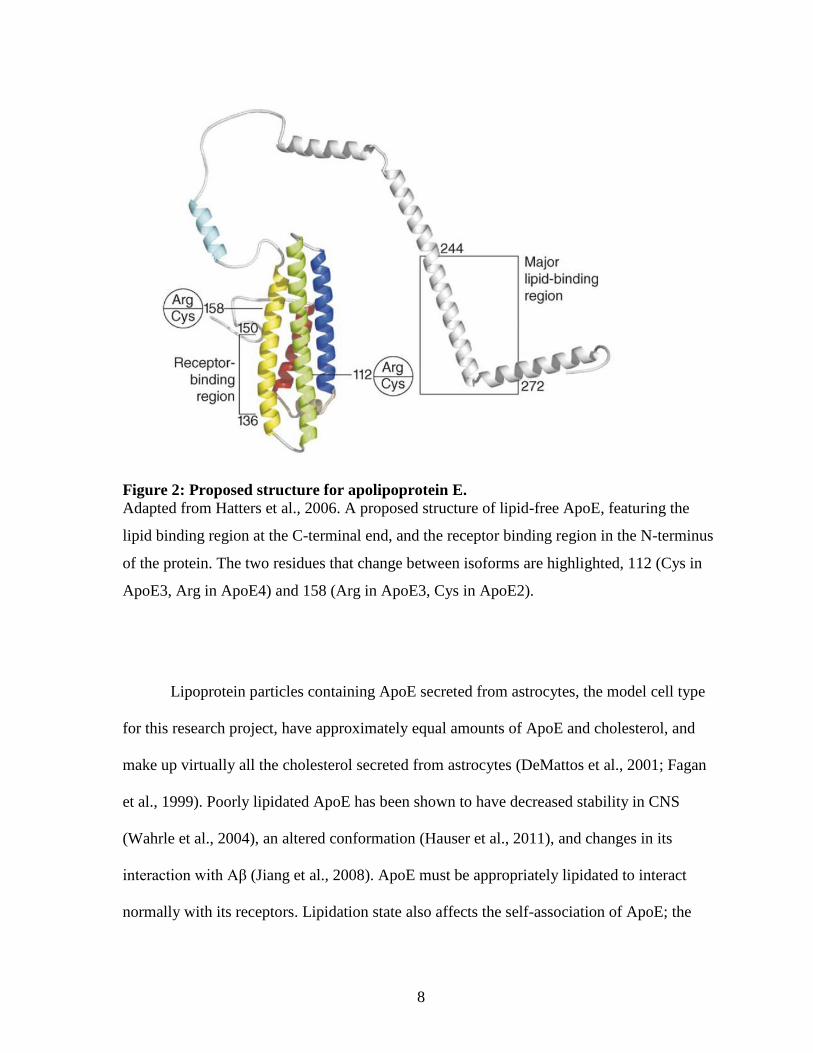
three-dimensional structure of ApoE consists of two separately folded domains, divided by a
‘hinge’ region; the C-terminal domain is responsible for protein binding to lipids, while the
N-terminal region mediates binding to various ApoE receptors (Figure 2). There is no single
model which is accepted to describe the arrangement of protein and lipid in ApoE particles:
studies have suggested the formation of a ‘belt’ of protein wrapped around a discoid lipid
bilayer or a spheroidal hydrophobic lipid core, with surface ApoE proteins wrapping around
polar head groups (Hatters et al., 2006).
ApoE containing lipoproteins bind to a class of metabolic receptors known as low-
density lipoprotein receptors (LDLRs), primarily LDLR itself and the LDL receptor related
protein 1 (LRP1). This is a highly conserved family of transmembrane receptors that are
responsible for the uptake and clearance of lipoproteins in plasma and cerebrospinal fluid,
affecting energy usage and nutrient uptake and mediating a wide range of cell signalling
pathways (Dieckmann et al., 2010). Some of these pathways have been shown to prevent
neuronal cell death. This includes the N-methyl-d-aspartate receptor, which controls
intracellular calcium and cAMP response element-binding (Qiu et al., 2003), and reelin
signalling, which promotes synaptic plasticity and function, primarily through the actions of
LRP1 (Herz & Chen, 2006).
8
Figure 2: Proposed structure for apolipoprotein E.
Adapted from Hatters et al., 2006. A proposed structure of lipid-free ApoE, featuring the
lipid binding region at the C-terminal end, and the receptor binding region in the N-terminus
of the protein. The two residues that change between isoforms are highlighted, 112 (Cys in
ApoE3, Arg in ApoE4) and 158 (Arg in ApoE3, Cys in ApoE2).
Lipoprotein particles containing ApoE secreted from astrocytes, the model cell type
for this research project, have approximately equal amounts of ApoE and cholesterol, and
make up virtually all the cholesterol secreted from astrocytes (DeMattos et al., 2001; Fagan
et al., 1999). Poorly lipidated ApoE has been shown to have decreased stability in CNS
(Wahrle et al., 2004), an altered conformation (Hauser et al., 2011), and changes in its
interaction with Aβ (Jiang et al., 2008). ApoE must be appropriately lipidated to interact
normally with its receptors. Lipidation state also affects the self-association of ApoE; the
9
lipid-free form exists primarily in tetramer arrangement, while lipid-bound forms vary based
on the amount and type of lipid (Garai & Frieden, 2010).
ApoE lipidation occurs as a result of the activity of the ATP-binding cassette A1
(ABCA1), a cholesterol efflux protein. ABCA1 is necessary for proper lipidation of ApoE,
and in knockout models, ABCA1 deficiency led to a decrease in overall levels of ApoE in
CNS (Krimbou et al., 2004; Wahrle et al., 2004). It is unclear whether ABCA1 activity plays
any role in AD; knockout of ABCA1 has been show to have no effect on Aβ levels in mouse
models (Hirsch-Reinshagen et al., 2005), and ABCA1 polymorphisms in human populations
were found not to correlate with the prevalence of AD (Wahrle et al., 2007), though one
study found over-expression of ABCA1 provided a level of protection against amyloid
deposition (Wahrle et al., 2008).
1.2.1. Differential AD risk between ApoE isoforms
ApoE has three common alleles, ε2, ε3 and ε4. The ε3 allele is the most prevalent,
occurring at a 77% frequency in the general population (Mahley, 1988). The ε2 allele is the
least frequent of the three (8%), and is associated with some degree of neuro-protection from
AD, although it is also implicated in a form of hyperlipoproteinemia (Corder et al., 1994;
Genin et al., 2011). The ε4 allele is a very strong risk factor for AD; an ε3/ε4 heterozygote
has a ~2-3 times greater risk for contracting AD, compared to an ε3/ε3 individual, while an
ε4 homozygote has ~12 times the risk (Roses, 1996). As a consequence, the ε4 allele is much
more common in AD populations. Its prevalence is ~15% in the general population, but ~30-
40% or higher in AD patients (Chuang et al., 2010; Corder et al., 1993). It is important to
note that despite its strong genetic association with AD, the ε4 allele is neither necessary nor
sufficient in the development of AD (Patterson et al., 2008). Comparison of these human
10
alleles with other species suggest that ApoE4 is the ‘ancestral’ form, similar to that in mouse
and rat models, as well as closer primate relatives, with ApoE3 developing in human
populations relatively recently, in evolutionary terms (Hanlon & Rubinsztein, 1995).
1.2.2 Structural and functional differences between ApoE isoforms
The three main human isoforms of ApoE differ as a result of a pair of single
nucleotide polymorphisms. ApoE3 features Cys112 and Arg158 residues, while ApoE2 has
Cys112 and Cys158, and ApoE4 has Arg112 and Arg158. The exact structural differences
propagated by these amino acid differences are not yet totally understood, especially in the
lipid-bound conformation of ApoE. One model, derived from x-ray crystallography of lipid-
free ApoE isoforms, suggests that the arginine at position 112 in ApoE4 has profound
structural effects on the protein’s arrangement, with the side chain of the arginine residue
interacting with the Glu255 residue (Hatters et al., 2006) (Figure 3a, left). As a result of
these changes, a ‘salt bridge’ forms between the C-terminal and N-terminal domains. This
domain interaction is believed to play a critical role in the functional differences seen in the
ApoE4 protein, relative to ApoE’s other isoforms (Morrow et al., 2002). In one
mitochondrial model of AD, relief of this domain interaction, either through mutation or
treatment with a small molecule, was able to restore normal function, suggesting that the
interaction may play an role in ApoE4’s deleterious effects (Chen et al., 2011). Another
recent model, based on nuclear magnetic resonance analysis of modified versions of human
ApoE isoforms suggests that the domain interaction may not be a critical difference between
the isoforms. Instead, it suggests Arg112, present in ApoE4, causes a shift in the a region
adjacent to the lipid binding domain through interaction with a nearby histidine residue
(Frieden & Garai, 2012) (Figure 3a , right).
11
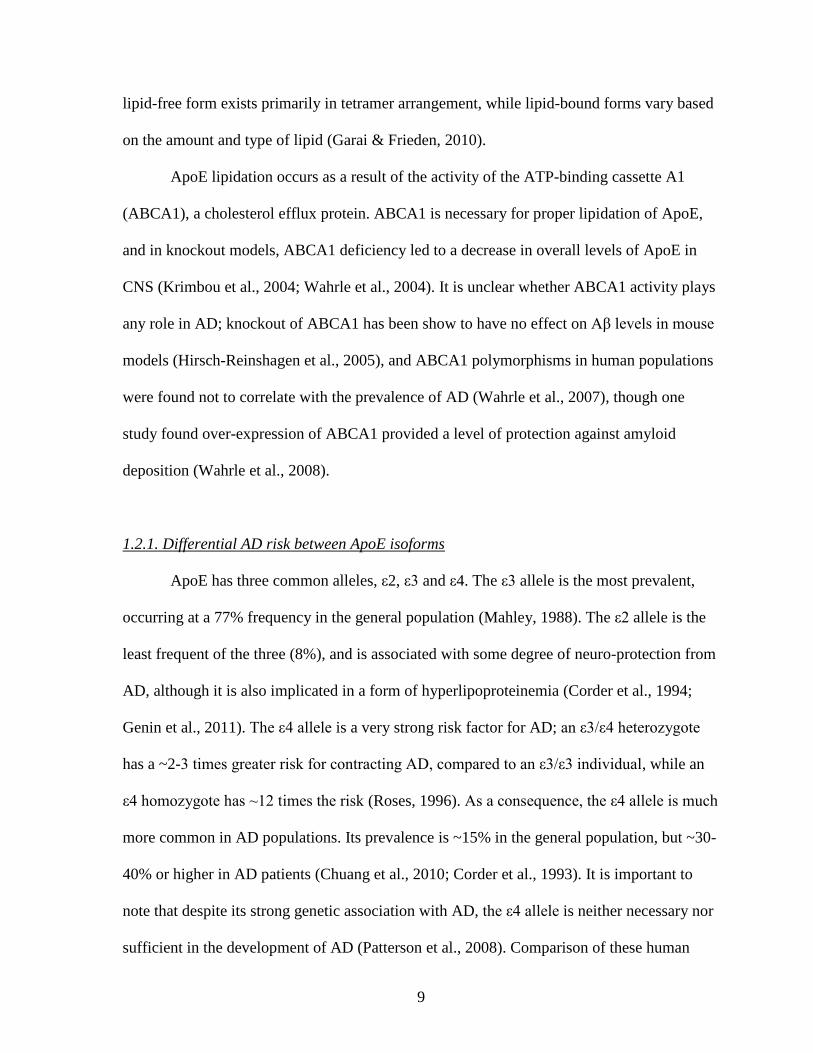
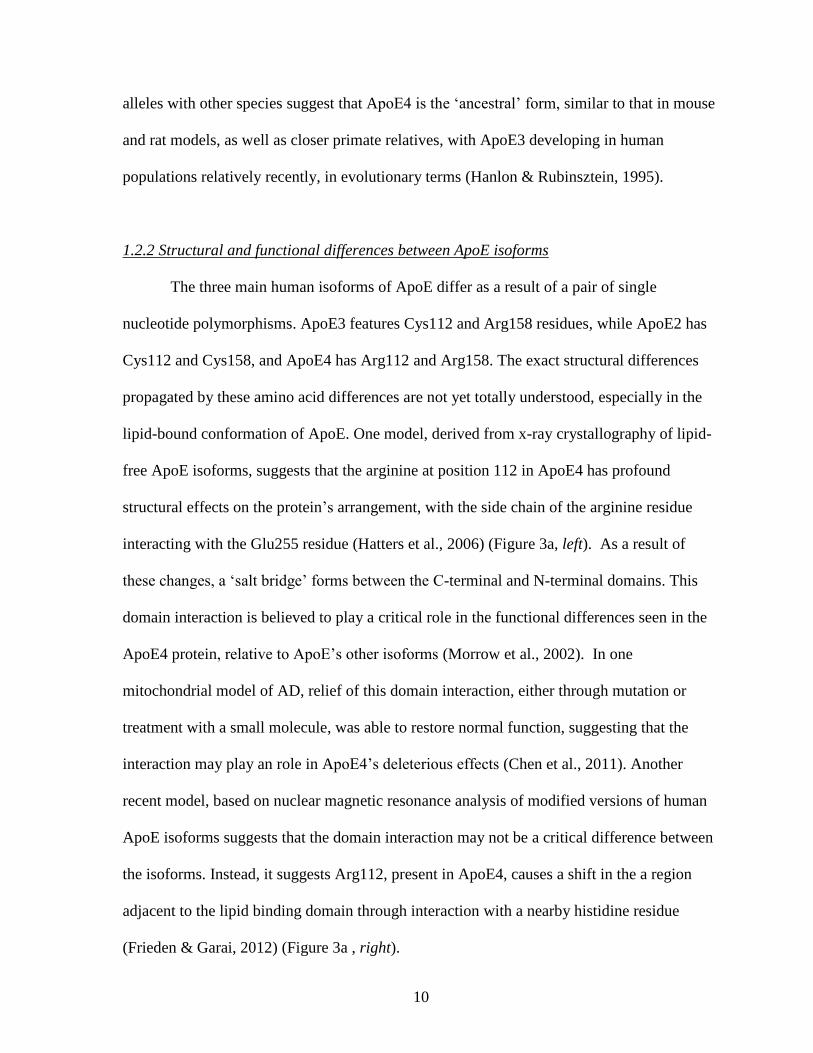
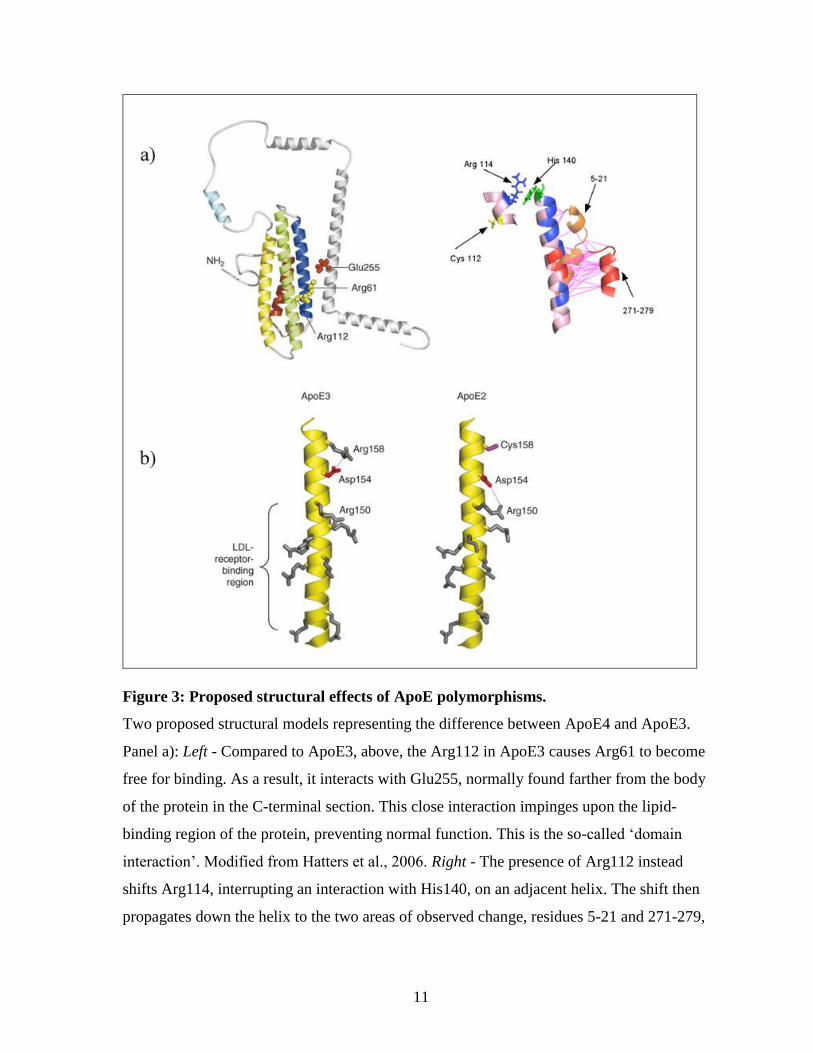
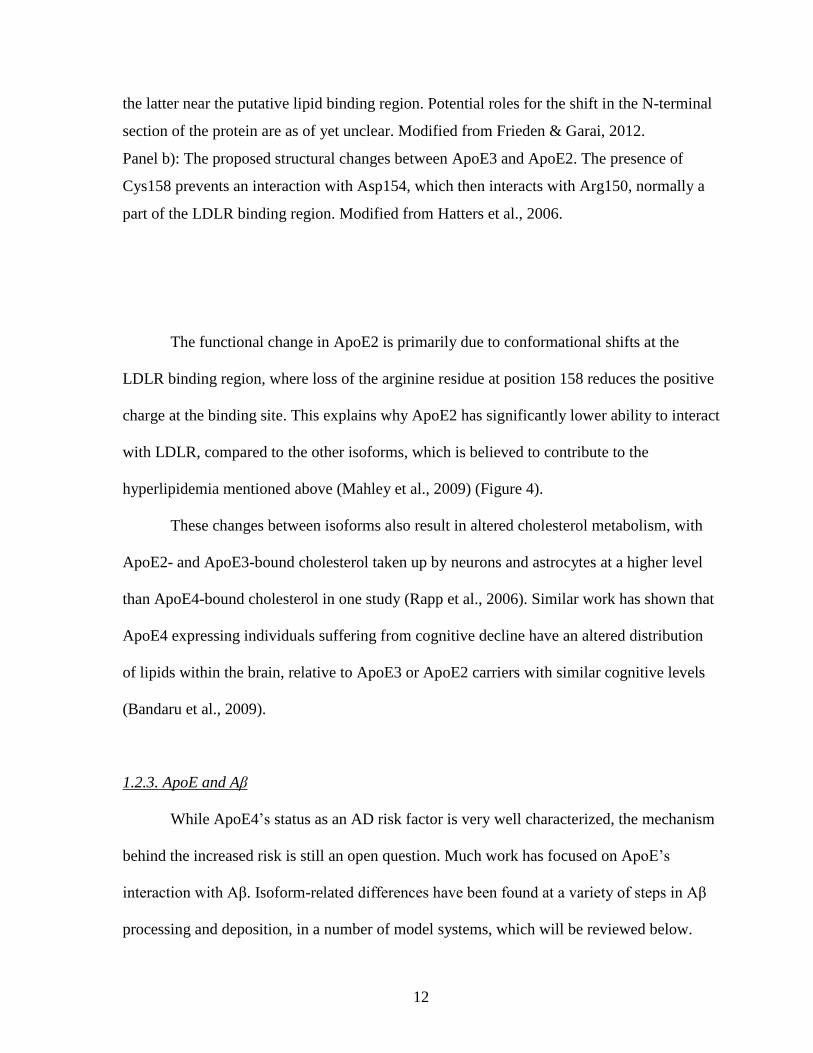
Figure 3: Proposed structural effects of ApoE polymorphisms.
Two proposed structural models representing the difference between ApoE4 and ApoE3.
Panel a): Left - Compared to ApoE3, above, the Arg112 in ApoE3 causes Arg61 to become
free for binding. As a result, it interacts with Glu255, normally found farther from the body
of the protein in the C-terminal section. This close interaction impinges upon the lipid-
binding region of the protein, preventing normal function. This is the so-called ‘domain
interaction’. Modified from Hatters et al., 2006. Right - The presence of Arg112 instead
shifts Arg114, interrupting an interaction with His140, on an adjacent helix. The shift then
propagates down the helix to the two areas of observed change, residues 5-21 and 271-279,
12
the latter near the putative lipid binding region. Potential roles for the shift in the N-terminal
section of the protein are as of yet unclear. Modified from Frieden & Garai, 2012.
Panel b): The proposed structural changes between ApoE3 and ApoE2. The presence of
Cys158 prevents an interaction with Asp154, which then interacts with Arg150, normally a
part of the LDLR binding region. Modified from Hatters et al., 2006.
The functional change in ApoE2 is primarily due to conformational shifts at the
LDLR binding region, where loss of the arginine residue at position 158 reduces the positive
charge at the binding site. This explains why ApoE2 has significantly lower ability to interact
with LDLR, compared to the other isoforms, which is believed to contribute to the
hyperlipidemia mentioned above (Mahley et al., 2009) (Figure 4).
These changes between isoforms also result in altered cholesterol metabolism, with
ApoE2- and ApoE3-bound cholesterol taken up by neurons and astrocytes at a higher level
than ApoE4-bound cholesterol in one study (Rapp et al., 2006). Similar work has shown that
ApoE4 expressing individuals suffering from cognitive decline have an altered distribution
of lipids within the brain, relative to ApoE3 or ApoE2 carriers with similar cognitive levels
(Bandaru et al., 2009).
1.2.3. ApoE and Aβ
While ApoE4’s status as an AD risk factor is very well characterized, the mechanism
behind the increased risk is still an open question. Much work has focused on ApoE’s
interaction with Aβ. Isoform-related differences have been found at a variety of steps in Aβ
processing and deposition, in a number of model systems, which will be reviewed below.
13
The conflicting evidence surrounding ApoE’s role in Aβ deposition is a good
example of the uncertainty in understanding the protein’s role in AD. In vitro studies have
shown human ApoE both promoting and inhibiting Aβ aggregation and the formation of
fibrils, depending on the particular conditions; different Aβ preparations have distinct
patterns of aggregation and deposition, and it is likely that they differentially respond to
ApoE. Studies have shown that ApoE isoforms produced in Escherichia coli (E.coli) are
capable of inhibiting fibrillar formation, regardless of isoform (Naiki et al., 1998; Wood et
al., 1996), while others found an increase in Aβ deposition and an isoform-specific
difference, with ApoE4 preferentially encouraging aggregation (Dafnis et al., 2010; Ma et
al., 1994; Wisniewski et al., 1994). In addition, the lipidation state of ApoE may have an
important effect on its role in Aβ fibril formation, with all three ApoE isoforms showing
decreased inhibition of Aβ fibrillation upon lipidation in a cell-free model (Beffert & Poirier,
1998).
Knockout of apoE in mouse models with over-expression of human APP showed that
the presence of apoE seemed to promote Aβ accumulation and plaque deposition (Bales et
al., 1999; Bales et al., 1997). Studies both in mice and in AD patients have shown an
isoform-specific effect, ApoE4 showing higher levels of Aβ and more advanced and larger
amyloid plaques, relative to ApoE3, and ApoE2 showing even lower levels, commensurate
with its protective role (Bales et al., 2009; Bien-Ly et al., 2012; Castellano et al., 2011;
Fagan et al., 2002) . Increased ApoE4 gene dose contributes to increased levels of Aβ, with
ε3/ε4 carriers showing lower Aβ burden, relative to ε4 homozygotes (Reiman et al., 2009).
ApoE has also been suggested as a modulator of APP processing, mediating Aβ levels by
altering production of the peptide. As above, there have been clear differences between
studies, with some finding that ApoE had no effect on the production of Aβ (Biere et al.,
14
1995; Cedazo-Minguez et al., 2001), while others found that exogenous ApoE stimulated Aβ
production in cell culture models (He et al., 2007; Ye et al., 2005) and yet others suggesting
ApoE discouraged the formation of Aβ, both in vitro and in transgenic mouse models
(Dodart et al., 2002; Hoe et al., 2006; Irizarry et al., 2004; Minami et al., 2010). Studies that
compared ApoE isoforms generally found differences, as ApoE4 was associated with higher
levels of Aβ production (Hoe et al., 2006; Huebbe et al., 2007). Other work suggests that
ApoE receptors, rather than ApoE itself, may be responsible for changes in APP processing
(Cam & Bu, 2006; Hoe & Rebeck, 2008).
ApoE’s role in mediating Aβ aggregation may be due to its ability to bind the
peptide, a characteristic that has been well documented. ApoE is known to associate with
amyloid plaques, and to form complexes with Aβ itself, binding the peptide at the same
region that the protein uses to bind lipids (Liu et al., 2011; Naslund et al., 1995; Strittmatter
et al., 1993). This interaction is dependent on the arrangement of Aβ into a beta-sheet
conformation, which promotes the formation and aggregation of Aβ fibres (Castano et al.,
1995; Golabek et al., 1996). ApoE4 has a decreased ability to bind Aβ, compared to the other
isoforms of ApoE, both as plaques and as neurotoxic oligomers (Petrlova et al., 2011;
Tokuda et al., 2000). Aβ binding is also known to inhibit ApoE’s ability to bind lipids,
possibly due to the Aβ binding site’s overlap with the lipid binding domain, which may
contribute to general ApoE dysfunction (Tamamizu-Kato et al., 2008). Both in vitro and
transgenic mice models have suggested that disrupting the ApoE-Aβ interaction leads to
decreased fibrillogensis and amyloid burden (Hao et al., 2010; Yang et al., 2011).
In addition to binding Aβ, it is also known that ApoE is involved in clearance of Aβ
across the blood-brain barrier (BBB), a process that takes place in both astrocytes and
microglia through interaction of Aβ-ApoE complexes with ApoE’s receptors, particularly
15
LRP1 (Kang et al., 2000; Lee & Landreth, 2010; Shibata et al., 2000; Thal, 2012). Other
evidence suggests ApoE promotes the retention of Aβ within the CNS, as it substantially
slows the peptide’s clearance across the BBB. This change is mediated by the lipidation state
of ApoE (lipid-binding slows transport across the BBB), but is also affected by the ApoE
isoform (Bell et al., 2007). One study suggested that ApoE4-Aβ complexes utilize the VLDL
receptor pathway, a slower method of clearance, while ApoE3 and ApoE2 complexes use
LRP1 (Deane et al., 2008). Additional work in transgenic mice confirms that ApoE4 is much
less efficient at clearing Aβ, compared to the other isoforms, though the mechanism is not
entirely clear (Castellano et al., 2011; Ji et al., 2001). It is possible that the observed increase
in plaque density in the presence of the ApoE4 allele is due, at least in part, to a diminution
of the amount and speed of Aβ clearance. ApoE also reduces the ability of peripheral tissues
to clear Aβ, though what impact, if any, this has on CNS Aβ levels is still unknown (Hone et
al., 2003; Sharman et al., 2010).
The clearance of Aβ from the CNS also occurs through the degradation of the
peptide, both extracellularly, by insulin degrading enzyme (IDE), and within microglia and
astrocytes by neprilysin (Iwata et al., 2000; Koistinaho et al., 2004; Kurochkin & Goto,
1994). Some genetic association studies have indicated that IDE variants may be associated
with the risk of AD, suggesting that altering the degree of Aβ degradation could substantially
affect the course of the disease (Carrasquillo et al., 2010; Mueller et al., 2007). ApoE has
been implicated in modulating this response, both in microglial degradation of Aβ and
macrophage-mediated proteolysis (Jiang et al., 2008; Zhao et al., 2009). An isoform-specific
effect has also been seen with cells from mice expressing human ApoE isoforms, with
ApoE2 showing more robust extracellular degradation of exogenous Aβ than ApoE3 or
ApoE4 (Zhao et al., 2009). Also, in ApoE knockout microglia incubated with human ApoE
16
isoforms, ApoE2 showed the strongest positive effect on degradation, and ApoE4 the
weakest (Jiang et al., 2008). Other work has shown that ApoE4 down-regulates IDE
expression, which could contribute to differential levels of degradation, though the overall
importance of this down-regulation in terms of greater disease risk is not known (Du et al.,
2009).
Lipids seem to play a critical role in the process as well, as ABCA1 knock-out
astrocytes showed a reduced ability to facilitate Aβ degradation (Jiang et al., 2008). A recent
study showed that lower microglial cholesterol levels, a result of ApoE activity, promoted
the degradation of Aβ in lysosomes (Lee et al., 2012a). There is still a question about just
how critical ApoE is in the degradation process, as there is evidence for an ApoE
independent degradation pathway, featuring LDLR directly interacting with Aβ peptides
(Basak et al., 2012).
Another important functional change observed with the ApoE4 isoform is an increase
in ApoE proteolysis and a decrease in stability, relative to other ApoE isoforms (Elliott et al.,
2011; Morrow et al., 2002). This change is thought to be a contributor to the lower levels of
ApoE protein found in the CNS of ApoE4 transgenic mice (Riddell et al., 2008). Given
ApoE’s role in Aβ clearance and degradation, it is possible that this decreased stability plays
a critical role in ApoE4’s status as an AD risk factor.
17
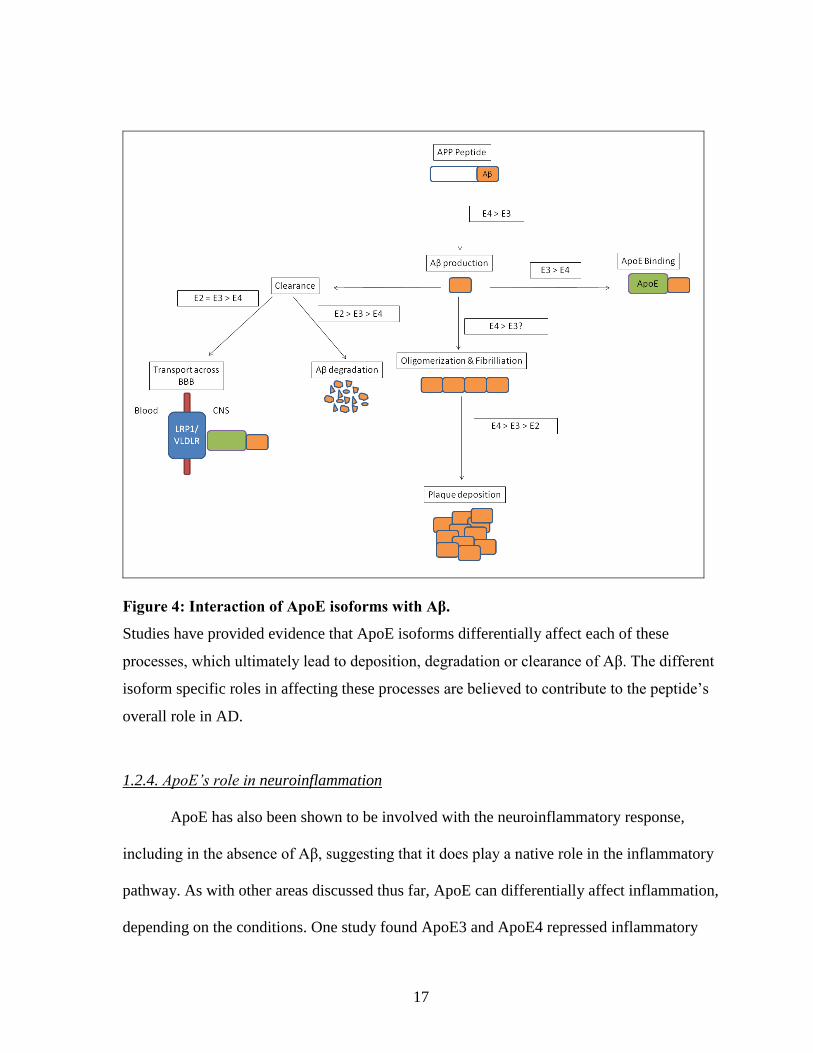
Figure 4: Interaction of ApoE isoforms with Aβ.
Studies have provided evidence that ApoE isoforms differentially affect each of these
processes, which ultimately lead to deposition, degradation or clearance of Aβ. The different
isoform specific roles in affecting these processes are believed to contribute to the peptide’s
overall role in AD.
1.2.4. ApoE’s role in neuroinflammation
ApoE has also been shown to be involved with the neuroinflammatory response,
including in the absence of Aβ, suggesting that it does play a native role in the inflammatory
pathway. As with other areas discussed thus far, ApoE can differentially affect inflammation,
depending on the conditions. One study found ApoE3 and ApoE4 repressed inflammatory
18
signalling after challenge with Aβ, but in the absence of that challenge, actually promoted
inflammation (Guo et al., 2004). Overall, the consensus is that each ApoE isoform has an
anti-inflammatory effect, as exogenous addition of ApoE, or even ApoE mimetics, to
cultured cells has been shown to downregulate the activation of microglia and peripheral
macrophages (Baitsch et al., 2011; Laskowitz et al., 2006; Lynch et al., 2003). This is
confirmed by the fact that apoE knockout mice show higher systemic activation of
macrophages, along with increased circulating inflammatory markers (Grainger et al., 2004),
and apoE knockout glial cells show higher in vitro inflammatory response to Aβ (LaDu et
al., 2001).
Isoform specific differences also exist in this ApoE-mediated inflammatory response.
As expected, the ApoE4 isoform is associated with increased levels of inflammation. This
has been shown in a variety of cell types, and in response to a number of different
inflammatory triggers. In macrophages transfected with human ApoE, ApoE4 expressing
cells responded more strongly to lipopolysaccharide (LPS), a potent inflammatory activator,
compared to ApoE3 expressing cells (Jofre-Monseny et al., 2007). ApoE4 expressing
astrocytes also showed significant impairment in their ability to promote neuronal recovery
after inflammatory insult (Maezawa et al., 2006). A similar study examining Schwann cells
showed that ApoE3 expression led to decreased inflammatory markers, relative to both
ApoE4 and ApoE2 expressing cells, suggesting that despite its protective role, ApoE2 may
contribute to inflammatory dysfunction in some cell types (Zhang et al., 2011). In addition
to observing changes in inflammatory cytokines, studies have found that ApoE4
preferentially increases NO release in human-derived macrophages after LPS stimulation
(Colton et al., 2004), and increases oxidative stress in neuronal cultures (Huebbe et al.,
19
2007). ApoE4 can also trigger activation of the pro-inflammatory complement system upon
Aβ challenge, which does not occur with ApoE3 or ApoE2 (McGeer et al., 1997).
Transgenic mouse models also provide evidence for this differential response
between isoforms. ApoE4 models show increased expression of inflammatory genes after
LPS treatment (Ophir et al., 2005) and increased inflammatory activation in hippocampal
areas, which are critical in AD neurodegeneration and in memory (Belinson & Michaelson,
2009). Interestingly, Vitek et al. (2009) found that mice expressing just one human ε3 allele
(ε3/0) had higher inflammatory response on LPS challenge than ε3/ε3 mice, but lower than
ε4/ε4 mice, suggesting that ApoE4 actively promotes a pro-inflammatory response.
A reverse relationship also exists; inflammatory activation has been shown to mediate
ApoE expression. Aβ treatment of astrocytes induces the release of ApoE lipoproteins by a
mechanism believed to involve nuclear factor-κB (NF-κB) (Bales et al., 2000). However,
other work has shown that ApoE gene expression is decreased after inflammatory activation
in macrophages (Gafencu et al., 2007), and that inflammatory cytokines interleukin-1 (IL-1)
and TNF-α reduce astrocytic and glial release of ApoE, suggesting that these cytokines are
acting to suppress ApoE’s basal anti-inflammatory activity (Aleong et al., 2008).
1.3. Research Proposal
Neuroinflammation is an emerging area of study in AD research, and recent research
on the interaction of this response with cholesterol metabolism in the AD brain, as well as
with ApoE specifically, suggests that neuroinflammation could be a critical part of ApoE’s
role as a genetic risk factor for AD. Astroglial cells are the most abundant cells in the brain,
and are the major cell type involved in neuroinflammation. One of the major goals of this
research is to determine the expression pattern of a variety of astrocytic inflammatory
20
mediators and signalling pathways upon Aβ treatment, and to determine how ApoE’s
isoforms differentially regulate this response. This will enhance our understanding of how
neuroinflammation is regulated in AD patients, and further highlight potential areas for
therapeutic intervention or ways to modify disease progression.
The main objective is to examine the involvement of ApoE isoforms on the
inflammatory response observed upon challenge with Aβ1-42. This will be initially
accomplished by measuring a range of inflammatory markers in astrocytes after treatment
with ApoE and Aβ1-42. Once this response is quantified, attempts will be made to identify
which signalling pathways are involved in this response. A wide ranging screen of
transcription factors (TFs) that are differentially regulated by ApoE isoforms should yield
clues to those pathways that influence the inflammatory response. Pathways that are
identified as being of interest from this screen will then be chemically manipulated, either
through activation or inhibition, in order to determine if these pathways are critical in the
Aβ-induced inflammatory response.
1.4. Hypothesis
The hypothesis is that ApoE isoforms differentially modify the Aβ peptide-induced
neuroinflammatory response via distinct signalling pathways in astrocytes. It is expected that
ApoE4 should potentiate Aβ-induced inflammation, relative to the other isoforms, while
ApoE2 should ameliorate this response.
21
Materials and Methods
2.1. Chemical Reagents
Dulbecco’s modified Eagle’s medium (DMEM), Advanced DMEM, TRIzol,
geneticin, sodium pyruvate, dNTPs, 0.25% trypsin/EDTA and antibiotic/antimycotic
(amphotericin B, streptomycin, penicillin) were purchased from Life Technologies Inc.
(Burlington, ON). Fetal bovine serum (FBS) was purchased from Hyclone (Logan, UT,
USA). HBSS was purchased from Wisent Multicell (St. Bruno, QC). Dimethyl sulfoxide
(DMSO), S3I-201 and 1α, 25-Dihydroxyvitamin D3 were purchased from Sigma (Oakville,
ON). BAY-11-7082 and MG-132 were purchased from EMD Millipore (Billerica, MA,
USA). Total c-Jun, phospho c-Jun ser-63 and 73, total p38 mitogen-activated protein kinase
(MAPK) and phospho-p38 MAPK antibodies were purchased from Cell Signalling
Technology (Danvers, MA, USA). Human recombinant ApoE isoforms were purchased from
Leinco (St. Louis, MO, USA). Shift antibodies for NF-κB, signal transducer and activator of
transcription-3 (STAT-3) and vitamin D receptor (VDR) were purchased from Santa Cruz
Biotechnologies (Santa Cruz, CA, USA). Aβ1-42 and a scrambled control, featuring the same
amino acids in a randomized order, were purchased from r-Peptide (Bogart, GA, USA).
Amino acids sequences of those peptides are presented below (Table 1). Polymerase chain
reaction (PCR) buffer and Taq DNA polymerase were purchased from Promega (Madison,
WI, USA).
22
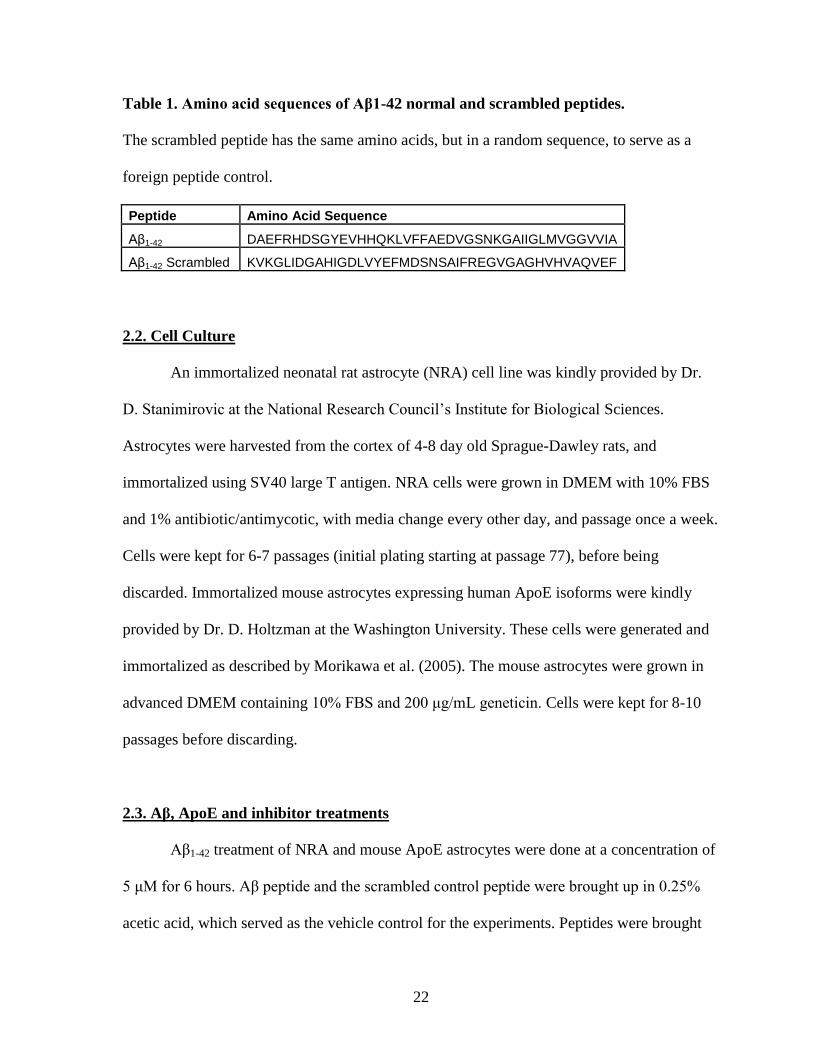
Table 1. Amino acid sequences of Aβ1-42 normal and scrambled peptides.
The scrambled peptide has the same amino acids, but in a random sequence, to serve as a
foreign peptide control.
Peptide Amino Acid Sequence
Aβ1-42 DAEFRHDSGYEVHHQKLVFFAEDVGSNKGAIIGLMVGGVVIA
Aβ1-42 Scrambled KVKGLIDGAHIGDLVYEFMDSNSAIFREGVGAGHVHVAQVEF
2.2. Cell Culture
An immortalized neonatal rat astrocyte (NRA) cell line was kindly provided by Dr.
D. Stanimirovic at the National Research Council’s Institute for Biological Sciences.
Astrocytes were harvested from the cortex of 4-8 day old Sprague-Dawley rats, and
immortalized using SV40 large T antigen. NRA cells were grown in DMEM with 10% FBS
and 1% antibiotic/antimycotic, with media change every other day, and passage once a week.
Cells were kept for 6-7 passages (initial plating starting at passage 77), before being
discarded. Immortalized mouse astrocytes expressing human ApoE isoforms were kindly
provided by Dr. D. Holtzman at the Washington University. These cells were generated and
immortalized as described by Morikawa et al. (2005). The mouse astrocytes were grown in
advanced DMEM containing 10% FBS and 200 μg/mL geneticin. Cells were kept for 8-10
passages before discarding.
2.3. Aβ, ApoE and inhibitor treatments
Aβ1-42 treatment of NRA and mouse ApoE astrocytes were done at a concentration of
5 μM for 6 hours. Aβ peptide and the scrambled control peptide were brought up in 0.25%
acetic acid, which served as the vehicle control for the experiments. Peptides were brought
23
up to 400μM and stored at -80 °C. The Aβ preparation contains a wide variety of forms of
Aβ1-42, from small low-weight forms to more complex, higher-weight aggregates. Human
recombinant ApoE purified from bacteria was brought up according to manufacturer’s
instructions, in 20 mM sodium phosphate + 0.5 μM DTT. ApoE treatment of NRA cells was
done at 3μM, for a period of 24 hours. Several chemicals were also used to modify signalling
mechanisms in both NRA cells and mouse ApoE astrocytes. Based on literature, a number of
doses were chosen for each of these compounds, along with recommended time courses.
MG-132 was used at 25, 10, and 5 μM for 6 hours, Bay-11-7082 at 30, 15, 10 μM for 6
hours, S3I-201 at 250, 100 and 50 μM for 6 hours and 1α, 25-Dihydroxyvitamin D3 was used
at 100, 50 and 25 nM, for 24 hrs. All four of these inhibitors were dissolved in 99% DMSO,
which served as the vehicle control.
2.4. RNA isolation, reverse-transcriptase (RT) and quantitative PCR
Total RNA was isolated from cells treated with Aβ, ApoE isoforms and/or chemical
modulators of signalling pathways using TRIzol reagent, a solution of phenol and guanidine
isothiocyanate, according to manufacturer’s instructions. The TRIzol reagent was used to
lyse cells, followed by collection into clean tubes and the addition of chloroform, at a ratio of
1:5 with TRIzol. The mixture was shaken for 15 seconds, allowed to settle for 2 minutes,
then spun at 14000 rpm for 15 minutes at 4°C. The clear aqueous phase was transferred to
new tubes, and was mixed at 1:1 with isopropanol. This mixture was again shaken, and left
for 30 minutes at -20°C, in order to precipitate the RNA. After this, the samples were left at
room temperature for 10 minutes, then spun at 14000 rpm for 10 minutes at 4°C, leaving a
small pellet. The isopropanol was decanted off, and the pellet washed by adding 1 mL of
70% ethanol in DNase/RNase free distilled water, vortexed strongly to ensure the pellet
24
lifted off of the bottom of the tube, and spun at 10000 rpm for 5 minutes at 4°C. The ethanol
was then pipetted off, and the pellet left to dry for 30 minutes. After that wait, the pellets
were resuspended in DNase/RNase-free water, and heated at 55°C for 10 minutes.
For RNA samples processed by qPCR, the next step was the cleanup of genomic
DNA in the samples, done using Ambion DNA-free kits (Life Technologies, Burlington,
ON). Recombinant DNase I enzyme (1 μL) and 0.1 volume of 10X DNase I buffer were
added to RNA samples, which were then incubated at 37°C for 30 minutes. After the
incubation, 0.1 volume of DNase Inactivation Reagent was added. This was mixed
thoroughly, and allowed to sit for 2 minutes. Samples were then spun at 10000 g for 90
seconds, and the supernatant, containing RNA free of any genomic DNA contamination, was
transferred to a new tube.
The concentration of RNA in the samples was then determined through measuring
the absorbance of the sample at 260nm with a NanoDrop 1000 UV-Vis Spectrophotometer
(Thermo Scientific Inc, Nepean, ON). The mRNA was then transcribed into cDNA, using
iScript kits (BioRad, Berkeley, CA, USA). RNA (2μg) was combined with 5x iScript
reaction mix and 1x reverse transcriptase enzyme, and run for 5 minutes at 25°C, 30 minutes
at 42°C and 5 minutes at 85°C to produce cDNA.
For samples run on RT-PCR, a reaction mix of 1x commercial PCR buffer, 1.5 mM
MgCl2, 200 μM of dNTP mixture, 400 μM each of forward and reverse primers, and 0.625 U
of Taq DNA polymerase were used. Primers for the particular genes used were designed
using NCBI/Primer Blast, and ordered from AlphaDNA (Montreal, QC) (Table 2). Reaction
protocols for each pair of primers are also listed (Table 3). The reaction products were then
run on 1.5% agarose gels at 100 V for 1 hour, and the bands visualized with a Fluorchem E
imager (Proteinsimple, Santa Clara, CA, USA). Densitometry analysis of the bands was then
25
performed using AlphaView SA (Cell Biosciences Inc., Santa Clara, CA, USA). The bands
for the inflammatory markers GRO and TNF-α were then normalized to the level of
expression of actin, and the fold change relative to control treatments was determined.
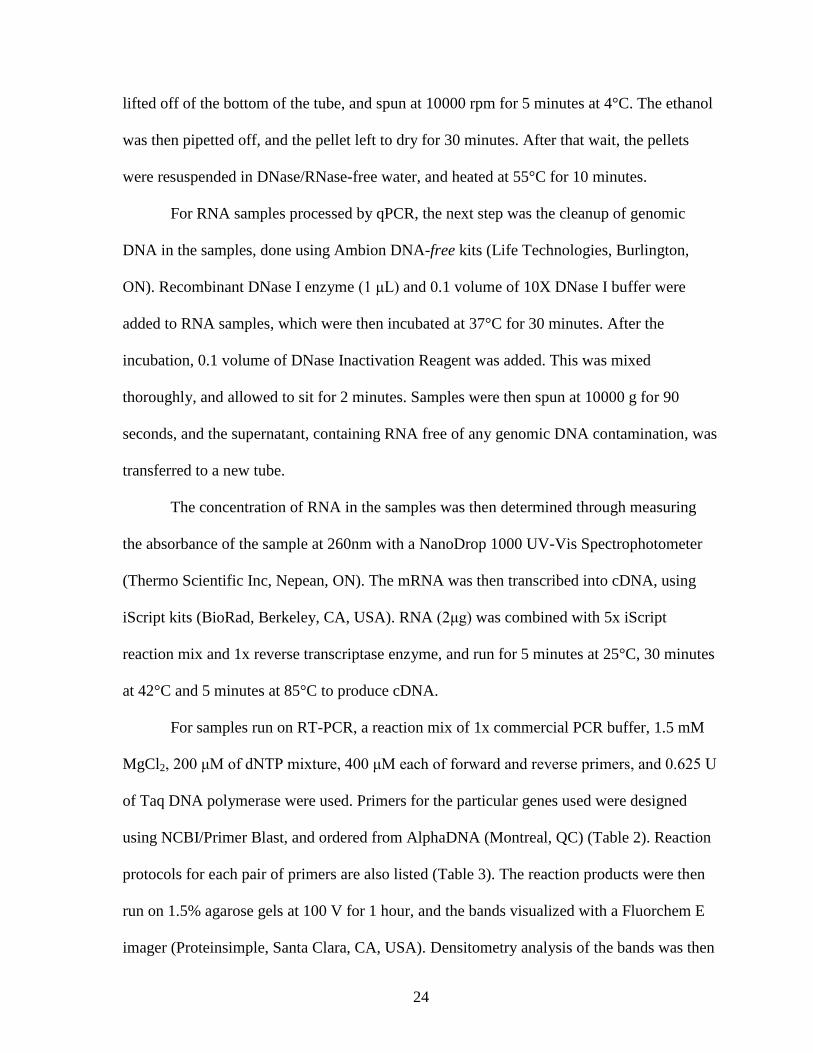
Table 2. RT-PCR primer sequences
Gene Sequences
GRO Forward 5’-CGCGAGGCTTGCCTTGACCC-3’
Reverse 5’-CCGCCCTTCTTCCCGCTCAAC-3’
TNF-α Forward 5’-GCCACCACGCTCTTCTG-3’
Reverse 5’-GGTGTGGGTGAGAGGAGCAC-3’
Actin Forward 5’-GGCTACAGCTTCACCACCAC-3’
Reverse 5’-TACTTGCGCTCAGGAGGAGC-3’
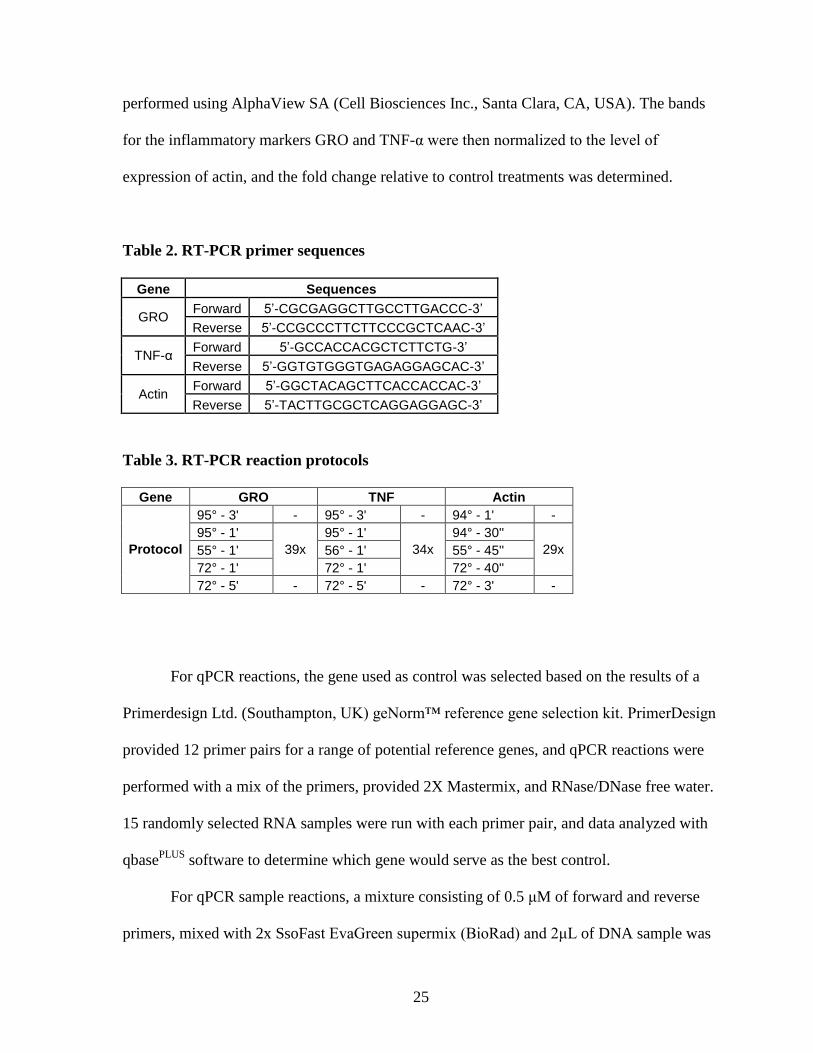
Table 3. RT-PCR reaction protocols
Gene GRO TNF Actin
Protocol
95° - 3' - 95° - 3' - 94° - 1' -
95° - 1'
39x
95° - 1'
34x
94° - 30''
29x 55° - 1' 56° - 1' 55° - 45''
72° - 1' 72° - 1' 72° - 40''
72° - 5' - 72° - 5' - 72° - 3' -
For qPCR reactions, the gene used as control was selected based on the results of a
Primerdesign Ltd. (Southampton, UK) geNorm™ reference gene selection kit. PrimerDesign
provided 12 primer pairs for a range of potential reference genes, and qPCR reactions were
performed with a mix of the primers, provided 2X Mastermix, and RNase/DNase free water.
15 randomly selected RNA samples were run with each primer pair, and data analyzed with
qbasePLUS
software to determine which gene would serve as the best control.
For qPCR sample reactions, a mixture consisting of 0.5 μM of forward and reverse
primers, mixed with 2x SsoFast EvaGreen supermix (BioRad) and 2μL of DNA sample was
26
reacted using a CFX96 Real-time PCR detection system (BioRad). qPCR Primers were
ordered from IDT (Coralville, IA, USA) (Table 4). Reactions were performed with the
following conditions: 98°C for 2 minutes, then 39 cycles of 98°C for 2 seconds and 55°C for
5 seconds (for TNF-α reactions, 60° for 5 seconds was used). Standard curves for each set of
primers were run using dilutions ranging from 1/10 to 1/10000. Based on Ct values
calculated from these curves, dilution factors for each set of primers were chosen. CFX
Manager software (BioRad) was used to measure the fluorescence at each cycle of the
reaction, and baseline values, determined from the standard curves, were used to calculate Ct
values.
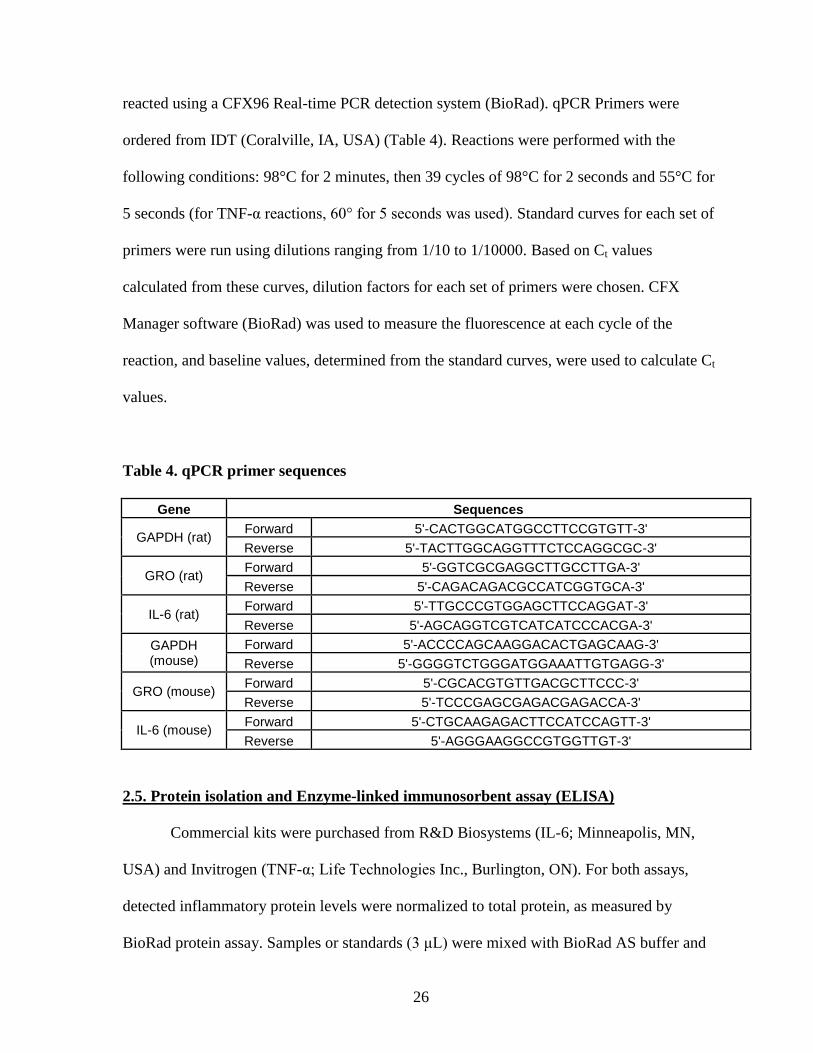
Table 4. qPCR primer sequences
Gene Sequences
GAPDH (rat) Forward 5'-CACTGGCATGGCCTTCCGTGTT-3'
Reverse 5'-TACTTGGCAGGTTTCTCCAGGCGC-3'
GRO (rat) Forward 5'-GGTCGCGAGGCTTGCCTTGA-3'
Reverse 5'-CAGACAGACGCCATCGGTGCA-3'
IL-6 (rat) Forward 5'-TTGCCCGTGGAGCTTCCAGGAT-3'
Reverse 5'-AGCAGGTCGTCATCATCCCACGA-3'
GAPDH (mouse)
Forward 5'-ACCCCAGCAAGGACACTGAGCAAG-3'
Reverse 5'-GGGGTCTGGGATGGAAATTGTGAGG-3'
GRO (mouse) Forward 5'-CGCACGTGTTGACGCTTCCC-3'
Reverse 5'-TCCCGAGCGAGACGAGACCA-3'
IL-6 (mouse) Forward 5'-CTGCAAGAGACTTCCATCCAGTT-3'
Reverse 5'-AGGGAAGGCCGTGGTTGT-3'
2.5. Protein isolation and Enzyme-linked immunosorbent assay (ELISA)
Commercial kits were purchased from R&D Biosystems (IL-6; Minneapolis, MN,
USA) and Invitrogen (TNF-α; Life Technologies Inc., Burlington, ON). For both assays,
detected inflammatory protein levels were normalized to total protein, as measured by
BioRad protein assay. Samples or standards (3 μL) were mixed with BioRad AS buffer and
27
BioRad B buffer, according to manufacturer’s specifications, then left to incubate at room
temperature for 15 minutes. The plate was then read at 750 nm by a Spectra MAX 340
spectrophotometer, using SoftMax PRO software. The resulting absorbance values were then
converted into protein concentrations, allowing the ELISA results to be normalized.
For the TNF-α assay, 100 μL of media samples harvested from cells treated with a
combination of Aβ and recombinant ApoE, as discussed above, was added to the provided
plates. Samples and standards were incubated for 2 hours and washed with provided wash
buffer. Biotin conjugate was then added to the plate and incubated for an hour, then washed
off, replaced by Streptadvidin-HRP working solution, which was incubated for an hour.
Following that, the solution was washed off and stabilized chromogen was added for 30
minutes, at which point stop solution was used to end the reaction. The plate was then read at
450 nm by a Spectra MAX 340 spectrophotometer, using SoftMax PRO software.
For the IL-6 ELISA, whole cell protein was harvested using RIPA buffer (1% NP40,
0.5% Deoxycholate, 0.1% SDS, 1X PBS). Ice cold buffer, along with a protease inhibitor
cocktail (Sigma), was added to cells, and the lysate collected and kept on ice for 30 minutes.
Samples were then spun at 12000 rpm for 10 minutes at 4°C. The supernatants were
transferred to new tubes and stored. As above, protein concentration was determined by
BioRad protein assay. For the ELISA reaction itself, Assay Diluent was added to each well
on the plate, followed by 50 μL of standard or sample. These were then incubated for two
hours, washed and replaced with conjugate solution, followed by another two hour
incubation and washing. Substrate solution was added to each well, and left to incubate for
30 minutes. At that point, stop solution was used to end the reaction, and absorbance of each
sample read at 450 nm by a Spectra MAX 340 spectrophotometer, using SoftMax PRO
software.
28
2.6. Isolation of nuclear extract and Protein/DNA array
NRA cells were treated with combination treatments of Aβ or scrambled control and
either recombinant ApoE2 or ApoE3, as described above. Nuclear material was then isolated,
using a kit purchased from Panomics Inc. Working reagents were created according to kit
specifications, combining DTT, protease inhibitor and two phosphatase inhibitors with
Panomics Buffer A or Buffer B, respectively. Cells were washed with 1X chilled PBS,
followed by adding Buffer A working reagent. The culture dishes were then shaken on ice
for 10 minutes, and the cells scraped off the bottom of the dish and transferred into clean
tubes. The samples were spun at 14000 g for 3 minutes at 4°C, after which the supernatant
was discarded, leaving a pellet. Buffer B working reagent was added to the pellet, and left on
ice for an hour. The samples were then spun at 14000 g for 5 minutes at 4°C, and the
supernatant, containing the nuclear extract, was transferred to a new tube. Protein
concentration of each sample extract was then determined by Bio-Rad protein assay
(described above).
The Protein/DNA Combo array was purchased from Panomics Inc. The initial step
was preparation of the array membranes. Membranes were placed in hybridization bottles,
along with pre-heated Panomics 1X Pre-Treatment Buffer I, and left to circulate in a
hybridization oven for 5 minutes at 45°C. This was followed by adding Pre-Treatment Buffer
II, and incubating for a further 10 minutes, again at 45°C. After a through rinsing, pre-heated
Hybridization buffer was added to the bottles, and left overnight to incubate at 42°C.
The DNA probe mix provided by Panomics was mixed with RNase/DNase free water
and the nuclear extract samples, and left to sit for 30 minutes at 15°C, to allow Protein-DNA
complexes to form. The protein-bound probes were then isolated using spin columns. Each
29
column was washed with incubation buffer, and spun at 10000 rpm for 30 seconds at 4°C.
Each sample probe mix was then mixed with incubation buffer, and added to the washed
columns. The columns sat on ice for 30 minutes, and then were spun at 7000 rpm for 30
seconds at 4°C. The flow-through was discarded, and the column was washed, by adding 1X
wash buffer then spinning at 7000 rpm for 30 seconds at 4°C. This washing was repeated
five times, and remaining wash buffer removed by a further spin at 10000 rpm for 30
seconds at 4°C. 1X elution buffer was then added to the spin column, and left for 5 minutes,
then spun for 1 minute at 10000 rpm, collecting the flow-through, consisting of the bound
DNA probes, in a clean tube.
The bound probes were then denatured by heating at 95°C for 3 minutes. After a
quick cooling, the probes were added to the buffer and membrane in the hybridization
bottles, and left at 42 °C overnight to hybridize. The next day, the hybridization mixture was
poured off, and the membranes washed, first left to incubate at 42°C for 20 minutes with
Wash Buffer I, and then repeated with Wash Buffer II. After these wash steps, the
membranes were ready for detection and visualization.
Each membrane was placed in a container with provided 1X blocking buffer, and left
to shake for 15 minutes. Buffer (1 mL) was then removed from the container, mixed with 1X
Streptavidin-HRP conjugate, placed back in with the membrane and left to shake for a
further 15 minutes. The Blocking/Streptavidin solution was then decanted off, and each
membrane washed three times with Panomics wash buffer, for 8 minutes each wash.
Detection buffer was then added to each membrane and incubated for five minutes. Each blot
was then covered with Panomics Working substrate solution, left for five minutes, then
visualized using X-ray film. Blots were analyzed using UN-SCAN-IT gel software (Silk
Scientific, Inc, Orem, UT, USA).
30
2.7. Whole cell protein isolation and Western Blotting
Protein was harvested from NRA cells treated with Aβ and ApoE isoforms, as above.
Cells were lysed with Western loading buffer (25% glycerol, 25% β-mercaptoethanol, 15%
SDS, 0.25% bromphenol blue, 50mM Tris-HCl). The samples were then boiled at 100°C for
10 minutes, cooled on ice for 5 minutes, and spun at 14000 rpm for 15 minutes. The protein-
containing supernatant was then transferred and stored. Total protein levels were determined
by tricholoracetic acid (TCA) assay. Samples and standards were mixed with 60% TCA, left
to incubate at 37°C for 15 minutes, and then read at 570 nm by a Spectra MAX 340
spectrophotometer, using SoftMax PRO software.
For Western blotting, 20-30 μg of the isolated protein was loaded onto 10% SDS-
PAGE gel, and run for one hour at 100 V. The proteins were then transferred onto PVDF
membrane overnight at 150mA. Blots were blocked for 1 hour at room temperature in
blocking buffer [5% skim milk powder in 1X Tris-buffered saline/Tween 20 (TBST)].
Primary antibody was then added to the blots. Antibodies used were Phospho-p38 MAPK
(Thr180/Tyr182), Phospho-c-Jun (Ser63), total p38 MAPK and total c-Jun, at dilution of
1:1000 in 1% skim milk powder in TBST. Blots were incubated at 4°C overnight, then
washed and incubated with secondary antibodies, diluted at 1:5000 in 1% skim milk powder
in TBST. Protein bands were then visualized with ECL Plus solution, and imaged on X-ray
film.
31
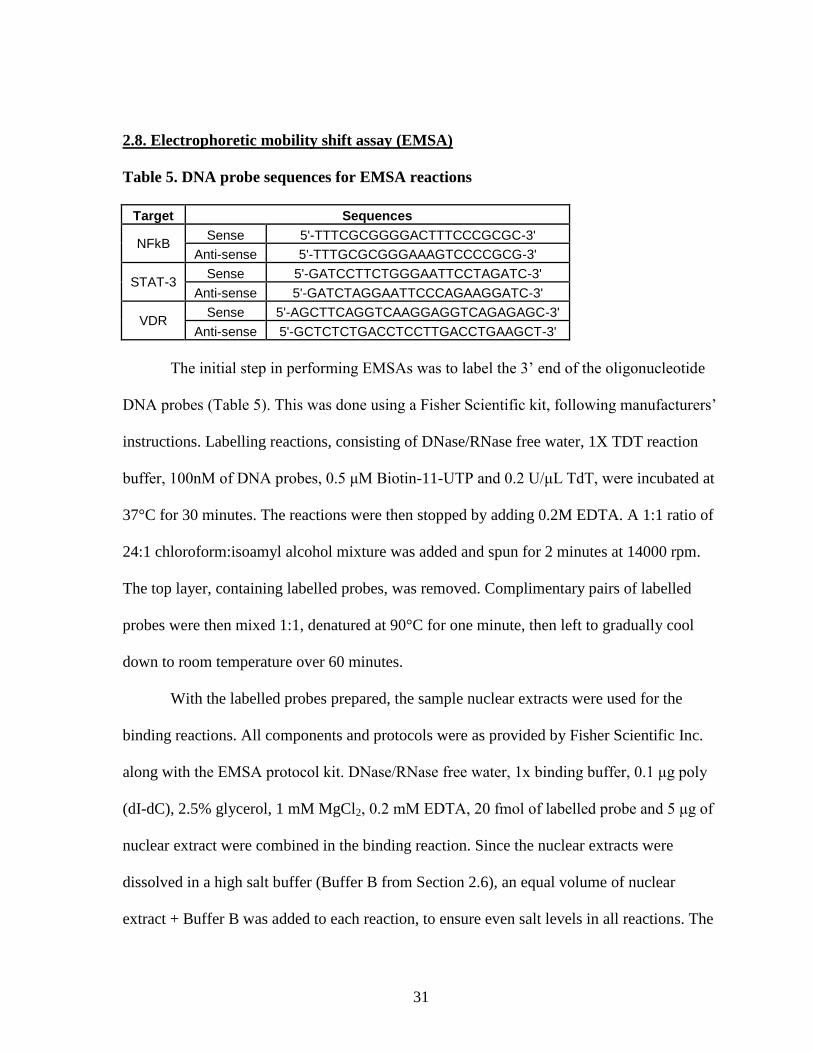
2.8. Electrophoretic mobility shift assay (EMSA)
Table 5. DNA probe sequences for EMSA reactions
Target Sequences
NFkB Sense 5'-TTTCGCGGGGACTTTCCCGCGC-3'
Anti-sense 5'-TTTGCGCGGGAAAGTCCCCGCG-3'
STAT-3 Sense 5'-GATCCTTCTGGGAATTCCTAGATC-3'
Anti-sense 5'-GATCTAGGAATTCCCAGAAGGATC-3'
VDR Sense 5'-AGCTTCAGGTCAAGGAGGTCAGAGAGC-3'
Anti-sense 5'-GCTCTCTGACCTCCTTGACCTGAAGCT-3'
The initial step in performing EMSAs was to label the 3’ end of the oligonucleotide
DNA probes (Table 5). This was done using a Fisher Scientific kit, following manufacturers’
instructions. Labelling reactions, consisting of DNase/RNase free water, 1X TDT reaction
buffer, 100nM of DNA probes, 0.5 μM Biotin-11-UTP and 0.2 U/μL TdT, were incubated at
37°C for 30 minutes. The reactions were then stopped by adding 0.2M EDTA. A 1:1 ratio of
24:1 chloroform:isoamyl alcohol mixture was added and spun for 2 minutes at 14000 rpm.
The top layer, containing labelled probes, was removed. Complimentary pairs of labelled
probes were then mixed 1:1, denatured at 90°C for one minute, then left to gradually cool
down to room temperature over 60 minutes.
With the labelled probes prepared, the sample nuclear extracts were used for the
binding reactions. All components and protocols were as provided by Fisher Scientific Inc.
along with the EMSA protocol kit. DNase/RNase free water, 1x binding buffer, 0.1 μg poly
(dI-dC), 2.5% glycerol, 1 mM MgCl2, 0.2 mM EDTA, 20 fmol of labelled probe and 5 μg of
nuclear extract were combined in the binding reaction. Since the nuclear extracts were
dissolved in a high salt buffer (Buffer B from Section 2.6), an equal volume of nuclear
extract + Buffer B was added to each reaction, to ensure even salt levels in all reactions. The
32
samples were then left at room temperature for 20 minutes. To generate the supershift
reactions, 2 μg of antibody was added to one of the reaction mixes, and left to sit an
additional 5 minutes. The samples were then mixed with 5X loading buffer, and run on 5%
native polyacrylamide gels for 75 minutes at 100 V at room temperature. These gels were
then transferred onto Thermo Scientific membranes, at 1 A of current for one hour. The
DNA/protein interactions were then cross-linked by exposing the membrane to a
transilluminator at 312 nm for 15 minutes.
To detect the bands on the cross-linked membranes, Thermo Scientific detection kits
were used. Blots were placed in blocking buffer for 15 minutes, which was then removed and
replaced with blocking buffer containing a 1:300 dilution of stabilized streptavidin-HRP
conjugate, and left to shake for another 15 minutes. This buffer solution was then removed,
and the membranes washed five times with 1X wash buffer, each wash lasting 5 minutes.
The membranes were then incubated with substrate equilibration buffer for 5 minutes, and
then in a substrate working solution (1:1 mixture of luminol/enhancer and peroxide
solutions) for five minutes. Bands were then visualized on X-ray film at a variety of
exposure times.
2.9. Statistical analysis
Statistical analysis for all experiments was done using GraphPad Prism from
GraphPad Software (La Jolla, CA, USA). For comparisons between multiple treatments,
One-Way ANOVA was used, with post-hoc analysis using the Bonferroni method. For
comparisons between single treatments, Student’s t-test was used. In all cases, the threshold
for statistical significance was considered p<0.05. All experiments were repeated at least 3
times (n=3).
33
Results
3.1. Aβ1-42 peptides induce an inflammatory response in NRA cells
3.1.1. mRNA levels of inflammatory markers are increased upon Aβ treatment, as measured
by RT-PCR and qPCR
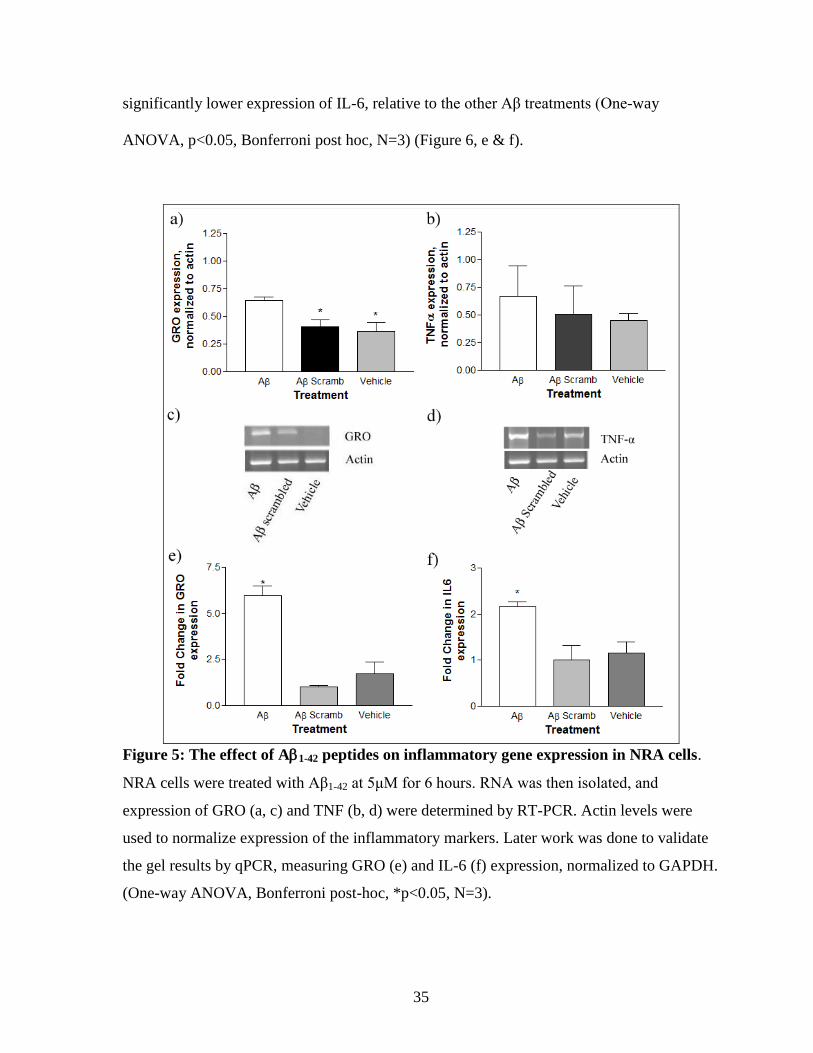
NRA cells were treated with Aβ or scrambled Aβ peptide at 5μM for 6 hours, after
which total RNA was recovered from the cells, cleaned of genomic DNA and reverse-
transcribed to cDNA via the methods described above, and transcript levels of GRO and
TNF-α analyzed by RT-PCR. Expression of these markers was normalized to β-actin.
Analysis by one-way ANOVA showed a significant treatment effect on GRO expression and
significant increase upon Aβ treatment, relative to both vehicle control and the scrambled Aβ
peptide (One-way ANOVA, Bonferroni post-hoc test, p<0.05, N=3). There was no
significant difference between the vehicle and scrambled peptide treatments (Figure 5 a & c).
TNF-α expression showed a similar trend of inflammatory response upon Aβ challenge, but
the results were not statistically significant (Figure 5 b & d; One-way ANOVA, Bonferroni
post-hoc test, N=3).
This showed that the NRA cells were, as expected, responding with increased
inflammatory activity in the presence of Aβ peptide. This experiment served as a good test of
the NRA system as a model cell type, as astrocytes are known to be critical in the
neuroinflammatory response, and are also important in the uptake, processing and
degradation of Aβ within the CNS. Observing this response in the in vitro cell line allowed
progression into further experiments.
34
qPCR measurement of inflammatory activation agreed with the RT-PCR gel results
above. Again, RNA was isolated from NRA cells treated with Aβ, as described. The mRNA
expression of two inflammatory markers, GRO and IL-6, were measured, and normalized to
a control gene, GAPDH. Expression of both GRO and IL-6 was significantly higher upon Aβ
challenge, relative to controls (Figure 5 e & f ; One-way ANOVA, Bonferroni post-hoc,
p<0.05, N=3), consistent with the findings of the RT-PCR results.
3.2. ApoE isoforms differentially modulate the Aβ-induced inflammatory response
3.2.1. mRNA expression of inflammatory markers changes upon treatment with exogenous
ApoE in combination with Aβ
Once it was confirmed that Aβ activated inflammation in the test model system, the
effect of the various isoforms of ApoE on this response was examined. NRA cells were
treated concurrently with Aβ and the three isoforms of recombinant human ApoE at a
concentration of 3μM for 24 hours, then expression of inflammatory markers was measured.
As above, levels of GRO and TNF-α were assessed by RT-PCR and normalized to actin
expression. The ApoE2 + Aβ treatment showed significantly lower expression of both
markers, compared to ApoE4 + Aβ (GRO p<0.01; TNF-α p<0.05), ApoE3 + Aβ (p<0.05),
or, Aβ alone (One-way ANOVA, Bonferroni post-hoc, p<0.05, N=3). ApoE4 + Aβ
treatment trended to have higher expression than the ApoE3 + Aβ treatment, but this was not
significant for either gene (Figure 6, a & d).
These results agreed with qPCR measurement of GRO and IL-6 expression,
normalized to GAPDH. ApoE2 + Aβ treatment showed significantly lower expression of
GRO, relative to ApoE3 + Aβ or to Aβ alone (One-way ANOVA, p<0.05 relative to
scrambled, Bonferroni post hoc; p<0.05 relative to Aβ, Two-tailed t-test, N=3), and
35
significantly lower expression of IL-6, relative to the other Aβ treatments (One-way
ANOVA, p<0.05, Bonferroni post hoc, N=3) (Figure 6, e & f).
Figure 5: The effect of A1-42 peptides on inflammatory gene expression in NRA cells.
NRA cells were treated with Aβ1-42 at 5μM for 6 hours. RNA was then isolated, and
expression of GRO (a, c) and TNF (b, d) were determined by RT-PCR. Actin levels were
used to normalize expression of the inflammatory markers. Later work was done to validate
the gel results by qPCR, measuring GRO (e) and IL-6 (f) expression, normalized to GAPDH.
(One-way ANOVA, Bonferroni post-hoc, *p<0.05, N=3).
36
Figure 6: The effect of ApoE isoforms on inflammatory gene expression induced by
Aβ1-42 peptides in NRA cells.
The expression of Aβ induced expression of inflammatory genes in NRA cells was
determined by RT-PCR. Panel a): RT-PCR measurement of GRO expression, normalized to
β-actin. ApoE4+Aβ treatment showed significantly higher expression, relative to ApoE2 +
Aβ (One-way ANOVA, Bonferroni post-hoc, **p<0.01, N=4). ApoE2 + Aβ treatment
showed significantly lower expression, relative to ApoE3 + Aβ or to Aβ alone (One-way
ANOVA, Bonferroni post-hoc, *p<0.05, N = 3). Panel b): RT-PCR measurement of TNF-α
expression, normalized to β-actin (N = 3). The level of TNF-α in NRA cells treated with
ApoE2 + Aβ was significantly lower than that of the cells treated with ApoE4+Aβ, ApoE3 +
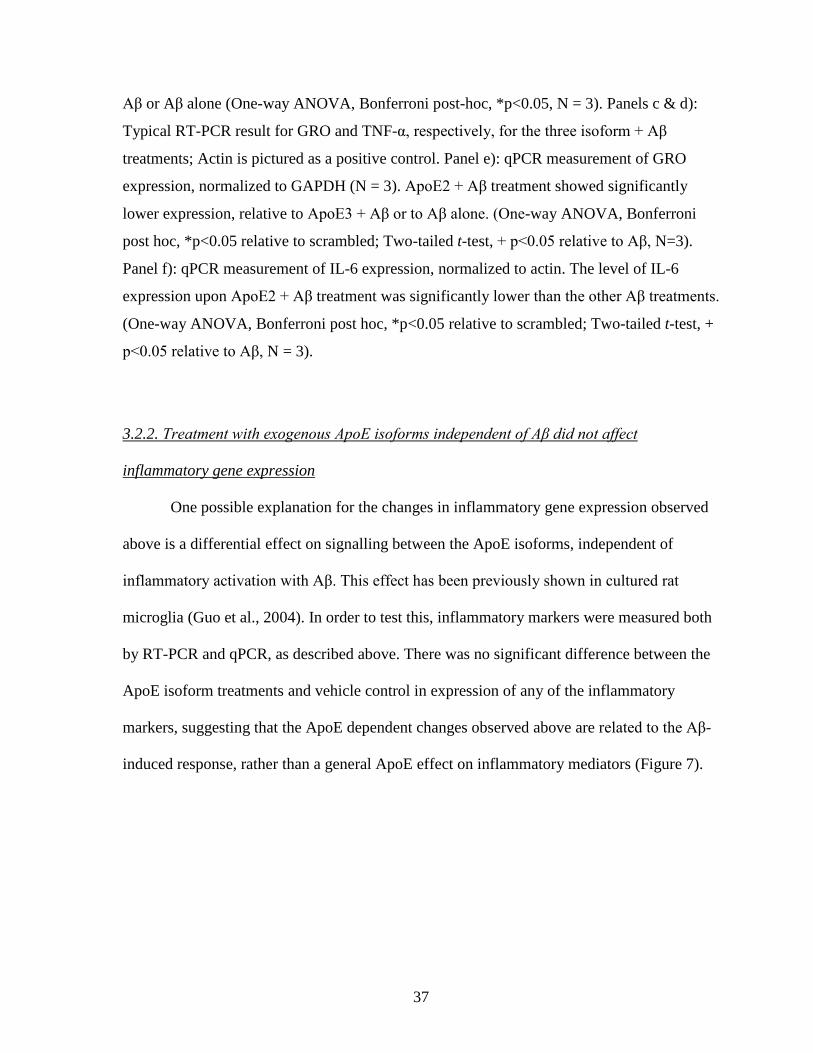
37
Aβ or Aβ alone (One-way ANOVA, Bonferroni post-hoc, *p<0.05, N = 3). Panels c & d):
Typical RT-PCR result for GRO and TNF-α, respectively, for the three isoform + Aβ
treatments; Actin is pictured as a positive control. Panel e): qPCR measurement of GRO
expression, normalized to GAPDH (N = 3). ApoE2 + Aβ treatment showed significantly
lower expression, relative to ApoE3 + Aβ or to Aβ alone. (One-way ANOVA, Bonferroni
post hoc, *p<0.05 relative to scrambled; Two-tailed t-test, + p<0.05 relative to Aβ, N=3).
Panel f): qPCR measurement of IL-6 expression, normalized to actin. The level of IL-6
expression upon ApoE2 + Aβ treatment was significantly lower than the other Aβ treatments.
(One-way ANOVA, Bonferroni post hoc, *p<0.05 relative to scrambled; Two-tailed t-test, +
p<0.05 relative to Aβ, N = 3).
3.2.2. Treatment with exogenous ApoE isoforms independent of Aβ did not affect
inflammatory gene expression
One possible explanation for the changes in inflammatory gene expression observed
above is a differential effect on signalling between the ApoE isoforms, independent of
inflammatory activation with Aβ. This effect has been previously shown in cultured rat
microglia (Guo et al., 2004). In order to test this, inflammatory markers were measured both
by RT-PCR and qPCR, as described above. There was no significant difference between the
ApoE isoform treatments and vehicle control in expression of any of the inflammatory
markers, suggesting that the ApoE dependent changes observed above are related to the Aβ-
induced response, rather than a general ApoE effect on inflammatory mediators (Figure 7).
38
Figure 7: The effect of human ApoE isoforms on the expression of inflammatory
markers in the absence of Aβ challenge.
The expression of inflammatory genes was measured in NRA cells treated with human ApoE
isoform. Panels a & b): RT-PCR measurement of GRO and TNF-α expression did not
change significantly between the ApoE isoform treatments and the Aβ vehicle alone. Human
ApoE isoforms also did not differentially affect TNF-α. Panels c & d): qPCR measurement
of GRO and IL-6 expression. There was no significant difference between the Aβ scrambled
control treatment with or without the three human ApoE isoforms.
39
3.2.3. Inflammatory protein levels change along with mRNA expression
Media (for TNF-α assay) and whole cell protein (for IL-6 assay) were isolated from
cells treated with human ApoE isoforms for 24 hours and Aβ for 6 hours, and protein levels
of inflammatory markers quantified through colourimetric assay. TNF-α levels in media
collected from cells treated with ApoE2+ Aβ were significantly lower, compared to the
ApoE4+ Aβ treatment (One-way ANOVA, Bonferroni post-hoc, p<0.05), or the Aβ
treatment alone (two-tailed t-test, p<0.05, N=3). IL-6 levels in whole cell lysate were not
significantly different between ApoE2+ Aβ and Aβ alone, but were significantly lower in the
ApoE2 + Aβ treatment than the ApoE3 and ApoE4 + Aβ treatments (One-way ANOVA,
Bonferroni post-hoc, p<0.05, N=3) (Figure 8). This confirms that the changes in
inflammatory gene expression in response to different ApoE isoforms are not exclusively an
RNA effect, but results in actual changes in protein levels of these cytokines.
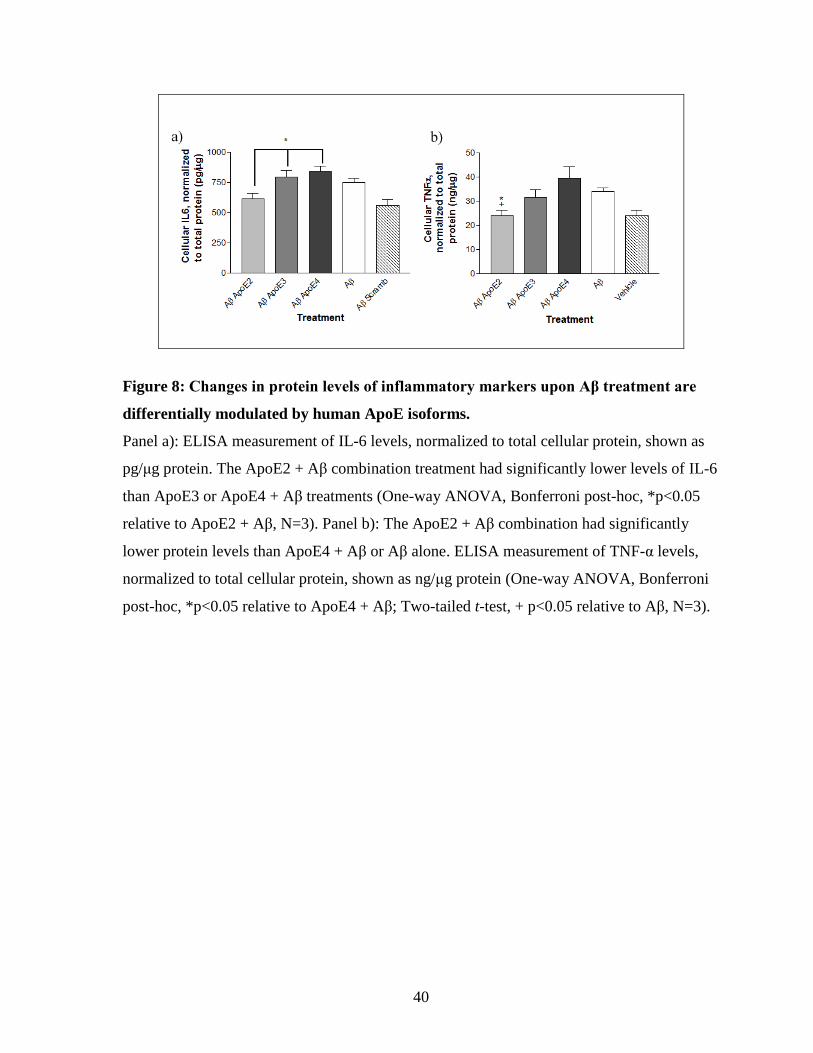
40
Figure 8: Changes in protein levels of inflammatory markers upon Aβ treatment are
differentially modulated by human ApoE isoforms.
Panel a): ELISA measurement of IL-6 levels, normalized to total cellular protein, shown as
pg/μg protein. The ApoE2 + Aβ combination treatment had significantly lower levels of IL-6
than ApoE3 or ApoE4 + Aβ treatments (One-way ANOVA, Bonferroni post-hoc, *p<0.05
relative to ApoE2 + Aβ, N=3). Panel b): The ApoE2 + Aβ combination had significantly
lower protein levels than ApoE4 + Aβ or Aβ alone. ELISA measurement of TNF-α levels,
normalized to total cellular protein, shown as ng/μg protein (One-way ANOVA, Bonferroni
post-hoc, *p<0.05 relative to ApoE4 + Aβ; Two-tailed t-test, + p<0.05 relative to Aβ, N=3).
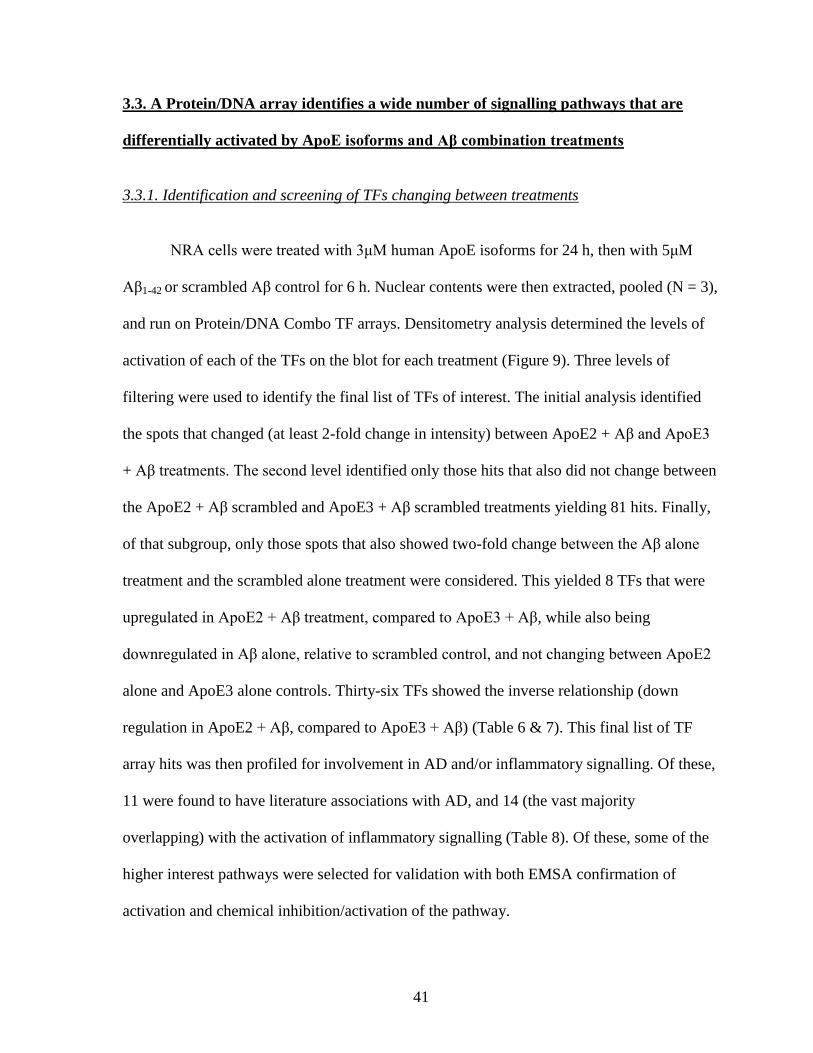
41
3.3. A Protein/DNA array identifies a wide number of signalling pathways that are
differentially activated by ApoE isoforms and Aβ combination treatments
3.3.1. Identification and screening of TFs changing between treatments
NRA cells were treated with 3μM human ApoE isoforms for 24 h, then with 5μM
Aβ1-42 or scrambled Aβ control for 6 h. Nuclear contents were then extracted, pooled (N = 3),
and run on Protein/DNA Combo TF arrays. Densitometry analysis determined the levels of
activation of each of the TFs on the blot for each treatment (Figure 9). Three levels of
filtering were used to identify the final list of TFs of interest. The initial analysis identified
the spots that changed (at least 2-fold change in intensity) between ApoE2 + Aβ and ApoE3
+ Aβ treatments. The second level identified only those hits that also did not change between
the ApoE2 + Aβ scrambled and ApoE3 + Aβ scrambled treatments yielding 81 hits. Finally,
of that subgroup, only those spots that also showed two-fold change between the Aβ alone
treatment and the scrambled alone treatment were considered. This yielded 8 TFs that were
upregulated in ApoE2 + Aβ treatment, compared to ApoE3 + Aβ, while also being
downregulated in Aβ alone, relative to scrambled control, and not changing between ApoE2
alone and ApoE3 alone controls. Thirty-six TFs showed the inverse relationship (down
regulation in ApoE2 + Aβ, compared to ApoE3 + Aβ) (Table 6 & 7). This final list of TF
array hits was then profiled for involvement in AD and/or inflammatory signalling. Of these,
11 were found to have literature associations with AD, and 14 (the vast majority
overlapping) with the activation of inflammatory signalling (Table 8). Of these, some of the
higher interest pathways were selected for validation with both EMSA confirmation of
activation and chemical inhibition/activation of the pathway.
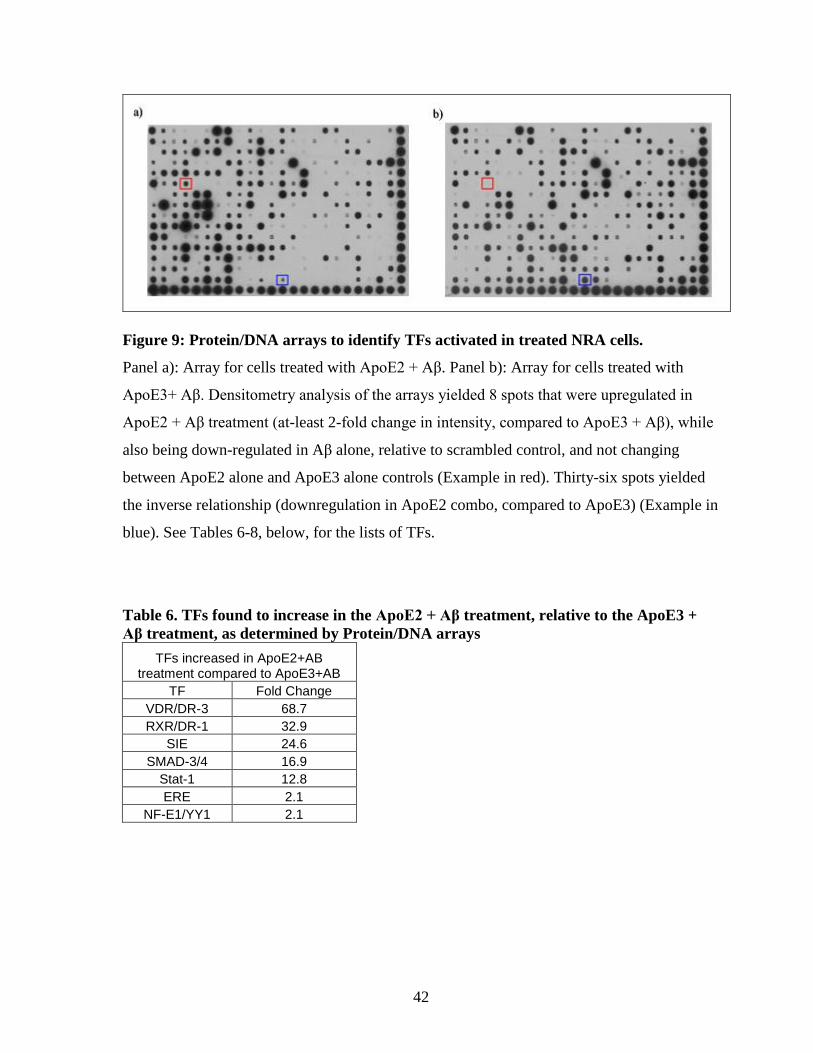
42
Figure 9: Protein/DNA arrays to identify TFs activated in treated NRA cells.
Panel a): Array for cells treated with ApoE2 + Aβ. Panel b): Array for cells treated with
ApoE3+ Aβ. Densitometry analysis of the arrays yielded 8 spots that were upregulated in
ApoE2 + Aβ treatment (at-least 2-fold change in intensity, compared to ApoE3 + Aβ), while
also being down-regulated in Aβ alone, relative to scrambled control, and not changing
between ApoE2 alone and ApoE3 alone controls (Example in red). Thirty-six spots yielded
the inverse relationship (downregulation in ApoE2 combo, compared to ApoE3) (Example in
blue). See Tables 6-8, below, for the lists of TFs.
Table 6. TFs found to increase in the ApoE2 + Aβ treatment, relative to the ApoE3 +
Aβ treatment, as determined by Protein/DNA arrays
TFs increased in ApoE2+AB treatment compared to ApoE3+AB
TF Fold Change
VDR/DR-3 68.7
RXR/DR-1 32.9
SIE 24.6
SMAD-3/4 16.9
Stat-1 12.8
ERE 2.1
NF-E1/YY1 2.1
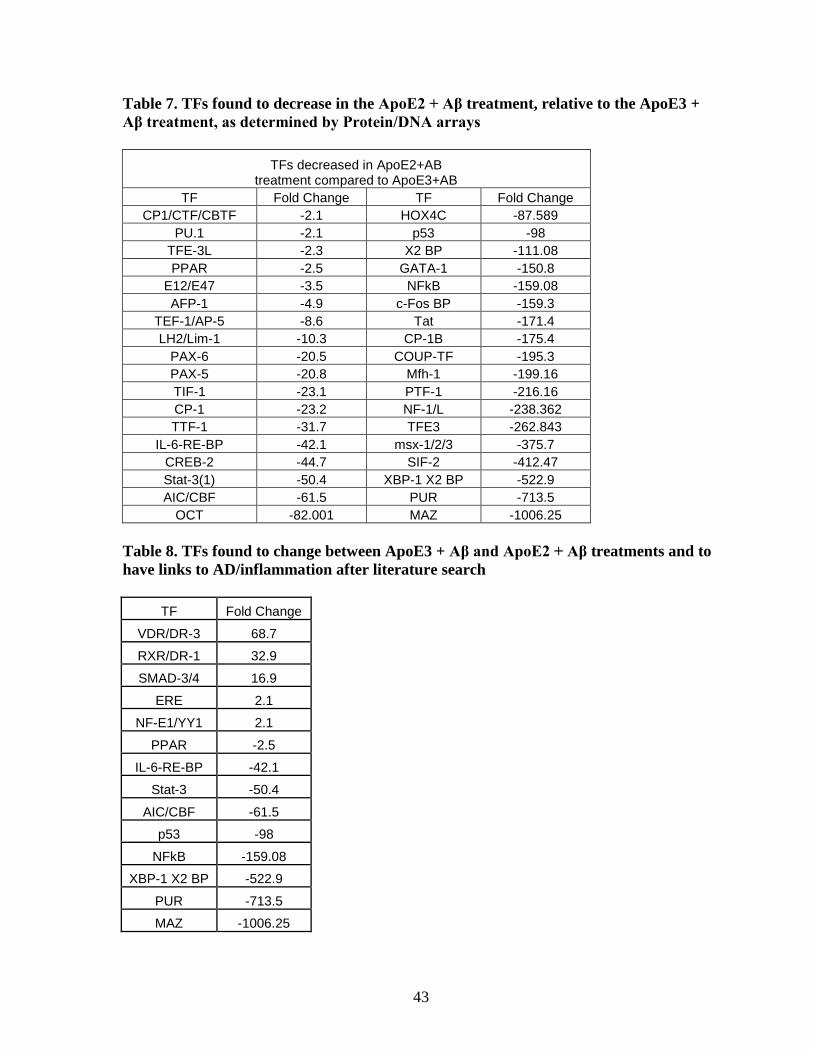
43
Table 7. TFs found to decrease in the ApoE2 + Aβ treatment, relative to the ApoE3 +
Aβ treatment, as determined by Protein/DNA arrays
TFs decreased in ApoE2+AB treatment compared to ApoE3+AB
TF Fold Change TF Fold Change
CP1/CTF/CBTF -2.1 HOX4C -87.589
PU.1 -2.1 p53 -98
TFE-3L -2.3 X2 BP -111.08
PPAR -2.5 GATA-1 -150.8
E12/E47 -3.5 NFkB -159.08
AFP-1 -4.9 c-Fos BP -159.3
TEF-1/AP-5 -8.6 Tat -171.4
LH2/Lim-1 -10.3 CP-1B -175.4
PAX-6 -20.5 COUP-TF -195.3
PAX-5 -20.8 Mfh-1 -199.16
TIF-1 -23.1 PTF-1 -216.16
CP-1 -23.2 NF-1/L -238.362
TTF-1 -31.7 TFE3 -262.843
IL-6-RE-BP -42.1 msx-1/2/3 -375.7
CREB-2 -44.7 SIF-2 -412.47
Stat-3(1) -50.4 XBP-1 X2 BP -522.9
AIC/CBF -61.5 PUR -713.5
OCT -82.001 MAZ -1006.25
Table 8. TFs found to change between ApoE3 + Aβ and ApoE2 + Aβ treatments and to
have links to AD/inflammation after literature search
TF Fold Change
VDR/DR-3 68.7
RXR/DR-1 32.9
SMAD-3/4 16.9
ERE 2.1
NF-E1/YY1 2.1
PPAR -2.5
IL-6-RE-BP -42.1
Stat-3 -50.4
AIC/CBF -61.5
p53 -98
NFkB -159.08
XBP-1 X2 BP -522.9
PUR -713.5
MAZ -1006.25
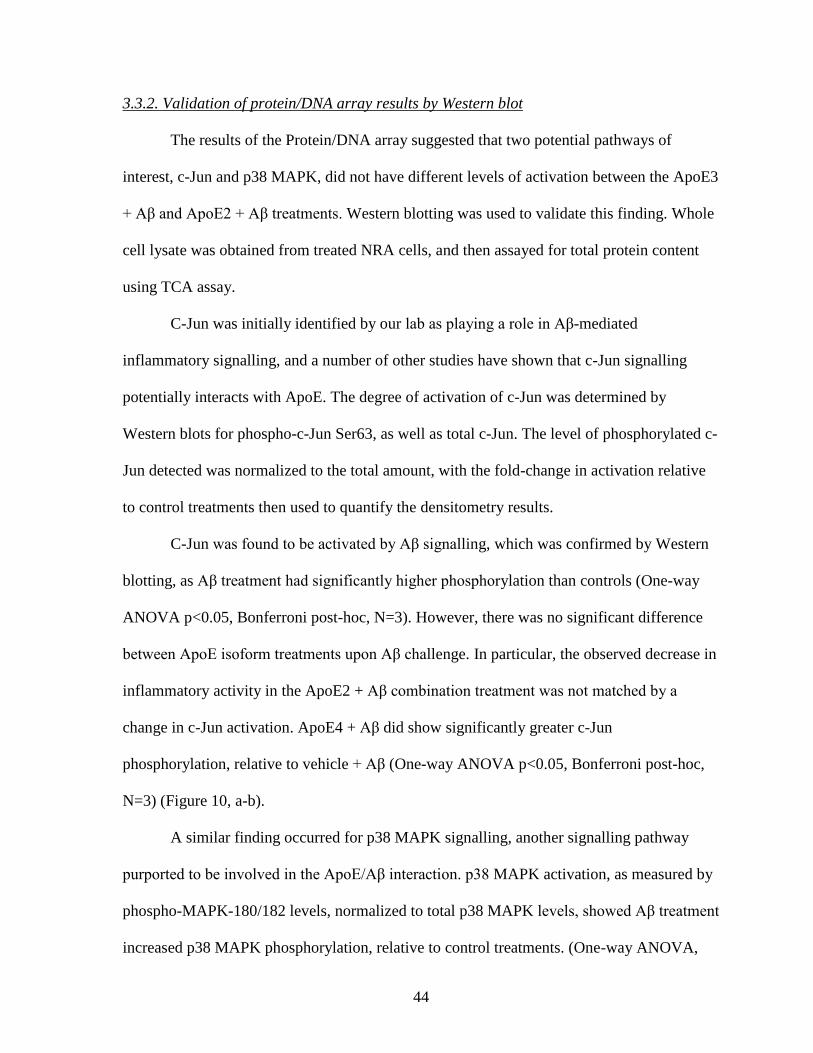
44
3.3.2. Validation of protein/DNA array results by Western blot
The results of the Protein/DNA array suggested that two potential pathways of
interest, c-Jun and p38 MAPK, did not have different levels of activation between the ApoE3
+ Aβ and ApoE2 + Aβ treatments. Western blotting was used to validate this finding. Whole
cell lysate was obtained from treated NRA cells, and then assayed for total protein content
using TCA assay.
C-Jun was initially identified by our lab as playing a role in Aβ-mediated
inflammatory signalling, and a number of other studies have shown that c-Jun signalling
potentially interacts with ApoE. The degree of activation of c-Jun was determined by
Western blots for phospho-c-Jun Ser63, as well as total c-Jun. The level of phosphorylated c-
Jun detected was normalized to the total amount, with the fold-change in activation relative
to control treatments then used to quantify the densitometry results.
C-Jun was found to be activated by Aβ signalling, which was confirmed by Western
blotting, as Aβ treatment had significantly higher phosphorylation than controls (One-way
ANOVA p<0.05, Bonferroni post-hoc, N=3). However, there was no significant difference
between ApoE isoform treatments upon Aβ challenge. In particular, the observed decrease in
inflammatory activity in the ApoE2 + Aβ combination treatment was not matched by a
change in c-Jun activation. ApoE4 + Aβ did show significantly greater c-Jun
phosphorylation, relative to vehicle + Aβ (One-way ANOVA p<0.05, Bonferroni post-hoc,
N=3) (Figure 10, a-b).
A similar finding occurred for p38 MAPK signalling, another signalling pathway
purported to be involved in the ApoE/Aβ interaction. p38 MAPK activation, as measured by
phospho-MAPK-180/182 levels, normalized to total p38 MAPK levels, showed Aβ treatment
increased p38 MAPK phosphorylation, relative to control treatments. (One-way ANOVA,
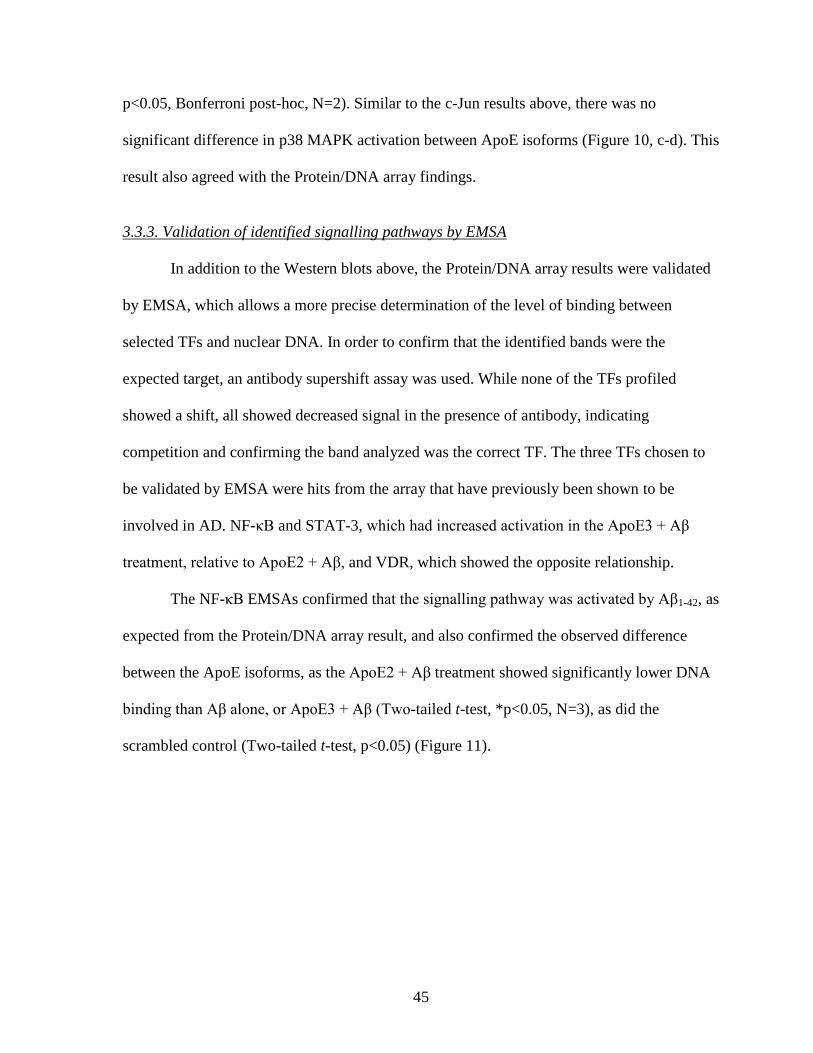
45
p<0.05, Bonferroni post-hoc, N=2). Similar to the c-Jun results above, there was no
significant difference in p38 MAPK activation between ApoE isoforms (Figure 10, c-d). This
result also agreed with the Protein/DNA array findings.
3.3.3. Validation of identified signalling pathways by EMSA
In addition to the Western blots above, the Protein/DNA array results were validated
by EMSA, which allows a more precise determination of the level of binding between
selected TFs and nuclear DNA. In order to confirm that the identified bands were the
expected target, an antibody supershift assay was used. While none of the TFs profiled
showed a shift, all showed decreased signal in the presence of antibody, indicating
competition and confirming the band analyzed was the correct TF. The three TFs chosen to
be validated by EMSA were hits from the array that have previously been shown to be
involved in AD. NF-κB and STAT-3, which had increased activation in the ApoE3 + Aβ
treatment, relative to ApoE2 + Aβ, and VDR, which showed the opposite relationship.
The NF-κB EMSAs confirmed that the signalling pathway was activated by Aβ1-42, as
expected from the Protein/DNA array result, and also confirmed the observed difference
between the ApoE isoforms, as the ApoE2 + Aβ treatment showed significantly lower DNA
binding than Aβ alone, or ApoE3 + Aβ (Two-tailed t-test, *p<0.05, N=3), as did the
scrambled control (Two-tailed t-test, p<0.05) (Figure 11).
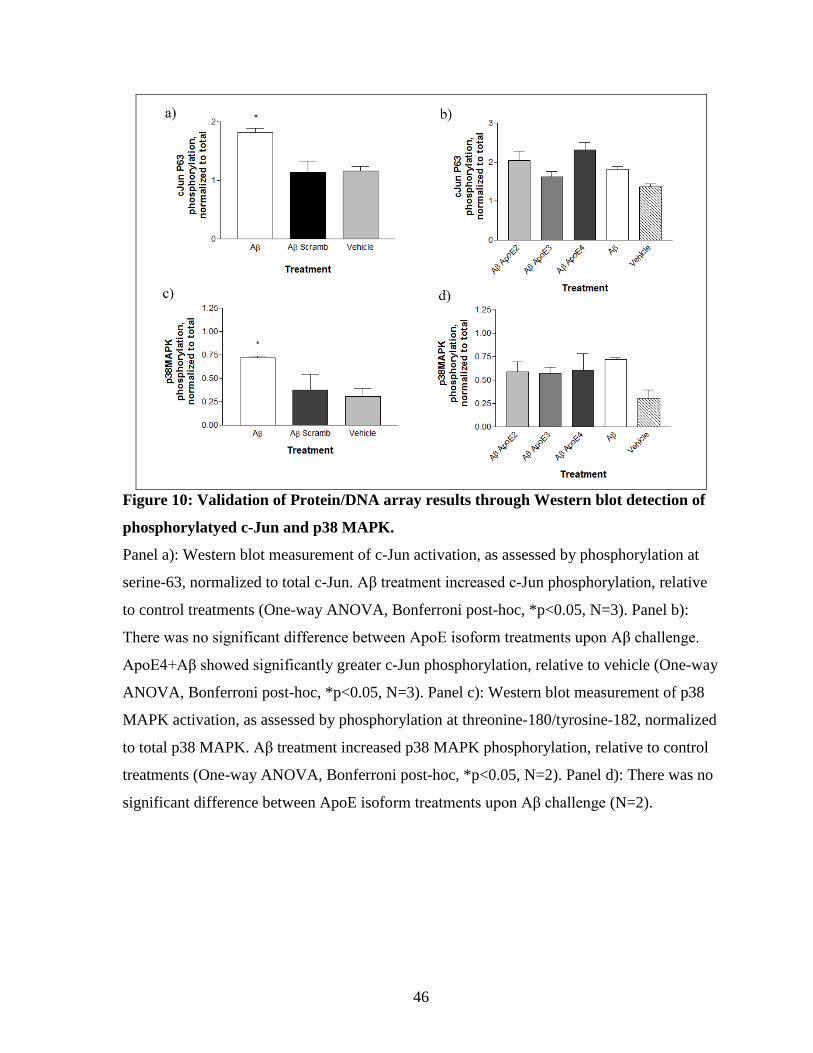
46
Figure 10: Validation of Protein/DNA array results through Western blot detection of
phosphorylatyed c-Jun and p38 MAPK.
Panel a): Western blot measurement of c-Jun activation, as assessed by phosphorylation at
serine-63, normalized to total c-Jun. Aβ treatment increased c-Jun phosphorylation, relative
to control treatments (One-way ANOVA, Bonferroni post-hoc, *p<0.05, N=3). Panel b):
There was no significant difference between ApoE isoform treatments upon Aβ challenge.
ApoE4+Aβ showed significantly greater c-Jun phosphorylation, relative to vehicle (One-way
ANOVA, Bonferroni post-hoc, *p<0.05, N=3). Panel c): Western blot measurement of p38
MAPK activation, as assessed by phosphorylation at threonine-180/tyrosine-182, normalized
to total p38 MAPK. Aβ treatment increased p38 MAPK phosphorylation, relative to control
treatments (One-way ANOVA, Bonferroni post-hoc, *p<0.05, N=2). Panel d): There was no
significant difference between ApoE isoform treatments upon Aβ challenge (N=2).
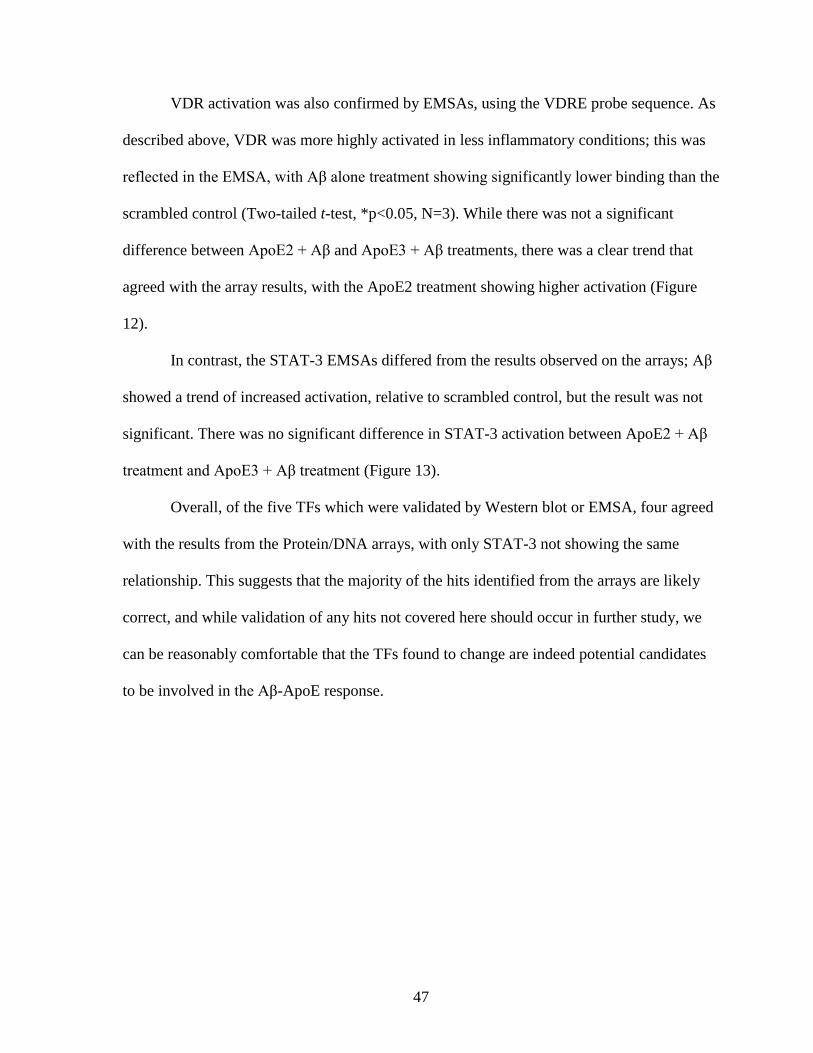
47
VDR activation was also confirmed by EMSAs, using the VDRE probe sequence. As
described above, VDR was more highly activated in less inflammatory conditions; this was
reflected in the EMSA, with Aβ alone treatment showing significantly lower binding than the
scrambled control (Two-tailed t-test, *p<0.05, N=3). While there was not a significant
difference between ApoE2 + Aβ and ApoE3 + Aβ treatments, there was a clear trend that
agreed with the array results, with the ApoE2 treatment showing higher activation (Figure
12).
In contrast, the STAT-3 EMSAs differed from the results observed on the arrays; Aβ
showed a trend of increased activation, relative to scrambled control, but the result was not
significant. There was no significant difference in STAT-3 activation between ApoE2 + Aβ
treatment and ApoE3 + Aβ treatment (Figure 13).
Overall, of the five TFs which were validated by Western blot or EMSA, four agreed
with the results from the Protein/DNA arrays, with only STAT-3 not showing the same
relationship. This suggests that the majority of the hits identified from the arrays are likely
correct, and while validation of any hits not covered here should occur in further study, we
can be reasonably comfortable that the TFs found to change are indeed potential candidates
to be involved in the Aβ-ApoE response.
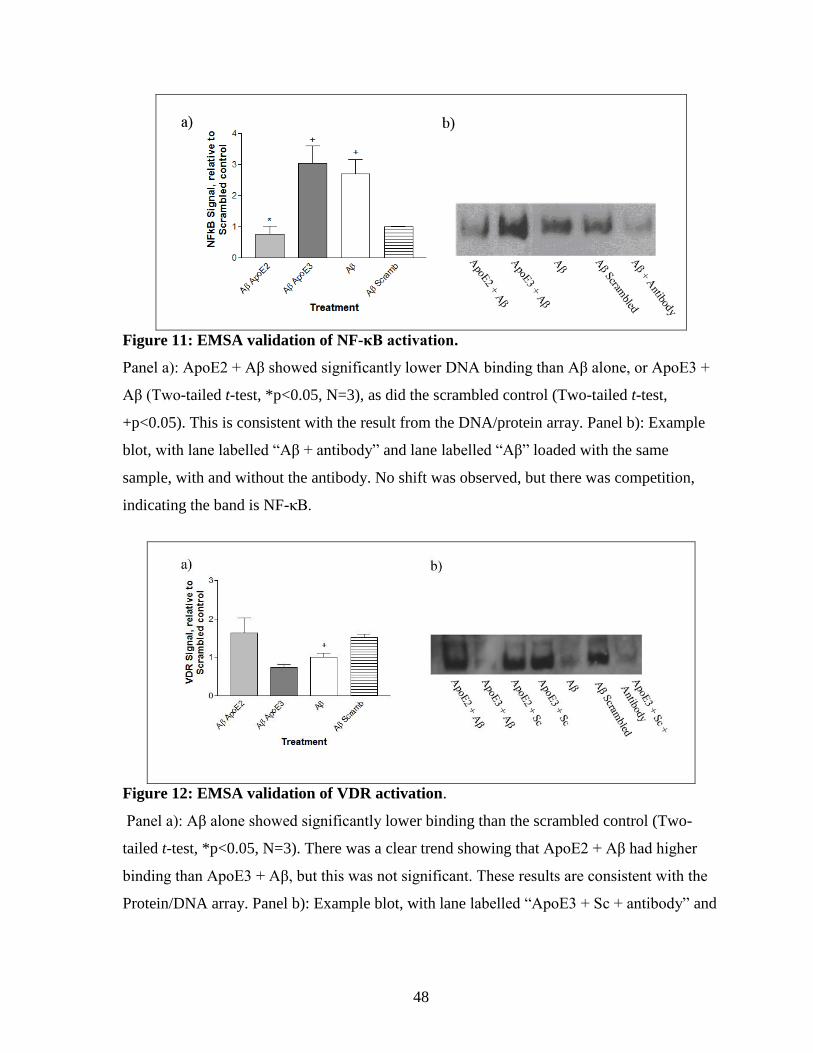
48
Figure 11: EMSA validation of NF-κB activation.
Panel a): ApoE2 + Aβ showed significantly lower DNA binding than Aβ alone, or ApoE3 +
Aβ (Two-tailed t-test, *p<0.05, N=3), as did the scrambled control (Two-tailed t-test,
+p<0.05). This is consistent with the result from the DNA/protein array. Panel b): Example
blot, with lane labelled “Aβ + antibody” and lane labelled “Aβ” loaded with the same
sample, with and without the antibody. No shift was observed, but there was competition,
indicating the band is NF-κB.
Figure 12: EMSA validation of VDR activation.
Panel a): Aβ alone showed significantly lower binding than the scrambled control (Two-
tailed t-test, *p<0.05, N=3). There was a clear trend showing that ApoE2 + Aβ had higher
binding than ApoE3 + Aβ, but this was not significant. These results are consistent with the
Protein/DNA array. Panel b): Example blot, with lane labelled “ApoE3 + Sc + antibody” and
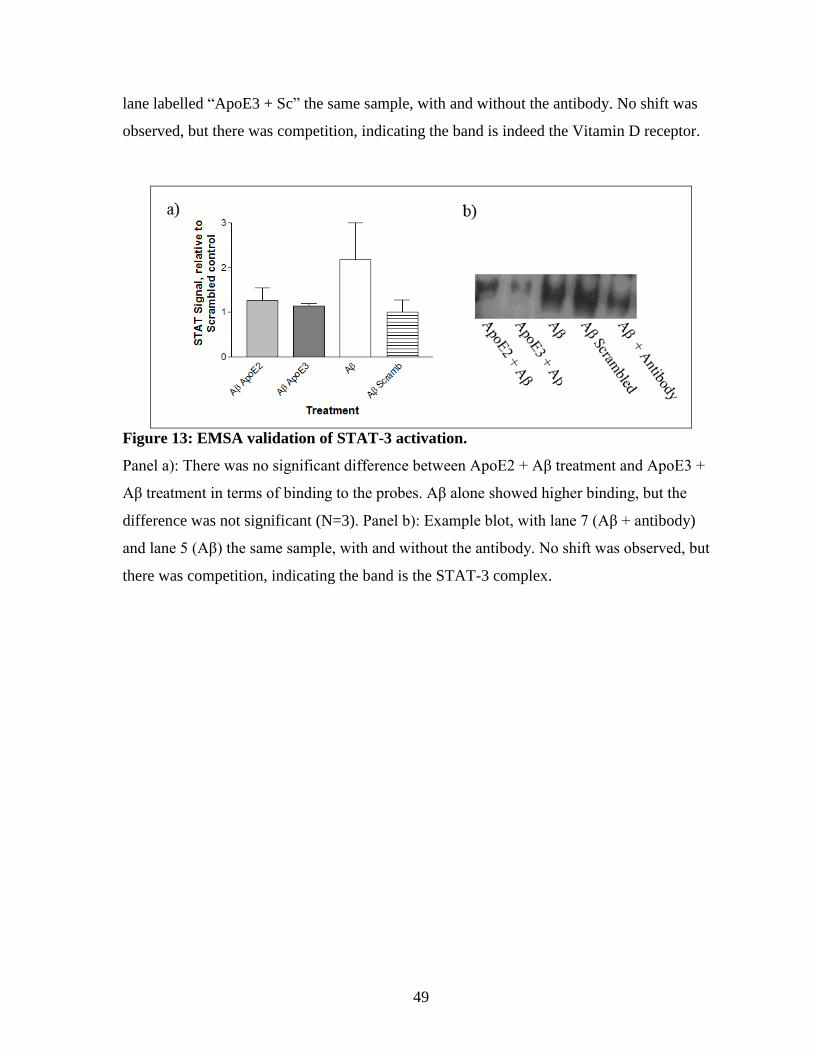
49
lane labelled “ApoE3 + Sc” the same sample, with and without the antibody. No shift was
observed, but there was competition, indicating the band is indeed the Vitamin D receptor.
Figure 13: EMSA validation of STAT-3 activation.
Panel a): There was no significant difference between ApoE2 + Aβ treatment and ApoE3 +
Aβ treatment in terms of binding to the probes. Aβ alone showed higher binding, but the
difference was not significant (N=3). Panel b): Example blot, with lane 7 (Aβ + antibody)
and lane 5 (Aβ) the same sample, with and without the antibody. No shift was observed, but
there was competition, indicating the band is the STAT-3 complex.
50
3.4. The effects of signalling modulation on Aβ-induced inflammatory response
3.4.1. Inhibition of NF-κB with a general proteosome inhibitor (MG-132) potentiates the Aβ-
induced inflammatory response
The next step was to determine whether chemical manipulation of the identified
signalling pathways would affect the inflammatory response. The same three pathways
examined by EMSA (NF-κB, STAT-3 and VDR) were chosen for chemical manipulation.
The initial attempts to decrease signalling of NF-κB used MG-132, a reversible proteosome
inhibitor, which prevents the degradation of the inhibitor of κB (IκB) chaperone protein, but
also is known to affect other signalling pathways (Li et al., 2007). These additional effects
may have contributed to an increase in inflammatory signalling, as MG-132 treatment at a
range of concentrations potentiated both GRO and IL-6 RNA levels measured by qPCR.
The Aβ-induced inflammatory response was still present in the vehicle control, as
well as in the MG-132 treated cells, the former with both GRO and IL-6 and the latter only
with GRO (One-way ANOVA p<0.05, Bonferroni post hoc, N=3; Figure 14), but at all
concentrations of MG-132 there was significantly greater response to Aβ than with controls
alone. This may be due to secondary effects of the compound, which also activates AP-1 , a
signalling pathway that leads to increased levels of inflammation. There was no significant
difference in GRO expression between ApoE2 + Aβ and ApoE3 + Aβ treatments at all
concentrations except 25 μM, where the ApoE2 + Aβ combination showed a significant
decrease (Two-tailed t-test, p<0.05, N=3). IL-6 did not significantly differ between the
ApoE2 + Aβ and ApoE3 + Aβ treatments. While this suggests that NF-κB signalling may
play a role in the ApoE isoform specific response, the fact that MG-132 seemed to promote
Aβ-induced inflammatory signalling so strongly, rather than inhibiting it, made further
investigation with another NF-κB inhibitor prudent.
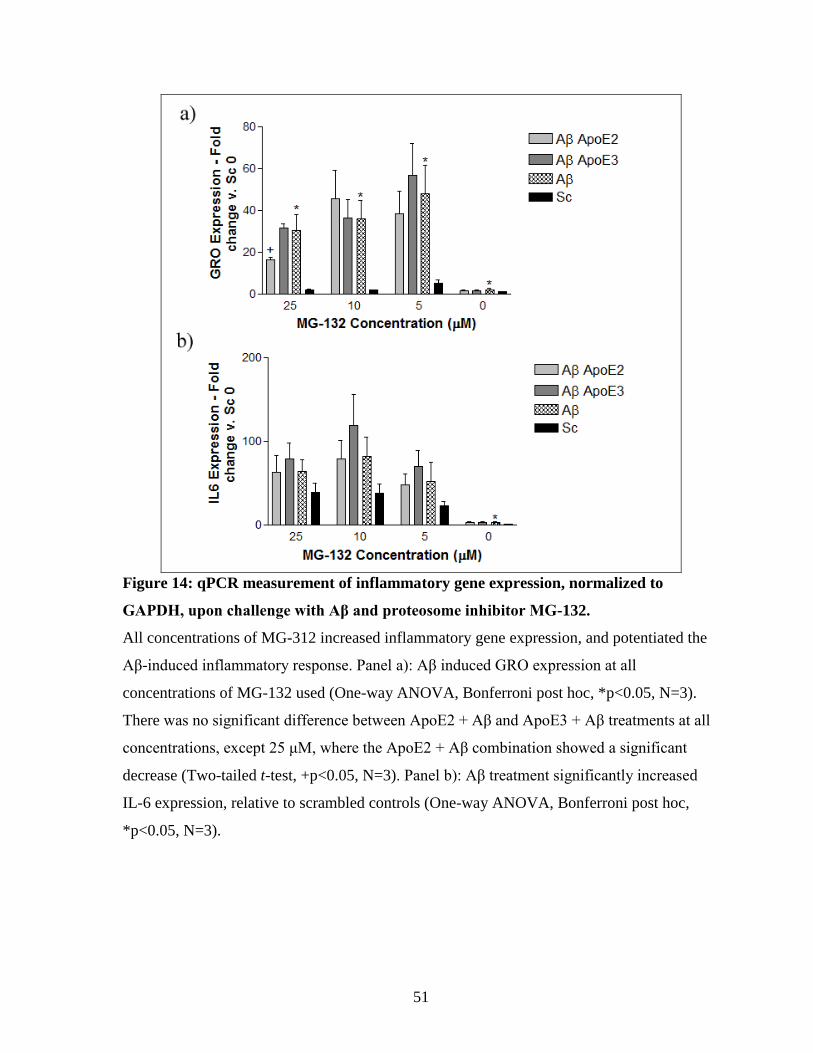
51
Figure 14: qPCR measurement of inflammatory gene expression, normalized to
GAPDH, upon challenge with Aβ and proteosome inhibitor MG-132.
All concentrations of MG-312 increased inflammatory gene expression, and potentiated the
Aβ-induced inflammatory response. Panel a): Aβ induced GRO expression at all
concentrations of MG-132 used (One-way ANOVA, Bonferroni post hoc, *p<0.05, N=3).
There was no significant difference between ApoE2 + Aβ and ApoE3 + Aβ treatments at all
concentrations, except 25 μM, where the ApoE2 + Aβ combination showed a significant
decrease (Two-tailed t-test, +p<0.05, N=3). Panel b): Aβ treatment significantly increased
IL-6 expression, relative to scrambled controls (One-way ANOVA, Bonferroni post hoc,
*p<0.05, N=3).
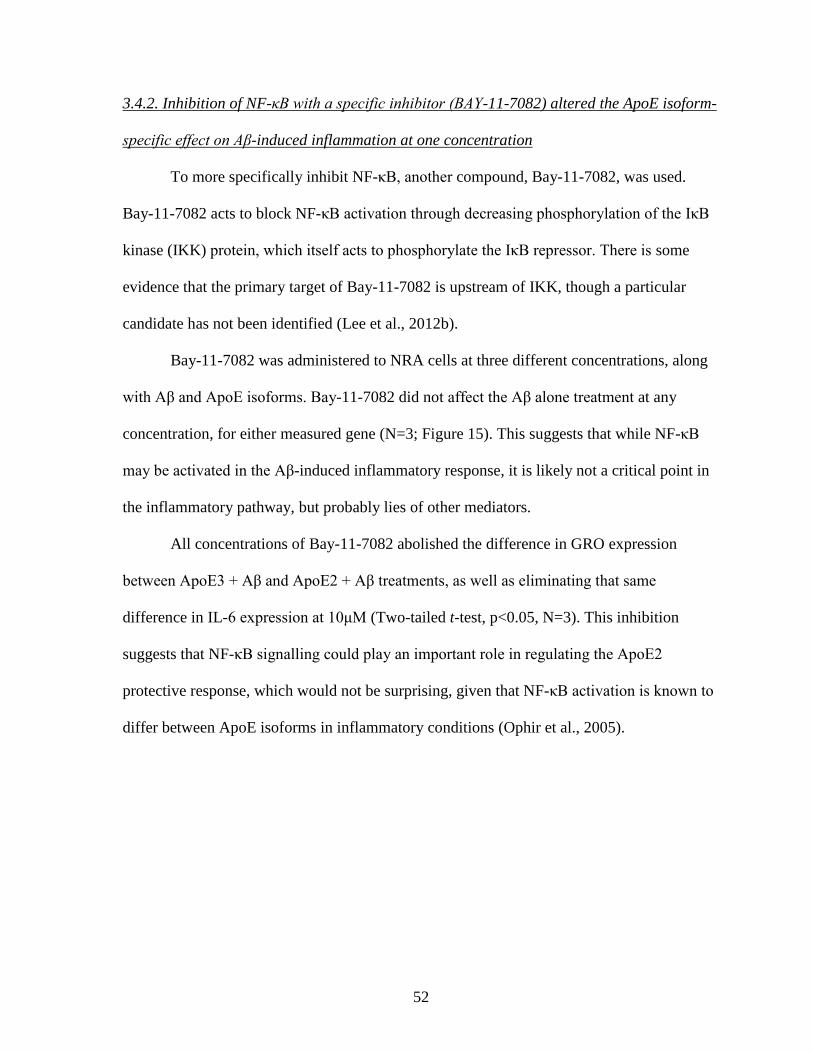
52
3.4.2. Inhibition of NF-κB with a specific inhibitor (BAY-11-7082) altered the ApoE isoform-
specific effect on Aβ-induced inflammation at one concentration
To more specifically inhibit NF-κB, another compound, Bay-11-7082, was used.
Bay-11-7082 acts to block NF-κB activation through decreasing phosphorylation of the IκB
kinase (IKK) protein, which itself acts to phosphorylate the IκB repressor. There is some
evidence that the primary target of Bay-11-7082 is upstream of IKK, though a particular
candidate has not been identified (Lee et al., 2012b).
Bay-11-7082 was administered to NRA cells at three different concentrations, along
with Aβ and ApoE isoforms. Bay-11-7082 did not affect the Aβ alone treatment at any
concentration, for either measured gene (N=3; Figure 15). This suggests that while NF-κB
may be activated in the Aβ-induced inflammatory response, it is likely not a critical point in
the inflammatory pathway, but probably lies of other mediators.
All concentrations of Bay-11-7082 abolished the difference in GRO expression
between ApoE3 + Aβ and ApoE2 + Aβ treatments, as well as eliminating that same
difference in IL-6 expression at 10μM (Two-tailed t-test, p<0.05, N=3). This inhibition
suggests that NF-κB signalling could play an important role in regulating the ApoE2
protective response, which would not be surprising, given that NF-κB activation is known to
differ between ApoE isoforms in inflammatory conditions (Ophir et al., 2005).
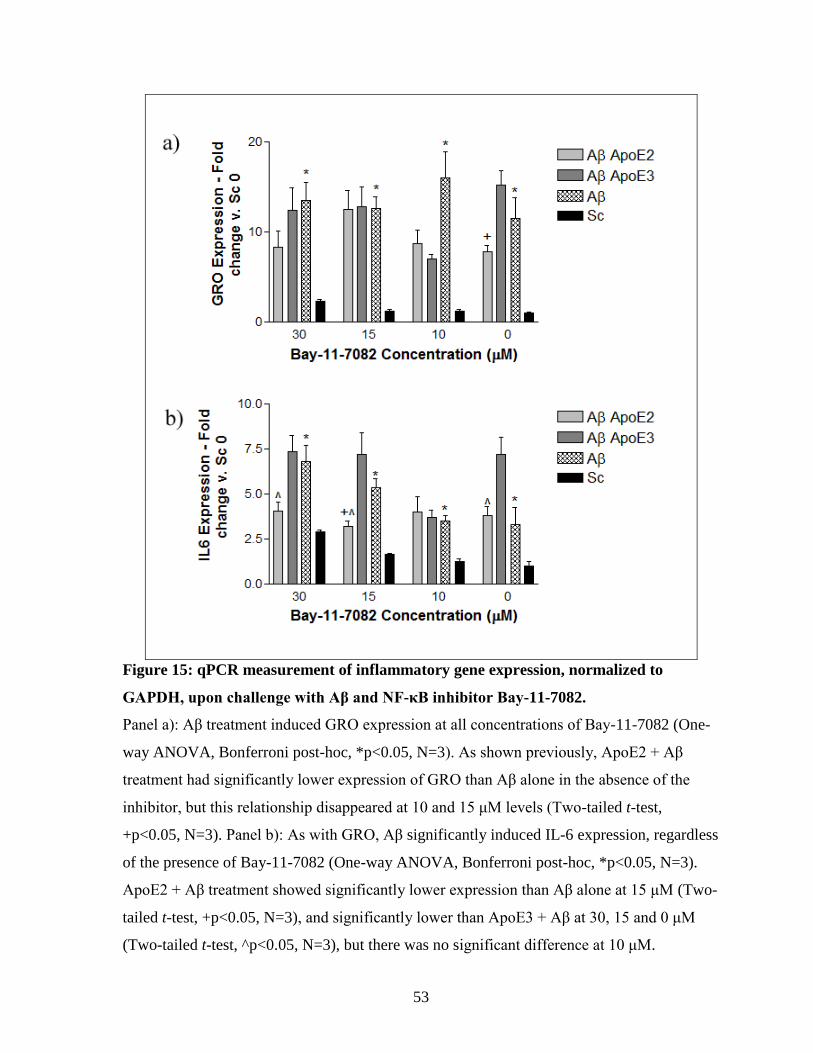
53
Figure 15: qPCR measurement of inflammatory gene expression, normalized to
GAPDH, upon challenge with Aβ and NF-κB inhibitor Bay-11-7082.
Panel a): Aβ treatment induced GRO expression at all concentrations of Bay-11-7082 (One-
way ANOVA, Bonferroni post-hoc, *p<0.05, N=3). As shown previously, ApoE2 + Aβ
treatment had significantly lower expression of GRO than Aβ alone in the absence of the
inhibitor, but this relationship disappeared at 10 and 15 μM levels (Two-tailed t-test,
+p<0.05, N=3). Panel b): As with GRO, Aβ significantly induced IL-6 expression, regardless
of the presence of Bay-11-7082 (One-way ANOVA, Bonferroni post-hoc, *p<0.05, N=3).
ApoE2 + Aβ treatment showed significantly lower expression than Aβ alone at 15 μM (Two-
tailed t-test, +p<0.05, N=3), and significantly lower than ApoE3 + Aβ at 30, 15 and 0 μM
(Two-tailed t-test, ^p<0.05, N=3), but there was no significant difference at 10 μM.
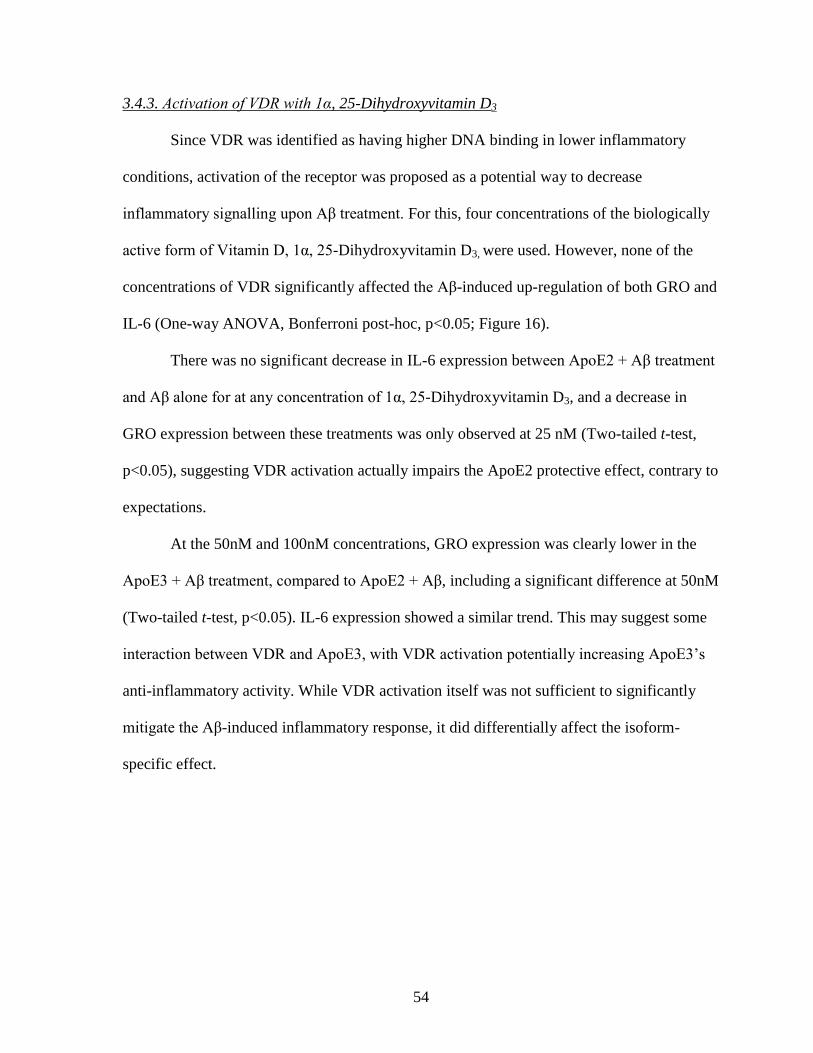
54
3.4.3. Activation of VDR with 1α, 25-Dihydroxyvitamin D3
Since VDR was identified as having higher DNA binding in lower inflammatory
conditions, activation of the receptor was proposed as a potential way to decrease
inflammatory signalling upon Aβ treatment. For this, four concentrations of the biologically
active form of Vitamin D, 1α, 25-Dihydroxyvitamin D3, were used. However, none of the
concentrations of VDR significantly affected the Aβ-induced up-regulation of both GRO and
IL-6 (One-way ANOVA, Bonferroni post-hoc, p<0.05; Figure 16).
There was no significant decrease in IL-6 expression between ApoE2 + Aβ treatment
and Aβ alone for at any concentration of 1α, 25-Dihydroxyvitamin D3, and a decrease in
GRO expression between these treatments was only observed at 25 nM (Two-tailed t-test,
p<0.05), suggesting VDR activation actually impairs the ApoE2 protective effect, contrary to
expectations.
At the 50nM and 100nM concentrations, GRO expression was clearly lower in the
ApoE3 + Aβ treatment, compared to ApoE2 + Aβ, including a significant difference at 50nM
(Two-tailed t-test, p<0.05). IL-6 expression showed a similar trend. This may suggest some
interaction between VDR and ApoE3, with VDR activation potentially increasing ApoE3’s
anti-inflammatory activity. While VDR activation itself was not sufficient to significantly
mitigate the Aβ-induced inflammatory response, it did differentially affect the isoform-
specific effect.
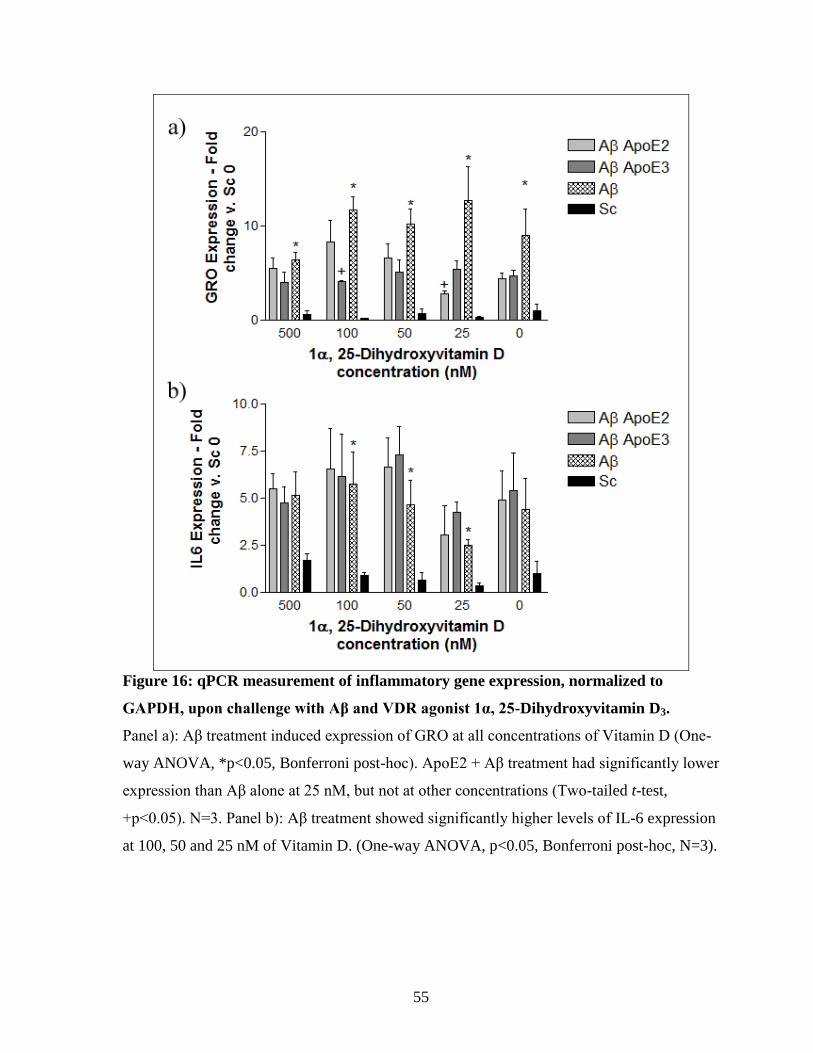
55
Figure 16: qPCR measurement of inflammatory gene expression, normalized to
GAPDH, upon challenge with Aβ and VDR agonist 1α, 25-Dihydroxyvitamin D3.
Panel a): Aβ treatment induced expression of GRO at all concentrations of Vitamin D (One-
way ANOVA, *p<0.05, Bonferroni post-hoc). ApoE2 + Aβ treatment had significantly lower
expression than Aβ alone at 25 nM, but not at other concentrations (Two-tailed t-test,
+p<0.05). N=3. Panel b): Aβ treatment showed significantly higher levels of IL-6 expression
at 100, 50 and 25 nM of Vitamin D. (One-way ANOVA, p<0.05, Bonferroni post-hoc, N=3).
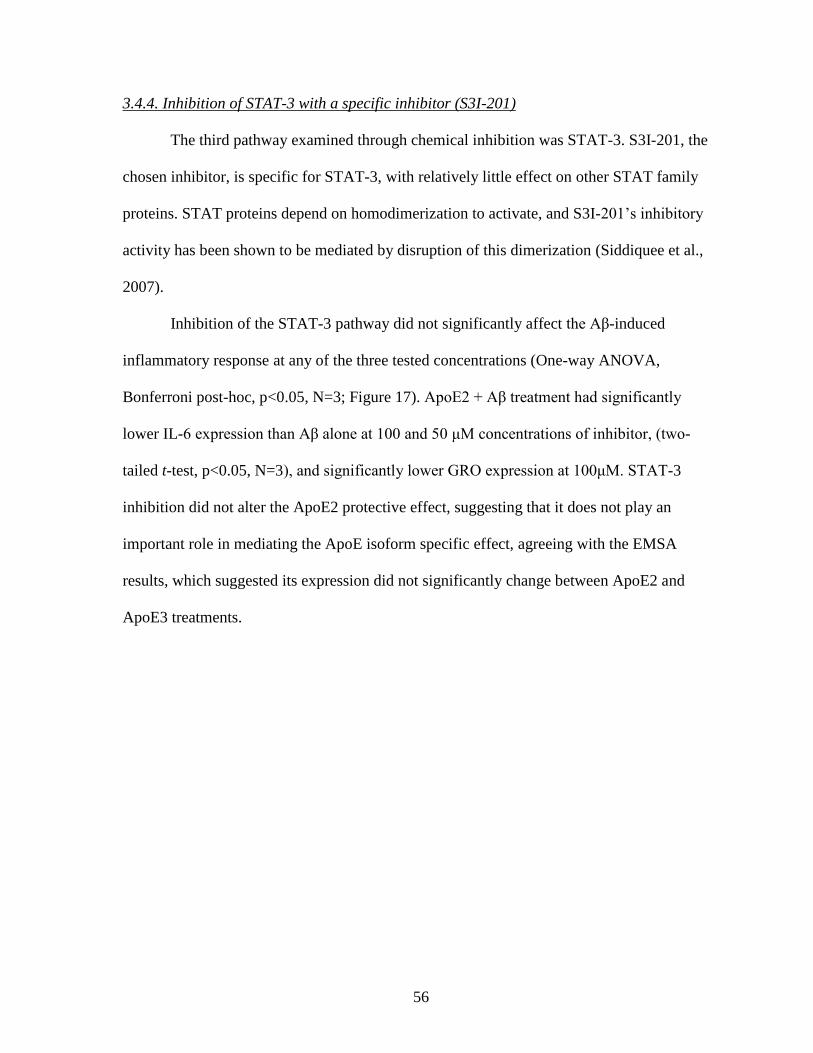
56
3.4.4. Inhibition of STAT-3 with a specific inhibitor (S3I-201)
The third pathway examined through chemical inhibition was STAT-3. S3I-201, the
chosen inhibitor, is specific for STAT-3, with relatively little effect on other STAT family
proteins. STAT proteins depend on homodimerization to activate, and S3I-201’s inhibitory
activity has been shown to be mediated by disruption of this dimerization (Siddiquee et al.,
2007).
Inhibition of the STAT-3 pathway did not significantly affect the Aβ-induced
inflammatory response at any of the three tested concentrations (One-way ANOVA,
Bonferroni post-hoc, p<0.05, N=3; Figure 17). ApoE2 + Aβ treatment had significantly
lower IL-6 expression than Aβ alone at 100 and 50 μM concentrations of inhibitor, (two-
tailed t-test, p<0.05, N=3), and significantly lower GRO expression at 100μM. STAT-3
inhibition did not alter the ApoE2 protective effect, suggesting that it does not play an
important role in mediating the ApoE isoform specific effect, agreeing with the EMSA
results, which suggested its expression did not significantly change between ApoE2 and
ApoE3 treatments.
57
Figure 17: qPCR measurement of inflammatory gene expression, normalized to
GAPDH, upon challenge with Aβ and STAT-3 inhibitor S3I-201.
Panel a): Increasing concentrations of S3I-201 did not significantly alter Aβ-induced
expression of GRO. Aβ significantly increased inflammatory expression across all
concentrations of S3I-201 treatment (One-way ANOVA, Bonferroni post-hoc, *p<0.05
relative to Scrambled control, N=3). ApoE2 + Aβ treatment trended lower than ApoE3 + Aβ
at all concentrations, but not to significance. Only one concentration, 100 μM, showed a
significant difference between ApoE2 + Aβ treatment and Aβ alone (two-tailed t-test,
+p<0.05 relative to Aβ, N=3). Panel b): Increasing concentrations of S3I-201 did not
significantly alter Aβ-induced expression of IL-6. Unlike GRO expression, Aβ significantly
increased inflammatory expression across all concentrations of S3I-201 treatment. ApoE2 +
Aβ treatment trended lower than ApoE3 + Aβ at all concentrations (One-way ANOVA,
58
Bonferroni post-hoc, *p<0.05 relative to Scrambled control, N=3). ApoE2 + Aβ treatment
showed significantly lower inflammatory expression than Aβ alone at three lowest
concentrations, while ApoE3 + Aβ showed only one significant difference (two-tailed t-test,
+p<0.05 relative to Aβ, N=3).
3.5. Aβ treatment of mouse astrocytes expressing human ApoE isoforms
3.5.1. Aβ induces inflammation in astrocytes expressing human ApoE
A draw-back of the studies above is the use of exogenous recombinant ApoE,
produced in E.coli. This form of the protein does not have the same lipidation or post-
translational modifications that are observed in human ApoE, and, as discussed above, these
effects may significantly impact the function of ApoE. Immortalized mouse astrocytes, with
native murine apoE knocked-out and human ApoE isoforms knocked-in, were used to test if
the observed ApoE isoform specific effect on Aβ-induced inflammation exists with a version
of ApoE more analogous to what is seen natively.
The mouse ApoE expressing astrocytes were challenged with Aβ under the same
conditions used for NRA cells in this study, at 5μM for 6 hrs. Each of three cell lines showed
increases in GRO and IL-6 expression after Aβ treatment. In ApoE4- and ApoE3-expressing
cells, the increase upon Aβ was significant for both markers (Two-tailed t-test, p<0.05),
while in the ApoE2 cells, Aβ treatment led to a significant increase in IL-6 expression, and a
clear trend of increased GRO expression, relative to scrambled control (Figure 18).
However, while the mouse astrocytes behaved similarly to NRA cells in response to
Aβ, the relationship of this response between isoforms differed significantly. Unlike the
NRA cells, ApoE4 cells showed significantly higher GRO and IL-6 expression after Aβ
challenge, compared to ApoE3 or ApoE2 + Aβ (One-Way ANOVA, Bonferroni post-hoc,
59
p<0.05). This finding is in line with the original expectations of the study, as well as
ApoE4’s status as an AD risk factor. The inflammatory increase in the ApoE4 cell line was
at much greater level than seen in the NRA cells treated with Aβ, suggesting that the
lipidated ApoE4 is in fact potentiating inflammatory activation, relative to the recombinant
lipid-poor proteins. In addition, there was no significant difference between the ApoE3 and
ApoE2 cell lines’ response to Aβ, again in contrast to data from the NRAs. Both lipid-poor
and lipidated ApoE proteins are present in human cells and tissues. The observed effects of
recombinant lipid-poor ApoE and lipidated ApoE proteins could be both true on Aβ-induced
inflammatory response.
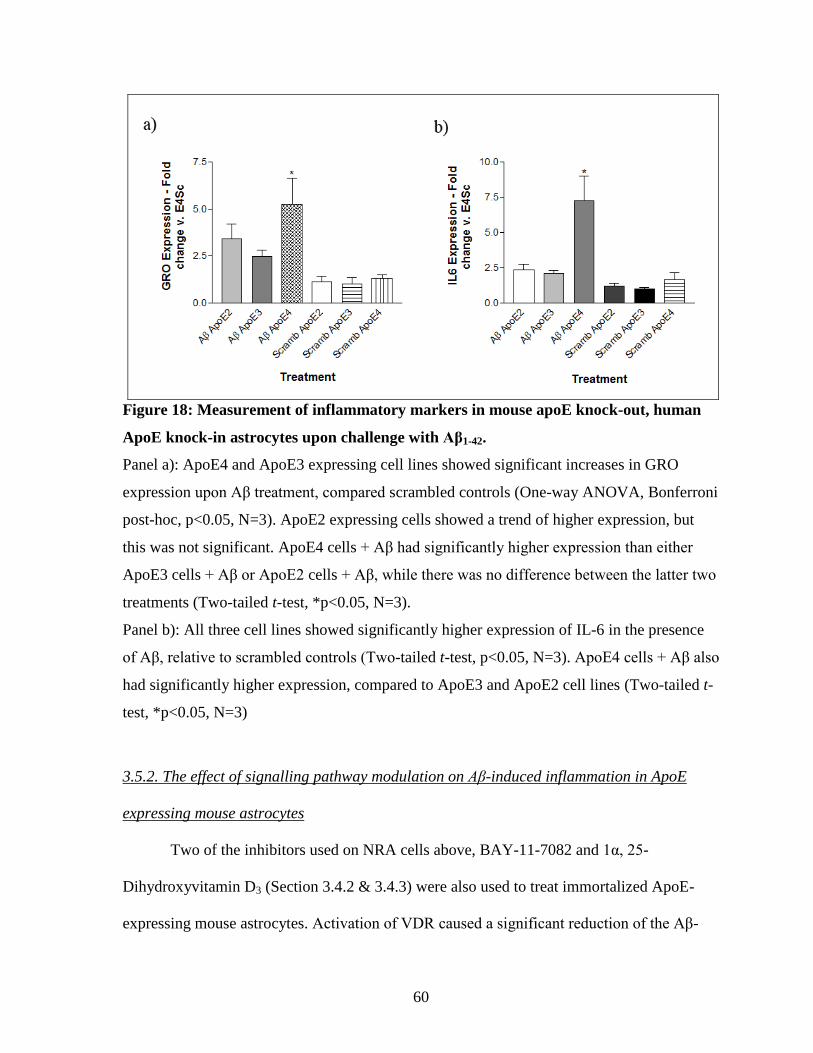
60
Figure 18: Measurement of inflammatory markers in mouse apoE knock-out, human
ApoE knock-in astrocytes upon challenge with Aβ1-42.
Panel a): ApoE4 and ApoE3 expressing cell lines showed significant increases in GRO
expression upon Aβ treatment, compared scrambled controls (One-way ANOVA, Bonferroni
post-hoc, p<0.05, N=3). ApoE2 expressing cells showed a trend of higher expression, but
this was not significant. ApoE4 cells + Aβ had significantly higher expression than either
ApoE3 cells + Aβ or ApoE2 cells + Aβ, while there was no difference between the latter two
treatments (Two-tailed t-test, *p<0.05, N=3).
Panel b): All three cell lines showed significantly higher expression of IL-6 in the presence
of Aβ, relative to scrambled controls (Two-tailed t-test, p<0.05, N=3). ApoE4 cells + Aβ also
had significantly higher expression, compared to ApoE3 and ApoE2 cell lines (Two-tailed t-
test, *p<0.05, N=3)
3.5.2. The effect of signalling pathway modulation on Aβ-induced inflammation in ApoE
expressing mouse astrocytes
Two of the inhibitors used on NRA cells above, BAY-11-7082 and 1α, 25-
Dihydroxyvitamin D3 (Section 3.4.2 & 3.4.3) were also used to treat immortalized ApoE-
expressing mouse astrocytes. Activation of VDR caused a significant reduction of the Aβ-
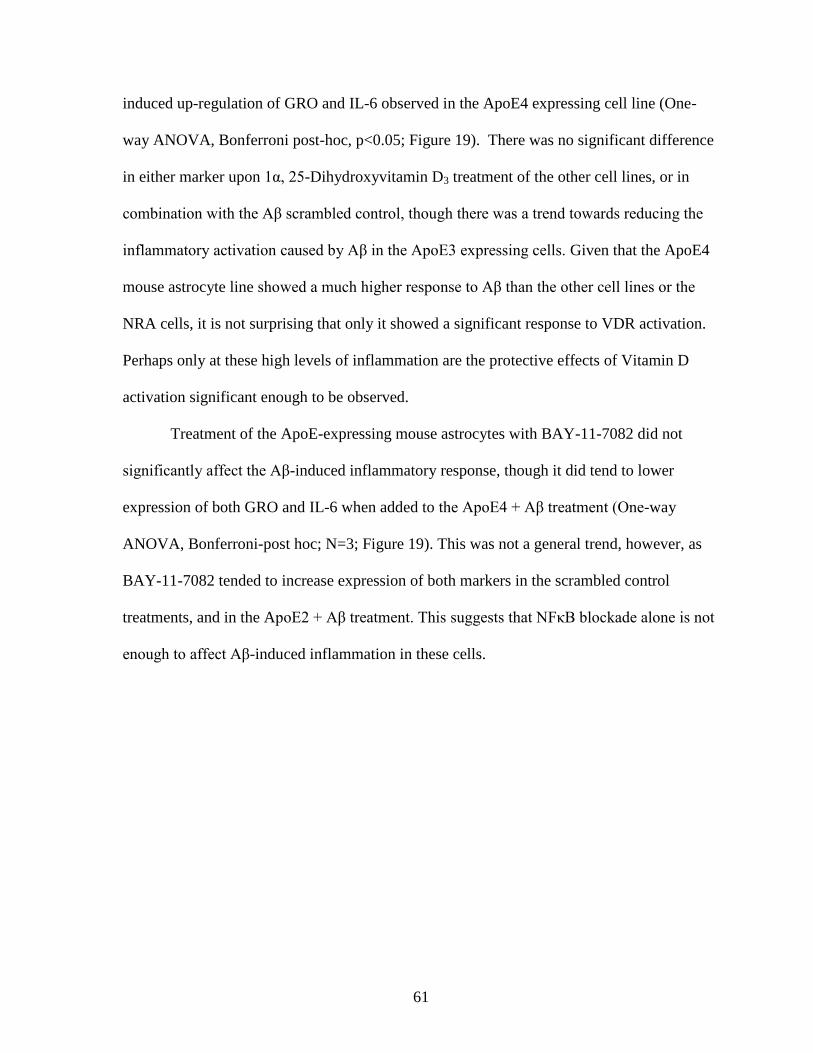
61
induced up-regulation of GRO and IL-6 observed in the ApoE4 expressing cell line (One-
way ANOVA, Bonferroni post-hoc, p<0.05; Figure 19). There was no significant difference
in either marker upon 1α, 25-Dihydroxyvitamin D3 treatment of the other cell lines, or in
combination with the Aβ scrambled control, though there was a trend towards reducing the
inflammatory activation caused by Aβ in the ApoE3 expressing cells. Given that the ApoE4
mouse astrocyte line showed a much higher response to Aβ than the other cell lines or the
NRA cells, it is not surprising that only it showed a significant response to VDR activation.
Perhaps only at these high levels of inflammation are the protective effects of Vitamin D
activation significant enough to be observed.
Treatment of the ApoE-expressing mouse astrocytes with BAY-11-7082 did not
significantly affect the Aβ-induced inflammatory response, though it did tend to lower
expression of both GRO and IL-6 when added to the ApoE4 + Aβ treatment (One-way
ANOVA, Bonferroni-post hoc; N=3; Figure 19). This was not a general trend, however, as
BAY-11-7082 tended to increase expression of both markers in the scrambled control
treatments, and in the ApoE2 + Aβ treatment. This suggests that NFκB blockade alone is not
enough to affect Aβ-induced inflammation in these cells.
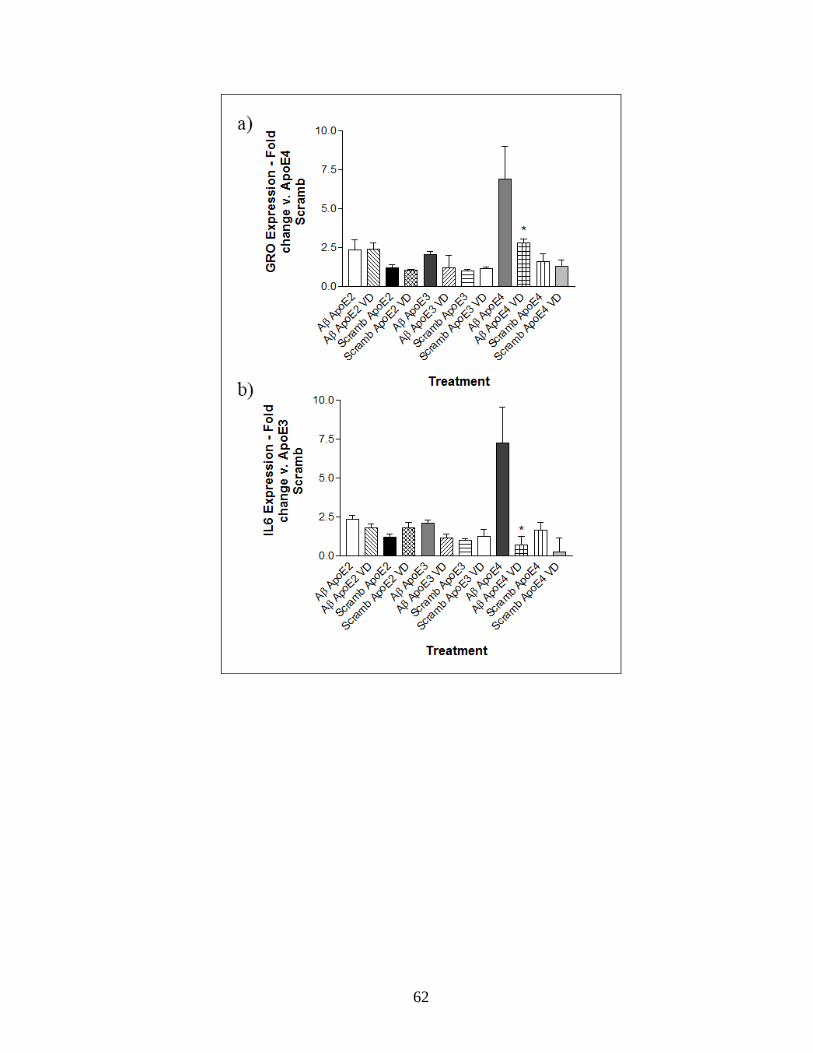
62
63
Figure 19: Effect of VDR agonist 1α, 25-Dihydroxyvitamin D3 and NF-ΚB inhibitor
BAY-11-7082 on the expression of inflammatory markers in mouse apoE knockout,
human ApoE knock-in astrocytes upon challenge with Aβ1-42.
Panels a & c): Expression of GRO, as measured by qPCR, normalized to GAPDH. The
increase in inflammatory expression in the ApoE4 cells + Aβ treatment, as described above,
was significantly reduced by treatment with 100 nM of 1α, 25-Dihydroxyvitamin D3 for 24
hours (One-way ANOVA, Bonferroni post-hoc, *p<0.05, N=3). There was no significant
difference in any of the treatments upon addition of 15μM BAY-11-7082 for 6 hours, though
it did tend to decrease the inflammatory response to Aβ in ApoE4 expressing cells, and to
increase. Panels b & d): Expression of IL-6, as measured by qPCR, normalized to GAPDH.
1α, 25- Dihydroxyvitamin D3 treatment significantly decreased IL-6 expression upon Aβ1-42

64
treatment of ApoE4 expressing astrocytes (One-way ANOVA, Bonferroni post-hoc,
*p<0.001, N=3). BAY-11-7082 treatment did not significantly alter IL-6 expression for any
of the Aβ + ApoE combination treatments, though it did tend to reduce the inflammatory
response of the Aβ + ApoE4 treatment.
65
Discussion
The ε4 allele of ApoE has been identified as a major risk factor for AD, and while
many studies have proposed mechanisms to explain this effect, the allele’s role in AD
progression is still unclear. A growing area of interest in AD study and treatment is
neuroinflammation, as inflammatory activation is known to contribute to a number of
degenerative disorders. Since Aβ has been shown to stimulate inflammatory responses,
activation of inflammatory pathways has been proposed as one of the key events in AD.
Some studies have shown an interaction between ApoE isoforms and inflammatory
activation (Jofre-Monseny et al., 2007; Zhang et al., 2011), but before this work there had
been no examination of how each isoform affected Aβ-stimulated inflammation in particular.
Two astrocyte models, NRAs and mouse cells expressing human ApoE isoforms, were used
in this study to determine how ApoE affected the inflammatory response. This study also
profiled a number of TFs to determine which signalling pathways are involved in the Aβ-
ApoE response. After the initial screening to determine TFs of interest, certain pathways
were validated by Western Blot or EMSA, and chemical inhibition was used to try and alter
the Aβ-induced inflammatory response. The difference in inflammatory markers between
E.coli produced, lipid-poor, recombinant ApoE and lipidated, mammalian ApoE produced in
mouse cells after challenge with Aβ was also examined.
4.1 ApoE isoforms differentially affect the Aβ-induced inflammatory response in NRA
cells
In contrast to expectations, treatment with recombinant ApoE4 did not significantly
affect the Aβ-induced inflammatory response in an NRA cell model. Instead, an anti-
66
inflammatory effect of ApoE2 was observed, as ApoE2 + Aβ treatment showed significantly
decreased gene expression and protein levels of inflammatory markers, compared to Aβ
alone.
That ApoE4 +Aβ treatment did not differ from Aβ-alone treatment in terms of
inflammatory activation contrasted with previous studies, which found that various
preparations of ApoE4 increased levels of inflammatory markers, in vitro in mouse and
human macrophages (Chen et al., 2005; Colton et al., 2004; Jofre-Monseny et al., 2007).
This includes both mouse cells expressing human isoforms of ApoE and exogenous
treatment using ApoE isoforms. However, these previous studies did not examine the
inflammatory response in astrocytes. While astrocytes are not the primary cell type in
inflammatory processes, they are the main site of ApoE production and deposition (Bu,
2009), and it is expected that they would be a site in which ApoE isoform specific
differences would manifest. One study did find that ApoE4, relative to mouse apoE or
ApoE3, had a significantly impaired ability to mediate the short-term activation of astrocytes
upon intracerebroventricular (i.c.v.) LPS injection (Ophir et al., 2003). However, a recent
study contradicted this result, showing mice expressing ApoE4 had higher levels of
astrogliosis upon similar treatment (Zhu et al., 2012). It is likely that differences in
transgenic mouse models, the time-frame of LPS treatment and the measures chosen to
assess activation, account for some of the variation.
These studies also highlight the importance of the wider cellular context. Astrocytic
activation does not happen in isolation, but is accompanied by activation of other glial cells,
and the release of a wide range of paracrine factors. One possible explanation as to why
ApoE4 did not have the expected effect in this cell model is that ApoE’s role in the
inflammatory response may depend on interaction with other neighbouring cell types. For
67
example, it is possible that the increased inflammation occurs through activation of
macrophages, and that the initial step may be ApoE4’s ability to promote activation of the
complement pathway and other innate immune systems. In that case, ApoE4 treatment of
astrocytes alone, as done in this study, may not be sufficient to cause substantial changes in
inflammatory activation after Aβ treatment.
An alternative explanation to the question of ApoE4’s lack of pro-inflammatory
activity was provided by Aβ treatment of astrocytes expressing human ApoE isoform. It is
possible that the lipidation state and post-translational modification of the protein had a
substantial effect on its activity, as discussed below.
As described above, ApoE2 is known to be genetically associated with a degree of
neuro-protection, but little research had been done into determining what mechanisms might
be involved. Based on this finding, it seems possible that ApoE2’s ability to prevent
inflammatory activation is one of the critical steps in decreasing risk of degeneration in the
AD brain. Recent work by Zhu et al. (2012) in brains of transgenic human ApoE isoform
mice upon LPS administration showed that while ApoE2 did not significantly reduce
markers of inflammatory activation, there were clear trends of a decrease in activation
observed. In concert with the findings from this study’s treatment of NRA cells, it is
reasonable to think that ApoE2’s protective role involves some degree of inflammatory
protection, as demonstrated in this work. This protection could couple with other ApoE2
effects on Aβ clearance and degradation, for example (Section 1.2.4.), to provide neuro-
protection. Understanding which pathways and mechanisms ApoE2 utilizes may provide
insights into how we can clinically provide similar protection to individuals who do not carry
the ε2 allele. Alternatively, it is possible that while ApoE2 is protective against inflammation
68
in astrocytes alone, there is not a strong enough protective effect in other cell types to have
an overall CNS effect.
4.2 Effect of Aβ on ApoE isoform expressing murine astrocytes
Aβ treatment of human ApoE-expressing mouse astrocytes yielded different results
than treatment of NRAs with recombinant ApoE proteins. The ApoE4 astrocyte line showed
the response initially expected, showing significantly greater levels of inflammatory
cytokines after Aβ treatment, compared to ApoE3- and ApoE2-expressing astrocytes. In
addition, there was no ApoE2 protective effect observed, as there was no significant
difference in inflammatory expression between the ApoE3 and ApoE2 cell lines upon Aβ
challenge. The ApoE4 cell line result agreed with work from another group, which found
that ApoE4 expressing macrophages had increased inflammatory response to LPS, though
that group also found an increased response in ApoE2 cells which was not observed here
(Tsoi et al., 2007). This could potentially agree with the suggestion above that an ApoE2
protective effect may be specific to astrocytes.
Of note, the 3-dimensional structure of the ApoE produced from mouse astrocytes
differed from recombinant human ApoE protein, due to its partial lipidation, and post-
translational modifications (Morikawa et al., 2005). As mentioned above (Section 1.2.),
lipidation state can substantially affect ApoE’s activity, and the difference in the pro-
inflammatory activity of ApoE4 between the two cell model systems in this study may
depend on the lipidation state of the ApoE proteins. Typically, studies that assess the effect
of lipidation state on the activity of ApoE utilize knockout of ABCA1, a lipid transporter
responsible for the efflux of lipids that make up HDL particles. ABCA1 deficiency typically
results in lower levels of ApoE in mouse brain, and decreased lipidation of the ApoE-
69
containing lipoproteins that are present (Hirsch-Reinshagen et al., 2004; Wahrle et al., 2004).
Delipidation of ApoE has also been shown to promote the formation of Aβ plaques in a
variety of models (Hirsch-Reinshagen et al., 2005; Koldamova et al., 2005; Wahrle et al.,
2005). Upregulation of ABCA1 through liver X receptor agonist activation shows the
opposite effect, decreasing Aβ levels (Riddell et al., 2008). All of this evidence suggests that
lipidation state, beyond its overall role affecting on levels of ApoE, may play a critical role
in AD progression. No study has yet examined whether CNS inflammatory activity is
directly impacted by changes in ApoE lipidation. The increase in Aβ plaques in ABCA1
knockout animals does not necessarily depend on changes in ApoE, as ABCA1 may interact
with the Aβ production and processing in other ways. ABCA1 knockout animals have also
been shown to have increased inflammatory responses in peripheral tissues, but ApoE’s
importance, if any, in this response is not known (Yvan-Charvet et al., 2010; Zhu et al.,
2008). Still, based on these studies, it is possible that ApoE lipidation state plays a role in
mediating the protein’s ability to affect the inflammatory response. In addition, it is known
that ApoE is present in both lipidated & unlipidated forms intracellularly, meaning that the
effect observed using the recombinant protein may still be relevant in a clinical context. This
difference could serve to explain the discrepancy between the recombinant and mammalian
ApoE observed in this study, and suggests that further study into the role of lipidation in the
AD inflammatory response is warranted.
4.3 Signalling pathways thought to mediate Aβ-induced inflammation
One of the objectives of this study was to identify signalling pathways of importance
in the ApoE/Aβ inflammatory response in NRAs. All data was based on 24 hour treatment of
NRA cells with recombinant ApoE isoforms, along with a 6 hour challenge with Aβ. Several
70
pathways of interest were identified as having at least a 2-fold increase in activity in ApoE3
+ Aβ treatment, which represented higher inflammatory levels, compared to ApoE2 + Aβ.
Some pathways were shown to have increased activity (again at least 2-fold) in less
inflammatory conditions, while others which were expected to change did not differentially
respond (Table 8). While some of these pathways are quite well-known in the field of AD
research, many have not been substantially studied in an AD context. The sections below
provide more detail on these identified pathways. Brief descriptions of some pathways are
also included in Table 9.
4.3.1 Signalling pathways found to be activated in higher inflammatory conditions
4.3.1.1 NF-κB
NF-κB is a heterodimeric protein complex, consisting of a p50 subunit and a Rel
subunit. It is constitutively expressed in many cell types, though in most conditions it is
sequestered in the cytosol through its binding with an IκB protein. When a cell is exposed to
inflammatory stimuli, cell surface receptors recruit and activate an IKK complex. This
complex phosphorylates the IκB protein, causing it to dissociate from NF-κB. The IκB
protein is then degraded, while NF-κB migrates to the nucleus to bind and regulate target
genes (Gilmore, 2006).
Multiple studies have suggested that the NF-κB signalling pathway is associated with
increased inflammatory response in mouse models, both upon inflammatory stimulation with
LPS (Ophir et al., 2005), and in transgenic models of AD (Bales et al., 2000; Ophir et al.,
2005). NF-κB is important in inflammatory signalling, as a wide range of inflammatory
cytokine genes display NF-κB binding sites in their promoter regions, including IL-1β and
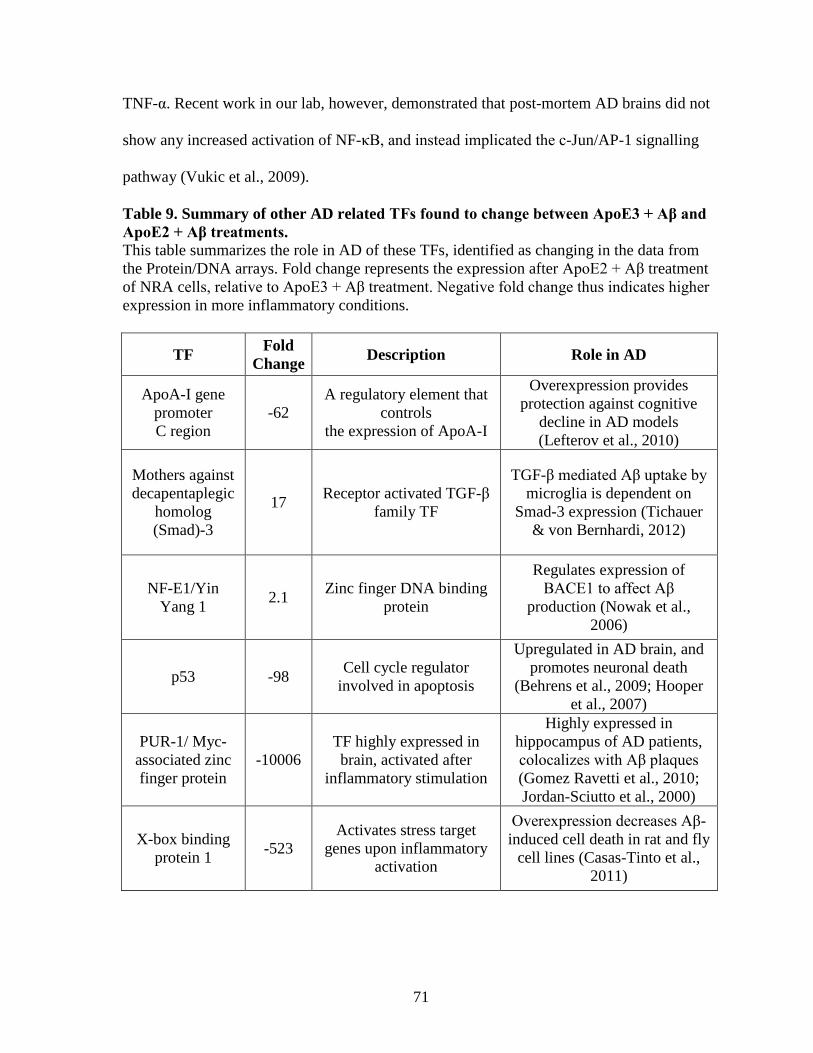
71
TNF-α. Recent work in our lab, however, demonstrated that post-mortem AD brains did not
show any increased activation of NF-κB, and instead implicated the c-Jun/AP-1 signalling
pathway (Vukic et al., 2009).
Table 9. Summary of other AD related TFs found to change between ApoE3 + Aβ and
ApoE2 + Aβ treatments.
This table summarizes the role in AD of these TFs, identified as changing in the data from
the Protein/DNA arrays. Fold change represents the expression after ApoE2 + Aβ treatment
of NRA cells, relative to ApoE3 + Aβ treatment. Negative fold change thus indicates higher
expression in more inflammatory conditions.
TF Fold
Change Description Role in AD
ApoA-I gene
promoter
C region
-62
A regulatory element that
controls
the expression of ApoA-I
Overexpression provides
protection against cognitive
decline in AD models
(Lefterov et al., 2010)
Mothers against
decapentaplegic
homolog
(Smad)-3
17 Receptor activated TGF-β
family TF
TGF-β mediated Aβ uptake by
microglia is dependent on
Smad-3 expression (Tichauer
& von Bernhardi, 2012)
NF-E1/Yin
Yang 1 2.1
Zinc finger DNA binding
protein
Regulates expression of
BACE1 to affect Aβ
production (Nowak et al.,
2006)
p53 -98 Cell cycle regulator
involved in apoptosis
Upregulated in AD brain, and
promotes neuronal death
(Behrens et al., 2009; Hooper
et al., 2007)
PUR-1/ Myc-
associated zinc
finger protein
-10006
TF highly expressed in
brain, activated after
inflammatory stimulation
Highly expressed in
hippocampus of AD patients,
colocalizes with Aβ plaques
(Gomez Ravetti et al., 2010;
Jordan-Sciutto et al., 2000)
X-box binding
protein 1 -523
Activates stress target
genes upon inflammatory
activation
Overexpression decreases Aβ-
induced cell death in rat and fly
cell lines (Casas-Tinto et al.,
2011)
72
The Protein/DNA array performed in this study, using the NRA cell model, indicated
that NF-κB was more highly activated in ApoE3 + Aβ treated cells than ApoE2 + Aβ treated
cells, a finding that was confirmed by EMSA (Figure 11). This is in agreement with those
studies which have found a link between increased inflammation and NF-κB activation.
Inhibition of this pathway with a specific inhibitor (BAY-11-7082) was able to
eliminate this difference in NRA cells, at least at one concentration (Figure 15). This is a
critical finding, suggesting that the inflammatory difference observed between ApoE2 and
ApoE3 treated NRA cells is dependent on an effect on NF-κB signalling. This suggests that
ApoE2’s protective effect could involve repression of the NF-κB signalling pathway, in
order to reduce inflammatory activation. NF-κB inhibition did not have a significant effect
on the Aβ alone treatment, however. This indicates that NF-κB activation is not a necessary
step in Aβ-induced inflammation in this cell model. It is likely that there are many pro-
inflammatory pathways activated in concert upon Aβ treatment, and it is possible that NF-κB
inhibition may not be sufficient to provide a clear degree of protection.
In mouse astrocytes, NF-κB inhibition did not alter the response to Aβ in ApoE2 or
ApoE3 cell lines, but decreased the Aβ-induced inflammatory response in the ApoE4 cell
line (Figure 19). This would also agree with findings of Ophir et al. (2005), in which ApoE4-
expressing mice, which are susceptible to neuroinflammation, were shown to have higher
NF-κB activation than ApoE3 mice. It is possible that a similar mechanism occurs in the
mouse astrocytes, and inhibition of NF-κB serves to prevent the inflammatory activation.
73
This study provides further evidence that NF-κB is one of a number of pathways
involved in inflammatory activation in astrocytes. It also suggests that beyond having a role
in ApoE2 protection, NF-κB may be important in ApoE4’s role as an AD risk factor, through
promoting activation of inflammatory signalling.
These results, combined with the fact that NF-κB activation occurs upstream of other
pro-inflammatory signalling pathways make it clear that the pathway is a promising target
for therapeutic intervention.
4.3.1.2 Peroxisome proliferator-activated receptor (PPAR)
The PPAR family of proteins are nuclear receptors, binding effectors in the
cytoplasm, then translocating to the nucleus and complexing with retinoid X receptor
proteins to activate target genes. These PPAR targets include several genes that play an
important role in the regulation of cholesterol and lipid levels. There are three main classes
of PPAR receptors, α, β and γ. PPARγ has been identified as a potential therapeutic target in
AD, as it shows increased expression in AD patients. Activation of PPARγ has been shown
to decrease Aβ-triggered activation of microglia, and to promote Aβ clearance from CNS
(Combs et al., 2000; Heneka et al., 2011). This activation also decreases the inflammatory
activation of astrocytes in an in vitro, LPS-stimulated model (Xu et al., 2006). Furthermore,
PPAR agonists have shown promise in mouse models of AD, reducing inflammatory
activation and plaque formation in mouse brain (Heneka et al., 2005), as well as leading to an
improvement in behavioural studies and memory ability (Pedersen et al., 2006). PPAR
activation also promotes astrocyte-mediated Aβ degredation (Mandrekar-Colucci et al.,
2012). This body of evidence suggests that PPAR plays roles in a number of AD related
74
pathways, and makes it a critical area for further research. This study found that PPAR
activity was increased by 2.5-fold in the more inflammatory, ApoE3 + Aβ treatment. This
finding is in agreement with studies finding that PPAR serves as a neuroprotective pathway
in the presence of Aβ. Based on this, it seems that PPAR may be activated as a compensatory
mechanism, to rescue the increased inflammation present in AD. This would agree with its
well-attested protective role, and suggest that PPAR activation could indeed be a good
therapeutic approach in AD.
4.3.2 Signalling pathways found to be activated in lesser inflammatory conditions
4.3.2.1 VDR
Vitamin D is a steroid hormone produced endogenously as a result of exposure to
UVB radiation. Its primary method of altering gene transcription is through the VDR, which
is phosphorylated and translocates to the nucleus upon ligand binding. There, like other
steroid hormone receptors, it recruits a retinoid X receptor, forming a hetero-dimeric
complex that then binds DNA at sites known as Vitamin D response elements (VDRE),
further recruiting transcriptional co-activators or co-repressors. Thousands of these VDREs
exist in the human genome, affecting hundreds of genes with a wide range of functions
(Wang et al., 2005). Many of these VDR targets are expressed in the CNS, and have been
shown to have neuroprotective effects. This includes within astrocytes, through affecting the
expression of nitric oxide synthase (Garcion et al., 1998). VDR activation also has critical
effects on immune cells, decreasing release of pro-inflammatory cytokines from Th1 cells, as
well having a protective role in a number of immune-related diseases (Fernandes de Abreu et
al., 2009). Some preliminary evidence has also suggested that polymorphisms in the VDR
75
gene may increase risk for AD, further pointing to a role for this pathway in AD pathology
(Lehmann et al., 2011).
VDR was found to be more activated in ApoE2 + Aβ treated NRA cells by ~70 fold
on the Protein/DNA array, relative to ApoE3 + Aβ , a find validated by EMSA (Figure 12).
Activation of the pathway with the native agonist did not have a significant effect on the
expression of inflammatory cytokines, in NRA cells (Figure 16). However, in mouse ApoE
knock-in cells, VDR activation significantly reduced the level of inflammatory activation in
the ApoE4 cell line after Aβ treatment, but did not affect the ApoE3 or ApoE2 cell lines
(Figure 19). Since the ApoE4 cell line showed much higher inflammatory response to Aβ
than the other cell lines, it is possible that VDR’s effect was only observable in these highly
inflammatory conditions. Since VDR is proposed to be downstream of NF-κB, chemical
activation of the pathway may not be a critical point in the inflammatory response in NRA
cells or in the ApoE3 or ApoE2 expressing mouse astrocyte lines. However, VDR activation
could still be a potential AD therapeutic approach as a part of a wider attempt to affect a
number of inflammatory pathways.
4.3.2.2 Estrogen receptor (ER)
The estrogen receptor is a classical nuclear steroid receptor; upon binding to the
hormone, the protein moves to the nucleus, co-dimerizes with another ER, and binds
estrogen response elements (EREs). Alternate pathways of activation do exist, including
through activation of MAPK signalling, and through interaction with other TFs in larger
complexes (McDevitt et al., 2008).
76
There is a strong base of evidence linking ER signalling to neuro-protection in AD
and to ApoE isoform specific effects. One critical manifestation of the protection in AD is
the prevention of neuronal death from Aβ-induced toxicity. This may be due to interference
with the ability of Aβ to form oligomers (Morinaga et al., 2011), blockade of pro-apoptotic
signalling (Pike et al., 2009) and/or decreasing the production of ROS in mitochondria, as
shown in AD brain (Long et al., 2012; Razmara et al., 2007). Another mechanism that could
be involved is neprylisin-mediated Aβ degradation. The neprylisin gene contains EREs in its
promoter region, and estrogen treatment increases its activity, along with increasing Aβ
degradation in one in vitro model (Liang et al., 2010). ER’s positive role in neuronal
regeneration has been shown to depend on ApoE, and ER is capable of regulating ApoE
expression, which may provide a framework for the link between ER activation and the
isoform-specific response to Aβ (Struble et al., 2007). ApoE genotypes have also been
shown to alter the estrogen response in microglia, with ApoE4 expressing mice showing a
decreased anti-inflammatory effect upon estrogen treatment, relative to ApoE3 (Brown et al.,
2008). In this study, ER was found to be increased two-fold in ApoE2 + Aβ treatment,
relative to ApoE3 + Aβ. This confirms its role as a neuroprotective pathway, and suggests
that ApoE2’s decreased levels of inflammation may be due to increased activation of ER,
making it an interesting area for further study.
4.3.3 Signalling pathways unchanged between ApoE2 + Aβ and ApoE3 + Aβ treatments
4.3.3.1 Signal transducer and activator of transcription-3
STAT-3 is primarily involved in the Janus kinase (JAK)/STAT tyrosine kinase
signalling pathway. STAT-3 is activated by JAK2, through phosphorylation at two sites
77
(Levy & Darnell, 2002). Upon binding of certain cytokines, including IL-6 and other pro-
inflammatory mediators, JAK2 phosphorylates those residues, causing the STAT-3 proteins
to dimerize and translocate to the nucleus, where they bind target DNA sequences to affect
transcription.
There has been conflicting evidence involving STAT-3 in AD. Previous work in our
lab has shown increased activation in post-mortem AD brains with cerebral amyloid
angiopathy, but decreased signalling in cell models (Unpublished). Similarly, another group
found STAT-3 signalling was increased in post-mortem AD brains, and that transgenic APP
mice also exhibited higher STAT-3 phosphorylation. In addition, they found that Aβ
treatment in cultured rat neurons increased STAT-3 activation (Wan et al., 2010). Another
group found the opposite, that in AD patients STAT-3 was inactivated, and that i.c.v.
injection of Aβ into mice led to decreased STAT-3 signalling (Chiba et al., 2009). STAT-3
was found to be activated ~50 fold in pro-inflammatory conditions by the protein/DNA
array, but this result was not confirmed by EMSA (Figure 13), which found no difference in
activation between ApoE3 + Aβ and ApoE2 + Aβ treatments. STAT-3 does seem to play a
role in AD, but the nature of that role seems poised to remain an open question for the time
being.
4.3.3.2 c-Jun/Activator protein-1
The activator protein-1 (AP-1) proteins are a family of dimeric complexes, made up
of homodimers of Jun or ATF proteins, or heterodimers of Jun, ATF or Fos proteins. In
response to certain stimuli, such as cytokines or stress, MAPK kinases (MAPKKs) are
activated. These MAPKKs then phosphorylate and activate MAPKs, including c-Jun N-
78
terminal kinases (JNKs). These bind and phosphorylate c-Jun, which triggers synthesis of
Jun and Fos proteins, and the formation of AP-1 complexes. These complexes are also
phosphorylated, which triggers their activation (Eferl & Wagner, 2003). Once activated, AP-
1 upregulates a number of inflammatory mediators, such as TNF-α, as well as cytokines
which contribute to the activation of the inflammatory response (Johnson & Nakamura,
2007).
It has been shown that inflammatory challenge with LPS down-regulates ApoE
expression and that this repression is removed upon inhibition of JNK (Gafencu et al., 2007;
Pocivavsek & Rebeck, 2009). This repression was linked to binding of activated c-Jun to a
repressor site at the ApoE promoter, making it clear that AP-1 affects the ApoE’s role in the
inflammatory response. There is also some evidence to support the reverse relationship,
ApoE altering c-Jun signalling. One group has shown that ApoE acts through activation of
LDLR in microglia to trigger the activation of JNK kinase (Pocivavsek et al., 2009a;
Pocivavsek et al., 2009b), while another showed that ApoE mediated the c-Jun response
through toll-like receptors (Zhu et al., 2010). None of these studies, however, compared the
response between the various ApoE isoforms, nor did they examine whether Aβ-induced
inflammation is governed by these same mechanisms. In this study, AP-1 was, contrary to
expectations, not found to change between the ApoE2 + Aβ and ApoE3 + Aβ treatments,
either on the Protein/DNA array or by Western blotting. Thus, while it is an important
pathway to study in AD pathology, it does not seem to contribute to the observed ApoE2
protective effect. If c-Jun’s effects depend on modifying the expression of ApoE, as some
studies suggest, that was likely not detectable in this study, in which exogenous treatment of
ApoE was used.
79
4.3.3.3 p38 MAPK
The p38 MAPK pathway, like the AP-1 pathway above, is activated by
phosphorylation by upstream kinases, which respond to a number of physiological stimuli,
including cytokines IL-1 and TNF-α. These kinases phosphorylate p38 MAPK at two sites to
trigger its activation. The primary activity of p38 MAPK proteins is not directly binding
DNA, but increasing signalling of a wide range of downstream TFs such as p53 and STAT-1.
One of the primary results of this is further activation and release of cytokines, potentiating
inflammatory activation (Cuenda & Rousseau, 2007).
Beyond its role in mediating inflammation, there has been some indication of a
potential interaction between p38 MAPK signalling and AD. It has been shown that p38
signalling is increased in early stages of AD (Sun et al., 2003), and in one transgenic mouse
model hippocampal astrocytes have significantly higher p38 MAPK activation (Giovannini
et al., 2008). P38 MAPK inhibition has also been proposed as a potential therapeutic
approach, with a group showing that one particular compound decreased inflammatory
activation in AD model mice (Munoz et al., 2007). Despite this evidence, p38 MAPK was
not found to change between higher and lower inflammatory conditions in this study, either
by the Protein/DNA array or Western blotting. It is possible that p38 MAPK is not important
enough to inflammatory activation to significantly change in these conditions.
4.4 Conclusion
This study set out to examine out how ApoE isoforms affect the Aβ-induced
inflammatory response in two model systems of astrocytes, NRA cells and mouse cells
knocked in with human ApoE isoforms. It seemed that the relationship was dependent upon
80
the ApoE preparation used. NRA cells treated with recombinant, lipid-poor proteins showed
a protective effect of ApoE2, as challenge with Aβ induced significantly lower gene and
protein levels of inflammatory cytokines, compared to the other ApoE isoforms. This could
contribute to ApoE2’s overall neuroprotective role, as identified from genetic studies. Also, a
wide range of TFs were profiled in Aβ and ApoE-treated NRA cells to determine their role,
if any, in this response. The results suggested roles for some well-attested pathways (NF-κB,
VDR, PPAR), as well as identifying a number of candidates which have not been thoroughly
studied in the context of AD. In addition, STAT-3 and AP-1, which have been previously
shown be involved in the AD inflammatory response, were not found to respond upon
ApoE2 treatment. This suggests that their role in inflammation of the AD brain is not
necessarily critical in the ApoE2-mediated anti-inflammatory response.
Human ApoE expressing mouse astrocyte cell lines, which produce lipidated ApoE
similar in structure to that seen in human brain (Morikawa et al., 2005), did not show the
ApoE2 protective effect. Instead, the results showed that ApoE4 cells were had much higher
inflammatory response to challenge with Aβ. This fits with previous expectations, and
suggests that ApoE4’s role in promoting inflammation is likely through a loss of some
nascent anti-inflammatory activity of ApoE2 and ApoE3. This increased inflammation likely
contributes to its status as the primary AD genetic risk factor.
Two major future areas of study are highlighted by this work. The first is to examine
those signalling pathways that have limited known involvement in AD, but were found to be
candidates in this study; perhaps some of these play crucial roles in inflammation and
neurodegeneration. The second is to examine the role of ApoE’s interaction with lipids and
to determine whether the lipidation state of the protein defines the difference between the
results in the NRA cell line and the ApoE mouse cell lines. Altogether, this study sheds some

81
light into the mechanism of neuroinflammation in AD, a growing area of interest as effective
clinical treatments remain elusive.
82
References
Aizenstein, H. J., Nebes, R. D., Saxton, J. A., Price, J. C., Mathis, C. A., Tsopelas, N. D.,
Ziolko, S. K., James, J. A., Snitz, B. E., Houck, P. R., Bi, W., Cohen, A. D., Lopresti, B. J.,
DeKosky, S. T., Halligan, E. M., & Klunk, W. E. (2008). Frequent amyloid deposition
without significant cognitive impairment among the elderly. Arch Neurol, 65(11), 1509-
1517.
Aleong, R., Blain, J. F., & Poirier, J. (2008). Pro-inflammatory cytokines modulate glial
apolipoprotein E secretion. Curr Alzheimer Res, 5(1), 33-37.
Atamna, H., & Boyle, K. (2006). Amyloid-beta peptide binds with heme to form a
peroxidase: relationship to the cytopathologies of Alzheimer's disease. Proc Natl Acad
Sci U S A, 103(9), 3381-3386.
Baitsch, D., Bock, H. H., Engel, T., Telgmann, R., Muller-Tidow, C., Varga, G., Bot, M.,
Herz, J., Robenek, H., von Eckardstein, A., & Nofer, J. R. (2011). Apolipoprotein E
induces antiinflammatory phenotype in macrophages. Arterioscler Thromb Vasc Biol,
31(5), 1160-1168.
Bales, K. R., Du, Y., Holtzman, D., Cordell, B., & Paul, S. M. (2000). Neuroinflammation
and Alzheimer's disease: critical roles for cytokine/Abeta-induced glial activation, NF-
kappaB, and apolipoprotein E. Neurobiol Aging, 21(3), 427-432; discussion 451-423.
Bales, K. R., Liu, F., Wu, S., Lin, S., Koger, D., DeLong, C., Hansen, J. C., Sullivan, P. M.,
& Paul, S. M. (2009). Human APOE isoform-dependent effects on brain beta-amyloid
levels in PDAPP transgenic mice. J Neurosci, 29(21), 6771-6779.
Bales, K. R., Verina, T., Cummins, D. J., Du, Y., Dodel, R. C., Saura, J., Fishman, C. E.,
DeLong, C. A., Piccardo, P., Petegnief, V., Ghetti, B., & Paul, S. M. (1999). Apolipoprotein
E is essential for amyloid deposition in the APP(V717F) transgenic mouse model of
Alzheimer's disease. Proc Natl Acad Sci U S A, 96(26), 15233-15238.
Bales, K. R., Verina, T., Dodel, R. C., Du, Y., Altstiel, L., Bender, M., Hyslop, P.,
Johnstone, E. M., Little, S. P., Cummins, D. J., Piccardo, P., Ghetti, B., & Paul, S. M.
(1997). Lack of apolipoprotein E dramatically reduces amyloid beta-peptide deposition.
Nat Genet, 17(3), 263-264.
83
Bandaru, V. V., Troncoso, J., Wheeler, D., Pletnikova, O., Wang, J., Conant, K., & Haughey,
N. J. (2009). ApoE4 disrupts sterol and sphingolipid metabolism in Alzheimer's but not
normal brain. Neurobiol Aging, 30(4), 591-599.
Basak, J. M., Verghese, P. B., Yoon, H., Kim, J., & Holtzman, D. M. (2012). Low-density
lipoprotein receptor represents an apolipoprotein E-independent pathway of Abeta
uptake and degradation by astrocytes. J Biol Chem, 287(17), 13959-13971.
Beffert, U., & Poirier, J. (1998). ApoE associated with lipid has a reduced capacity to
inhibit beta-amyloid fibril formation. Neuroreport, 9(14), 3321-3323.
Belinson, H., & Michaelson, D. M. (2009). ApoE4-dependent Abeta-mediated
neurodegeneration is associated with inflammatory activation in the hippocampus but
not the septum. J Neural Transm, 116(11), 1427-1434.
Bell, R. D., Sagare, A. P., Friedman, A. E., Bedi, G. S., Holtzman, D. M., Deane, R., &
Zlokovic, B. V. (2007). Transport pathways for clearance of human Alzheimer's
amyloid beta-peptide and apolipoproteins E and J in the mouse central nervous system.
J Cereb Blood Flow Metab, 27(5), 909-918.
Bien-Ly, N., Gillespie, A. K., Walker, D., Yoon, S. Y., & Huang, Y. (2012). Reducing
human apolipoprotein E levels attenuates age-dependent Abeta accumulation in
mutant human amyloid precursor protein transgenic mice. J Neurosci, 32(14), 4803-
4811.
Biere, A. L., Ostaszewski, B., Zhao, H., Gillespie, S., Younkin, S. G., & Selkoe, D. J.
(1995). Co-expression of beta-amyloid precursor protein (betaAPP) and apolipoprotein
E in cell culture: analysis of betaAPP processing. Neurobiol Dis, 2(3), 177-187.
Blasko, I., Stampfer-Kountchev, M., Robatscher, P., Veerhuis, R., Eikelenboom, P., &
Grubeck-Loebenstein, B. (2004). How chronic inflammation can affect the brain and
support the development of Alzheimer's disease in old age: the role of microglia and
astrocytes. Aging Cell, 3(4), 169-176.
Brown, C. M., Choi, E., Xu, Q., Vitek, M. P., & Colton, C. A. (2008). The APOE4
genotype alters the response of microglia and macrophages to 17beta-estradiol.
Neurobiol Aging, 29(12), 1783-1794.
Bu, G. (2009). Apolipoprotein E and its receptors in Alzheimer's disease: pathways,
pathogenesis and therapy. Nat Rev Neurosci, 10(5), 333-344.
84
Cam, J. A., & Bu, G. (2006). Modulation of beta-amyloid precursor protein trafficking
and processing by the low density lipoprotein receptor family. Mol Neurodegener, 1, 8.
Carrasquillo, M. M., Belbin, O., Zou, F., Allen, M., Ertekin-Taner, N., Ansari, M., Wilcox,
S. L., Kashino, M. R., Ma, L., Younkin, L. H., Younkin, S. G., Younkin, C. S., Dincman, T.
A., Howard, M. E., Howell, C. C., Stanton, C. M., Watson, C. M., Crump, M., Vitart, V.,
Hayward, C., Hastie, N. D., Rudan, I., Campbell, H., Polasek, O., Brown, K., Passmore, P.,
Craig, D., McGuinness, B., Todd, S., Kehoe, P. G., Mann, D. M., Smith, A. D., Beaumont,
H., Warden, D., Holmes, C., Heun, R., Kolsch, H., Kalsheker, N., Pankratz, V. S., Dickson,
D. W., Graff-Radford, N. R., Petersen, R. C., Wright, A. F., & Morgan, K. (2010).
Concordant association of insulin degrading enzyme gene (IDE) variants with IDE
mRNA, Abeta, and Alzheimer's disease. PLoS One, 5(1), e8764.
Casas-Tinto, S., Zhang, Y., Sanchez-Garcia, J., Gomez-Velazquez, M., Rincon-Limas, D. E.,
& Fernandez-Funez, P. (2011). The ER stress factor XBP1s prevents amyloid-beta
neurotoxicity. Hum Mol Genet, 20(11), 2144-2160.
Castano, E. M., Prelli, F., Wisniewski, T., Golabek, A., Kumar, R. A., Soto, C., & Frangione,
B. (1995). Fibrillogenesis in Alzheimer's disease of amyloid beta peptides and
apolipoprotein E. Biochem J, 306 ( Pt 2), 599-604.
Castellano, J. M., Kim, J., Stewart, F. R., Jiang, H., DeMattos, R. B., Patterson, B. W.,
Fagan, A. M., Morris, J. C., Mawuenyega, K. G., Cruchaga, C., Goate, A. M., Bales, K. R.,
Paul, S. M., Bateman, R. J., & Holtzman, D. M. (2011). Human apoE isoforms
differentially regulate brain amyloid-beta peptide clearance. Sci Transl Med, 3(89),
89ra57.
Cedazo-Minguez, A., Wiehager, B., Winblad, B., Huttinger, M., & Cowburn, R. F. (2001).
Effects of apolipoprotein E (apoE) isoforms, beta-amyloid (Abeta) and apoE/Abeta
complexes on protein kinase C-alpha (PKC-alpha) translocation and amyloid precursor
protein (APP) processing in human SH-SY5Y neuroblastoma cells and fibroblasts.
Neurochem Int, 38(7), 615-625.
Chen, H. K., Ji, Z. S., Dodson, S. E., Miranda, R. D., Rosenblum, C. I., Reynolds, I. J.,
Freedman, S. B., Weisgraber, K. H., Huang, Y., & Mahley, R. W. (2011). Apolipoprotein
E4 domain interaction mediates detrimental effects on mitochondria and is a potential
therapeutic target for Alzheimer disease. J Biol Chem, 286(7), 5215-5221.
Chen, S., Averett, N. T., Manelli, A., Ladu, M. J., May, W., & Ard, M. D. (2005). Isoform-
specific effects of apolipoprotein E on secretion of inflammatory mediators in adult rat
microglia. J Alzheimers Dis, 7(1), 25-35.
85
Chiba, T., Yamada, M., Sasabe, J., Terashita, K., Shimoda, M., Matsuoka, M., & Aiso, S.
(2009). Amyloid-beta causes memory impairment by disturbing the JAK2/STAT3 axis
in hippocampal neurons. Mol Psychiatry, 14(2), 206-222.
Chuang, W. L., Hsieh, Y. C., Wang, C. Y., Kuo, H. C., & Huang, C. C. (2010). Association
of apolipoproteins e4 and c1 with onset age and memory: a study of sporadic Alzheimer
disease in Taiwan. J Geriatr Psychiatry Neurol, 23(1), 42-48.
Colton, C. A., Needham, L. K., Brown, C., Cook, D., Rasheed, K., Burke, J. R., Strittmatter,
W. J., Schmechel, D. E., & Vitek, M. P. (2004). APOE genotype-specific differences in
human and mouse macrophage nitric oxide production. J Neuroimmunol, 147(1-2), 62-
67.
Combs, C. K., Johnson, D. E., Karlo, J. C., Cannady, S. B., & Landreth, G. E. (2000).
Inflammatory mechanisms in Alzheimer's disease: inhibition of beta-amyloid-
stimulated proinflammatory responses and neurotoxicity by PPARgamma agonists. J
Neurosci, 20(2), 558-567.
Corder, E. H., Saunders, A. M., Risch, N. J., Strittmatter, W. J., Schmechel, D. E., Gaskell,
P. C., Jr., Rimmler, J. B., Locke, P. A., Conneally, P. M., Schmader, K. E., & et al. (1994).
Protective effect of apolipoprotein E type 2 allele for late onset Alzheimer disease. Nat
Genet, 7(2), 180-184.
Corder, E. H., Saunders, A. M., Strittmatter, W. J., Schmechel, D. E., Gaskell, P. C., Small,
G. W., Roses, A. D., Haines, J. L., & Pericak-Vance, M. A. (1993). Gene dose of
apolipoprotein E type 4 allele and the risk of Alzheimer's disease in late onset families.
Science, 261(5123), 921-923.
Craft, J. M., Watterson, D. M., & Van Eldik, L. J. (2006). Human amyloid beta-induced
neuroinflammation is an early event in neurodegeneration. Glia, 53(5), 484-490.
Cuenda, A., & Rousseau, S. (2007). p38 MAP-kinases pathway regulation, function and
role in human diseases. Biochim Biophys Acta, 1773(8), 1358-1375.
Dafnis, I., Stratikos, E., Tzinia, A., Tsilibary, E. C., Zannis, V. I., & Chroni, A. (2010). An
apolipoprotein E4 fragment can promote intracellular accumulation of amyloid peptide
beta 42. J Neurochem, 115(4), 873-884.
86
Deane, R., Sagare, A., Hamm, K., Parisi, M., Lane, S., Finn, M. B., Holtzman, D. M., &
Zlokovic, B. V. (2008). apoE isoform-specific disruption of amyloid beta peptide
clearance from mouse brain. J Clin Invest, 118(12), 4002-4013.
DeMattos, R. B., Brendza, R. P., Heuser, J. E., Kierson, M., Cirrito, J. R., Fryer, J., Sullivan,
P. M., Fagan, A. M., Han, X., & Holtzman, D. M. (2001). Purification and
characterization of astrocyte-secreted apolipoprotein E and J-containing lipoproteins
from wild-type and human apoE transgenic mice. Neurochem Int, 39(5-6), 415-425.
Dieckmann, M., Dietrich, M. F., & Herz, J. (2010). Lipoprotein receptors--an
evolutionarily ancient multifunctional receptor family. Biol Chem, 391(11), 1341-1363.
Dodart, J. C., Bales, K. R., Johnstone, E. M., Little, S. P., & Paul, S. M. (2002).
Apolipoprotein E alters the processing of the beta-amyloid precursor protein in
APP(V717F) transgenic mice. Brain Res, 955(1-2), 191-199.
Du, J., Chang, J., Guo, S., Zhang, Q., & Wang, Z. (2009). ApoE 4 reduces the expression
of Abeta degrading enzyme IDE by activating the NMDA receptor in hippocampal
neurons. Neurosci Lett, 464(2), 140-145.
Eferl, R., & Wagner, E. F. (2003). AP-1: a double-edged sword in tumorigenesis. Nat Rev
Cancer, 3(11), 859-868.
Elliott, D. A., Tsoi, K., Holinkova, S., Chan, S. L., Kim, W. S., Halliday, G. M., Rye, K. A.,
& Garner, B. (2011). Isoform-specific proteolysis of apolipoprotein-E in the brain.
Neurobiol Aging, 32(2), 257-271.
Fagan, A. M., Holtzman, D. M., Munson, G., Mathur, T., Schneider, D., Chang, L. K., Getz,
G. S., Reardon, C. A., Lukens, J., Shah, J. A., & LaDu, M. J. (1999). Unique lipoproteins
secreted by primary astrocytes from wild type, apoE (-/-), and human apoE transgenic
mice. J Biol Chem, 274(42), 30001-30007.
Fagan, A. M., Watson, M., Parsadanian, M., Bales, K. R., Paul, S. M., & Holtzman, D. M.
(2002). Human and murine ApoE markedly alters A beta metabolism before and after
plaque formation in a mouse model of Alzheimer's disease. Neurobiol Dis, 9(3), 305-318.
Fernandes de Abreu, D. A., Eyles, D., & Feron, F. (2009). Vitamin D, a neuro-
immunomodulator: implications for neurodegenerative and autoimmune diseases.
Psychoneuroendocrinology, 34 Suppl 1, S265-277.
87
Frieden, C., & Garai, K. (2012). Structural differences between apoE3 and apoE4 may be
useful in developing therapeutic agents for Alzheimer's disease. Proc Natl Acad Sci U S
A, 109(23), 8913-8918.
Gafencu, A. V., Robciuc, M. R., Fuior, E., Zannis, V. I., Kardassis, D., & Simionescu, M.
(2007). Inflammatory signaling pathways regulating ApoE gene expression in
macrophages. J Biol Chem, 282(30), 21776-21785.
Garai, K., & Frieden, C. (2010). The association-dissociation behavior of the ApoE
proteins: kinetic and equilibrium studies. Biochemistry, 49(44), 9533-9541.
Garcion, E., Sindji, L., Montero-Menei, C., Andre, C., Brachet, P., & Darcy, F. (1998).
Expression of inducible nitric oxide synthase during rat brain inflammation: regulation
by 1,25-dihydroxyvitamin D3. Glia, 22(3), 282-294.
Garwood, C. J., Pooler, A. M., Atherton, J., Hanger, D. P., & Noble, W. (2011). Astrocytes
are important mediators of Abeta-induced neurotoxicity and tau phosphorylation in
primary culture. Cell Death Dis, 2, e167.
Gaspar, R. C., Villarreal, S. A., Bowles, N., Hepler, R. W., Joyce, J. G., & Shughrue, P. J.
(2010). Oligomers of beta-amyloid are sequestered into and seed new plaques in the
brains of an AD mouse model. Exp Neurol, 223(2), 394-400.
Genin, E., Hannequin, D., Wallon, D., Sleegers, K., Hiltunen, M., Combarros, O., Bullido,
M. J., Engelborghs, S., De Deyn, P., Berr, C., Pasquier, F., Dubois, B., Tognoni, G., Fievet,
N., Brouwers, N., Bettens, K., Arosio, B., Coto, E., Del Zompo, M., Mateo, I., Epelbaum, J.,
Frank-Garcia, A., Helisalmi, S., Porcellini, E., Pilotto, A., Forti, P., Ferri, R., Scarpini, E.,
Siciliano, G., Solfrizzi, V., Sorbi, S., Spalletta, G., Valdivieso, F., Vepsalainen, S., Alvarez,
V., Bosco, P., Mancuso, M., Panza, F., Nacmias, B., Bossu, P., Hanon, O., Piccardi, P.,
Annoni, G., Seripa, D., Galimberti, D., Licastro, F., Soininen, H., Dartigues, J. F., Kamboh,
M. I., Van Broeckhoven, C., Lambert, J. C., Amouyel, P., & Campion, D. (2011). APOE
and Alzheimer disease: a major gene with semi-dominant inheritance. Mol Psychiatry,
16(9), 903-907.
Gilmore, T. D. (2006). Introduction to NF-kappaB: players, pathways, perspectives.
Oncogene, 25(51), 6680-6684.
Giovannini, M. G., Cerbai, F., Bellucci, A., Melani, C., Grossi, C., Bartolozzi, C., Nosi, D.,
& Casamenti, F. (2008). Differential activation of mitogen-activated protein kinase
signalling pathways in the hippocampus of CRND8 transgenic mouse, a model of
Alzheimer's disease. Neuroscience, 153(3), 618-633.
88
Golabek, A. A., Soto, C., Vogel, T., & Wisniewski, T. (1996). The interaction between
apolipoprotein E and Alzheimer's amyloid beta-peptide is dependent on beta-peptide
conformation. J Biol Chem, 271(18), 10602-10606.
Grainger, D. J., Reckless, J., & McKilligin, E. (2004). Apolipoprotein E modulates
clearance of apoptotic bodies in vitro and in vivo, resulting in a systemic
proinflammatory state in apolipoprotein E-deficient mice. J Immunol, 173(10), 6366-
6375.
Guo, L., LaDu, M. J., & Van Eldik, L. J. (2004). A dual role for apolipoprotein e in
neuroinflammation: anti- and pro-inflammatory activity. J Mol Neurosci, 23(3), 205-
212.
Guo, Q., Wang, Z., Li, H., Wiese, M., & Zheng, H. (2012). APP physiological and
pathophysiological functions: insights from animal models. Cell Res, 22(1), 78-89.
Hanlon, C. S., & Rubinsztein, D. C. (1995). Arginine residues at codons 112 and 158 in
the apolipoprotein E gene correspond to the ancestral state in humans. Atherosclerosis,
112(1), 85-90.
Hao, J., Zhang, W., Zhang, P., Liu, R., Liu, L., Lei, G., Su, C., Miao, J., & Li, Z. (2010).
Abeta20-29 peptide blocking apoE/Abeta interaction reduces full-length Abeta42/40
fibril formation and cytotoxicity in vitro. Neuropeptides, 44(4), 305-313.
Hardy, J., & Selkoe, D. J. (2002). The amyloid hypothesis of Alzheimer's disease:
progress and problems on the road to therapeutics. Science, 297(5580), 353-356.
Hatters, D. M., Peters-Libeu, C. A., & Weisgraber, K. H. (2006). Apolipoprotein E
structure: insights into function. Trends Biochem Sci, 31(8), 445-454.
Hauser, P. S., Narayanaswami, V., & Ryan, R. O. (2011). Apolipoprotein E: from lipid
transport to neurobiology. Prog Lipid Res, 50(1), 62-74.
He, X., Cooley, K., Chung, C. H., Dashti, N., & Tang, J. (2007). Apolipoprotein receptor 2
and X11 alpha/beta mediate apolipoprotein E-induced endocytosis of amyloid-beta
precursor protein and beta-secretase, leading to amyloid-beta production. J Neurosci,
27(15), 4052-4060.
89
Heneka, M. T., Reyes-Irisarri, E., Hull, M., & Kummer, M. P. (2011). Impact and
Therapeutic Potential of PPARs in Alzheimer's Disease. Curr Neuropharmacol, 9(4),
643-650.
Heneka, M. T., Sastre, M., Dumitrescu-Ozimek, L., Hanke, A., Dewachter, I., Kuiperi, C.,
O'Banion, K., Klockgether, T., Van Leuven, F., & Landreth, G. E. (2005). Acute treatment
with the PPARgamma agonist pioglitazone and ibuprofen reduces glial inflammation
and Abeta1-42 levels in APPV717I transgenic mice. Brain, 128(Pt 6), 1442-1453.
Herz, J., & Chen, Y. (2006). Reelin, lipoprotein receptors and synaptic plasticity. Nat Rev
Neurosci, 7(11), 850-859.
Hirsch-Reinshagen, V., Maia, L. F., Burgess, B. L., Blain, J. F., Naus, K. E., McIsaac, S. A.,
Parkinson, P. F., Chan, J. Y., Tansley, G. H., Hayden, M. R., Poirier, J., Van Nostrand, W.,
& Wellington, C. L. (2005). The absence of ABCA1 decreases soluble ApoE levels but
does not diminish amyloid deposition in two murine models of Alzheimer disease. J Biol
Chem, 280(52), 43243-43256.
Hirsch-Reinshagen, V., Zhou, S., Burgess, B. L., Bernier, L., McIsaac, S. A., Chan, J. Y.,
Tansley, G. H., Cohn, J. S., Hayden, M. R., & Wellington, C. L. (2004). Deficiency of
ABCA1 impairs apolipoprotein E metabolism in brain. J Biol Chem, 279(39), 41197-
41207.
Hoe, H. S., Pocivavsek, A., Dai, H., Chakraborty, G., Harris, D. C., & Rebeck, G. W. (2006).
Effects of apoE on neuronal signaling and APP processing in rodent brain. Brain Res,
1112(1), 70-79.
Hoe, H. S., & Rebeck, G. W. (2008). Functional interactions of APP with the apoE
receptor family. J Neurochem, 106(6), 2263-2271.
Hone, E., Martins, I. J., Fonte, J., & Martins, R. N. (2003). Apolipoprotein E influences
amyloid-beta clearance from the murine periphery. J Alzheimers Dis, 5(1), 1-8.
Hu, J., Ferreira, A., & Van Eldik, L. J. (1997). S100beta induces neuronal cell death
through nitric oxide release from astrocytes. J Neurochem, 69(6), 2294-2301.
Huebbe, P., Schaffer, S., Jofre-Monseny, L., Boesch-Saadatmandi, C., Minihane, A. M.,
Muller, W. E., Eckert, G. P., & Rimbach, G. (2007). Apolipoprotein E genotype and
alpha-tocopherol modulate amyloid precursor protein metabolism and cell cycle
regulation. Mol Nutr Food Res, 51(12), 1510-1517.
90
Irizarry, M. C., Deng, A., Lleo, A., Berezovska, O., Von Arnim, C. A., Martin-Rehrmann,
M., Manelli, A., LaDu, M. J., Hyman, B. T., & Rebeck, G. W. (2004). Apolipoprotein E
modulates gamma-secretase cleavage of the amyloid precursor protein. J Neurochem,
90(5), 1132-1143.
Irvine, G. B., El-Agnaf, O. M., Shankar, G. M., & Walsh, D. M. (2008). Protein
aggregation in the brain: the molecular basis for Alzheimer's and Parkinson's diseases.
Mol Med, 14(7-8), 451-464.
Iwata, N., Tsubuki, S., Takaki, Y., Watanabe, K., Sekiguchi, M., Hosoki, E., Kawashima-
Morishima, M., Lee, H. J., Hama, E., Sekine-Aizawa, Y., & Saido, T. C. (2000).
Identification of the major Abeta1-42-degrading catabolic pathway in brain
parenchyma: suppression leads to biochemical and pathological deposition. Nat Med,
6(2), 143-150.
Jack, C. R., Jr., Knopman, D. S., Jagust, W. J., Shaw, L. M., Aisen, P. S., Weiner, M. W.,
Petersen, R. C., & Trojanowski, J. Q. (2010). Hypothetical model of dynamic biomarkers
of the Alzheimer's pathological cascade. Lancet Neurol, 9(1), 119-128.
Jana, A., & Pahan, K. (2010). Fibrillar amyloid-beta-activated human astroglia kill
primary human neurons via neutral sphingomyelinase: implications for Alzheimer's
disease. J Neurosci, 30(38), 12676-12689.
Jana, M., Palencia, C. A., & Pahan, K. (2008). Fibrillar amyloid-beta peptides activate
microglia via TLR2: implications for Alzheimer's disease. J Immunol, 181(10), 7254-
7262.
Ji, Y., Permanne, B., Sigurdsson, E. M., Holtzman, D. M., & Wisniewski, T. (2001).
Amyloid beta40/42 clearance across the blood-brain barrier following intra-ventricular
injections in wild-type, apoE knock-out and human apoE3 or E4 expressing transgenic
mice. J Alzheimers Dis, 3(1), 23-30.
Jiang, Q., Lee, C. Y., Mandrekar, S., Wilkinson, B., Cramer, P., Zelcer, N., Mann, K., Lamb,
B., Willson, T. M., Collins, J. L., Richardson, J. C., Smith, J. D., Comery, T. A., Riddell, D.,
Holtzman, D. M., Tontonoz, P., & Landreth, G. E. (2008). ApoE promotes the proteolytic
degradation of Abeta. Neuron, 58(5), 681-693.
Jofre-Monseny, L., Loboda, A., Wagner, A. E., Huebbe, P., Boesch-Saadatmandi, C.,
Jozkowicz, A., Minihane, A. M., Dulak, J., & Rimbach, G. (2007). Effects of apoE
genotype on macrophage inflammation and heme oxygenase-1 expression. Biochem
Biophys Res Commun, 357(1), 319-324.
91
Johnson, G. L., & Nakamura, K. (2007). The c-jun kinase/stress-activated pathway:
regulation, function and role in human disease. Biochim Biophys Acta, 1773(8), 1341-
1348.
Jonsson, T., Atwal, J. K., Steinberg, S., Snaedal, J., Jonsson, P. V., Bjornsson, S.,
Stefansson, H., Sulem, P., Gudbjartsson, D., Maloney, J., Hoyte, K., Gustafson, A., Liu, Y.,
Lu, Y., Bhangale, T., Graham, R. R., Huttenlocher, J., Bjornsdottir, G., Andreassen, O. A.,
Jonsson, E. G., Palotie, A., Behrens, T. W., Magnusson, O. T., Kong, A., Thorsteinsdottir,
U., Watts, R. J., & Stefansson, K. (2012). A mutation in APP protects against Alzheimer's
disease and age-related cognitive decline. Nature, 488(7409), 96-99.
Kang, D. E., Pietrzik, C. U., Baum, L., Chevallier, N., Merriam, D. E., Kounnas, M. Z.,
Wagner, S. L., Troncoso, J. C., Kawas, C. H., Katzman, R., & Koo, E. H. (2000).
Modulation of amyloid beta-protein clearance and Alzheimer's disease susceptibility by
the LDL receptor-related protein pathway. J Clin Invest, 106(9), 1159-1166.
Kitazawa, M., Yamasaki, T. R., & LaFerla, F. M. (2004). Microglia as a potential bridge
between the amyloid beta-peptide and tau. Ann N Y Acad Sci, 1035, 85-103.
Koistinaho, M., Lin, S., Wu, X., Esterman, M., Koger, D., Hanson, J., Higgs, R., Liu, F.,
Malkani, S., Bales, K. R., & Paul, S. M. (2004). Apolipoprotein E promotes astrocyte
colocalization and degradation of deposited amyloid-beta peptides. Nat Med, 10(7), 719-
726.
Koldamova, R., Staufenbiel, M., & Lefterov, I. (2005). Lack of ABCA1 considerably
decreases brain ApoE level and increases amyloid deposition in APP23 mice. J Biol
Chem, 280(52), 43224-43235.
Krimbou, L., Denis, M., Haidar, B., Carrier, M., Marcil, M., & Genest, J., Jr. (2004).
Molecular interactions between apoE and ABCA1: impact on apoE lipidation. J Lipid
Res, 45(5), 839-848.
Kurochkin, I. V., & Goto, S. (1994). Alzheimer's beta-amyloid peptide specifically
interacts with and is degraded by insulin degrading enzyme. FEBS Lett, 345(1), 33-37.
LaDu, M. J., Shah, J. A., Reardon, C. A., Getz, G. S., Bu, G., Hu, J., Guo, L., & Van Eldik,
L. J. (2001). Apolipoprotein E and apolipoprotein E receptors modulate A beta-induced
glial neuroinflammatory responses. Neurochem Int, 39(5-6), 427-434.
92
Laskowitz, D. T., Fillit, H., Yeung, N., Toku, K., & Vitek, M. P. (2006). Apolipoprotein E-
derived peptides reduce CNS inflammation: implications for therapy of neurological
disease. Acta Neurol Scand Suppl, 185, 15-20.
Lee, C. Y., & Landreth, G. E. (2010). The role of microglia in amyloid clearance from the
AD brain. J Neural Transm, 117(8), 949-960.
Lee, C. Y., Tse, W., Smith, J. D., & Landreth, G. E. (2012a). Apolipoprotein E promotes
beta-amyloid trafficking and degradation by modulating microglial cholesterol levels. J
Biol Chem, 287(3), 2032-2044.
Lee, J., Rhee, M. H., Kim, E., & Cho, J. Y. (2012b). BAY 11-7082 Is a Broad-Spectrum
Inhibitor with Anti-Inflammatory Activity against Multiple Targets. Mediators Inflamm,
2012, 416036.
Lehmann, D. J., Refsum, H., Warden, D. R., Medway, C., Wilcock, G. K., & Smith, A. D.
(2011). The vitamin D receptor gene is associated with Alzheimer's disease. Neurosci
Lett, 504(2), 79-82.
Levy, D. E., & Darnell, J. E., Jr. (2002). Stats: transcriptional control and biological
impact. Nat Rev Mol Cell Biol, 3(9), 651-662.
Li, C., Zhao, R., Gao, K., Wei, Z., Yin, M. Y., Lau, L. T., Chui, D., & Hoi Yu, A. C. (2011).
Astrocytes: implications for neuroinflammatory pathogenesis of Alzheimer's disease.
Curr Alzheimer Res, 8(1), 67-80.
Li, W., Zhang, X., & Olumi, A. F. (2007). MG-132 sensitizes TRAIL-resistant prostate
cancer cells by activating c-Fos/c-Jun heterodimers and repressing c-FLIP(L). Cancer
Res, 67(5), 2247-2255.
Liang, K., Yang, L., Yin, C., Xiao, Z., Zhang, J., Liu, Y., & Huang, J. (2010). Estrogen
stimulates degradation of beta-amyloid peptide by up-regulating neprilysin. J Biol
Chem, 285(2), 935-942.
Liu, Q., Wu, W. H., Fang, C. L., Li, R. W., Liu, P., Lei, P., Hu, J., Sun, X., Zheng, Y. Z.,
Zhao, Y. F., & Li, Y. M. (2011). Mapping ApoE/Abeta binding regions to guide inhibitor
discovery. Mol Biosyst, 7(5), 1693-1700.
93
Liu, S., Liu, Y., Hao, W., Wolf, L., Kiliaan, A. J., Penke, B., Rube, C. E., Walter, J., Heneka,
M. T., Hartmann, T., Menger, M. D., & Fassbender, K. (2012). TLR2 is a primary receptor
for Alzheimer's amyloid beta peptide to trigger neuroinflammatory activation. J
Immunol, 188(3), 1098-1107.
Long, J., He, P., Shen, Y., & Li, R. (2012). New evidence of mitochondria dysfunction in
the female Alzheimer's disease brain: deficiency of estrogen receptor-beta. J Alzheimers
Dis, 30(3), 545-558.
Lynch, J. R., Tang, W., Wang, H., Vitek, M. P., Bennett, E. R., Sullivan, P. M., Warner, D.
S., & Laskowitz, D. T. (2003). APOE genotype and an ApoE-mimetic peptide modify the
systemic and central nervous system inflammatory response. J Biol Chem, 278(49),
48529-48533.
Ma, J., Yee, A., Brewer, H. B., Jr., Das, S., & Potter, H. (1994). Amyloid-associated
proteins alpha 1-antichymotrypsin and apolipoprotein E promote assembly of
Alzheimer beta-protein into filaments. Nature, 372(6501), 92-94.
Maezawa, I., Zaja-Milatovic, S., Milatovic, D., Stephen, C., Sokal, I., Maeda, N., Montine,
T. J., & Montine, K. S. (2006). Apolipoprotein E isoform-dependent dendritic recovery
of hippocampal neurons following activation of innate immunity. J Neuroinflammation,
3, 21.
Mahley, R. W. (1988). Apolipoprotein E: cholesterol transport protein with expanding
role in cell biology. Science, 240(4852), 622-630.
Mahley, R. W., Weisgraber, K. H., & Huang, Y. (2009). Apolipoprotein E: structure
determines function, from atherosclerosis to Alzheimer's disease to AIDS. J Lipid Res,
50 Suppl, S183-188.
Mandrekar-Colucci, S., Karlo, J. C., & Landreth, G. E. (2012). Mechanisms Underlying the
Rapid Peroxisome Proliferator-Activated Receptor-gamma-Mediated Amyloid
Clearance and Reversal of Cognitive Deficits in a Murine Model of Alzheimer's
Disease. J Neurosci, 32(30), 10117-10128.
McDevitt, M. A., Glidewell-Kenney, C., Jimenez, M. A., Ahearn, P. C., Weiss, J., Jameson,
J. L., & Levine, J. E. (2008). New insights into the classical and non-classical actions of
estrogen: evidence from estrogen receptor knock-out and knock-in mice. Mol Cell
Endocrinol, 290(1-2), 24-30.
94
McGeer, P. L., Walker, D. G., Pitas, R. E., Mahley, R. W., & McGeer, E. G. (1997).
Apolipoprotein E4 (ApoE4) but not ApoE3 or ApoE2 potentiates beta-amyloid protein
activation of complement in vitro. Brain Res, 749(1), 135-138.
McKee, A. C., Kosik, K. S., & Kowall, N. W. (1991). Neuritic pathology and dementia in
Alzheimer's disease. Ann Neurol, 30(2), 156-165.
McLean, C. A., Cherny, R. A., Fraser, F. W., Fuller, S. J., Smith, M. J., Beyreuther, K.,
Bush, A. I., & Masters, C. L. (1999). Soluble pool of Abeta amyloid as a determinant of
severity of neurodegeneration in Alzheimer's disease. Ann Neurol, 46(6), 860-866.
Minami, S. S., Cordova, A., Cirrito, J. R., Tesoriero, J. A., Babus, L. W., Davis, G. C.,
Dakshanamurthy, S., Turner, R. S., Pak, D., Rebeck, G. W., Paige, M., & Hoe, H. S. (2010).
ApoE mimetic peptide decreases Abeta production in vitro and in vivo. Mol
Neurodegener, 5, 16.
Morikawa, M., Fryer, J. D., Sullivan, P. M., Christopher, E. A., Wahrle, S. E., DeMattos, R.
B., O'Dell, M. A., Fagan, A. M., Lashuel, H. A., Walz, T., Asai, K., & Holtzman, D. M.
(2005). Production and characterization of astrocyte-derived human apolipoprotein E
isoforms from immortalized astrocytes and their interactions with amyloid-beta.
Neurobiol Dis, 19(1-2), 66-76.
Morinaga, A., Ono, K., Takasaki, J., Ikeda, T., Hirohata, M., & Yamada, M. (2011). Effects
of sex hormones on Alzheimer's disease-associated beta-amyloid oligomer formation in
vitro. Exp Neurol, 228(2), 298-302.
Morley, J. E., Farr, S. A., Banks, W. A., Johnson, S. N., Yamada, K. A., & Xu, L. (2010). A
physiological role for amyloid-beta protein:enhancement of learning and memory. J
Alzheimers Dis, 19(2), 441-449.
Morrow, J. A., Hatters, D. M., Lu, B., Hochtl, P., Oberg, K. A., Rupp, B., & Weisgraber, K.
H. (2002). Apolipoprotein E4 forms a molten globule. A potential basis for its
association with disease. J Biol Chem, 277(52), 50380-50385.
Mueller, J. C., Riemenschneider, M., Schoepfer-Wendels, A., Gohlke, H., Konta, L.,
Friedrich, P., Illig, T., Laws, S. M., Forstl, H., & Kurz, A. (2007). Weak independent
association signals between IDE polymorphisms, Alzheimer's disease and cognitive
measures. Neurobiol Aging, 28(5), 727-734.
95
Munoz, L., Ralay Ranaivo, H., Roy, S. M., Hu, W., Craft, J. M., McNamara, L. K., Chico, L.
W., Van Eldik, L. J., & Watterson, D. M. (2007). A novel p38 alpha MAPK inhibitor
suppresses brain proinflammatory cytokine up-regulation and attenuates synaptic
dysfunction and behavioral deficits in an Alzheimer's disease mouse model. J
Neuroinflammation, 4, 21.
Naiki, H., Hasegawa, K., Yamaguchi, I., Nakamura, H., Gejyo, F., & Nakakuki, K. (1998).
Apolipoprotein E and antioxidants have different mechanisms of inhibiting Alzheimer's
beta-amyloid fibril formation in vitro. Biochemistry, 37(51), 17882-17889.
Naslund, J., Thyberg, J., Tjernberg, L. O., Wernstedt, C., Karlstrom, A. R., Bogdanovic, N.,
Gandy, S. E., Lannfelt, L., Terenius, L., & Nordstedt, C. (1995). Characterization of stable
complexes involving apolipoprotein E and the amyloid beta peptide in Alzheimer's
disease brain. Neuron, 15(1), 219-228.
Nowak, K., Lange-Dohna, C., Zeitschel, U., Gunther, A., Luscher, B., Robitzki, A., Perez-
Polo, R., & Rossner, S. (2006). The transcription factor Yin Yang 1 is an activator of
BACE1 expression. J Neurochem, 96(6), 1696-1707.
Ophir, G., Amariglio, N., Jacob-Hirsch, J., Elkon, R., Rechavi, G., & Michaelson, D. M.
(2005). Apolipoprotein E4 enhances brain inflammation by modulation of the NF-
kappaB signaling cascade. Neurobiol Dis, 20(3), 709-718.
Ophir, G., Meilin, S., Efrati, M., Chapman, J., Karussis, D., Roses, A., & Michaelson, D. M.
(2003). Human apoE3 but not apoE4 rescues impaired astrocyte activation in apoE null
mice. Neurobiol Dis, 12(1), 56-64.
Parachikova, A., Agadjanyan, M. G., Cribbs, D. H., Blurton-Jones, M., Perreau, V., Rogers,
J., Beach, T. G., & Cotman, C. W. (2007). Inflammatory changes parallel the early stages
of Alzheimer disease. Neurobiol Aging, 28(12), 1821-1833.
Patterson, C., Feightner, J. W., Garcia, A., Hsiung, G. Y., MacKnight, C., & Sadovnick, A.
D. (2008). Diagnosis and treatment of dementia: 1. Risk assessment and primary
prevention of Alzheimer disease. CMAJ, 178(5), 548-556.
Pauwels, K., Williams, T. L., Morris, K. L., Jonckheere, W., Vandersteen, A., Kelly, G.,
Schymkowitz, J., Rousseau, F., Pastore, A., Serpell, L. C., & Broersen, K. (2012).
Structural basis for increased toxicity of pathological abeta42:abeta40 ratios in
Alzheimer disease. J Biol Chem, 287(8), 5650-5660.
96
Pedersen, W. A., McMillan, P. J., Kulstad, J. J., Leverenz, J. B., Craft, S., & Haynatzki, G.
R. (2006). Rosiglitazone attenuates learning and memory deficits in Tg2576 Alzheimer
mice. Exp Neurol, 199(2), 265-273.
Petrlova, J., Hong, H. S., Bricarello, D. A., Harishchandra, G., Lorigan, G. A., Jin, L. W., &
Voss, J. C. (2011). A differential association of Apolipoprotein E isoforms with the
amyloid-beta oligomer in solution. Proteins, 79(2), 402-416.
Pike, C. J., Carroll, J. C., Rosario, E. R., & Barron, A. M. (2009). Protective actions of sex
steroid hormones in Alzheimer's disease. Front Neuroendocrinol, 30(2), 239-258.
Pocivavsek, A., Burns, M. P., & Rebeck, G. W. (2009a). Low-density lipoprotein receptors
regulate microglial inflammation through c-Jun N-terminal kinase. Glia, 57(4), 444-
453.
Pocivavsek, A., Mikhailenko, I., Strickland, D. K., & Rebeck, G. W. (2009b). Microglial
low-density lipoprotein receptor-related protein 1 modulates c-Jun N-terminal kinase
activation. J Neuroimmunol, 214(1-2), 25-32.
Pocivavsek, A., & Rebeck, G. W. (2009). Inhibition of c-Jun N-terminal kinase increases
apoE expression in vitro and in vivo. Biochem Biophys Res Commun, 387(3), 516-520.
Qiu, Z., Crutcher, K. A., Hyman, B. T., & Rebeck, G. W. (2003). ApoE isoforms affect
neuronal N-methyl-D-aspartate calcium responses and toxicity via receptor-mediated
processes. Neuroscience, 122(2), 291-303.
Rapp, A., Gmeiner, B., & Huttinger, M. (2006). Implication of apoE isoforms in
cholesterol metabolism by primary rat hippocampal neurons and astrocytes. Biochimie,
88(5), 473-483.
Razmara, A., Duckles, S. P., Krause, D. N., & Procaccio, V. (2007). Estrogen suppresses
brain mitochondrial oxidative stress in female and male rats. Brain Res, 1176, 71-81.
Reed-Geaghan, E. G., Reed, Q. W., Cramer, P. E., & Landreth, G. E. (2010). Deletion of
CD14 attenuates Alzheimer's disease pathology by influencing the brain's
inflammatory milieu. J Neurosci, 30(46), 15369-15373.
97
Reed-Geaghan, E. G., Savage, J. C., Hise, A. G., & Landreth, G. E. (2009). CD14 and toll-
like receptors 2 and 4 are required for fibrillar A{beta}-stimulated microglial
activation. J Neurosci, 29(38), 11982-11992.
Reiman, E. M., Chen, K., Liu, X., Bandy, D., Yu, M., Lee, W., Ayutyanont, N., Keppler, J.,
Reeder, S. A., Langbaum, J. B., Alexander, G. E., Klunk, W. E., Mathis, C. A., Price, J. C.,
Aizenstein, H. J., DeKosky, S. T., & Caselli, R. J. (2009). Fibrillar amyloid-beta burden in
cognitively normal people at 3 levels of genetic risk for Alzheimer's disease. Proc Natl
Acad Sci U S A, 106(16), 6820-6825.
Riddell, D. R., Zhou, H., Atchison, K., Warwick, H. K., Atkinson, P. J., Jefferson, J., Xu, L.,
Aschmies, S., Kirksey, Y., Hu, Y., Wagner, E., Parratt, A., Xu, J., Li, Z., Zaleska, M. M.,
Jacobsen, J. S., Pangalos, M. N., & Reinhart, P. H. (2008). Impact of apolipoprotein E
(ApoE) polymorphism on brain ApoE levels. J Neurosci, 28(45), 11445-11453.
Roses, A. D. (1996). Apolipoprotein E alleles as risk factors in Alzheimer's disease. Annu
Rev Med, 47, 387-400.
Scheuner, D., Eckman, C., Jensen, M., Song, X., Citron, M., Suzuki, N., Bird, T. D., Hardy,
J., Hutton, M., Kukull, W., Larson, E., Levy-Lahad, E., Viitanen, M., Peskind, E., Poorkaj,
P., Schellenberg, G., Tanzi, R., Wasco, W., Lannfelt, L., Selkoe, D., & Younkin, S. (1996).
Secreted amyloid beta-protein similar to that in the senile plaques of Alzheimer's
disease is increased in vivo by the presenilin 1 and 2 and APP mutations linked to
familial Alzheimer's disease. Nat Med, 2(8), 864-870.
Schwab, C., Klegeris, A., & McGeer, P. L. (2010). Inflammation in transgenic mouse
models of neurodegenerative disorders. Biochim Biophys Acta, 1802(10), 889-902.
Sharman, M. J., Morici, M., Hone, E., Berger, T., Taddei, K., Martins, I. J., Lim, W. L.,
Singh, S., Wenk, M. R., Ghiso, J., Buxbaum, J. D., Gandy, S., & Martins, R. N. (2010).
APOE genotype results in differential effects on the peripheral clearance of amyloid-
beta42 in APOE knock-in and knock-out mice. J Alzheimers Dis, 21(2), 403-409.
Shibata, M., Yamada, S., Kumar, S. R., Calero, M., Bading, J., Frangione, B., Holtzman, D.
M., Miller, C. A., Strickland, D. K., Ghiso, J., & Zlokovic, B. V. (2000). Clearance of
Alzheimer's amyloid-ss(1-40) peptide from brain by LDL receptor-related protein-1 at
the blood-brain barrier. J Clin Invest, 106(12), 1489-1499.
Siddiquee, K., Zhang, S., Guida, W. C., Blaskovich, M. A., Greedy, B., Lawrence, H. R.,
Yip, M. L., Jove, R., McLaughlin, M. M., Lawrence, N. J., Sebti, S. M., & Turkson, J.
(2007). Selective chemical probe inhibitor of Stat3, identified through structure-based
98
virtual screening, induces antitumor activity. Proc Natl Acad Sci U S A, 104(18), 7391-
7396.
Soscia, S. J., Kirby, J. E., Washicosky, K. J., Tucker, S. M., Ingelsson, M., Hyman, B.,
Burton, M. A., Goldstein, L. E., Duong, S., Tanzi, R. E., & Moir, R. D. (2010). The
Alzheimer's disease-associated amyloid beta-protein is an antimicrobial peptide. PLoS
One, 5(3), e9505.
Strittmatter, W. J., Weisgraber, K. H., Huang, D. Y., Dong, L. M., Salvesen, G. S., Pericak-
Vance, M., Schmechel, D., Saunders, A. M., Goldgaber, D., & Roses, A. D. (1993). Binding
of human apolipoprotein E to synthetic amyloid beta peptide: isoform-specific effects
and implications for late-onset Alzheimer disease. Proc Natl Acad Sci U S A, 90(17),
8098-8102.
Struble, R. G., Nathan, B. P., Cady, C., Cheng, X., & McAsey, M. (2007). Estradiol
regulation of astroglia and apolipoprotein E: an important role in neuronal
regeneration. Exp Gerontol, 42(1-2), 54-63.
Sun, A., Liu, M., Nguyen, X. V., & Bing, G. (2003). P38 MAP kinase is activated at early
stages in Alzheimer's disease brain. Exp Neurol, 183(2), 394-405.
Tamamizu-Kato, S., Cohen, J. K., Drake, C. B., Kosaraju, M. G., Drury, J., &
Narayanaswami, V. (2008). Interaction with amyloid beta peptide compromises the lipid
binding function of apolipoprotein E. Biochemistry, 47(18), 5225-5234.
Thal, D. R. (2012). The role of astrocytes in amyloid beta-protein toxicity and clearance.
Exp Neurol, 236(1), 1-5.
Tichauer, J. E., & von Bernhardi, R. (2012). Transforming growth factor-beta stimulates
beta amyloid uptake by microglia through Smad3-dependent mechanisms. J Neurosci
Res, 90(10), 1970-1980.
Tokuda, T., Calero, M., Matsubara, E., Vidal, R., Kumar, A., Permanne, B., Zlokovic, B.,
Smith, J. D., Ladu, M. J., Rostagno, A., Frangione, B., & Ghiso, J. (2000). Lipidation of
apolipoprotein E influences its isoform-specific interaction with Alzheimer's amyloid
beta peptides. Biochem J, 348 Pt 2, 359-365.
Tsoi, L. M., Wong, K. Y., Liu, Y. M., & Ho, Y. Y. (2007). Apoprotein E isoform-
dependent expression and secretion of pro-inflammatory cytokines TNF-alpha and IL-
6 in macrophages. Arch Biochem Biophys, 460(1), 33-40.
99
Udan, M. L., Ajit, D., Crouse, N. R., & Nichols, M. R. (2008). Toll-like receptors 2 and 4
mediate Abeta(1-42) activation of the innate immune response in a human monocytic
cell line. J Neurochem, 104(2), 524-533.
Vassar, R., Bennett, B. D., Babu-Khan, S., Kahn, S., Mendiaz, E. A., Denis, P., Teplow, D.
B., Ross, S., Amarante, P., Loeloff, R., Luo, Y., Fisher, S., Fuller, J., Edenson, S., Lile, J.,
Jarosinski, M. A., Biere, A. L., Curran, E., Burgess, T., Louis, J. C., Collins, F., Treanor, J.,
Rogers, G., & Citron, M. (1999). Beta-secretase cleavage of Alzheimer's amyloid
precursor protein by the transmembrane aspartic protease BACE. Science, 286(5440),
735-741.
Vella, L. J., & Cappai, R. (2012). Identification of a novel amyloid precursor protein
processing pathway that generates secreted N-terminal fragments. FASEB J, 26(7),
2930-2940.
Vitek, M. P., Brown, C. M., & Colton, C. A. (2009). APOE genotype-specific differences
in the innate immune response. Neurobiol Aging, 30(9), 1350-1360.
Vukic, V., Callaghan, D., Walker, D., Lue, L. F., Liu, Q. Y., Couraud, P. O., Romero, I. A.,
Weksler, B., Stanimirovic, D. B., & Zhang, W. (2009). Expression of inflammatory genes
induced by beta-amyloid peptides in human brain endothelial cells and in Alzheimer's
brain is mediated by the JNK-AP1 signaling pathway. Neurobiol Dis, 34(1), 95-106.
Wahrle, S. E., Jiang, H., Parsadanian, M., Hartman, R. E., Bales, K. R., Paul, S. M., &
Holtzman, D. M. (2005). Deletion of Abca1 increases Abeta deposition in the PDAPP
transgenic mouse model of Alzheimer disease. J Biol Chem, 280(52), 43236-43242.
Wahrle, S. E., Jiang, H., Parsadanian, M., Kim, J., Li, A., Knoten, A., Jain, S., Hirsch-
Reinshagen, V., Wellington, C. L., Bales, K. R., Paul, S. M., & Holtzman, D. M. (2008).
Overexpression of ABCA1 reduces amyloid deposition in the PDAPP mouse model of
Alzheimer disease. J Clin Invest, 118(2), 671-682.
Wahrle, S. E., Jiang, H., Parsadanian, M., Legleiter, J., Han, X., Fryer, J. D., Kowalewski,
T., & Holtzman, D. M. (2004). ABCA1 is required for normal central nervous system
ApoE levels and for lipidation of astrocyte-secreted apoE. J Biol Chem, 279(39), 40987-
40993.
Wahrle, S. E., Shah, A. R., Fagan, A. M., Smemo, S., Kauwe, J. S., Grupe, A., Hinrichs, A.,
Mayo, K., Jiang, H., Thal, L. J., Goate, A. M., & Holtzman, D. M. (2007). Apolipoprotein E
levels in cerebrospinal fluid and the effects of ABCA1 polymorphisms. Mol
Neurodegener, 2, 7.
100
Walsh, D. M., Klyubin, I., Fadeeva, J. V., Cullen, W. K., Anwyl, R., Wolfe, M. S., Rowan,
M. J., & Selkoe, D. J. (2002). Naturally secreted oligomers of amyloid beta protein
potently inhibit hippocampal long-term potentiation in vivo. Nature, 416(6880), 535-
539.
Walter, S., Letiembre, M., Liu, Y., Heine, H., Penke, B., Hao, W., Bode, B., Manietta, N.,
Walter, J., Schulz-Schuffer, W., & Fassbender, K. (2007). Role of the toll-like receptor 4 in
neuroinflammation in Alzheimer's disease. Cell Physiol Biochem, 20(6), 947-956.
Wan, J., Fu, A. K., Ip, F. C., Ng, H. K., Hugon, J., Page, G., Wang, J. H., Lai, K. O., Wu, Z.,
& Ip, N. Y. (2010). Tyk2/STAT3 signaling mediates beta-amyloid-induced neuronal cell
death: implications in Alzheimer's disease. J Neurosci, 30(20), 6873-6881.
Wang, T. T., Tavera-Mendoza, L. E., Laperriere, D., Libby, E., MacLeod, N. B., Nagai, Y.,
Bourdeau, V., Konstorum, A., Lallemant, B., Zhang, R., Mader, S., & White, J. H. (2005).
Large-scale in silico and microarray-based identification of direct 1,25-
dihydroxyvitamin D3 target genes. Mol Endocrinol, 19(11), 2685-2695.
Wisniewski, T., Castano, E. M., Golabek, A., Vogel, T., & Frangione, B. (1994).
Acceleration of Alzheimer's fibril formation by apolipoprotein E in vitro. Am J Pathol,
145(5), 1030-1035.
Wood, S. J., Chan, W., & Wetzel, R. (1996). Seeding of A beta fibril formation is
inhibited by all three isotypes of apolipoprotein E. Biochemistry, 35(38), 12623-12628.
Xu, J., Chavis, J. A., Racke, M. K., & Drew, P. D. (2006). Peroxisome proliferator-
activated receptor-alpha and retinoid X receptor agonists inhibit inflammatory
responses of astrocytes. J Neuroimmunol, 176(1-2), 95-105.
Yang, J., Ji, Y., Mehta, P., Bates, K. A., Sun, Y., & Wisniewski, T. (2011). Blocking the
apolipoprotein E/amyloid-beta interaction reduces fibrillar vascular amyloid deposition
and cerebral microhemorrhages in TgSwDI mice. J Alzheimers Dis, 24(2), 269-285.
Ye, S., Huang, Y., Mullendorff, K., Dong, L., Giedt, G., Meng, E. C., Cohen, F. E., Kuntz, I.
D., Weisgraber, K. H., & Mahley, R. W. (2005). Apolipoprotein (apo) E4 enhances
amyloid beta peptide production in cultured neuronal cells: apoE structure as a
potential therapeutic target. Proc Natl Acad Sci U S A, 102(51), 18700-18705.
101
Yvan-Charvet, L., Wang, N., & Tall, A. R. (2010). Role of HDL, ABCA1, and ABCG1
transporters in cholesterol efflux and immune responses. Arterioscler Thromb Vasc Biol,
30(2), 139-143.
Zhang, K. J., Zhang, H. L., Zhang, X. M., Zheng, X. Y., Quezada, H. C., Zhang, D., & Zhu,
J. (2011). Apolipoprotein E isoform-specific effects on cytokine and nitric oxide
production from mouse Schwann cells after inflammatory stimulation. Neurosci Lett,
499(3), 175-180.
Zhao, L., Lin, S., Bales, K. R., Gelfanova, V., Koger, D., Delong, C., Hale, J., Liu, F.,
Hunter, J. M., & Paul, S. M. (2009). Macrophage-mediated degradation of beta-amyloid
via an apolipoprotein E isoform-dependent mechanism. J Neurosci, 29(11), 3603-3612.
Zhu, X., Lee, J. Y., Timmins, J. M., Brown, J. M., Boudyguina, E., Mulya, A., Gebre, A. K.,
Willingham, M. C., Hiltbold, E. M., Mishra, N., Maeda, N., & Parks, J. S. (2008). Increased
cellular free cholesterol in macrophage-specific Abca1 knock-out mice enhances pro-
inflammatory response of macrophages. J Biol Chem, 283(34), 22930-22941.
Zhu, Y., Kodvawala, A., & Hui, D. Y. (2010). Apolipoprotein E inhibits toll-like receptor
(TLR)-3- and TLR-4-mediated macrophage activation through distinct mechanisms.
Biochem J, 428(1), 47-54.
Zhu, Y., Nwabuisi-Heath, E., Dumanis, S. B., Tai, L. M., Yu, C., Rebeck, G. W., & LaDu,
M. J. (2012). APOE genotype alters glial activation and loss of synaptic markers in
mice. Glia, 60(4), 559-569.