Embed Size (px)
Citation preview

Computer Applications in Mining Industry


The 19th International Mining Congress and Fair of Turkey, IMCET2005, İzmir, Turkey, June 09-12, 2005
Computer Aided Evaluation of a Magnesite Ore Body
K.Erarslan Dumlupinar University, Department of Mining Engineering, 43100, Kütahya, Turkey
ABSTRACT: The geology and mining system (JMS) is a computer aided valuation system capable of generation of survey, stratigraphy, assay databases, drill hole and bench compositing, 2D and 3D log sectioning, contouring, 3D surface generation, cross-sectioning, 3D ore body modeling, designing of open pit, volume and reserve estimation and economical valuation. In this research, JMS is applied in evaluation of a magnesite ore body in Kütahya, Turkey. Thirty-seven drill holes are used to build a collar, geology and assay databases. Basic statistical analyses are followed by drill hole and bench composite calculations. Besides, variogram models of thickness and grade are generated. Topographical elevation, ore thickness and grade contours are drawn as well as 3D surfaces. Ore body is also modeled in 3D and reserve amount is estimated. Regarding ore extensions, an open pit is designed in which pit volume and included ore are also calculated. 1 INTRODUCTION
Computer aided valuation and mine design systems provide great facilities in project development and planning. There are many commercial software systems integrating geological assessment and mine planning and design utilities (Surpac, 2003; MineSight, 2003; Gemcom, 2003; GDM, 2003; Techbase, 2003; Datamine 2003; Lynx Mining, 2003; Minex, 2003). The Geology and Mining System (JMS) is a new program package for mine valuation and design, including fundamental functions of commercial systems (Erarslan, 2003). This system has been developed for educational purposes. However, it provides the utilities to some extent that widely used systems provide (Fig.l).
Figure 1. Cover of the JMS 1.0 (Erarslan, 2003)
Main functions of the JMS for open pit mine fields are given below: - Drill hole database building including topography,
stratigraphy, and assay databases, - Drill hole and bench compositing, - Drill hole log sectioning and three dimensional
drill hole sections, - Topography, thickness and grade contouring, - Three dimensional surface modeling, - Taking parallel sections through surfaces, - Three dimensional ore body modeling, - Volume and reserve calculations by several
methods, - Basic statistics and variogram modeling, - Open pit design, - Calculating excavator-truck fleet and dragline
bench dimensions, - Economical assessments (such that net present
value, future worth, etc.). Graphical outputs of the system are displayed in
drafting packages such as AutoCAD, 3D Studio MAX, Bryce, etc.
In general speaking, the system provides computer aided valuation of geological data. Geostatistics, inverse distance square methods are employed for spatial data estimation.
The JMS field application is realized in the valuation of a magnesite field in Kütahya, Turkey.
269

K.Erarslan
2 DESCRIPTION OF GEOLOGY AND MINING SYSTEM (JMS)
Reliability of a valuation system is strictly related with a correct database. The JMS has an easy and practical database generation utility (Fig. 2).
Figure 2 Database generation utility of the JMS.
Drill holes collar coordinates, lithological data, and assay values are recorded in different files.
In the system, compositing are performed both along drill hole and bench levels. Bench composites are also the base for ore body block modeling.
Drill hole sections could be taken entirely in 3D or hole by hole in 2D. Besides, the JMS enables drawing of contour maps of topography, ore thickness, grade and any other parameter that user desires as well as drill holes location maps.
The system provides three dimensional surface drawing utility (Fig.3). Topography, thickness, grade surfaces could be visualized as well as surface of any other parameter defined by user. Successive cross-sections could also be taken through a particular direction. In case of having a vein type ore body, geological cross-sections could also be taken.
The JMS provides three dimensional ore body modeling ability. This could be realized by combining successive parallel geological cross-sections or block modeling (Fig.4). Block modeling is based on bench composites while geological sections could be determined in the section editor of the JMS. Both approaches give volume icport about ore body.
Figure 3 Three dimensional surface modeling
Figure 4. Block modeling utility of the JMS.
The system estimates ore volume and reserve by using several methods. Volume between geological sections, volume by average ore thickness and ore body limits area, block model volume and volume by grid polygons are approaches used in volume and reserve estimation.
The JMS provides basic statistics about drill holes, ore thickness and grade. Besides that, variogram model could also be developed. Open pit design is another utility provided by the JMS (Fig.5).
Figure 5. Open pit design uuhty.
After studying contour maps, 3D models and ore limits, a pit base could be introduced to the system by the polygon editor. It is also available that open pit and ore body could be displayed together so that design of pit could be examined (Fig.6).
270

The 19th International Mining Congress and Fair of Turkey, IMCET2005, İzmir, Turkey, June 09-12, 2005
Figure 6 Open pit and ore body.
Besides, the JMS provides utilities for computation of blasting holes geometry, excavator-truck numbers and dragline bench dimensions. Additionally, basic economical assessments could also be performed on mine projects by calculation of net present value, future value, annual value and project rate of return (Erarslan, 2003).
3 USING JMS FOR MAGNESITE ORE BODY
The JMS is applied to a magnesite ore body in Kütahya, Turkey. Collar, stratigraphy and assay data of 37 drill holes with were used to build the database. The drill holes are located along Southwest to North-East.
The statistics utility of the system reports the total depth of drill holes as 2216m. Minimum and maximum values for coordinates, thickness and grade and Skewness and Kurtosis values are also reported. Additionally, histograms are drawn for grade and thickness (Fig. 7).
Basic Statistical assessments are supported by geostatistical valuation. Variogram models for topographical elevations of drill holes, ore thickness and grade are developed (Fig. 8).
Radius of influence is estimated to be 120m within an isotropic structure regarding the variogram model. This radius is used in estimation of several parameters at grid nodes and blocks. Estimation method is inverse distance square interpolation.
As well as each drill log could be represented with collar, stratigraphy and assay details, all drill logs could also be represented in three dimensions (Fig. 9).
Figure 8. Variogram modeling
Figure 9 Drill logs in three dimensions.
The contour maps of topography, thickness and grade are drawn. The maps are shown in Figure 10 successively.
Figure 7. Histograms of grade (upper) and thickness
271

KErarslan
Figure 10 Topographical, thickness and grade contour maps
Topographical contours are ranged between 992 to 1026m, while thickness varies between 1 to 20m and grade changes from 80% to 90% Contour maps are also supported by three dimensional surfaces (Fig 11)
Figure 11 Topographical surface
Following surface generation, parallel surface sections and geological sections are taken (Fig 12)
Figure 12 Geological sections in y (Noıth)-dırectıon
Three dimensional modeling of ore body is crucial in valuation Hence, ore model of the magnesite body is also generated and visualized (Fig 13)
Figure 13 Ore body block model
Regarding ore limits, a pit is designed with 10m bench height and 70° bench slope angle (Fig 14)
Figure 14 Open pit design
Generated pit and ore body model are represented together to observe their interaction (Fig 15)
Figure 15 Open pit and ore body block model
Besides, numerical results are handled, too Using variogram modeling, radius of influence is found to be 120m The area that ore body extends is 359978 53m2 Average ore thickness is 5 31m Volume of ore body is estimated as 1,485,045 75m3
by block model method, 1,909,886 00m3 by ore limits area and average thickness approach and 1,820,971 12m3 by grid polygons (100x100) method
272

The 19th International Mining Congress and Fair of Turkey, IMCET2005, İzmir, Turkey, June 09-12, 2005
4. CONCLUSION
In this study, the JMS software package for mine valuation and design is applied to a magnesite field in Kütahya, Turkey. Thirty seven drill holes are used to generate the database. Holes logs are drawn one by one in two dimensions and entirely in three dimensions. Drill hole and bench composites are calculated. Contour maps of topography, thickness and grade are drawn as well as three dimensional surface generation and cross-sectioning through mem. Besides, following the three dimensional ore body block modeling, open pit is designed. Ore volume and reserve are calculated by several methods.
NOTE: The JMS (Turkish Version) is available at http://mf.dumlupinar.edu.tr/JMS
REFERENCES
Datamine, 2003. Datamine Studio v. 2, Catena Systems, Wells, United Kingdom, www.datamine.co.uk
Erarslan, K., 2003. "The Geology and Mining System (JMS) and Valuation of a Copper Field", The Journal of Chamber of Mining Engineers of Turkey, Vol. 42, No.4, pp. 3-14.
GDM, 2003. BRGM International Division, Orléans Cedex, France, www.brgm.fr
GemCom, 2003. GEMCOM, Inc., Canada. www.gemcomsoftware.com
Lynx Mining, 2003. MicroLynx Systems, Qld, Australia. www.lynxmining.corn.au
MineSight, 2003. MinTech, Inc., Tucson, Arizona, USA. www.mintec.com
Minex, 2003. ECS Minex Mining System v. 4, Denver, USA, www.minex.com
Surpac Vision, 2003. Surpac Software International Ltd., United Kingdom, www.surpac.com
Techbase, 2003. Techbase International, Lakewood, Colorado, USA. www.techbase.com
273


The 19th International Mining Congress and Fair of Turkey 1MCET2005 Izmir Turkey June 09 12 2005
The Future of Mine Planning Software - New Tools and Innovations
IK Kapagendis Department of Geotechnology and Environmental Engineering, School of Technological Applications, Technological Education Institute of Wat Macedonia, Kozanı, Greece
ABSTRACT: Modern mine planning software plays a crucial role in the operation of many of the world's mining operations and projects Mine planning software provides the mining industry with a fast, accurate, cost effective and efficient tool in order to manage their business interests worldwide Every aspect of the mining industry is today using some form of mine planning software From exploration to rehabilitation, the use of software is becoming more and more widespread
Mine planning software companies are constantly under pressure to evolve products to meet new challenges and solve new problems Development of software is a result of both programming foresight and reaction to industry demands Without mining industry feedback, many of the products now available would probably not have been developed Mining software is an extremely competitive market which constantly drives the levels of development to new heights This paper discusses some of the most important new tools and technologies in corporated in modern mine planning software and presents potential areas of improvement and further development
1 INTRODUCTION
1.1 Mine Planning Software -Review
A Historical
Mine planning and design software packages have been around for some time Application of these packages has greatly improved the quality of designs as well as the overall economics throughout the rmn mg process (Kaiser, et al, 2002)
The evolution of mine planning software started towards the late 70's across the world with a clear focus in operative gold mines where it was crucial to avoid any wasteful mining Many of the current packages were initiated by existing mining companies or were off-loaded to universities as research projects (Ray, 2000) Competitive market pressures ensured that 3rd party software maintained a clear technological and functional advantage over in-house systems Most major mining groups have abandoned in house development in favor of commercial software
In the last couple of decades, an increasing number of companies, engaged in the extraction of minerals throughout the world, have embraced the use of modern mine planning software A great deal of historical information and data has been fed to such software to build large databases and models in exist mg mines The first direct benefit was simply the use
of largely unutilized information, and the validation of data that has been used in the past
The 3D modeling capabilities of mine planning software became extremely important in assessing the environmental impact of new developments
1.2 Modern Packages
There are a number of software products on the market today covering a large range of capabilities Many packages are aimed at one particular market, such as database management and surveying Others concentrate on CAD functionality However, over the past couple of decades, a number of software packages have evolved to carry out most of the func tionality required on an operation or project The standard functionality carried out by these packages includes
• Visualisation • Modelling • Database Management • Reserve Calculation • Mine Design • Mme Planning
The development of mine planning software has gone through many changes in hardware compatibility, software tools and users expectations These changes have impacted on management decisions as
275

l.K. Kapageridis
to the most cost effective approach to providing the users the applications they need. The major objective remained the same throughout this development: to provide users with tools that allow quick and accurate management and assessment of the value and risk associated with the exploration, feasibility and production of mineral resources.
With the increasing range and sophistication of the applications, the development and management of the software requires a greater level of coordination than the simpler non-integrated systems of some decades ago. Professional development of the software by dedicated teams of software engineers is essential to the production of software that satisfies users' expectations.
2 STRUCTURE OF MINE PLANNING SOFTWARE
2.1 Modularity
It is a common trend in most of the advanced mine planning software packages to have a modular structure. Usually there is a core program that controls other modules and enables communication of information and data between them. In some cases, this core program also incorporates the graphical environment.
Several modules are normally available, each with specialized functionality. Such modules can include:
• Samples database editor, • Geological interpretation and modeling, • Statistics and geostatistics « Grid modeling editor • Block modeling editor » Reserving module • Open pit design • Underground design • Open pit optimizer • Production Scheduler • Production Schedule Optimizer • Plotting utility
Other more specialized modules can include groundwater and geotechnical modeling, surveying, and ventilation. This architecture provides a range of functionality including:
• A powerful, intuitive and interactive user interface, which minimizes user requirements to understand the workings of the computer and maximizes user ability to get close to their data and the models produced.
• A full range of sophisticated estimation and modeling algorithms for geological interpretation.
• A wide variety of mine design tools that generate the layout of the pit, analyze the eco
nomic limits, analyze slope conditions, plan ventilation requirements etc.
• Operational controls and monitoring systems are linked to design steps for areas such as survey, grade control, slope monitoring, truck dispatch etc.
2.2 Graphical Environments
A very important part of today's mine planning software, the graphical environment controls all aspects of visualization and graphical editing and analysis of data. Information from various sources such as samples databases, vector data (strings), block models, etc. are visualized in 3D within the graphical environment. Most of the on-screen interaction with the user is provided through this environment and for this reason most of the user friendliness of the entire package is defined here.
Any weakness of the graphical environment can render a very advanced mine planning package almost useless in the hands of an inexperienced user. Conversely, a powerful graphical environment can help an inexperienced user be more productive and significantly decrease the time required to build the necessary skills and expertise in computer aided mine planning.
Communication of visual information is always the most successful way to interact with other professionals and this adds to the significance of the graphical environment. Inherent complexities of three-dimensional data can be viewed with a true sense of depth and spatial relationship.
Most of today's mine planning software is based on well established visual technologies such as OpenGL (SGI), DirectX (Microsoft) or Java (Sun). The graphical environments benefit from the development of these technologies and become more stable and user friendly.
2.3 File Structures and Dato Exchange
In the minerals industries, data comes from many different sources each of a distinct nature, such as drill logs, assay data, survey data, production statistics or real time equipment locations. Somewhere in its useful life data will be transferred between computer systems, even if it is only across an office, but commonly between two different software packages. The time wasted undertaking simple data transfer operations can be staggering (Jonkman and Savage, 1989). The few attempts made to create data transfer standards failed to gain universal acceptance and utilization (Hunter and Müller, 1990).
The use of AutoCAD (Autodesk Inc.) has become so widespread world-wide for architectural and surveying applications that the AutoCAD Drawing Exchange Format (DXF) has become the standard for
276

The 19th International Mining Congress and Fair of Turkey, IMCET2005, İzmir, Turkey, June 09-12, 2005
2D and 3D data exchange. Unfortunately, the DXF format itself is anything but standard and îs constantly evolving, thus becoming a development issue for most of today's mine planning software.
2A Model Structures
There is a number of existing model structures used in mine planning software, such as grid and block models, triangulations (open and closed), and vector based models usually in the form of strings. The basic assumptions made by these models remained constant throughout the years of development. What changed is their flexibility and adjustability to more complex and realistic geological and extraction scenarios.
Grid models have evolved from simple arrays of nodes to complex structures that contain complex masking, faulting and other geometrical alterations. Block models, in particular, have become extremely large with sub-blocking capabilities that can match any geologist's desire for detail in following geological structures in three dimensions. The number of variables contained in the blocks also keeps increasing.
Triangulation models remained the same in their structure. However, major progress has been made in the way these models are visualized. Many of the advanced visual effects existing in Virtual Reality environments have found their way into modern mine planning software.
2.5 Algorithms
A modern mine planning package can contain an extremely large number of different algorithms providing the basis for most of its functionality. From geo-statistics to pit optimization and from triangulation model editing to mine reserves calculations, the integrated algorithms bring to the users a range of options that define the levels of automation, functionality and user friendliness. Generally, the presence of certain algorithms and their sophistication can control the time required to achieve a certain modeling step or to edit an existing model. All this is hidden behind the GUI and users commonly take for granted what required years of research and money in the making.
Some of the advanced triangulation modeling and CAD algorithms that can be found in today's mine planning software are practically non-existent even in advanced VR modeling packages. The increased complexity of the entities modeled in the minerals industry is what drives most of the algorithm development. Clearly, modeling a car or a building is not as complex as trying to model a faulted orebody or a complex open pit with multiple ramps. The financial and safety consequences of the modeling process in
the mine planning case can also be much more severe, adding to the drive for better and more sophisticated algorithms.
2.6 User Interface and Interactivity
Effective user interfaces reduce the amount of training required for a new user, however there will always be a significant training or learning overhead with all mine planning software packages. Computers often bring more effective working methods but they also bring change, and this requires careful management.
Much progress has been made in the area of user interfaces for office computing, as can be evidenced by the success of the WIMP (windows, icons, mouse, pull-down menus) style of interface but there is still a long way to go before we reach optimum human-computer interaction.
Users of mine planning software come from different fields and have very different perceptions as to how computers work (or should work) and this is why user interfaces must be adaptive and customizable. Serious efforts have been made in the last few years but there is still a lot to be done. As an indication of what is available to users regarding user interface customization we mention the following available functions that can be found in some of the most sophisticated mine planning packages:
• Customized toolbars: users can create new toolbars combining existing functionality that they use more frequently. This can also include extended functionality provided through scripts. Custom icons can be chosen and used to represent functionality through scripts.
• Context menus: different options that depend on the object/model that is being edited can be chosen to be accessed through simple mouse or keyboard keys.
• Customized GUI layout: users can change the position of toolbars, the size and position of the various windows.
» Customized GUI behavior: users can change the way the GUI operates. For example, in VULCAN following a certain operation, the GUI can open the same pull-down menu that was used to access the particular function.
• History menu options: users can access using the mouse or a special toolbar a certain number of the last menu options that they used. This is very useful when repeating similar modeling steps.
In addition to this specialized customization functionality, most of the functionality available through the hosting operating system/GUI (Microsoft Windows for example) is available to the user of a mine planning package.
277
l.K. Kapageridis
3 NEW TOOLS FOR OLD PROBLEMS
The progress made by mine planning software in the recent years is evident in several areas of software development and operation. The most important areas of development are highlighted in the following paragraphs.
3.1 User/Software Interaction
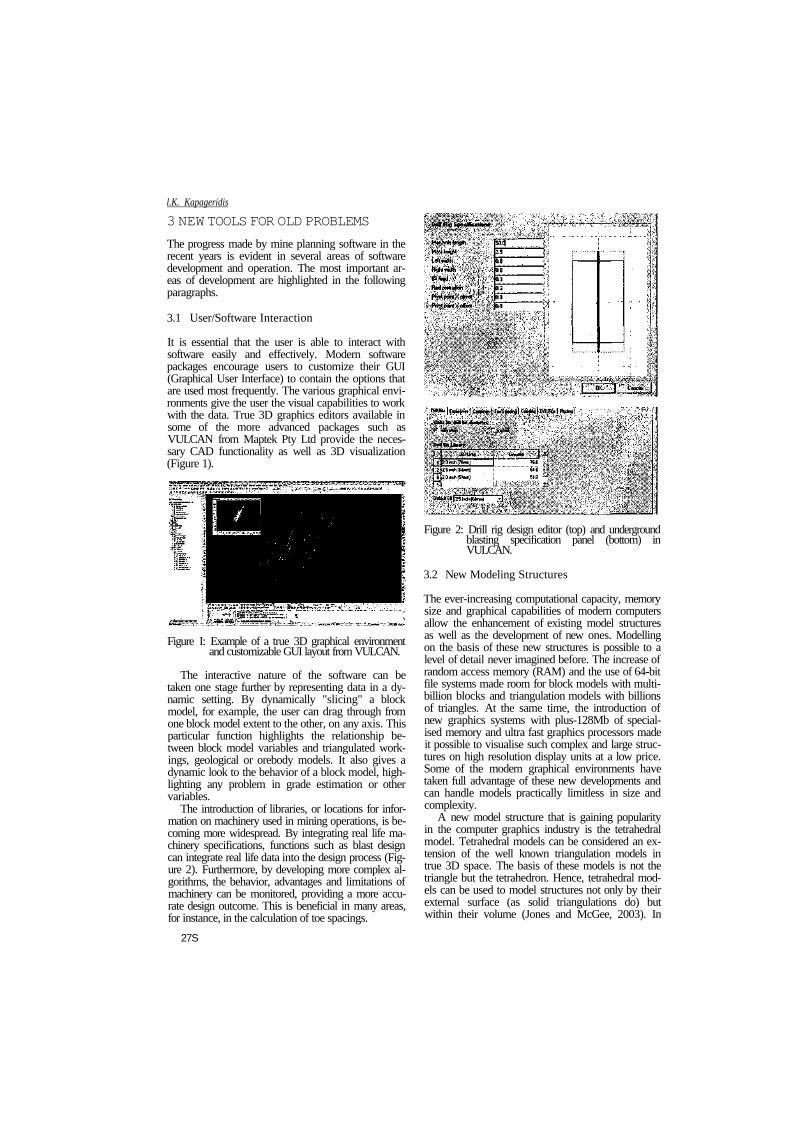
It is essential that the user is able to interact with software easily and effectively. Modern software packages encourage users to customize their GUI (Graphical User Interface) to contain the options that are used most frequently. The various graphical environments give the user the visual capabilities to work with the data. True 3D graphics editors available in some of the more advanced packages such as VULCAN from Maptek Pty Ltd provide the necessary CAD functionality as well as 3D visualization (Figure 1).
Figure I: Example of a true 3D graphical environment and customizable GUI layout from VULCAN.
The interactive nature of the software can be taken one stage further by representing data in a dynamic setting. By dynamically "slicing" a block model, for example, the user can drag through from one block model extent to the other, on any axis. This particular function highlights the relationship between block model variables and triangulated workings, geological or orebody models. It also gives a dynamic look to the behavior of a block model, highlighting any problem in grade estimation or other variables.
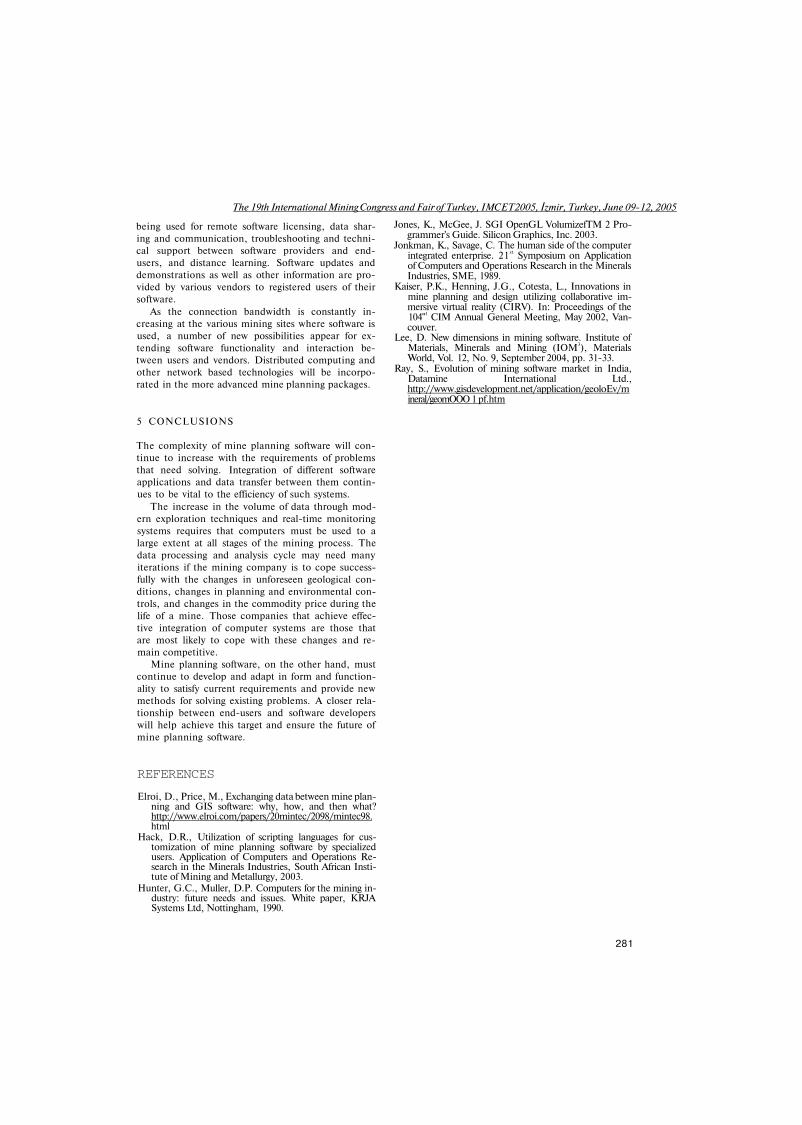
The introduction of libraries, or locations for information on machinery used in mining operations, is becoming more widespread. By integrating real life machinery specifications, functions such as blast design can integrate real life data into the design process (Figure 2). Furthermore, by developing more complex algorithms, the behavior, advantages and limitations of machinery can be monitored, providing a more accurate design outcome. This is beneficial in many areas, for instance, in the calculation of toe spacings.
Figure 2: Drill rig design editor (top) and underground blasting specification panel (bottom) in VULCAN.
3.2 New Modeling Structures
The ever-increasing computational capacity, memory size and graphical capabilities of modern computers allow the enhancement of existing model structures as well as the development of new ones. Modelling on the basis of these new structures is possible to a level of detail never imagined before. The increase of random access memory (RAM) and the use of 64-bit file systems made room for block models with multi-billion blocks and triangulation models with billions of triangles. At the same time, the introduction of new graphics systems with plus-128Mb of specialised memory and ultra fast graphics processors made it possible to visualise such complex and large structures on high resolution display units at a low price. Some of the modern graphical environments have taken full advantage of these new developments and can handle models practically limitless in size and complexity.
A new model structure that is gaining popularity in the computer graphics industry is the tetrahedral model. Tetrahedral models can be considered an extension of the well known triangulation models in true 3D space. The basis of these models is not the triangle but the tetrahedron. Hence, tetrahedral models can be used to model structures not only by their external surface (as solid triangulations do) but within their volume (Jones and McGee, 2003). In
27S

The 19th International Mining Congress and Fair of Turkey, IMCET2005, İzmir, Turkey, June 09-12, 2005
VULCAN, the Tetra Modelling module utilises the tetrahedral model to perform structural analysis (variography) and grade estimation in structurally deformed ore bodies (Figure 3).
Figure 3: Grade estimation on a block model basis following a tetrahedral model of the ore body deformation. (Screenshot from VULCAN)
As mentioned above, the size of block models being created depends on the capabilities of both the hardware and the software design. The capabilities of modern hardware continue to expand at a large rate. Therefore, mining software must take advantage of this continual advance to push the limits and extents of modeling capabilities. This also applies to database functionality, allowing larger and more complex databases to be created and utilized at ever faster speeds and accuracy.
3.3 Extending Functionality through Scripting
Several scripting languages have been developed in the computer industry enabling advanced users to automate repetitive tasks and software producers to rapidly respond to new functionality demands. Perl, Tel and Python are the most common examples of scripting languages adopted by today's mining software. These scripting languages are usually extended to include more specialized functionality and give users access to the various file types and model structures available with the mine planning software. A very good example is VULCAN software's Lava scripting language - an extension of the very well established Perl language. Lava enables the user to construct simple to very advanced programs that build upon the existing functionality of VULCAN. The user can access all data and model structures through a Lava script to retrieve information and perform further analysis and modeling in a more automated way. Lava scripts can be fully integrated with the existing user interface through toolbars. They can also extend the user interface with new panels for user input and control.
Customization of mine planning solutions can also help professionals from sectors for which the software was not originally designed, such as industrial minerals (Hack, 2003). Software developers have
recognized scripting as a way to reach unexplored market areas.
3.4 Integration with GIS and Other Software
GIS (Geographic Information Systems) is having more and more influence on working procedures. Data sharing between professionals from various departments is always a key factor to the success of mining operations. This has lead to several advances that allow easier exchange of data between GIS and mine planning software (Elroi and Price, 1998).
A common scenario in many projects is the combined use of GIS and mining software. By providing an interface for leading GIS programs (such as ESRI's ArcView), modern software packages enable the importing and exporting of GIS formats (for example, shape files or TINs). The advantage is that registered images can be brought into the mine planning software environment (such as geological maps) and integrated further with other data being used.
Another trend of today's mine planning packages is the ability to communicate data and reports from database systems, design structures and models with other specialised or general software packages in a generic file format. Character Separated Variables (csv) files are becoming the norm for most packages. This format is very easy to import and export using the most common spreadsheet and database software packages or even simple text editors.
3.5 Integrated Simulation Capabilities
Mine planning systems are becoming increasingly dynamic in their modelling and visualisation processes. A number of visual aids allow the visualisation and analysis of mine designs and other data through time. We can effectively simulate the operation of a dragline, cast Wasting, bulldozing, truck & shovel operations and any other kind of material movement, to develop a series of optimised range diagrams. These diagrams, combined in 3D and visualised at appropriate time intervals, give a very a clear picture of the extraction process (Figure 4).
Figure 4: Range diagrams of dragline operation in VULCAN.
279

l.K. Kapageridis
An exhaustive suite of tools is provided for moving blocks in a wide variety of ways, allowing the user to work in a fully interactive design environment. Complete, parametric control of all functional equipment dimensions provides a powerful, graphical tool for analyzing equipment capabilities and limitations. Average equipment cycles and swing angles are also calculated. Different swell factors and repose angles can be applied to different material types moved by the different equipment.
Formatted reports can be generated on blocks and operations, with totals and weighted averages tallied. Reporting in CSV format enables quick and easy importation into spreadsheet packages, allowing scope for additional analysis and scheduling, if required.
4 FUTURE TRENDS
Mining software is an extremely competitive market which constantly drives the levels of development to new heights. Not only must software companies react to the demands of the end user, but increasing competition between software companies generates products of consistently high quality and functionality. In this highly competitive market, modern software packages continue to develop functionality not found in other software packages.
Mining software can only continue to develop with the support and drive of the users in the mining industry. Mining companies should consider software packages as an investment, designed to help an operation in' a number of different ways. All too often, cost is the primary consideration for companies when buying software. Cost should be balanced with cost effectiveness and an understanding of the value of the functionality that these packages offer (Lee, 2004). This type of investment not only aids the ongoing viability of operations and projects, but provides unique skills to the workforce. These skills will be more and more in demand as time goes on and to have personnel trained in this particular area is itself an investment in the people that make a mining company successful.
Looking to the future, the mining industry will become increasingly reliant on software. As deposits become more marginal, new features and procedures will need to be developed to make these marginal deposits economic. To do that, software must provide platforms that are cost effective and extremely efficient. Already, remarkable achievements have been made in a short space of time. Large datasets will continue to get larger, calculation times will continue to take less time to complete and designs will become increasingly interactive.
As the industry continues to develop and new techniques and procedures become apparent, mining software will be at the technological forefront to pro
vide the industry with the tools necessary to meet these demands.
4.1 Advances in Computer Hardware and Operating Systems
Computer hardware is developing at a much higher rate than software. More powerful processors, faster data buses, faster and larger hard disks, faster and more sophisticated graphics systems enable us to do mine planning operations faster more accurate and considering many more controlling factors than before. What used to be extreme in geological modeling and mine design ten years ago is today common practice. Triangulations with hundreds of thousands of triangle faces, block models with millions of blocks, and pit optimization based on such extremely detailed block models is today a reality. The cost of the necessary hardware is not an issue anymore allowing smaller mining companies to have well organized IT departments.
Software development tools are more standardized today allowing developers to produce software of high quality and compatibility for the popular operating system platforms. This aspect of the development process will continue to improve with the release of better and more sophisticated development tools that will take advantage of the new hardware developments.
4.2 Software Integration
Neither the traditional piecemeal approach to having isolated pockets of uncooperative automation, nor the all-encompassing, high-cost, company-wide system that in many cases fails to deliver the promised product before being overtaken by the next major advance in hardware, are likely to achieve the desired result. Modern mine planning software must remain focused on the part of functionality that is truly required and not extend in areas that do not add to the value of the package and are already covered by well established specialized packages.
On the other hand, integrating functionality that is directly linked to the mine planning process, such as production scheduling and pit optimization, can be very beneficial as it will increase productivity levels and allow easier and faster analysis of different operational scenarios. In any case, integration must not lead to re-inventing the wheel as is very commonly happening in software development. In order to avoid this, better developed and maintained interfacing between applications must be considered.
4.3 Use of the Internet
The internet is a place where mine planning software can expand in many different ways. Currently it is
280
The 19th International Mining Congress and Fair of Turkey, IMCET2005, İzmir, Turkey, June 09-12, 2005
being used for remote software licensing, data sharing and communication, troubleshooting and technical support between software providers and end-users, and distance learning. Software updates and demonstrations as well as other information are provided by various vendors to registered users of their software.
As the connection bandwidth is constantly increasing at the various mining sites where software is used, a number of new possibilities appear for extending software functionality and interaction between users and vendors. Distributed computing and other network based technologies will be incorporated in the more advanced mine planning packages.
5 CONCLUSIONS
The complexity of mine planning software will continue to increase with the requirements of problems that need solving. Integration of different software applications and data transfer between them continues to be vital to the efficiency of such systems.
The increase in the volume of data through modern exploration techniques and real-time monitoring systems requires that computers must be used to a large extent at all stages of the mining process. The data processing and analysis cycle may need many iterations if the mining company is to cope successfully with the changes in unforeseen geological conditions, changes in planning and environmental controls, and changes in the commodity price during the life of a mine. Those companies that achieve effective integration of computer systems are those that are most likely to cope with these changes and remain competitive.
Mine planning software, on the other hand, must continue to develop and adapt in form and functionality to satisfy current requirements and provide new methods for solving existing problems. A closer relationship between end-users and software developers will help achieve this target and ensure the future of mine planning software.
REFERENCES
Elroi, D., Price, M., Exchanging data between mine planning and GIS software: why, how, and then what? http://www.elroi.com/papers/20mintec/2098/mintec98. html
Hack, D.R., Utilization of scripting languages for customization of mine planning software by specialized users. Application of Computers and Operations Research in the Minerals Industries, South African Institute of Mining and Metallurgy, 2003.
Hunter, G.C., Muller, D.P. Computers for the mining industry: future needs and issues. White paper, KRJA Systems Ltd, Nottingham, 1990.
Jones, K., McGee, J. SGI OpenGL VolumizefTM 2 Programmer's Guide. Silicon Graphics, Inc. 2003.
Jonkman, K., Savage, C. The human side of the computer integrated enterprise. 21 s t Symposium on Application of Computers and Operations Research in the Minerals Industries, SME, 1989.
Kaiser, P.K., Henning, J.G., Cotesta, L., Innovations in mine planning and design utilizing collaborative immersive virtual reality (CIRV). In: Proceedings of the 104"1 CIM Annual General Meeting, May 2002, Vancouver.
Lee, D. New dimensions in mining software. Institute of Materials, Minerals and Mining (IOM3), Materials World, Vol. 12, No. 9, September 2004, pp. 31-33.
Ray, S., Evolution of mining software market in India, Datamine International Ltd., http://www.gisdevelopment.net/application/geoloEv/m ineral/geomOOO 1 pf.htm
281


The 19th International Mining Congress and Fair of Turkey, IMCET2005, Izmir, Turkey, June 09-12, 2005
Enhancements on Reproduction of Spatial Variability with Multi-Objective Simulated Annealing
M. Kumral Department of Mining Engineering, Inonu University, Malatya, Turkey
ABSTRACT: Simulated Annealing (SA) has been increasingly used in the reproduction of spatial variability. In this research, SA was used to improve output of direct sequential simulation method as initial solution. SA algorithm mainly consists of four parts: objective (cost) function, transition (perturbation) mechanism, acceptance criterion and cooling schedule. The objective function was expressed as a multiple criteria minimisation problem in terms of deviations of semi-variogram and histogram of new solution from those of current solution. The approach was demonstrated on a chromites ore deposit. The results showed that SA could be used to reproduce the spatial variability.
1 INTRODUCTION
SA is a stochastic method for solving large combinatorial minimisation problems (Lundy and Mees, 1986, Laarhoven and Aarts, 1987, Eglese, 1990, Pres et. al., 1992, Ansari and Hou, 1997). The method is based on the principle of stochastic relaxation. The method has an analogy in thermodynamics, specifically with the way that liquids freeze and crystallise or metal cools and anneals.
Suppose that a cost function in many variables is to be minimised. A simple, iterative, local search could be performed to find the minimum cost. During the local search process, an initial solution is given and then a new solution is selected at random. If the cost of the new solution is smaller than that of the current solution, the current solution is replaced by the new solution. Unfortunately, a local search may get stuck at local minima. Let / : X —> R be a function to be minimised over X, where X is a finite, but very large, set. A neighbourhood N(x) cX is associated with each element x £ X. Iterations can be defined by first selecting a starting point and then repetitively selecting y e N(x) and comparing successive values. SA allows the choice of y to be governed by the following stochastic rule: the first y e N(x) is selected with probability then y is accepted with probability:
(1)
where 7* is a parameter known as temperature, x is the current solution, y is the new solution.
2 PROBLEM SPECIFIC DECISIONS
2.1 Cost / objective function
The reproduction of stochastic image is expressed as an optimisation problem, which can be solved by multi-objective SA. In this research, two objectives are introduced. Firstly, to reproduce the same spatial dispersion (Eq. 2). Secondly, to reproduce the same histogram as the true values (Eq. 3). Jti = minimisation of deviation from value of the target semi-vanogram at lags
(2)
where y( \ ) is value of expected semi-variogram at lag h, and f( h, ) is value of experimental semi-variogram at lag h, after new transition.
Given that behaviour of model of semi-variogram is more reliable near origin, the division of square of the semi-variogram model gives more weights at each lag.
283

M. Kumral
minimisation of deviation from target cumulative histogram at each interval
(3)
where G} is value of expected cumulative histogram at interval y and Ğ, is cumulative distribution of simulated realization after new transition.
Objective function: Min
Min
(4)
However, the objective functions have different units. Therefore, the solution may be dominated by other solutions that lead to the algorithm being dependent on one objective. This problem is handled small modification in acceptance criterion.
2.2. Perturbation Mechanism
In transition mechanism possible locations are selected in a certain order. As known, when a location is selected at random it is possible to accept some uphill moves before the local optimum is selected. Therefore, the local optimum may never be attained. This mechanism also prevents to consider for a second time before all possible locations are tried once. In this research conditional distributions have been extracted from ordinary kriging weights. The sum of the kriging weights assigned to data of any given class is interpreted as the conditional probability of this class (Rao and Journel, 1997).
2.3. Initial solution
In this research direct sequential simulation was used as initial solution. The conditional distributions could be of any type as long as their means and variances are determined by simple kriging (Journel, 1994). The implicit random function model is no longer Gaussian and may be difficult to identify a priori, but the properties of the implicit random function can be observed in the simulated realisations. This kind of generalisation preserves the prior covariance matrix and leads to an important theoretical extension of the sequential simulation paradigm. Thus, original data values can be used in simulation without data transformation. This is called direct sequential simulation. Given a stationary random function Z(u), not necessarily Gaussian, and N original data,
the direct sequential
simulation algorithm is as follows: 1. Define a random path through all nodes to be
simulated, 2. Build the" cumulative conditional distribution
function of given the N original data and
all previously simulated values at each node, 3. Draw a realisation from the estimated ccdf. This
realisation becomes a conditioning datum for all subsequent nodes
4. Loop until all K nodes are visited. The direct sequential simulation produced the
smoothed random field. In addition, as the numbers of location being simulated and of objectives increase, only SA can be prohibitively difficult because of computer time.
3 GENERIC DECISIONS
3.1. Acceptance criterion
The percentage deviation is calculated for each solution instead of the difference between new and current solutions as shown in the Equation 6:
(5)
(6)
If the new solution is accepted, it becomes the current solution and is noted as a potentially non-dominated (PN) point. The current solution is compared with previously noted potential PN points. If the current solution dominates any PN solution, this PN solution is removed from the PN points file. If a dominated solution is chosen by the acceptance criteria, the comparison procedure is not applied. This solution will be removed to prevent solutions becoming stuck in local optima.
3.2. Cooling schedule
Although SA is a simple process, the selection of the annealing parameters is not simple because of possibility of stuck at local optima and the operational restrictions such as execution time.
284
Where:

The 19th International Mining Congress and Fair of Turkey, IMCET2005, Izmir, Turkey, June 09-12, 2005
r*+;=a7"/t was used for the decrement function firstly (Kirkpatrick et. al., 1983), where «is accepted as 0.80-0.95. This decrement form reduces the temperature very rapidly and most of the running time is spent at low temperatures. In this research, a more gradual process was used (Dowsland, 1993). Every time a move is accepted the system cools according to the function , and every time a move is rejected the system is heated according to the function = ka the system will need to go through k heating iterations to balance one cooling. If the ratio of rejected moves to accepted moves is greater than k, the system heats up and vice versa. Thus, this schedule theoretically tends to converge to a situation in which the ratio is about k. This was also used as stopping (termination) criterion, k should be governed by the size of the neighborhoods around these minima. Therefore, sufficient number of iterations was allowed around these minima, k is separating factor that gives a measure of required ratio of reduction amount at accepted transitions to increasing amount at rejected transitions. In this research it is planned in such a way that 99 out of 100 transitions are rejected. and a are chosen as 0.01500 and 0.00015, respectively.
In order to reduce execution time, an initial temperature is calculated before running the algorithm in the following way:
Where; fnew-fmrrem is the average difference in cost over the
n2 cost increasing transitions, nt is the number of cost-decreasing transitions, «2 is the number of cost-increasing transitions, A is the required acceptance ratio - the ratio between the number of accepted transitions and the number of proposed transitions at the given temperature.
k value is desired as 200 in the case study. Since annealing algorithm has also been used in combination with direct sequential simulation, this ratio is adequate. The direct sequential simulation generates a sub-optimal solution that then becomes the starting solution for SA. Initial temperature was selected as 35.0 to yield the required ratio.
4 ENHANCEMENTS ON SA STRUCTURE
4.1 Quick calculation of cost function
In SA most of running time was spent for calculating new cost function in each transition. Given mat the vast numbers of transitions are implemented, the computer time required may be prohibitively long since calculations of histogram and semi-variogram should be repeated in each transition. Therefore, histograms are updated locally. As for semi-variogram, a new value replaces with old value. Contribution of old value to semi-variogram is subtracted at corresponding lag and is added to the contributions of the new value.
4.2 Storing best solution
As has been known, SA may accept worse solution in final transition. Therefore, it is possible to find worse solution as final solution in the end of annealing. In addition, It was remarked that the SA algorithm did not rely on a strong convergence over time with this modification (Glover and Greenberg, 1989). If the best solution found so far is storaged, it will be guarantee to retain the best solution. This is not computationally expensive.
5. CASE STUDY
A case study has been conducted on a chromite data set to demonstrate the algorithm developed during this research.
The initial data comprised a set of 27 drillholes, the cores from which had been assayed for Cr203. A three-dimensional block model was created by direct sequential simulation the three grades for each block. Blocks are 4m (EW) x 4m (NS) x 3m on a 50 (EW) x 50 (NS) x 20 grid. This provided a total of 50 000 blocks.
Model statistics are inferred from sample information, which are assumed to represent population parameters. A stochastic realization should reproduce the declustered sample histogram and tiie semi-variogram model, and should coincide with data values at their locations. Figure 1 showed histogram and semi-variogram of 205 core samples. Figure 2 showed histogram and semi-variogram of 50 000 simulated values obtained from direct sequential simulation. As has been seen, there was no exact match with histogram and semi-variogram of data. This sub-optimal reproduction was then submitted to the SA algorithm. The algorithm was implemented
285

M Kumral
for four million transitions. As the algorithm has been designed for multi-criteria optimization problems, there are generally more than one optimal solution (non-dominated or Pareto optimality). In the case study, the program has yielded three random
fields in the end of execution of algorithm. Table 1 summarizes these fields. Final reproduction has the same semi-variogram as the true values and the same distribution as the true values.
D i s Lanoö (îıitg)
Figure 1. Histogram and settu-variogram of reference data
Oi!t»3 ïii^uertiiul ïïimuïiiOcin
D i s t a n c e {Lsg) Figure 2 Histogram and semi-variogram obtainedfrom direct sequential simulation
O u n i d i r e c t i o n a l S f i m v « t i o g t a m <A£"fc-»r t o u t m i l l x o n t r a n m t i o n a )
Figure 3 Histograms and semi-venograms obtained Distance (Lag)
during the SA (after 4 million transitions)
Table 1. Non-dominated results fo
Sample
Field 1
Field 2 Field 3
Co 23.80
23 88 23 81
23 85
c, 37.71
37.48 37.62
37.49
• t w o object
Objective
C-,
13.59
13.58 13.64
13.52
ives
ai
119.41
119 03 ! 19.87
118.91
a i
155.24
155 37
155.81
154.40
Objective 2
Mean
37.52
37 53 37.59
37.50
St.Dev
8 6239 8 6217
8.6277
8.6235
286

The 19th International Mınmg Congress and Fair of Turkes IMCET2005 Izmir Turkey June 09 12, 2005
6. CONCLUSIONS
As SA with enhancements proceeded, exact reproduction was obtained Implementation m the selected temperature decrement, selection of locations m certain order during transition mechanism and storing best solution so fai produced good ıesults m shorter time The program yielded three non-dominated fields Selection among these repioduc tions depends upon preferences of decision maker These preferences could be incorporated into algorithm directly Multi-objective SA ıs very powerful technique for reproduction of same spatial dispersion and dıstııbutıon However, the approach needs extensive experimentation to find the parameters of cooling schedule
7 KAYNAKLAR
Ansan, N and Hou, N, (1997), Computational Intelli gence for Optimization, Kluwer Academic Pub
Dowsland, K, (1993), "Simulated Annealing", m C Reeves, ed, Modern Heuristic Techniques for Combi notorial Problems 20 63, Oxford Press
Eglese, R W , (1990), "Simulated Annealing A Tool for Operational Research", European Journal of Opera tional Research, 46, 271 281
Glover, F and Greenberg, H J , (1989), New Approach for Heuristic Search A Bileteral Linkage with Artificial Intelligence, European Journal of Operational Research 39,119-130
Journel, AG , (1994), Modeling Uncertainty Some Conceptual Thoughts, in R Dimitrakopoulos, ed, Geosta-ttstics for the Next Century,30-43
Kirkpatnck, S , Gelatt, C D, Vecchı, M P, (1983), Opti mızatıon by Simulated Annealing, Science 220, 671 680
Laarhoven, PJM and Aarts, E H L , (1987), Simulated Annealing Theory and Applications, Reidel, Dor-decht
Lundy, M and Mees, A, (1986), Convergence of an An nealmg Algorithm, Mathematical Programming, 34, H i 124
Press, W H , Flannery, B P, Teukolsky, S A, Vetterlmg, T V , (1992), Numerical Recipes, Cambridge Umv Pi ess
Rao S A and Journel A G (1997), Deriving Conditional Distributions Mom Ordinary Krıgıng, m E Baafı and Schofield, eds , Geostatıstıcs Wollongong 1,92-102
287


The 19th International Mining Congress and Fair of Turkey, IMCET2005, İzmir, Turkey, June 09-12, 2005
A Linear Model for Determination of Block Economic Values
M. Ataee-pour Department of Mining, Metallurgical and Petroleum Engineering, Amirkabir University of Technology, Tehran, Iran
ABSTRACT: Most algorithms developed for optimisation of the mine layout and production scheduling, for both open pit and underground mines, are implemented on an economic block model of the ore-body. There are various formulae for calculating the economic value of a block. This paper introduces an approach employed to define a linear function for determination of block values in underground metalliferous mines. The proposed value function uses terms BMC, the block mining cost, and BRR, the block revenue ratio, as the constant and the multiplier, respectively. BMC may be fixed for a range of depth or a specific mining method. Costs are categorised into two classes, the ore-based costs and the metal-based costs. Rules of thumb in block valuation and the difference between open pit and underground cases are also discussed. In multi-metal deposits, the main product is set as the base and an equivalent grade is defined and calculated, which substitutes grades of all existing products. The "main product equivalent grade" (MPEG) is then used in the mentioned formula. The approach is found to be simple and fast. It is suitable for feasibility studies and preliminary resource appraisal.
1 INTRODUCTION
Determination of block economic values in a block model of the ore-body is the base for constructing an economic model. This is a vital task for most optimisation methods, used in mining industry. Optimisation of the ultimate mine layout and production scheduling are two well known examples, which are fundamentally based on the economic model of the ore-body. This is regardless of the mining method, ie surface or underground mining, and considering or ignoring the time value of money, ie the objective function is maximising the profit or the net present value.
What is normally available in a block model is a set of blocks in three dimensions each containing estimates of a set of data, most importantly assay values. Assay values are useful in discriminating between blocks of ore and waste based on a given cutoff grade. However, for production scheduling purposes and mine layout optimisation, it is necessary to express blocks in economic terms to indicate their net worth, ie their dollar values. The reason is that blocks with the same grade value may have different net worth that affects their mineablity, the optimum mine layout and when they should be mined. Some factors that influence the net value of blocks are the location of blocks, when they will be mined and the mining method applied.
The relative location of a block may affect its net value due to the fact that haulage distance is influenced by the block location. The effect is not considerable for small differences in block locations. However, for blocks that are located far from the dump site or the crusher, it may be significant. In particular, depth of the mine can be divided into different categories each specifying a separate cost for haulage.
The block net value is also affected by when the block will be mined. The revenue obtained from a block depends on the price of the recovered (metal) product contained in the block. However, the product price is usually considered as the main economic uncertainty over time. In addition, the amount spent for the associated cost of blocks, including the payment for equipment, materials and wages vary with time. Moreover, and most significantly, taking into account the inflation rate and the time value of money, the revenue and costs must be discounted by a factor that increase over time.
Various mining methods may also influence the economic value of a block. The value of a block, when excavated using open pit mining methods, is not necessarily the same as when it is mined using underground methods. In addition, the block values may vary with different underground methods. For example, mining costs for a block in a selective mining method, such as cut-and-fill, may be different
289

M. Ataee-pour
from those for the block mined in the block-caving or sub-level stoping methods. In the block-caving method, there is no cost for ore extraction (except occasional drilling for initiating the caving process) nor ore handling cost (since the ore falls down due to its gravity). However, the development in the block-caving method is complicated and time consuming, so that it may take years to complete the development (Hamrin, 1982). On the other hand, in the cut-and-fill method, there is no cost for development and the selectivity of the method provides good recovery. However, the method entails drilling and blasting costs and the cost for handling ore to the orepass within the stope as well as the filling cost.
In mine layout optimisation, it is usually practised to use the Block Economic Values (BEV) as attributes of blocks. The corresponding model is called the economic block model. An economic block model is a block model, which has each block assigned an estimate of its net economic (dollar) value. The typical element of the economic block model is denoted by BEV,]/,, which is a real scalar number and represents the economic value of the block, B,Jt.
2 RULES OF THUMB IN CALCULATING BLOCK VALUES
When calculating block values for optimisation purposes, basic rules must be followed. Whittle (1989) has suggested three rules of thumb, in this regard, as presented below. 1. The value must be calculated based on the as
sumption that the block has already been uncovered. That is, the cost required to access the block must not be included to the block costs.
2. The value must be calculated based on the assumption that the block will be mined. A block, which contains more waste than ore is not going to be, primarily, chosen for the optimal layout. However, if it has to be mined to satisfy the mining constraints, the ore content will pay for some of the included waste.
3. When considering the cost of mining or the cost of processing for blocks, only those costs must be included that would stop if mining stopped. For example, fuel costs and wages would stop if mining stopped and therefore, must be included in the corresponding cost of mining, processing or refining. The reason is that addition of each extra block to the mine layout extends the life of the mine. Therefore, that extra block should pay for the extra cost during the extra life of the mine (Whittle, 1990).
The assumption, made in the first rule, is true for open pit mining since the cost of accessing a block has, in fact, been paid already when calculating values of preceding blocks. In other words, uncovering
a block is equivalent to mining its preceding blocks; the block cannot be mined directly without mining its preceding blocks; so, when a block is going to be mined, it is already uncovered and no extra cost is required. However, in underground mines, accessing a block does not need uncovering that block. That is, each block must contribute in the accessing cost, including required costs for shafts, inclines, underground roadways and so on.
3 BLOCK VALUATION
Various formulae have been suggested to calculate the economic value of a block (Camus, 1992: Whittle, 1993). The approach used in this study is based on the fact that the economic value of a block (BEV) is equal to the revenue earned from selling the recovered metal (product) content of the block less all costs encountered for mining that block, processing the metal (product) from the ore and refining it to be prepared for sale. The basic relation may be expressed as below:
BEV = Revenue - Costs
The revenue of a block is directly related to the metal content, recovered from the block and the market price of the product. The metal content is further a function of the assay value as well as the volume and density of the block as described in the following relations:
Block revenue - Price x Product
= Price xRecovery xMelal
~ Price xRecovery xGrade xOre
= Price xRecovery xGrade xVolume xDensity
This is simply expressed by Equations (1).
Block_ Re venue = P rgVp ( 1 )
where P: the price of the product (metal) to be sold, in $/t
of the metal, r. total proportion of the metal recovered form the
ore, including mining, processing and refining recoveries,
g: grade of the metal estimated for the block, in "%" or "ppm",
V: the volume of the block, B,]k, in cubic meters and p. the density of blocks, in t/m3.
Costs, on the other hand, can be divided into two categories, ie "ore_based" costs and "metal_based" costs.
Costs = Orejjased costs + Metal_based costs
29©

The 19th International Mining Congress and Fair of Turkey, IMCET2005, Izmir, Turkey, June 09-12, 2005
The first category contains those costs, which relates to mining of a block from the (surface or underground) deposit and delivering it either to the processing plant if it is an ore block or to the dump site if it is a waste block. "Ore_based" costs are calculated for each tonne of rock (ore or waste) contained in the block as described by:
Ore_.basedcosls=Unitproduction cost xTonnage (Rock)
= Unit production cost x Volume X Density
This may be expressed by Equation (2):
Ore _ based costs = Core V p (2)
where Core is the cost of mining a tonne of ore (or waste), in $/t of rock.
The second category refers to those costs, which are necessary to extract the metal content of the ore through concentrating, processing, refining and preparing the product for sale. "Metal_based" costs are calculated for each tonne of the metal contained in the block as shown in the following relations:
MetalJ>ased costs -Unit costxRecoveryxTonnage (Metal)
= Unit cost XRecovery xGrade xOre
= Unit cost x Recovery x Grade x Volume x Density
This may be expressed by Equation (3):
Metal _based costs = C/^ rgVp (3)
where CM represents those costs required for processing a tonne of metal, refining it and preparing it for sale, in $/t of the metal. Substituting the revenue and costs in the basic relation for calculating the block value, the relation can be reduced to:
BEV = PrgVp-(CoreVp-l-CurgVp) = (P-CM)rgVp-CoreVp
or simply:
BEV = Vp[(P -CM)rg-Core] (4)
In general, considering different densities for ore and waste blocks, the formula for calculating the net value of a typical block, may be obtained through Equation (5).
where : the economic value of the block, B/jt, in $, the density of ore blocks, in t/m3, the density of waste blocks, in t/m3, the grade of the metal estimated for the block, Byk, in "%" or "ppm" and the cut-off grade.
Among the above parameters and for blocks of the same cost estimation category, only the grade value is variable from block to block. Other parameters may be considered constant at least in a certain zone. Therefore, Equation (5) can be modified to a linear function (y = ax + b), in which the block economic value is a function of the block grade (provided that the unit costs are constant), as expressed by Equation (6).
BEVijk = BRR gijk - BMC
given : BRR = (P-CM)rVp
(6)
BMC= CoreVp
where BRR: the "block revenue ratio", as the multiplier in
the formula and BMC: the "block mining cost", as the constant of the
formula. When a block is barren, ie the grade is zero, there
is a cost required to mine the block. This is called the "block mining cost" (BMC) and is the same for all blocks. Therefore, the value of barren blocks would be negative. It is equal to this base cost and is the minimum block value. The metal content of mineralised blocks will pay for all or part of the base cost, BMC, which is related, linearly, to the grade value of the block. However, the grade value compensates for the cost with a ratio (its multiplier, [(P-CMJrVp], in Equation (6), which is called the "block revenue ratio" (BRR). At a certain grade value, the block revenue can pay for total block mining cost, in which the block net value is zero. Accordingly, for blocks with higher-grade values, the block economic value would be positive. Fig. 1 shows linear variation of block values (BEV) as a function of grade, g, of blocks.
291

M. Ataee-pour
As a result, the equivalence factor for the main-product would be equal to 1. Equation (8) denotes the EF formula.
Figure 1: The block value function
4 EQUIVALENT GRADE
In many cases, there is more than one (metal) product in the deposit while the block value formula uses the grade value of only one metal. Therefore, it is required to determine an equivalent grade that substitutes grade values of all products and is used in the block valuation formula. Consider that there are one main product and "n" by-products in the deposit, of which the grade, recovery and price are known. The gross value obtained from the metal content can be calculated using the relation:
Gross value = Grade xRecovery xPrice
This may be expressed for each product within the deposit by Equation (7).
(7)
where GV,: the gross value of the i'h product, g,: the grade of the i"' product, r,: total recovery of the i'h product, P,: the unit price of the i"' product and n: the total number of hitproducts (for the main
product, n = 0).
Considering one of the products as the base, a factor can be defined for each of the other products to obtain the base product equivalent grade. In practice, the main product is usually set as the base and the grade of each by-product is converted to its "main product equivalent grade" (MPEG). The equivalence factor, EF, for each by-product is defined as the ratio of its gross value to the gross value of the main product.
EF Grossvalue of the by -product
Gross value of the main - product
(8)
The equivalence factor for a by-product is the factor that has to be multiplied by the grade of the main-product to produce the MPEG of that byproduct. The main product equivalent grade is, therefore, obtained using Equation (9).
Finally, the total equivalent grade of the main-product is obtained through summation of MPEGs of all products as shown below.
Recalling that the equivalence factor of the main (base) product equals to 1 (EF0 = /), Equation (9) reduces to Equation (10).
(10)
As a simple example, consider a deposit containing a main-product and two by-products. Having known the grade, recovery and price of each (metal) product, their gross values, equivalence factors and MPEGs are calculated based on the above formulae and shown in Table 1.
In order to check the results, the grade of the main-product must be substituted with the total MPEG to obtain the equivalent gross value. The result should match the total gross value obtained earlier.
Equivalent gross value = Total MPEG xr0 xP0
= 0.309x0.9x100 = 27.84
292

The 19th International Mining Congress and Fair of Turkey, 1MCET2005, Izmir, Turkey, June 09-12, 2005
Applying the above factors, the relation for gross value is modified to:
Gross value - (Grade x Grade factor) x Recovery xfPrice x Price factor)
This is expressed by Equation (11).
GVi=(g,GFl)rl(P,PFl) ; =0,1,....,« (11)
where GFf. the grade unit factor for the i"1 product and PFj-, the price unit factor for the ilh product.
Table 3: Price factors applied for corrections in MPEG formulae
#
1
2
3
Price unit
Dollar per tonne ($/tonne)
Cents per kilo (c/kilo)
Dollar per ounce ($/oz)
Price factor
1
10
35,242
5 A NUMERICAL EXAMPLE
The model was implemented on a numerical example using Stope Limit Optimiser (SLO), a software tool developed for optimisation of the stope boundaries (Ataee-pour and Baafi, 2003). The deposit was assumed to contain a main product (Copper) and three by-products (Gold, Silver and Molybdenum). Table 4 shows the echo of inputs and the computed block economic value (BEV) for block No. 203, provided by SLO.
Table 4: An example of the input data and computed block net value in SLO
203
1.37
0 .010000
2600 .00
1
0 .90000
3 2 . 0 6
1.00
0 .01370
82400 .00
- 1 1 2 8 0 . 5 7
0 .00
0 .000001
410 .00
35242
0 .75000
0 .00
0 .00
5191199.50
0 .00
0 .000001
6 .00
35242
0 .80000
0 .00
0 .00
0 .00
0 .010000
40000 .00
1
0 .75000
0 .00
0 .00
Table 1: Equivalent grades calculated for a deposit with two by-products
Grade (%)
Total recovery (%) Price($/t)
Gross Value ($) EF
MPEG (%)
Main-
product
20
90
100
18
1
20
by-
product_l
5
80
150
6
0.333
6.667
by
products
4
80
120
3.84
0.213
4.267
Total
27.84
1.547
30.933
Products of the deposit may have different units for their prices or grades. Grades and prices are usually expressed in various units, which require additional factors to produce equivalent price and grade units. Two major units for grades include "percent" (%) and "gram per tonne" (ppm). Three major units for price values are "dollar per tonne" ($/t), "cents per kilo" (c/kilo) and "dollar per ounce" ($/oz)- Tables 2 and 3 show the grade factors and price factors used in the MPEG formulae, respectively.
Table 2: Grade factors applied for corrections in MPEG formulae
#
1
2
Grade unit
percent (%)
gram per tonne
Grade factor
0.01
0.000,001
293

M Alaee pour
The line description of Table 4 is as follows Line l specifies the sequential (ID) address of the
block Line 2 contains the assay values of Copper, Gold,
c ver and Molybdenum, respectively Line 3 contains the grade factor of the products,
which indicate the proportion of the product m the ore
Line 4 contains the price value of the products Line 5 contains the pnce factors, which represent
the factors for converting the prices of the by-products into the price of the main product
Line 6 includes the total recoveries of the products in terms of their proportions
Line 7 includes the gross values obtained from the products
Line 8 contains the E factors of the products that represent the ratio of the gross values of the by-products compared to the main product
Line 9 includes the equivalent grade of the block Line 10 contains the block mining costs (BMC) and
the block revenue ratio (BRR) Line 11 contains the obtained BEV of the block
Table 5 shows the result of block valuation for a number of blocks, computed in SLO
Table 5 Block valuation performed by SLO
Grade
ID Cu Au Ag Mo BEV ($)
% ppm ppm %
201
202
203
204
205
206
207
208
209
210
211
212
213
214
215
1
1
1
1
1
6
1
0
0
0
0
1
2
1
0
36
35
37
63
8
44
05
78
02
13
03
96
88
43
29
82
91
0
0
0
0
0
0
32
21
0
5
6
0
0
103
151
0
315
186
77
185
25
0
18
0
179
120
420
165
0
0
0
0
0
0
0
0
0
0
0
0
0
0
0
17
16
17
17
1
07
05
14
2111380 25
2338590 75
-11280 57
233570 78
193984 92
347363 53
41534 11
-32526 69
687959 13
482558 03
-80842 64
206728 73
256387 66
182728 02
87750 8
6 CONCLUDING REMARKS
The approach used in the proposed model considers costs in two categories, le ore-based and metal-based costs It also takes into account the equivalence factor for multi-metal deposits Factors influencing the value of a block are expressed in two terms, the block revenue ratio and the block mining cost, to introduce a linear function for the block valuation The mining cost of blocks has been assumed fixed for a range of depths, eg a level in underground mines The approach is found to be simple and fast It would be useful for feasibility studies and preliminary resource appraisal
7 REFERENCES
Ataee-pour M and Baafi E Y 2003, SLO - A Program for Stope Limit Optimisation Using A Heuristic Algorithm, Proceedings of the IS1' International Mining Coup ess and Exhibition of Turkey - IMCET'2003, G Ozbayoglu (ed ), Turkey, pp 295-301
Camus J P 1992, Open Pit Optimisation Considering an Underground Alternative, 23"' International Symposium on the Application of Computers and Operations Research in the Mineral Industry, Y C Kim (ed ), Society for Mining, Metallurgy and Exploration, Inc, Colorado, pp 435-441
Hamnn, H 1982, Choosing an Underground Mining Method, SME Underground Mmmg Handbook, W A Hustruhd (ed ), Society for Mining, Metallurgy and Exploration, Inc , Colorado, pp 88-112
Whittle, J 1989, The Facts and Fallacies of Open Pit Optimisation, Whittle Programming Pty Ltd, Melbourne
Whittle, J 1990, Open Pit Optimisation, Surface Mmmg (2"d Edition), B A Kennedy (ed ), Society for Mining, Metallurgy and Exploration, Inc, Colorado, Chapter 5 3 pp 470-475
Whittle, J 1993, Open Pit Design, Short Course Notes in Pit Optimisation, Whittle Programming Pty Ltd, Melbourne, 40 p
294

The 19th International Mmmg Congress and Fair of Turkey IMCET200S Izmir, Turkey June 09 12 2005
Aspects Regarding the Mathematical Modeling of Stress- strain for Mining Works
V. Arad & S. Arad Petrosam University
NIanc INSEMEX Petroiam, Romania
ABSTRACT: The paper presents the stress and strain state around a tunnel lining applying the confining and convergence method, used some time to dimension tunnel linings This method can be developed in an analytical form only on restrictive hypotheses for the tunnel geometry and the initial stress of the rock A fundamental aspect is applying the convergence - confinement method is represented by the assessment of massif convergence when the lining is activated and which depends by the completing of the lining performance when it starts to introduce a pressure to oppose to the massif convergence
1 INTRODUCTION The mmmg activity performed m Romania until the year 1990 was focused mamly on to reaching high production levels, fact which had led to neglect ecological issue and that resulted in time, very serious damages for the environment The technical depletion and the decrease of governmental subventions determined down of working productivity
Simple observations indicated that the horizontal stress regime at the mine was relatively benign
These indications included the lack of any stress indications at the head end, little or no floor lift and the stability of roadways, both from the point of view of roof and floor closure Negative aspects included consistent over height with material dropping out and the apparent rapid weathering of the sides
2 THEORETICAL CONSIDERATION
The design of the mining works linings as permanent retaining structures, taking into account the hning-ground interaction is influenced by the geological and physical - mechanical characteristics of the rock massif, the physical - mechanical characteristics of the lining and their time dependency (Arad, 1995)
The final equilibrium of the lining is given by the intersection of the rock confining curve in the exca vation walls and the lining convergence curve and it can be reached differently depending on the time of lining performance The behaviour domain of the massive rock where the tunnel of circular cross -section is performed is elastic and then elastic - plastic with the same restriction concerning the initial stress state
The convergence - confinement method represents an analytical method that gives the possibility to take into account different factors which influence the final equilibrium of the rock massif - tunnel lining system like m papers (Panet,1995, Bud, 2001)
• The tunnel deformabihty - (time dependency behaviour before yielding),
• The lining stiffness, • The massif deformabihty before performing
the lining Four specific domains (figure 1) define the elasto
- plastic behaviour of soils and hard rock 1 An elastic behaviour domain, until the elastic
ity limit (I), 2 A plastic strain domain limited by the maxi
mum strength (II), 3 A plastic strain domain with consolidation lim
ited by the residual strength (III), 4 A domain of perfect strains in the conditions
of residual strength (IV)
Figure 1 The domains of elasto plastic behaviour of soils and hard rocks
295

V. Arad, S. Arad & N.tanc
3 THE CONVERGENCE LAW FOR THE CASE OF AN ELASTO-PLASTIC BEHAVIOUR OF THE MASSIF (PANET, 1995
The ti' A\A excavation induces stress redistribution within the massif (Arad, S; Arad, D; 2000). If it is considered the rock massif with perfect elasto-plastic behaviour, subjected to the Mohr - Coulomb failure criterion, one may write the following relationship:
where:
(1)
(2)
one dimensional compression strength. Considering the axis-symmetrical case, the stress
redistribution in the plastic zone is obtained by integration of the equilibrium equation:
(3)
If the rock massif begins to work in the domain of linear elastic behaviour, the radial stress and the orthoradial stress, on the tunnel wall of circular cross - section are given by relationships:
(4)
where: represents the confinement degree the failure conditions are reached at the wall border for a value of the confinement degree, in which case one may write:
(5)
where:
(6)
For the plastic zone does not appear and for a plastic zone is developed around the tunnel
with a radius that increases with the confinement degree.
4 THE STRESS AND STRAIN STATES FOR THE CASE OF AN ELASTO -PLASTIC BEHAVIOUR OF SOIL
The strain increase in the plastic zone equals the sum of the elastic and plastic strain increases:
(7)
If it is considered that the elastic strain is negligible in comparison with the plastic strain, the main strains verify the relationship:
(8) Where: K = 1, when the strain is produced at constant
volume; K > 1, when the strain is produced at the volume
an increase. The radial displacement in the plastic zone is
given by the integration of the differential equation (Boti, N; Stanciu, A; Droniuc, N; Lungu, I, 2000):
(9)
In the conditions of isotropic initial stress (Ko = 1) solving the equation goes to the following:
(10) In the limit conditions:
r = a; (11) The differential equation for the axis-symmetric
case becomes:
(12)
where: The obtained solution by the integration of this
equation is the following:
where
(13)
The radius of the plastic domain results by the relationship:
296
or:

The 19th International Mining Congress and Fair of Turkey, 1MCET2005, Izmir, Turkey, June 09-12, 2005
where: a - radius of the tunnel.
(14)
5 THE USE OF THE NUMERICAL MODELS TO APPLY THE CONVERGENCE -CONFINEMENT METHOD
In the convergence - confinement method the plane strain problem is the substitute of the three -dimensional problem, where the following stress is applied at the outer lining. 0 r = ( l -X)YaH (15) corresponding to the appropriate confinement for the considered construction stage.
The study of the massif - tunnel lining interaction that develops during the tunnel excavation, applying the convergence - confinement method includes generally the following stage:
Stage 1 - the construction at the finite element network of the model.
Stage 2 - the introduction of the initial equilibrium conditions, obtained the model forces F„ on the inner tunnel lining.
Stage 3 - the simulation of the tunnel excavation and lining performance; the nodal forces that act at the inner lining are decreased at the value X VB, where X is the confinement degree which corresponds to the excavation progress before the performance of the lining.
Stage 4 - the simulation of the lining performance by activating the appropriate finite elements.
A fundamental aspect is applying the convergence - confinement method is represented by the assessment of massif convergence when the lining is activated and which depends by the completing of the
lining performance when it starts to introduce a pressure to oppose to the massif convergence.
To determine the confinement degree, XĞ the method based on the convergence curve of the unsupported tunnel and implicit methods can be used. Based on previous studies, it was noticed that if the confinement degree is almost the same, 0,03, for an elastic behaviour of the rock massif, for elastic -plastic behaviour there is no explicit solution and it is recommended to use the successive approximation method.
6 RESULTS AND EXPERIMENTS
Based on the previous theory and taking into account that deformation is influenced by a large number of factors, we analysed the stress- strain state of a horizontal mine workings
The geostatic forces increase with the depth and play a significant role in the analysis of the rock mass deformation. These forces together with the tectonic ones cause remaining stresses which cause the modification of geomechanical properties.
From the stress state analysis of the rock mass, present the maximum stress variation on a mine working contour line span 2a= 4.5 m and h = 3.7 m, located at various depths for some rock types , prevailing in the Jiu Valley Coal Basin, table no. 1.
The stresses acting around an underground working can be determined analytically or experimentally by measurements, Table no.2.
For the above mentioned mine working located in argillaceous rock having the following characteristic: E = 1,5*103 [MPa], ya = 2.57*103[N/m3] and u =0.29, by applying the finite element method, the results have been obtained that are in agreement with those determined experimentally and they are rendered in Table 2.
Table 1 The maximum stress variation on diverse depths for some rock types from Jiu Valley Coal Basm
Rock type
Chocolate clay Siliceous sandstone Marl Doad Argiuaceus sandstone
Maximum stress value for the depth variations loo (ml 5 77 7 33 6 25 641 7
200 [m] 121 146 13 128 14.1
300 (ml 18 4 22 1 196 191 21.1
400 (ml 24 7 29 8 26 1 26 3 28
is
312 36 9 33 1 32 9 35.1
600 (ml 35 8 44 2 40 39 2 42.1
700 (ml 42 1 52 2 45 7 45 8 48.8
800
48.6 60.7 52.8 53.1 55.9
Table 2. The values of maximum stress determined Maximum Stress oO[MPa] Analmcally Numerically
100 57 5.9
200 12 1 13.1
300 18 4 19.5
Depth H[ml 400 24 7 25.8
500 31 2 32.1
600 35 8 36.4
700 42 1 43.0
800 48 6 49.8
7 CONCLUSIONS An important aspect in the construction of mining works is ensuring that they function properly. The
297

V Arad S Arad &N lane
underground constructions in general unfortunately can be a negative effect on surface or have been in future disturbed by natural factors of the environment
In the paper a numerical model of the rock-support interaction for tunnels by the underground construction is determined
This study has been performed for the two-dimensional stress and strain state
The use of the convergence - confinement method in the rock massif - lining tunnel interaction m a circular tunnel may be also realised for an elasto - plastic behaviour of the rock
The stress state is obtained for both rock massif and tunnel lining and based on these results the be haviour in service is predicted for the tunnel that is to be performed
REFERENCES
Arad, D , 1995 Mining Geotechnics Technical Publishing House Bucureştı
Arad, S, Arad, D , Chındns, Gh, 2000 Environmental Geotechnıc medıuluı, Polodava Publishing House Deva)
Botı, N, Stanciu, A, Dronmc, N, Lungu, I, 2000 Numerical Modeling of the rock support interaction for circular tunnels, in Proceedings of the third National Conference of Undei ground Constructions 2000, Petrosani, pp 32-38
Bud, I, 1999 Studıul regımuluı de presıune în lucrânle miniere de pregätire penini exploatarea zäcämintelor filoniene în scopul perfectionäm sustineni la mineme dm bazınul Baıa Mare PhD thesis (unpublished), Petrosani University, Petrosani
Garbea, D 1990, Analım eu elemente finite , Bucureştı, Panet, M ,1995 Calcul des tunneles par la méthode con
vergence - confinement (Presses de l'Ecole Nationale des Ponts et Chaussées Pans)
Stematiu, D, 1988, Calculul structunlor htdrolehnice prin metoda eleınentelorfinite Bucureştı
Zenkıevıcı, O , Gang, 1, 1974, Metod konecimh elemen-tov v teoru soorujenu ı v mehamka sploymh sred, Moscova Nedra
298

The 19th International Mining Congress and Fair of Turkey, İMCET2005, Izmir, Turkey, June 09-12, 2005
A System for Virtual Reality Applications on 3D Geological Models and Mine Designs
K.Erarslan Dumlupinar University, Department of Mining Engineering, 43100, Kütahya, Turkey
ABSTRACT: Determination of location and extensions of an ore body is crucial as well as estimation of quantities numerical values like reserve, thickness, grade distribution, etc. That is why recently virtual reality applications have been widely used for visual interaction and simulation on models of topography, ore body, and 3D mine designs. In this study, a very simple and practical approach to visualize underground assets and application of virtual reality on them is presented. The visual simulation includes walking or flying effects on, around or through physical surfaces and volumes. In the developed system, 3D terrain models, ore body and open pit models are generated initially by using drill holes data. Inverse distance interpolation or geostatistics are employed for modeling. The system produces 3D models in the form of Data exchange Format (DXF) which can also be converted into virtual reality format WRL. WRL form is processed by virtual reality processors like OpenGL or GLView. The final step is to load WRL formatted views and interact with them. These processors provide walking or flying utilities on 3D models. The developed system has been applied to a hypothetical 3D structure and ore body cases and revealed that it can easily be used for interactive virtual reality applications.
1 INTRODUCTION
Ore bodies are hidden economical assets to be discovered and determined. Drill holes give the most concrete information about them. This information is further used to estimate reserve and waste to be stripped as well as to determine and model the shape, extensions, thickness and quality of ore body. Various computer techniques serve to estimate these quantities and model mining site in three dimensions. Also, there are various commercial software systems employing this approach (Surpac, 2003; MineSight, 2003; Gemcom, 2003; GDM, 2003; Techbase, 2003; Datamine 2003; Lynx Mining, 2003; Minex, 2003). The aim is to determine physical appearance of ore body, as real as, it exists underground. This is crucial since all further mining activities are based on these estimations.
Virtual reality has brought a new aspect to geological modeling and mine design. It can be thought as the next step of modeling and visualization because the geological structures and designed mines are not only visualized but also can be visited virtually. This also provides an interactive visual simulation on developed models. As in many
other improvements in computer techniques, virtual reality has found an application field in computerized mining systems (Denby and Schofield, 1999; Arnold et.al. 2001). Commercial software systems have also added this utility to their products.
This study presents an easy and practical approach for any mining researcher to develop this own virtual reality system. It is also shown that, the approach reduces modeling and visualization processes to geometrical calculations. In other words, the approach provides researchers a state of art for development of their own modeling systems and virtual applications on them with no need of computer graphics and visual simulation techniques.
2 THE SYSTEM APPROACH
Computer graphics is a great deal. However, it is a unique part of visualization and virtual reality systems.
The approach used in this study aims at providing an easy and practical methodology and state of art to build the visualization andrirtual reality system. It reduces the work to geometrical calculations while eliminating complicated computations of computer
299

K.Erarslan
graphics. Determination of geometric coordinates of a physical body is enough in the system. This is achieved by employing a distinctive format called Data eXchange Format (DXF) which is a special one to determine drawing vectors, 3D objects and entities in ASCII code. It can be visualized in several software like AutoCAD, 3D Studio Max, Bryce, etc. (AutoCAD, 1987). In other terms, the format is a way of stating geometric coordinates and can directly be introduced to many drafting software. Hence, the use of DXF format reduces many graphical computations (Erarslan, 2001).
The system approach is given as a flowchart in Figure 1.
system superimposed onto mine field. Grid nodes are estimated from surrounding drill holes by several methods such as inverse distance interpolation and geostatistics. Topographical, strata and assay data are major information needed for geological models and pit design.
A topographical model can be easily generated after assigning z-coordinate (elevation) to each node in addition to x-coordinate and y-coordinate (easting and northing relatively). In a three dimensional space, grid ceils can be displayed as rectangular or square surfaces (Fig. 2).
Figure 2. A part from three-dimensional terrain construction.
Similarly, parallel cross-sections or block models are used to generate 3 dimensional ore body models (Fig. 3).
Figure 3. Three-dimensional ore body block model.
Figure 1. Flowchart of the system approach.
Accordingly, initially physical models are generated and then they are stated in DXF format. Thereafter, models can be both visualized and applied virtual reality.
2.1 Three Dimensional Modeling
Drill holes constitute the database of the system. Several interpolation techniques may utilize the database and make estimations at nodes of a grid
Open pit mines can also be designed using pit base polygon, bench height, width, and slope angle (Fig. 4 and Fig. 5).
Figure 4. Pit base polygon (Erarslan, 2000).
300
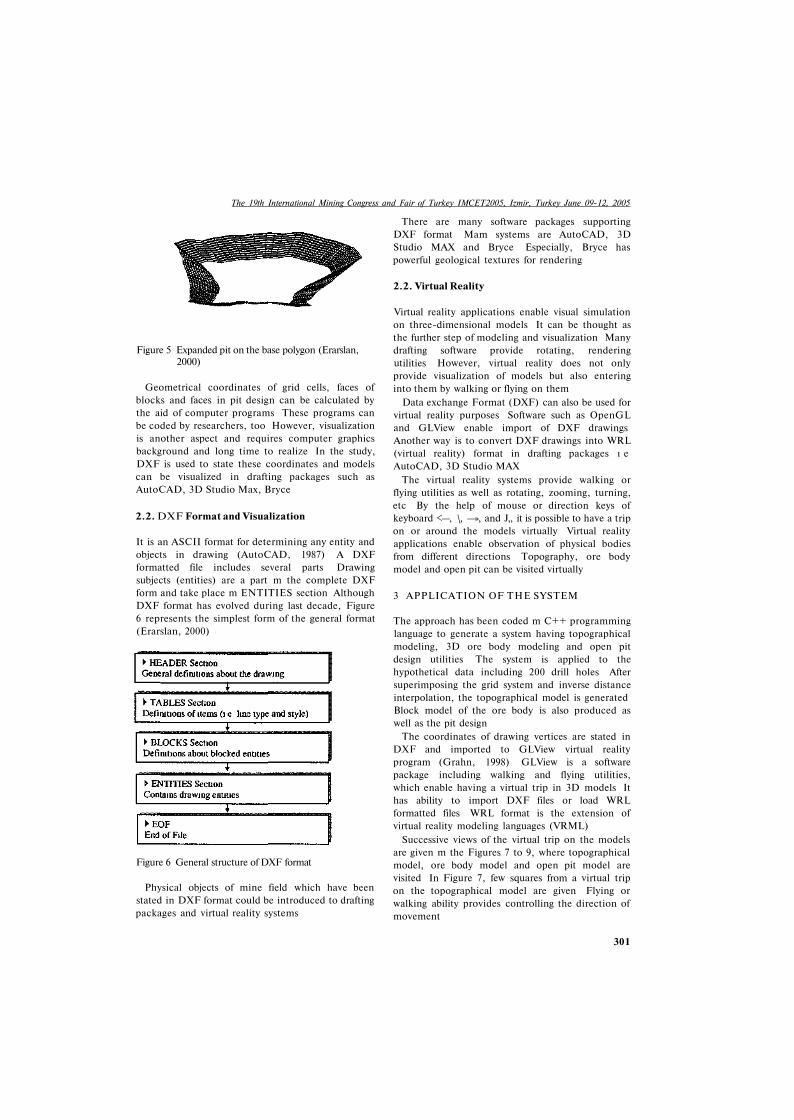
The 19th International Mining Congress and Fair of Turkey IMCET2005, Izmir, Turkey June 09-12, 2005
Figure 5 Expanded pit on the base polygon (Erarslan, 2000)
Geometrical coordinates of grid cells, faces of blocks and faces in pit design can be calculated by the aid of computer programs These programs can be coded by researchers, too However, visualization is another aspect and requires computer graphics background and long time to realize In the study, DXF is used to state these coordinates and models can be visualized in drafting packages such as AutoCAD, 3D Studio Max, Bryce
2.2. DXF Format and Visualization
It is an ASCII format for determining any entity and objects in drawing (AutoCAD, 1987) A DXF formatted file includes several parts Drawing subjects (entities) are a part m the complete DXF form and take place m ENTITIES section Although DXF format has evolved during last decade, Figure 6 represents the simplest form of the general format (Erarslan, 2000)
Figure 6 General structure of DXF format
Physical objects of mine field which have been stated in DXF format could be introduced to drafting packages and virtual reality systems
There are many software packages supporting DXF format Mam systems are AutoCAD, 3D Studio MAX and Bryce Especially, Bryce has powerful geological textures for rendering
2.2. Virtual Reality
Virtual reality applications enable visual simulation on three-dimensional models It can be thought as the further step of modeling and visualization Many drafting software provide rotating, rendering utilities However, virtual reality does not only provide visualization of models but also entering into them by walking or flying on them
Data exchange Format (DXF) can also be used for virtual reality purposes Software such as OpenGL and GLView enable import of DXF drawings Another way is to convert DXF drawings into WRL (virtual reality) format in drafting packages ı e AutoCAD, 3D Studio MAX
The virtual reality systems provide walking or flying utilities as well as rotating, zooming, turning, etc By the help of mouse or direction keys of keyboard <—, \, —», and J,, it is possible to have a trip on or around the models virtually Virtual reality applications enable observation of physical bodies from different directions Topography, ore body model and open pit can be visited virtually
3 APPLICATION OF THE SYSTEM
The approach has been coded m C++ programming language to generate a system having topographical modeling, 3D ore body modeling and open pit design utilities The system is applied to the hypothetical data including 200 drill holes After superimposing the grid system and inverse distance interpolation, the topographical model is generated Block model of the ore body is also produced as well as the pit design
The coordinates of drawing vertices are stated in DXF and imported to GLView virtual reality program (Grahn, 1998) GLView is a software package including walking and flying utilities, which enable having a virtual trip in 3D models It has ability to import DXF files or load WRL formatted files WRL format is the extension of virtual reality modeling languages (VRML)
Successive views of the virtual trip on the models are given m the Figures 7 to 9, where topographical model, ore body model and open pit model are visited In Figure 7, few squares from a virtual trip on the topographical model are given Flying or walking ability provides controlling the direction of movement
301

K Erarslan
Figure 7 Virtual trip on the topographical model
Direction can be manipulated by arrow (direction) keys on the board or mouse Speed of action can also be adjusted by the software system Background color or figure determination, shading, rendering, rotating, turning, texture covering, camera controls are other utilities of GLView system
A virtual leality application on 3 dimensional ore body block model is given in Figure 8 Camera is positioned to fly around the model Extensions of the ore body could be observed easily Figure 9 represents a trip m the open pit mine that is designed for the ore body It is possible to either walking on the benches or flying over the pit
302
Figure 8 Flying on and around 3D block model
Figure 9 Virtual reality application at the pit

The 19th International Mining Congress and Fair of Turkey IMCET2005 Izmir, Turkey June 09 12 2005
4 CONCLUSION
In this research, virtual reality applications on mine fields are studied. Difficulty of generation of a computer graphics system is overcome by Data exchange Format (DXF) A system is coded in C++ to model topography, ore body block model and open pit design The system outputs model drawings in which could be processed by many drafting and virtual reality software packages Generated 3D models are introduced to GLView virtual reality system and objective is reached The methodology used m the approach reduces the works to coordinate calculation of vertices
REFERENCES
Arnold, B, Bethell, P, Porterfield, T, 2001 "Visualizing a better prep plant". Coal Age, Overland Park, April, Vol 106, Issue 4, pp 45-46
AutoCAD, 1987 The AutoCAD Diaftmg Package, AutoDESK, Inc , p 443
Datamme, 2003 Datarmne Studio v 2, Catena Systems, Wells, United Kingdom www datamme co uk
Denby, B and Schofield, D, 1999 "Role of virtual reality in safety training of mine personnel". Mining Engineenng,Littleton, Oct, Vol 51, No 10, pp 59-64
Erarslan, K , 2000 ' A Practical Approach For Open Pit Design And Visualisation ', Mıneı al Resources Engineering, 9, No 3, pp 313-321
Erarslan, K , 2001 "Visual Aspect of Mme Evaluation, A Case Study", 17"' Intl Mining Congress and Exhibition of Tut key, Ankara, pp 825-829
GDM, 2003 BRGM International Division, Orléans • Cedex, France www brgm fr
GemCom, 2003 GEMCOM, Inc, Canada www gemcomsoftware com
Grahn, H , 2003 http //download com com/3000-2378-890374 html''tag=lst-0-l
Lynx Mining, 2003 MicroLynx Systems, Qld, Australia www lvnxmining com au
MineSight, 2003 MinTech, Inc , Tucson, Arizona, USA v. ww mmtec com
Mmex, 2003 ECS Minex Mining System v 4, Denver, USA www minex com
Surpac Vision, 2003 Surpac Software International Ltd , United Kingdom ww w suipac com
Techbase, 2003 Techbase International, Lakewood, Colorado, USA www techbase com
303


The 19th International Mining Congress and Fair of Turkey, 1MCET2005, İzmir, Turkey, June 09-12, 2005
An Approach to Reliability Allocation Problem in a Mining System
M. Kumral Department of Mining Engineering, Inonu University, Malatya, Turkey
ABSTRACT: Throughout the design of a mine system, the reliability of system should be assessed. When the estimated reliability is inadequate, how to satisfy a reliability target is significant problem. Selection of a mine production design requires maximizing system reliability. The minimum required reliability for each subsystem of a mine system should be estimated so as to accomplish a system reliability objective with minimum cost. A minimum reliability should be allocated to each sub-system with regard to the cost of increasing reliability. The objective is to develop a mine production design that will achieve the desired reliability while performing all sub-system functions at a minimum cost. This requires a balancing act of determining how to allocate reliability to the sub-systems in the system. In this research, the problem is solved by genetic algorithms (GA).
1 INTRODUCTION
A mining system contains sub-systems such as drilling, blasting, loading, hauling and hoisting. In order to ensure pre-defined system reliability, the minimum required reliability for each component should be estimated. The problem is to seek a trade-off between cost of increasing reliability and satisfactory reliability to guarantee safety and customer orders. There are many researches on the reliability in mining context (Kumar and Huang, 1993, Roy et. al, 2001, Venegas etat. 2003 and Hall et. ai, 2003). These researches focused on the analysis of mean time to failure (MTTF) and mean time to repair it (MTTR). In the first stage of these researches, the system is defined and sub-systems are identified and coded. Then, data are analyzed for verification of the identically and independently distributed (IID) assumption. A theoretical probability distribution is fitted to MTTF and MTTR data for sub-systems. Finally, reliability parameters of system and each sub-system are estimated. This paper takes previous researches a step further by determining optimal reliability allocation for each sub-system such a way as to reach predefined system reliability.
In order to improve the system, the parameters described in five sub-systems should be improved. This mprovement, of course, requires cost. Depending
upon sub-system complexity, geological and geome-chanical factors, and technological restrictions, imT
provability of each sub-system varies to each other. Relative importance of each sub-system is determined by feasibility concept (Mettas, 2000). Because of the reasons given above, some sub-system can improved more costly (Figure 1).
Figure 1. Effect of feasibility on cost
2 GENETIC ALGORITHMS
The problem is solved by the GA, which is a stochastic search algorithm that mimics the process of natural selection and genetics (Goldberg 1989, Reeves 1993, Davis 1991, Haupt & Haupt 1998). The GA has exhibited considerable achievement in yielding
305

M Kumral
good solution to many complex optimization problems When the objective functions are multi-model or the search space is irregular, highly robust algorithms are required so as to avoid trapping at local optima The GA can reach the global optimum fairly Furthermore, the GA does not require the specific mathematical analysis of optimization problem The GA is an iterative algorithm that yields a pool of solutions at each iteration Firstly, the pool of initial solutions is generated at random A new pool of solutions is created by the genetic operators at new iteration Each solution is evaluated with an objective function This process is repeated until the convergence is reached
A solution is called a chromosome or string The GA with an initial set of randomly generated chromosomes called a population The number of individuals m the population is called the population size The objective function is known as the evaluation or fitness function A new population is created by the selection process using some sampling mechanism An iteration of the GA is called a generation All chromosomes are updated by the reproduction, crossover and mutation operators m each new generation The revised chromosomes are also called the offspring
Simple algorithm of the GA consists of the following steps 1 Generate an initial population of strings 2 Evaluate the string according to the fitness func
tion 3 Apply a set of genetic operators to generate a
new population of strings 4 Go Step 2 until a solution converges
3 PROBLEM DESCRIPTION
Binary or floating vector can be used as the representation structure m the GA In this research a floating vector represents a real value of a decision variable as a chromosome because binar> coding has received substantial criticism (Liu 1998) When the values of the decision variables are continuous, it is necessary to represent them by a floating vector Furthermore, real-valued GA can ensure the values of decision variables to the full machine precision The real valued GA also has the advantage of requiring less storage than the binary valued GA As the number of bits in binary coding representation increases, the storage becomes important The representation of the fitness function in real valued GA is also more accurate as a result
306
The length of the vector of floating number is same as the solution vector The chromosome V=(x:, X2, ,x„) represents a solution x - (xi, xz, , x„) of the problem where n is the dimension In order to solve the problem by the GA, each solution is coded by a chromosome V(xi, X2, ,x„) A pre-defined integer population-size, which is the number of chromosomes, is initiated at random
do i=l, population-size chrt = x. =(r„ *(xupp. - xlow; ))+xlow. (j = l.nvan)
enddo
Until the pre-determined population size is reached, the feasible solutions are accepted as chromosomes in the population Then the fitness value of each chromosome is calculated The chromosomes are rearranged in ascending order on the basis of the fitness values
Now the parameter, a, is initiated in the genetic system The rank-based evaluation function is defined as follows E(V,) = a(l a)'1 i = l,2, , population-size (1)
When i = 1 represents the best individual, ı = population-size is the worst individual The reproduction operator used herein is a biased roulette wheel, which is spun population-size time A single chromosome is selected in each spinning for a new population The roulette wheel is a fitness-proportional selection The selection process is as follows
1 The cumulative probability q, is calculated for each chromosome
, population - size
2 A random number r is drawn m (0, qp„p„ı„m„ „ J) 3 The chromosome V, is selected such that q, t< r
4 The second and third steps are repeated population-size time
This population is updated by the crossover and mutation operators First of all, the crossover probability, Pc, is defined Pc * population-size gives the expected value of number of chromosomes undergoing on the crossover process In order to carry out this process, random numbers, r„ are generated from interval [0, 1] in ; = 1, population size If r, is smaller than />„ V, is selected as a parent The selected chromosomes are randomly grouped as pairs If the number of selected chromosomes is odd, one

The 19th International Mining Congress and Fair of Turkey, IMCET2005 Izmir Turkey, June 09-12, 2005
of them ıs removed from the system. The crossover procedure is performed on each pair Let the pair (Vj, V2) be subjected to the crossover operation Firstly, a random number, r, is generated from the interval (0, 1) Then the crossover operator will yield two children X and Y as follows
(2) The feasibility of each child is checked If so, the child is accepted
The mutation operator is implemented on new version of population Similar to the crossover operation, a mutation probability, P,„, is defined P,„ * population-size gives the expected value of number of chromosomes undergoing the mutation operation In this procedure a random number, r„ is generated i=l to population-size from the interval [0, 1] If r, smaller than Pm V, is selected as a parent for the mutation A random direction, d, is generated m 31 3
The selected parent will be mutated by V + M*d in this direction A proper large number, M, is also initiated m this section
If V + M*d is not feasible to the constraints, M ıs set as a random number from interval [0, M] until it is feasible If this procedure does not manage to find a feasible solution m a pre-determıned number of iterations, M ıs set to zero
Thus one generation is completed All procedure is implemented up to the pre-determıned number of iterations After finishing the program, the best solution is reported as the results yielding the minimum cost of increasing system reliability
4 APPLICATION
tamable reliability of sub-system ( at time /, Ä ( m m(0
is reliability estimation of sub-system ( at time t, f, is feasibility of increasing reliability of sub-system ı The objective shows exponential behaviour The objective contains three parameters / is the feasibility of increasing a sub-system reliability and varies between 0 and 1 As/ approaches to 1, the improvement of system reliability is more difficult and expensive
The technique was demonstrated on a hypothetical data Mining system comprises seven basic operations (sub-systrms) such as drilling, blasting, loading, hauling, hoisting, ventilation and draining Maximum available reliabilities and feasibilities were estimated from old data and experiences These data is given in Table 1
Table 1 GA parameters and reliability data 30 \number of chromosome 200 \number of iterations 7 \number of subsystems in each face 0 68 0 92 0 80 \min-max reliabilities and feasibility (1) 0 78 0 95 0 75 \mm-max reliabilities and feasibility (2) 0 74 0 97 0 30 \mm-max reliabilities and feasibility (3) 0 67 0 94 0 60 \rmn-max reliabilities and feasibility (4) 0 78 0 93 0 80 \mm-max reliabilities and feasibility (5) 0 88 0 95 0 50 \mm-max reliabilities and feasibility (6) 0 91 0 99 0 90 \mm-max reliabilities and feasibility (7) 0 05 \parameter (a-( 1 -a)i-1 ) 0 30 \crossover probability 0 5 \a large positive number 0 15 \mutation probability 0 50 \required reliability
The problem is expressed as minimization of cost of per cent increasing reliability m such a way as to meet minimum reliability requirement
(3)
Subject to
(4)
; = 1, ,;var (5)
(6)
Where jvar is the number of decision variables attributed to the reliabilities, R,(ı jıs reliability estimation of sub-system ; at time t, Rs(t) is the required system reliability at time t, R,ımK(t) is maximum at-
in order to solve the problem with the GA, a computer program was written There is no clear rule for the selection of control parameters (the population size, parameter a, crossover and mutation probability) Therefore, the parameters were determined by the experimentation It was observed that small population size led to the GA to quickly converge at a local optimum On the other hand, large population size was prohibitively time consuming High the parameter a, crossover and mutation probability caused to convert the GA into a random search Low the parameter a, crossover and mutation probability caused to tiap at local optima The procedure was repeated 300 times in approximately 15 minutes, the best solutions were given in Table 2
307

M Kumral
Table 2 Optimal results
Cost Sub-system 1 Sub-system 2 Sub-system 3 Sub-system4 Sub-system 5 Sub-system 6 Sub-system 7
8 783957 0 8848201 0 9005929 0 9672122 0 9255640 0 8447140 0 9023753 0 9267560
System reliability 0 5039344
5 CONCLUSIONS
In order to avoid important safety, quality and contractual losses, a mining production system should be operated m pre-defined reliability In this research, the minimum required reliability of each sub-system was estimated to achieve the required system reliability with minimum cost This allocation problem was formulated as a constrained optimization problem and solved by the GA The results showed that the GA was very powerful method for the reliability allocation problem As long as the equation of system reliability is derived, the approach can be used to solve problem
REFERENCES
Davis, L, (1991) Handbook of genetic algorithms New York VN Reinhold
Goldberg, DE (1989), Genetic Algorithms in Search, Optimization and Machine Learning Addison Wesley Pub Co
Hall, RA & Daneshmend, L K , (2003) Reliability Modelling of Surface Mining Equipment Data Gathering and Analysis Methodologies, International Journal of Surface Mining, Reclamation and Environment, 17(3), 139-155
Haupt R L & Haupt S E , (1998) Practical genetic algorithms John Wiley & Sons
Kumar U & Huang, Y , (1993) Reliability analysis of a mine production system- A case study, In Proceedings Annual Reliability and Maintainability Symposium, 167-172
Mettas, A , (2000) Reliability allocation and optimization for complex system, m http //www reliasoft org/pubs/2000rm_087 pdf, 6 p
Reeves, C R , (1993) Genetic algorithms In C R Reeves (ed), Modem heuristic techniques for combinatorial problems, 151-188, Blackwell Pub
Roy S K, Bhattacharyya M M & Naıkan V N A, (2001) Maintainability and reliability analysis of a fleet of shovels Trans of IMM (Sect A Mining Technology), 110(2), 163 171
308

The 19th International Mining Congress and Fair of Turkey, IMCET2005, Izmir, Turkey, June 09-12, 2005
Optimization of Çayeli(Çbi) Grinding Circuit By Modelling And Simulation
L. Ergün, Ö. Giilsoy, M. Can & H. Benzer Department of Mining Engineering, Hacettepe University, Ankara, Turkey
ABSTRACT: In this study, optimization of the ÇBİ grinding circuit after installation of tertiary crusher was carried out using modelling and simulation techniques. A detailed sampling survey was performed and size distributions of the samples were determined by the combination of wet sieving and cyclosizing down to 8.8/tm. Bond Work Index and breakage characteristics of the feed sample were determined by standard Bond test and drop weight test, respectively. After mass balancing studies, using the mass balanced data, the models for both ball mills and hydrocyclones were developed. The existing performance was predicted using only measured size distribution and tonnage of the fresh feed. The predicted size distributions, tonnages and cyclone parameters were in very good agreement with the measured data. The fineness and solids content of the flotation feed was %72.4 -36jim and 42.6% solids by weight respectively obtained during the survey were taken as target values in the simulation studies. The effects of feed rate and size distribution, solids content of cyclone feed, grindability of the ore, ball size, apex and vortex finder diameter were investigated by computer simulations. The results showed that performance of the existing circuit could be improved. Optimum apex and vortex finder diameters were found to be 75 mm and 125 mm, respectively. The fineness of the flotation feed could be increased and circulating load could be further decreased by using 20 mm balls in the secondary mill.
1 INTRODUCTION
Simulation of the grinding circuits using mathematical models of the mills and classifiers is a technique which is being used increasingly in comminution because of its low cost and its ability to consider many variables simultaneously. Its value depends on the accuracy of the models. The problems with these which encountered for several years are diminishing as experience with simulation is being gained in the design and optimisation of grinding circuits and models are being refined.
Simulation would provide the quantified information about the effects of the proposed changes on the circuit performance in terms of size distribution, solid and water flowrates etc. Such information could then be used to check the suitability of the existing equipment to the modified conditions, and for equipment selection. It could also be used to estimate the improvement expected in the downstream flotation circuit performance.
ÇBİ grinding circuit has been modified during the years to improve the performance. After installation
of single stage classification instead of double stage the annual capacity has increased to 1,000,000 tons. This has also improved control over classification and simplified the operation (Aksam and Mian, 2003). Then, to further improve the capacity and performance, a tertiary crusher has installed in the crushing circuit.
The aim of the study is to investigate optimum operating variables in ÇBİ grinding circuit using modelling and simulation techniques, after installation of tertiary crusher.
For this purpose sampling survey was carried around the circuit. After mass balancing, using the size distributions and tonnages, models for ball mills and hydrocyclones were developed. Finally, the effects of operating parameters on the circuit performance were investigated by computer simulations.
2. MODELS USED
309

L Ergun O Gulsoy M Can & H Benzer
For the ball mills and hydrocyclones, the models developed in Julius Kruttschnitt Mineral Research Center were used (Napier-Munn, et al, 1996) Ball MM Model (3)
Perfect mixing modelling approach is used for ball mill modelling (Lynch, 1977) The model considers a ball mill or a section of it as a perfectly stirred tank Then, the process can be described m terms of transport through the mill and breakage within the mill
Because the mill is perfectly mixed, a discharge rate, d„ for each size fraction is an important variable in defining the product
p, = d, s,
The equations for steady state operations are,
or, by substituting s, with
(1)
(2)
where, Feed rate of size fraction ı (tVh) Product rate of size fraction ı (t/h) The mass fraction of partide of size that appear at size i after breakage Breakage rate of particle size ı (h ') Amount of size ı particles inside the mill (t) The discharge rate of particle size (h ')
If the breakage distribution function is known, calibrating the model to a ball mill involves the calculation of r / d values using the feed and product size distributions obtained under particular operating conditions Where the size distribution of the mill content is available, breakage rates and discharge rates can be calculated separately
Hydrocylone Model
Hydrocyclone classifiers are modelled using the model developed by Nageswararao (Napier-Munn, et al, 1996) The model is based on efficiency curves for classifiers The general form of the equation is presented below This equation is capable of defining fish hook type efficiency curves
310
where E„a The actual efficiency expressed as the particles
reporting to overflow C The propı rtıon of feed particles which are subjected
to the classifying action within a classifier ( = 1 bypass)
a A model parameter defining the sharpness of classification
ß A model parameter defining the fish hook ß* A dummy parameter introduced to the model to
preserve the definition of d50c ( ı e d=d50c when E=(1/2)C )
d, Particle size d50c The corrected cut size which is defined as the size
which divides equally between underflow and overflow due to classification only
Nageswararao developed a number of empncal equations defining the relationship between operating and geometrical variables of hydrocyclones, and model parameters including d 5 0 c and water recovery (Napier-Munn, etal, 1996) There are also four calibration constants in the equations which are used to define material characteristics The model could be used to predict cyclone inlet pressure and roping conditions when operating variables are changed The calibration of hydrocyclone model involves the calculation of the best fit values a, ß, d50c and C to the plant data The calibration constants defining the dependence of d50c capacity, water recovery and volumetric recovery on operating geometrical variables are also determined If fish hook behaviour does not exist, then ß ıs taken as equal to one
When a cyclone model is calibrated, material charactencs in relation to its behaviour in classifying circuit is determined The parameters fitted to the experimental data are material specific After the calibration, the effects of all operating and geometrical variables on the seperator performance could be investigated by simulation (Napier-Munn, et al, 1996)
2. SAMPLING SURVEY AND DATA ANALYSIS
A detailed sampling survey was performed at 132 dmtph (dry metric ton per hour) Samples were taken from each stream in the circuit and solids content of all samples were determined The simplified flowsheet with the marked sampling points on it are given in Figure 1 and the geometrical parameters of

The 19th International Mining Congress and Fair of Turkey, IMCET2005, İzmir, Turkey, June 09-12, 2005
the equipments and the measured data are presented in Table 1.
Sump Water Addition (m3/h) 132.08-132.0
Figure 1. Simplified flowsheet of ÇBI grinding circuit and sampling points.
Table 1. Main operating and design conditions for the sampling survey
Mill Outer Diameter (mm)
Mill Length (mm)
Liner Thickness (mm)
Mill Speed
Critical Speed (Cs)
% C s
Ball Size(mm)
Power (kW)
Diameter (mm)
Inlet Diameter (mm)
VF diameter (mm)
VF length (mm)
Apex diameter (mm)
Cylinder length (mm)
Cone angle (°)
Primary Ball Mill
3200
4300
100
17.4
24.7
70.5
100
560
Se-ondary Ball Mill
4400
7200
50
15.4
20.55
74.9
40
2160
Hydrocyclone
371.2
152
130
276
70
360
10
Feed Tonnage (wet) PBM (kW)
SBM (kW)
Cyclone Pressure (bar) Cyclone Feed Density (t/m3)
Cyclone Feed % Solids
Flotation Feed % Solids PBM Water Addition (m3/h)
135.66-136 511.57-512
1958.14-1958 0.85
1.85 61.74-61.7
41.47 28.95-29.0
Size distributions of the samples were determined by the combination of wet sieving and cyclosizing down to 8.8jMn. Bond grindability and work index of the plant feed were determined using standard Bond test for 74 micron test sieve. Bond index of the feed sample was measured as 9.70 kWh/t. Breakage distribution of the material was determined using drop weight test apparatus built at Hacettepe University Laboratories. The breakage function of the mill feed is given in Figure 2.
Figure 2. Breakage Functions of different size fractions of the mill feed
The size distribution and breakage data were used for the mass balancing studies.
3. MASS BALANCING STUDIES
In any sampling operation, the occurence of some errors are inevitable. These errors result from dynamic nature of the system, physical conditions at particular point, random errors, measurement errors and human errors. Mass balancing is the key to eliminate these errors statistically. Mass balancing of the raw data was accomplished by using JKSimMet software.
During the mass balancing studies, all the flow rates and the percent solids around the circuit were calculated as given in Figure 3. The results of the size distributions of raw and adjusted data of the streams around the circuit are given in Figure 4.
311

L. Ergün, Ö. Gülsoy, M. Can & H. Benzer
Figure 3. The simplified flowsheet after mass balancing
The actual and corrected performance curves of the hydrocyclone are given in Figure 5. The hydrocyclone was operating with 30 % water recovery to underflow and the actual cut size was about 40 fixa.
Figure 5. The actual and corrected performance curves of the hydrocyclone
4. MODELLING AND SIMULATION
For the calculation of model parameters, the mass balanced data obtained from the survey were used. For the ball mills, using drop weight breakage function, r/d knots were calculated for the existing operating conditions. For the hydrocyclones, the model parameters in Nageswararo model were calculated. Average of the individual apex diameters of the cyclones were used. JKSimMet software were used for the calculation of model parameters.
Model parameters for ball mills and hydrocyclones are given at Table 2 and 3, respectively.
Table 2. r/d knots for the ball mills
Figure 4. The measured and calculated size distributions
primary ball mill size(mm)
0.03
0.2 1.5 15
ln(r/d) -1.38
-0.01638 3.99 12.03
secondary ball mill size(mm)
0.03
0.08 0.2 1
ln(r/d) -1.91
0.5595 2.3 4,.2
Table 3. Model parameters for the hydrocyclone.
KD0 (d50) KQ0 (Capacity) KV1 (Volume split) KW1 (Water split) a 3
6.45E-05 353.19 8.99 6.34 1.59
0.7796
The models fitted very good to the data and were found to be convenient for simulation studies. Then, using these models and by entering only tonnage and
312

The 19th International Mining Congress and Fair of Turkey, 1MCET2005, Izmir, Turkey, June 09-12, 2005
size distribution of the fresh feed, the size distributions and mass flow rates were calculated.
In Figure 6, simulated and mass balanced size distributions are presented. As can be seen from the figures, the simulated size distributions were in a very good agreement with the mass balanced data. The cyclone operating pressure and tonnages of the streams were also very well predicted. The detailed results for the simulation of existing condition are given in Table 4.
Solids [tph]
Solids [%]
% Passing
36am
80 %Pas (fim)
CYCLONE O/F
Mass
Bal
132
43 7
73 24
41
Sim
132
42 6
72 44
43
CYCLONE U/F
Mass
Bal
313 01
78 9
IS 43
249
Sim
313 09
77 9
15 42
240
Corrected dsn {mm)
Cyclone pressure
(bar)
Water split to O/F
<*)
Meas
0 04934
0 85
65 99
Sim
0 05000
0 84
66 7
Figure 6.The simulated and mass balanced size distributions around the circuit
Table 4. The detailed results for the simulation of existing condition.
Solids [tph]
Solids [%]
% Passing
36pm
80.0% Pas.
(fLftl)
Solids [tph]
Solids [%]
% Passing
36am
80% Pas.
(am)
PBM FEED
Mass
Bal
132
80
9 57
6130
Sim
132
80
9 57
6130
SBM DISCHARGE
Mass
Bal
313 01
78 9
36 84
99
Sim
313 09
77 9
36 53
98
PBM DISCHARGE
Mass
Bal
132
8u
22 56
469
Sim
132
80
22 38
455
CYCLONE FEED
Mass
Bal
445
62 2
32 59
165
Sim
445 07
62 5
32 33
163
As the simulation of existing condition was found to be successful, then various alternatives for the grinding circuit were evaluated. 4.1. Effect of feed rate
The effect of feed rate was investigated in the range of 132-160 dmtph.
The effect of feed rate on circulating load tonnage and primary ball mill discharge fineness are shown in Figure 7.
Figure 7. The effect of feed rate on circulating load tonnage and primary ball mill discharge fineness
The results showed that circulating load tonnage increases with increasing feed rate. The circulating load ratio decreases from 237% for 132 dmtph feed rate to 231 % for 160 dmtph.
Primary ball mill discharge became coarser with the increase in feed rate. P80 sizes for the 132 dmtph feed and 150 dmtph are 455/un and 478 /im, respectively.
The effect of feed rate on cyclone operating pressure and secondary ball mill discharge fineness are shown in Figure 8.
313

L Ergün, Ö. Gülsoy, M. Can & H. Benzer
120 125 130 135 140 145 150 155 160 165
leedraîefttolpb)
Figure 8. The effect of feed rate on cyclone operating pressure and secondary ball mill discharge fineness
As expected, an increase in feed rate causes an increase in cyclone operating pressure. P80 of secondary ball mill discharge slightly increased from 98/tm to 104/im with the increase of feed rate from 132 dmtph to 160 dmtph. The effect of feed rate on cyclone feed P80 and % solids are shown in Figure 9. As can be seen from the figure, both values increased with increasing feed rate. For the feed rates above 150 dmtph, cylone feed % solids should increased to over 63.5% by weight (28.3% solids by volume) to obtain a flotation feed having 42.6% solids by weight. This can be considered as a limit for a reliable cyclone operation.
Figure 9. The effect of feed rate on cyclone feed P80 and % solids
Figure 10. The effect of feed rate on flotation feed fineness
For the feed rate upto 145 dmtph P80 of the flotation feed was 43/im, above this feed rate, P80 increased only 1 jum. The amount of material passing 36/wn varies between 71 and 72.4%.
4.2. Effect of cyclone feed % solids
The effect of cyclone feed % solids was investigated in the range of 61-63.5%. The feed rate was kept constant at 132 dmtph.
The effect of cyclone feed % solids on circulating load tonnage and secondary ball mill discharge fineness are shown in Figure 11.
Figure 11. Effect of cyclone feed % solids on circulating load tonnage and secondary ball mill discharge fineness
The effect of feed rate on flotation feed P80 and % passing 36/im are presented in Figure 10.
As the cyclone feed % solids increases, circulating load decreases. Each 0.5% increase in cyclone feed % solids increased fineness of secondary ball mill discharge about 1 jim. It can be concluded that secondary ball discharge did not significantly affected by cyclone feed density.
314

The 19th International Mining Congress and Fair of Turkey, IMCET2005, Izmir, Turkey, June 09-12, 2005
The effect of cyclone feed % solids on corrected dw and operating pressure of the cyclone are given in Figure 12.
Figure 12. Effect of cyclone feed % solids on d50 and operating pressure of the cyclone
Increasing feed density increases cut size, while decreases pressure due to decrease in cyclone underflow tonnage. The change in the d5o is significant and it was 44 /xm for 6 1 % and increased 2 fim for each 0.5% increase in cyclone feed % solids. Both cyclone feed and underflow became coarser with the increase in cyclone feed % solids. This is illustrated in Figure 13.
Figure 13. Effect of cyclone feed % solids on P80 of cyclone feed and underlow
The effect of cyclone feed % solids on flotation feed P80 and % passing 36jnm, and on flotation feed and cyclone underflow % solids are presented in Figure 14 and 15, respectively.
Figure 14. The effect of cyclone feed % solids on flotation feed fineness
cyclone feed S sclids
Figure 15. The effect of cyclone feed % solids on flotation feed and cyclone underflow % solids
The flotation feed became coarser as the cyclone feed density increased. Therefore, to keep flotation feed fineness constant, cyclone feed density should strictly be controlled. On the other hand, as it can be seen from Figure 15, there is a margin for decreasing cyclone feed density to reduce flotation feed density while keeping it in acceptable limits. In this case, it could be possible to increase the fineness of flotation feed when necessary.
4.3. Effect of size distribution of the fresh feed.
The effect of size .distribution \\ as investigated using the size distributions of samples taken during the sampling surveys and for t lie size distribution of fresh feed before installation ı l tertiary crusher.
The P80 sizes of the samples were between 5.68 mm and 7.20 mm during the surveys. Simulation studies showed that this variation did not effect the performance significantly. The only remarkable effect was on primary ball mill discharge and for the finest feed, P80 of which was 446 /tm while for the coarsest it was 482 ftm.
315

L Ergiin, Ö. Gülsoy, M. Can & H. Benzer
These size distributions are shown in Figure 16 and summarized in Table 5.
Figure 16. Fresh feed size distributions used in simulation studies
Table 5. Fresh feed size distnbutions used in simulation studies.
F90(mm) F80 (mm) F50 (mm) F20(mm)
finest 9.18 6.13 1.11 0.14
medium 10.53 7.00 1.31 0.15
coarsest 13.20 8.15 1.58 0.17
The effect of feed size distribution on circulating load and corrected of the cyclone and primary and secondary ball mill discharge finenesses are shown in Figure 17 and 18, respectively. The effect of feed size distribution on cyclone pressure was very small therefore was not given in the figures.
Circulating load increased from 317 dmtph to 331 dmtph from the finest to coarsest feed and the corrected d,o increased from 51 /im to 53 /tm.
Figure 18. Effect of feed size distribution on primary and secondary ball mill discharge P80 sizes
The effect of feed size on P80 of the mill discharges was significant. Both mill discharges became coarser. The effect was more pronounced for secondary ball mill discharge.
Similar comments can be made for P80 of the cyclone feed and underflow which are shown in Figure 19.
Figure 19. Effect of feed size distribution on cyclone feed and underflow P80 sizes
The effect of feed size distribution on cyclone feed and underflow % solids are shown in Figure 20. Both values increased about 1% within range studied.
Figure 17. Effect of feed size distribution on circulating load and corrected d50
316

The 19th International Mining Congress and Fair of Turkey, IMCET2005, Izmir, Turkey, June 09-12, 2005
Figure 20. Effect of feed size distribution on cyclone feed and underflow % solids
The effect of feed size distribution on flotation feed P80 and % passing 36/tm is exhibited in Figure 21.
Figure 21. Effect of feed size distribution on flotation feed fineness.
As can be seen from Figure 21, flotation feed became coarser with coarser feed. However, the coarser size distributions tested can only be expected in any failure in tertiary crusher and serious blockage and material handling problems in the fine screening. Another simulation was run for the coarsest feed to increase the flotation feed fineness. In this case, cyclone feed density was decreased. The flotation feed % solids decreased to 41% solids by weight and hence % passing 36 jinx was increased to 71.7 %.
4.4. Effect of grindability of the fresh feed
During surveys the Bond indices of the ore were found to be almost constant as 9.70 kWh/t and 9.55 kWh/t. In an earlier study, grindabilities of different ore types were also measured (Ergiin et al., 2000). The highest Bond index was 10.46 kWh/t and the lowest was 8.68 kWh/t. Therefore, the effect of
grindability of the ore was investigated for these extremes and the grindability of this survey. Within the range studied, the effect of grindability was found to be minimum.
4.5. Effect of cyclone apex and vortex finder diameter
The effect of apex diameter on circulating load tonnage for different vortex finder diameters is shown in Figure 22.
60 65 70 75 80 85 90 95 100 105
apex diameterfmm)
Figure 22. Effect of apex diameter on circulating load tonnage.
As can be seen from Figure 22, as apex diameter increases the circulating load increases for all vortex' finders. The circulating load for the larger vortex finder diameters is less than smaller one. Since the effect of apex diemater is very pronounced, correct selection of it would be the key for successful operation. The effect of apex diameter on secondary ball mill disharge fineness is shown in Figure 23.
P80 size of the secondary ball mill discharge increases as apex diameter increases. However, no discernible trend was observed for different vortex finder diameters.
317

L. Ergün, Ö. Gülsoy, M. Can & H. Benzer
Figure 23. Effect of apex diameter on secondary ball mill discharge fineness.
Figure 25. Effect of apex diameter on cyclone feed % solids
The effect of apex diameter on cyclone feed fineness is given in Figure 24. As apex diameter increases, P80 of the cyclone feed decreases. For the same apex diameter, increasing vortex finder diameter gives a coarser cyclone feed.
60 65 70 75 80 85 90 95 100 105 apex diameter(mm)
Figure 24. Effect of apex diameter on cyclone feed fineness.
Cyclone feed % solids should be increased to obtain same flotation feed % solids for larger apexes. For the same apex diameter, the difference between the largest and the smallest vortex finder is about 1.5% solids.
The effect of apex diameter on corrected d̂ o of the cyclone is shown in Figure 26.
Figure 26. Effect of apex diameter on corrected d50
The effect of apex diameter on cyclone feed solids is shown in Figure 25.
As expected, an increase in apex diamater increases the corrected d50 value. Cyclone operating pressure increases with the increasing apex diameter (Figure 27).
318

The 19th International Mining Congress and Fair of Turkey, 1MCET2005, Izmir, Turkey, June 09-12, 2005
66 70 75 80 85 90 95 100 105
apex dıameter(mm)
Figure 27. Effect of apex diameter on operating pressure of the cyclone
underflow. For 70 mm and 90 mm apexes, the change in P80 values were in the order of 90 ßm. The cyclone underflow % solids sharply increases with the decreasing apex diameter. Although during simulations no roping was observed for the 70 mm apexes, cyclone underflow % solids were near to roping condition. It is evident that apex diameter smaller than 90 mm (base condition) would be useful.
The effect of apex diameter on flotation feed fineness is shown in Figure 30 and 31. From both figures, it can be seen that for the different apexes flotation feed fineness did not change significantly. For a given apex diameter as the vortex finder diameter increases, flotation feed becomes coarser.
The effect of apex diameter on cyclone underflow fineness and % solids are shown in Figure 28 and 29, respectively.
60 65 70 75 80 85 9 0 95 100 105
apex d i a m e t e r ( m m )
Figure 28. Effect of apex diameter on cyclone underflow fineness
60 65 70 75 80 85 90 95 100 105
apex diameter(mm)
Figure 29. Effect of apex diameter on cyclone underflow % solids.
60 65 70 75 80 85 90 95 100 105
apex diameterfmm)
Figure 30. Effect of apex diameter on flotation feed P80
apex d]ameter{mm)
Figure 31. Effect of apex diameter on flotation feed % passing 36 /mi
4.6. Effect of ball load and ball size
Cyclone underflow became finer with the increasing apexes due to increasing bypass to
The measured volumetric ball loads for primary and secondary ball mills during surveys were 43% and
319

L. Ergiin, Ö. GUlsoy, M. Can & H. Benzer
35%, respectively. Ball load in the primary ball mill was not changed in simulations. According to power calculations volumetric ball load in the secondary ball mill could be increased to 42%. Therefore, simulations were run for 40% and 42% volumetric ball load. Increasing ball load would increase the flotation feed fineness marginally from 72.4% -36/jm to 73.1% and 73.2% for 40% and 42% load, respectively. But practically at the plant conditions it is not possible to load the mill up to these values.
Using Bond formula, the top size of the balls for primary ball mill and secondary ball mill were calculated as 65 mm and 15 mm, respectively. However, considering the coarsest feed to the primary ball mill which is given in Figure 32, it should be larger than 70 mm. Therefore, only the effect of 20 mm ball size in the secondary ball mill was investigated without changing the ball size in PBM. All the conditions were kept constant as in the sampling survey, except ball size.
The performance of the circuit is shown in Figure
Figure 32. The performance of the circuit using 20 mm balls in secondary ball mill
The results showed that using 20 mm ball in the secondary ball mill would improve the performance of the circuit.
5. CONCLUSIONS
Modelling of ball mills and hydrocyclone were performed using the data collected from ÇBİ grinding circuit. The models predicted existing performance very well as given in Figure 4.
The results showed that performance of the existing circuit for 132 dmtph could be improved. Optimum apex and vortex finder diameters were found to be 75 mm and 125 mm, respectively. In this
case, circulating load ratio would be decreased from 2.4 to 1.8. It is suggested that both of them should be replaced after 10 mm wear. The fineness of the flotation feed could be increased and circulating load could be further decreased by using 70 mm balls in the primary ball mill and 20 mm balls in the secondary mill. In this case, fineness of flotation feed would be 75% -36/im.
Acknowlegment
The authors would like to thank ÇBİ Management for the financial support and for the permission to publish this paper, and also to Mill Staff for their efforts during the studies at Çayeli.
REFERENCES
Lynch, A.J. 1977. Mineral crushing and grinding circuits: their simulation, optimisation, design and control.E\sevier.340pp.
Napier-Munn, T.J., Morrel,S., Morrison, R.D.& Kojovic.T. 1996. Mineral comminution circuits: their operation and optimisation. JKMRC.413pp.
Ergün, Ş.L., Ersayın, S., Gülsoy, Ö.Y., Ekmekçi, Z., Can, M., Asian, A., 2000, Modelling and simulation of grinding circuit at Çayeli Bakır İşletmeleri A.Ş. (ÇBİ) flotation plant, Mineral Processing on the Verge of the 21" Century, Özbayoğlu et al. (eds), A.A.Balkema Publishers, pp65-70.
320