Embed Size (px)
Citation preview
www.nicholas.duke.edu/institute
A Path to Greenhouse Gas Reductionsin the United States: Economic Modelingof Interim National Targets
Prepared by the Nicholas Institute for EnvironmentalPolicy Solutions, Duke University
Brian Murray1
Martin Ross2
Etan Gumerman3
1 Nicholas Institute for Environmental Policy Solutions, Duke University2 RTI International3 Independent Consultant
September 2007NI WP 07-06
WORKING PAPER
A Path to Greenhouse Gas Reductions in the United States: Economic Modeling of Interim National Targets*
Brian Murray, Nicholas Institute for Environmental Policy Solutions, Duke University
Martin Ross, RTI International Etan Gumerman, Independent Consultant
September 2007
Abstract
Momentum is building in the U.S. to consider mandatory caps for greenhouse gas emissions. The U.S. Senate has expressed support for such action if it will not cause significant harm to the U.S. economy and will engage other countries. This position motivates the need for economic assessment of potential GHG restrictions on the U.S. economy. Toward that end, this study employs a computable general equilibrium model of the U.S. integrated into the global economy (ADAGE) and a detailed model of the U.S. energy sector (NI-NEMS) to examine the broad and deep economic implications of interim-term GHG cap-and-trade programs across sectors and regions of the U.S. economy over time. Interim target scenarios hold U.S. emissions to either 1990 or 2005 levels in the year 2020 and hold this level fixed beyond that. These 2020 emission targets are in the range of those now being considered by the U.S. Congress, though several of the Congressional proposals call for continued cuts beyond 2020. This study therefore provides a bounding assessment of the initial pathway to GHG reductions, one which can provide a first order assessment of “economic harm” and provides a platform for gauging the implications of longer term cuts should they be applied. Results suggest rather modest macroeconomic impacts on the U.S. economy of the GHG targets considered, though impacts tend to be concentrated, as expected, in the more energy intensive sectors. The electric power sector has some of the least costly options for reducing emissions through decarbonization of power generation and could end up being net sellers of GHG allowances to other sectors in a cap-and-trade program, depending on how the initial GHG allowances are allocated. In addition to synthesizing economic results from the interim targets modeled, the paper discusses the implications for longer term and deeper cuts beyond those considered here. * The authors gratefully acknowledge the comments of Eric Williams, Richard Newell, and Tim Profeta, as well as the feedback of corporate participants in the Nicholas Institute Climate Policy Process. Any errors or omissions are the responsibility of the authors. This work is an analytical assessment of policy options and not advocacy of policy positions by the Nicholas Institute or Duke University.
A Path to Greenhouse Gas Reductions in the US: Economic Modeling of Interim National Targets
1. INTRODUCTION
Since 2003, when legislation was first introduced in the U.S. Senate calling for
mandatory restrictions on the emission of greenhouse gases, momentum has been
building for a federal mandate to cap greenhouse gases (GHGs). The fall elections of
2006 seemed to provide the now-proverbial “tipping point” that has accelerated
momentum toward such a mandate. While the tipping point analogy might derive from
the notion that Democrats gained control of both houses of Congress, federal climate
policy proposals include sponsors from both parties. Just nine days after the 2006
election, Senator John McCain (R-Arizona) announced that he planned to reintroduce
with Senator Joseph Lieberman (D-Connecticut) a revised version of their Climate
Stewardship Act that they had previously introduced, arguing that the time was here to
implement a federal GHG mandatory policy. Additional proposals by other legislators
from both political parties have since been introduced.
One of the critical elements of political viability for a federal climate bill is whether it is
deemed economically sound. Toward this end, in 2005 the U.S. Senate passed the
following Sense of the Senate resolution1
Congress should enact a comprehensive and effective national program of
mandatory, market-based limits and incentives on emissions of greenhouse
gases that slow, stop, and reverse the growth of such emissions at a rate and
in a manner that--
(1) will not significantly harm the United States economy; and (2) will encourage comparable action by other nations that are major trading partners and key contributors to global emissions.
In essence, the Senate recommended mandatory greenhouse gas limits as long as such
limits do not cause great economic distress in the United States and do not let other key
emitting nations off the hook. While this leaves open the question of what constitutes
1 Congressional Record – Senate – S7053 - June 22, 2005
Nicholas Institute 2 9/28/2007 2
A Path to Greenhouse Gas Reductions in the US: Economic Modeling of Interim National Targets
“significant economic harm,” it nonetheless creates a need for rigorous economic studies
of alternative greenhouse gas limits for the U.S. economy. The purpose of this paper is to
help fill that need.
Because they are directly linked to fossil fuel use, GHG regulations have the most direct
impacts on the energy sector of the economy. However, due to the magnitude of the
policy interventions needed to adequately address climate change risks and the
pervasiveness of energy use in economic activities, very few types of policies have as
much potential to cut across the entire economy as much as climate policy does. This
pervasiveness calls for economic analysis tools that both examine effects within the
energy sector and across all sectors of the economy. Using two economic models, one a
model of the United States in a global economy that captures important macroeconomic
implications and cross-sector feedbacks of such far-reaching policies, and the other a
model of the U.S. energy markets that provides more detail on changes within each sector
necessary to meet a set of greenhouse gas limits. The limits are met with a cap-and-trade
policy that allocates emission allowances equal to the GHG cap. This allows parties
subject to the cap to trade allowances among themselves at a specified allowance price,
guiding mitigation toward the most cost-effective reduction opportunities in the
economy.
The paper continues with a summary that further describes the analysis scenarios and
provides an overview of the underlying models’ structure, conceptual foundation, scope,
and data. Each of the two models, ADAGE and NI-NEMS, have separate more extensive
and detailed documentation to which the reader is directed if they wish to explore the
model details further. Following the model descriptions, economic and emission results
are presented for a reference business-as-usual scenario and two policy scenarios.
Economic results include macroeconomic results nationally and for key regions, as well
as those focused on energy sector outcomes. The paper concludes with a summary and
discussion of policy inferences that can be drawn.
Nicholas Institute 3 9/28/2007 3
A Path to Greenhouse Gas Reductions in the US: Economic Modeling of Interim National Targets
2. ANALYSIS OVERVIEW
The purpose of this exercise is to better understand potential economic responses to an
interim national GHG emission target for the U.S. within and across key economic
sectors and regions. By looking at an interim target (Year 2020), we focus on efforts to
get a national program off the ground that aims to slow, stop, and begin to reverse
national emissions in the near-term. Interim Targets potentially form the basis for a
broader program of deeper cuts in the long-run, should policymakers so choose. Several
of the current policy proposals being considered in Congress at this writing have GHG
targets that go beyond 2020 (e.g. to 2050), but they vary widely in their stringency, with
some proposals calling for an essential flattening of emissions to current levels, and
others calling for very steep cuts (up to 80% below current levels by 2050). The
proposed bills have been under intense debate at this time, and it is difficult to tell which
long-term targets are more likely to become law or whether legislation will be phased-in
with a series of interim targets. Either way, most of the proposals now under
consideration have emissions targets for 2020 that fall into the range examined here (see
Paltsey et al, 2007. Thus we believe the interim bounding scenarios in this paper capture
a reasonable range of options for the slow-and-stop phase of any longer term strategy.
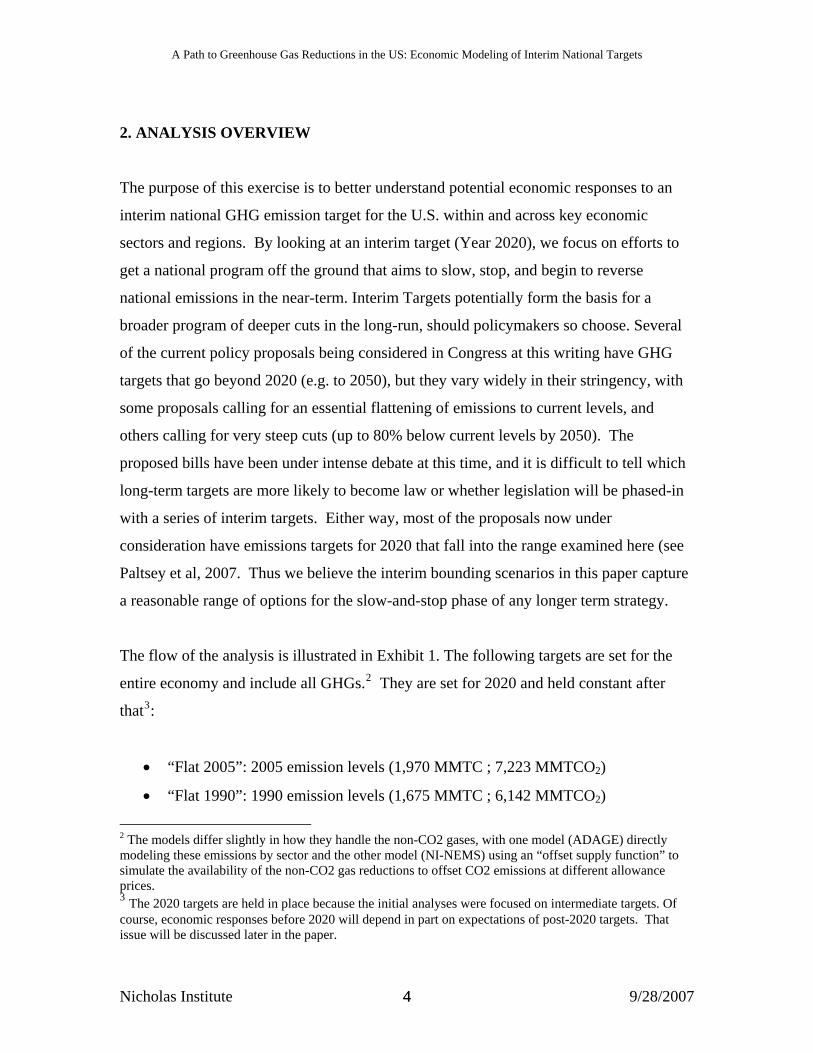
The flow of the analysis is illustrated in Exhibit 1. The following targets are set for the
entire economy and include all GHGs.2 They are set for 2020 and held constant after
that3:
• “Flat 2005”: 2005 emission levels (1,970 MMTC ; 7,223 MMTCO2)
• “Flat 1990”: 1990 emission levels (1,675 MMTC ; 6,142 MMTCO2)
2 The models differ slightly in how they handle the non-CO2 gases, with one model (ADAGE) directly modeling these emissions by sector and the other model (NI-NEMS) using an “offset supply function” to simulate the availability of the non-CO2 gas reductions to offset CO2 emissions at different allowance prices. 3 The 2020 targets are held in place because the initial analyses were focused on intermediate targets. Of course, economic responses before 2020 will depend in part on expectations of post-2020 targets. That issue will be discussed later in the paper.
Nicholas Institute 4 9/28/2007 4
A Path to Greenhouse Gas Reductions in the US: Economic Modeling of Interim National Targets
Policy Simulation/GHG Constraints•Start in 2010•GHG Cap Target in 2020
•2005 levels•1990 levels
•Economywide•All gases•Rest of world assumed to follow Kyoto targets beyond 2012
ADAGE Model
•All sectors•Global coverage
•US/Regions•Rest of World
NI-NEMS Model
•US energy sector focus•Technology detail•Energy market forecasts
Focal outputs•GHG allowance prices•Emission reductions by sector/gas•Sectoral / regional output
•Energy sector•Other
•Macro-economic effects•Trade effects
Focal outputs•Electricity generation mix•New capacity additions•Retired capacity•Demand side management•Criteria air pollutants
Synthesized Results
Analysis Overview
Exhibit 1. Analysis Flow from Policy Inputs to Model Outputs
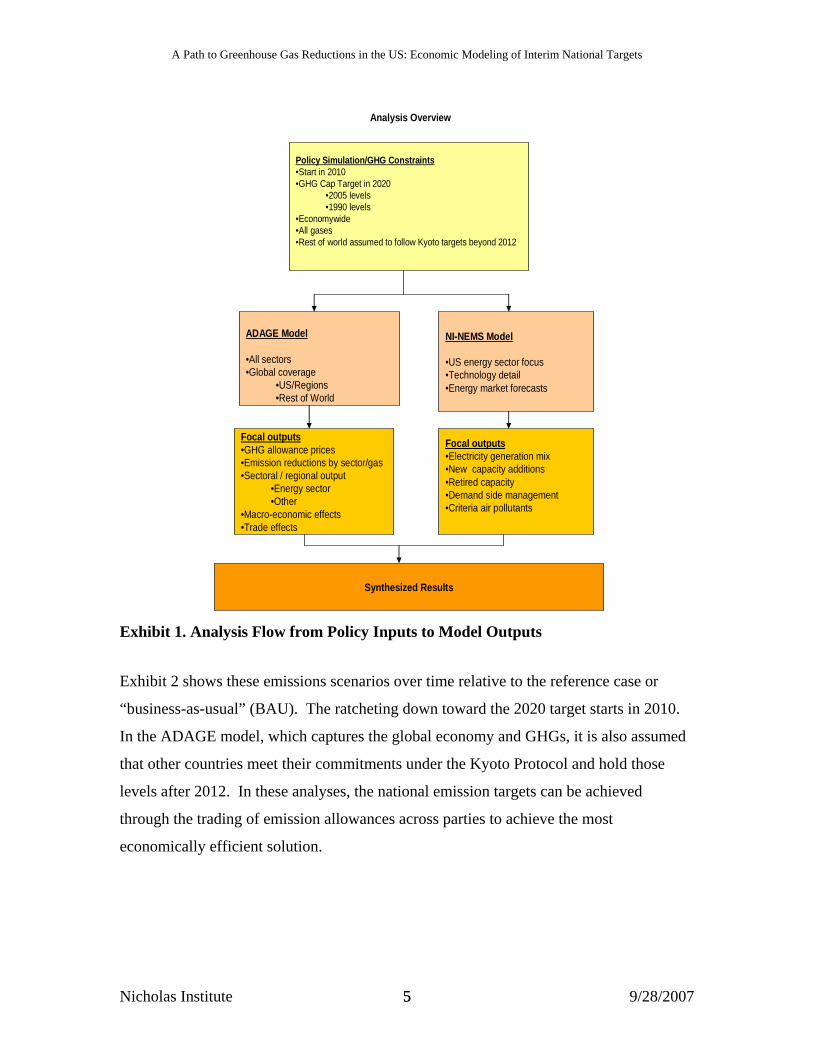
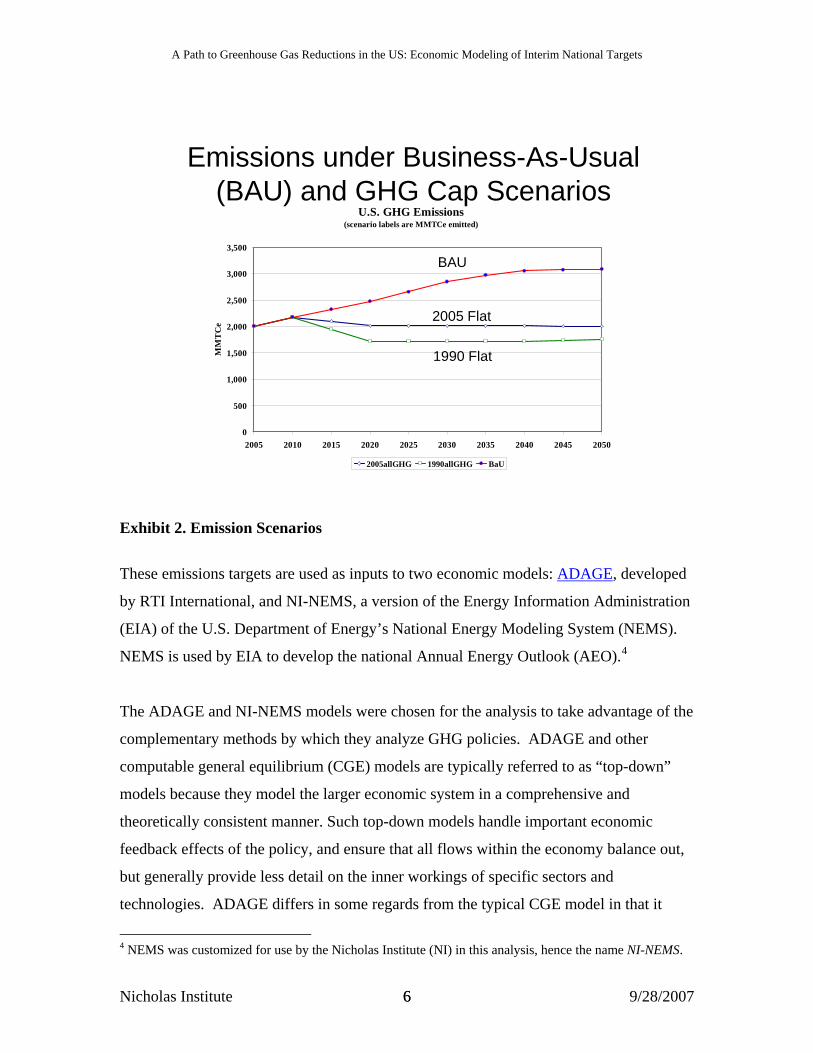
Exhibit 2 shows these emissions scenarios over time relative to the reference case or
“business-as-usual” (BAU). The ratcheting down toward the 2020 target starts in 2010.
In the ADAGE model, which captures the global economy and GHGs, it is also assumed
that other countries meet their commitments under the Kyoto Protocol and hold those
levels after 2012. In these analyses, the national emission targets can be achieved
through the trading of emission allowances across parties to achieve the most
economically efficient solution.
Nicholas Institute 5 9/28/2007 5
A Path to Greenhouse Gas Reductions in the US: Economic Modeling of Interim National Targets
Emissions under Business-As-Usual (BAU) and GHG Cap Scenarios
U.S. GHG Emissions(scenario labels are MMTCe emitted)
0
500
1,000
1,500
2,000
2,500
3,000
3,500
2005 2010 2015 2020 2025 2030 2035 2040 2045 2050
MM
TC
e
2005allGHG 1990allGHG BaU
BAU
2005 Flat
1990 Flat
Exhibit 2. Emission Scenarios
These emissions targets are used as inputs to two economic models: ADAGE, developed
by RTI International, and NI-NEMS, a version of the Energy Information Administration
(EIA) of the U.S. Department of Energy’s National Energy Modeling System (NEMS).
NEMS is used by EIA to develop the national Annual Energy Outlook (AEO).4
The ADAGE and NI-NEMS models were chosen for the analysis to take advantage of the
complementary methods by which they analyze GHG policies. ADAGE and other
computable general equilibrium (CGE) models are typically referred to as “top-down”
models because they model the larger economic system in a comprehensive and
theoretically consistent manner. Such top-down models handle important economic
feedback effects of the policy, and ensure that all flows within the economy balance out,
but generally provide less detail on the inner workings of specific sectors and
technologies. ADAGE differs in some regards from the typical CGE model in that it
4 NEMS was customized for use by the Nicholas Institute (NI) in this analysis, hence the name NI-NEMS.
Nicholas Institute 6 9/28/2007 6
A Path to Greenhouse Gas Reductions in the US: Economic Modeling of Interim National Targets
delves into more detail in the energy sector because of its use in climate policy analyses,
but is still best described as a top-down model.
Alternatively, NI-NEMS would be more accurately described as a “bottom-up” model,
with a primary focus on technology characteristics and choices within the energy sector.
NI-NEMS forecasts the effects of particular technologies on energy market prices and
production. This captures, for instance, how a GHG policy might change the specific
technologies that producers use to make electricity (e.g., conventional coal, IGCC, solar,
wind, biomass), how GHG emissions constraints affect the nature and timing of plant
replacement decisions, and how all this affects demands and prices for fuel commodities
such as coal, natural gas, and oil.
Due to differences in model features, we focus on different aspects of the reported
outputs from each model. We use ADAGE results primarily for broader economic
measures such as Gross Domestic Production (GDP), employment, sectoral distribution
of emission reductions, and the GHG allowance price in an economywide cap-and-trade
system. We use NI-NEMS for results related to changes in generation mix for electric
power, specific decisions on new build capacity and technology use, and demand side
responses in the energy and transportation sectors.
Relying on both top-down and bottom-up models to inform policy decisions is a common
analytical practice. For instance, the U.S. Environmental Protection Agency (EPA) uses
ADAGE and other CGE models to assess the economywide and interregional impacts of
climate policy options and other forms of pollution control policy, but EPA also relies on
detailed bottom-up models of the electric power sector (e.g., the IPM model developed by
ICF Inc.) to delve into more sectoral detail. This dual approach has been used by EPA to
examine recently promulgated clean air rules such as the Clean Air Interstate Rule (US
EPA, 2005a) and Regional Haze Rule (US EPA 2005b), along with Senate Bill S. 280,
the Climate Stewardship and Innovation Act of 2007 (US EPA 2007).
Nicholas Institute 7 9/28/2007 7
A Path to Greenhouse Gas Reductions in the US: Economic Modeling of Interim National Targets
We now proceed with descriptions of the individual models and how they were applied to
generate the analysis reported herein.
3. MODEL DESCRIPTIONS
ADAGE5
The RTI Applied Dynamic Analysis of the Global Economy (ADAGE) model is a
dynamic computable general equilibrium (CGE) model capable of examining many types
of economic, energy, environmental, climate-change mitigation, and trade policies. To
investigate policy effects, the CGE model combines a consistent theoretical structure with
economic data covering all interactions among businesses and households. A classical
Arrow-Debreu general equilibrium framework is then used to describe economic
behaviors of these agents. ADAGE typically solves in 5-year time intervals from 2005 to
2050, and assumes that economic agents will anticipate future policies and act to mitigate
their impacts. Emissions and abatement costs for six types of GHG are included in the
model - CO2, CH4, N2O, HFCs, PFCs, SF6.
ADAGE is designed with an integrated, modular structure that allows it to consider both
international and domestic policies, and evaluate their effects on regions and states within
the United States. Computational constraints tend to limit the total size of nonlinear,
intertemporally-optimizing CGE models (which is one of the motivating factors for
adopting an integrated modular design). Thus, when examining energy or climate
policies, data in the model are usually aggregated to represent five primary energy
industries (with multiple forms of electricity generation) and five other industries (chosen
based on their energy consumption patterns):
• Coal • Agriculture
• Crude Oil • Energy-Intensive Manufacturing
• Electricity (multiple types) • Other Manufacturing
5 The version of ADAGE used for this analysis was the version in place in Winter 2006-2007. The model has since been updated with more recent energy, greenhouse gas and economic data and more energy sector technological detail.
Nicholas Institute 8 9/28/2007 8
A Path to Greenhouse Gas Reductions in the US: Economic Modeling of Interim National Targets
• Natural Gas • Services
• Refined Petroleum • Transportation Services
The international regions used in this analysis were selected to focus on the United States
plus countries assumed to be participating in the Kyoto Protocol, along with other
significantly emitting nations. Within the U.S., five regions were selected to preserve
differences in electricity-generation technologies:
International U.S. Regions
• United States • Northeast
• Europe • South
• Canada • Midwest
• Japan • Plains
• China • West
• Rest of World
The economic data used to describe these regions and industries come from databases
provided by the Global Trade Analysis Project-GTAP
(https://www.gtap.agecon.purdue.edu/) and the Minnesota IMPLAN Group
(http://www.implan.com/index.html). These data show production techniques and trade
patterns, along with households’ demands and income sources, in each region in the
model. Energy data and various growth forecasts are taken from the International Energy
Agency and the U.S. Department of Energy’s EIA.
The theory and equations in ADAGE are based on other CGE models also designed to
look at GHG emissions policies. Nested constant-elasticity-of-substitution (CES)
equations are used to describe how manufacturing techniques or household behavior will
change in response to the change in relative factor prices caused by such policies.
Equations related to production technologies in ADAGE are largely based on the
Massachusetts Institute of Technology’s Emissions Prediction and Policy Analysis, or
EPPA, model (see http://web.mit.edu/globalchange/www/eppa.html and Paltsev et al
2005). Researchers at MIT derived their CES equations and associated parameter
estimates from a variety of empirical literature, expert elicitations, and “bottom-up”
Nicholas Institute 9 9/28/2007 9
A Path to Greenhouse Gas Reductions in the US: Economic Modeling of Interim National Targets
engineering studies. Beyond manufacturing technologies, the two models are different in
regional scope and their representation of dynamics and households.
Data
The ADAGE model uses a variety of economic, energy, and emissions data sources to
characterize production and consumption decisions by firms and households. These data
are used to develop a balanced Social Accounting Matrix (SAM) for each region that
shows current production technologies, demands for goods, income sources, and trade
flows. This information is combined with economic growth forecasts and estimates of
future energy production, consumption, and prices.
• International – Global Trade Analysis Project (GTAP) data and International
Energy Agency (IEA) energy production and consumption data, along with World
Energy Outlook forecasts. Carbon dioxide (CO2) emissions are from IEA, and non-
CO2 GHG emissions and reduction costs are from the EPA
• US – State-level economic data from the Minnesota IMPLAN Group, and energy
data and forecasts from the EIA: Annual Energy Outlook, Manufacturing Energy
Consumption Survey, State Energy Reports, and various Industry Annuals. CO2
emissions from EIA and non-CO2 GHG emissions from EPA.
Please see the ADAGE model website (RTI International, http://www.rti.org/adage) for
additional documentation of the theoretical structure, equations, parameter estimates, and
data in the model.
How GHG Mitigation is Modeled
ADAGE provides several broad options for meeting a GHG emissions target6:
• reducing emissions by switching fuels (e.g., from coal to natural gas),
• improving energy efficiency, and
• lowering energy consumption. 6 The most recent version of ADAGE used in EPA’s S280 analysis (US EPA 2007) has more advanced generation technology switching as well as carbon, capture and storage, than the version used in this analysis. The NI-NEMS model below captures these technology features in this analysis.
Nicholas Institute 10 9/28/2007 10
A Path to Greenhouse Gas Reductions in the US: Economic Modeling of Interim National Targets
Both firms and households have options for changing their actions. If, for example,
petroleum prices rise, a firm can shift away from petroleum to other types of energy. A
firm can also choose to employ more capital or labor in place of petroleum, thus allowing
ADAGE to model improvements in energy efficiency. The ease with which firms can
switch among production inputs is controlled by the equations mentioned above and will
affect how the economy responses to a GHG policy. If firms are able to substitute away
from energy with relative ease, the price of their output will not change much when
energy prices vary. Similarly, households can take actions to switch among fuels and
improve energy efficiency if energy prices rise. Energy demands, along with those for
other types of goods, are also influenced by any declines in overall economic activity
(e.g., Gross Domestic Product or household income).
To model a specific GHG mitigation policy, an emissions target is introduced as an
additional constraint in ADAGE that limits emissions to the given level. Based on this
emissions cap, the model estimates a shadow (or implicit) value on GHG emissions
associated with the constraint, which can be interpreted as the price at which GHG
allowances (or permits) would trade under a GHG cap-and-trade system. This price
reflects costs to the economy of abating emissions as necessary to meet the policy target.
If the policy is implemented as a cap-and-trade system (as was done in the model runs for
this paper), the model assumes affected entities can either reduce their emissions,
purchase allowances giving them the right to emit GHGs, or sell allowances if they have
low-cost opportunities to reduce emissions below the number of allowances they receive
under the policy. Thus, the cap-and-trade system ensures that the marginal costs of
abatement are minimized across the economy by encouraging the most cost-effective
reductions.
Estimated GHG allowance prices, and associated macroeconomic effects, in ADAGE
will be influenced significantly by the following model characteristics and policy
features:
• The degree of fuel switching between coal and natural gas, especially in
electricity generation – standard parameter estimates in the model allow a fair
Nicholas Institute 11 9/28/2007 11
A Path to Greenhouse Gas Reductions in the US: Economic Modeling of Interim National Targets
amount of switching, which holds allowance prices down (energy efficiency
improvements have a similar effect).
• The ability of households to reduce energy consumption – ADAGE assumes
households are willing to lower energy use, rather than forcing all reductions to
come from industry.
• Overall changes in economic activity – the model estimates relatively small
adjustments in industrial production and household consumption. Small changes
limit the impact on GDP, but will also tend to raise allowance prices since
demand for goods remains high.
• The combined influences of international and U.S. domestic GHG policies on the
global economy – for example, if demand for crude oil declines in the U.S. and
Europe, world crude oil prices will decline, leading to an offsetting increase in
domestic demand that makes it somewhat harder to meet U.S. targets; similarly,
energy-intensive manufacturing may shift overseas if U.S. competitiveness
declines, affecting the U.S. economy.7
• Consideration of non-CO2 emissions in the GHG mitigation policy – engineering
studies typically find that non-CO2 GHG reductions are relatively cheap methods
for lowering emissions. If they are included in an emissions cap, or allowed to
provide “offsets” for reductions in CO2 emissions otherwise needed from energy
markets, they will help lower allowance prices estimated by the ADAGE model.
• Finally, along with changes in international energy production, domestic resource
supplies will respond to a GHG policy and can affect allowance prices – for
example, declining demand for coal can lower minemouth prices, thus raising
demand somewhat (delivered coal prices, including the effects of allowance costs,
will generally increase).
While the initial production of natural resources for fuel is based on EIA forecasts from
the Annual Energy Outlook (AEO), these levels can change under a climate change 7 Current experience in the EU Emissions Trading System (ETS) is demonstrating such linkages between oil and gas price fluctuations and GHG prices, reflecting the greater difficulty put on emission reduction efforts if, for instance, these fuel price increases cause shifting to coal.
Nicholas Institute 12 9/28/2007 12
A Path to Greenhouse Gas Reductions in the US: Economic Modeling of Interim National Targets
mitigation policy (baseline prices for coal, natural gas, and crude oil are also from AEO
forecasts). In a policy scenario, the model determines how demands for energy resources
will be affected by the need to hold GHG allowances in order to consume fossil fuels.
Supplies of energy resources are simultaneously adjusted based on any related changes in
energy prices and demands (parameters controlling how supplies respond to prices are
based on data from the EPPA model).
Scenario Simulations
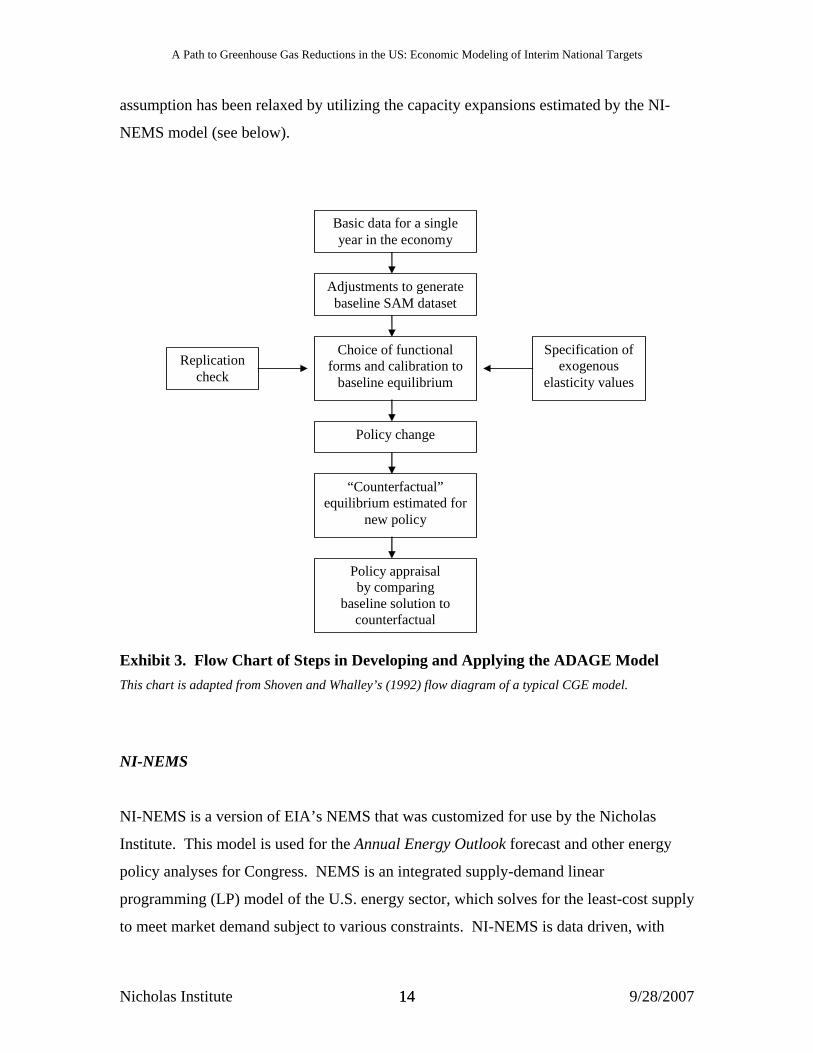
Exhibit 3 illustrates the steps followed in an ADAGE policy scenario. Before ADAGE
can be used to evaluate a policy, it must be calibrated to represent the BAU baseline data
and forecasts regarding the economy and energy production, consumption, and prices.
First, the model’s data are calibrated to a baseline equilibrium that represents expected
economic growth in the absence of new policies. Then, the CES equations, or functional
forms, and elasticities that control model reactions are calibrated to the chosen values,
and a replication check is run to ensure the model is operating properly. At this point, the
model is ready to evaluate “counterfactual” policies that move the economy away from
this initial baseline equilibrium. The effects of these policies can then be evaluated by
comparing the BAU baseline economy to the counterfactual solution.
The BAU baseline path for the economy in ADAGE incorporates economic growth and
technology changes that are expected to occur in the absence of any new policies.
Forecasts of energy production, consumption, prices, electricity generation, and overall
economic growth from EIA and IEA are used to establish these growth paths. Emissions
of CO2 are controlled by the energy consumption forecasts and are combined with EPA
forecasts regarding non-CO2 gases to determine overall GHG emissions. Policy
scenarios are then run by specifying a target level for these emissions and examining how
the economy adjusts to meet the target through the fuel switching, energy efficiency
improvements, and changes in consumption discussed above. The assumption in the
ADAGE version used in this analysis is that nuclear generation will not change as the
result of instituting the interim climate policy evaluated here – in some cases, this
Nicholas Institute 13 9/28/2007 13
A Path to Greenhouse Gas Reductions in the US: Economic Modeling of Interim National Targets
assumption has been relaxed by utilizing the capacity expansions estimated by the NI-
NEMS model (see below).
Basic data for a single year in the economy
Adjustments to generate baseline SAM dataset
Choice of functional forms and calibration to
baseline equilibrium
Specification of exogenous
elasticity values Replication
check
Policy change
“Counterfactual” equilibrium estimated for
new policy
Policy appraisal by comparing
baseline solution to counterfactual
Exhibit 3. Flow Chart of Steps in Developing and Applying the ADAGE Model This chart is adapted from Shoven and Whalley’s (1992) flow diagram of a typical CGE model.
NI-NEMS
NI-NEMS is a version of EIA’s NEMS that was customized for use by the Nicholas
Institute. This model is used for the Annual Energy Outlook forecast and other energy
policy analyses for Congress. NEMS is an integrated supply-demand linear
programming (LP) model of the U.S. energy sector, which solves for the least-cost supply
to meet market demand subject to various constraints. NI-NEMS is data driven, with
Nicholas Institute 14 9/28/2007 14
A Path to Greenhouse Gas Reductions in the US: Economic Modeling of Interim National Targets
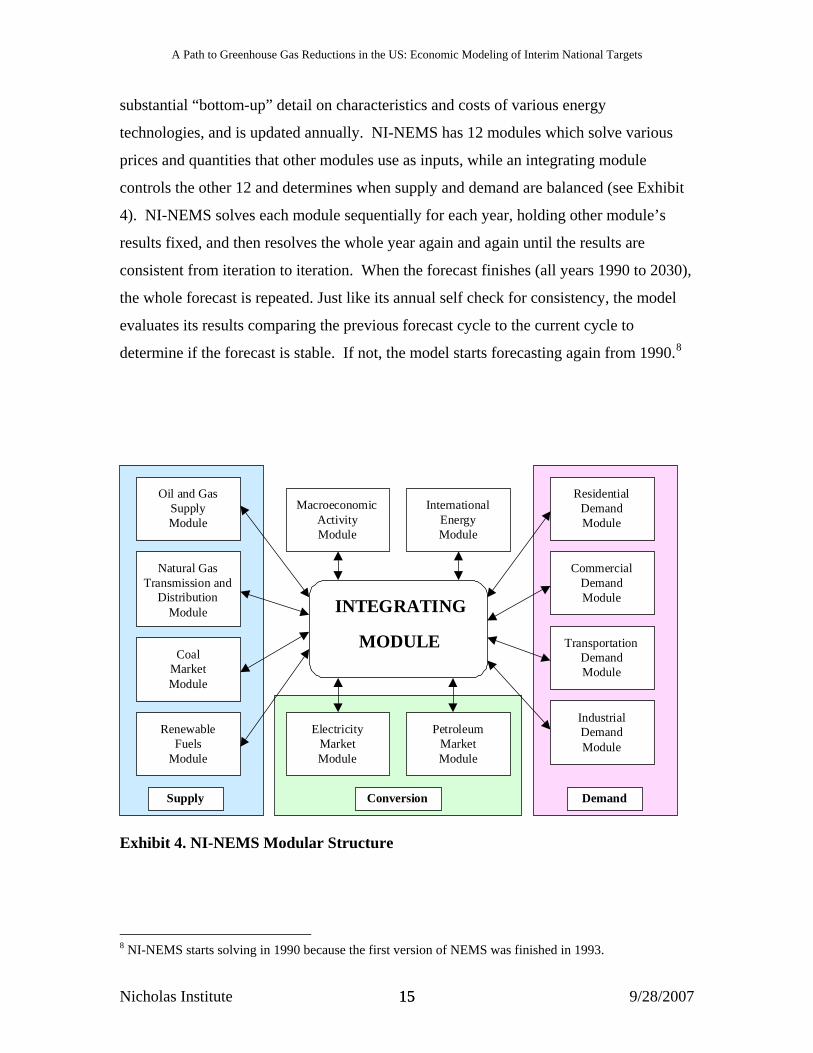
substantial “bottom-up” detail on characteristics and costs of various energy
technologies, and is updated annually. NI-NEMS has 12 modules which solve various
prices and quantities that other modules use as inputs, while an integrating module
controls the other 12 and determines when supply and demand are balanced (see Exhibit
4). NI-NEMS solves each module sequentially for each year, holding other module’s
results fixed, and then resolves the whole year again and again until the results are
consistent from iteration to iteration. When the forecast finishes (all years 1990 to 2030),
the whole forecast is repeated. Just like its annual self check for consistency, the model
evaluates its results comparing the previous forecast cycle to the current cycle to
determine if the forecast is stable. If not, the model starts forecasting again from 1990.8
MacroeconomicActivityModule
INTEGRATING
MODULE
InternationalEnergyModule
ElectricityMarketModule
PetroleumMarketModule
Conversion
Oil and GasSupplyModule
Natural GasTransmission and
DistributionModule
CoalMarketModule
RenewableFuels
Module
Supply Demand
ResidentialDemandModule
CommercialDemandModule
TransportationDemandModule
IndustrialDemandModule
Exhibit 4. NI-NEMS Modular Structure
8 NI-NEMS starts solving in 1990 because the first version of NEMS was finished in 1993.
Nicholas Institute 15 9/28/2007 15
A Path to Greenhouse Gas Reductions in the US: Economic Modeling of Interim National Targets
The Nicholas Institute version, NI-NEMS, is directly derived from NEMS, but does not
use the macroeconomic feedback portion of the model, instead focusing on technology,
demand, and output responses within the energy sector.
NI-NEMS forecasts energy supply, demand, and prices. NI-NEMS’s baseline forecast
includes only policies that are currently legislated, and it is sometimes referred to as the
“Business-As-Usual” or BAU forecast. Five of the modules in NI-NEMS have rather
detailed technology descriptions: refining, electric markets, commercial, residential, and
transportation. NI-NEMS has nine demand regions which correspond to census divisions
and 13 electricity supply regions (based on NERC regions). These regions are explained
in EIA’s electricity documentation pages 5 and 92, (EIA, 2006)
NI-NEMS tracks SO2, NOX, mercury and CO2 emissions. Coal and natural gas supply
regions are different than the electricity supply regions. As a bottom-up model, with
much detail, the electricity module aggregates time periods to keep the capacity planning
and fuel dispatch parts of the model at a manageable size. Capacity planning looks at
load duration curves with 11 time slices for each region: winter peak day, summer peak
day, as well as three other load levels for each of three seasons - winter, summer, and
shoulder season. Electricity fuel dispatch is solved for 36 unique hours in each region.
Even with these simplifications, the fuel dispatch and capacity planning are the most time
consuming parts of the model to solve.
The model endogenously solves for all fuel markets except crude oil. The solutions are
derived by simulating changes in supply, demand, and other constraints in each fuel
market and linking together regional and national markets as appropriate. The world
crude oil price in NI-NEMS is an exogenous input to the model, assumed to be
determined primarily from factors outside the U.S. economy.
Demand modules are end-use driven. The residential, commercial, and transportation
sectors have extensive new technology menus which allow the model to choose from a
Nicholas Institute 16 9/28/2007 16
A Path to Greenhouse Gas Reductions in the US: Economic Modeling of Interim National Targets
wide range of fuel switching or efficiency options when new or substitution decisions are
made.
Data
Given NEMS’ use in developing the Annual Energy Outlook for the U.S., NI-NEMS uses
historical or current data for everything that EIA can reasonably assess, for example,
regional load duration curves, supply curves, technology costs, pipeline capacity,
emissions, plant data, and beyond.9 Given the prominent role of the electricity sector in
climate policy options in general and for this analysis in particular, the reader may want
to pay specific attention to the “Electricity Market Module” component of the
input/assumptions documents just referenced. In particular, Table 38. Cost and
Performance Characteristics of New Central Station Electricity Generating Technologies
provides the data on size, lead time, capital and operating costs, and heat rates for 19 new
electric power generating technologies,. These costs and efficiency assumptions are
critical in determining whether GHG caps induce the turnover of new generating
technologies.
These data and assumptions are updated each year. Expert judgments from EIA analysts
and outside consultants are used for future inputs (e.g. costs or efficiency improvements
over time).
For more details on the NEMS model, access the model brief overview EIA (2003,
http://www.eia.doe.gov/oiaf/aeo/overview/) , which also accesses the model’s latest full
documentation of each module.
9 The key data inputs and driving assumptions for the model can be found at http://www.eia.doe.gov/oiaf/aeo/assumption/index.html.
Nicholas Institute 17 9/28/2007 17
A Path to Greenhouse Gas Reductions in the US: Economic Modeling of Interim National Targets
How GHG Mitigation is Modeled
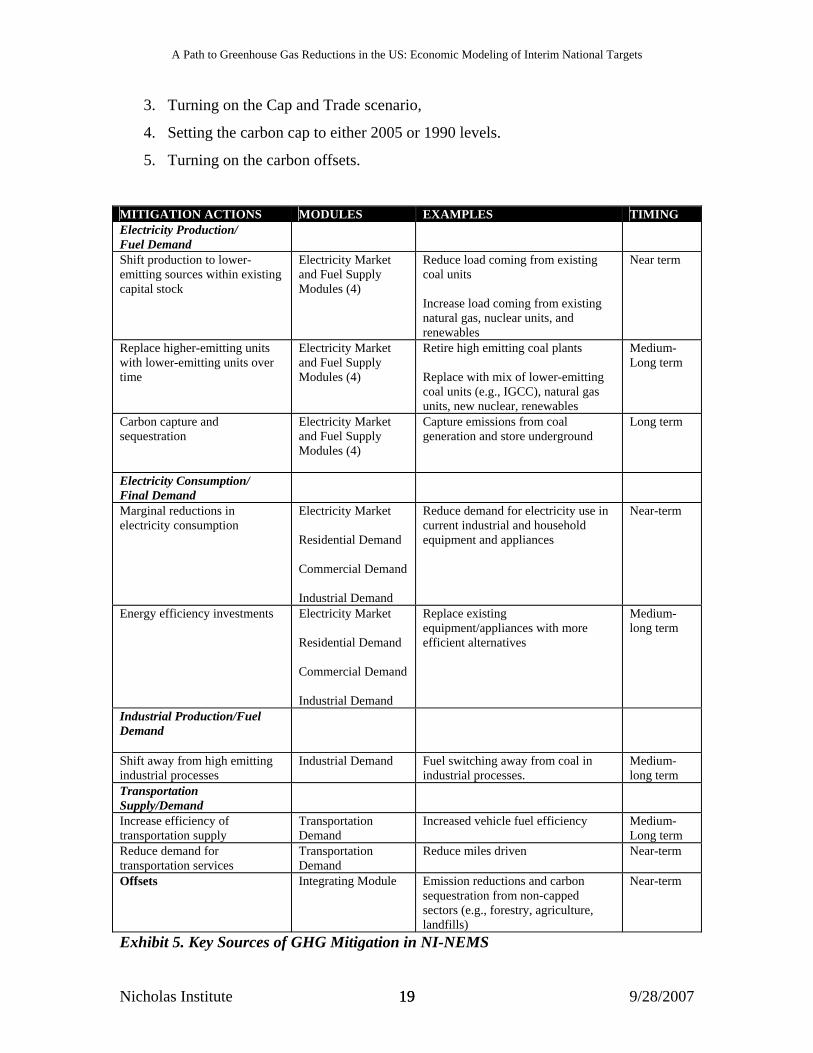
Exhibit 5 summarizes the different ways in which the NI-NEMS model incorporates
GHG mitigation into its economic logic. The electricity sector has the largest potential
for emissions reduction, in part because of the sheer volume of emissions generated, but
also because of the various choices available to it in terms of fuel-switching in the short
term as well as the addition of alternative lower-emitting generation technologies in the
long run. NI-NEMS models electricity demand side responses and energy efficiency
investments from the industrial, commercial, and residential sectors as a source of
emission reductions. NI-NEMS also models mitigation through changes in direct fuel
consumption in industrial production processes, for instance, switching fuels such as
natural gas for coal in industrial processes. The fuel substitution possibilities in the
industrial sector are more limited than they are in the electric power sector.
Mitigation in the transportation sector occurs primarily through changes in vehicle
efficiency and miles driven. GHG offsets from emission reduction projects from other
(non-capped) sources are available and expressed as exogenous offset supply curves that
are responsive to the allowance price. Most offsets come from either high greenhouse
warming potential gases or landfill and natural gas methane.
Scenario Simulations
NI-NEMS’s BAU baseline used in this analysis is essentially EIA’s Annual Energy
Outlook 2006 reference case. The differences are that NI-NEMS does not include
macroeconomic feedback and is done using the Nicholas Institute’s version of NEMS.
The Flat 2005 and the Flat 1990 GHG policy scenarios are modifications to NI-NEMS’
BAU baseline. Changes are made in five areas. The first two are done to allow NI-
NEMS to reach a stable result more quickly (in the order of a day or two, instead of many
days).
1. Using EIA’s carbon scenario basis files.
2. Allowing the model to try and stabilize differently between cycles.
Nicholas Institute 18 9/28/2007 18
A Path to Greenhouse Gas Reductions in the US: Economic Modeling of Interim National Targets
3. Turning on the Cap and Trade scenario,
4. Setting the carbon cap to either 2005 or 1990 levels.
5. Turning on the carbon offsets.
MITIGATION ACTIONS MODULES EXAMPLES TIMING Electricity Production/ Fuel Demand
Shift production to lower-emitting sources within existing capital stock
Electricity Market and Fuel Supply Modules (4)
Reduce load coming from existing coal units Increase load coming from existing natural gas, nuclear units, and renewables
Near term
Replace higher-emitting units with lower-emitting units over time
Electricity Market and Fuel Supply Modules (4)
Retire high emitting coal plants Replace with mix of lower-emitting coal units (e.g., IGCC), natural gas units, new nuclear, renewables
Medium- Long term
Carbon capture and sequestration
Electricity Market and Fuel Supply Modules (4)
Capture emissions from coal generation and store underground
Long term
Electricity Consumption/ Final Demand
Marginal reductions in electricity consumption
Electricity Market Residential Demand Commercial Demand Industrial Demand
Reduce demand for electricity use in current industrial and household equipment and appliances
Near-term
Energy efficiency investments Electricity Market Residential Demand Commercial Demand Industrial Demand
Replace existing equipment/appliances with more efficient alternatives
Medium-long term
Industrial Production/Fuel Demand
Shift away from high emitting industrial processes
Industrial Demand Fuel switching away from coal in industrial processes.
Medium-long term
Transportation Supply/Demand
Increase efficiency of transportation supply
Transportation Demand
Increased vehicle fuel efficiency
Medium-Long term
Reduce demand for transportation services
Transportation Demand
Reduce miles driven Near-term
Offsets
Integrating Module Emission reductions and carbon sequestration from non-capped sectors (e.g., forestry, agriculture, landfills)
Near-term
Exhibit 5. Key Sources of GHG Mitigation in NI-NEMS
Nicholas Institute 19 9/28/2007 19
A Path to Greenhouse Gas Reductions in the US: Economic Modeling of Interim National Targets
4. MODEL RESULTS
Simulating the GHG emission targets scenarios referenced above, the two models
collectively produce a range of results on the environmental and economic effects of the
policy targets. The two models achieve the same level of emissions reductions in
somewhat different ways due to differences in their underlying nature (top-down and
bottom-up). In ADAGE, emission reductions are primarily through reduced demand for
energy due to input substitution and output shifts in the economy and secondarily through
reduced carbon intensity of electricity production through fuel/capacity-switching from
coal and oil generation to natural gas. Reductions in NI-NEMS come primarily through
fuel/capacity-switching in electricity generation from coal and oil to renewables, nuclear,
natural gas and some IGCC+CCS in later years (depending on the scenario) and
secondarily through reduced energy use.
Results by key categories are presented below.
GHG Emissions
The GHG allowance price is a key economic indicator of a given cap-and-trade proposal,
as it reflects the marginal cost of achieving the targeted level of emission reductions at a
given point in time. Some parties will cut their emissions up to the point where it is
cheaper to buy the allowance at the market price. Alternatively, others will sell their
allowances up to the point that the price they receive in the market covers their marginal
cost. In equilibrium, marginal cost should be equalized across all parties in the allowance
market.
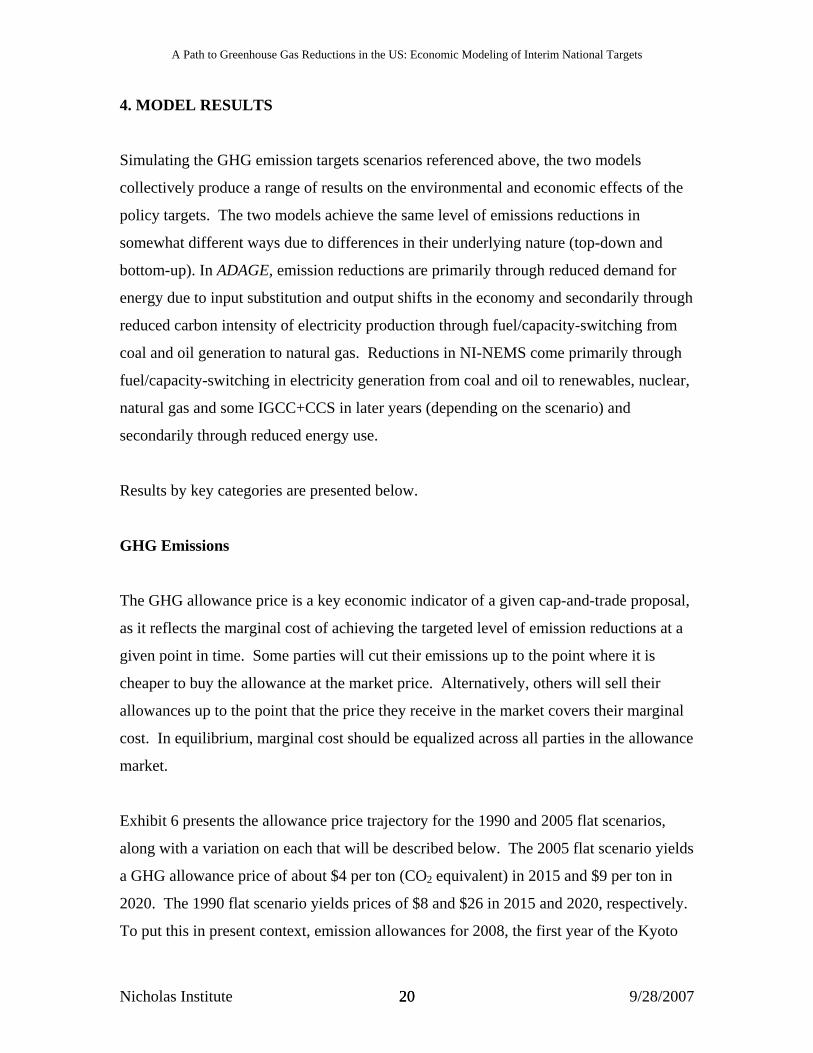
Exhibit 6 presents the allowance price trajectory for the 1990 and 2005 flat scenarios,
along with a variation on each that will be described below. The 2005 flat scenario yields
a GHG allowance price of about $4 per ton (CO2 equivalent) in 2015 and $9 per ton in
2020. The 1990 flat scenario yields prices of $8 and $26 in 2015 and 2020, respectively.
To put this in present context, emission allowances for 2008, the first year of the Kyoto
Nicholas Institute 20 9/28/2007 20
A Path to Greenhouse Gas Reductions in the US: Economic Modeling of Interim National Targets
Protocol compliance period are now trading on the European Union Emissions Trading
System for about $25-33 per ton CO2 when converted from current euros to 2005
dollars.10 (Point Carbon, 2007)
Exhibit 6 also shows alternative scenarios in which the 1990 and 2005 targets are met
with a ramped-up availability of renewable fuels, subject to variations on the NI-NEMS
results. This lowers the allowance price, and the effect is most pronounced in the 1990
flat scenario, where accelerated adoption of renewables lowers the allowance price from
$26 per ton to $16 in 2020.
$0
$5
$10
$15
$20
$25
$30
2010 2015 2020
Year
GH
G A
llow
ance
Pric
e (2
005$
/ t
CO2
eq)
1990 flat
1990 flat,acceleratedrenewables
2005 flat
2005 flat,acceleratedrenewables
Exhibit 6. GHG Allowance Prices by Scenario Sources: ADAGE and NI-NEMS
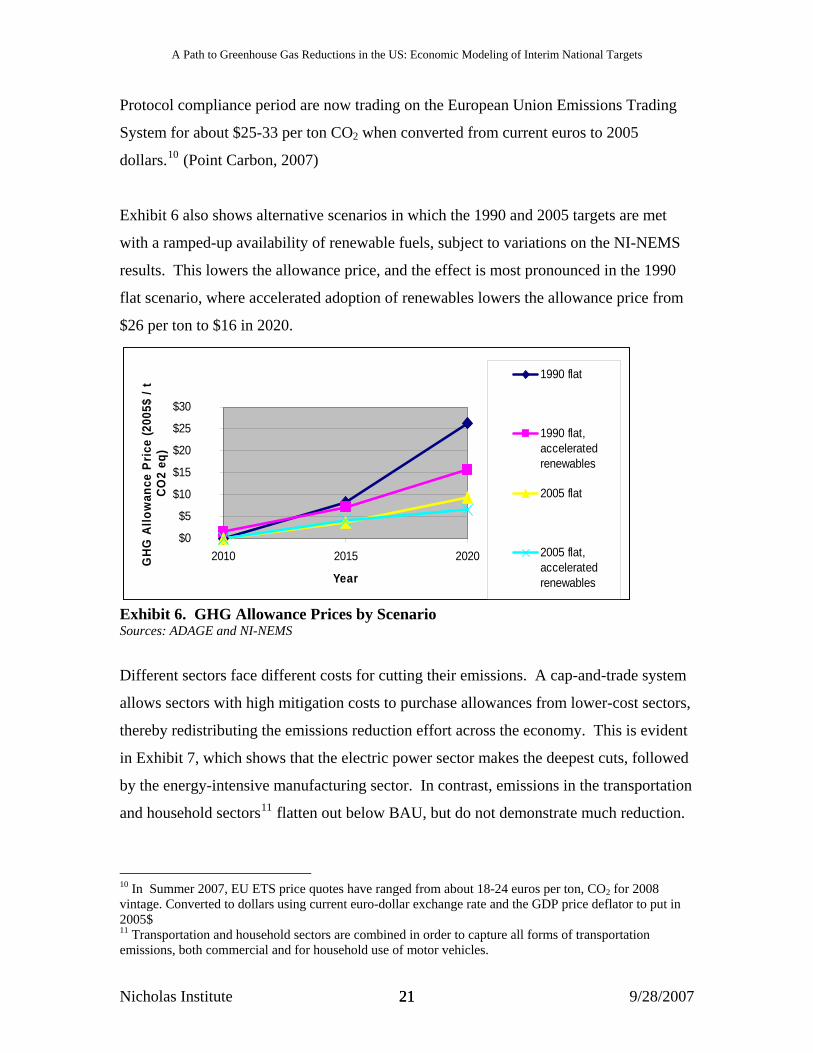
Different sectors face different costs for cutting their emissions. A cap-and-trade system
allows sectors with high mitigation costs to purchase allowances from lower-cost sectors,
thereby redistributing the emissions reduction effort across the economy. This is evident
in Exhibit 7, which shows that the electric power sector makes the deepest cuts, followed
by the energy-intensive manufacturing sector. In contrast, emissions in the transportation
and household sectors11 flatten out below BAU, but do not demonstrate much reduction.
10 In Summer 2007, EU ETS price quotes have ranged from about 18-24 euros per ton, CO2 for 2008 vintage. Converted to dollars using current euro-dollar exchange rate and the GDP price deflator to put in 2005$ 11 Transportation and household sectors are combined in order to capture all forms of transportation emissions, both commercial and for household use of motor vehicles.
Nicholas Institute 21 9/28/2007 21
A Path to Greenhouse Gas Reductions in the US: Economic Modeling of Interim National Targets
Energy Intensive Manufacturing Emissions
0.0
50.0
100.0
150.0
200.0
250.0
300.0
2005 2010 2015 2020 2025Year
MM
TC/y
r BAU2005 Flat1990 Flat
Electricity Sector Emissions
0.0
100.0
200.0
300.0
400.0
500.0
600.0
700.0
800.0
900.0
1000.0
2005 2010 2015 2020 2025Year
MM
TC/y
r BAU2005 Flat1990 Flat
Residential & Transportation Sectors
0.0
100.0
200.0
300.0
400.0
500.0
600.0
700.0
800.0
900.0
1000.0
2005 2010 2015 2020 2025Year
MM
TC/y
r BAU2005 Flat1990 Flat
Source: ADAGE
Exhibit 7. Emission Pathways by Key Sectors
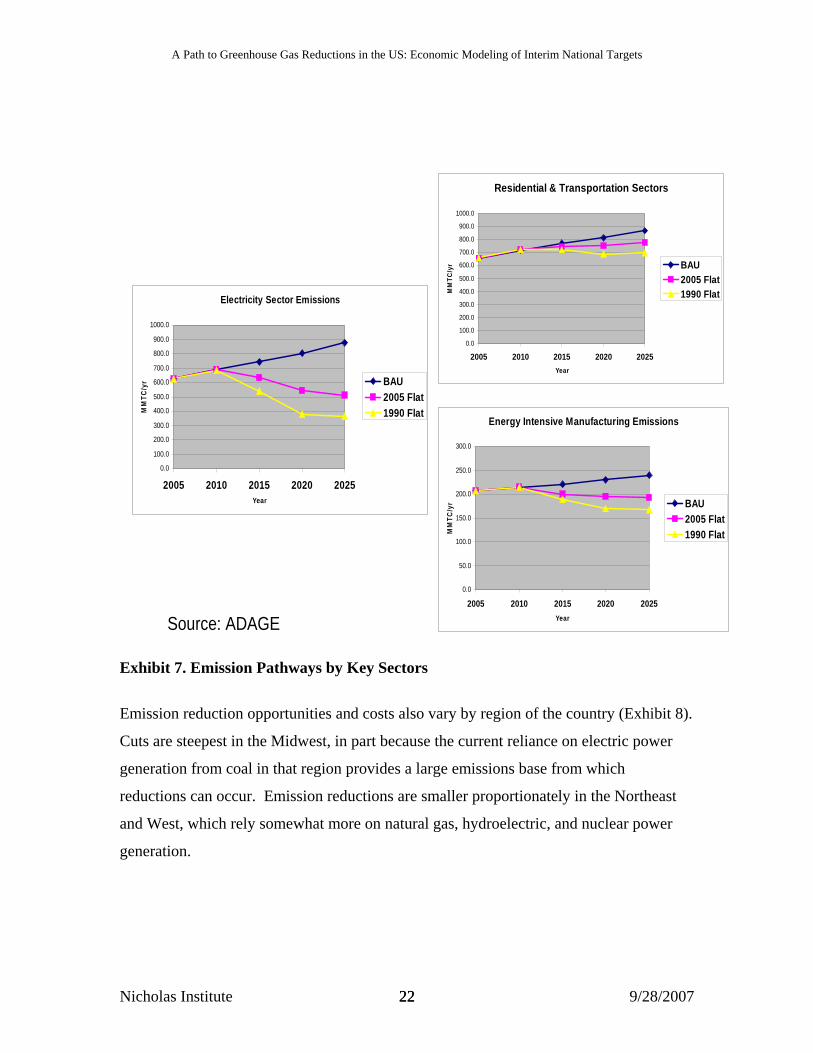
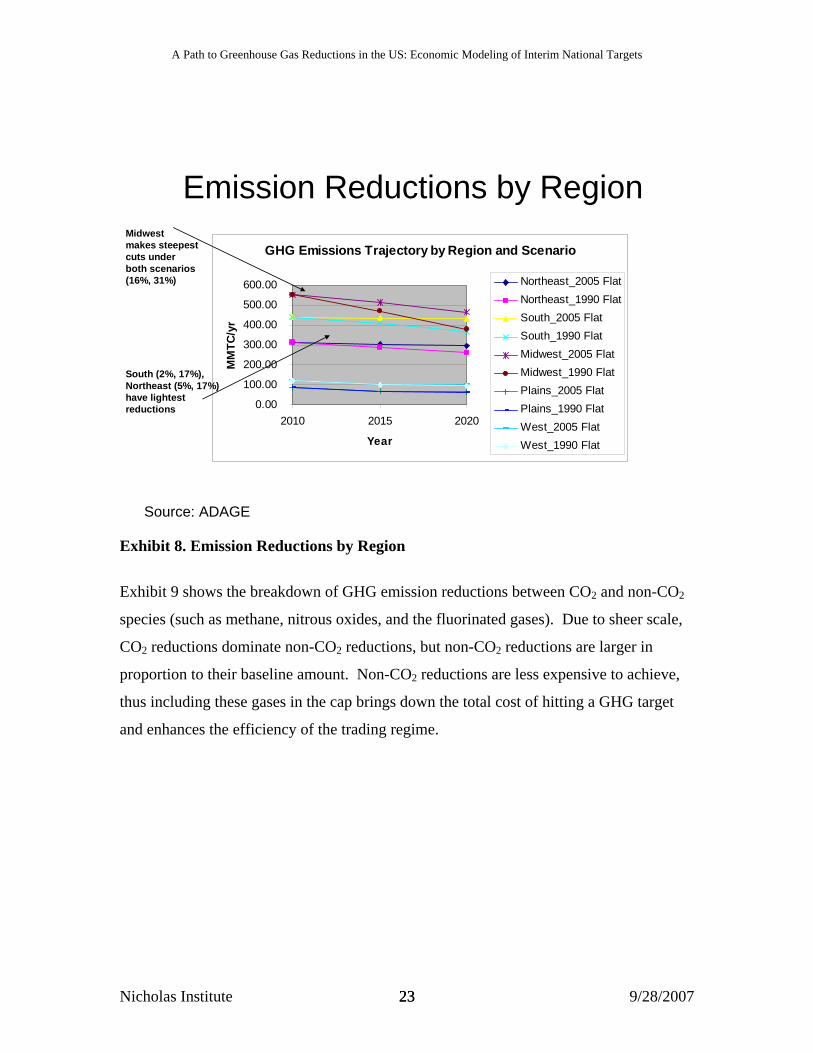
Emission reduction opportunities and costs also vary by region of the country (Exhibit 8).
Cuts are steepest in the Midwest, in part because the current reliance on electric power
generation from coal in that region provides a large emissions base from which
reductions can occur. Emission reductions are smaller proportionately in the Northeast
and West, which rely somewhat more on natural gas, hydroelectric, and nuclear power
generation.
Nicholas Institute 22 9/28/2007 22
A Path to Greenhouse Gas Reductions in the US: Economic Modeling of Interim National Targets
Emission Reductions by Region
GHG Emissions Trajectory by Region and Scenario
0.00
100.00
200.00
300.00
400.00
500.00
600.00
2010 2015 2020
Year
MM
TC/y
r
Northeast_2005 FlatNortheast_1990 FlatSouth_2005 FlatSouth_1990 FlatMidwest_2005 FlatMidwest_1990 FlatPlains_2005 FlatPlains_1990 FlatWest_2005 FlatWest_1990 Flat
Midwest makes steepestcuts under both scenarios(16%, 31%)
South (2%, 17%),Northeast (5%, 17%)have lightest reductions
Source: ADAGE
Exhibit 8. Emission Reductions by Region
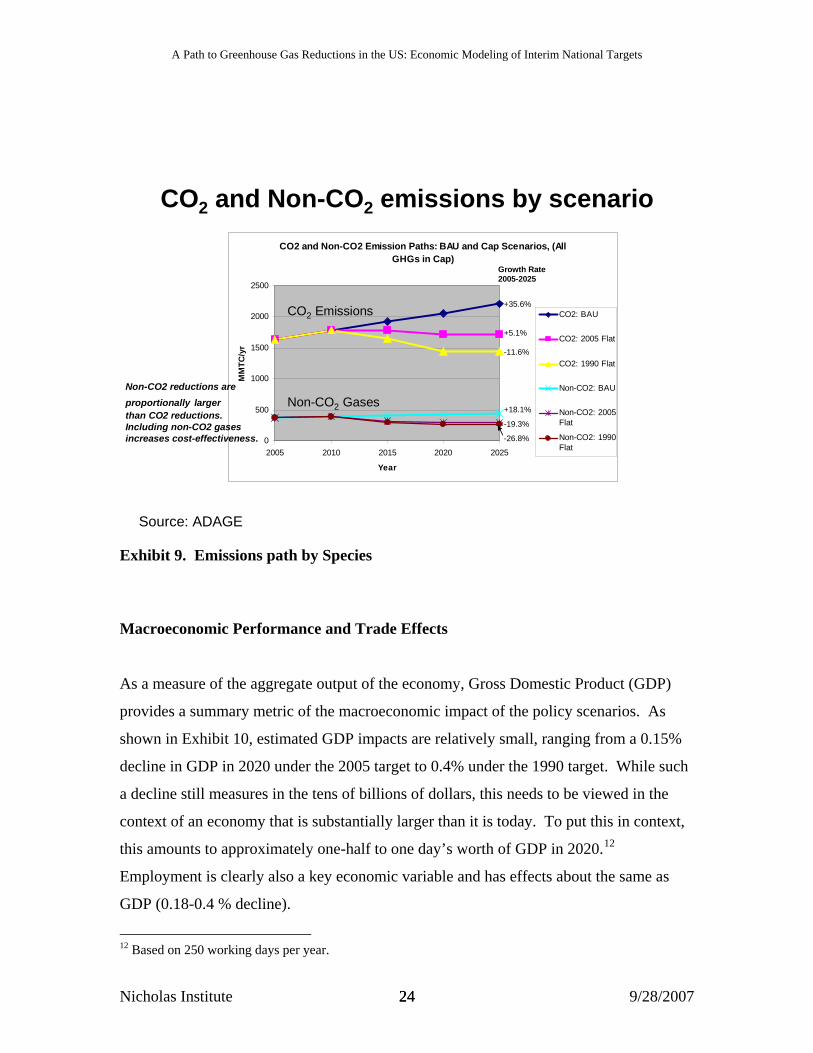
Exhibit 9 shows the breakdown of GHG emission reductions between CO2 and non-CO2
species (such as methane, nitrous oxides, and the fluorinated gases). Due to sheer scale,
CO2 reductions dominate non-CO2 reductions, but non-CO2 reductions are larger in
proportion to their baseline amount. Non-CO2 reductions are less expensive to achieve,
thus including these gases in the cap brings down the total cost of hitting a GHG target
and enhances the efficiency of the trading regime.
Nicholas Institute 23 9/28/2007 23
A Path to Greenhouse Gas Reductions in the US: Economic Modeling of Interim National Targets
CO2 and Non-CO2 emissions by scenarioCO2 and Non-CO2 Emission Paths: BAU and Cap Scenarios, (All
GHGs in Cap)
0
500
1000
1500
2000
2500
2005 2010 2015 2020 2025
Year
MM
TC/y
r
CO2: BAU
CO2: 2005 Flat
CO2: 1990 Flat
Non-CO2: BAU
Non-CO2: 2005Flat
Non-CO2: 1990Flat
+35.6%
+5.1%
-11.6%
+18.1%
-19.3%
-26.8%
Growth Rate2005-2025
Non-CO2 Gases
CO2 Emissions
Non-CO2 reductions areproportionally largerthan CO2 reductions.Including non-CO2 gasesincreases cost-effectiveness.
Source: ADAGE
Exhibit 9. Emissions path by Species
Macroeconomic Performance and Trade Effects
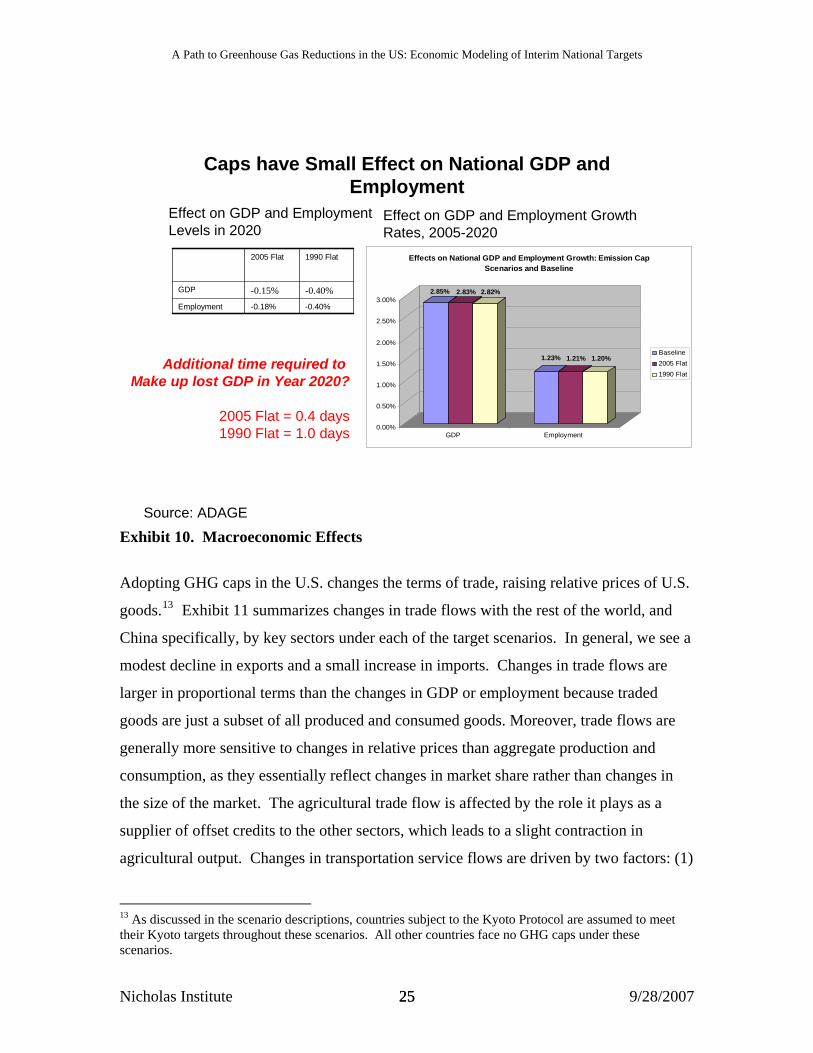
As a measure of the aggregate output of the economy, Gross Domestic Product (GDP)
provides a summary metric of the macroeconomic impact of the policy scenarios. As
shown in Exhibit 10, estimated GDP impacts are relatively small, ranging from a 0.15%
decline in GDP in 2020 under the 2005 target to 0.4% under the 1990 target. While such
a decline still measures in the tens of billions of dollars, this needs to be viewed in the
context of an economy that is substantially larger than it is today. To put this in context,
this amounts to approximately one-half to one day’s worth of GDP in 2020.12
Employment is clearly also a key economic variable and has effects about the same as
GDP (0.18-0.4 % decline).
12 Based on 250 working days per year.
Nicholas Institute 24 9/28/2007 24
A Path to Greenhouse Gas Reductions in the US: Economic Modeling of Interim National Targets
Caps have Small Effect on National GDP and Employment
2.85% 2.83% 2.82%
1.23% 1.21% 1.20%
0.00%
0.50%
1.00%
1.50%
2.00%
2.50%
3.00%
GDP Employment
Effects on National GDP and Employment Growth: Emission Cap Scenarios and Baseline
Baseline2005 Flat1990 Flat
Source: ADAGE
-0.40%-0.18%Employment
-0.40% -0.15% GDP
1990 Flat2005 Flat
Effect on GDP and Employment Levels in 2020
Effect on GDP and Employment GrowthRates, 2005-2020
Additional time required to Make up lost GDP in Year 2020?
2005 Flat = 0.4 days1990 Flat = 1.0 days
Exhibit 10. Macroeconomic Effects
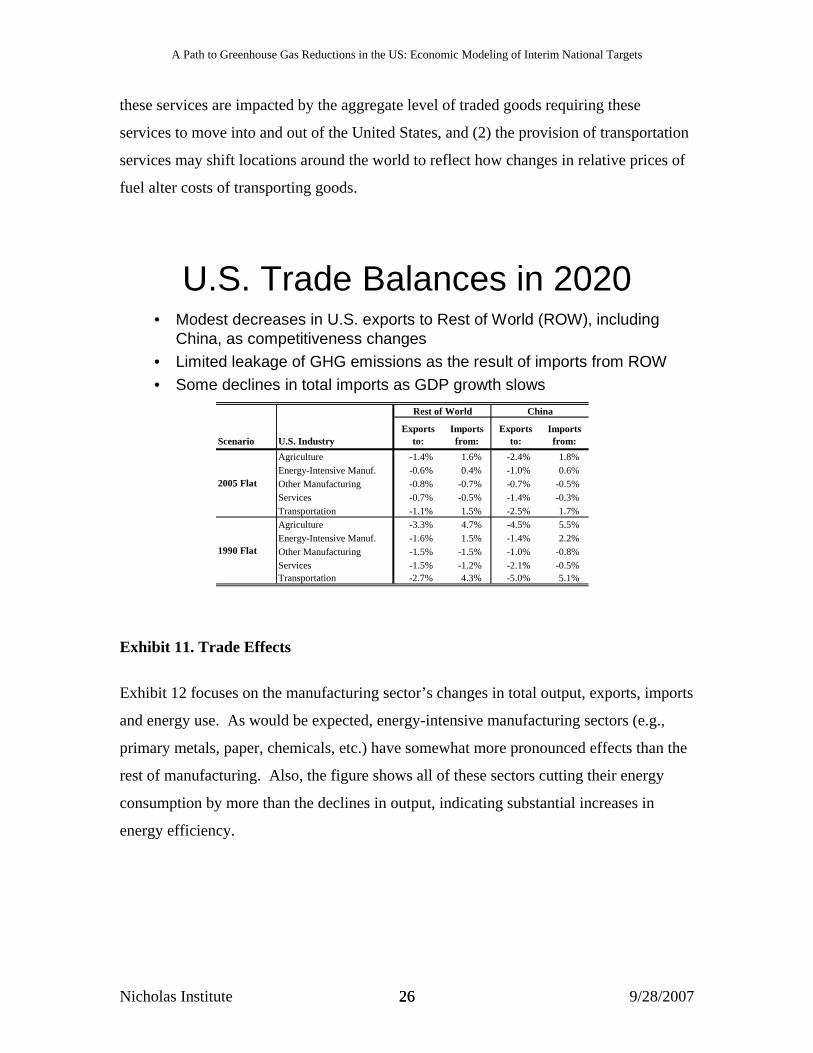
Adopting GHG caps in the U.S. changes the terms of trade, raising relative prices of U.S.
goods.13 Exhibit 11 summarizes changes in trade flows with the rest of the world, and
China specifically, by key sectors under each of the target scenarios. In general, we see a
modest decline in exports and a small increase in imports. Changes in trade flows are
larger in proportional terms than the changes in GDP or employment because traded
goods are just a subset of all produced and consumed goods. Moreover, trade flows are
generally more sensitive to changes in relative prices than aggregate production and
consumption, as they essentially reflect changes in market share rather than changes in
the size of the market. The agricultural trade flow is affected by the role it plays as a
supplier of offset credits to the other sectors, which leads to a slight contraction in
agricultural output. Changes in transportation service flows are driven by two factors: (1)
13 As discussed in the scenario descriptions, countries subject to the Kyoto Protocol are assumed to meet their Kyoto targets throughout these scenarios. All other countries face no GHG caps under these scenarios.
Nicholas Institute 25 9/28/2007 25
A Path to Greenhouse Gas Reductions in the US: Economic Modeling of Interim National Targets
these services are impacted by the aggregate level of traded goods requiring these
services to move into and out of the United States, and (2) the provision of transportation
services may shift locations around the world to reflect how changes in relative prices of
fuel alter costs of transporting goods.
U.S. Trade Balances in 2020• Modest decreases in U.S. exports to Rest of World (ROW), including
China, as competitiveness changes• Limited leakage of GHG emissions as the result of imports from ROW• Some declines in total imports as GDP growth slows
Scenario U.S. IndustryExports
to:Imports from:
Exports to:
Imports from:
Agriculture -1.4% 1.6% -2.4% 1.8% Energy-Intensive Manuf. -0.6% 0.4% -1.0% 0.6% Other Manufacturing -0.8% -0.7% -0.7% -0.5% Services -0.7% -0.5% -1.4% -0.3% Transportation -1.1% 1.5% -2.5% 1.7% Agriculture -3.3% 4.7% -4.5% 5.5% Energy-Intensive Manuf. -1.6% 1.5% -1.4% 2.2% Other Manufacturing -1.5% -1.5% -1.0% -0.8% Services -1.5% -1.2% -2.1% -0.5% Transportation -2.7% 4.3% -5.0% 5.1%
Rest of World China
2005 Flat
1990 Flat
Exhibit 11. Trade Effects
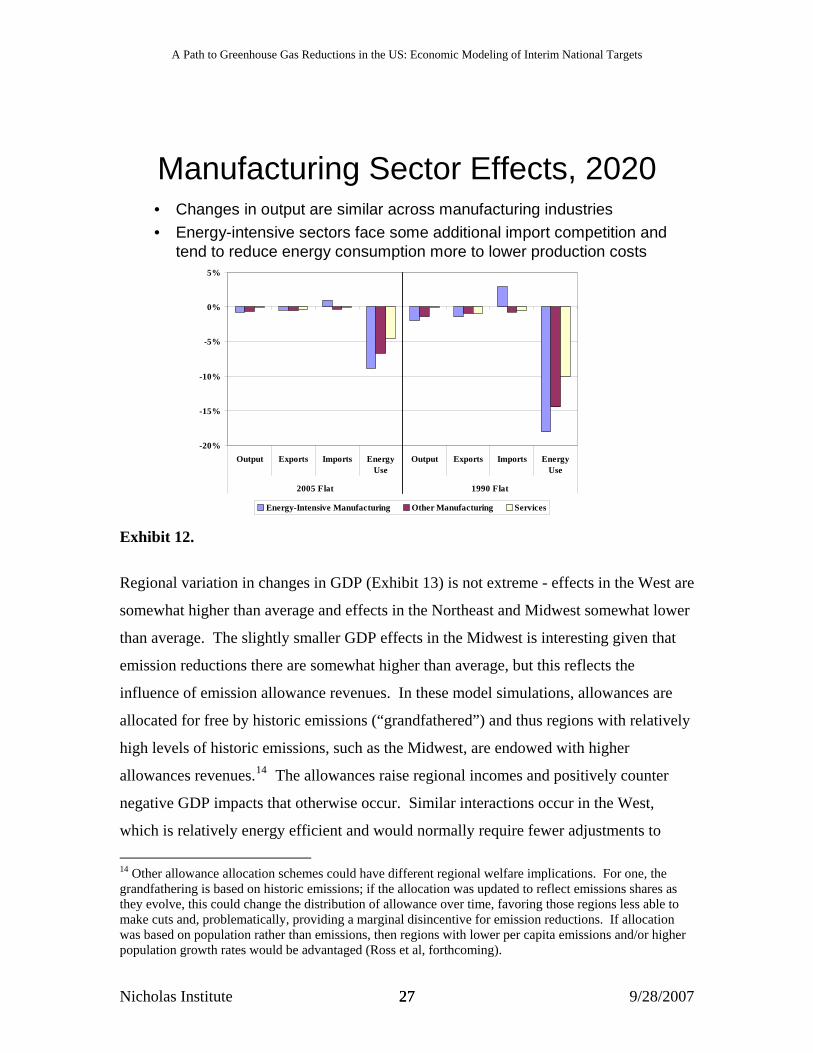
Exhibit 12 focuses on the manufacturing sector’s changes in total output, exports, imports
and energy use. As would be expected, energy-intensive manufacturing sectors (e.g.,
primary metals, paper, chemicals, etc.) have somewhat more pronounced effects than the
rest of manufacturing. Also, the figure shows all of these sectors cutting their energy
consumption by more than the declines in output, indicating substantial increases in
energy efficiency.
Nicholas Institute 26 9/28/2007 26
A Path to Greenhouse Gas Reductions in the US: Economic Modeling of Interim National Targets
Manufacturing Sector Effects, 2020• Changes in output are similar across manufacturing industries• Energy-intensive sectors face some additional import competition and
tend to reduce energy consumption more to lower production costs
-20%
-15%
-10%
-5%
0%
5%
Output Exports Imports EnergyUse
Output Exports Imports EnergyUse
2005 Flat 1990 Flat
Energy-Intensive Manufacturing Other Manufacturing Services
Exhibit 12.
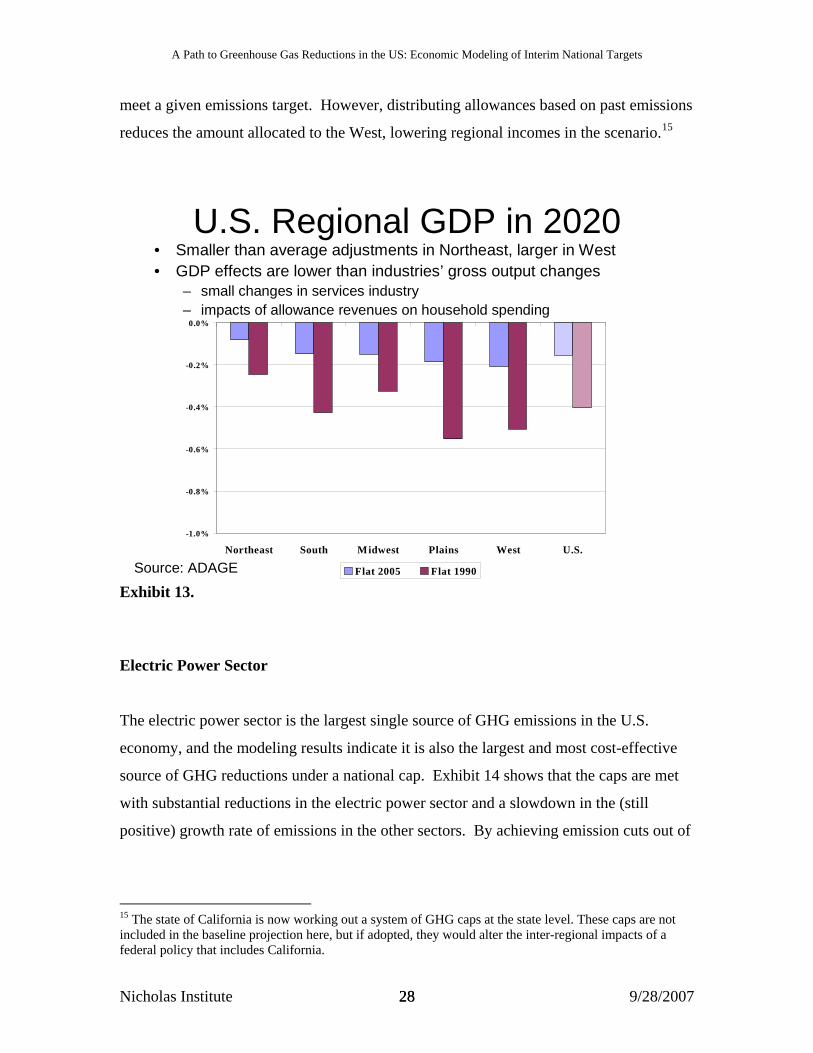
Regional variation in changes in GDP (Exhibit 13) is not extreme - effects in the West are
somewhat higher than average and effects in the Northeast and Midwest somewhat lower
than average. The slightly smaller GDP effects in the Midwest is interesting given that
emission reductions there are somewhat higher than average, but this reflects the
influence of emission allowance revenues. In these model simulations, allowances are
allocated for free by historic emissions (“grandfathered”) and thus regions with relatively
high levels of historic emissions, such as the Midwest, are endowed with higher
allowances revenues.14 The allowances raise regional incomes and positively counter
negative GDP impacts that otherwise occur. Similar interactions occur in the West,
which is relatively energy efficient and would normally require fewer adjustments to
14 Other allowance allocation schemes could have different regional welfare implications. For one, the grandfathering is based on historic emissions; if the allocation was updated to reflect emissions shares as they evolve, this could change the distribution of allowance over time, favoring those regions less able to make cuts and, problematically, providing a marginal disincentive for emission reductions. If allocation was based on population rather than emissions, then regions with lower per capita emissions and/or higher population growth rates would be advantaged (Ross et al, forthcoming).
Nicholas Institute 27 9/28/2007 27
A Path to Greenhouse Gas Reductions in the US: Economic Modeling of Interim National Targets
meet a given emissions target. However, distributing allowances based on past emissions
reduces the amount allocated to the West, lowering regional incomes in the scenario.15
U.S. Regional GDP in 2020• Smaller than average adjustments in Northeast, larger in West• GDP effects are lower than industries’ gross output changes
– small changes in services industry– impacts of allowance revenues on household spending
-1.0%
-0.8%
-0.6%
-0.4%
-0.2%
0.0%
Northeast South Midwest Plains West U.S.
Flat 2005 Flat 1990Source: ADAGE
Exhibit 13.
Electric Power Sector
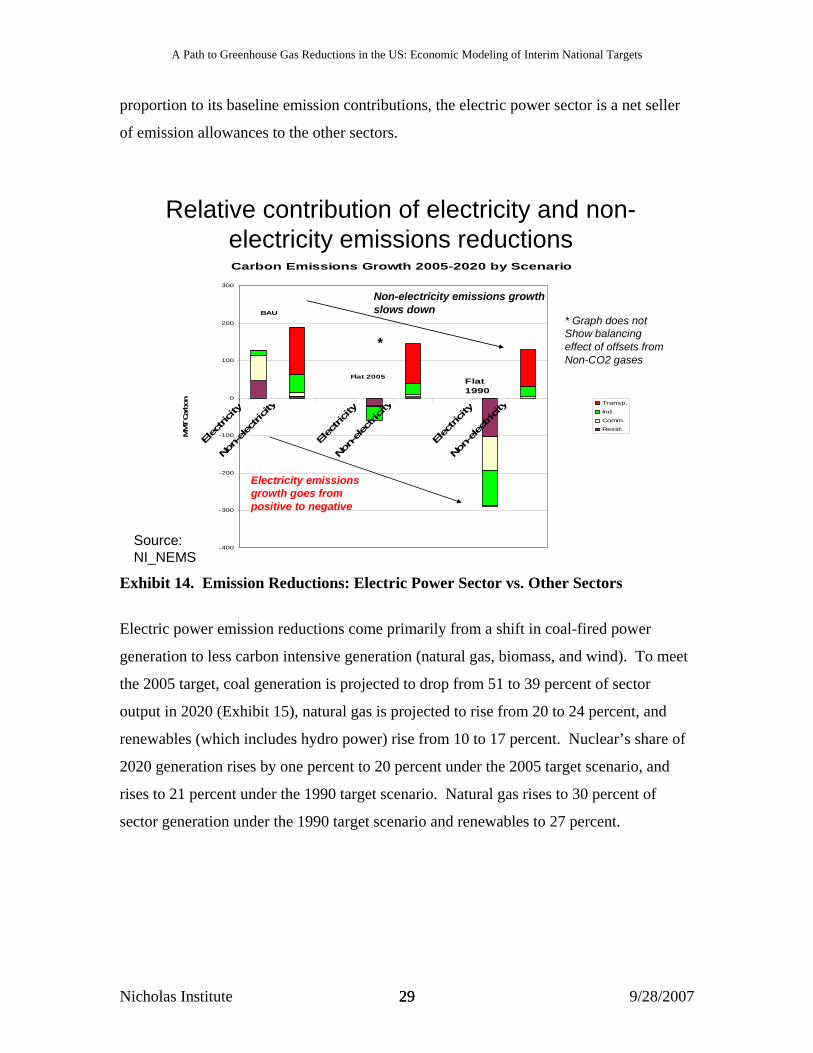
The electric power sector is the largest single source of GHG emissions in the U.S.
economy, and the modeling results indicate it is also the largest and most cost-effective
source of GHG reductions under a national cap. Exhibit 14 shows that the caps are met
with substantial reductions in the electric power sector and a slowdown in the (still
positive) growth rate of emissions in the other sectors. By achieving emission cuts out of
15 The state of California is now working out a system of GHG caps at the state level. These caps are not included in the baseline projection here, but if adopted, they would alter the inter-regional impacts of a federal policy that includes California.
Nicholas Institute 28 9/28/2007 28
A Path to Greenhouse Gas Reductions in the US: Economic Modeling of Interim National Targets
proportion to its baseline emission contributions, the electric power sector is a net seller
of emission allowances to the other sectors.
Relative contribution of electricity and non-electricity emissions reductionsCarbon Emissions Growth 2005-2020 by Scenario
-400
-300
-200
-100
0
100
200
300
Elec
tricity
Non-ele
ctric
ity
Elec
tricity
Non-ele
ctric
ity
Elec
tricity
Non-ele
ctric
ity
MM
T Car
bon Transp.
Ind.
Comm.
Resid.
BAU
Flat 2005 Flat 1990
Source:NI_NEMS
Non-electricity emissions growth slows down
* Graph does notShow balancingeffect of offsets from Non-CO2 gases
*
Electricity emissionsgrowth goes from positive to negative
Exhibit 14. Emission Reductions: Electric Power Sector vs. Other Sectors
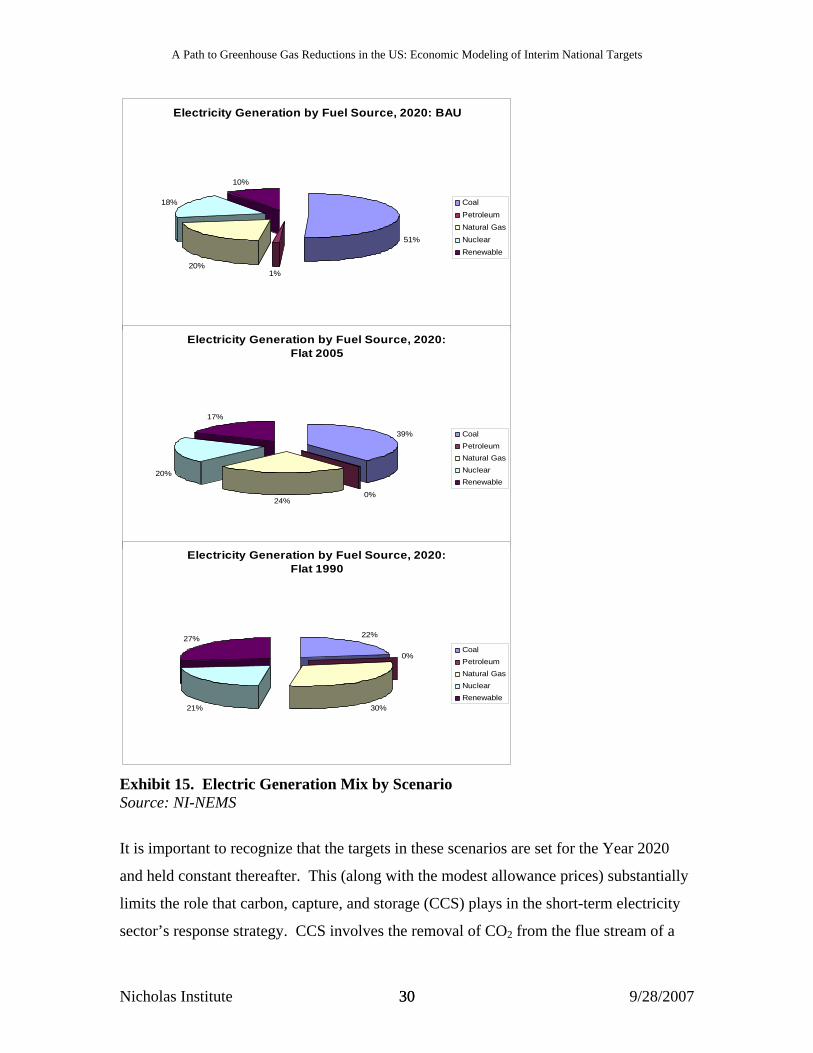
Electric power emission reductions come primarily from a shift in coal-fired power
generation to less carbon intensive generation (natural gas, biomass, and wind). To meet
the 2005 target, coal generation is projected to drop from 51 to 39 percent of sector
output in 2020 (Exhibit 15), natural gas is projected to rise from 20 to 24 percent, and
renewables (which includes hydro power) rise from 10 to 17 percent. Nuclear’s share of
2020 generation rises by one percent to 20 percent under the 2005 target scenario, and
rises to 21 percent under the 1990 target scenario. Natural gas rises to 30 percent of
sector generation under the 1990 target scenario and renewables to 27 percent.
Nicholas Institute 29 9/28/2007 29
A Path to Greenhouse Gas Reductions in the US: Economic Modeling of Interim National Targets
Electricity Generation by Fuel Source, 2020: BAU
51%
1%20%
18%
10%
CoalPetroleum Natural GasNuclearRenewable
Electricity Generation by Fuel Source, 2020: Flat 2005
39%
0%24%
20%
17%
CoalPetroleum Natural GasNuclearRenewable
Electricity Generation by Fuel Source, 2020: Flat 1990
22%
0%
30%21%
27%CoalPetroleum Natural GasNuclearRenewable
Exhibit 15. Electric Generation Mix by Scenario Source: NI-NEMS
It is important to recognize that the targets in these scenarios are set for the Year 2020
and held constant thereafter. This (along with the modest allowance prices) substantially
limits the role that carbon, capture, and storage (CCS) plays in the short-term electricity
sector’s response strategy. CCS involves the removal of CO2 from the flue stream of a
Nicholas Institute 30 9/28/2007 30
A Path to Greenhouse Gas Reductions in the US: Economic Modeling of Interim National Targets
coal-generating unit (normally using an integrated gasification combined cycle or IGCC
technology in the combustion process), and pipes the CO2 for below-ground storage,
rather than release to the atmosphere.
CCS is a very promising strategy and one that is expected to play a vital role if
substantial long-term reductions are targeted beyond 2020. The post-2020 timeframe is
relevant for CCS because CCS still needs to be demonstrated for broad scale commercial
application, which will take some time, and because, while effective, it will likely be
more expensive than the other options such as fuel-switching (MIT, 2007). CCS does not
penetrate in most of this paper’s scenarios because of the shorter time horizon and the
somewhat modest emission targets evaluated.
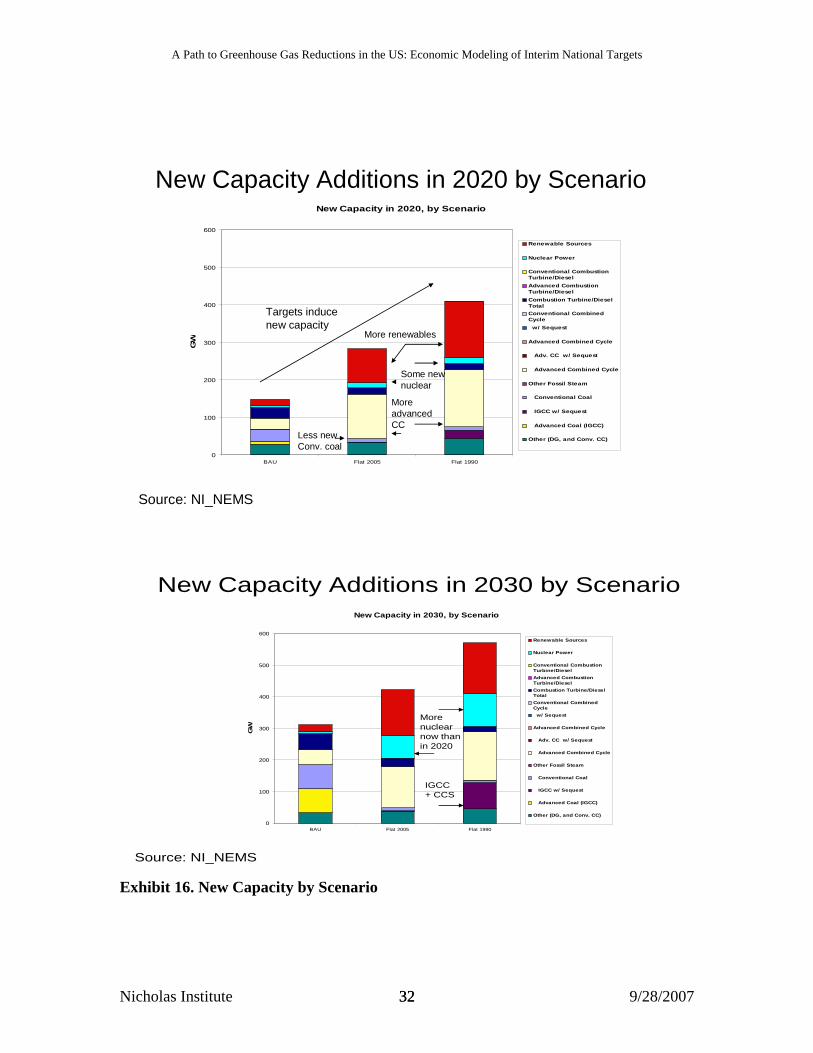
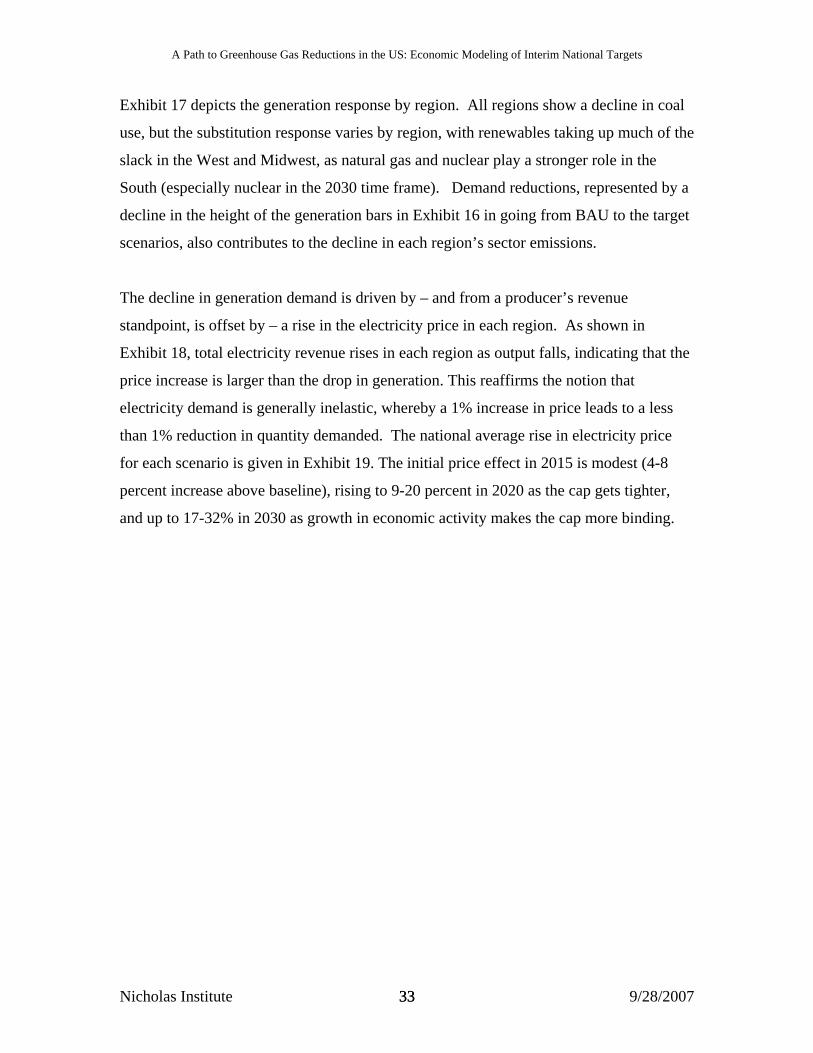
Exhibit 16 shows new generation capacity development in the power sector by 2020 and
2030 under BAU and the two emission targets. The targets induce an acceleration of
capital replacement over BAU, with a roughly doubling of BAU capacity built by 2020
under the 2005 target and about a tripling of capacity built under the 1990 target.
Consistent with the changes in generation mix described above, the new capacity shows
primarily renewables and natural gas replacing conventional coal capacity additions in
2020. In 2030, more nuclear capacity is added under both policy targets and IGCC +
CCS capacity is added by 2030 in the more stringent 1990 target scenario.
Nicholas Institute 31 9/28/2007 31
A Path to Greenhouse Gas Reductions in the US: Economic Modeling of Interim National Targets
New Capacity Additions in 2020 by ScenarioNew Capacity in 2020, by Scenario
0
100
200
300
400
500
600
BAU Flat 2005 Flat 1990
GW
Renewable Sources
Nuclear Power
Conventional CombustionTurbine/DieselAdvanced CombustionTurbine/DieselCombustion Turbine/DieselTotalConventional CombinedCycle w/ Sequest
Advanced Combined Cycle
Adv. CC w/ Sequest
Advanced Combined Cycle
Other Fossil Steam
Conventional Coal
IGCC w/ Sequest
Advanced Coal (IGCC)
Other (DG, and Conv. CC)
Source: NI_NEMS
Targets induce new capacity
Less newConv. coal
More renewables
More advancedCC
Some newnuclear
New Capacity Additions in 2030 by ScenarioNew Capacity in 2030, by Scenario
0
100
200
300
400
500
600
BAU Flat 2005 Flat 1990
GW
Renewable Sources
Nuclear Power
Conventional CombustionTurbine/DieselAdvanced CombustionTurbine/DieselCombustion Turbine/DieselTotalConventional CombinedCycle w/ Sequest
Advanced Combined Cycle
Adv. CC w/ Sequest
Advanced Combined Cycle
Other Fossil Steam
Conventional Coal
IGCC w/ Sequest
Advanced Coal (IGCC)
Other (DG, and Conv. CC)
Source: NI_NEMS
Morenuclearnow thanin 2020
IGCC+ CCS
Exhibit 16. New Capacity by Scenario
Nicholas Institute 32 9/28/2007 32
A Path to Greenhouse Gas Reductions in the US: Economic Modeling of Interim National Targets
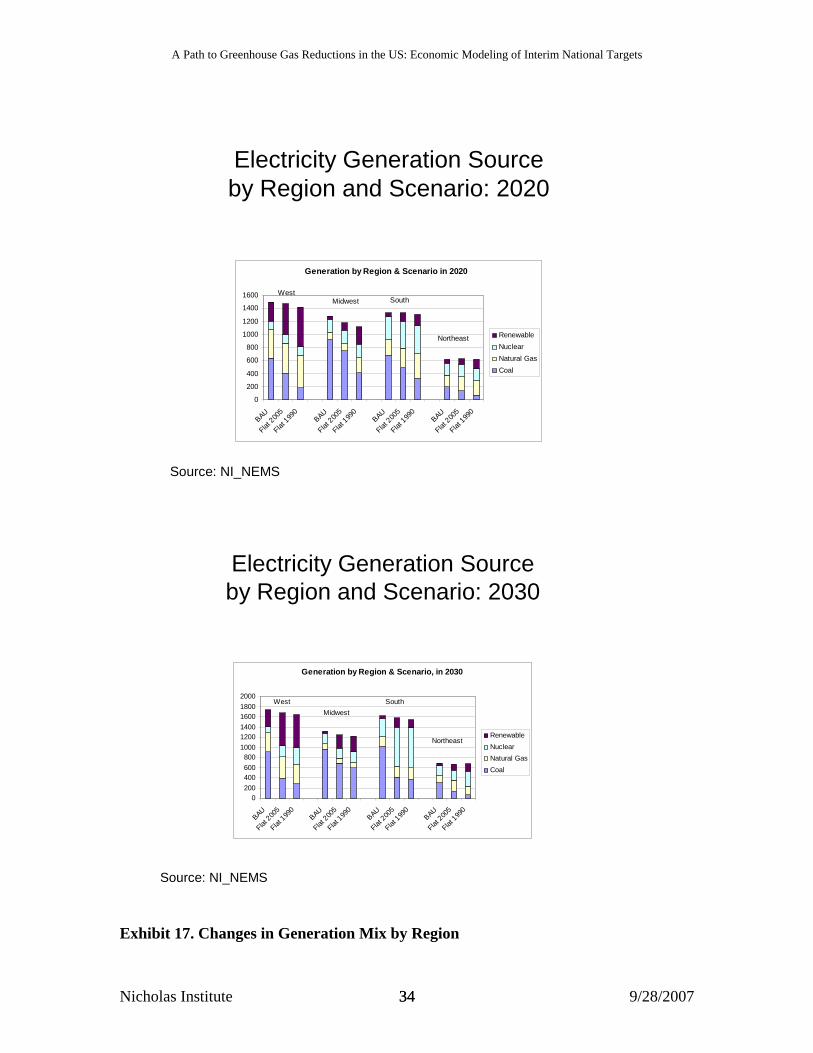
Exhibit 17 depicts the generation response by region. All regions show a decline in coal
use, but the substitution response varies by region, with renewables taking up much of the
slack in the West and Midwest, as natural gas and nuclear play a stronger role in the
South (especially nuclear in the 2030 time frame). Demand reductions, represented by a
decline in the height of the generation bars in Exhibit 16 in going from BAU to the target
scenarios, also contributes to the decline in each region’s sector emissions.
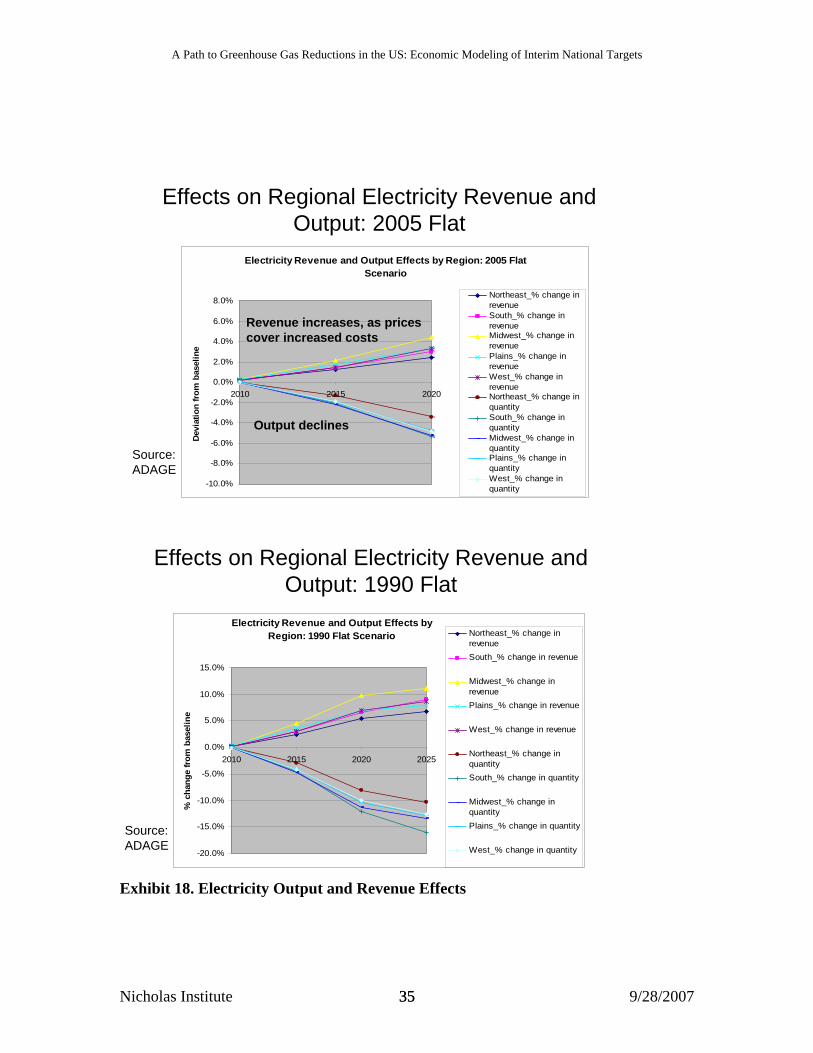
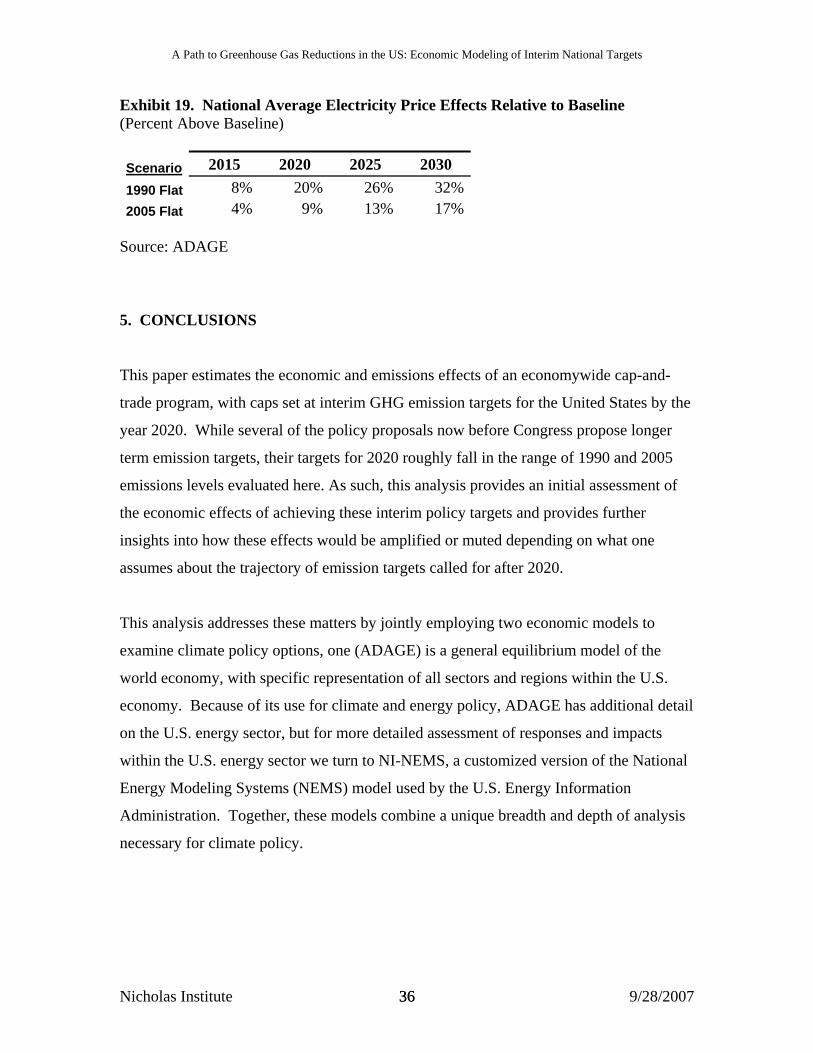
The decline in generation demand is driven by – and from a producer’s revenue
standpoint, is offset by – a rise in the electricity price in each region. As shown in
Exhibit 18, total electricity revenue rises in each region as output falls, indicating that the
price increase is larger than the drop in generation. This reaffirms the notion that
electricity demand is generally inelastic, whereby a 1% increase in price leads to a less
than 1% reduction in quantity demanded. The national average rise in electricity price
for each scenario is given in Exhibit 19. The initial price effect in 2015 is modest (4-8
percent increase above baseline), rising to 9-20 percent in 2020 as the cap gets tighter,
and up to 17-32% in 2030 as growth in economic activity makes the cap more binding.
Nicholas Institute 33 9/28/2007 33
A Path to Greenhouse Gas Reductions in the US: Economic Modeling of Interim National Targets
Electricity Generation Sourceby Region and Scenario: 2020
Generation by Region & Scenario in 2020
0
200
400
600
800
1000
1200
1400
1600
BAU
Flat 200
5
Flat 199
0BAU
Flat 200
5
Flat 199
0BAU
Flat 200
5
Flat 199
0BAU
Flat 200
5
Flat 199
0
RenewableNuclearNatural GasCoal
West
Northeast
SouthMidwest
Source: NI_NEMS
Electricity Generation Sourceby Region and Scenario: 2030
Generation by Region & Scenario, in 2030
0200400600800
100012001400160018002000
BAU
Flat 200
5
Flat 199
0BAU
Flat 200
5
Flat 199
0BAU
Flat 200
5
Flat 199
0BAU
Flat 200
5
Flat 199
0
RenewableNuclearNatural GasCoal
West
Northeast
SouthMidwest
Source: NI_NEMS
Exhibit 17. Changes in Generation Mix by Region
Nicholas Institute 34 9/28/2007 34
A Path to Greenhouse Gas Reductions in the US: Economic Modeling of Interim National Targets
Effects on Regional Electricity Revenue and Output: 2005 Flat
Electricity Revenue and Output Effects by Region: 2005 Flat Scenario
-10.0%
-8.0%
-6.0%
-4.0%
-2.0%
0.0%
2.0%
4.0%
6.0%
8.0%
2010 2015 2020
Dev
iatio
n fr
om b
asel
ine
Northeast_% change inrevenueSouth_% change inrevenueMidwest_% change inrevenuePlains_% change inrevenueWest_% change inrevenueNortheast_% change inquantitySouth_% change inquantityMidwest_% change inquantityPlains_% change inquantityWest_% change inquantity
Output declines
Revenue increases, as pricescover increased costs
Source:ADAGE
Effects on Regional Electricity Revenue and Output: 1990 Flat
Electricity Revenue and Output Effects by Region: 1990 Flat Scenario Northeast_% change in
revenueSouth_% change in revenue
-15.0%
-10.0%
-5.0%
0.0%
5.0%
10.0%
15.0%
2010 2015 2020 2025
% c
hang
e fr
om b
asel
ine
Midwest_% change inrevenuePlains_% change in revenue
West_% change in revenue
Northeast_% change inquantitySouth_% change in quantity
Midwest_% change inquantityPlains_% change in quantity
-20.0% West_% change in quantity
Source:
xhibit 18. Electricity Output and Revenue Effects
ADAGE
E
Nicholas Institute 35 9/28/2007 35
A Path to Greenhouse Gas Reductions in the US: Economic Modeling of Interim National Targets
Exhibit 19. National Average Electricity Price Effects Relative to Baseline ercent Above Baseline)
(P
Scenario
2015 2020 2025 2030 1990 Flat 8% 20% 26% 32% 2005 Flat 4% 9% 13% 17%
ource: ADAGE
. CONCLUSIONS
e
t of
on what one
ssumes about the trajectory of emission targets called for after 2020.
tail
ational
models combine a unique breadth and depth of analysis
ecessary for climate policy.
S
5
This paper estimates the economic and emissions effects of an economywide cap-and-
trade program, with caps set at interim GHG emission targets for the United States by th
year 2020. While several of the policy proposals now before Congress propose longer
term emission targets, their targets for 2020 roughly fall in the range of 1990 and 2005
emissions levels evaluated here. As such, this analysis provides an initial assessmen
the economic effects of achieving these interim policy targets and provides further
insights into how these effects would be amplified or muted depending
a
This analysis addresses these matters by jointly employing two economic models to
examine climate policy options, one (ADAGE) is a general equilibrium model of the
world economy, with specific representation of all sectors and regions within the U.S.
economy. Because of its use for climate and energy policy, ADAGE has additional de
on the U.S. energy sector, but for more detailed assessment of responses and impacts
within the U.S. energy sector we turn to NI-NEMS, a customized version of the N
Energy Modeling Systems (NEMS) model used by the U.S. Energy Information
Administration. Together, these
n
Nicholas Institute 36 9/28/2007 36
A Path to Greenhouse Gas Reductions in the US: Economic Modeling of Interim National Targets
The results of the modeling analyses produced several key insights that can inform
s
in
roduct is
smaller
r
g
ggressive action may be warranted. Complementary
orld.
ers
d
the world. The magnitude of these trade
policymakers as they consider the range of GHG cap-and-trade options before them, a
summarized below.
• The macroeconomic impacts of meeting the two emissions targets are fairly
modest for the economy as a whole, though more adjustments are expected
energy-intensive sectors than in other sectors that are less dependent on energy
production or use. Under business-as-usual (BAU), gross domestic p
expected to rise in absolute terms by more than 50 percent from 2005-2020.
Under the climate caps, GDP is projected to be from 0.15 to 0.40 percent
in 2020 than this BAU level under the 2005 and 1990 target scenarios
respectively. In other words, the economy is slated to grow substantially with o
without the policies in place. The marginal effect of GDP loss would be
equivalent to less than one day of economic output. This estimate does not
include the value of economic benefits generated (costs avoided) by reducin
climate risks. If unmitigated climate risks cost the economy more than the
economic opportunity costs measured here, than more extensive action may be
warranted. If the climate risk cost to the economy is smaller than the costs
estimated here, less a
research is needed to pair these costs with benefits, perhaps building off of the
recent work by Stern (2006) and Nordhaus (2007) and synthesis of the IPCC
Working Group II.
• U.S. adoption of GHG caps could affect trade flows with the rest of the w
In these simulations, other countries are projected to continue with their Kyoto
commitments for the time being. This means that the United States would join
Kyoto Annex I countries in taking on commitments, thereby losing trade
advantage procured when Kyoto was rejected in the United States. In addition,
like the other Annex I countries, this would endow non-Annex I trading partn
such as China with terms of trade advantages over the United States. In these
scenarios, the trade disadvantages lead to only a modest drop in exports to, an
increase in imports from, the rest of
Nicholas Institute 37 9/28/2007 37
A Path to Greenhouse Gas Reductions in the US: Economic Modeling of Interim National Targets
effects in the longer term will, of course, depend on how each group of nations
adopts future GHG commitments and how technologies and costs change in
adopting vs.non-adopting countries
• Initial allowance prices would likely be modest, then rise as the target becomes
more stringent. An economywide cap-and-trade program achieving these
emissions targets is projected to produce allowance prices in the range of $4-8 pe
ton of CO2 in 2015, rising to $7-26 per ton in 2020. For context, this largely falls
below the futures prices trading on the EU ETS for the first commitment peri
the Kyoto Protocol during the summer of 2007 ($25-35 per ton). However, the
comparison should not be taken too far as the EU ETS has, like most commodity
markets, proven to be somewhat volatile in response to, among other things,
previously unknown information on member country national emissions le
and changes in expectations about post-2012 policy options. Presumably a world
in which the United States, European Union and other countries wou
r
od of
vels
ld jointly
re that
d demand
ilarly,
cted
n
participate in a global carbon market would tend to equalize prices across
countries, but this would depend on negotiations between countries to ensu
the reduction efforts are harmonized and linked to a common goal.
• Electric power accounts for a disproportionate share of the emission reductions
due to more cost-effective opportunities in that sector. It is less costly to
decarbonize electric power through fuel switching, the adoption of low-carbon
generation technologies such as renewable power and nuclear power, an
reductions than it is to reduce emissions in other major sectors of the economy.
This suggests that the electric power sector could produce more than their share of
emissions and could be a net seller of allowances to the other sectors if
allowances are allocated across sector in proportion to their emissions. Sim
the economic impacts on energy-intensive businesses as a group (or other affe
groups such as households) will depend on allowance allocations, which could be
used to offset effects on particularly disadvantaged areas of the economy.
• Integrated Gasification Combined Cycle (IGCC) with Carbon Capture and
Storage (CCS) plays a minor role in these mitigation scenarios, but will be more
important if the targeted cuts are deeper or sustained longer than they are i
Nicholas Institute 38 9/28/2007 38
A Path to Greenhouse Gas Reductions in the US: Economic Modeling of Interim National Targets
this study. This underscores a very important policy implication. If firms in the
power sector expect to be held to targets in the 1990-2005 range by 2020 and kept
constant thereafter (as is simulated in this paper), they will not likely opt for
IGCC+CCS as a strategy by 2020. However, if they expect deeper reductions
beyond 2020, other economic studies suggest that IGCC+CCS will be an integral
part of the solution (Paltsev et al. 2007, US EPA 2007), which has imp
implications for the future of coal. Widespread adoption of IGCC+CCS coul
allow coal to roughly maintain its current share of the electric power market
some long-term reduction scenarios (e.g., US EPA, 2007), rather than
ortant
d
under
s
ts. Any significant expansion in nuclear power would
G
ndicated in these results. Concerns
nd
l
experiencing the decline shown here. Because NI-NEMS does not forecast
beyond 2030, we can only suspect without further analysis that IGCC+CCS
would likely be implemented if the flat caps were kept in place beyond 2030.
• As with IGCC+CCS, the role of nuclear power as a mitigation response i
relatively small in these scenarios, but would likely grow substantially with
deeper long-term targe
require solutions to current problems associated with safe nuclear storage
capacity, certainty of long-term uranium supplies and overcoming public concerns
about safety issues.
• Renewable sources comprise a large share of the generation response to a GH
cap. Advances in renewable technologies and the availability of a corresponding
infrastructure are expanding rapidly today, but will need to grow even more
dramatically to meet the generation needs i
about supply availability across time and space must be addressed by developing
an efficient portfolio of renewable options that can integrate with base load
generation and ensure reliable sourcing.
• While interregional differences in impacts are not that extreme, they exist a
are a factor to consider politically. Regional GDP impacts are a bit higher in the
West than in other regions, but this is determined to some extent by the assumed
“grandfathering” method for allocating emission allowances. Grandfathered
allowances are distributed based on historic emissions. The western United States
has historically been more GHG efficient than other regions because of their fue
Nicholas Institute 39 9/28/2007 39
A Path to Greenhouse Gas Reductions in the US: Economic Modeling of Interim National Targets
sources (e.g., hydro power and natural gas play a much larger role than coal) s
they might receive fewer allowances in the allocation scheme and also might find
it more costly to make marginal reductions than higher emitting regions. Th
would reduce the ability of Western emitters to sell allowances on the carb
market and redu
o
is
on
ce income opportunities relative to other regions. This situation
could be remedied by alternative allocation schemes that are based more on
nomic
nd unevenly distributed across the economy, but modest from a
acroeconomic point of view. Thus starting down the path toward long-term reductions
enate
40-50
ill
ll
ncertain as the scope, breadth and depth of interim targets out to 2020 may be, the depth
output levels or that otherwise reward those sources with lower emissions
intensities.
In summary, the scope and expectations of the climate policy matter. The eco
impacts of the policy scenarios simulated here – setting national GHG targets to 1990 and
2005 levels by 2020 respectively and leaving them fixed – can best be described as
discernible a
m
need not cause the significant economic harm referenced in the 2006 Sense of the S
resolution.
At a recent forum of economic modelers of climate change policy, some panelists
expressed concern about the accuracy and value of economic simulations incorporating
very long term emission targets (40-50 years plus).16 The concern is that short- to
interim-term results are greatly affected by modeled expectations of policy targets
years hence. Forward-looking economic models, such as those used in this analysis, w
anticipate steep future cuts and start taking actions today to minimize costs expected we
in the future. While this is the most economically efficient way to manage GHG
restrictions, it may cause more aggressive and costly actions today than might actually
unfold given policy uncertainty and less than perfect foresight of economic agents. As
u
16 Economic Modeling of Federal Climate Legislation. Symposium hosted by the Nicholas Institute for Environmental Policy Solutions, Duke University. July 18-19, 2007. Washington, DC. Presentations at conference website (http://www.nicholas.duke.edu/econmodeling/)
Nicholas Institute 40 9/28/2007 40
A Path to Greenhouse Gas Reductions in the US: Economic Modeling of Interim National Targets
of any future cuts beyond 2020 is even more so. This point, in part, explains this paper’
strategy in focusing on interim targets (2020) and holding them constant into the futur
Yet, the scientific community strongly counsels further emissions cuts be imposed past
2020. If deeper cuts are proposed after 2020 and results are examined past 2030, we
would presumably see larger impacts on the economy and potentially different re
(e.g., much more IGCC+CCS, more nuclear power if the infrastructure is there, larger
demand response and less reliance on basic fuel-switching from coal to natural gas).
Moreover, deep long term cuts would likely yield an evolution of technological
development and change that is diffic
s
e.
sponses
ult to predict or model. Modeling expectations and
sponses under long-term emissions targets and stochastic technological developments is
learly a fruitful area for the economic modeling community to focus on in order to better
development.
EIA. ation Administration
re
c
guide climate policy
6. REFERENCES
Congressional Record – Senate – S7053 - June 22, 2005.
Annual Energy Outlook (AEO). Recurring. Energy Informhttp://www.eia.doe.gov/oiaf/aeo/),
. 2003. The National Energy Modeling System: An Overview 200http://www.eia.doe.gov/oiaf/aeo/overview/
EIA 3.
EIA. 2006. The Electricity Market Module of the National Energy Modeling System Model Documentation Report. http://tonto.eia.doe.gov/FTPROOT/modeldoc/m068(2006).pdf
roject. https://www.gtap.agecon.purdue.edu/Global Trade Analysis P
IPCC. 2007. Climate Change 2007: Impacts, Adaptation, and Vulnerability. Fourth Assessment Report, Working Group II. Intergovermental Panel on Climate Change. http://www.ipcc-wg2.org/index.html
Minnesota IMPLAN Group. http://www.implan.com/index.html.
Institute of Technology’s MIT. Undated. Massachusetts Emissions Prediction and Policy Analysis, or EPPA, model (see http://web.mit.edu/globalchange/www/eppa.html
Nicholas Institute 41 9/28/2007 41
A Path to Greenhouse Gas Reductions in the US: Economic Modeling of Interim National Targets
MIT. 2007. The Future of Coal: Options for a Carbon-constrained World. http://web.mit.edu/coal/The_Future_of_Coal.pdf
Nicholas Institute for Environmental Policy Solutions. 2007. Economic Modeling of ington DC. Federal Climate Legislation. Symposium held on July 18-19, 2007, Wash
http://www.nicholas.duke.edu/econmodeling/
Nordhaus. 2007. The Challenge of Global Warming: Economic Models and Environmental Policy. Yale University. Document available at http://nordhaus.econ.yale.edu/dice_mss_072407_all.pdf
Paltsev, S., J. Reilly, H. Jacoby, A. Gurgel, G. Metcalf, A. Sokolov and J. Holak. 2007. and
Paltsev, S., J. M. Reilly, H. D. Jacoby, R. S. Eckaus, J. McFarland, M. Sarofim, M. Asadoorian and M. Babiker. 2005. The MIT Emissions Prediction and Policy
rogram on the Science and Policy of Global Change. Report No. 125.
Poin
Assessment of US Cap-and-Trade Proposals. MIT Joint Program on the SciencePolicy of Global Change. Report No. 146.
Analysis (EPPA) Model: Version 4. MIT Joint P
t Carbon. 2007 (daily). www.pointcarbon.com
Ross, M.T., B.C. Murray, R.H. Beach, and B.M. Depro. Forthcoming. “State-level ate
d documentation, http://www.rti.org/adage
Economic Impacts of Global Climate Change Policies: Analysis of the ClimStewardship Act of 2003.” Pew Center on Global Climate Change.
RTI International. The RTI Applied Dynamic Analysis of the Global Economy (ADAGE) Model. Website an
. Briefing packet, http://www.epa.gov/climatechange/downloads/s280fullbrief.pdf
Shoven, J.B., and J. Whalley. 1992. Applying General Equilibrium. Cambridge: Cambridge University Press.
Stern, N. 2006. Stern Review on the Economics of Climate Change. HM Treasury, UK. Cambridge University Press.
US EPA. 2007. EPA Analysis of The Climate Stewardship and Innovation Act of 2007
US EPA. 2005a. Regulatory Impact Analysis for the Final Clean Air Interstate Rule.
U.S.
US E r the Final Clean Air Visibility Rule or the Guidelines for Best Available Retrofit Technology (BART) Determinations Under the Regional Haze Regulations. U.S. Environmental Protection Agency, Office of Air and Radiation. EPA-452/R-05-004.
Environmental Protection Agency, Office of Air and Radiation. EPA-452/R-05-002
PA. 2005b. Regulatory Impact Analysis fo
Nicholas Institute 42 9/28/2007 42
the Nicholas Institute
The Nicholas Institute for Environmental Policy Solutions at Duke Universityis a nonpartisan institute founded in 2005 to engage with decision makers ingovernment, the private sector and the nonprofit community to developinnovative proposals that address critical environmental challenges. TheInstitute seeks to act as an “honest broker” in policy debates by fosteringopen, ongoing dialogue between stakeholders on all sides of the issues andby providing decision makers with timely and trustworthy policy-relevantanalysis based on academic research.The Institute, working in conjunctionwith the Nicholas School of the Environment and Earth Sciences, leveragesthe broad expertise of Duke University as well as public and private partnersnationwide.
for more information please contact:
Nicholas Institute for Environmental Policy Solutions
Duke University
Box 90328
Durham,NC 27708
919.613.8709
919.613.8712 fax
copyright © 2007 Nicholas Institute for Environmental Policy Solutions


![Response to Intervention (RtI) Handbook and RtI Resources · 2016-12-09 · OASD RtI Handbook [2] Response to Intervention (RtI) Overview Core Principles of RtI RtI is grounded in](https://img.pdfslide.us/doc/110x75/5f04175d7e708231d40c46b9/response-to-intervention-rti-handbook-and-rti-resources-2016-12-09-oasd-rti.jpg)