Embed Size (px)
Citation preview
APAC FUTURE OF ENERGY SUMMIT 亚太地区未来能源峰会
Michael Liebreich
Chairman of the Advisory Board
Twitter: @mliebreich
迈克尔·利布莱希
BNEF咨询委员会主席
2 November 2016, Shanghai
2016年11月2日,上海
1 Michael Liebreich @MLiebreich BNEF APAC Future of Energy Summit, 2 November 2016 #BNEFSummit
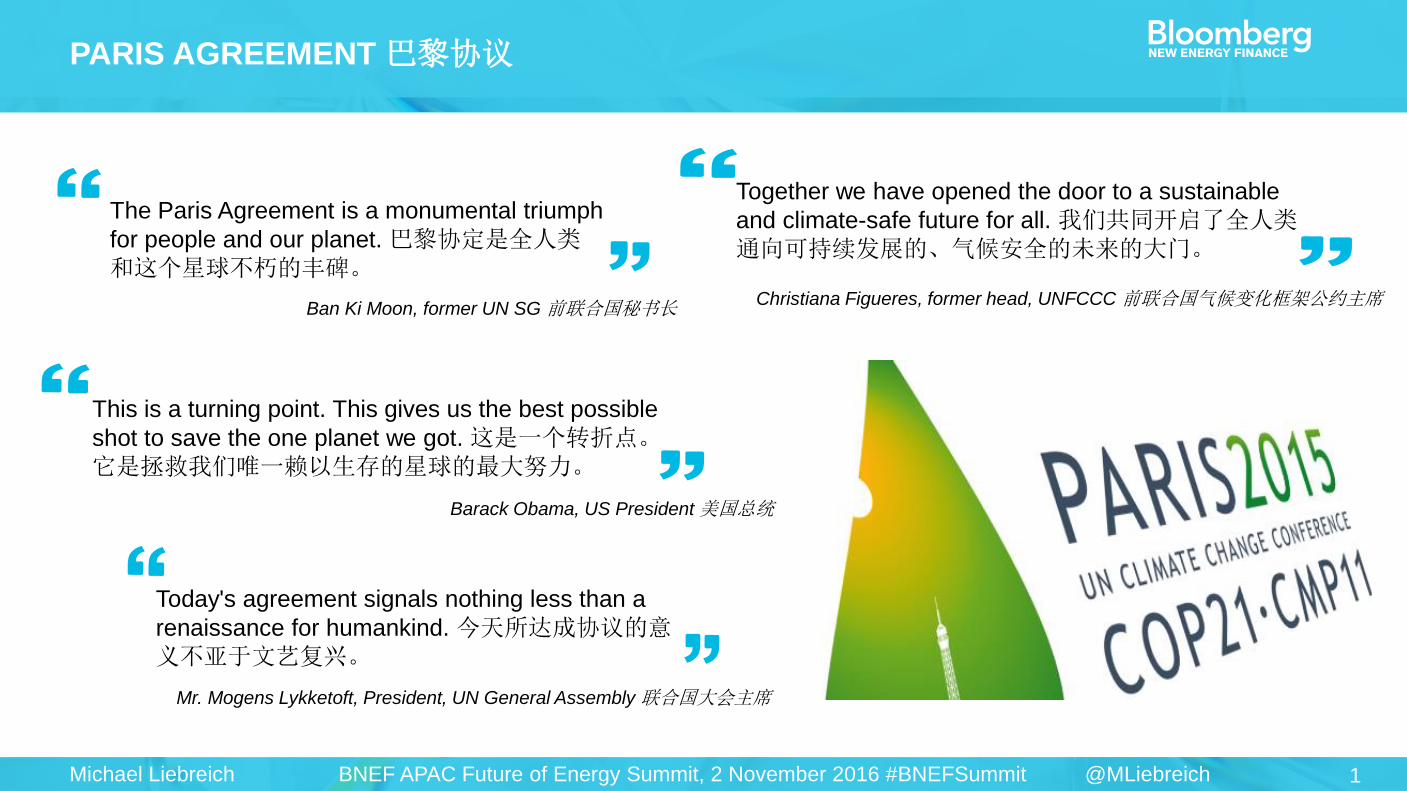
PARIS AGREEMENT 巴黎协议
The Paris Agreement is a monumental triumph
for people and our planet. 巴黎协定是全人类和这个星球不朽的丰碑。
Ban Ki Moon, former UN SG 前联合国秘书长
This is a turning point. This gives us the best possible
shot to save the one planet we got. 这是一个转折点。它是拯救我们唯一赖以生存的星球的最大努力。
Barack Obama, US President 美国总统
Today's agreement signals nothing less than a
renaissance for humankind. 今天所达成协议的意义不亚于文艺复兴。
Mr. Mogens Lykketoft, President, UN General Assembly 联合国大会主席
Together we have opened the door to a sustainable
and climate-safe future for all. 我们共同开启了全人类通向可持续发展的、气候安全的未来的大门。
Christiana Figueres, former head, UNFCCC 前联合国气候变化框架公约主席
2 Michael Liebreich @MLiebreich BNEF APAC Future of Energy Summit, 2 November 2016 #BNEFSummit
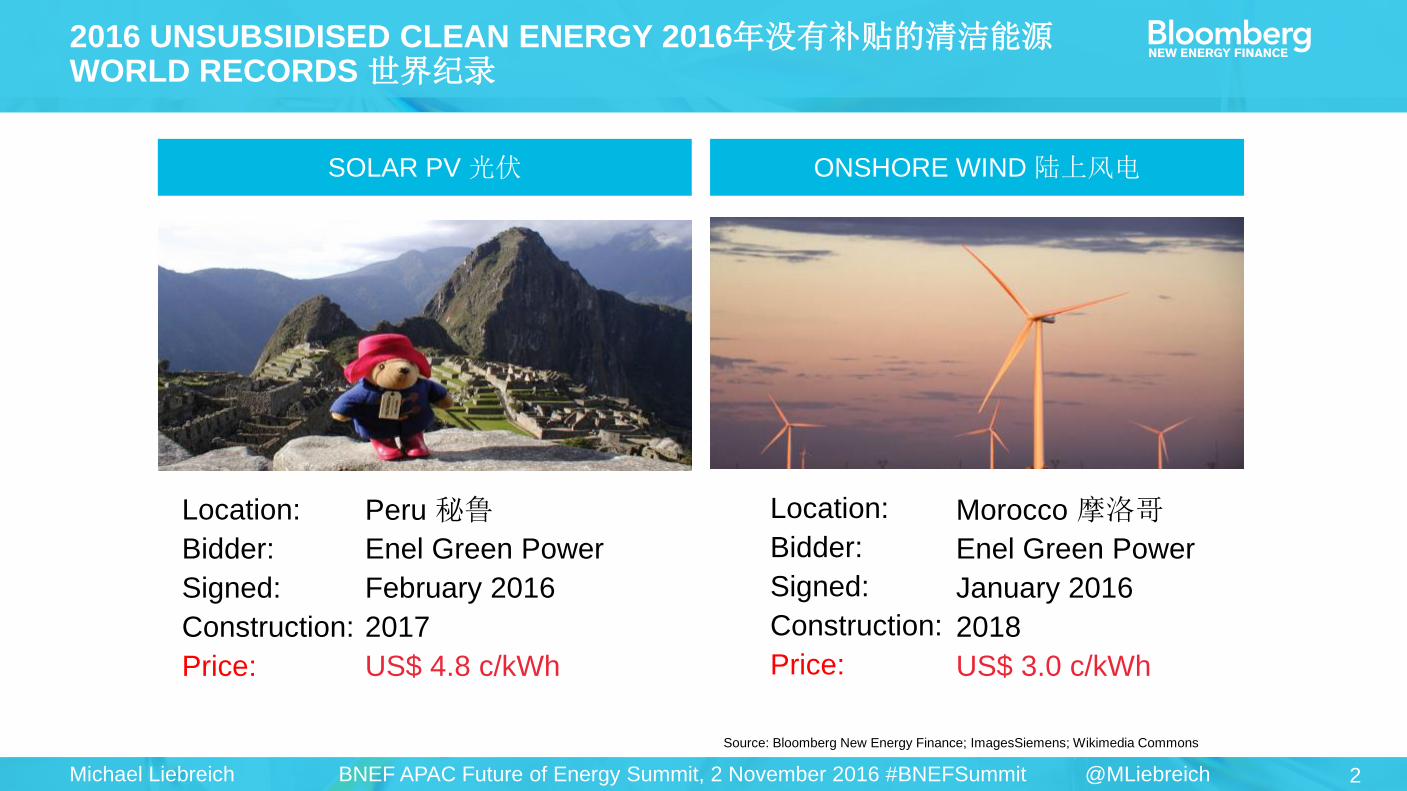
ONSHORE WIND 陆上风电 SOLAR PV 光伏
Location:
Bidder:
Signed:
Construction:
Price:
Morocco 摩洛哥
Enel Green Power
January 2016
2018
US$ 3.0 c/kWh
Location:
Bidder:
Signed:
Construction:
Price:
Peru 秘鲁
Enel Green Power
February 2016
2017
US$ 4.8 c/kWh
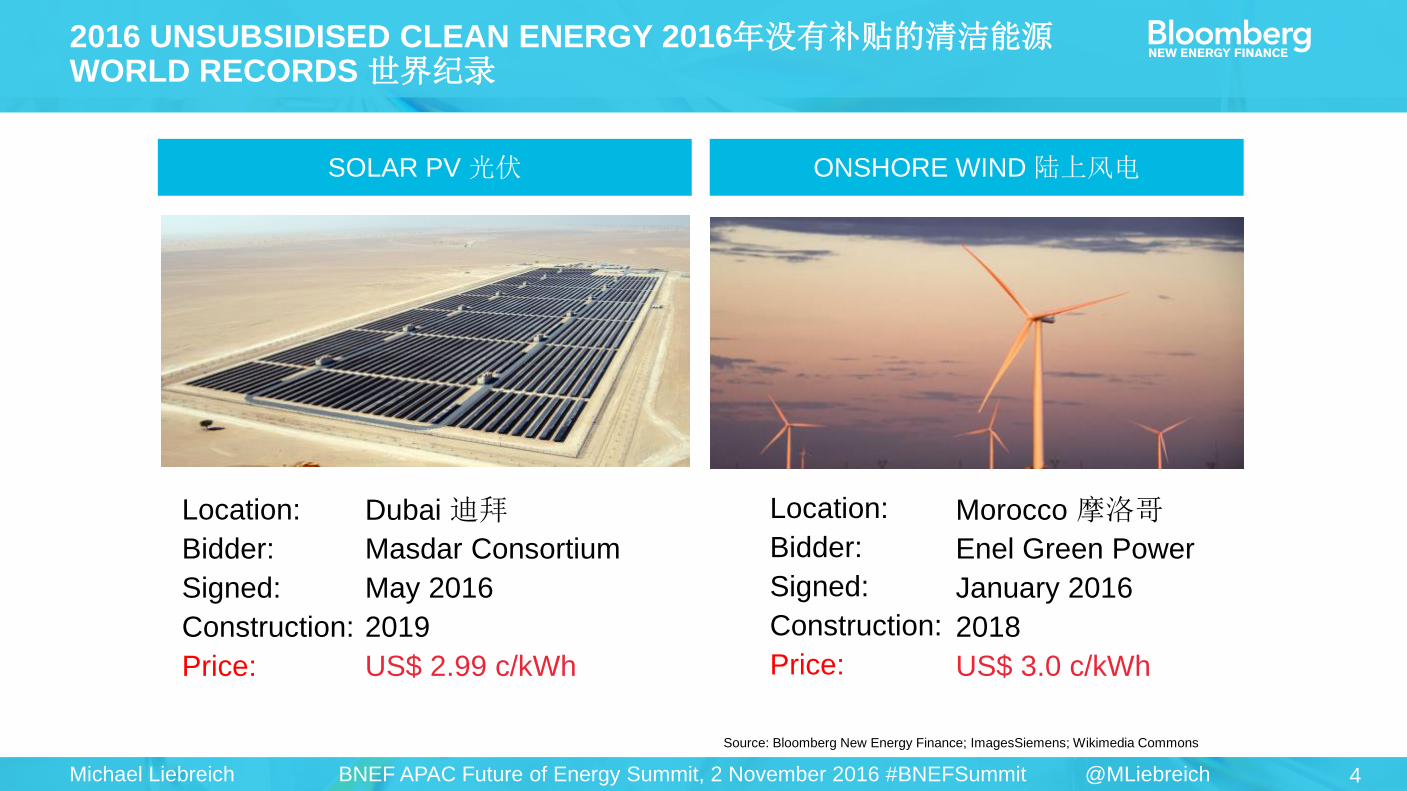
2016 UNSUBSIDISED CLEAN ENERGY 2016年没有补贴的清洁能源 WORLD RECORDS 世界纪录
Source: Bloomberg New Energy Finance; ImagesSiemens; Wikimedia Commons
3 Michael Liebreich @MLiebreich BNEF APAC Future of Energy Summit, 2 November 2016 #BNEFSummit
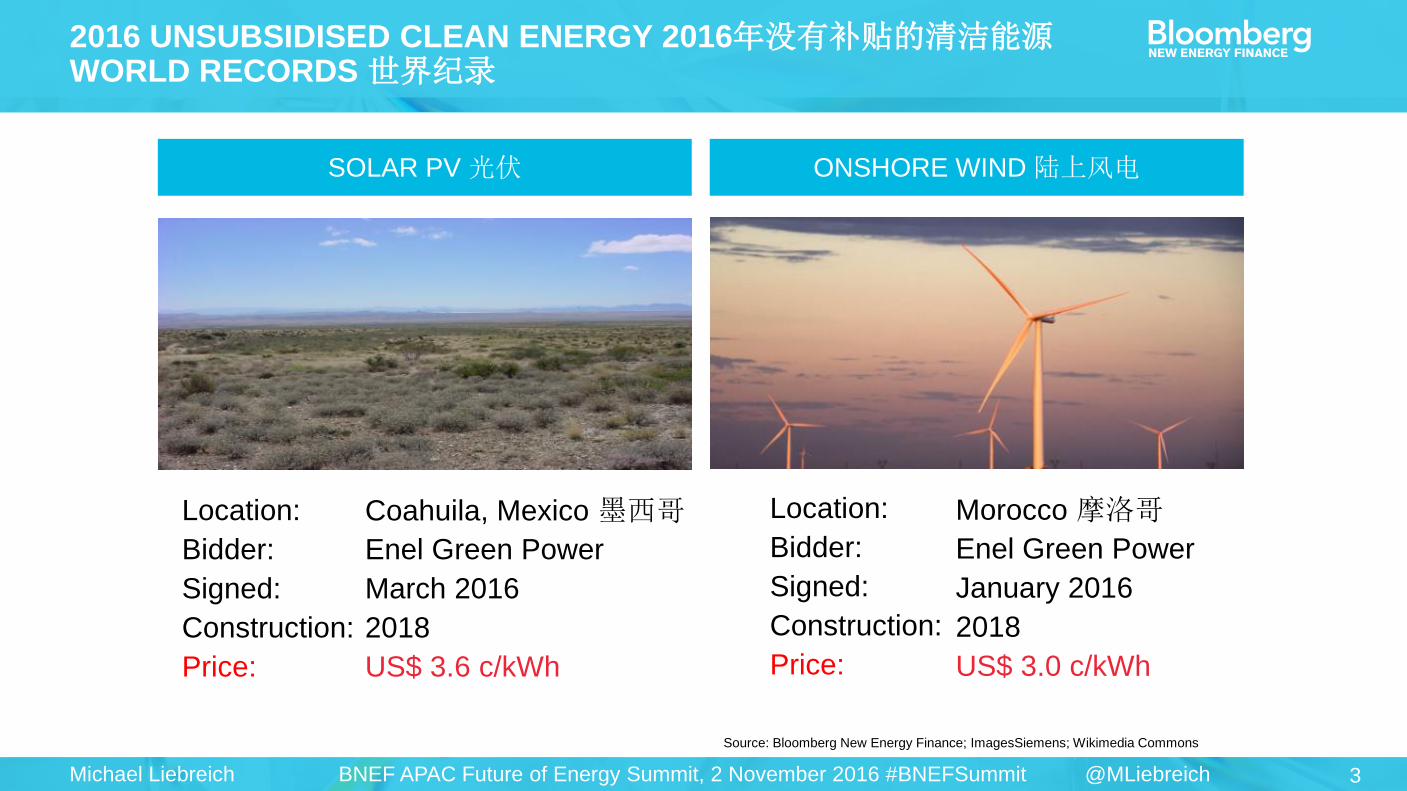
ONSHORE WIND 陆上风电
Location:
Bidder:
Signed:
Construction:
Price:
Morocco 摩洛哥
Enel Green Power
January 2016
2018
US$ 3.0 c/kWh
Location:
Bidder:
Signed:
Construction:
Price:
Coahuila, Mexico 墨西哥
Enel Green Power
March 2016
2018
US$ 3.6 c/kWh
2016 UNSUBSIDISED CLEAN ENERGY 2016年没有补贴的清洁能源 WORLD RECORDS 世界纪录
Source: Bloomberg New Energy Finance; ImagesSiemens; Wikimedia Commons
SOLAR PV 光伏
4 Michael Liebreich @MLiebreich BNEF APAC Future of Energy Summit, 2 November 2016 #BNEFSummit
ONSHORE WIND 陆上风电 SOLAR PV 光伏
Location:
Bidder:
Signed:
Construction:
Price:
Morocco 摩洛哥
Enel Green Power
January 2016
2018
US$ 3.0 c/kWh
Location:
Bidder:
Signed:
Construction:
Price:
Dubai 迪拜
Masdar Consortium
May 2016
2019
US$ 2.99 c/kWh
2016 UNSUBSIDISED CLEAN ENERGY 2016年没有补贴的清洁能源 WORLD RECORDS 世界纪录
Source: Bloomberg New Energy Finance; ImagesSiemens; Wikimedia Commons
5 Michael Liebreich @MLiebreich BNEF APAC Future of Energy Summit, 2 November 2016 #BNEFSummit
ONSHORE WIND 陆上风电 SOLAR PV 光伏
Location:
Bidder:
Signed:
Construction:
Price:
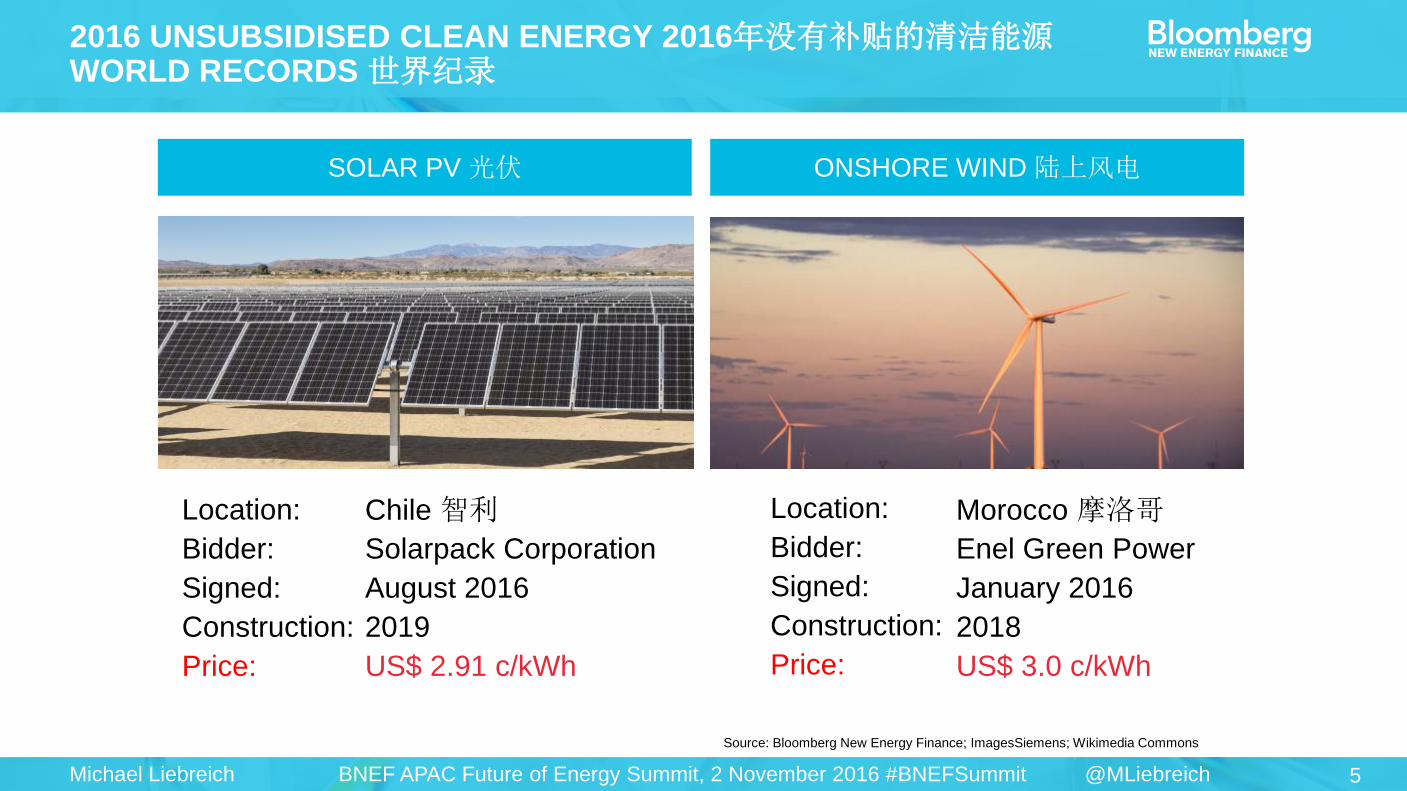
Morocco 摩洛哥
Enel Green Power
January 2016
2018
US$ 3.0 c/kWh
Location:
Bidder:
Signed:
Construction:
Price:
Chile 智利
Solarpack Corporation
August 2016
2019
US$ 2.91 c/kWh
2016 UNSUBSIDISED CLEAN ENERGY 2016年没有补贴的清洁能源 WORLD RECORDS 世界纪录
Source: Bloomberg New Energy Finance; ImagesSiemens; Wikimedia Commons
6 Michael Liebreich @MLiebreich BNEF APAC Future of Energy Summit, 2 November 2016 #BNEFSummit
y = 3,582.42x-0.30
R² = 0.91
16
32
64
128
256
512
1,024
100 1,000 10,000 100,000 1,000,000
1985
2025
2016
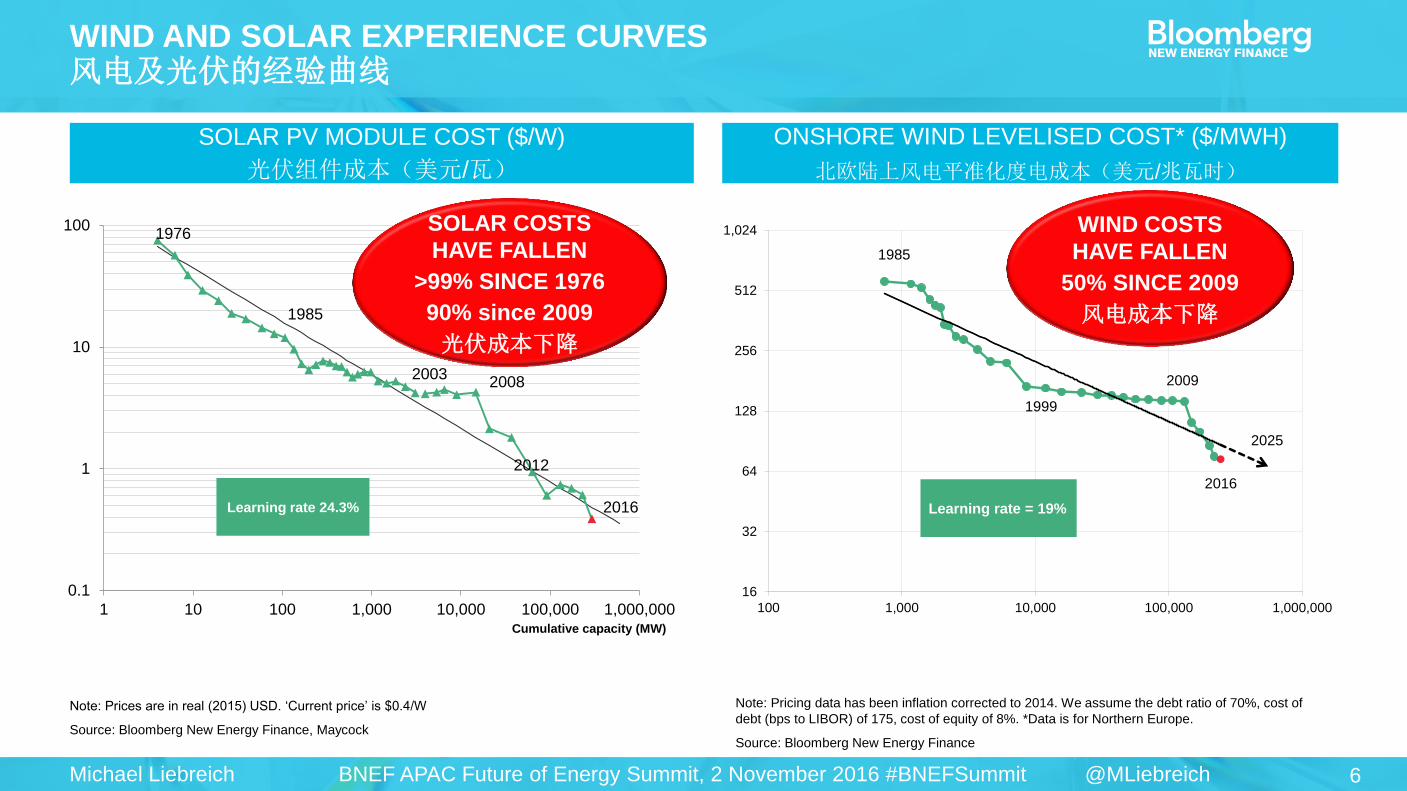
Learning rate = 19%
1999
2009
WIND COSTS
HAVE FALLEN
50% SINCE 2009
风电成本下降
WIND AND SOLAR EXPERIENCE CURVES 风电及光伏的经验曲线
Note: Prices are in real (2015) USD. ‘Current price’ is $0.4/W
Source: Bloomberg New Energy Finance, Maycock
Note: Pricing data has been inflation corrected to 2014. We assume the debt ratio of 70%, cost of
debt (bps to LIBOR) of 175, cost of equity of 8%. *Data is for Northern Europe.
Source: Bloomberg New Energy Finance
0.1
1
10
100
1 10 100 1,000 10,000 100,000 1,000,000
1976
1985
2003
2012
Cumulative capacity (MW)
2016
2008
Learning rate 24.3%
SOLAR COSTS
HAVE FALLEN
>99% SINCE 1976
90% since 2009
光伏成本下降
SOLAR PV MODULE COST ($/W)
光伏组件成本(美元/瓦)
ONSHORE WIND LEVELISED COST* ($/MWH)
北欧陆上风电平准化度电成本(美元/兆瓦时)
7 Michael Liebreich @MLiebreich BNEF APAC Future of Energy Summit, 2 November 2016 #BNEFSummit
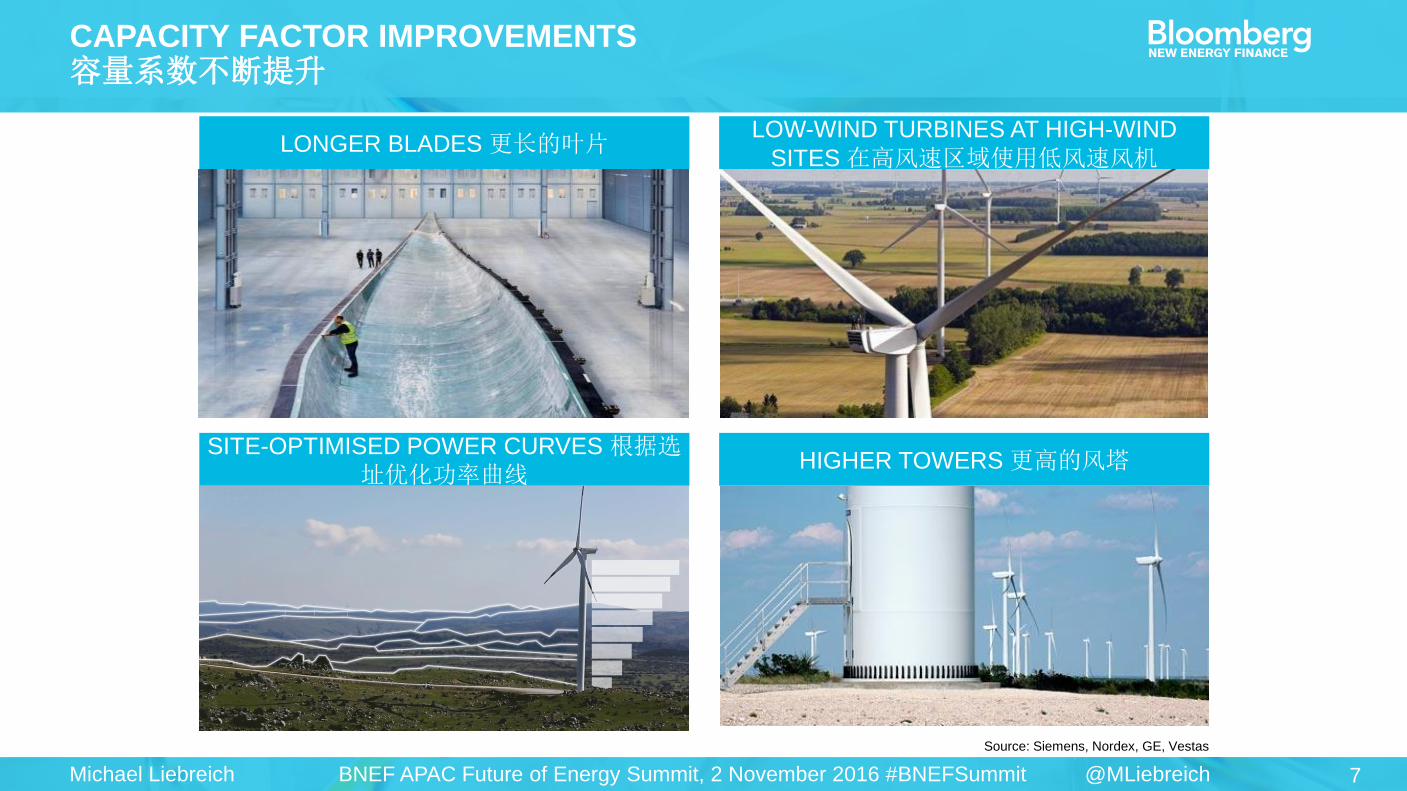
CAPACITY FACTOR IMPROVEMENTS 容量系数不断提升
LONGER BLADES 更长的叶片 LOW-WIND TURBINES AT HIGH-WIND
SITES 在高风速区域使用低风速风机
SITE-OPTIMISED POWER CURVES 根据选址优化功率曲线
HIGHER TOWERS 更高的风塔
Source: Siemens, Nordex, GE, Vestas
8 Michael Liebreich @MLiebreich BNEF APAC Future of Energy Summit, 2 November 2016 #BNEFSummit
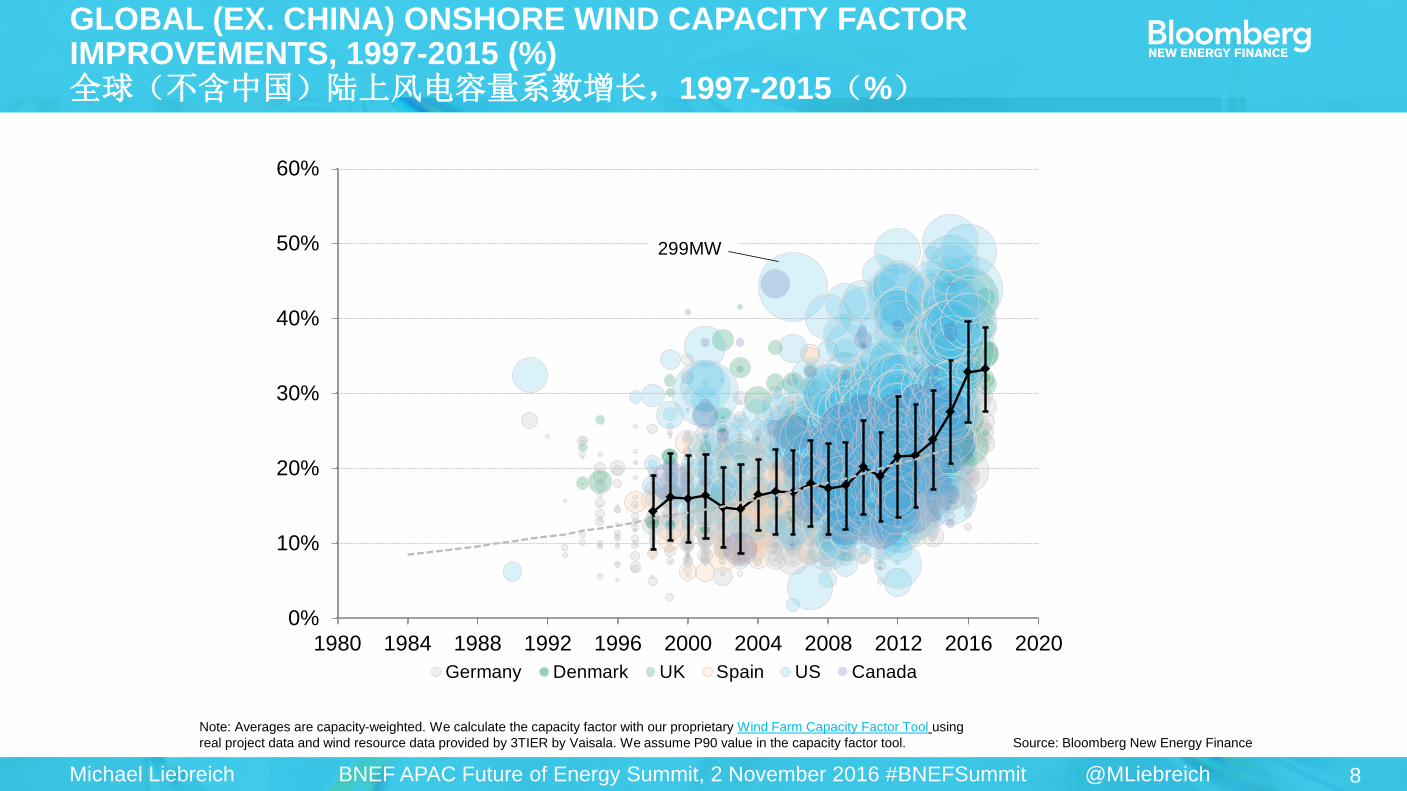
Note: Averages are capacity-weighted. We calculate the capacity factor with our proprietary Wind Farm Capacity Factor Tool using
real project data and wind resource data provided by 3TIER by Vaisala. We assume P90 value in the capacity factor tool. Source: Bloomberg New Energy Finance
GLOBAL (EX. CHINA) ONSHORE WIND CAPACITY FACTOR IMPROVEMENTS, 1997-2015 (%) 全球(不含中国)陆上风电容量系数增长,1997-2015(%)
0%
10%
20%
30%
40%
50%
60%
1980 1984 1988 1992 1996 2000 2004 2008 2012 2016 2020
Germany Denmark UK Spain US Canada
299MW
9 Michael Liebreich @MLiebreich BNEF APAC Future of Energy Summit, 2 November 2016 #BNEFSummit
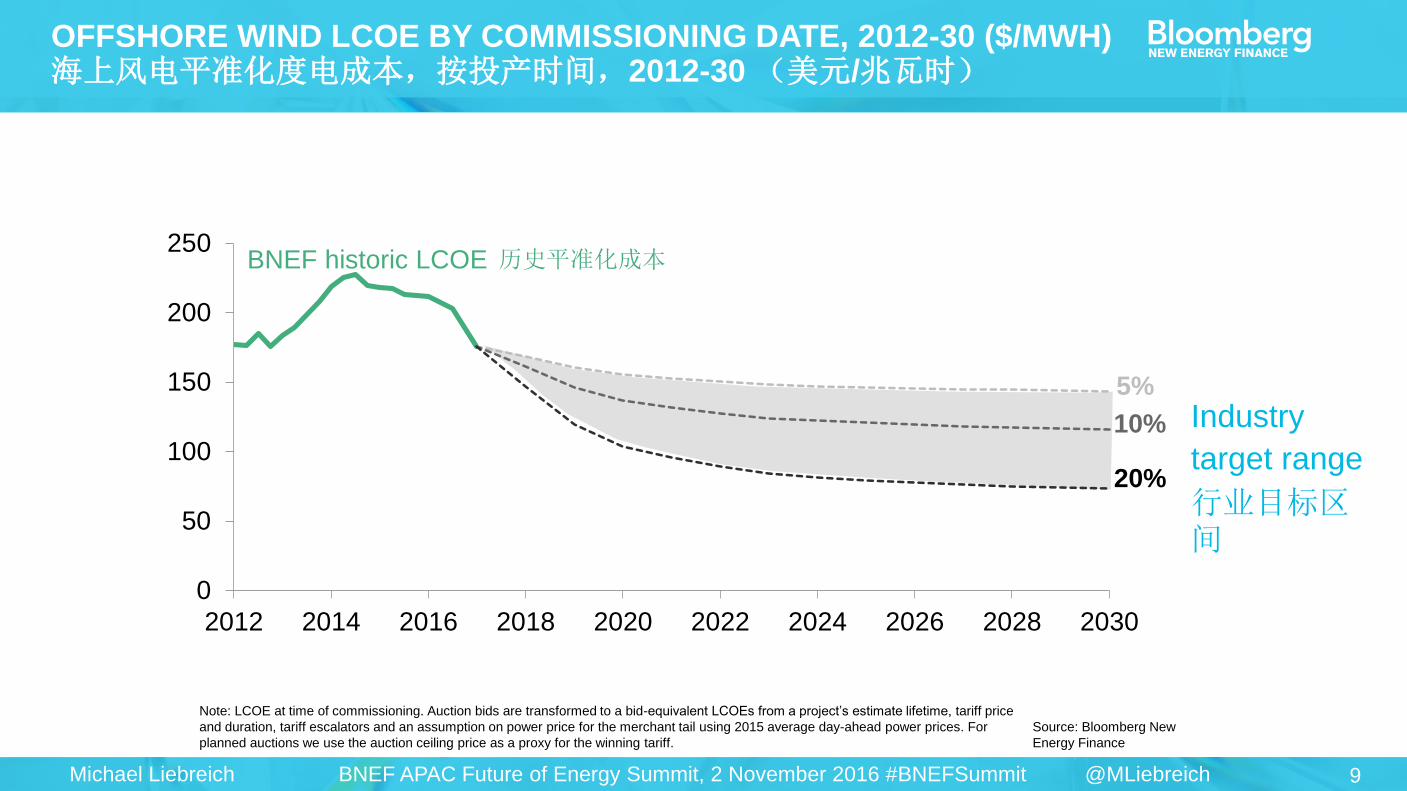
Note: LCOE at time of commissioning. Auction bids are transformed to a bid-equivalent LCOEs from a project’s estimate lifetime, tariff price
and duration, tariff escalators and an assumption on power price for the merchant tail using 2015 average day-ahead power prices. For
planned auctions we use the auction ceiling price as a proxy for the winning tariff.
Source: Bloomberg New
Energy Finance
OFFSHORE WIND LCOE BY COMMISSIONING DATE, 2012-30 ($/MWH) 海上风电平准化度电成本,按投产时间,2012-30 (美元/兆瓦时)
0
50
100
150
200
250
2012 2014 2016 2018 2020 2022 2024 2026 2028 2030
BNEF historic LCOE
5%
10%
20%
Industry
target range
行业目标区间
历史平准化成本
10 Michael Liebreich @MLiebreich BNEF APAC Future of Energy Summit, 2 November 2016 #BNEFSummit
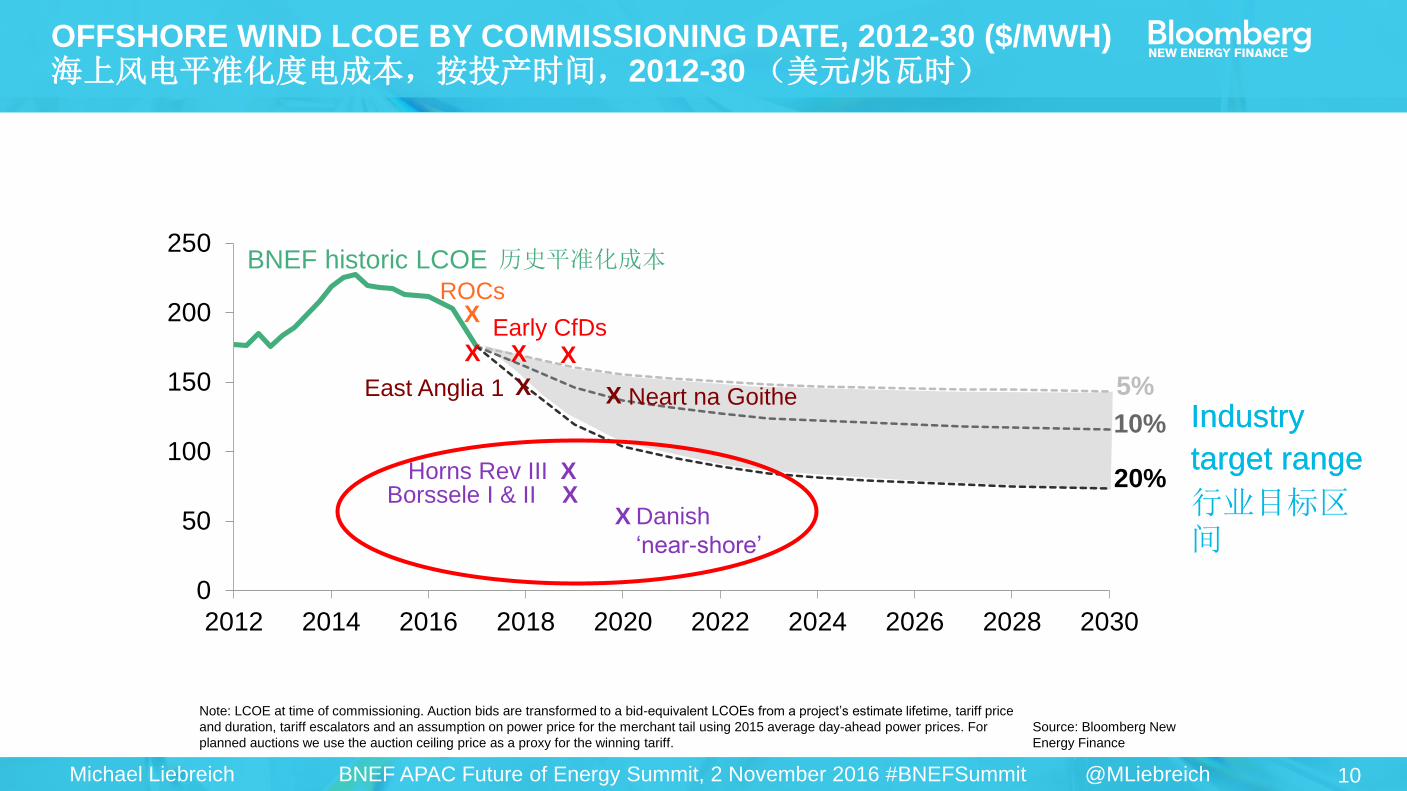
Note: LCOE at time of commissioning. Auction bids are transformed to a bid-equivalent LCOEs from a project’s estimate lifetime, tariff price
and duration, tariff escalators and an assumption on power price for the merchant tail using 2015 average day-ahead power prices. For
planned auctions we use the auction ceiling price as a proxy for the winning tariff.
Source: Bloomberg New
Energy Finance
0
50
100
150
200
250
2012 2014 2016 2018 2020 2022 2024 2026 2028 2030
BNEF historic LCOE
5%
10%
20%
X X X
X
X X Neart na Goithe East Anglia 1
Early CfDs
ROCs
X Horns Rev III
X Danish
‘near-shore’
X Borssele I & II
Industry
target range
OFFSHORE WIND LCOE BY COMMISSIONING DATE, 2012-30 ($/MWH) 海上风电平准化度电成本,按投产时间,2012-30 (美元/兆瓦时)
历史平准化成本
Industry
target range
行业目标区间
11 Michael Liebreich @MLiebreich BNEF APAC Future of Energy Summit, 2 November 2016 #BNEFSummit
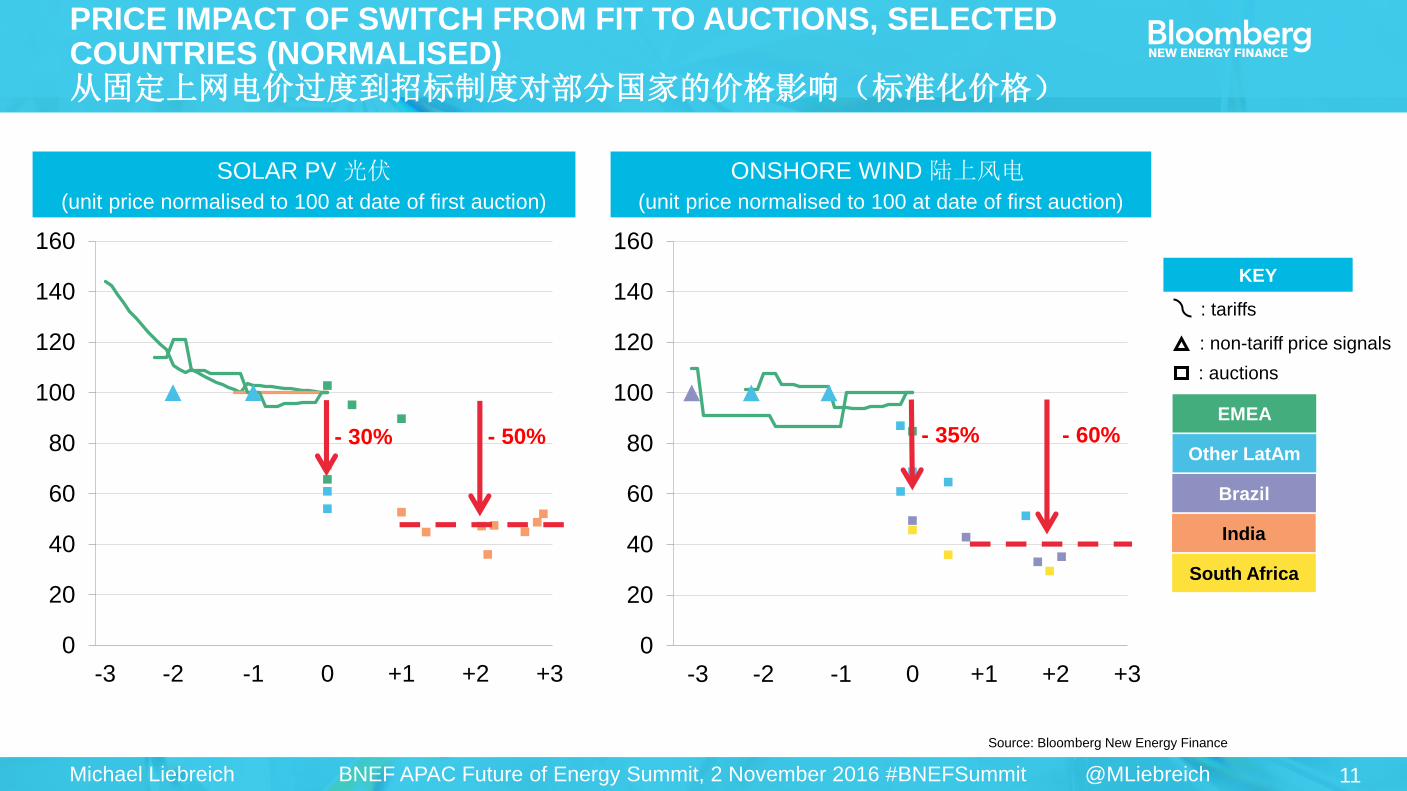
Source: Bloomberg New Energy Finance
PRICE IMPACT OF SWITCH FROM FIT TO AUCTIONS, SELECTED COUNTRIES (NORMALISED) 从固定上网电价过度到招标制度对部分国家的价格影响(标准化价格)
SOLAR PV 光伏
(unit price normalised to 100 at date of first auction)
ONSHORE WIND 陆上风电
(unit price normalised to 100 at date of first auction)
: non-tariff price signals
: tariffs
: auctions
KEY
EMEA
Other LatAm
Brazil
India
South Africa
0
20
40
60
80
100
120
140
160
+3+2+10-1-2-3
- 30% - 50%
0
20
40
60
80
100
120
140
160
+3+2+10-1-2-3
- 35% - 60%
12 Michael Liebreich @MLiebreich BNEF APAC Future of Energy Summit, 2 November 2016 #BNEFSummit
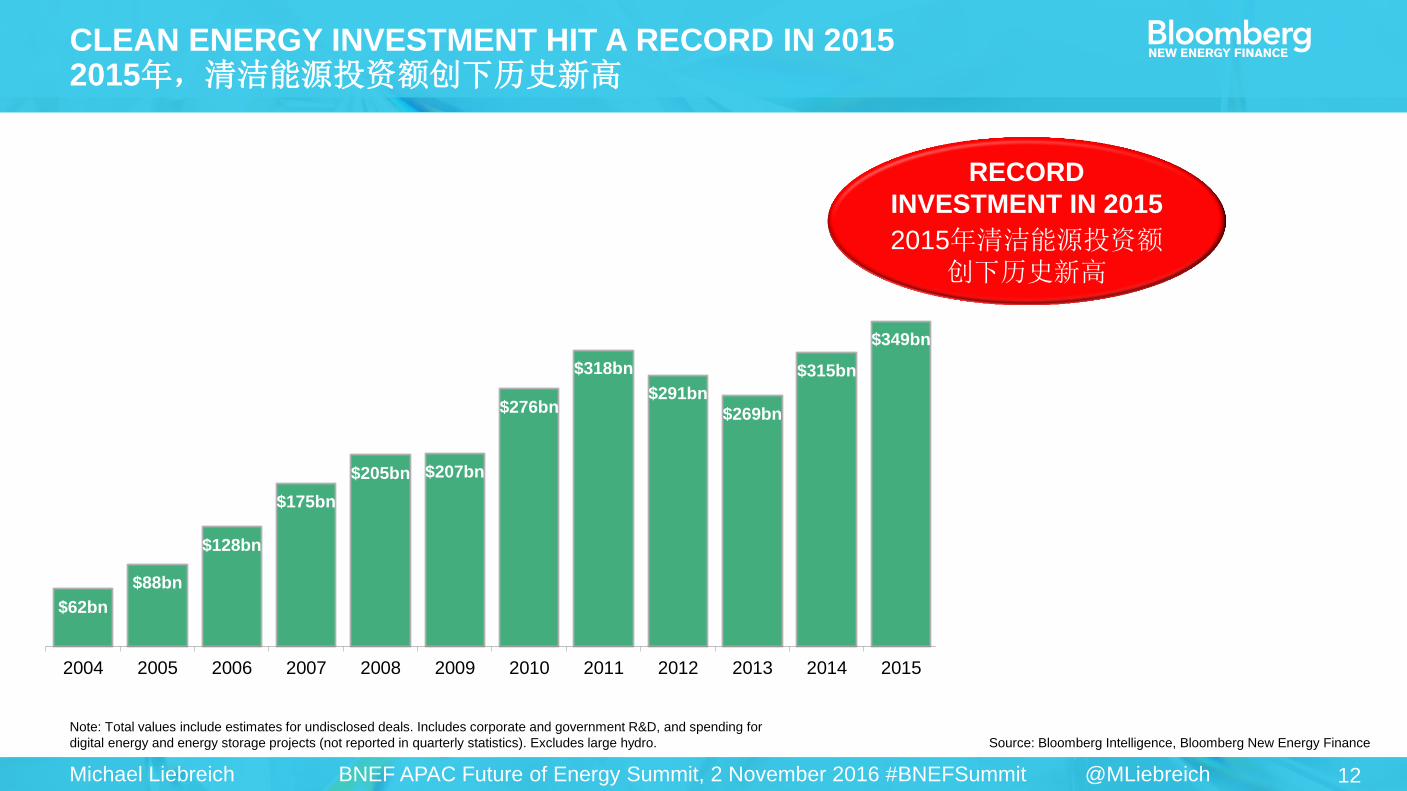
$62bn
$88bn
$128bn
$175bn
$205bn $207bn
$276bn
$318bn
$291bn
$269bn
$315bn
$349bn
0.00
20.00
40.00
60.00
80.00
100.00
120.00
140.00
160.00
0
100
200
300
400
500
2004 2005 2006 2007 2008 2009 2010 2011 2012 2013 2014 2015 2016 2017 2018 2019 2020
CLEAN ENERGY INVESTMENT HIT A RECORD IN 2015 2015年,清洁能源投资额创下历史新高
RECORD
INVESTMENT IN 2015
2015年清洁能源投资额创下历史新高
Note: Total values include estimates for undisclosed deals. Includes corporate and government R&D, and spending for
digital energy and energy storage projects (not reported in quarterly statistics). Excludes large hydro. Source: Bloomberg Intelligence, Bloomberg New Energy Finance
13 Michael Liebreich @MLiebreich BNEF APAC Future of Energy Summit, 2 November 2016 #BNEFSummit
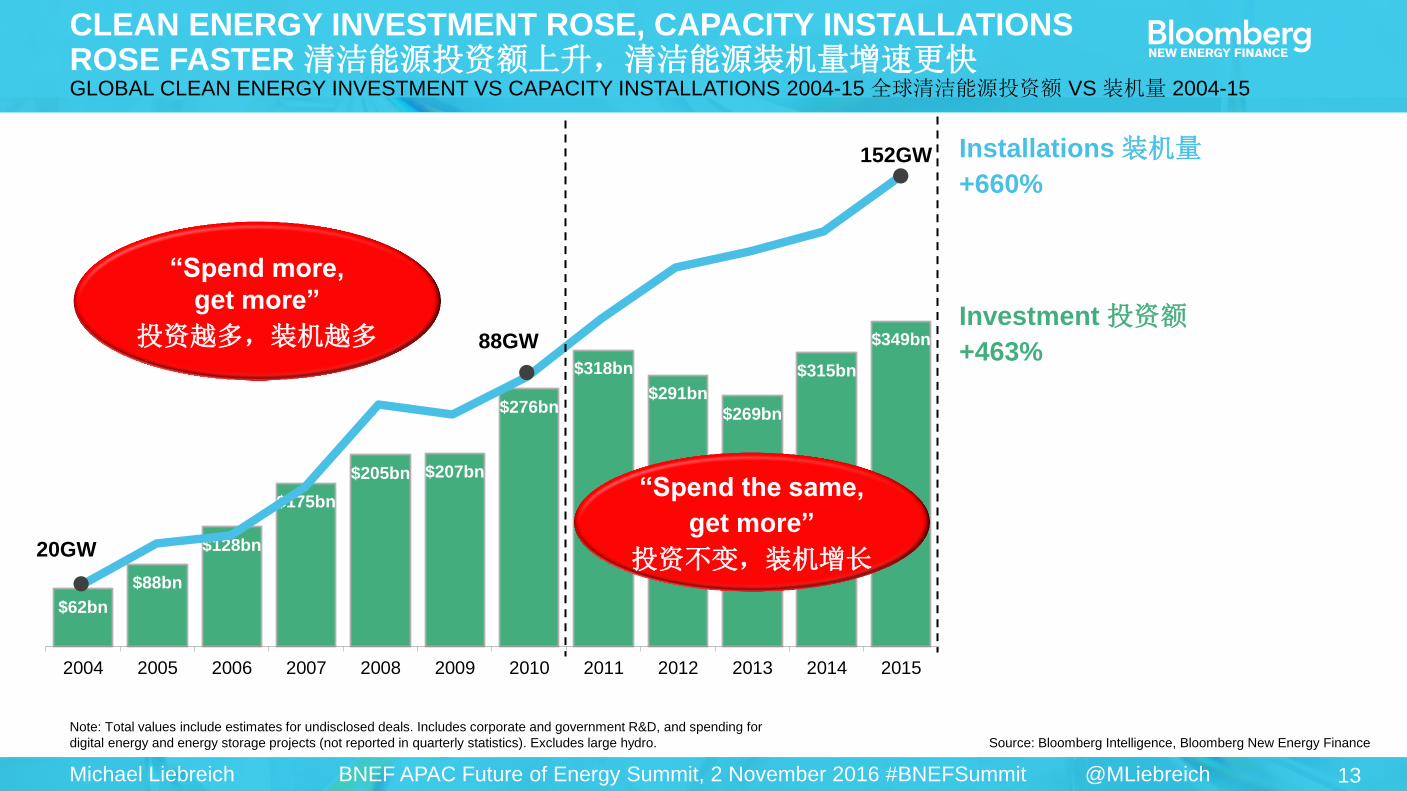
$62bn
$88bn
$128bn
$175bn
$205bn $207bn
$276bn
$318bn
$291bn
$269bn
$315bn
$349bn
0.00
20.00
40.00
60.00
80.00
100.00
120.00
140.00
160.00
0
100
200
300
400
500
2004 2005 2006 2007 2008 2009 2010 2011 2012 2013 2014 2015 2016 2017 2018 2019 2020
Note: Total values include estimates for undisclosed deals. Includes corporate and government R&D, and spending for
digital energy and energy storage projects (not reported in quarterly statistics). Excludes large hydro. Source: Bloomberg Intelligence, Bloomberg New Energy Finance
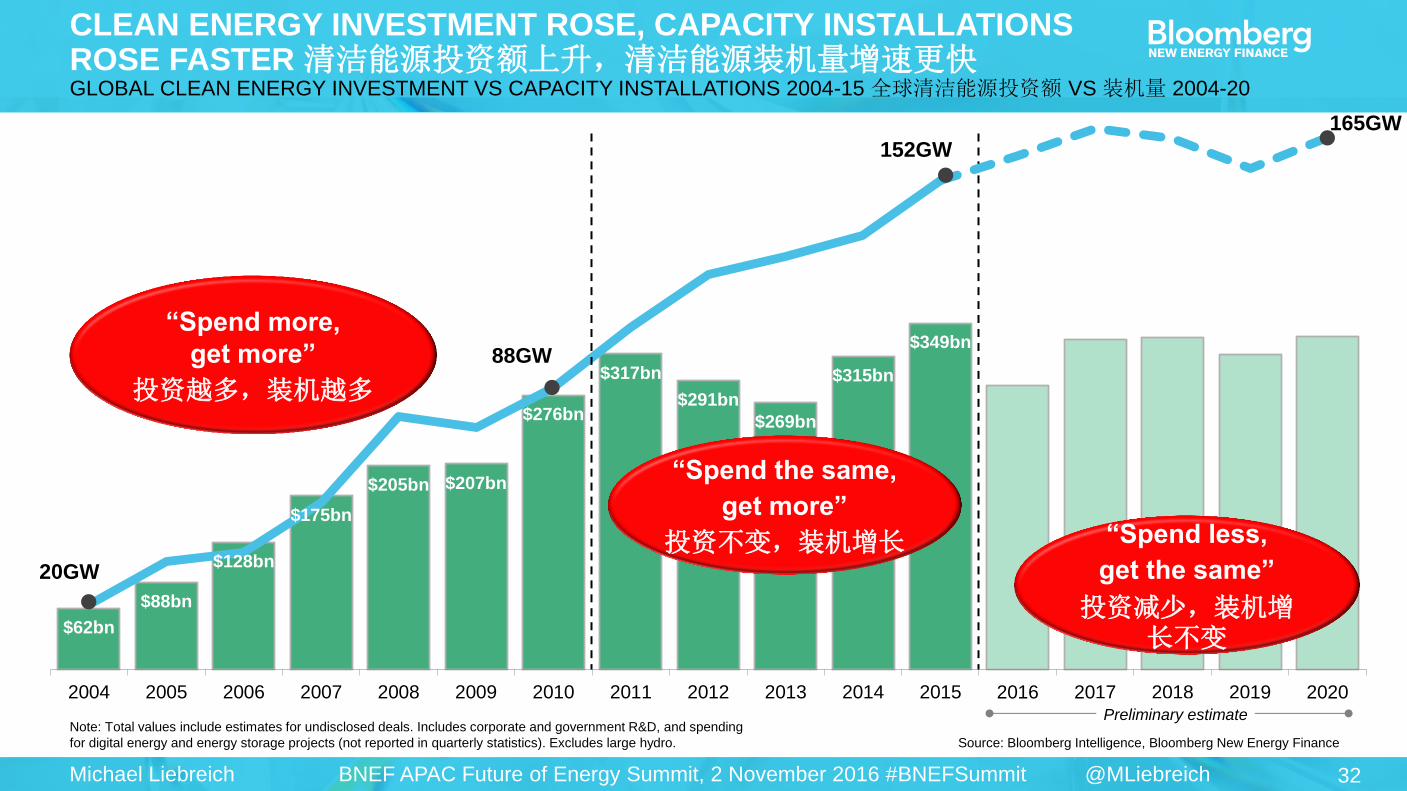
CLEAN ENERGY INVESTMENT ROSE, CAPACITY INSTALLATIONS ROSE FASTER 清洁能源投资额上升,清洁能源装机量增速更快 GLOBAL CLEAN ENERGY INVESTMENT VS CAPACITY INSTALLATIONS 2004-15 全球清洁能源投资额 VS 装机量 2004-15
0.00
20.00
40.00
60.00
80.00
100.00
120.00
140.00
160.00
0
100
200
300
400
500
2004 2005 2006 2007 2008 2009 2010 2011 2012 2013 2014 2015 2016 2017 2018 2019 2020
88GW
20GW
“Spend the same,
get more”
投资不变,装机增长
152GW
Investment 投资额
+463%
Installations 装机量
+660%
“Spend more,
get more”
投资越多,装机越多
14 Michael Liebreich @MLiebreich BNEF APAC Future of Energy Summit, 2 November 2016 #BNEFSummit
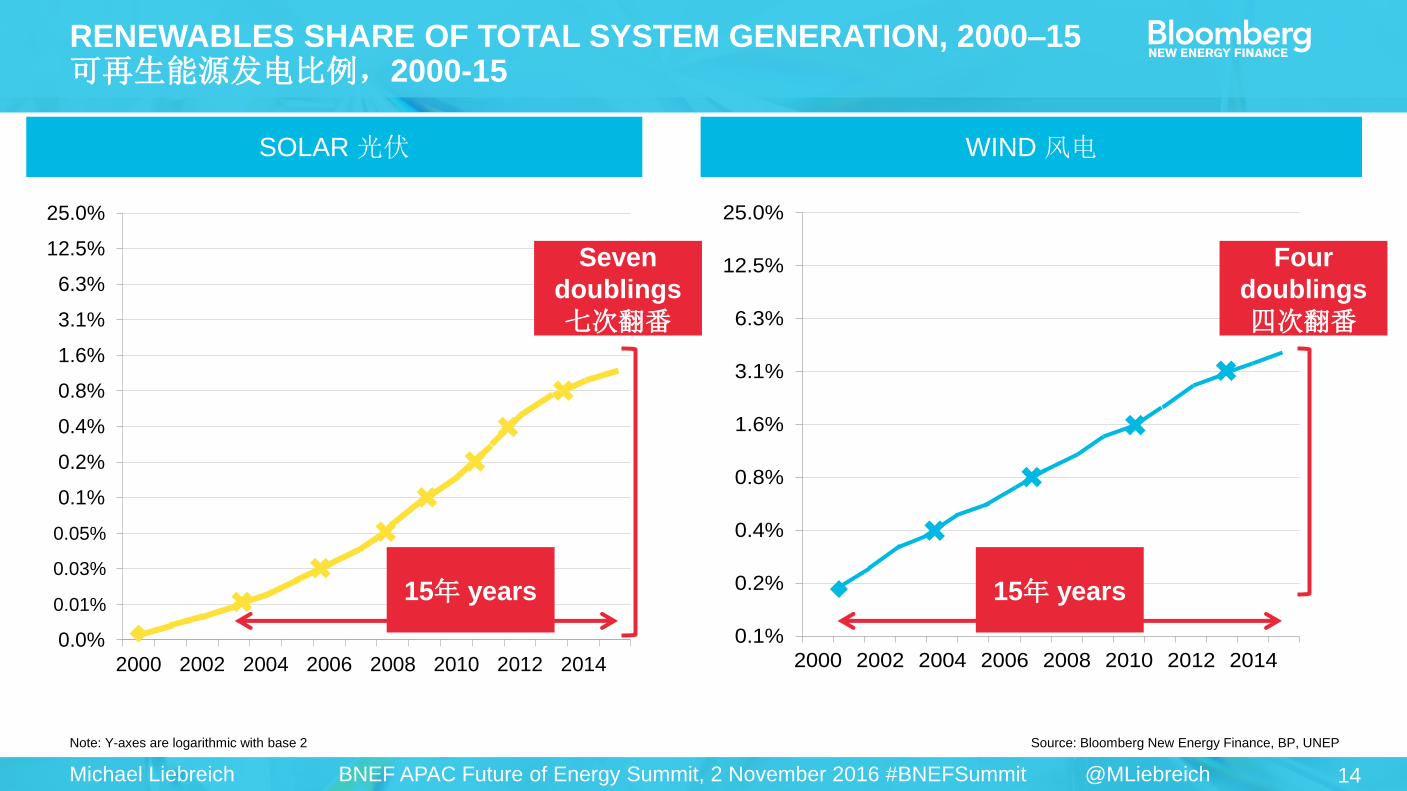
0.1%
0.2%
0.4%
0.8%
1.6%
3.1%
6.3%
12.5%
25.0%
2000 2002 2004 2006 2008 2010 2012 2014
RENEWABLES SHARE OF TOTAL SYSTEM GENERATION, 2000–15 可再生能源发电比例,2000-15
Note: Y-axes are logarithmic with base 2 Source: Bloomberg New Energy Finance, BP, UNEP
WIND 风电
Four
doublings
四次翻番
SOLAR 光伏
0.0%
0.0%
0.0%
0.0%
0.1%
0.2%
0.4%
0.8%
1.6%
3.1%
6.3%
12.5%
25.0%
2000 2002 2004 2006 2008 2010 2012 2014
Seven
doublings
七次翻番
0.05%
0.03%
0.01% 15年 years 15年 years
15 Michael Liebreich @MLiebreich BNEF APAC Future of Energy Summit, 2 November 2016 #BNEFSummit
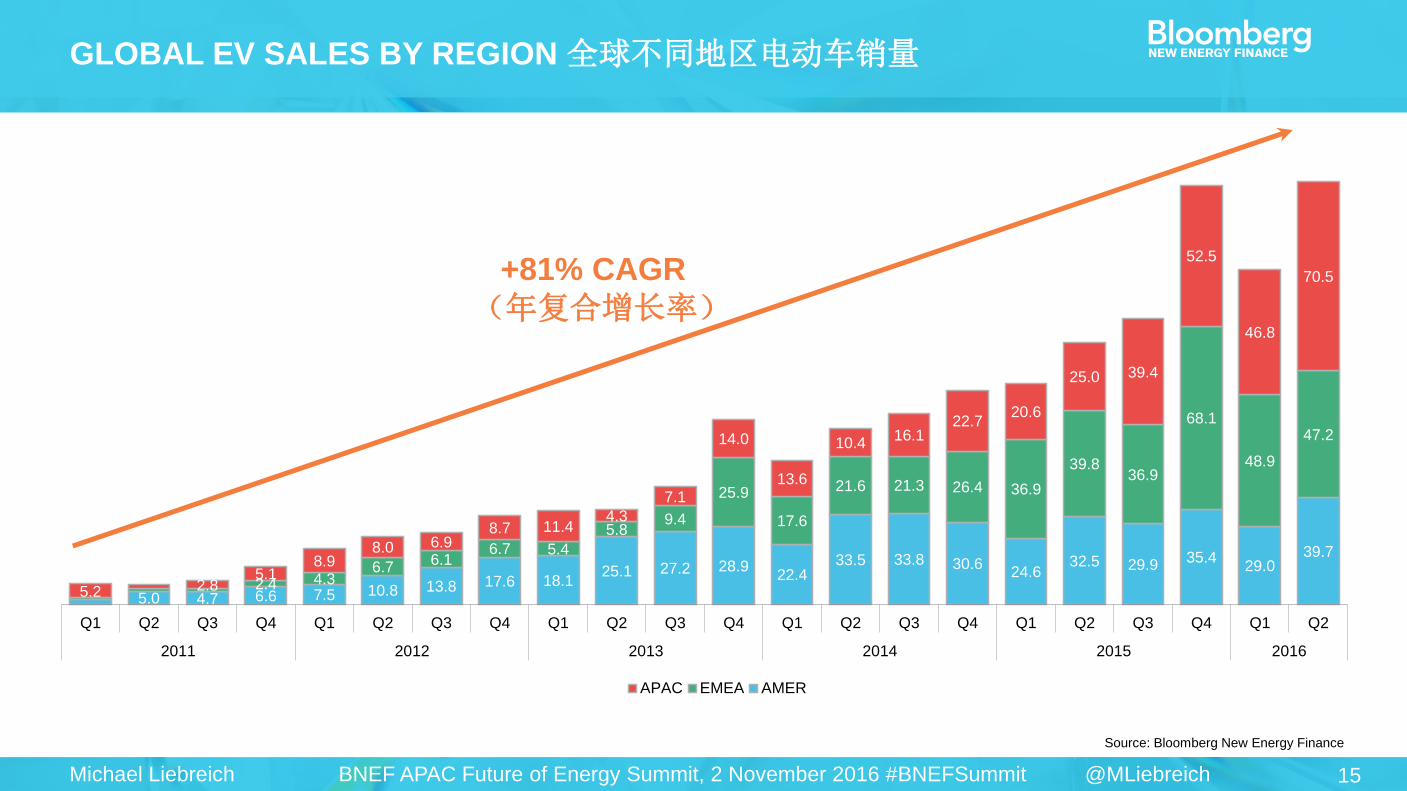
Source: Bloomberg New Energy Finance
GLOBAL EV SALES BY REGION 全球不同地区电动车销量
5.0 4.7 6.6 7.5 10.8 13.8 17.6 18.125.1 27.2 28.9
22.433.5 33.8 30.6
24.632.5 29.9
35.429.0
39.7
2.4 4.36.7
6.16.7 5.4
5.89.4
25.9
17.6
21.6 21.3 26.4 36.9
39.836.9
68.1
48.9
47.2
5.2 2.85.1
8.98.0 6.9
8.7 11.44.3
7.1
14.0
13.6
10.416.1
22.720.6
25.0 39.4
52.5
46.8
70.5
Q1 Q2 Q3 Q4 Q1 Q2 Q3 Q4 Q1 Q2 Q3 Q4 Q1 Q2 Q3 Q4 Q1 Q2 Q3 Q4 Q1 Q2
2011 2012 2013 2014 2015 2016
APAC EMEA AMER
+81% CAGR
(年复合增长率)
16 Michael Liebreich @MLiebreich BNEF APAC Future of Energy Summit, 2 November 2016 #BNEFSummit
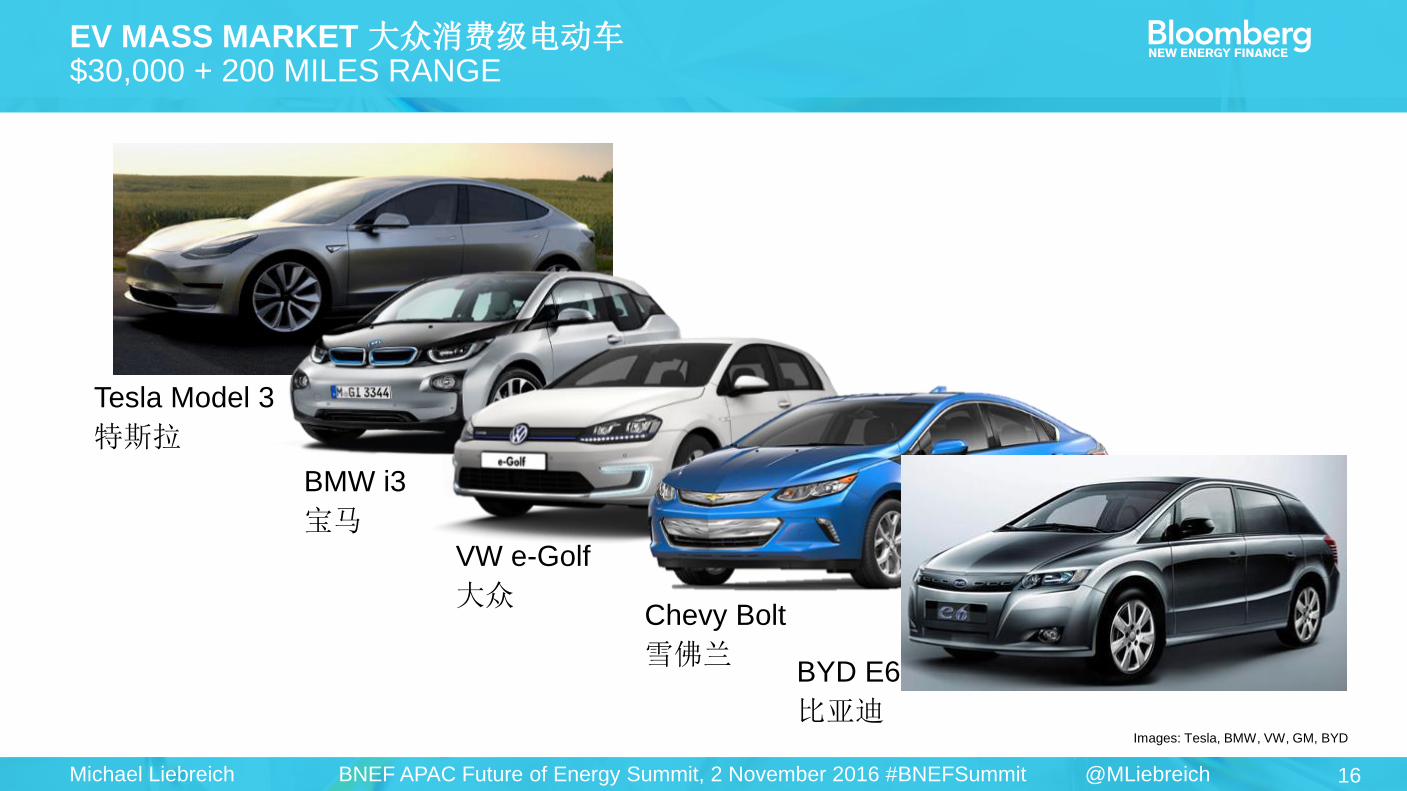
Tesla Model 3
特斯拉
BMW i3
宝马
VW e-Golf
大众 Chevy Bolt
雪佛兰
Images: Tesla, BMW, VW, GM, BYD
EV MASS MARKET 大众消费级电动车 $30,000 + 200 MILES RANGE
BYD E6
比亚迪
17 Michael Liebreich @MLiebreich BNEF APAC Future of Energy Summit, 2 November 2016 #BNEFSummit
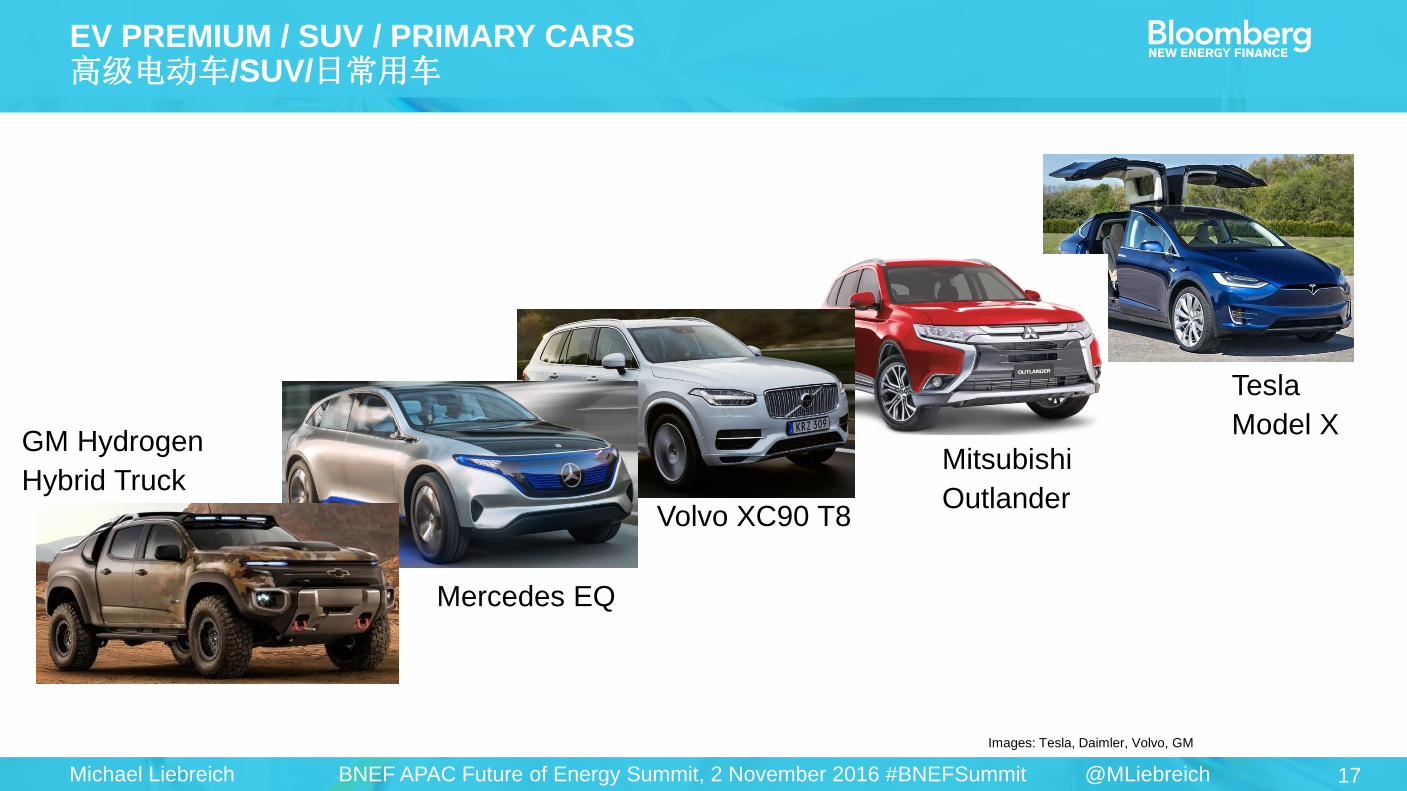
Images: Tesla, Daimler, Volvo, GM
EV PREMIUM / SUV / PRIMARY CARS 高级电动车/SUV/日常用车
Tesla
Model X
Mitsubishi
Outlander Volvo XC90 T8
Mercedes EQ
GM Hydrogen
Hybrid Truck
18 Michael Liebreich @MLiebreich BNEF APAC Future of Energy Summit, 2 November 2016 #BNEFSummit
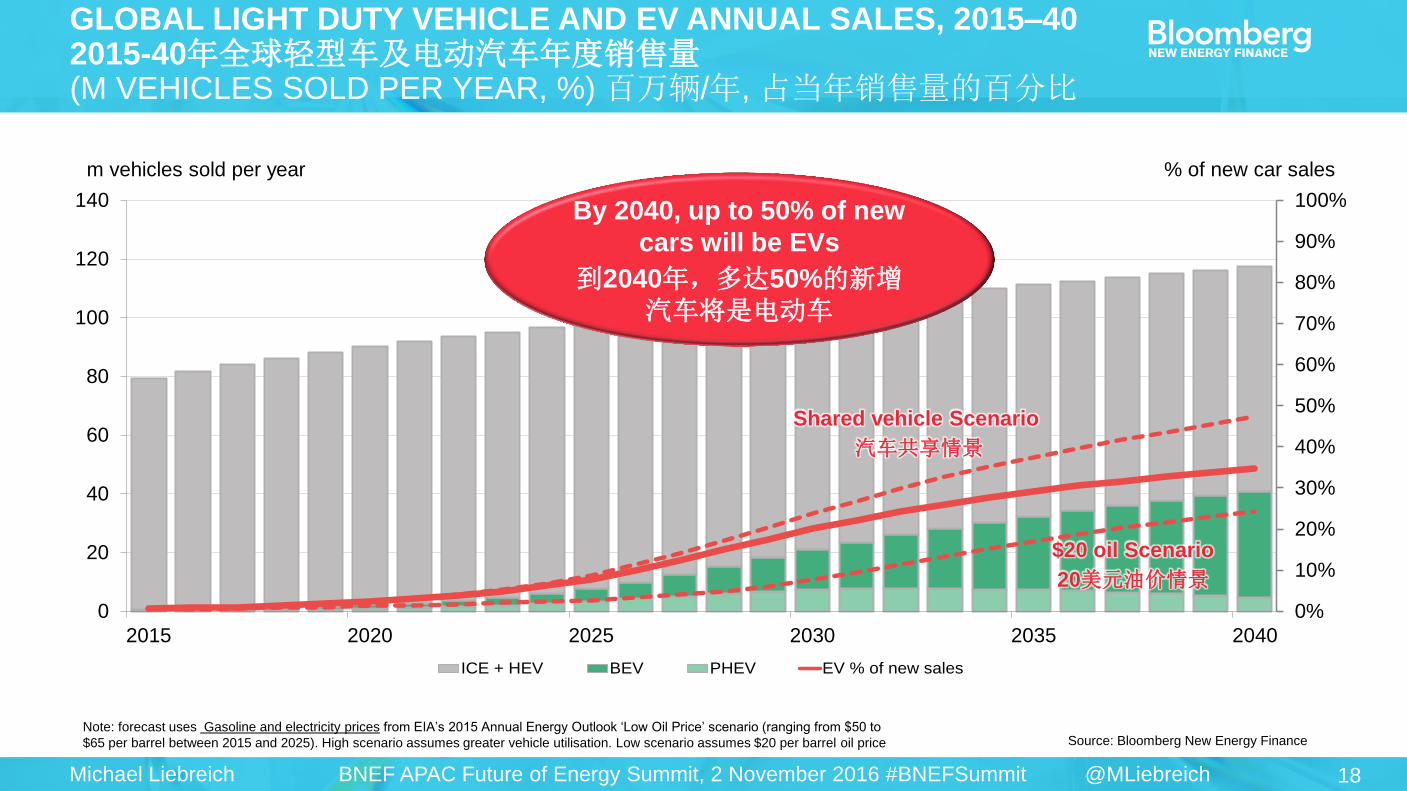
Note: forecast uses Gasoline and electricity prices from EIA’s 2015 Annual Energy Outlook ‘Low Oil Price’ scenario (ranging from $50 to
$65 per barrel between 2015 and 2025). High scenario assumes greater vehicle utilisation. Low scenario assumes $20 per barrel oil price Source: Bloomberg New Energy Finance
GLOBAL LIGHT DUTY VEHICLE AND EV ANNUAL SALES, 2015–40 2015-40年全球轻型车及电动汽车年度销售量 (M VEHICLES SOLD PER YEAR, %) 百万辆/年, 占当年销售量的百分比
0%10%20%30%40%50%60%70%80%90%100%
020406080100120140
2015 2020 2025 2030 2035 2040
ICE + HEV BEV PHEV EV % of new sales
m vehicles sold per year % of new car sales
0%
10%
20%
30%
40%
50%
60%
70%
80%
90%
100%
0
20
40
60
80
100
120
140
2015 2020 2025 2030 2035 2040
m vehicles sold per year % of new car sales
By 2040, up to 50% of new
cars will be EVs
到2040年,多达50%的新增汽车将是电动车
Shared vehicle Scenario
汽车共享情景
$20 oil Scenario
20美元油价情景
19 Michael Liebreich @MLiebreich BNEF APAC Future of Energy Summit, 2 November 2016 #BNEFSummit
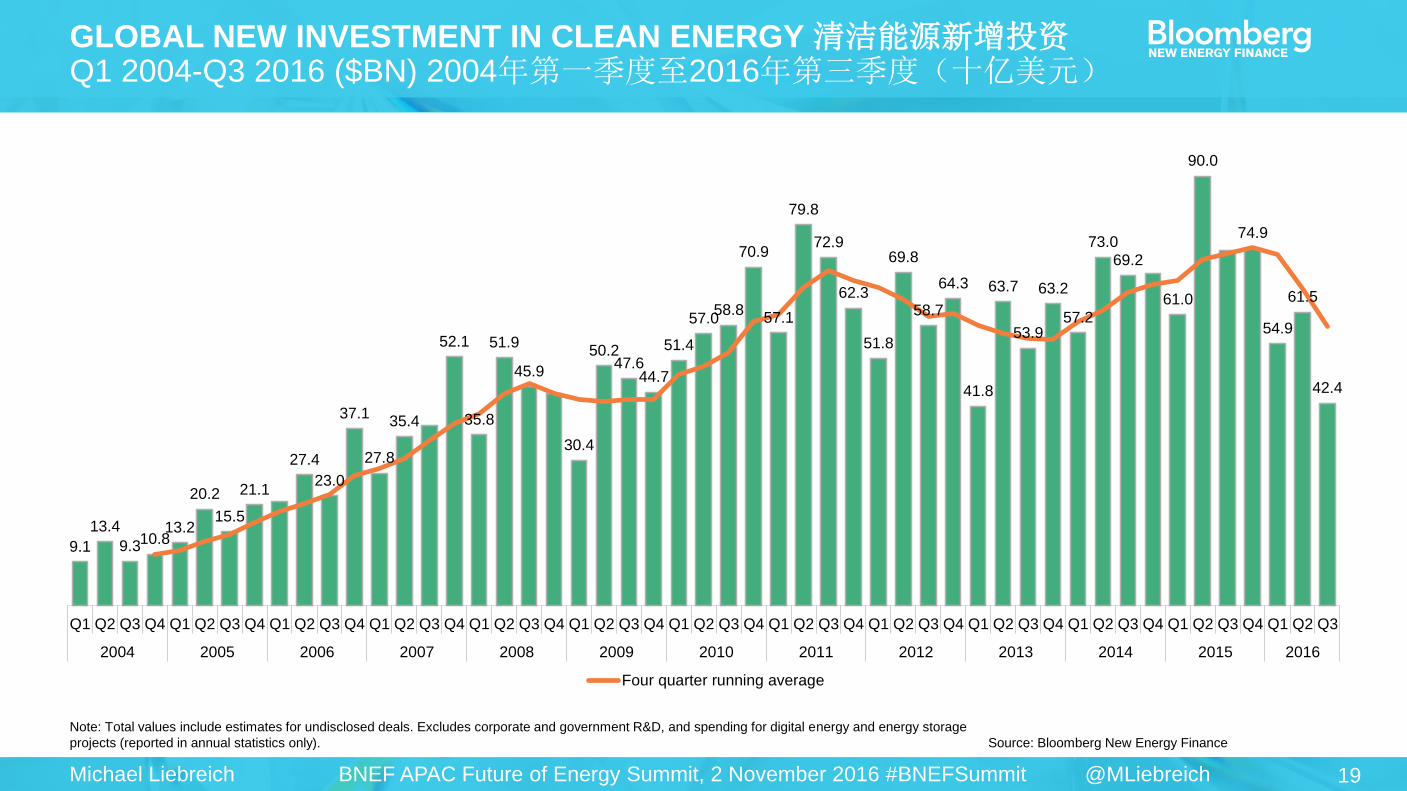
Note: Total values include estimates for undisclosed deals. Excludes corporate and government R&D, and spending for digital energy and energy storage
projects (reported in annual statistics only). Source: Bloomberg New Energy Finance
GLOBAL NEW INVESTMENT IN CLEAN ENERGY 清洁能源新增投资 Q1 2004-Q3 2016 ($BN) 2004年第一季度至2016年第三季度(十亿美元)
9.1
13.4
9.310.813.2
20.2
15.5
21.1
27.4
23.0
37.1
27.8
35.4
52.1
35.8
51.9
45.9
30.4
50.247.6
44.7
51.4
57.058.8
70.9
57.1
79.8
72.9
62.3
51.8
69.8
58.7
64.3
41.8
63.7
53.9
63.2
57.2
73.0
69.2
61.0
90.0
74.9
54.9
61.5
42.4
Q1 Q2 Q3 Q4 Q1 Q2 Q3 Q4 Q1 Q2 Q3 Q4 Q1 Q2 Q3 Q4 Q1 Q2 Q3 Q4 Q1 Q2 Q3 Q4 Q1 Q2 Q3 Q4 Q1 Q2 Q3 Q4 Q1 Q2 Q3 Q4 Q1 Q2 Q3 Q4 Q1 Q2 Q3 Q4 Q1 Q2 Q3 Q4 Q1 Q2 Q3
2004 2005 2006 2007 2008 2009 2010 2011 2012 2013 2014 2015 2016
Four quarter running average
20 Michael Liebreich @MLiebreich BNEF APAC Future of Energy Summit, 2 November 2016 #BNEFSummit
Note: Total values include estimates for undisclosed deals. Excludes corporate and government R&D, and spending for digital energy and energy storage
projects (reported in annual statistics only) Source: Bloomberg New Energy Finance
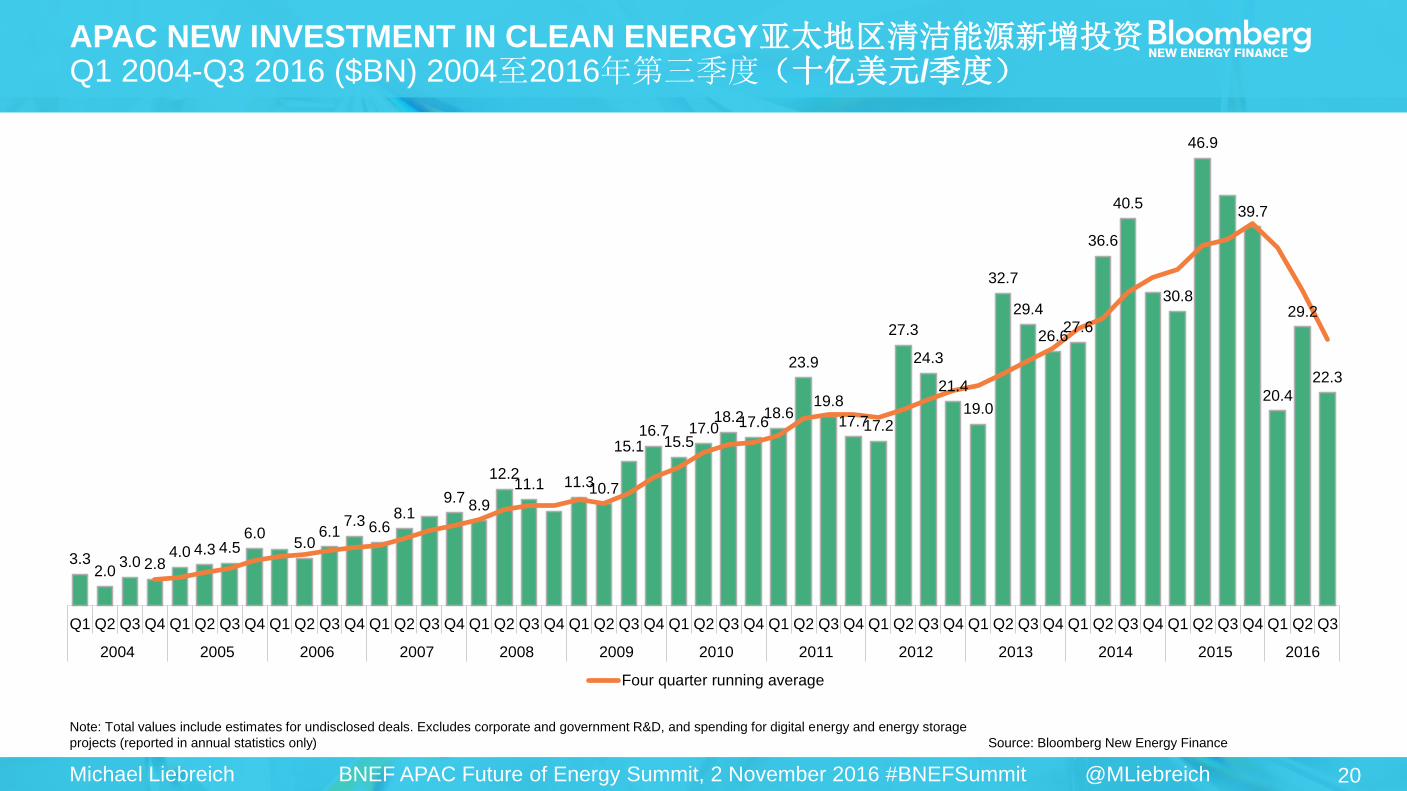
APAC NEW INVESTMENT IN CLEAN ENERGY亚太地区清洁能源新增投资 Q1 2004-Q3 2016 ($BN) 2004至2016年第三季度(十亿美元/季度)
3.3 2.0 3.0 2.8 4.0 4.3 4.5 6.0 5.9 5.0 6.1 7.3 6.6 8.1 9.3 9.7 8.912.211.19.911.310.7
15.116.715.517.018.217.618.6
23.9
19.817.717.2
27.324.3
21.419.0
32.729.4
26.627.6
36.6
40.5
32.830.8
46.9
42.939.7
20.4
29.2
22.3
Q1 Q2 Q3 Q4 Q1 Q2 Q3 Q4 Q1 Q2 Q3 Q4 Q1 Q2 Q3 Q4 Q1 Q2 Q3 Q4 Q1 Q2 Q3 Q4 Q1 Q2 Q3 Q4 Q1 Q2 Q3 Q4 Q1 Q2 Q3 Q4 Q1 Q2 Q3 Q4 Q1 Q2 Q3 Q4 Q1 Q2 Q3 Q4 Q1 Q2 Q3
2004 2005 2006 2007 2008 2009 2010 2011 2012 2013 2014 2015 2016
Four quarter running average
3.32.0
3.0 2.84.0 4.3 4.5
6.05.0
6.17.3 6.6
8.19.7
8.9
12.211.1 11.310.7
15.116.7
15.517.0
18.217.618.6
23.9
19.8
17.717.2
27.3
24.3
21.4
19.0
32.7
29.4
26.627.6
36.6
40.5
30.8
46.9
39.7
20.4
29.2
22.3
Q1 Q2 Q3 Q4 Q1 Q2 Q3 Q4 Q1 Q2 Q3 Q4 Q1 Q2 Q3 Q4 Q1 Q2 Q3 Q4 Q1 Q2 Q3 Q4 Q1 Q2 Q3 Q4 Q1 Q2 Q3 Q4 Q1 Q2 Q3 Q4 Q1 Q2 Q3 Q4 Q1 Q2 Q3 Q4 Q1 Q2 Q3 Q4 Q1 Q2 Q3
2004 2005 2006 2007 2008 2009 2010 2011 2012 2013 2014 2015 2016
Four quarter running average
21 Michael Liebreich @MLiebreich BNEF APAC Future of Energy Summit, 2 November 2016 #BNEFSummit
Note: Total values include estimates for undisclosed deals. Excludes corporate and government R&D, and spending for digital energy and energy storage
projects (reported in annual statistics only) Source: Bloomberg New Energy Finance
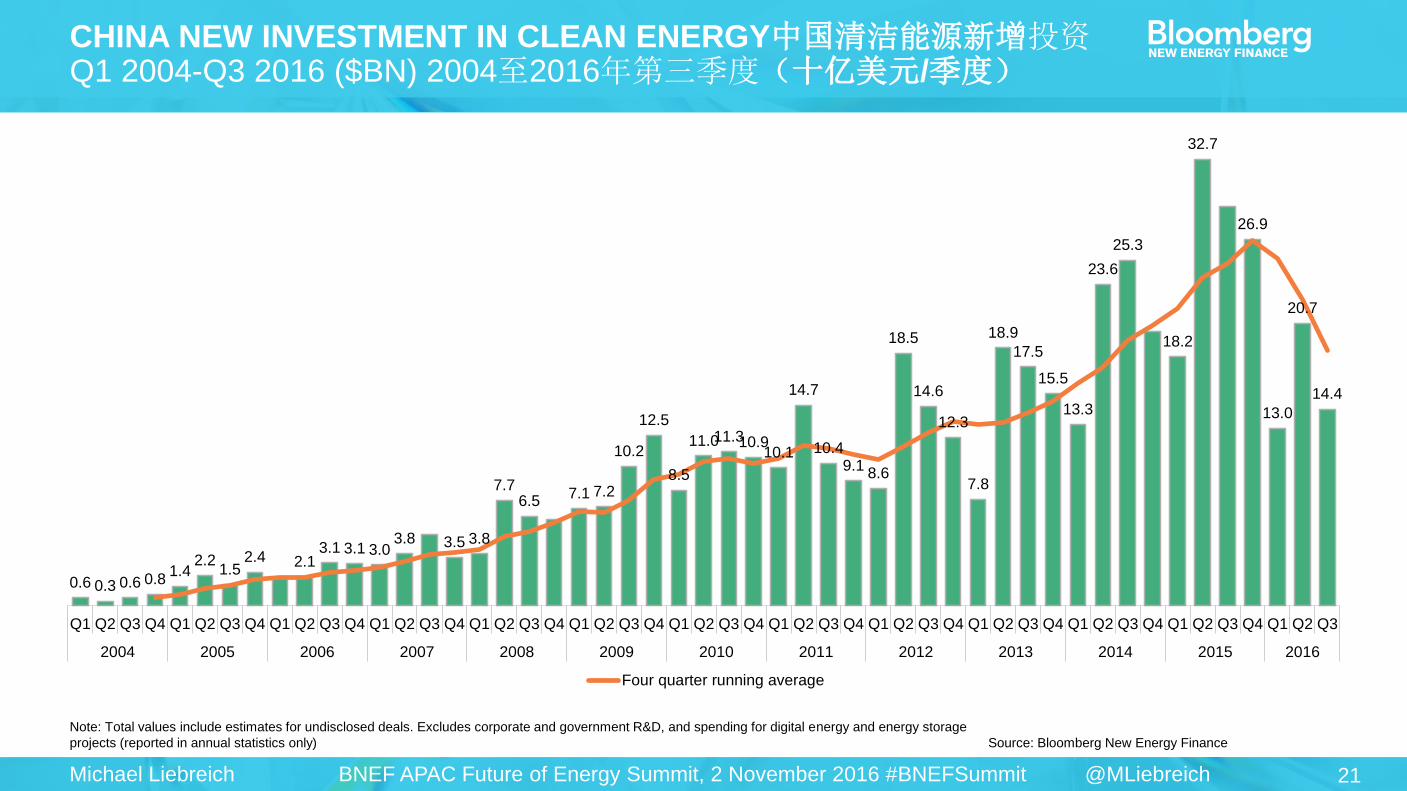
CHINA NEW INVESTMENT IN CLEAN ENERGY中国清洁能源新增投资 Q1 2004-Q3 2016 ($BN) 2004至2016年第三季度(十亿美元/季度)
0.6 0.3 0.6 0.8 1.4 2.2 1.5 2.4 2.1 2.1 3.1 3.1 3.0 3.8 5.23.5 3.8
7.7 6.5 6.3 7.1 7.210.2
12.5
8.511.0 10.9
14.7
10.48.6
18.5
14.612.3
7.8
18.915.5
13.3
25.3
18.2
32.729.3
26.9
13.0
20.7
14.4
Q1 Q2 Q3 Q4 Q1 Q2 Q3 Q4 Q1 Q2 Q3 Q4 Q1 Q2 Q3 Q4 Q1 Q2 Q3 Q4 Q1 Q2 Q3 Q4 Q1 Q2 Q3 Q4 Q1 Q2 Q3 Q4 Q1 Q2 Q3 Q4 Q1 Q2 Q3 Q4 Q1 Q2 Q3 Q4 Q1 Q2 Q3 Q4 Q1 Q2 Q3
2004 2005 2006 2007 2008 2009 2010 2011 2012 2013 2014 2015 2016
Four quarter running average
0.6 0.3 0.6 0.81.4
2.21.5
2.4 2.13.1 3.1 3.0
3.8 3.5 3.8
7.76.5
7.1 7.2
10.2
12.5
8.5
11.011.310.910.1
14.7
10.49.1
8.6
18.5
14.6
12.3
7.8
18.9
17.5
15.5
13.3
23.6
25.3
18.2
32.7
26.9
13.0
20.7
14.4
Q1 Q2 Q3 Q4 Q1 Q2 Q3 Q4 Q1 Q2 Q3 Q4 Q1 Q2 Q3 Q4 Q1 Q2 Q3 Q4 Q1 Q2 Q3 Q4 Q1 Q2 Q3 Q4 Q1 Q2 Q3 Q4 Q1 Q2 Q3 Q4 Q1 Q2 Q3 Q4 Q1 Q2 Q3 Q4 Q1 Q2 Q3 Q4 Q1 Q2 Q3
2004 2005 2006 2007 2008 2009 2010 2011 2012 2013 2014 2015 2016
Four quarter running average
22 Michael Liebreich @MLiebreich BNEF APAC Future of Energy Summit, 2 November 2016 #BNEFSummit
Note: Total values include estimates for undisclosed deals. Excludes corporate and government R&D, and spending for digital energy and energy storage
projects (reported in annual statistics only) Source: Bloomberg New Energy Finance
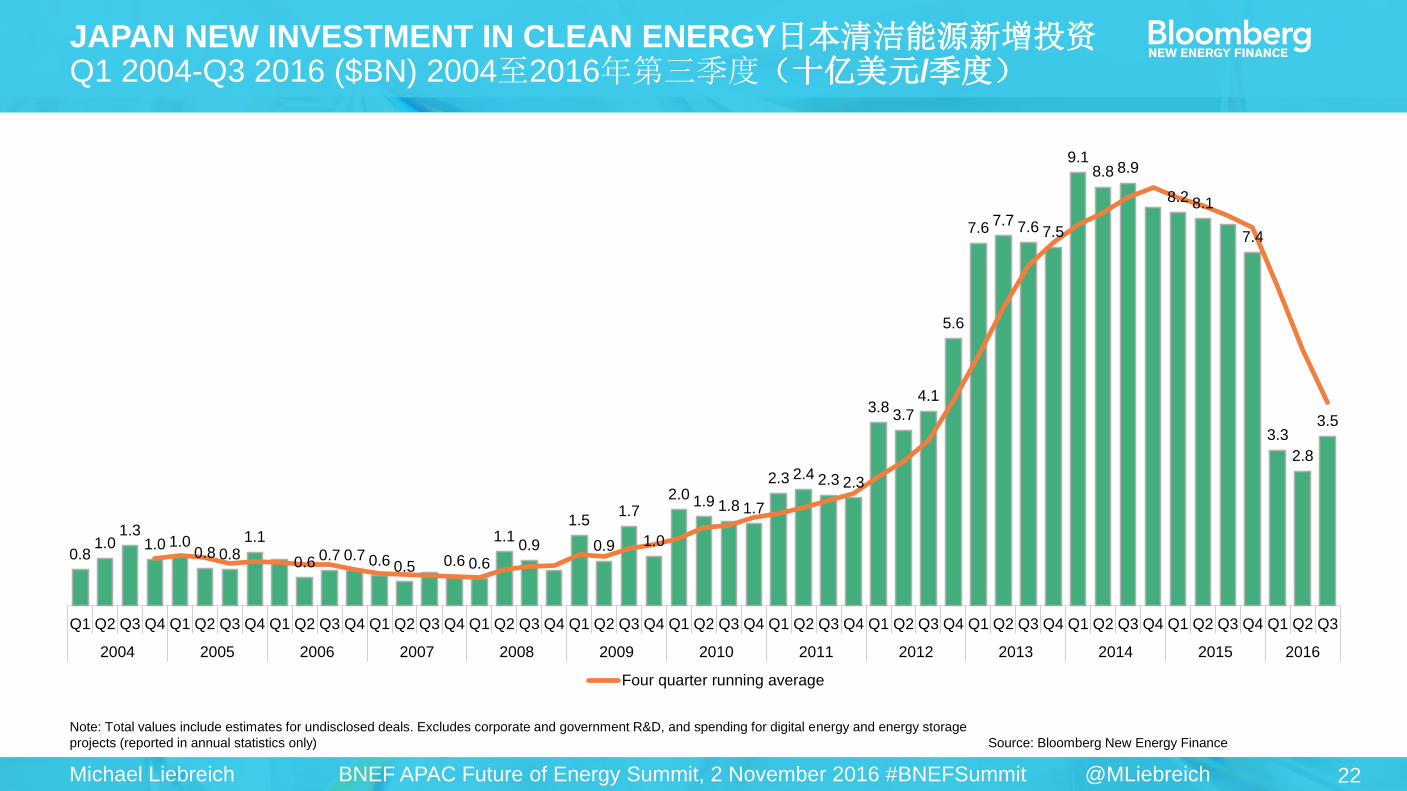
JAPAN NEW INVESTMENT IN CLEAN ENERGY日本清洁能源新增投资 Q1 2004-Q3 2016 ($BN) 2004至2016年第三季度(十亿美元/季度)
0.8 1.0 1.3 1.0 1.0 0.8 0.8 1.1 1.0 0.6 0.7 0.7 0.6 0.5 0.7 0.6 0.6 1.1 0.9 0.7 1.5 0.9 1.7 1.0 2.0 1.9 1.8 1.7 2.3 2.4 2.3 2.33.8 3.7 4.1 5.6
7.6 7.7 7.6 7.59.1 8.8 8.9 8.3 8.2 8.1 8.0 7.4
3.3 2.8 3.5
Q1 Q2 Q3 Q4 Q1 Q2 Q3 Q4 Q1 Q2 Q3 Q4 Q1 Q2 Q3 Q4 Q1 Q2 Q3 Q4 Q1 Q2 Q3 Q4 Q1 Q2 Q3 Q4 Q1 Q2 Q3 Q4 Q1 Q2 Q3 Q4 Q1 Q2 Q3 Q4 Q1 Q2 Q3 Q4 Q1 Q2 Q3 Q4 Q1 Q2 Q3
2004 2005 2006 2007 2008 2009 2010 2011 2012 2013 2014 2015 2016
Four quarter running average
0.81.0
1.31.0 1.0
0.8 0.81.1
0.6 0.7 0.7 0.6 0.5 0.6 0.6
1.10.9
1.5
0.9
1.7
1.0
2.0 1.9 1.8 1.7
2.3 2.4 2.3 2.3
3.83.7
4.1
5.6
7.67.7 7.6 7.5
9.18.8 8.9
8.2 8.1
7.4
3.3
2.8
3.5
Q1 Q2 Q3 Q4 Q1 Q2 Q3 Q4 Q1 Q2 Q3 Q4 Q1 Q2 Q3 Q4 Q1 Q2 Q3 Q4 Q1 Q2 Q3 Q4 Q1 Q2 Q3 Q4 Q1 Q2 Q3 Q4 Q1 Q2 Q3 Q4 Q1 Q2 Q3 Q4 Q1 Q2 Q3 Q4 Q1 Q2 Q3 Q4 Q1 Q2 Q3
2004 2005 2006 2007 2008 2009 2010 2011 2012 2013 2014 2015 2016
Four quarter running average
23 Michael Liebreich @MLiebreich BNEF APAC Future of Energy Summit, 2 November 2016 #BNEFSummit
Note: Total values include estimates for undisclosed deals. Excludes corporate and government R&D, and spending for digital energy and energy storage
projects (reported in annual statistics only) Source: Bloomberg New Energy Finance
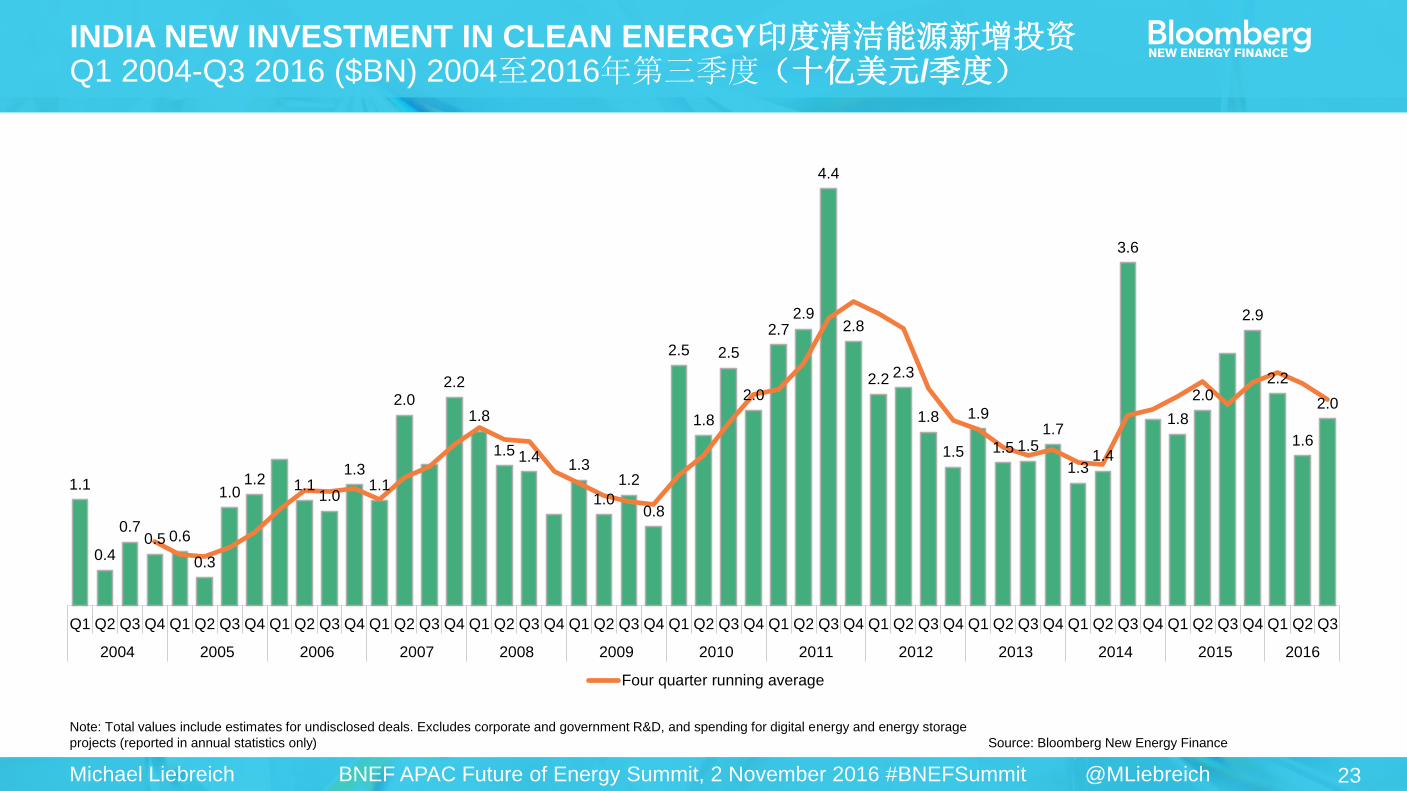
INDIA NEW INVESTMENT IN CLEAN ENERGY印度清洁能源新增投资 Q1 2004-Q3 2016 ($BN) 2004至2016年第三季度(十亿美元/季度)
1.1 0.4 0.7 0.5 0.6 0.3 1.0 1.2 1.5 1.1 1.0 1.3 1.1 2.0 1.5 2.2 1.8 1.5 1.4 0.9 1.3 1.0 1.2 0.82.5 1.8 2.5 2.0 2.7 2.9 4.4
2.8 2.2 2.3 1.8 1.5 1.9 1.5 1.5 1.7 1.3 1.43.6
2.0 1.8 2.0 2.6 2.9 2.2 1.6 2.0
Q1 Q2 Q3 Q4 Q1 Q2 Q3 Q4 Q1 Q2 Q3 Q4 Q1 Q2 Q3 Q4 Q1 Q2 Q3 Q4 Q1 Q2 Q3 Q4 Q1 Q2 Q3 Q4 Q1 Q2 Q3 Q4 Q1 Q2 Q3 Q4 Q1 Q2 Q3 Q4 Q1 Q2 Q3 Q4 Q1 Q2 Q3 Q4 Q1 Q2 Q3
2004 2005 2006 2007 2008 2009 2010 2011 2012 2013 2014 2015 2016
Four quarter running average
1.1
0.4
0.70.5 0.6
0.3
1.01.2 1.1
1.0
1.31.1
2.02.2
1.8
1.5 1.41.3
1.0
1.2
0.8
2.5
1.8
2.5
2.0
2.72.9
4.4
2.8
2.2 2.3
1.8
1.5
1.9
1.5 1.51.7
1.31.4
3.6
1.8
2.0
2.9
2.2
1.6
2.0
Q1 Q2 Q3 Q4 Q1 Q2 Q3 Q4 Q1 Q2 Q3 Q4 Q1 Q2 Q3 Q4 Q1 Q2 Q3 Q4 Q1 Q2 Q3 Q4 Q1 Q2 Q3 Q4 Q1 Q2 Q3 Q4 Q1 Q2 Q3 Q4 Q1 Q2 Q3 Q4 Q1 Q2 Q3 Q4 Q1 Q2 Q3 Q4 Q1 Q2 Q3
2004 2005 2006 2007 2008 2009 2010 2011 2012 2013 2014 2015 2016
Four quarter running average
24 Michael Liebreich @MLiebreich BNEF APAC Future of Energy Summit, 2 November 2016 #BNEFSummit
0%
4%
8%
12%
16%
20%
24%
0
20
40
60
80
100
120
140
2001 2002 2003 2004 2005 2006 2007 2008 2009 2010 2011 2012 2013 2014 2015
Solar
Wind
Hydro
Nuclear
Gas
Coal
0%
4%
8%
12%
16%
20%
24%
0
20
40
60
80
100
120
140
2001 2002 2003 2004 2005 2006 2007 2008 2009 2010 2011 2012 2013 2014 2015
Solar
Wind
Hydro
Nuclear
Gas
Coal
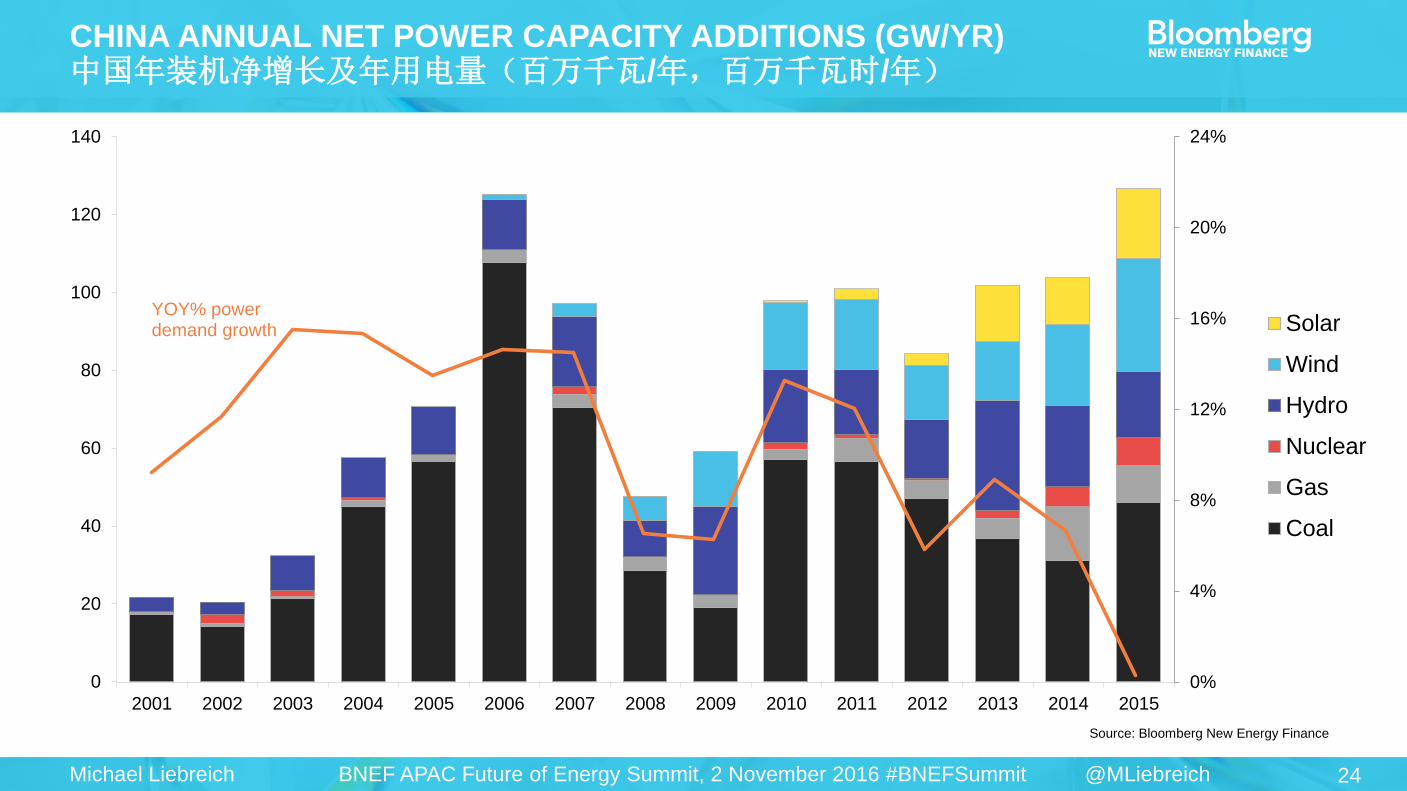
CHINA ANNUAL NET POWER CAPACITY ADDITIONS (GW/YR) 中国年装机净增长及年用电量(百万千瓦/年,百万千瓦时/年)
Source: Bloomberg New Energy Finance
0%
4%
8%
12%
16%
20%
24%
0
20
40
60
80
100
120
2001 2002 2003 2004 2005 2006 2007 2008 2009 2010 2011 2012 2013 2014 2015
Solar
Wind
Nuclear
Gas
Coal
YOY% power demand growth
0%
4%
8%
12%
16%
20%
24%
0
20
40
60
80
100
120
140
2001 2002 2003 2004 2005 2006 2007 2008 2009 2010 2011 2012 2013 2014 2015
Solar
Wind
Hydro
Nuclear
Gas
Coal
25 Michael Liebreich @MLiebreich BNEF APAC Future of Energy Summit, 2 November 2016 #BNEFSummit
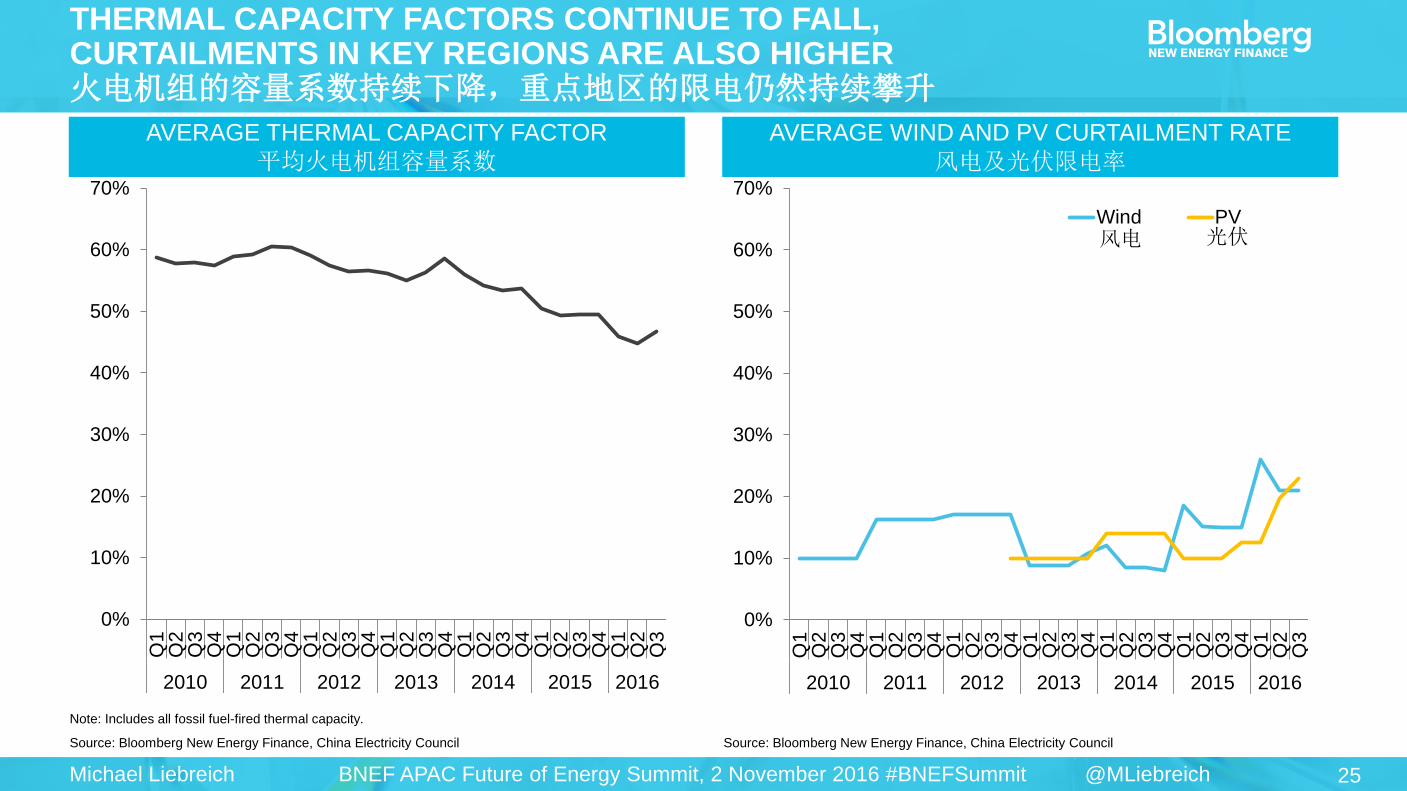
THERMAL CAPACITY FACTORS CONTINUE TO FALL, CURTAILMENTS IN KEY REGIONS ARE ALSO HIGHER 火电机组的容量系数持续下降,重点地区的限电仍然持续攀升
Note: Includes all fossil fuel-fired thermal capacity.
Source: Bloomberg New Energy Finance, China Electricity Council Source: Bloomberg New Energy Finance, China Electricity Council
AVERAGE THERMAL CAPACITY FACTOR
平均火电机组容量系数
AVERAGE WIND AND PV CURTAILMENT RATE
风电及光伏限电率 Q
1Q
2Q
3Q
4Q
1Q
2Q
3Q
4Q
1Q
2Q
3Q
4Q
1Q
2Q
3Q
4Q
1Q
2Q
3Q
4Q
1Q
2Q
3Q
4Q
1Q
2Q
3
2010 2011 2012 2013 2014 2015 2016
0%
10%
20%
30%
40%
50%
60%
70%
Q1
Q2
Q3
Q4
Q1
Q2
Q3
Q4
Q1
Q2
Q3
Q4
Q1
Q2
Q3
Q4
Q1
Q2
Q3
Q4
Q1
Q2
Q3
Q4
Q1
Q2
Q3
2010 2011 2012 2013 2014 2015 2016
0%
10%
20%
30%
40%
50%
60%
70%
Wind PV风电 光伏
26 Michael Liebreich @MLiebreich BNEF APAC Future of Energy Summit, 2 November 2016 #BNEFSummit
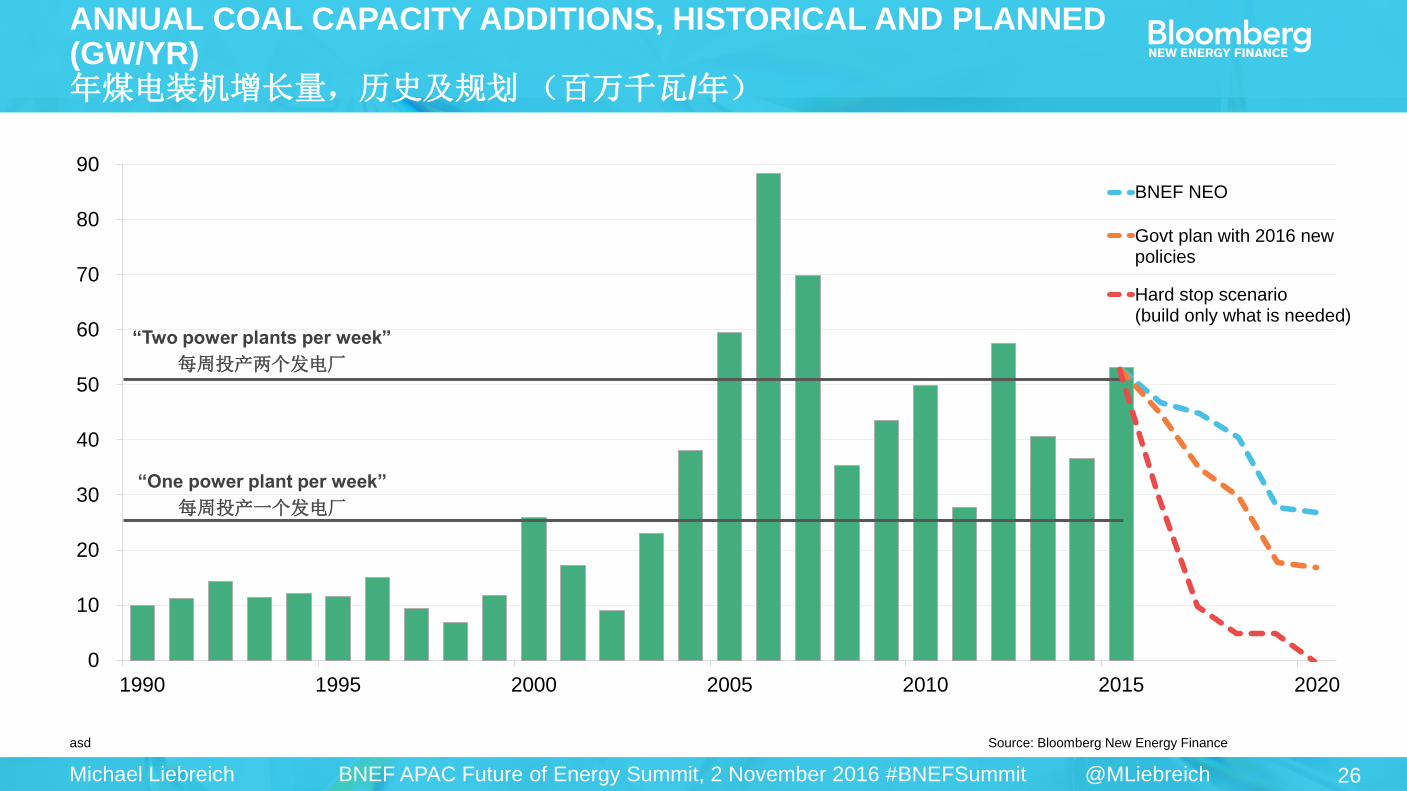
asd Source: Bloomberg New Energy Finance
ANNUAL COAL CAPACITY ADDITIONS, HISTORICAL AND PLANNED (GW/YR) 年煤电装机增长量,历史及规划 (百万千瓦/年)
0
10
20
30
40
50
60
70
80
90
1990 1995 2000 2005 2010 2015 20200
10
20
30
40
50
60
70
80
90
1990 1995 2000 2005 2010 2015 2020
0
10
20
30
40
50
60
70
80
90
1990 1995 2000 2005 2010 2015 2020
0
10
20
30
40
50
60
70
80
90
1990 1995 2000 2005 2010 2015 2020
0
10
20
30
40
50
60
70
80
90
1990 1995 2000 2005 2010 2015 2020
BNEF NEO
Govt plan with 2016 newpolicies
Hard stop scenario(build only what is needed)
0
10
20
30
40
50
60
70
80
90
1990 1995 2000 2005 2010 2015 2020
BNEF NEO
Govt plan with 2016 newpolicies
Hard stop scenario(build only what is needed)0
10
20
30
40
50
60
70
80
90
1990 1995 2000 2005 2010 2015 2020
BNEF NEO
Govt plan with 2016 newpolicies
Hard stop scenario(build only what is needed)
“One power plant per week”
每周投产一个发电厂
“Two power plants per week”
每周投产两个发电厂
27 Michael Liebreich @MLiebreich BNEF APAC Future of Energy Summit, 2 November 2016 #BNEFSummit
0
10
20
30
40
50
60
2005 2010 2015 2020 2025 2030
0
200
400
600
800
1,000
1,200
0
10
20
30
40
50
60
2005 2010 2015 2020 2025 2030
0
200
400
600
800
1,000
1,200
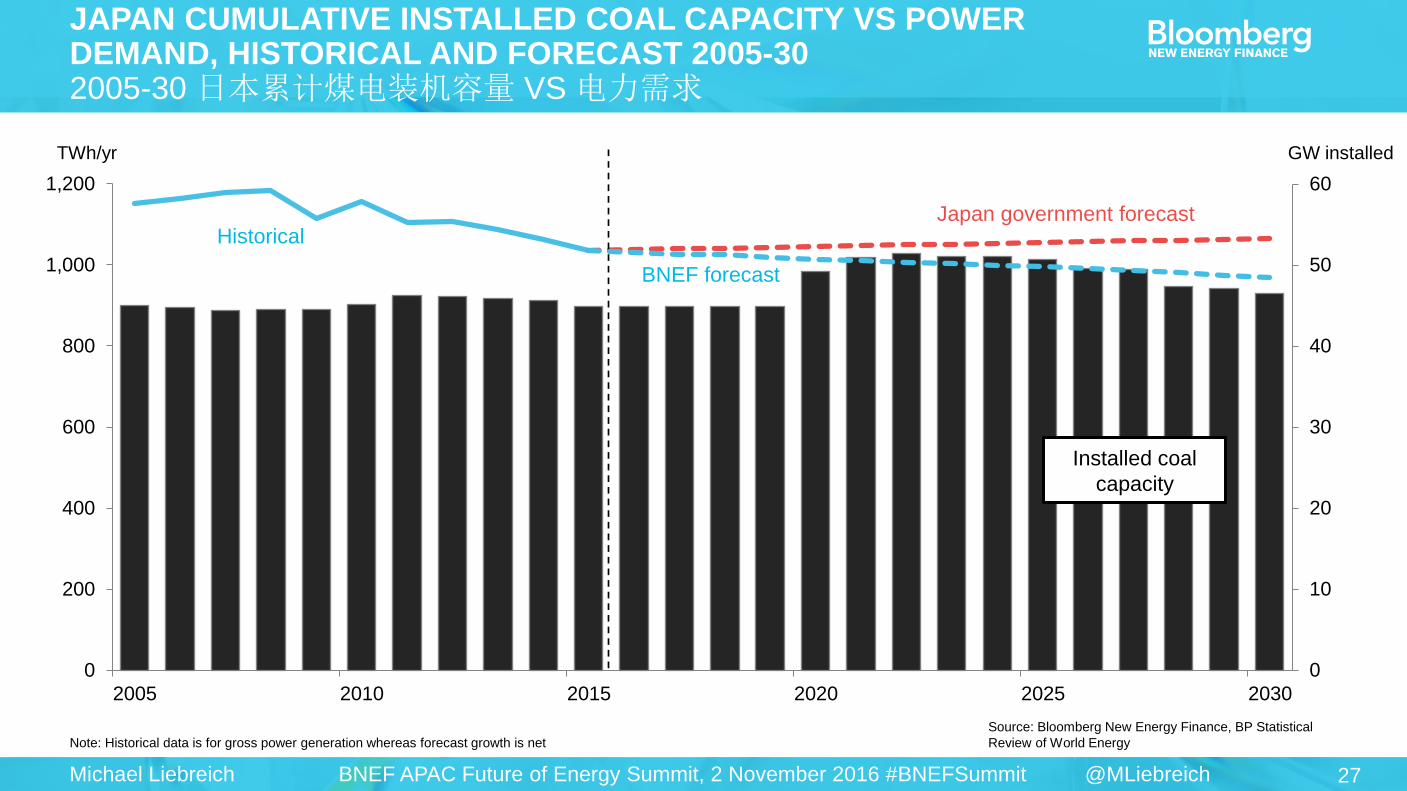
Note: Historical data is for gross power generation whereas forecast growth is net
Source: Bloomberg New Energy Finance, BP Statistical
Review of World Energy
JAPAN CUMULATIVE INSTALLED COAL CAPACITY VS POWER DEMAND, HISTORICAL AND FORECAST 2005-30 2005-30 日本累计煤电装机容量 VS 电力需求
TWh/yr GW installed
0
10
20
30
40
50
60
2005 2010 2015 2020 2025 2030
0
200
400
600
800
1,000
1,200
0
10
20
30
40
50
60
2005 2010 2015 2020 2025 2030
0
200
400
600
800
1,000
1,200
0
10
20
30
40
50
60
2005 2010 2015 2020 2025 2030
0
200
400
600
800
1,000
1,200
Historical
BNEF forecast
Japan government forecast
Installed coal
capacity
28 Michael Liebreich @MLiebreich BNEF APAC Future of Energy Summit, 2 November 2016 #BNEFSummit
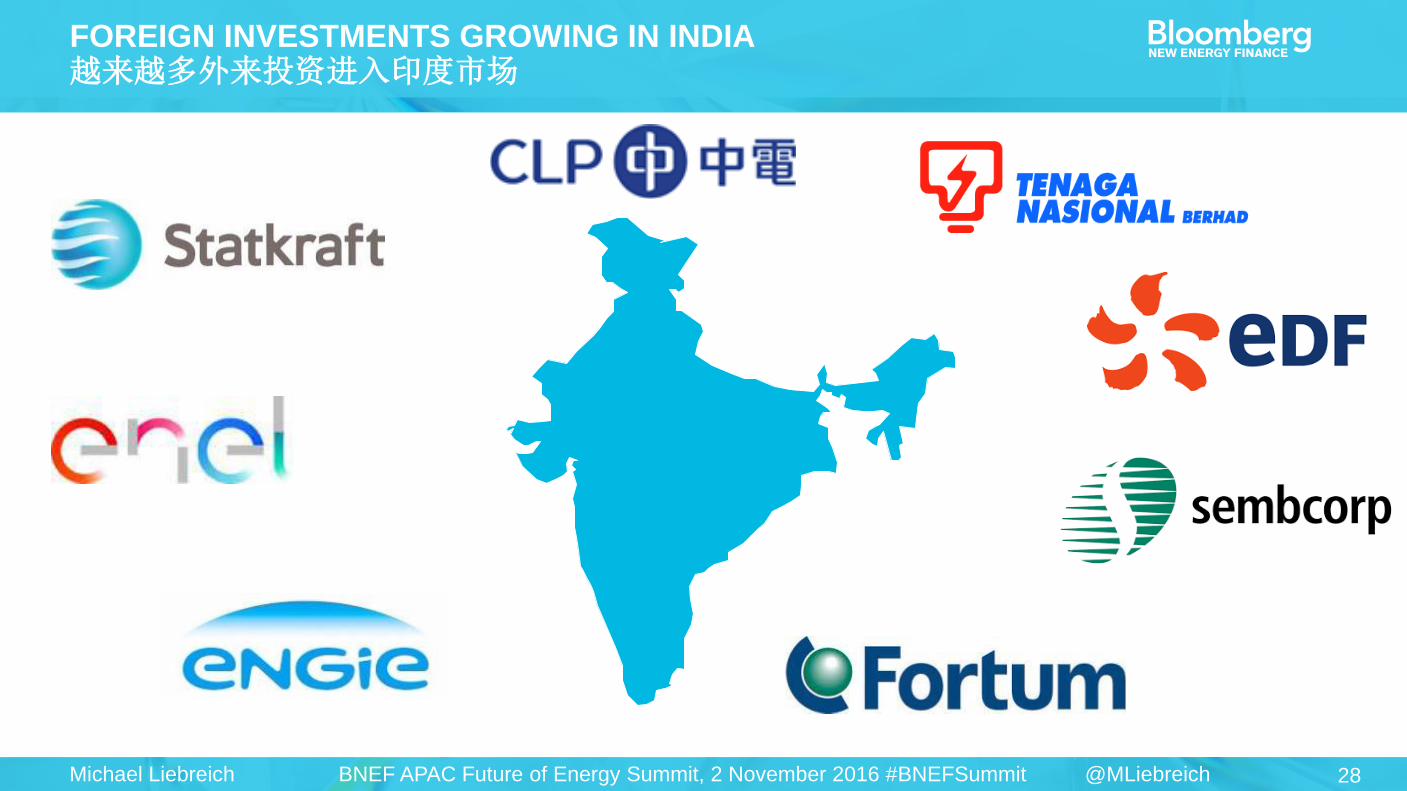
FOREIGN INVESTMENTS GROWING IN INDIA 越来越多外来投资进入印度市场
29 Michael Liebreich @MLiebreich BNEF APAC Future of Energy Summit, 2 November 2016 #BNEFSummit
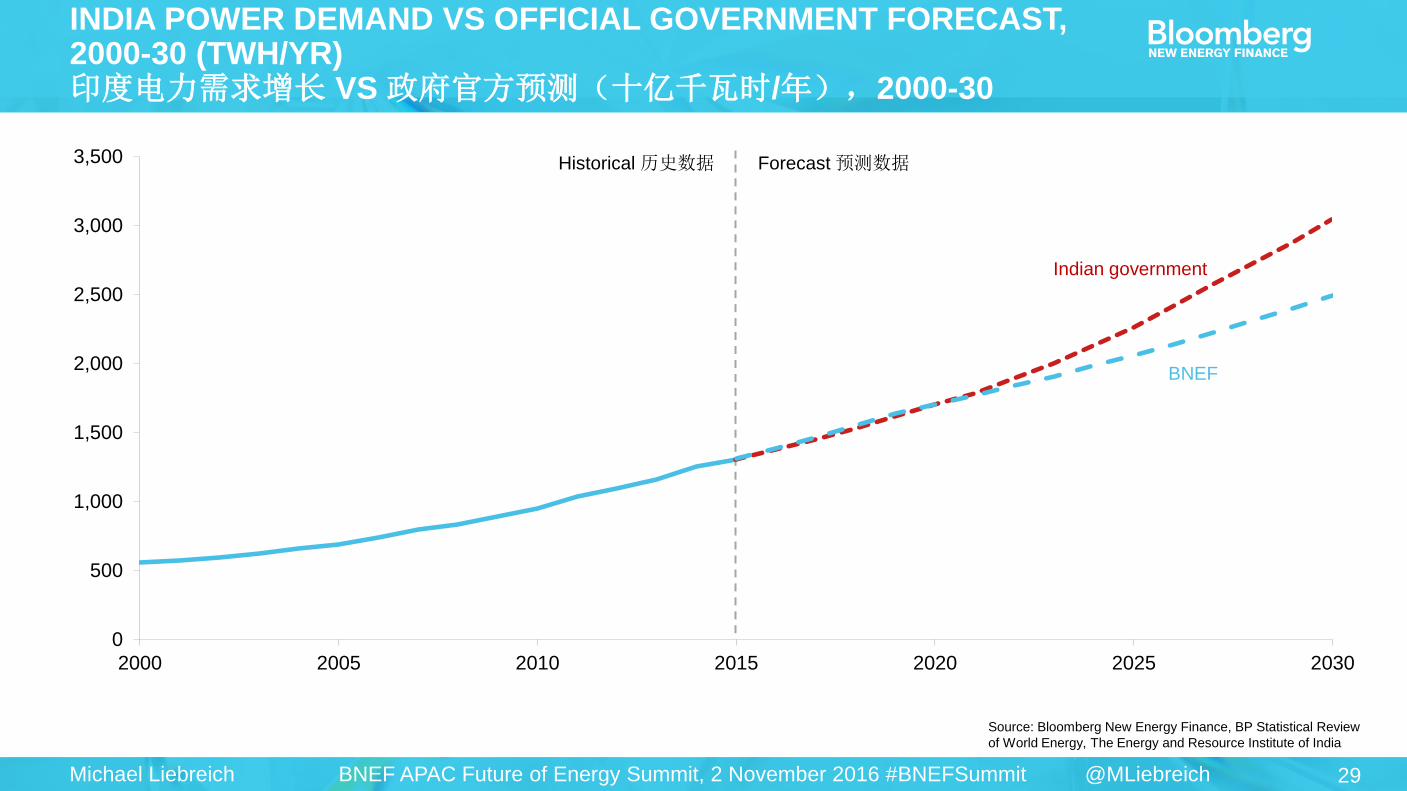
Source: Bloomberg New Energy Finance, BP Statistical Review
of World Energy, The Energy and Resource Institute of India
INDIA POWER DEMAND VS OFFICIAL GOVERNMENT FORECAST, 2000-30 (TWH/YR) 印度电力需求增长 VS 政府官方预测(十亿千瓦时/年),2000-30
Historical 历史数据 Forecast 预测数据
0
500
1,000
1,500
2,000
2,500
3,000
3,500
2000 2005 2010 2015 2020 2025 2030
0
500
1,000
1,500
2,000
2,500
3,000
3,500
2000 2005 2010 2015 2020 2025 2030
0
500
1,000
1,500
2,000
2,500
3,000
3,500
2000 2005 2010 2015 2020 2025 2030
0
500
1,000
1,500
2,000
2,500
3,000
3,500
2000 2005 2010 2015 2020 2025 2030
BNEF
Indian government
30 Michael Liebreich @MLiebreich BNEF APAC Future of Energy Summit, 2 November 2016 #BNEFSummit
0%
10%
20%
30%
40%
50%
60%
70%
80%
90%
0
2
4
6
8
10
12
14
16
18
20
2005 2010 2015 2020 2025 2030
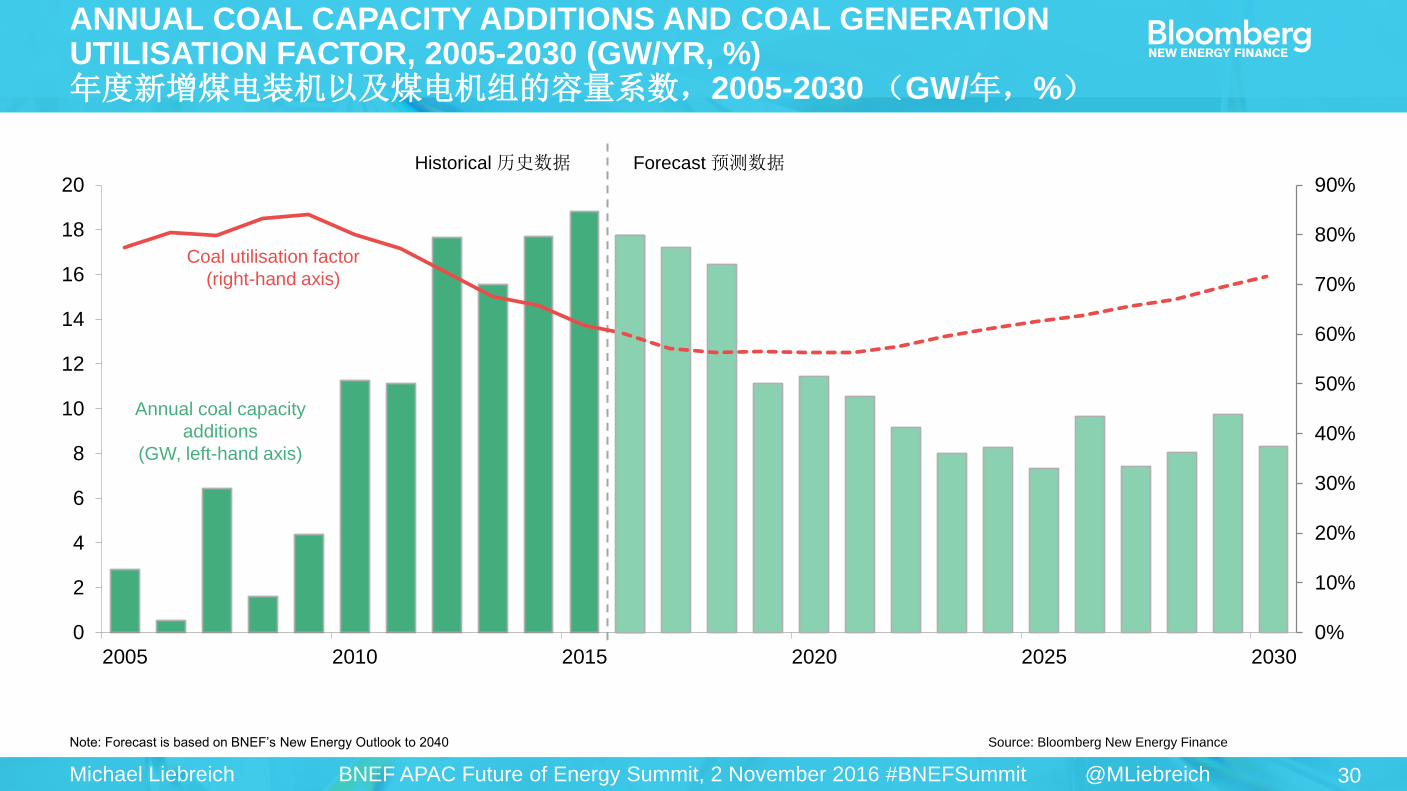
Note: Forecast is based on BNEF’s New Energy Outlook to 2040 Source: Bloomberg New Energy Finance
ANNUAL COAL CAPACITY ADDITIONS AND COAL GENERATION UTILISATION FACTOR, 2005-2030 (GW/YR, %) 年度新增煤电装机以及煤电机组的容量系数,2005-2030 (GW/年,%)
Historical 历史数据 Forecast 预测数据
0%
10%
20%
30%
40%
50%
60%
70%
80%
90%
0
2
4
6
8
10
12
14
16
18
20
2005 2010 2015 2020 2025 2030
0%
10%
20%
30%
40%
50%
60%
70%
80%
90%
0
2
4
6
8
10
12
14
16
18
20
2005 2010 2015 2020 2025 2030
0%
10%
20%
30%
40%
50%
60%
70%
80%
90%
0
2
4
6
8
10
12
14
16
18
20
2005 2010 2015 2020 2025 2030
0%
10%
20%
30%
40%
50%
60%
70%
80%
90%
0
2
4
6
8
10
12
14
16
18
20
2005 2010 2015 2020 2025 2030
Coal utilisation factor
(right-hand axis)
Annual coal capacity
additions
(GW, left-hand axis)
31 Michael Liebreich @MLiebreich BNEF APAC Future of Energy Summit, 2 November 2016 #BNEFSummit
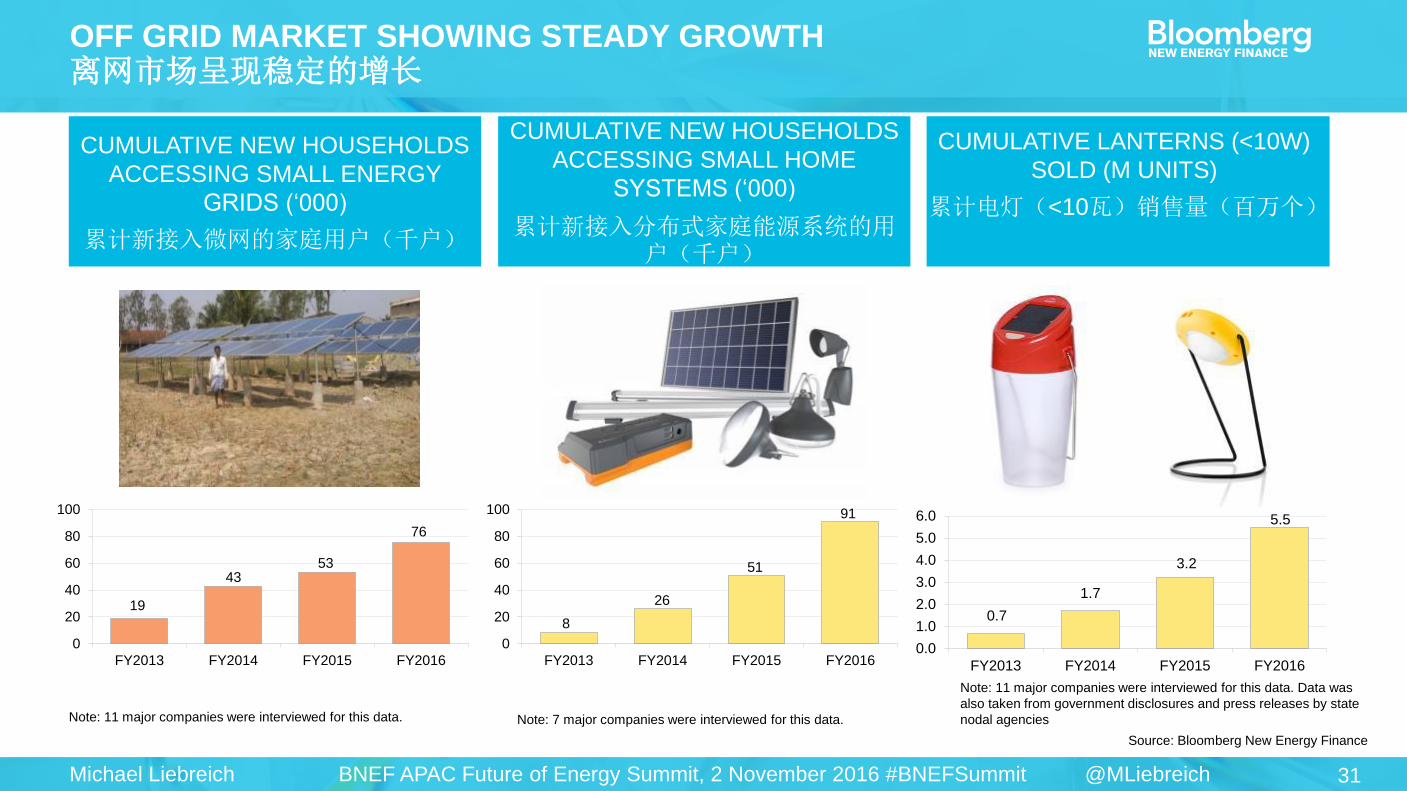
OFF GRID MARKET SHOWING STEADY GROWTH 离网市场呈现稳定的增长
CUMULATIVE NEW HOUSEHOLDS
ACCESSING SMALL ENERGY
GRIDS (‘000)
累计新接入微网的家庭用户(千户)
CUMULATIVE NEW HOUSEHOLDS
ACCESSING SMALL HOME
SYSTEMS (‘000)
累计新接入分布式家庭能源系统的用户(千户)
CUMULATIVE LANTERNS (<10W)
SOLD (M UNITS)
累计电灯(<10瓦)销售量(百万个)
Note: 11 major companies were interviewed for this data. Note: 7 major companies were interviewed for this data.
Note: 11 major companies were interviewed for this data. Data was
also taken from government disclosures and press releases by state
nodal agencies
Source: Bloomberg New Energy Finance
8
26
51
91
0
20
40
60
80
100
FY2013 FY2014 FY2015 FY2016
19
4353
76
0
20
40
60
80
100
FY2013 FY2014 FY2015 FY2016
0.7
1.7
3.2
5.5
0.0
1.0
2.0
3.0
4.0
5.0
6.0
FY2013 FY2014 FY2015 FY2016
32 Michael Liebreich @MLiebreich BNEF APAC Future of Energy Summit, 2 November 2016 #BNEFSummit
$62bn
$88bn
$128bn
$175bn
$205bn $207bn
$276bn
$317bn
$291bn
$269bn
$315bn
$349bn
0.00
20.00
40.00
60.00
80.00
100.00
120.00
140.00
160.00
0
100
200
300
400
500
2004 2005 2006 2007 2008 2009 2010 2011 2012 2013 2014 2015 2016 2017 2018 2019 2020
Note: Total values include estimates for undisclosed deals. Includes corporate and government R&D, and spending
for digital energy and energy storage projects (not reported in quarterly statistics). Excludes large hydro. Source: Bloomberg Intelligence, Bloomberg New Energy Finance
CLEAN ENERGY INVESTMENT ROSE, CAPACITY INSTALLATIONS ROSE FASTER 清洁能源投资额上升,清洁能源装机量增速更快 GLOBAL CLEAN ENERGY INVESTMENT VS CAPACITY INSTALLATIONS 2004-15 全球清洁能源投资额 VS 装机量 2004-20
88GW
20GW
“Spend the same,
get more”
投资不变,装机增长
“Spend more,
get more”
投资越多,装机越多
0.00
20.00
40.00
60.00
80.00
100.00
120.00
140.00
160.00
0
100
200
300
400
500
2004 2005 2006 2007 2008 2009 2010 2011 2012 2013 2014 2015 2016 2017 2018 2019 20200.00
20.00
40.00
60.00
80.00
100.00
120.00
140.00
160.00
0
100
200
300
400
500
2004 2005 2006 2007 2008 2009 2010 2011 2012 2013 2014 2015 2016 2017 2018 2019 2020
152GW
“Spend less,
get the same”
投资减少,装机增长不变
165GW
Preliminary estimate
33 Michael Liebreich @MLiebreich BNEF APAC Future of Energy Summit, 2 November 2016 #BNEFSummit
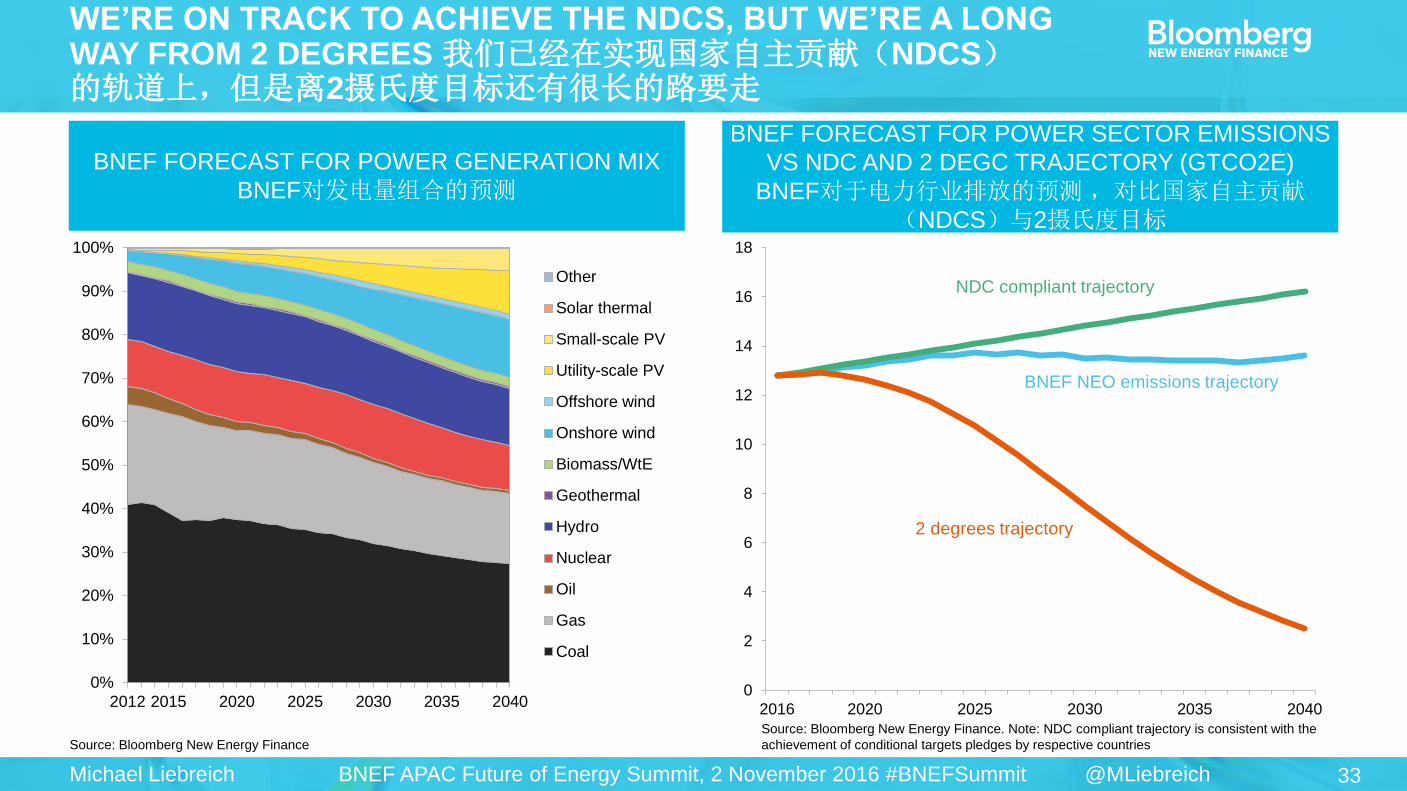
WE’RE ON TRACK TO ACHIEVE THE NDCS, BUT WE’RE A LONG WAY FROM 2 DEGREES 我们已经在实现国家自主贡献(NDCS) 的轨道上,但是离2摄氏度目标还有很长的路要走
Source: Bloomberg New Energy Finance
Source: Bloomberg New Energy Finance. Note: NDC compliant trajectory is consistent with the
achievement of conditional targets pledges by respective countries
BNEF FORECAST FOR POWER GENERATION MIX
BNEF对发电量组合的预测
BNEF FORECAST FOR POWER SECTOR EMISSIONS
VS NDC AND 2 DEGC TRAJECTORY (GTCO2E)
BNEF对于电力行业排放的预测 ,对比国家自主贡献(NDCS)与2摄氏度目标
0%
10%
20%
30%
40%
50%
60%
70%
80%
90%
100%
2012 2015 2020 2025 2030 2035 2040
Other
Solar thermal
Small-scale PV
Utility-scale PV
Offshore wind
Onshore wind
Biomass/WtE
Geothermal
Hydro
Nuclear
Oil
Gas
Coal
0
2
4
6
8
10
12
14
16
18
2016 2020 2025 2030 2035 2040
0
2
4
6
8
10
12
14
16
18
2016 2020 2025 2030 2035 2040
BNEF NEO emissions trajectory
0
2
4
6
8
10
12
14
16
18
2016 2020 2025 2030 2035 2040
NDC compliant trajectory
0
2
4
6
8
10
12
14
16
18
2016 2020 2025 2030 2035 2040
2 degrees trajectory
34 Michael Liebreich @MLiebreich BNEF APAC Future of Energy Summit, 2 November 2016 #BNEFSummit
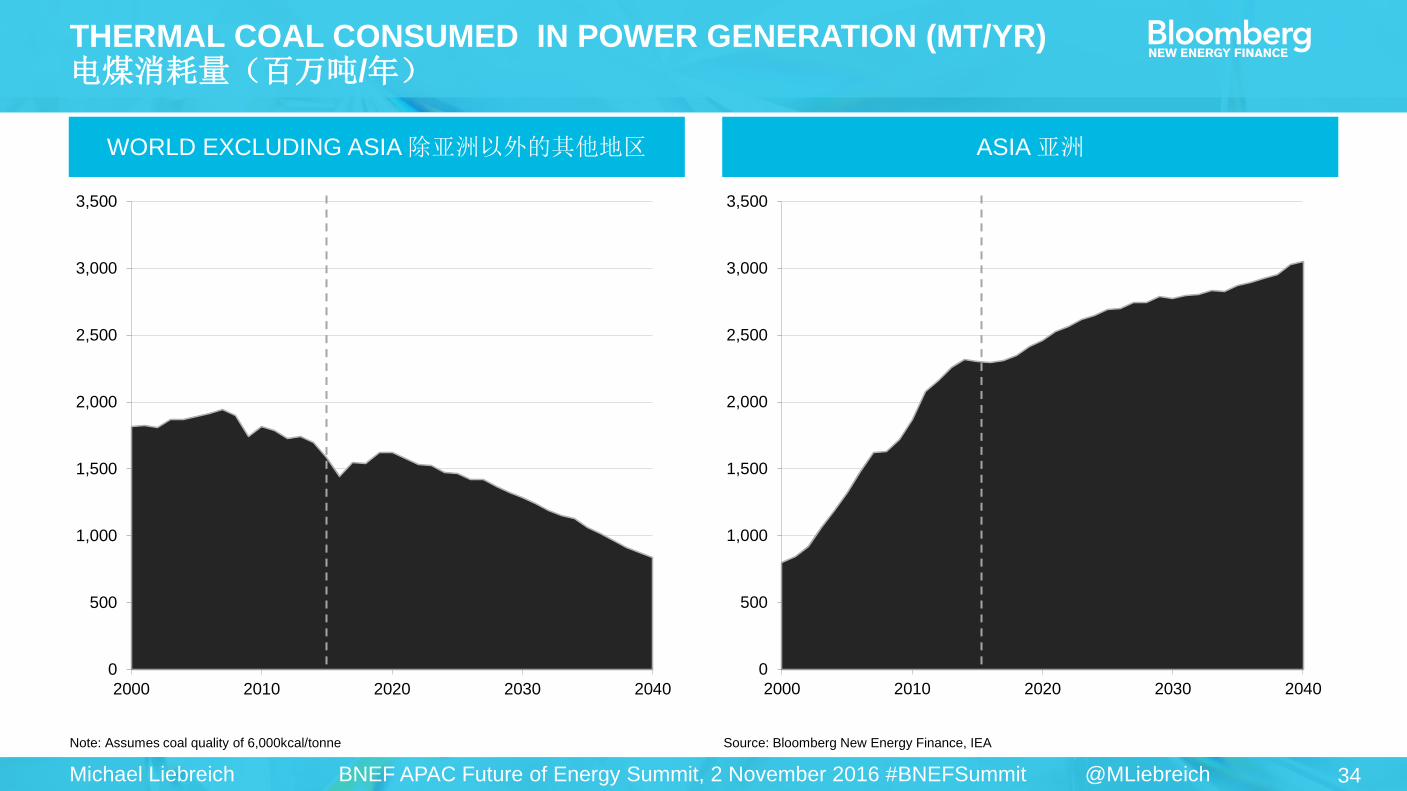
THERMAL COAL CONSUMED IN POWER GENERATION (MT/YR) 电煤消耗量(百万吨/年)
Note: Assumes coal quality of 6,000kcal/tonne Source: Bloomberg New Energy Finance, IEA
WORLD EXCLUDING ASIA 除亚洲以外的其他地区 ASIA 亚洲
0
500
1,000
1,500
2,000
2,500
3,000
3,500
2000 2010 2020 2030 2040
0
500
1,000
1,500
2,000
2,500
3,000
3,500
2000 2010 2020 2030 2040
35 Michael Liebreich @MLiebreich BNEF APAC Future of Energy Summit, 2 November 2016 #BNEFSummit
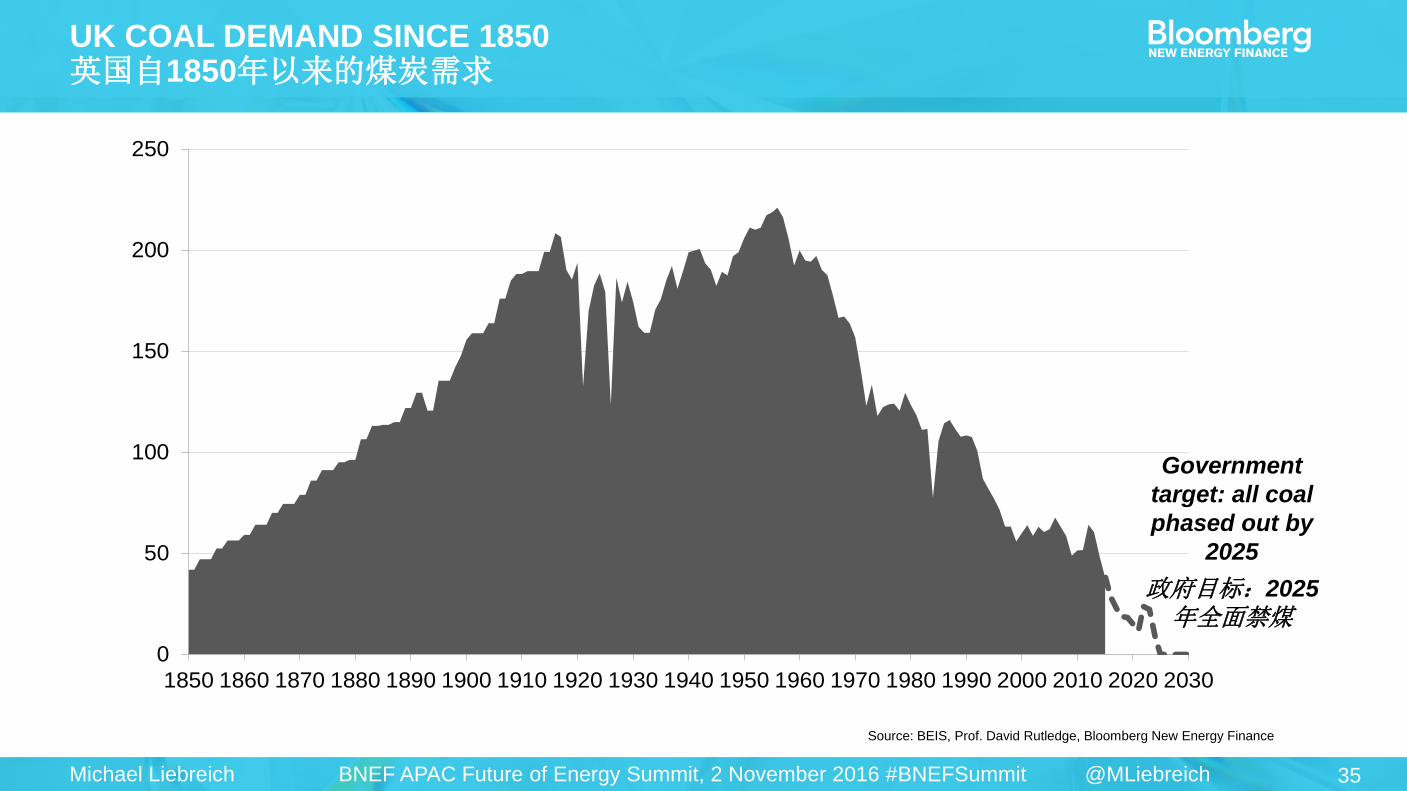
UK COAL DEMAND SINCE 1850 英国自1850年以来的煤炭需求
0
50
100
150
200
250
1850 1860 1870 1880 1890 1900 1910 1920 1930 1940 1950 1960 1970 1980 1990 2000 2010 2020 2030
Source: BEIS, Prof. David Rutledge, Bloomberg New Energy Finance
Government
target: all coal
phased out by
2025
政府目标:2025
年全面禁煤
36 Michael Liebreich @MLiebreich BNEF APAC Future of Energy Summit, 2 November 2016 #BNEFSummit
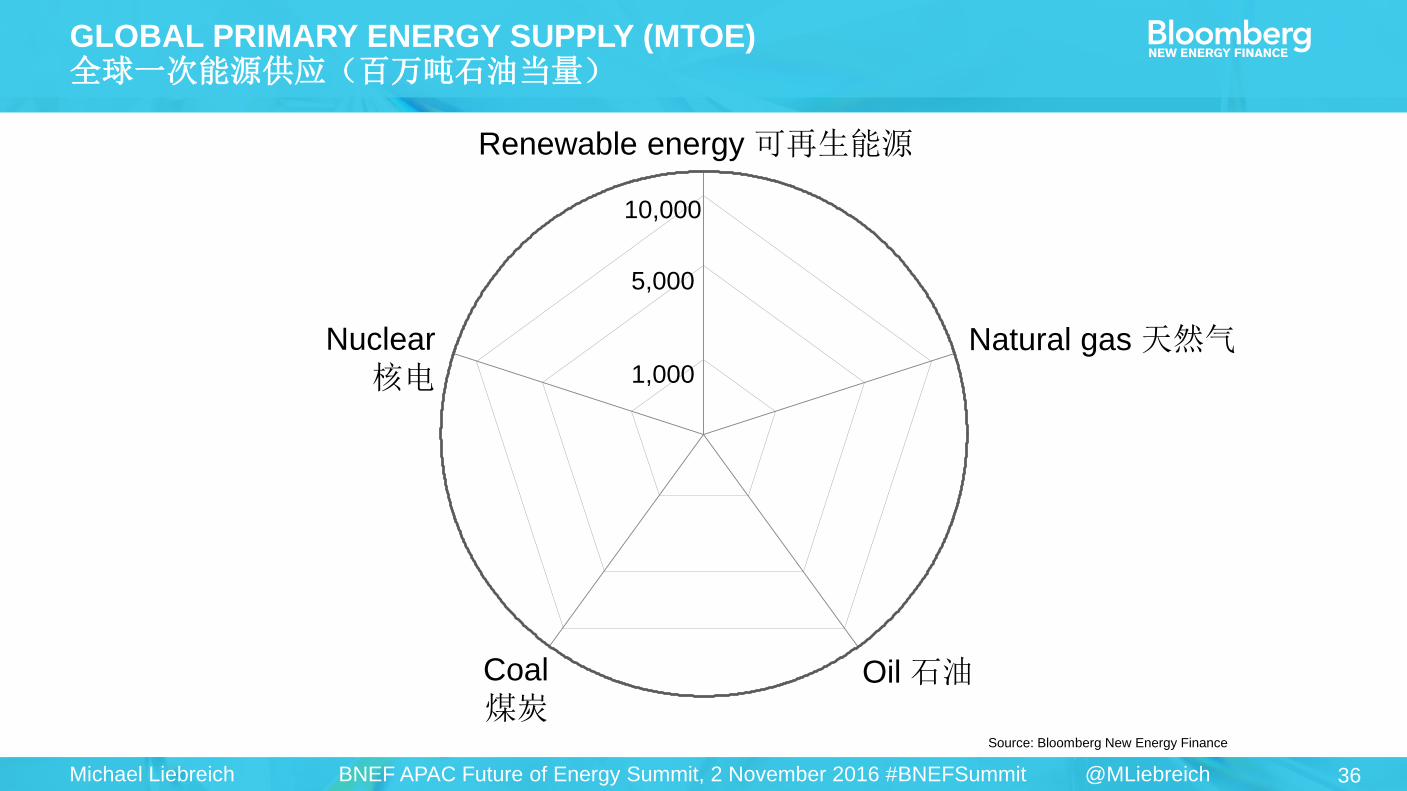
Source: Bloomberg New Energy Finance
GLOBAL PRIMARY ENERGY SUPPLY (MTOE) 全球一次能源供应(百万吨石油当量)
10,000
5,000
1,000
0
Renewable energy 可再生能源
Natural gas 天然气
Oil 石油 Coal
煤炭
Nuclear
核电

37 Michael Liebreich @MLiebreich BNEF APAC Future of Energy Summit, 2 November 2016 #BNEFSummit
Note: BNEF adjusted IEA NPS forecast using its own electricity generation and EV demand forecast. Renewables total includes bioenergy and hydro. Source: Bloomberg New Energy Finance, IEA
GLOBAL PRIMARY ENERGY SUPPLY, 1975 (MTOE) 全球一次能源供应,1975年(百万吨石油当量)
10,000
5,000
1,000
1975
Renewable energy 可再生能源
Natural gas 天然气
Oil 石油
Nuclear
核电
Coal
煤炭

38 Michael Liebreich @MLiebreich BNEF APAC Future of Energy Summit, 2 November 2016 #BNEFSummit
Note: BNEF adjusted IEA NPS forecast using its own electricity generation and EV demand forecast. Renewables total includes bioenergy and hydro. Source: Bloomberg New Energy Finance, IEA
GLOBAL PRIMARY ENERGY SUPPLY, 1980 (MTOE) 全球一次能源供应,1980年(百万吨石油当量)
10,000
5,000
1,000
1980
Renewable energy 可再生能源
Natural gas 天然气
Oil 石油
Nuclear
核电
Coal
煤炭
39 Michael Liebreich @MLiebreich BNEF APAC Future of Energy Summit, 2 November 2016 #BNEFSummit
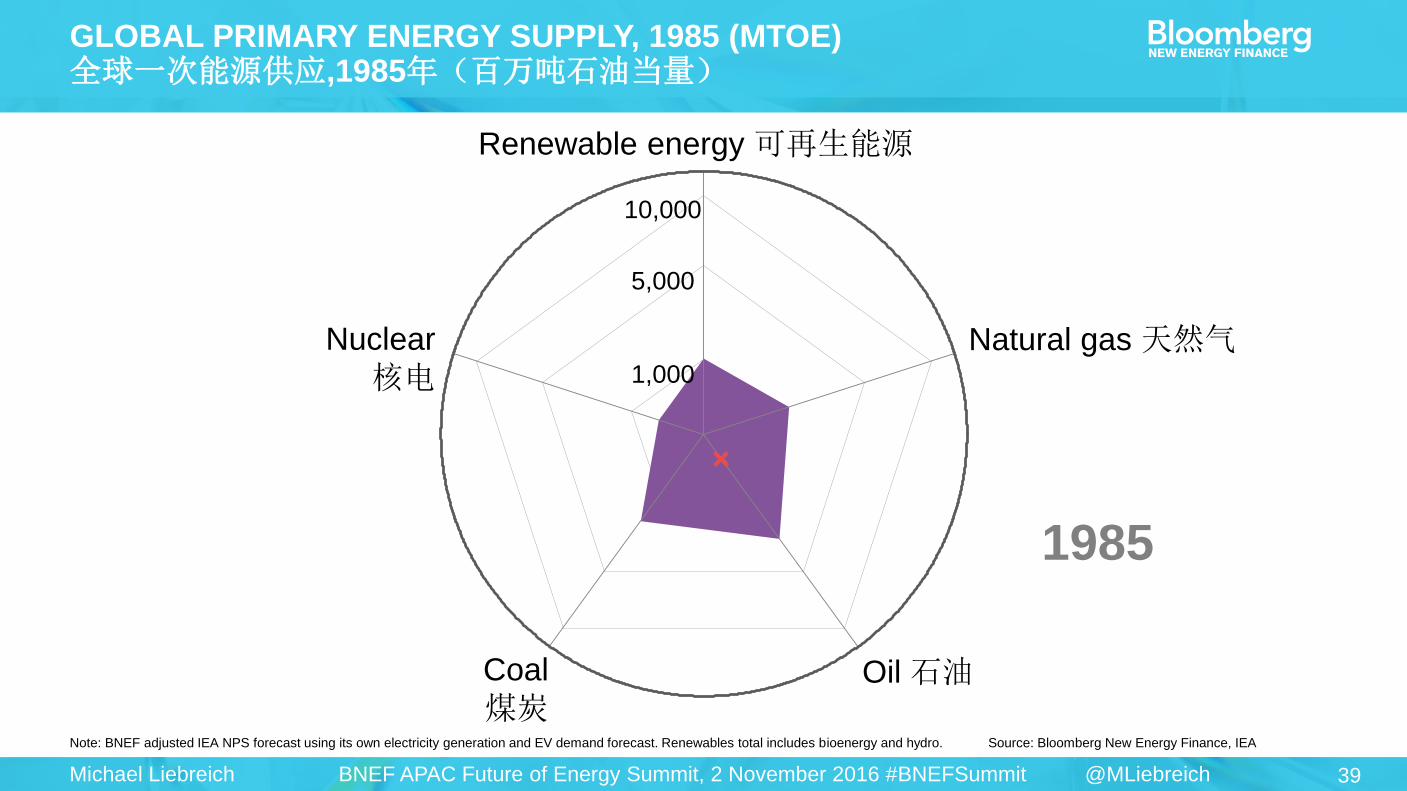
Note: BNEF adjusted IEA NPS forecast using its own electricity generation and EV demand forecast. Renewables total includes bioenergy and hydro. Source: Bloomberg New Energy Finance, IEA
GLOBAL PRIMARY ENERGY SUPPLY, 1985 (MTOE) 全球一次能源供应,1985年(百万吨石油当量)
10,000
5,000
1,000
1985
Renewable energy 可再生能源
Natural gas 天然气
Oil 石油
Nuclear
核电
Coal
煤炭

40 Michael Liebreich @MLiebreich BNEF APAC Future of Energy Summit, 2 November 2016 #BNEFSummit
Note: BNEF adjusted IEA NPS forecast using its own electricity generation and EV demand forecast. Renewables total includes bioenergy and hydro. Source: Bloomberg New Energy Finance, IEA
GLOBAL PRIMARY ENERGY SUPPLY, 1990 (MTOE) 全球一次能源供应,1990年(百万吨石油当量)
10,000
5,000
1,000
1990
Renewable energy 可再生能源
Natural gas 天然气
Oil 石油
Nuclear
核电
Coal
煤炭

41 Michael Liebreich @MLiebreich BNEF APAC Future of Energy Summit, 2 November 2016 #BNEFSummit
Note: BNEF adjusted IEA NPS forecast using its own electricity generation and EV demand forecast. Renewables total includes bioenergy and hydro. Source: Bloomberg New Energy Finance, IEA
GLOBAL PRIMARY ENERGY SUPPLY, 1995 (MTOE) 全球一次能源供应,1995年(百万吨石油当量)
10,000
5,000
1,000
1995
Renewable energy 可再生能源
Natural gas 天然气
Oil 石油
Nuclear
核电
Coal
煤炭
42 Michael Liebreich @MLiebreich BNEF APAC Future of Energy Summit, 2 November 2016 #BNEFSummit
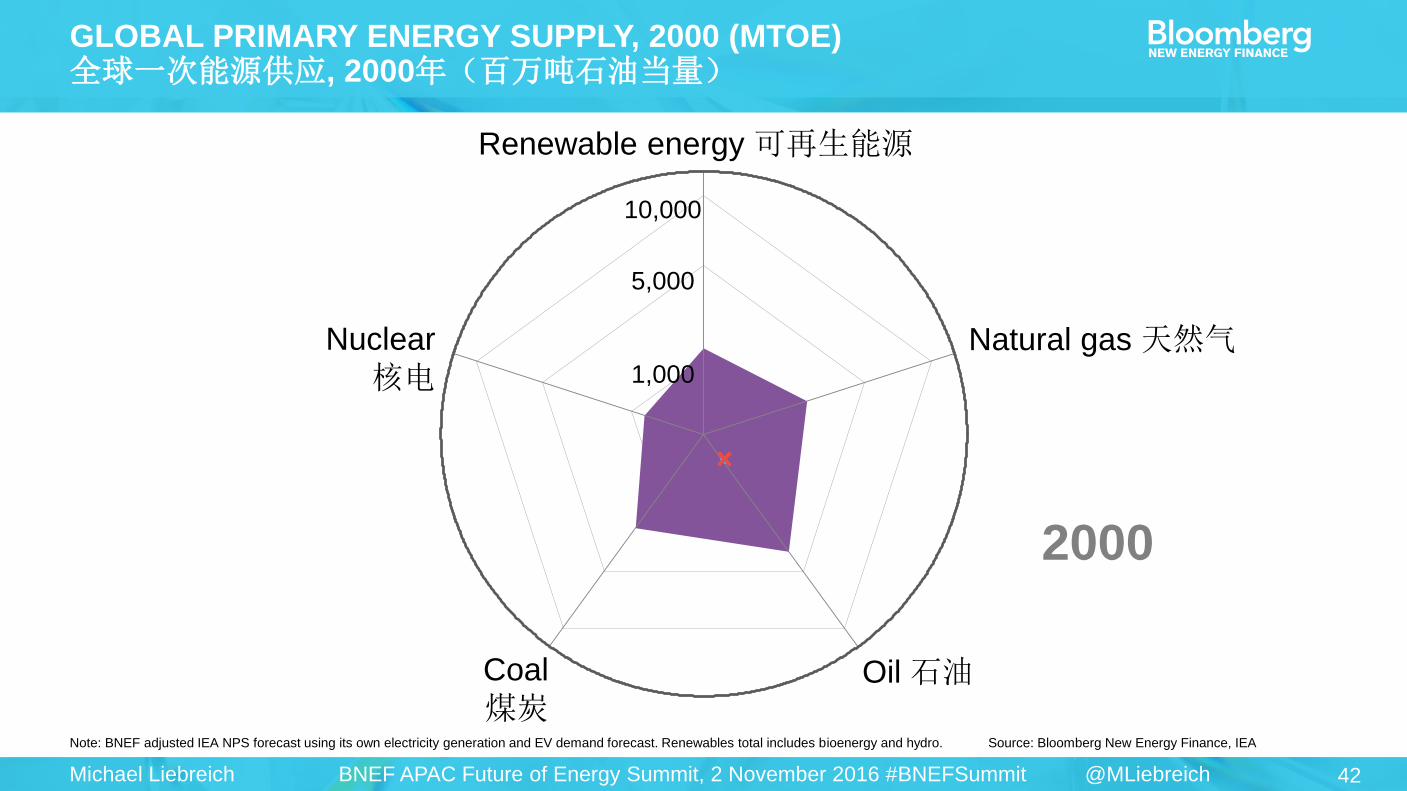
Note: BNEF adjusted IEA NPS forecast using its own electricity generation and EV demand forecast. Renewables total includes bioenergy and hydro. Source: Bloomberg New Energy Finance, IEA
GLOBAL PRIMARY ENERGY SUPPLY, 2000 (MTOE) 全球一次能源供应, 2000年(百万吨石油当量)
10,000
5,000
1,000
2000
Renewable energy 可再生能源
Natural gas 天然气
Oil 石油
Nuclear
核电
Coal
煤炭
43 Michael Liebreich @MLiebreich BNEF APAC Future of Energy Summit, 2 November 2016 #BNEFSummit
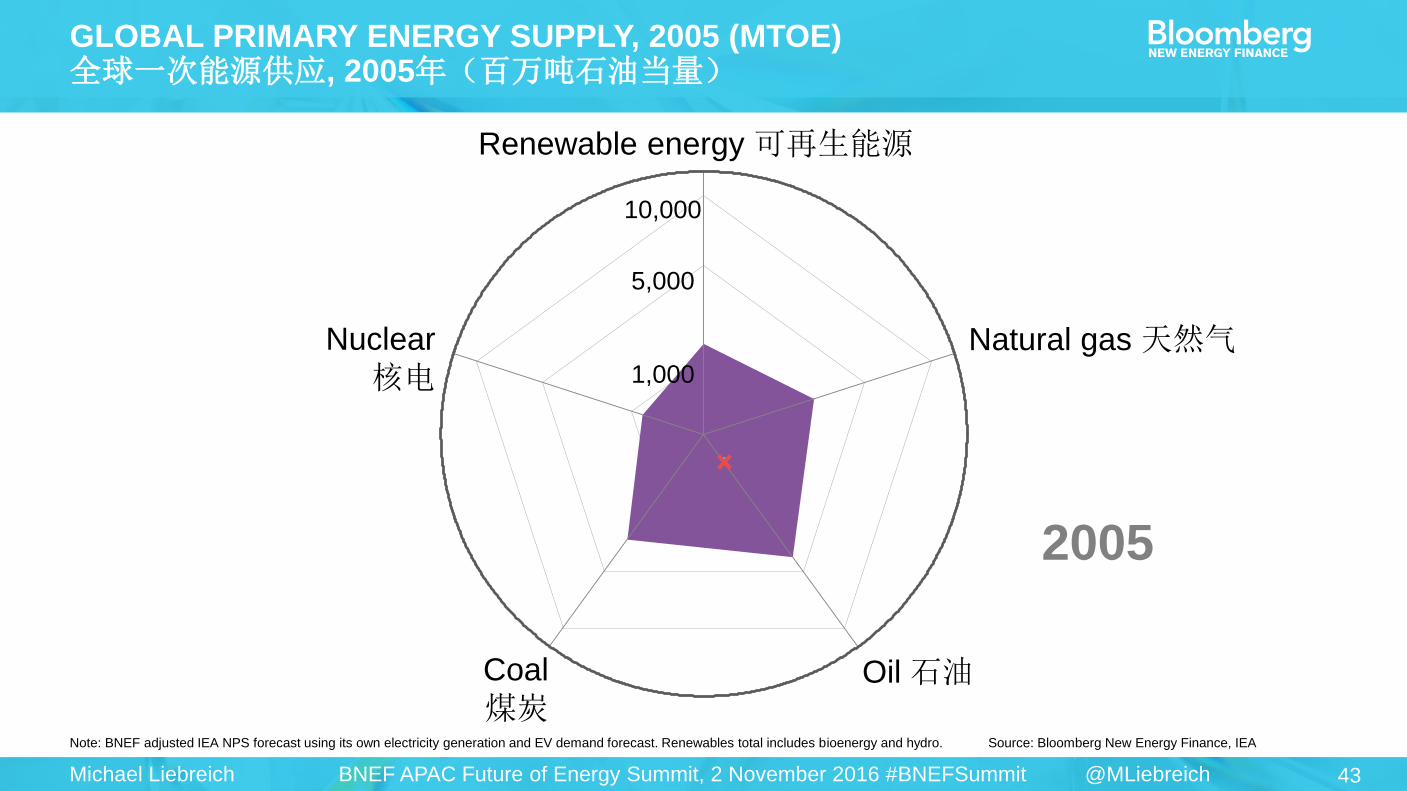
Note: BNEF adjusted IEA NPS forecast using its own electricity generation and EV demand forecast. Renewables total includes bioenergy and hydro. Source: Bloomberg New Energy Finance, IEA
GLOBAL PRIMARY ENERGY SUPPLY, 2005 (MTOE) 全球一次能源供应, 2005年(百万吨石油当量)
10,000
5,000
1,000
2005
Renewable energy 可再生能源
Natural gas 天然气
Oil 石油 Coal
煤炭
Nuclear
核电

44 Michael Liebreich @MLiebreich BNEF APAC Future of Energy Summit, 2 November 2016 #BNEFSummit
Note: BNEF adjusted IEA NPS forecast using its own electricity generation and EV demand forecast. Renewables total includes bioenergy and hydro. Source: Bloomberg New Energy Finance, IEA
GLOBAL PRIMARY ENERGY SUPPLY, 2010 (MTOE) 全球一次能源供应, 2010年(百万吨石油当量)
10,000
5,000
1,000
2010
Renewable energy 可再生能源
Natural gas 天然气
Oil 石油
Nuclear
核电
Coal
煤炭

45 Michael Liebreich @MLiebreich BNEF APAC Future of Energy Summit, 2 November 2016 #BNEFSummit
Note: BNEF adjusted IEA NPS forecast using its own electricity generation and EV demand forecast. Renewables total includes bioenergy and hydro. Source: Bloomberg New Energy Finance, IEA
GLOBAL PRIMARY ENERGY SUPPLY, 2015 (MTOE) 全球一次能源供应, 2015年(百万吨石油当量)
10,000
5,000
1,000
2015
Renewable energy 可再生能源
Natural gas 天然气
Oil 石油
Nuclear
核电
Coal
煤炭
46 Michael Liebreich @MLiebreich BNEF APAC Future of Energy Summit, 2 November 2016 #BNEFSummit
Note: BNEF adjusted IEA NPS forecast using its own electricity generation and EV demand forecast. Renewables total includes bioenergy and hydro. Source: Bloomberg New Energy Finance, IEA
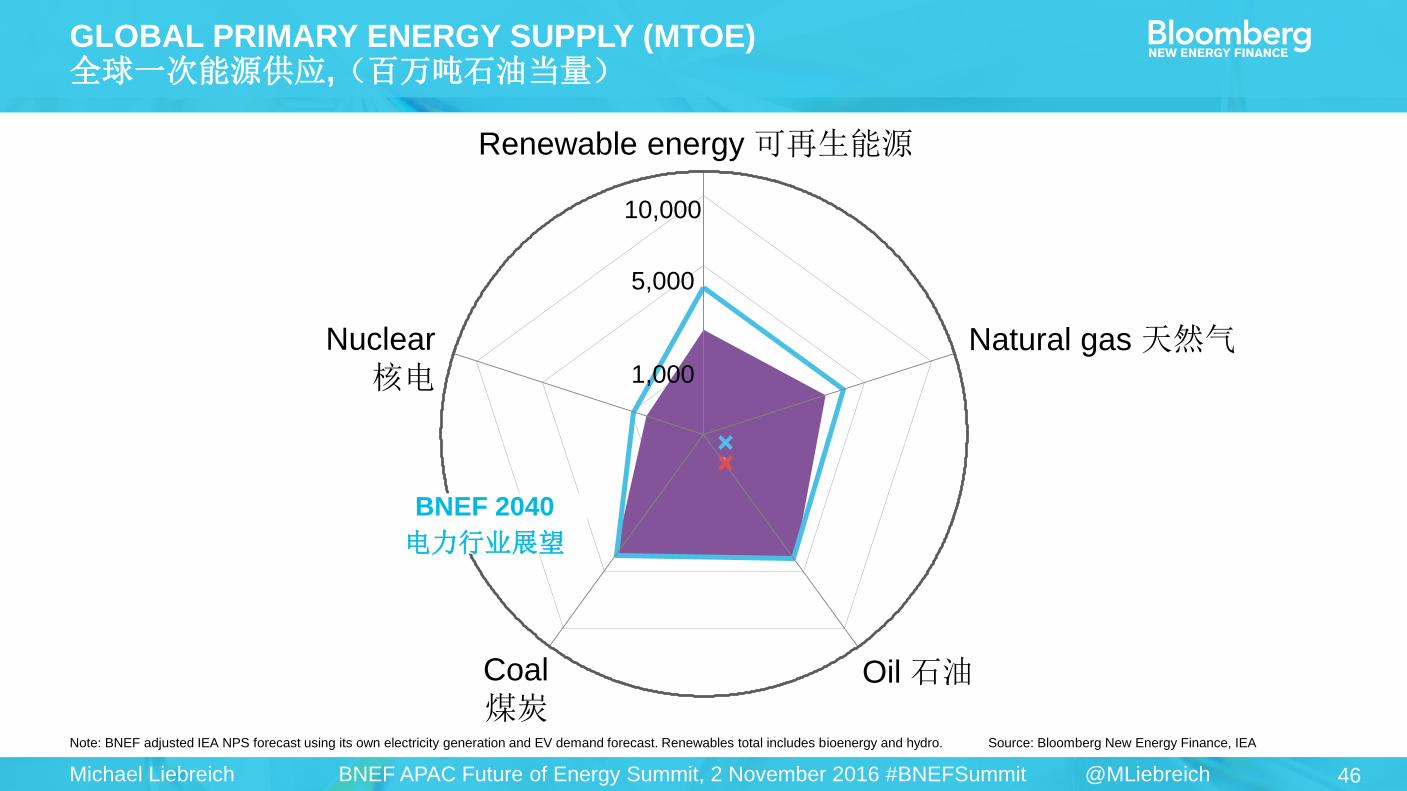
GLOBAL PRIMARY ENERGY SUPPLY (MTOE) 全球一次能源供应,(百万吨石油当量)
10,000
5,000
1,000
2015BNEF 2040
电力行业展望
Renewable energy 可再生能源
Natural gas 天然气
Oil 石油
Nuclear
核电
Coal
煤炭
47 Michael Liebreich @MLiebreich BNEF APAC Future of Energy Summit, 2 November 2016 #BNEFSummit
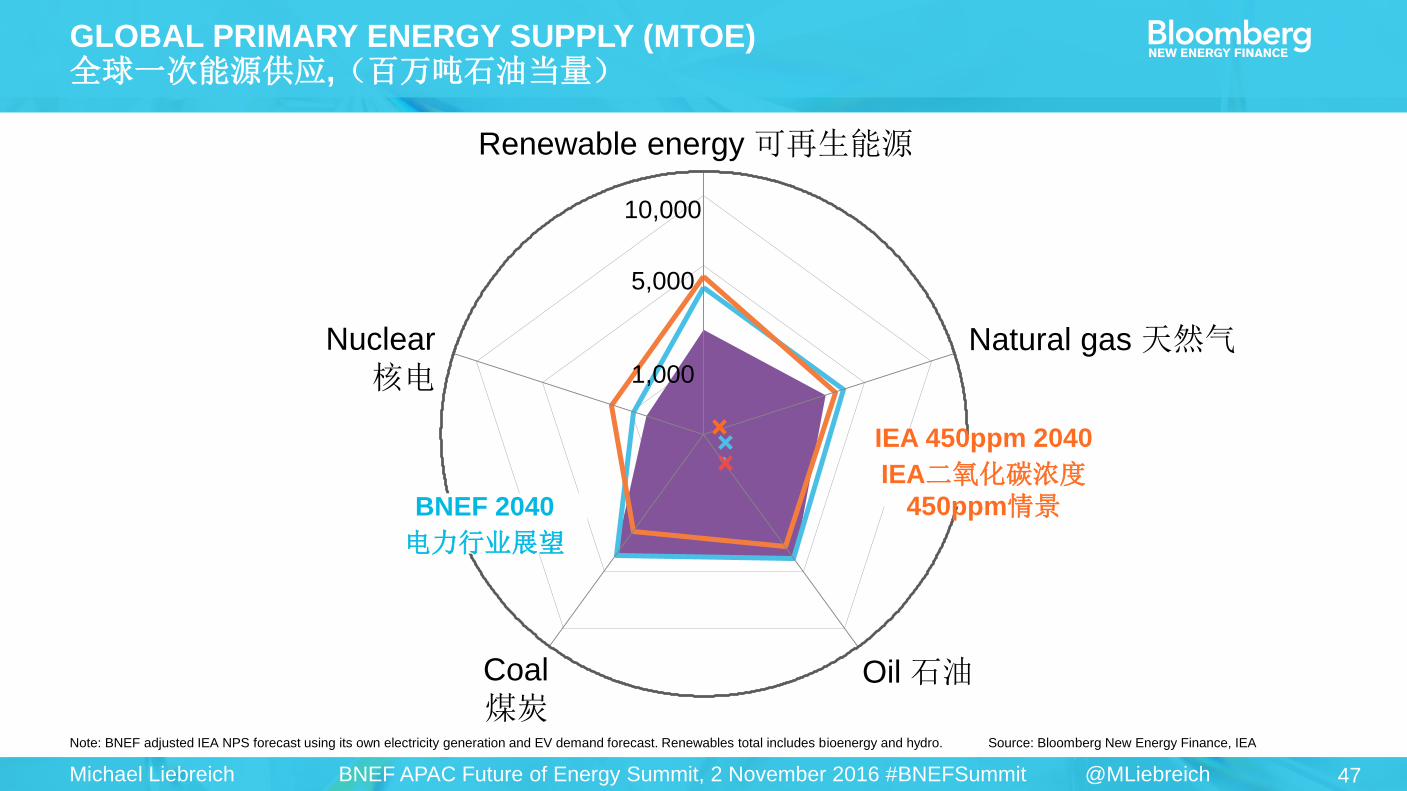
Note: BNEF adjusted IEA NPS forecast using its own electricity generation and EV demand forecast. Renewables total includes bioenergy and hydro. Source: Bloomberg New Energy Finance, IEA
GLOBAL PRIMARY ENERGY SUPPLY (MTOE) 全球一次能源供应,(百万吨石油当量)
10,000
5,000
1,000
2015
Renewable energy 可再生能源
Natural gas 天然气
Oil 石油
Nuclear
核电
IEA 450ppm 2040
IEA二氧化碳浓度450ppm情景 BNEF 2040
电力行业展望
Coal
煤炭
48 Michael Liebreich @MLiebreich BNEF APAC Future of Energy Summit, 2 November 2016 #BNEFSummit
Source: Bloomberg New Energy Finance, IEA
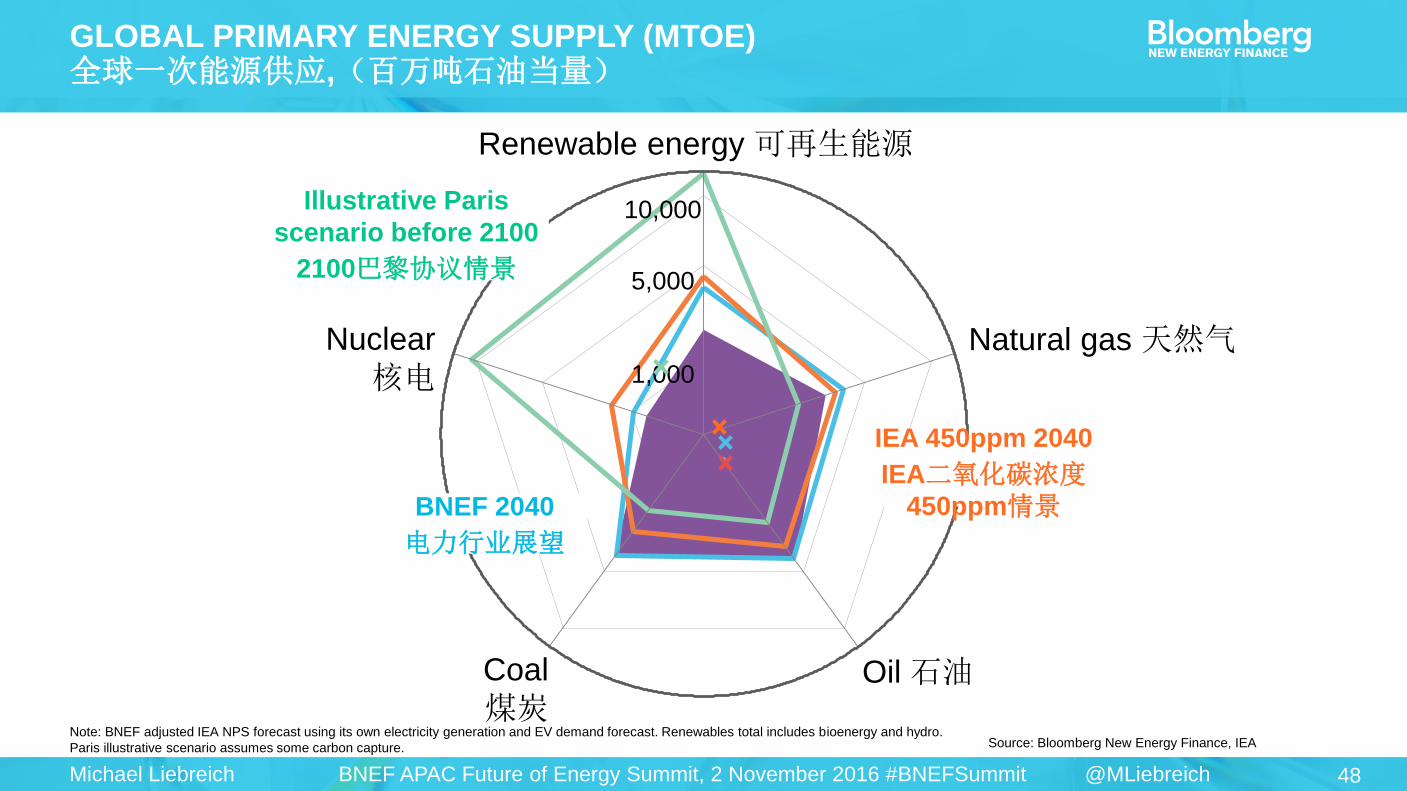
GLOBAL PRIMARY ENERGY SUPPLY (MTOE) 全球一次能源供应,(百万吨石油当量)
10,000
5,000
1,000
2015
IEA 450ppm 2040
IEA二氧化碳浓度450ppm情景
Illustrative Paris
scenario before 2100
2100巴黎协议情景
Note: BNEF adjusted IEA NPS forecast using its own electricity generation and EV demand forecast. Renewables total includes bioenergy and hydro.
Paris illustrative scenario assumes some carbon capture.
Renewable energy 可再生能源
Natural gas 天然气
Oil 石油
Nuclear
核电
BNEF 2040
电力行业展望
Coal
煤炭
49 Michael Liebreich @MLiebreich BNEF APAC Future of Energy Summit, 2 November 2016 #BNEFSummit
SHANGHAI 上海
Image: Dan Spira
Unique analysis, tools and data for decision-makers driving
change in the energy system
MARKETS Renewable Energy
Energy Smart Technologies
Advanced Transport
Gas
Carbon and RECs
SERVICES Americas Service
Asia Pacific Service
EMEA Service
Applied Research
Events and Workshops
Michael Liebreich
Twitter: @mliebreich
迈克尔·利布莱希,BNEF咨询委员会主席
Thanks! 谢谢!