Embed Size (px)
Citation preview
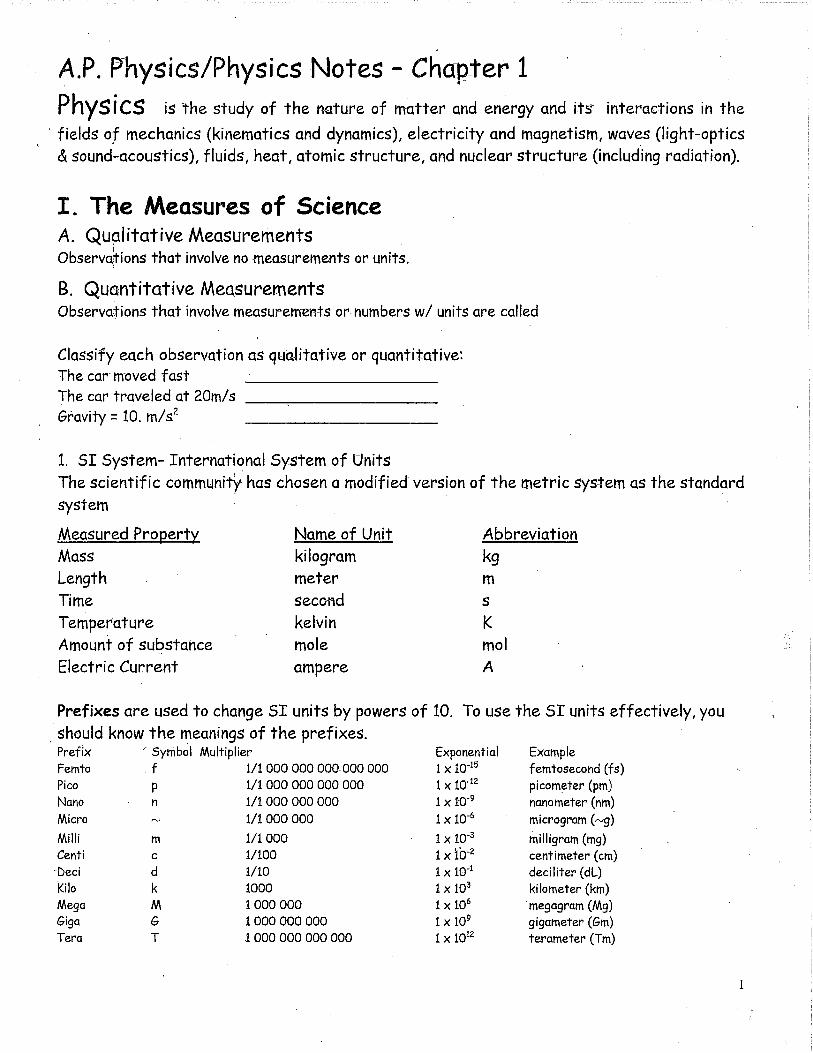
A.P. Physics/Physics Notes - Chapter 1 Physics is the study of the nature of matter and energy and its interactions in the
fields of mechanics (kinematics and dynamics), electricity and magnetism, waves (light-optics (St sound-acoustics), fluids, heat, atomic structure, and nuclear structure (including radiation).
I. The Measures of Science A. Qualitative Measurements Observc6-ions that involve no measurements or units.
B. Quantitative Measurements Observations that involve_measuretnents or numbers w/ units are called
Classify each observation as qualitative or quantitative: The car moved fast The car traveled at 20m/s Gravity = 10. m/s2
1. 51 System- International System of Units
The scientific community has chosen a modified version of the metric system as the standard system
Measured Property
Name of Unit
Abbreviation
Mass
kilogram
kg Length
meter
Time
second Temperature
kelvin
Amount of substance
mole mol
Electric Current
ampere
A
Prefixes are used to change SI units by powers of 10.
should know the meanings of the prefixes.
To use the SI units effectively, you
Prefix Symbol Multiplier Exponential Femto f 1/1 000 000 000 000 000 1 x 10-15 Pico p 1/1 000 000 000 000 1 x 10-12 Nano n 1/1 000 000 000 1 x 10⁻⁹ Micro 1/1 000 000 1 x 10⁻⁶
Milli m 1/1 000 1 x 10⁻³ Centi c 1/100 1 x 10⁻²
-bed d 1/10 1 x 10⁴ Kilo k 1000 1 x 10³ Mega M 1 000 000 1 x 10⁶ Giga G 1 000 000 000 1x10⁹ Tera 1 000 000 000 000 1 x 10¹²
Example femtosecond (fs) picometer (pm) nanometer (nm) microgram (—g)
milligram (mg) centimeter (cm) deciliter (dL) kilometer (km) megagram (Mg) gigameter (Gm) terameter (Tm)
1
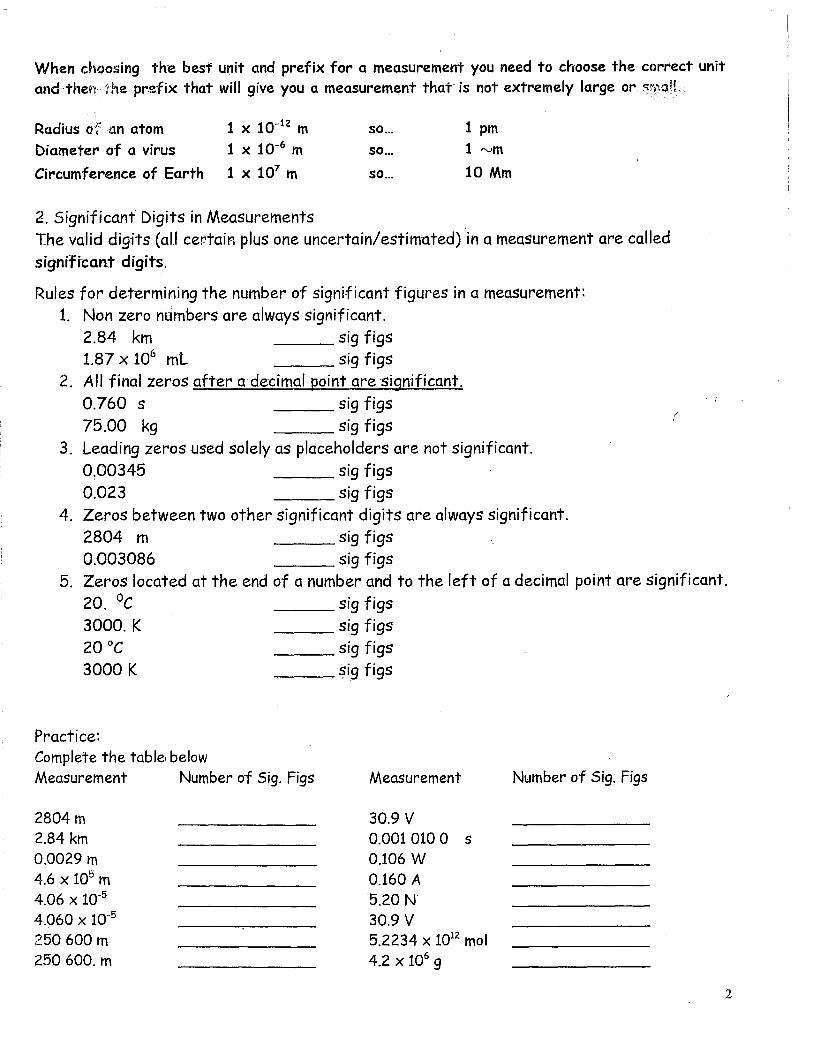
When choosing the best unit and prefix for a measurement you need to choose the correct unit and-then The prefix that will give you a measurement that- is not extremely large or
Radius of an atom 1 x 10-12 in so... 1 pm
biameter of a virus 1 x 10⁻⁶ m so... 1 rs.im
Circumference of Earth 1 x 10⁷ m so... 10 Mm
2. Significant Digits in Measurements The valid digits (all certain plus one uncertain/estimated) in a measurement are called
significant digits.
Rules for determining the number of significant figures in a measurement: 1. Non zero numbers are always significant.
2.84 km sig figs 1.87 x 10⁶ mL sig figs
2. All final zeros after a decimal point are significant.
0.760 s sig figs
75.00 kg sig figs
3. Leading zeros used solely as placeholders are not significant.
0,00345 sig figs
0.023 sig figs
4. Zeros between two other significant digits are always significant.
2804 m sig figs
0.003086 sig figs
5. Zeros located at the end of a number and to the left of a decimal point are significant.
20. °C sig figs
3000. K sig figs
20 °C sig figs
3000 K sig figs
Practice: Complete the table, below Measurement Number of Sig. Figs Measurement Number of Sig. Figs
2804 m 30.9 V 2.84 km 0.001 010 0 s 0.0029 m 0.106 W 4.6 x 10⁵ m 0.160 A 4.06 x10⁻⁵ 5.20 N 4.060 x 10⁻⁵ 30.9 V 250 600 in 5.2234 x 10¹² mol 250 600. m 4.2 x 10⁶ g
2
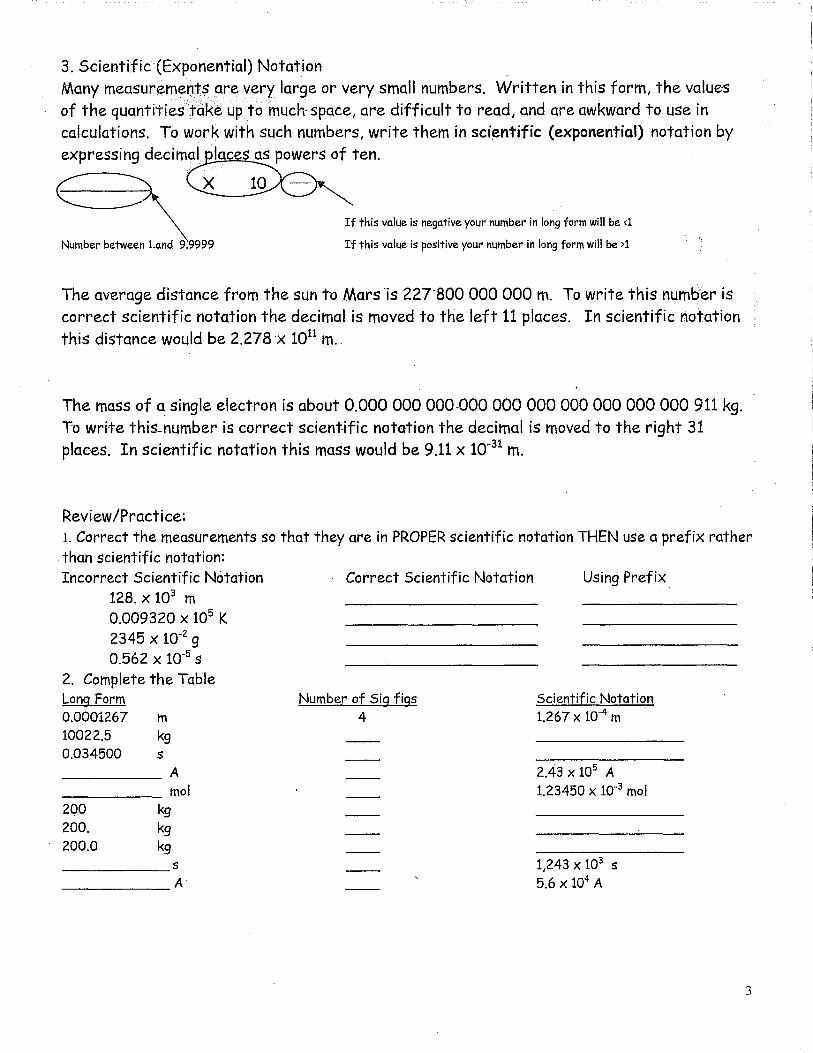
3. Scientific-(Exponential) Notation Many measurements are very large or very small numbers. Written in this form, the values
of the quanti-ties take up to much space, are difficult to read, and are awkward to use in
calculations. To work with such numbers, write them in scientific (exponential) notation by
expressing decimal • laces as powers of ten.
X 10
If this value is negative your number in long form will be <1
Number between Land 9.9999
If this value is positive your number in long form will be >1
The average distance from the sun to Mars is 227-800 000 000 m. To write this number is correct scientific notation the decimal is moved to the left 11 places. In scientific notation
this distance would be 2.278 -x 1011 m.
The mass of a single electron is about 0.000 000 000-000 000 000 000 000 000 000 911 kg. To write this-number is correct scientific notation the decimal is moved to the right 31
places. In scientific notation this mass would be 9.11 x 10⁻³¹ m.
Review/Practice: 1. Correct the measurements so that they are in PROPER scientific notation THEN use a prefix rather than scientific notation: Incorrect Scientific Notation Correct Scientific Notation Using Prefix
128. x 103 m 0.009320 x 10⁵ K 2345 x 10-2 g 0.562 x 10⁻⁵ s
2. Complete the Table Long Form Number of Sig figs Scientific Notation 0.0001267 m 4 1.267 x 10⁴ m 10022.5 kg 0.034500 s A 2.43 x 10⁵ A mol 1.23450 x 10⁻³ mol 200 kg 200. kg 200.0 kg
1,243 x 103 s A 5.6 x 10⁴ A
3
cs-Tr4.ct re...cam te•ki
'XritoErigqr
3. Using the five-rules following table:
Long Form a) 0.004080 g
b) 0.0180 cm c) 3450000 s
d) 0.0000012 m e)
f)
9)
of significant figures, use of scientific notation, and use of prefixes - complete the
#Sig Figures Scientific Notation Unit w/ Prefix
3.3 dm
1. 67 x 10z g
2.33 x 10⁻³ s h)
2.35 ps
4. Place the following measurements in order from smallest to largest 1.0 km, 1.0 Tm, 1.0 cm, 1.0 m, 1.0 nm, 1.0 pm
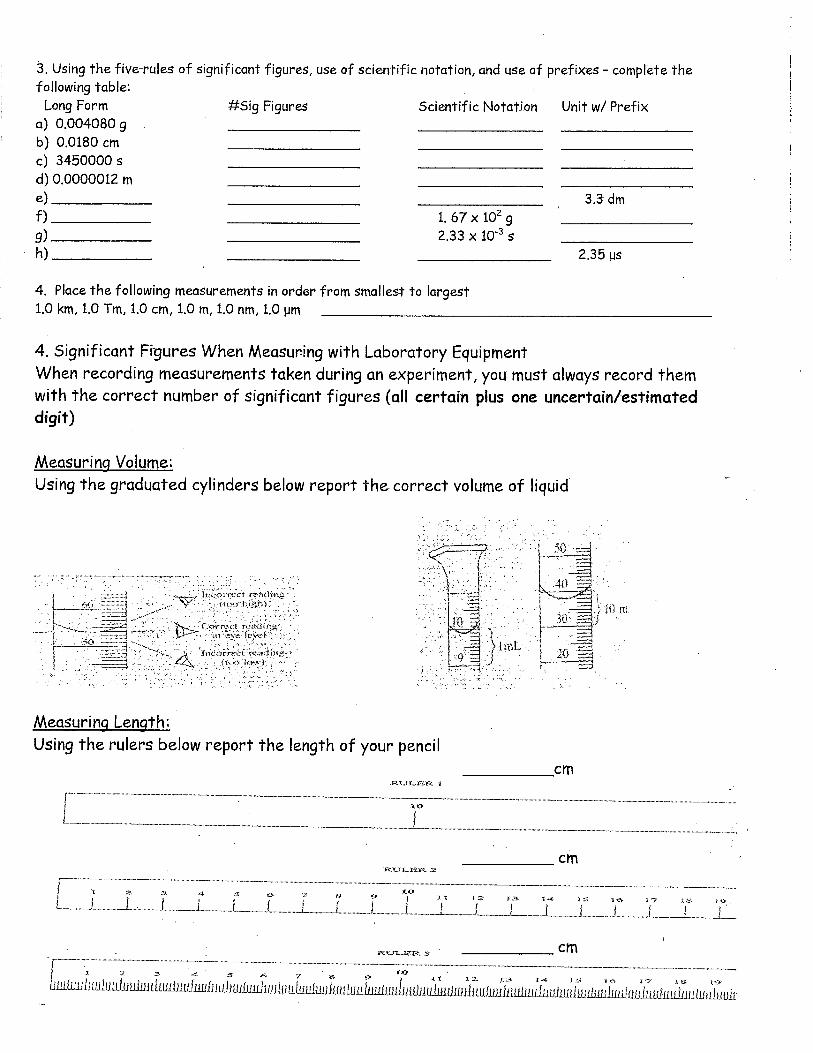
4. Significant Figures When Measuring with Laboratory Equipment When recording measurements taken during an experiment, you must always record them with the correct number of significant figures (all certain plus one uncertain/estimated digit)
Measuring Volume:
Using the graduated cylinders below report the correct volume of liquid
Measuring Length: Using the rulers below report the length of your pencil
.(43-11-...11.31zt I
T
.2 3
fillanninglii111111/111M111/111WhillInniftitiunimilittlintilun
3 CM
11111iftfinififnitilf iftlthajbliliilnit
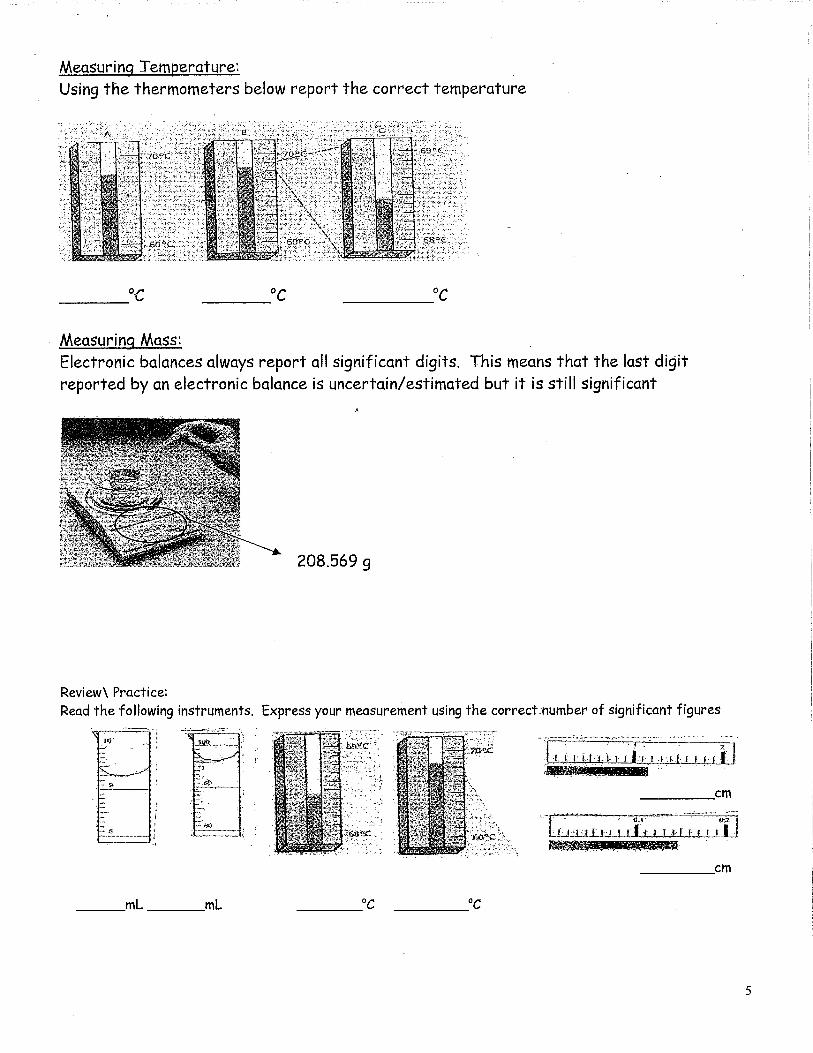
Measuring Temperature: Using the thermometers below report the correct temperature
Measuring Mass: Electronic balances always report all significant digits. This means that the last digit reported by an electronic balance is uncertain/estimated but it is still significant
208.569
Review\ Practice: Read the following instruments. Express your measurement using the correct number of significant figures
i:. ta• 1•4'.1.11 I 1.f
cm
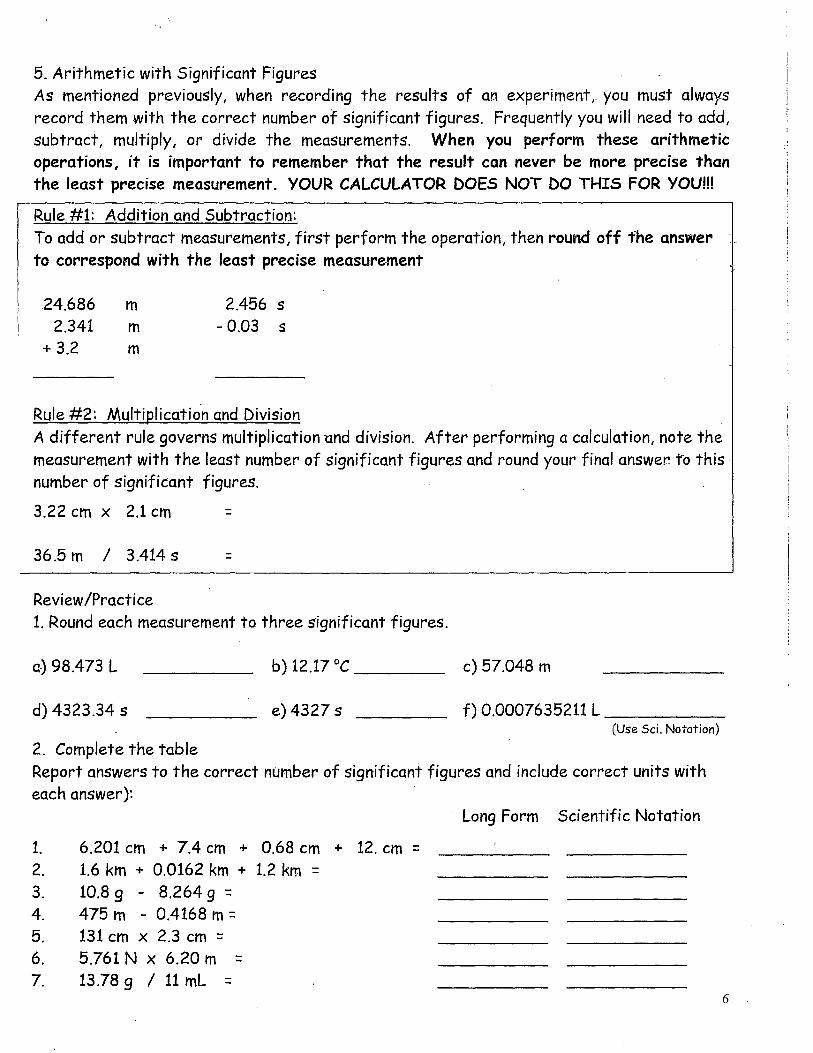
Rule #1: Addition and Subtraction:
To add or subtract measurements, first perform the operation, then round off the answer to correspond with the least precise measurement
24.686 m 2.341 m
+3.2
2.456 s -0.03 s
Rule #2: Multiplication and Division
A different rule governs multiplication ond division. After performing a calculation, note the measurement with the least number of significant figures and round your final answer to this • number of significant figures.
3.22 cm x 2.1 cm
36.5m / 3.414s
5. Arithmetic with Significant Figures As mentioned previously, when recording the results of an experiment, you must always record them with the correct number of significant figures. Frequently you will need to add, subtract, multiply, or divide the measurements. When you perform these arithmetic operations, it is important to remember that the result can never be more precise than the least precise measurement. YOUR CALCULATOR DOES NOT DO THIS FOR YOUIll
Review/Practice 1. Round each measurement to three significant figures.
a) 98.473 L b) 12.17 °C c) 57.048 m
d) 4323.34s e) 4327 s f).0.0007635211 L (Use 5ci. Notation)
2. Complete the table Report answers to the correct number of significant figures and include correct units with each answer):
Long Form Scientific Notation
1. 6.201 cm + 7.4 cm + 0.68 cm + 12. cm = 2. 1.6 km + 0.0162 km + 1.2 km = 3. 10.8 g - 8.264 g = 4. 475m - 0.4168m = 5. 131 cm x 2.3 cm = 6. 5.761N x 6.20m = 7. 1318 / 11 mL =
6
B. 3.1416 cm / 12.4 s =
9. (1:68) ( 23.56 - 2.3) =
1.248-x 103
10. (6.2 x 10¹⁸ m) ( 4.7 x 10⁻¹° m) 11. (6.5 x 10⁵ kg) / (3.4 x 10³ m3)
12. The following -operations were completed_on a calculator. The answer the calculator
provided is provided for you. Please round the provided answer to the correct number of
significant figures with the correct units. Rounded to
Calculator Answer Correct num. of SF's
a) 3.46 cm + 104.5 cm + 0.346 cm
-b) 2.384g - 1.5 g
c) 9.40 mm x 2.6 mm- d) 1.50g / 2 cm3
e) 21.50 9/(4.06cm x 1.8 cm X 0.905cm) =
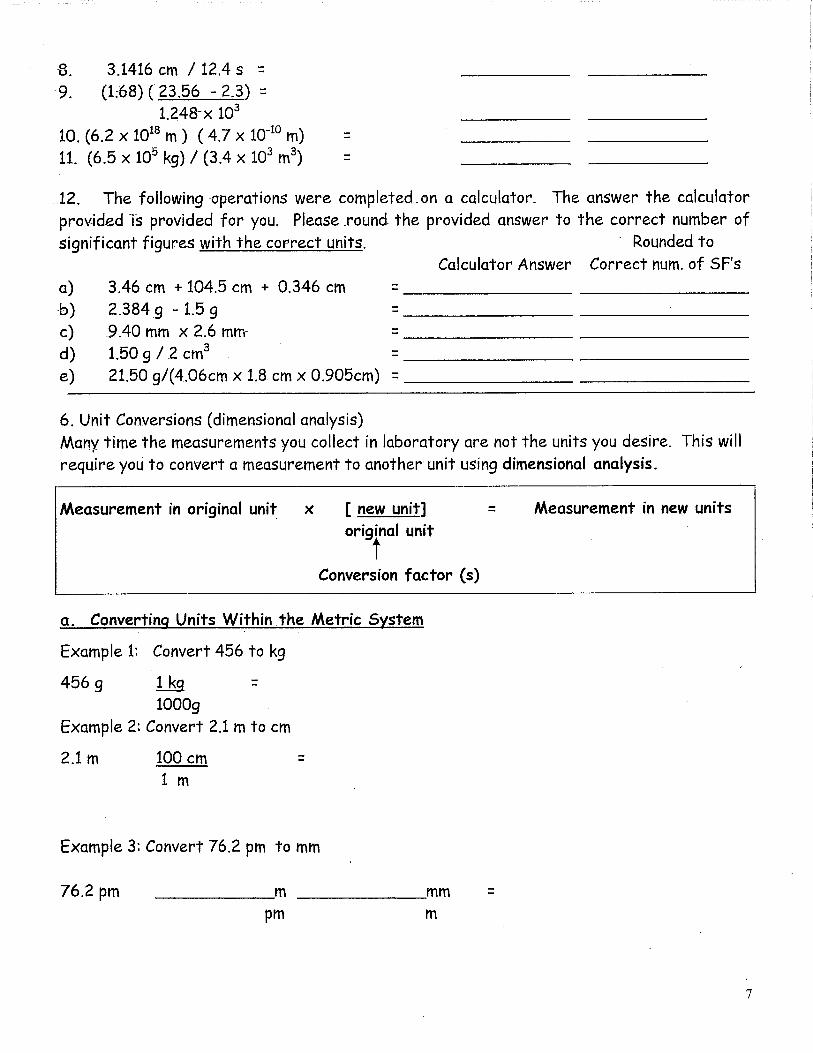
6. Unit Conversions (dimensional analysis)
Many time the measurements you collect in laboratory are not the units you desire. This will
require you to convert a measurement to another-unit using dimensional analysis.
Measurement in original unit x [ new unit] = Measurement in new units original unit
t Conversion factor (s)
a. Converting Units Within the Metric System
Example 1: Convert 456 to kg
456g 1 kq 10009
Example 2: Convert 2.1 m to cm
2.1 m
100 cm lm
Example 3: Convert 76.2 pm to mm
76.2 pm m mm
Pm
7
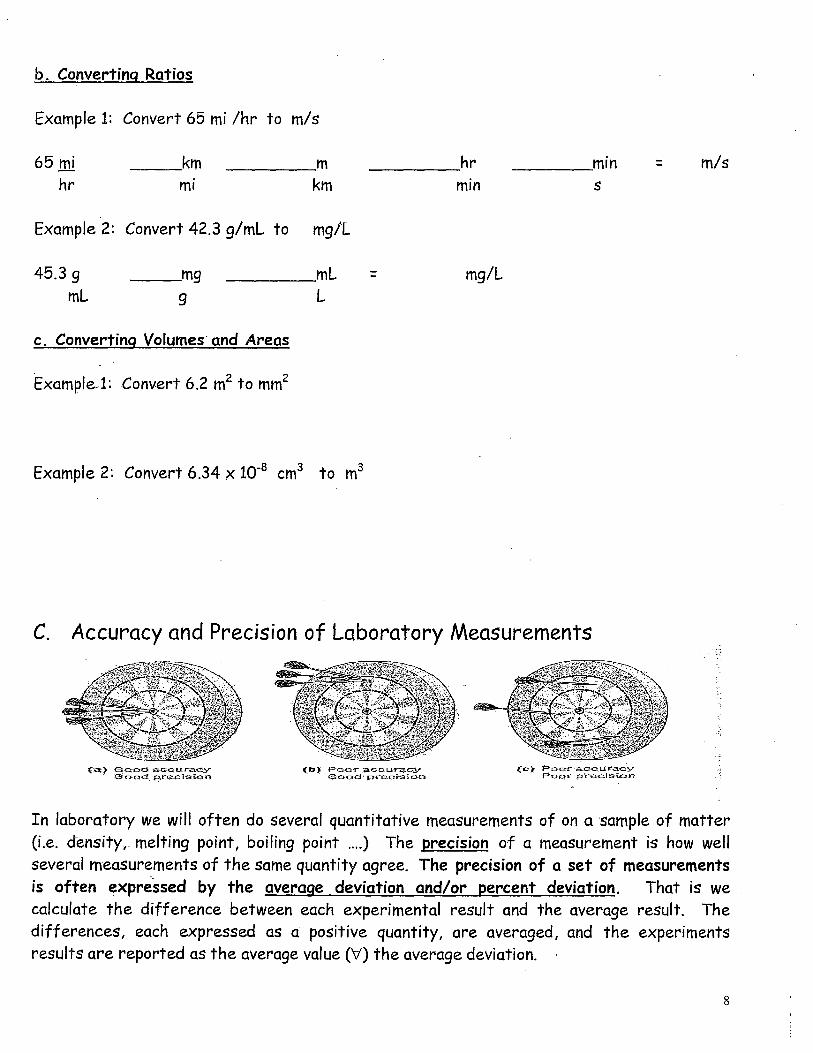
b. Converting Ratios
Example 1: Convert 65 ml /hr to m/s
6S ml km m hr min m/s
hr ml km min
Example 2: Convert 42.3 g/mL to mg/L
45.3 g
mL
mg
9
mL = mg/L
c. Converting Volumes and Areas
Example 1: Convert 6.2 m2 to mm2
Example 2: Convert 6.34 x 10⁻⁸ cm3 to m3
C. Accuracy and Precision of Laboratory Measurements
cricoc OGU a,crcl, .r41-ac €c;
kb) Ptackr oowa GCTID.Ci precision Plz!.,Qr p
In laboratory we will often do several quantitative measurements of on a sample of matter (i.e. density, melting point, boiling point ....) The precision of a measurement is how well several measurements of the same quantity agree. The precision of a set of measurements is often expressed by the average deviation and/or percent deviation. That is we calculate the difference between each experimental result and the average result. The
differences, each expressed as a positive quantity, are averaged, and the experiments results are reported as the average value (V) the average deviation.
8
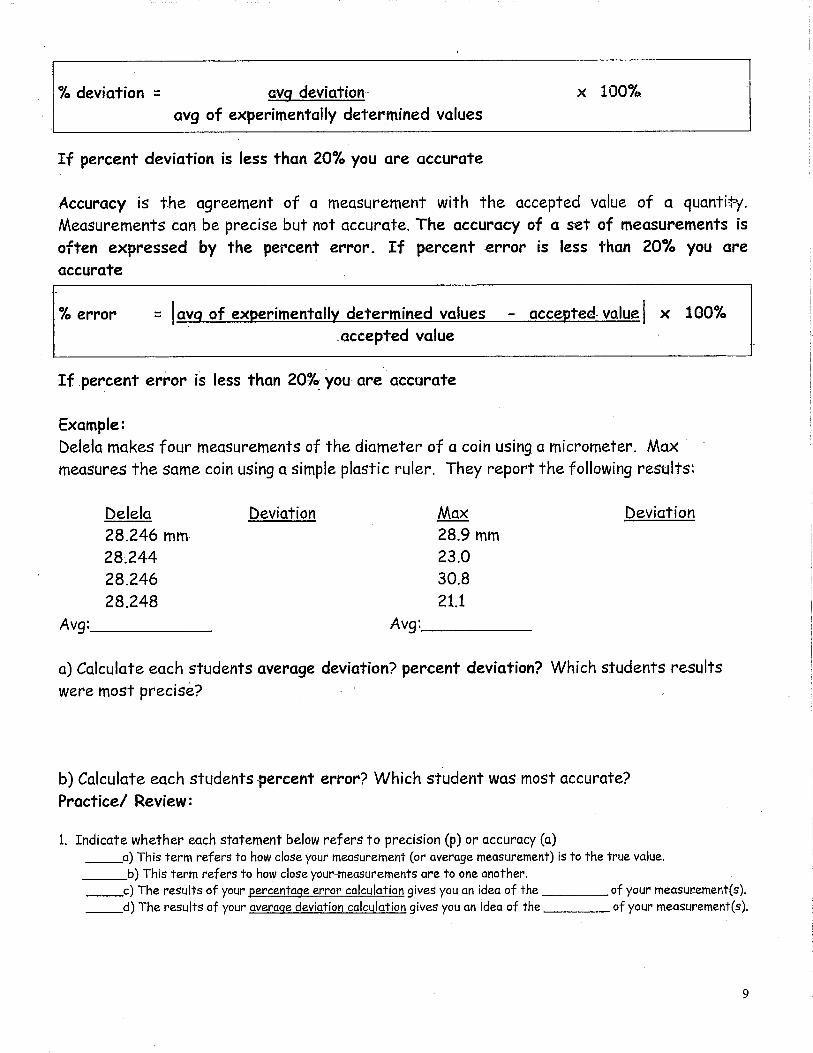
% deviation = avg deviation- x 100%
avg of experimentally determined values
If percent deviation is less than 20% you are accurate
Accuracy is the agreement of a measurement with the accepted value of a quantity.
Measurements can be precise but not accurate. The accuracy of a set of measurements is often expressed by the percent error. If percent error is less than 20% you are accurate
% error = I avg of experimentally determined values - accepted- value x 100% accepted value
If percent error is less than 20% you are accurate
Example: Delela makes four measurements of the diameter of a coin using a micrometer. Max measures the same coin using a simple plastic ruler. They report the following results:
Delela
Deviation
Max
Deviation
28.246 mm 28.9 mm
28.244 23.0
28.246 30.8
28.248 21.1
Avg: Avg:
a) Calculate each students average deviation? percent deviation? Which students results
were most precise?
b) Calculate each students percent error? Which student was most accurate?
Practice/ Review:
1. Indicate whether each statement below refers to precision (p) or accuracy (a) a) This term refers to how close your measurement (or average measurement) is to the true value. b) This term refers to how close your-measurements are to one another. c) The results of your percenta_ge error calculation gives you an idea of the of your measurement(s). d) The results of your average deviation calculation gives you an idea of the of your measurement(s).
9
trw IT
!ig:Nrs,„ -E,,g;z44.;•igw7
41.
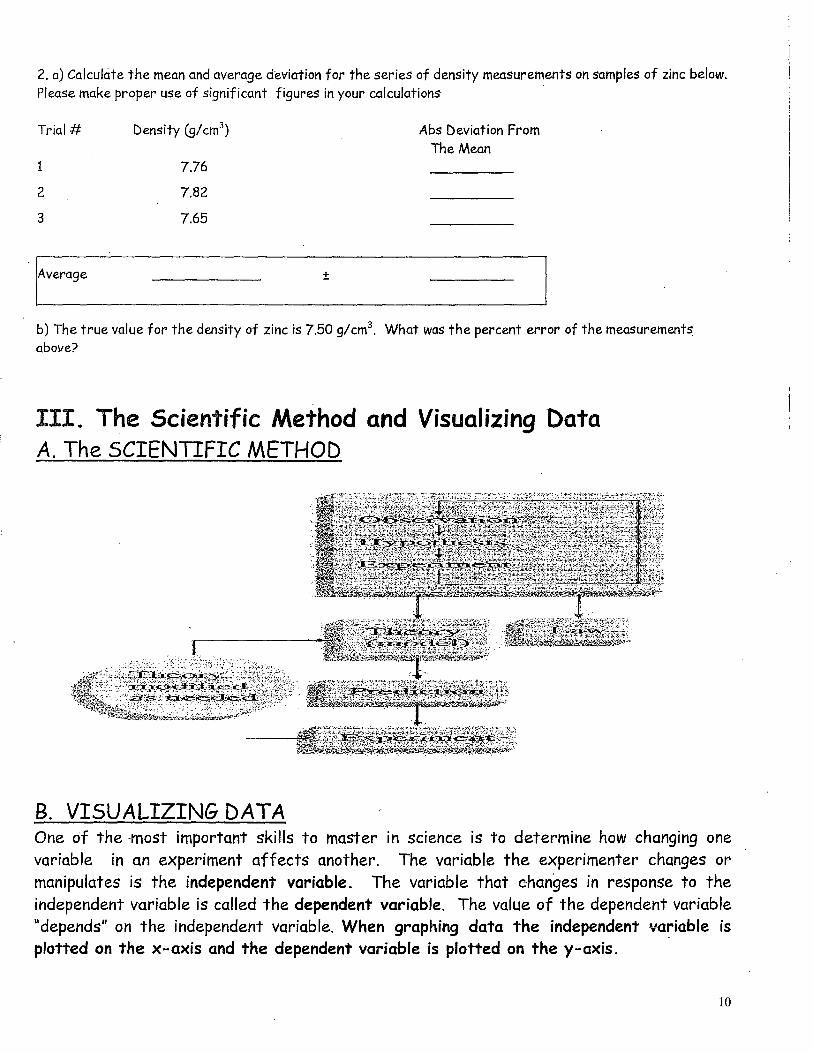
2. a) Calculate the mean and average deviation for the series of density measurements on samples of zinc below. Please make proper use of significant figures in your calculations
Trial # Density (g/cm3) Abs Deviation From The Mean
1 7.76
7.82
7.65
2
3
Average
b) The true value for the density of zinc is 7.50 9/cm3. What was the percent error of the measurements above?
III. The Scientific Method and Visualizing Data A. The SCIENTIFIC METHOD
B. VISUALIZING DATA One of the most important skills to master in science is to determine how changing one variable in an experiment affects another. The variable the experimenter changes or manipulates is the independent variable. The variable that changes in response to the independent variable is called the dependent variable. The value of the dependent variable "depends" on the independent variable. When graphing data the independent variable is
plotted on the x-axis and the dependent variable is plotted on the y-axis.
10
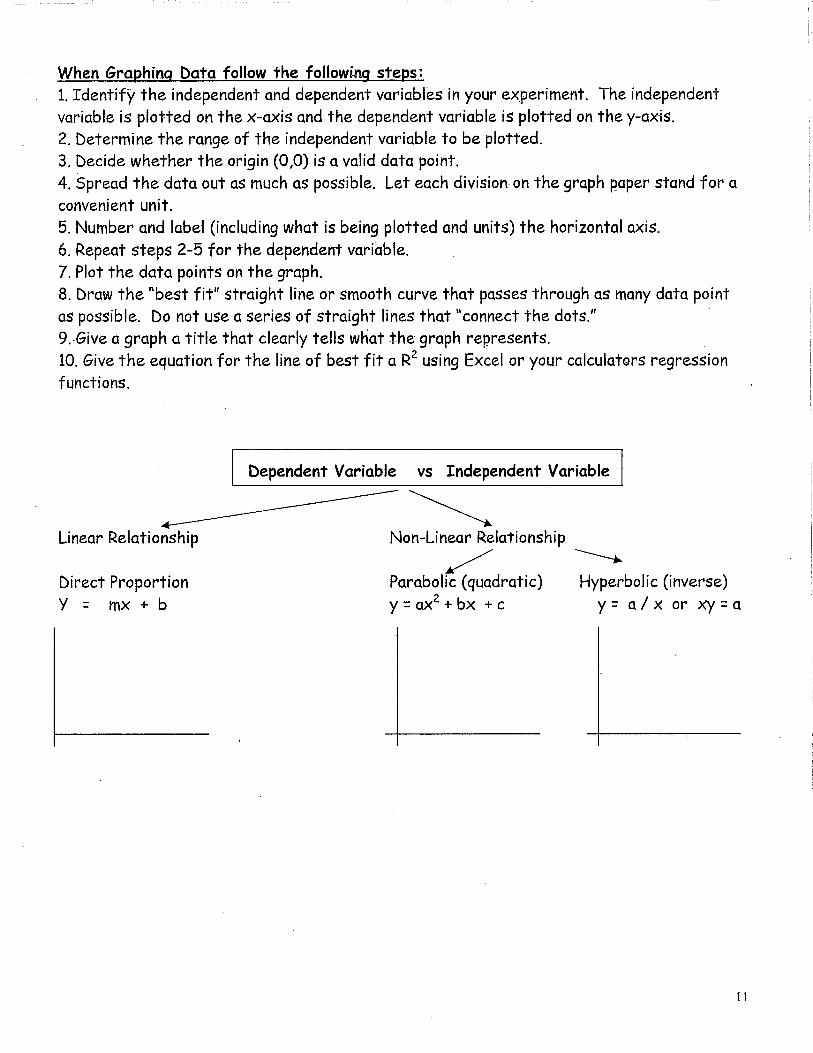
When Graphing Data follow the following steps: 1. Identify the independent and dependent variables in your experiment. The independent variable is plotted on the x-axis and the dependent variable is plotted on the y-axis. 2. Determine the range of the independent variable to be plotted. 3. Decide whether the origin (0,0) is a valid data point. 4. Spread the data out as much as possible. Let each division-on the graph paper stand for a convenient unit. 5. Number and label (including what is being plotted and units) the horizontal axis. 6. Repeat steps 2-5 for the dependent variable. 7. Plot the data points on the graph. 8. Draw the "best fit" straight line or smooth curve that passes through as many data point as possible. Do not use a-series of straight lines that "connect the dots." 9.-Give a graph a title that clearly tells what the graph represents. 10. Give the equation for the line of best fit a R2 using Excel or your calculators regression functions.
Dependent Variable vs Independent Variable
Linear Relationship
Non-Linear Relationship
Direct Proportion
Parabolic (quadratic) Hyperbolic (inverse)
Y = mx + b
y = ax2 + bx +c y = a / x or xy = a
11
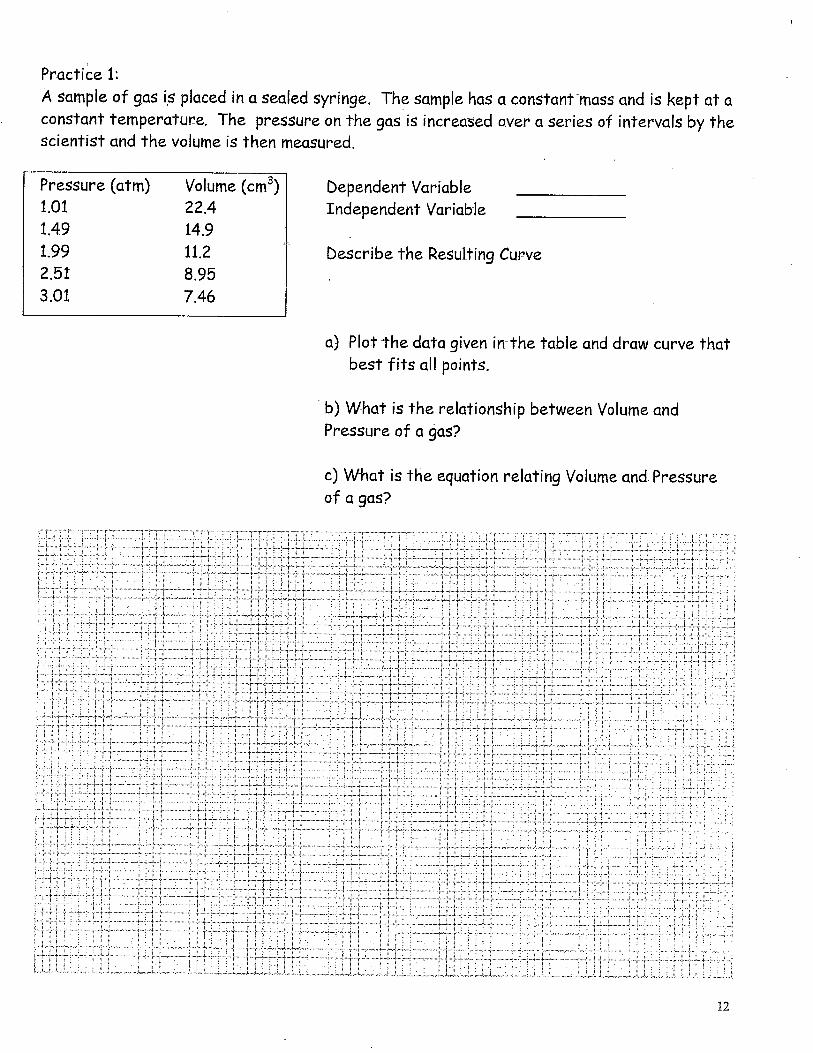
Practice 1: A sample of gas is placed in a sealed syringe. The sample has a constant mass and is kept at a constant temperature. The pressure on the gas is increased over a series of intervals by the scientist and the volume is then measured.
Pressure atm Volume 1.01 22.4 1.49 14.9 1.99 11.2 2.51 8.95 3.01 7.46
Dependent Variable Independent Variable
Describe the Resulting Curve
Plot the data given in the table and draw curve that best fits all points.
b) What is the relationship between Volume and Pressure of a gas?
c) What is the equation relating Volume and Pressure of a gas?
–,-- . .
--1".” • i .. : ..
— :: i .. 1
. :
. . ;
2 ——r— -T—i . ...1 U.-
4-1-: r ,...1
- i. 1 Iii . 1• i . i ,.
. , 1 2,,..,
....... _ _ - tv- rr _.
..... t1 • 1
. ___.... ._ " 1
, .. _
. • i . ' ... - r
. ...... .. -,--
_ - -
—
, ...... -...
-- • ....
t • — 4.L4:
ii4 . • _i_. L1_ J
.. 1 . . .. ... ,
. . . . . . .
, , , t . . .
I. I WM
..
.i:— —1
.
*-4
!"
J. -ij,--1—.-1--
i'
— . - ..: . . :
. rL
L .. . I. ..... . . ..... 1 Tr. . . : : • . , : I • •
.
. i; .. f 1
I
. ' ... • • _,.
. • • • • • -1-''' 1 ..... i.. • ... .. , .. ...
t : . .
,...L —. .. s
.....
-I -
1 • ,..3— a—.
I
—1 . "" •
.
1----i.7:—.i. — ..... , ... ,. L —
. ..... ..... . '
. .'' : ri .'L.1
, •
i- -;
..,_
vfTi _
_ . .
4—
--, 0, —
..... • - • -
.... . . • •
—rj ri --..
..... ... .... .. i.., .. : .. —
.ri I
: .. • ..
— i. T . •
,
,.. . , .— • . 0. ! ,. ,
..
: .1.1 .... 1 .._.. ,.... -A a—.
12
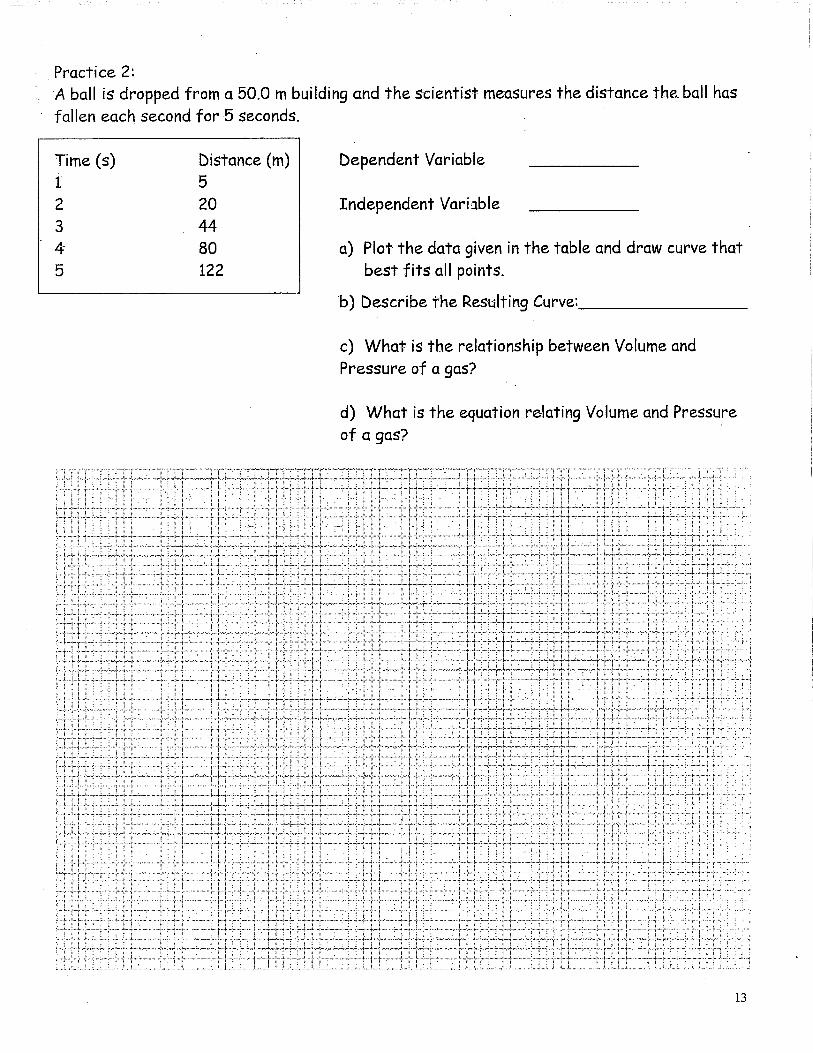
Practice 2:
A ball is dropped from a 50.0 m building and the scientist measures the distance the ball has
fallen each second for 5 seconds.
Dependent Variable
Independent Variable
a) Plot the data given in the table and draw curve that best fits all points.
b) Describe the Resulting Curve:
Time (s) 1
Distance (m) 5 20 44
80 122
c) What is the relationship between Volume and
Pressure of a gas?
d) What is the equation relating Volume and Pressure
of a gas?
1 3-
iLL 1
. - 1 : - IL
.. t, I . -!- i
1--c-i-,....• , -r - ......t. 1-7'. ri
• i.1
: CI; . .. I
1-... ...... : .. ..
: . . •• . . •
•• •
• ..1..... ..L. i ..... ,
1-- . , - . 1. .
F't 41. . .
Ti1
'I I .. I
I
Wii .T.:".• I.-L...L.
• 4...i...
I } • j • • . I [
.
.1
:
. I.....
1.... .
I i I
.".".1
t
" - -••• T I 1
.
- .....:r h 4-717 A
xi 1 .--.0
3. 7 i
I 1 .,..
I . : .. .
I ftIi I
Elin i r---. . -r -
- . „..1 . 1 ....
' :. !• . . '
1
..I...- • .
. ; . 11' :
... . .
. . -_
..
• -...•
1
1- :' . .
_
• ,--: .
! _ . 1
. . 1
1 i : . . . .. . .
1..._.... ....._ ..... 4
, I
• .I. - -..
1 . -
• .....
.. • --
. . -
,.
. . : •:- I
. .....
...
: : •
rfl I t ..... i .
.....
-.
. :- •••• 4
J . ..
...
i •
: i
•
•--1
I r•-i-i-r
— • .
..
% i
.. . : :
—I-J JJ J 2 1
J .—
i
.............. 1
. :
13
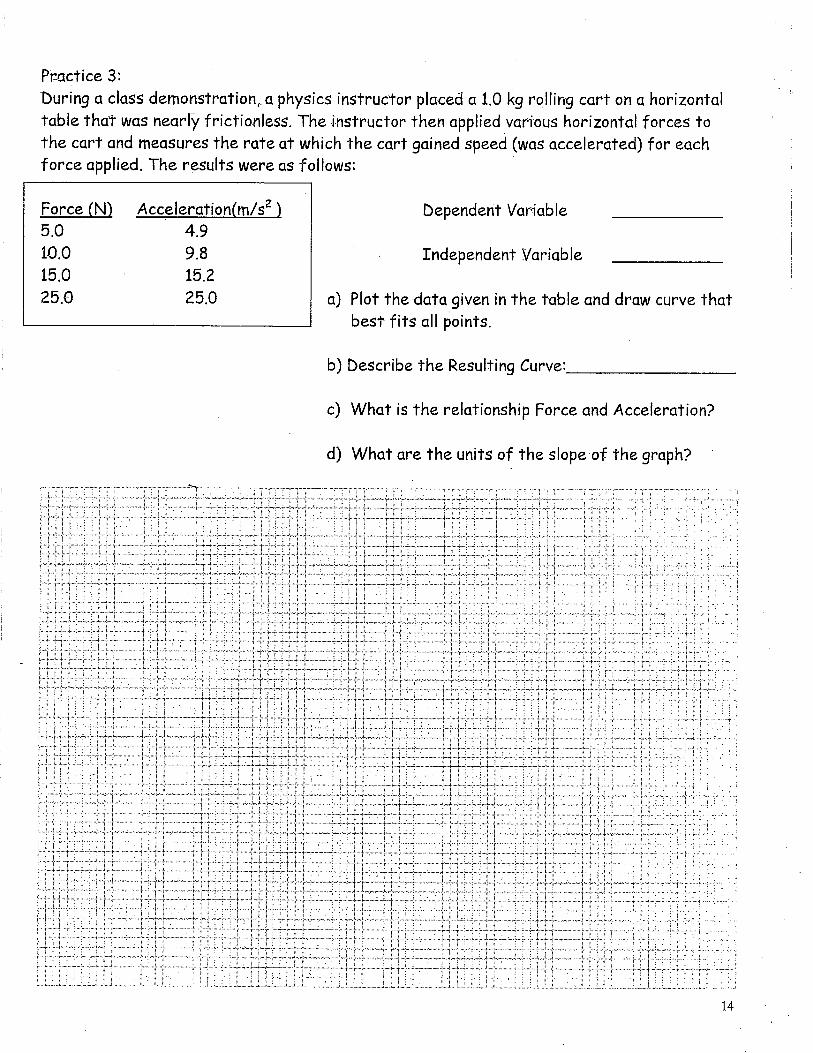
Practice 3:
During a class demonstration, a physics instructor placed a 1.0 kg rolling cart on a horizontal table that was nearly frictionless. The instructor then applied various horizontal forces to the cart and measures the rate at which the cart gained speed (was accelerated) for each force applied. The results were as follows:
Force (N) Acceleration(m/s 5.0 4.9 10.0 9.8 15.0 15.2 25.0 25.0
Dependent Variable
Independent Variable
Plot the data given in the table and draw curve that best fits all points.
b) Describe the Resulting Curve:
c) What is the relationship Force and Acceleration?
d) What are the units of the slope of the graph?
i- -, --;. ;
, I.. I
.. .
•,-- ,
1
-1. - •••1 '11 ' l'.• n i 1
't "4- -+
. . •-•-•i- 4 -:-•::--' I :
•
- -:.-:_ .,. _r. i I.
1 ', I t , I 1 -
41 . ..... . .. : ......... r—t ..,.
,
—1.74,
i L
„..... _ J .s.: . ..
'....-...; :
t --t.
i
I J-1 ...4....
r _. - I
I. t I I 1 i---1
' :
I ,
- 1 ..4
'.....h..1 .1... • , .,
.....I
i I !
: -1- 1
.
i 4 r
I . ...4
L
. Fft Li ,
,
• t • I
t
:
,....- . . f
r _ . i
i
: .—
•: •r-i• . ' 1 I_ . . 1 •
; t .
• .. i'.
: : • : :
. . ., . ._.. . . i .. : .. .
: .. ...... .
I
., j if . • -1-'
. t . f a ....4.... ..
• C ... •r- 1 .
..,.. I : ' ' i .,:: :.• :
I . T :
•-• 1 ,..._ .......-
.
, • •I
r I t- - r "I 1
'1Ii .., -t...i ..l_t_f_ . • i _EL. Jjj .
— i
1 1
14