Embed Size (px)
Citation preview
Given a choice between two theories, take the one that is funnier. -- Blore's Razor
AP Biology Summer Assignment
Welcome to AP Biology! The two main goals of AP Biology are to help you develop a conceptual framework for modern biology and to gain a deeper appreciation of science as a process. Because of the rapid pace of discovery in the life sciences, we have to start early, and our primary emphasis is on developing an understanding of unifying concepts that connect the major topics of biology. The AP Biology Curriculum centers around the four Big Ideas and you will need to not only know these but also understand how they all relate: - Big Idea 1: The process of evolution drives the diversity and unity of life. - Big Idea 2: Biological systems utilize free energy and molecular building blocks to grow, to
reproduce and to maintain dynamic homeostasis. - Big Idea 3: Living systems store, retrieve, transmit and respond to information essential to life
processes. - Big Idea 4: Biological systems interact, and these systems and their interactions possess
complex properties. (see college board site for details of an AP biology course: https://apstudent.collegeboard.org/apcourse/ap-biology)
What to do before the first day of school: 1. AP Biology was designed by a select group of college professors and high school science teachers to be
equivalent to an introductory college biology course. Visit the below College Board site to explore what an AP Biology course is like, or watch the attached video links to get an idea of the course. (Get to know either Bozeman science or Crash Course biology videos, as they are a great study tool and both on YouTube):
• https://paul-andersen.squarespace.com/biology • http://www.bozemanscience.com/ap-biology/ • https://apstudent.collegeboard.org/exploreap?affiliateId=apcentral&bannerId=exploreap1
2. Mader’s Biology textbook reading and “reviewing this chapter” questions: Get use to your textbook, you will be using it a lot. You will be reviewing some science basics in Ch 1, as well as reviewing ecology in Ch 44 and 45.
o Read Chapter 1 in Mader Biology book, answer “reviewing this chapter” questions #1-13 on pg 18 (the short answer Qs, NOT the multiple choice questions) Answers must be handwritten
o Read Chapter 44 in Mader Biology book, answer “reviewing this chapter questions #1-10 on page 837
o Read Chapter 45 in Mader Biology book, answer “reviewing this chapter” questions #1-11 on pg. 863
3. Science Skills Review Packet: Because it is assumed that you have basic biology and chemistry knowledge before starting AP biology, this packet will help you review some of those skills. Interpreting and graphing data is a key skill. Vocabulary in this course can be a stumbling block, you need to take some time to review the scientific Latin/Greek roots that form many of our scientific terms.
4. Cricket lab: Lab work is a big part of this course. Your first lab will be an online simulation to help you review the scientific method and learn to write a detailed lab report. Please use both the “Cricket Lab Report Directions” and the “Scientific Method Lab Report rubric” to create a lab report write up on the experiment. Have a completed, printed, first draft in class the first day.
• http://webapp.gccaz.edu/academic/biology/scientific_method/ • must be typed and printed
5. Safety Contract: Read and sign the student safety contract. Have a parent or guardian sign as well.
6. (Highly suggested but not mandatory) If you can, purchase a copy of an AP biology study book. Good
study books include Princeton Review Cracking the AP Biology Exam, Barron’s AP Biology, CliffNotes AP Biology and 5 Steps to a 5 by Mark Anestis (Amazon or your local book store). It must be a 2015 or NEWER addition because the course was redesigned recently.
I truly am looking forward to working with you next year! Don’t procrastinate on this assignment but don’t let it keep you from having a wonderful summer!!!
Name: ___________________
2
Science Skills Review Packet This is a review of basic science skills, including graphing, chemistry and biology– we will not spend mush class time on all these concepts, as they should have been learned already. Please make sure that you know them and if not, be sure to study through them. Please hand write in pencil or pen. Chemistry Review: 1. Compare and contrast the term element with compound.
2. Know the symbols of the following elements and their charge: a. Carbon:
b. Hydrogen:
c. Oxygen:
d. Nitrogen:
e. Phosphorus:
f. Sulfur:
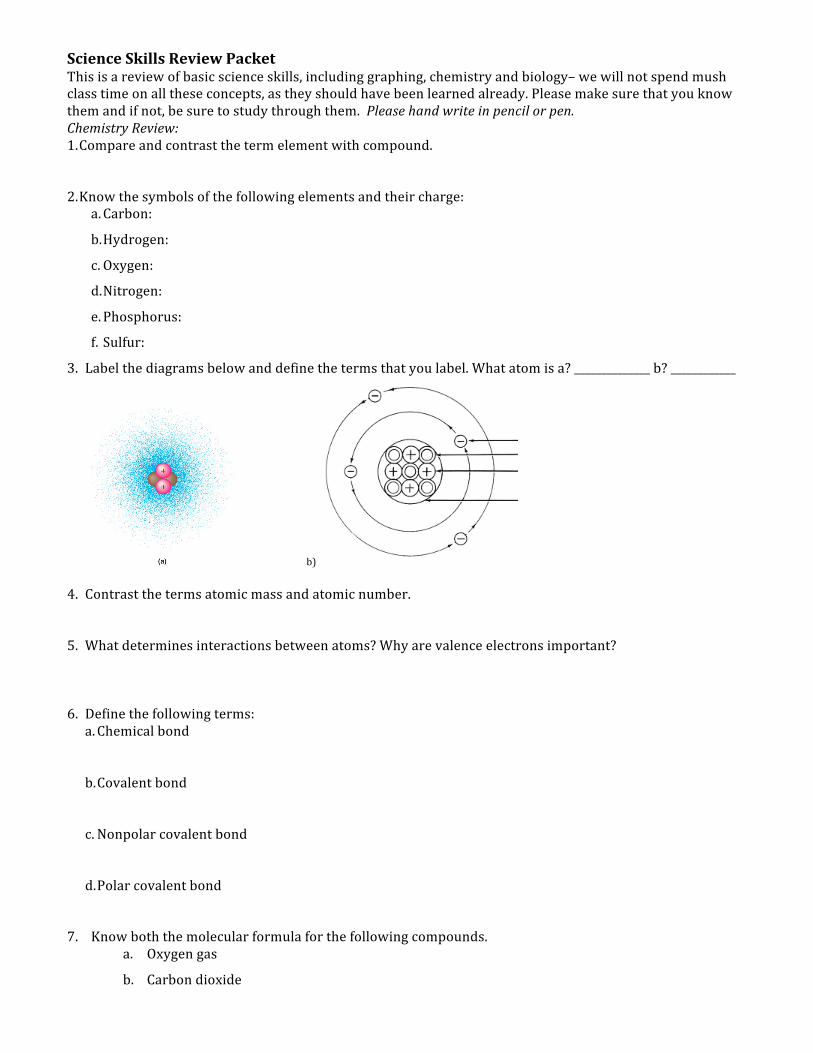
3. Label the diagrams below and define the terms that you label. What atom is a? ______________ b? ____________
b)
4. Contrast the terms atomic mass and atomic number.
5. What determines interactions between atoms? Why are valence electrons important?
6. Define the following terms: a. Chemical bond
b. Covalent bond
c. Nonpolar covalent bond
d. Polar covalent bond
7. Know both the molecular formula for the following compounds. a. Oxygen gas
b. Carbon dioxide
3
c. Glucose
d. Nitrogen gas
e. Ammonia
f. Water (you would be surprised at how many people missed this!!!)
8. How do ionic bonds compare with covalent bonds?
9. What are hydrogen bonds
10. Define the following terms: a. Solute
b. Solvent
c. Aqueous solution
d. Hydrophilic
e. Hydrophobic
f. Molarity
11. What defines an acid and a base?
12. What is special about carbon that makes it the central atom in the chemistry of life?
Biology Review: 13. Define the following:
a. Biology:
b. Hypothesis:
c. Observation:
d. Homeostasis:
14. What are the main characteristics of life (minimum of 5)?
15. Scientists are testing a new pain reducing drug in a trial with 50 patients. Group A gets the drug while group B gets a placebo pill. Level of pain is being recorded for each patient.
a. What is the control group:
4
b. Experimental group:
c. Independent variable:
d. Dependent variable:
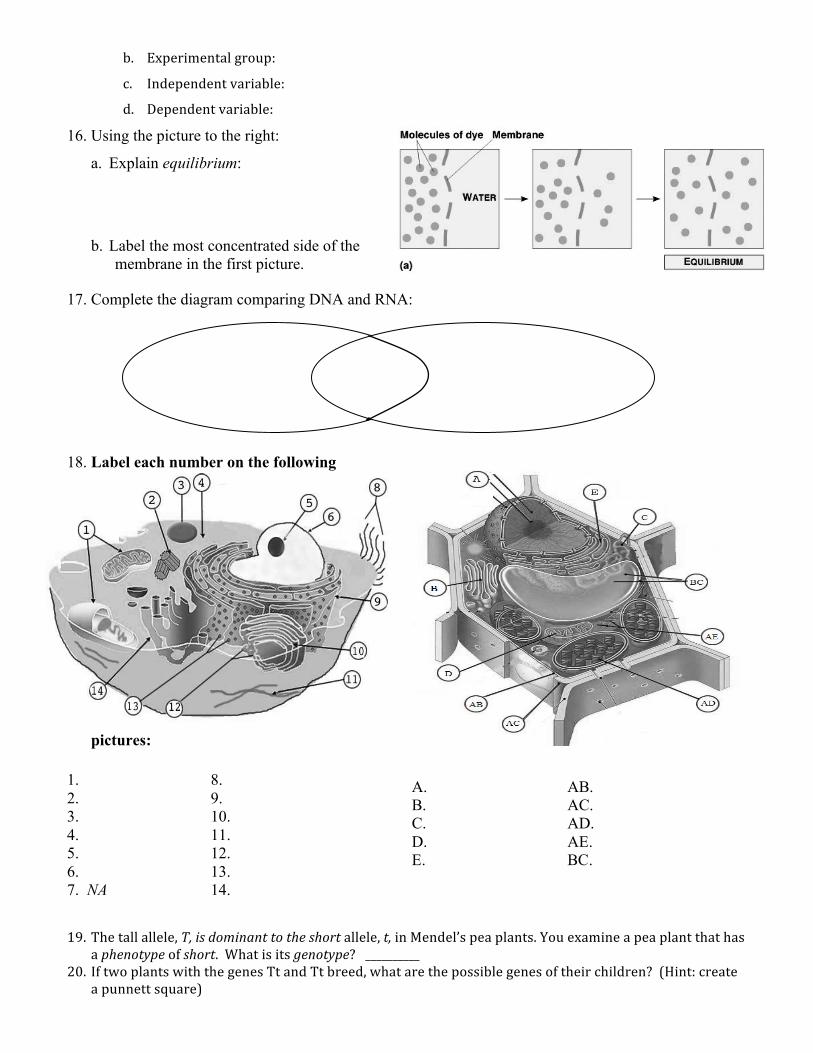
16. Using the picture to the right:
a. Explain equilibrium:
b. Label the most concentrated side of the membrane in the first picture.
17. Complete the diagram comparing DNA and RNA:
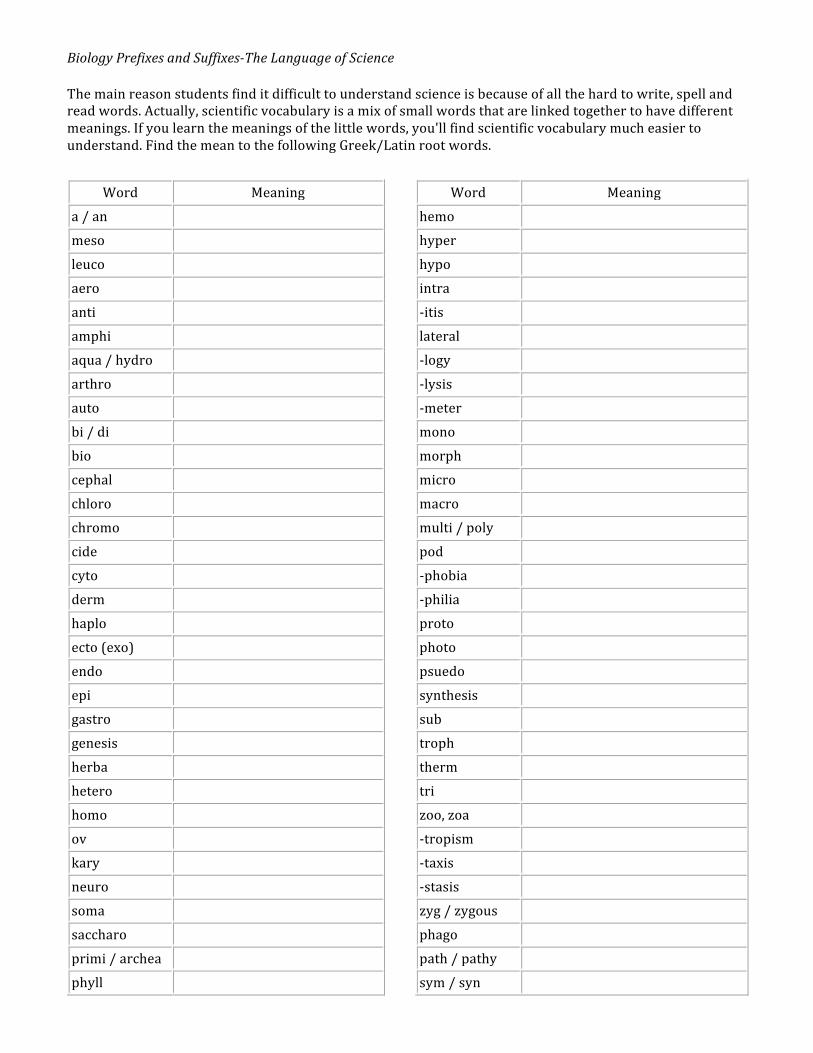
18. Label each number on the following
pictures: 1. 8. 2. 9. 3. 10. 4. 11. 5. 12. 6. 13. 7. NA 14. 19. The tall allele, T, is dominant to the short allele, t, in Mendel’s pea plants. You examine a pea plant that has
a phenotype of short. What is its genotype? __________ 20. If two plants with the genes Tt and Tt breed, what are the possible genes of their children? (Hint: create
a punnett square)
A. B. C. D. E.
AB. AC. AD. AE. BC.
5
Biology Prefixes and Suffixes-‐The Language of Science
The main reason students find it difficult to understand science is because of all the hard to write, spell and read words. Actually, scientific vocabulary is a mix of small words that are linked together to have different meanings. If you learn the meanings of the little words, you'll find scientific vocabulary much easier to understand. Find the mean to the following Greek/Latin root words.
Word Meaning a / an meso leuco aero anti amphi aqua / hydro arthro auto bi / di bio cephal chloro chromo cide cyto derm haplo ecto (exo) endo epi gastro genesis herba hetero homo ov kary neuro soma saccharo primi / archea phyll
Word Meaning hemo hyper hypo intra -‐itis lateral -‐logy -‐lysis -‐meter mono morph micro macro multi / poly pod -‐phobia -‐philia proto photo psuedo synthesis sub troph therm tri zoo, zoa -‐tropism -‐taxis -‐stasis zyg / zygous phago path / pathy sym / syn
6
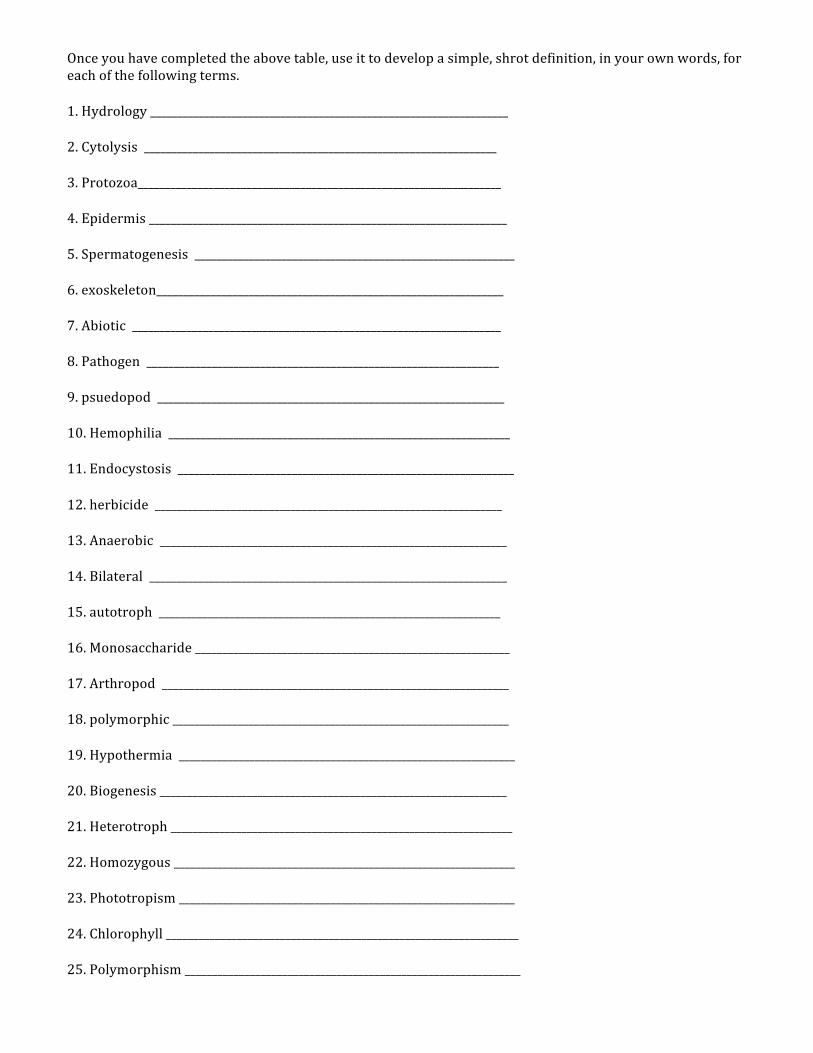
Once you have completed the above table, use it to develop a simple, shrot definition, in your own words, for each of the following terms.
1. Hydrology __________________________________________________________________
2. Cytolysis _________________________________________________________________
3. Protozoa___________________________________________________________________
4. Epidermis __________________________________________________________________
5. Spermatogenesis ___________________________________________________________
6. exoskeleton________________________________________________________________
7. Abiotic ____________________________________________________________________
8. Pathogen _________________________________________________________________
9. psuedopod ________________________________________________________________
10. Hemophilia _______________________________________________________________
11. Endocystosis ______________________________________________________________
12. herbicide ________________________________________________________________
13. Anaerobic ________________________________________________________________
14. Bilateral __________________________________________________________________
15. autotroph _______________________________________________________________
16. Monosaccharide __________________________________________________________
17. Arthropod ________________________________________________________________
18. polymorphic ______________________________________________________________
19. Hypothermia ______________________________________________________________
20. Biogenesis ________________________________________________________________
21. Heterotroph _______________________________________________________________
22. Homozygous _______________________________________________________________
23. Phototropism ______________________________________________________________
24. Chlorophyll _________________________________________________________________
25. Polymorphism ______________________________________________________________
7
Graphing Practice Graphing is an important procedure used by scientists to display the data that is collected during a controlled experiment. Line graphs must be constructed correctly to accurately portray the data collected. Many times the wrong construction of a graph detracts from the acceptance of an individual’s hypothesis
A graph contains five major parts: a. Title b. The independent variable c. The dependent variable d. The scales for each variable e. A legend
• The TITLE: depicts what the graph is about. By reading the title, the reader should get an idea about the graph. It should be a concise statement placed above the graph.
• The INDEPENDENT VARIABLE: is the variable that can be controlled by the experimenter. It usually includes time (dates, minutes, hours, etc.), depth (feet, meters), and temperature (Celsius). This variable is placed on the X axis (horizontal axis).
• The DEPENDENT VARIABLE: is the variable that is directly affected by the independent variable. It is the result of what happens because of the independent variable. Example: How many oxygen bubbles are produced by a plant located five meters below the surface of the water? The oxygen bubbles are dependent on the depth of the water. This variable is placed on the Y-axis or vertical axis.
• The SCALES for each Variable: In constructing a graph one needs to know where to plot the points representing the data. In order to do this a scale must be employed to include all the data points. This must also take up a conservative amount of space. It is not suggested to have a run on scale making the graph too hard to manage. The scales should start with 0 and climb based on intervals such as: multiples of 2, 5, 10, 20, 25, 50, or 100. The scale of numbers will be dictated by your data values.
• The LEGEND: is a short descriptive narrative concerning the graph's data. It should be short and concise and placed under the graph.
• The MEAN for a group of variables: To determine the mean for a group of variables, divide the sum of the variables by the total number of variables to get an average.
• The MEDIAN for a group of variables: To determine median or “middle” for an even number of values, put the values in ascending order and take the average of the two middle values. e.g. 2, 3, 4, 5, 9, 10 Add 4+5 (2 middle values) and divide by 2 to get 4.5
• The MODE for a group of variables: The mode for a group of values is the number that occurs most frequently. e.g. 2, 5, 8, 2, 6, 11 The number 2 is the mode because it occurred most often (twice)
Rules and Tips for Graphing: 1. Always use a pencil to draw your graph. It’s easier to fix mistakes (Or use Excel!). 2. Always draw lines with a ruler. Do not freehand. Use at least half of your paper for the graph. 3. Make sure Independent Variable is on the X-axis and Dependent Variable is on the Yaxis. 4. Include all parts: Title, Axis Labels WITH Units, Legend 5. If you are graphing multiple subjects, use different colored or patterned lines and explain what they are in the
legend. 6. Choose an appropriate graph to explain your data. Examples:
a. LINE: Measuring a change in something over time b. BAR: Comparing individuals to each other with only one data point. c. PIE: Show percentages that add up to 100%.
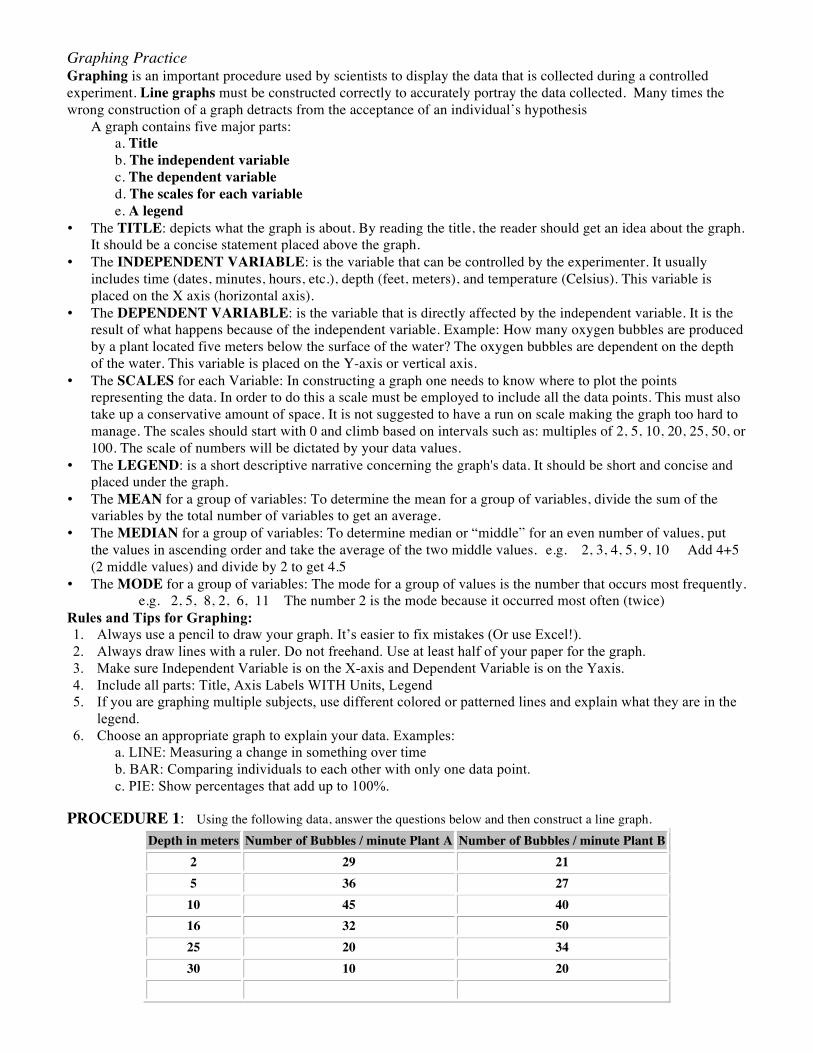
PROCEDURE 1: Using the following data, answer the questions below and then construct a line graph.
Depth in meters Number of Bubbles / minute Plant A Number of Bubbles / minute Plant B 2 29 21 5 36 27
10 45 40 16 32 50 25 20 34 30 10 20
8
1. What is the dependent variable and why?
2. What is the independent variable and why?
4. What are the mean, median, and mode of all 3 columns of data?
a). Depth : Mean____________Median__________Mode________
b). Bubble Plant A.: Mean ____________Median_________Mode________
c). Bubbles Plant B: Mean ____________Median_________Mode________
Title: _______________________________________________
5. Come up with an explanation for the data in this graph, including the varying rates in plant A and B. (This is an explanation or hypothesis of why the data is the way it is)
LEGEND:
9
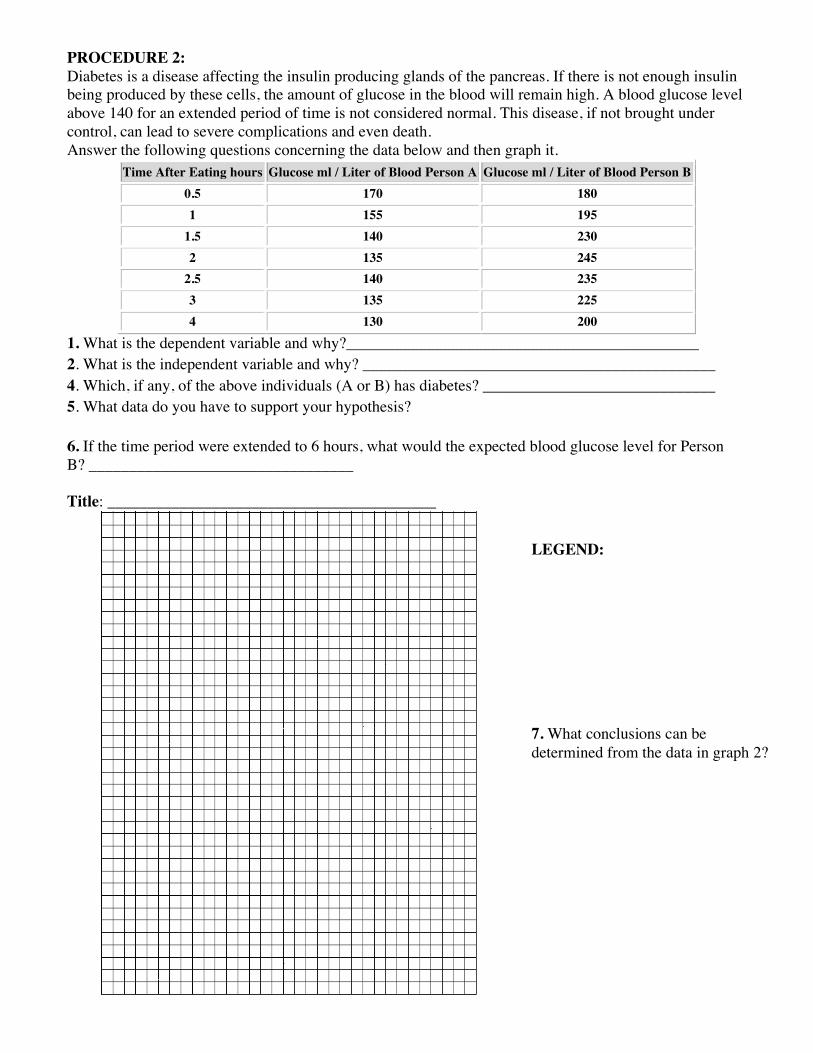
PROCEDURE 2: Diabetes is a disease affecting the insulin producing glands of the pancreas. If there is not enough insulin being produced by these cells, the amount of glucose in the blood will remain high. A blood glucose level above 140 for an extended period of time is not considered normal. This disease, if not brought under control, can lead to severe complications and even death. Answer the following questions concerning the data below and then graph it.
Time After Eating hours Glucose ml / Liter of Blood Person A Glucose ml / Liter of Blood Person B 0.5 170 180 1 155 195
1.5 140 230 2 135 245
2.5 140 235 3 135 225 4 130 200
1. What is the dependent variable and why?____________________________________________ 2. What is the independent variable and why? ____________________________________________ 4. Which, if any, of the above individuals (A or B) has diabetes? _____________________________ 5. What data do you have to support your hypothesis? 6. If the time period were extended to 6 hours, what would the expected blood glucose level for Person B? _________________________________ Title: _________________________________________
LEGEND: 7. What conclusions can be determined from the data in graph 2?
10
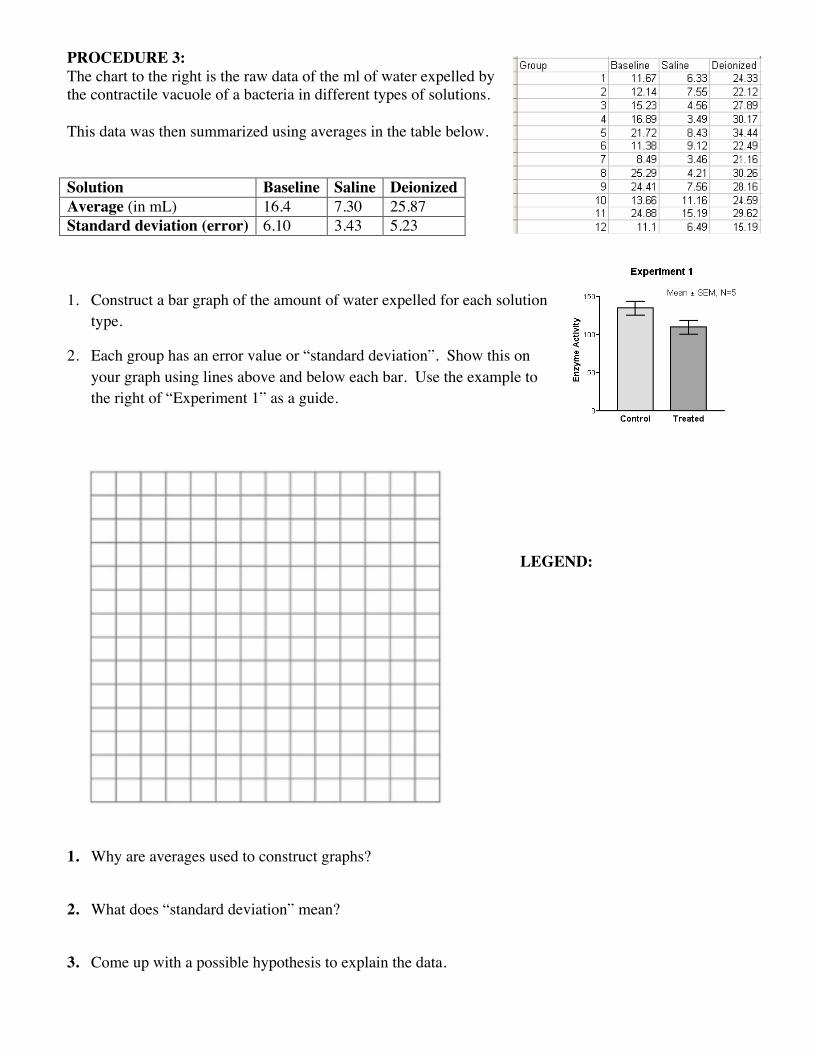
PROCEDURE 3: The chart to the right is the raw data of the ml of water expelled by the contractile vacuole of a bacteria in different types of solutions. This data was then summarized using averages in the table below. Solution Baseline Saline Deionized Average (in mL) 16.4 7.30 25.87 Standard deviation (error) 6.10 3.43 5.23 1. Construct a bar graph of the amount of water expelled for each solution
type.
2. Each group has an error value or “standard deviation”. Show this on your graph using lines above and below each bar. Use the example to the right of “Experiment 1” as a guide.
1. Why are averages used to construct graphs?
2. What does “standard deviation” mean?
3. Come up with a possible hypothesis to explain the data.
LEGEND: