Embed Size (px)
Citation preview

Copyright © 2015 Aozora Bank, Ltd.All Rights Reserved.
~~~~Primary Secondary Bank: An Even More Reliable Partner ~~~~
May 18, 2015
Aozora BankFY2014 Results
Analyst Meeting

Copyright © 2015 Aozora Bank, Ltd.All Rights Reserved. 1
Q&A Session
FY2014 Financial Results
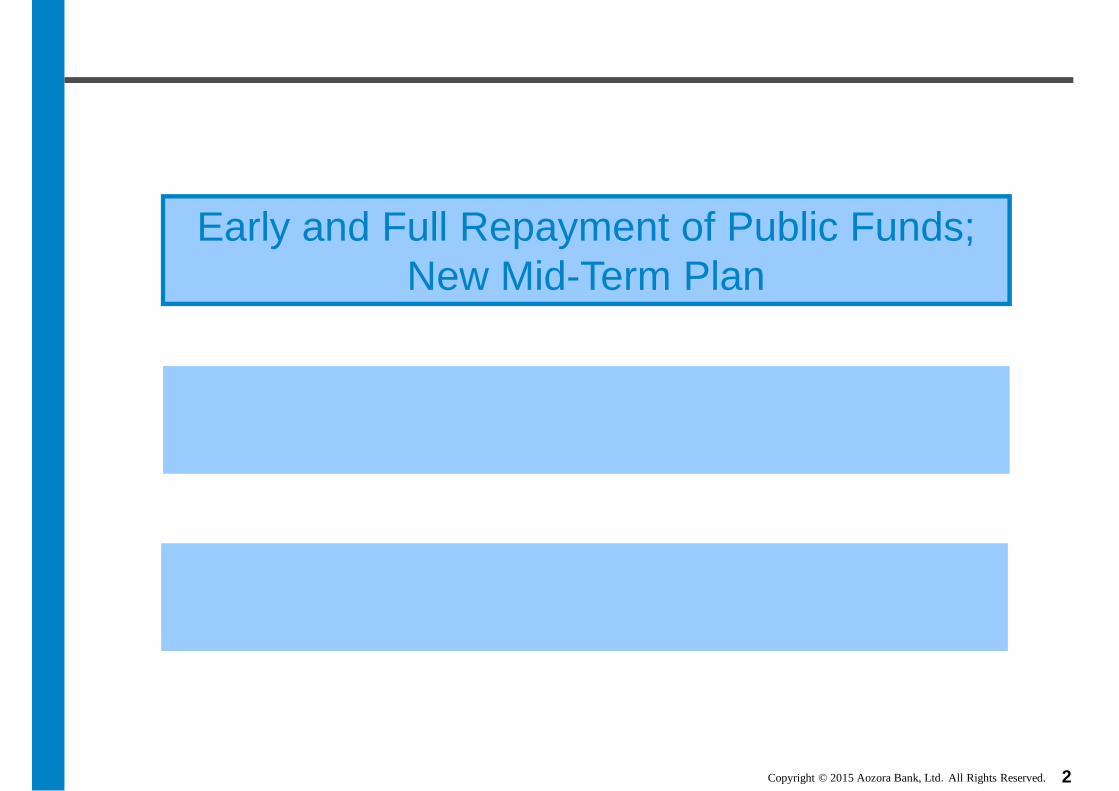
Early and Full Repayment of Public Funds; New Mid-Term Plan
Today’s Agenda(Note) Unless otherwise stated, all figures are on a consolidated basis and amounts
stated in 100 million yen have been rounded to the nearest 100 million yen
Copyright © 2015 Aozora Bank, Ltd.All Rights Reserved. 2
Q&A Session
FY2014 Financial Results
Early and Full Repayment of Public Funds; New Mid-Term Plan

Copyright © 2015 Aozora Bank, Ltd.All Rights Reserved. 3
Summary
Early and Full Repayment of Public Funds
� Early and full repayment of public funds scheduled for June 29, 2015
� Adequate level of capital after full repayment
Strategic Direction
� “Primary Secondary Bank: An Even More Reliable Partner”
� Updated Business Model centered on ‘6 Focuses’
� Differentiated and specialized financial services
Financial Targets� ROE target: mid-term 9% or higher; long-term 10%
� Earnings target: Net revenue 100+ billion yen; Net income 40 billion yen or more
Capital Policy
� Dividend payout ratio: Increase to 50% of consolida ted net income
� Capital adequacy ratio target: 10% or higher (dome stic standard)
� Cancel 467 million of treasury shares (Retain 16.5 million treasury shares after cancella tion)
(Note) From FY2015 onwards, consolidated net income represents ‘profit attributable to owners of parent’ in accordance with the Revised Accounting Standards for Business Combinations and related standards and implementation guidance

Copyright © 2015 Aozora Bank, Ltd.All Rights Reserved.
FY2010 FY2011 FY2012 FY2013 FY2014
Net revenue 779 843 845 858 928
Net Income 328 463 406 423 437
16.93% 17.86% 15.70% 15.13% 14.45% 10.6%Capitaladequacy ratio
FY2010/ FY2011/ FY2012: Basel ll basis, domestic standard ; FY2013/ FY2014: Basel lll basis, domestic standard *2
Based on business-related revenue, including gains on the sale of domestic equity ETFs*1
Fair value of preferred shares: Share price x number of common share equivalents *3
Post-repayment estimate
*2
*1
Early and Full Repayment of Public Funds
The full repayment of the remaining 143.4 billion y en in public funds is scheduled for June 29, following the third installment payment of 20.5 bil lion yen, subject only to the approval of the regulatory authorities
4
< Business Performance >
< Installment Repayment of Public Funds >Share price (yen)
Remaining Amt. of Public funds
Fair value of Pref. Shares*3
3-month avg. share price (2/16 - 5/14)
(Preliminary)
Copyright © 2015 Aozora Bank, Ltd.All Rights Reserved. 5
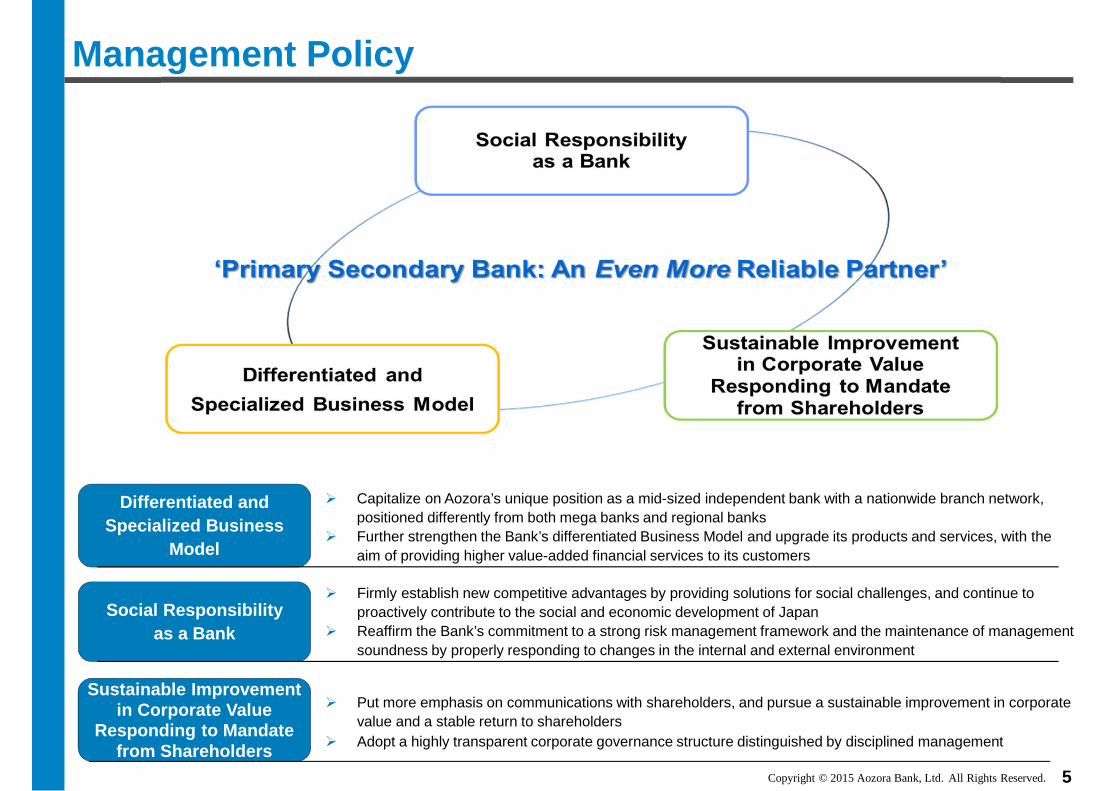
Management Policy
Differentiated and Specialized Business
Model
� Capitalize on Aozora’s unique position as a mid-sized independent bank with a nationwide branch network, positioned differently from both mega banks and regional banks
� Further strengthen the Bank’s differentiated Business Model and upgrade its products and services, with the aim of providing higher value-added financial services to its customers
Social Responsibilityas a Bank
� Firmly establish new competitive advantages by providing solutions for social challenges, and continue to proactively contribute to the social and economic development of Japan
� Reaffirm the Bank’s commitment to a strong risk management framework and the maintenance of management soundness by properly responding to changes in the internal and external environment
Sustainable Improvement in Corporate Value
Responding to Mandate from Shareholders
� Put more emphasis on communications with shareholders, and pursue a sustainable improvement in corporate value and a stable return to shareholders
� Adopt a highly transparent corporate governance structure distinguished by disciplined management

Copyright © 2015 Aozora Bank, Ltd.All Rights Reserved. 6
‘4 Focuses’ Business Accomplishments
Retail Banking Focusing on Mass Affluent Customers Collaboration with Regional Financial Institutions
Proactive Approach to SME Customers Advanced Services in Specialty Finance Areas
<Increase in cross-selling> <Sales amount of derivative-embedded products to financial institutions >
<Disciplined expansion of overseas business>� Sharp focus on balancing risk-return in lending
operations
� Promotion of sales activities with business solutio ns, leveraging the Bank’s expertise
� Expansion of Asian Network
� Increased sales of derivative-related products to respond to customer needs
� Promoted inter-regional and cross-border business matching

Copyright © 2015 Aozora Bank, Ltd.All Rights Reserved. 7
� Expand business base centered on “6 Focuses”
� Continue “selection and concentration” with respect to management resources
� Strengthen the Bank’s differentiated and specialized Business Model
Vision :“:“:“:“Primary Secondary Bank: An Even More Reliable Partner”
Key Points
Business Strategy
4 Focuses 6 Focuses
Specialty Finance
Deeper Partnerships with Regional Financial Institutions
Marketing with business solutions for SME and other corporate customers
Retail Banking Focusing on Senior Generation Mass-affluent
Customers
Pursuit of DiversifiedGlobal Investments and
Promotion of risk consulting
International BusinessCollaboration with Regional Financial Institutions
Proactive Approach to SME Customers
Retail Banking Focusing on Senior Generation Mass-affluent
Customers
Advanced Services in Specialty Finance Areas
Provide DifferentiatedFinancial Services
Further Leverage Expertise

Copyright © 2015 Aozora Bank, Ltd.All Rights Reserved. 8
Strengthening of Business Model
Outline of Business Model
Upgrade the Bank’s products and services, with the aim of providing higher value-added financial services to customers

Copyright © 2015 Aozora Bank, Ltd.All Rights Reserved. 9
‘6 Focuses’

Copyright © 2015 Aozora Bank, Ltd.All Rights Reserved. 10
Investment / M&A Strategy
Investment / M&A Strategy
� Evaluate capital investment or M&A opportunities from a mid- to long-term viewpoint, in accordance with the following basic principles aimed at further growth or new business leading to next generation market segments
� Existence of clear synergy and/or complementary relationship
� Target business should be manageable
� Appropriate investment costs, financially acceptable and future value can be expected
� Timing should be appropriate
Basic Principles
< Ref: Aozora Bank Group >

Copyright © 2015 Aozora Bank, Ltd.All Rights Reserved. 11
Resource Plan
Risk Management Framework
� Implement proactive risk management (management of early indicators)
� Structure/manage a credit portfolio where risk appetite and risk resistance are balanced
� Continue reviewing risk management framework in light of changes in financial regulations including Basel regulation
Human Resources
� Develop human resources and establish reputation as a “Team of highly-motivated and compassionate professionals”
� Foster human resources who have a strong sense of ethics and welcome challenges, and establish a better workplace for people with diverse backgrounds
IT and Facility Investments
� Improve service quality and provide prompt response for customers as well as realize stable system operation by Kanjo-kei System Replacement Project which has been a corporate priority for the Bank

Copyright © 2015 Aozora Bank, Ltd.All Rights Reserved. 12
Post-Repayment Financial Targets
Earnings Target
Key Performance Indicators (KPIs)
FY2012Results
FY2013Results
FY2014Results
Mid-term targets((((FY2015----FY2017)
Net interest margin 1.07% 1.09% 1.21% 1.20%
Non-interest income ratio 46% 46% 46% 40~~~~50%
Overhead ratio (OHR )))) 45.8% 45.8% 43.3% 45% or below
Credit cost ratio 0.09% 0.09% - 0.10~~~~0.20%
ROE 7.1% 8.0% 8.1% 9% or higher
ROA 0.8% 0.9% 0.9% 0.8%
FY2012Results
FY2013Results
FY2014Results
Mid-term targets((((FY2017))))
Net revenue 845 858 928 100+ billion yen
Net income 406 423 437 40 billion yen or more
Credit-related expenses were a net reversal in FY2014.*2Based on business-related revenue, including gains on the sale of domestic equity ETFs*1
*1
*1
*2 Long-term target
10%

Copyright © 2015 Aozora Bank, Ltd.All Rights Reserved.
Number of issued shares after cancellation
1,182.9 million shares
13
� Dividend payout: 50%%%% of consolidated net income (FY2015- FY2017)
� Continue payment of quarterly dividends, unique for a Japanese bank
Shareholder Return Policy Cancellation of Treasury Shares
Revised Capital Policy
*The full -year dividend forecast for FY2015 is based on the total dividend amount, which is 50% of the consolidated net income forecast of 43.0 billion yen for the full-year, divided by the total number of common shares issued, excluding treasury shares, as of March 31, 2015.
< Increase dividend payout ratio>
Adequate Capital
Treasury shares to be cancelled
467.3 million shares
Remaining Treasury shares16.5 million shares
1,166.4 million shares
*
CAR target
10%%%% or higher (FY2015-FY2017)
(yen)
CAR (domestic standard)
CET1 ratioPublic funds (Prefs.)

Copyright © 2015 Aozora Bank, Ltd.All Rights Reserved. 14
Q&A Session
FY2014 Financial Results
Early and Full Repayment of Public Funds; New Mid-Term Plan

Copyright © 2015 Aozora Bank, Ltd.All Rights Reserved. 15
� Net revenue was 92.8 billion yen and net income was 43.7 billion yen, both exceeding the FY2013 results and the FY2014 full-year forecasts
� Both net interest income and non-interest income increased year on year
� Net interest margin increased 12 bps year on year to 1.21%
� The OHR was 43.3%, reflecting the ongoing priority assigned to efficient operations
� Maintained strong financial condition
� Sound asset quality
� Conservative allocation of loan loss reserves
� Adequate capital
� Announced FY2014 full-year common share dividend of 14.90 yen, exceeding the full-year forecast of 14.70 yen
� FY2014 fourth quarter dividend payment : 4.90 yen per common share
ⅠⅠⅠⅠ. Financial highlights(Note) Unless otherwise stated, all figures are on a consolidated basis and amounts
stated in 100 million yen have been rounded to the nearest 100 million yen
: The Financial Reconstruction Law (FRL) ratio (non-consolidated) improved by 1.63 points to 1.35% from end-March 2014
: The ratio of loan loss reserves to total loans remained high at 2.29%
: Capital adequacy ratio (Basel III basis, domestic standard) was 14.45% (preliminary) as of end-March 2015

Copyright © 2015 Aozora Bank, Ltd.All Rights Reserved.
(100 million yen)
3 monthsJan. - Mar.
Full-YearA
3 monthsJan. - Mar.
Full-YearB
Amount %
Net revenue 205 806 231 928 +122 +15.2% 920 100.9%
General & administrative expenses -104 -393 -116 -402 -8 -2.1% -410 97.9%
Business profit 100 413 114 527 +114 +27.6% 510 103.3%
Ordinary profit 109 522 52 597 +75 +14.3% 515 115.9%
Net income 82 423 95 437 +14 +3.2% 430 101.6%
6 -23 -72 47 +70 -
-0 -0 -0 -58 -57 -
Taxes -27 -98 42 -102 -4 -
Achievement
FY2013 Change B-A FY2014full-yearforecast
FY2014
<<<<Reference >>>>
Credit-related expenses
Extraordinary profit
16
ⅡⅡⅡⅡ. PL: Summary
� Net income was 43.7 billion yen, exceeding the FY2013 result and the FY2014 full-year forecast� Net revenue was 92.8 billion yen, an increase of 12.2 billion yen, or 15.2% year on year, and
business profit was 52.7 billion yen, an increase of 11.4 billion yen, or 27.6%, both exceeding the FY2013 results
� Ordinary profit increased 7.5 billion yen, or 14.3%, to 59.7 billion yen

Copyright © 2015 Aozora Bank, Ltd.All Rights Reserved.
3 monthsJan. - Mar.
Full-YearA
3 monthsJan. - Mar.
Full-YearB
Amount %
Net revenue 205 806 231 928 +122 +15.2%
Net interest income 106 437 119 500 +63 +14.4%
Non-interest income 99 369 111 429 +59 +16.1%
Net fees & commissions 32 125 41 145 +20 +16.2%
Net trading revenues 32 98 42 125 +27 +27.4%
34 146 29 158 +12 +8.3%
Gains/losses on bond transactions 9 4 -11 29 +24 +545.4%
25 142 40 130 -12 -8.5%
(100 million yen)
Change B-A
Net other ordinary income
FY2013 FY2014
Net other ordinary incomeexcl. gains/losses on bond transactions
17
ⅡⅡⅡⅡ. PL: Net revenue
� Net revenue increased 12.2 billion yen, or 15.2% year on year, to 92.8 billion yen, exceeding the full-year forecast of 92.0 billion yen� Net interest income was 50.0 billion yen, an increase of 6.3 billion yen, or 14.4%, and non-interest
income was 42.9 billion yen, an increase of 5.9 billion yen, or 16.1%, both exceeding the FY2013 results

Copyright © 2015 Aozora Bank, Ltd.All Rights Reserved.
3 monthsJan. - Mar. A
Full-YearB
3 monthsJan. - Mar. C
Full-YearD C-A D-B
Net interest income 106 437 119 500 +13 +63
Interest income 141 590 152 634 +11 +44Interest on loans and discounts 103 424 110 429 +8 +5Interest and dividends on securities 34 141 38 177 +4 +36Other interest income 3 14 3 23 +1 +9Interest on swaps 2 11 1 5 -1 -6
Interest expenses -35 -153 -33 -134 +3 +19Interest on deposits and NCDs -27 -118 -22 -93 +5 +25Interest on debentures -1 -6 -1 -6 -0 +0Interest on borrowings and rediscount -1 -6 -2 -7 -1 -2Other interest expenses -2 -10 -3 -10 -0 -1Interest on swaps -3 -14 -5 -18 -2 -3
Decreases in expenses are shown as positive
Net interest marginYield on total investments (A) 1.44% 1.49% 1.50% 1.55% +0.06% +0.06%
Yield on loans (B) 1.56% 1.63% 1.61% 1.60% +0.05% -0.03%Yield on securities 1.22% 1.18% 1.38% 1.45% +0.16% +0.27%
Yield on funding (C) 0.37% 0.40% 0.33% 0.34% -0.04% -0.06%Net interest margin (A)-(C) 1.07% 1.09% 1.17% 1.21% +0.10% +0.12%Net loan margin (B)-(C) 1.19% 1.23% 1.28% 1.26% +0.09% +0.03%
(100 million yen)
FY2013 FY2014 Change
18
ⅡⅡⅡⅡ. PL: Net interest income
� Net interest income increased 6.3 billion yen, or 14.4% year on year, to 50.0 billion yen� Net interest margin increased 12 bps to 1.21%
� The yield on total investments increased 6 bps to 1.55% as the Bank continued its disciplined balance sheet management
� Funding costs were reduced 6 bps to 0.34% as a result of our ongoing efforts to reduce funding costs
Copyright © 2015 Aozora Bank, Ltd.All Rights Reserved.
3 monthsJan. - Mar.
A
Full-YearB
3 monthsJan. - Mar.
C
Full-YearD
C-A D-B
Net fees and commissions 32 125 41 145 +9 +20
Fees and commissions received 35 134 44 156 +10 +22
Loans, deposits and debentures 17 63 18 72 +1 +8
Securities 4 22 9 28 +6 +6
Agencies 11 35 10 42 -1 +7
Other 4 14 7 15 +3 +1
Fees and commissions payments -3 -9 -3 -11 -1 -2
Net trading revenues 32 98 42 125 +9 +27
Trading-related financial derivatives 30 80 23 92 -7 +13
Others 2 18 18 32 +16 +14
Incl. Structured bonds 5 18 12 24 +8 +6
16 64 26 80 +10 +16
(100 million yen)
Change
Earnings related to the sale of investment trusts,insurance, and structured bonds
FY2013 FY2014
Earnings from the sale of investment products (included in the two items above)
19
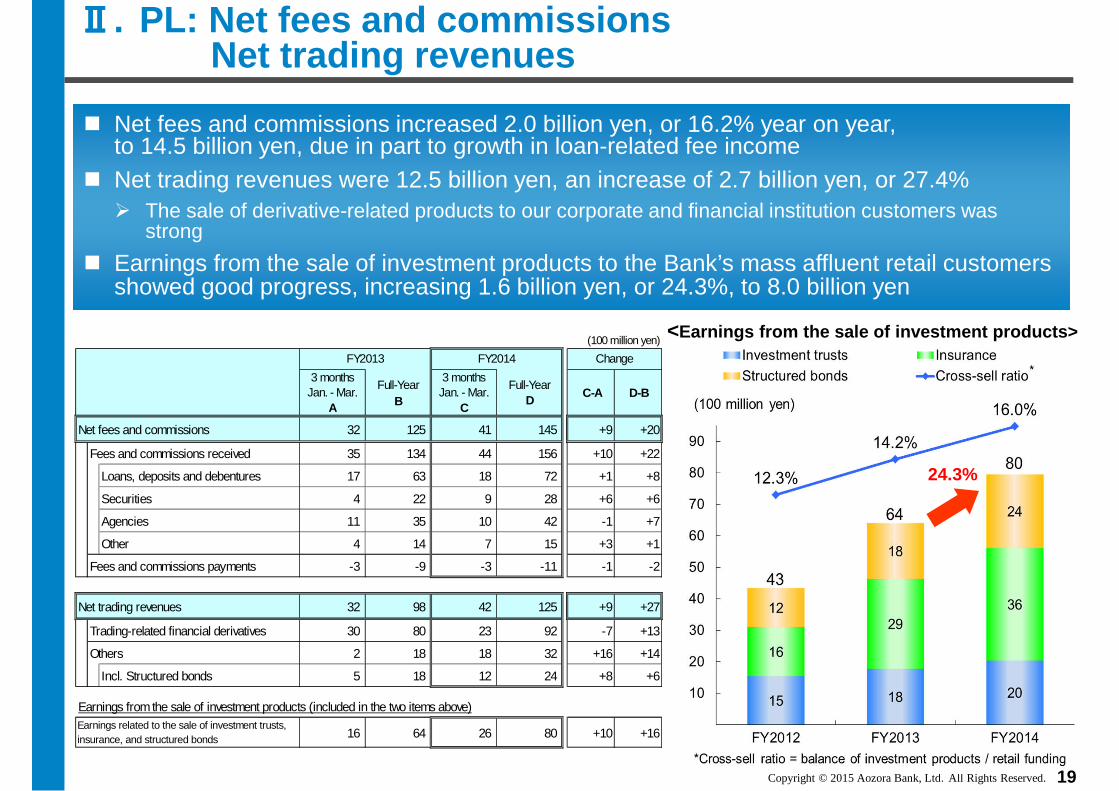
ⅡⅡⅡⅡ. PL: Net fees and commissionsNet trading revenues
� Net fees and commissions increased 2.0 billion yen, or 16.2% year on year, to 14.5 billion yen, due in part to growth in loan-related fee income� Net trading revenues were 12.5 billion yen, an increase of 2.7 billion yen, or 27.4%
� The sale of derivative-related products to our corporate and financial institution customers was strong
� Earnings from the sale of investment products to the Bank’s mass affluent retail customers showed good progress, increasing 1.6 billion yen, or 24.3%, to 8.0 billion yen
<Earnings from the sale of investment products>
24.3%

Copyright © 2015 Aozora Bank, Ltd.All Rights Reserved.
3 monthsJan. - Mar.
A
Full-YearB
3 monthsJan. - Mar.
C
Full-YearD
C-A D-B
Gains/losses on bond transactions 9 4 -11 29 -21 +24
Japanese government bonds (JGB) - 2 0 20 +0 +18
Foreign government bonds & mortgage-backed securities - -47 4 9 +4 +56
Others (J-REITs, foreign currency ETFs, etc.) 9 49 -15 -0 -24 -50
Net other ordinary income excl. gains/losses on bond transactions 25 142 40 130 +15 -12
Gains/losses on foreign currency transactions -4 -2 -3 7 +1 +9
Gains/losses on derivatives other than trading, net -0 3 -0 -0 -0 -3
Gains from limited partnerships 27 129 41 90 +14 -39
Real estate-related 14 48 3 12 -10 -36
Distressed loan-related 5 45 7 33 +3 -13
Others (Buyout, etc.) 9 35 30 45 +21 +9
Gains on distressed loans (Aozora Loan Services) 2 9 2 10 -1 +1
Debenture issue cost -0 -0 -0 -0 -0 -0
Others 0 3 2 24 +1 +20
FY2013 ChangeFY2014
(100 million yen)
20
ⅡⅡⅡⅡ. PL: Net other ordinary income
� Gains/losses on bond transactions were a gain of 2.9 billion yen, increasing 2.4 billion yen in comparison to FY2013 � The Bank continued to focus on the diversification and performance of its investment portfolio
� Net other ordinary income, excluding gains/losses on bond transactions, was 13.0 billion yen, a decrease of 1.2 billion yen, or 8.5% year on year� Contributing to this result were solid gains from limited partnerships of 9.0 billion yen, mainly from the
Bank’s buyout funds and distressed loan business

Copyright © 2015 Aozora Bank, Ltd.All Rights Reserved.
3 monthsJan. - Mar.
A
Full-YearB
3 monthsJan. - Mar.
C
Full-YearD
C-A D-B
G&A expenses (A) 104 393 116 402 +12 +8
Personnel 52 200 56 204 +4 +4
Non-Personnel 47 175 54 175 +7 -0
Tax 5 19 6 23 +1 +4
205 858 231 928
45.8% 43.3%
FY2013 FY2014 Change
(100 million yen)
Net revenue (B)
OHR (A)/(B)
21
ⅡⅡⅡⅡ. PL: G&A expenses
� G&A expenses were 40.2 billion yen, a year on year increase of 0.8 billion yen, or 2.1%, mainly due to head count increases in our retail staff
� The OHR was 43.3% due to growth in net revenue, as well as the ongoing priority the Bank has assigned to efficient operations
Breakdown of G&A expenses <G&A expenses transition>
*Based on business-related revenue, including gains on the sale of domestic equity ETFs
*
*

Copyright © 2015 Aozora Bank, Ltd.All Rights Reserved.
Coverage 949 715 307
348 296 116
602 419 191
89.3% 89.1% 80.4%Coverage ratio
Reserves
Collateral & guarantees
200 199 118
792567
262
72
36
3
1,063
802
382
3.83%
2.98%
1.35%
1%
2%
3%
4%
500
1,000
1,500
End-Mar. 13 End-Mar. 14 End-Mar. 15
Bankrupt Doubtful
Special attention FRL ratio(Ratio of FRL claims to total claims)
(100 million yen)
(100 million yen)
End - Mar.2014
End - Dec.2014
End - Mar.2015
Reserves for loan losses (A) 647 559 637
26,435 27,620 27,758
2.44% 2.02% 2.29%
Total loans (B)
(A) / (B)
3 monthsJan. - Mar.
A
Full-YearB
3 monthsJan.-Mar.
C
Full-YearD
C-A D-B
6 -23 -72 47 -78 +70
Write-off of loans 0 -13 -3 -6 -3 +7
Gains/losses on disposition of loans -1 15 -0 26 +1 +11
Reserves for loan losses 22 -82 -79 -30 -101 +52
Specific reserve for loan losses 13 -9 6 86 -7 +95
General reserve for loan losses 8 -73 -86 -116 -94 -43
-16 -19 8 6 +24 +26
Recoveries of written-off claims 1 76 2 50 +1 -26
(100 million yen)
Reserve for credit losses onoff-balance-sheet instruments
FY2013
Credit-related expenses
FY2014 Change
22
ⅡⅡⅡⅡ. PL: Credit-related expenses
� Credit-related expenses were a net reversal of 4.7 billion yen, compared with a net expense of 2.3 billion yen in FY2013 � Contributing to this result was a reversal of specific reserves mainly due to an improvement in the
condition of borrowers, in addition to the recoveries of written off claims� During the fourth quarter, the Bank allocated additional loan loss reserves, mainly for overseas loans,
as a preventative measure
� The Financial Reconstruction Law (FRL) ratio improved by 1.63 points to 1.35% � The ratio of loan loss reserves to total loans remained high at 2.29%
<FRL credit (Non-consolidated)>
Ratio of loan loss reserves to total loans
Credit-related expenses
Copyright © 2015 Aozora Bank, Ltd.All Rights Reserved.
(100 million yen)
Change
B - A
30,097 29,925 29,847 -250
Debentures 1,976 2,305 2,461 +486
1,588 1,795 1,872 +285
Trading liabilities 3,182 3,852 3,113 -70
Others 6,051 7,645 6,277 +226
Total liabilities 42,894 45,520 43,571 +677
Capital stock 1,000 1,000 1,000 -
Capital surplus 3,102 2,897 2,897 -205
Retained earnings 2,098 2,306 2,350 +252
-993 -993 -993 -
-31 221 349 +380
-69 13 12 +81
Others 53 59 59 +6
Total net assets 5,160 5,502 5,674 +514
Total liabilities and net assets 48,054 51,023 49,245 +1,190
End - Dec.2014
Borrowed money
End - Mar.2014 A
End - Mar.2015 B
Treasury Stock
Valuation difference onavailable-for-sale securities
Foreign currency translation adjustment
Deposits /Negotiable certificates of deposit
Change
B - A
Loans and bills discounted 26,435 27,620 27,758 +1,323
Domestic loans 21,016 20,414 20,197 -818
Overseas loans 5,419 7,206 7,561 +2,141
Securities 11,686 12,580 9,841 -1,846
Incl. JGBs 3,459 3,689 1,940 -1,519
Incl. US Treasury 2,060 2,285 2,066 +7
Cash and due from banks 4,419 3,936 5,505 +1,087
3,529 4,110 3,471 -58
Others 1,986 2,776 2,670 +684
Total assets 48,054 51,023 49,245 +1,190
End - Mar.2014 A
End - Mar.2015 B
End - Dec.2014
Trading assets
23
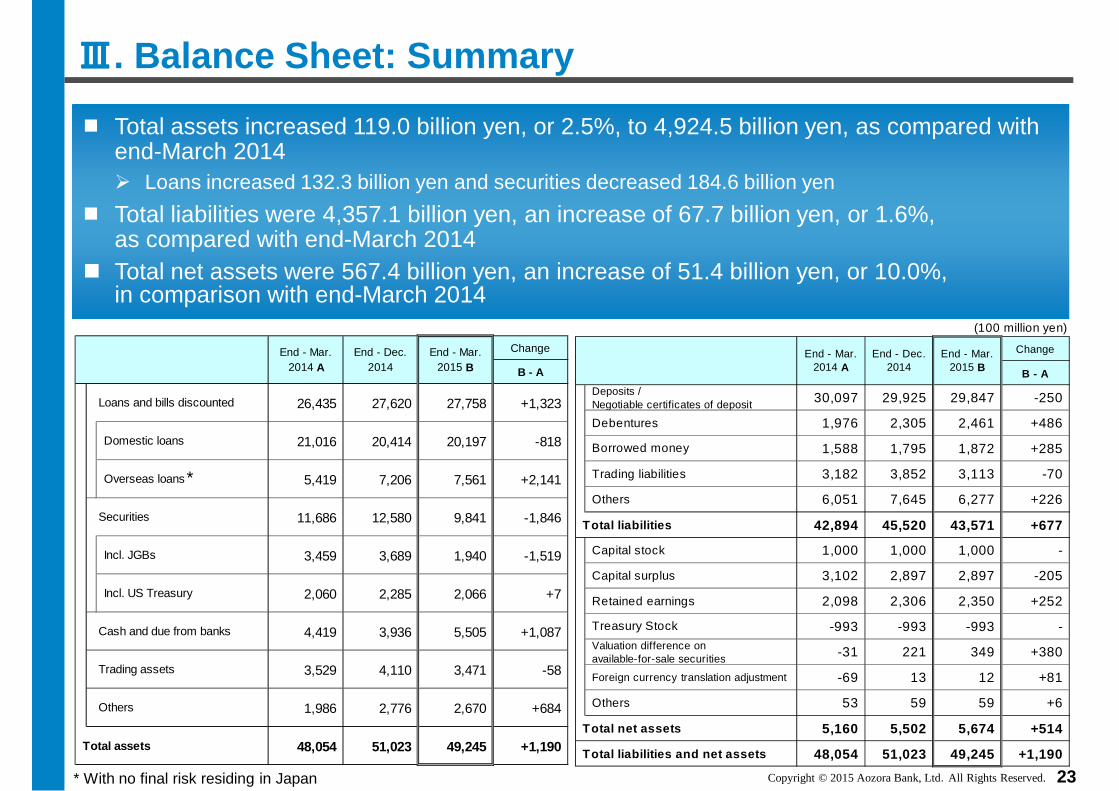
ⅢⅢⅢⅢ. Balance Sheet: Summary
� Total assets increased 119.0 billion yen, or 2.5%, to 4,924.5 billion yen, as compared with end-March 2014� Loans increased 132.3 billion yen and securities decreased 184.6 billion yen
� Total liabilities were 4,357.1 billion yen, an increase of 67.7 billion yen, or 1.6%, as compared with end-March 2014� Total net assets were 567.4 billion yen, an increase of 51.4 billion yen, or 10.0%,
in comparison with end-March 2014
* With no final risk residing in Japan
*

Copyright © 2015 Aozora Bank, Ltd.All Rights Reserved.
Retail funding ratio 64.6% 63.8% 63.8%
Loan-to-deposit ratio incl. NCDs 89.5% 87.8% 93.0%
20,727 20,463 20,597
7,074 6,503 6,135
4,282 5,107 5,576
32,083 32,073 32,309
10,000
20,000
30,000
40,000
End-Mar. 13 End-Mar. 14 End-Mar. 15
Financial Institutions Corporate and Public Institutions Retail
(100 million yen)
(100 million yen)
5,223 5,052 6,300
End-Mar.2015
Liquidity reserves
End-Dec.2014
End-Mar.2014
(100 million yen)
Change
B-A
30,097 29,925 29,847 -250
1,976 2,305 2,461 +486
End-Mar.2015 B
Deposits/ NCDs
Debentures
End-Dec.2014
End-Mar.2014 A
(100 million yen)
Change
B-A
32,073 32,230 32,309 +236
End-Mar.2015 B
End-Dec.2014
End-Mar.2014 A
Total core funding
24
ⅢⅢⅢⅢ. Balance Sheet: Funding
� Total core funding was 3,230.9 billion yen, an increase of 23.6 billion yen, or 0.7% from end-March 2014
� The percentage of retail funding to total core funding was 63.8%
� Liquidity reserves were at an adequate level of 630.0 billion yen
Funding sources < Funding by customer segment >
<Funding sources by products>
Liquidity reserves

Copyright © 2015 Aozora Bank, Ltd.All Rights Reserved.
(100 million yen)
Balance % Balance % Balance % B -A
Loans by dom estic o ffices (exc lud ing Japan o ffsho re m arke t acco un ts ) 23 ,951 90 .6% 24,187 87 .6% 23,926 86 .2% -25
M anufacturing 2,961 11 .2% 2,720 9 .8% 2,643 9 .5% -318
Agriculture, forestry and fisheries 24 0 .1% 31 0 .1% 31 0 .1% +7
M ining, quarry, gravel extraction 19 0 .1% 18 0 .1% 16 0 .1% -3
Construction 223 0 .8% 254 0 .9% 222 0 .8% -1
Electricity, gas, heat supply and w ater 61 0 .2% 99 0 .4% 143 0 .5% +82
Information and communications 564 2 .1% 427 1 .5% 402 1 .4% -161
Transport, postal services 1,122 4 .2% 1,034 3 .7% 823 3 .0% -299
W holesale and retail sale 1,284 4 .9% 1,246 4 .5% 1,278 4 .6% -6
Financial and insurance 3,840 14 .5% 3,967 14 .4% 4,317 15 .6% +476
Real estate 6,688 25 .3% 6,190 22 .4% 6,065 21 .8% -623 3,969 59 .3% 3,619 58 .5% 3,579 59 .0% -390
Leasing 1,123 4 .2% 1,217 4 .4% 1,167 4 .2% +44
O ther services 1,590 6 .0% 1,618 5 .9% 1,609 5 .8% +19
Local governments 455 1 .7% 413 1 .5% 404 1 .5% -51
O thers 3,997 15 .1% 4,953 17 .9% 4,806 17 .3% +809 3,426 13 .0% 4,390 15 .9% 4,260 15 .3% +834
2,485 9 .4% 3,434 12 .4% 3,832 13 .8% +1,348
T otal 26,435 100.0% 27,620 100.0% 27,758 100.0% +1,323
Domestic loans 21,016 79 .5% 20,414 73 .9% 20,197 72 .8% -818
O verseas loans (with no final r isk residing in Japa n) 5,419 20 .5% 7,206 26 .1% 7,561 27 .2% +2,141
C hangeLoans and b ills d iscountedby indus try
End - Mar.2014 A
E nd - Mar.2015 B
End - D ec.2014
Incl. Non-recourse loans*
Incl. O verseas (Headquarters booked)
Loans by ov e rse as office s incl. Japan offshore m ark e t accounts
* Non-recourse loans ratio is % of real estate loans 25
ⅢⅢⅢⅢ. Balance Sheet: Loans
� Loans increased 132.3 billion yen, or 5.0%, to 2,775.8 billion yen from end-March 2014
� Overseas loans increased, while domestic loans decreased as the Bank maintained its focus on balancing risk and return

Copyright © 2015 Aozora Bank, Ltd.All Rights Reserved.
(100 million yen)
Change
B - A
Total loans (A) 26,435 27,620 27,758 +1,323
Overseas loans (B) 5,419 7,206 7,561 +2,141
(B) / (A) 20.5% 26.1% 27.2% -
End - Mar.2015 B
End - Mar.2014 A
End - Dec.2014
26
<<<<By industry >>>> <<<<By region >>>>
ⅢⅢⅢⅢ. Balance Sheet: Loans ーーーー Overseas ーーーー
� Overseas loans* were 756.1 billion yen. The percentage of overseas loans to total loans was 27.2%
� The Bank continued its selective origination of loans, mainly in North America where risk-return profiles remain attractive, based on the Bank’s disciplined risk management framework
* With no final risk residing in Japan
*

Copyright © 2015 Aozora Bank, Ltd.All Rights Reserved.
Breakdown of non-recourse loans
70% or below80% or below
95.9%98.7%
Cumulative % of portfolio
(100 million yen)
Change
B-A
Total loans 26,435 27,620 27,758 +1,323
Real estate sector 6,688 6,190 6,065 -623
3,969 3,619 3,579 -390
End - Mar.2014 A
Incl. Non-recourse loans
End - Mar.2015 B
End - Dec.2014
27
ⅢⅢⅢⅢ. Balance Sheet: Loans ーーーー Domestic real estate ーーーー
� 96% of the non-recourse loan portfolio remained LTV 70% or below
� Tokyo-metro focused. Most non-recourse loans were office or residential
LTV Status Maturity schedule
<<<<By area>>>> <<<<By sector >>>>
Non-recourse loansas of end-Mar. 2015
12% 11% 16% 11% 50%
FY2018 FY2019 or laterFY2015 FY2017FY2016 Legal maturity Balance

Copyright © 2015 Aozora Bank, Ltd.All Rights Reserved.
(100 million yen)
ChangeB - A D - C
JGBs 3,459 3,689 1,940 -1,519 20 8 9 -11 Incl. TDB only 1,702 2,902 1,602 -100 -0 0 0 +0 Incl. 15Y floating rate only 1,453 787 338 -1,115 23 8 9 -14
Municipal bonds 169 159 185 +16 1 2 1 +1 Corporate bonds 575 418 393 -182 3 2 0 -3 Equities 295 381 418 +123 6 229 263 +257 Foreign bonds 3,672 3,856 3,704 +32 -108 -14 36 +143
US Treasury 2,060 2,285 2,066 +7 -48 -10 19 +67 MBS 1,128 801 899 -229 -67 -22 -5 +62 German government bonds - 318 285 +285 - 12 16 +16
485 452 454 -30 8 7 5 -2 Others 3,516 4,077 3,200 -315 38 118 201 +164
Hedge funds 79 76 72 -7 21 24 24 +4 ETFs 1,308 2,118 1,444 +136 6 34 111 +105 Investments in limited partnerships 430 405 675 +244 0 3 6 +5 REIT 349 439 482 +133 14 65 59 +45 Investment trusts 1,247 860 324 -923 -3 -9 -2 +1 Others 102 179 204 +101 -0 1 4 +4
Total 11,686 12,580 9,841 -1,846 -40 345 511 +551
Book value
End - Mar.2014 C
Others
Unrealized gains / lossesEnd - Mar.
2015 DEnd - Dec.
2014ChangeEnd - Mar.
2014 AEnd - Mar.
2015 BEnd - Dec.
2014
28
ⅢⅢⅢⅢ. Balance Sheet: Securities
A portion of beneficial interests in investment trusts within ‘monetary claims bought’ is marked at fair value, but the amounts (balance sheet total 0.7 billion yen; valuation gains of 1 million yen as of end-March 2015) are not included in the table above
� Securities were 984.1 billion yen, a decrease of 184.6 billion yen, or 15.8%, compared with end-March 2014� Total unrealized gains amounted to 51.1 billion yen, increasing 55.1 billion yen from
end-March 2014� Unrealized gains on foreign bonds and ETFs increased, in addition to an increase in unrealized gains
on equities in the third quarter due to the public offering of an unlisted stock

Copyright © 2015 Aozora Bank, Ltd.All Rights Reserved.
(100 million yen)
End-Mar. End-Mar. Change
2014 A 2015 B B - A
Capital adequacy ratio 15.13% 14.45% -0.68%
Regulatory capital (A-B) 5,289 5,429 140
Instruments and reserve (A) 5,289 5,453 164
Shareholders' equity 4,946 4,989 43
Others 343 464 121
Regulatory adjustment (B) - 23 23
Risk-weighted assets 34,956 37,570 2,615
Credit risk assets 32,254 34,614 2,361
Market risk assets 1,368 1,478 110
Operational risk assets 1,334 1,478 144
29
ⅣⅣⅣⅣ. Capital Adequacy Ratio (Preliminary)
� Capital adequacy ratio (Basel III basis, domestic standard) was 14.45% (preliminary) as of end-Mar. 2015, and remained at an adequate level
Basel III basis, domestic standard

Copyright © 2015 Aozora Bank, Ltd.All Rights Reserved.
ⅤⅤⅤⅤ. Earnings Forecast for FY2015
� Net income forecast for FY2015 is 43.0 billion yen
(100 million yen)
FY2013Results
FY2014Results
FY2015Full-YearForecast
Net revenue 806 928 960
G&A expenses -393 -402 -430
Business profit 413 527 530
Ordinary profit 522 597 535
Net income 423 437 430
Credit-related expenses -23 47 -15
Net Income per common share 34.87 yen 36.19 yen 36.86 yen
30

Copyright © 2015 Aozora Bank, Ltd.All Rights Reserved.
1st quarter 2nd quarter 3rd quarter Year-end Full-year
Current forecast(FY2015)
18.40 yen
Dividend payment(FY2014)
3.00 yen 3.00 yen 4.00 yen 4.90 yen 14.90 yen
Dividend per common share
31
� Dividend forecast for FY2015 : 18.40 yen per common share� The Bank will continue the payment of quarterly dividends
< Dividend transition >
*The full-year dividend forecast for FY2015 is based on the total dividend amount, which is 50% of the consolidated net income forecast of 43.0 billion yen for the full-year, divided by the total number of common shares issued, excluding treasury stock, as of March 31, 2015
*
ⅥⅥⅥⅥ. Dividend Forecast for FY2015
(Note) From FY2015 onwards, consolidated net income represents ‘profit attributable to owners of parent’ in accordance with the Revised Accounting Standards for Business Combinations and related standards and implementation guidance

Copyright © 2015 Aozora Bank, Ltd.All Rights Reserved.
� FY2014 results
(100 million yen)
RetailBankingGroup
InstitutionalBankingGroup
SpecializedBankingGroup
FinancialMarketsGroup
BusinessGroupTotal
CompanyTotal
RetailBankingGroup
InstitutionalBankingGroup
SpecializedBankingGroup
FinancialMarketsGroup
BusinessGroupTotal
CompanyTotal
Netrevenue 144 223 355 82 804 806 145 266 348 168 927 928
G&Aexpenses -78 -156 -124 -37 -394 -393 -81 -152 -131 -38 -402 -402
Businessprofit 66 67 231 46 410 413 64 114 217 130 525 527
FY2013 Full-Year FY2014 Full-Year
ⅦⅦⅦⅦ. Reference : Results by Business Group
32

Copyright © 2015 Aozora Bank, Ltd.All Rights Reserved. 33
� Non-consolidated net income was 48.3 billion yen, an increase of 6.7 billion yen, or 16.1% year on year� Difference between non-consolidated net income and consolidated net income of 43.7 billion yen
was 4.6 billion yen, mainly due to the recognition in the first quarter of FY2014 of an extraordinary loss of 5.7 billion yen on a consolidated basis only
ⅦⅦⅦⅦ. Reference : Consolidated, Non-consolidated Difference
(100 million yen)
Non-consolidated net income 483
Subsidiaries
Shareholding, etc Net Income
Aozora Trust Bank, Ltd. 100.0% -0
Aozora Securities Co., Ltd. 100.0% 6
Aozora Loan Services Co., Ltd. 67.6% 1
Aozora Regional Consulting Co., Ltd. 100.0% 0
Aozora Investment Management Co., Ltd. 100.0% -2
Aozora Real Estate Investment Advisors Co., Ltd. 100.0% -0
Aozora Asia Pacific Finance Limited (AAPF) 100.0% 4
AZB CLO 1-4 100.0% 1
AZB Funding 1-5 100.0% 1
Aozora Investment, Inc. etc. 100.0% 12
23
-70
Incl. Foreign currency translation adjustment -57
Consolidated net income 437
Difference -46
Company name
Total
Consolidation adjustments

Copyright © 2015 Aozora Bank, Ltd.All Rights Reserved.
� Deferred tax assets were 40.7 billion yen (*1)
(A) Future taxable income for the next 5 years has been conservatively estimated at 183.6 billion yen
(B) The total of future deductible temporary differences realizable within the next 5 years of 109.6 billion yen and tax loss carryforwards of 16.8 billion yen was 126.4 billion yen
Deferred tax assets were calculated at 40.7 billion yen(*1) by multiplying (B), the lesser amount of (A) and (B) above, by the effective tax rate (32.5%)
� Income taxes deferred were a net expense of 6.8 billion yen, which represents the change in the outstanding amount of deferred tax assets from 47.5 billion yen(*2)
as of end-March 2014 to 40.7 billion yen as of end-March 2015
The Bank has been categorized under the ‘proviso of Category No.4 of the judgment guidelines on the realizability of deferred tax assets’
(*1) After deducting deferred tax liabilities of 0.4 billion yen(*2) After deducting deferred tax liabilities of 0.2 billion yen
� Income taxes deferred were a net expense of 6.8 billion yen compared with a net expense of 7.1 billion yen in FY2013 � Income taxes deferred were a net reversal of 5.4 billion yen in the fourth quarter, mainly as a result of
the estimation of taxable losses incurred in previous years as future deductible temporary differences� A net tax expense of approximately 3.9 billion yen was recognized due to a reduction in the corporate
tax rate
ⅦⅦⅦⅦ. Reference : Deferred Tax Assets (Non-consolidated basis)
34

Copyright © 2015 Aozora Bank, Ltd.All Rights Reserved.
@ 1,000
@ 600
Total 1,528 -
24
215
June 2022
June 2022
Conversion price(yen)
200
450
Mandatoryconversion
Current number of commonshares equivalent(million shares)
120
Per share paid-in amount (yen)
Number of shares (million)
286
-- 406
Total paid-in amount (100 million yen)
5th preferred shares 1,287
4th preferred shares 241
(as of end-Mar. 2015)
35
Remaining amount of public funds : 163.9 billion ye n (as of end-Mar. 2015)
Based on the Comprehensive Recapitalization Plan, each June the Bank will make an annual installment repayment of public funds through a super preferred dividend of 20.49 billion yen
<<<<Reference >>>>
� Common shares
� Preferred shares (Public funds)
1,650
-484
1,166
Number of shares issued
Treasury stock
Number of shares(million shares)
Shares outstanding (After deduction of treasury stock)
Common shares
(as of end-Mar. 2015)
ⅦⅦⅦⅦ. Reference : Share Status
Copyright © 2015 Aozora Bank, Ltd.All Rights Reserved.
FY2012Results
FY2013Results
FY2014Results
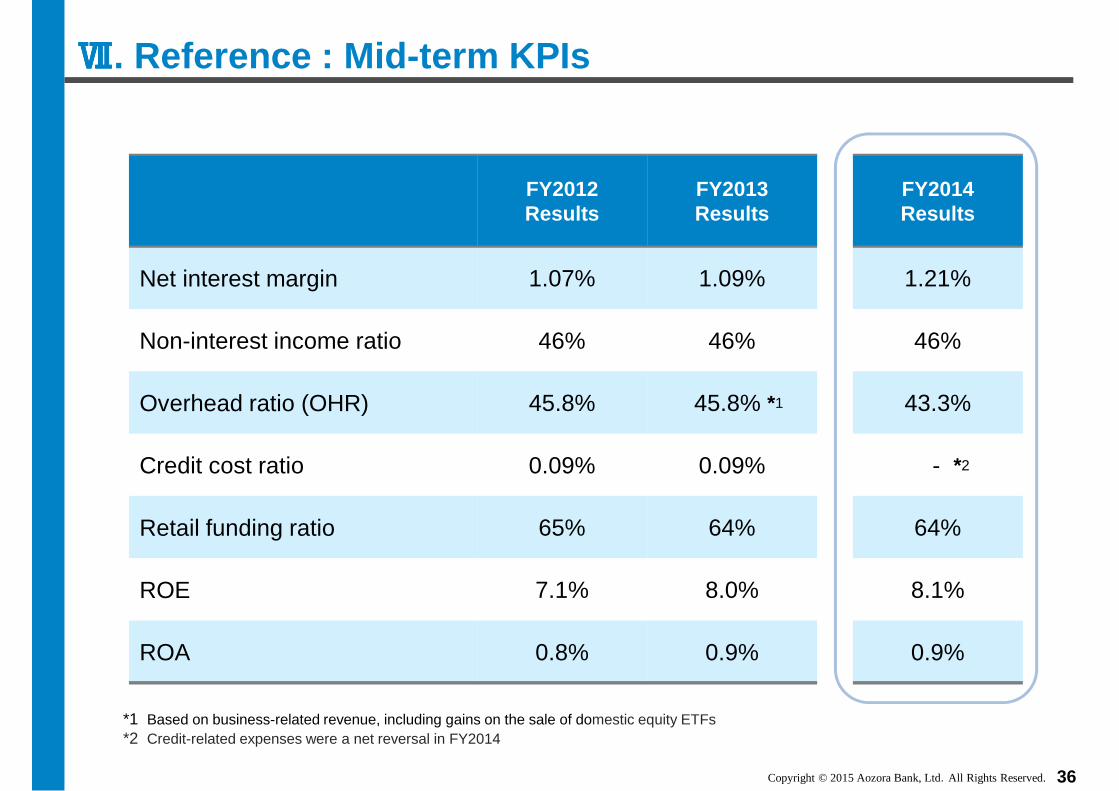
Net interest margin 1.07% 1.09% 1.21%
Non-interest income ratio 46% 46% 46%
Overhead ratio (OHR) 45.8% 45.8% *1 43.3%
Credit cost ratio 0.09% 0.09% - *2
Retail funding ratio 65% 64% 64%
ROE 7.1% 8.0% 8.1%
ROA 0.8% 0.9% 0.9%
*1 Based on business-related revenue, including gains on the sale of domestic equity ETFs*2 Credit-related expenses were a net reversal in FY2014
ⅦⅦⅦⅦ. Reference : Mid-term KPIs
36

Copyright © 2015 Aozora Bank, Ltd.All Rights Reserved. 37
Q&A Session
FY2014 Financial Results
Early and Full Repayment of Public Funds; New Mid-Term Plan

Copyright © 2015 Aozora Bank, Ltd.All Rights Reserved.
Appendix
38

Copyright © 2015 Aozora Bank, Ltd.All Rights Reserved.
� Headquarters: Chiyoda-ku, Tokyo
� Total Assets: JPY 4,924.5bn
� Credit Ratings: A- / A- / A- / Baa2 (S&P / R&I / JCR / Moody’s)
� Office Network:
� Domestic: 21 offices nationwide� Overseas: New York, Shanghai,
Singapore, Hong Kong
� Major Subsidiaries:
�Aozora Trust Bank, Ltd.
�Aozora Loan Services Co., Ltd.
�Aozora Securities Co., Ltd.
�Aozora Regional Consulting Co., Ltd.
�Aozora Investment Management Co., Ltd.
�Aozora Real Estate Investment Advisors Co., Ltd.
�Aozora Asia Pacific Finance Limited
� Full-time Employees: 1,661
(as of end-Mar. 2015)
� History� Franchise
� 1957: Established as The Nippon Fudosan Bank,Limited
� 1977: Changed name to The Nippon CreditBank, Ltd.
� 1998: Temporarily nationalized
� 2000: Re-privatized
� 2001: Changed name to Aozora Bank, Ltd.
� 2003: Through a common stock tender offer,Cerberus group became the largest shareholder
� 2006: Listed on the First Section of the TokyoStock Exchange
� 2012: Announced ComprehensiveRecapitalization Plan
� 2013: Major shareholder Cerberus group sold itsAozora common shares
Aozora at a Glance
39

Copyright © 2015 Aozora Bank, Ltd.All Rights Reserved.
〔1,166〕 〔1,166〕〔1,166〕〔1,496〕
346 (30%)
524 (45%)
272 (23%)
24 (2%)
293 (25%)
481 (41%)
265 (23%)
97 (8%)
31 (3%)
277 (24%)
518 (44%)
352 (30%)
20 (2%)
104 (7%)
313 (21%)
243 (16%)
821 (55%)
15 (1%)
52,761 64,50832,017 57,908
Shareholder Composition
Unit: Million shares% shows ratio of voting rights
No. of shares outstanding, excl. Treasury stock
# of retailshareholders
40

Copyright © 2015 Aozora Bank, Ltd.All Rights Reserved.
� 4 out of the 8 board members are outside directors; 2 out of 3 members of the Audit and Supervisory Board are outside members
� Audit & Compliance Committee and Nomination & Remuneration Committee mainly comprising outside directors / Audit & Supervisory board members
Corporate Governance
< Governance System >
41

Copyright © 2015 Aozora Bank, Ltd.All Rights Reserved.
Management Team
� Makoto Fukuda Director and ChairmanFormer Deputy Chairman and Senior Managing Director of the Regional Banks Association of Japan
� Shinsuke Baba Representative Director, President and CEO Appointed Representative Director and Deputy President in 2009 and Representative Director, President and CEO in 2012
� Masaki Tanabe Representative Director, Deputy President and CFO Appointed CFO in 2008 and Representative Director and Deputy President in 2013
� Takeo Saito Director, Senior Managing Executive Officer, CRO and CCRO Appointed MEO, Head of Financial Markets Group, in 2013. SMEO, CRO and CCRO in 2014
� Clark D. Graninger MEO, Head of Retail Banking Group
� Katsuya Hosono MEO, Head of Corporate Banking Group
� Kei Tanikawa MEO, Head of Allied Banking Group
� Koji Yamakoshi EO, Head of Specialty Finance Group (Real Estate Finance and Domestic Business)
� Keiichi Asada EO, Head of Business Banking Group
� Masayoshi Ohara EO, Head of Financial Markets Group
� Hideaki Kuraishi EO, Head of International Finance Group (International)
� Masaki Yamagata SMEO, Corporate Strategy Officer and Head of Compliance & Governance
� Masatatsu Ozeki MEO, CTO
� Jorge A. Leon EO
� Tomomi Akutagawa EO, Deputy CFO
� Masaaki Harada EO, Head of Human Resources
� Yukio Sekizawa EO, Deputy CTO
� Fumihiko Hirose EO, Deputy CCRO
42

Copyright © 2015 Aozora Bank, Ltd.All Rights Reserved.
> 6mn2mn–6mnPopulation< 2mn
Source: MIS Statistics Bureau (as of Oct. 1, 2014)
Sapporo
Sendai
Head Office +7 branches and offices in Tokyo
Fukuoka
Hiroshima
Kansai, Osaka and Umeda
Kyoto
Kanazawa
Nagoya
Takamatsu
Yokohama
Chiba
Head Office, Domestic Branches and Offices
Domestic Network:
(as of end-Mar. 2015)
Aozora Network
Overseas Network:
New YorkShanghai
Singapore
Hong Kong
43

Copyright © 2015 Aozora Bank, Ltd.All Rights Reserved.
This presentation contains forward-looking statements regarding the Bank’s financial condition and results of operations. These forward-looking statements, which include the Bank’s views and assumptions with respect to future events, involve certain risks and uncertainties. Actual results may differ from forecasts due to changes in economic conditions and other factors including the effects of changes in general economic conditions, changes in interest rates, stock markets and foreign currency, and any ensuing decline in the value of our securities portfolio, incurrence of significant credit-related cost and the effectiveness of our operational, legal and other risk management policies
< Inquiries >
AOZORA BANK, LTD.
Corporate Communication Division
TEL: 03-5212-9253
FAX: 03-3239-8065
URL: http://www.aozorabank.co.jp/english/
Mr. Hiroyuki Kajitani [email protected]
Ms. Junko Matsumoto [email protected]
Mr. Yasunari Shimizu [email protected]
Mr. Sohei Ito [email protected]
Ms. Yasuko Fukai [email protected]