Embed Size (px)
Citation preview

“The Role of Renewable Energy, Cogeneration and gy, gDistributed Generation in Sustainable Energy
Development in Thailand”
Piyasvasti AmranandChief Advisor to Energy for Environment Foundationgy
World Renewable Energy Congress 2009 - AsiaWorld Renewable Energy Congress 2009 AsiaBITEC, Bangkok, Thailand
20 May 2009y

CHP/DG has grown significantly in Thailand over the past 17 yearsC / G s g ow s g c y d ove e p s 7 ye s
•SPP/VSPP: regulations issued in Power Purchase from SPP/VSPP1993•SPP/VSPP: cogeneration or generation of power from RE•Most SPP/VSPP are CHP/DG
14,000
16,000
10.0%
12.0%
GWh% of system generation
Most SPP/VSPP are CHP/DG•SPP: sale of excess power to grid 10-90 MW•VSPP: sale of excess power to
8 000
10,000
12,000
Wh
6 0%
8.0%
% grid < 10 MW•Direct sale without using utility’s wires allowed•10% of national power supply is4,000
6,000
8,000
GW
4.0%
6.0% %
10% of national power supply is from SPP. But if direct sale is included, power generation from SPP/VSPP accounts for 16% of 0
2,000
0.0%
2.0%
total electricity generation1993 1994 1995 1996 1997 1998 1999 2000 2001 2002 2003 2004 2005 2006 2007 2008

SPP/VSPP in operationSPP/VSPP Projects in Operation
Number Gen. Capacity Power Sale
as of Dec. 2009 (MW) (MW)
Cogeneration/Fossil fuels 28 2,741 1,676
Natural Gas 21 2,319 1,465
Coal 6 411 202
Oil 1 10 9
Non-conventional 145 1,269 621
Biomass 67 1,213 589
Bagasse 33 675 214
Rice Husk 14 107 88
Woodchips, Wood, Saw Dust 3 36 27
Palm Wastes 3 23 18
Black Liquor or mixture 2 108 75
Mixed Biomass and Others 12 265 166
Wastes 4 6.4 3.5
Bi 24 26 2 19 5 Biogas 24 26.2 19.5
Solar 45 1.8 1.8
Wind 1 0.08 0.08
Hydro 2 0.08 0.06
Others 2 21 8 Others 2 21 8
SPP- Mixed fossil+Non-conventional 4 476 233
Total Non-conventional 149 1,745 854
Grand Total 177 4,486 2,530

SPP CHP/DHCGlow SPP Industrial Cogen
SPP CHP/DHC• 61% of capacity is cogen
using fossil fuelsusing fossil fuels• One District Cooling
project (Suvarnabhumi airport
Palm Wastes Suvarnabhumi airportPalm Wastes Suvarnabhumi airport
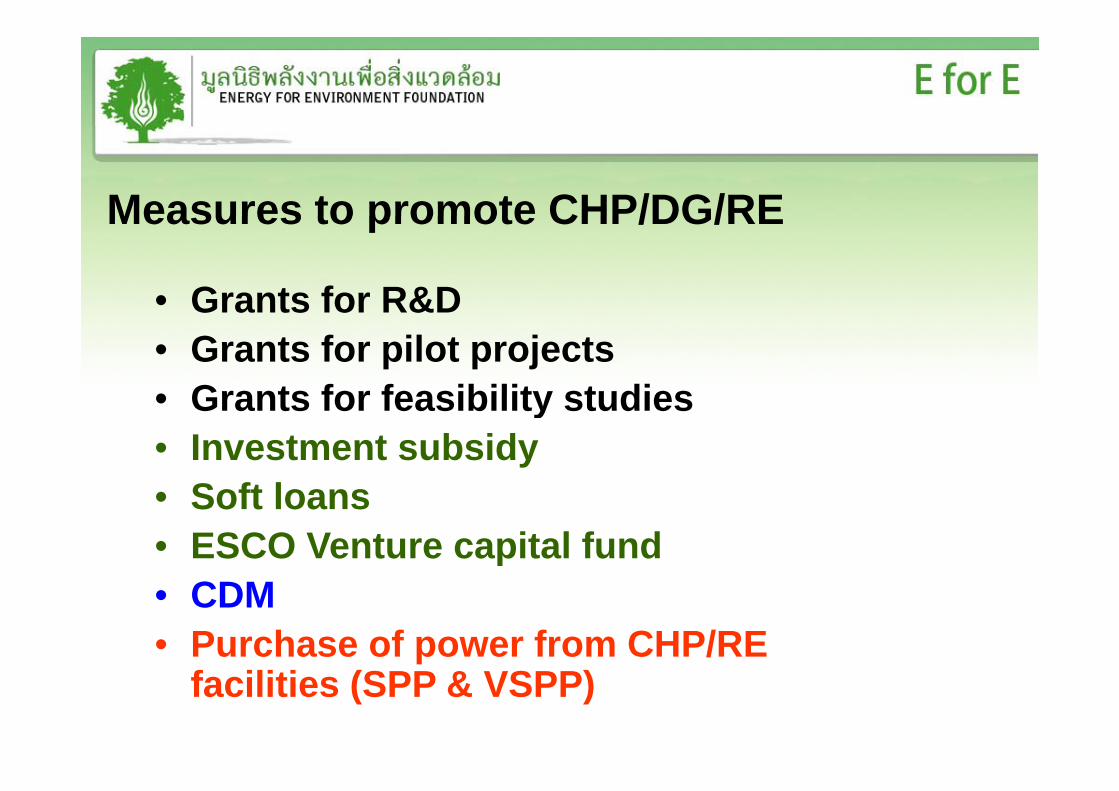
Measures to promote CHP/DG/REMeasures to promote CHP/DG/RE
• Grants for R&DGrants for R&D• Grants for pilot projects• Grants for feasibility studies• Grants for feasibility studies• Investment subsidy
S ft l• Soft loans• ESCO Venture capital fund• CDM• Purchase of power from CHP/RE
facilities (SPP & VSPP)

SPP & VSPPSPP & VSPP
VSPP(< 10 MW)
SPP(> 10 MW-< 90 MW)
Current sale to grid 2,286 MW
Total planned purchase 4 000 MWCurrent sale to grid 245 MW
R blF il F l R bl F il F l
Total planned purchase 4,000 MW
RenewableFossil Fuel Cogeneration
Renewable Fossil Fuel Cogeneration
Adder toCompetitive bidding for Adder to
normal tariffbidding for biomass

ESCO Venture ESCO Venture Capital FundCapital Fund Energy
Conservation Promotion FundPromotion Fund
500 500 Million BahtMillion Baht
ESCO Fund Investment Committee
Fund ManagerFund Manager11. E for E (. E for E (250 250 Million Baht)Million Baht) 22. ECFT (. ECFT (250 250 Million Baht)Million Baht)
Equity InvestmentESCO Venture Capital Equipment Leasing
Technical AssistanceCarbon Credit Market Credit Guarantee Facility
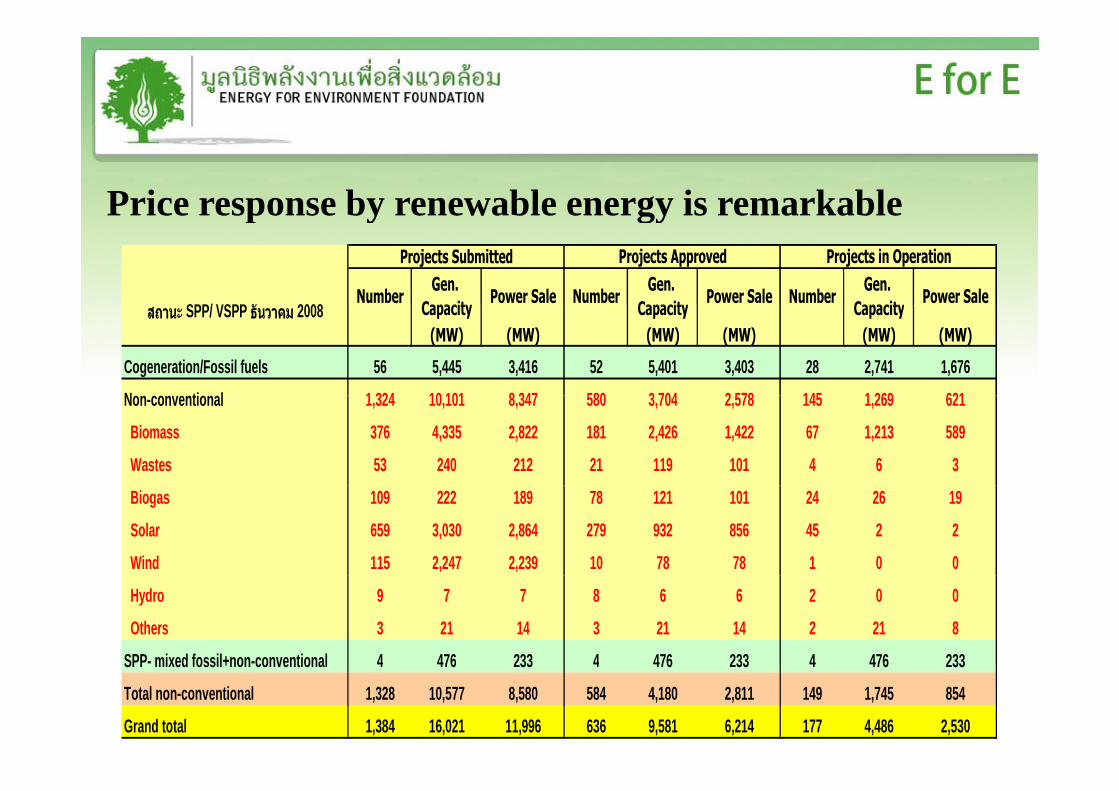
Price response by renewable energy is remarkablep y gy
SPP/ VSPP ั 2008Number
Gen. Capacity
Power Sale NumberGen.
CapacityPower Sale Number
Gen. Capacity
Power Sale
Projects Submitted Projects Approved Projects in Operation
สถานะ SPP/ VSPP ธันวาคม 2008 Capacity Capacity Capacity(MW) (MW) (MW) (MW) (MW) (MW)
Cogeneration/Fossil fuels 56 5,445 3,416 52 5,401 3,403 28 2,741 1,676
N ti l 1 324 10 101 8 347 580 3 704 2 578 145 1 269 621Non-conventional 1,324 10,101 8,347 580 3,704 2,578 145 1,269 621
Biomass 376 4,335 2,822 181 2,426 1,422 67 1,213 589
Wastes 53 240 212 21 119 101 4 6 3
Biogas 109 222 189 78 121 101 24 26 19
Solar 659 3,030 2,864 279 932 856 45 2 2
Wind 115 2,247 2,239 10 78 78 1 0 0
Hydro 9 7 7 8 6 6 2 0 0
Others 3 21 14 3 21 14 2 21 8
SPP- mixed fossil+non-conventional 4 476 233 4 476 233 4 476 233SPP mixed fossil+non conventional 4 476 233 4 476 233 4 476 233
Total non-conventional 1,328 10,577 8,580 584 4,180 2,811 149 1,745 854
Grand total 1,384 16,021 11,996 636 9,581 6,214 177 4,486 2,530
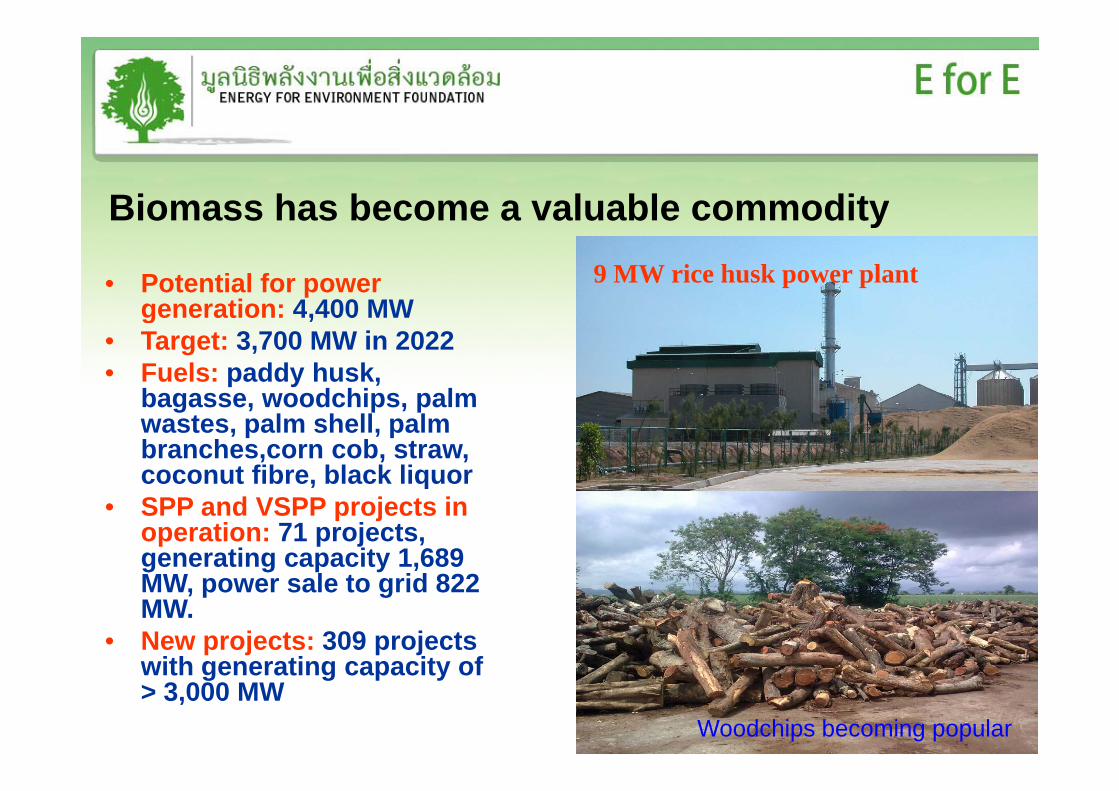
Biomass has become a valuable commodityBiomass has become a valuable commodity
• Potential for power generation: 4 400 MW
9 MW rice husk power plantgeneration: 4,400 MW
• Target: 3,700 MW in 2022• Fuels: paddy husk,
bagasse woodchips palmbagasse, woodchips, palm wastes, palm shell, palm branches,corn cob, straw, coconut fibre, black liquor, q
• SPP and VSPP projects in operation: 71 projects, generating capacity 1,689 MW l t id 822MW, power sale to grid 822 MW.
• New projects: 309 projects with generating capacity ofwith generating capacity of > 3,000 MW
Woodchips becoming popular
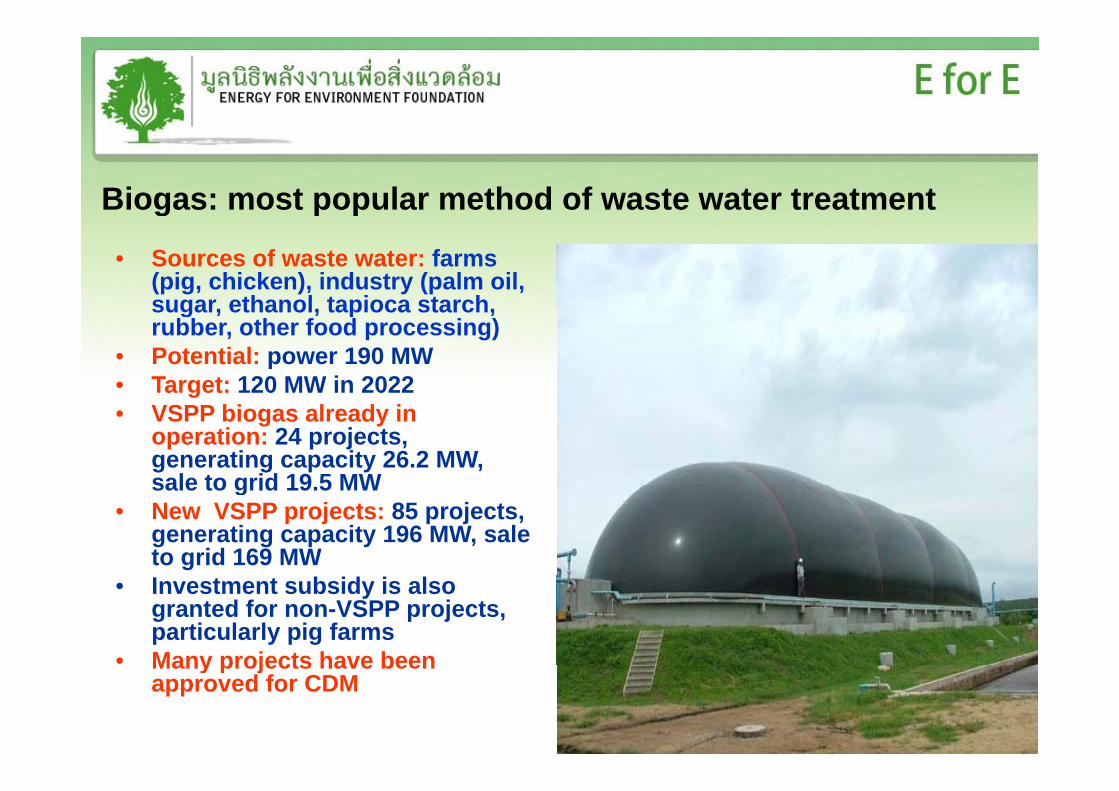
Biogas: most popular method of waste water treatmentg
• Sources of waste water: farms (pig, chicken), industry (palm oil, sugar ethanol tapioca starchsugar, ethanol, tapioca starch, rubber, other food processing)
• Potential: power 190 MW• Target: 120 MW in 2022g• VSPP biogas already in
operation: 24 projects, generating capacity 26.2 MW, sale to grid 19 5 MWsale to grid 19.5 MW
• New VSPP projects: 85 projects, generating capacity 196 MW, sale to grid 169 MW
• Investment subsidy is also granted for non-VSPP projects, particularly pig farms
• Many projects have beenMany projects have been approved for CDM

Wastes to energy projects are finally movingWastes to energy projects are finally moving• Amount of municipal waste in
Thailand per day: BMA 9,300 tons, municipal areas 12,500 tons, outside municipal areas 18,100 tons
• Potential for power generation: 320 MW
• Target for 2022: 160 MW• Technologies: incineration, landfill,
anaerobic digestion• 1/3 of MSW is plastics which could p
be used to produce oil• SPP and VSPP in operation: 4
projects with generating capacity of 6.4 MW
• New projects: 49 projects with generating capacity of 234 MW
• CDM could substantially improve economics
• Small non-VSPP projects; biogas system using wastes form schools, hotels to replace LPG 1 MW landfill VSPP in Nakorn Pathom

Rapid growth in solar VSPPs?Rapid growth in solar VSPPs?
• Current solar capacity: 32 MW,Current solar capacity: 32 MW, mainly off-grid
• Grid connected solar roof top:32 projects in operation with p j pgenerating capacity of 0.14 MW
• Solar farm: 3 projects in operation (EGAT+ 2 private) with t t l ti it f 2 2total generating capacity of 2.2 MW
• Target for 2022: 500 MWNe solar VSPP >600 projects• New solar VSPP: >600 projects with generating capacity of ~ 3,000 MW (solar cells + Concentrating Thermal SolarConcentrating Thermal Solar Power (CSP))
1.5 MW solar farm in Bangpakong
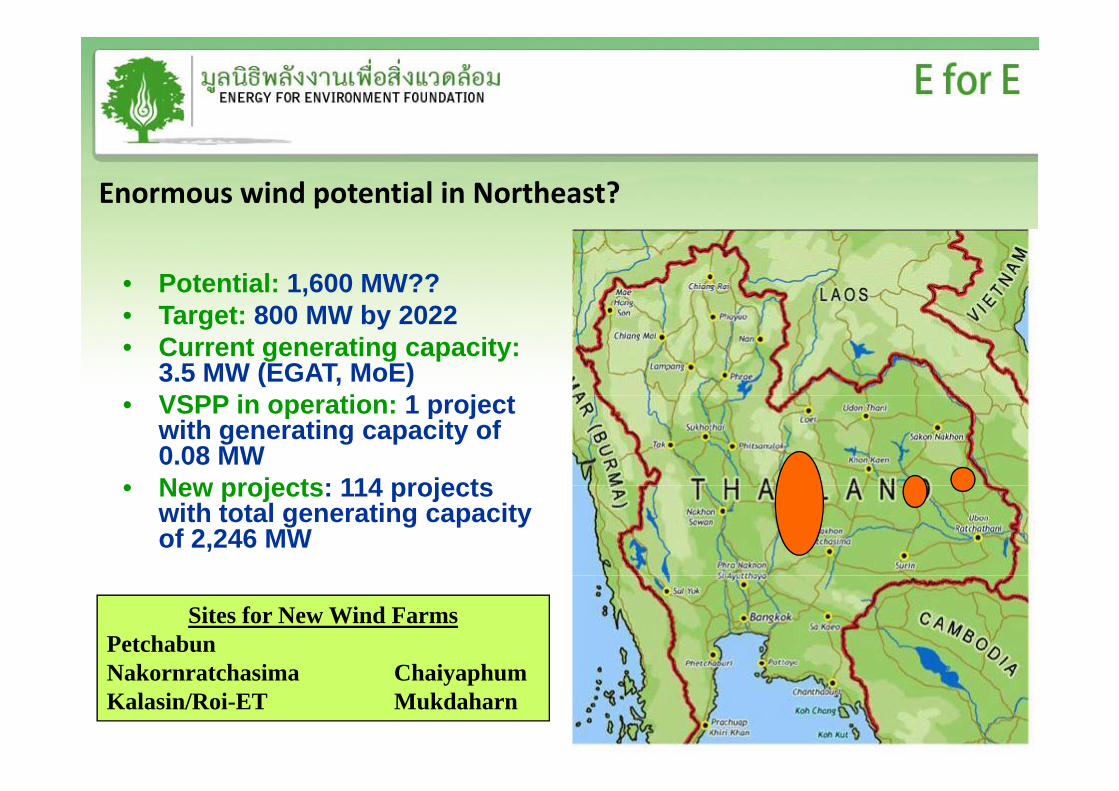
Enormous wind potential in Northeast?
• Potential: 1,600 MW?? T t 800 MW b 2022• Target: 800 MW by 2022
• Current generating capacity:3.5 MW (EGAT, MoE)VSPP i ti 1 j t• VSPP in operation: 1 project with generating capacity of 0.08 MW
• New projects: 114 projects• New projects: 114 projects with total generating capacity of 2,246 MW
Sites for New Wind FarmsPetchabunN k h i Ch i hNakornratchasima ChaiyaphumKalasin/Roi-ET Mukdaharn
Revival of mini and micro hydro projectsRevival of mini and micro hydro projects
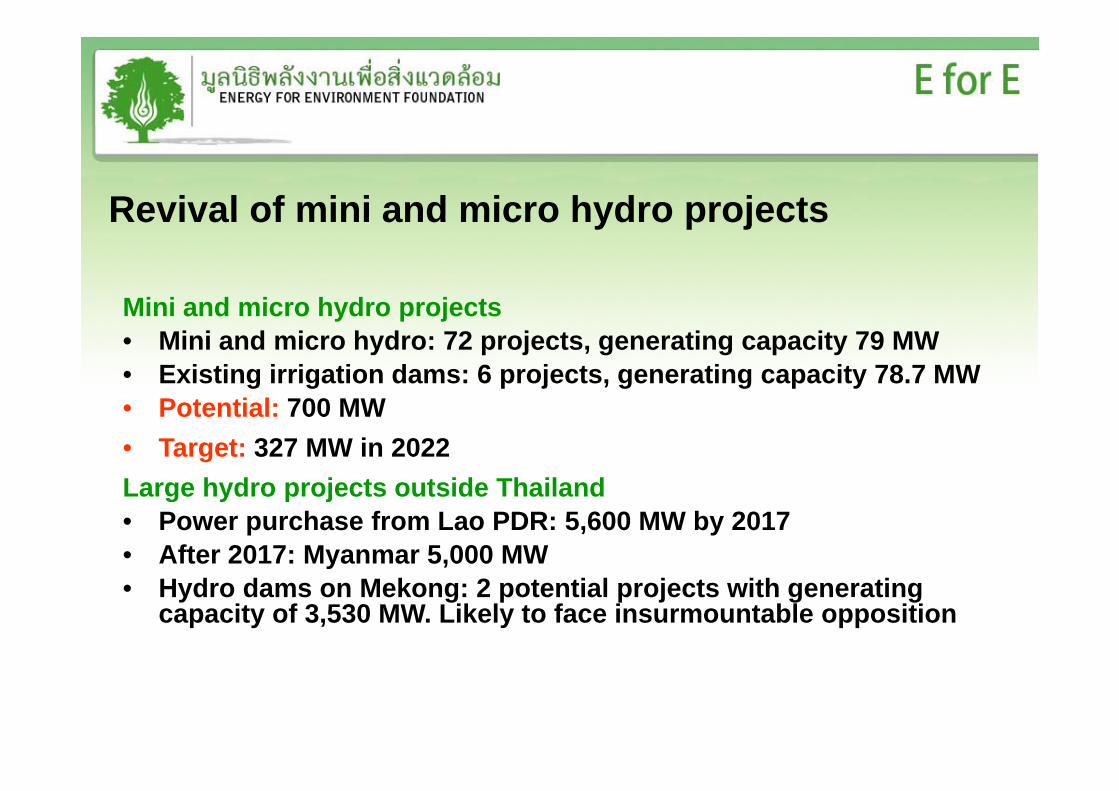
Mini and micro hydro projectsMini and micro hydro projects• Mini and micro hydro: 72 projects, generating capacity 79 MW • Existing irrigation dams: 6 projects, generating capacity 78.7 MW• Potential: 700 MW• Target: 327 MW in 2022Large hydro projects outside ThailandLarge hydro projects outside Thailand• Power purchase from Lao PDR: 5,600 MW by 2017• After 2017: Myanmar 5,000 MW• Hydro dams on Mekong: 2 potential projects with generating
capacity of 3,530 MW. Likely to face insurmountable opposition
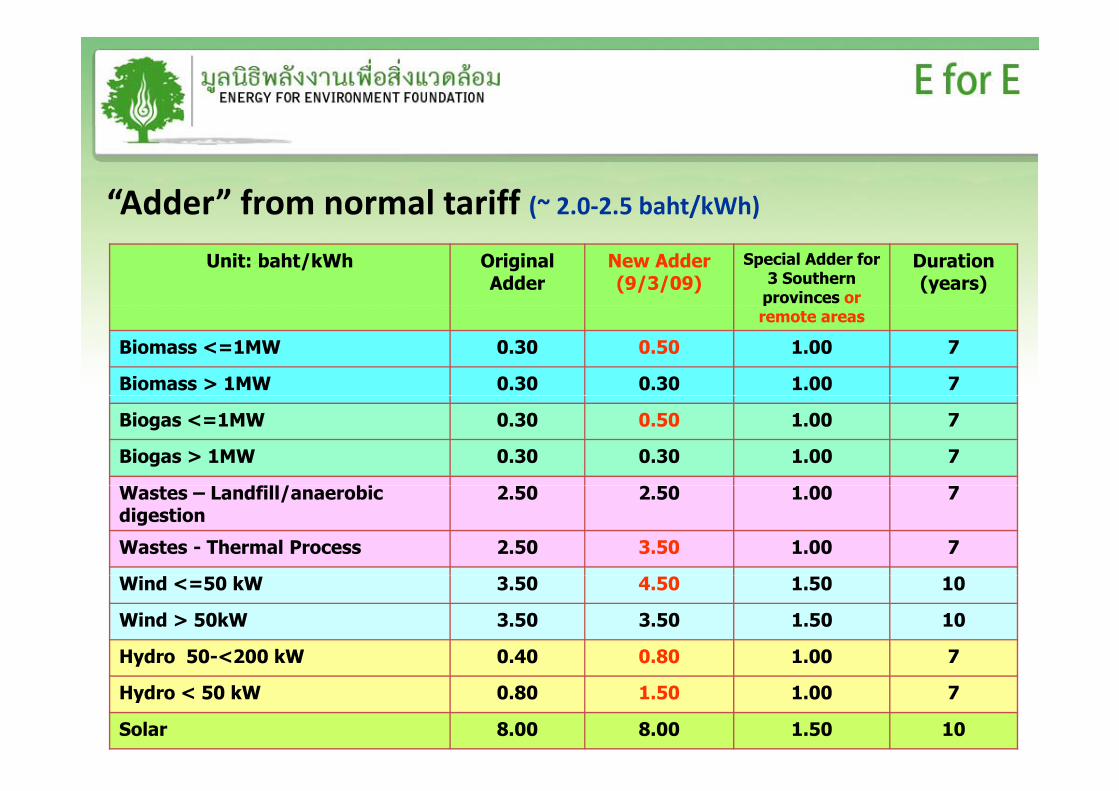
“Adder” from normal tariff (~ 2.0‐2.5 baht/kWh)( / )
Unit: baht/kWh Original Adder
New Adder (9/3/09)
Special Adder for 3 Southern
provinces or
Duration (years)
premote areas
Biomass <=1MW 0.30 0.50 1.00 7
Biomass > 1MW 0.30 0.30 1.00 7
Biogas <=1MW 0.30 0.50 1.00 7
Biogas > 1MW 0.30 0.30 1.00 7
dfill/ biWastes – Landfill/anaerobic digestion
2.50 2.50 1.00 7
Wastes - Thermal Process 2.50 3.50 1.00 7
Wind <=50 kW 3.50 4.50 1.50 10
Wind > 50kW 3.50 3.50 1.50 10
Hydro 50-<200 kW 0.40 0.80 1.00 7y
Hydro < 50 kW 0.80 1.50 1.00 7
Solar 8.00 8.00 1.50 10
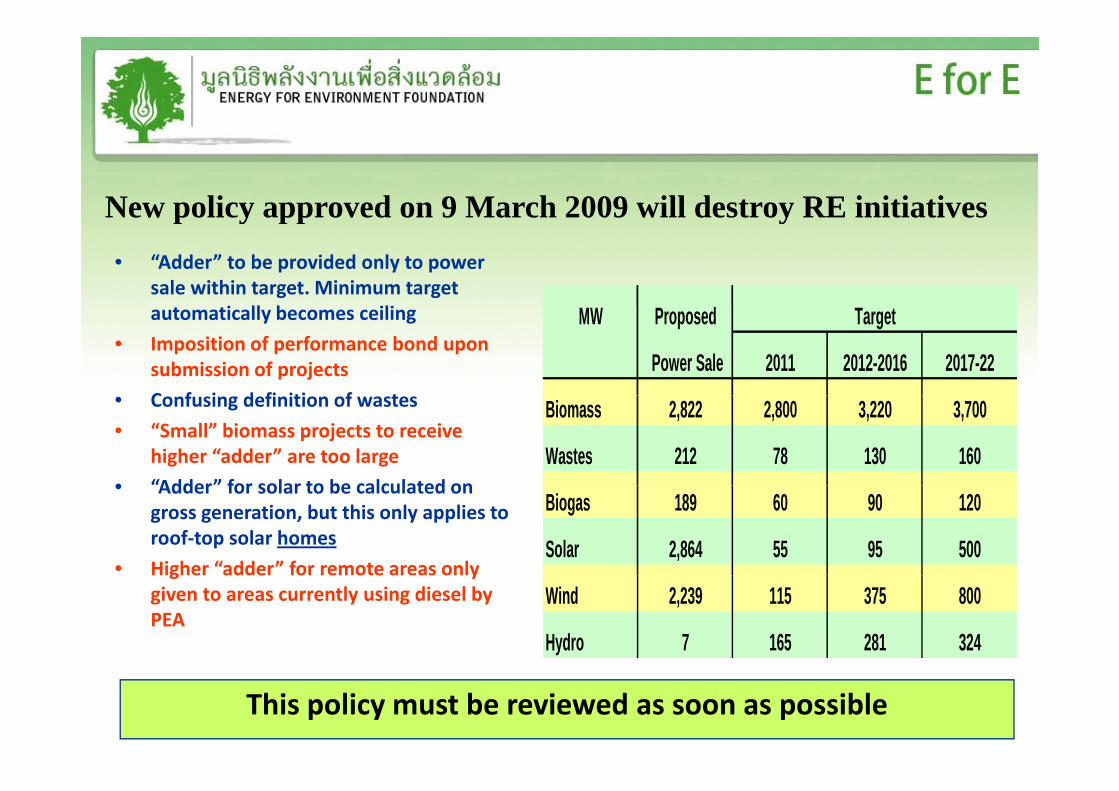
New policy approved on 9 March 2009 will destroy RE initiativesNew policy approved on 9 March 2009 will destroy RE initiatives• “Adder” to be provided only to power
sale within target. Minimum target i ll b iliautomatically becomes ceiling
• Imposition of performance bond upon submission of projects
C f i d fi iti f t
MW Proposed
Power Sale 2011 2012-2016 2017-22
Target
• Confusing definition of wastes
• “Small” biomass projects to receive higher “adder” are too large
• “Adder” for solar to be calculated on
Biomass 2,822 2,800 3,220 3,700
Wastes 212 78 130 160• Adder for solar to be calculated on
gross generation, but this only applies to roof‐top solar homes
• Higher “adder” for remote areas only
Biogas 189 60 90 120
Solar 2,864 55 95 500Higher adder for remote areas only given to areas currently using diesel by PEA
Wind 2,239 115 375 800
Hydro 7 165 281 324
This policy must be reviewed as soon as possible
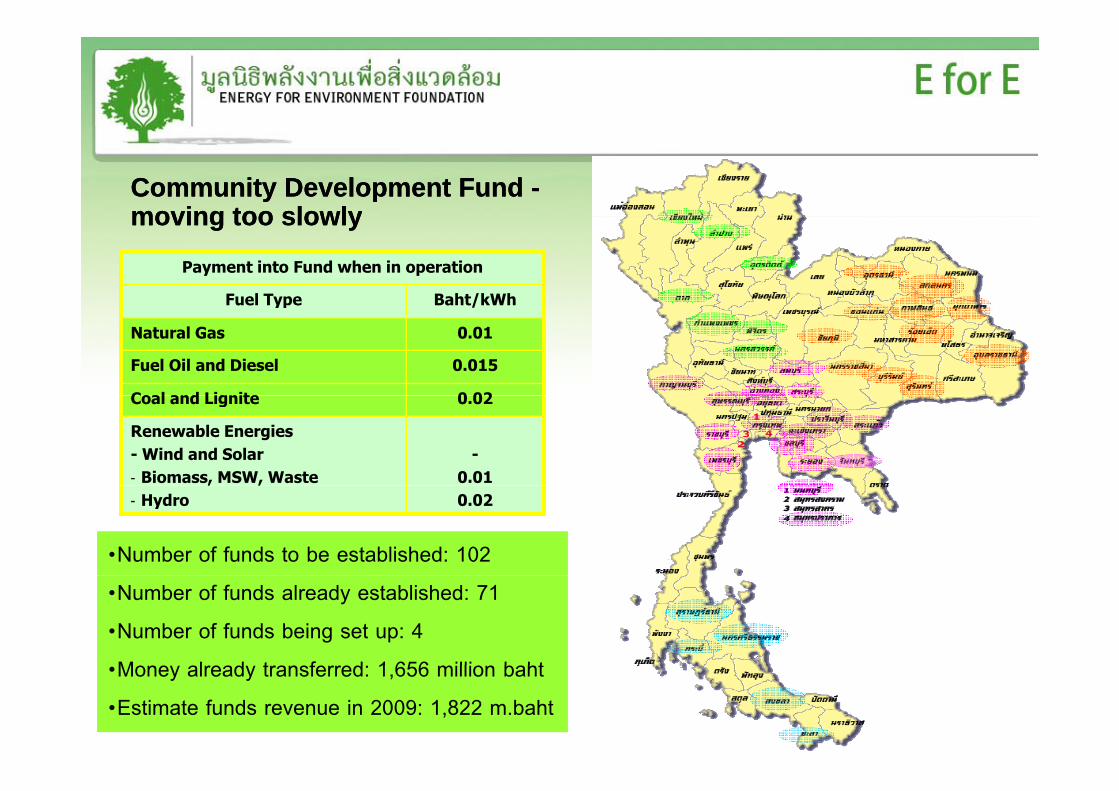
Community Development Fund Community Development Fund --moving too slowlymoving too slowlymoving too slowlymoving too slowly
Payment into Fund when in operation
Fuel Type Baht/kWhyp /
Natural Gas 0.01
Fuel Oil and Diesel 0.015
Coal and Lignite 0 02Coal and Lignite 0.02
Renewable Energies- Wind and Solar- Biomass, MSW, Waste
-0.01, ,
- Hydro 0.02
•Number of funds to be established: 102
•Number of funds already established: 71
•Number of funds being set up: 4
M l d t f d 1 656 illi b ht•Money already transferred: 1,656 million baht
•Estimate funds revenue in 2009: 1,822 m.baht

Energy Industry Act is powerful tool to promote CHP/DG/REe gy dust y ct s po e u too to p o ote C / G/
• Establishment “Energy Regulatory Commission” (ERC) as an independent regulator of the electricity and natural gas supplyindependent regulator of the electricity and natural gas supply industries
• Clear separation between authority of ERC and Energy Ministry• ERC responsible for economic and technical regulations• ERC responsible for economic and technical regulations• ERC consists of 7 member board for a term of 6 years• Energy Industry Act became law on 11 December 2007 and
commissioner appointments endorsed by the King on 1 February 2008
• Interim regulation issued on 30 January 2008 for transition g yperiod
• Regulations are gradually being issued but far from complete

Licenses: generation/sale of power< 1,000 kVA exemptedLicenses: generation/sale of power< 1,000 kVA exempted
Types of Licenses from Maximum Duration
Permit Fees (B ht/F ilit )
Annual Operation FERC Duration
(Years)(Baht/Facility) Fees
Power Generation 25 5,000-50,000 5 Baht/kVA
Power Transmission 30 50,000 2,500 Baht/km
Power Distribution 30 50,000 1 Baht/kW
Power Retail Business 15 50 000 0 001 Baht/kWhPower Retail Business 15 50,000 0.001 Baht/kWh
Power System Operation 30 50,000 20 M.Baht/Year
Natural Gas Transmission 50,000 24,500 Baht/km
20
, ,
Natural Gas Supply & Wholesale 50,000 0.05 Baht/MMBTU
Natural Gas Retail/Distribution 50,000 0.05 Baht/MMBTU
Natural Gas Storage & Regasification
50,000 5 Baht/Ton

Another 2,000 MW of CHP during 2009-18 is possibleAnother 2,000 MW of CHP during 2009 18 is possible
Power Purchase from SPP/VSPP under latest plan
25,000
30,000
14.0%
16.0%
GWh% of system generation Total sale to grid by CHP:
4 000+2 000 = 6 000 MW
20,000
h
10.0%
12.0% 4,000+2,000 = 6,000 MW
•Growth in industry•Availability of natural gas
10,000
15,000
GW
h
6.0%
8.0% %
y gsupply in new locations•Efficiency improvements by existing industry
5,0002.0%
4.0%
0
1993 1995 1997 1999 2001 2003 2005 2007 2009 2011 2013 2015 2017 2019 2021
0.0%

RE Target is far too low: 8,000 MW RE capacity is possibleRE Target is far too low: 8,000 MW RE capacity is possible
Proposed Power Purchase from SPP/VSPP RE
8,000
9,000
Original target: 5,604 MW in 2021
5 000
6,000
7,000OthersHydroWind
3 000
4,000
5,000
MW Solar
BiogasWastesBiomass
1 000
2,000
3,000
0
1,000
2008 2009 2010 2011 2012 2013 2014 2015 2016 2017 2018 2019 2020 2021

EfE’s proposed power purchase from SPP/VSPPEfE s proposed power purchase from SPP/VSPP
Power Purchase from SPP/VSPP Cogen and RE
60,000
70,000SPP RE+VSPP (Proposed Addition)SPP Cogen (Proposed Addition)SPP RE+VSPP (PDP Mar 2009)
Proposed addition40,000
50,000SPP Cogen (PDP Mar 2009)SPP+VSPP
Existing30,000
GW
h
PDP Mar 200910,000
20,000
0
1993
1995
1997
1999
2001
2003
2005
2007
2009
2011
2013
2015
2017
2019
2021

Decline in GHG emission from power sector under EfE’s proposalp p p
Carbon Dioxide Emission from Electricity Generation150 150 Lower CO2 emission is due to
•Much higher RE and CHP•Speed up of nuclear program•Higher hydropower
140
150
140
150
PDP 2007 (Mar 2009 adjustment)
•Higher hydropower development in neighbouring countries120
130
s
120
130
s
PDP 2007 (proposed adjustment toMar. 2009)
Unclear national policy100
110
M. T
on
100
110
M.T
ons
Unclear national policy on global warming has caused wavering support for RE and nuclear80
90
80
90
for RE and nuclear
702007 2008 2009 2010 2011 2012 2013 2014 2015 2016 2017 2018 2019 2020 2021
70