Embed Size (px)
Citation preview
“MOLECULAR AND AGRO-MORPHOLOGICAL
CHARACTERIZATION OF SELECTED RICE (Oryza sativa L.)
GERMPLASM ACCESSION BASED ON GRAIN LENGTH”
M. Sc. (Ag.) Thesis
by
SUMAN RAWTE
DEPARTMENT OF GENETICS AND PLANT BREEDING
COLLEGE OF AGRICULTURE
INDIRA GANDHI KRISHI VISHWAVIDYALAYA
RAIPUR (CHHATTISGARH)
2016
“MOLECULAR AND AGRO-MORPHOLOGICAL
CHARACTERIZATION OF SELECTED RICE (Oryza sativa L.)
GERMPLASM ACCESSION BASED ON GRAIN LENGTH”
Thesis
Submitted to the
Indira Gandhi Krishi Vishwavidyalaya, Raipur
By
SUMAN RAWTE
IN PARTIAL FULFILMENT OF THE REQUIREMENTS
FOR THE DEGREE OF
Master of Science
in
Agriculture
(Genetics and Plant Breeding)
Roll No. 120114118 ID No. 2014520336
JULY, 2016
iii
ACKNOWLEDGEMENT
I would like to take this opportunity to first and foremost thank God for being my
strength and guide in the writing of this thesis. Without Him, I would not have had the
wisdom or the physical ability to do so.
I take immense pleasure to express my sincere and deep sense of gratitude to my major
advisor Dr. Ritu R. Saxena, Associate Professor, Department of Genetics and Plant Breeding,
Indira Gandhi Krishi Vishwavidyalaya, Raipur (C.G.), for her sustained enthusiasm, creative
suggestions, motivation and exemplary guidance throughout the course of my master research.
She has gone beyond the call of a thesis advisor to assume the role of an academic mother, apart
from the subject of my research, I learnt a lot from her, which I am sure will be useful in
different stages of my life. I solemnly submit my honest and humble thanks to her for bringing
my dreams into reality.
I emphatically and gratefully acknowledge extend my loyal and venerable thanks to
members of my Advisory Committee, Dr. A.K. Sarawgi, Professor and Head, Department of
Genetics and Plant Breeding, Dr. N. Mehta, Principal Scientist (Linseed), Department of
Genetics and Plant Breeding, Dr. S.B. Verulkar, Professor and Head, Department of Plant
Molecular Biology and Biotechnology, Dr. R.R. Saxena, Professor (ADR), Department of
Agriculture Statistics and Social Science, College of Agriculture, IGKV, Raipur. They were
always ready to provide valuable guidance, regular encouragement and timely advice whenever
required for enriching with productive scientific discussion, during the most trying times in the
tenure of this research work.
I wish to record my grateful thanks to Dr. S. K. Patil, Hon’ble Vice Chancellor, Shri
K. C. Paikra, Registrar, Dr. J.S. Urkurkar, Director Research Services, Dr. S. S. Shaw,
Director of Instructions and Dr. S.S. Rao, Dean, College of Agriculture, IGKV, Raipur for
providing necessary facilities technical and administrative supports for conductance of this
research work.
I am immensely thankful to Dr. P. K. Chandrakar, Dr. N.K. Motiramani, Dr. R. N.
Sharma, Dr. H. C. Nanda, Dr. Nandan Mehta, Dr. P. K. Joshi, Dr. N. K. Rastogi, Dr. Rajeev
Shrivastava , Dr. Sandeep Bhandarkar, Dr. S. K. Nair, Shri P. L. Johnson, Dr. G. R. Sahu,
Dr. Ravindra K. Verma, Dr.(Smt.) Alice Tirkey, Shri Sunil K. Nag, Smt. Mangla Parikh, Dr.
iv
Bhawana Sharma, Dr. Mayuri Sahu, Dr.(Smt) Prabha R. Chowdhri, Ku. Krishna Tandekar,
for their co-operation and support during my work period for their encouragement and constant
help throughout course of my studies. I extend my thanks to other non-teaching staff of
Department of Genetics and Plant Breeding for their timely cooperation. I would like to
specially thanks to Smt. Pratibha Mohan, RA, Department of Plant Molecular Biology and
Biotechnology, COA, IGKV Raipur, for her kind help and valuable suggestions during the
course of investigation.
I would like to express my sincere gratitude to Dr. Madhav Pandey (Librarian, Nehru
Library, IGKV, Raipur) and all other members of the Nehru Library for giving me their kind
help during the study. My sincere thanks are extended to non- teaching staffs, Lime Dai, and
Radha didi of the Department of Genetics and Plant Breeding, Manish Bhaiya and Moti
Bhaiya, Department of Plant Molecular Biology and Biotechnology.
I sincerely acknowledge my seniors Mr. Hemant Sahu, Miss Namrata Dirhi, Miss
Pooja Yadav, Miss Nirmala Bharti Patel, Mr. Umesh Deshmukh, Mr. Vikas Kumar for their
support and encouragement in my studies and research work. It is with immense pleasure I
express my thankfulness to my batch mates Pratima, Anjali, Neelima, Meenu and many others
who helped me in several ways.
I am speechless! I can barely find words to express all the wisdom, love and support
given me for that I am eternally grateful to my beloved parents Mr. D. L. Rawte and Mrs.
Nirmala Rawte for their unconditional love, fidelity, endurance and encouragement. They have
been selfless in giving me the best of everything and I express my deep gratitude for their love
without which this work would not have been completed. My most cordial thanks goes to my
brothers, Dr. Deepesh Rawte, Lokesh, Saurabh and my family who have been the vital source
of inspiration that helped me to set higher for their blessings and inspiring thoughts throughout
my work. This thesis would not have been possible without the filial affection, obstinate
sacrifice, pampered support, sincere prayers and blessings of the biggest asset of my life.
Last but not least, I would like to convey my cordial thanks to all the teachers and
well wishers from my schooling days onwards who have directly and indirectly helped me to
reach upto this level in my life.
Raipur (SUMAN RAWTE) Dated : Department of Genetics and Plant Breeding College of Agriculture, I.G.K.V. Raipur (C.G.)
v
TABLE OF CONTENTS
Chapter Title Page
ACKNOWLEDGEMENT iii-iv
TABLE OF CONTENTS v-vi
LIST OF TABLES vii-viii
LIST OF FIGURES ix-x
LIST OF NOTATIONS xi
LIST OF ABBREVIATIONS xii
ABSTRACT xiii-xviii
I INTRODUCTION 1-5
II REVIEW OF LITERATURE 6-36
2.1 Agro-morphological characterization 7-9
2.2 Genetic variability 10-13
2.3 Association analysis 13-19
2.3.1 Correlation coefficient analysis
2.3.2 Path coefficient analysis
13-17
17-19
2.4 Principal component and cluster analysis 19-26
2.5 Quality parameter 26-29
2.6 Molecular characterization
29-36
III MATERIALS AND METHODS 37-67
3.1 Experimental site 37
3.2 Climate and weather 37
3.3 Experimental materials and methods 38
3.4 Observations recorded 38-54
3.5 Molecular Study 54-62
3.6 Statistical analysis 62-67
IV RESULTS AND DISCUSSION 68-165
4.1 Agro-morphological and quality characterization 69-86
4.2 Estimation of genetic variance 87-104
4.2.1 Analysis of variance
4.2.2 Mean performance and variability
87-88
vi
Chapter Title Page
parameters of different characters
4.2.3 Phenotypic and Genotypic coefficient of
variation
4.2.4 Heritability and genetic advance as percent
of mean
89-100
100-101
102-104
4.3 Association analysis 104-137
4.3.1 Correlation coefficient
4.3.2 Path coefficient analysis based on grain
yield
4.3.3 Path coefficient analysis based on HRR
104-114
128-137
4.4 Principal Component Analysis 138-145
4.5 Cluster Analysis 146-153
4.6 Molecular characterization 154-166
4.6.1 Development of genotypic data based on
SSR and ISSR Markers
155
4.6.1.1 SSR marker analysis
4.6.1.1a Similarity coefficient analysis and
Clustering
4.6.1.1b Polymorphism Information
Content of SSR markers
4.6.1.2 ISSR marker analysis
4.6.1.2a Similarity coefficient analysis and
Clustering
4.6.1.2b Polymorphism Information
Content of ISSR markers
155-161
157-158
159
162-166
162-164
165
V SUMMARY AND CONCLUSIONS 167-170
REFERENCES 171-189
APPENDICES 190-223
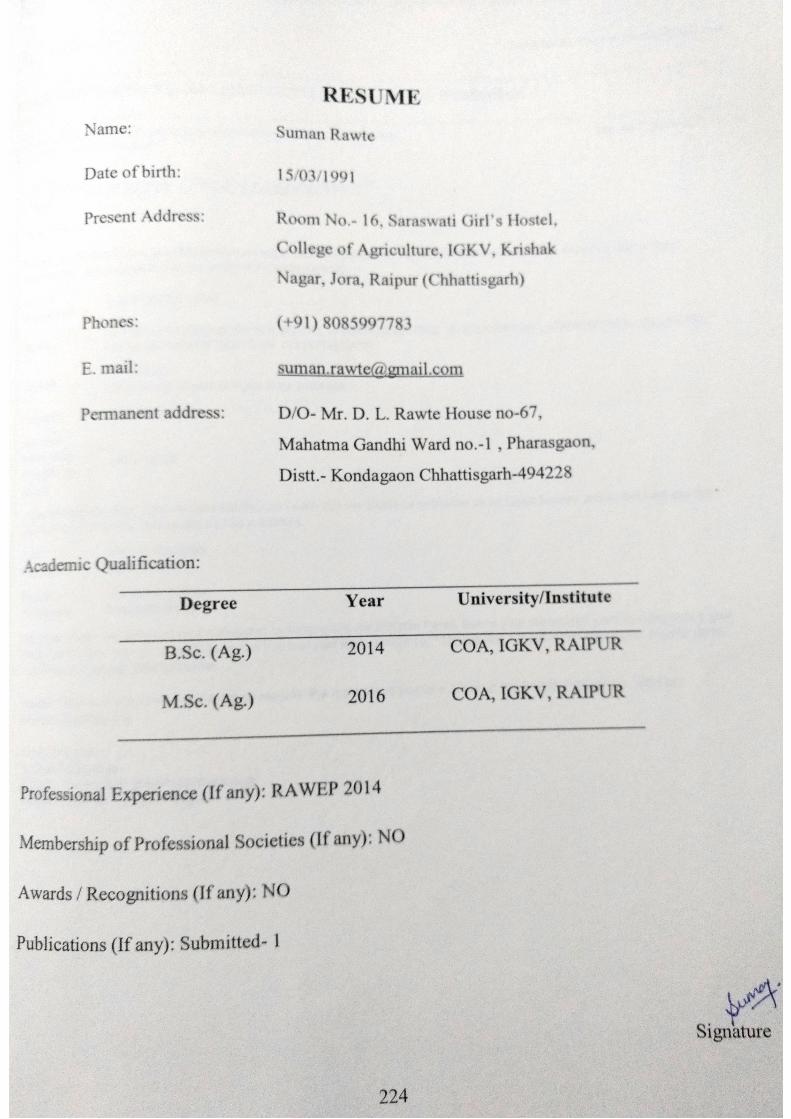
RESUME 224
vii
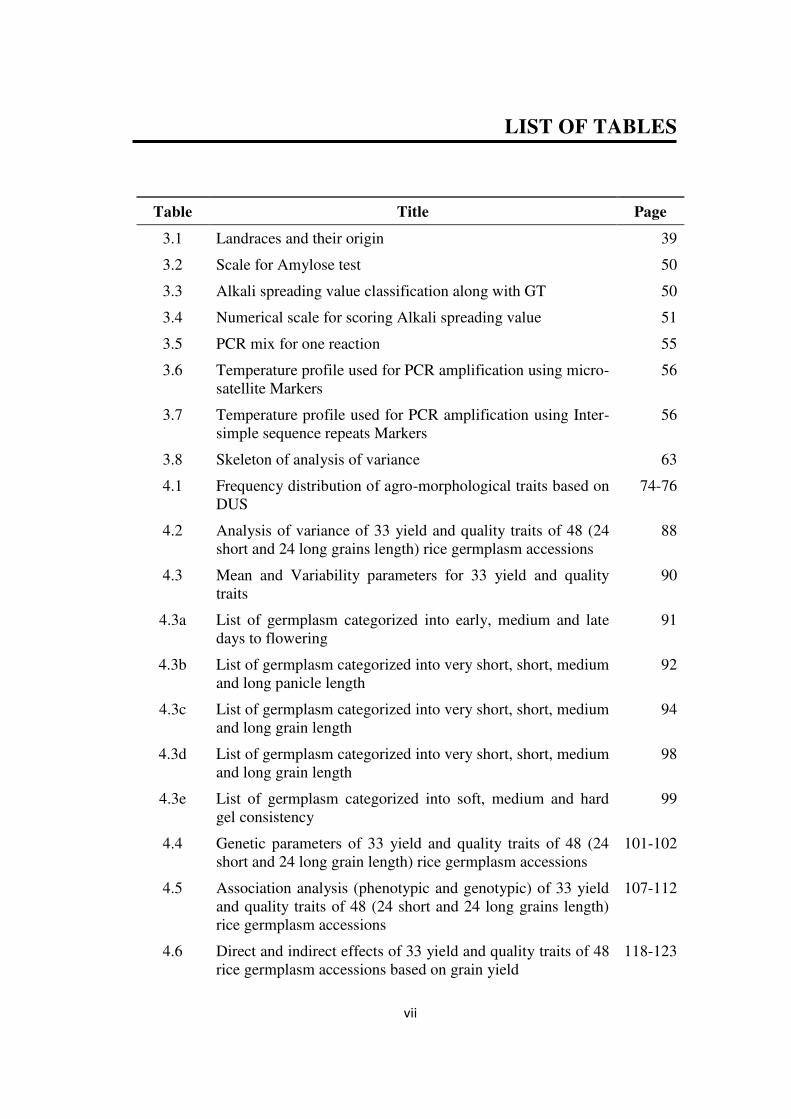
LIST OF TABLES
Table Title Page
3.1 Landraces and their origin 39
3.2 Scale for Amylose test 50
3.3 Alkali spreading value classification along with GT 50
3.4 Numerical scale for scoring Alkali spreading value 51
3.5 PCR mix for one reaction 55
3.6 Temperature profile used for PCR amplification using micro-
satellite Markers
56
3.7 Temperature profile used for PCR amplification using Inter-
simple sequence repeats Markers
56
3.8 Skeleton of analysis of variance 63
4.1 Frequency distribution of agro-morphological traits based on
DUS
74-76
4.2 Analysis of variance of 33 yield and quality traits of 48 (24
short and 24 long grains length) rice germplasm accessions
88
4.3 Mean and Variability parameters for 33 yield and quality
traits
90
4.3a List of germplasm categorized into early, medium and late
days to flowering
91
4.3b List of germplasm categorized into very short, short, medium
and long panicle length
92
4.3c List of germplasm categorized into very short, short, medium
and long grain length
94
4.3d List of germplasm categorized into very short, short, medium
and long grain length
98
4.3e List of germplasm categorized into soft, medium and hard
gel consistency
99
4.4 Genetic parameters of 33 yield and quality traits of 48 (24
short and 24 long grain length) rice germplasm accessions
101-102
4.5 Association analysis (phenotypic and genotypic) of 33 yield
and quality traits of 48 (24 short and 24 long grains length)
rice germplasm accessions
107-112
4.6 Direct and indirect effects of 33 yield and quality traits of 48
rice germplasm accessions based on grain yield
118-123
viii
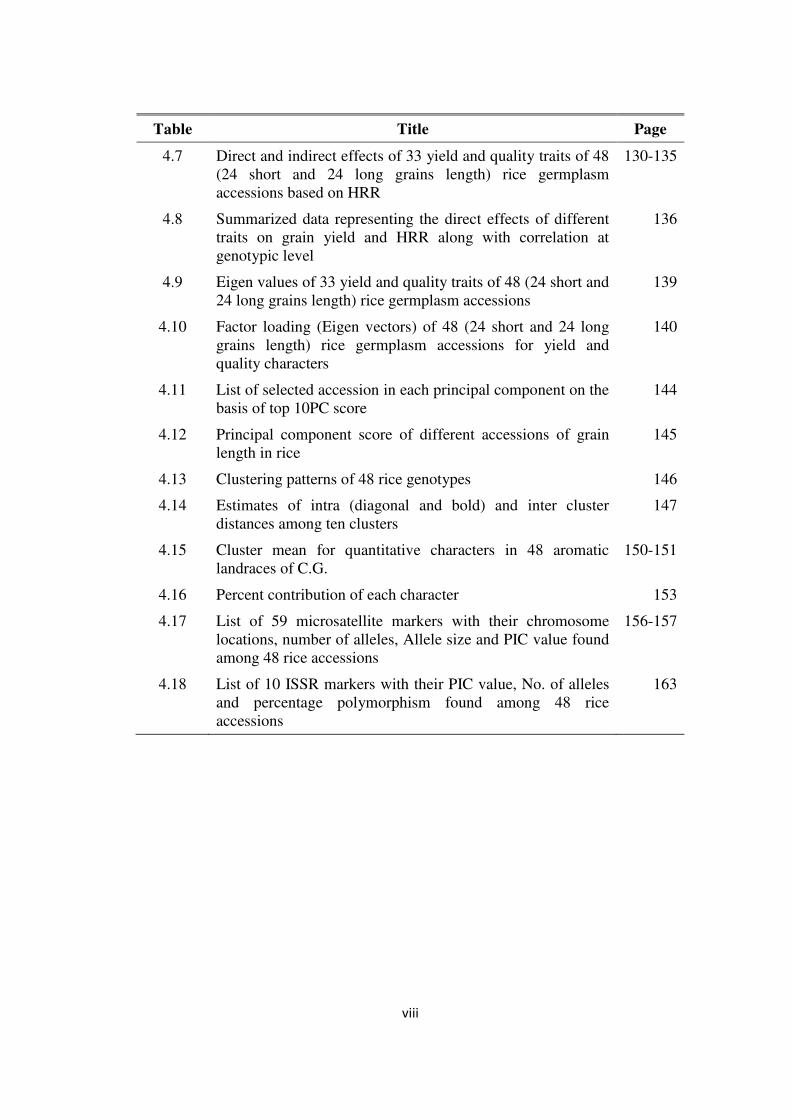
Table Title Page
4.7 Direct and indirect effects of 33 yield and quality traits of 48
(24 short and 24 long grains length) rice germplasm
accessions based on HRR
130-135
4.8 Summarized data representing the direct effects of different
traits on grain yield and HRR along with correlation at
genotypic level
136
4.9 Eigen values of 33 yield and quality traits of 48 (24 short and
24 long grains length) rice germplasm accessions
139
4.10 Factor loading (Eigen vectors) of 48 (24 short and 24 long
grains length) rice germplasm accessions for yield and
quality characters
140
4.11 List of selected accession in each principal component on the
basis of top 10PC score
144
4.12 Principal component score of different accessions of grain
length in rice
145
4.13 Clustering patterns of 48 rice genotypes 146
4.14 Estimates of intra (diagonal and bold) and inter cluster
distances among ten clusters
147
4.15 Cluster mean for quantitative characters in 48 aromatic
landraces of C.G.
150-151
4.16 Percent contribution of each character 153
4.17 List of 59 microsatellite markers with their chromosome
locations, number of alleles, Allele size and PIC value found
among 48 rice accessions
156-157
4.18 List of 10 ISSR markers with their PIC value, No. of alleles
and percentage polymorphism found among 48 rice
accessions
163
ix
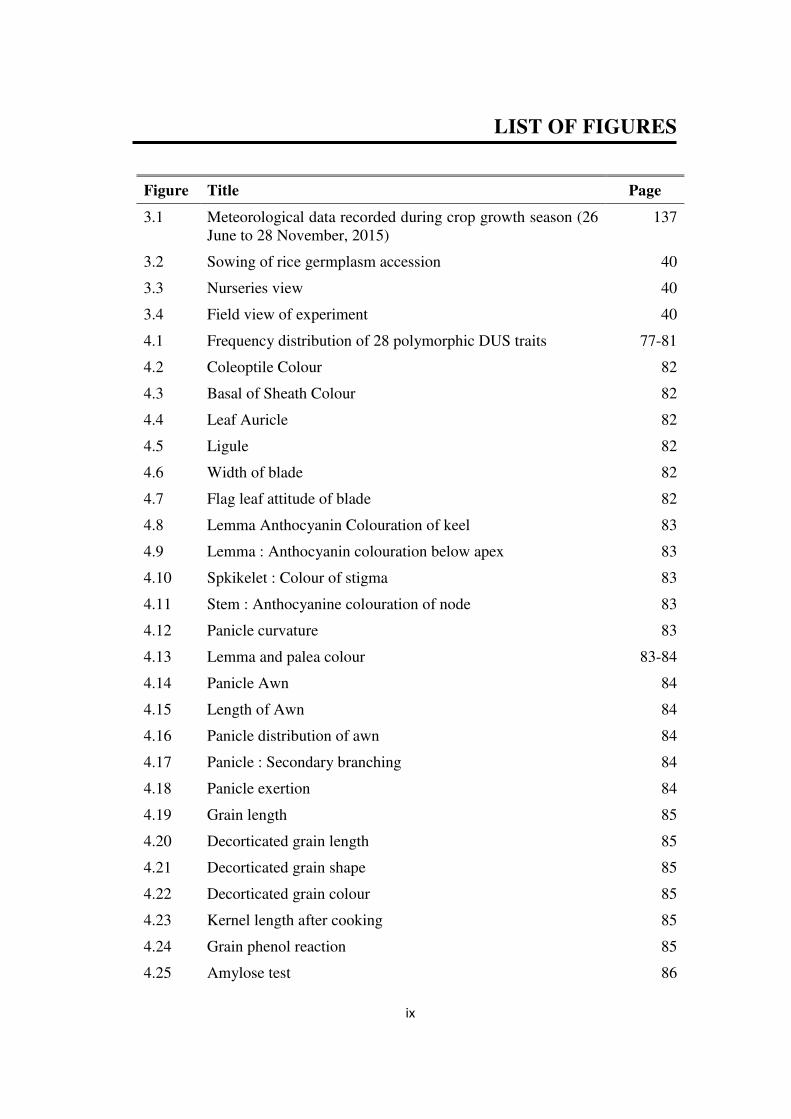
LIST OF FIGURES
Figure Title Page
3.1 Meteorological data recorded during crop growth season (26
June to 28 November, 2015)
137
3.2 Sowing of rice germplasm accession 40
3.3 Nurseries view 40
3.4 Field view of experiment 40
4.1 Frequency distribution of 28 polymorphic DUS traits 77-81
4.2 Coleoptile Colour 82
4.3 Basal of Sheath Colour 82
4.4 Leaf Auricle 82
4.5 Ligule 82
4.6 Width of blade 82
4.7 Flag leaf attitude of blade 82
4.8 Lemma Anthocyanin Colouration of keel 83
4.9 Lemma : Anthocyanin colouration below apex 83
4.10 Spkikelet : Colour of stigma 83
4.11 Stem : Anthocyanine colouration of node 83
4.12 Panicle curvature 83
4.13 Lemma and palea colour 83-84
4.14 Panicle Awn 84
4.15 Length of Awn 84
4.16 Panicle distribution of awn 84
4.17 Panicle : Secondary branching 84
4.18 Panicle exertion 84
4.19 Grain length 85
4.20 Decorticated grain length 85
4.21 Decorticated grain shape 85
4.22 Decorticated grain colour 85
4.23 Kernel length after cooking 85
4.24 Grain phenol reaction 85
4.25 Amylose test 86
x
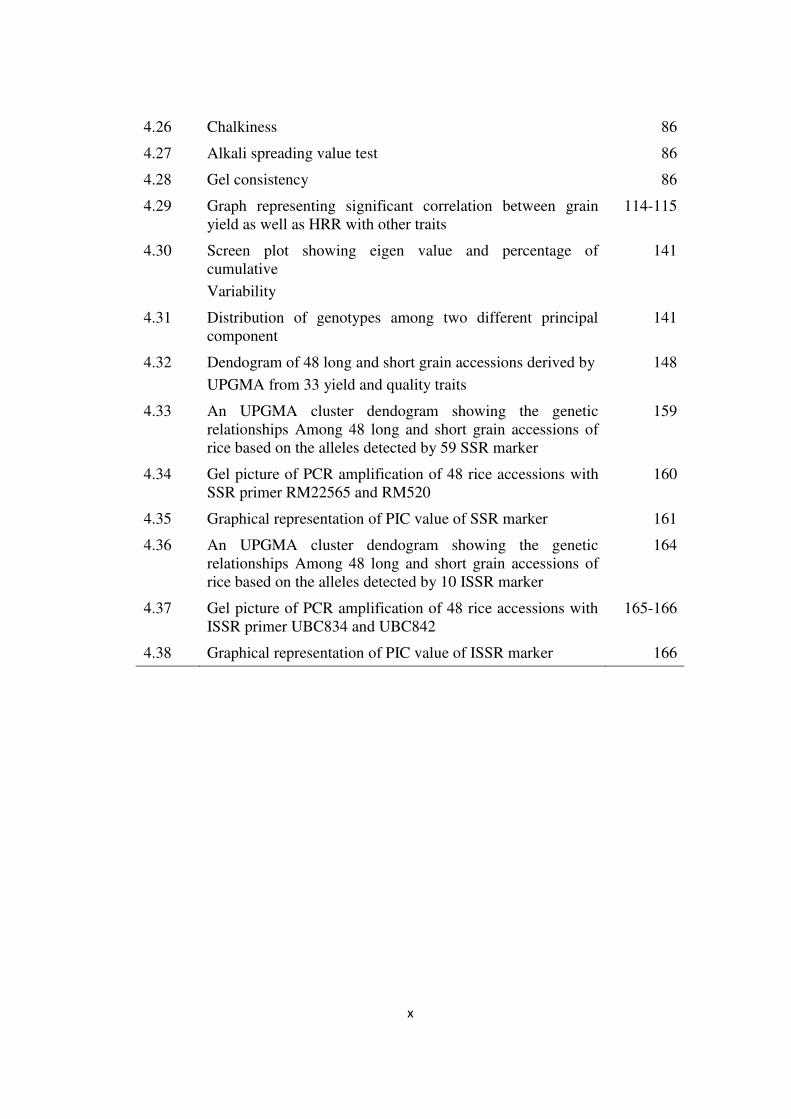
4.26 Chalkiness 86
4.27 Alkali spreading value test 86
4.28 Gel consistency 86
4.29 Graph representing significant correlation between grain
yield as well as HRR with other traits
114-115
4.30 Screen plot showing eigen value and percentage of
cumulative
Variability
141
4.31 Distribution of genotypes among two different principal
component
141
4.32 Dendogram of 48 long and short grain accessions derived by
UPGMA from 33 yield and quality traits
148
4.33 An UPGMA cluster dendogram showing the genetic
relationships Among 48 long and short grain accessions of
rice based on the alleles detected by 59 SSR marker
159
4.34 Gel picture of PCR amplification of 48 rice accessions with
SSR primer RM22565 and RM520
160
4.35 Graphical representation of PIC value of SSR marker 161
4.36 An UPGMA cluster dendogram showing the genetic
relationships Among 48 long and short grain accessions of
rice based on the alleles detected by 10 ISSR marker
164
4.37 Gel picture of PCR amplification of 48 rice accessions with
ISSR primer UBC834 and UBC842
165-166
4.38 Graphical representation of PIC value of ISSR marker 166
xi
LIST OF NOTATIONS/SYMBOLS
% Per Cent
°C Degree Celsius
μl Micro Litre
bp Base Pairs
cm Centimeter
d.f. Degree of Freedom
et al. and others
g Gram
H2O Water
ha Hectare
HCl Hydrochloric Acid
i.e. that is
KCl Potassium Chloride
m Meter
M Molar
MgCl2 Magnesium Chloride
min Minutes
ml Milliliter
NaCl Sodium Chloride
ng Nanogram
rpm Rotations per Minute
U Units
xii
LIST OF ABBREVIATIONS
BYPP Biological Yield Per Plant
DTF Days To 50 % Flowering
dATP deoxy adenosine 5’ triphosphate
dCTP deoxy cytidine 5’ triphosphate
dGTP deoxy guanosine 5’ triphosphate
DNA Deoxyribo Nucleic Acid
dNTPs deoxynucleotide triphosphates
dTTP deoxy thymidine 5’ triphosphate
EDTA Ethylene Diamine Tetra Acetic Acid
EtOH Ethanol
EtBr Ethidium Bromide
EI Elongation Index
ET Effective Tillers Per Plant
FLL Flag Leaf Length
FLW Flag Leaf Width
GB Grain Breadth
GL Grain Length
GYPP Grain Yield Per Plant
HI Harvest Index
H % Hulling Per Cent
HRR % Head Rice Recovery Per Cent
KB Kernel Breadth
KBAC Kernel Breadth After Cooking
KER Kernel Elongation Ratio
KL Kernel Length
KLBR Kernel Length Breadth Ratio
KLAC Kernel Length After Cooking
LBRAC Length Breadth Ratio After Cooking
M % Milling Per Cent
NOS Number of Spikelet Per Panicle
PCV Phenotypic Coefficient of Variation
GCV Genotypic Coefficient of Variation
PCA Principal Component Analysis
PC Principal Component
PCR Polymerase Chain Reaction
PH Plant Height
PL Panicle Length
SSR Single Sequence Repeats
ISSR Inter Simple Sequence Repeat
TBE Tris Boric Acid EDTA Buffer
xiv
crop development and improvement programs. Grain length, width and thickness
are important factors relating to not only grain yield but also grain quality in rice.
So keeping these points in view, the present study was conducted with the
objective of characterization of accessions based on DUS descriptors and DNA
profiling using SSR and ISSR markers at Research cum Instructional farm, College
of Agriculture, IGKV, Raipur (C.G.), Department of Genetics and Plant Breeding
and R. H. Richhariya research laboratory, College of Agriculture, IGKV, Raipur
(C.G.) with 24 short and 24 long grain rice accessions in randomized block design
(RBD) during Kharif 2015. The data was statistically analyzed to calculate various
descriptive statistics and to perform Correlation analysis, Path coefficient, principal
component analysis (PCA) and the un- weighted variable pair group method of the
average linkage cluster analysis (UPGMA) between 33 yield and other yield
attributing traits.
All considered morphological and quality descriptors showed remarkable
differences in their distribution and amount of variations within them. The analysis
of variance indicated existence of considerable amount of variability for all
observed characters. The high amount of genotypic and phenotypic coefficient of
variation with high heritability and genetic advance as percentage of mean was
observed for thousand grain weight followed by grain length, decorticated grain
length, length of milled grain, length of cooked kernel and elongation index.
Nagbel is the prominent germplasm accession which is having good quality
character namely grain length, thousand grain weight, decorticated grain length,
length of milled grain along with grain yield and harvest index. Thus, this
accession can be taken as a donor parent in crossing program to improve/enhance
these traits.
The result of correlation and path analysis revealed that the traits such as
biological yield, stem thickness, plant height, panicle per plant, time of maturity
and decorticated grain length had significant positive correlation with grain yield
as well as positive direct effect on grain yield per plant. Positive direct effect on
grain yield as well as significant positive correlation with grain yield indicates true

xv
relationship between them and direct selection for these traits will be rewarding for
yield improvement. PCA showed the contribution of each character to the
classification of the rice accessions. The first four principal components explained
about 63.74% of the total variation among the 33 characters. The results of PCA
suggested that characters such as plant height, thousand grain weight, grain length,
decorticated grain length, length of milled grain and length of cooked kernel were
the principal discriminatory characteristics of short and long grain accessions of
rice. On the basis of PC score it is cleared that Nagbel is the best accession for both
quality and yield traits followed by Khatriya Pati , Anjania and Banreg. Ten cluster
groups were obtained from the 33 yield and quality characters using multivariate
analysis. The pattern of constellation proved the existence of significant amount of
variability. Cluster VII constituted of 16 accessions, forming the largest cluster.
Since, the inter cluster distance between cluster IX (Safri) and cluster X (Nagbel)
is quite large therefore, they can be use to obtain higher variability and heterotic
effects.
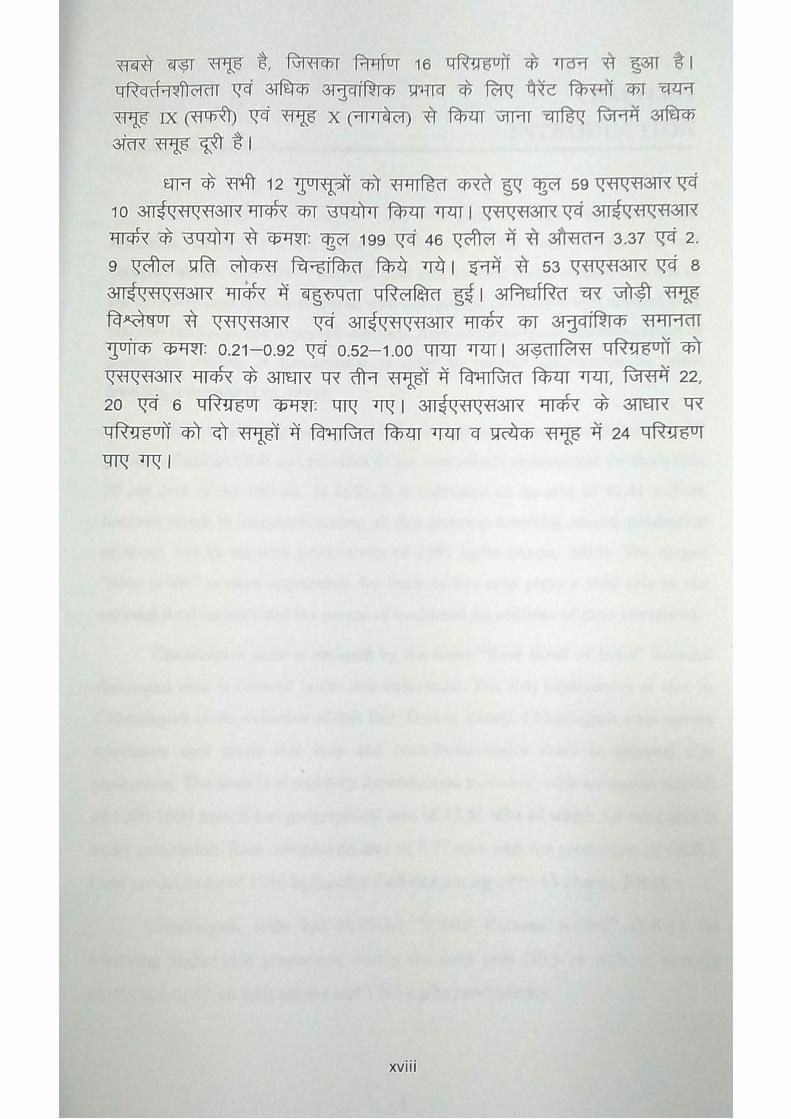
A total of 59 SSR and 10 ISSR markers (primers) were used covering all
the 12 chromosomes of rice. A total of 199 and 46 alleles with an average of 3.37
and 2.9 alleles per locus were detected by SSR and ISSR markers, respectively.
Out of which 53 SSR and 8 ISSR markers showed polymorphism. Genetic
similarity coefficient ranged from 0.21-0.93 and 0.52-1.00 as revealed by UPGMA
cluster analysis of SSR and ISSR marker, respectively. Forty-eight accessions were
grouped into three major clusters having 22, 20 and 6 genotypes in SSR analysis
while two major clusters were formed in ISSR marker having 24 genotypes in each
cluster.

1
CHAPTER- I
INTRODUCTION
Rice (Oryza sativa L.) (2n = 24) belonging to the family, Poaceae and
subfamily, Oryzoidea is the staple food for half of the world‟s population and
occupies almost one-fifth of the total land area covered under cereals. It is one of
the very few crop species endowed with rich genetic diversity which account over
100,000 landraces and improved cultivars. Agro-morphological characterization of
germplasm variety is fundamental in order to provide information for plant
breeding programs (Lin, 1991).
Rice occupies a pivotal place in Indian agriculture and it contributes to 17
percent of annual GDP and provides 43 per cent calorie requirement for more than
70 per cent of the Indians. In India, it is cultivated on an area of 42.41 million
hectares which is maximum among all rice growing countries, annual production
of about 105.31 mt with productivity of 2393 kg/ha (Anon, 2013). The slogan
“Rice is life” is most appropriate for India as this crop plays a vital role in our
national food security and is a means of livelihood for millions of rural household.
Chhattisgarh state is eminent by the name “Rice Bowl of India” because
maximum area is covered under rice cultivation. The rich biodiversity of rice in
Chhattisgarh is the evidence of this fact. During Kharif, Chhattisgarh state covers
maximum area under rice crop and contributes major share in national rice
production. The state is completely dependent on monsoon, with an annual rainfall
of 1200-1600 mm. It has geographical area of 13.51 mha of which 5.9 mha area is
under cultivation. Rice occupies an area of 3.77 mha with the production of 6608.8
t and productivity of 1746 kg/ha of milled rice during 2012-13 (Anon, 2014).
Chhattisgarh state has received “Krishi Karman Award” (KKA) for
achieving higher rice production during the crop year 2013-14 with an average
production of 67.16 lakh tonnes and 1766 kg/ha productivity.
2
Grain size and weight contribute for crop yield in cereals, whereas in rice,
grain size and shape are major criteria to assess market value and to classify rice
genotypes. Grain size with its dimensions for length and width has become a target
trait for rice breeding in recent years (Xing and Zhang, 2010). Rice yield is
dependent on several factors, including number of plants per unit area, number of
grains per panicle and grain weight, which is largely determined by grain size
(Ikeda et al., 2013 and Xing et al., 2002). Grain size directly affects to rice yield
and is an important determinant of rice quality (Tan et al., 2000). Elucidating the
genetic mechanisms affecting grain shape has great significance to breed high-
yielding rice varieties. In recent years, much research has been devoted to the study
of identification, localization, cloning and functional analysis of genes involved
grain shape and great progress has been made (Miura et al., 2011). Enhancing
grain yield and quality are the two major objectives for many breeding programs.
Grain quality characteristics (grain length (GL), grain breadth (GB), cooked grain
length (CGL), cooked grain breadth (CGB) and gelatinization temperature (GT)) of
rice are related to a complexity of physicochemical properties viz., dimension,
shape and weight, fragmentation, hardness, milling properties, chemical
composition of the endosperm, aroma and nutritional factors. In breeding
programs, the major grain quality considerations are evaluated as (i) milling
efficiency; (ii) grain shape and appearance; (iii) cooking and edibility
characteristics and (iv) nutritional quality (Li et al., 2003).
The yield of rice increases due to breeding efforts but quality part of rice
still have to be improved, this is because the standard of living of the people are
also increased with the change of time. The poor people do not give much priority
to the quality of rice but rich people give more consideration to rice quality. In
cereals, rice has to be cooked and consumed as a whole grain therefore, quality
consideration is more important for any other food crop (Hossain et al., 2009).
Preferences for grain shape vary across different consumers. Long and
slender grain varieties are preferred in most Asian countries including China, USA,
Pakistan and Thailand, and also in the India, while short grain cultivars are
preferred in Japan and Sri Lanka. In addition, grain dimension is an important
indicator of the evolution of cereal crops because humans tended to select large
3
seeds during the early domestication, as evidenced by the fact that most cultivated
species have larger seeds than their wild relatives (Harlan 1992). However, small
seed is usually favoured by natural selection because it is frequently associated
with more seeds per plant, early maturity, and wider geographic distribution.
Therefore, from the standpoints of both biological development and breeding, it is
necessary to understand the genetic basis and formation mechanism of rice grain
shape (Wan et al., 2006).
Enormous variations in size and shape of grain exist among the rice
varieties available in the world. As grain quality is endospermic traits, its
inheritance become more complicated because genetic expression of endospermic
trait in cereals seed is not only conditioned by triploid endosperm genotype, but
also diploid maternal genotype and any additional by cytoplasmic difference
(Pooni et al., 1992; Zhu 1994). The size of a grain measured by weight of grain but
the grain length is more adequate character for analyzing the inheritance of grain
size because of high heritability of trait.
Since, rice grain length is quantitatively inherited (McKenzie and Rutger
1983), it is difficult for breeders to efficiently improve grain appearance using
conventional selection methods. Thus, it should be particularly helpful for
enhancing breeding efficiency to use markers closely linked to genes or major
quantitative trait loci (QTLs) for grain length in order to screen target genotypes
directly in early generations. In rice, numerous studies have been conducted to
genetically map QTLs for grain yield traits, and thousands of QTLs have been
detected. Grain size and shape are important determinants of grain yield and grain
quality, which are usually controlled by QTLs. More than 400 QTLs that control
grain size and shape have been detected by using various mapping populations
(Hao et al., 2010; Huang et al., 2013 and Yu et al., 2013).
Many QTLs for rice grain size traits have been reported in the last decade
(Gao et al, 2011; Huang et al, 2013). Among them, qGL3 (Zhang et al, 2012),
GW8 (Wang et al, 2012), GS5 (Li et al, 2011), GS3 (Fan et al, 2006; Mao et al,
2010), GW2 (Song et al, 2007), GW5 (Weng et al, 2008) and qSW5 (Shomura et
al, 2008) have been cloned, and gw3.1 (Li et al, 2004), qGL7 (Bai et al, 2010),
4
GS7 (Shao et al, 2012), Lk-4(t) (Zhou et al, 2006), gw8.1 (Xie et al, 2006) and
gw9.1 (Xie et al, 2008) have been fine mapped. Thus, understanding the genetic
and molecular basis of grain size is extremely important for rice improvement
programs. Utilization of molecular markers has greatly facilitated the investigation
of the genetic basis of complex quantitative traits. Molecular marker technique has
proved valuable in identification of loci involved in quantitative traits related to
grain quality characters and has provided insight into its complex relationship with
associated factors and their underlying genes are now far more accessible.
Agromorphological characterization gives the mark of identification which
distinguishes one genotype from other. Many studies on genetic diversity using
agro-morphological characterization have been conducted and it led to
identification of phenotypic variability in rice (Ogunbayo et al., 2005; Bajracharya
et al., 2006 and Barry et al., 2007). Traditionally, morphological traits are used to
determine genetic diversity and classify germplasm. However, this technique is a
low-level but powerful taxonomic tool which can be utilized for the preliminary
grouping of cultivars prior to their characterization using more robust marker
technologies. Moreover, this technique is cost effective, less time consuming, easy
to score and it does not need any technical knowledge. According to Din et al.,
(2010) scientific classification of the plant still relies on morphological traits.
Characterization and evaluation of diversity among traditional varieties will
provide plant breeders the information necessary to identify initial materials for
hybridization to produce varieties with improved productivity and quality (Thilang
et al., 2014). So, collection and characterization of this germplasm is not only
important for utilizing the appropriate attribute based donors in breeding
programmes, but is also essential in the present era for protecting the unique rice.
Several researches reported the use of agro-morphological markers in the study of
characterization of rice germplasm diversity.
Keeping in view the above facts, the present investigation entitled
“Molecular and agro-morphological characterization of selected rice (Oryza
sativa L.) germplasm accession based on grain length” has been planned and
was carried out at the Research cum Instructional farm, College of Agriculture,
IGKV, Raipur (C.G), Department of Genetics and Plant Breeding and R. H.
5
Richhariya research laboratory, College of Agriculture, IGKV, Raipur (C.G.)
during Kharif, 2015 with the following objectives:
1. DUS (Distinctiveness, Uniformity, and Stability) based characterization for
yield and yield parameters.
2. DNA profiling for long and short grain length using SSR markers.
3. DNA profiling for long and short grain length using ISSR markers.
6
CHAPTER- II
REVIEW OF LITERATURE
Genetic variability, nature and magnitude of genetic diversity, present in
the available breeding materials are the key resource of a breeding program. Those
criteria create the opportunities for a successful breeding program by the
association of different traits both at physio-morphological and molecular levels.
People in different areas of the world prefer different types of rice for general
consumption. Grain quality characteristics of rice are related to a complexity of
physicochemical properties viz., dimension, shape and weight, fragmentation,
hardness, milling properties, chemical composition of the endosperm, aroma and
nutritional factors. Grain length and shape determine appearance in rice, and affect
milling, cooking and eating quality and are therefore, important traits in rice
breeding. On that point of view, this study was conducted for characterization of
forty eight landraces of rice of Chhattisgarh using agro-morphological and
molecular parameters to provide useful information to facilitate the choice of
breeders for rice plant breeding programme.
In this chapter, an attempt has been taken to review the relevant literatures,
which focuses the basic features of rice plant and associated genetic variability,
nature and magnitude of genetic divergence, association among different traits,
evaluation of field performance and diversity analysis through SSR and ISSR
markers in rice under the following subheads:
2.1 Agro-morphological characterization
2.2 Genetic variability
2.3 Association analysis
2.3.1 Correlation coefficient analysis
2.3.2 Path coefficient analysis
2.4 Principal component and cluster analysis
2.5 Quality parameter
2.6 Molecular characterization
7
2.1 Agro-morphological characterization
Subba Rao et al. (2001) reported that genetic diversity probably serves as
an insurance against crop failure.
Ogunbayo et al. (2005) characterized forty rice accessions using fourteen
agro-botanical traits. Number of effective tillers and total number of tillers as well
as heading and maturity dates were observed to greatly influence grain yield.
Significant block effects were observed for flowering date, maturity day and plant
height whereas block effects were non-significant for the other traits meaning that
blocking was not important for the eleven traits that showed non-significant block
effects.
Hien et al. (2007) studied Genetic diversity of morphological responses and
the relationships among Asia aromatic rice (Oryza sativa L.) cultivars.
Characterization for 22 morphological characters with 101 morphometric
descriptors was carried out. Most traits were polymorphic except to ligule color.
Grain size, grain shape, culm strength, plant height and secondary branching
contributed the highest mean diversity indices (H, = 0.91, 0.88, 0.87, 0.82 and
0.83, respectively). For trait groups, highest diversity was found in grain and culm
traits (H, = 1.00 and 0.96, respectively). Populations from Vietnam were more
diverse than others (H, = 0.92) whereas populations from India and Thailand
displayed lower diversity indices (H, = 0.46 and 0.49, respectively). No clear
association was detected between phenotypic diversity and countries of origin.
Five clusters of 36 genotypes based on Euclidean distance were observed with 1 to
22 cultivars per group.
Vanisree et al. (2011) worked in Sugandha Samba (RNR2465), first-ever
highyielding, aromatic, short-grained rice. Sugandha Samba (RNR2465) was the
first aromatic, high-yielding, semi-dwarf, medium-duration (130–135 d), medium-
slender rice variety released in Andhra Pradesh by the State Variety Release
Committee in April 2010. Developed using the pedigree method, this variety has
two quality rice varieties, early samba (RNR-M7) and RNR19994, as the female
and male parent, respectively. This variety recorded a grain yield of 6–7 t ha–1
under good management, comparable with that of Samba Mahsuri (BPT5204), the
8
most popular mega-variety released by ANGRAU. It registered 70% head rice
recovery and had excellent cooking quality and strong aroma.
Subudhi et al. (2012) studied Collection and agro-morphological
characterization of aromatic short grain rice in eastern India. The good yielders are
Chhotbasmati, Pimpudibas, Lajkuri, Jaigundi, Kanika, Bishnubhog. These
landraces can be popularized among the farmers and can be used as donor in
varietal development programme.
Parikh et al. (2012) evaluated physio-chemical characters and cooking
quality of 36 rice genotypes and reported that the fine grain genotypes like Rajim-
12, Kalimuchh, and Munibhog were good for moderate kernel length and L:B
ratio; Rajabhog, Jhulari, and Baghmuchha for kernel length after cooking and L:B
ratio of cooked rice Kalajira and Bikoni for head rice recovery %; Barang,
Bantaphool, Gangabalu, and Bikoni for elongation ratio; Barang, Rajabhog,
Gangabalu, Bikoni, and Chirainikhi for elongation index; Sonth, Rajim-12, Jhulari,
Gangabalu, Jhilli Safri, and Bikoni for intermediate alkali values. These genotypes
may be utilized as donors for improvement of quality traits.
Sarawgi et al. (2012) characterized 46 aromatic rice accessions of Dubraj
group from Chhattisgarh and Madhya Pradesh for twenty morphological, six
agronomical and eight quality characters. The specific accessions D: 1137, D: 812,
D: 950, D: 959, D: 925, D: 1008, D: 939, D: 666I and D: 1090 were identified for
quality and agronomical characteristics. These may be used in hybridization
programme to achieve desired segregants for good grain quality with higher yield.
Subba Rao et al. (2013) characterized 65 landraces of rice using 43
agromorphological traits following Distinctiveness, Uniformity and Stability test
(DUS). Out of 65 varieties studied, 32 were found to be distinctive on the basis of
22 essential and 24 additional characters. This study will be useful for breeders,
researchers and farmers to identify and choose the restoration and conservation of
beneficial genes for crop improvement and also to seek protection under Protection
of Plant Varieties and Farmer‟s Rights Act.
Mondal et al. (2014) reported the descriptors offering the most
discrimination were time to 50% heading, decorticated grain shape, and the color
9
of lemma and palea, Eight of the 21 qualitative and 8 of the 14 quantitative traits
exhibited uniformity as determined by UPOV-recommended levels. Twelve of the
quantitative traits were relatively stable as judged by seasonal variation in
Phenotypic Coefficient of Variation (PCV) and Genotypic Coefficient of Variation
(GCV) values.
Sarawgi et al. (2014) on the basis of frequency distribution for eighteen
qualitative traits of 408 rice germplasm accessions reported that majority of
genotypes possessed green basal leaf sheath colour (87.25 %), green leaf blade
colour (89.70 %), pubescent leaf (48.03 %), well panicle exsertion (57.10 %),
white stigma colour (65.93 %), straw apiculus colour (78.18 %), compact panicle
type (55.63 %), awnless (88.48 %), white seed coat (82.84 %), straw hull colour
(70.34 %), intermediate threshability (47.30 %), erect flag leaf angle (57.59 %),
medium leaf senescence (67.15 %) and straw sterile lemma (97.05 %).
Sajid et al. (2015) has characterized thirty indigenous rice germplasm on
the basis of 32 different agro-morphological traits (15 qualitative and 17
quantitative). Highly significant differences (p<0.01) were observed for the traits
of flag leaf length, flag leaf breadth, culm length, days to 50% flowering, panicle
length, length of primary branches panicle-1
, secondary branches panicle-1, grain
length, grain width, awn length and percent leaf lession while significant
differences (p<0.05) were observed for peduncle length and primary branches. The
rice germplasm exhibited sufficient genetic variation for most of the qualitative
and quantitative traits.
Sinha et al. (2015) has studied fifty five traditional rice varieties of West
Bengal, and investigated for grain morphological characters. A wide variation of
grain characters, like grain size and shape, anthocyanin colouration of lemma-palea
and kernel, presence or absence of aroma, awning characteristics, were found
among the studied varieties. Wide variation among the grain morphological
characters indicated wide genetic variation present among these varieties, which
may be utilized for the selection of the parents for the plant breeding and
production of new improved variety.
10
2.2 Genetic Variability
Choudhary et al. (2004) studied genetic variability and genetic advance for
plant traits viz., kernel length, panicle length, effective tiller per plant, fertile
spikelets per panicle, spikelet density, biological yield per plant, harvest index and
grain yield per plant. All these traits exhibited high heritability coupled with high
genetic advance and genetic variability.
Veni and Rani (2006) studied variability and heritability for seven
important physico-chemical traits viz., kernel length, kernel breadth,
length/breadth ratio, kernel length after cooking, elongation ratio, alkali spreading
value and amylose content. Low to moderate estimates of variability (both at
genotypic and phenotypic level), moderate to high heritability and low expected
genetic advance for all the characters indicated the preponderance of both additive
and non-additive gene effects in conditioning these traits.
Sarkar et al, (2007) evaluated 41 genotypes of rice for ten different quality
parameters of grains to asses the genetic variability and revealed that genotypic
and phenotypic coefficient of variations were maximum for cooked kernel L/B
ratio and 1000-grain weight.
Bajpai and Singh (2010) studied the grain quality of some short and
medium grain aromatic rice and compared with premium Dehradun basmati 3020.
The quality characteristics studied from consumer's point of view revealed that
paddy length ranged from 6.8 mm to 7.4 mm. Kernel length ranged from 9.3 mm
to 11.0 mm, elongation ratio ranged from 1.86 to 2.34, amylose content recorded
was from 20.6 % to 25.5 %. The gelatinizing temperature was low in all lines
except 3047 (intermediate) while aroma was strong in all lines except 3047, which
revealed moderate aroma. The parameters studied from farmers/traders point of
view revealed that hulling percentage ranged from 78.6 % to 81.6, milling
percentage ranged from 72 % to 75 % while panicle length recorded ranged from
24.2 cm to 31.0 cm. From consumers point of view expect paddy length and kernel
elongation all quality parameters of these line were near to premium Dehradun
basmati 3020.
11
Das and Ghosh (2011) characterize thirty one qualitative traits of four
hundred thirty one traditional rice cultivars from germplasm collection of Rice
Research Station, Chinsurch. Among the qualitative traits considerable variability
was recorded for basal leaf sheath color, awning and auricle color. Maximum
variability was observed for grains per panicle followed by spikelet per panicle.
Parikh et al. (2011) evaluated seventy one rice accession and studied
diversity pattern among genotype. The genotypes were grouped into eight clusters.
The genotypes in these clusters i.e. Tulsi Mala (cluster II), Kali Kamod (cluster
VI), Shankar Jeera and Bhata Dubraj (cluster VII) and Lohandi and TilKasturi
(cluster VIII) can be used as potential donors for future hybridization programs to
develop genotype with high grain yield.
Chakravorty et al. (2013) studied fifty-one landraces of rice to characterize,
evaluate and work out the interrelationship among the 18 agro-morphological traits
with a view to exploiting them directly in the field and forming a base for using
these landraces in breeding program. The analysis of variance found significant
variability in eighteen quantitative traits. Leaf length had mean value of 47.47 cm
with a wide variation from 34.0 cm to 61.0 cm. Most of the lines (58.8 %) were in
the range of 44.0-53.0 cm. The highest leaf breadth value (2.20 cm) was observed
in Rupsal and Sitasal. Maximum plant height (43.0 cm) was observed in variety
Sarkele aman, while minimum (24.0 cm) in Tolsibhog.
Kumari et al. (2013) evaluated twelve accessions of rice for physical and
biochemical traits and observed highest kernel length in NDR 6265 (7.07 mm) and
kernel breadth in NDR 625 (1.81 mm). Maximum elongation ratio was observed in
Kankjeer and Banta Phool A (1.88 mm) and kernel length after cooking was
maximum in NDR 6265(11.4 mm). Maximum amylose content was found in
variety Kalanamak Berdpur (19.8 %). On the basis of above parameters variety
Kalanamak Berdpur, Badshah pasonda, NDR 6265 and NDR 625 were rated
superior among the all varieties/accessions tested in the present investigation.
Phenotyping of the 41 rice genotypes was done by Pachauri et al. (2013)
for grain quality characters viz., grain length, grain breadth, length breadth ratio,
elongation ratio, alkali spreading value and aroma. The longest grain length
12
(unmilled and milled) was recorded as 11.67±0.4 mm and 8.2±0.38 mm
respectively for SS20, while Sulendas had shortest grain length of 6.93±0.37 mm
and 5.07±0.15 mm respectively. Diverse L: B ratio (unmilled grain) was observed,
ranging from 2.29±0.24 mm (Suranit) to 5.66±0.22 mm (SS20). Highest kernel
elongation ratio was observed in Kakeria-2 (1.608±0.19), while SHPP-20 showed
the lowest elongation ratio of 1.078±0.06. Most of the rice varieties had an ASV of
2 and 1. Sensory analysis of grain aroma revealed the range of sensory scores
between 0 and 3. Highly aromatic varieties such as Tilakchandan and Basmati-334
having a sensory aroma score of 3 as well as moderately aromatic varieties with a
sensory score of 2 had been identified along with some non-aromatic and less
aromatic varieties.
Vanisree et al. (2013) investigated fifty genotypes comprising both basmati
and aromatic short grain types and revealed significant differences among
genotypes for yield, its components and grain quality traits. The high variability
was observed for productive tillers per plant and filled grain per panicle whereas,
the estimates for panicle length, days to 50 % flowering, kernel breadth and kernel
elongation ratio were low.
A population panel of 192 rice genotypes comprising traditional landraces
and exotic genotypes was evaluated for twelve agro - morphological traits by
Nachimuthu et al. (2014) to determine the pattern of genetic diversity and
relationship among individuals. The largest variation was observed for number of
productive tillers with coefficient of variation (CV) of 28.03 % followed by
number of filled grains per panicle, single plant yield, leaf length , grain length
width ratio. Days to maturity has shown the least variation with the CV of 9.74 %.
Tuhina-Khatun et al. (2015) evaluated forty-three genotypes all genotypes
exhibited a wide and significant variation for 22 traits. The highest phenotypic and
genotypic coefficient of variation was recorded for the number of filled
grains/panicle and yields/plant (g). The highest heritability was found for
photosynthetic rate, transpiration rate, stomatal conductance, intercellular CO2, and
number of filled grains/panicle and yields/plant (g). Cluster analysis based on 22
traits grouped the 43 rice genotypes into five clusters. Cluster II was the largest and
13
consisted of 20 genotypes mostly originating from the Philippines. The first four
principle components of 22 traits accounted for about 72% of the total variation
and indicated a wide variation among the genotypes.
Lingaiah et al. (2015) conducted experiment to estimate the genetic
variability parameters for the quantitative characters in mid early group genotypes
of rice cultivars. The analysis of variance revealed significant difference among the
genotypes for the traits studied indicating that a large amount of variability was
present in the material. The magnitude of phenotypic co-efficient of variation was
higher to genotypic co-efficient of variation for all the traits.
Rahman et al. (2016) have studied the response to selection and estimate
the heritability for grain yield and yield components in F2 segregating populations
of rice. Among F2 populations, high heritability and genetic advance values were
observed for spikelet panicle‑1 (0.99 and 67.9), grain length (0.78% and 1.42),
100‑grain weight (0.73% and 0.83), biological yield plant‑1 (0.93% and 33.8),
grain yield plant‑1 (0.94% and 19.0) and harvest index (0.94% and 25.2). The
genetic potential of Dilrosh, TN‑1 and Kangni‑27 for yield and yield associated
traits could be exploited in future rice breeding program.
2.3 Association analysis
2.3.1 Correlation coefficient analysis
Grain yield of plant is influenced by a number of components, either
directly or indirectly. Contribution of each character towards increase in grain
yield varies from crop to crop. Correlation coefficient is therefore used to measure
the mutual relationship between various plant characters and to determine the
component characters on which selection can be based for genetic improvement in
the yield.
Madhavilatha et al. (2005) reported positive and significant association of
grain yield per plant with days to 50 % flowering, plant height, number of effective
tillers per plant, panicle length, number of grains per panicle, harvest index and
1000 grain weight.
14
Satyanarayana et al. (2005) observed positive association of grain yield per
plant with spikelet fertility, panicle length, number of grains per panicle and
number of effective tillers per plant.
Muthuswamy and Ananda Kumar (2006) reported significant positive
correlation of grain yield per plant with the characters viz., plant height, number of
effective tillers per plant, panicle length, number of grains per panicle, spikelet
fertility and 1000 grain weight.
Girish et al. (2006) reported positive and significant association of grain
yield per plant with plant height, panicle length, number of spikelets per panicle,
number of tillers per plant, biological yield, harvest index and grain breadth.
Agahi et al. (2007) estimated correlations among the traits to find out
association and showed that the grain yield was significantly correlated with days
to heading, total tillers, number of productive tillers, days to maturity, number of
grains per panicle and plant height.
Gnanasekaran et al. (2008) reported positive correlation between grain
yield and length-breadth ratio. Kernel length and Kernel breadth, respectively had
positive and negative correlations with length breadth ratio was reported by
Mahala et al. (2008).
Khan et al. (2009) reported significant and positive correlation of grain
yield per plant with plant height, panicle length, flag leaf width, number of grains
per panicle.
Chakraborty et al. (2010) revealed significant positive correlation of grain
yield per plant with plant height, number of panicles per plant, panicle length,
number of filled grains per panicle and harvest index.
Nandan et al. (2010) revealed strong positive association of yield with days
to 50 % flowering, plant height, number of grains per panicle, number of spikelets
per panicle and spikelet fertility.
Mia et al. (2010) observed highly significant negative correlation between
grain aroma and gelatinization temperature. However, positive correlation was
observed between grain aroma and kernel elongation by Golam et al. (2010).
15
Sanni et al. (2010) reported positive associations between the grain weight
and grain width, and grain length indicate that the wider and/or longer the grain,
the heavier it is. The highly positive correlation between total number of tillers and
fertile tillers showed that the fertile tillers tend to increase along with the total
number of tillers. However, grain length had been found highly significant and
positive association with grain length width ratio.
Ekka et al. (2011) on the basis of association analysis reported that grain
yield per plant had positive significant correlation with leaf width, days to 50 %
flowering, plant height, panicle length, number of filled grains per panicle, 100
seed weight and paddy (grain) length. A positive and significant correlation of
head rice recovery percentage was also observed with leaf length, leaf width, days
to 50 % flowering, number of filled grains per panicle, spikelet sterility % and
milling %.
Ambili and Radhakrishnan (2011) reported significant and positive
correlation of grain yield per plant with plant height, total number of tillers per
plant, number of productive tillers per plant, panicle length, straw yield and harvest
index. At genotypic level yield was positively and significantly correlated with
days to flowering and number of spikelets per panicle
Chakravorty and Ghosh (2012) reported positive and significant association
of plant height with panicle length and grain weight. At genotypic level, kernel
weight was correlated positively and significantly with maturity, grain weight,
grain length, grain breadth and flag leaf angle.
Chakravorty et al. (2013) studied fifty-one landraces of rice to work out the
interrelationship among the 18 agro-morphological traits and found all the traits
except ligule length, culm length, number of grains per panicle and number of
primary branches per panicle exhibited positive and significant correlation
coefficients with kernel weight. Leaf length was positively and significantly
correlated with leaf breadth, plant height and culm length.
Seraj et al. (2013) revealed significant and positive association of grain
aroma with grain length width ratio; significant and negative association with grain
width, gelatinization temperature, and with grain length. Gelatinization
16
temperature had significant and negative correlation with grain length, grain length
width ratio, significant and positive association with grain width. Grain length had
significant and negative correlation with grain width; significant and positive
correlation with length width ratio.
Sinha and Mishra (2013) reported that days to 50 % flowering was highly
correlated with maturity time and also correlated with stem length. Panicle length
was negatively correlated with 100 grain weight. Panicle number shows maximum
correlation with grain length. 100 grain weight shows maximum of correlation
with grain length, grain width, kernel width and kernel length. Grain length and
grain weight possesses maximum correlation with kernel length and kernel weight
respectively. Stem length was highly correlated with length of blade, showing the
morphogenetic compatibility in the architectural configuration of rice plant.
Vanisree et al. (2013) studied association analysis of fifty genotypes
comprising both basmati and aromatic short grain types and revealed that grain
yield was significantly associated with harvest index, plant height, days to 50 %
flowering, panicle length, number of grains per panicle and filled grain per panicle.
Rashid et al. (2014) reported highly significant and positive association of
the traits days to heading, days to maturity, number of productive tillers, 1000-
grain weight with grain yield per plant whereas flag leaf area, plant height and
panicle length showed highly significant negative correlation with grain yield per
plant. Number of grains per panicle was non significant positively correlated with
grain yield per plant.
Sohgaura et al. (2014) reported positive and significant association of grain
yield per plant with number of spikelets per panicle, panicle weight per plant,
kernel elongation ratio, head rice recovery % and number of leaves per plant,
indicated that these are primary yield contributing traits and selection for above
traits might be utilized as inbred for production of hybrids in rice.
Islam et al. (2015) evaluated twenty three rice genotypes including three
check varieties Grain yield was found to be positively and significantly correlated
with filled grain per panicle, plant height, days to 50% flowering and days to
17
maturity both at genotypic and phenotypic levels, indicating the importance of
these traits for yield improvement in rice.
Naseer et al. (2015) studied twenty four Asian accessions of rice Plant yield
was positively and significantly correlated with filled grains weight per panicle,
number of grains per panicle, 1000-grain weight and spikelet fertility percentage at
genotypic and phenotypic levels. Thus, these traits could play pivotal role in the
development of high yielding rice genotypes.
Al-Salim et al. (2016) evaluate the performance of different ten genotypes
of bread rice under irrigated field conditions. The results indicated the existence of
genetic variability, in a significant manner (at the level 5%). The study showed the
importance of the Panicle Length due to its positive and high significant
correlation with the grain yield, so it can be used as indicator of suitable selection
for the development of high-yielding genotypes. Results also showed that
correlation between grain yield and plant height was negative and significant.
2.3.2 Path coefficient analysis
Path coefficient analysis measures the direct and indirect contributions of
independent variables on dependent variable. Though, the correlation coefficients
depict the nature of association among the characters, it is the path analysis that
splits the correlation coefficients into direct and indirect effects thus specifying the
relative contribution of each character. It further reveals the different ways in
which character influence the dependent variable.
Bhagat (2007) reported positive direct effect of number of tillers per plant,
number of productive tillers per plant, panicle length, panicle weight per plant,
panicle index, number of spikelets per panicle, number of filled grains per panicle,
1000 grain weight, biological yield per plant and harvest index on grain yield per
plant.
The highest positive direct effect of number of productive tillers on grain
yield was reported by Agahi et al. (2007) however, the greatest direct effect of
filled grains per panicle on the grain yield was reported by Gnanasekran et al.
(2008).
18
Nandan et al. (2010) reported that the number of grains per panicle had
maximum direct effect on grain yield per plant followed by kernel length after
cooking (KLAC), days to 50 % flowering, hulling percentage, plant height, harvest
index and kernel breadth after cooking (KBAC).
Wattoo et al. (2010) reported that the days to maturity had highest direct
effect on grain yield per plant. In addition, the yield components had positive direct
effect on grain yield except the days to heading.
Ambili and Radhakrishnan (2011) reported highest positive direct effect of
plant height on grain yield. This was followed by number of productive tillers per
plant, straw yield, harvest index and total number of tillers per plant. The highest
negative direct effect on yield was obtained for days to flowering. So it can be
concluded that yield of rice can be improved by selecting medium tall genotypes
having more number of productive tillers per plant, higher straw yield and an
optimum duration.
Selvaraj et al. (2011) reported that the test weight exhibited maximum
positive direct effect on grain yield per plant followed by filled grains per panicle,
plant height, panicle length, number of tillers per plant and days to 50 % flowering
and they contributed primarily to yield and could be relied upon for selection of
genotypes to improve genetic yield potential of rice.
Ravindra Babu et al. (2012) reported that panicle length had the highest
positive direct effect on grain yield. Grain yield linearly correlated with panicle
length, the number of panicle per plant, and the number of filled grains per panicle.
Therefore, these traits may be used in the selection for grain yield in rice.
Naseem et al. (2014) reported that the number of productive tillers per
plant, number of spikelets per panicle, number of grains per panicle and days to
maturity had positive direct effect on grain yield per plant.
Sarawgi et al. (2015) reported that the leaf length, leaf width, days to 50%
flowering, effective tiller, plant height, panicle length and days to maturity had
positive direct effect on grain yield per plant. These characters could be used as
direct selection criterion for higher grain yield.

19
Hossain et al. (2015) evaluated Thirty five local aman rice varieties for
their variability with regards to yield and yield components. Yield was observed to
be positively associated with panicle bearing tillers and number of filled grains per
panicle and these characters were noticed to exert high direct effects on grain yield
per plant. High indirect effects of most of the traits were noticed mostly through
panicle bearing tillers per hill indicating importance of the trait as selection criteria
in crop yield improvement programs.
Ratna et al. (2015) studied Correlation and path coefficients analyses
among fourteen morphological Characters in six advanced lines of Basmati rice
and one commercial check. Path coefficient analysis revealed highest positive
direct effect of number of filled spikelets/panicle on grain yield but plant height
and number of unfilled spikelets/panicle had negative direct effect on grain.
Islam et al. (2015) evaluated twenty three rice genotypes including three
check varieties the path coefficient analysis, revealed that days to maturity, days to
50% flowering, plant height, number of filled grain per panicle and grain length
had direct positive effect on yield, indicating these are the main contributors to
yield. Eventually, it was recommended that, for obtaining increased rice yield, a
genotype should possess more number of filled grains per panicle.
Singh et al. (2016) The phenotypic path-coefficient analysis in fourteen
quantitative traits of upland rice (Oryza sativa L.) showed that the total number of
grains per panicle had maximum direct effect on the grain yield per plant followed
by spikelet fertility percentage. The filled grains per panicle and total number of
grains per panicle exhibited high positive and significant association with grain
yield per plant, due to high direct and indirect effect of total number of grains per
panicle on grain yield per plant.
2.4 Principal component and cluster analysis
Multivariate statistical tools have found extensive use in summarizing and
describing the inherent variation among crop genotypes. One of the tools includes
Principal Component Analysis (PCA). This technique identifies plant traits that
20
characterize the distinctness among selected genotypes. These are often extended
to the classification of a population into groups of distinct orders based on
similarities in one or more characters, and thus guide in the choice of parents for
hybridization (Nair et al., 1998). Cluster analysis is also a multivariate method
which aims to classify a sample of subjects (or objects) on the basis of a set of
measured variables into a number of different groups such that similar subjects are
placed in the same group.
Zhang et al. (2004) studied principal component and correlation analyses to
test the quality characteristics of 89 japonica rice varieties. Principal component
analysis showed that brown rice rate, milled rice rate, length: width, chalkiness,
gelatinisation temperature and gel consistency should be taken as the principal
properties for estimating rice quality.
Rashid et al. (2008) in order to identify the major characters which account
for variation among Basmati rice mutants used Single Linkage Cluster Analysis
(SLCA) and Principal Component Analysis (PCA). The first three PCs with
eigenvalues > 1 contributed 78.7 % of the variability among the genotypes. Four
characters were positive to PC3 than PC2 and PC1. Productive tillers per plant and
panicle fertility contributed maximum in PC3.
Yang et al. (2009) classified ten agronomic traits of 98 accessions of
upland rice using PCA and showed that there was remarkable variance among
traits of the accessions. Ten agronomic traits of the accessions could be classified
into four principal components with cumulative proportion of 77.03 %. The first
principal component was determined by spikelets per panicle, total grains per
panicle. The second was determined by effective tillers per plant, 1000-grain
weight and panicle length. The third mainly represented yield per plant, and the
fourth reflected grain and growth period of the accessions.
Li et al. (2010) carried out principal component analysis and clustering of
46 introduced black pericarp rice cultivars based on 8 agronomic traits. On the
basis of principal components, these 46 black rice varieties were divided into three
groups for 4.19 Euclidean distances. The characters of the first group were late
maturity, high stalk, moderate spikes and many grains; and the second group had
21
the characteristics of early maturity, medium stalk, long spike, and weighty grains;
the third group was type of late maturity, high stalk, many spikes, many and light
grains.
Anandan et al. (2011) assessed diversity of 44 rice genotypes from
different geographic regions using Mahalanobis D2 and Principal Component
Analysis (PCA). The PCA revealed that axes 1 and 2 accounted for 82.88 % and
11.14 % of the variance, respectively. The highest contributing variable was the
number of grains per panicle in PC1 and the plant height in PC2. Both D2 and
PCA revealed that the morphometric diversity was based on the pedigree and
independent of geographical origin.
Ashfaq et al. (2012) performed PCA for twelve morphological traits and
reported four principal components out of twelve which exhibited more than one
Eigen value and showed about 67.7 % variability. The PC1 was more related to
plant height, panicle length, primary branches per panicle, number of spikelets per
panicle, number of seed per panicle, seed weight per panicle, plant yield, heading
days and maturity days so, it must be considered. In PC2 the primary branches,
seeds per panicle, seed weight per panicle, 1000 grain weight and plant yield were
more related traits. The PC3 exhibited positive effect for plant height, panicle
length, flag leaf area, primary branches per panicle and 1000 grain weight. The
PC4 was more related to number of spikelets per panicle, 1000 grain weight,
heading days and maturity days. Based on first our PCs it was cleared that the 1000
grain weight, number of spikelets per panicle, primary branches per panicle,
number of seeds per panicle and seed weight per panicle had high weightage value
and number of tillers had lowest value.
Chanbeni et al. (2012) reported nine clusters using by considering 13
quantitative characters in 70 rice genotypes. Cluster I and cluster III constituted
maximum number of genotypes (12 each). The genotypes falling in cluster VII had
the maximum divergence, which was closely followed by cluster V and cluster I.
The inter cluster distance was maximum between cluster VI and VII followed by
cluster III and IX, suggesting that the genotypes constituted in these clusters may
be used as parents for future hybridization programme. Traits like spikelets per
22
panicle; plant height and biological yield were the major contributors to genetic
divergence.
Chakravorty et al. (2013) studied 51 landraces of rice to determine the
nature and magnitude of the variability among the genetic materials, and the
intensity of relationships among the traits using multivariate tools. They identified
six principal components with Eigen value greater than 1.0 and that explained 75.9
% of the total cumulative variance within the axes could effectively be used for
selection among them. In PC1, the traits that accounted for most of the 23.47 %
observed variability among 51 genotypes included leaf length, plant height, culm
diameter, culm number and panicle length. PC2 is related to leaf width, ligule
length, number of primary branches per panicle and number of grains per panicle.
PC3 was more related to grain breadth and grain length: breadth ratio. PC4 was
related to flag leaf angle, maturity and sterile lemma length. PC5 included grain
length while PC6 was related to culm length. Thus, principal component analysis
revealed that six quantitative characters viz., leaf length, culm number, culm
diameter, number of grains per panicle, grain length: breadth ratio and grain length
significantly influenced the variation in these cultivars. Clustering pattern using the
first two principal components permitted the separation 51 landraces of rice into
ten major clusters from diverse geographical location, suggesting environmental
adaptation of the landraces.
Kumar et al. (2013) reported five Principal Components (PCs) exhibited
more than 1.8 Eigen value and showed about 68.34 % variability on the basis of
principal component analysis. The PC1 showed 25.81 %, while PC2, PC3, PC4
and PC5 exhibited 17.22 %, 9.56 %, 8.58 % and 7.16 % variability respectively,
among the RILs for the traits under study. Rotated component matrix revealed that
each principal component separately loaded with various yield and quality
attributing traits. The PC1, PC2, PC3 and PC5 mostly related to yield attributing
traits whereas PC4 related to quality traits. As PC1 was constituted by most of the
yield attributing traits, an intensive selection procedures can be designed to bring
about rapid improvement of dependent traits i.e., grain yield by selecting the lines
from PC1. Similarly, for quality aspect a good breeding programme can be
initiated by selecting the lines from PC4. PC scores of RILs in these five PCs
23
suggested that RIL 2-36 is the best for yield attributing traits whereas RIL 2-52 for
quality traits. These selected RILs may be used as inbred in production of hybrid in
rice. However, RIL 2-50 is the best for both yield and quality traits, which can be
used directly for cultivation.
Meti et al. (2013) studied the cluster pattern by using UPGMA algorithm of
48 aromatic rice germplasm, and grouped into two Clusters (I and II) at 49 %
similarity coefficient. 11 aromatic rice genotypes were represented in Cluster I
whereas 37 varieties were placed in Cluster II. Cluster I was divided into two
subclusters „IA‟ and „IB‟ at 56 % similarity coefficient. The sub-cluster „IA‟
included seven aromatic rice varieties in which „Kaminibhog-1‟ and „Kalikati-1‟
were most similar genotypes within sub-cluster. On the other hand the sub-cluster
„IB‟ was represented by the following four aromatic rice varieties „Basumati dhan‟
„Basumati Bhog‟, „Chatianak‟ and „Pumpudibasa‟. Among them „Basumati dhan‟
was the most diverged one in this sub-cluster. The cluster II was further classified
into two sub-clusters „IIA‟ and „IIB‟. There were 35 aromatic rice varieties
included in the sub-cluster „IIA‟ whereas only two aromatic rice varieties „Dubraj‟
and „Sujata‟ were placed in Cluster „IIB‟.
Sinha and Mishra (2013) characterized 34 landraces of rice based on 12
quantitative agro-morphological characters using Multivariate statistical analysis
and enabled pattern of variation of the germplasm of landraces of rice and
identification of the major traits contributing to the diversity of landraces. Five
cluster groups were obtained from the 12 agro-morphological characters. PCA
showed the contribution of each character to the classification of the rice landraces
into different cluster groups. The first three principal components explained about
86.9 % of the total variation among the 12 characters. The results of PCA
suggested that characters such as leaf length, leaf width, panicle length and grain
size (100 grain weight, length and width of grain and kernel were the principal
discriminatory characteristics of landraces of rice.
Shiva Prasad et al. (2013) reported significant differences among the 470
genotypes for all the nineteen characters studied. The quantum of genetic
divergence was assessed by cluster analysis using Mahalanobis‟s Euclidean
24
squared distances which grouped the entire material into eight clusters and
estimates the average distance between them. It was interesting to observe that
most of the genotypes of one cluster were adapted to only one region. The
clustering pattern reflects the closeness between the clusters and the geographical
adaptation of the genotypes. Also, traits contributing maximum to genetic
divergence are fertile grains/ panicle and panicle length may be utilized in
selecting genetically diverse parents. It was also reported that genotypes within the
cluster with high degree of divergence would produce more desirable breeding
materials for achieving maximum genetic advance.
Nachimuthu et al. (2014) used principal component analysis to examine the
variation and to estimate the relative contribution of various traits in a population
panel of 192 rice genotypes for 12 agro-morphological traits. Component 1 had the
contribution from the traits such as days to 50 % flowering, leaf length, plant
height, panicle length, days to maturity and number of filled grains which
accounted 28.46 % of the total variability. Grain width and grain length width ratio
has contributed 16.8 % of total variability in component 2. The remaining
variability of 14.4 %, 11.7 % and 9.3 % was consolidated in component 3,
component 4 and component 5 by various traits such as spikelet fertility, single
plant yield, grain length and number of productive tillers. The cumulative variance
of 80.56 % of total variation among 12 characters was explained by the first five
axes.
Kumar et al. (2014) reported five clusters based on D2 analysis for 23
genotypes of rice. Among the five clusters, cluster III consists of 7 genotypes
forming the largest cluster followed by cluster I and IV with 5 genotypes each.
Cluster II with 4 genotypes and cluster V with 2 genotypes. Inter cluster distances
were found to be higher than intra cluster distances which depicted wide genetic
diversity among the rice genotypes. The contribution of various characters towards
the expression of total genetic diversity indicated that 1000 grain weight
contributed maximum (54.55 %) followed by plant height (13.44 %) and kernel
breadth (11.86 %). Clustering of the cultivars did not show any pattern of
association between the morphological characters and the origin of the cultivars.
25
Cluster analysis performed by Rashid et al. (2014) on twenty diverse
cultivars of rice revealed that maximum genetic diversity was present between
Cluster I and Cluster VI. Minimum genetic diversity was found between Cluster III
and Cluster IV. It was concluded that traits like number of productive tillers,
number of grains per panicle and 1000-grain weight was useful for direct selection
criteria for higher grain yield.
Apsath Beevi and Venkatesan (2015) grouped 60 rice genotypes from
different eco- geographical regions of India into six clusters. Cluster I was found to
be the largest comprising of 50 genotypes followed by cluster II had four
genotypes. The clusters IV and V had two genotypes each while cluster III and VI
are monogenotypic in nature. The pattern of distribution of genotypes from
different eco-geographical regions into various clusters was at random indicating
that geographical diversity and genetic diversity were not related. The characters
grain yield plant-1, number of grains panicle-1 and plant height contributed
maximum towards genetic divergence among the genotypes. Cluster III recorded
highest mean value for grain yield plant -1 and lowest mean value for days to first
flower. The highest inter-cluster distance (D2 =7925.46) was recorded between
clusters III and VI.
Ayesha et al. (2015) genetic variability among the Oryza sativa germplasm
using agromorphological characters. The data were analyzed by cluster analysis
and principal component analyses. A significant level of variability was noticed for
a number of agro-morphological traits. The largest variation was observed in seed
yield per plant, (588.32), sterile culms per plant (341.25) and flag leaf length
(291.09). The 116 accessions in this study were grouped into seven clusters based
on hierarchical clustering method. PCI which is most important explained 28.41%,
PC II contributed 13.38%, and PC III accounted for 11.69% of total morphological
variability.
Rathore et al. (2016) studied the functional traits of 76 weedy rice
populations and commonly grown rice cultivars from different agro-climatic zones
for nine morphological and five physiological parameters in a field experiment.
The results of principal component analysis revealed the first three principal
26
components to represent 47.3% of the total variation, which indicates an important
role of transpiration, conductance, leaf-air temperature difference, days to panicle
emergence, days to heading, flag leaf length, grain weight, plant height, and
panicle length to the diversity in weedy rice populations.
2.5 Quality parameter
Babu et al. (2006) studied genetic divergence for different grain quality
traits in 70 rice genotypes from different eco-geographical regions of India. The
genotypes were grouped into nine clusters. Water uptake, gel consistency and head
rice recovery contributed the maximum towards genetic divergence. Geographical
diversity was not related with genetic diversity.
Roy et al. (2007) evaluated genetic divergence in twenty eight rice
genotypes using D2 statistics. These genotypes were grouped into four clusters.
Seed yield per plant contributed the maximum towards genetic divergence
followed by amylose content cooked kernel length and thousand seed weight.
Shrivastava et al. (2007) studied genetic diversity using Mahalanobis D2 statistics
in 20 genotypes of rice. These genotypes were grouped into six clusters. There was
lack of relationship between genetic and geographical diversity.
Singh and Singh (2007) analyzed various cooking and physical qualities of
rice. The hulling varied from 68.9 to 82.9%, milling from 56.1 to 74.2%, head rice
recovery from 19.7 to 49.4%, kernel length (KL, uncooked) from 5.1 to 7.1 mm,
kernel breadth (KB, uncooked) from 1.7 to 2.4 mm, kernel length breadth ratio
from 2.31 to 3.94, KL (cooked) from 9.5 to 12.7 mm, KB (cooked) from 2.5 to 3.6
mm, kernel elongation ratio from 1.39 to 1.98, alkali score from 2.6 to 6.6, volume
expansion from 2.78 to 3.12, water uptake number from 390 to 500, amylase
content from 15.15 to 41.62, gel consistency from 30 to 100, and aroma absent to
strong.
Pkania et al. (2007) predicted genotypic values for quality traits were
calculated using the Mahalanobis distance method and used to measure the genetic
similarities among rice varieties.
27
Sharma et al. (2008) studied under irrigated situation using D2
statistics in a
set of 100 aromatic rice genotypes. The genotypes were grouped into nine clusters
and it was observed that there was no association between the geographical
distribution and genetic diversity.
Lang et al. (2009) studied a collection of 200 salt tolerance rice landraces
was assessed for genetic diversity using quantitative agro-morphological
characters. The diversity indices (H‟) for quantitative descriptors were high
ranging from 0.68 to 0.95. Overall the mean diversity index for all traits was 0.88).
Cluster analysis generated by UPGMA grouped the 200 rice landraces into six
clusters with similarity coefficient of 20.61. The six clusters were distinct in terms
of culm length, number of filled grains, panicle length, panicles per plant, grain
length, grain width, yield and biomass.
Shahidullah et al. (2009) studied 40 genotypes composed of 32 local
aromatic, five exotic aromatic and three non-aromatic rice varieties. Univariate and
multivariate analyses were done. Enormous variations were observed in majority
of characters viz. grain length, grain breadth, kernel weight, milling yield, kernel
length, Length/Breadth ratio of kernel, volume expansion ratio (VER), protein
content, amylose content, elongation ratio (ER) and cooking time.
Pandey and Anurag (2010) observed among 22 genotypes of indigenous
rice for yield and quality contributing traits viz., volume expansion ratio, head rice
recovery, kernel length and length breadth ratio, indicating that there is presence of
sufficient amount of variability in the study material. On the basis of mean
performance of yield and yield contributing traits they found that “Indrani” was the
best performer for both yield and quality over Jhumeri. For quality parameters
Narendra-359 and Indrani were good, milling percentage of Lohandi was best
followed by Bayalu and Dudagi general types.
Shilpa et al. (2010) studied 22 traditionally cultivated rice varieties from
Goa for physicochemical characteristics such as physical (hulling, head rice
recovery, broken rice, grain classification, chalkiness), chemical (alkali spreading
value, amylose content, gel consistency, aroma) and cooking characteristics
(volume 29 expansion, elongation ratio, water uptake). The hulling percentage
28
ranged from 63-81% and head rice recovery from 45-74%. Among the varieties
Length/Breath ratio ranged from 1.5-3.5 and the amylose content ranged from 14-
25%. The kernel elongation ratio ranged from 4.78-1.83 mm and water uptake ratio
ranged from 160-390.
Garg et al. (2011) studied forty eight genotypes of rice to study the nature
and magnitude of genetic divergence using D2 statistics. Seventeen yield and
quality traits were recorded on the genotypes. The forty eight genotypes were
grouped into five clusters based on Euclidean cluster analysis. Days to maturity,
gel consistency and days to 50 per cent flowering contributed 74.55 per cent of
total divergence.
Danbaba et al. (2011) studied on the cooking and eating quality of Ofada
rice. The result showed that Ofada rice had high cooked rice volume with length
and breadth increase of 152.54% and 87.85% respectively. Grain elongation ratio
ranged from 1.24-1.75 and highest length/breadth ratio of cooked rice (3.68) and
lowest (2.49) was recorded. Water uptake ratio, cooking time, solids in cooking
gruel and amylase content of Ofada rice samples ranged from 174.0-211.0, 17-24
min, 0.8- 2.1%, and 19.77-24.13% respectively.
Satheeshkumar and Saravanan (2012) studied genetic diversity among fifty
three genotypes of rice genotypes from various states of south Eastern region of
India was evaluated using Mahalanobis D2 statistic. Based on 15 morphological
and quality characters, these genotypes were grouped into six Clusters.
Geographical origin was not found to be a good parameter of genetic divergence.
Grain yield per plant (38.52%) followed by filled grains per panicle (13.46%) and
total number of grain per panicle (12.65%) contributed maximum to total
divergence.
Subudhi et al. (2012) evaluated forty-one rice varieties of different
ecologies at CRRI, Cuttack and found that hulling percentage in all the genotypes
ranged from 71.0 to 81.0, milling recovery varied from 62.0 to 76.0 and head rice
recovery % varied from 43.5 to 68.0. The kernel length was highest (7.54) and
lowest (3.88), kernel length after cooking varied from 7.9 to 12.5, elongation ratio
was highest (2.07) and (2.0) and lowest (1.44). Volume expansion ratio was
29
highest (5.25), and lowest (3.25). Amylose content was intermediate in all the
tested genotypes and it ranged from 22.1 to 26.1.
Gnanamalar and Vivekanandan (2013) analysis of generation mean was
carried out in six crosses of rice for hulling percentage, milling percentage, head
rice recovery, kernel length, kernel breadth, kernel Length/Breadth ratio, kernel
length after cooking, linear elongation ratio and alkali spreading value. The scaling
test showed the presence of epistatic interactions for all the nine grain quality traits
studied. Milling percentage was governed by additive, dominance and epistatic
interactions of additive x additive, dominance x dominance and duplicate epistasis.
Hulling percentage was governed by additive, dominance and duplicate type. Head
rice recovery was under the control of additive, dominance, dominance x
dominance and duplicate epistasis.
Gangadharaiah et al. (2015) studied the physicochemical and cooking
quality of traditioal rice cultivars grown in the farmer‟s field. Among the cultivars,
Kichadi Sona and Salem Sanna recorded higher milling yield (66.0% and 65.0%)
and head rice recovery (58.5% and 58.30%), respectively. Therefore, these
cultivars could be utilized in the breeding programme is the need of the today
towards the „hidden hunger‟ free world.
Hosen et al. (2016) studied 17 Aus rice cultivars including 10 local
cultivars. The highest milling outturn 72.22% was found in the traditional variety
Chakilla and lowest in Kasalath (65.43%). The highest milled rice length (6.5 mm)
was BRRI dhan42 and the highest length-breadth ratio (3.8) was found in both
BR24 and BR26. The lowest grain length was found in BR20 (5.0 mm) and lowest
length-breadth ratio was found in Phul Dumra (2.0). In addition, Surjamukhi has
aroma. These local Aus variety could be a useful germplasm in breeding program
to get improve HYV especially for Aus season.
2.6 Molecular characterization
Molecular characterization of the genotypes gives precise information
about the extent of genetic diversity which helps in the development of an
appropriate breeding program. It is also very important for germplasm

30
management, varietal identification and DNA fingerprinting. A brief reviews has
been summarized below:
Tan et al. (2000) conducted a molecular marker-based genetic analysis of
the traits that are determinants of the appearance quality of rice grains, including
traits specifying grain shape and endosperm opacity and reported the QTL located
in the interval of RG393-C1087 on chromosome 3 is the major locus for grain
length, and the one in the interval RG360-C734a on chromosome 5 plays a major
role in determining grain width.
Hossain et al. (2007) used a total of thirty microsatellite molecular markers
across 21 rice genotypes for their characterization and discrimination. The number
of alleles per locus ranged from three (RM165, RM219, RM248, RM463, RM470
and RM517) to nine (RM223), with an average of 4.53 alleles across the 30 loci
obtained in the study. The polymorphism information content (PIC) values ranged
from 0.30 (RM219) to 0.84 (RM223) in all 30 loci. RM223 was found the best
marker for the identification of 21 genotypes as revealed by PIC values. The
frequency of the most common allele at each locus ranged from 24% (RM223 and
RM334) to 81% (RM219).
Nipon et al. (2007) assessed genetic variability among 24 rice genotypes
from Assam employing ISSR-PCR using ten primers. A total of 201, ISSR markers
were generated with 98 per cent polymorphism. The average polymorphism
information content (PIC) for ISSR markers was 0.88. Cluster analysis and
cophenetic correlation value based on the ISSR data discretely separated the
accessions, according to farmer‟s classification.
Mia et al. (2010) used three SSR primers viz. RM223, RM515 and RM342
for identification of fgr gene locus in 22 rice genotypes and reported that all the
three markers identified fifteen rice genotypes having fgr gene locus. From
phenotypic and genotypic evaluation, it was found that, six genotypes (Basmati
370, Indian Ndingo, Nam Sagui19, IR77542-127-1-1-1-1-2, Si- Feng 43 and
Kalizira) having strong aroma with slender grain. Four genotypes (M6-9-28 UL,
PSB RC 70, PR 26768-PJ (T) 4C 18-8-2-1 and Chinisagor) having moderate aroma
with slender to medium grain. Finally, five genotypes (Indian Ndingo,
31
NamSagui19, IR77542-127-1-1-1-1- 2, Basmati 370 and Si- Feng 43) were
selected having strong aroma with good agronomic performances. These genotypes
could be used in breeding programme to develop new varieties.
Bai et al. (2010) performed QTL analysis for grain shape using an RIL
population derived from two varieties with contrasts in grain shape. Twenty-eight
QTLs were identified. Seven of them were detected for the first time. These results
demonstrated that the mapping population derived from parents with contrasting
phenotypes can be used for detecting more QTLs. In their study, a minor QTL
of qGL7 was validated with pleiotropic effects on GL, GW, TGW, SPP, and GT in
an NIL-F2 population. It is suggested that minor QTL of a highly heritable trait
could be isolated following the strategy of map-based cloning in a large NIL-
F2population.
Girma et al. (2010) studied genetic diversity of three wild rice populations
of Ethiopia along with three cultivated rice populations using Inter simple
sequence repeats (ISSRs) as a molecular marker. Both UPGMA and neighbor
joining trees were constructed for each individual and population using Jaccard‟s
similarity coefficient. The trees and PCO clearly indicated six distinct groups
which are based on populations of origin. Oryza glaberrima, Oryza sativa and
NERICA-3 clustered as a major group while Oryza barthii and Oryza
longistaminata were clustered as the second major group. The overall gene
diversity and percent polymorphisms were found to be higher in wild rice (0.14;
38.3 respectively) than in cultivars (0.11; 28.3 respectively).
The SSR markers have been increasingly applied by many scientists in rice
germplasm. Priti et al. (2011) studied genetic diversity of popular of 29 rice
varieties in India using 12 SSR markers and identified genotype specific alleles in
14 popular rice varieties which can be employed in true identification germplasm
in their country. Herrera et al. (2008) assessed genetic diversity in Venezuelan rice
cultivars using simple sequence repeat markers to broaden the genetic bases of rice
germplasm in the country. The genetic diversity reported was very low, but this
work proved SSR to be an efficient tool in assessing the genetic diversity of rice
genotypes.

32
Shukla et al. (2011) characterized forty four indigenous local strains of
Kalanamak rice (Oryza sativa L.) with 60 morphological DUS descriptors, RAPD
and ISSR markers. The UPGMA cluster analysis revealed that the ISSR loci
enabled identification of 42 strains (95%). Two ISSR primers, viz LC 61 and LC
67 produced genotype specific loci in Kalanamak strains 3131-1P and 3119-SN
which were able to discriminate them from rest of the strains. Higher number of
average bands (8.2), number of average polymorphic bands (6.6), percentage of
polymorphic bands (78.9%), average polymorphic information content (0.33),
average resolving power (10.85), average effective multiplex ratio (5.6) and
marker index (2.08) for ISSR marker as compared to RAPD reflected that ISSR
marker is more efficient tool to establish distinctiveness amongst the present set of
experimental material.
Das et al. (2012) reported the diversity among 26 indigenous non-basmati
aromatic rice genotypes, six basmati and 9 HYV; both morphologically using 12
grain and kernel traits and genetically using 23 previously mapped SSR markers.
High genetic diversity was observed for the grain and kernel dimension and quality
traits, in the indigenous non-basmati aromatic rice genotypes through D2 analysis.
The polymerase chain reaction (PCR) profile obtained from 23 SSR markers
generated 172 alleles including 28 rare alleles and 9 null alleles. The ensuing
dendrogram obtained from the SSR profiles clustered the basmati rice and the
indigenous non-basmati aromatic rice genotypes separately.
Rahman et al. (2012) studied thirty-four microsatellite markers across 21
types of rice to characterize and discriminate among different varieties. The
number of alleles per locus ranged from 2 to 11, with an average of 4.18 alleles
across 34 loci. A total of 57 rare alleles were detected at 24 loci, whereas 42
unique alleles were detected at 20 loci. The results revealed that 14 rice varieties
produced unique alleles that could be used for identification, molecular
characterization, and DNA fingerprinting of these varieties. Polymorphic
Information Content (PIC) values ranged from 0.157 to 0.838, with an average of
0.488, which revealed that much variation was present among the studied varieties.
The PIC values revealed that RM401 might be the best marker for identification
and diversity estimation of rice varieties, followed by RM566, RM3428, RM463,
33
and RM8094 markers. In this study, eight SSR markers (RM10713, RM279,
RM424, RM6266, RM1155, RM289, RM20224, and RM5371) were identified that
produced specific alleles only in the aromatic rice varieties and were useful for
varietal identification and DNA fingerprinting of these varieties. The findings of
this study should be useful for varietal identification and could help in background
selection in backcross breeding programs.
Sajib et al. (2012) used a total of 24 SSR markers across 12 elite aromatic
rice genotypes for their characterization and discrimination. Among these 24
markers 9 microsatellite markers were showed polymorphism. The number of
alleles per locus ranged from 2 alleles (RM510, RM244, and RM277) to 6 alleles
(RM163), with an average of 3.33 alleles across 9 loci obtained in the study. The
polymorphic information content values ranged from 0.14 (RM510) to 0.71
(RM163) in all 9 loci with an average of 0.48. RM163 was found the best marker
for the identification of 12 genotypes as revealed by PIC values. The frequency of
most common allele at each locus ranged from 41 % (RM163, RM590, and
RM413) to 91 % (RM510). The microsatellite marker based molecular
fingerprinting could serve as a sound basis in the identification of genetically
distant accessions as well as in the duplicate sorting of the morphologically close
accessions.
Meti et al. (2013) reported the allelic diversity and relationship among 48
traditional indigenous aromatic rice germplasm grown under Eastern part of India
using SSR markers. Out of 30 primers, 12 primers showed DNA amplification and
polymorphism among 48 aromatic rice genotypes. The number of alleles per locus
ranged from 1 to 5 with an average 2.08. Out of 28 bands, 25 bands were
polymorphic and three were monomorphic bands. The results reveal that all the
tested primers showed distinct polymorphism among the landraces/varieties
indicating the robust nature of SSR markers. The cluster analysis indicates that the
48 traditional indigenous aromatic rice genotypes were grouped into two major
clusters. The information obtained from the SSR profile helps to identify the
variety diagnostic markers in 48 traditional indigenous aromatic rice genotypes.
34
Vohra et al. (2013) reported the genetic diversity among twenty aromatic
and non-aromatic rice genotypes using twenty five microsatellite markers (SSR).
They used fifteen markers for analysis of aromatic and non-aromatic rice
genotypes. These markers generated higher level of polymorphism because they
generated 356 polymorphic reproducible bands with 164 loci. The remaining ten
markers were used for the study of quality traits which shown 222 polymorphic
bands with 101 alleles. The cluster analysis using SSR markers could distinguish
the different genotypes. The dendogram generated on the principle of Unweighted
Pair Wise Method using Arithmetic Average (UPGMA) was constructed by
Jaccard‟s Coefficient and the genotypes were grouped in to clusters. The
dendogram developed for aroma and quality traits showed that the genotypes with
common phylogeny and geographical orientation tend to cluster together.
Kumbhar et al. (2013) used ISSR fingerprinting to assess the genetic
diversity among fifty rice accessions. Out of 25 ISSR primers screened 13 primers
produced polymorphic amplicons and were selected for genetic diversity analysis.
It produced a total of 103 reproducible amplification products with an average of
7.92 amplicons per primer. All the markers displayed polymorphic amplicons. Of
the total amplicons, 100 (97.08 %) were polymorphic for more than one variety.
The UPGMA based clustering analysis using Dice similarity coefficient grouped
these genotypes into three major and eleven sub-clusters. Cluster I had highest
number of genotypes (38) followed by Cluster II (11) and cluster III (I). The
grouping resembled the ancestry of the genotypes under study.
Kumar et al. (2014) characterized a set of 72 rice genotypes collected from
different villages of Chhattisgarh state, using molecular (SSR) marker. SSR
analysis with 15 polymorphic SSR primers produced 44 different alleles on 2.5 %
agarose gel with an average of 2.93, ranging from 1 to 4 alleles per locus.
Aslam and Arif (2014) studied 48 rice accessions and there are a lot of
gene/QTLs were identified by different groups on chromosome 3 and 7 controlling
grain length. Clustering based on grain length divided the 48 accessions into two
major clusters with some contradiction. Genetic relationships among the 48 rice
accessions were determined based on allelic diversity using Power Marker tree,
35
structure analyses and PCA using 51 SSR markers located on chromosome 3 and
chromosome 7. Two-dimensional PCA scaling and power marker tree analysis
showed high-level of differentiation between Basmati and indica rice accessions
and divide these rice accessions in two distinct clusters.
Rout et al. (2014) assess the genetic diversity on the basis of molecular
characterization among 48 traditional aromatic rice varieties of India. Twenty four
ISSR markers were studied in 48 traditional aromatic rice to characterize and
discriminate it. A total of 151 polymorphic alleles were detected whereas 37
monomorphic alleles were detected. Polymorphic information content (PIC) was
found to be the highest in primer (AM-8) and lowest in primer UBC-840. Result
revealed that the primer AM-8 might be the best marker for identification and
diversity estimation of aromatic rice varieties, followed by AM-4, AM-1, UBC-
818 and UBC-850 primers. The UPGMA cluster dendrogram created in this study
identified two clusters with a similarity coefficient of 53%. The genotype pair
(„Dangerbasumati‟ and „Gangaballi‟) showed the maximum similarity (0.93)
among the 48 aromatic genotypes.
Kunusoth et al. (2015) has reported the genetic diversity assessment of 24
elite Indian rice varieties was based on 24 agro-morphological traits and 86 SSR
markers. The morphological and grain traits exhibiting significant variation are
useful for discrimination of the rice varieties and were confirmed by Principal
Component Analysis. Genetic diversity assessment based on SSR markers
displayed genetic similarity coefficients and grouped the varieties into five major
clusters. The genetic population structure obtained was predominantly associated
with UPGMA clustering and the structure bar plot. Cluster analysis based on both
phenotype and SSR marker data did not show perfect congruence between the two
measures of genetic diversity.
Becerra et al. (2015) analyzed 16 commercial varieties using 54
microsatellites. The 54 microsatellite loci allowed the discrimination among the 16
varieties. The number of alleles ranged between 2 and 8 with a mean of 3.54 alleles
per locus, while the polymorphism information content (PIC) presented a mean of
0.44. The highest PIC was positively associated with the highest number of alleles
36
detected by SSRs. Given this situation, it is important to continuously introduce
germplasm from other regions to increase the Rice Breeding Program's genetic
base.
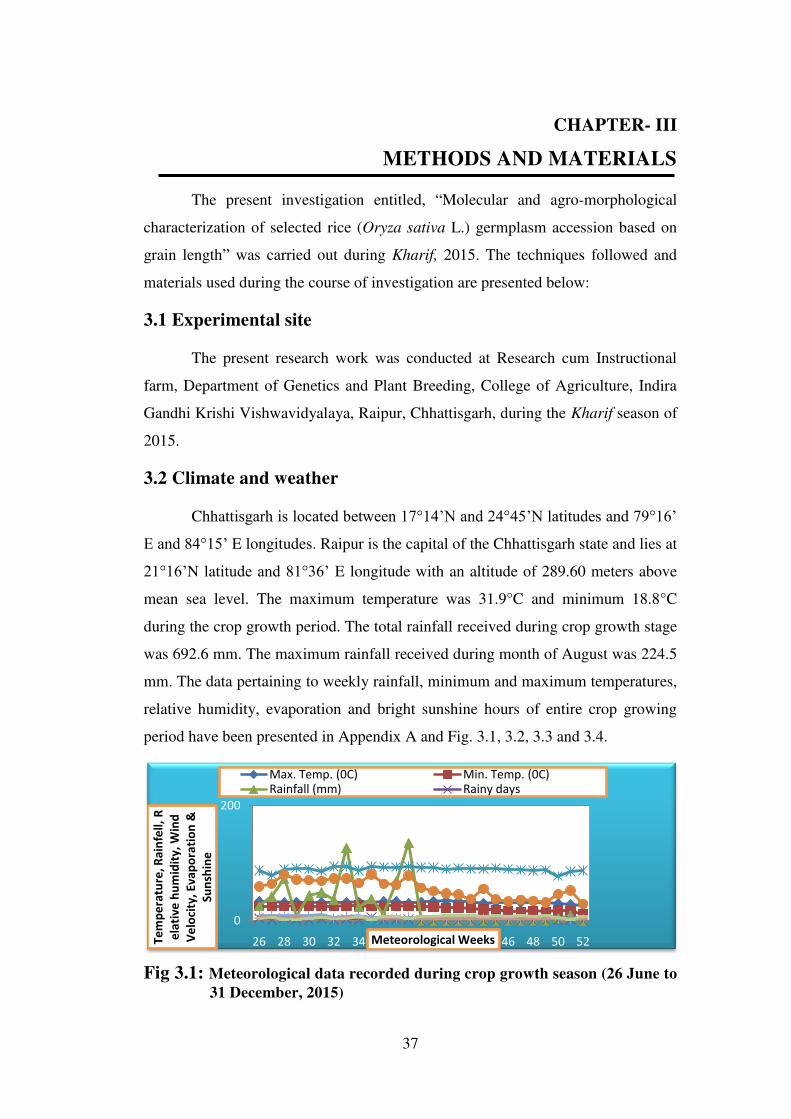
37
CHAPTER- III
METHODS AND MATERIALS
The present investigation entitled, “Molecular and agro-morphological
characterization of selected rice (Oryza sativa L.) germplasm accession based on
grain length” was carried out during Kharif, 2015. The techniques followed and
materials used during the course of investigation are presented below:
3.1 Experimental site
The present research work was conducted at Research cum Instructional
farm, Department of Genetics and Plant Breeding, College of Agriculture, Indira
Gandhi Krishi Vishwavidyalaya, Raipur, Chhattisgarh, during the Kharif season of
2015.
3.2 Climate and weather
Chhattisgarh is located between 17°14‟N and 24°45‟N latitudes and 79°16‟
E and 84°15‟ E longitudes. Raipur is the capital of the Chhattisgarh state and lies at
21°16‟N latitude and 81°36‟ E longitude with an altitude of 289.60 meters above
mean sea level. The maximum temperature was 31.9°C and minimum 18.8°C
during the crop growth period. The total rainfall received during crop growth stage
was 692.6 mm. The maximum rainfall received during month of August was 224.5
mm. The data pertaining to weekly rainfall, minimum and maximum temperatures,
relative humidity, evaporation and bright sunshine hours of entire crop growing
period have been presented in Appendix A and Fig. 3.1, 3.2, 3.3 and 3.4.
Fig 3.1: Meteorological data recorded during crop growth season (26 June to
31 December, 2015)
0
200
26 28 30 32 34 36 38 40 42 44 46 48 50 52Te
mp
era
ture
, R
ain
fell
, R
ela
tiv
e h
um
idit
y,
Win
d
Ve
loci
ty,
Ev
ap
ora
tio
n &
Su
nsh
ine
Meteorological Weeks
Max. Temp. (0C) Min. Temp. (0C)Rainfall (mm) Rainy days
38
3.3 Experimental Materials and Methods
Forty-eight land races of rice belonging to Chhattisgarh were selected for
this study (Table 3.1). Nurseries were raised and twenty-one days old seedlings
were subsequently transplanted in the field, in Randomized Block Design (RBD)
with two replications. Net plot size was 3 m x 1.5 m with both row to row & plant
to plant distance of 25 cm X 25 cm. The crop was maintained under rainfed
condition. Fertilizer dose @ of 50 N: 40 P: 30 K kg/ha was applied. The entire
dose of phosphorus and potassium along with half the dose of nitrogen was applied
as basal dose before transplanting. The remaining dose of nitrogen was applied in
two splits, first at the time of beginning of tillering and second one week after it.
Agronomical practices adopted were similar for all the treatments. Five random
plants from each of the plot were taken for recording data on agro-morphological
and yield characters. To assess distinctness, uniformity and stability (DUS), the
characteristics and their statuswas done as given by PPV & FR Authority, GOI,
2007.
3.4 Observations recorded
In research work, observations on various agro-morphological and quality
traits were recorded to fulfill the objectives of the study. Five random plants from
each of the progeny rows were taken for recording data of various characters at
optimum plant growth stage. Averages of the data from the sampled plants with
respect to different characters were used for various statistical analyses.
3.4.1 Agro-morphological Characters
The observations on various morphological traits including qualitative and
quantitative characters as diagnostic descriptors were recorded. The classification
of DUS is given in appendix B.
3.4.1.1 Seedling Character
Coleoptile color:
The coleoptiles color was recorded at first leaf stage by visual observation
of individual plants. The categories observed were colorless, green color and the
purple color of the coleoptile.
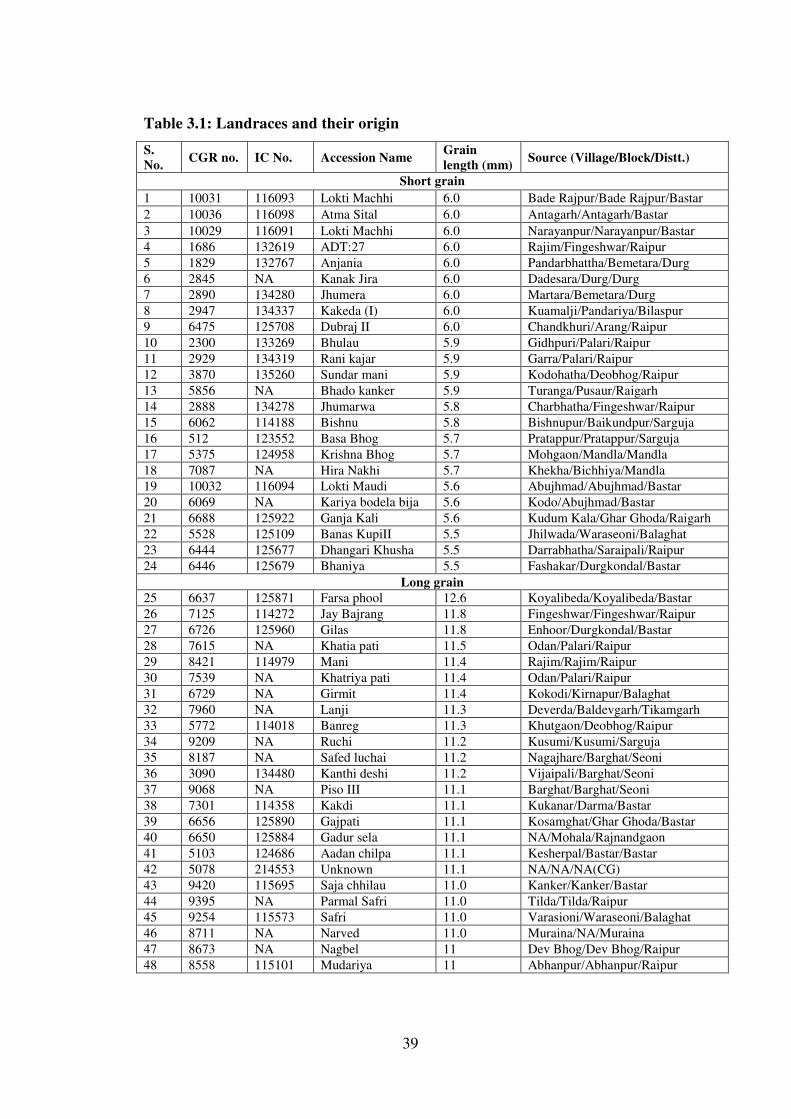
39
Table 3.1: Landraces and their origin
S.
No. CGR no. IC No. Accession Name
Grain
length (mm) Source (Village/Block/Distt.)
Short grain
1 10031 116093 Lokti Machhi 6.0 Bade Rajpur/Bade Rajpur/Bastar
2 10036 116098 Atma Sital 6.0 Antagarh/Antagarh/Bastar
3 10029 116091 Lokti Machhi 6.0 Narayanpur/Narayanpur/Bastar
4 1686 132619 ADT:27 6.0 Rajim/Fingeshwar/Raipur
5 1829 132767 Anjania 6.0 Pandarbhattha/Bemetara/Durg
6 2845 NA Kanak Jira 6.0 Dadesara/Durg/Durg
7 2890 134280 Jhumera 6.0 Martara/Bemetara/Durg
8 2947 134337 Kakeda (I) 6.0 Kuamalji/Pandariya/Bilaspur
9 6475 125708 Dubraj II 6.0 Chandkhuri/Arang/Raipur
10 2300 133269 Bhulau 5.9 Gidhpuri/Palari/Raipur
11 2929 134319 Rani kajar 5.9 Garra/Palari/Raipur
12 3870 135260 Sundar mani 5.9 Kodohatha/Deobhog/Raipur
13 5856 NA Bhado kanker 5.9 Turanga/Pusaur/Raigarh
14 2888 134278 Jhumarwa 5.8 Charbhatha/Fingeshwar/Raipur
15 6062 114188 Bishnu 5.8 Bishnupur/Baikundpur/Sarguja
16 512 123552 Basa Bhog 5.7 Pratappur/Pratappur/Sarguja
17 5375 124958 Krishna Bhog 5.7 Mohgaon/Mandla/Mandla
18 7087 NA Hira Nakhi 5.7 Khekha/Bichhiya/Mandla
19 10032 116094 Lokti Maudi 5.6 Abujhmad/Abujhmad/Bastar
20 6069 NA Kariya bodela bija 5.6 Kodo/Abujhmad/Bastar
21 6688 125922 Ganja Kali 5.6 Kudum Kala/Ghar Ghoda/Raigarh
22 5528 125109 Banas KupiII 5.5 Jhilwada/Waraseoni/Balaghat
23 6444 125677 Dhangari Khusha 5.5 Darrabhatha/Saraipali/Raipur
24 6446 125679 Bhaniya 5.5 Fashakar/Durgkondal/Bastar
Long grain
25 6637 125871 Farsa phool 12.6 Koyalibeda/Koyalibeda/Bastar
26 7125 114272 Jay Bajrang 11.8 Fingeshwar/Fingeshwar/Raipur
27 6726 125960 Gilas 11.8 Enhoor/Durgkondal/Bastar
28 7615 NA Khatia pati 11.5 Odan/Palari/Raipur
29 8421 114979 Mani 11.4 Rajim/Rajim/Raipur
30 7539 NA Khatriya pati 11.4 Odan/Palari/Raipur
31 6729 NA Girmit 11.4 Kokodi/Kirnapur/Balaghat
32 7960 NA Lanji 11.3 Deverda/Baldevgarh/Tikamgarh
33 5772 114018 Banreg 11.3 Khutgaon/Deobhog/Raipur
34 9209 NA Ruchi 11.2 Kusumi/Kusumi/Sarguja
35 8187 NA Safed luchai 11.2 Nagajhare/Barghat/Seoni
36 3090 134480 Kanthi deshi 11.2 Vijaipali/Barghat/Seoni
37 9068 NA Piso III 11.1 Barghat/Barghat/Seoni
38 7301 114358 Kakdi 11.1 Kukanar/Darma/Bastar
39 6656 125890 Gajpati 11.1 Kosamghat/Ghar Ghoda/Bastar
40 6650 125884 Gadur sela 11.1 NA/Mohala/Rajnandgaon
41 5103 124686 Aadan chilpa 11.1 Kesherpal/Bastar/Bastar
42 5078 214553 Unknown 11.1 NA/NA/NA(CG)
43 9420 115695 Saja chhilau 11.0 Kanker/Kanker/Bastar
44 9395 NA Parmal Safri 11.0 Tilda/Tilda/Raipur
45 9254 115573 Safri 11.0 Varasioni/Waraseoni/Balaghat
46 8711 NA Narved 11.0 Muraina/NA/Muraina
47 8673 NA Nagbel 11 Dev Bhog/Dev Bhog/Raipur
48 8558 115101 Mudariya 11 Abhanpur/Abhanpur/Raipur
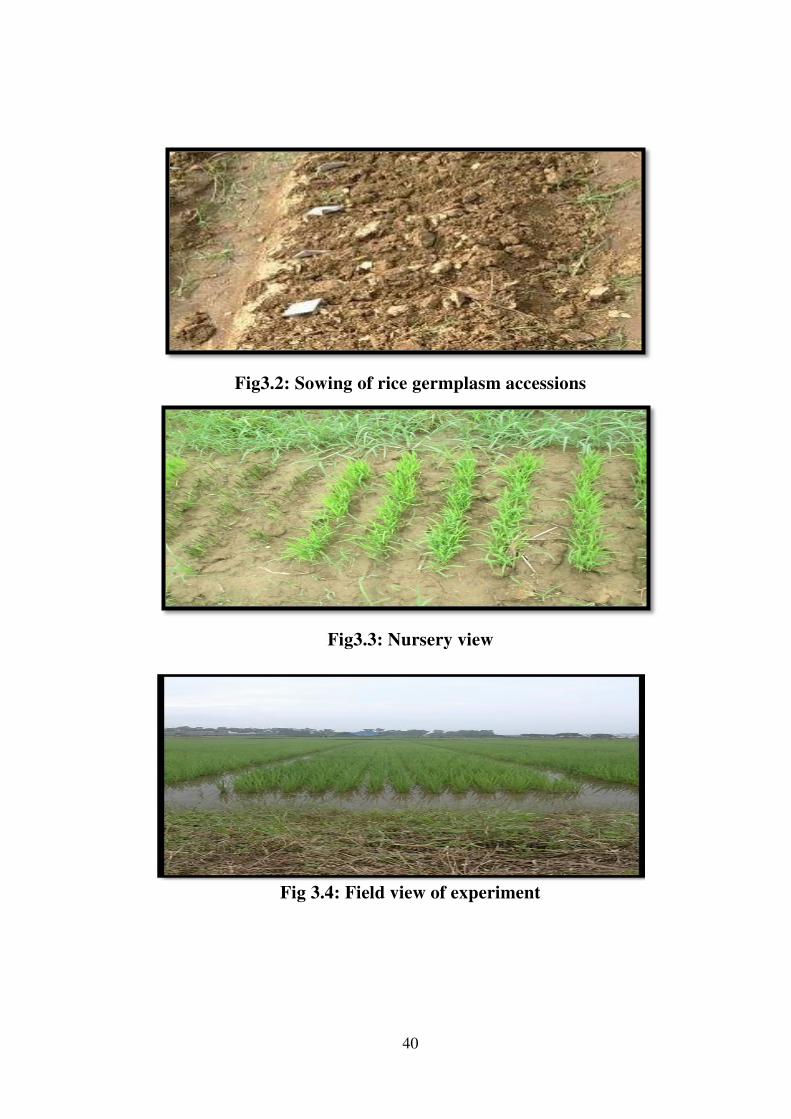
40
Fig3.2: Sowing of rice germplasm accessions
Fig3.3: Nursery view
Fig 3.4: Field view of experiment
41
3.4.1.2 Leaf characters
Basal leaf sheath color:
The color of the leaf sheath, which is wrapped around the culms above the
basal node, was visually recorded at early boot stage on individual plants. The
categories observed were green, light purple, purple lines and purple color at basal
leaf sheath.
Intensity of green color in leaf:
The intensity of green color of leaves was visually recorded at early boot
stage by observation of a group of plants. The major categories recorded were
light, medium and dark green color.
Anthocyanin coloration on leaf:
The presence or absence of anthocyanin coloration on leaf was recorded at
early boot stage by visual assessment in a group of plants.
Distribution of anthocyanin coloration on leaf blade:
The distribution of anthocyanin coloration on leaf was recorded at early
boot stage by visual assessment of group of plants. The major categories are on
leaf tips only, on leaf margins only, in blotches only and uniform presence of
anthocyanin color on leaf lemma.
Anthocyanin coloration on leaf sheath:
The presence or absence of leaf sheath anthocyanin coloration was
recorded at early boot stage by visual assessment of group of plants.
Intensity of anthocyanin coloration on leaf sheath:
The intensity of anthocyanin coloration on leaf sheath was visually
recorded at early boot stage of a group of plants. The major groups recorded were
very weak, weak, medium and strong based on anthocyanin coloration.
42
Presence of pubescence on leaf blade surface:
The intensity of leaf pubescence was recorded at early boot stage by visual
assessment of individual plants of every land race. The categories observed under
this character were absence, weak, medium, strong and very strong presence of
pubescence on blade surface.
Presence of auricles on leaf:
Most of the leaves possess small paired hairy appendages on either side of
the base of the blade. These appendages are called auricles. The presence or
absence of auricles was visually assessed at early boot stage by observation of
individual plant.
Anthocyanin coloration of auricles:
The anthocyanin coloration of auricles i.e. colorless, light purple and purple
color in auricles was recorded at early boot stage with visual assessment by
observation of individual plants.
Presence of collar on leaves:
The presence or absence of leaf collar that is the juncture between leaf
blade and leaf sheath was recorded at early boot stage by visual assessment of
individual plants.
Anthocyanin coloration of collar:
The presence or absence of anthocyanin coloration at collar was recorded at
early boot stage by visual assessment of individual plants.
Presence of ligule on leaf:
Presence or absence of papery membrane at the inside juncture between the
leaf sheath and blade called ligule was recorded at early boot stage by observation
of individual plants or parts of plants.
Shape of ligule:
The shapes of ligule i.e. truncate, acute and split shapes was recorded at
early boot stage by visual assessment of individual plants.
43
Color of ligule:
The colors of ligule i.e. green, light purple or purple was recorded at early
boot stage by visual assessment of individual plants or parts of plants.
Length of leaf blade:
The length of the leaf blade was measured in centimeter and categorized in
to short, medium and long leaves.
Width of leaf blade:
The width of the leaf blade was measured in centimeter and categorized in
to narrow, medium and broad leaves.
Attitude of flag leaf (early observation):
The flag leaf attitude was recorded at beginning of anthesis through visual
assessment and categorized in to erect, semi-erect, open and spreading types by
observation of group of plants.
Attitude of flag leaf (Late observation):
The attitude of flag leaf was recorded at ripening stage through visual
observation and grouped in to erect, semi-erect, horizontal and deflexed classes
according to the features of majority of plants of the landraces.
Leaf senescence:
The leaf senescence was visually recorded at stage when caryopsis became
hard on a group of plants. Senescence is categorized in to early, medium and late
classes.
3.4.1.3 Characters of culm:
Culm: attitude:
The Culm attitude was recorded at early boot stage by visual assessment
and grouped in to erect, semi-erect, open or spreading culm attitude by observation
of individual plants.
44
Stem thickness:
The stem thickness was recorded at milk development stage. Thickness was
measured in centimeter and categorized into thin, medium and thick stem classes.
Anthocyanin coloration of nodes:
The presence or absence of anthocyanin coloration of nodes was recorded
at milk filling stage through visual assessment of individual plants nodes.
Intensity of anthocyanin coloration of nodes:
The intensity of anthocyanin coloration on nodes was recorded at milk
filling stage of each landrace and through visual assessment the plants are
categorized in to weak, medium and strong intensity of anthocyanin coloration at
node.
Anthocyanin coloration of internodes:
The presence or absence of anthocyanin coloration on internodes was
recorded at milk development stage through visual assessment of each landrace.
3.4.1.4 Flower characters
Days to 50 percent flowering:
Number of days was recorded from date of sowing to the days when
primary panicles in 50 percent plants were emerged.
Color of stigma:
The color of stigma was recorded at stage of half-way anthesis and grouped
in to white and purple stigma through visual assessment by observation of
individual plants.
3.4.1.5 Characters of panicle
Panicle length (cm):
Panicle length was measured at the time of maturity from the base of
panicle to the tip of last spikelet prior to harvesting. The categories under this class
are very short (<16 cm), short (16-20 cm), medium (21-25 cm), long (26-30 cm)
and very long (>30 cm).
45
Curvature of main axis of panicle:
The curvature of main axis of panicle was recorded at ripening stage and
grouped into straight, semi-straight, drooping and deflexed classes through visual
assessment by observation of a group of plants.
Number of effective tillers per plant:
The numbers of panicle bearing tillers of the plants were counted in five
random plants.
Density of pubescence of lemma:
The density of pubescence of lemma was recorded at beginning of anthesis
to dough development stage through visual assessment and grouped in to absent,
medium and strong categories by visual observation of individual plants.
Anthocyanin coloration on apex of lemma:
The anthocyanin coloration on apex of lemma was recorded at half way of
anthesis by visual observation and grouped into absent, very weak, weak, strong
and very strong.
Anthocyanin coloration below apex of lemma:
The anthocyanin coloration below apex of lemma was recorded at half way
of anthesis by visual observation and grouped into absent, weak, medium and very
strong.
Presence of secondary branching on panicles:
The presence or absence of secondary branching was recorded at ripening
stage through visual observation of a group of plants.
Density of secondary branching on panicles:
The panicles which possess secondary branching were classified in to
weak, strong and clustered branching categories. Observations were visual
observed on a group of plants.
46
Exertion of panicle:
The panicle exertion was recorded at ripening stage and classified into
partly exerted, exerted and well exerted classes. The classes were recorded through
visual assessment of a group of plants.
3.4.1.6 Spikelet characters
Color of lemma and palea:
The lemma and palea color was recorded at dough development to ripening
stage through visual assessment of group of plants of landraces and classified into
straw, gold and gold furrows on straw background, brown spots on straw, brown
furrows on straw, brown (tawny), reddish to light purple, purple spots on straw,
purple furrows on straw and purple black.
Presence of awns on panicles:
The individual landraces were classified on the basis of presence or absence
of awns at ripening stage and assessed through visual observation of a group of
plants.
Color of awns:
The color of awns was recorded at ripening stage through visual assessment
of individual plants and grouped into classes yellowish white, yellowish brown,
brown, reddish brown, light red, red, light purple, purple and black on the basis of
awn color.
Length of longest awn:
Length of longest awn was recorded at ripening stage through centimeter
measurement of individual panicle and grouped into very short, short, medium and
long awn length.
Distribution of awns:
The distribution of awns was recorded at ripening stage through visual
assessment by observation of individual plants and grouped in to presence of awns
at tip only, upper half only and whole length.
47
Days to maturity:
This was recorded in days from sowing to maturity. This character is
categorized into very early, early, medium, late and very late duration.
Color of sterile lemma:
The color of sterile lemma was recorded at maturity stage when caryopsis
get hard by visual assessment by observation of individual panicle and grouped
into straw color, purple and gold sterile lemma color.
3.4.1.7 Grain characters
Grain length (mm):
The average length of randomly selected ten hulled spikelets was measured
in terms of millimeters. This is grouped into very short, short, medium, long and
very long grain.
Grain width (mm):
The average breadth of randomly selected ten hulled spikelets was
measured in terms of millimeters. This was grouped into narrow, medium, and
broad grain.
Thousand grain weight (g):
Thousand seeds of each of the entry were taken randomly and weighed in
gram.
Grain yield per plant (g):
The grain (filled) yield of each of the five plants was recorded in grams
after sun drying for 5-8 days after harvesting and averaged.
Biological yields per plant (g):
Weight of each of the five plant excluding root was recorded in grams after
sun drying for 5-8 days after harvesting and averaged.
48
Harvest index (%):
The ratio of grain yield to the biological yield was calculated and expressed
as percentage. Harvest index was calculated as follows:
Grain yield
Harvest index (%) = ---------------------------- × 100
Biological yield
3.4.1.8 Grain quality characters:
Following grain quality characters were recorded:
Hulling (%):
100 g of paddy sample was used; it was properly cleaned, before starting
the dehulling. The dehusking of rice was done by dehusker and hulled rice weight
was recorded.
Weight of the dehusked kernel
Hulling percentage = ------------------------------------------ X 100
Weight of paddy
Milling (%):
Brown rice was put into standard miller or polisher and later milled rice
weight was recorded.
Weight of polished kernel
Milling percentage = ----------------------------------------- X 100
Weight of paddy
Head rice recovery (%):
From milled rice the ¾ kernel was taken as whole grain. The sorting out of
full and broken rice was done and its weight was recorded.
Weight of whole polished kernel
Head Rice Recovery = --------------------------------------------- X 100
Weight of paddy
Amylose content:
49
Amylose content was determined by the method developed at International
Rice Research Institute, Philippines (Jenning et al., 1979). The basic procedure is
to prepare a standard curve using solutions of purified potato amylose employing
the standard method. In this curve, the light transmission value of the colored
solution is plotted against amylose concentration. Next, standard rice samples with
a range of known low, intermediate and high amylose content are treated using the
standard method, and the light transmission values are determined. The already
plotted curve is then used to determine the amylose content of the samples. Their
percentage of amylose is plotted against light transmission values to form a second
curve. Finally, the unknown samples are treated with the use of the simplified
method and the light transmission values are determined. By referring to the
second standard curve, the percentage of amylose of the unknown samples is
determined. The second curve is made to account for the effect of the amylose that
is present in rice but not in purified potato amylose.
Procedure for determining Amylose content:
Weighing of 0.10 g of fine powdered rice grain in 100ml volumetric flask.
Add 4 ml methanol was added and kept for 2.30 hr.
After that methanol was extracted.
Add 9 ml of 1N NaOH and 1ml of 9.5% ethanol.
Then it was heated for 10 minutes in pre-heated water-bath.
Cool it and make up 100 ml volume with distilled water.
From this, 5 ml sample in volumetric flask was taken and 1ml of acetic acid
and 2ml of potassium iodide (KI) reagent was added.
Again the volume was made up with 100 ml distilled water and kept for 20
minutes.
Finally the reading of the sample at 620 nm on spectrophotometer was
recorded.
Amylose (percent) = R X 76.92SS
R = Reading at 620nm on spectrophotometer.
50
Table 3.2: Scale for Amylose test
Very low <10%
Low 11-19%
Medium 20-25%
High 26-30%
Very high >30%
Alkali spreading value and Gelatinization temperature:
Alkali spreading values were determined as per procedure described by
Jennings et al. (1979) and is as follows
(i) Six milled rice kernels without cracks were selected of each variety from each
replication and placed in Petri dishes.
(ii) 10 ml of 1.7 % KOH was added to each Petri dish.
(iii) These were evenly placed in Petri dishes to allow enough space for spreading.
(iv) Petri dishes were covered and placed for 23 hours at constant temperature of
30°C.
(v) Disintegration of endosperm was visually rated as per following scale (Little
et al. 1958).
Table 3.3: Alkali spreading value classification along with Gelatinization
Temperature
Classification Alkali spreading
value(ASV)
Gelatinization
temperature(GT)
1-2 Low High >74 0C
3 Low, intermediate High, intermediate
4-5 Intermediate Intermediate (70 0C – 74
0C)
6-7 High Low (55 0C – 69
0C)
51
Table 3.4: Numerical scale for scoring Alkali spreading value
Score Spreading Clearing
1. Kernel not affected Kernel chalky
2. Kernel swollen Kernel chalky collar powdery
3. Kernel swollen, collar complete and
narrow
Kernel chalky collar cottony or
cloudy
4. Kernel swollen, collar complete and
wide
Center cottony, collar cloudy
5. Kernel split or segregated, collar
complete and wide
Center cottony, collar clearing
6. Kernel dispersed merging with
collar
Center cloudy collar clear
7. Kernel completely dispersed and
intermingled
Center and collar clear
Aroma:
Aroma was determined at post harvest stage using the technique developed
at International Rice Research Institute, Philippines (Jennings et al., 1979).
According to this 20 to 30 freshly harvested milled grains were taken in a test tube
with 20 ml of distilled water. Stoppers were put on the mouth of test tubes and
placed in boiling water bath for 10-20 minutes. Test tubes were removed and
cooled. Aroma was then detected by smelling and categorized into:
SS: Strongly scented; MS = Mild scented; NS = Non - scented.
Gel consistency:
Method of determining gel consistency was given as follow:
1. Take 100 mg of flour quadruplicates in culture tubes.
2. Add 0.2 ml of ethanol containing 0.25% thymol blue.
3. Add 2 ml of 0.2 N Potassium Hydroxide (KOH).

52
4. Mix the solution on a cyclone mixer.
5. Keep the test tube in water bath at 90-100 0C for 8 minutes after putting one
glass tube marble on each test tube.
6. After removing the culture tubes from water bath cool them for 5 minutes.
7. Mix the solution on cyclone mixer.
8. Keep the culture tube in low temperature bath at 0-2o C for 20 minutes.
9. The culture tubes are removed from ice bath and laid horizontally for one hour
over graph paper.
10. Length of blue colored gel from the inside bottom of the test tube to the gel
front was then measured as gel consistency of the sample.
11. 26-40mm Hard gel consistency
12. 41-60mm Medium gel consistency
13. 61-100mm Soft gel consistency
Chalkiness:
The degree of chalkiness describes the milled sample rice‟s with respect to
(a) White belly (b) White center (c) White back.
Notation Kernel area (Extent)
A Absent None
VOC Very occasionally present Small (less than 10%) kernel
OC Occasionally present Medium (11% to 20%)
P Present Long (more than 20%)
Kernel length (mm):
Ten milled grains were taken randomly and average length was recorded in
millimeters. These were classified in to very short, short, medium, long and very
long classes.
Kernel breadth (mm):
Breadth of the above ten milled grains was recorded and average breadth
was recorded in millimeters. These were classified in to very narrow, narrow,
medium, broad and very broad classes.
53
L/B Ratio:
The length/breadth ratio of randomly selected ten milled spikelets was
calculated by dividing respective length with breadth.
Length of milled grains
Kernel L/B ratio= -----------------------------------
Breadth of milled grains
Grain Shape
Based on length and L/B ratio the grain type is classified as per the
guidlines of DUS, PPV & FR 2007.
State Kernel length (mm) Length/breadth ratio
Short Slender < 6.0 > 3.0
Short Bold < 6.0 < 2.5
Medium Slender < 6.0 2.5-3.0
Long Slender > 6.0 > 3.0
Long Bold > 6.0 < 3.0
Basmati type > 6.61 > 3.0
Extra Long
Slender > 7.5 > 3.0
Kernal length after cooking (mm):
The length of randomly selected ten cooked spikelets was measured in
terms of millimeters.
Kernel breadth after cooking:
The breadth of randomly selected ten cooked grains were measured in
terms of millimeters
Length breadth ratio after cooking:
The length/breadth ratio of randomly selected ten cooked grains was
calculated by dividing respective length with breadth. It was computed by formula:
Kernel length after cooking
Length breadth ratio after cooking = ----------------------------------------
Kernel breadth after cooking
54
Kernel Elongation Ratio:
This was calculated by the following formula:
Kernel length after cooking (mm)
Elongation ratio = -----------------------------------------------
Kernel length before cooking (mm)
Elongation Index:
Elongation index was calculated as the ratio of L/B (after cooking) and L/B
(before cooking).
Ratio of L/B (after cooking)
Elongation index = ---------------------------------------
Ratio of L/B (before cooking)
3.5 Molecular Study
Twenty four long grain and twenty four short grain accessions were used
for molecular characterization. For assessing the genetic diversity of rice
germplasm molecular study was performed, which included DNA isolation,
quantification, dilution of DNA, PCR amplification using SSR primers,
electrophoresis using polyacrylamide gel, scoring and analysis of data.
3.5.1 Genomic DNA isolation
Whole genomic DNA was extracted out from rice seedlings of each of the
landraces of rice. The protocol CTAB method (Zheng et al. 1995) of DNA
isolation from rice seedling leaves was as follows.
Procedure
Young plant leaves were collected at seedling stage, about one gram of
leaves bits were cut by scissors and put in 2 ml of eppendrof tube.
Add 700µl of CTAB extraction buffer.
Grind the leaves with the help of tissuelyzer. After grinding add 300 µl of
CTAB extraction buffer.
Keep it in water bath at 650C for 20 minutes.
Add 700 µl of Chloroform: Isoamyl alcohol (24:1).
55
Vertex the sample.
Centrifuge it for 10 min at 14000 rpmin centrifuge machine.
Transfer the supernatant in 1.5 ml of fresh eppendorf tube,
(Repeat the protocol twice from step 5-8)
Add 70 µl of Sodium acetate and about 400 µl of pre-chilled isopropanol
(equal volume of the supernatant transferred) in this and kept it for incubation
at 40C for 2 hr. or -20
0C for overnight.
Centrifuge it for 3 min @ 14000 rpm.
Decant the solution and add 50 µl of 70 % ethanol for washing and
centrifuged at 14000 rpm for 5 minutes.
Decant the solution and dry the pellet for 2 hours or overnight until the smell
of ethanol was evaporated.
Finally dissolved the pellets in 50 μl of TE buffer.
Stored at -200C until use.
3.5.2 Nanodrop spectrophotometer based quantification of DNA
For quantification, DNA samples isolated from each line were quantified
on Nano Drop Spectroscopy (NANODROP, 2000c). After quantification, the DNA
was diluted with TE buffer such that the final concentration of DNA was 50 ηg / μl
for PCR analysis.
3.5.3 PCR amplification using SSR and ISSR primers:
About, 2 μl of diluted template DNA (50 ηg/μl) of each line was dispensed
in the bottom of 96 well PCR plates (AXYGEN-MAKE). Separately cocktail was
prepared in an Eppendorf tube as described in Table 3.5. About 18 μl of the
cocktail was added to each tube to make final volume 20 μl. Then, the PCR was set
as per the temperature profile given is Table 3.6 and 3.7.
Table 3.5: PCR mix for one reaction (Volume 20 μl)
Reagent Stock Concentration Volume (l)
Nanopure H2O - 13.5
PCR buffer A 10 X 2.0
dNTPs (Mix) 1.0 mM 1.0
Primer (forward) 5 ρmol 0.5
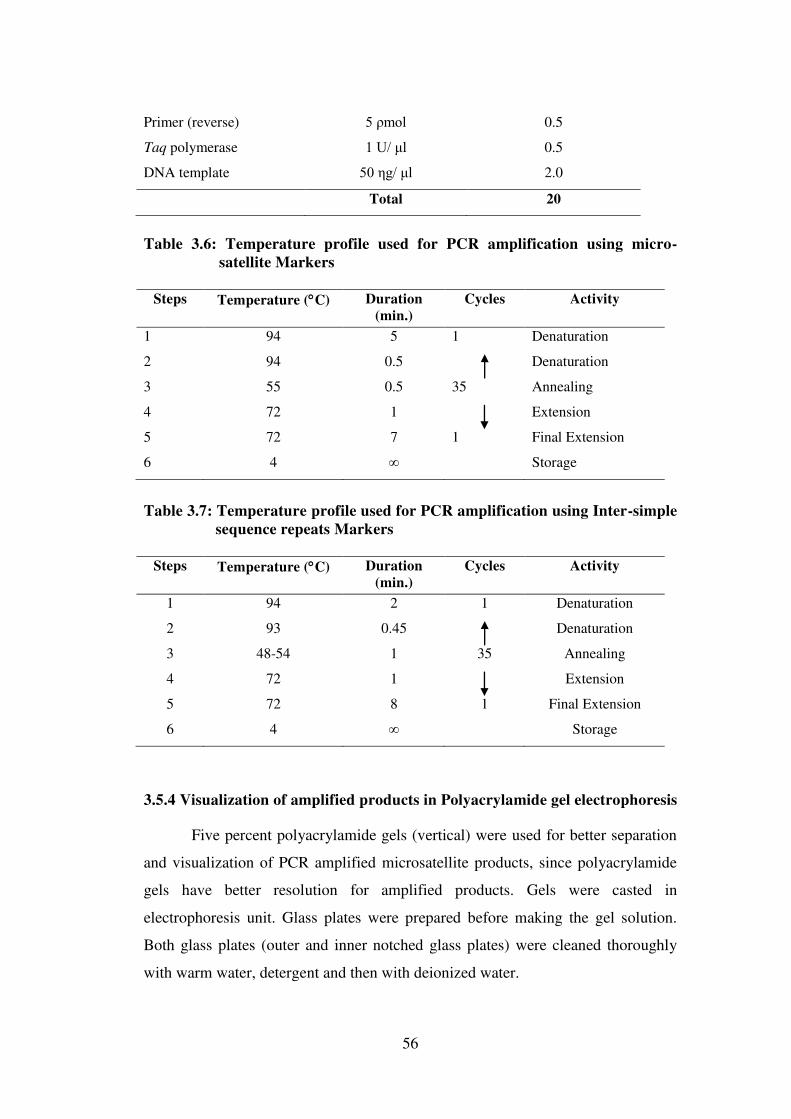
56
Primer (reverse) 5 ρmol 0.5
Taq polymerase 1 U/ μl 0.5
DNA template 50 ηg/ μl 2.0
Total 20
Table 3.6: Temperature profile used for PCR amplification using micro-
satellite Markers
Steps Temperature (C) Duration
(min.)
Cycles Activity
1
2
3
4
5
6
94
94
55
72
72
4
5
0.5
0.5
1
7
∞
1
35
1
Denaturation
Denaturation
Annealing
Extension
Final Extension
Storage
Table 3.7: Temperature profile used for PCR amplification using Inter-simple
sequence repeats Markers
Steps Temperature (C) Duration
(min.)
Cycles Activity
1
2
3
4
5
6
94
93
48-54
72
72
4
2
0.45
1
1
8
∞
1
35
1
Denaturation
Denaturation
Annealing
Extension
Final Extension
Storage
3.5.4 Visualization of amplified products in Polyacrylamide gel electrophoresis
Five percent polyacrylamide gels (vertical) were used for better separation
and visualization of PCR amplified microsatellite products, since polyacrylamide
gels have better resolution for amplified products. Gels were casted in
electrophoresis unit. Glass plates were prepared before making the gel solution.
Both glass plates (outer and inner notched glass plates) were cleaned thoroughly
with warm water, detergent and then with deionized water.

57
3.5.5 Assembling and pouring the gel
Gasket was fixed to the three sides of the outer plate (without notches).
Spacers of 1.5mm thickness were placed along the sides by just attaching the
gasket of outer plate.
Later, notch plate was kept on the outer plate so that spacers were between
the two plates. Clamps were put on the three sides of plates leaving notch side of
unit. It was checked with water to found any leakages.
For casting each gel, 65 ml of acrylamide gel (5%) solution was prepared
just prior to pouring. For each 65 ml of solution, 70 μl of TEMED (N-N-N-N-
Tetramethylethylene diamine) and 700 μl of (freshly prepared) ammonium per
sulphate (APS, 10%) were added to initiate the polymerization process.
The contents were mixed gently by swirling, but bubbles were avoided.
Before pouring, assembly was kept on the bench top so that it made 45 degree
angle with bench top.
Then gel solution was poured from notch side with maximum care to avoid
air bubbles. Comb of 1.5 mm thickness (63 wells) was inserted with tooth side in
the gel. Later, the assembly was kept for polymerization for 20-30 min.
3.5.6 Electrophoresis
After polymerization process, gasket was removed and assembly was kept
in the electrophoresis unit with electrophoresis unit clamps so that notch
side facing inner side of the unit and facing other plate without notch to
outer side.
TBE (1x) was poured in upper tank in the unit and the rest was poured in
bottom chamber.
Comb was removed with care so that it does not disturb the wells formed in
the gel.
At last, 4 μl loading dye (10x) was added to PCR products.
58
Finally, 5 μl of each sample were loaded into the wells for facilitating the
sizing of the various alleles. Ladder (50bp, Bangalore GeNei, Mereck Bio
Science) was loaded in the first well.
Gel was run at 180 volts till the dye reached bottom of the gel.
After electrophoresis, gels were stained with Ethidium bromide (10μl/
100ml) and visualized in BIORAD Gel Doc XR+.
3.5.7 Visualization of bands
After electrophoresis, clamps were removed and glass plates were
separated without damaging the gel.
a) Gel was taken out from plate into staining box with care by flipping the gel with
help of spatula and by pouring little amount of water for easy removal.
b) Ethidium bromide solution (prepared by adding 10 μl to 100 ml double distilled
water) was poured into the staining box to stain the gel.
c) It was agitated for about five minutes to stain the gel.
d) Gel stained with Ethidium Bromide was washed two times with double distilled
water to have clear images.
e) The gels were scanned with the help of BIO-RAD gel doc XR+.
f) Care was taken while using TEMED and staining with Ethidium bromide
solution as they are carcinogenic and mutagenic agents, respectively.
3.5.8 Detection of varietal polymorphism using simple sequence repeats (SSR)
primers and ISSR primers
The varietal polymorphism was detected by using 59 SSR primers and 10
ISSR primers.
59
3.5.9 Scoring and analysis of data:
The banding pattern of population developed by each set of primer was
scored separately. The size of amplified fragments was determined by comparing
the migration distance of amplified fragments relative to the molecular weight of
known size markers, 50 base pairs (bp) DNA ladder. Particular base pair position
was scored as “1” and absence of band for that particular base pair position was
scored as “0” (zero). For analysis NTSYS-pc software was used to construct a
UPGMA (unweighted pair group method with arithmetic averages) dendrogram
showing the distance-based interrelationship among the genotypes.
3.5.10 Reagents and solutions
a) Primers: Highly variable rice microsatellite markers from Imperial life sciences
(ILS), USA or Sigma Aldrich were used in the study.
b) dNTPs (dATP/dCTP/dGTP/dTTP):10 mM stock of dNTPs (Bangalore
GeNei, Mereck Bio Science) was used.
c) PCR buffer (10X): 10X GeNei buffer was used.
d) Taq polymerase: 1 unit/μl, Taq polymerase (GeNei) was used for PCR.
3.5.11 Stock solutions:
a) Stock preparation for dNTPs – 10μl of each dNTPs (i.e.
dATP/dCTP/dGTP/dTTPs) was taken in 1.5 ml of Eppendorf tube, mix well by
vortexing, final volume is made to 40μl having 100 mM dNTPs stock
concentration. For dilution 10 μl dNTPs of stock solution was taken in 1.5 ml
Eppendorf tube and add 990 μl SIGMA water to the tube, so the total volume
became 1000 μl. This makes 1mM dNTPs is ready to use for PCR.
b) DNA extraction buffer:
Tris HCl (1M; pH-8) 5 ml
EDTA (0.5M; pH-8) 5 ml
NaCl (4M) 7.5 ml
SDS (20% W/V) 5 ml
60
Final volume was adjusted to 100 ml with distilled water and the pH was
maintained to 8.0.
c) TE buffer:
1M Tris-HCl (pH-8) 10 ml
0.5M EDTA (pH-8) 2 ml
Final volume was adjusted to 100 ml and autoclaved and the pH was
maintained to 8.0.
d) EDTA (0.5M; pH-8):
186.12 g of EDTA was dissolved in 700 ml of distilled water. The pH was
set to 8 using NaOH. Final volume was adjusted to 1000 ml with distilled water
and sterilized by autoclaving.
e) 4M NaCl:
23.36 g of NaCl was dissolved in 80 ml of distilled water. Final volume
was adjusted to 100 ml and sterilized by autoclaving.
f) 1M Tris HCl (pH 8.0 at 25°C):
30.28 g of Trizma base was dissolved in 200 ml of distilled water. The pH
was set to 8.0 using concentrated HCl. The final volume was adjusted to 250 ml
with distilled water and sterilized by autoclaving.
3.5.11 Solutions for electrophoresis
a) 10X TBE buffer:
Tris base 104 g
EDTA (0.5M) 40 ml
Boric Acid 55 g
Distilled water - 500 ml Final volume was adjusted to 1 liter with distilled water.
b) 1X TBE buffer:
100 ml of 10 X TBE + 900 ml of distilled water were taken to make 1 liter
of 1X TBE.
61
c) 10X loading dye
Sucrose 667 mg
Bromophenol Blue 4.2 mg
Water 1.0 ml
d) 50 bp DNA ladder:
GeNei Mereck Biosciences, Bangalore Company was used as known
marker. This is prepared by taking 0.1ml of 50bp with 0.2 ml of 6X loading buffer
and making the volume with 0.4 ml sigma water.
3.5.12 Stocks and solutions for PAGE
a) Five percent PAGE solution (1000ml)
Acrylamide when dissolved in water, slow spontaneous auto
polymerization takes place joining molecules together by head and tail fashion to
form long single chain polymers. A solution of these polymer chains become
viscous but simple slide over one another.
Acrylamide 47.5g
Bis-Acrylamide 2.5g
10X TBE 100 ml
Acrylamide and bis-acrylamide were weighed and dissolved in (to make up
volume to 1000 ml) 500 ml distilled water and then added to the beaker containing
100 ml of 10X TBE and the volume was made upto 1000 ml by adding autoclaved
double distilled water. The solution was sterilized by passing through 0.22 micron
filter and stored in amber colour bottle at 4 0C.
b) 10% Ammonium persulphate (APS) solution was prepared by mixing
following components
Most frequent used linking agent for polyacrylamide gel.
Ammonium persulphate 1.0g
Distilled water 10ml
62
c) TEMED
Stabilizers free radicals and improve polymerization.
3.5.13 Instruments used in the laboratory
Veriti 96 well thermal cycler (Applied Biosystems)
Refrigerated centrifuge
Microwave oven
C.B.S. PAGE unit with power pack
Transilluminator and Gel documentation system( BIORAD Gel Doc XR+)
Micropipettes
Eppendorf tubes
Electronic balance
3.6 Statistical analysis
The data recorded in respect to different morphological and quantitative
characters on the forty eight short and long grain accessions were subjected to the
statistical analysis:
3.6.1 Analysis of variance
Firstly, mean values were worked out for all traits for each genotype. These
mean data were utilized to calculate variability parameters viz. range, standard
deviation, and coefficient of variation. ANOVA is calculated by using O.P.STAT
software.
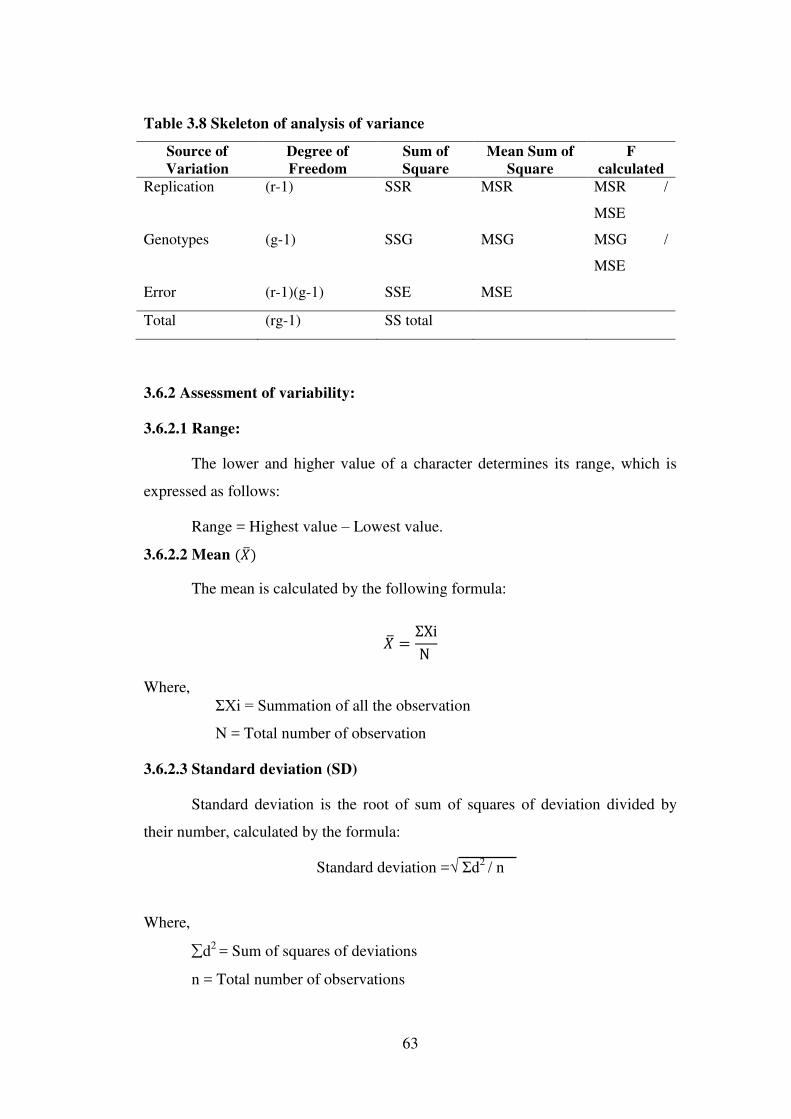
63
Table 3.8 Skeleton of analysis of variance
Source of
Variation
Degree of
Freedom
Sum of
Square
Mean Sum of
Square
F
calculated
Replication (r-1) SSR MSR MSR /
MSE
Genotypes (g-1) SSG MSG MSG /
MSE
Error (r-1)(g-1) SSE MSE
Total (rg-1) SS total
3.6.2 Assessment of variability:
3.6.2.1 Range:
The lower and higher value of a character determines its range, which is
expressed as follows:
Range = Highest value – Lowest value.
3.6.2.2 Mean (� )
The mean is calculated by the following formula:
� =ΣXi
N
Where,
ΣXi = Summation of all the observation
N = Total number of observation
3.6.2.3 Standard deviation (SD)
Standard deviation is the root of sum of squares of deviation divided by
their number, calculated by the formula:
Standard deviation =√ Σd2 / n
Where,
d2
= Sum of squares of deviations
n = Total number of observations
64
3.6.2.4 Standard error (SE)
Standard error = S/ √�
Where,
S = Standard deviation
√n = Total number of observation
3.6.2.5 Estimation of coefficients of variation:
The coefficient of variation for different characters was estimated by
formula as suggested by Burton and De Vane (1953).
GCV (%) = (√� 2g/X) 100
PCV (%) = (√�2p/X) 100
where,
PCV = Phenotypic coefficient of variation
GCV = Genotypic coefficient of variation � = Mean of character √�g2= Genotypic variance √�p
2= Phenotypic variance
The magnitude of coefficient of variation was categorized as high (> 20%),
moderate (20% - 10%) and low (< 10%).
3.6.2.6 Heritability (broad sense)
It is the ratio of genotypic variance to the phenotypic variance (total
variance). Heritability for the present study was calculated in a broad sense by
adopting the formula as suggested by Hanson et al., (1956).
h2 (bs) % = (�g
2/� p
2) X 100
Where,
h2 (bs) = heritability in broad sense, �g2 = Genotypic variance,
65
�g2 = Phenotypic variance
As suggested by Johnson et al (1955) heritability values are categorized as
low (<30%), moderate (30 - 60%), and high (>60%).
3.6.2.7 Genetic advance
Improvement in the mean genotypic value of selected plants over the
parental population is known as genetic advance. Expected genetic advance (GA)
was calculated by the method suggested by Johnson et al., (1955)
G A = K .h2. �p
Where,
GA= Genetic advance
K = Constant (Standardized selection differential) having the value of 2.06
at 5 per cent level of selection intensity.
h2 = Heritability of the character �p= Phenotypic standard deviation
3.6.2.8 Genetic advance as percentage of mean
It was calculated by the following formula �� �� % �� = ��/� ×
Where,
GA = genetic advance � = mean of the character
The range of genetic advance as percent of mean is classified as suggested
by Johnson et al., (1955)
GA > 20 per cent High
GA = 10 – 20 per cent Moderate
GA < 10 per cent Low
3.6.3 Association analysis:
Correlation coefficients analysis measures the mutual relationship between
various characters at genotypic (g), phenotypic (p) and environmental levels with
the help of following formula suggested by Miller et al. (1958).
66
3.6.3.1 Path analysis
Path analysis was originally developed by Wright (1921) and first used for
plant selection by Dewey and Lu (1959). It measures the direct and indirect
contribution of independent variables on dependent variable.
The results of path coefficient analysis are interpreted as per the following
scale suggested by Lenka and Mishra (1973).
Value of direct and indirect effects Rate/ Scale
0.00 to 0.09 Negligible
0.10 to 0.19 Low
0.20 to 0.29 Moderate
0.30 to 0.99 High
> 1.00 Very high
3.6.4 Principal Components Analysis
It is a multivariate statistical analysis to reduce the data with large number
of correlated variables into a substantially smaller set of new variables through
linear combination of the variables that accounts most of the variation present in
the original variables. Principal components are generally estimated either from
correlation matrix or covariance matrix. When the variables are measured in
different units, scale effects can influence the composition of derived components.
In such situations it becomes desirable to standardize the variables. In the
present investigation correlation matrix was used to extract the principal
components.
PCA is a well-known method of dimension reduction (Massy, 1965;
Jolliffe, 1986), which seeks linear combinations of the columns of X with maximal
variance, or equivalently, high information. The analysis was performed using
XLSTAT 2014 sofware.
3.6.6 Cluster analysis
Cluster analysis is a multivariate method which aims to classify a sample of
subjects (or objects) on the basis of a set of measured variables into a number of
67
different groups such that similar subjects are placed in the same group. Cluster
analysis has no mechanism for differentiating between relevant and irrelevant
variables. Therefore, the choice of variables included in a cluster analysis must be
underpinned by conceptual considerations. This is very important because the
clusters formed can be very dependent on the variables included.
In the present study, Euclidian distance between genotypes was calculated
from the standardized data matrix by Unweighted Pair Group Method using
Arithmetic Averages (UPGMA) method and clustering was done by
Agglomerative Hierarchical method using XLSTAT 2014 software.
68
CHAPTER- IV
RESULTS AND DISCUSSION
Rice is the principal cereal food crop grown most extensively in the tropical
and sub-tropical regions of the world. Though, cultivated on large area, rice crop is
characterized by low productivity due to lack of high yielding varieties adapted to
different seasons and agronomic conditions. Now most of the plant breeders
recognize the importance of utilizing genetic diversity in breeding programmes to
meet the continuously expanding needs of varietal improvement.
Grain quality characteristics of rice are related to a complexity of physic-
chemical properties viz., dimension, shape and weight, fragmentation, hardness,
milling properties, chemical composition of the endosperm, aroma. Nearly all
possible combinations of the above component traits can be found in existing
cultivars, signifying the enormous diversity that exists in rice germplasm.
Among the various grain quality characters, grain length (GL), grain breath
(GB), cooked grain length (CGL), cooked grain breath (CGB) and gelatinization
temperature (GT) are considered as prime characters in deciding the overall grain
quality in rice.
The experimental results obtained from present investigation have been
described in following heads:
4.1 Agro-morphological and quality characterization
4.2 Estimation of Genetic Variance
4.2.1 Analysis of variance
4.2.2 Mean performance of and variability parameters different characters
4.2.3 Genotypic and phenotypic component of variation
4.2.4 Heritability and genetic advance as percent of mean
4.3 Association analysis
4.3.1 Correlation Coefficient
4.3.2 Path Analysis
4.4 Principal component analysis
69
4.5 Cluster analysis
4.6 Molecular characterization
4.6.1 Development of genotypic data based on SSR and ISSR markers
4.6.1.1 SSR Primers
4.6.1.1a Similarity coefficient analysis and Clustering
4.6.1.1b Polymorphism Information Content
4.6.1.2 ISSR Primers
4.6.1.2a Similarity coefficient analysis and Clustering
4.6.1.2b Polymorphism Information Content
4.1 Agro-morphological and quality characterization
These observations were recorded on 48 germplasm accessions all
descriptors showed makeable differences in their distribution and amount of
variations within them. The data of agro-morphological and quality
characterization as observed in 48 accessions are presented in Appendix C.
Frequency distribution and percentage value of agro-morphological and quality
characters of forty eight long and short grain accessions of rice are presented in
Table 4.1., Table 4.2 and Fig 4.1).
4.1.1 Coleoptile colour
All forty eight landraces under study were classified into three different
classes of coleoptiles colour (DRR, DUS discriptors), colourless, green and purple,
out of which coleoptiles colour was observed under two categories; green (38) and
purple (10) (Fig: 4.1a and 4.2).
4.1.2 Basal leaf sheath colour
Basal leaf sheath colour was observed under two categories, green (32) and
purple line (16) (Fig: 4.1b and 4.3).
4.1.3 Leaf intensity of green colour
This trait was observed under two categories; Dark green (5) and medium
(43) (Fig: 4.1c).
70
4.1.4 Leaf: Pubescence of blade surface
This trait was observed under four categories; Weak (12), Strong (5),
Medium (30) and Hard (1) (Fig: 4.1d).
4.1.5 Leaf: Auricles
Leaf auricle was present in all forty eight germplasm accessions (Fig: 4.4)
4.1.6 Leaf: Anthocyanin colouration of auricles
This trait was observed under two categories; colourless (46) and light
purple (2).
4.1.7 Leaf: Collar
Leaf collar was present in all forty eight long and short grain landraces.
4.1.8 Leaf: Ligule
This trait was found in all the forty eight landraces (Fig: 4.5)
4.1.9 Leaf: Shape of ligule
This trait was observed under two categories; split (45) and acute (3).
4.1.10 Colour of ligules
Colour of ligule was found white in all the germplasm accessions.
4.1.11 Culm: Attitude
This trait was observed under three categories; Erect (30), Semi-erect (15)
and Spreading (3) (Fig: 4.1f).
4.1.12 Attitude of flag leaf (Early)
This trait was observed under two categories; Erect (40) and Semi-erect (8)
(Fig: 4.1g and 4.7).
4.1.13 Spilelet: Density of pubescence of lemma
This trait was observed under four categories; weak (5), medium (22),
strong (15) and very strong (6) (Fig: 4.1h).
4.1.14 Male Sterility
Male sterility was found absent in all the forty eight germplasm accession.
71
4.1.15 Lemma: Anthocyanine colouration of keel
Anthocyanine colouration of keel of lemma was found under4 five
categories; Weak (6), Medium (1), Strong (10), Very Strong (8) and absent (23)
(Fig: 4.1i and 4.8).
4.1.16 Lemma: Anthocyanine colouration of area below apex
This trait was found under five categories; absent (27), Weak (5), Medium
(2), Strong (6) and Very Strong (8) (Fig: 4.1j and 4.9).
4.1.17 Lemma: Anthocyanine colouration of apex
This trait was found under five categories; absent (26), weak (5), medium
(3), Strong (6) and Very Strong (8) (Fig: 4.1k).
4.1.18 Spilelet: Colour of Stigma
The colour of stigma of different forty eight accessions were found under
two categories; White (34) and Purple (14) (Fig: 4.1l and 4.10).
4.1.19 Stem: Anthocyanine colouration of nodes
This trait was found under two categories; present (25) and absent (23)
(Fig: 4.12).
4.1.20 Stem: Intensity of anthocyanine colouration of nodes
This trait was found under four categories; Absent (23), Weak (1), Medium
(23) and Strong (1).
4.1.21 Stem: Anthocyanine colouration of internode
This trait was found under two categories; Present (26) and absent (22).
4.1.22 Flag leaf: Attitude of blade (late observation)
This trait was found under four categories; Desceading (1), Erect (28),
Semi-erect (1) and Horizontal (18).
4.1.23 Panicle: Curvature of main axis
Curvature of panicle was found under three categories; Deflexed (13),
Semi-straight (25) and Straight (10) (Fig: 4.1p and 4.11).
4.1.24 Spikelet: Colour of tip of lemma
This trait was found under five categories; Black (15), Purple (3), Red (4),
White (5) and Yellow (21) (Fig: 4.1q).
72
4.1.25 Lemma and palea colour
Lemma and palea colour was observed under eight categories; Brown (1),
brown furrows on straw (6), Brown spot on straw (1), Gold and gold furrows on
straw (3), Purple furrows on straw (3), Red (8), Reddish to light purple (2) and
Straw (24) (Fig: 4.1r and 4.13).
4.1.26 Panicle: Awns
This trait was observed under two categories; Present (20) and Absent (28)
(Fig: 4.1s and 4.14).
4.1.27 Panicle: Colour of awns (late observation)
This trait was found under four categories; Absent (28), Brown (1), Red (5)
and Yellowish (14) (Fig: 4.1t).
4.1.28 Panicle: Distribution of awns
This trait was found in two categories; Tiponly (20) and rest of the
accessions does not have awns on them i.e. Absent (28) (Fig: 4.1v and 4.16).
4.1.29 Panicle: Presence of secondary branching
Secondary branching in panicle was present in all forty eight germplasm
accessions (Fig: 4.1w and 4.16).
4.1.30 Panicle: Secondary branching
Secondary branching of panicle was found under three categories; Cluster
(11), Strong (16) and Weak (21).
4.1.31 Panicle : Attitude of branches
This trait was found under five categories; Erect (5), Erect to Semi-erect
(11), Semi-erect (13), Semi-erect to spreading (4) and Spreading (15) (Fig: 4.1x).
4.1.32 Panicle: Exertion
The exertion of panicle was found under three categories; Mostly exerted
(23), Partly exerted (2) and Well exerted (23) (Fig: 4.1y and 4.18).
4.1.33 Leaf: Senescence
This trait was observed under two categories; Early (9) and Medium (39)
(Fig: 4.1aa).
73
4.1.34 Sterile lemma: Colour
The colour of sterile lemma of forty eight accession were found under five
categories; Gold (15), Purple (4), Red (1), Straw (27) and Yellow (1) (Fig: 4.1ab).
4.1.35 Grain: Phenol reaction of lemma
Out of 48 rice accessions phenol reaction of lemma exhibited in 6
genotypes and in 42 accessions phenol reaction is absent (Fig 4.24).
4.1.36 Decorticated grain shape
This trait was found under 5 category Basmati type (4), extra long slender
(18), long bold (1), long slender (1), short bold(24) (Fig:4.21).
4.1.37 Decorticated grain: Colour
Out of 48 rice accessions brown colour is observed in only one accession
and rest of the 47 had white colour.
4.1.38 Alkali spreading value
Out of 48 accessions, high alkali spreading value found in one accession,
intermediate in 13 accessions and low in 34 accessions (Fig. 27).
4.1.39 Aroma
Out of forty eight genotypes, 3 showed strong aroma, 17 genotypes were
having mild aroma and 38 genptypes were non - scented.
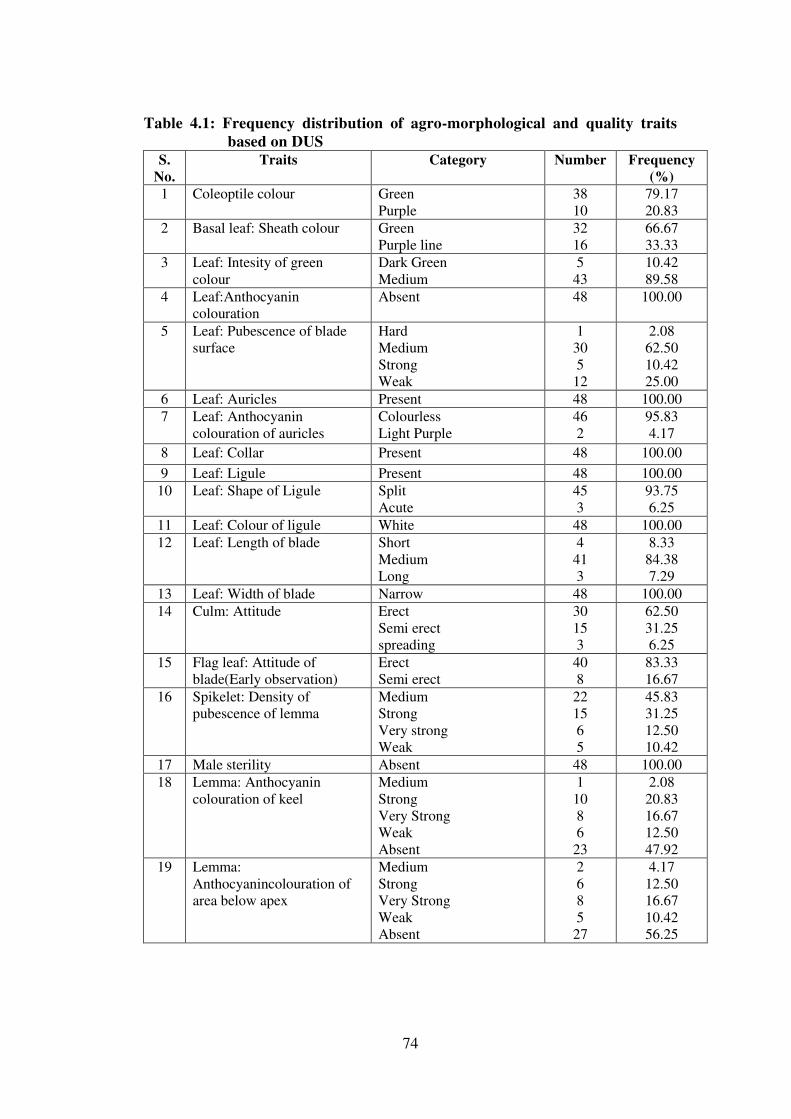
74
Table 4.1: Frequency distribution of agro-morphological and quality traits
based on DUS S.
No.
Traits Category Number Frequency
(%)
1 Coleoptile colour Green
Purple
38
10
79.17
20.83
2 Basal leaf: Sheath colour Green
Purple line
32
16
66.67
33.33
3 Leaf: Intesity of green
colour
Dark Green
Medium
5
43
10.42
89.58
4 Leaf:Anthocyanin
colouration
Absent 48 100.00
5 Leaf: Pubescence of blade
surface
Hard
Medium
Strong
Weak
1
30
5
12
2.08
62.50
10.42
25.00
6 Leaf: Auricles Present 48 100.00
7 Leaf: Anthocyanin
colouration of auricles
Colourless
Light Purple
46
2
95.83
4.17
8 Leaf: Collar Present 48 100.00
9 Leaf: Ligule Present 48 100.00
10 Leaf: Shape of Ligule Split
Acute
45
3
93.75
6.25
11 Leaf: Colour of ligule White 48 100.00
12 Leaf: Length of blade Short
Medium
Long
4
41
3
8.33
84.38
7.29
13 Leaf: Width of blade Narrow 48 100.00
14 Culm: Attitude Erect
Semi erect
spreading
30
15
3
62.50
31.25
6.25
15 Flag leaf: Attitude of
blade(Early observation)
Erect
Semi erect
40
8
83.33
16.67
16 Spikelet: Density of
pubescence of lemma
Medium
Strong
Very strong
Weak
22
15
6
5
45.83
31.25
12.50
10.42
17 Male sterility Absent 48 100.00
18 Lemma: Anthocyanin
colouration of keel
Medium
Strong
Very Strong
Weak
Absent
1
10
8
6
23
2.08
20.83
16.67
12.50
47.92
19 Lemma:
Anthocyanincolouration of
area below apex
Medium
Strong
Very Strong
Weak
Absent
2
6
8
5
27
4.17
12.50
16.67
10.42
56.25
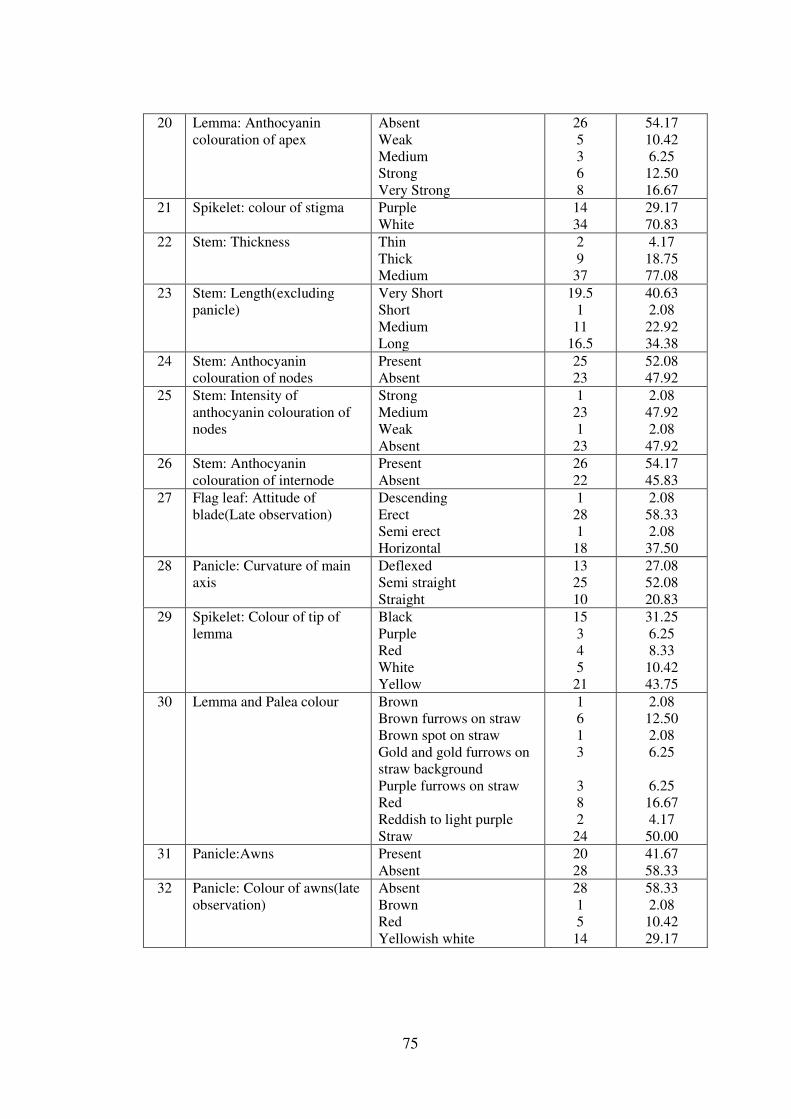
75
20 Lemma: Anthocyanin
colouration of apex
Absent
Weak
Medium
Strong
Very Strong
26
5
3
6
8
54.17
10.42
6.25
12.50
16.67
21 Spikelet: colour of stigma Purple
White
14
34
29.17
70.83
22 Stem: Thickness Thin
Thick
Medium
2
9
37
4.17
18.75
77.08
23 Stem: Length(excluding
panicle)
Very Short
Short
Medium
Long
19.5
1
11
16.5
40.63
2.08
22.92
34.38
24 Stem: Anthocyanin
colouration of nodes
Present
Absent
25
23
52.08
47.92
25 Stem: Intensity of
anthocyanin colouration of
nodes
Strong
Medium
Weak
Absent
1
23
1
23
2.08
47.92
2.08
47.92
26 Stem: Anthocyanin
colouration of internode
Present
Absent
26
22
54.17
45.83
27 Flag leaf: Attitude of
blade(Late observation)
Descending
Erect
Semi erect
Horizontal
1
28
1
18
2.08
58.33
2.08
37.50
28 Panicle: Curvature of main
axis
Deflexed
Semi straight
Straight
13
25
10
27.08
52.08
20.83
29 Spikelet: Colour of tip of
lemma
Black
Purple
Red
White
Yellow
15
3
4
5
21
31.25
6.25
8.33
10.42
43.75
30 Lemma and Palea colour Brown
Brown furrows on straw
Brown spot on straw
Gold and gold furrows on
straw background
Purple furrows on straw
Red
Reddish to light purple
Straw
1
6
1
3
3
8
2
24
2.08
12.50
2.08
6.25
6.25
16.67
4.17
50.00
31 Panicle:Awns Present
Absent
20
28
41.67
58.33
32 Panicle: Colour of awns(late
observation)
Absent
Brown
Red
Yellowish white
28
1
5
14
58.33
2.08
10.42
29.17
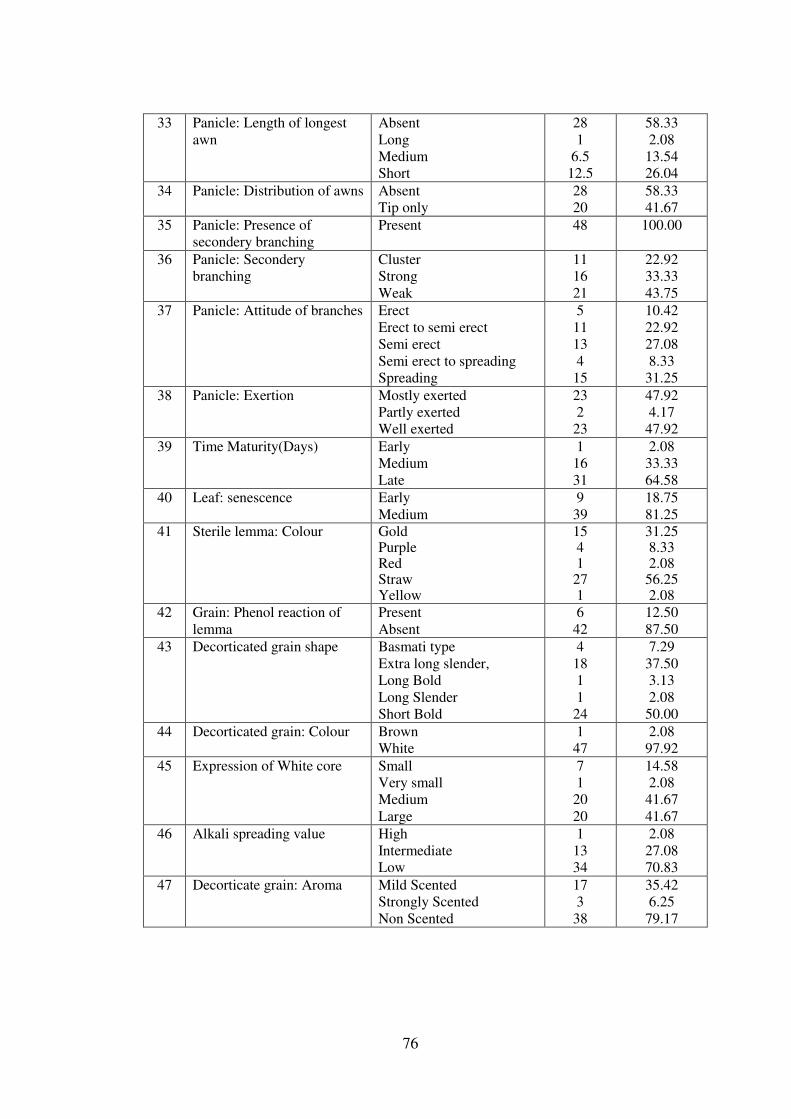
76
33 Panicle: Length of longest
awn
Absent
Long
Medium
Short
28
1
6.5
12.5
58.33
2.08
13.54
26.04
34 Panicle: Distribution of awns Absent
Tip only
28
20
58.33
41.67
35 Panicle: Presence of
secondery branching
Present 48 100.00
36 Panicle: Secondery
branching
Cluster
Strong
Weak
11
16
21
22.92
33.33
43.75
37 Panicle: Attitude of branches Erect
Erect to semi erect
Semi erect
Semi erect to spreading
Spreading
5
11
13
4
15
10.42
22.92
27.08
8.33
31.25
38 Panicle: Exertion Mostly exerted
Partly exerted
Well exerted
23
2
23
47.92
4.17
47.92
39 Time Maturity(Days) Early
Medium
Late
1
16
31
2.08
33.33
64.58
40 Leaf: senescence Early
Medium
9
39
18.75
81.25
41 Sterile lemma: Colour Gold Purple Red Straw Yellow
15 4 1
27 1
31.25 8.33 2.08
56.25 2.08
42 Grain: Phenol reaction of
lemma
Present
Absent
6
42
12.50
87.50
43 Decorticated grain shape Basmati type
Extra long slender,
Long Bold
Long Slender
Short Bold
4
18
1
1
24
7.29
37.50
3.13
2.08
50.00
44 Decorticated grain: Colour Brown
White
1
47
2.08
97.92
45 Expression of White core Small
Very small
Medium
Large
7
1
20
20
14.58
2.08
41.67
41.67
46 Alkali spreading value High
Intermediate
Low
1
13
34
2.08
27.08
70.83
47 Decorticate grain: Aroma Mild Scented
Strongly Scented
Non Scented
17
3
38
35.42
6.25
79.17
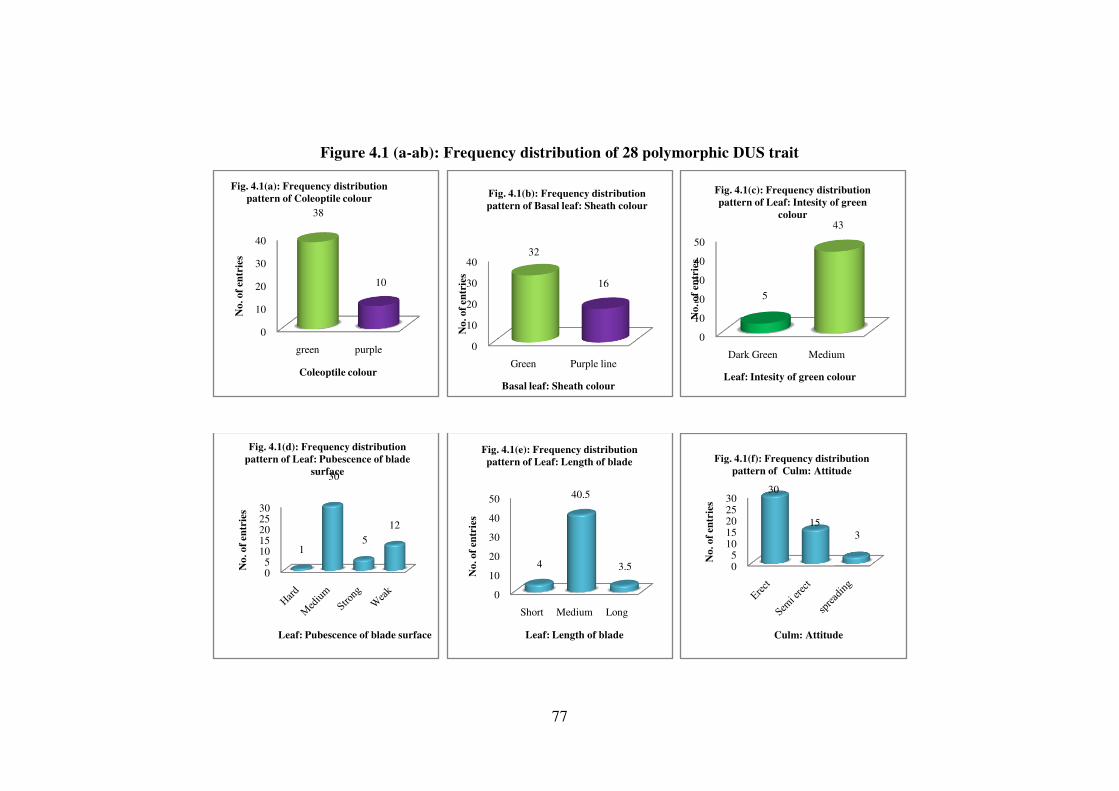
77
Figure 4.1 (a-ab): Frequency distribution of 28 polymorphic DUS trait
0
10
20
30
40
green purple
38
10
No
. o
f en
trie
s
Coleoptile colour
Fig. 4.1(a): Frequency distribution
pattern of Coleoptile colour
0
10
20
30
40
Green Purple line
32
16
No
. o
f en
trie
s
Basal leaf: Sheath colour
Fig. 4.1(b): Frequency distribution
pattern of Basal leaf: Sheath colour
0
10
20
30
40
50
Dark Green Medium
5
43
No
. o
f en
trie
s
Leaf: Intesity of green colour
Fig. 4.1(c): Frequency distribution
pattern of Leaf: Intesity of green
colour
05
1015202530
1
30
5
12
No
. o
f en
trie
s
Leaf: Pubescence of blade surface
Fig. 4.1(d): Frequency distribution
pattern of Leaf: Pubescence of blade
surface
0
10
20
30
40
50
Short Medium Long
4
40.5
3.5
No
. o
f en
trie
s
Leaf: Length of blade
Fig. 4.1(e): Frequency distribution
pattern of Leaf: Length of blade
05
1015202530
30
15
3
No
. o
f en
trie
s
Culm: Attitude
Fig. 4.1(f): Frequency distribution
pattern of Culm: Attitude
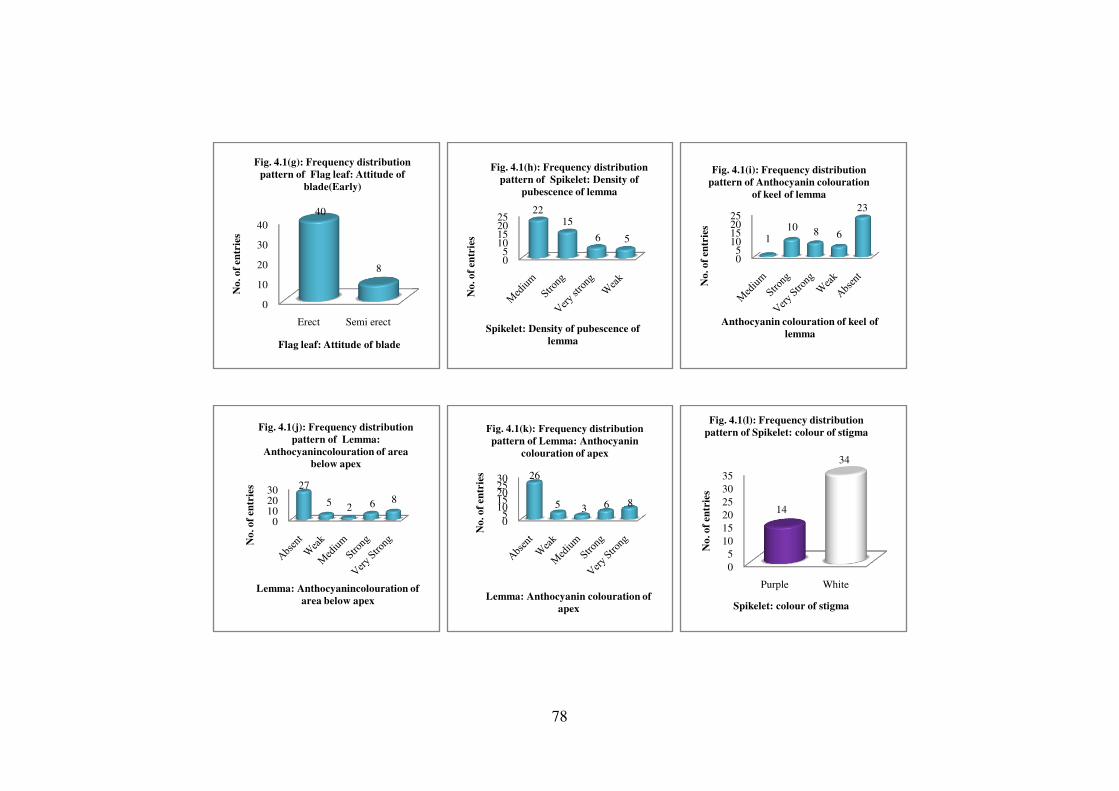
78
0
10
20
30
40
Erect Semi erect
40
8
No
. o
f en
trie
s
Flag leaf: Attitude of blade
Fig. 4.1(g): Frequency distribution
pattern of Flag leaf: Attitude of
blade(Early)
05
10152025
2215
6 5
No
. o
f en
trie
s
Spikelet: Density of pubescence of
lemma
Fig. 4.1(h): Frequency distribution
pattern of Spikelet: Density of
pubescence of lemma
05
10152025
110 8 6
23
No
. o
f en
trie
s
Anthocyanin colouration of keel of
lemma
Fig. 4.1(i): Frequency distribution
pattern of Anthocyanin colouration
of keel of lemma
0102030 27
52 6 8
No
. o
f en
trie
s
Lemma: Anthocyanincolouration of
area below apex
Fig. 4.1(j): Frequency distribution
pattern of Lemma:
Anthocyanincolouration of area
below apex
05
1015202530 26
5 3 6 8
No
. o
f en
trie
s
Lemma: Anthocyanin colouration of
apex
Fig. 4.1(k): Frequency distribution
pattern of Lemma: Anthocyanin
colouration of apex
0
5
10
15
20
25
30
35
Purple White
14
34
No
. o
f en
trie
s
Spikelet: colour of stigma
Fig. 4.1(l): Frequency distribution
pattern of Spikelet: colour of stigma
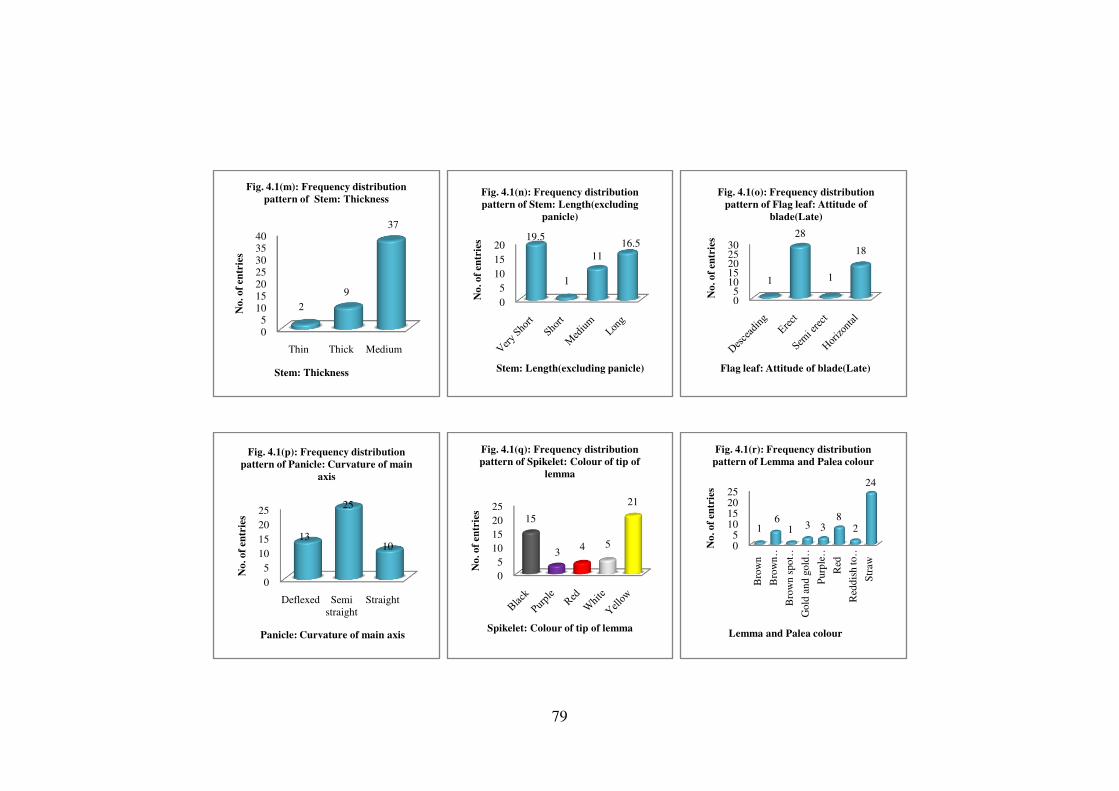
79
05
10152025303540
Thin Thick Medium
2
9
37
No
. o
f en
trie
s
Stem: Thickness
Fig. 4.1(m): Frequency distribution
pattern of Stem: Thickness
0
5
10
15
2019.5
1
11
16.5
No
. o
f en
trie
s
Stem: Length(excluding panicle)
Fig. 4.1(n): Frequency distribution
pattern of Stem: Length(excluding
panicle)
05
1015202530
1
28
1
18
No
. o
f en
trie
s
Flag leaf: Attitude of blade(Late)
Fig. 4.1(o): Frequency distribution
pattern of Flag leaf: Attitude of
blade(Late)
0
5
10
15
20
25
Deflexed Semi
straight
Straight
13
25
10
No
. o
f en
trie
s
Panicle: Curvature of main axis
Fig. 4.1(p): Frequency distribution
pattern of Panicle: Curvature of main
axis
0
5
10
15
20
2515
34 5
21
No
. o
f en
trie
s
Spikelet: Colour of tip of lemma
Fig. 4.1(q): Frequency distribution
pattern of Spikelet: Colour of tip of
lemma
05
10152025
Bro
wn
Bro
wn
…B
row
n s
pot …
Gold
an
d g
old
…P
urp
le …
Red
Red
dis
h to …
Str
aw
16
1 3 38
2
24
No
. o
f en
trie
s
Lemma and Palea colour
Fig. 4.1(r): Frequency distribution
pattern of Lemma and Palea colour
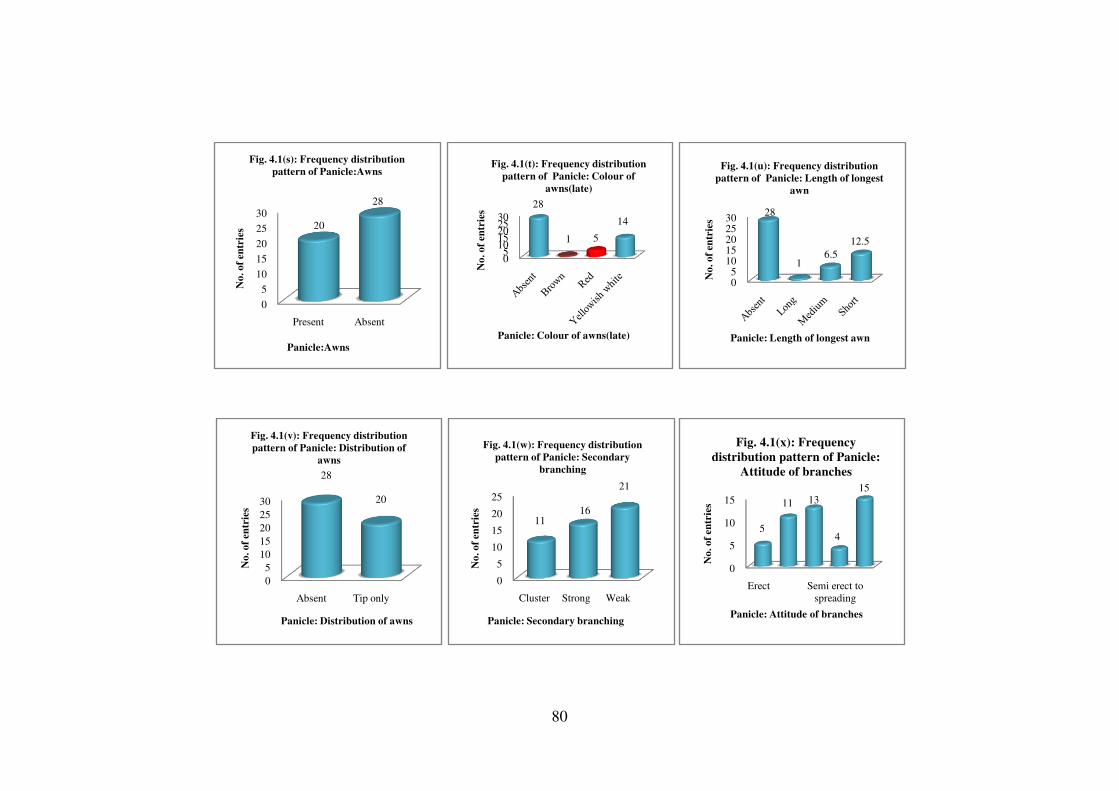
80
0
5
10
15
20
25
30
Present Absent
20
28
No
. o
f en
trie
s
Panicle:Awns
Fig. 4.1(s): Frequency distribution
pattern of Panicle:Awns
05
1015202530
28
1 5
14
No
. o
f en
trie
s
Panicle: Colour of awns(late)
Fig. 4.1(t): Frequency distribution
pattern of Panicle: Colour of
awns(late)
05
1015202530
28
16.5
12.5
No
. o
f en
trie
s
Panicle: Length of longest awn
Fig. 4.1(u): Frequency distribution
pattern of Panicle: Length of longest
awn
0
5
10
15
20
25
30
Absent Tip only
28
20
No
. o
f en
trie
s
Panicle: Distribution of awns
Fig. 4.1(v): Frequency distribution
pattern of Panicle: Distribution of
awns
0
5
10
15
20
25
Cluster Strong Weak
1116
21N
o. o
f en
trie
s
Panicle: Secondary branching
Fig. 4.1(w): Frequency distribution
pattern of Panicle: Secondary
branching
0
5
10
15
Erect Semi erect to
spreading
5
11 13
4
15
No
. o
f en
trie
s
Panicle: Attitude of branches
Fig. 4.1(x): Frequency
distribution pattern of Panicle:
Attitude of branches
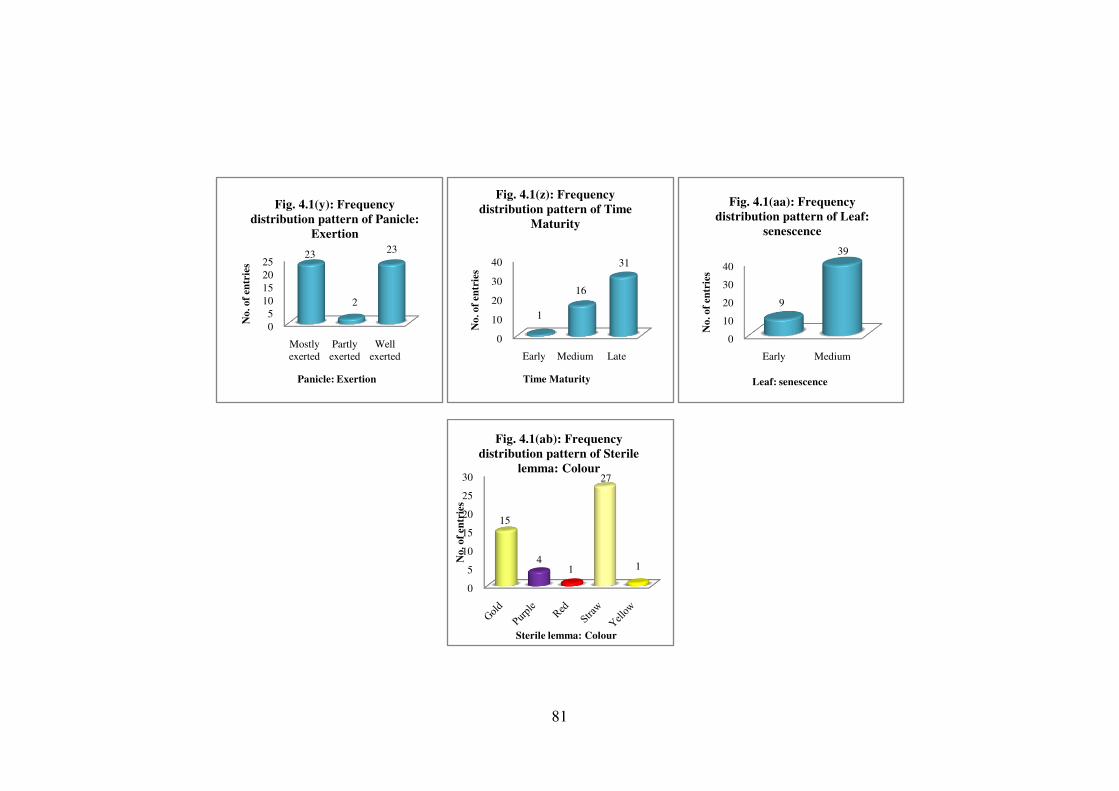
81
0
5
10
15
20
25
Mostly
exerted
Partly
exerted
Well
exerted
23
2
23N
o. o
f en
trie
s
Panicle: Exertion
Fig. 4.1(y): Frequency
distribution pattern of Panicle:
Exertion
0
10
20
30
40
Early Medium Late
1
16
31
No
. o
f en
trie
s
Time Maturity
Fig. 4.1(z): Frequency
distribution pattern of Time
Maturity
0
10
20
30
40
Early Medium
9
39
No
. o
f en
trie
s
Leaf: senescence
Fig. 4.1(aa): Frequency
distribution pattern of Leaf:
senescence
0
5
10
15
20
25
30
15
41
27
1
No
. o
f en
trie
s
Sterile lemma: Colour
Fig. 4.1(ab): Frequency
distribution pattern of Sterile
lemma: Colour
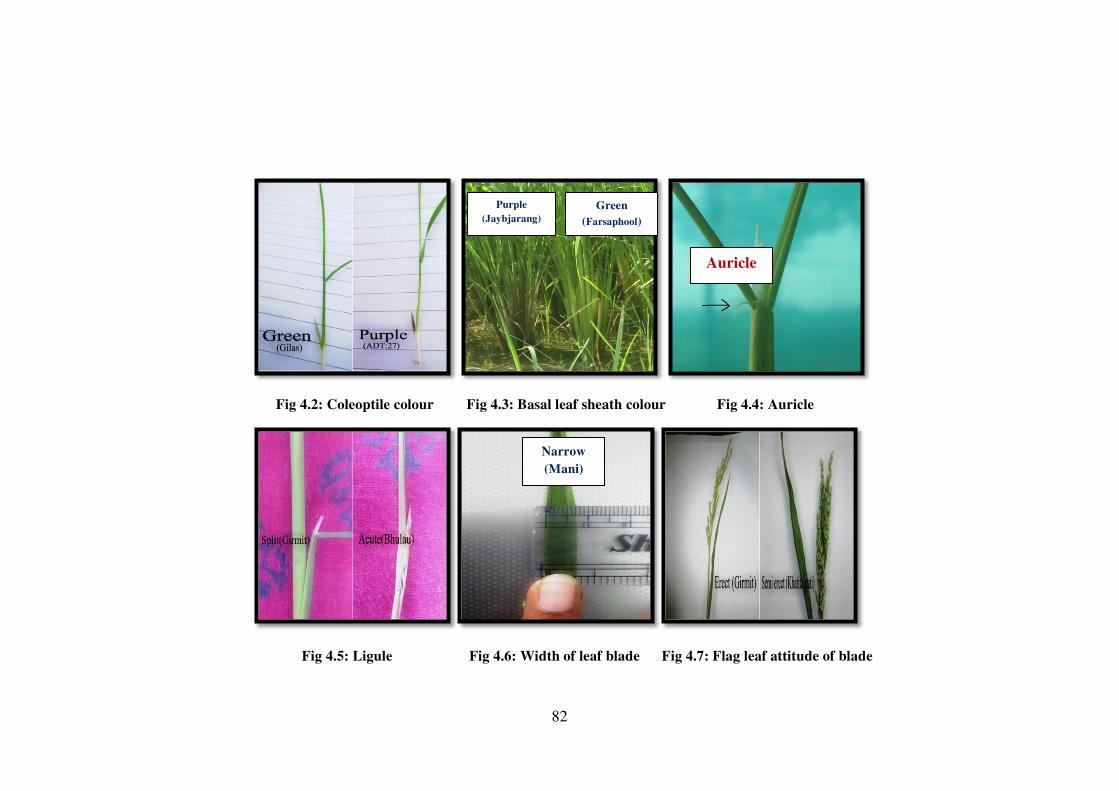
82
Fig 4.2: Coleoptile colour Fig 4.3: Basal leaf sheath colour Fig 4.4: Auricle
Fig 4.5: Ligule Fig 4.6: Width of leaf blade Fig 4.7: Flag leaf attitude of blade
Green
(Farsaphool)
Purple
(Jaybjarang)
Auricle
Narrow
(Mani)
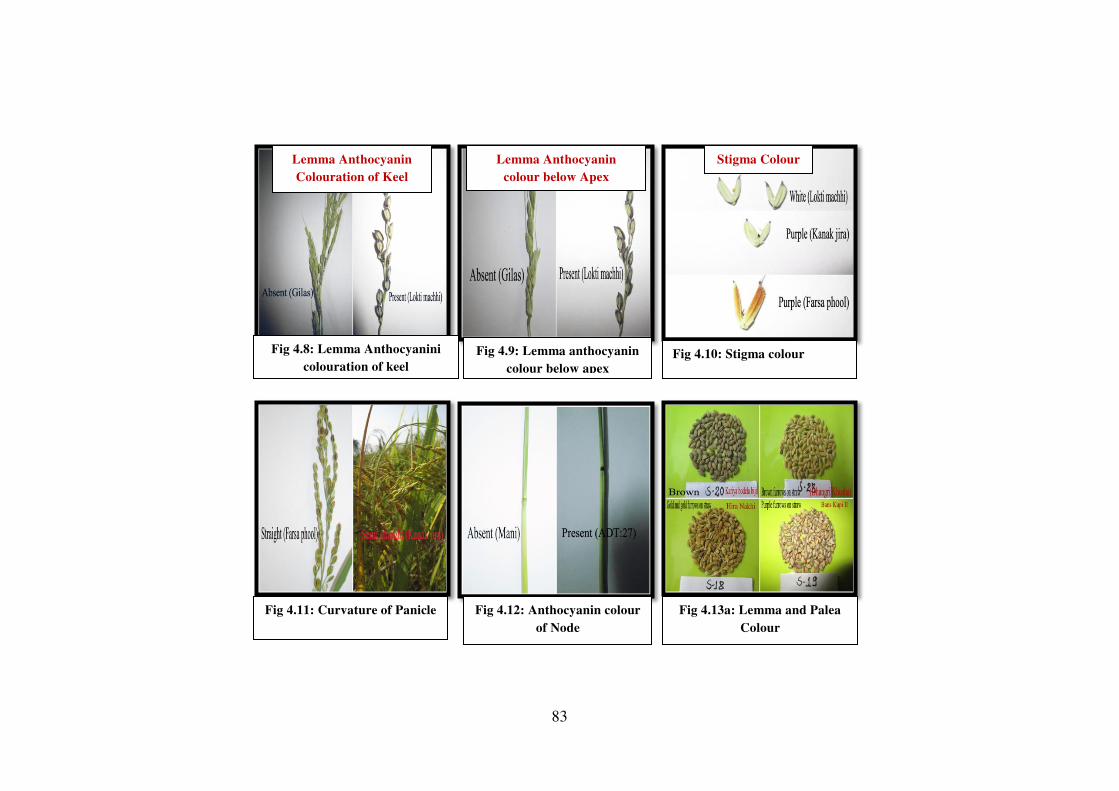
83
Lemma Anthocyanin
Colouration of Keel
Lemma Anthocyanin
colour below Apex
Stigma Colour
Fig 4.8: Lemma Anthocyanini
colouration of keel
Fig 4.9: Lemma anthocyanin
colour below apex Fig 4.10: Stigma colour
Fig 4.11: Curvature of Panicle Fig 4.12: Anthocyanin colour
of Node
Fig 4.13a: Lemma and Palea
Colour
84
Fig 4.13b: Lemma and Palea Colour Fig 4.14: Panicle Awn Fig 4.15: Panicle length of Awn
Fig 4.16: Panicle distribution of awn Fig 4.17: Panicle secondary branching Fig 4.18: Panicle exertion
85
Fig 4.19: Grain length Fig 4.20: Decorticated grain length Fig 4.21: Decorticated grain shape
Fig 4.22: Decorticated grain colour Fig 4.23: Grain length after cooking Fig 4.24: Grain phenol reaction
86
Fig 4.25: Amylose Fig 4.26: Chalkiness Fig 4.27: Alkali spreading value test
Fig 4.28: Gel consistency (Soft/Medium/Hard)
87
4.2 Estimation of genetic variance
4.2.1 Analysis of variance
The analysis of variance of 33 yield and quality traits of 48 (24 short and 24
long grains) rice germplasm accessions presented in Table 4.2. The statistical
procedure which separates or splits the total variation into different components is
known as analysis of variation. It is useful in estimating the different components
of variance. Such analysis divides the total variation into two main viz, variation
between varieties and variation within varieties i.e, environmental variation into
genotypic and environmental components.
The results of the analysis of variance indicated that the mean sum of
squares due to accession for replication were significant for most of the characters
except leaf: width of blade, panicle: length of main axis; panicle: length of longest
awn; grain: weight of 1000 fully developed grains; grain length, decorticated grain:
width, L/B ratio of decorticated grain, milling percent, length of milled grain,
width and L/B ratio of milled grain.
The mean sum of squares due to genotype/ treatments was found to be
highly significant for all the traits. This clearly indicates that variability does exist
in all the genotypes for all the traits. The significant and relatively large percentage
of the total variation attributable to GxE interaction suggests that genotypes
responded differentlly to envioronment of rice.
Under study, presence of high variability for plant height is in agreement
with Hein et al. (2007), Sarawgi et al. (2012), Chakravorty et al. (2013).
Significant variability for days to 50% flowering was estimated in present
study supports the findings of Subba Rao et al. (2013), Sarawgi (2014), Sajid et al.
(2015).
Significant variability for grain yield observed in this study is supported by
the findings of Ogunbayo et al. (2005), Vanisree et al. (2011), Sarawgi et al.
(2012) and Tuhia-Khatun et al. (2015).
88
Table 4.2: Analysis of variance of 33 yield and quality traits of 48 (24 short and 24 long grains length) rice germplasm accessions
SV
DF
Mean sum of squares
1 2 3 4 5 6 7 8 9 10
Rep 1 4.99* 0.004 1254.26** 0.05** 89.12* 0.87 107.65* 11.38** 0.003 1218.37**
Treat 47 56.5** 0.019** 130.64** 0.011** 982.68** 23.98** 1228.61** 2.01** 1.391** 138.57**
Error 47 1.2 0.005 1.94 0.003 15.77 1.4 19.22 0.24 0.008 2.35
SV
DF
Mean sum of squares
11 12 13 14 15 16 17 18 19 20
Rep 1 0.07 0.003 0.15** 37** 0.13** 0.001 0.001 2274888.37** 101465.01** 2,198.83**
Treat 47 144.58** 12.82** 0.26** 58.65** 5.96** 0.271** 0.04** 88992.88** 8,927.39** 2,166.74**
Error 47 0.05 0.028 0.01 0.68 0.01 0.016 0.001 39,864.35 6,130.45 2,016.39
SV
DF
Mean sum of squares
21 22 23 24 25 26 27 28 29 30 31 32 33
Rep 1 1.69* 0.21 0.22** 0.013 0.06 0.01 0.28** 0.1* 0.01 0.03** 0.023 4.08* 6*
Treat 47 68.73** 80.63** 125.83** 4.494** 0.2** 1.17** 7.25** 0.28** 0.58** 0.12** 0.152** 34.42** 424.74**
Error 47 0.29 10.47 0.01 0.012 0.01 0.02 0.01 0.01 0.01 0.003 0.008 0.67 0.78
1 = Leaf: Length of blade ; 2 = Leaf: Width of blade ; 3 = Time of heading(50% plants with panicle) ; 4 = Stem: Thickness ; 5 = Stem: Length(excluding panicle) ; 6
= Panicle: Length of main axis ; 7 = plant height ; 8 = Panicle: Number per plant (number of tillers) ; 9 = Panicle: Length of longest awn ; 10 = Time Maturity(Days) ;
11 = Grain: Weight of 1000 fully develop grain ; 12 = Grain: Length ; 13 = Grain: Width ; 14 = L/B ratio ; 15 = Decorticated grain: Length ; 16 = Decorticated grain:
Width ; 17 = L/B Ratio of decorticated grain ; 18 = Biological Yield(gm) ; 19 = Grain Yield(gm) ; 20= Harvest Index ; 21 = Hulling Percent ; 22 = Milling Percent ;
23 = Head Rice Recovery ; 24 = Length of milled grain ; 25 = Width of milled grain ; 26 = L/B ratio of milled grain ; 27 = Length of cooked kernel ; 28 = Width of
cooked kernel ; 29 = L/B ratio of cooked kernel ; 30 = Elongation Ratio ; 31 = Elongation index ; 32 = Endosperm content of Amylose ; 33 = Gel Consistency.
* and ** Significant at 5% and 1% probability level
89
4.2.2 Mean and variability parameters for 33 yield and quality traits of 48 (24
short and 24 long grains) rice germplasm accessions
Execution of the breeding programmes depends largely on the presence of
significant genetic variability to permit effective selection. Relative magnitude of
variability presence in a crop species helps the breeder to handle the breeding
population created by hybridizing the selected donors with high yielding base
varieties. Results revealed that high degree of variability was present in the
breeding lines for all the characters under study.
The mean and variability parameters for 33 yield and quality traits of 48
(24 short and 24 long grains) rice germplasm accessions are presented in table 4.3
and mean performance for different quantitative and quality characters under
present study is presented in Appendix D.
4.2.2.1 Leaf: Length of blade:
The mean of leaf length of blade was found 36.17 cm with minimum length
of blade of 27.00 cm (Krishna Bhog) and maximum of 48.70 cm (Banreg). The
maximum leaf length of blade was recorded is 48.70 cm in Banreg followed by
47.90 cm (Ruchi) and 47.00 cm (Kakeda (I)). The coefficient of variation observed
for this trait was 14.70%.
4.2.2.2 Leaf: Width of blade:
The mean of width of leaf blade was found 0.71 cm with minimum leaf
width of blade of 0.50 cm (Atma Sital) and maximum of 0.90 cm (Lanji). The
maximum leaf : width of blade was recorded is 0.90 cm in Lanji followed by 0.85
cm (Rani Kajar), Basabhog, Hira Nakhi, Banas Kup (II), Khatiya pati, Girmit,
Banreg and Narved. The coefficient of variation recorded for this trait was 13.70%
(Fig: 4.6)
4.2.2.3 Time of heading (50% plant with panicle) days:
The range for days to 50% flowering varied from 88.00 days (Basa Bhog)
to 126.00 days (Lokti Machhi CGR No. 10029) with the overall mean of 112.11
days. Four categories for days to 50% flowering were reported i.e. early (91-
90
Table 4.3: Mean and Variability parameters for 33 yield and quality traits of
48 (24 short and 24 long grains length) rice germplasm accessions
S.
No.
Characters Mean Standard
Error
Standard
Deviation
Coefficient of
Variation (%)
1 Leaf: Length of blade(cm) 36.17 0.77 5.32 14.70
2 Leaf: Width of blade(cm) 0.71 0.01 0.10 13.70
3 Time of heading(50% plants
with panicle) 112.11 1.17 8.08 7.21
4 Stem: Thickness(cm) 0.47 0.01 0.07 15.67
5 Stem: Length(excluding
panicle)(cm) 141.91 3.20 22.17 15.62
6 Panicle: Length of main axis 22.71 0.50 3.46 15.25
7 Plant height(cm) 164.62 3.58 24.79 15.06
8 Panicle: Number per plant
(number of tillers) 7.44 0.15 1.00 13.50
9 Panicle: Length of longest awn 0.57 0.12 0.83 16.38
10 Time Maturity(Days) 141.21 1.20 8.32 5.89
11 Grain: Weight of 1000 fully
develop grain(g) 22.03 1.23 8.50 18.60
12 Grain: Length(mm) 8.21 0.37 2.53 25.84
13 Grain: Width(mm) 2.51 0.05 0.36 14.47
14 L/B ratio 18.8 0.78 5.42 23.81
15 Decorticated grain:
Length(mm) 5.8 0.25 1.73 24.77
16 Decorticated grain:
Width(mm) 2.34 0.05 0.37 15.73
17 L/B Ratio of decorticated grain 0.47 0.02 0.14 25.24
18 Biological Yield(g) 844.688 30.45 210.94 24.97
19 Grain Yield(g) 181.09 9.64 66.81 31.89
20 Harvest Index 22.30 4.75 5.08 22.82
21 Hulling Percent 72.14 0.85 5.86 8.13
22 Milling Percent 61.99 0.92 6.35 10.24
23 Head Rice Recovery (%) 49.44 1.14 7.93 16.04
24 Length of milled grain(mm) 5.23 0.22 1.50 23.66
25 Width of milled grain(mm) 2.26 0.05 0.32 14.01
26 L/B ratio of milled grain 2.36 0.11 0.77 27.44
27 Length of cooked kernel(mm) 8.3 0.27 1.90 22.95
28 Width of cooked kernel(mm) 3.21 0.05 0.37 11.66
29 L/B ratio of cooked kernel 2.58 0.08 0.54 20.98
30 Elongation Ratio 1.63 0.04 0.25 15.25
31 Elongation index 1.16 0.04 0.28 23.77
32 Endosperm content of
Amylose 22.46 0.60 4.15 18.47
33 Gel Consistency 90.46 2.10 14.57 16.11
91
90days), medium (91-110days), late (111-130days) and very late (> 131days). The
C.V. recorded for this trait was 7.21%.
Table 4.3 a: List of germplasm categorized into early, medium and late days
to flowering
Category Short grain rice germplasm
Early ADT:27 (85 days)
Medium Kanak Jira (99); Jhumera(106); Kakeda (I)(96); Bhulau(108); Rani
kajar(100); Sundar mani(107); Bhado kanker(102); Jhumarwa(108);
Bishnu(107); Basa Bhog(94);Krishna Bhog(103); Lokti
Maudi(109); Ganja Kali(102); Dhangari Khusha(102);
Bhaniya(102)
Late
Lokti Machhi(117); Atma Sital(121); Lokti Machhi(121);
Anjania(119); Dubraj II(123); Hira Nakhi(114); Kariya bodela
bija(113); Banas KupiII(114)
Category Long grain rice germplasm
Late Farsa phool(112); Jay Bajrang(113); Gilas(112); Khatia pati(115);
Mani(123); Khatriya pati(113); Girmit(119); Lanji(114);
Banreg(123); Ruchi(120); Safed luchai(113); Kanthi deshi(119);
Piso III(111); Kakdi(122); Gajpati(113); Gadur sela(121); Aadan
chilpa(114); Unknown(122); Saja chhilau(113); Parmal Safri(119);
Safri(114); Narved(121); Nagbel(114); Mudariya(118)
4.2.2.4 Stem: Thickness (cm):
The range of stem thickness varied from 0.30 cm (Sunder Mani) to 0.65 cm
(Anjania) with the grand mean of 0.47 cm. The maximum stem thickness was
recorded was 0.65 cm in Anjania followed by 60 cm (Kariya Bodela Bija, Girmit
and Piso III). The C.V. was 15.67% for stem thickness.
4.2.2.5 Stem Length (cm):
The mean of stem length was found 141.90 cm with minimum stem length
of 82.20 cm (ADT: 27) and maximum of 179.60 cm (Khatia Pati). The maximum
stem length was recorded is 179.60 cm in Khatia Pati followed by 179.20 cm Lanji
and 177.60 Nagbel. The C.V. was recorded for this trait was 15.62%.
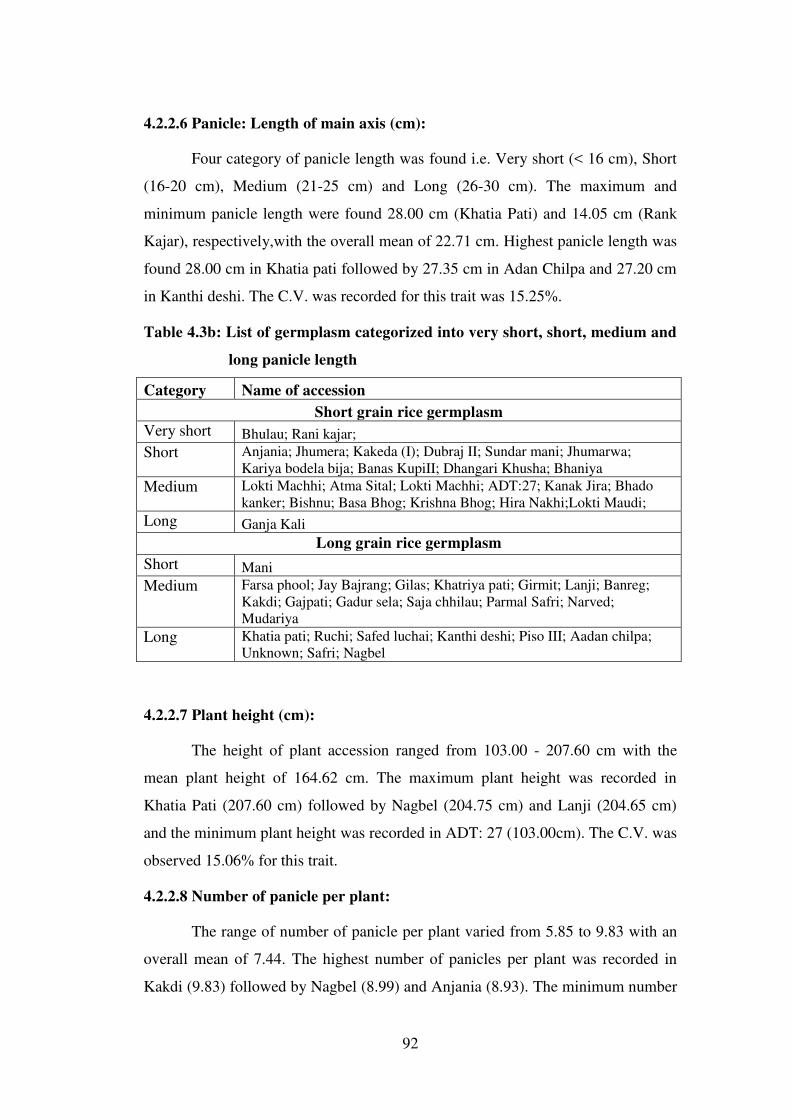
92
4.2.2.6 Panicle: Length of main axis (cm):
Four category of panicle length was found i.e. Very short (< 16 cm), Short
(16-20 cm), Medium (21-25 cm) and Long (26-30 cm). The maximum and
minimum panicle length were found 28.00 cm (Khatia Pati) and 14.05 cm (Rank
Kajar), respectively,with the overall mean of 22.71 cm. Highest panicle length was
found 28.00 cm in Khatia pati followed by 27.35 cm in Adan Chilpa and 27.20 cm
in Kanthi deshi. The C.V. was recorded for this trait was 15.25%.
Table 4.3b: List of germplasm categorized into very short, short, medium and
long panicle length
Category Name of accession
Short grain rice germplasm
Very short Bhulau; Rani kajar;
Short Anjania; Jhumera; Kakeda (I); Dubraj II; Sundar mani; Jhumarwa;
Kariya bodela bija; Banas KupiII; Dhangari Khusha; Bhaniya
Medium Lokti Machhi; Atma Sital; Lokti Machhi; ADT:27; Kanak Jira; Bhado
kanker; Bishnu; Basa Bhog; Krishna Bhog; Hira Nakhi;Lokti Maudi;
Long Ganja Kali
Long grain rice germplasm
Short Mani
Medium Farsa phool; Jay Bajrang; Gilas; Khatriya pati; Girmit; Lanji; Banreg;
Kakdi; Gajpati; Gadur sela; Saja chhilau; Parmal Safri; Narved;
Mudariya
Long Khatia pati; Ruchi; Safed luchai; Kanthi deshi; Piso III; Aadan chilpa;
Unknown; Safri; Nagbel
4.2.2.7 Plant height (cm):
The height of plant accession ranged from 103.00 - 207.60 cm with the
mean plant height of 164.62 cm. The maximum plant height was recorded in
Khatia Pati (207.60 cm) followed by Nagbel (204.75 cm) and Lanji (204.65 cm)
and the minimum plant height was recorded in ADT: 27 (103.00cm). The C.V. was
observed 15.06% for this trait.
4.2.2.8 Number of panicle per plant:
The range of number of panicle per plant varied from 5.85 to 9.83 with an
overall mean of 7.44. The highest number of panicles per plant was recorded in
Kakdi (9.83) followed by Nagbel (8.99) and Anjania (8.93). The minimum number
93
of panicle per plant was recorded in Dubraj II (5.85). The C.V. was recorded
13.50% for this trait.
4.2.2.9 Panicle: Length of longest awn (cm):
The length of longest awn ranged from 0.00-3.40 cm with a overall mean of
0.57 cm. The longest awn in recorded in Khatia Pati (3.40 cm) followed by Kanthi
deshi (2.55) and Lanji (2.15 cm) and all the short grain germplasm accessions were
awnless. The C.V. was observed 16.38% for this trait (Fig: 4.15).
4.2.2.10 Time Maturity (Days):
Days to maturity ranged between 116 to 155.50 days with an average of
141.21 days. Atma Sital (155.50 days) took maximum duration to reach maturity
followed by Lokti Machhi CGR no. 10029 (154.00 days), Lokti Machhi CGR no.
10031 (149.50 days) and Banreg (149.00 days). The minimum period for maturity
was recorded in Basa Bhog (116.00 days). The C.V. was recorded 5.89 % for this
trait.
4.2.2.11 1000-seed weight (g):
1000-seed weight ranged from 10.35 gm to 38.65 gm with an average
weight of 22.033 cm. The maximum 1000-seed weight recorded in Jay Bajrang
(38.65 gm) followed by Khatia Pati (38.55 gm) and Nagbel (37.50 gm). The
minimum 1000-seed weight recorded in Krishna Bhog (10.35 gm). The C.V. was
18.60 % for this trait.
4.2.2.12 Grain length (mm):
Grain length ranged from 5.15 to 11.80 mm with the mean performance of
8.21 mm. Jay Bajrang (11.80 mm) recorded maximum grain length, followed by
Nagbel (11.45 mm), Khatiya Pati (11.40 mm), Banreg (11.10 mm) and Mudaria
(11.05 mm). The minimum length of grain was recorded for Jhunarwa (5.15 mm),
Rani Kajar (5.15 mm), Lokti Machhi CGR No. 10029 (5.25), Basa Bhog (5.25),
Krishna Bhog (5.25). The C.V. observed for this trait was 25.84 % (Fig: 4.19).
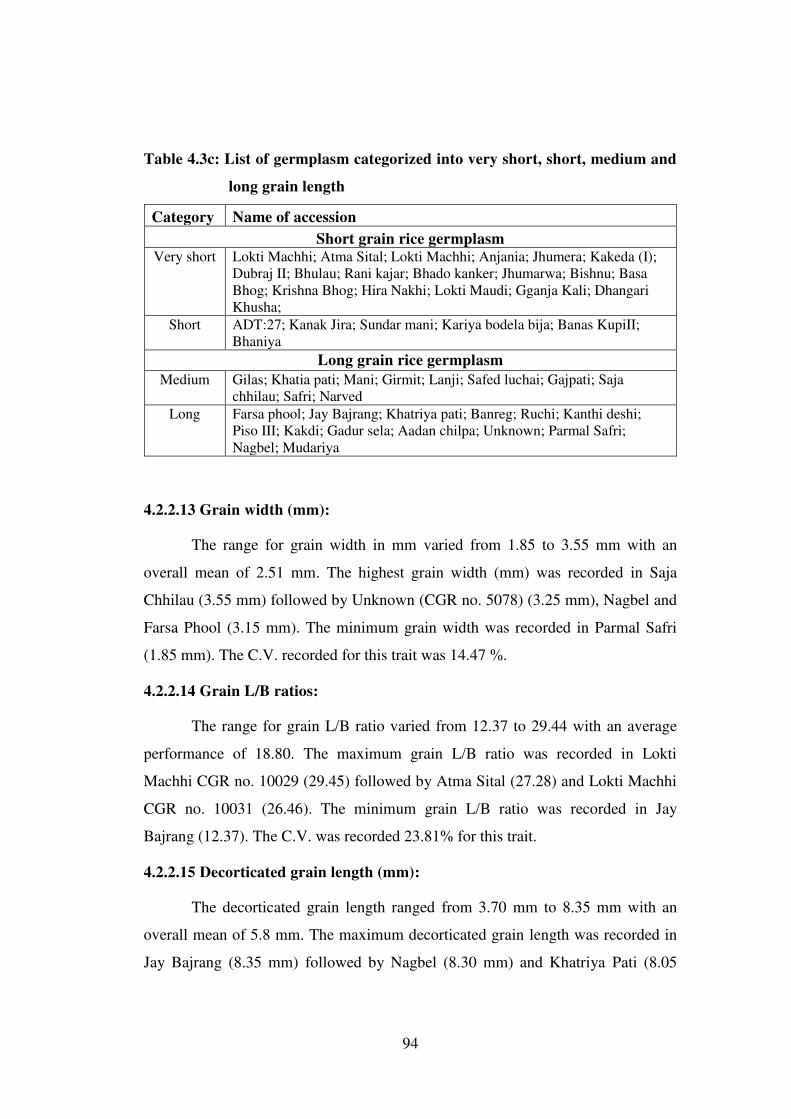
94
Table 4.3c: List of germplasm categorized into very short, short, medium and
long grain length
Category Name of accession
Short grain rice germplasm Very short Lokti Machhi; Atma Sital; Lokti Machhi; Anjania; Jhumera; Kakeda (I);
Dubraj II; Bhulau; Rani kajar; Bhado kanker; Jhumarwa; Bishnu; Basa
Bhog; Krishna Bhog; Hira Nakhi; Lokti Maudi; Gganja Kali; Dhangari
Khusha;
Short ADT:27; Kanak Jira; Sundar mani; Kariya bodela bija; Banas KupiII;
Bhaniya
Long grain rice germplasm
Medium Gilas; Khatia pati; Mani; Girmit; Lanji; Safed luchai; Gajpati; Saja
chhilau; Safri; Narved
Long Farsa phool; Jay Bajrang; Khatriya pati; Banreg; Ruchi; Kanthi deshi;
Piso III; Kakdi; Gadur sela; Aadan chilpa; Unknown; Parmal Safri;
Nagbel; Mudariya
4.2.2.13 Grain width (mm):
The range for grain width in mm varied from 1.85 to 3.55 mm with an
overall mean of 2.51 mm. The highest grain width (mm) was recorded in Saja
Chhilau (3.55 mm) followed by Unknown (CGR no. 5078) (3.25 mm), Nagbel and
Farsa Phool (3.15 mm). The minimum grain width was recorded in Parmal Safri
(1.85 mm). The C.V. recorded for this trait was 14.47 %.
4.2.2.14 Grain L/B ratios:
The range for grain L/B ratio varied from 12.37 to 29.44 with an average
performance of 18.80. The maximum grain L/B ratio was recorded in Lokti
Machhi CGR no. 10029 (29.45) followed by Atma Sital (27.28) and Lokti Machhi
CGR no. 10031 (26.46). The minimum grain L/B ratio was recorded in Jay
Bajrang (12.37). The C.V. was recorded 23.81% for this trait.
4.2.2.15 Decorticated grain length (mm):
The decorticated grain length ranged from 3.70 mm to 8.35 mm with an
overall mean of 5.8 mm. The maximum decorticated grain length was recorded in
Jay Bajrang (8.35 mm) followed by Nagbel (8.30 mm) and Khatriya Pati (8.05
95
mm). The minimum kernel length was recorded in Jhumarva (3.70 mm). The C.V.
observed for this trait was 24.77 % (Fig: 4.20).
4.2.2.16 Decorticated grain width (mm):
The decorticated grain width ranges from 1.65 to 3.05 mm with an overall
mean of 2.34 mm. The maximum decorticated grain width was recdorded in Saja
Chhilau (3.05 mm) followed by Anjania (2.95) and Jhumera (2.85 mm). The
minimum decorticated grain width recorded was in Parmal Safri (1.65 mm). The
C.V. was recorded 15.73 % for this trait.
4.2.2.17 L/B ratio of decorticated grain:
The L/B ratio of decorticated grain ranges from 0.24 to 0.70 with an
average of 0.47. The highest L/B ratio was recorded in Dubraj II (0.70) followed
by Hira Nakhi (0.68) and Bhulau (0.67) and the minimum L/B ratio of decorticated
grain was recorded in Parmal Safri (0.24). The C.V. recorded for this trait was
25.24 %.
4.2.2.18 Biological yield (g):
The mean performance of biological yield was 844.69. It showed variation
from 414.00 to 1439.50 gm. The maximum biological yield was recorded in Safri
(1439.50 gm) followed by Bishnu (1281.50 gm) and Ganja Kali and the minimum
were recorded in Basa bhog (414.00 gm). The C.V. recorded for this trait was
24.97%.
4.2.2.19 Grain yield (g):
The range for grain yield (g) varied from 61.00 g to 498.50 g with a mean
value of 181.09 g. The highest grain yield (g) was recorded in Anjania (498.50 g)
followed by Safri (285.50 g) and Nagbel (259.00 g). The minimum grain yield (g)
was recorded in Lokti Machhi CGR no. 10029 (61.00 g). The C.V. was 31.89%
recorded for this trait.
4.2.2.20 Harvest index (%):
Harvest index was found to vary from 12.50% to 65.51% with an overall
mean of 22.30%. The maximum harvest index was recorded in Anjania (65.51%

96
followed by Nagbel (60.23%) and Mudariya (26.98%). The minimum harvest
index was recorded in Kakeda (I) (12.50%). The C.V. recorded for this trait was
22.82 %.
4.2.2.21 Hulling percent (%):
Hulling percentage ranged from 56.44% to 78.95% with an overall mean
performance of 72.14%. The maximum hulling percent was recorded in Lokti
Machhi CGR no. 10031 (78.95%), followed by Bhaniya (78.83%) and Piso III
(78.43%) and the minimum hulling per cent was recorded in Gilas (56.44%). The
C.V. recorded 8.13% for this trait.
4.2.2.22 Milling percent (%):
Milling percentage ranged from 44.88% to 78.91% with an overall mean
performance of 61.99%. The maximum milling percent was recorded in Kanthi
Deshi (78.91%) followed by Lokti Machhi (71.38%) and Kakeda I (69.81%). The
minimum milling percent was recorded in Lanji (44.88%). The C.V. observed for
this trait was 10.24%.
4.2.2.23 Head Rice Recovery (%):
The head rice recovery was found in the ranged from 27.41% to 62.14%
with an overall average of 49.44%. The highest head rice recovery was recorded in
Piso III (62.14%) followed by Mudariya (60.20%) and Safed Luchai (59.88%).
The minimum head rice recovery was recorded in Bhado Kanker (27.41%). The
C.V. recorded for this trait was 16.04%.
4.2.2.24 Length of milled grain (mm):
The length of milled grain ranged from 3.25 to 7.25 mm with an overall
mean of 5.23 mm. The maximum milled grain length was recorded in Safed Luchai
(7.25 mm) followed by Jay Bajrang (7.20 mm) and Khatriya Pati, Nagbel,
Mudariya (7.10 mm) and minimum milled grain length was recorded in Jhumarwa
(3.25 mm). The C.V. recorded from this trait was 23.66%.
97
4.2.2.25 Width of milled grain (mm):
The width of milled grain ranges from 1.55 mm to 3.00 mm with an overall
mean of 2.3 mm. The maximum milled grain width was recorded in Saja Chhilau
and Parmal Safri (3.00 mm) followed by Nagbel (2.95 mm) and Anjania (2.75
mm) and the lowest width of milled grain was recorded in Lokti Machhi CGR no.
10029 (1.55 mm). The C.V. was 14.01% recorded for this trait.
4.2.2.26 L/B ratio of milled grain:
The L/B ratio of milled grain ranges from 1.35 to 4.07 with an average
performance of 2.36. The maximum L/B ratio of milled grain was recorded in
Mani (4.07) followed by Safed luchai (4.04) and Khatriya pati (3.39). The
minimum L/B ratio of milled grain was recorded in Jhumarwa (1.35). The C.V.
observed for this trait was 27.44%.
4.2.2.27 Length of cooked kernel (mm):
The kernel length after cooking in genotypes ranged from 5.50 mm to
13.15 mm with an overall average 8.30 mm. The maximum length of cooked
kernel was recorded in Piso III (13.15 mm) followed by Mudariya (11.45 mm) and
Banreg (11.30 mm). The minimum length of cooked kernel was recorded in ADT:
27 (5.50 mm). The C.V. was 22.95% for this trait (Fig: 4.23).
4.2.2.28 Width of cooked kernel (mm):
The kernel width after cooking ranged from 2.50mm to 4.25 mm with an
average of 3.21 mm. The maximum width of cooked kernel was recorded in Kanthi
Deshi (4.25 mm) followed by Godur Sela (3.85 mm), Piso III (3.85 mm) and the
minimum width of cooked kernel was recorded in Banas Kupi II (2.50 mm). The
C.V. observed for this trait was 11.66%.
4.2.2.29 L/B ratio of cooked kernel:
The L/B ratio of cooked kernel ranged from 1.75 to 3.65 with an average of
2.59. The maximum L/B ratio of cooked kernel was recorded in Ruchi (3.65)
followed by Banreg (3.54) and Parmal Safri (3.45). The minimum L/B ratio of
cooked kernel was recorded in Dhangari Khusha (1.75). The C.V. observed was
20.98% for this trait.
98
4.2.2.30 Elongation ratio:
The variation in elongation ratio ranged from 1.13 to 2.30 with the overall
mean of 1.63. The highest elongation ratio was recorded in Kariya Bodela Bija
(2.30) followed by Dubraj II (2.26) and Piso III (2.04). The minimum elongation
ratio was recorded in Jay Bajrang (1.13). The C.V. observed for trait was 15.25%.
4.2.2.31 Elongation index:
The elongation index ranges from 0.69 to 1.86 with an overall mean of
1.164. The highest elongation index was recorded in Bhaniya (1.86) followed by
Ganja Kali (1.62) and Dubraj II (1.60) and the minimum elongation index were
recorded in Safed Luchai (0.69). The C.V. was 23.77% for this trait.
4.2.2.32 Amylose content (%):
The amylose content in genotypes ranged from 15.42% to 29.33% with an
overall mean of 22.46%. The highest amylase content was recorded in Sunder
Mani (29.33%) followed by Basa Bhog (28.82%) and Jhumarwa (28.39%) and the
minimum were recorded in Lokti Machhi CGR no. 10031 (14.92%). The C.V.
observed for this trait was 18.47% (Fig: 4.25).
Table 4.3d: List of germplasm categorized into very short, short, medium and
long grain length
Category Name of accession
Short grain rice germplasm
Low Lokti Machhi; ADT:27; Jhumera; Krishna Bhog; Hira Nakhi; Lokti Maudi;
Kariya bodela bija; Gganja Kali; Bhaniya
Medium Atma Sital; Lokti Machhi; Anjania; Kanak Jira; Dubraj II; Bhulau; Bhado
kanker; Bishnu; Banas KupiII; Dhangari Khusha
High Kakeda (I); Rani kajar; Sundar mani; Jhumarwa; Basa Bhog
Long grain rice germplasm
Low Mani; Khatriya pati; Banreg; Ruchi
Medium Jay Bajrang; Gilas; Khatia pati; Girmit; Lanji; Safed luchai; Kanthi deshi;
Piso III; Kakdi; Gajpati; Aadan chilpa; Saja chhilau; Parmal Safri;
Mudariya
High Farsa phool; Gadur sela; Unknown; Safri; Narved; Nagbel
99
4.2.2.33 Gel consistency (%)
The gel consistency in genotypes ranges from 32.50% to 100% with an
overall mean of 90.46%. The highest gel consistency was observed in many
genotypes like Atma Sital (100%), ADT : 27 (100%), Anjania (100%), Jhumera
(100%), Kakeda I (100%), Dubraj II and the minimum was recorded in Bhania
(32.50%). The C.V. recorded for this trait was 16.11% (Fig: 4.28).
Table 4.3e: List of germplasm categorized into soft, medium and hard gel
consistency
Category Name of accessions
Short grain rice germplasm
Soft Lokti Machhi; Atma Sital; ADT:27; Anjania; Kanak Jira; Jhumera;
Kakeda (I); Dubraj II; Bhulau; Sundar mani; Bhado kanker;
Jhumarwa; Bishnu; Basa Bhog; Krishna Bhog; Hira Nakhi; Lokti
Maudi; Kariya bodela bija; Gganja Kali; Banas KupiII; Dhangari
Khusha
Medium Lokti Machhi; Rani kajar
Hard Bhaniya
Long grain rice germplasm
Soft Farsa phool; Jay Bajrang; Gilas; Khatia pati; Mani; Khatriya pati;
Girmit; Lanji; Banreg; Ruchi; Safed luchai; Kanthi deshi; Piso III;
Kakdi; Gajpati; Gadur sela; Aadan chilpa; Unknown; Saja chhilau;
Parmal Safri; Safri; Narved; Nagbel; Mudariya
The genetic variability in any breeding material is a prerequisite as it does
not only provide a basis for selection but also provide some valuable information
regarding selection of diverse parents for use in hybridization programme.
Coefficient of variation was evolved by Karl Pearson. It is very useful for
the study of variation. It indicates that when the C.V. is high the sample is less
consistent or more variable.
Coefficient of variation truly provides a relative measure of variability
among different traits. In the present investigation wide range of variability was
observed for most of the quantitative traits. High magnitude of coefficient of
variation (more than 20%) in the entire accessions was observed for grain yield
(31.89), L/B ratio of milled grain (27.44), grain length (25.84), L/B ratio of
decorticated grain (25.24), biological yield (24.97), decorticated grain length
100
(24.77), grain L/B ratio (23.81), elongation index (23.77), length of milled grain
(23.66), length of cooked kernel (22.95) and harvest index (22.82). High
magnitude of coefficient of variation for grain yield was observed by Nachimuthu
et al. (2014) and Sarawgi et al. (2014).
Moderate magnitude of coefficient of variation (10-20%) was observed for
1000 grain weight (18.60), endosperm content of amylose (18.47), length of
longest awn (16.38), gel consistency (16.11), head rice recovery (16.04),
decorticated grain width (15.73), stem length (15.62), plant height (15.25),
elongation ratio (15.25), grain width (14.47), no. of panicle per plant (13.50).
Similar findings were also reported by the earlier workers (Chakravorty et al.,
2013; Nachimuthu et al., 2014 and Sarawgi et al., 2014 and Lingaiah et al. 2015).
4.2.3 Phenotypic and Genotypic coefficient of variation
Coefficient of variation was calculated at genotypic and phenotypic levels
as analysis of variance permits estimation of phenotypic, genotypic and
environmental coefficient of variation (Burton, 1952). As usual, phenotypic
coefficient of variation was higher in magnitude than genotypic coefficient of
variation. The PCV and GCV are classified as follows as suggested by Siva
Subramanian and Madhavamenon (1973) (low <10%; moderate 10-20% and
high>20%). The estimates of phenotypic and genotypic coefficient of variation for
different quantitative characters and quality characters are present in Table 4.4.
The highest value of PCV coupled with GCV was recorded in harvest index
(98.63-32.34) followed by grain yield (47.91-20.65), length of longest awn (46.79-
45.98), 1000 grain weight (38.59-38.58), L/B ratio of milled grain (32.75-32.08),
grain length (30.88-30.82), L/B ratio of decorticated grain (30.56-29.94), L/B ratio
(28.97-28.63), decorticated grain: length (29.81-29.73), length of milled grain
(28.68-28.60), length of cooked kernel (22.96-22.92), L/B ratio of cooked kernel
(21.09-20.73) and elongation index (24.28-23.09).
The values of PCV are higher than GCV, indicating the apparent variation
is not only due to genotypes but also due to the influence of environment. The high
magnitude of genotypic coefficient of variation reveals the high genetic variability
present in the material studied. In the present investigation phenotypic coefficient
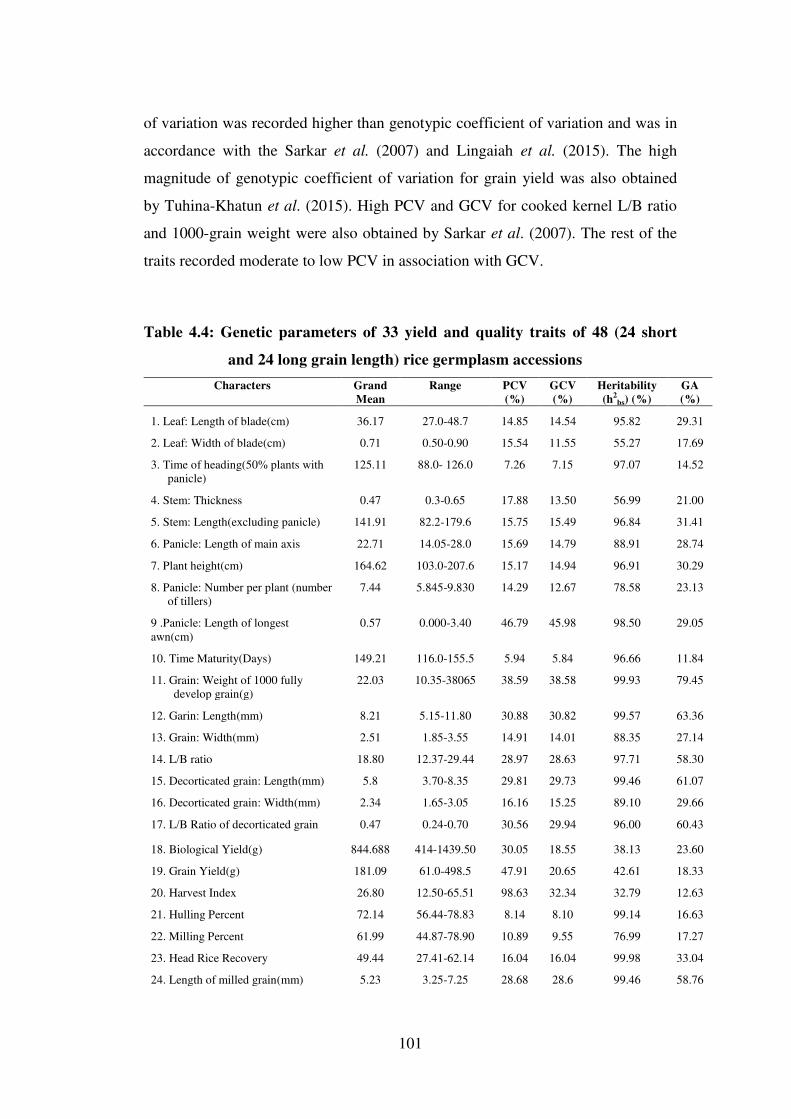
101
of variation was recorded higher than genotypic coefficient of variation and was in
accordance with the Sarkar et al. (2007) and Lingaiah et al. (2015). The high
magnitude of genotypic coefficient of variation for grain yield was also obtained
by Tuhina-Khatun et al. (2015). High PCV and GCV for cooked kernel L/B ratio
and 1000-grain weight were also obtained by Sarkar et al. (2007). The rest of the
traits recorded moderate to low PCV in association with GCV.
Table 4.4: Genetic parameters of 33 yield and quality traits of 48 (24 short
and 24 long grain length) rice germplasm accessions
Characters Grand
Mean
Range PCV
(%)
GCV
(%)
Heritability
(h2bs) (%)
GA
(%)
1. Leaf: Length of blade(cm) 36.17 27.0-48.7 14.85 14.54 95.82 29.31
2. Leaf: Width of blade(cm) 0.71 0.50-0.90 15.54 11.55 55.27 17.69
3. Time of heading(50% plants with
panicle)
125.11 88.0- 126.0 7.26 7.15 97.07 14.52
4. Stem: Thickness 0.47 0.3-0.65 17.88 13.50 56.99 21.00
5. Stem: Length(excluding panicle) 141.91 82.2-179.6 15.75 15.49 96.84 31.41
6. Panicle: Length of main axis 22.71 14.05-28.0 15.69 14.79 88.91 28.74
7. Plant height(cm) 164.62 103.0-207.6 15.17 14.94 96.91 30.29
8. Panicle: Number per plant (number
of tillers)
7.44 5.845-9.830 14.29 12.67 78.58 23.13
9 .Panicle: Length of longest
awn(cm)
0.57 0.000-3.40 46.79 45.98 98.50 29.05
10. Time Maturity(Days) 149.21 116.0-155.5 5.94 5.84 96.66 11.84
11. Grain: Weight of 1000 fully
develop grain(g)
22.03 10.35-38065 38.59 38.58 99.93 79.45
12. Garin: Length(mm) 8.21 5.15-11.80 30.88 30.82 99.57 63.36
13. Grain: Width(mm) 2.51 1.85-3.55 14.91 14.01 88.35 27.14
14. L/B ratio 18.80 12.37-29.44 28.97 28.63 97.71 58.30
15. Decorticated grain: Length(mm) 5.8 3.70-8.35 29.81 29.73 99.46 61.07
16. Decorticated grain: Width(mm) 2.34 1.65-3.05 16.16 15.25 89.10 29.66
17. L/B Ratio of decorticated grain 0.47 0.24-0.70 30.56 29.94 96.00 60.43
18. Biological Yield(g) 844.688 414-1439.50 30.05 18.55 38.13 23.60
19. Grain Yield(g) 181.09 61.0-498.5 47.91 20.65 42.61 18.33
20. Harvest Index 26.80 12.50-65.51 98.63 32.34 32.79 12.63
21. Hulling Percent 72.14 56.44-78.83 8.14 8.10 99.14 16.63
22. Milling Percent 61.99 44.87-78.90 10.89 9.55 76.99 17.27
23. Head Rice Recovery 49.44 27.41-62.14 16.04 16.04 99.98 33.04
24. Length of milled grain(mm) 5.23 3.25-7.25 28.68 28.6 99.46 58.76
102
25. Width of milled grain(mm) 2.26 1.55-3.00 14.54 13.40 85.07 25.47
26. L/B ratio of milled grain 2.36 1.35-4.07 32.75 32.08 95.97 64.74
27. Length of cooked kernel(mm) 8.30 5.50-13.15 22.96 22.92 99.61 47.12
28. Width of cooked kernel(mm) 3.21 2.50-4.25 11.93 11.33 90.12 22.15
29. L/B ratio of cooked kernel 2.58 1.75-3.65 21.09 20.73 96.61 41.97
30. Elongation Ratio 1.63 1.12-2.30 15.41 15.08 95.72 30.39
31. Elongation index 1.16 0.69-1.86 24.28 23.09 90.48 45.25
32. Endosperm content of Amylose 22.46 15.42-29.33 18.65 18.29 96.16 36.95
33. Gel Consistency 90.46 32.50-100.0 16.13 16.09 99.63 33.09
4.2.4 Heritability and Genetic advance as percentage of mean:
Heritability estimates provide the information regarding the amount of
transmissible genetic variation to total variation and determine genetic
improvement and response to selection. Thus, heritability is the heritable portion of
the phenotypic variance. It is a good index of the transformation of characters from
parent to their offsprings. Heritability and genetic advance are important selection
parameters. Heritability estimates alongwith genetic advance are normally more
helpful in predicting the gain under selection than heritability estimates alone.
Improvement in the mean genotypic value of selected plants over the parental
population is known as genetic advance. It is the measure of genetic gain under
selection. The success of genetic advance under selection depends on genetic
variability, heritability and selection intensity. In the present investigation
heritability in broad sense and genetic advance were calculated for 33 yield and
quality characters under study and are presented in Table-4.4.
High estimate of heritability was found for all characters except for harvest
index (32.79%), biological yield (g) (38.13%), grain yield (g) (42.61%), leaf width
of blade (cm) (55.27%) and stem thickness (57.00%). The highest heritability was
estimated for head rice recovery (99.98%) followed by 1000-grain weight
(99.93%), Gel consistency (99.63%), length of cooked kernel (99.62%) and Grain
length (99.57%). This finding is in agreement with Choudhary et al. (2004) and
Tuhina Khatun et al. (2015). Highest heritability for head rice recovery, length of
decorticated grain, gel consistency is similar with the findings of Shrivastava et al.
(2012).
103
Genetic advance is a measure of genetic gain under selection. The success
of genetic advance under selection depends on heritability of the character under
consideration. This indicates that though the character is less influenced by
environmental effects, the selection for improvement of such trait may not be
useful because, heritability is based on total genetic variance which includes
fixable (additive) and non fixable (dominance and epistatic) varience.
The magnitude of genetic advance as percent of mean was recorded high
for all the traits. Only some traits observed moderate genetic advance namely, time
of maturity (11.84%), harvest index (12.63%), time of heading (14.52%), hulling
percent (16.63%), milling percent (17.27%), and leaf: width of blade (17.69%) and
grain yield (18.33%). All the traits possessing high values of genetic advance
indicate that the characters are governed by additive genes and selection will be
rewarding for improvement of such trait.
Out of 33 yield and quality traits, twenty four characters namely, leaf:
length of blade (95.82-29.31), stem length (96.84-31.41), panicle: length of main
axis (88.91-28.74), plant height (96.91-30.29), panicle: number per plant (78.58-
23.13), length of longest awn (98.50-29.05), 1000 grain weight (99.93-79.45),
grain length (99.57-63.36), grain width (88.35-27.14), grain L/B ratio (97.71-
58.30), decorticated grain length (99.46-61.07), decorticated grain width (89.10-
29.66), L/B ratio of decorticated grain (96.00-60.43), head rice recovery (99.98-
33.04), length of milled grain (99.46-58.76), width of milled grain (85.07-25.47),
L/B ratio of milled grain (95.97-64.74), length of cooked kernel (99.61-47.12),
width of cooked kernel (90.12-22.15), L/B ratio of cooked kernel (96.61-41.97),
elongation ratio (95.72-30.39), elongation index (90.48-45.25), amylose content
(96.16-36.95), gel consistency (99.63-33.09) exhibited high heritability coupled
with high genetic advance. It clearly indicates that most likely the heritability is
due to additive gene effects and selection may be effective.
High heritability with low genetic advance as percentage of mean was
observed for Time of heading (97.07, 14.52). Time maturity (days) (96.66, 11.83)
and Hulling percent (99.13, 16.63). This indicates non-additive (dominance and
104
epistasis) gene action. These findings are in agreement with findings of Veni and
Rani (2006) and Rahman et al. (2016).
4.3 Association analysis:
4.3.1 Correlation analysis
Association analysis is an important approach in a breeding programme. It
gives an idea about relationship among the various characters and determines the
component characters, on which selection can be based for genetic improvement in
the grain yield. Degree of association also affects the effectiveness of selection
process. The degree of association between independent and dependent variables
was suggested by Galton 1888, its theory was developed by Pearson (1904) and
their mathematical utilization at phenotypic, genotypic and environmental levels
was described by Searle (1961). The association between any two variables is
termed as simple correlation or total correlation or zero order correlation
coefficient. It is of three types viz, phenotypic, genotypic and environmental
correlations.
The correlation coefficient analysis is the index of association between two
variables. These have been dealt in all possible combination for important
characters at phenotypic and genotypic level and are presented in Table-4.5a and
4.5b.
In table 4.5b, grain yield showed positive and significant correlation with
time of heading (0.40) followed by stem thickness (0.62), stem length (0.38),
panicle length (0.43), plant height (0.40), panicle per plant (0.48), length of longest
awn (0.33), time maturity (0.37), 1000-grain weight (0.56), grain length (0.54),
decorticated grain length (0.54) and biological yield (0.98). However, it showed
negative and significant association with L/B ratio (-0.54).
Time of maturity showed positive and significant correlation with Leaf:
length of blade (0.40, 0.41) followed by Time of heading (0.98, 0.99), Stem length
(0.68, 0.69), Panicle length (0.46, 0.49), Plant height (0.67, 0.69) and Length of
longest awn (0.40, 0.41) both phenotypically and genotypically. 1000-fully
developed grain weight showed positive and significant association with Leaf:
length of blade (0.53) followed by Time of heading (0.44), Stem length (0.70),
105
Panicle length (0.72), Plant height (0.73), Length of longest awn (0.58), Time of
maturity (0.47).
Grain length possessed positive and significant association with Leaf:
length of blade (0.63), followed by Time of heading (0.56), Stem length (0.77),
Panicle length (0.74), Plant height (0.79), Length of longest awn (0.65), Time of
maturity (0.59) and 1000-grain weight (0.93).
Decorticated grain length showed positive and significant association with
Leaf: length of blade (0.60), Time of heading (0.56), Stem length (0.78), Panicle
length (0.74), Plant height (0.80), Length of longest awn (0.63), Time of maturity
(0.58) and 1000-grain weight (0.93) and Grain length (0.99).
Biological yield showed positive and significant association with Time of
maturity (0.44), Stem length (0.46), Panicle length (0.57), Plant height (0.49) and
Time of maturity (0.48).
Harvest index possessed positive and significant association with Time of
heading (0.34), Stem length (0.51), Panicle length (0.42), Plant height (0.51),
Panicle per plant (0.96), 1000-grain weight (0.96), Grain length (0.61), Grain width
(0.88), Decorticated grain length (0.67), Decorticated grain width (0.70) and Grain
yield (0.62).
Hulling percent showed positive and significant association with L/B ratio
(0.44), L/B ratio of decorticated grain (0.29) and Biological yield (0.28). However
it showed negative but significant association with grain length (-0.42) and Harvest
index (-0.81).
Head rice recovery showed positive and significant association with Leaf :
length of blade (0.28) followed by Time of heading (0.34), Stem thickness (0.31),
Stem length (0.39), Panicle length (0.46), Plant height (0.42), Length of longest
awn (0.32), Time of maturity (0.37), 1000-grain weight (0.29), Grain length (0.34),
Decorticated grain length (0.37), Biological yield (0.41), Grain yield (0.34) and
Milling percent (0.37). However, it showed negative but significant association
with L/B ratio of decorticated grain (-0.45).
106
Length of milled grain possessed positive and significant association with
Leaf : length of blade (0.60) followed by Time of heading (0.60), Stem length
(0.77), Panicle length (0.73), Plant height (0.79), Length of longest awn (0.65),
Time of maturity (0.62), 1000-grain weight (0.92), Grain length (0.98),
Decorticated grain length (0.98), Grain yield (0.52), Harvest index (0.61) and Head
rice recovery (0.39).
Width of milled grain showed positive and significant association with
grain width (0.39), Decorticated grain width (0.63), Grain yield (0.40) and Harvest
index (0.97).
L/B ratio of milled grain showed positive and significant association with
Leaf : length of blade (0.59), Time of heading (0.61), Stem length (0.66), Panicle
length (0.65), Plant height (0.68), Length of longest awn (0.63), Time of maturity
(0.61), 1000-grain weight (0.74), Grain length (0.85), Decorticated grain length
(0.85), Biological yield (0.26), Grain yield (0.32), Head rice recovery (0.43) and
Length of milled grain (0.89). However, it showed negative but significant
association with Width of milled grain.
Length of cooked kernel possessed positive and significant association with
Leaf : length of blade (0.50), Time of heading (0.56), Stem thickness (0.27), Stem
length (0.71), Panicle length (0.66), Plant height (0.73), Length of longest awn
(0.64), Time of maturity (0.58), 1000-grain weight (0.76), Grain length (0.85),
decorticated grain length (0.86), Biological yield (0.32), Grain yield (0.62),
Harvest index (0.54), Head rice recovery (0.45), Length of milled grain (0.84) and
L/B ratio of milled grain (0.73). However, it showed negative but significant
association with Grain L/B ratio (-0.82).
Width of cooked kernel possessed positive and significant association with
Time of heading (0.24), Stem thickness (0.34), Stem length (0.25), Panicle length
(0.24), Plant height (0.26), Length of longest awn (0.42), Time of maturity (0.27),
1000-grain weight (0.36), Grain length (0.35), Decorticated grain length (0.35),
Grain yield (0.39), Harvest index (0.35), Head rice recovery (0.33), Length of
milled grain (0.33), L/B ratio of milled grain (0.33) and Length of cooked kernel
(0.44).
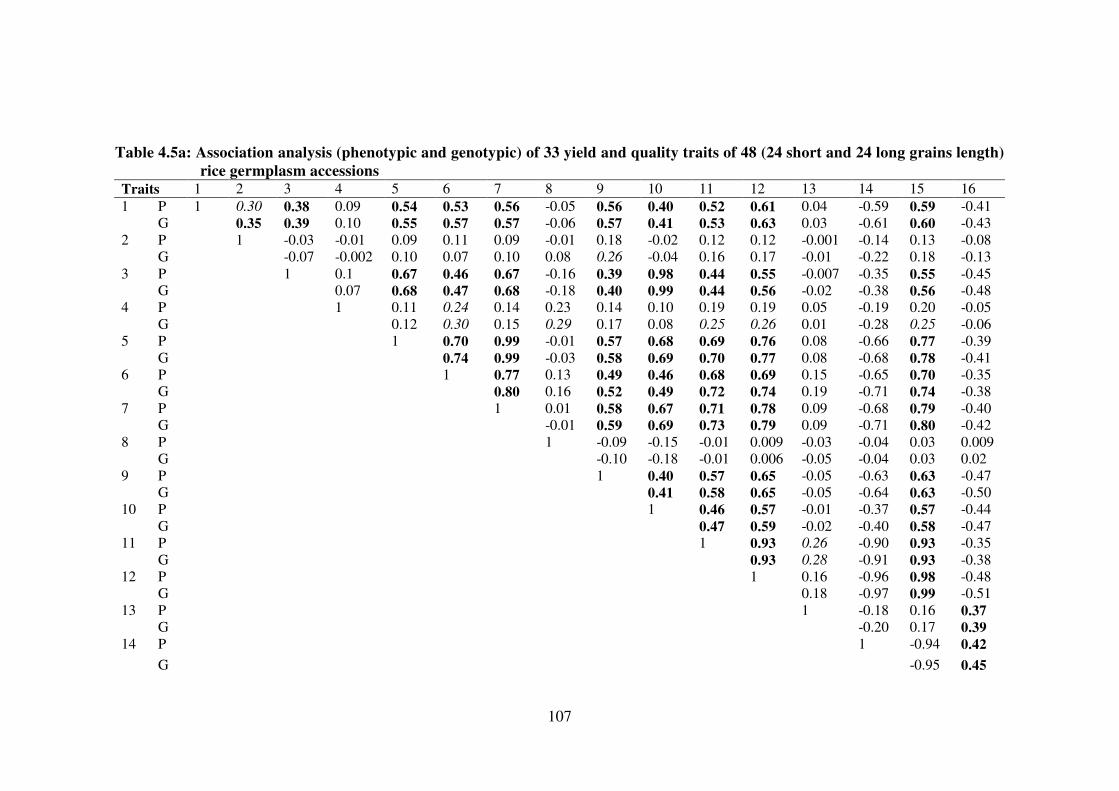
107
Table 4.5a: Association analysis (phenotypic and genotypic) of 33 yield and quality traits of 48 (24 short and 24 long grains length)
rice germplasm accessions
Traits 1 2 3 4 5 6 7 8 9 10 11 12 13 14 15 16
1 P 1 0.30 0.38 0.09 0.54 0.53 0.56 -0.05 0.56 0.40 0.52 0.61 0.04 -0.59 0.59 -0.41
G 0.35 0.39 0.10 0.55 0.57 0.57 -0.06 0.57 0.41 0.53 0.63 0.03 -0.61 0.60 -0.43
2 P 1 -0.03 -0.01 0.09 0.11 0.09 -0.01 0.18 -0.02 0.12 0.12 -0.001 -0.14 0.13 -0.08
G -0.07 -0.002 0.10 0.07 0.10 0.08 0.26 -0.04 0.16 0.17 -0.01 -0.22 0.18 -0.13
3 P 1 0.1 0.67 0.46 0.67 -0.16 0.39 0.98 0.44 0.55 -0.007 -0.35 0.55 -0.45
G 0.07 0.68 0.47 0.68 -0.18 0.40 0.99 0.44 0.56 -0.02 -0.38 0.56 -0.48
4 P 1 0.11 0.24 0.14 0.23 0.14 0.10 0.19 0.19 0.05 -0.19 0.20 -0.05
G 0.12 0.30 0.15 0.29 0.17 0.08 0.25 0.26 0.01 -0.28 0.25 -0.06
5 P 1 0.70 0.99 -0.01 0.57 0.68 0.69 0.76 0.08 -0.66 0.77 -0.39
G 0.74 0.99 -0.03 0.58 0.69 0.70 0.77 0.08 -0.68 0.78 -0.41
6 P 1 0.77 0.13 0.49 0.46 0.68 0.69 0.15 -0.65 0.70 -0.35
G 0.80 0.16 0.52 0.49 0.72 0.74 0.19 -0.71 0.74 -0.38
7 P 1 0.01 0.58 0.67 0.71 0.78 0.09 -0.68 0.79 -0.40
G -0.01 0.59 0.69 0.73 0.79 0.09 -0.71 0.80 -0.42
8 P 1 -0.09 -0.15 -0.01 0.009 -0.03 -0.04 0.03 0.009
G -0.10 -0.18 -0.01 0.006 -0.05 -0.04 0.03 0.02
9 P 1 0.40 0.57 0.65 -0.05 -0.63 0.63 -0.47
G 0.41 0.58 0.65 -0.05 -0.64 0.63 -0.50
10 P 1 0.46 0.57 -0.01 -0.37 0.57 -0.44
G 0.47 0.59 -0.02 -0.40 0.58 -0.47
11 P 1 0.93 0.26 -0.90 0.93 -0.35
G 0.93 0.28 -0.91 0.93 -0.38
12 P 1 0.16 -0.96 0.98 -0.48
G 0.18 -0.97 0.99 -0.51
13 P 1 -0.18 0.16 0.37
G -0.20 0.17 0.39
14 P 1 -0.94 0.42
G -0.95 0.45
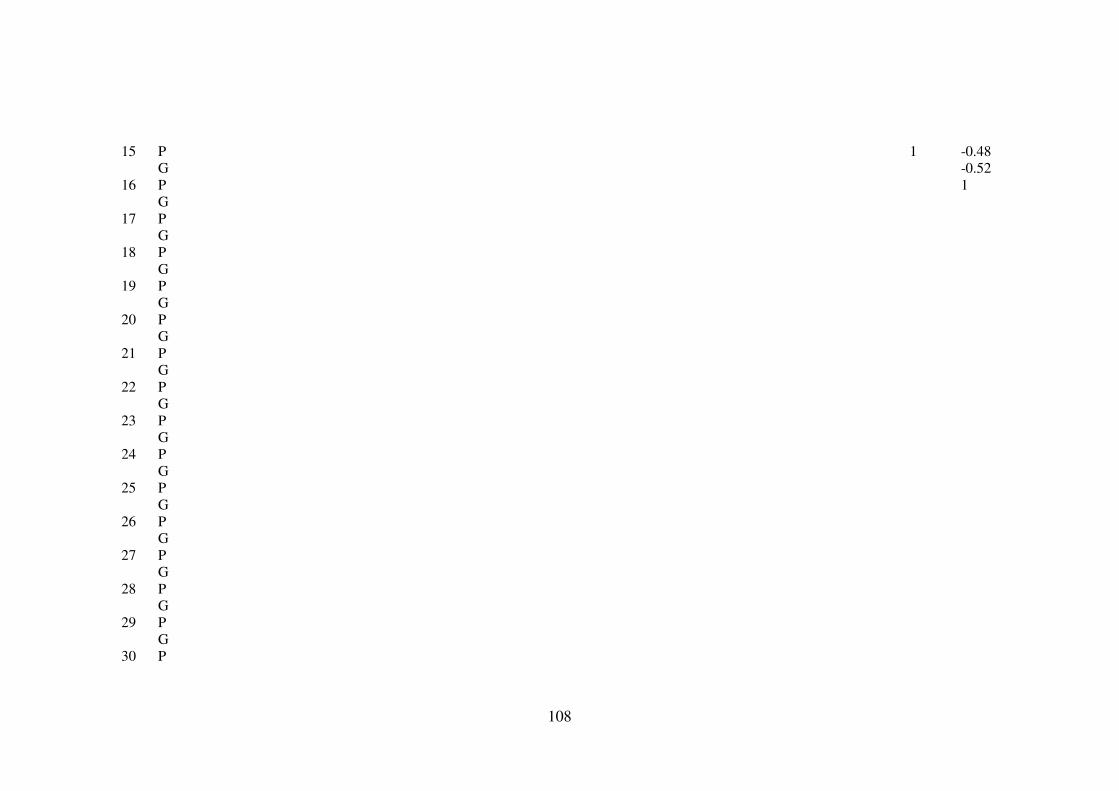
108
15 P 1 -0.48
G -0.52
16 P 1
G
17 P
G
18 P
G
19 P
G
20 P
G
21 P
G
22 P
G
23 P
G
24 P
G
25 P
G
26 P
G
27 P
G
28 P
G
29 P
G
30 P
109
G
31 P
G
32 P
G
33 P
G 1 = Leaf: Length of blade ; 2 = Leaf: Width of blade ; 3 = Time of heading(50% plants with panicle) ; 4 = Stem: Thickness ; 5 = Stem: Length(excluding panicle) ; 6
= Panicle: Length of main axis ; 7 = plant height ; 8 = Panicle: Number per plant (number of tillers) ; 9 = Panicle: Length of longest awn ; 10 = Time Maturity(Days) ;
11 = Grain: Weight of 1000 fully develop grain ; 12 = Grain: Length ; 13 = Grain: Width ; 14 = L/B ratio ; 15 = Decorticated grain: Length ; 16 = Decorticated grain:
Width ; 17 = L/B Ratio of decorticated grain ; 18 = Biological Yield(gm) ; 19 = Grain Yield(gm) ; = 20 Harvest Index ; 21 = Hulling Percent ; 22 = Milling Percent ;
23 = Head Rice Recovery ; 24 = Length of milled grain ; 25 = Width of milled grain ; 26 = L/B ratio of milled grain ; 27 = Length of cooked kernel ; 28 = Width of
cooked kernel ; 29 = L/B ratio of cooked kernel ; 30 = Elongation Ratio ; 31 = Elongation index ; 32 = Endosperm content of Amylose ; 33 = Gel Consistency.
Figures in italics and bold are significant at 5% and 1% probability level, respectively.

110
Table 4.5b: Association analysis (phenotypic and genotypic) of 33 yield and quality traits of 48 (24 short and 24 long grains length)
rice germplasm accessions
Traits 17 18 19 20 21 22 23 24 25 26 27 28 29 30 31 32 33
1 P -0.55 0.04 0.01 -0.01 -0.22 -0.01 0.27 0.59 -0.10 0.56 0.49 0.13 0.47 -0.37 -0.33 -0.03 0.22
G -0.58 0.05 -0.02 -0.05 -0.23 -0.01 0.28 0.60 -0.10 0.59 0.50 0.14 0.49 -0.39 -0.03 -0.04 0.23
2 P -0.09 -0.20 0.03 0.11 -0.05 -0.05 0.03 0.12 0.01 0.11 0.06 0.16 -0.01 -0.16 -0.15 0.02 0.10
G -0.13 -0.2 -0.10 -0.01 -0.07 -0.06 0.052 0.17 0.01 0.15 0.08 0.21 -0.00 -0.24 -0.21 0.03 0.14
3 P -0.56 0.25 0.23 0.07 -0.15 -0.01 0.33 0.58 -0.16 0.58 0.55 0.22 0.49 -0.27 -0.38 -0.05 0.08
G -0.59 0.44 0.40 0.34 -0.15 -0.001 0.34 0.60 -0.19 0.61 0.56 0.24 0.50 -0.29 -0.42 -0.05 0.08
4 P -0.17 0.15 0.31 0.01 0.03 -0.04 0.23 0.17 0.02 0.14 0.20 0.23 0.08 -0.05 -0.15 -0.12 0.09
G -0.27 0.20 0.62 0.19 0.04 -0.04 0.31 0.22 0.08 0.17 0.27 0.34 0.12 -0.04 -0.16 -0.14 0.11
5 P -0.71 0.28 0.20 0.10 -0.22 -0.11 0.39 0.75 0.01 0.64 0.70 0.22 0.64 -0.36 -0.32 0.11 0.18
G -0.75 0.46 0.38 0.51 -0.23 -0.14 0.39 0.77 0.02 0.66 0.71 0.25 0.65 -0.38 -0.35 0.12 0.18
6 P -0.62 0.27 0.20 0.1 -0.15 0.01 0.44 0.69 -0.01 0.58 0.63 0.22 0.56 -0.39 -0.35 -0.02 0.30
G -0.66 0.57 0.43 0.42 -0.17 0.01 0.46 0.73 -0.02 0.65 0.66 0.24 0.61 -0.43 -0.4 -0.02 0.32
7 P -0.72 0.29 0.21 0.10 -0.22 -0.10 0.41 0.77 0.01 0.66 0.72 0.23 0.65 -0.38 -0.34 0.10 0.20
G -0.76 0.49 0.40 0.51 -0.23 -0.12 0.42 0.79 0.01 0.68 0.73 0.26 0.67 -0.40 -0.37 0.10 0.20
8 P -0.01 0.10 0.19 0.20 -0.04 0.05 -0.05 -0.03 -0.01 -0.02 -0.01 0.03 -0.04 0.02 -0.03 0.11 0.32
G -0.01 0.14 0.48 0.96 -0.05 0.04 -0.06 -0.03 -0.05 0.01 -0.01 0.04 -0.04 0.02 -0.07 0.16 0.37
9 P -0.64 0.11 0.14 0.02 -0.26 -0.04 0.32 0.65 -0.10 0.62 0.63 0.40 0.45 -0.30 -0.43 0.09 0.16
G -0.65 0.19 0.33 0.21 -0.26 -0.05 0.32 0.65 -0.1 0.63 0.64 0.42 0.47 -0.31 -0.45 0.09 0.16
10 P -0.57 0.28 0.23 0.05 -0.14 -0.02 0.36 0.60 -0.15 0.59 0.57 0.24 0.50 -0.26 -0.38 -0.03 0.09
G -0.61 0.48 0.37 0.22 -0.14 -0.00 0.37 0.62 -0.16 0.61 0.58 0.27 0.51 -0.29 -0.41 -0.02 0.10
11 P -0.78 0.08 0.24 0.17 -0.35 -0.23 0.29 0.92 0.16 0.73 0.76 0.35 0.64 -0.57 -0.42 0.28 0.27
G -0.79 0.13 0.56 0.96 -0.35 -0.27 0.29 0.92 0.17 0.74 0.76 0.36 0.65 -0.59 -0.44 0.28 0.27
12 P -0.88 0.13 0.21 0.12 -0.42 -0.21 0.34 0.97 0.06 0.83 0.85 0.34 0.74 -0.56 -0.47 0.18 0.26
G -0.90 0.20 0.54 0.61 -0.42 -0.24 0.34 0.98 0.07 0.85 0.85 0.35 0.75 -0.58 -0.49 0.19 0.26
13 P 0.27 -0.15 0.03 0.17 -0.22 -0.34 -0.17 0.10 0.32 -0.09 0.10 0.01 0.11 -0.01 0.12 0.17 0.31
G 0.23 -0.34 -0.03 0.88 -0.24 -0.42 -0.18 0.11 0.39 -0.11 0.11 0.04 0.11 -0.01 0.41 0.21 0.32
14 P 0.83 -0.09 -0.17 -0.1 0.43 0.24 -0.30 -0.93 -0.10 -0.77 -0.81 -0.30 -0.72 0.53 0.40 -0.19 -0.26
111
G 0.86 -0.13 -0.54 -0.55 0.44 0.28 -0.30 -0.94 -0.12 -0.79 -0.82 -0.31 -0.74 0.55 0.42 -0.19 -0.27
15 P -0.89 0.15 0.23 0.13 -0.37 -0.18 0.37 0.97 0.06 0.83 0.86 0.33 0.75 -0.55 -0.46 0.22 0.25
G -0.90 0.23 0.54 0.67 -0.37 -0.20 0.37 0.98 0.06 0.85 0.86 0.35 0.76 -0.56 -0.48 0.23 0.25
16 P 0.59 -0.14 0.01 0.14 0.2 -0.05 -0.36 -0.52 0.61 -0.74 -0.43 -0.16 -0.35 0.36 0.66 0.05 -0.11
G 0.64 -0.27 0.13 0.7 0.21 -0.09 -0.38 -0.56 0.63 -0.77 -0.45 -0.16 -0.39 0.40 0.69 0.07 -0.11
17 P 1 -0.23 -0.21 -0.05 0.28 0.053 -0.44 -0.90 0.05 -0.83 -0.78 -0.28 -0.69 0.54 0.47 -0.13 0.04
G -0.40 -0.58 -0.29 0.29 0.052 -0.45 -0.92 0.07 -0.87 -0.80 -0.29 -0.72 0.56 0.51 -0.13 -0.05
18 P 1 0.16 -0.33 0.17 0.25 0.25 0.15 -0.12 0.18 0.18 -0.03 0.26 -0.04 -0.08 0.06 0.07
G 0.92 -0.26 0.28 0.38 0.41 0.25 -0.14 0.26 0.32 -0.01 0.36 -0.02 -0.10 0.07 0.11
19 P 1 0.48 -0.05 -0.06 0.14 0.22 0.18 0.13 0.27 0.17 0.23 -0.01 -0.00 0.07 0.10
G 0.62 -0.14 0.01 0.34 0.52 0.40 0.32 0.62 0.39 0.52 -0.07 -0.03 0.23 0.26
20 P 1 -0.1 -0.14 -0.03 0.10 0.30 -0.03 0.10 0.08 0.07 -0.04 0.08 0.11 0.07
G -0.81 -0.79 -0.2 0.61 0.97 -0.04 0.54 0.35 0.44 -0.29 0.31 0.73 0.43
21 P 1 0.70 0.11 -0.42 -0.05 -0.36 -0.25 -0.08 -0.22 0.39 0.26 -0.16 -0.25
G 0.81 0.11 -0.42 -0.06 -0.37 -0.25 -0.09 -0.23 0.40 0.28 -0.17 -0.25
22 P 1 0.33 -0.21 -0.16 -0.11 -0.07 0.01 -0.07 0.25 0.08 -0.12 -0.16
G 0.37 -0.25 -0.24 -0.12 -0.08 0.02 -0.09 0.31 0.07 -0.13 -0.18
23 P 1 0.39 -0.15 0.42 0.45 0.31 0.32 -0.10 -0.32 -0.03 0.09
G 0.39 -0.16 0.43 0.45 0.33 0.32 -0.10 -0.34 -0.03 0.09
24 P 1 0.01 0.87 0.84 0.31 0.74 -0.61 -0.51 0.16 0.23
G 0.02 0.89 0.84 0.33 0.76 -0.62 -0.53 0.16 0.24
25 P 1 -0.44 0.05 -0.06 0.11 0.03 0.62 0.28 -0.01
G -0.41 0.06 -0.06 0.21 0.04 0.61 0.32 -0.03
26 P 1 0.72 0.31 0.60 -0.56 -0.74 0.011 0.20
G 0.73 0.33 0.63 -0.58 -0.75 0.01 0.20
27 P 1 0.42 0.84 -0.11 -0.24 0.12 0.17
G 0.44 0.86 -0.12 -0.25 0.13 0.17
28 P 1 -0.11 0.03 -0.49 0.04 0.15
G -0.06 0.02 -0.50 0.03 0.16
29 P 1 -0.15 0.03 0.09 0.09
G -0.16 0.00 0.10 0.09
112
30 P 1 0.61 -0.13 -0.16
G 0.64 -0.1 -0.16
31 P 1 0.041 -0.22
G 0.05 -0.24
32 P 1 0.19
G 0.20
33 P 1
G
1 = Leaf: Length of blade ; 2 = Leaf: Width of blade ; 3 = Time of heading(50% plants with panicle) ; 4 = Stem: Thickness ; 5 = Stem: Length(excluding panicle) ; 6 = Panicle: Length
of main axis ; 7 = plant height ; 8 = Panicle: Number per plant (number of tillers) ; 9 = Panicle: Length of longest awn ; 10 = Time Maturity(Days) ; 11 = Grain: Weight of 1000 fully
develop grain ; 12 = Grain: Length ; 13 = Grain: Width ; 14 = L/B ratio ; 15 = Decorticated grain: Length ; 16 = Decorticated grain: Width ; 17 = L/B Ratio of decorticated grain ; 18 =
Biological Yield(gm) ; 19 = Grain Yield(gm) ; = 20 Harvest Index ; 21 = Hulling Percent ; 22 = Milling Percent ; 23 = Head Rice Recovery ; 24 = Length of milled grain ; 25 = Width of
milled grain ; 26 = L/B ratio of milled grain ; 27 = Length of cooked kernel ; 28 = Width of cooked kernel ; 29 = L/B ratio of cooked kernel ; 30 = Elongation Ratio ; 31 = Elongation
index ; 32 = Endosperm content of Amylose ; 33 = Gel Consistency.
Figures in italics and bold are significant at 5% and 1% probability level, respectively.
113
L/B ratio of cooked kernel showed positive and significant association with
Leaf : length of blade, Time of heading (0.50), Stem length (0.65), Panicle length
(0.61), Plant height (0.67), Length of longest awn (0.47), Time of maturity (0.51),
1000-grain weight (0.65), Grain length (0.75), Decorticated grain length (0.76),
Biological yield (0.36), Grain yield (0.52), Harvest index (0.44), Head rice
recovery (0.32), Length of milled grain (0.76), L/B ratio of milled grain (0.63) and
Length of cooked kernel (0.86).
Elongation ratio showed positive and significant association with Grain L/B
ratio (0.42), decorticated grain width (0.69), L/B ratio of decorticated grain (0.51),
Harvest index (0.31), Hulling percent (0.28), Width of milled grain (0.61) and
Elongation ratio (0.64). Endosperm content of amylose showed positive and
significant association with 1000-grain weight (0.28) followed by Harvest index
(0.73) and Width of milled grain (0.32).
Gel consistency possessed positive and significant association with Panicle
length (0.32), Panicle per plant (0.37), 1000-grain weight (0.27), Grain length
(0.26), Grain width (0.32), Grain yield (0.26), Harvest index (0.43) and
Decorticated grain length (0.25). However it showed negative but significant
association with Grain L/B ratio (0.27).
Grain yield observed high positive and significant correlation with
thousand grain weight. This result is in confirmation with the findings of
Madhvilatha et al. (2005); Muthuswamy and Anadakumar (2006) and Rashid et al.
(2014). However, high positive and significant correlation between grain yield and
biological yield is in agreement with the findings of Girish et al. (2006).
A highly significant and positive correlation of number of panicle per plant
with grain yield is in confirmation with the findings advocated by Madhavilatha et
al. (2005); Muthuswamy and Ananda kumar (2006); Ambili and Radhakrishnan
(2011) and Rashid et al. (2014). Grain length showing significant and positive
correlation with grain yield is in agreement with the findings of Gananasekaran et
al. (2008) while, the same result for correlation between grain yield and grain
breath is in confirmation of the finding of Girish et al. (2006).
114
A significant positive correlation of grain length with grain breath and L/B
ratio are in agreement with the findings of Seraj et al. (2013). Head rice recovery
had significant and positive correlation with milling percent is in confirmation with
the findings of Ekka et al. (2011).
The association between two variables which can be directly observed is
termed as phenotypic correlation and it includes Genotypic and E nvironmental
effects therefore, it differs under environmental conditions.
The inherent or heritable association between two variables is known as
genotypic or genetic correlation. This may be either due to pleotropic action of
genes or due to linkage or both. The main genetic cause of such association is
pleotropy, which refers to manifold effects of a gene (Falconer, 1960). This type of
correlation is more stable and is of paramount importance to bring about genetic
improvement in one character by selecting the other character of a pair that is
genetically correlated.
In the present investigation biological yield, 1000-grain weight, flag leaf
width, grain length, stem length, panicle length, plant height, panicle per plant,
decorticated grain length and time of heading had positive and highly significant
correlation with grain yield per plant. It indicates strong correlation of these traits
with grain yield and selection of these traits will be useful in improving grain yield.
Fig 4.29a: Graph representing signicficant correlation between grain yield
and other traits
0.4
0.62
0.380.43 0.4
0.48
0.37
0.56 0.54
-0.54
0.54
0.92
0.34
0.52
0.40.32
0.62
0.39
0.52
0.26
-0.8
-0.6
-0.4
-0.2
0
0.2
0.4
0.6
0.8
1
Tim
e o
f h
ea
din
g(5
0%
pla
nts
wit
h p
an
icle
)
Ste
m:
Th
ick
ne
ss
Ste
m:
Len
gth
(exc
lud
ing
pa
nic
le)
Pa
nic
le:
Len
gth
of
ma
in a
xis
Pla
nt
he
igh
t
Pa
nic
le:
Nu
mb
er
pe
r p
lan
t
(nu
mb
er
of
tille
rs)
Tim
e M
atu
rity
(D
ay
s)
Gra
in:
We
igh
t o
f 1
00
0 f
ully
de
ve
lop
gra
in
Ga
rin
: Le
ng
th
L/B
ra
tio
De
cort
ica
ted
gra
in:
Len
gth
Bio
log
ica
l Y
ield
(gm
)
He
ad
Ric
e R
eco
ve
ry
Len
gth
of
mill
ed
gra
in
Wid
th o
f m
ille
d g
rain
L/B
ra
tio
of
mill
ed
gra
in
Len
gth
of
coo
ke
d k
ern
el
Wid
th o
f co
ok
ed
ke
rne
l
L/B
ra
tio
of
coo
ke
d k
ern
el
Ge
l Co
nsi
ste
ncy
Genotypic correlation between Grain yield and other traits
115
Fig 4.29b: Graph representing signicficant genotypic correlation between
Head Rice Recovery and other traits
4.3.2 Path coefficient analysis:
The genetic architecture of economic yield must be resolved with the
genetic contribution of all other characters, influencing it directly or indirectly.
Path coefficient analysis is helpful in partitioning the correlation into the measures
of direct and indirect effects. It measures the direct and indirect contribution of
independent variables on depended variable.
The concept of path analysis was originally developed by Wright in 1921,
but was firstly used for plant selection by Dewey and Lu, 1959. Path coefficient
analysis is simply a standardized partial regression coefficient, which splits the
correlation coefficient into direct and indirect effects. The path coefficient analysis
was carried out by using the correlation coefficient between different quantitative
characters to obtain direct and indirect effects of different characters on grain yield
per plant.
Correlation coefficients along with path coefficients together provide more
reliable information, which can be effectively predicted in crop improvement
programme. If the correlation between causal factor and direct effects is more or
less of equal magnitude, it explains the true and perfect relationship between the
0.28
0.34
0.39
0.460.42
0.32
0.37
0.29
0.340.37
-0.38
-0.45
0.370.39
0.430.45
0.33 0.32
-0.6
-0.4
-0.2
0
0.2
0.4
0.6
Lea
f: L
en
gth
of
bla
de
Tim
e o
f h
ea
din
g(5
0%
pla
nts
wit
h
pa
nic
le)
Ste
m:
Len
gth
(exc
lud
ing
pa
nic
le)
Pa
nic
le:
Len
gth
of
ma
in a
xis
Pla
nt
he
igh
t
Pa
nic
le:
Len
gth
of
lon
ge
st a
wn
Tim
e M
atu
rity
(D
ay
s)
Gra
in:
We
igh
t o
f 1
00
0 f
ully
de
ve
lop
gra
in
Ga
rin
: Le
ng
th
De
cort
ica
ted
gra
in:
Len
gth
De
cort
ica
ted
gra
in:
Wid
th
L/B
Ra
tio
of
de
cort
ica
ted
gra
in
Mill
ing
Pe
rce
nt
Len
gth
of
mill
ed
gra
in
L/B
ra
tio
of
mill
ed
gra
in
Len
gth
of
coo
ke
d k
ern
el
Wid
th o
f co
ok
ed
ke
rne
l
L/B
ra
tio
of
coo
ke
d k
ern
el
Genotypic correlation between Head Rice Recovery and
other traits
116
traits and hence, direct selection through these traits will be rewarding. However, if
the correlation coefficient is positive and the direct effects are negative or
negligible the indirect causal factors are to be considered in simultaneous selection.
To measure the direct and indirect effects, Lenka and Mishra (1973) used
the following scale in rice. The same scale given below is used in the present
investigation also.
Value of direct and indirect effect Rate of scale
0.00 to 0.09 Negligible
0.10 to 0.19 Low
0.20 to 0.29 Moderate
0.30 to 0.99 High
> 1.00 Very high
Direct effect of components on grain yield:
The correlation coefficients between grain yield and other yield attributing
characters were partitioned into direct and indirect effects and are presented in
Table 4.6a and 4.6b. Path coefficient study was carried out by considering the
grain yield as the dependent variable and rest of the characters as the independent
variables.
Based on direct and indirect effect recorded for the traits under present
investigation, it was observed that the high positive direct effect on grain yield was
exhibited by L/B ratio of cooked kernel (42.61) followed by Width of cooked
kernel (34.41), Time of maturity (29.13), Length of milled grain (21.79),
Elongation index (18.91), Plant height (11.05), L/B ratio of decorticated grain
(4.21), Milling percent (3.34), Panicle : number per plant (3.32), Stem thickness
(1.77), gel consistency (1.56), Decorticated grain length (1.47), Endosperm content
of amylase (1.20) and Grain width (0.88). The moderate magnitude of direct effect
on grain yield was recorded by biological yield (gm) (0.21).
As far as indirect effects in concerned, Leaf : length of blade recorded very
high positive indirect effect via Plant height (6.36), Time of maturity (12.17), L/B
ratio of grain (16.53), Decorticated grain width (1.77), Length of milled grain
(13.21), Width of cooked kernel (4.90), L/B ratio of cooked kernel (21.12),
117
Elongation ratio (11.13), Time of heading had high positive indirect effect via
Plant height (7.53), Time of maturity (28.89), L/B ratio of grain (10.13),
Decorticated grain width (2.00), Width of milled grain (3.69), Length of milled
grain (13.12), Width of cooked kernel (8.35), L/B ratio of cooked kernel (21.57)
and Elongation ratio (8.34).
Panicle length had high positive indirect effect via Plant height (8.87),
Time of maturity (14.33), L/B ratio of grain ( 19.16), Decorticated grain length
(1.10), Decorticated grain width (1.56), Length of milled grain (15.99), Width of
cooked kernel (8.40), L/B ratio of cooked kernel (26.02) and Elongation ratio
(12.18).
Plant height had high positive indirect effect via Endosperm content of
amylase (0.32) and had very high positive indirect effect via Time of maturity
(20.11) followed by L/B ratio of grain (18.99), Decorticated grain length (1.18),
Decorticated grain width (1.75), Length of milled grain (17.26), Width of cooked
kernel (9.09), L/B ratio of cooked kernel (28.53) and Elongation ratio (11.45).
Number of panicle per plant (number of tillers) had high positive indirect
effect via Stem thickness (0.52) and Gel consistency (0.58) and had very high
positive indirect effect via Time of heading (4.35), L/B ratio of grain (1.17), Width
of milled grain (1.07) and Width of cooked kernel (1.52).
118
Table 4.6a: Direct and indirect effects of 33 yield and quality traits of 48 (24 short and 24 long grains length) rice germplasm
accessions
Traits 1 2 3 4 5 6 7 8 9 10 11 12 13 14 15 16
1 P -0.17 0.00 0.02 0.02 -0.40 -0.05 0.44 0.00 0.04 -0.09 -0.02 0.50 0.01 -0.44 -0.39 0.07
G -0.95 -1.84 -9.31 0.18 -1.39 -2.00 6.36 -0.21 0.12 12.17 -0.73 -37.50 0.03 16.53 0.89 1.77
2 P -0.05 0.03 0.00 0.00 -0.07 -0.01 0.08 0.00 0.01 0.00 0.00 0.10 0.00 -0.11 -0.09 0.01
G -0.34 -5.19 1.66 0.00 -0.27 -0.27 1.19 0.27 0.06 -1.40 -0.22 -10.59 -0.01 6.04 0.26 0.54
3 P -0.07 0.00 0.06 0.02 -0.50 -0.05 0.53 -0.01 0.03 -0.23 -0.01 0.45 0.00 -0.27 -0.36 0.08
G -0.37 0.36 -23.70 0.13 -1.72 -1.65 7.53 -0.61 0.09 28.89 -0.60 -33.60 -0.02 10.13 0.83 2.00
4 P -0.02 0.00 0.01 0.24 -0.09 -0.02 0.11 0.01 0.01 -0.02 -0.01 0.16 0.01 -0.14 -0.13 0.01
G -0.10 0.01 -1.72 1.77 -0.31 -1.04 1.67 0.97 0.04 2.48 -0.35 -15.34 0.01 7.55 0.38 0.27
5 P -0.09 0.00 0.04 0.03 -0.74 -0.07 0.78 0.00 0.05 -0.16 -0.02 0.61 0.02 -0.50 -0.51 0.07
G -0.53 -0.56 -16.33 0.22 -2.50 -2.57 11.01 -0.10 0.12 20.30 -0.95 -45.75 0.07 18.31 1.15 1.71
6 P -0.09 0.00 0.03 0.06 -0.52 -0.10 0.61 0.01 0.04 -0.11 -0.02 0.56 0.03 -0.49 -0.46 0.06
G -0.55 -0.41 -11.28 0.53 -1.86 -3.46 8.87 0.53 0.11 14.33 -0.98 -44.06 0.17 19.16 1.10 1.56
7 P -0.10 0.00 0.04 0.03 -0.74 -0.08 0.79 0.00 0.05 -0.16 -0.02 0.63 0.02 -0.52 -0.52 0.07
G -0.55 -0.56 -16.14 0.27 -2.49 -2.77 11.05 -0.02 0.13 20.11 -0.99 -46.92 0.09 18.99 1.18 1.75
8 P 0.01 0.00 -0.01 0.06 0.01 -0.01 0.00 0.04 -0.01 0.04 0.00 0.01 -0.01 -0.03 -0.02 0.00
G 0.06 -0.42 4.35 0.52 0.08 -0.55 -0.06 3.32 -0.02 -5.47 0.02 -0.37 -0.05 1.17 0.05 -0.11
9 P -0.10 0.01 0.02 0.04 -0.43 -0.05 0.46 0.00 0.08 -0.09 -0.02 0.52 -0.01 -0.47 -0.41 0.08
G -0.55 -1.38 -9.64 0.31 -1.47 -1.82 6.60 -0.34 0.21 12.10 -0.79 -38.65 -0.05 17.14 0.94 2.06
10 P -0.07 0.00 0.06 0.02 -0.50 -0.05 0.53 -0.01 0.03 -0.23 -0.02 0.46 0.00 -0.28 -0.38 0.08
G -0.40 0.25 -23.51 0.15 -1.74 -1.70 7.63 -0.62 0.09 29.13 -0.64 -34.84 -0.02 10.75 0.86 1.95
11 P -0.09 0.00 0.03 0.05 -0.51 -0.07 0.56 0.00 0.05 -0.11 -0.03 0.75 0.06 -0.68 -0.61 0.06
G -0.51 -0.86 -10.59 0.46 -1.76 -2.50 8.06 -0.05 0.12 13.75 -1.35 -55.17 0.25 24.45 1.37 1.57
12 P -0.11 0.00 0.03 0.05 -0.56 -0.07 0.61 0.00 0.05 -0.13 -0.03 0.81 0.03 -0.73 -0.65 0.08
G -0.60 -0.93 -13.50 0.46 -1.94 -2.58 8.79 0.02 0.14 17.19 -1.26 -59.01 0.16 25.94 1.45 2.13
13 P -0.01 0.00 0.00 0.01 -0.06 -0.02 0.08 0.00 0.00 0.00 -0.01 0.14 0.21 -0.14 -0.11 -0.06
G -0.03 0.07 0.47 0.02 -0.20 -0.67 1.08 -0.17 -0.01 -0.71 -0.38 -10.65 0.88 5.44 0.25 -1.62
14 P 0.10 0.00 -0.02 -0.05 0.49 0.07 -0.54 0.00 -0.05 0.09 0.03 -0.78 -0.04 0.75 0.62 -0.07
119
G 0.59 1.17 8.99 -0.50 1.71 2.48 -7.86 -0.15 -0.14 -11.73 1.24 57.34 -0.18 -26.70 -1.41 -1.87
15 P -0.10 0.00 0.03 0.05 -0.57 -0.07 0.62 0.00 0.02 -0.13 -0.03 0.79 0.03 -0.71 -0.65 0.08
G -0.57 -0.93 -13.45 0.46 -1.96 -2.59 8.90 0.12 0.13 17.07 -1.27 -58.48 0.15 25.59 1.47 2.14
16 P 0.07 0.00 -0.03 -0.01 0.29 0.04 -0.32 0.00 -0.04 0.10 0.01 -0.39 0.08 0.32 0.32 -0.17
G 0.41 0.68 11.51 -0.12 1.04 1.31 -4.68 0.09 -0.11 -13.80 0.51 30.52 0.35 -12.15 -0.76 -4.12
17 P 0.10 0.00 -0.03 -0.04 0.53 0.06 -0.57 0.00 -0.05 0.13 0.03 -0.71 0.06 0.63 0.58 -0.10
G 0.55 0.68 13.97 -0.48 1.87 2.31 -8.43 -0.04 -0.14 -17.76 1.08 53.21 0.21 -22.99 -1.33 -2.64
18 P -0.01 -0.01 0.02 0.04 -0.21 -0.03 0.23 0.00 0.01 -0.07 0.00 0.11 -0.03 -0.07 -0.10 0.03
G -0.05 1.04 -10.52 0.37 -1.15 -1.97 5.42 0.49 0.04 14.17 -0.18 -12.10 -0.31 3.02 0.34 1.15
20 P 0.00 0.00 0.00 0.00 -0.08 -0.01 0.08 0.01 0.00 -0.01 -0.01 0.09 0.04 -0.07 -0.09 -0.03
G 0.05 0.08 -8.21 0.34 -1.29 -1.45 5.74 3.21 0.04 6.68 -1.31 -36.26 0.78 14.74 0.98 -3.25
21 P 0.04 0.00 -0.01 0.01 0.17 0.02 -0.18 0.00 -0.02 0.03 0.01 -0.34 -0.05 0.33 0.25 -0.03
G 0.22 0.40 3.66 0.07 0.59 0.60 -2.60 -0.17 -0.06 -4.35 0.48 24.97 -0.22 -11.89 -0.55 -0.88
22 P 0.00 0.00 0.00 -0.01 0.09 0.00 -0.08 0.00 0.00 0.00 0.01 -0.17 -0.07 0.18 0.12 0.01
G 0.01 0.33 0.03 -0.07 0.36 -0.06 -1.38 0.13 -0.01 -0.19 0.37 14.67 -0.76 -7.66 -0.30 0.37
23 P -0.05 0.00 0.02 0.06 -0.29 -0.04 0.33 0.00 0.03 -0.08 -0.01 0.28 -0.04 -0.23 -0.25 0.06
G -0.27 -0.27 -8.17 0.56 -1.00 -1.62 4.65 -0.21 0.07 10.81 -0.40 -20.60 -0.16 8.20 0.55 1.58
24 P -0.10 0.00 0.04 0.04 -0.56 -0.07 0.61 0.00 0.05 -0.14 -0.03 0.79 0.02 -0.70 -0.64 0.09
G -0.58 -0.90 -14.27 0.40 -1.93 -2.54 8.76 -0.12 0.14 18.05 -1.25 -58.06 0.10 25.26 1.44 2.33
25 P 0.02 0.00 -0.01 0.01 -0.01 0.00 0.01 0.00 -0.01 0.04 -0.01 0.05 0.07 -0.08 -0.04 -0.11
G 0.10 -0.05 4.53 0.15 -0.06 0.09 0.20 -0.18 -0.02 -4.83 -0.24 -4.13 0.34 3.29 0.10 -2.61
26 P -0.10 0.00 0.04 0.03 -0.48 -0.06 0.52 0.00 0.05 -0.14 -0.02 0.67 -0.02 -0.58 -0.54 0.13
G -0.56 -0.80 -14.56 0.31 -1.67 -2.26 7.60 0.01 0.13 17.99 -1.01 -50.20 -0.10 21.32 1.25 3.20
27 P -0.09 0.00 0.03 0.05 -0.52 -0.06 0.57 0.00 0.05 -0.13 -0.03 0.69 0.02 -0.61 -0.56 0.07
G -0.48 -0.46 -13.31 0.49 -1.79 -2.31 8.11 -0.03 0.14 17.10 -1.04 -50.57 0.10 22.06 1.27 1.88
28 P -0.02 0.01 0.01 0.06 -0.17 -0.02 0.19 0.00 0.03 -0.06 -0.01 0.27 0.00 -0.23 -0.22 0.03
G -0.14 -1.09 -5.75 0.62 -0.64 -0.84 2.92 0.15 0.09 7.87 -0.50 -21.10 0.04 8.51 0.52 0.69
29 P -0.08 0.00 0.03 0.02 -0.47 -0.06 0.51 0.00 0.04 -0.12 -0.02 0.60 0.02 -0.54 -0.49 0.06
G -0.47 0.01 -12.00 0.21 -1.64 -2.11 7.40 -0.16 0.10 15.10 -0.88 -44.72 0.10 19.85 1.12 1.61
30 P 0.06 -0.01 -0.02 -0.01 0.27 0.04 -0.30 0.00 -0.02 0.06 0.02 -0.46 0.00 0.40 0.36 -0.06
G 0.37 1.26 7.01 -0.07 0.97 1.49 -4.49 0.08 -0.07 -8.45 0.80 34.29 0.00 -14.83 -0.83 -1.66
120
31 P 0.06 0.00 -0.02 -0.04 0.24 0.04 -0.27 0.00 -0.03 0.09 0.01 -0.38 0.03 0.30 0.30 -0.11
G 0.34 1.10 10.03 -0.28 0.90 1.38 -4.15 -0.23 0.09535 -12.12 0.61 29.17 0.12 -11.37 -0.71 -2.87
32 P 0.01 0.00 0.00 -0.03 -0.09 0.00 0.08 0.00 0.01 0.01 -0.01 0.15 0.04 -0.15 -0.15 -0.01
G 0.04 -0.18 1.20 -0.27 -0.30 0.09 1.14 0.53 0.02 -7.20 -0.39 -11.28 0.19 5.31 0.34 -0.29
33 P -0.04 0.00 0.01 0.02 -0.13 -0.03 0.16 0.01 0.03 -0.02 -0.01 0.21 0.06 -0.20 -0.17 0.02
G -0.22 -0.77 -2.05 0.21 -0.46 -1.12 2.30 1.23 0.04 2.95 -0.38 -15.77 0.29 7.24 0.38 0.46
1 = Leaf: Length of blade ; 2 = Leaf: Width of blade ; 3 = Time of heading(50% plants with panicle) ; 4 = Stem: Thickness ; 5 = Stem: Length(excluding panicle) ; 6
= Panicle: Length of main axis ; 7 = plant height ; 8 = Panicle: Number per plant (number of tillers) ; 9 = Panicle: Length of longest awn ; 10 = Time Maturity(Days) ;
11 = Grain: Weight of 1000 fully develop grain ; 12 = Grain: Length ; 13 = Grain: Width ; 14 = L/B ratio ; 15 = Decorticated grain: Length ; 16 = Decorticated grain:
Width ; 17 = L/B Ratio of decorticated grain ; 18 = Biological Yield(gm) ; 19 = Grain Yield(gm) ; = 20 Harvest Index ; 21 = Hulling Percent ; 22 = Milling Percent ;
23 = Head Rice Recovery ; 24 = Length of milled grain ; 25 = Width of milled grain ; 26 = L/B ratio of milled grain ; 27 = Length of cooked kernel ; 28 = Width of
cooked kernel ; 29 = L/B ratio of cooked kernel ; 30 = Elongation Ratio ; 31 = Elongation index ; 32 = Endosperm content of Amylose ; 33 = Gel Consistency.
121
Table 4.6b: Direct and indirect effects of 33 yield and quality traits of 48 (24 short and 24 long grains length) rice germplasm
accessions
Traits 17 18 19 20 21 22 23 24 25 26 27 28 29 30 31 32
1 P 0.29 0.01 -0.01 -0.04 0.00 -0.02 -0.86 -0.09 0.78 -1.64 0.25 1.69 -0.04 0.11 0.00 0.03
G -2.46 -0.30 0.01 -0.02 -0.04 -0.09 13.21 0.02 -14.27 -12.23 4.90 21.12 11.13 -6.69 -0.05 0.36
2 P 0.05 -0.05 0.05 -0.01 0.01 0.00 -0.18 0.01 0.15 -0.21 0.30 -0.03 -0.02 0.05 0.00 0.01
G -0.56 1.05 0.00 -0.01 -0.21 -0.02 3.79 -0.17 -3.72 -2.15 7.24 -0.05 6.85 -4.02 0.04 0.23
3 P 0.30 0.06 0.03 -0.03 0.00 -0.02 -0.86 -0.15 0.81 -1.84 0.41 1.74 -0.03 0.13 0.00 0.01
G -2.48 -2.34 -0.07 -0.01 0.00 -1.05 13.12 3.69 -14.83 -13.63 8.35 21.57 8.34 -8.00 -0.06 0.13
4 P 0.09 0.04 0.01 0.01 0.01 -0.01 -0.26 0.03 0.19 -0.68 0.44 0.29 -0.01 0.05 -0.01 0.01
G -1.15 -1.10 -0.04 0.00 -0.14 -0.97 4.94 -1.61 -4.20 -6.71 12.02 5.10 1.19 -3.03 -0.18 0.18
5 P 0.38 0.07 0.05 -0.04 0.02 -0.02 -1.10 0.02 0.89 -2.36 0.42 2.27 -0.04 0.11 0.01 0.02
G -3.16 -2.43 -0.10 -0.02 -0.48 -1.22 16.86 -0.48 -16.16 -17.44 8.88 27.94 10.94 -6.78 0.14 0.29
6 P 0.33 0.07 0.05 -0.03 0.00 -0.03 -1.01 -0.01 0.81 -2.10 0.42 1.99 -0.04 0.12 0.00 0.03
G -2.82 -3.00 -0.08 -0.02 0.06 -1.43 15.99 0.49 -15.79 -16.24 8.40 26.02 12.18 -7.57 -0.03 0.51
7 P 0.39 0.07 0.05 -0.04 0.02 -0.02 -1.13 0.01 0.91 -2.41 0.44 2.31 -0.04 0.12 0.01 0.02
G -3.21 -2.58 -0.10 -0.02 -0.42 -1.28 17.26 -0.36 -16.61 -17.81 9.09 28.53 11.45 -7.09 0.12 0.32
8 P 0.00 0.03 0.10 -0.01 -0.01 0.00 0.05 -0.01 -0.04 0.03 0.07 -0.14 0.00 0.01 0.01 0.04
G -0.05 -0.78 -0.19 0.00 0.13 0.20 -0.80 1.07 -0.05 0.22 1.52 -2.09 -0.66 -1.32 0.19 0.58
9 P 0.34 0.03 0.01 -0.05 0.01 -0.02 -0.95 -0.09 0.86 -2.14 0.75 1.62 -0.03 0.15 0.01 0.02
G -2.77 -1.03 -0.04 -0.02 -0.20 -0.99 14.24 2.04 -15.33 -15.65 14.77 20.01 8.82 -8.56 0.12 0.26
10 P 0.31 0.07 0.02 -0.03 0.00 -0.02 -0.88 -0.14 0.82 -1.93 0.45 1.79 -0.03 0.13 0.00 0.01
G -2.57 -2.56 -0.05 -0.01 -0.02 -1.13 13.51 3.21 -14.92 -14.25 9.29 22.10 8.18 -7.87 -0.03 0.16
11 P 0.42 0.02 0.08 -0.06 0.04 -0.02 -1.34 0.15 1.01 -2.55 0.65 2.26 -0.06 0.14 0.02 0.03
G -3.37 -0.69 -0.19 -0.03 -0.90 -0.90 20.11 -3.44 -18.05 -18.59 12.66 27.80 16.64 -8.48 0.35 0.44
12 P 0.47 0.03 0.05 -0.08 0.04 -0.02 -1.43 0.05 1.15 -2.85 0.63 2.62 -0.06 0.16 0.01 0.03
G -3.80 -1.08 -0.12 -0.04 -0.83 -1.06 21.44 -1.35 -20.55 -20.80 12.30 32.29 16.39 -9.35 0.23 0.42
13 P -0.14 -0.04 0.08 -0.04 0.06 0.01 -0.15 0.29 -0.13 -0.35 0.04 0.39 0.00 -0.04 0.01 0.03
G 0.98 1.84 -0.18 -0.02 -1.42 0.56 2.45 -7.53 2.65 -2.78 1.43 4.69 0.11 2.67 0.25 0.51
122
14 P -0.44 -0.02 -0.05 0.08 -0.04 0.02 1.36 -0.09 -1.07 2.73 -0.56 -2.55 0.05 -0.14 -0.02 -0.03
G 3.63 0.60 0.11 0.04 0.96 0.94 -20.62 2.38 19.29 20.06 -10.97 -31.68 -15.67 8.06 -0.24 -0.42
15 P 0.47 0.04 0.06 -0.07 0.03 -0.02 -1.43 0.06 1.14 -2.88 0.62 2.65 -0.06 0.16 0.02 0.03
G -3.83 -1.23 -0.13 -0.03 -0.69 -1.15 21.42 -1.32 -20.52 -21.02 12.17 32.66 15.94 -9.17 0.28 0.40
16 P -0.32 -0.04 0.07 0.04 0.01 0.02 0.77 0.54 -1.02 1.44 -0.30 -1.27 0.04 -0.22 0.00 -0.01
G 2.70 1.47 -0.16 0.02 -0.30 1.17 -12.32 -12.23 18.77 11.05 -5.80 -16.66 -11.35 13.16 0.08 -0.17
17 P -0.53 -0.06 -0.02 0.05 -0.01 0.03 1.32 0.05 -1.15 2.62 -0.52 -2.46 0.05 -0.16 -0.01 -0.01
G 4.21 2.13 0.06 0.03 0.17 1.38 -20.09 -1.40 21.09 19.43 -10.08 -31.04 -16.04 9.68 -0.16 -0.08
18 P 0.13 0.24 -0.16 0.03 -0.04 -0.02 -0.22 -1.11 0.25 -0.61 -0.07 0.80 0.00 0.03 0.01 0.01
G -1.70 -5.26 0.05 0.03 1.30 -1.27 5.45 2.88 -6.42 -7.80 -0.15 15.45 0.64 -2.00 0.09 0.17
20 P 0.03 -0.08 0.47 -0.03 0.03 0.00 -0.16 0.27 -0.05 -0.36 0.16 0.27 0.00 -0.03 0.01 0.01
G -1.26 1.41 -0.20 -0.08 -2.65 0.61 13.48 -26.48 1.11 -13.21 12.14 19.13 8.27 5.93 0.89 0.68
21 P -0.52 0.04 -0.07 0.18 -0.12 -0.01 0.62 -0.05 -0.50 0.84 -0.16 -0.81 0.04 -0.09 -0.01 -0.03
G 1.23 -1.52 0.16 0.09 2.72 -0.34 -9.30 1.25 8.96 6.13 -3.25 -9.85 -11.46 5.37 -0.22 -0.40
22 P -0.03 0.06 -0.07 0.13 -0.17 -0.02 0.31 -0.15 -0.16 0.25 0.01 -0.27 0.03 -0.03 -0.01 -0.02
G 0.22 -2.04 0.16 0.08 3.34 -1.15 -5.47 4.67 2.99 2.09 0.90 -4.19 -8.84 1.50 -0.16 -0.29
23 P 0.24 0.06 -0.02 0.02 -0.06 -0.06 -0.57 -0.14 0.58 -1.52 0.58 1.14 -0.01 0.11 0.00 0.01
G -1.91 -2.19 0.04 0.01 1.27 -1.15 8.58 3.19 -10.38 -11.06 11.48 13.92 3.05 -6.45 -0.04 0.15
24 P 0.48 0.04 0.05 -0.08 0.04 -0.02 -1.46 0.02 1.21 -2.82 0.51 2.64 -0.06 0.17 0.01 0.03
G -3.88 -1.32 -0.12 -0.04 -0.84 -1.20 21.79 -0.38 -21.59 -20.62 11.35 32.60 17.49 -10.11 0.20 0.37
25 P -0.03 -0.03 0.14 -0.01 0.03 0.01 -0.03 0.89 -0.61 -0.18 -0.11 0.39 0.00 -0.21 0.02 0.00
G 0.30 0.78 -0.27 -0.01 -0.81 0.50 0.43 -19.32 10.11 -1.56 -2.18 5.14 -1.34 11.55 0.39 0.00
26 P 0.44 0.04 -0.02 -0.07 0.02 -0.03 -1.28 -0.40 1.38 -2.40 0.59 2.12 -0.06 0.25 0.00 0.02
G -3.68 -1.40 0.01 -0.03 -0.41 -1.31 19.48 8.09 -24.15 -17.84 11.51 26.86 16.48 -14.24 0.01 0.32
27 P 0.42 0.04 0.05 -0.05 0.01 -0.03 -1.23 0.05 0.99 -3.34 0.78 2.99 -0.01 0.08 0.01 0.02
G -3.37 -1.69 -0.11 -0.02 -0.29 -1.39 18.51 -1.24 -17.75 -24.28 15.18 36.67 3.64 -4.83 0.16 0.28
28 P 0.15 -0.01 0.04 -0.02 0.00 -0.02 -0.46 -0.05 0.44 -1.41 1.85 -0.41 0.00 0.17 0.00 0.02
G -1.23 0.02 -0.07 -0.01 0.09 -1.02 7.19 1.22 -8.08 -10.71 34.41 -2.93 -0.65 -9.49 0.05 0.26
29 P 0.37 0.05 0.04 -0.04 0.01 -0.02 -1.09 0.10 0.83 -2.83 -0.21 3.53 -0.02 -0.01 0.01 0.01
G -3.07 -1.91 -0.09 -0.02 -0.33 -0.99 16.67 -2.33 -15.22 -20.90 -2.36 42.61 4.67 0.01 0.12 0.15
30 P -0.29 -0.01 -0.02 0.07 -0.04 0.01 0.90 0.03 -0.78 0.39 0.06 -0.54 0.10 -0.21 -0.01 -0.02
123
1 = Leaf: Length of blade ; 2 = Leaf: Width of blade ; 3 = Time of heading(50% plants with panicle) ; 4 = Stem: Thickness ; 5 = Stem: Length(excluding panicle) ; 6 = Panicle: Length
of main axis ; 7 = plant height ; 8 = Panicle: Number per plant (number of tillers) ; 9 = Panicle: Length of longest awn ; 10 = Time Maturity(Days) ; 11 = Grain: Weight of 1000 fully
develop grain ; 12 = Grain: Length ; 13 = Grain: Width ; 14 = L/B ratio ; 15 = Decorticated grain: Length ; 16 = Decorticated grain: Width ; 17 = L/B Ratio of decorticated grain ; 18 =
Biological Yield(gm) ; 19 = Grain Yield(gm) ; = 20 Harvest Index ; 21 = Hulling Percent ; 22 = Milling Percent ; 23 = Head Rice Recovery ; 24 = Length of milled grain ; 25 = Width of
milled grain ; 26 = L/B ratio of milled grain ; 27 = Length of cooked kernel ; 28 = Width of cooked kernel ; 29 = L/B ratio of cooked kernel ; 30 = Elongation Ratio ; 31 = Elongation
index ; 32 = Endosperm content of Amylose ; 33 = Gel Consistency.
Residual value: P= 0.436, G= 0.354
G 2.40 0.12 0.06 0.04 1.05 0.33 -13.51 -0.92 14.11 3.13 0.79 -7.05 -28.20 12.16 -0.16 -0.26
31 P -0.25 -0.02 0.04 0.05 -0.02 0.02 0.75 0.55 -1.03 0.81 -0.92 0.11 0.06 -0.34 0.00 -0.03
G 2.16 0.56 -0.06 0.03 0.27 1.04 -11.65 -11.80 18.19 6.19 -17.26 0.03 -18.13 18.91 0.06 -0.37
32 P 0.07 0.02 0.06 -0.03 0.02 0.00 -0.24 0.25 0.02 -0.42 0.08 0.32 -0.01 -0.01 0.08 0.02
G -0.57 -0.38 -0.15 -0.02 -0.46 0.10 3.69 -6.20 -0.13 -3.15 1.31 4.34 3.87 0.99 1.20 0.32
33 P 0.02 0.02 0.04 -0.05 0.03 -0.01 -0.35 -0.01 0.28 -0.59 0.29 0.33 -0.02 0.08 0.02 0.11
G -0.21 -0.58 -0.09 -0.02 -0.63 -0.29 5.24 0.06 -4.96 -4.30 5.71 3.98 4.75 -4.53 0.24 1.56
124
Time of maturity had high positive indirect effect via Decorticated grain
length (0.86) and had very high positive indirect effect via Plant height (7.63), L/B
ratio of grain (10.75), Decorticated grain width (1.95), Width of milled grain
(3.21), Length of milled grain (13.51), Width of cooked kernel (9.23), L/B ratio of
cooked kernel (22.10) and Elongation ratio (8.18).
1000-grain weight had moderate positive indirect effect via Grain width
(0.25) and had high positive indirect effect via Stem thickness (0.46), Amylose
content (0.35) and Gel consistency (0.44) and it had very high positive indirect
effect via Plant height (8.06), Time of maturity (13.75), Grain L/B ratio (24.45),
Decorticated grain length (1.37), Decorticated grain width (1.57), Length of milled
grain (20.11), Width of cooked kernel (12.66), L/B ratio of cooked kernel (27.80)
and Elongation ratio (16.64).
Grain length had moderate positive indirect effect via Amylose content
(0.23), it had high positive indirect effect via Gel consistency (0.42), Stem
thickness (0.46), it also had very high positive indirect effect via Plant height 8.79),
Time of maturity (17.19), Grain L/B ratio (25.94), Decorticated grain length (1.45),
Decorticated grain width (2.13), Length of milled grain (21.44), Width of cooked
kernel (12.30), L/B ratio of cooked kernel (32.29) and Elongation ratio (16.39).
Grain width has moderate positive indirect effect via Content of amylose
(0.25), it had high positive indirect effect via Time of heading (0.47), L/B ratio of
decorticated grain (0.98), Head rice recovery (0.56) and Gel consistency (0.51). It
also had very high positive indirect effect via Plant height (1.08), L/B ratio of grain
(5.44), Biological yield (1.84), Length of milled grain (2.45), L/B ratio of milled
grain (2.65), L/B ratio of cooked kernel (4.69) and Elongation index (2.67).
Grain L/B ratio had high positive indirect effect via Leaf : length of blade
(0.59), Biological yield (0.60), Head rice recovery (0.94), Milling per cent (0.96),
it had very high positive indirect effect via Width of Lead blade (1.17), Time of
heading (8.99), Panicle length (2.48), 1000-grain weight (1.24), Grain length
(57.34), L/B ratio of decorticated grain (8.63), Width of milled grain (2.38), L/B
125
ratio of milled grain (19.28), Length of cooked kernel (20.06) and Elongation
index (8.06).
Decorticated grain length had moderate positive indirect effect via Amylose
content of Endosperm (0.28) and had very high positive indirect effect via Plant
height (8.90), Time of maturity (17.07), Grain L/B ratio (25.59), Decorticated grain
width (2.14), Length of milled grain (21.42), Width of cooked kernel (12.17), L/B
ratio of cooked kernel (32.66) and Elongation ratio (15.94).
Decorticated grain width had high positive indirect effect via Leaf : length
of blade ( (0.41), Leaf : Width of blade (0.68), 1000-grain weight (0.51), Grain
width (0.35) and it had very high positive indirect effect via Time of heading
(11.57), Stem length (0.04), Panicle length (1.31), Grain length (30.52), L/B ratio
of decorticated grain (2.70), Biological yield (1.47), Head rice recovery (1.17), L/B
ratio of milled grain (18.77), Length of cooked kernel (11.05) and Elongation
index (13.16).
L/B ratio of decorticated grain had moderate positive indirect effect via
Grain width (0.21), had high positive indirect effect via Leaf : length of blade
(0.55), Leaf width of blade (0.68), it also had very high positive indirect effect via
Time of heading (13.97), Stem length (1.87), Panicle length (2.31), 1000-grain
weight (1.08), Grain length (53.21), Biological yield (2.13), Head rice recovery
(1.38), L/B ratio of milled grain (21.09), Length of cooked kernel (19.43) and
Elongation index (9.68).
Biological yield had high positive indirect effect via Stem thickness (0.37),
Number of panicle per plant (0.49), Decorticated grain length (0.34), Elongation
ratio (0.64), it also had very high positive indirect effect via Width of leaf blade
(1.04), Plant height (5.42), Time of maturity (14.17), Grain L/B ratio (3.02),
Decorticated grain width (1.15), Milling percent (1.30), Length of milled grain
(5.45), Width of milled grain (2.88) and L/B ratio of cooked kernel (15.45).
Harvest index had high positive indirect effect via Stem thickness (0.34),
Decorticated grain length, Head rice recovery (0.61), Amylose content of
Endosperm (0.89) and Gel consistency (0.68).
126
Head rice recovery had high positive indirect effect via Stem thickness
(0.56), also had very high positive indirect effect via Plant height (4.65), Time of
maturity (10.81), Grain L/B ratio (8.20), Decorticated grain width (1.58), Milling
percent (1.27), Length of milled grain (8.58), Width of milled grain (3.19), Width
of cooked kernel (11.48), L/B ratio of cooked kernel (13.92) and Elongation ratio
(3.05).
Length of milled grain had high positive indirect effect via Stem thickness
(0.40), Gel consistency (0.37), it had very high positive indirect effect via Plant
height (8.76), Time of maturity (18.05), Grain L/B ratio (25.26), Decorticated grain
length (1.44), Decorticated grain width (2.33), Length of milled grain (21.79),
Width of cooked kernel (11.35), L/B ratio of cooked kernel (32.60) and Elongation
ratio (17.49).
Width of milled grain had high positive indirect effect via Grain width
(0.34), L/B ratio of Decorticated grain (0.30), Biological yield (0.78), Head rice
recovery (0.50) and Length of milled grain (0.43), it also had very high positive
indirect effect via Time of heading (4.53), L/B ratio of milled grain (10.11), L/B
ratio of cooked kernel (5.14) and Elongation ratio (11.55).
L/B ratio of milled grain had high positive indirect effect via Stem
thickness (0.31), Gel consistency (0.32), it had very high positive indirect effect
via Plant height (7.60), Time of maturity (17.99), Grain L/B ratio (2.32),
Decorticated grain length (1.25), Decorticated grain width (3.20), Length of milled
grain (19.48), Width of milled grain (8.09), Width of cooked kernel (11.51), L/B
ratio of cooked kernel (26.86) and Elongation ratio (16.48).
Length of cooked kernel had moderate positive indirect effect via Gel
consistency (0.28), it had very high positive indirect effect via Plant height (8.11),
Time of maturity (17.10), Grain L/B ratio (22.06), Decorticated grain length (1.27),
Decorticated grain width (1.88), Length of milled grain (18.51), Width cooked
kernel (15.18), L/B ratio of cooked kernel (36.67) and Elongation ratio (3.64).
Width of cooked kernel had very high positive indirect effect via Plant
height (2.92), Time of maturity (7.87), Grain L/B ratio (8.51), Length of milled
grain (7.19), Width of milled grain (1.22).
127
L/B ratio of cooked kernel had very high positive indirect effect via Plant
height (7.40), Time of maturity (15.10), Decorticated grain length (1.12), Grain
L/B ratio (19.85), Decorticated grain width (1.61), Length of milled grain (16.67)
and Elongation ratio (4.67).
Elongation ratio had high positive indirect effect via Leaf : length of blade
(0.37), Stem length (0.97), it also had very high positive indirect effect via Leaf :
width of blade (1.26), Time of heading (7.01), Panicle length (1.49), Grain length
(34.29), L/B ratio of decorticated grain (2.40), Milling percent (1.05), L/B ratio of
milled grain (14.11), Length of cooked kernel (3.13) and Elongation index (12.16).
Elongation index had very high positive indirect effect via Leaf : width of
blade (1.10), Time of heading (10.03), Panicle length (1.38), Grain length (29.17),
L/B ratio of decorticated grain (2.16), Head rice recovery (1.04), L/B ratio milled
grain (18.19) and Length of cooked kernel (6.19).
Endosperm content of amylose had very high positive indirect effect via
Time of heading (1.20), Plant height (1.14), Grain L/B ratio (5.31), Length of
milled grain (3.69), Width cooked kernel (1.31), L/B ratio of cooked kernel (4.34)
and Elongation ratio (3.87).
Gel consistency had moderate positive indirect effect via Stem thickness
(0.21), Grain width (0.29), Amylose content (0.24), it had high positive indirect
effect via Decorticated grain length (0.38) and Decorticated grain width (0.46), it
also had very high positive indirect effect via Plant height (2.30), Panicle per plant
(1.23), Time of maturity (2.95), Grain L/B ratio (7.24), Length of milled grain
(5.24), Width of cooked kernel (5.71), L/B ratio of cooked kernel (3.98) and
Elongation ratio (4.75).
Low residual value (P= 0.436, G= 0.354) was observed, it indicates that the
characters taken for study is sufficient to explain the variability.
From the above result, it is clear that L/B ratio of cooked kernel, Time of
maturity, Length of milled grain, Elongation index, Plant height, L/B ratio of
decorticated grain, Milling percent, Stem thickness, Gel consistency, Grain width,
Amylose content had high positive direct effect on Grain yield. The high positive
128
direct effect of plant height on grain yield was in accordance with Ambili and
Radhakrishnan et al. (2011), Selvraj et al. (2011). Time of maturity had direct
positive effect with grain yield was in accordance with Watto et al. (2010), Selvraj
et al. (2011), Naseem et al. (2014), Sarawgi et al. (2015). Islam et al. (2015) found
length of milled grain had direct positive on grain yield which is contradictory with
the present study.
Path coefficient analysis based on HRR:
The correlation coefficients between head rice recovery and other yield
attributing characters were partitioned into direct and indirect effects and are
presented in Table 4.7. Path coefficient study was carried out by considering the
HRR as the dependent variable and rest of the characters as the independent
variable
The high positive direct effect on Head rice recovery was exhibited by Gel
consistency (0.97) followed by Leaf: width of blade (0.63) and Elongation ratio
(0.30). Very high positive direct effect exhibited by Stem length (7.61) followed by
L/B ratio of milled grain (5.96), Grain width (5.70), Length of cooked kernel
(5.54), Time of maturity (3.91), Grain L/B ratio (3.90), Width of milled grain
(3.74), Milling percent (2.33) and 1000-grain weight (1.68).
Time of heading had high positive indirect effect via 1000-grain weight
(0.75), Decorticated grain width (0.52), Elongation index (0.61).
Grain length had high positive indirect effect via Decorticated grain width
(0.55), Hulling percent (0.58) and Elongation index (0.71).
L/B ratio of grain had high positive indirect effect via Leaf: length of blade,
Panicle length (0.43), Grain length (0.54), Milling percent (0.67) and Width of
cooked kernel (0.87).
Decorticated grain length had high positive indirect effect via Grain width
(0.98), Decorticated grain width (0.56), Hulling percent (0.52) and Elongation
index (0.70).
129
L/B ratio of decorticated grain show high positive indirect effect via
Panicle length (0.40), Grain length (0.50 and Width of cooked kernel (0.80).
Biological yield had high positive indirect effect via Decorticated grain
width (0.30) and milling percent (0.90).
Grain yield had high positive indirect effect via 1000-grain weight (0.94)
and had moderate positive indirect effect via Gel consistency (0.25) and Hulling
percent (0.20).
Length of milled grain had high positive indirect effect via Grain width
(0.64), Decorticated grain width (0.60), Hulling percent (0.58) and Elongation
index (0.77).
L/B ratio of milled grain had high positive indirect effect via Decorticated
grain width and Hulling per cent (0.51).
Length of cooked kernel had high positive indirect effect via Grain width
(0.65), Decorticated grain width (0.49), Hulling percent (0.34) and Elongation
index (0.37).
L/B ratio of cooked kernel had high positive indirect effect via Grain width
(0.63), Decorticated grain width (0.42), Hulling percent (0.32) and Width of milled
grain (0.45).
Elongation ratio had high positive indirect effect via Grain length (0.32),
Milling percent (0.73) and L/B ratio of cooked kernel (0.63).
Elongation index had high positive indirect effect via Grain width (0.80)
and had moderate positive indirect effect via Panicle length (0.24) and Grain length
(0.27).
Amylose content of Endosperm had high positive indirect effect via Stem
length (0.91), 1000-grain weight (0.48) and Length of cooked kernel (0.72).
Gel consistency had high positive indirect effect via Time of maturity
(0.40), 1000-grain weight (0.47), L/B ratio of decorticated grain (0.59), Hulling
percent (0.35), Length of cooked kernel (0.98) and Elongation index (0.34).
130
Table 4.7a: Direct and indirect effects of 33 yield and quality traits of 48 (24 short and 24 long grains length) rice germplasm
accessions based on HRR
Charact
ers
1 2 3 4 5 6 7 8 9 10 11 12 13 14 15 16
1 P -0.04 -0.03 -0.07 0.02 0.41 0.08 -0.19 0.01 -0.12 0.74 -0.11 -1.85 0.02 0.63 0.05 0.12
G -0.44 0.22 -2.13 0.00 4.22 -0.34 -4.04 0.00 -0.21 1.63 0.90 -0.35 0.20 -2.42 -5.02 0.46
2 P -0.01 -0.09 0.05 0.00 0.08 0.02 -0.03 0.00 -0.04 -0.04 -0.02 -0.37 0.00 0.15 0.01 0.02
G -0.15 0.63 0.38 0.00 0.83 -0.05 -0.76 0.01 -0.10 -0.19 0.28 -0.10 -0.07 -0.88 -1.49 0.14
3 P -0.01 0.00 -1.77 0.02 0.51 0.07 -0.22 0.04 -0.08 1.79 -0.09 -1.67 0.00 0.37 0.05 0.13
G -0.17 -0.04 -5.42 0.00 5.24 -0.28 -4.79 -0.01 -0.15 3.88 0.75 -0.31 -0.11 -1.48 -4.72 0.52
4 P -0.03 0.00 -0.18 0.18 0.09 0.04 -0.05 -0.06 -0.03 0.19 -0.04 -0.59 0.03 0.20 0.02 0.01
G -0.04 0.00 -0.39 0.00 0.94 -0.18 -1.06 0.02 -0.06 0.33 0.43 -0.14 0.06 -1.10 -2.14 0.07
5 P -0.02 -0.01 -1.20 0.02 0.75 0.10 -0.33 0.00 -0.12 1.23 -0.14 -2.28 0.04 0.70 0.06 0.14
G -0.24 0.07 -3.74 0.00 7.61 -0.44 -7.00 0.00 -0.22 2.72 1.18 -0.43 0.46 -2.68 -6.53 0.44
6 P -0.02 -0.01 -0.81 0.04 0.53 0.15 -0.26 -0.03 -0.10 0.84 -0.14 -2.09 0.08 0.70 0.06 0.10
G -0.25 0.05 -2.58 0.00 5.66 -0.60 -5.64 0.01 -0.19 1.92 1.21 -0.41 1.10 -2.80 -6.22 0.41
7 P -0.02 -0.01 -1.19 0.03 0.75 0.11 -0.33 0.00 -0.12 1.22 -0.15 -2.34 0.05 0.73 0.07 0.12
G -0.25 0.07 -3.69 0.00 7.58 -0.48 -7.03 0.00 -0.22 2.70 1.22 -0.44 0.56 -2.78 -6.69 0.45
8 P 0.00 0.00 0.29 0.04 -0.01 0.02 0.00 -0.24 0.02 -0.29 0.00 -0.03 -0.02 0.05 0.00 0.00
G 0.03 0.05 1.00 0.00 -0.23 -0.10 0.04 0.07 0.04 -0.73 -0.03 0.00 -0.29 -0.17 -0.29 -0.03
9 P -0.02 -0.02 -0.70 0.03 0.43 0.07 -0.19 0.02 -0.21 0.73 -0.12 -1.95 -0.03 0.67 0.05 0.14
G -0.25 0.17 -2.21 0.00 4.47 -0.31 -4.20 -0.01 -0.37 1.62 0.97 -0.36 -0.33 -2.51 -5.30 0.54
10 P -0.01 0.00 -1.75 0.02 0.51 0.07 -0.22 0.04 -0.08 1.81 -0.10 -1.72 -0.01 0.40 0.05 0.13
G -0.18 -0.03 -5.38 0.00 5.30 -0.29 -4.85 -0.01 -0.15 3.91 0.79 -0.33 -0.14 -1.57 -4.87 0.51
11 P -0.02 -0.01 -0.78 0.04 0.52 0.10 -0.24 0.00 -0.12 0.84 -0.21 -2.80 0.13 0.96 0.08 0.10
G -0.23 0.10 -2.42 0.00 5.37 -0.43 -5.13 0.00 -0.21 1.84 1.68 -0.52 1.61 -3.58 -7.79 0.41
12 P -0.02 -0.01 -0.98 0.04 0.57 0.10 -0.26 0.00 -0.14 1.04 -0.19 -3.00 0.08 1.03 0.08 0.14
G -0.28 0.11 -3.09 0.00 5.90 -0.45 -5.59 0.00 -0.24 2.31 1.57 -0.55 1.03 -3.79 -8.24 0.55
13 P 0.00 0.00 0.01 0.01 0.06 0.02 -0.03 0.01 0.01 -0.02 -0.05 -0.50 0.48 0.20 0.01 -0.11
G -0.02 -0.01 0.11 0.00 0.61 -0.12 -0.69 0.00 0.02 -0.10 0.47 -0.10 5.70 -0.80 -1.42 -0.42
131
14 P 0.02 0.01 0.62 -0.03 -0.50 -0.10 0.23 0.01 0.13 -0.68 0.19 2.90 -0.09 -1.06 -0.08 -0.12
G 0.27 -0.14 2.06 0.00 -5.22 0.43 5.00 0.00 0.24 -1.57 -1.54 0.54 -1.16 3.90 7.97 -0.49
15 P -0.02 -0.01 -0.98 0.04 0.58 0.10 -0.26 -0.01 -0.13 1.04 -0.19 -2.96 0.08 1.00 0.08 0.14
G -0.26 0.11 -3.08 0.00 5.98 -0.45 -5.66 0.00 -0.24 2.29 1.57 -0.55 0.98 -3.74 -8.31 0.56
16 P 0.01 0.01 0.80 -0.01 -0.29 -0.05 0.13 0.00 0.10 -0.81 0.07 1.46 0.18 -0.45 -0.04 -0.29
G 0.19 -0.08 2.63 0.00 -3.16 0.23 2.98 0.00 0.19 -1.85 -0.64 0.29 2.24 1.78 4.33 -1.07
17 P 0.02 0.01 0.99 -0.03 -0.54 -0.09 0.24 0.00 0.13 -1.05 0.16 2.64 0.13 -0.88 -0.07 -0.17
G 0.25 -0.08 3.20 0.00 -5.71 0.40 5.36 0.00 0.24 -2.38 -1.34 0.50 1.33 3.36 7.54 -0.69
18 P 0.00 0.02 -0.45 0.03 0.21 0.04 -0.10 -0.02 -0.02 0.52 -0.02 -0.41 -0.08 0.10 0.01 0.04
G -0.02 -0.13 -2.41 0.00 3.51 -0.34 -3.45 0.01 -0.07 1.90 0.22 -0.11 -1.99 -0.44 -1.94 0.30
19 P 0.00 0.00 -0.42 0.06 0.15 0.03 -0.07 -0.05 -0.03 0.43 -0.05 -0.65 0.02 0.19 0.02 -0.01
G 0.01 -0.07 -2.19 0.00 2.96 -0.26 -2.87 0.04 -0.12 1.47 0.94 -0.30 -0.19 -2.13 -4.53 -0.14
20 P 0.00 -0.01 -0.12 0.00 0.08 0.01 -0.04 -0.05 -0.01 0.09 -0.04 -0.34 0.08 0.11 0.01 -0.04
G 0.02 -0.01 -1.88 0.00 3.93 -0.25 -3.65 0.07 -0.08 0.90 1.62 -0.34 5.07 -2.16 -5.57 -0.84
21 P 0.01 0.01 0.27 0.01 -0.17 -0.02 0.08 0.01 0.05 -0.26 0.07 1.26 -0.11 -0.47 -0.03 -0.06
G 0.10 -0.05 0.84 0.00 -1.80 0.10 1.66 0.00 0.10 -0.58 -0.59 0.23 -1.40 1.74 3.14 -0.23
22 P 0.00 0.00 0.03 -0.01 -0.09 0.00 0.03 -0.01 0.01 -0.04 0.05 0.64 -0.16 -0.26 -0.02 0.02
G 0.01 -0.04 0.01 0.00 -1.08 -0.01 0.88 0.00 0.02 -0.03 -0.45 0.14 -2.43 1.12 1.71 0.10
24 P -0.02 -0.01 -1.04 0.03 0.57 0.10 -0.26 0.01 -0.14 1.09 -0.19 -2.93 0.05 0.99 0.08 0.15
G -0.26 0.11 -3.27 0.00 5.89 -0.44 -5.57 0.00 -0.24 2.42 1.55 -0.54 0.64 -3.69 -8.17 0.60
25 P 0.00 0.00 0.30 0.01 0.01 0.00 0.00 0.00 0.02 -0.28 -0.03 -0.18 0.16 0.11 0.01 -0.18
G 0.05 0.01 1.04 0.00 0.19 0.02 -0.13 0.00 0.04 -0.65 0.30 -0.04 2.22 -0.48 -0.57 -0.68
26 P -0.02 -0.01 -1.04 0.03 0.48 0.09 -0.22 0.01 -0.13 1.07 -0.15 -2.50 -0.05 0.83 0.07 0.22
G -0.26 0.10 -3.33 0.00 5.09 -0.39 -4.83 0.00 -0.23 2.41 1.25 -0.47 -0.63 -3.12 -7.06 0.83
27 P -0.02 -0.01 -0.97 0.04 0.53 0.09 -0.24 0.00 -0.13 1.04 -0.16 -2.56 0.05 0.87 0.07 0.13
G -0.22 0.06 -3.05 0.00 5.47 -0.40 -5.16 0.00 -0.24 2.29 1.28 -0.47 0.65 -3.23 -7.20 0.49
28 P 0.00 -0.01 -0.39 0.04 0.17 0.03 -0.08 -0.01 -0.08 0.44 -0.07 -1.02 0.01 0.32 0.03 0.05
G -0.06 0.13 -1.32 0.00 1.96 -0.15 -1.86 0.00 -0.16 1.06 0.62 -0.20 0.24 -1.24 -2.94 0.18
29 P -0.02 0.00 -0.87 0.02 0.48 0.08 -0.22 0.01 -0.10 0.91 -0.13 -2.23 0.05 0.77 0.06 0.10
G -0.22 0.00 -2.75 0.00 4.99 -0.36 -4.71 0.00 -0.17 2.03 1.09 -0.42 0.63 -2.90 -6.37 0.42
30 P 0.01 0.02 0.49 -0.01 -0.28 -0.06 0.13 -0.01 0.06 -0.49 0.12 1.70 0.00 -0.57 -0.05 -0.11
132
G 0.17 -0.15 1.60 0.00 -2.95 0.26 2.85 0.00 0.12 -1.13 -0.99 0.32 -0.02 2.17 4.70 -0.43
31 P 0.01 0.01 0.69 -0.03 -0.25 -0.05 0.11 0.01 0.09 -0.69 0.09 1.41 0.06 -0.43 -0.04 -0.19
G 0.15 -0.13 2.30 0.00 -2.73 0.24 2.64 -0.01 0.17 -1.63 -0.75 0.27 0.80 1.66 4.03 -0.74
32 P 0.00 0.00 0.10 -0.02 0.09 0.00 -0.03 -0.03 -0.02 -0.06 -0.06 -0.57 0.08 0.21 0.02 -0.02
G 0.02 0.02 0.28 0.00 0.91 0.02 -0.73 0.01 -0.04 -0.09 0.48 -0.11 1.21 -0.78 -1.94 -0.07
33 P -0.01 -0.01 -0.15 0.02 0.14 0.04 -0.07 -0.08 -0.03 0.18 -0.06 -0.80 0.15 0.28 0.02 0.03
G -0.10 0.09 -0.47 0.00 1.40 -0.19 -1.46 0.03 -0.06 0.40 0.47 -0.15 1.87 -1.06 -2.15 0.12
1 = Leaf: Length of blade ; 2 = Leaf: Width of blade ; 3 = Time of heading(50% plants with panicle) ; 4 = Stem: Thickness ; 5 = Stem: Length(excluding panicle) ; 6 = Panicle: Length
of main axis ; 7 = plant height ; 8 = Panicle: Number per plant (number of tillers) ; 9 = Panicle: Length of longest awn ; 10 = Time Maturity(Days) ; 11 = Grain: Weight of 1000 fully
develop grain ; 12 = Grain: Length ; 13 = Grain: Width ; 14 = L/B ratio ; 15 = Decorticated grain: Length ; 16 = Decorticated grain: Width ; 17 = L/B Ratio of decorticated grain ; 18 =
Biological Yield(gm) ; 19 = Grain Yield(gm) ; = 20 Harvest Index ; 21 = Hulling Percent ; 22 = Milling Percent ; 23 = Head Rice Recovery ; 24 = Length of milled grain ; 25 = Width of
milled grain ; 26 = L/B ratio of milled grain ; 27 = Length of cooked kernel ; 28 = Width of cooked kernel ; 29 = L/B ratio of cooked kernel ; 30 = Elongation Ratio ; 31 = Elongation
index ; 32 = Endosperm content of Amylose ; 33 = Gel Consistency.
133
Table 4.7b: Direct and indirect effects of 33 yield and quality traits of 48 (24 short and 24 long grains length) rice germplasm
accessions based on HRR
Charact
ers
17 18 19 20 21 22 23 24 25 26 27 28 29 30 31 32
1 P 0.65 -0.01 0.00 0.00 0.01 -0.01 -1.28 -0.12 0.52 -0.35 0.12 1.08 0.12 0.44 0.00 0.05
G 6.86 0.01 0.00 0.00 0.32 -0.03 -3.87 -0.39 3.52 2.79 -0.39 -1.88 -0.12 0.51 0.05 0.22
2 P 0.11 0.03 0.00 0.00 0.00 -0.02 -0.27 0.01 0.10 -0.05 0.15 -0.02 0.05 0.20 0.00 0.02
G 1.55 -0.02 0.00 0.00 0.11 -0.15 -1.11 0.03 0.92 0.49 -0.58 0.00 -0.07 0.31 -0.04 0.14
3 P 0.66 -0.04 -0.01 0.00 0.00 -0.01 -1.27 -0.20 0.54 -0.39 0.20 1.11 0.09 0.51 0.00 0.02
G 6.94 0.05 -0.01 -0.02 0.21 0.00 -3.84 -0.72 3.66 3.11 -0.67 -1.91 -0.09 0.61 0.06 0.08
4 P 0.20 -0.03 -0.01 0.00 0.00 -0.02 -0.38 0.03 0.13 -0.14 0.21 0.19 0.02 0.20 0.00 0.02
G 3.21 0.02 -0.01 -0.01 -0.06 -0.09 -1.45 0.31 1.03 1.53 -0.96 -0.45 -0.01 0.23 0.17 0.11
5 P 0.84 -0.05 -0.01 0.00 0.01 -0.05 -1.64 0.02 0.59 -0.50 0.21 1.45 0.11 0.43 0.00 0.04
G 8.83 0.05 -0.01 -0.03 0.32 -0.33 -4.94 0.09 3.99 3.98 -0.71 -2.48 -0.12 0.51 -0.14 0.18
6 P 0.73 -0.04 -0.10 0.00 0.00 0.00 -1.49 -0.01 0.54 -0.45 0.20 1.28 1.23 0.47 0.00 0.07
G 7.87 0.06 -0.01 -0.02 0.24 0.04 -4.68 -0.10 3.89 3.71 -0.67 -2.31 -0.13 0.57 0.03 0.31
7 P 0.85 -0.05 -0.01 0.00 0.01 -0.04 -1.68 0.02 0.60 -0.52 0.21 1.48 0.12 0.45 0.00 0.05
G 8.97 0.05 -0.01 -0.03 0.32 -0.29 -5.06 0.07 4.10 4.07 -0.72 -2.53 -0.12 0.54 -0.12 0.20
8 P 0.01 -0.02 -0.01 0.00 0.00 0.02 0.08 -0.01 -0.03 0.01 0.03 -0.09 -0.01 0.05 0.00 0.07
G 0.13 0.02 -0.01 -0.05 0.07 0.09 0.23 -0.21 0.01 -0.05 -0.12 0.19 0.01 0.10 -0.19 0.36
9 P 0.75 -0.02 -0.01 0.00 0.01 -0.02 -1.41 -0.12 0.57 -0.46 0.37 1.04 0.10 0.57 0.00 0.04
G 7.74 0.02 -0.01 -0.01 0.36 -0.14 -4.17 -0.40 3.78 3.57 -1.18 -1.78 -0.09 0.65 -0.12 0.16
10 P 0.68 -0.05 -0.01 0.00 0.00 -0.01 -1.30 -0.18 0.52 -0.41 0.02 1.15 0.08 0.50 0.00 0.02
G 7.18 0.05 -0.01 -0.01 0.20 -0.02 -3.96 -0.62 3.68 3.25 -0.74 -1.96 -0.09 0.60 0.03 0.10
11 P 0.91 -0.01 -0.01 0.00 0.01 -0.10 -1.99 0.19 0.67 -0.55 0.32 1.45 0.18 0.56 0.00 0.06
G 9.41 0.01 -0.01 -0.05 0.48 -0.63 -5.89 0.67 4.45 4.24 -1.01 -2.47 -0.18 0.64 -0.34 0.27
12 P 1.03 -0.02 -0.01 0.00 0.01 -0.09 -2.12 0.07 0.76 -0.61 0.31 1.68 0.18 0.62 0.00 0.06
G 10.62 0.02 -0.01 -0.03 0.58 -0.58 -6.28 0.26 5.07 4.75 -0.98 -2.87 -0.17 0.71 -0.22 0.26
13 P -0.32 0.03 0.00 0.00 0.01 -0.14 -0.22 0.38 -0.09 -0.08 0.02 0.25 0.00 -0.17 0.00 0.07
G -2.74 -0.04 0.00 -0.05 0.33 -0.99 -0.72 1.46 -0.65 0.63 -0.11 -0.42 0.00 -0.20 -0.25 0.32
134
14 P -0.97 0.02 0.01 0.00 -0.01 0.10 2.02 -0.12 -0.71 0.58 -0.27 -1.64 -0.17 -0.53 0.00 -0.06
G -10.14 -0.01 0.01 0.03 -0.61 0.67 6.04 -0.46 -4.76 -4.58 0.87 2.81 0.17 -0.61 0.23 -0.26
15 P 1.04 -0.03 -0.01 0.00 0.01 -0.08 -2.12 0.07 0.76 -0.62 0.30 1.70 0.17 0.61 0.00 0.06
G 10.69 0.02 -0.01 -0.03 0.52 -0.48 -6.27 0.26 5.06 4.80 -0.97 -2.90 -0.17 0.70 -0.27 0.25
16 P -0.69 0.02 0.00 0.00 0.00 -0.02 1.14 0.70 -0.68 0.31 -0.15 -0.81 -0.11 -0.87 0.00 -0.02
G -7.56 -0.03 0.00 -0.04 -0.29 -0.21 3.61 2.37 -4.63 -2.52 0.46 1.48 0.12 -1.00 -0.08 -0.11
17 P -1.17 0.04 0.01 0.00 -0.01 0.02 1.95 0.07 -0.76 0.56 -0.26 -1.58 -0.17 -0.63 0.00 -0.01
G -11.77 -0.04 0.01 0.02 -0.40 0.12 5.89 0.27 -5.20 -4.44 0.80 2.76 0.17 -0.74 0.16 -0.05
18 P 0.28 -0.16 -0.01 -0.01 0.00 0.11 -0.33 -0.15 0.17 -0.13 -0.03 0.51 0.01 0.11 0.00 0.02
G 4.76 0.10 -0.02 0.01 -0.39 0.90 -1.60 -0.56 1.58 1.78 0.01 -1.37 -0.01 0.15 -0.08 0.11
19 P 0.26 -0.03 -0.05 0.01 0.00 -0.03 -0.48 0.22 0.12 -0.19 0.16 0.52 0.01 0.00 0.00 0.02
G 6.93 0.13 -0.02 -0.03 0.20 0.04 -3.38 1.50 1.96 3.44 -1.07 -1.97 -0.02 0.04 -0.28 0.25
20 P 0.06 0.05 -0.02 0.02 0.00 -0.06 -0.23 0.35 -0.03 -0.08 0.08 0.17 0.01 -0.12 0.00 0.02
G 3.52 -0.03 -0.01 -0.05 1.11 -1.85 -3.95 5.13 -0.27 3.02 -0.97 -1.70 -0.09 -0.45 -0.86 0.42
21 P -0.33 -0.03 0.00 0.00 -0.02 0.29 0.92 -0.07 -0.33 0.18 -0.08 -0.52 -0.12 -0.35 0.00 -0.06
G -3.43 0.03 0.00 0.04 -1.36 1.90 2.72 -0.24 -2.21 -1.40 0.26 0.87 0.12 -0.41 0.21 -0.25
22 P -0.06 -0.04 0.00 0.00 -0.02 0.41 0.46 -0.19 -0.10 0.05 0.00 -0.17 -0.08 -0.11 0.00 -0.04
G -0.61 0.04 0.00 0.04 -1.11 2.33 1.60 -0.91 -0.74 -0.48 -0.07 0.37 0.09 -0.11 0.16 -0.18
24 P 1.06 -0.02 -0.01 0.00 0.01 -0.09 -2.16 0.02 0.80 -0.60 0.28 1.69 0.19 0.68 0.00 0.05
G 10.85 0.03 -0.01 -0.03 0.58 -0.59 -6.38 0.07 5.32 4.71 -0.90 -2.89 -0.19 0.77 -0.20 0.23
25 P -0.07 0.02 -0.01 0.01 0.00 -0.07 -0.04 1.15 -0.41 -0.04 -0.05 0.25 -0.01 -0.82 0.00 0.00
G -0.85 -0.02 -0.01 -0.07 0.09 -0.56 -0.13 3.74 -2.49 0.36 0.17 -0.46 0.01 -0.88 -0.38 0.00
26 P 0.98 -0.03 -0.01 0.00 0.01 -0.05 -1.90 -0.51 0.91 -0.51 0.29 1.36 0.18 0.99 0.00 0.04
G 10.28 0.03 -0.01 0.00 0.51 -0.29 -5.71 -1.57 5.96 4.07 -0.92 -2.38 -0.17 1.08 -0.01 0.20
27 P 0.92 -0.03 -0.01 0.00 0.01 -0.03 -1.83 0.06 0.66 -0.72 0.38 1.92 0.04 0.32 0.00 0.04
G 9.43 0.03 -0.01 -0.03 0.34 -0.20 -5.42 0.24 4.38 5.54 -1.21 -3.26 -0.04 0.37 -0.15 0.17
28 P 0.33 0.01 -0.01 0.00 0.00 0.00 -0.68 -0.07 0.29 -0.30 0.91 -0.26 -0.01 0.65 0.00 0.03
G 3.45 0.00 -0.01 -0.02 0.13 0.06 -2.11 -0.24 1.99 2.44 -2.74 0.26 0.01 0.72 -0.04 0.16
29 P 0.82 -0.04 -0.01 0.00 0.01 -0.03 -1.61 0.13 0.55 -0.61 -0.10 2.26 0.05 -0.04 0.00 0.02
G 8.58 0.04 -0.01 -0.02 0.32 -0.23 -4.88 0.45 3.75 4.77 0.19 -3.78 -0.05 0.00 -0.12 0.09
30 P -0.64 0.01 0.00 0.00 -0.01 0.11 1.34 0.04 -0.52 0.08 0.03 -0.35 -0.31 -0.81 0.00 -0.04
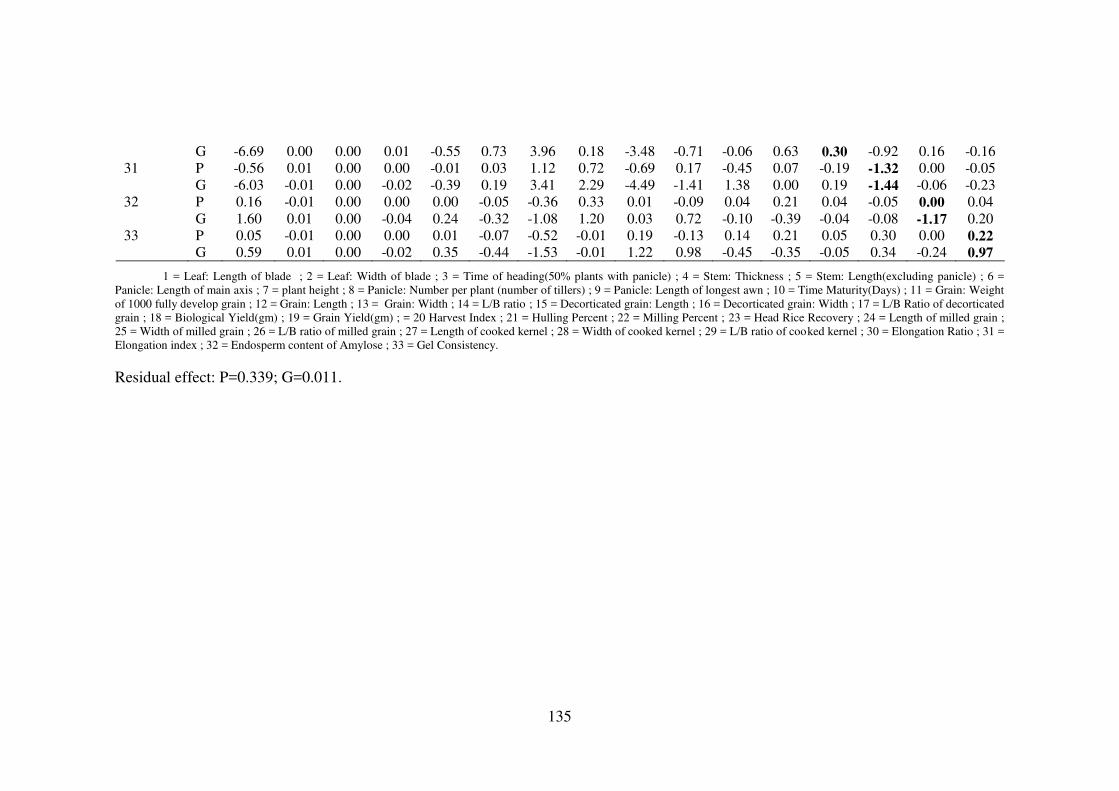
135
G -6.69 0.00 0.00 0.01 -0.55 0.73 3.96 0.18 -3.48 -0.71 -0.06 0.63 0.30 -0.92 0.16 -0.16
31 P -0.56 0.01 0.00 0.00 -0.01 0.03 1.12 0.72 -0.69 0.17 -0.45 0.07 -0.19 -1.32 0.00 -0.05
G -6.03 -0.01 0.00 -0.02 -0.39 0.19 3.41 2.29 -4.49 -1.41 1.38 0.00 0.19 -1.44 -0.06 -0.23
32 P 0.16 -0.01 0.00 0.00 0.00 -0.05 -0.36 0.33 0.01 -0.09 0.04 0.21 0.04 -0.05 0.00 0.04
G 1.60 0.01 0.00 -0.04 0.24 -0.32 -1.08 1.20 0.03 0.72 -0.10 -0.39 -0.04 -0.08 -1.17 0.20
33 P 0.05 -0.01 0.00 0.00 0.01 -0.07 -0.52 -0.01 0.19 -0.13 0.14 0.21 0.05 0.30 0.00 0.22
G 0.59 0.01 0.00 -0.02 0.35 -0.44 -1.53 -0.01 1.22 0.98 -0.45 -0.35 -0.05 0.34 -0.24 0.97
1 = Leaf: Length of blade ; 2 = Leaf: Width of blade ; 3 = Time of heading(50% plants with panicle) ; 4 = Stem: Thickness ; 5 = Stem: Length(excluding panicle) ; 6 =
Panicle: Length of main axis ; 7 = plant height ; 8 = Panicle: Number per plant (number of tillers) ; 9 = Panicle: Length of longest awn ; 10 = Time Maturity(Days) ; 11 = Grain: Weight
of 1000 fully develop grain ; 12 = Grain: Length ; 13 = Grain: Width ; 14 = L/B ratio ; 15 = Decorticated grain: Length ; 16 = Decorticated grain: Width ; 17 = L/B Ratio of decorticated
grain ; 18 = Biological Yield(gm) ; 19 = Grain Yield(gm) ; = 20 Harvest Index ; 21 = Hulling Percent ; 22 = Milling Percent ; 23 = Head Rice Recovery ; 24 = Length of milled grain ;
25 = Width of milled grain ; 26 = L/B ratio of milled grain ; 27 = Length of cooked kernel ; 28 = Width of cooked kernel ; 29 = L/B ratio of cooked kernel ; 30 = Elongation Ratio ; 31 =
Elongation index ; 32 = Endosperm content of Amylose ; 33 = Gel Consistency.
Residual effect: P=0.339; G=0.011.
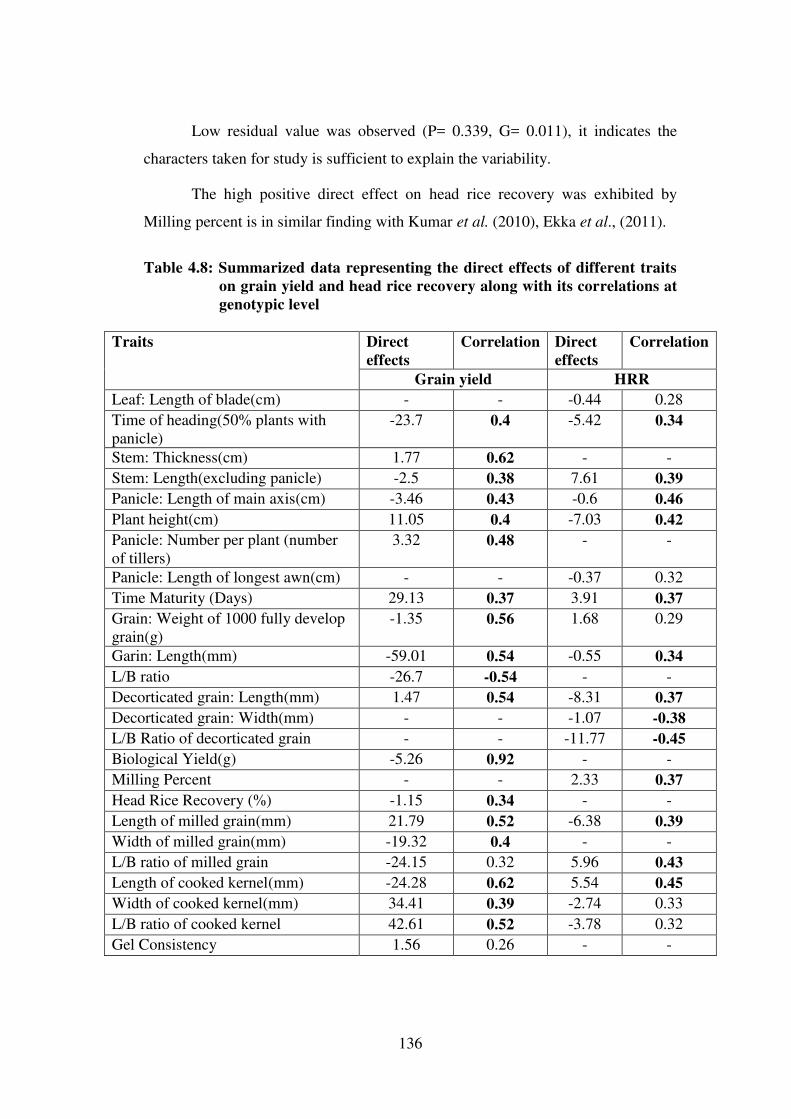
136
Low residual value was observed (P= 0.339, G= 0.011), it indicates the
characters taken for study is sufficient to explain the variability.
The high positive direct effect on head rice recovery was exhibited by
Milling percent is in similar finding with Kumar et al. (2010), Ekka et al., (2011).
Table 4.8: Summarized data representing the direct effects of different traits
on grain yield and head rice recovery along with its correlations at
genotypic level
Traits Direct
effects
Correlation Direct
effects
Correlation
Grain yield HRR
Leaf: Length of blade(cm) - - -0.44 0.28
Time of heading(50% plants with
panicle)
-23.7 0.4 -5.42 0.34
Stem: Thickness(cm) 1.77 0.62 - -
Stem: Length(excluding panicle) -2.5 0.38 7.61 0.39
Panicle: Length of main axis(cm) -3.46 0.43 -0.6 0.46
Plant height(cm) 11.05 0.4 -7.03 0.42
Panicle: Number per plant (number
of tillers)
3.32 0.48 - -
Panicle: Length of longest awn(cm) - - -0.37 0.32
Time Maturity (Days) 29.13 0.37 3.91 0.37
Grain: Weight of 1000 fully develop
grain(g)
-1.35 0.56 1.68 0.29
Garin: Length(mm) -59.01 0.54 -0.55 0.34
L/B ratio -26.7 -0.54 - -
Decorticated grain: Length(mm) 1.47 0.54 -8.31 0.37
Decorticated grain: Width(mm) - - -1.07 -0.38
L/B Ratio of decorticated grain - - -11.77 -0.45
Biological Yield(g) -5.26 0.92 - -
Milling Percent - - 2.33 0.37
Head Rice Recovery (%) -1.15 0.34 - -
Length of milled grain(mm) 21.79 0.52 -6.38 0.39
Width of milled grain(mm) -19.32 0.4 - -
L/B ratio of milled grain -24.15 0.32 5.96 0.43
Length of cooked kernel(mm) -24.28 0.62 5.54 0.45
Width of cooked kernel(mm) 34.41 0.39 -2.74 0.33
L/B ratio of cooked kernel 42.61 0.52 -3.78 0.32
Gel Consistency 1.56 0.26 - -
137
Association and path coefficient analysis was performed between 33 yield
and quality characters among 48 rice germplasm accessions. The summarized data
representing the direct effect on grain yield and on head rice recovery along with
its correlation values at genotypic level is presented in Table 4.8. The results
revealed that the correlation between grain yield and 20 other traits is due to direct
effects as depicted in the aforesaid table clearly indicates a true relationship
between them and direct selection of these traits will be rewarding for yield
improvement. Higest correlation value of (0.92) was recorded by biological yield
followed by stem: thickness (0.62), length of cooked kernel (0.62), 1000 grain
weight (-0.56), grain: length (0.54), length of milled grain (0.52) and L/B ratio of
cooked kernel (0.52). Path analysis has been widely applied to several crop species
crested wheat grass (Dewey and Lu, 1959), cereals and legumes (Dixit and Singh,
1975, Singh and Singh, 1976; Mayo, 1984). The information obtained by this
technique helps in indirect selection for genetic improvement of grain yield and
head rice recovery. Selection for a component trait with a view to improve yield is
called indirect selection while selection for yield per se. is called as direct
selection. A greater yield response is obtained when the character for which
indirect selection is practiced has a high heritability and high correlation with
yield.
Path analysis provides information about the cause and effect situation and
helps in understanding the cause of association between two variables. It is quite
possible that a trait showing positive direct effect on yield may have negative
indirect effect via other component traits. Path analysis permits the examination of
direct effects of various characters on yield as well as their indirect effects via
other component traits. It provides the basis for selection of superior genotypes
from the diverse breeding population.
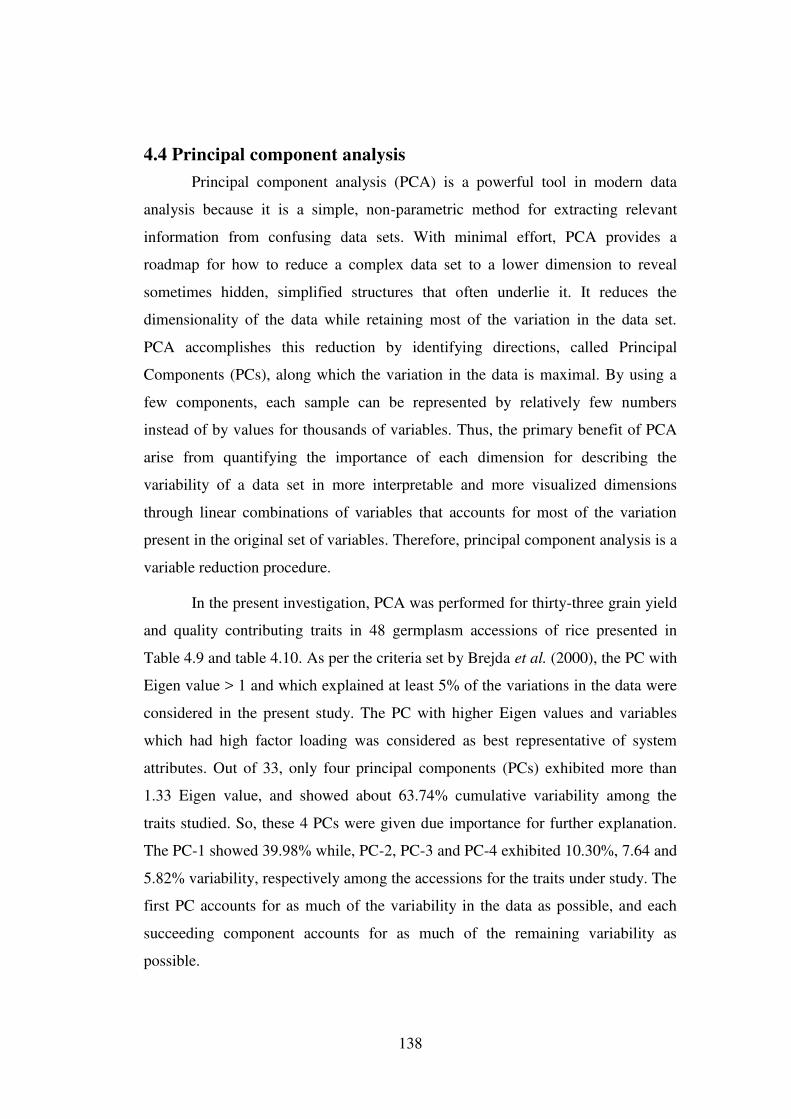
138
4.4 Principal component analysis
Principal component analysis (PCA) is a powerful tool in modern data
analysis because it is a simple, non-parametric method for extracting relevant
information from confusing data sets. With minimal effort, PCA provides a
roadmap for how to reduce a complex data set to a lower dimension to reveal
sometimes hidden, simplified structures that often underlie it. It reduces the
dimensionality of the data while retaining most of the variation in the data set.
PCA accomplishes this reduction by identifying directions, called Principal
Components (PCs), along which the variation in the data is maximal. By using a
few components, each sample can be represented by relatively few numbers
instead of by values for thousands of variables. Thus, the primary benefit of PCA
arise from quantifying the importance of each dimension for describing the
variability of a data set in more interpretable and more visualized dimensions
through linear combinations of variables that accounts for most of the variation
present in the original set of variables. Therefore, principal component analysis is a
variable reduction procedure.
In the present investigation, PCA was performed for thirty-three grain yield
and quality contributing traits in 48 germplasm accessions of rice presented in
Table 4.9 and table 4.10. As per the criteria set by Brejda et al. (2000), the PC with
Eigen value > 1 and which explained at least 5% of the variations in the data were
considered in the present study. The PC with higher Eigen values and variables
which had high factor loading was considered as best representative of system
attributes. Out of 33, only four principal components (PCs) exhibited more than
1.33 Eigen value, and showed about 63.74% cumulative variability among the
traits studied. So, these 4 PCs were given due importance for further explanation.
The PC-1 showed 39.98% while, PC-2, PC-3 and PC-4 exhibited 10.30%, 7.64 and
5.82% variability, respectively among the accessions for the traits under study. The
first PC accounts for as much of the variability in the data as possible, and each
succeeding component accounts for as much of the remaining variability as
possible.
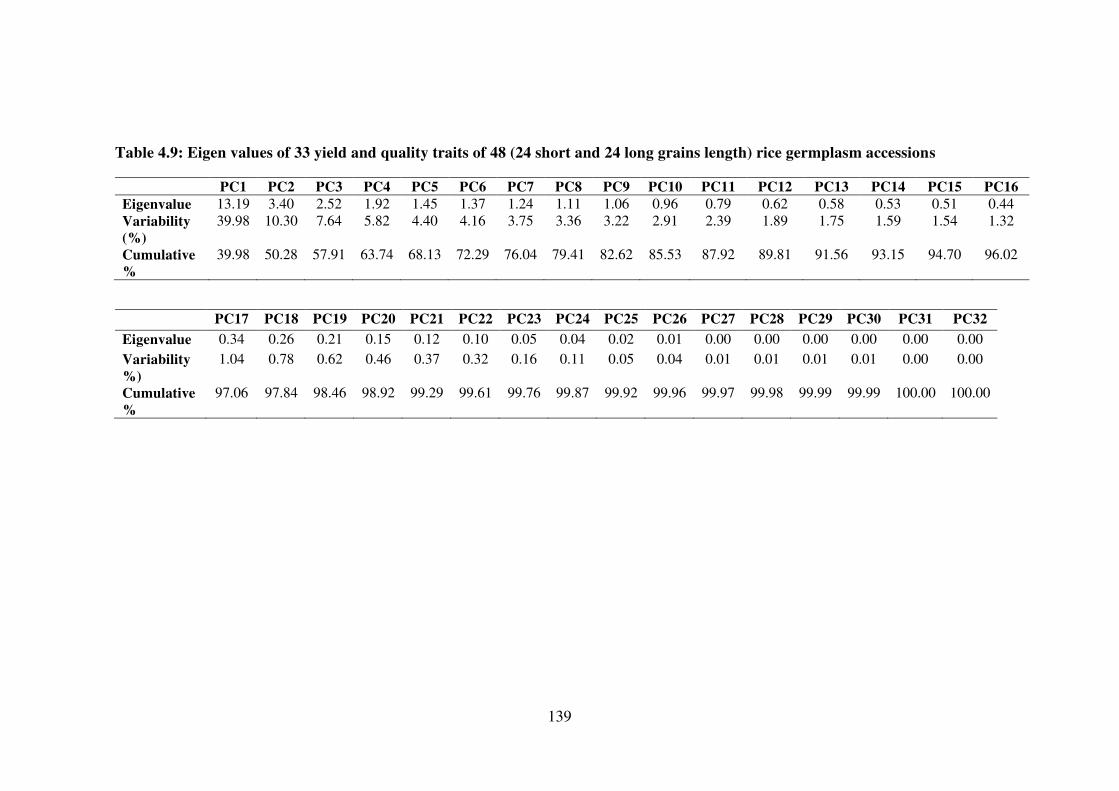
139
Table 4.9: Eigen values of 33 yield and quality traits of 48 (24 short and 24 long grains length) rice germplasm accessions
PC1 PC2 PC3 PC4 PC5 PC6 PC7 PC8 PC9 PC10 PC11 PC12 PC13 PC14 PC15 PC16
Eigenvalue 13.19 3.40 2.52 1.92 1.45 1.37 1.24 1.11 1.06 0.96 0.79 0.62 0.58 0.53 0.51 0.44
Variability
(%)
39.98 10.30 7.64 5.82 4.40 4.16 3.75 3.36 3.22 2.91 2.39 1.89 1.75 1.59 1.54 1.32
Cumulative
%
39.98 50.28 57.91 63.74 68.13 72.29 76.04 79.41 82.62 85.53 87.92 89.81 91.56 93.15 94.70 96.02
PC17 PC18 PC19 PC20 PC21 PC22 PC23 PC24 PC25 PC26 PC27 PC28 PC29 PC30 PC31 PC32
Eigenvalue 0.34 0.26 0.21 0.15 0.12 0.10 0.05 0.04 0.02 0.01 0.00 0.00 0.00 0.00 0.00 0.00
Variability
%)
1.04 0.78 0.62 0.46 0.37 0.32 0.16 0.11 0.05 0.04 0.01 0.01 0.01 0.01 0.00 0.00
Cumulative
%
97.06 97.84 98.46 98.92 99.29 99.61 99.76 99.87 99.92 99.96 99.97 99.98 99.99 99.99 100.00 100.00
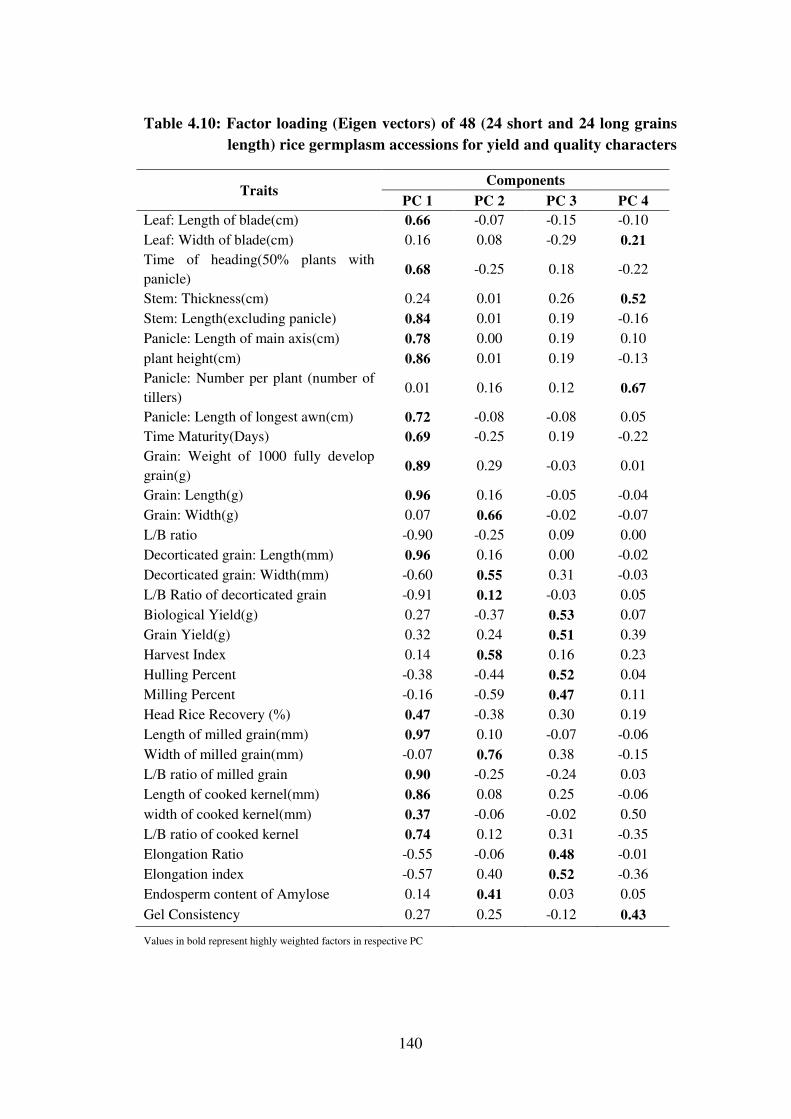
140
Table 4.10: Factor loading (Eigen vectors) of 48 (24 short and 24 long grains
length) rice germplasm accessions for yield and quality characters
Traits Components
PC 1 PC 2 PC 3 PC 4
Leaf: Length of blade(cm) 0.66 -0.07 -0.15 -0.10
Leaf: Width of blade(cm) 0.16 0.08 -0.29 0.21
Time of heading(50% plants with
panicle) 0.68 -0.25 0.18 -0.22
Stem: Thickness(cm) 0.24 0.01 0.26 0.52
Stem: Length(excluding panicle) 0.84 0.01 0.19 -0.16
Panicle: Length of main axis(cm) 0.78 0.00 0.19 0.10
plant height(cm) 0.86 0.01 0.19 -0.13
Panicle: Number per plant (number of
tillers) 0.01 0.16 0.12 0.67
Panicle: Length of longest awn(cm) 0.72 -0.08 -0.08 0.05
Time Maturity(Days) 0.69 -0.25 0.19 -0.22
Grain: Weight of 1000 fully develop
grain(g) 0.89 0.29 -0.03 0.01
Grain: Length(g) 0.96 0.16 -0.05 -0.04
Grain: Width(g) 0.07 0.66 -0.02 -0.07
L/B ratio -0.90 -0.25 0.09 0.00
Decorticated grain: Length(mm) 0.96 0.16 0.00 -0.02
Decorticated grain: Width(mm) -0.60 0.55 0.31 -0.03
L/B Ratio of decorticated grain -0.91 0.12 -0.03 0.05
Biological Yield(g) 0.27 -0.37 0.53 0.07
Grain Yield(g) 0.32 0.24 0.51 0.39
Harvest Index 0.14 0.58 0.16 0.23
Hulling Percent -0.38 -0.44 0.52 0.04
Milling Percent -0.16 -0.59 0.47 0.11
Head Rice Recovery (%) 0.47 -0.38 0.30 0.19
Length of milled grain(mm) 0.97 0.10 -0.07 -0.06
Width of milled grain(mm) -0.07 0.76 0.38 -0.15
L/B ratio of milled grain 0.90 -0.25 -0.24 0.03
Length of cooked kernel(mm) 0.86 0.08 0.25 -0.06
width of cooked kernel(mm) 0.37 -0.06 -0.02 0.50
L/B ratio of cooked kernel 0.74 0.12 0.31 -0.35
Elongation Ratio -0.55 -0.06 0.48 -0.01
Elongation index -0.57 0.40 0.52 -0.36
Endosperm content of Amylose 0.14 0.41 0.03 0.05
Gel Consistency 0.27 0.25 -0.12 0.43
Values in bold represent highly weighted factors in respective PC
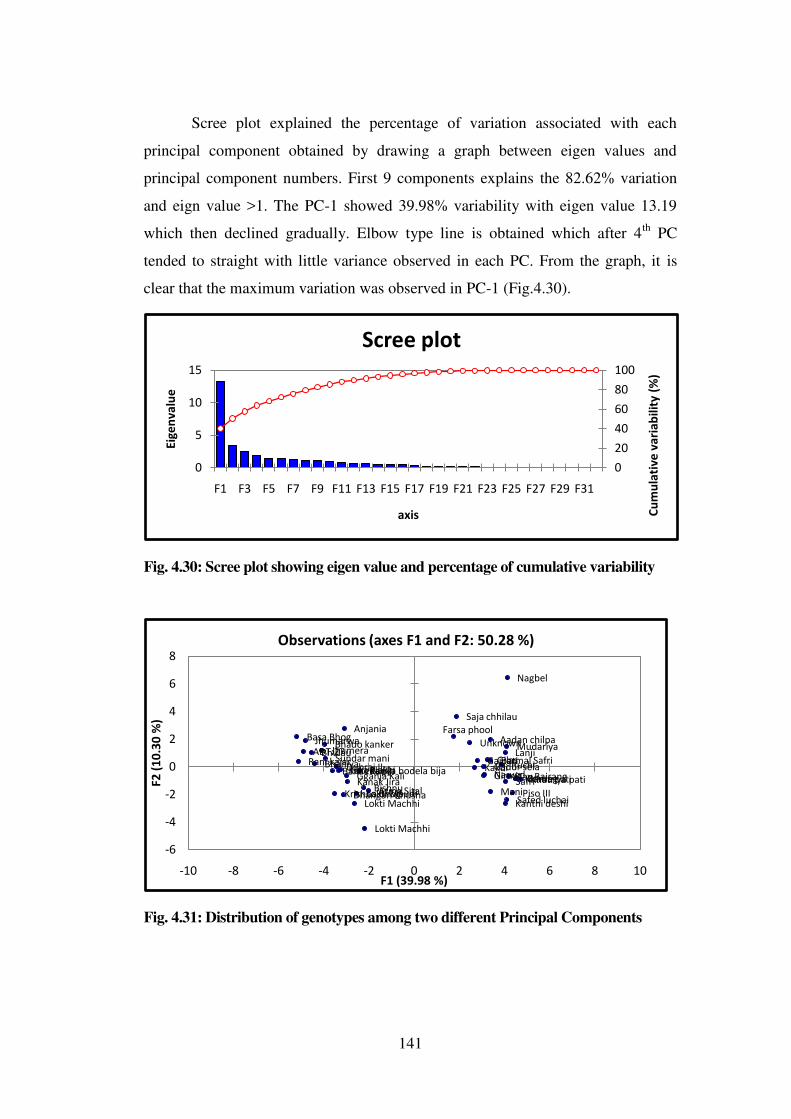
141
Scree plot explained the percentage of variation associated with each
principal component obtained by drawing a graph between eigen values and
principal component numbers. First 9 components explains the 82.62% variation
and eign value >1. The PC-1 showed 39.98% variability with eigen value 13.19
which then declined gradually. Elbow type line is obtained which after 4th
PC
tended to straight with little variance observed in each PC. From the graph, it is
clear that the maximum variation was observed in PC-1 (Fig.4.30).
Fig. 4.30: Scree plot showing eigen value and percentage of cumulative variability
Fig. 4.31: Distribution of genotypes among two different Principal Components
0
20
40
60
80
100
0
5
10
15
F1 F3 F5 F7 F9 F11 F13 F15 F17 F19 F21 F23 F25 F27 F29 F31
Cu
mu
lati
ve
va
ria
bil
ity
(%
)
Eig
en
va
lue
axis
Scree plot
Lokti Machhi
Atma Sital
Lokti Machhi
ADT:27
Anjania
Kanak Jira
Jhumera
Kakeda (I)Dubraj II
BhulauRani kajarSundar mani
Bhado kankerJhumarwa
Bishnu
Basa Bhog
Krishna Bhog
Hira Nakhi
Lokti Maudi
Kariya bodela bijaGganja Kali
Banas KupiII
Dhangari Khusha
Bhaniya
Farsa phool
Jay Bajrang
Gilas
Khatia pati
Mani
Khatriya patiGirmit
Lanji
Banreg
Ruchi
Safed luchaiKanthi deshiPiso III
KakdiGajpati
Gadur sela
Aadan chilpaUnknown
Saja chhilau
Parmal Safri
SafriNarved
Nagbel
Mudariya
-6
-4
-2
0
2
4
6
8
-10 -8 -6 -4 -2 0 2 4 6 8 10
F2
(1
0.3
0 %
)
F1 (39.98 %)
Observations (axes F1 and F2: 50.28 %)
142
The results of the PCA explained the genetic diversity of the long and short
grain accessions of rice. „Proper values‟ measure the importance and contribution
of each component to total variance, whereas each co-efficient of proper factors
indicates the degree of contribution of every original variable with which each
principal component is associated. The higher the coefficients, regardless of the
direction (positive or negative), the more effective they will be in discriminating
between accessions (Sanni et al., 2010).
Within each PC, only highly loaded factors or traits (having absolute values
within 10% of the highest factor loading) were retained for further explanation.
Component matrix revealed that the PC-1 which accounted for the highest
variability (39.98%) was mostly related with traits such as length of milled grain
(0.97) followed by decorticated grain length (0.96), grain length (0.96), L/B ratio
of milled grain (0.90), 1000-grain weight (0.89), plant height (0.86), length of
cooked kernel (0.86), stem length (0.84), panicle length (0.78), L/B ratio of cooked
kernel (0.74), panicle : length of longest awn (0.72), time of maturity (0.69), time
of heading (0.68), leaf : length of blade (0.66), head rice recovery (0.47) and width
of cooked kernel (0.37) (Table-4.10). As a result, the first component differentiated
those accessions that have high length of milled grain, decorticated grain length,
grain length, L/B ratio of milled grain, 1000-grain weight, plant height, length of
cooked kernel, stem length, panicle length, L/B ratio of cooked kernel, time of
maturity, time of heading, leaf: length of blade, head rice recovery and width of
cooked kernel. The second principal component accounted for 10.30% of total
variance. Variables highly and positively correlated were width of milled grain,
grain width, harvest - index, width of decorticated grain, amylase content and L/B
ratio of decorticated grain. The second component thus identified good cooking
quality variables presenting positive contributions and the main characters
responsible for quality characterization. The third principal component accounted
for 7.64% of the variability and was highly loaded with four cooking quality
characters viz., elongation index, elongation ratio, hulling and milling percent as
well as two yield attributing characters i.e. Biological yield and grain yield.
The PC-4 was positively and more related with number of panicle per plant
followed by stem thickness, leaf width of blade and gel consistency. Thus, the
143
prominent characters coming together in different principal components and
contributing towards explaining the variability have the tendency to remain
together which may be kept into consideration during utilization of these characters
in breeding program. From the first four PCs, it was cleared that the PC-1, PC-2
are mostly related to quality characters while PC-3 and Pc-4 are associated with
yield related traits. So, for quality aspect a good breeding programme can be
initiated by selecting the accessions from PC-1 and PC-2. These results are in
agreement with the findings of earlier workers (Ashfaq et al., 2012; Chakraborty et
al., 2013; Sinha and Mishra, 2013 and Nachimuthu et al., 2014).
Top 10 principal component scores (PC scores) for all the accessions were
estimated in four principal components and presented in Table-4.12. These scores
can be utilized to propose precise selection indices whose intensity can be decided
by variability explained by each of the principal component. High PC score for a
particular accession in a particular component denotes high values for the variables
in that particular accession. Perusal of results revealed that the Khatria Pati had
highest PC score followed by Banreg, Khatia Pati, Piso III, Jay Bajrang, Nagbel,
Safed Luchai, Mudariya, Safri and Kanthi Deshi in PC-1 indicated that they had
high quality characters. In PC-2, Nagbel had the highest score followed by Saja
Chhilau, Anjania, Farsa Phool, Basa Bhog, Aadan Chilpa, Jhumarwa, Unknown,
Bhado Kanker and Mudariay for the highly loaded traits of cooking quality. The
highest PC score of PC-3 recorded by Ganja Kali followed by Unknown, Kariya
Bodela Bija, Piso III, Anjania, Safri, Bishnu, Ruchi, Lokti Maudi and Dhangari
Khusha it indicates that they had high yielding characters. In PC-4 Anjania had
highest score followed by Kanthi deshi, Kanak Jira, ADT: 27, Piso III, Bishnu,
Safed luchai, Basa Bhog, Krishna Bhog and Bhulau for yield related trait. On the
basis of top 10 PC scores in each principal component, accessions are selected and
presented in summarized form in Table-4.11.
Thus, it is cleared that the principal component analysis highlights the
characters with maximum variability. So, intensive selection procedures can be
designed to bring about rapid improvement of yield and quality traits. PCA also
help in ranking of genotypes on the basis of PC scores in corresponding
component. From the above results, it is cleared that Nagbel is the best accession
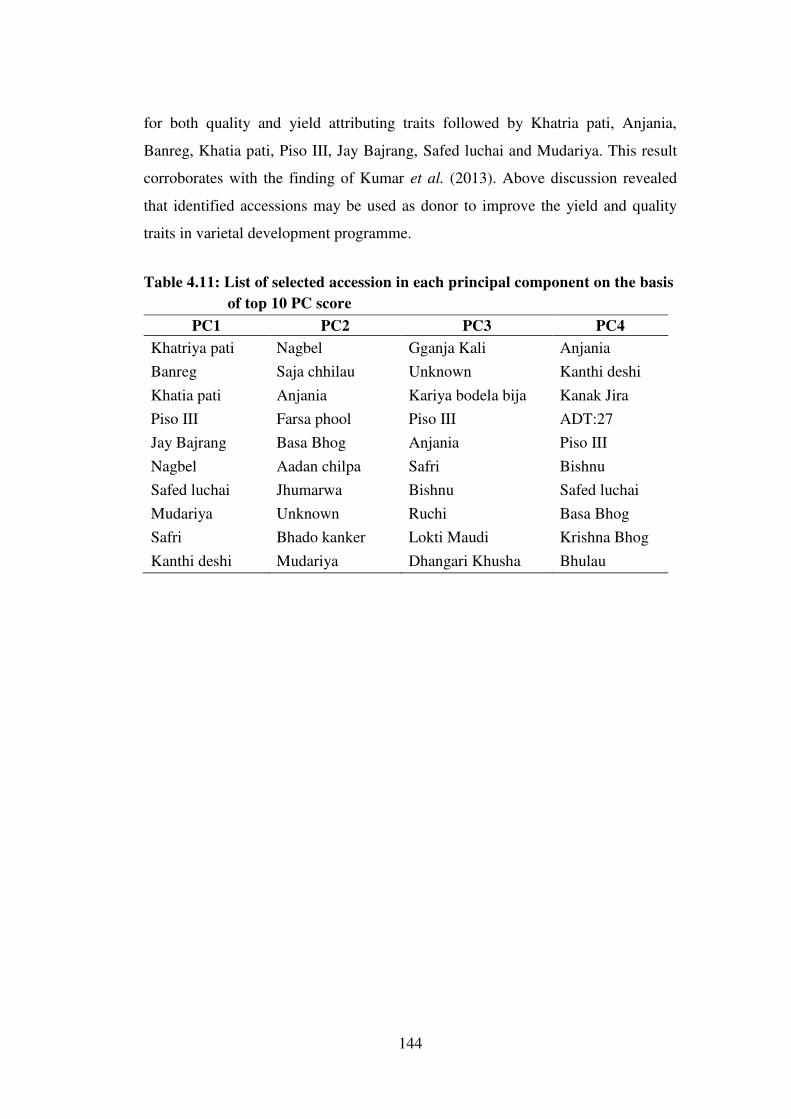
144
for both quality and yield attributing traits followed by Khatria pati, Anjania,
Banreg, Khatia pati, Piso III, Jay Bajrang, Safed luchai and Mudariya. This result
corroborates with the finding of Kumar et al. (2013). Above discussion revealed
that identified accessions may be used as donor to improve the yield and quality
traits in varietal development programme.
Table 4.11: List of selected accession in each principal component on the basis
of top 10 PC score
PC1 PC2 PC3 PC4
Khatriya pati Nagbel Gganja Kali Anjania
Banreg Saja chhilau Unknown Kanthi deshi
Khatia pati Anjania Kariya bodela bija Kanak Jira
Piso III Farsa phool Piso III ADT:27
Jay Bajrang Basa Bhog Anjania Piso III
Nagbel Aadan chilpa Safri Bishnu
Safed luchai Jhumarwa Bishnu Safed luchai
Mudariya Unknown Ruchi Basa Bhog
Safri Bhado kanker Lokti Maudi Krishna Bhog
Kanthi deshi Mudariya Dhangari Khusha Bhulau
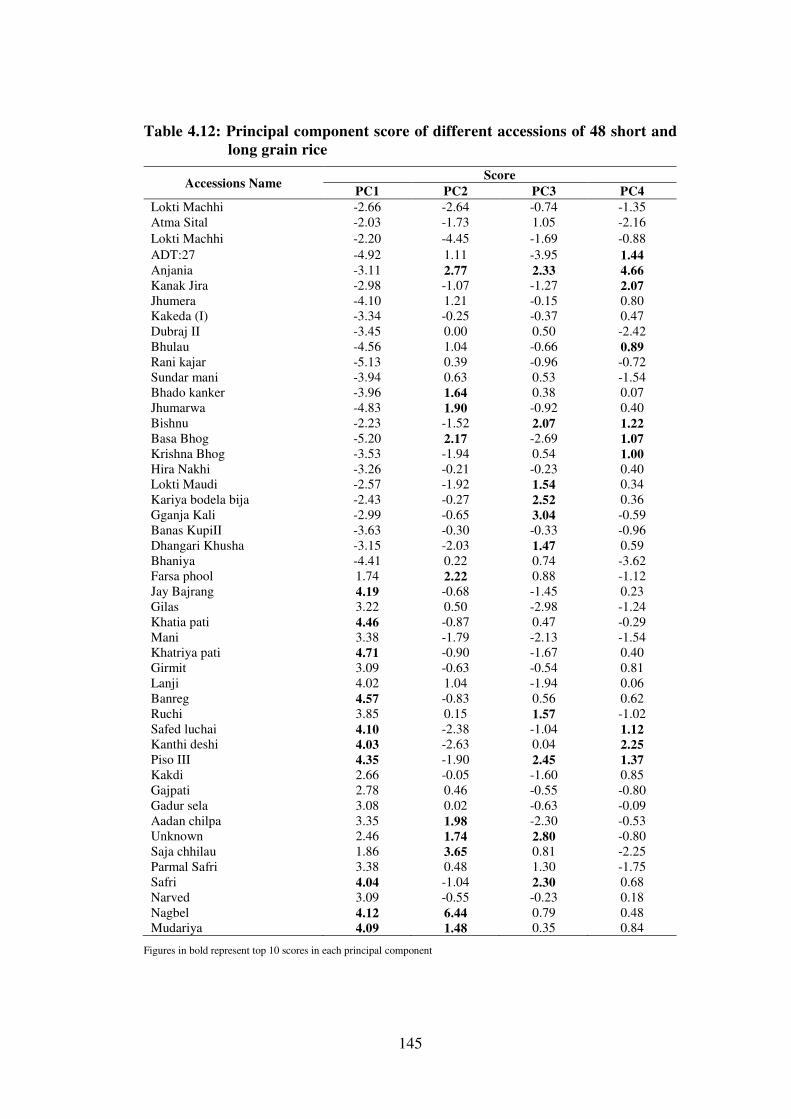
145
Table 4.12: Principal component score of different accessions of 48 short and
long grain rice
Accessions Name Score
PC1 PC2 PC3 PC4
Lokti Machhi -2.66 -2.64 -0.74 -1.35
Atma Sital -2.03 -1.73 1.05 -2.16
Lokti Machhi -2.20 -4.45 -1.69 -0.88
ADT:27 -4.92 1.11 -3.95 1.44
Anjania -3.11 2.77 2.33 4.66
Kanak Jira -2.98 -1.07 -1.27 2.07
Jhumera -4.10 1.21 -0.15 0.80
Kakeda (I) -3.34 -0.25 -0.37 0.47
Dubraj II -3.45 0.00 0.50 -2.42
Bhulau -4.56 1.04 -0.66 0.89
Rani kajar -5.13 0.39 -0.96 -0.72
Sundar mani -3.94 0.63 0.53 -1.54
Bhado kanker -3.96 1.64 0.38 0.07
Jhumarwa -4.83 1.90 -0.92 0.40
Bishnu -2.23 -1.52 2.07 1.22
Basa Bhog -5.20 2.17 -2.69 1.07
Krishna Bhog -3.53 -1.94 0.54 1.00
Hira Nakhi -3.26 -0.21 -0.23 0.40
Lokti Maudi -2.57 -1.92 1.54 0.34
Kariya bodela bija -2.43 -0.27 2.52 0.36
Gganja Kali -2.99 -0.65 3.04 -0.59
Banas KupiII -3.63 -0.30 -0.33 -0.96
Dhangari Khusha -3.15 -2.03 1.47 0.59
Bhaniya -4.41 0.22 0.74 -3.62
Farsa phool 1.74 2.22 0.88 -1.12
Jay Bajrang 4.19 -0.68 -1.45 0.23
Gilas 3.22 0.50 -2.98 -1.24
Khatia pati 4.46 -0.87 0.47 -0.29
Mani 3.38 -1.79 -2.13 -1.54
Khatriya pati 4.71 -0.90 -1.67 0.40
Girmit 3.09 -0.63 -0.54 0.81
Lanji 4.02 1.04 -1.94 0.06
Banreg 4.57 -0.83 0.56 0.62
Ruchi 3.85 0.15 1.57 -1.02
Safed luchai 4.10 -2.38 -1.04 1.12
Kanthi deshi 4.03 -2.63 0.04 2.25
Piso III 4.35 -1.90 2.45 1.37
Kakdi 2.66 -0.05 -1.60 0.85
Gajpati 2.78 0.46 -0.55 -0.80
Gadur sela 3.08 0.02 -0.63 -0.09
Aadan chilpa 3.35 1.98 -2.30 -0.53
Unknown 2.46 1.74 2.80 -0.80
Saja chhilau 1.86 3.65 0.81 -2.25
Parmal Safri 3.38 0.48 1.30 -1.75
Safri 4.04 -1.04 2.30 0.68
Narved 3.09 -0.55 -0.23 0.18
Nagbel 4.12 6.44 0.79 0.48
Mudariya 4.09 1.48 0.35 0.84
Figures in bold represent top 10 scores in each principal component
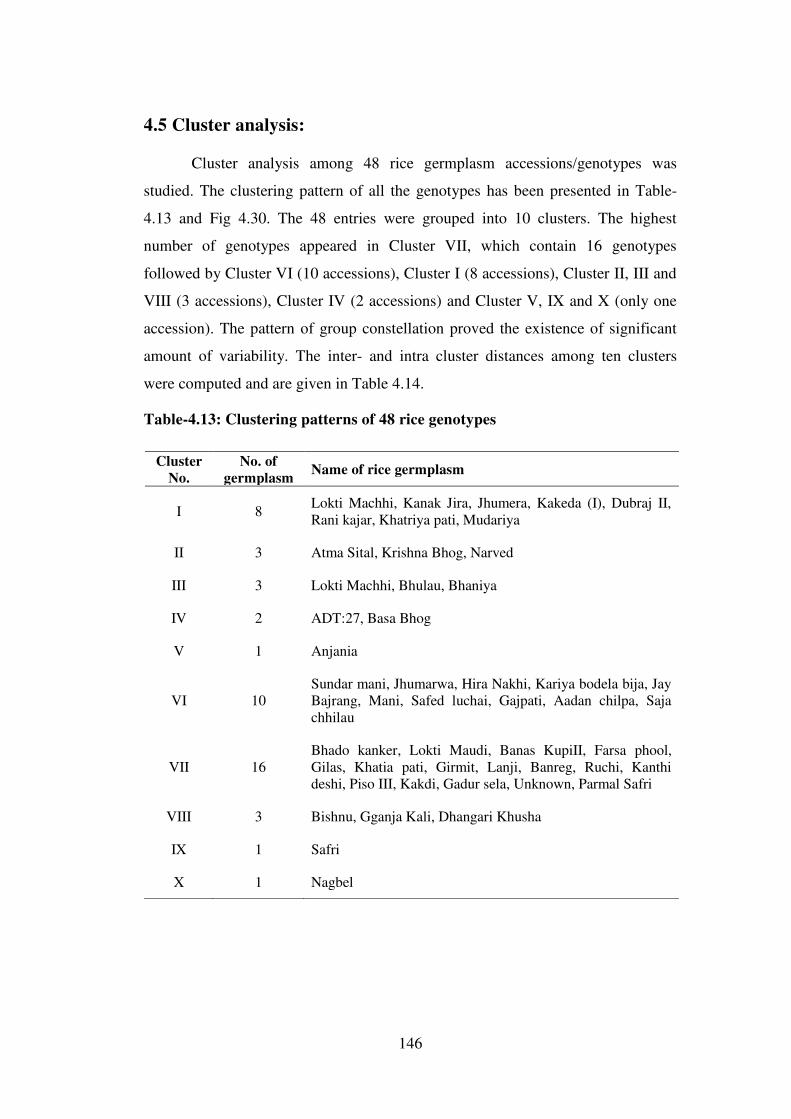
146
4.5 Cluster analysis:
Cluster analysis among 48 rice germplasm accessions/genotypes was
studied. The clustering pattern of all the genotypes has been presented in Table-
4.13 and Fig 4.30. The 48 entries were grouped into 10 clusters. The highest
number of genotypes appeared in Cluster VII, which contain 16 genotypes
followed by Cluster VI (10 accessions), Cluster I (8 accessions), Cluster II, III and
VIII (3 accessions), Cluster IV (2 accessions) and Cluster V, IX and X (only one
accession). The pattern of group constellation proved the existence of significant
amount of variability. The inter- and intra cluster distances among ten clusters
were computed and are given in Table 4.14.
Table-4.13: Clustering patterns of 48 rice genotypes
Cluster
No.
No. of
germplasm Name of rice germplasm
I 8 Lokti Machhi, Kanak Jira, Jhumera, Kakeda (I), Dubraj II,
Rani kajar, Khatriya pati, Mudariya
II 3 Atma Sital, Krishna Bhog, Narved
III 3 Lokti Machhi, Bhulau, Bhaniya
IV 2 ADT:27, Basa Bhog
V 1 Anjania
VI 10
Sundar mani, Jhumarwa, Hira Nakhi, Kariya bodela bija, Jay
Bajrang, Mani, Safed luchai, Gajpati, Aadan chilpa, Saja
chhilau
VII 16
Bhado kanker, Lokti Maudi, Banas KupiII, Farsa phool,
Gilas, Khatia pati, Girmit, Lanji, Banreg, Ruchi, Kanthi
deshi, Piso III, Kakdi, Gadur sela, Unknown, Parmal Safri
VIII 3 Bishnu, Gganja Kali, Dhangari Khusha
IX 1 Safri
X 1 Nagbel
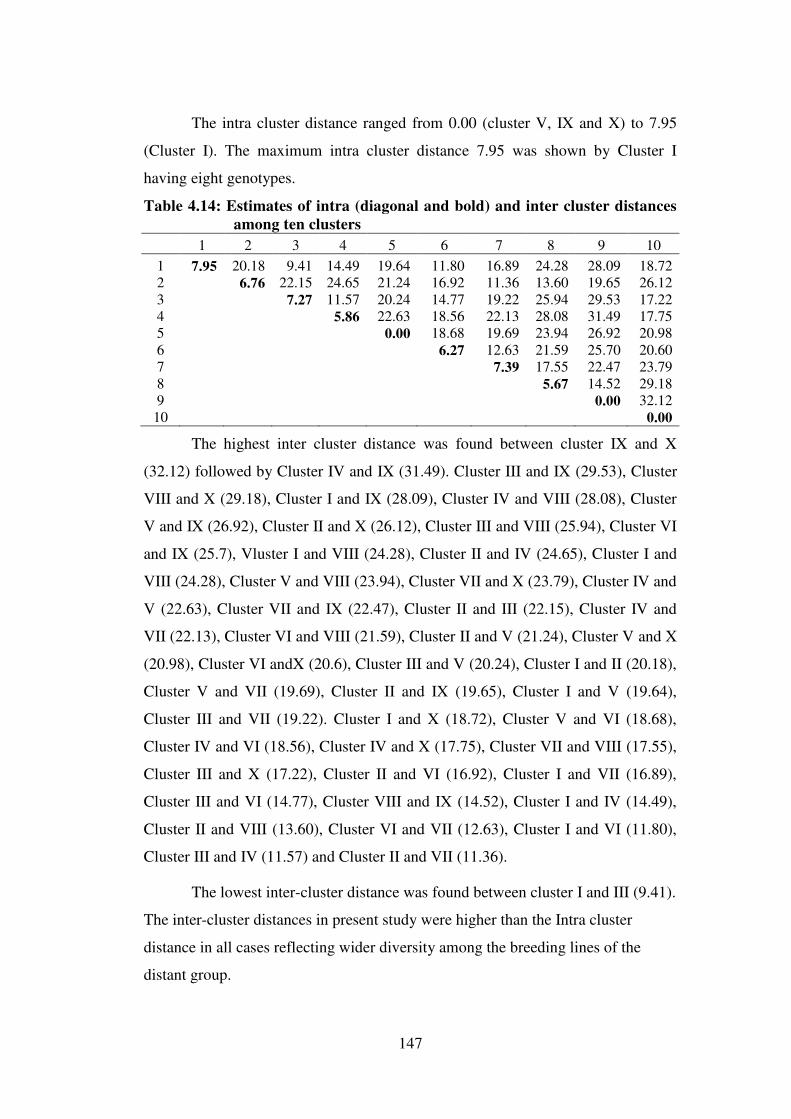
147
The intra cluster distance ranged from 0.00 (cluster V, IX and X) to 7.95
(Cluster I). The maximum intra cluster distance 7.95 was shown by Cluster I
having eight genotypes.
Table 4.14: Estimates of intra (diagonal and bold) and inter cluster distances
among ten clusters
1 2 3 4 5 6 7 8 9 10
1 7.95 20.18 9.41 14.49 19.64 11.80 16.89 24.28 28.09 18.72
2
6.76 22.15 24.65 21.24 16.92 11.36 13.60 19.65 26.12
3
7.27 11.57 20.24 14.77 19.22 25.94 29.53 17.22
4
5.86 22.63 18.56 22.13 28.08 31.49 17.75
5
0.00 18.68 19.69 23.94 26.92 20.98
6
6.27 12.63 21.59 25.70 20.60
7
7.39 17.55 22.47 23.79
8
5.67 14.52 29.18
9
0.00 32.12
10
0.00
The highest inter cluster distance was found between cluster IX and X
(32.12) followed by Cluster IV and IX (31.49). Cluster III and IX (29.53), Cluster
VIII and X (29.18), Cluster I and IX (28.09), Cluster IV and VIII (28.08), Cluster
V and IX (26.92), Cluster II and X (26.12), Cluster III and VIII (25.94), Cluster VI
and IX (25.7), Vluster I and VIII (24.28), Cluster II and IV (24.65), Cluster I and
VIII (24.28), Cluster V and VIII (23.94), Cluster VII and X (23.79), Cluster IV and
V (22.63), Cluster VII and IX (22.47), Cluster II and III (22.15), Cluster IV and
VII (22.13), Cluster VI and VIII (21.59), Cluster II and V (21.24), Cluster V and X
(20.98), Cluster VI andX (20.6), Cluster III and V (20.24), Cluster I and II (20.18),
Cluster V and VII (19.69), Cluster II and IX (19.65), Cluster I and V (19.64),
Cluster III and VII (19.22). Cluster I and X (18.72), Cluster V and VI (18.68),
Cluster IV and VI (18.56), Cluster IV and X (17.75), Cluster VII and VIII (17.55),
Cluster III and X (17.22), Cluster II and VI (16.92), Cluster I and VII (16.89),
Cluster III and VI (14.77), Cluster VIII and IX (14.52), Cluster I and IV (14.49),
Cluster II and VIII (13.60), Cluster VI and VII (12.63), Cluster I and VI (11.80),
Cluster III and IV (11.57) and Cluster II and VII (11.36).
The lowest inter-cluster distance was found between cluster I and III (9.41).
The inter-cluster distances in present study were higher than the Intra cluster
distance in all cases reflecting wider diversity among the breeding lines of the
distant group.
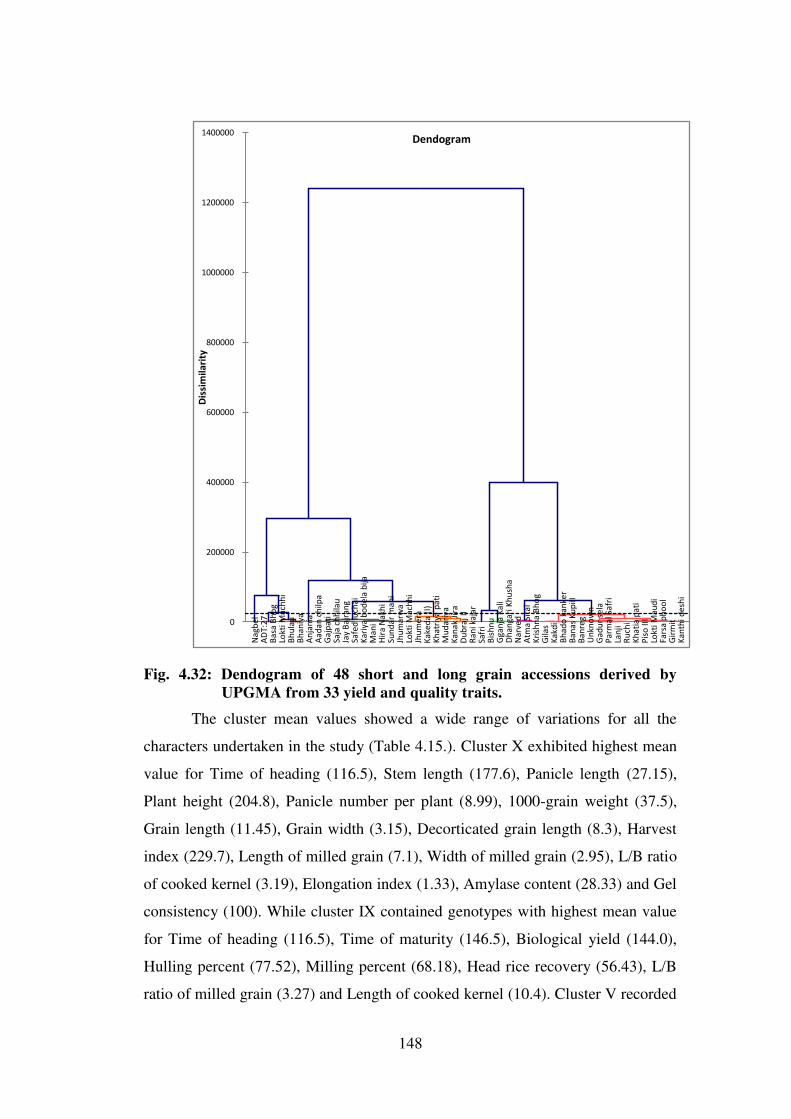
148
Fig. 4.32: Dendogram of 48 short and long grain accessions derived by
UPGMA from 33 yield and quality traits.
The cluster mean values showed a wide range of variations for all the
characters undertaken in the study (Table 4.15.). Cluster X exhibited highest mean
value for Time of heading (116.5), Stem length (177.6), Panicle length (27.15),
Plant height (204.8), Panicle number per plant (8.99), 1000-grain weight (37.5),
Grain length (11.45), Grain width (3.15), Decorticated grain length (8.3), Harvest
index (229.7), Length of milled grain (7.1), Width of milled grain (2.95), L/B ratio
of cooked kernel (3.19), Elongation index (1.33), Amylase content (28.33) and Gel
consistency (100). While cluster IX contained genotypes with highest mean value
for Time of heading (116.5), Time of maturity (146.5), Biological yield (144.0),
Hulling percent (77.52), Milling percent (68.18), Head rice recovery (56.43), L/B
ratio of milled grain (3.27) and Length of cooked kernel (10.4). Cluster V recorded
Na
gb
el
AD
T:2
7B
asa
Bh
og
Lokti
Ma
chh
iB
hu
lau
Bh
an
iya
An
jan
iaA
ad
an
ch
ilp
aG
ajp
ati
Sa
ja c
hh
ila
uJa
y B
ajr
an
gS
afe
d lu
cha
iK
ari
ya
bo
de
la b
ija
Ma
ni
Hir
a N
akh
iS
un
da
r m
an
iJh
um
arw
aLo
kti
Ma
chh
iJh
um
era
Ka
ke
da
(I)
Kh
atr
iya
pa
tiM
ud
ari
ya
Ka
na
k J
ira
Du
bra
j II
Ra
ni ka
jar
Sa
fri
Bis
hn
uG
ga
nja
Ka
liD
ha
ng
ari
Kh
ush
aN
arv
ed
Atm
a S
ita
lK
rish
na
Bh
og
Gila
sK
akd
iB
ha
do
ka
nke
rB
an
as
Ku
piI
IB
an
reg
Un
kn
ow
nG
ad
ur
sela
Pa
rma
l S
afr
iLa
nji
Ru
chi
Kh
ati
a p
ati
Pis
o I
IILo
kti
Ma
ud
iF
ars
a p
ho
ol
Gir
mit
Ka
nth
i d
esh
i
0
200000
400000
600000
800000
1000000
1200000
1400000
Dis
sim
ila
rity
Dendogram
149
highest value for Stem thickness (0.65, Decorticated grain width (2.95), Grain
yield (498.5) and Gel consistency (100) while highest mean value for Leaf width
of blade (0.78), L/B ratio of decorticated grain (0.66) and Gel consistency (100)
was recorded by cluster IV. Cluster I had highest value for Width of cooked kernel
(3.34) and Elongation ratio (1.77) while Cluster II had highest mean value for
Time of maturity (116.5) and Gel consistency (100). Cluster VII had highest mean
value for Leaf length of blade (39.63) and Length of longest awn (1.10) while
highest mean value for Grain L/B ratio (24.65) was recorded for Cluster VIII. This
result are in confirmation with the findings of Chanbeni et al. (2012); Shiva Prasad
et al. (2013); Kumar et al. (2014) Apsath Beevi and Venkatesan (2015) and
Rathore et al. (2016).
The selection and choice of parents mainly depends upon contribution of
characters towards divergence. It is well known that crosses between divergent
parents usually produce greater heterotic effect than between closely related ones.
Considering the importance of genetic distance and relative contribution of
characters towards total divergence, the present study indicated that parental lines
selected from cluster X (Nagbel) for Time of heading, Stem length, Panicle length,
Plant height, Panicle per plant, 1000-grain weight, Grain length, Grain width,
Decorticated grain length, Harvest index, Length of milled grain, L/B ratio of
cooked kernel, Elongation index, Amylose content and Gel consistency could be
used in crossing programmes to achieve desired segregants.
150
Table 4.15a: Cluster mean for quantitative characters in 48 aromatic landraces of C.G.
Cluster 1 2 3 4 5 6 7 8 9 10 11 12 13 14 15 16
1 36.37 0.74 109.94 0.43 134.71 21.14 155.85 7.36 0.33 139.25 19.53 7.09 2.55 21.30 5.05 2.41
2 32.40 0.68 116.50 0.42 139.87 23.78 163.65 7.62 0.00 145.83 16.45 7.02 2.28 22.52 5.25 2.22
3 34.05 0.72 109.83 0.43 126.37 18.62 144.98 7.04 0.00 137.83 13.18 5.77 2.28 24.31 4.22 2.43
4 33.38 0.78 89.50 0.48 84.10 20.45 104.55 7.83 0.00 117.50 16.85 5.75 2.75 20.62 4.18 2.48
5 29.30 0.75 113.00 0.65 100.70 19.60 120.30 8.93 0.00 141.00 16.45 5.85 2.40 24.11 4.15 2.95
6 34.56 0.66 113.05 0.45 148.75 22.07 170.82 6.99 0.55 141.85 24.27 8.78 2.58 17.47 6.13 2.41
7 39.63 0.74 115.28 0.50 152.53 24.42 176.94 7.43 1.10 144.78 25.18 9.69 2.52 15.69 6.70 2.18
8 31.48 0.58 107.67 0.48 131.90 22.95 154.85 7.76 0.00 137.00 16.70 5.57 2.27 24.65 4.15 2.57
9 37.80 0.75 116.50 0.45 165.00 25.85 190.85 8.57 0.75 146.50 29.30 10.45 2.40 14.02 7.90 2.15
10 38.10 0.75 116.50 0.40 177.60 27.15 204.75 8.99 0.95 144.50 37.50 11.45 3.15 12.62 8.30 2.65
1 = Leaf: Length of blade ; 2 = Leaf: Width of blade ; 3 = Time of heading(50% plants with panicle) ; 4 = Stem: Thickness ; 5 = Stem: Length(excluding panicle) ; 6
= Panicle: Length of main axis ; 7 = plant height ; 8 = Panicle: Number per plant (number of tillers) ; 9 = Panicle: Length of longest awn ; 10 = Time Maturity(Days) ;
11 = Grain: Weight of 1000 fully develop grain ; 12 = Grain: Length ; 13 = Grain: Width ; 14 = L/B ratio ; 15 = Decorticated grain: Length ; 16 = Decorticated grain:
Width ; 17 = L/B Ratio of decorticated grain ; 18 = Biological Yield(gm) ; 19 = Grain Yield(gm) ; = 20 Harvest Index ; 21 = Hulling Percent ; 22 = Milling Percent ;
23 = Head Rice Recovery ; 24 = Length of milled grain ; 25 = Width of milled grain ; 26 = L/B ratio of milled grain ; 27 = Length of cooked kernel ; 28 = Width of
cooked kernel ; 29 = L/B ratio of cooked kernel ; 30 = Elongation Ratio ; 31 = Elongation index ; 32 = Endosperm content of Amylose ; 33 = Gel Consistency.
151
Table: 4.15b Cluster mean for quantitative characters in 48 aromatic landraces of C.G.
Cluster 17 18 19 20 21 22 23 24 25 26 27 28 29 30 31 32 33
1 0.55 690.81 140.56 20.37 74.05 62.55 49.43 4.54 2.20 2.10 7.81 3.34 2.32 1.77 1.18 21.65 92.00
2 0.47 1079.00 174.50 16.99 74.35 63.21 48.36 4.75 2.05 2.30 7.50 2.88 2.60 1.64 1.17 21.08 100.00
3 0.55 571.33 114.17 22.16 77.28 64.84 44.36 3.80 2.17 1.84 6.53 3.02 2.23 1.72 1.30 20.60 60.00
4 0.66 445.25 75.50 16.30 68.69 57.88 42.82 3.78 2.23 1.71 5.88 2.90 2.02 1.56 1.20 22.67 100.00
5 0.58 760.00 498.50 111.98 70.55 58.87 48.51 3.90 2.75 1.42 6.80 3.70 1.84 1.74 1.30 22.21 100.00
6 0.46 797.20 181.35 23.08 69.79 59.05 49.26 5.58 2.27 2.57 8.32 3.29 2.55 1.57 1.09 22.02 91.65
7 0.40 927.09 190.91 20.50 71.00 62.47 50.28 6.02 2.29 2.67 9.45 3.27 2.90 1.59 1.13 23.21 92.50
8 0.54 1247.33 213.67 17.46 77.30 67.83 55.26 3.98 2.28 1.75 6.82 3.03 2.28 1.71 1.30 21.38 77.17
9 0.30 1439.50 284.50 20.71 77.52 68.18 56.43 6.70 2.05 3.27 10.40 3.05 3.41 1.55 1.05 28.23 98.00
10 0.38 430.00 259.00 229.71 64.34 54.58 46.27 7.10 2.95 2.41 10.35 3.25 3.19 1.46 1.33 28.33 100.00
1 = Leaf: Length of blade ; 2 = Leaf: Width of blade ; 3 = Time of heading(50% plants with panicle) ; 4 = Stem: Thickness ; 5 = Stem: Length(excluding panicle) ; 6
= Panicle: Length of main axis ; 7 = plant height ; 8 = Panicle: Number per plant (number of tillers) ; 9 = Panicle: Length of longest awn ; 10 = Time Maturity(Days) ;
11 = Grain: Weight of 1000 fully develop grain ; 12 = Grain: Length ; 13 = Grain: Width ; 14 = L/B ratio ; 15 = Decorticated grain: Length ; 16 = Decorticated grain:
Width ; 17 = L/B Ratio of decorticated grain ; 18 = Biological Yield(gm) ; 19 = Grain Yield(gm) ; = 20 Harvest Index ; 21 = Hulling Percent ; 22 = Milling Percent ;
23 = Head Rice Recovery ; 24 = Length of milled grain ; 25 = Width of milled grain ; 26 = L/B ratio of milled grain ; 27 = Length of cooked kernel ; 28 = Width of
cooked kernel ; 29 = L/B ratio of cooked kernel ; 30 = Elongation Ratio ; 31 = Elongation index ; 32 = Endosperm content of Amylose ; 33 = Gel Consistency.
152
Cluster analysis is one of the useful tools for selection and efficient use of
parents in hybridization program to develop high yielding potential
cultivars/hybrids. The better genotypes can be selected for most of the
characters on the basis of mean performance of the genotypes in the cluster.
The value of percentage contribution of 33 characters (Table: 4.16), included in
cluster analysis, towards divergence ranged from time of maturity (0.67) to
length of longest awn (cm) (16.74). Highest percentage contribution towards
divergence was recorded by trait, length of longest awn (16.74) followed by
harvest index (%) (14.04), 1000-grain weight (4.41), grain yield (g) (4.22), L/B
ratio of milled grain (3.71), grain length (3.53), L/B ratio of decorticated grain
(3.46), decorticated grain length (3.40), grain L/B ratio (3.29), length of milled
grain (3.27), biological yield (2.85), elongation index (2.71), length of cooked
kernel (2.62), L/B ratio of cooked kernel(2.39), amylase content (2.11),
decorticated grain width (1.80), stem length (1.79), leaf : length of blade (1.68),
grain width (1.65), width of milled grain (1.60), leaf width of blade (1.57),
number of panicle per plant (1.54), width of cooked kernel (1.33), milling
percent (1.17), hulling percent (0.93), time of heading (0.82) and time of the
maturity (0.67). The result is in agreement with Rashid et al. (2014) and
Ayesha et al. (2015).
153
Table: 4.16 Percent contribution of each character
S. No. Variable % contribution of each
character
1 Leaf: Length of blade(cm) 1.68
2 Leaf: Width of blade(cm) 1.57
3 Time of heading(50% plants with
panicle) 0.82
4 Stem: Thickness(cm) 1.81
5 Stem: Length(excluding panicle)(cm) 1.79
6 Panicle: Length of main axis(cm) 1.74
7 plant height(cm) 1.72
8 Panicle: Number per plant (number of
tillers) 1.54
9 Panicle: Length of longest awn(cm) 16.74
10 Time Maturity(Days) 0.67
11 Grain: Weight of 1000 fully develop
grain(g) 4.41
12 Grain: Length(mm) 3.53
13 Grain: Width(mm) 1.65
14 L/B ratio 3.29
15 Decorticated grain: Length(mm) 3.40
16 Decorticated grain: Width(mm) 1.80
17 L/B Ratio of decorticated grain 3.46
18 Biological Yield(g) 2.85
19 Grain Yield(g) 4.22
20 Harvest Index 14.04
21 Hulling Percent 0.93
22 Milling Percent 1.17
23 Head Rice Recovery (%) 1.83
24 Length of milled grain(mm) 3.27
25 Width of milled grain(mm) 1.60
26 L/B ratio of milled grain 3.71
27 Length of cooked kernel(mm) 2.62
28 width of cooked kernel(mm) 1.33
29 L/B ratio of cooked kernel 2.39
30 Elongation Ratio 1.74
31 elongation index 2.71
32 Endosperm content of Amylose 2.11
33 Gel Consistency 1.84

154
4.6 Molecular Characterization:
Grain size and weight contribute for crop yield in cereals, whereas in rice, grain
size and shape are major criteria to assess market value and to classify rice genotypes.
Grain size with its dimensions for length and width has become a target trait for rice
breeding in recent years (Xing & Zhang, 2010). Preferences for grain size and grain
shape varies widely between countries; some like long and cylindrical grains (USA and
Europe) and others go for short and round grains including China, Japan, and Korea
(Bai et al., 2010). Rice varieties show huge amount of variation in grain size (Juliano
&Villareal, 1993).
Many individual quantitative trait loci (QTLs) studies for grain size have been
carried out. These individual studies reported hundreds of QTLs, out of which very few
were reported by dozens of studies with different genetic background (Lin et at., 1995;
Tan et al., 2000; Thomson et al., 2003: Li et al., 2004; Lei et al., 2006; Bai et al., 2010;
Shao et al., 2010). Out of many independent studies for identification of QTLs for grain
length in rice, located on chromosome 3 and chromosome 7 has been reported number
of times in different genetic background. Tsunematsu et al. (1996) mapped two QTLs
for grain length on chromosomes 3 and 7, by using F7 population derived from a cross
between Asominari and IR64. Redona & Mackill (1998) also found seven QTLs for
grain length and grain shape were mostly controlled by loci on chromosomes 3 and
chromosomes 7. Tan et al., (2000) identified the QTLs for appearance characteristics of
rice, and suggested that grain length and grain width were individually controlled by
one or two major QTLs and minor QTLs. Numbers of grain length genes was reported
by Wan et al., (2006) on chromosome 2, 3, 5, 7 & 9 with varying phenotypic variation
5.8 to 35.6 in three different environments using SSR and EST markers. Dong & Zheng
(2002) studied steamed-rice shape and detected three QTLs for length on chromosomes
2, 3 and 10.
The outcome of several studies resulted in identification of QTL for grain length
or grain size on chromosome 3 by using different genetic background with biparental
populations originating from indica/ indica and indica/japonica crosses (Li et al., 1997;
Yu et al., 1997; Xiao et al., 1996; Redona & Mackill 1998; Kubo et al., 2001; Xing et
155
al., 2002; Moncada et al., 2001). Bai et al., (2010) reported QTL for grain length on
chromosome 7. Shao et al., (2010) also reported QTL on chromosome 7 placed about
13.2 cM away from the QTL qGL7. The genetic separation between these two loci
implies that they are distinct from each other. Xu et al., (2002) also identified a QTL
associated with variation for grain length (13.9% phenotypic variance) near to the
location of qGL7-2. A QTL was found associated with grain length between the interval
of SSR markers RM505 and RM248 on chromosome 7 by Zheng et al., (2007). The
main aim of this study was to evaluate the correlation between phenotypic diversity
analysis and genetic phylogenetic analysis of chromosomes 3 and 7 based on grain
length variations.
4.6.1 Development of genotypic data based on SSR and ISSR Markers
Total genomic DNA was extracted from 48 lines viz., 24 long grain lengths and
24 short grain length of rice using CTAB method (Zheng et al., 1995). Fresh and
healthy leaves were used for extraction of DNA. The DNA samples were quantified by
using Nano Drop Spectroscopy (NANODROP 2000c). The quantity of the samples was
found in the range from 500-2000 ηg/μl. DNA samples were then diluted with sterilized
water such that the final concentration of DNA became 50 ηg/μl.
Grain length variation: Phenotypic analysis of 48 rice accessions, showed statistically
significant difference in grain length. Grain length variation ranged from 5.2 mm to 11.8
mm. The average grain length was 8.2 mm was found among these accessions.
Maximum grain length was found in Jay Bajrang (11.8 mm) followed by Nagbel (11.5
mm) and Khatriya Pati (11.4 mm). The minimum grain length was found in Rani Kajar
and Jhumarwa (5.2 mm).
4.6.1.1 SSR marker analysis
Genetic associations among 48 accessions were analyzed, based on phenotypic
variation of grain length with the help of 59 SSR markers covering all the
chromosomes. Out of 59 SSR markers, six primers were found monomorphic across all
accessions. A total of 199 alleles were amplified and the number of alleles per locus
156
generated by each marker ranged from 1 to 11 alleles with an average number of 3.37
alleles per locus. Maximum number of alleles (11) was amplified by marker RM 1
marker. The PIC value across markers ranged from 0 to 0.87 with an average of 0.47.
Maximum PIC on chromosome 1 was 0.87 at marker RM 1 followed by RM 19 (0.85)
and RM 135 (0.81).
Table 4.17: List of 59 microsatellite markers with their chromosome locations,
number of alleles, allele size and PIC value found among 48 rice
accessions
S. No. Marker Amplicon
Size
No. of
Alleles
Chromosome
No. #
PIC Value
1 RM 1 67-119 11 1 0.87
2 RM 5 94-138 6 1 0.74
3 RM11 118-151 3 7 0.49
4 RM 19 192-250 10 12 0.85
5 RM 25 121-159 6 8 0.79
6 RM 30 100-140 1 6 0
7 RM 104 222-238 1 1 0
8 RM 105 100-141 4 9 0.59
9 RM 125 105-147 3 7 0.12
10 RM 130 73-81 2 3 0.22
11 RM 132 70-85 2 3 0.5
12 RM 134 92-94 2 7 0.04
13 RM 135 100-150 7 3 0.81
14 RM 148 190-210 4 3 0.65
15 RM 152 133-157 3 8 0.64
16 RM 154 148-230 3 2 0.55
17 RM 161 154-187 3 5 0.28
18 RM 168 96-116 2 3 0.64
19 RM 171 307-347 5 10 0.77
20 RM 172 159-165 2 7 0.49
21 RM 175 80-95 2 3 0.15
22 RM 186 115-132 3 3 0.51
23 RM 201 155-350 2 9 0.48
24 RM 215 126-161 3 9 0.38
25 RM 218 100-120 4 3 0.64
26 RM 231 157-182 3 3 0.55
27 RM 234 133-163 3 7 0.26
157
28 RM 242 200-290 4 9 0.32
29 RM 248 75-100 4 7 0.53
30 RM 287 82-118 3 11 0.46
31 RM 316 194-216 3 9 0.55
32 RM 338 178-184 2 3 0.35
33 RM 408 112-128 2 8 0.50
34 RM 422 385-450 5 3 0.76
35 RM 431 233-261 2 1 0.25
36 RM 432 150-187 5 7 0.76
37 RM 433 216-248 2 8 0.49
38 RM 436 83-134 4 7 0.66
39 RM 447 95-146 4 8 0.72
40 RM 455 127-144 6 7 0.79
41 RM 468 260-350 4 3 0.72
42 RM 481 95-200 6 7 0.79
43 RM 489 248-314 3 3 0.29
44 RM 501 130-179 3 7 0.53
45 RM 517 260-287 3 3 0.57
46 RM 520 200-290 4 3 0.69
47 RM 523 130-150 3 3 0.55
48 RM 527 200-233 2 6 0.33
49 RM 545 150-230 3 3 0.53
50 RM 546 115-150 1 3 0
51 RM 560 237-368 3 7 0.52
52 RM 569 170-185 2 3 0.15
53 RM 22565 200-280 5 8 0.55
54 RM 22710 150-180 1 8 0.44
55 RM 3825 147-200 3 1 0.7
56 OSR-13 85-122 2 8 0
57 Xa- 5 S 300 1 5 0
58 Xa-13 Pro 290-610 1 8 0
59 Xa-21 800-1200 3 11 0.23
4.6.1.1a Similarity coefficient analysis and Clustering:
Many studies have also reported significantly greater allelic diversity of
microsatellite markers than other molecular markers (McCouch et. al., 2001).
Microsatellite markers (SSR) are also used to detect the genetic similarity of long and
158
short grain accessions of rice under study. The genetic similarity coefficient ranged
from 0.21-0.93 as revealed by UPGMA cluster analysis using the 59 SSR markers. Rice
similarity index revealed that high degree of similarity to the extent of 93% exists
between Anjania, Kanak Jira and Jhumera. Similar studies were made by different
authors using SSR markers (Pal et al., 2003; Chakravarthi and Naravaneni, 2006). Three
major clusters were formed 1st cluster consist of 22 genotypes whereas 2
nd cluster
consisted of 20 and 3rd
cluster consist of 6 genotypes (Fig. 4.32).
The accessions that are derivatives of genetically similar dropped in one group.
In UPGMA tree, the accessions within group 1, 2 and 3 clustered into smaller sub
groups based on short and long grains. Group I had twenty-two accessions at 47%
similarity and is further subdivided into 3 sub-clusters. Sub-cluster I consisted of eight
genotypes which fall into category of long grains, it consisted of Farsa Phool, Jay
Bajarang, Khatriya Pati, Khatiya Pati, Gilas, Mani, Lanji and Girmit. Sub-cluster II
consists of nine short grains genotypes which are ADT: 27, Anjania, Kanak Jira,
Jhumera, Sundar Mani, Kakeda I, Bhulau, Rani Kajar, Dubraj II. Sub-cluster III consists
of five genotypes in which Atma Sital is short grain genotype whereas Banreg, Safed
luchai, Ruchi and Kanthi deshi are long grain genotypes.
Group II consists of twenty genotypes at 39% similarity and is further sub-
divided into three sub-clusters. Sub-cluster I had seven long grain accessions which are,
Kakdi, Piso III, Gjpati, Gadursela, Aadan chilpa, Unknown, Saja Chhilau. Sub-cluster II
had eight genotypes among them Parmal Safri, Safri, Narved, Nagbel and Mudariya are
long grain genotypes whereas Bhado Kanker, Jhumarwa, and Bishnu are short grain
genotypes. Sub-cluster III consists of five short grain genotypes which are Hira Nakhi,
Ganja Kali, Dhangri Khusha, Banas Kupi II and Basa Bhog.
Group III consists of six short grain genotypes at 27% similarity and is
comprised of Lokti Machhi, Lokti Machhi (CGR No. 10029), Krishna Bhog, Lokti
Maudi, Kariya Bodela Bija and Bhaniya. Similar kind of findings has been reported by
Kashif and Arif (2014), Singh and Singh (2012).
159
Fig: 4.33: UPGMA-based molecular dendogram of SSR marker showing 48 rice
germplasm
4.6.1.1b Polymorphism Information Content of SSR markers:
Polymorphism Information Content provides an estimate of determining power
of a marker based on the number of alleles at a locus and relative frequencies of these
alleles. PIC value represents the relative informativeness of each marker and in the
present study, PIC value ranged between 0 for RM 30, RM 104, RM 546, OSR-13, Xa-
5S, Xa-13 Pro to 0.87 for RM 1 followed by 0.85 for RM 19 and 0.81 for RM 135 with
an average PIC value of 0.47 (Fig: 4.34).
160
Fig4.34: PCR amplification of 48 short (24) and long (24) grain accessions of rice
with SSR primer RM 22565 and RM 520.
161
Fig 4.35: Graphical representation of PIC value of SSR markers
162
4.6.1.2 ISSR marker analysis:
A total of 10 ISSR primers were taken for this study. The 10 primers
yielded a total of 46 amplified fragments from 48 rice genotypes and out of these,
29 alleles were polymorphic (Table 4.18). The number of scorable bands produced
per primer ranged from 2 to 6 with an average of 4.6, and the average number of
polymorphic fragments per primer was 2.9. The banding profile and polymorphism
generated using one of the primers (UBC 834 and UBC 842) is shown in Fig 4.35.
The highest number of alleles (6) was detected on each of locus UBC 809, UBC
834, UBC 841, UBC 842, UBC 873 and the lowest number of alleles (2) was
detected on locus UBC 824. Out of 10 ISSR markers, two makers UBC 818, UBC
885 exhibited monomorphic reaction for all the accessions whereas rest 8 showed
polymorphic reaction. The polymorphism percentage ranged from 33.33% (primer
UBC 834) to 100% (primer UBC 824, UBC 841, UBC 856) with an average
polymorphism of 60% across all the 48 long and short grain length rice genotypes.
Similar to our study, Ben El Maati et al. (2004) and Fatehi et al. (2011) have found
moderate level of average polymorphism (45%) in their studies. High level of
polymorphism has been reported by Sofalian et al. (2008), Zhu et al. (2011) and
Sadigova et al. (2014). The suitability of the ISSR technique for genetic diversity
studies and germplasm evaluations has been shown in many studies (Shukla et al.,
2011, Tiwari et al., 2013, Kumbhar et al., 2013, Samal et al., 2014 and Singh et
al., 2015).
4.6.1.2a Similarity coefficient analysis and Clustering
The relationships among rice genotypes were estimated by a UPGMA
cluster analysis of genetic similarity matrices. ISSR similarity coefficient between
different genotypes ranged from 0.52 to 1.00. Two major clusters were formed and
are sub-divided into three sub-clusters. 1st cluster consists of 24 genotypes whereas
2nd
cluster also consisted of 24 rice genotypes (Fig4.35).
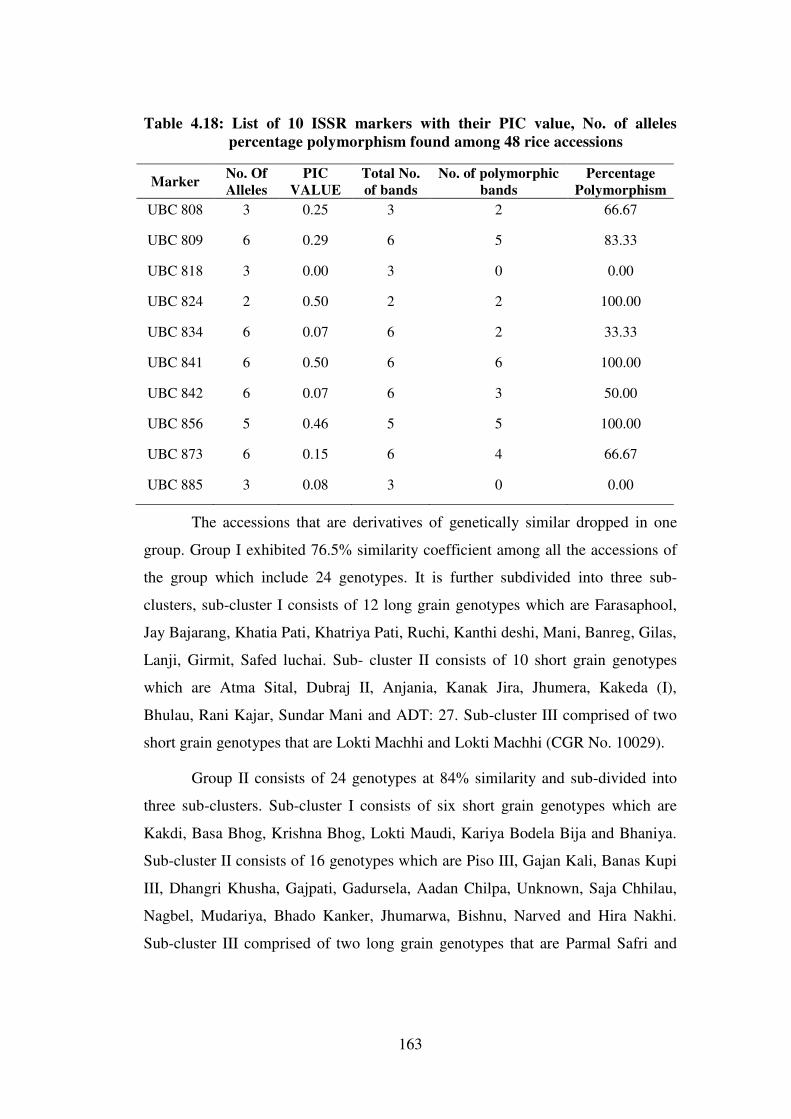
163
Table 4.18: List of 10 ISSR markers with their PIC value, No. of alleles
percentage polymorphism found among 48 rice accessions
Marker No. Of
Alleles
PIC
VALUE
Total No.
of bands
No. of polymorphic
bands
Percentage
Polymorphism
UBC 808 3 0.25 3 2 66.67
UBC 809 6 0.29 6 5 83.33
UBC 818 3 0.00 3 0 0.00
UBC 824 2 0.50 2 2 100.00
UBC 834 6 0.07 6 2 33.33
UBC 841 6 0.50 6 6 100.00
UBC 842 6 0.07 6 3 50.00
UBC 856 5 0.46 5 5 100.00
UBC 873 6 0.15 6 4 66.67
UBC 885 3 0.08 3 0 0.00
The accessions that are derivatives of genetically similar dropped in one
group. Group I exhibited 76.5% similarity coefficient among all the accessions of
the group which include 24 genotypes. It is further subdivided into three sub-
clusters, sub-cluster I consists of 12 long grain genotypes which are Farasaphool,
Jay Bajarang, Khatia Pati, Khatriya Pati, Ruchi, Kanthi deshi, Mani, Banreg, Gilas,
Lanji, Girmit, Safed luchai. Sub- cluster II consists of 10 short grain genotypes
which are Atma Sital, Dubraj II, Anjania, Kanak Jira, Jhumera, Kakeda (I),
Bhulau, Rani Kajar, Sundar Mani and ADT: 27. Sub-cluster III comprised of two
short grain genotypes that are Lokti Machhi and Lokti Machhi (CGR No. 10029).
Group II consists of 24 genotypes at 84% similarity and sub-divided into
three sub-clusters. Sub-cluster I consists of six short grain genotypes which are
Kakdi, Basa Bhog, Krishna Bhog, Lokti Maudi, Kariya Bodela Bija and Bhaniya.
Sub-cluster II consists of 16 genotypes which are Piso III, Gajan Kali, Banas Kupi
III, Dhangri Khusha, Gajpati, Gadursela, Aadan Chilpa, Unknown, Saja Chhilau,
Nagbel, Mudariya, Bhado Kanker, Jhumarwa, Bishnu, Narved and Hira Nakhi.
Sub-cluster III comprised of two long grain genotypes that are Parmal Safri and
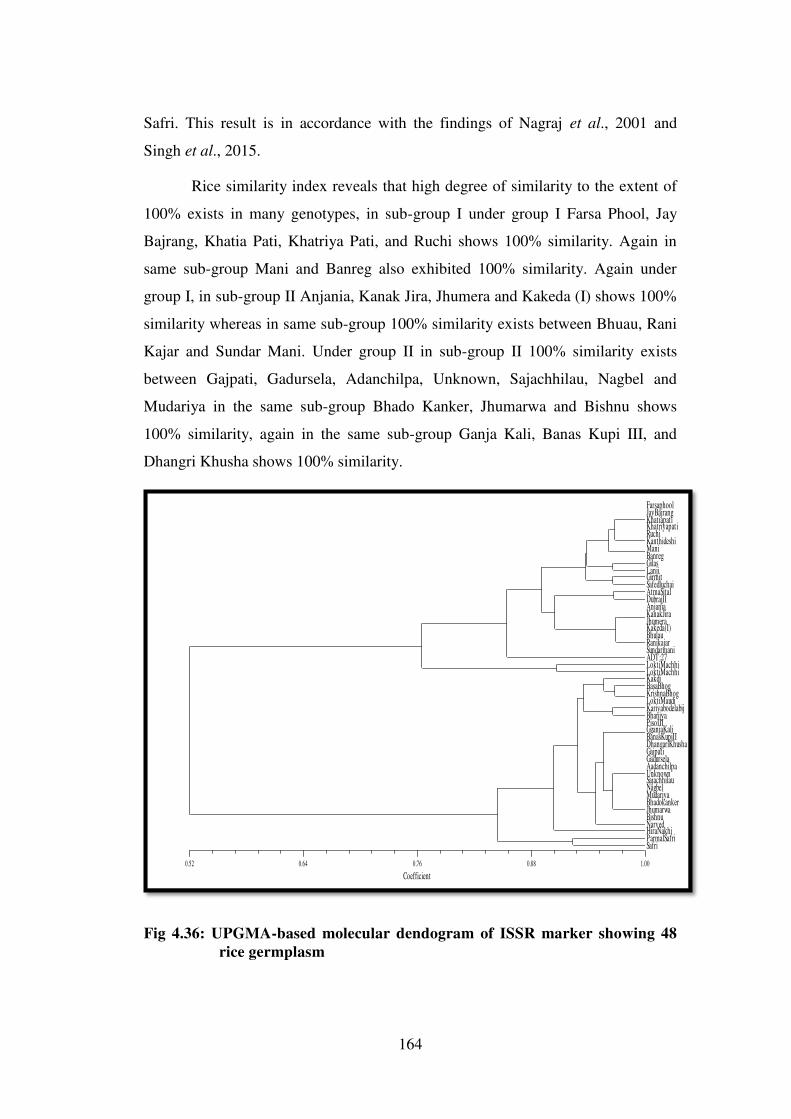
164
Safri. This result is in accordance with the findings of Nagraj et al., 2001 and
Singh et al., 2015.
Rice similarity index reveals that high degree of similarity to the extent of
100% exists in many genotypes, in sub-group I under group I Farsa Phool, Jay
Bajrang, Khatia Pati, Khatriya Pati, and Ruchi shows 100% similarity. Again in
same sub-group Mani and Banreg also exhibited 100% similarity. Again under
group I, in sub-group II Anjania, Kanak Jira, Jhumera and Kakeda (I) shows 100%
similarity whereas in same sub-group 100% similarity exists between Bhuau, Rani
Kajar and Sundar Mani. Under group II in sub-group II 100% similarity exists
between Gajpati, Gadursela, Adanchilpa, Unknown, Sajachhilau, Nagbel and
Mudariya in the same sub-group Bhado Kanker, Jhumarwa and Bishnu shows
100% similarity, again in the same sub-group Ganja Kali, Banas Kupi III, and
Dhangri Khusha shows 100% similarity.
Fig 4.36: UPGMA-based molecular dendogram of ISSR marker showing 48
rice germplasm
Coefficient
0.52 0.64 0.76 0.88 1.00
Farsaphool JayBajrang Khatiapati Khatriyapati Ruchi Kanthideshi Mani Banreg Gilas Lanji Girmit Safedluchai AtmaSital DubrajII Anjania KanakJira Jhumera Kakeda(I) Bhulau Ranikajar Sundarmani ADT:27 LoktiMachhi LoktiMachhi Kakdi BasaBhog KrishnaBhog LoktiMaudi Kariyabodelabij Bhaniya PisoIII GganjaKali BanasKupiII DhangariKhusha Gajpati Gadursela Aadanchilpa Unknown Sajachhilau Nagbel Mudariya Bhadokanker Jhumarwa Bishnu Narved HiraNakhi ParmalSafri Safri
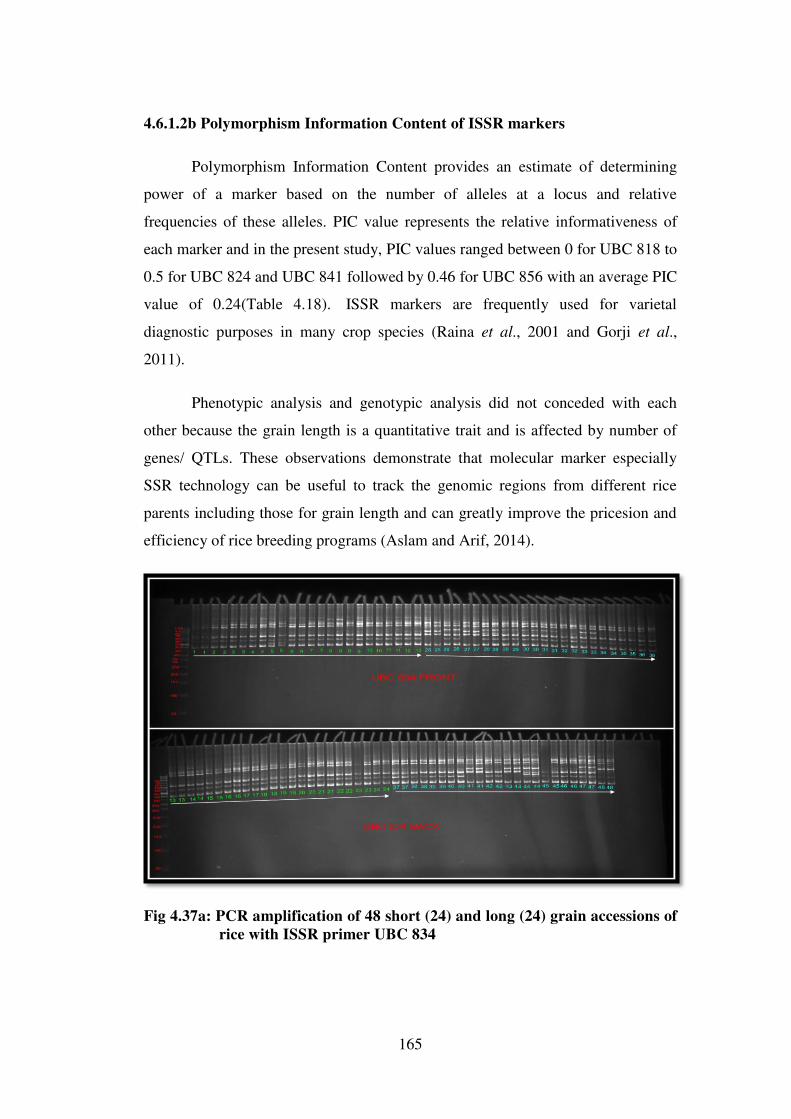
165
4.6.1.2b Polymorphism Information Content of ISSR markers
Polymorphism Information Content provides an estimate of determining
power of a marker based on the number of alleles at a locus and relative
frequencies of these alleles. PIC value represents the relative informativeness of
each marker and in the present study, PIC values ranged between 0 for UBC 818 to
0.5 for UBC 824 and UBC 841 followed by 0.46 for UBC 856 with an average PIC
value of 0.24(Table 4.18). ISSR markers are frequently used for varietal
diagnostic purposes in many crop species (Raina et al., 2001 and Gorji et al.,
2011).
Phenotypic analysis and genotypic analysis did not conceded with each
other because the grain length is a quantitative trait and is affected by number of
genes/ QTLs. These observations demonstrate that molecular marker especially
SSR technology can be useful to track the genomic regions from different rice
parents including those for grain length and can greatly improve the pricesion and
efficiency of rice breeding programs (Aslam and Arif, 2014).
Fig 4.37a: PCR amplification of 48 short (24) and long (24) grain accessions of
rice with ISSR primer UBC 834
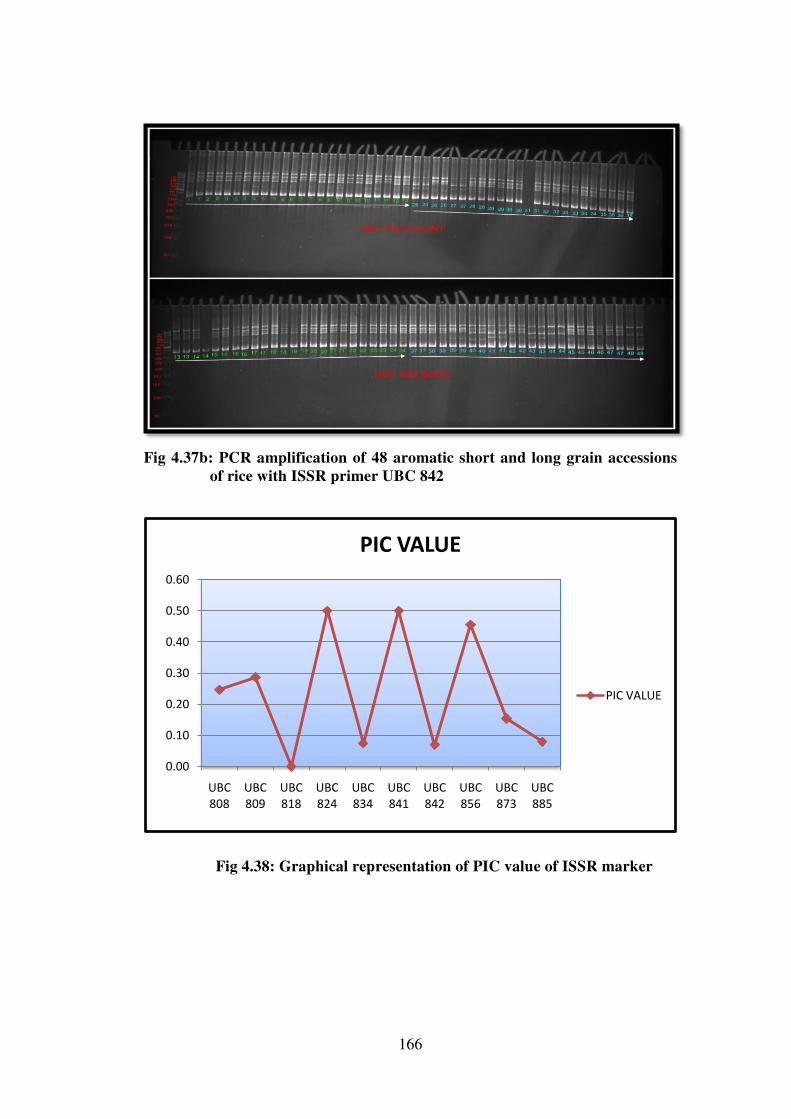
166
Fig 4.37b: PCR amplification of 48 aromatic short and long grain accessions
of rice with ISSR primer UBC 842
Fig 4.38: Graphical representation of PIC value of ISSR marker
0.00
0.10
0.20
0.30
0.40
0.50
0.60
UBC
808
UBC
809
UBC
818
UBC
824
UBC
834
UBC
841
UBC
842
UBC
856
UBC
873
UBC
885
PIC VALUE
PIC VALUE
167
CHAPTER- V
SUMMARY AND CONCLUSION
The present study “Molecular and agro-morphological characterization
of selected rice (Oryza sativa L.) germplasm accession based on grain length”
was carried out by using forty eight short and long grain rice landraces, with the
objective of their characterization at morphological, quality and molecular level.
The experiment was conducted at Research cum Instructional farm of IGKV,
Raipur during Kharif 2015. The experiment was conducted in Randomized Block
Design (RBD), with two replications. The plants were observed regularly at
different growth stages in order to find out the diagnostic descriptors of each land
race which were uniformly present in the population and to be stable. Apart from
morphological descriptors and quality analysis, molecular markers were also
applied in order to characterize these rice germplasm lines at DNA level. In order
to propose elite plant type with desired characters i.e. mean, range, phenotypic and
genotypic coefficient of variances, heritability, genetic advance and genetic
advance as percentage of mean were also studied.
Rice genetic diversity assessed so far suggests a broad genetic base in
India. Genotype specific pattern have been developed particularly for the elite
Basmati types for use in trade and commerce. The landraces available today
preserve the allelic richness. Commercial cultivars are genetically homogenous
while the landraces studied revealed composite genetic structure. Forty eight short
and long grain landraces of rice from Chhattisgarh were selected for this study; the
results can be summarized as below:
To establish distinctiveness among rice genotypes qualitative (DUS)
characters have been used. Qualitative characters are considered as morphological
markers in the identification of germplasm accessions of rice because they are less
influenced by environment. In the present investigation, among the qualitative
characters observed, leaf blade pubescence, leaf blade colour, panicle type, lemma
168
and palea colour, lemma and palea pubescence, sterile lemma colour recorded
highest variation among accessions.
Analysis of variance revealed the existence of significant variability for all
the characters included for study. The high magnitude of phenotypic coefficient of
variation was higher in magnitude than the genotypic coefficient of variation. The
highest value of PCV coupled with GCV was recorded for harvest index followed
by grain yield, length of longest awn, thousand grain weight, L:B ratio of milled
rice, grain length, L:B ratio of decorticated grain, Decorticated grain length, length
of milled grain, length of cooked kernel, L:B ratio of cooked kernel and elongation
index.
High heritability coupled with high genetic advance exhibited in twenty
traits such as grain length, thousand grain weight, elongation ratio, amylose
content, head rice recovery etc. High estimate of heritability was found for all the
quantitative characters related to yield and quality characters under study showed
more than 90% heritability estimate.
Grain yield had significant high positive genotypic correlation with
thousand grain weight. Number of panicle per plant, biological yield per plant,
grain length showed highly significant genotypic correlation with grain yield per
plant indicating the co-segregation of the concerned characters either due to linked
gene or pleiotropy effect or both. The trait biological yield per plant also had
significant very high positive direct effect on grain yield per plant revealing the
true relationship with grain yield.
On the basis of cluster analysis rice accession lines were grouped into 10
clusters. The highest numbers of accessions were in cluster VII, VI, and I had 16,
10 and 8 genotypes, respectively. The maximum inter cluster distance was
observed between cluster IX and cluster X (32.12). The inter cluster distances in
present study were higher than the intra cluster distance in all cases reflecting
wider diversity among the breeding lines of distant groups.
The result of the PCA explained the genetic diversity of the long and short
grain accessions of rice. From the results of PCA, it is cleared that Nagbel is the
best accession for both quality and yield attributing traits followed by Khatria pati,
169
Anjania, Banreg, Khatia pati, Piso III, Jay Bajrang, Safed luchai and Mudariya. A
total of 59 RM primers and 10 ISSR markers were utilized to provide genetic
diversity among 48 selected rice landraces.
After analysis the data generated from 59 microsatellite markers (SSR), 53
markers showed polymorphic reaction and out of 10 ISSR primers 8 markers
showed polymorphic reaction in forty eight rice accessions. SSR and ISSR markers
are also used to detect the genetic similarity of long and short grain accessions of
rice under study. The accessions that are derivatives of genetically similar dropped
in one group. In UPGMA tree, three major clusters were formed having 22, 20 and
6 genotypes in SSR marker while two major clusters were formed in ISSR having
24 genotypes in each cluster.
CONCLUSIONS:
Agro-morphological and quality descriptors showed remarkable differences
in their distribution and amount of variations within them.
Significant variation in all 33 yield and yield attributing traits were
obtained. Highest variation (PCV and GCV along with high heritability and
genetic advance) was observed in thousand grain weight followed by grain
length, decorticated grain length, length of milled grain, length of cooked
kernel and elongation index.
Biological yield, stem thickness, plant height, panicle per plant, time of
maturity and decorticated grain length exhibited positive and highly
significant correlation with grain yield as well as positive direct effect on
grain yield per plant.
Principal component analysis showed the contribution of each character to
the classification of rice accessions. The first four principal components
explained 63.74% of total variation among 33 traits. Top ten PC scores
revealed that Khatriya Pati is the best accession for both yield and quality
followed by Banreg, Khatiya Pati, Piso III, Jay Bajrang, Nagbel, Safed
Luchai, Mudariya, Safri and Kanthi Deshi.
Ten cluster groups were obtained from 33 yield and quality characters
using multivariate analysis. Inter crossing of genotypes from diverse cluster
170
showing high mean performance will be helpful in obtaining better
recombinants with higher genetic variability.
A total of 59 SSR and 10 ISSR markers were used, A total of 199 and 46
alleles with an average of 3.37 and 2.9 alleles per locus were detected by
SSR and ISSR markers respectively. Out of which 53 SSR and 8 ISSR
showed polymorphism. Genetic similarity coefficient ranged from 0.21-
0.93 and 0.52-1.00 as revealed by UPGMA cluster analysis of SSR and
ISSR markers.
171
REFERENCES
Agahi, K., Fotokian, M.H. and Farshadfar, E. 2007. Correlation and path analysis
of some yield related traits in rice genotypes (Oryza sativa L.). Asian J.
of Plant Sci., 6(3): 513-517.
Al-Salim, S.H.F., Al-Edelbi, R., Aljbory, F. and Saleh, M.M. 2016 Evaluation of
the Performance of Some Rice (Oryza sativa L.) Varieties in Two
Different Environments. Open Acc. Lib. J., 3: e2294.
Ambili, S.N. and Radhakrishnan, V.V. 2011. Correlation and path analysis of grain
yield in rice. Gregor Mendel Foundation Proceedings, pp: 1-6.
Anandan, A., Eswaran, R. and Prakash, M. 2011. Diversity in rice genotypes under
salt affected soil based on multivariate analysis. Pertanika J. Trop. Agric.
Sci., 34(1): 33-40.
Anonymous, 2013. Agricultural Outlook and situation Analysis Reports, Quarterly
Agricultural Outlook Report, Under the Project Commissioned by the
Ministry of Agriculture, National Council of Applied Economic
Research, New Delhi. 47-48
Anonymous, 2014. Directorate of Economics and Statistics. New Delhi. 14-15.
Apsath Beevi, H. and Venkatesan, M. 2015. Genetic divergence studies in rice
genotypes under saline condition. Int. J. of Cur. Adv. Res., 4(1): 6-8.
Ashfaq, M., Khan, A.S., Khan, S.H.U. and Ahmad, R. 2012. Association of
various morphological traits with yield and genetic divergence in rice
(Oryza sativa L.). Int. J. Agric. Biol., 14: 55-62.
Aslam, K. and Arif, M. 2014. SSR analysis of chromosomes 3 and 7 of rice (oryza
staiva l.) associated with grain length. Pak. J. Bot., 46(4): 1363-1372.
Ayesha, B., Abbasi, F.M., Rabbani, M.A. and Khatiba, B. 2015. Genetic diversity
assessment of indigenous rice germplasm from northern Pakistan using
agro morphometric traits. Pak. J. Bot., 47(3): 1061-1067.
172
Babu, R.V., Sandhya, K., Shobha, R.N. and Ravichandran 2006. Genetic
divergence analysis using quality traits in rice genotypes (Oryza sativa
L.). Oryza, 43(4): 260-263.
Bai, X., Luo, L., Yan, W., Kovi, M.R., Zhan, W. and Xing, Y. 2010. Genetic
dissection of rice grain shape using a recombinant inbred line population
derived from two contrast‑ ing parents and fine mapping a pleiotropic
quantitative trait locus qGL7. BMC Genet. 11: 16.
Bajpai, A. and Singh, Y. 2010. Study of quality characteristics of some small and
medium grained aromatic rices of Uttar Praesh and Uttarakhand. Agril.
Sci. Dig. 30(4): 241-245.
Bajracharya, J., Steele, K.A., Jarvis, D.I., Sthapit, B.R. and Witcombe, J.R. 2006.
Rice landrace diversity in Nepal: Variability of agromorphological traits
and SSR markers in landraces from a high-altitude site. Field Crops Res.
95: 327-335.
Barry, M.B., Pham, J.L., Noyer, A.J.L., Billot, A.C., Courtois, A.B. and Ahmad,
A.N. 2007. Genetic diversity of the two cultivated rice species (O. sativa
and O. glaberrima) in maritime Guinea. Evidence for interspecifc
recombination. Euphytica. 154, 127–137.
Becerra, V., Paredes, M., Gutiérrez, E. and Rojo, C. 2015. Genetic diversity,
identification, and certification of Chilean rice varieties using molecular
markers. Chilean J. Agric. Res. 75(3): 1204-1208.
Bhagat, R. 2007. Phenotyping of Recombinant Inbred Lines derived from Indica
Japonica Rice Crosses. M.Sc. Thesis, JNKVV, Jabalpur (M.P.).
Brejda, J.J., Moorman, T.B., Karlen, D.L. and Dao, T.H. 2000. Identification of
regional soil quality factors and indicators. I. Central and Southern High-
Plains. Soil Science Society of Am. J., 64: 2115–2124.
Burton, G.W., 1952. Quantitative inheritance in grasses. Proceedings of the 6th
International Grassland Congress, August 17-23, 1952, Pennsylvania
State College, USA., pp: 277-283.
173
Chakraborty, S., Das, P.K., Guha, B., Sarmah, K.K. and Barman, B. 2010.
Quantitative genetic analysis for yield and yield components in boro rice
(Oryza sativa L.). Not. Sci. Biol., 2(1): 117-120.
Chakravorty, A. and Ghosh, P.D. 2012. Grain dimension studies in view of kernel
weight development in traditional rice of West Bengal. Int. J. of Biosci.
10(2): 95-102.
Chakravorty, A., Ghosh, P.D. and Sahu, P.K. 2013. Multivariate analysis of
lanraces of rice of West Bengal. American J.of Exp. Agri. 3(1): 110-123.
Chanbeni, Y.O., Lal, G.M. and Rai, P.K. 2012. Studies on genetic diversity in Rice
(Oryza sativa L.). J. of Agril. Tech. 8(3): 1059- 1065.
Chand, S.P., Roy, S.K., Mondal, G.S., Mahato, P.D., Panda, S., Sarkar, G. and
Senapati, B.K. 2004. Genetic variability and character association in
rainfed lowland aman paddy (Oryza sativa L.). Environment and
Ecology, 22(2): 430-434.
Choudhary, M., Sarawgi, A.K. and Motiramani, N.K. 2004. Genetic variability of
quality, yield and yield attributing traits in aromatic rice (Oryza sativa
L.). Adv. in Plant Sci., 17 (2): 485-490.
Danbaba, N., Anounye, J. C., Gana A. S., Abo, M. E. and Ukwungwu, M. N. 2011.
Grain quality characteristics of Ofada rice (Oryza sativa L.) Cooking and
eating quality. Int. Fd. Res. J., 18: 629-634.
Das, B., Sengupta, S., Ghosh, M. and Ghose, T.K. 2012. Assessment of diversity
amongst a set of aromatic rice genotypes from India. Int. J. of Bio. and
Cons. 4(5): 206-218.
Das, S. and Ghosh, A. 2010. Characterization of rice germplasm of West Bengal.
Oryza. 47(3): 201-205.
Dewey, D.R. and Lu, K.H. 1959. Correlation and path coefficients analysis of
components of crested wheat grass seed population. Agron. J.: 515-518.

174
Din, R., Subhani, G.M., Ahmad, N., Hussain, M. and Rehman, N. 2010. Effect of
temperature on development and grain formation in spring wheat.
Pakistan J. of Bot. 42, 899-906.
Dixit, R.K. and Singh, P. 1975. Path analysis and selection indices as an aid for the
improvement of crested wheatgrass seed production. J. Agron.,57: 515-
18.
Dong, Y. and Zheng, Y. 2002. Quantitative trait loci controlling steamed-rice
shape in a recombinant inbred population. IRRN. 27(1): 19-20.
Ekka, R.E., Sarawgi, A.K. and Kanwar, R.R. 2011. Correlation and path analysis
in traditional rice accessions of Chhattisgarh. J. of Rice Res. 4(1 & 2):
11-17.
Falconer, D.S. 1960. Introduction to quantitative genetics. Edinburgh, Oliver and
Boyd.
Falconer, D.S. 1981. Introduction to quantitative genetics. 2nd
Edn., Lougman,
New York.
Fan, C., Xing, Y., Mao, H., Lu. T., Han, B., and Xu, C. 2006. GS3, a major QTL
for grain length and weight and minor QTL for grain width and
thickness in rice, encodes a putative transmembrane protein. Theor.
Appl. Genet. 112: 1164-1171.
Galton, F. 1888. Co-relations and their measurement, chiefly from anthropometric
data. Proc. Roy. Soc. London, 45 , 135–145.
Gangadharaiah, S., Babu, H.N., Prasad, S.R., Pramila, C.K and Vishwanath, K.
2015 Physiochemical Properties and Cooking Qualities of Traditional
Rice Cultivars. Annals. of Plant Sci. 4.8: 1173-1178.
Gao, Z., Zeng, D., Cheng, F., Tian, Z., Guo, L., Su, Y., Yan, M., Jiang, H., Dong,
G., Huang, Y., Han, B., Li, J. and Qian, Q. 2011. ALK, the key gene for
gelatinization temperature, is a modifier gene for gel consistency in
rice. J. Integr. Plant Biol., 53: 756–765.
175
Garg, P., Pandey, D. P. and Kaushik R. P. 2011.Genetic Divergence for Yield and
Quality Traits in Rice (Oryza sativa L.). J. Rice Res., 4: 1-2.
Girish, T.N., Gireesha, T.M., Vaishali, M.G., Hanamareddy, B.G., and Hittalmani,
S. 2006. Response of a new IR50/ Moroberekan recombinant inbred
population of rice (Oryza sativa L.) from an indica x japonica cross for
growth and yield traits under aerobic coditions. Euphytica, 152 (2): 149-
161.
Girma, G., Tesfaye, K. and Bekele, E., 2010. Inter Simple Sequence Repeat (ISSR)
analysis of wild and cultivated rice species from Ethiopia. Afric. J.
Bitech. 9(32):5048-5059.
Gnanamalar, R. P. and Vivekanandan, P. 2013. Genetic architecture of grain
quality characters in rice (Oryza sativa L.). Europ. J. Exper. Biol., 3(2):
275-279.
Gnanasekaran, M., Vivekanandan, P. and Muthuramu, S. 2008. Correlation and
path analysis in two line rice hybrids. Adv. in Plant Sci., 21(2): 689-692.
Gorji, A.M., Poczai, P., Polgar, Z., Taller, J. 2011. Efficiency of arbitrarily
amplified dominant markers (SCOT, ISSR and RAPD) for diagnostic
fingerprinting in tetraploid potato. Am. J. Potato Res. 88:226–237.
Hanson, G.H., Robinson, H.F. and Comstock, R.E. 1956. Biometrical studies of
yield in segregating population of Korean lespedeza. Agro. J., 48: 268-
272.
Herrera, T.G., Duque, D.P., Almeida, I.P., Nunez, G.T., Pieters, A.J., Martinez,
C.P. and Tohme, J.M. 2008. Assessment of genetic diversity in
Venezuelan rice cultivars using simple sequence repeat markers. Elec. J.
of Biotech. 11(5): 1 – 14.
Hien, N.L., Sarhadi, Wakil, A.O., Yosei and Hirata, Y. 2007. Genetic diversity of
morphological responses and the relationships among asia aromatic rice
(Oryza Sativa L.) cultivars. Tropics.,16 (4): 343-355.
176
Hosen, S., Siddiquee, M.A., Jahan, S., Alam, M.S., Hoque, F., Bhowmick, S.,
Ferdous, N and Shozib, H.B. 2016. Physicochemical properties of Aus
cultivars in Bangladesh. Biores. Comm. 2(1), 200-204.
Hossain, M.S., Singh, A.K., Zaman, Fu. 2009. Cooking and eating characteristics
of some newly identified inter sub-specific (indica/japonica) rice
hybrids. Sci. Asia. 35: 320-325.
Hossain, M.Z., Rasul, M.G., Ali, M.S., Iftekharuddaula, K.M. and Mian, M.A.K.
2007. Molecular characterization and genetic diversity in fine grain and
aromatic landraces of rice using microsatellite markers. Bangladesh J.
Genet. Pl. Breed., 20(2): 1-10.
Hossain, S., Maksudul, H.M.D, Rahman, J. 2015. Genetic Variability, Correlation
and Path Coefficient Analysis of Morphological Traits in some Extinct
Local Aman Rice (Oryza sativa L). J. Rice Res. 3: 158.
Huang, R., Jiang, L., Zheng, J., Wang, T., Wang, H. and Huang, Y. 2013. Genetic
bases of rice grain shape: so many genes, so little known. Trends Plant
Sci. 18: 218-226.
Ikeda, M., Miura, K., Aya, K., Kitano, H. and Matsuoka, M. 2013. Genes offering
the potential for designing yield-related traits in rice. Curr. Opin. Plant
Biol.,16(2):213–220.
Islam, M.A, Raffi, S.A, Hossain, M.A, Hasan, A.K. 2015 Character association
and path coefficient analysis of grain yield and yield related traits in
some promising early to medium duration rice advanced lines. Int. J.
Expt. Agric. 5(1), 8-12.
Jennings, P.R., Coffman, W.R. and Kauffman, H.E. 1979. Grain quality in Rice
Improvement. International Rice Research Institute, Los Banos,
Philippines. Chapter 6, pp. 113-118.
Johnson, H.W., Robinson, H.F. and Comstock, R.E. 1955. Estimation of genetic
and environmental variability in soybeans. Agro. J., 47: 314–318.
Juliano, B.O. and Villareal, C.P. 1993. Grain quality evaluation of world rice.
International Rice Research Institute. Manila, Philippines.
177
Khan, A.S., Imran, M. and Asfaq, M. 2009. Estimation of genetic variability and
correlation for grain yield components in rice (Oryza sativa L.). Am.
Europ. J. Agric. and Environ. Sci., 6(5): 585-590.
Kubo, T., Takano-Kai, N. and Yoshimura, A. 2001. RFLP mapping of genes for
long kernel and awn on chromosome 3 in rice. Rice Genet. Newsl., 18:
26-28.
Kumar, B., Gupta, B. And Singh, B. 2014. Genetic diversity for morphological and
quality traits in rice (Oryza sativa L.). The Bioscan, 9(4): 1759-1762.
Kumar, S., Tantwai, K., Kottapalli, P.R. and Katiyar, S.K. 2014. Genetic diversity
analysis of rice genotypes collected from different villages of
Chhattisgarh using simple sequence repeat (SSR) markers. Adv. in Plant
Sci., 25(2): 419-422.
Kumar, V., Koutu, G.K., Mishra, D.K. and Singh, S.K. 2013. Principal component
analysis of inter sub-specific RILs of rice for the important traits
responsible for yield and quality. JNKVV Res. J., 47(2): 185-190.
Kumari, S., Kewat, R.N., Singh, R.P. and Singh, P. 2013. Studies of quality
characteristics in short grain scented rice (Oryza sativa L.) varieties
accessions. Trends in Biosciences, 6(2): 177-179.
Kumbhar, S.D., Patil, J.V., Kulwal, P.L. and Chimote, V.P., 2013. Molecular
diversity in rice (Oryza sativa L.) using ISSR markers. Int. J. Int sci. Inn.
Tech. 2(2)7-23.
Kunusoth, K., Vadivel, K., Sundaram R.M., Sultana, R. Rajendrakumar P.,
Maganti, S., Subbarao, L.V. and Reyes, S. 2015. Assessment of Genetic
Diversity of Elite Indian Rice Varieties Using Agro-Morphological
Traits and SSR Markers. Am. J. Exp. Agril., 6(6): 384-401
Lang, N.T., Tu, P.T.B., Thanh, N.C., Buu, B.C. and Lsmail, A. 2009. Genetic
diversity of salt tolerance rice landraces in Vietnam. J. Plant Breed. and
Crop Sci.,1(5): 230-243.
178
Lei, C.L., Wang, J.L., Zhang, X., Cheng, Z.J. and Guo, X. P. 2006. QTL analysis
for rice grain length and fine mapping of an identified QTL with stable
and major effects. TAG. Theor. Appl. Genet., 112(7): 1258-1270.
Lenka, D. and Mishra, B. 1973. Path coefficient analysis of yield in rice varieties.
Indian J. Agric. Sci., 43: 376-379.
Li, J., Xiao, J., Grandillo, S., Jiang, L., Wang, Y., Deng, Q., Yuan, L. and
McCouch, S.R. 2004. QTL detection for rice grain quality traits using an
interspecific backcross population de‑ rived from cultivated Asian (O.
sativa L.) and African (O. glaberrima S.) rice. Genome 47: 697-704.
Li, S.Q., Li, X.D., Wang, S.H. and Zhang, Z.L. 2010. Clustering and principal
component analysis of introduced black pericarp rice germplasm based
on agronomic traits. Southwest China J. of Agril. Sci., 23(1): 11-15.
Li, Y., Fan, C., Xing, Y., Jiang, Y., Luo, L. and Sun, L. 2011. Natural variation in
GS5 plays an important role in regulating grain size and yield in rice.
Nat. Genet. 43: 1266-1.
Li, Z., Wan, J., Xiao, J., Yano, M. 2003. Mapping of quantitative trait loci
controlling physico-chemical properties of rice grain (Oryza sativa L.)
Breeding Sci. 53, 209–215.
Li, Z.K., Pinson, S.R.M., Park, W.D., Paterson, A.H. and Stansel, J.W. 1997.
Epistasis for three grain yield components in rice Oryza sativa L.
Genetics, 145: 453-465.
Lin, H.X., Min-Shao, K., Xiong, Z.M., Qian, H.R., Zhuang, J.Y., Lu, J., Huang,
N., Zheng, K., Lin, H.X., Min, S.K., Xiong, Z.M., Qian, H.R., Zhuang,
J.Y and K.L. Zheng. 1995. RFLP mapping of QTLs for grain shape traits
in indica rice (Oryza sativa L. subsp. indica). Scientia Agri. Sinica, 28:1-
7.
Lin, M.S. 1991. Genetic base of japonica rice varieties released in Taiwan.
Euphytica, 56:43-46
Lingaiah, N. 2015. Genetic variability, heritability and genetic advance in rice
(Oryza sativa L.). Asian J. Environ. Sci., 10(1): 110-112.
179
Madhavilatha, L., Reddi, M.S., Suneetha, Y. and Srinivas, T. 2005. Genetic
variability, correlation and path analysis for yield and quality traits in
rice (Oryza sativa L.). Res. on Crops, 6(3): 527-534.
Mao, H., Sun, S., Yao, J., Wang, C., Yu, S. and Xu, C. 2010. Linking differential
domain functions of the GS3 protein to natural variation of grain size in
rice. Proc. Natl. Acad. Sci. U.S.A. 107: 19579-19584.
Massy, W.F. 1965. Principal components regression in explanatory statistical
research. J. of Am. Stat. Asso., 60, 234–256.
Mayo, O. 1984. The Theory of Plant Breeding. Cleredon, Oxford.
McKenzie, K.S. and Rutger, J.N. 1983. Genetic analysis of amylose content, alkali
spreading score and grain dimensions in rice. Crop Sci., 23: 306–13.
Meti, N., Samal, K.C., Bastia, D.N. and Rout, G.R. 2013. Genetic diversity
analysis in aromatic rice genotypes using microsatellite based simple
sequence repeats (SSR) marker. African J. of Biotech., 12(27): 4238-
4250.
Mia, M.F., Begum, S.N., Islam, M.M., Manidas, A.C. and Halder, J. 2010.
Identification and differentiation of aromatic rice genotypes using SSR
makers. Int. J. BioRes., 2(9): 7-12.
Miller, P.A., Williams, J.C., Robinson, H.F. and Comstock, R.E. 1958. Estimates
of genotypic and environmental variances and covariances in upland
cotton and their implications in selection. Agron. J., 50: 126-131.
Miura, K., Ikeda, M., Matsubara, A., Song, X.J., Ito, M., Asano, K., Matsuoka,
M., Kitano, H. and Ashikari, M. 2011. OsSPL14 promotes panicle
branching and higher grain productivity in rice., Nat. Genet., 42(6):545–
549.
Moncada, P., Martinez, C.P., Borrero, J., Chatel, M., Gauch, H., Guimaraes, E.,
Tohme, J. and McCouch, S.R. 2001. Quantitative trait loci for yield and
yield components in an Oryza sativa 9 Oryza rufipogon BC2F2
population evaluated in an upland environment. TAG Theor. Appl.
Genet., 102: 41-52.
180
Mondal, B.S., Singh, S.P., Joshi, D.C. 2014. DUS characterization of rice (Oryza
sativa L.) using morphological descriptors and quality parameters.
Outlook On Agriculture; 43(2): 131-137(7).
Muhammad, S., Shahid, A.K., Haris, Kh., Javed, I., Ali, Mu. N.S., Syed, M.A.S.
2015. Characterization of Rice (Oryza Sativa L.) Germplasm Through
Various Agro-Morphological Traits . Sci. Agri., 9 (2), 83-88.
Muthuswamy, A., and Ananda, K.C.R. 2006. Variability studies in drought
resistant cultures of rice. Res. on Crops, 7(1): 130-132.
Nachimuthu, V.V., Robin, S., Sudhakar, D., Rajeshwari, S., Raveendran, S.,
Subramanian, K.S., Tannidi, S. and Pandian, B.A. 2014. Genotypic
variation for micronutrient content in traditional and improved rice lines
and its role in biofortification programme. Indian J. of Sci. and Tech.,
7(9): 1414-1425.
Nair, N.V., Balakrishan, R. and Sreenivasan, T.V. 1998.Variability for quantitative
traits in exotic hybrid germplasm of sugarcane. Genet. Res. Crop Evol.,
45: 459-464.
Nandan, R., Sweta and Singh, S.K. 2010. Character association and path analysis
in rice (Oryza sativa L.) genotypes. World J. of Agri. Sci., 6(2): 201-
206.
Naseem, I., Khan, A.S. and Akhter, M. 2014. Correlation and path coefficient
studies of some yield related traits in rice (Oryza sativa L.). Int. J. of Sci.
and Res. Pub., 4(4): 1-5.
Naseer, S., Kashif, M., Ahmad, H.M., Iqbal, M.S. and Ali, Q. 2015. Estimation of
genetic association among yield contributing traits in aromatic and non-
aromatic rice (Oryza sativa L) cultivars. Life Sci J., 12(4s):68-73
Nipon, B., Basanta, K.B. and Sharma, R.N. 2007. Genetic diversity analysis in
traditional lowland rice (Oryza sativa L.) of Assam using RAPD and
ISSR markers. Currn. Sci. 93(7): 967-972.
Ogunbayo, S.A., Ojo, D.K., Guei, R.G., Oyelakin, O.O. and Sanni, K.A. 2005.
Phylogenetic diversity and relationships among 40 rice accessions using
181
morphological and RAPDs techniques. African J. of Biotech., 4 (11):
1234-1244.
Pachauri, V., Nilay, T., Vikram, P., Singh, N.K. and Singh, S. 2013. Molecular and
morphological characterization of Indian farmer rice varieties. Aus. J. of
Crop Sci., 7(7): 923-932.
Pandey, P. and Anurag, P.J. 2010. Estimation of genetic parameters in indigenous
rice. AAB Bioflux, 2(1): 79-84.
Parikh, M., Motiramani, N.K., Rastogi, N.K. and Sharma, B. 2011.
Agromorphological characterization and assessment of variability in
aromatic rice germplasm. Bangladesh J. of Agril. Res., 37(1):1-8.
Parikh, M., Rastogi, N.K., and Sarawgi, A.K. 2012. Variability in grain quality
traits of aromatic rice (oryza sativa L.). Bangladesh J. Agril. Res., 37(4):
551-558
Pearson, K. 1904. Report on certain enteric fever inoculation statistics. British
Med. J. 3:1243-1246.
Pooni, H.S., Kumar, I. and Khush, G.S. 1992. Genetical control of amylose content
in selected crosses of indica rice. Heredity 70: 269-280.
Priti, U., Vikas K.S. and Neeraja, C.N. 2011. Identification of genotype specific
alleles and molecular diversity assessment of popular Rice (oryza sativa
L.) varieties of India. Int. J. of Plant Breed. Genet. 5(2): 130 – 140.
Rahman, A.U., Shah, S.M.A, Rahman, H., Shah, L., Ali, A., Raza, M.A. 2016.
Genetic Variability for Yield and Yield Associated Traits in F2
Segregating Populations of Rice. Acad. J. Agric. Res. 4(1): 018‑024.
Rahman, M.M., Rasaul, M.G., Hossain, M.A., Iftekharuddaula, K.M. and
Hasegawa, H. 2012. Molecular characterization and genetic diversity
analysis of rice using SSR markers. J. of Crop Impr., 26: 244-257.
Raina, S.N., Rani, V., Kojima, T., Ogihara, Y., Singh, K.P. and Devarumath, R.M.
2001. RAPD and ISSR fingerprints as useful markers for analysis of
genetic diversity, varietal identification and phylogenetic relationships in
182
peanut (Arachis hypogaea) cultivars and wild species. Genome 44:763–
772.
Rao, Subba, L.V., Prasad, G.S.V., Rao, Prasad, U., Prasad, Rama A., Acharyulu,
T.L. and Rama Krishna, S. 2001. Collection, characterization and
evaluation of rice germplasm from Bastar region. Indian J. of Plant
Genet. Res., 14(2):222-224.
Rashid, K., Kahlia, I., Farooq, O. and Ahsan, M.Z. 2014. Correlation and cluster
analysis of some yield and yield related traits in rice (Oryza sativa L.). J.
Recent Adv. Agr., 2 (6): 271-276.
Rashid, M.A., Ali, Cheema and M. Ashraf 2008. Numerical analysis of variation
among Basmati mutants. Pak. J. Bot., 40(6): 2413-2417.
Rathore, M., Sing, R., Kumar, B. and Chauhan, B.S. 2016 Characterization of
functional trait diversity among Indian cultivated and weedy rice
populations. Sci. Rep. 6, 24176
Ratna, M., Begum, S., Husna, A., Dey, S.R. and Hossain, M.S. 2015. Correlation
and path coefficiens analyses in Basmati rice. J. Agril. Res. Bangladesh
40(1): 153-161.
RavindraBabu, V., Shreya, K., Dangi, K.S., Usharani, G. and Siva Shankar A.
2012. Correlation and Path Analysis Studies inpopular Rice Hybrids of
India. Int. J. of Sci. and Res. Pub. 2(3): 1-5.
Redona, E.D. and Mackill, D.J. 1998. Quantitative trait locus analysis for rice
panicle and grain characteristics. TAG Theor. Appl. Genet., 96: 957-
963.
Redona, E.D. and Mackill, D.J. 1998. Quantitative trait locus analysis for rice
panicle and grain characteristics. TAG Theor. Appl. Genet., 96: 957-
963.
Rout, G.R., Samal, K.C., Meti, N. and Bastiaz, D.N. 2014. Genetic diversity
analysis of traditional aromatic rice using molecular markers. BMR
Biotech. 1(2) 1-14.

183
Roy, S., Biswar, A., Tarafdar, J. and Senpati, B.K. 2007. Genetic divergence of
rice germplasm for morphological and quality characters. National
symposium on rice, held at CRRI, Cuttack 2007.
Sajib, A.M., Hossain, M.M., Mosnaz, A.T.M.J., Islam, M.M., Ali, M.S. and
Prodhan, S.M. 2012. SSR marker-based molecular characterization and
genetic diversity analysis of aromatic landraces of rice (Oryza sativa L.).
J. BioSci. Biotech., 1(2): 107-116.
Sajid, M., Shahid, A.K., Haris, Kh., Javed, I., Ali, M.N.S. and Syed, M.A.S. 2015.
Characterization of Rice (Oryza Sativa L.) Germplasm Through Various
Agro-Morphological Traits . Sci. Agri., 9 (2), 83-88.
Sanni, K.A., Fawole, I., Ogunbayo, A., Tia, D., Somado, E.A. and Guei, R.G.
2010. Multivariate analysis of diversity of landraces of rice germplasm.
Second African Rice Congress, Bamako, Mali, 22-26 March 2010:
Innovation and Partnerships to Realize African Rice Potential.
Sarawagi, A.K., Ojha, G.C., Koshta, N. and Pachauri, A. 2015. Genetic divergence
and association study for grain yield in rice (Oryza sativa L.) germplasm
accessions. The Ecoscan, 9(1&2): 217-223.
Sarawgi, A.K., Parikh, M. and Sharma, B. 2012. Agro-Morphological and quality
characterization of Dubraj group from aromatic rice germplasm of
Chhattisgarh and Madhya Pradesh. An Int. J. of Plant Res., 25(2): 387-
394.
Sarawgi, A.K., Parikh, M., Sharma, B. And Sharma, D. 2014. Phenotypic
divergence for agro-morphological traits among dwarf and medium
duration rice germplasms and interrelationships between their
quantitative traits. The Bioscan, 9 (4): 1677-1681.
Sarkar, K.K., Bhutia, K.S., Senapati, B.K. and Roy, S.K. 2007. Genetic variability
and character association of quality traits in rice (Oryza sativa L.).
Oryza, 44(1): 64-67.
184
Satheeshkumar, P. and Saravanan, K. 2012. Genetic Divergence Analysis for Grain
Yield and Quality Traits in Rice (Oryza sativa L.). Plant Archi.,
12(2):639-644.
Satyanarayana, P.V., Srinivas, T., Reddy, P.R., Madhavilatha, L. and Suneetha, Y.
2005. Studies on variability, correlation and path coefficient analysis for
restorer lines in rice (Oryza sativa L.). Res. on Crops, 6 (1): 80-84.
Searle, S.R. 1961. Phenotypic, genotypic and environmental correlations.
Biometrics. 17: 474-480.
Selvaraj, C.I., Nagarajan, P., Thiyagarajan, K., Bharathi, M. and Rabindran, R.
2011. Genetic parameters of variability, correlation and path coefficient
studies for grain yield and other yield attributes among rice blast disease
resistant genotypes of rice (Oryza sativa L.). African J. of Biotech.,
10(17): 3322-3334.
Seraj, S., Hassan, L., Begum, S.N. and Sarker, M.M. 2013. Physiological attributes
and correlation among grain quality traits of some exotic rice lines. J.
Bangladesh Agril. Univ., 11 (2): 227-232.
Shahidullah, S.M., Hanafi, M.H., Ashrafuzzaman, M., Razi Ismail, M. and Khair,
A. 2009. Genetic diversity in grain quality and nutrition of aromatic
rices. African J. Biotech., 8(7): 1238-1246.
Shao, G., Tang, S., Luo, J., Jiao, G., Wei, X., Tang, A., Wu, J., Zhuang, J. and Hu,
P. 2010. Mapping of qGL7-2, a grain length QTL on chromosome 7 of
rice. J.of Gene. and Genom., 37: 523-531.
Shao, G., Wei, X., Chen, M., Tang, S., Luo, J., Jiao, G., Xie, L. and Hu, P. 2012.
Allelic variation for a candidate gene for GS7, responsible for grain
shape in rice. Theor. Appl. Genet. 125: 1303-1312.
Sharma, N., Singh, N., Singh, M. and Bharej, T.S. 2008. Quality of aromatic rice
in Basmati improvement. Indian J. Agric. Sci., 78(1): 42-49.
Shilpa, J., Bhonsle, and Sellappan, K. 2010. Grain Quality Evaluation of
Traditional Cultivated Rice Varieties of Goa, India. Recent Res. Sci. &
Tech., 2(6): 88-97.
185
Shiva Prasad, G., Radha Krishna, K.V., Subba Rao, L.V. and Chaithanya, U. 2013.
Quantitative analysis of rice genotypes (Oryza Sativa L.). Int. J. of
Innov. Res. and Develop., 2(9): 14- 17.
Shomura, A., Izawa, T., Ebana, K., Ebitani, T., Kanegae, H. and Konishi, S. 2008.
Deletion in a gene associated with grain size increased yields during rice
domestication. Nat. Genet. 40: 1023-1028.
Shukla, S., K., Joshi, D.C., Srivastava, R.K., Qureshi, M.I. and Singh, U.S. 2011.
Suitability of RAPD and ISSR to complement agro-morphological DUS
descriptors for establishing distinctiveness in indigenous local strains of
Kalanamak rice (Oryza sativa). Ind. J. of Agril. Sci. 81 (11): 994–1000.
Singh, A., Pandey, Y., Singh, M.K., Singh, A.K., Singh, P.K. 2016. Path
Coefficient Analysis in upland Rice Accessions. Ind. J. (8): 594-596.
Singh, P. and Singh, V.P. 2007. Quality of direct seeded rice cultivars. Agri. Sci.
Digest, 27(2): 79-82.
Singh, V. and Singh, P. 1976. Path analysis for yield components in Lentil (Lens
esculenta Moench). LENS, Canada, 3:6-7.
Sinha, A.K. and Mishra, P.K. 2013. Morphology based multivariate analysis of
phenotypic diversity of landraces of rice of Bankura district of West
Bengal. J. of Crop and Weed, 9(2): 115-121.
Sinha, A.K., Mallick, G.K., Mishra, P.K. 2015. Grain morphological diversity of
traditional rice varieties (Oryza sativa L.), in lateritic region of West
bengal. Int. J. of consv. Sci., 3(6): 419-426.
Sivasubramanian, V. and Madhavamenon, P. 1973. The PCV and GCV are
classified. Quantitative Genetics and Biometrical Techniques in Plant
Breeding. p-17.
Sohgaura, N., Mishra, D.K., Koutu, G.K., Singh, S.K. and Kumar, V. 2014.
Genetic evaluation of inter sub-specific derived RILs population for
yield and quality attributes in rice. Trends in Biosci., 7(18): 2631-2638.
186
Song, X.J., Huang, W., Shi, M., Zhu, M.Z. and Lin, H.X. 2007. A QTL for rice
grain width and weight encodes a previously unknown RING-type E3
ubiquitin ligase. Nat. Genet. 39: 623-630.
Subba Rao, L.V., Shiva Prasad, G., Chiranjivi, M., Chaitanya, U. And Surender, R.
2013. DUS characterization for farmer varieties of rice. IOSR J. of Agri.
and Vete. Sci., 4(5): 35-43.
Subbarao, G.V., Rao, K.J.N., Kumar, J. and Rao, K. 2001. Spatial distribution and
qualification of rice fallows in South-Asia, International crop research
institute for the semi-arid tropic, Patanchera, A.P., India, pp: 316.
Subudhi, H.N., Samantaray, S., Swain, D. and Singh, O.N. 2012. Collection and
agro-morphological characterization of aromatic short grain rice in
eastern India. African J. of Agril. Res, 7(36):5060-5068.
Subudhi, H.N., Swain, D., Das, S., Sharma, S.G. and Singh, O.N. 2012. Studies on
grain yield, physico-chemical and cooking characters of elite rice
varieties (Oryza sativa L.) in Eastern India. J. Agril. Sci., 4(12): 269-
275.
Tan, Y.F., Y.Z. Xing, J.X. Li, S.B. Yu, C.G. and Zhang, Q. 2000. Genetic bases of
appearance quality of rice grains in Shanyou 63, an elite rice hybrid.
Theor. Appl. Genet. 101: 823-829.
Thilang, N., Tam, B.P., Hieu, N.V., Nha, C.T., Ismail, A., Russell, R. and Bui,
C.B. 2014. Evaluation of rice landraces in Vietnam using SSR markers
and morphological characters. SABRAO J. Breed. Genet. 46 (1) 1-202.
Thomson, M., Tai, A., McClung, A., Xai, X.H., Hinga, M., Lobos, K., Xu, Y.,
Martinez, P. and McCouch, S.R. 2003. Mapping quantitative trait loci
for yield, yield components and morphological traits in an advanced
backcross population between Oryza rufipogon and the Oryza sativa
cultivar Jefferson. TAG. 107: 479-493.
Tsunematsu, H., Yoshimura, A., Harushima, Y., Nagamura, Y., Kurata, N., Yano,
M., Sasaki, T. and Iwata, N. 1996. RFLP framework map using
recombinant inbred lines in rice. Breed Sci., 46:279-284
187
Tuhina, Khatun, Hanafi, M.M., Yusop, M.R., Wong, M.Y., Salleh, F.M. and
Ferdous, J. 2015. Genetic Variation, Heritability, and Diversity Analysis
of Upland Rice (Oryza sativa L.) Genotypes Based on Quantitative
Traits. BioMed. Res. Int., pp: 1-7.
Vanisree, S., Anjali, K., Damodar, R.C., Surender, R.C. and Sreedhar, M. 2013.
Variability, heritability and association analysis in scented rice. J. of Bio.
and Sci. Opinion, 1(4): 347-352.
Vanisree, S., Reddy, P.N., Raju, C. Surender, Reddy, B.G., Jagdeesear, R., Verma,
R.G., Suryanarayana, Y., Krishna, L. and Reddy, P.R. 2010. Sugandha
Samba (RNR2465), First ever high yielding, aromatic, short-grained
rice. Rice Section, Agricutural research Institute, Acharya N.G. Ranga
Agricultural University (ANGRAU), Rajendra Nagar, Hydrabad,
500030.
Vanisree, S., Reddy, P.N., Surender, R.C., Reddy, B.G., Jagadeeswar, R., Verma,
R.G., Suryanarayana, Y., Krishna, L. and Reddy, P.R. 2011. Sugandha
Samba (RNR2465), first-ever high-yielding, aromatic, short-grained rice
variety of Andhra Pradesh, India. Gene. Res. 36: 117-222.
Veni, B.K. and Rani, N.S. 2006. Association of grain yield with quality
characteristics and other yield components in rice, Oryza, 43: 320-322.
Vhora, Z., Trivedi, R., Chakraborty, S., Ravikiran, R. And Sasidharan, N. 2013.
Molecular studies of aromatic and non aromatic rice (Oryza sativa L.)
genotypes for quality traits using microsatellite markers. The Bioscan,
8(2): 359-362.
Wan, X.Y., Wan, J.M., Jiang, L., Wang, J.K., Zhai, H.Q., Weng, J.F., Wang, H.L.,
Lei, C.L., Wang, J.L., Zhang, X., Cheng, Z.J., Guo, X.P. 2006. QTL
analysis for rice grain length and fine mapping of an identified QTL with
stable and major effects. Theor. Appl. Genet. 112:1258– 1270.
Wattoo, J.I., Khan, A.S., Ali, Z., Babar, M., Naeem, M., Aman, M.U. and Hussain,
N. 2010. Study of correlation among yield related traits and path
188
coefficient analysis in rice (Oryza sativa L.). Afr. J. Biotechnol., 9:
7853-7856.
Weng, J., Gu, S., Wan, X., Gao, H., Guo, T., Su, N., Lei, C., Zhang, X., Cheng, Z.,
Guo, X., Wang, J., Jiang, L., Zhai, H. and Wan, J. 2008. Isolation and
initial characterization of GW5, a major QTL associated with rice grain
width and weight. Cell Res. 18: 1199-1209.
Wright, S. 1921. Correlation and causation. J. Agric. Res. 20:557-585.
Xiao, J., Li, J., Yuan, L. and Tanksley, S.D. 1996. Identification of QTLs affecting
traits of agronomic importance in a recombinant inbred population
derived from a subspecific rice cross. TAG Theor. Appl. Genet., 92:
230-244.
Xie, X., Jin, F., Song, M.H., Suh, J.P., Hwang, H.G. and Kim, Y.G. 2008. Fine
mapping of a yield-enhancing QTL cluster associated with transgressive
variation in an Oryza sativa x O. rufipogon cross. Theor. Appl. Genet.
116: 613-622.
Xie, X.B., Song, M.H., Jin, F.X., Ahn, S.N., Suh, J.P., Hwang, H.G. and
McCouch, S.R. 2006. Fine mapping of a grain weight quantitative trait
locus on rice chromosome 8 using near-isogenic lines derived from a
cross between Oryza sativa and Oryza rufipogon. Theor. Appl. Genet.,
113(5): 885−894.
Xing, Y.Z. and Zhang, Q.F. 2010. Genetic and molecular bases of rice yield Annu.
Rev. Plant Biol., 61: pp. 421–442.
Xing, Y.Z., Tan, Y.F., Hua, J.P., Sun, X.L., Xu, C.G. and Zhang, Q. 2002
Characterization of the main effects, epistatic effects and their
environmental interactions of QTLs on the genetic basis of yield traits in
rice., Theor. Appl. Genet. 105: 248–257.
Xu, J.L., Xue, Q.Z., Luo, L.J. and Li, Z.K. 2002. Genetic dissection of grain
weight and its related traits in rice (Oryza sativa L.). Chin J. Rice Sci.,
16:6-10.
189
Yang, X.H., Yuan, J., Chen, H.C., He, H.Y., Chen, X.J., You, J.M., Wu, S.P. and
Wang, Y.Y. 2009. Principal component analysis of major agronomic
traits on upland rice germplasm resources in Guizhou. Sw. China J. of
Agril. Sci., 22(5): 1204-1208.
Yu, S.B., Li, J.X., Xu, C.G., Tan, Y.F., Gao, Y.J., Li, X.H., Zhang, Q. and Maroof,
M.A.S. 1997. Importance of epistasis as the genetic basis of heterosis in
an elite rice hybrid. Proc. Natl. Acad. Sci. USA., 94: 9226-9231.
Zhang, J.J., Li, T. and Zhu, W.D. 2004. Correlation analysis of quality characters
of japonica rice varieties introduced from Japan. J. of Sich. Agril. Uni.,
22(3): 209-212.
Zhang, X., Wang, J., Huang, J., Lan, H., Wang, C., Yin, C., Wu, Y., Tang, H.,
Qian, Q., Li, J. and Zhang, H. 2012. Rare allele of OsPPKL1 associated
with grain length causes extralarge grain and a significant yield increase
in rice. Proc. Natl. Acad. Sci. USA 109: 21534-21539.
Zheng, K., Subudhi, P.K., Domingo, J., Magpantay, G. and Huang, N. 1995. Rapid
DNA isolation for marker assisted selection in rice breeding. Rice
Genetics Newsletter 12: 255–258.
Zheng, T.Q., Xu, J.L., Li, Z.K., Zhai, H.Q. and Wan, J.M. 2007. Genomic regions
associated with milling quality and grain shape identified in a set of
random introgression lines of rice (Oryza sativa L.). Plant Breeding,
126: 158-163.
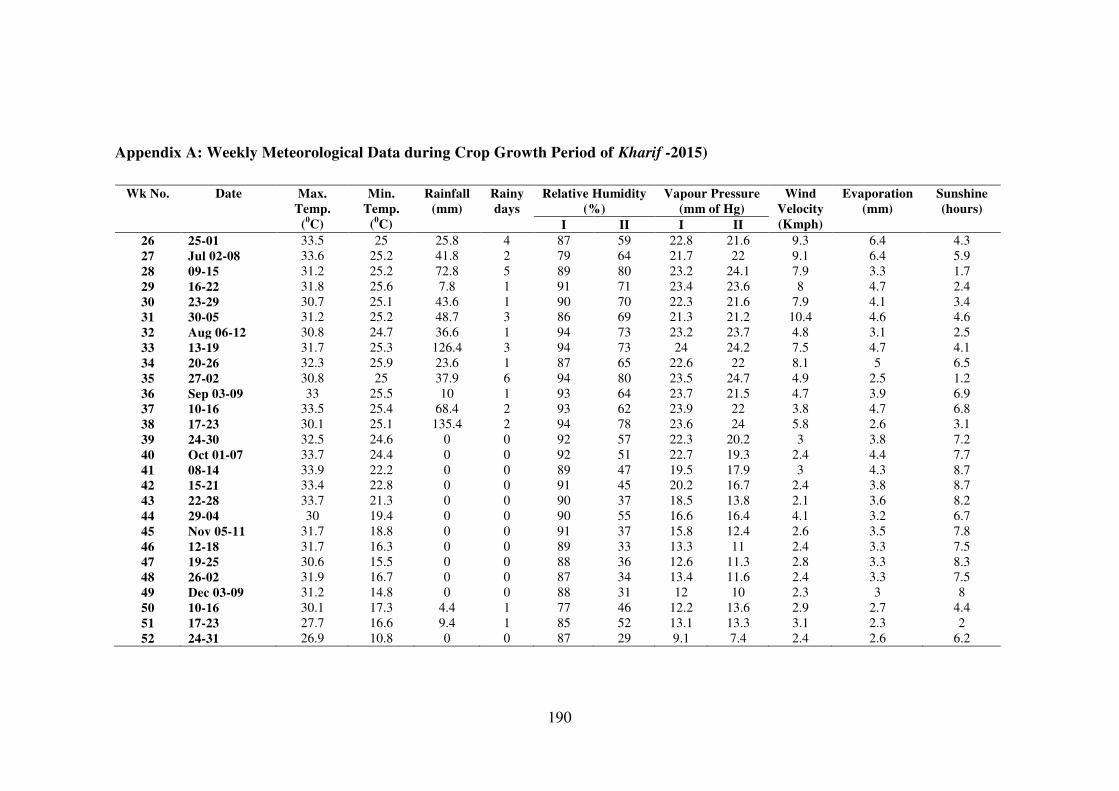
190
Appendix A: Weekly Meteorological Data during Crop Growth Period of Kharif -2015)
Wk No. Date Max.
Temp.
(0C)
Min.
Temp.
(0C)
Rainfall
(mm)
Rainy
days
Relative Humidity
(%)
Vapour Pressure
(mm of Hg)
Wind
Velocity
(Kmph)
Evaporation
(mm)
Sunshine
(hours)
I II I II
26 25-01 33.5 25 25.8 4 87 59 22.8 21.6 9.3 6.4 4.3
27 Jul 02-08 33.6 25.2 41.8 2 79 64 21.7 22 9.1 6.4 5.9
28 09-15 31.2 25.2 72.8 5 89 80 23.2 24.1 7.9 3.3 1.7
29 16-22 31.8 25.6 7.8 1 91 71 23.4 23.6 8 4.7 2.4
30 23-29 30.7 25.1 43.6 1 90 70 22.3 21.6 7.9 4.1 3.4
31 30-05 31.2 25.2 48.7 3 86 69 21.3 21.2 10.4 4.6 4.6
32 Aug 06-12 30.8 24.7 36.6 1 94 73 23.2 23.7 4.8 3.1 2.5
33 13-19 31.7 25.3 126.4 3 94 73 24 24.2 7.5 4.7 4.1
34 20-26 32.3 25.9 23.6 1 87 65 22.6 22 8.1 5 6.5
35 27-02 30.8 25 37.9 6 94 80 23.5 24.7 4.9 2.5 1.2
36 Sep 03-09 33 25.5 10 1 93 64 23.7 21.5 4.7 3.9 6.9
37 10-16 33.5 25.4 68.4 2 93 62 23.9 22 3.8 4.7 6.8
38 17-23 30.1 25.1 135.4 2 94 78 23.6 24 5.8 2.6 3.1
39 24-30 32.5 24.6 0 0 92 57 22.3 20.2 3 3.8 7.2
40 Oct 01-07 33.7 24.4 0 0 92 51 22.7 19.3 2.4 4.4 7.7
41 08-14 33.9 22.2 0 0 89 47 19.5 17.9 3 4.3 8.7
42 15-21 33.4 22.8 0 0 91 45 20.2 16.7 2.4 3.8 8.7
43 22-28 33.7 21.3 0 0 90 37 18.5 13.8 2.1 3.6 8.2
44 29-04 30 19.4 0 0 90 55 16.6 16.4 4.1 3.2 6.7
45 Nov 05-11 31.7 18.8 0 0 91 37 15.8 12.4 2.6 3.5 7.8
46 12-18 31.7 16.3 0 0 89 33 13.3 11 2.4 3.3 7.5
47 19-25 30.6 15.5 0 0 88 36 12.6 11.3 2.8 3.3 8.3
48 26-02 31.9 16.7 0 0 87 34 13.4 11.6 2.4 3.3 7.5
49 Dec 03-09 31.2 14.8 0 0 88 31 12 10 2.3 3 8
50 10-16 30.1 17.3 4.4 1 77 46 12.2 13.6 2.9 2.7 4.4
51 17-23 27.7 16.6 9.4 1 85 52 13.1 13.3 3.1 2.3 2
52 24-31 26.9 10.8 0 0 87 29 9.1 7.4 2.4 2.6 6.2
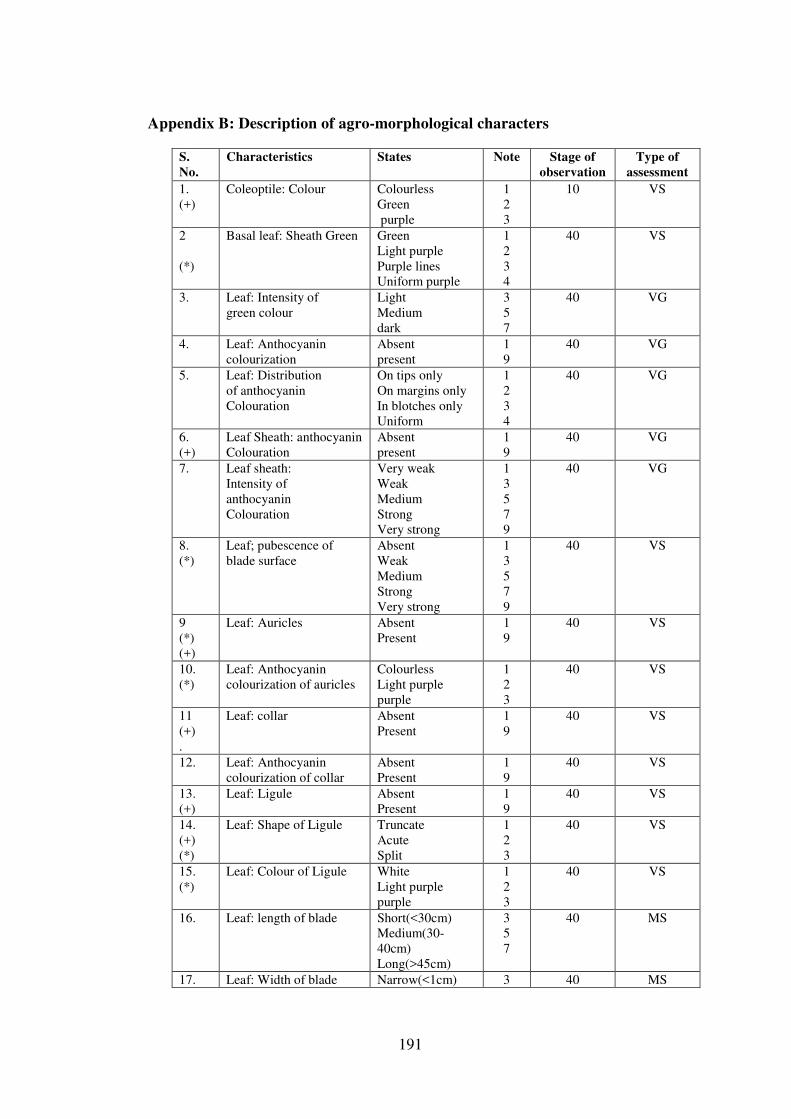
191
Appendix B: Description of agro-morphological characters
S.
No.
Characteristics States Note Stage of
observation
Type of
assessment
1.
(+)
Coleoptile: Colour Colourless
Green
purple
1
2
3
10 VS
2
(*)
Basal leaf: Sheath Green Green
Light purple
Purple lines
Uniform purple
1
2
3
4
40 VS
3. Leaf: Intensity of
green colour
Light
Medium
dark
3
5
7
40 VG
4. Leaf: Anthocyanin
colourization
Absent
present
1
9
40 VG
5. Leaf: Distribution
of anthocyanin
Colouration
On tips only
On margins only
In blotches only
Uniform
1
2
3
4
40 VG
6.
(+)
Leaf Sheath: anthocyanin
Colouration
Absent
present
1
9
40 VG
7. Leaf sheath:
Intensity of
anthocyanin
Colouration
Very weak
Weak
Medium
Strong
Very strong
1
3
5
7
9
40 VG
8.
(*)
Leaf; pubescence of
blade surface
Absent
Weak
Medium
Strong
Very strong
1
3
5
7
9
40 VS
9
(*)
(+)
Leaf: Auricles Absent
Present
1
9
40 VS
10.
(*)
Leaf: Anthocyanin
colourization of auricles
Colourless
Light purple
purple
1
2
3
40 VS
11
(+)
.
Leaf: collar Absent
Present
1
9
40 VS
12. Leaf: Anthocyanin
colourization of collar
Absent
Present
1
9
40 VS
13.
(+)
Leaf: Ligule Absent
Present
1
9
40 VS
14.
(+)
(*)
Leaf: Shape of Ligule Truncate
Acute
Split
1
2
3
40 VS
15.
(*)
Leaf: Colour of Ligule White
Light purple
purple
1
2
3
40 VS
16. Leaf: length of blade Short(<30cm)
Medium(30-
40cm)
Long(>45cm)
3
5
7
40 MS
17. Leaf: Width of blade Narrow(<1cm) 3 40 MS
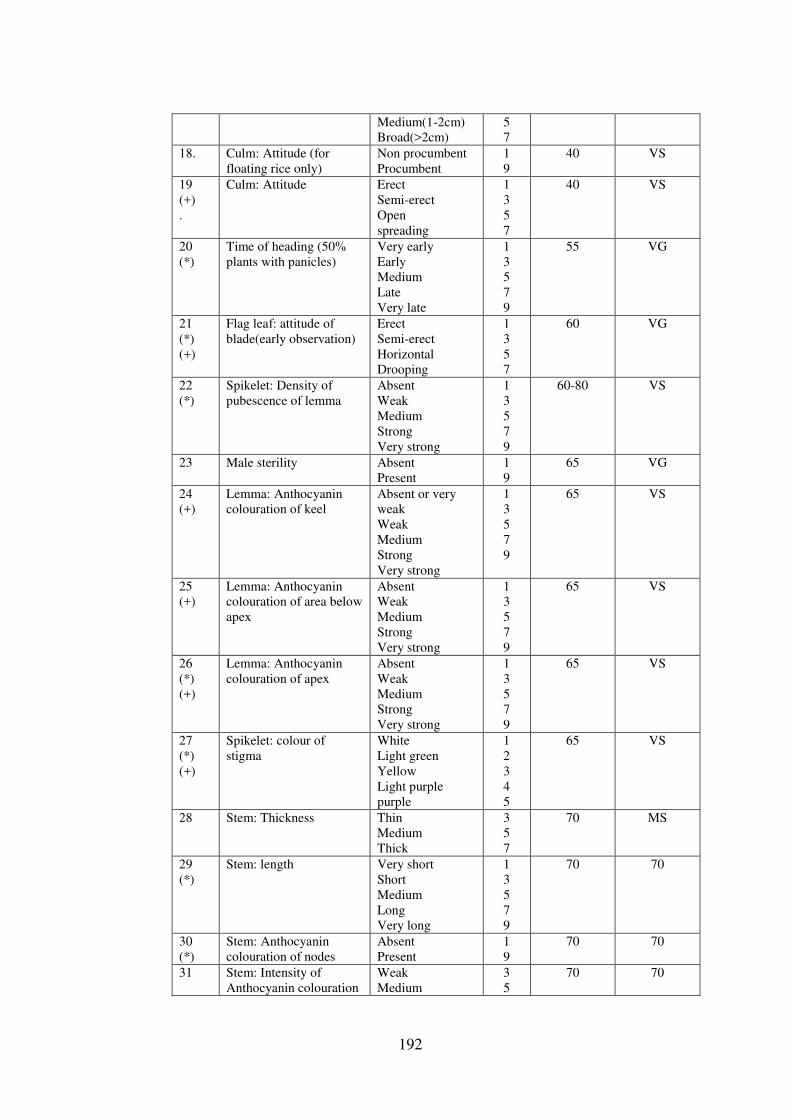
192
Medium(1-2cm)
Broad(>2cm)
5
7
18. Culm: Attitude (for
floating rice only)
Non procumbent
Procumbent
1
9
40 VS
19
(+)
.
Culm: Attitude Erect
Semi-erect
Open
spreading
1
3
5
7
40 VS
20
(*)
Time of heading (50%
plants with panicles)
Very early
Early
Medium
Late
Very late
1
3
5
7
9
55 VG
21
(*)
(+)
Flag leaf: attitude of
blade(early observation)
Erect
Semi-erect
Horizontal
Drooping
1
3
5
7
60 VG
22
(*)
Spikelet: Density of
pubescence of lemma
Absent
Weak
Medium
Strong
Very strong
1
3
5
7
9
60-80 VS
23 Male sterility Absent
Present
1
9
65 VG
24
(+)
Lemma: Anthocyanin
colouration of keel
Absent or very
weak
Weak
Medium
Strong
Very strong
1
3
5
7
9
65 VS
25
(+)
Lemma: Anthocyanin
colouration of area below
apex
Absent
Weak
Medium
Strong
Very strong
1
3
5
7
9
65 VS
26
(*)
(+)
Lemma: Anthocyanin
colouration of apex
Absent
Weak
Medium
Strong
Very strong
1
3
5
7
9
65 VS
27
(*)
(+)
Spikelet: colour of
stigma
White
Light green
Yellow
Light purple
purple
1
2
3
4
5
65 VS
28 Stem: Thickness Thin
Medium
Thick
3
5
7
70 MS
29
(*)
Stem: length Very short
Short
Medium
Long
Very long
1
3
5
7
9
70 70
30
(*)
Stem: Anthocyanin
colouration of nodes
Absent
Present
1
9
70 70
31 Stem: Intensity of
Anthocyanin colouration
Weak
Medium
3
5
70 70
193
of nodes strong 7
32 Stem: Intensity of
Anthocyanin colouration
of internodes
Absent
Present
1
9
70 70
33
(*)
(+)
Panicle: length of main
axis
Very short
Short
Medium
Long
Very long
1
3
5
7
9
70-90 MS
34
(*)
(+)
Flag leaf: Attitude of
blades
Erect
Semi-erect
Horizontal
Deflexed
1
3
5
7
90 VG
35
(*)
(+)
Panicle: Curvature of
main axis
Straight
Semi-Straight
Deflexed
Dropping
1
3
5
7
90 VG
36 Panicle: number per
plant
Few
Medium
many
3
5
7
80-90 MS
37
(*)
Spikelet: colour
of tip of lemma
White
Yellowish
Brown
Red
Purple
Black
1
2
3
4
5
6
80-90 VS
38
(+)
Lemma and palea: colour Straw
Gold and gold
furrows on straw
background
brown spots on
straw
1
2
3
80-90 VG
39
(*)
(+)
Panicle: Awns Absent
Present
1
9
90 VG
40
(*)
Panicle: colour of awns
(late observation)
Yellowish White
Yellowish brown
Brown
Reddish brown
Light red
Red
Light purple
Purple
Black
1
2
3
4
5
6
7
8
9
90 VS
41 Panicle: length of
longest Awns
Very short
Short
Medium
Long
Very long
1
3
5
7
9
90 VG-MS
42
(*)
Panicle: Distribution of
Awns
Tip only
Upper half only
Whole length
1
3
5
90 VS
43
(+)
Panicle: Presence of
secondary branching
Absent
Present
1
9
90 VG
194
44
(+)
Panicle: secondary
branching
Weak
Strong
clustered
1
2
3
90 VG
45
(+)
(*)
Panicle: attitude of
branches
Erect
Erect to semi
erect
Semi-erect
Semi erect to
spreading
spreading
1
3
5
7
9
90 VG
46
(*)
(+)
Panicle: Exertion Partly exerted
Mostly exerted
Well exerted
3
5
7
90 VG
47 Time maturity(days) Very early
Early
Medium
Late
Very late
1
3
5
7
9
90 VG
48 Leaf: Senescence Early
medium
late
3
5
7
92 VG
49
(*)
(+)
Sterile lemma: colour Straw
Gold
Red
purple
1
2
3
4
92 VS
50 Grain: Weight of 1000
fully developed grains
Very low
Low
Medium
High
very high
1
3
5
7
9
92 MG
51
(+)
Grain: Length Very short
Short
Medium
Long
Very long
1
3
5
7
9
92 MS
52 Grain: Width Very narrow
Narrow
Medium
Broad
Very broad
1
3
5
7
9
92 MS
53
(+)
Grain: Phenol reaction of
lemma
Absent
Present
1
9
92 VG
54
(*)
(+)
Decorticated grain:
length
Short
Medium
Long
Extra long
1
3
5
9
92 MS
55
(*)
(+)
Decorticated grain: width Narrow
Medium
broad
3
5
7
92 MS
56
(*)
(+)
Decorticated grain:
shape(in lateral view)
Short slender
Short bold
Medium slender
Long bold
Long slender
Extra Long
slender
1
2
3
4
5
6
92 MS
57 Decorticated grain: White 1 92 VG
195
(*) colour Light brown
Variegated brown
Dark brown
Light red
Red
Variegated
purple
Purple
Dark purple
2
3
4
5
6
7
8
9
58
(+)
Endosperm: presence of
amylose
Absent
Present
1
9
92 MG
59
(*)
(+)
Endosperm: content of
amylose
Very low
Low
Medium
High
very high
1
3
5
7
9
92 MG
60
(+)
Varieties with
endosperm of amylose
absent only polished
grain: Expressed of white
core
Absent or very
small
Small
Medium
Large
Fully chalky
1
3
5
7
9
90 MG
61
(+)
Gelatinization
temperature through
alkali spreading value
low
Medium
High
Medium
High
1
3
5
7
92 MG
62
(*)
(+)
Decorticated grain:
Aroma
Absent
Present
1
9
92 MG
196
Appendix C(i) : Agromorphological characters studied in short (24) and long (24) grain germplasm of rice
CGR
no.
IC No. Name Source (Village/
Block/Distt.)
Coleoptile
colour
Basal
leaf:
Sheath
colour
Leaf:
Intesity
of
green
colour
Leaf:
Anthocyanin
colouration
Leaf:
Distribution
of
Anthocyanin
colouration
Leaf
sheath:
anthocyanin
colouration
Leaf
sheath:Intensity
of anthocyanin
colourarion
Leaf:
Pubescence
of blade
surface
10031 116093 Lokti Machhi Bade Rajpur/Bade Rajpur/
Bastar
Green Green Medium Absent Absent Absent Absent Medium
10036 116098 Atma Sital Antagarh/Antagarh/ Bastar Green Green Medium Absent Absent Absent Absent Medium
10029 116091 Lokti Machhi Narayanpur/
Narayanpur/Bastar
Green Green Medium Absent Absent Absent Absent Medium
1686 132619 ADT:27 Rajim/Fingeshwar/ Raipur Purple Green Medium Absent Absent Absent Absent Medium
1829 132767 Anjania Pandarbhattha/
Bemetara/Durg
Purple Purple
Line
Medium Absent Absent Absent Absent Medium
2845 NA Kanak Jira Dadesara/Durg/Durg Purple Purple
Line
Medium Absent Absent Absent Absent Medium
2890 134280 Jhumera Martara/Bemetara/ Durg Purple Purple
Line
Medium Absent Absent Absent Absent Weak
2947 134337 Kakeda (I) Kuamalji/Pandariya/Bilaspur Green Green Medium Absent Absent Absent Absent Medium
6475 125708 Dubraj II Chandkhuri/Arang/ Raipur Green Green Medium Absent Absent Absent Absent Weak
2300 133269 Bhulau Gidhpuri/Palari/ Raipur Purple Green Medium Absent Absent Absent Absent Medium
2929 134319 Rani kajar Garra/Palari/Raipur Green Green Medium Absent Absent Absent Absent Medium
3870 135260 Sundar mani Kodohatha/Deobhog/Raipur Purple Green Medium Absent Absent Absent Absent Medium
5855 NA Bhado kanker Turanga/Pusaur/ Raigarh Green Green Medium Absent Absent Absent Absent Weak
2888 134278 Jhumarwa Charbhatha/
Fingeshwar/Raipur
Green Green Medium Absent Absent Absent Absent Weak
6062 114188 Bishnu Bishnupur/
Baikundpur/Sarguja
Green Green Medium Absent Absent Absent Absent Medium
512 123552 Basa Bhog Pratappur/Pratappur/Sarguja Green Green Dark
Green
Absent Absent Absent Absent Weak
5375 124958 Krishna Bhog Mohgaon/Mandla/ Mandla Green Green Medium Absent Absent Absent Absent Medium
7087 NA Hira Nakhi Khekha/Bichhiya/ Mandla Green Green Medium Absent Absent Absent Absent Medium
197
10032 116094 Lokti Maudi Abujhmad/Abujhmad/Bastar Green Green Medium Absent Absent Absent Absent Medium
6069 NA Kariya bodela
bija
Kodo/Abujhmad/ Bastar Green Green Medium Absent Absent Absent Absent Medium
6688 125922 Gganja Kali Kudum Kala/Ghar
Ghoda/Raigarh
Green Green Medium Absent Absent Absent Absent Medium
5528 125109 Banas KupiII Jhilwada/Waraseoni/Balagha
t
Green Green Medium Absent Absent Absent Absent Medium
6444 125677 Dhangari
Khusha
Darrabhatha/Saraipali/Raipur Green Green Medium Absent Absent Absent Absent Hard
6446 125679 Bhaniya Fashakar/Durgkondal/Bastar Green Green Medium Absent Absent Absent Absent Weak
6637 125871 Farsa phool Koyalibeda/
Koyalibeda/Bastar
Green Purple
Line
Medium Absent Absent Absent Absent Medium
7125 114272 Jay Bajrang Fingeshwar/
Fingeshwar/Raipur
Green Purple
Line
Medium Absent Absent Absent Absent Weak
6726 125960 Gilas Enhoor/Durgkondal/Bastar Green Green Medium Absent Absent Absent Absent Medium
7615 NA Khatia pati Odan/Palari/Raipur Purple Purple
Line
Medium Absent Absent Absent Absent Medium
8421 114979 Mani Rajim/Rajim/Raipur Green Green Dark
Green
Absent Absent Absent Absent Weak
7539 NA Khatriya pati Odan/Palari/Raipur Green Purple
Line
Medium Absent Absent Absent Absent Weak
6729 NA Girmit Kokodi/Kirnapur/ Balaghat Green Green Medium Absent Absent Absent Absent Medium
7960 NA Lanji Deverda/Baldevgarh/Tikamg
arh
Green Green Dark
Green
Absent Absent Absent Absent Strong
5772 114018 Banreg Khutgaon/Deobhog/Raipur Purple Purple
Line
Dark
Green
Absent Absent Absent Absent Strong
9209 NA Ruchi Kusumi/Kusumi/ Sarguja Green Green Dark
Green
Absent Absent Absent Absent Strong
8187 NA Safed luchai Nagajhare/Barghat/ Seoni Green Green Medium Absent Absent Absent Absent Medium
3090 134480 Kanthi deshi Vijaipali/Barghat/ Seoni Purple Purple
Line
Medium Absent Absent Absent Absent Medium
9068 NA Piso III Barghat/Barghat/ Seoni Green Green Medium Absent Absent Absent Absent Medium
7301 114358 Kakdi Kukanar/Darma/ Bastar Green Purple
Line
Medium Absent Absent Absent Absent Weak
6656 125890 Gajpati Kosamghat/Ghar
Ghoda/Bastar
Purple Purple
Line
Medium Absent Absent Absent Absent Weak
198
6650 125884 Gadur sela NA/Mohala/ Rajnandgaon Green Green Medium Absent Absent Absent Absent Weak
5103 124686 Aadan chilpa Kesherpal/Bastar/ Bastar Green Purple
Line
Medium Absent Absent Absent Absent Medium
5078 214553 Unknown NA/NA/NA(CG) Green Green Medium Absent Absent Absent Absent Medium
9420 115695 Saja chhilau Kanker/Kanker/ Bastar Green Purple
Line
Medium Absent Absent Absent Absent Strong
9395 NA Parmal Safri Tilda/Tilda/Raipur Green Purple
Line
Medium Absent Absent Absent Absent Medium
9254 115573 Safri Varasioni/Waraseoni/Balagh
at
Green Green Medium Absent Absent Absent Absent Strong
8711 NA Narved Muraina/NA/Muraina Green Green Medium Absent Absent Absent Absent Medium
8673 NA Nagbel Dev Bhog/Devbhog /Raipur Green Purple
Line
Medium Absent Absent Absent Absent Medium
8558 115101 Mudariya Abhanpur/Abhanpur/Raipur Green Purple
Line
Medium Absent Absent Absent Absent Medium
199
Appendix C (ii): Agromorphological characters studied in short (24) and long (24) grain germplasm of rice
CGR
no.
IC No. Name Source (Village/
Block/Distt.)
Leaf:
Auricles
Leaf:
Anthocyanin
colouration
of auricles
Leaf:
Collar
Leaf:
Anthocyanin
colouration
of collar
Leaf:
Ligule
Leaf:
Shape of
Ligule
Leaf:
Colour of
ligule
10031 116093 Lokti Machhi Bade Rajpur/Bade Rajpur/
Bastar
Present Colourless Present Absent Present Split White
10036 116098 Atma Sital Antagarh/Antagarh/ Bastar Present Colourless Present Absent Present Split White
10029 116091 Lokti Machhi Narayanpur/
Narayanpur/Bastar
Present Colourless Present Absent Present Split White
1686 132619 ADT:27 Rajim/Fingeshwar/ Raipur Present Colourless Present Absent Present Split White
1829 132767 Anjania Pandarbhattha/
Bemetara/Durg
Present Colourless Present Present Present Split White
2845 NA Kanak Jira Dadesara/Durg/Durg Present Colourless Present Present Present Split White
2890 134280 Jhumera Martara/Bemetara/ Durg Present Colourless Present Absent Present Split White
2947 134337 Kakeda (I) Kuamalji/Pandariya/Bilasp
ur
Present Colourless Present Absent Present Split White
6475 125708 Dubraj II Chandkhuri/Arang/ Raipur Present Colourless Present Absent Present Split White
2300 133269 Bhulau Gidhpuri/Palari/ Raipur Present Colourless Present Absent Present Acute White
2929 134319 Rani kajar Garra/Palari/Raipur Present Colourless Present Absent Present Split White
3870 135260 Sundar mani Kodohatha/Deobhog/
Raipur
Present Colourless Present Absent Present Split White
5855 NA Bhado kanker Turanga/Pusaur/ Raigarh Present Colourless Present Absent Present Split White
2888 134278 Jhumarwa Charbhatha/
Fingeshwar/Raipur
Present Colourless Present Absent Present Split White
6062 114188 Bishnu Bishnupur/
Baikundpur/Sarguja
Present Colourless Present Absent Present Acute White
512 123552 Basa Bhog Pratappur/Pratappur/
Sarguja
Present Colourless Present Absent Present Split White
5375 124958 Krishna Bhog Mohgaon/Mandla/ Mandla Present Colourless Present Absent Present Split White
7087 NA Hira Nakhi Khekha/Bichhiya/ Mandla Present Colourless Present Absent Present Split White
10032 116094 Lokti Maudi Abujhmad/Abujhmad/ Present Colourless Present Absent Present Split White
200
Bastar
6069 NA Kariya bodela
bija
Kodo/Abujhmad/ Bastar Present Colourless Present Absent Present Split White
6688 125922 Gganja Kali Kudum Kala/Ghar
Ghoda/Raigarh
Present Colourless Present Absent Present Acute White
5528 125109 Banas KupiII Jhilwada/Waraseoni/
Balaghat
Present Colourless Present Absent Present Split White
6444 125677 Dhangari Khusha Darrabhatha/Saraipali/
Raipur
Present Colourless Present Absent Present Split White
6446 125679 Bhaniya Fashakar/Durgkondal/
Bastar
Present Colourless Present Absent Present Split White
6637 125871 Farsa phool Koyalibeda/
Koyalibeda/Bastar
Present Colourless Present Absent Present Split White
7125 114272 Jay Bajrang Fingeshwar/
Fingeshwar/Raipur
Present Colourless Present Present Present Split White
6726 125960 Gilas Enhoor/Durgkondal/Bastar Present Colourless Present Absent Present Split White
7615 NA Khatia pati Odan/Palari/Raipur Present Colourless Present Absent Present Split White
8421 114979 Mani Rajim/Rajim/Raipur Present Colourless Present Absent Present Split White
7539 NA Khatriya pati Odan/Palari/Raipur Present Colourless Present Absent Present Split White
6729 NA Girmit Kokodi/Kirnapur/ Balaghat Present Colourless Present Absent Present Split White
7960 NA Lanji Deverda/Baldevgarh/
Tikamgarh
Present Colourless Present Absent Present Split White
5772 114018 Banreg Khutgaon/Deobhog/Raipur Present Colourless Present Absent Present Split White
9209 NA Ruchi Kusumi/Kusumi/ Sarguja Present Colourless Present Absent Present Split White
8187 NA Safed luchai Nagajhare/Barghat/ Seoni Present Colourless Present Absent Present Split White
3090 134480 Kanthi deshi Vijaipali/Barghat/ Seoni Present Colourless Present Absent Present Split White
9068 NA Piso III Barghat/Barghat/ Seoni Present Colourless Present Absent Present Split White
7301 114358 Kakdi Kukanar/Darma/ Bastar Present Colourless Present Absent Present Split White
6656 125890 Gajpati Kosamghat/Ghar
Ghoda/Bastar
Present Colourless Present Absent Present Split White
6650 125884 Gadur sela NA/Mohala/ Rajnandgaon Present Colourless Present Absent Present Split White
5103 124686 Aadan chilpa Kesherpal/Bastar/ Bastar Present Colourless Present Absent Present Split White
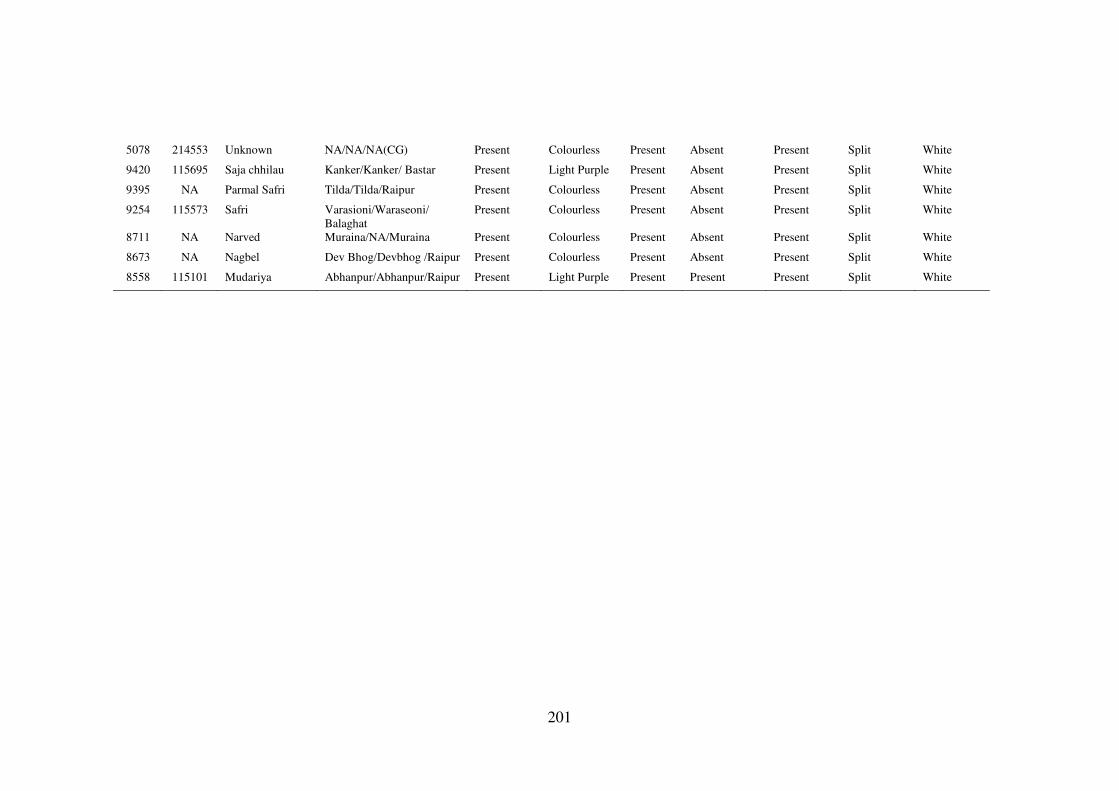
201
5078 214553 Unknown NA/NA/NA(CG) Present Colourless Present Absent Present Split White
9420 115695 Saja chhilau Kanker/Kanker/ Bastar Present Light Purple Present Absent Present Split White
9395 NA Parmal Safri Tilda/Tilda/Raipur Present Colourless Present Absent Present Split White
9254 115573 Safri Varasioni/Waraseoni/
Balaghat
Present Colourless Present Absent Present Split White
8711 NA Narved Muraina/NA/Muraina Present Colourless Present Absent Present Split White
8673 NA Nagbel Dev Bhog/Devbhog /Raipur Present Colourless Present Absent Present Split White
8558 115101 Mudariya Abhanpur/Abhanpur/Raipur Present Light Purple Present Present Present Split White
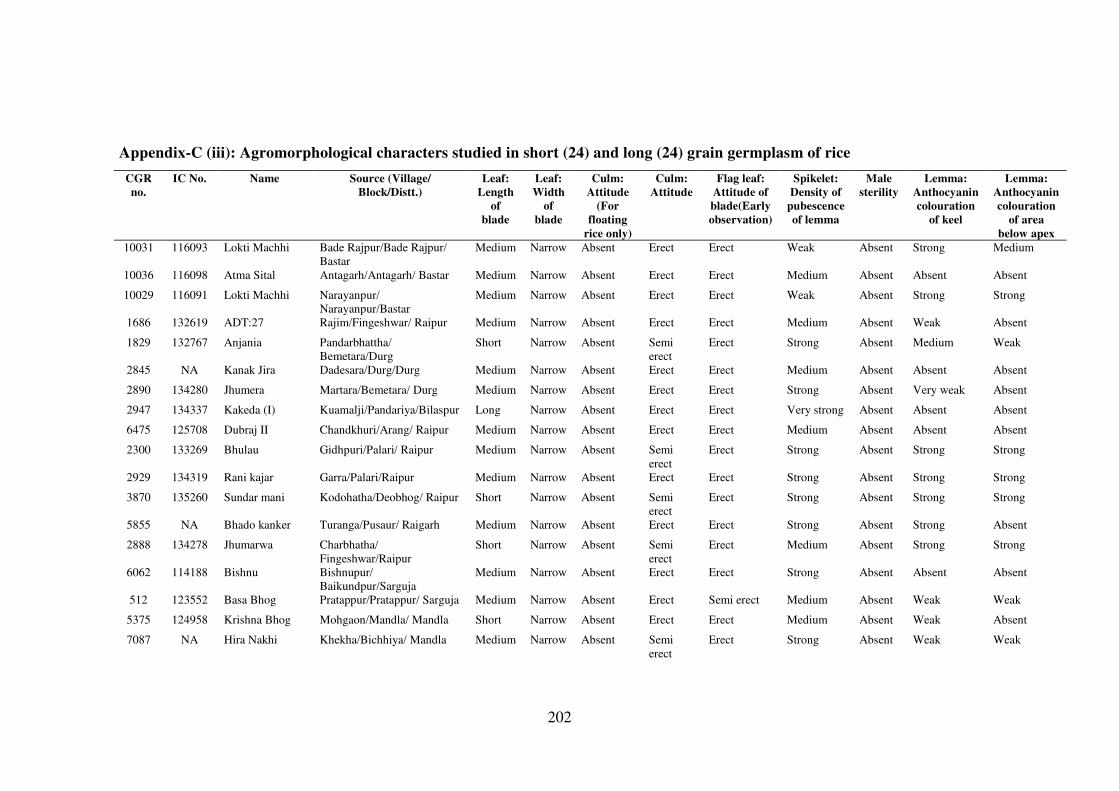
202
Appendix-C (iii): Agromorphological characters studied in short (24) and long (24) grain germplasm of rice
CGR
no.
IC No. Name Source (Village/
Block/Distt.)
Leaf:
Length
of
blade
Leaf:
Width
of
blade
Culm:
Attitude
(For
floating
rice only)
Culm:
Attitude
Flag leaf:
Attitude of
blade(Early
observation)
Spikelet:
Density of
pubescence
of lemma
Male
sterility
Lemma:
Anthocyanin
colouration
of keel
Lemma:
Anthocyanin
colouration
of area
below apex
10031 116093 Lokti Machhi Bade Rajpur/Bade Rajpur/
Bastar
Medium Narrow Absent Erect Erect Weak Absent Strong Medium
10036 116098 Atma Sital Antagarh/Antagarh/ Bastar Medium Narrow Absent Erect Erect Medium Absent Absent Absent
10029 116091 Lokti Machhi Narayanpur/
Narayanpur/Bastar
Medium Narrow Absent Erect Erect Weak Absent Strong Strong
1686 132619 ADT:27 Rajim/Fingeshwar/ Raipur Medium Narrow Absent Erect Erect Medium Absent Weak Absent
1829 132767 Anjania Pandarbhattha/
Bemetara/Durg
Short Narrow Absent Semi
erect
Erect Strong Absent Medium Weak
2845 NA Kanak Jira Dadesara/Durg/Durg Medium Narrow Absent Erect Erect Medium Absent Absent Absent
2890 134280 Jhumera Martara/Bemetara/ Durg Medium Narrow Absent Erect Erect Strong Absent Very weak Absent
2947 134337 Kakeda (I) Kuamalji/Pandariya/Bilaspur Long Narrow Absent Erect Erect Very strong Absent Absent Absent
6475 125708 Dubraj II Chandkhuri/Arang/ Raipur Medium Narrow Absent Erect Erect Medium Absent Absent Absent
2300 133269 Bhulau Gidhpuri/Palari/ Raipur Medium Narrow Absent Semi
erect
Erect Strong Absent Strong Strong
2929 134319 Rani kajar Garra/Palari/Raipur Medium Narrow Absent Erect Erect Strong Absent Strong Strong
3870 135260 Sundar mani Kodohatha/Deobhog/ Raipur Short Narrow Absent Semi
erect
Erect Strong Absent Strong Strong
5855 NA Bhado kanker Turanga/Pusaur/ Raigarh Medium Narrow Absent Erect Erect Strong Absent Strong Absent
2888 134278 Jhumarwa Charbhatha/
Fingeshwar/Raipur
Short Narrow Absent Semi
erect
Erect Medium Absent Strong Strong
6062 114188 Bishnu Bishnupur/
Baikundpur/Sarguja
Medium Narrow Absent Erect Erect Strong Absent Absent Absent
512 123552 Basa Bhog Pratappur/Pratappur/ Sarguja Medium Narrow Absent Erect Semi erect Medium Absent Weak Weak
5375 124958 Krishna Bhog Mohgaon/Mandla/ Mandla Short Narrow Absent Erect Erect Medium Absent Weak Absent
7087 NA Hira Nakhi Khekha/Bichhiya/ Mandla Medium Narrow Absent Semi
erect
Erect Strong Absent Weak Weak
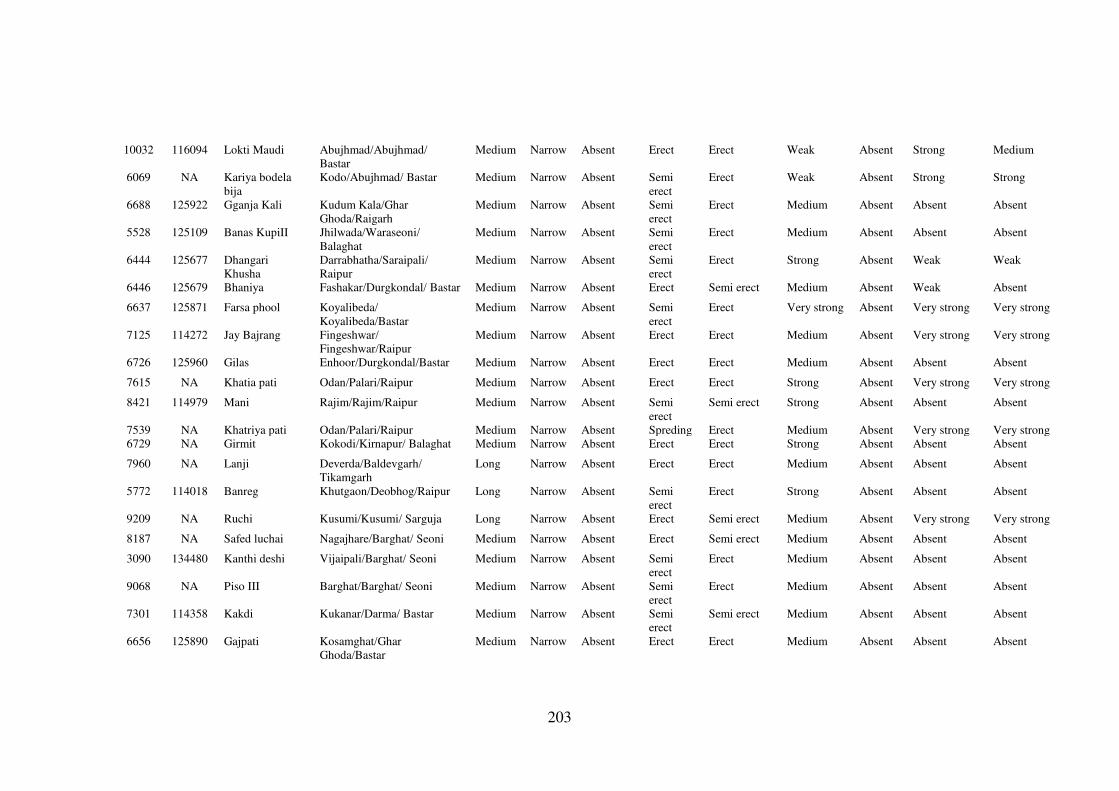
203
10032 116094 Lokti Maudi Abujhmad/Abujhmad/
Bastar
Medium Narrow Absent Erect Erect Weak Absent Strong Medium
6069 NA Kariya bodela
bija
Kodo/Abujhmad/ Bastar Medium Narrow Absent Semi
erect
Erect Weak Absent Strong Strong
6688 125922 Gganja Kali Kudum Kala/Ghar
Ghoda/Raigarh
Medium Narrow Absent Semi
erect
Erect Medium Absent Absent Absent
5528 125109 Banas KupiII Jhilwada/Waraseoni/
Balaghat
Medium Narrow Absent Semi
erect
Erect Medium Absent Absent Absent
6444 125677 Dhangari
Khusha
Darrabhatha/Saraipali/
Raipur
Medium Narrow Absent Semi
erect
Erect Strong Absent Weak Weak
6446 125679 Bhaniya Fashakar/Durgkondal/ Bastar Medium Narrow Absent Erect Semi erect Medium Absent Weak Absent
6637 125871 Farsa phool Koyalibeda/
Koyalibeda/Bastar
Medium Narrow Absent Semi
erect
Erect Very strong Absent Very strong Very strong
7125 114272 Jay Bajrang Fingeshwar/
Fingeshwar/Raipur
Medium Narrow Absent Erect Erect Medium Absent Very strong Very strong
6726 125960 Gilas Enhoor/Durgkondal/Bastar Medium Narrow Absent Erect Erect Medium Absent Absent Absent
7615 NA Khatia pati Odan/Palari/Raipur Medium Narrow Absent Erect Erect Strong Absent Very strong Very strong
8421 114979 Mani Rajim/Rajim/Raipur Medium Narrow Absent Semi
erect
Semi erect Strong Absent Absent Absent
7539 NA Khatriya pati Odan/Palari/Raipur Medium Narrow Absent Spreding Erect Medium Absent Very strong Very strong
6729 NA Girmit Kokodi/Kirnapur/ Balaghat Medium Narrow Absent Erect Erect Strong Absent Absent Absent
7960 NA Lanji Deverda/Baldevgarh/
Tikamgarh
Long Narrow Absent Erect Erect Medium Absent Absent Absent
5772 114018 Banreg Khutgaon/Deobhog/Raipur Long Narrow Absent Semi
erect
Erect Strong Absent Absent Absent
9209 NA Ruchi Kusumi/Kusumi/ Sarguja Long Narrow Absent Erect Semi erect Medium Absent Very strong Very strong
8187 NA Safed luchai Nagajhare/Barghat/ Seoni Medium Narrow Absent Erect Semi erect Medium Absent Absent Absent
3090 134480 Kanthi deshi Vijaipali/Barghat/ Seoni Medium Narrow Absent Semi
erect
Erect Medium Absent Absent Absent
9068 NA Piso III Barghat/Barghat/ Seoni Medium Narrow Absent Semi
erect
Erect Medium Absent Absent Absent
7301 114358 Kakdi Kukanar/Darma/ Bastar Medium Narrow Absent Semi
erect
Semi erect Medium Absent Absent Absent
6656 125890 Gajpati Kosamghat/Ghar
Ghoda/Bastar
Medium Narrow Absent Erect Erect Medium Absent Absent Absent

204
6650 125884 Gadur sela NA/Mohala/ Rajnandgaon Medium Narrow Absent Erect Erect Medium Absent Absent Absent
5103 124686 Aadan chilpa Kesherpal/Bastar/ Bastar Medium Narrow Absent Erect Erect Strong Absent Strong Very strong
5078 214553 Unknown NA/NA/NA(CG) Medium Narrow Absent Erect Semi erect Very strong Absent Absent Absent
9420 115695 Saja chhilau Kanker/Kanker/ Bastar Medium Narrow Absent Erect Semi erect Very strong Absent Absent Absent
9395 NA Parmal Safri Tilda/Tilda/Raipur Medium Narrow Absent Spreding Erect Weak Absent Absent Weak
9254 115573 Safri Varasioni/Waraseoni/
Balaghat
Medium Narrow Absent Erect Erect Strong Absent Absent Absent
8711 NA Narved Muraina/NA/Muraina Medium Narrow Absent Erect Erect Medium Absent Absent Absent
8673 NA Nagbel Dev Bhog/Devbhog /Raipur Medium Narrow Absent Erect Erect Very strong Absent Very strong Very strong
8558 115101 Mudariya Abhanpur/Abhanpur/Raipur Medium Narrow Absent Spreding Erect Very strong Absent Very strong Very strong
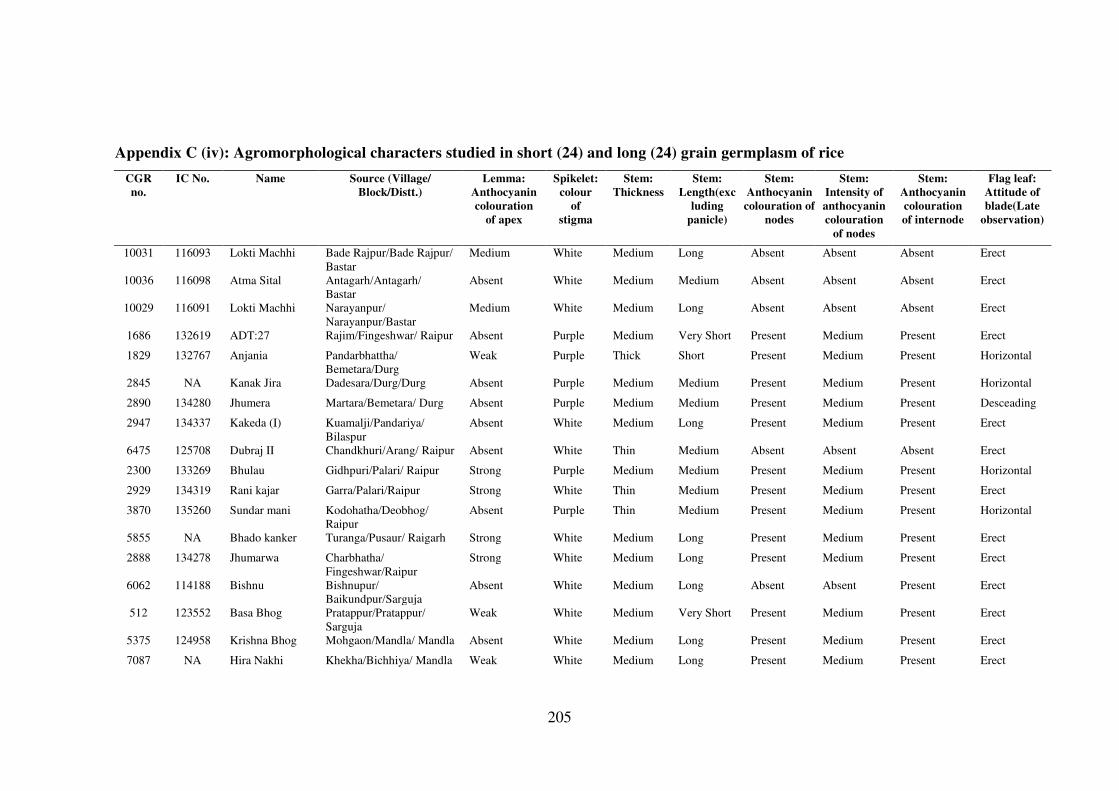
205
Appendix C (iv): Agromorphological characters studied in short (24) and long (24) grain germplasm of rice
CGR
no.
IC No. Name Source (Village/
Block/Distt.)
Lemma:
Anthocyanin
colouration
of apex
Spikelet:
colour
of
stigma
Stem:
Thickness
Stem:
Length(exc
luding
panicle)
Stem:
Anthocyanin
colouration of
nodes
Stem:
Intensity of
anthocyanin
colouration
of nodes
Stem:
Anthocyanin
colouration
of internode
Flag leaf:
Attitude of
blade(Late
observation)
10031 116093 Lokti Machhi Bade Rajpur/Bade Rajpur/
Bastar
Medium White Medium Long Absent Absent Absent Erect
10036 116098 Atma Sital Antagarh/Antagarh/
Bastar
Absent White Medium Medium Absent Absent Absent Erect
10029 116091 Lokti Machhi Narayanpur/
Narayanpur/Bastar
Medium White Medium Long Absent Absent Absent Erect
1686 132619 ADT:27 Rajim/Fingeshwar/ Raipur Absent Purple Medium Very Short Present Medium Present Erect
1829 132767 Anjania Pandarbhattha/
Bemetara/Durg
Weak Purple Thick Short Present Medium Present Horizontal
2845 NA Kanak Jira Dadesara/Durg/Durg Absent Purple Medium Medium Present Medium Present Horizontal
2890 134280 Jhumera Martara/Bemetara/ Durg Absent Purple Medium Medium Present Medium Present Desceading
2947 134337 Kakeda (I) Kuamalji/Pandariya/
Bilaspur
Absent White Medium Long Present Medium Present Erect
6475 125708 Dubraj II Chandkhuri/Arang/ Raipur Absent White Thin Medium Absent Absent Absent Erect
2300 133269 Bhulau Gidhpuri/Palari/ Raipur Strong Purple Medium Medium Present Medium Present Horizontal
2929 134319 Rani kajar Garra/Palari/Raipur Strong White Thin Medium Present Medium Present Erect
3870 135260 Sundar mani Kodohatha/Deobhog/
Raipur
Absent Purple Thin Medium Present Medium Present Horizontal
5855 NA Bhado kanker Turanga/Pusaur/ Raigarh Strong White Medium Long Present Medium Present Erect
2888 134278 Jhumarwa Charbhatha/
Fingeshwar/Raipur
Strong White Medium Long Present Medium Present Erect
6062 114188 Bishnu Bishnupur/
Baikundpur/Sarguja
Absent White Medium Long Absent Absent Present Erect
512 123552 Basa Bhog Pratappur/Pratappur/
Sarguja
Weak White Medium Very Short Present Medium Present Erect
5375 124958 Krishna Bhog Mohgaon/Mandla/ Mandla Absent White Medium Long Present Medium Present Erect
7087 NA Hira Nakhi Khekha/Bichhiya/ Mandla Weak White Medium Long Present Medium Present Erect
206
10032 116094 Lokti Maudi Abujhmad/Abujhmad/
Bastar
Strong Purple Medium Long Present Medium Present Erect
6069 NA Kariya bodela
bija
Kodo/Abujhmad/ Bastar Strong White Thick Long Absent Absent Absent Erect
6688 125922 Gganja Kali Kudum Kala/Ghar
Ghoda/Raigarh
Absent White Medium Long Present Medium Present Horizontal
5528 125109 Banas KupiII Jhilwada/Waraseoni/
Balaghat
Absent White Medium Medium Present Medium Present Horizontal
6444 125677 Dhangari
Khusha
Darrabhatha/Saraipali/
Raipur
Medium White Medium Long Absent Absent Absent Erect
6446 125679 Bhaniya Fashakar/Durgkondal/
Bastar
Absent White Medium Medium Present Medium Present Horizontal
6637 125871 Farsa phool Koyalibeda/
Koyalibeda/Bastar
Very strong Purple Medium Long Present Medium Present Erect
7125 114272 Jay Bajrang Fingeshwar/
Fingeshwar/Raipur
Very strong White Thick Very Long Present Strong Present Horizontal
6726 125960 Gilas Enhoor/Durgkondal/
Bastar
Absent White Medium Long Present Medium Present Horizontal
7615 NA Khatia pati Odan/Palari/Raipur Very strong White Medium Very Long Absent Absent Absent Horizontal
8421 114979 Mani Rajim/Rajim/Raipur Absent Purple Medium Long Absent Absent Absent Horizontal
7539 NA Khatriya pati Odan/Palari/Raipur Very strong White Medium Very Long Present Medium Present Erect
6729 NA Girmit Kokodi/Kirnapur/
Balaghat
Weak Purple Thick Long Absent Absent Absent Horizontal
7960 NA Lanji Deverda/Baldevgarh/
Tikamgarh
Absent White Medium Very Long Absent Absent Absent Erect
5772 114018 Banreg Khutgaon/Deobhog/
Raipur
Absent Purple Medium Very Long Present Medium Present Erect
9209 NA Ruchi Kusumi/Kusumi/ Sarguja Very strong White Thick Very Long Absent Absent Absent Erect
8187 NA Safed luchai Nagajhare/Barghat/ Seoni Absent White Medium Very Long Absent Absent Absent Horizontal
3090 134480 Kanthi deshi Vijaipali/Barghat/ Seoni Absent Purple Medium Long Present weak Present Horizontal
9068 NA Piso III Barghat/Barghat/ Seoni Absent White Thick Very Long Absent Absent Absent Horizontal
7301 114358 Kakdi Kukanar/Darma/ Bastar Absent White Medium Long Absent Absent Absent Erect
6656 125890 Gajpati Kosamghat/Ghar
Ghoda/Bastar
Absent Purple Medium Very Long Present Medium Present Horizontal
207
6650 125884 Gadur sela NA/Mohala/ Rajnandgaon Absent White Medium Long Absent Absent Absent Erect
5103 124686 Aadan chilpa Kesherpal/Bastar/ Bastar Very strong White Medium Very Long Absent Absent Absent Erect
5078 214553 Unknown NA/NA/NA(CG) Absent White Medium Very Long Absent Absent Absent Semi erect
9420 115695 Saja chhilau Kanker/Kanker/ Bastar Absent White Medium Very Long Absent Absent Absent Erect
9395 NA Parmal Safri Tilda/Tilda/Raipur Weak White Medium Very Long Absent Absent Absent Erect
9254 115573 Safri Varasioni/Waraseoni/
Balaghat
Absent White Medium Very Long Absent Absent Absent Erect
8711 NA Narved Muraina/NA/Muraina Absent White Medium Very Long Absent Absent Absent Erect
8673 NA Nagbel Dev Bhog/Devbhog
/Raipur
Very strong White Medium Very Long Absent Absent Absent Horizontal
8558 115101 Mudariya Abhanpur/Abhanpur/
Raipur
Very strong Purple Medium Very Long Present Medium Present Horizontal
208
Appendix C (v): Agromorphological characters studied in short and long grain accessions of rice
CGR
no.
IC No. Name Source (Village/
Block/Distt.)
Panicle:
Curvature of
main axis
Spikelet:
Colour of tip
of lemma
Lemma and Palea
colour
Panicle:Awns Panicle:
Colour of
awns (late
observation)
Panicle:
Length of
longest awn
10031 116093 Lokti Machhi Bade Rajpur/Bade Rajpur/
Bastar
Semi straight Purple Purple furrows on
straw
Absent Absent Absent
10036 116098 Atma Sital Antagarh/Antagarh/
Bastar
Semi straight Yellow Straw Absent Absent Absent
10029 116091 Lokti Machhi Narayanpur/
Narayanpur/Bastar
Semi straight Black Purple furrows on
straw
Absent Absent Absent
1686 132619 ADT:27 Rajim/Fingeshwar/ Raipur Straight Brown Straw Absent Absent Absent
1829 132767 Anjania Pandarbhattha/
Bemetara/Durg
Straight Black Brown furrows on
straw
Absent Absent Absent
2845 NA Kanak Jira Dadesara/Durg/Durg Semi straight Black Brown furrows on
straw
Absent Absent Absent
2890 134280 Jhumera Martara/Bemetara/ Durg Semi straight Brown Brown furrows on
straw
Absent Absent Absent
2947 134337 Kakeda (I) Kuamalji/Pandariya/
Bilaspur
Semi straight Yellow Brown furrows on
straw
Absent Absent Absent
6475 125708 Dubraj II Chandkhuri/Arang/ Raipur Semi straight Yellow Brown spot on
straw
Absent Absent Absent
2300 133269 Bhulau Gidhpuri/Palari/ Raipur Semi straight Brown Red Absent Absent Absent
2929 134319 Rani kajar Garra/Palari/Raipur Semi straight Brown Red Absent Absent Absent
3870 135260 Sundar mani Kodohatha/Deobhog/
Raipur
Straight Brown Brown furrows on
straw
Absent Absent Absent
5855 NA Bhado kanker Turanga/Pusaur/ Raigarh Semi straight Brown Red Absent Absent Absent
2888 134278 Jhumarwa Charbhatha/
Fingeshwar/Raipur
Semi straight Brown Reddish to light
purple
Absent Absent Absent
6062 114188 Bishnu Bishnupur/
Baikundpur/Sarguja
Straight Yellow Gold and gold
furrows on straw
background
Absent Absent Absent
512 123552 Basa Bhog Pratappur/Pratappur/
Sarguja
Semi straight Yellow Straw Absent Absent Absent
5375 124958 Krishna Bhog Mohgaon/Mandla/ Mandla Straight Black Straw Absent Absent Absent
209
7087 NA Hira Nakhi Khekha/Bichhiya/ Mandla Straight Brown Gold and gold
furrows on straw
background
Absent Absent Absent
10032 116094 Lokti Maudi Abujhmad/Abujhmad/
Bastar
Semi straight Purple Purple furrows on
straw
Absent Absent Absent
6069 NA Kariya bodela bija Kodo/Abujhmad/ Bastar Semi straight Purple Brown Absent Absent Absent
6688 125922 Gganja Kali Kudum Kala/Ghar
Ghoda/Raigarh
Straight Yellow Straw Absent Absent Absent
5528 125109 Banas KupiII Jhilwada/Waraseoni/
Balaghat
Straight Yellow Straw Absent Absent Absent
6444 125677 Dhangari Khusha Darrabhatha/Saraipali/
Raipur
Straight Yellow Brown furrows on
straw
Absent Absent Absent
6446 125679 Bhaniya Fashakar/Durgkondal/
Bastar
Straight Brown Straw Absent Absent Absent
6637 125871 Farsa phool Koyalibeda/
Koyalibeda/Bastar
Deflexed Brown Red Present Red Short
7125 114272 Jay Bajrang Fingeshwar/
Fingeshwar/Raipur
Semi straight Red Red Present Red Short
6726 125960 Gilas Enhoor/Durgkondal/
Bastar
Deflexed Yellow Straw Present Yellowish
white
Short
7615 NA Khatia pati Odan/Palari/Raipur Deflexed Red Straw Present Yellowish
white
Long
8421 114979 Mani Rajim/Rajim/Raipur Semi straight Yellow Straw Present Yellowish
white
Medium
7539 NA Khatriya pati Odan/Palari/Raipur Semi straight Brown Straw Present Red Medium
6729 NA Girmit Kokodi/Kirnapur/
Balaghat
Deflexed Yellow Straw Present Yellowish
white
Medium
7960 NA Lanji Deverda/Baldevgarh/
Tikamgarh
Deflexed Yellow Straw Present Yellowish
white
Medium
5772 114018 Banreg Khutgaon/Deobhog/
Raipur
Deflexed Yellow Straw Present Yellowish
white
Short
9209 NA Ruchi Kusumi/Kusumi/ Sarguja Deflexed Yellow Red Present Brown Short
8187 NA Safed luchai Nagajhare/Barghat/ Seoni Deflexed Yellow Straw Absent Absent Absent
3090 134480 Kanthi deshi Vijaipali/Barghat/ Seoni Semi straight Yellow Straw Present Yellowish
white
Medium
9068 NA Piso III Barghat/Barghat/ Seoni Semi straight Yellow Straw Present Yellowish Medium
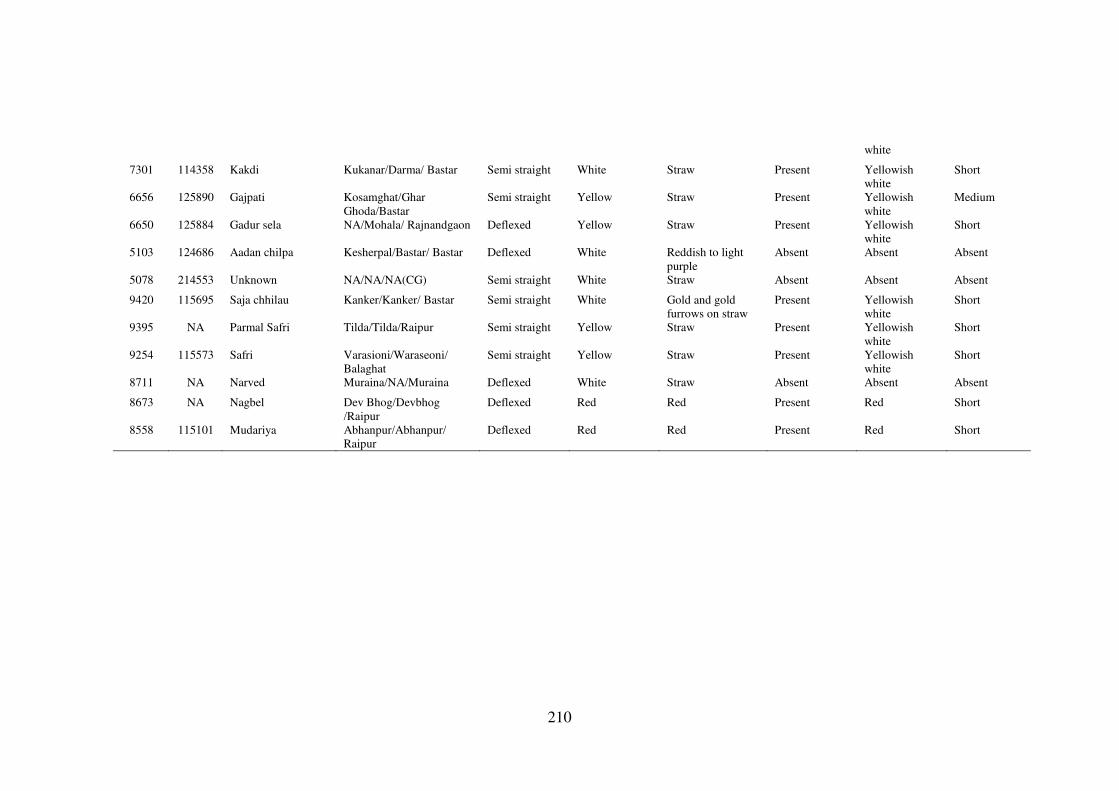
210
white
7301 114358 Kakdi Kukanar/Darma/ Bastar Semi straight White Straw Present Yellowish
white
Short
6656 125890 Gajpati Kosamghat/Ghar
Ghoda/Bastar
Semi straight Yellow Straw Present Yellowish
white
Medium
6650 125884 Gadur sela NA/Mohala/ Rajnandgaon Deflexed Yellow Straw Present Yellowish
white
Short
5103 124686 Aadan chilpa Kesherpal/Bastar/ Bastar Deflexed White Reddish to light
purple
Absent Absent Absent
5078 214553 Unknown NA/NA/NA(CG) Semi straight White Straw Absent Absent Absent
9420 115695 Saja chhilau Kanker/Kanker/ Bastar Semi straight White Gold and gold
furrows on straw
Present Yellowish
white
Short
9395 NA Parmal Safri Tilda/Tilda/Raipur Semi straight Yellow Straw Present Yellowish
white
Short
9254 115573 Safri Varasioni/Waraseoni/
Balaghat
Semi straight Yellow Straw Present Yellowish
white
Short
8711 NA Narved Muraina/NA/Muraina Deflexed White Straw Absent Absent Absent
8673 NA Nagbel Dev Bhog/Devbhog
/Raipur
Deflexed Red Red Present Red Short
8558 115101 Mudariya Abhanpur/Abhanpur/
Raipur
Deflexed Red Red Present Red Short
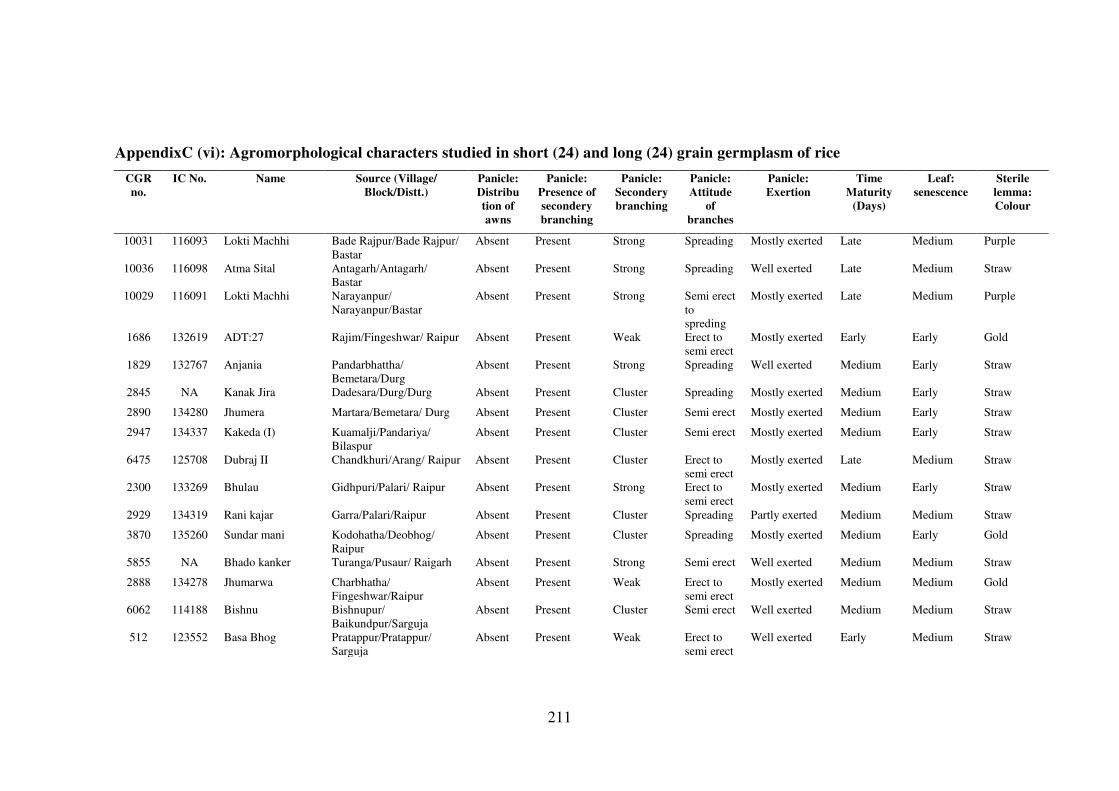
211
AppendixC (vi): Agromorphological characters studied in short (24) and long (24) grain germplasm of rice
CGR
no.
IC No. Name Source (Village/
Block/Distt.)
Panicle:
Distribu
tion of
awns
Panicle:
Presence of
secondery
branching
Panicle:
Secondery
branching
Panicle:
Attitude
of
branches
Panicle:
Exertion
Time
Maturity
(Days)
Leaf:
senescence
Sterile
lemma:
Colour
10031 116093 Lokti Machhi Bade Rajpur/Bade Rajpur/
Bastar
Absent Present Strong Spreading Mostly exerted Late Medium Purple
10036 116098 Atma Sital Antagarh/Antagarh/
Bastar
Absent Present Strong Spreading Well exerted Late Medium Straw
10029 116091 Lokti Machhi Narayanpur/
Narayanpur/Bastar
Absent Present Strong Semi erect
to
spreding
Mostly exerted Late Medium Purple
1686 132619 ADT:27 Rajim/Fingeshwar/ Raipur Absent Present Weak Erect to
semi erect
Mostly exerted Early Early Gold
1829 132767 Anjania Pandarbhattha/
Bemetara/Durg
Absent Present Strong Spreading Well exerted Medium Early Straw
2845 NA Kanak Jira Dadesara/Durg/Durg Absent Present Cluster Spreading Mostly exerted Medium Early Straw
2890 134280 Jhumera Martara/Bemetara/ Durg Absent Present Cluster Semi erect Mostly exerted Medium Early Straw
2947 134337 Kakeda (I) Kuamalji/Pandariya/
Bilaspur
Absent Present Cluster Semi erect Mostly exerted Medium Early Straw
6475 125708 Dubraj II Chandkhuri/Arang/ Raipur Absent Present Cluster Erect to
semi erect
Mostly exerted Late Medium Straw
2300 133269 Bhulau Gidhpuri/Palari/ Raipur Absent Present Strong Erect to
semi erect
Mostly exerted Medium Early Straw
2929 134319 Rani kajar Garra/Palari/Raipur Absent Present Cluster Spreading Partly exerted Medium Medium Straw
3870 135260 Sundar mani Kodohatha/Deobhog/
Raipur
Absent Present Cluster Spreading Mostly exerted Medium Early Gold
5855 NA Bhado kanker Turanga/Pusaur/ Raigarh Absent Present Strong Semi erect Well exerted Medium Medium Straw
2888 134278 Jhumarwa Charbhatha/
Fingeshwar/Raipur
Absent Present Weak Erect to
semi erect
Mostly exerted Medium Medium Gold
6062 114188 Bishnu Bishnupur/
Baikundpur/Sarguja
Absent Present Cluster Semi erect Well exerted Medium Medium Straw
512 123552 Basa Bhog Pratappur/Pratappur/
Sarguja
Absent Present Weak Erect to
semi erect
Well exerted Early Medium Straw
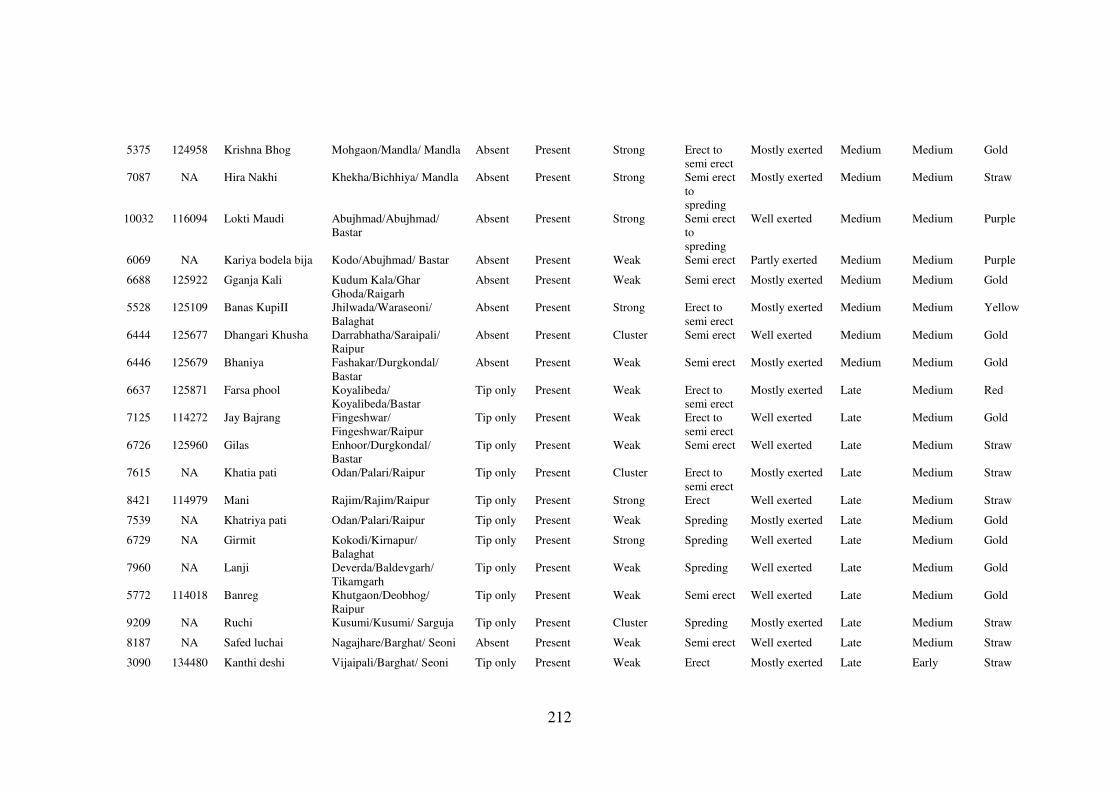
212
5375 124958 Krishna Bhog Mohgaon/Mandla/ Mandla Absent Present Strong Erect to
semi erect
Mostly exerted Medium Medium Gold
7087 NA Hira Nakhi Khekha/Bichhiya/ Mandla Absent Present Strong Semi erect
to
spreding
Mostly exerted Medium Medium Straw
10032 116094 Lokti Maudi Abujhmad/Abujhmad/
Bastar
Absent Present Strong Semi erect
to
spreding
Well exerted Medium Medium Purple
6069 NA Kariya bodela bija Kodo/Abujhmad/ Bastar Absent Present Weak Semi erect Partly exerted Medium Medium Purple
6688 125922 Gganja Kali Kudum Kala/Ghar
Ghoda/Raigarh
Absent Present Weak Semi erect Mostly exerted Medium Medium Gold
5528 125109 Banas KupiII Jhilwada/Waraseoni/
Balaghat
Absent Present Strong Erect to
semi erect
Mostly exerted Medium Medium Yellow
6444 125677 Dhangari Khusha Darrabhatha/Saraipali/
Raipur
Absent Present Cluster Semi erect Well exerted Medium Medium Gold
6446 125679 Bhaniya Fashakar/Durgkondal/
Bastar
Absent Present Weak Semi erect Mostly exerted Medium Medium Gold
6637 125871 Farsa phool Koyalibeda/
Koyalibeda/Bastar
Tip only Present Weak Erect to
semi erect
Mostly exerted Late Medium Red
7125 114272 Jay Bajrang Fingeshwar/
Fingeshwar/Raipur
Tip only Present Weak Erect to
semi erect
Well exerted Late Medium Gold
6726 125960 Gilas Enhoor/Durgkondal/
Bastar
Tip only Present Weak Semi erect Well exerted Late Medium Straw
7615 NA Khatia pati Odan/Palari/Raipur Tip only Present Cluster Erect to
semi erect
Mostly exerted Late Medium Straw
8421 114979 Mani Rajim/Rajim/Raipur Tip only Present Strong Erect Well exerted Late Medium Straw
7539 NA Khatriya pati Odan/Palari/Raipur Tip only Present Weak Spreding Mostly exerted Late Medium Gold
6729 NA Girmit Kokodi/Kirnapur/
Balaghat
Tip only Present Strong Spreding Well exerted Late Medium Gold
7960 NA Lanji Deverda/Baldevgarh/
Tikamgarh
Tip only Present Weak Spreding Well exerted Late Medium Gold
5772 114018 Banreg Khutgaon/Deobhog/
Raipur
Tip only Present Weak Semi erect Well exerted Late Medium Gold
9209 NA Ruchi Kusumi/Kusumi/ Sarguja Tip only Present Cluster Spreding Mostly exerted Late Medium Straw
8187 NA Safed luchai Nagajhare/Barghat/ Seoni Absent Present Weak Semi erect Well exerted Late Medium Straw
3090 134480 Kanthi deshi Vijaipali/Barghat/ Seoni Tip only Present Weak Erect Mostly exerted Late Early Straw
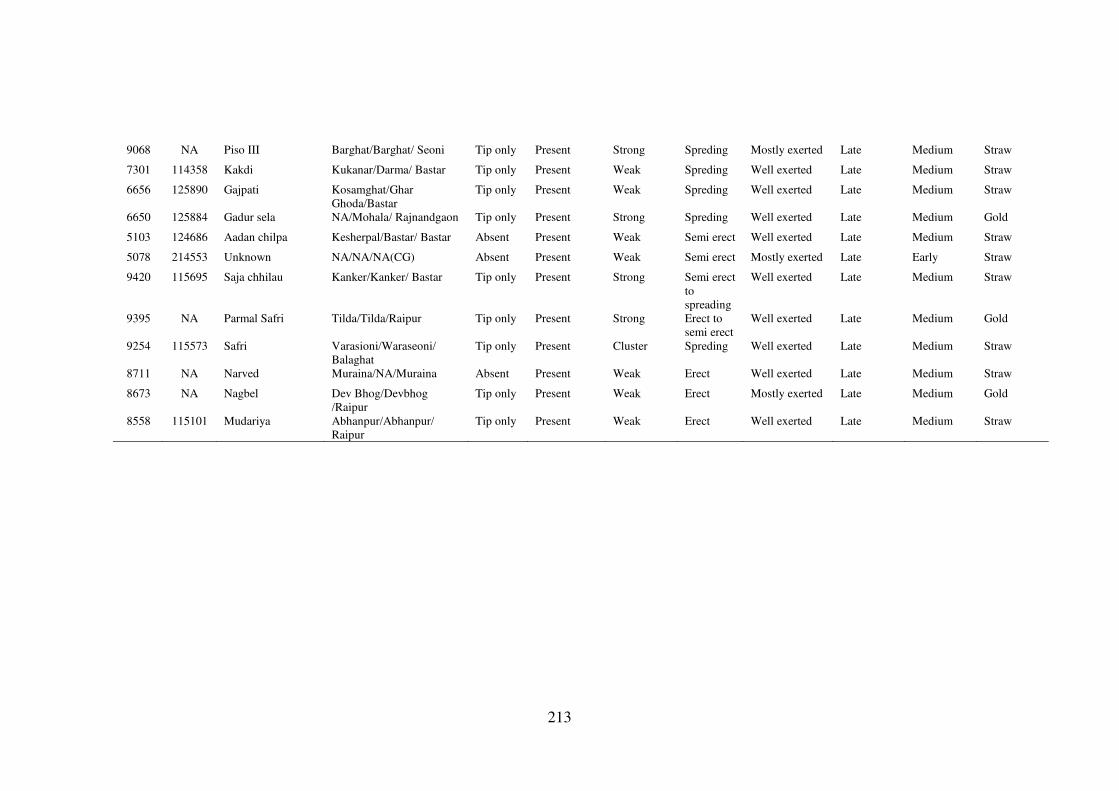
213
9068 NA Piso III Barghat/Barghat/ Seoni Tip only Present Strong Spreding Mostly exerted Late Medium Straw
7301 114358 Kakdi Kukanar/Darma/ Bastar Tip only Present Weak Spreding Well exerted Late Medium Straw
6656 125890 Gajpati Kosamghat/Ghar
Ghoda/Bastar
Tip only Present Weak Spreding Well exerted Late Medium Straw
6650 125884 Gadur sela NA/Mohala/ Rajnandgaon Tip only Present Strong Spreding Well exerted Late Medium Gold
5103 124686 Aadan chilpa Kesherpal/Bastar/ Bastar Absent Present Weak Semi erect Well exerted Late Medium Straw
5078 214553 Unknown NA/NA/NA(CG) Absent Present Weak Semi erect Mostly exerted Late Early Straw
9420 115695 Saja chhilau Kanker/Kanker/ Bastar Tip only Present Strong Semi erect
to
spreading
Well exerted Late Medium Straw
9395 NA Parmal Safri Tilda/Tilda/Raipur Tip only Present Strong Erect to
semi erect
Well exerted Late Medium Gold
9254 115573 Safri Varasioni/Waraseoni/
Balaghat
Tip only Present Cluster Spreding Well exerted Late Medium Straw
8711 NA Narved Muraina/NA/Muraina Absent Present Weak Erect Well exerted Late Medium Straw
8673 NA Nagbel Dev Bhog/Devbhog
/Raipur
Tip only Present Weak Erect Mostly exerted Late Medium Gold
8558 115101 Mudariya Abhanpur/Abhanpur/
Raipur
Tip only Present Weak Erect Well exerted Late Medium Straw
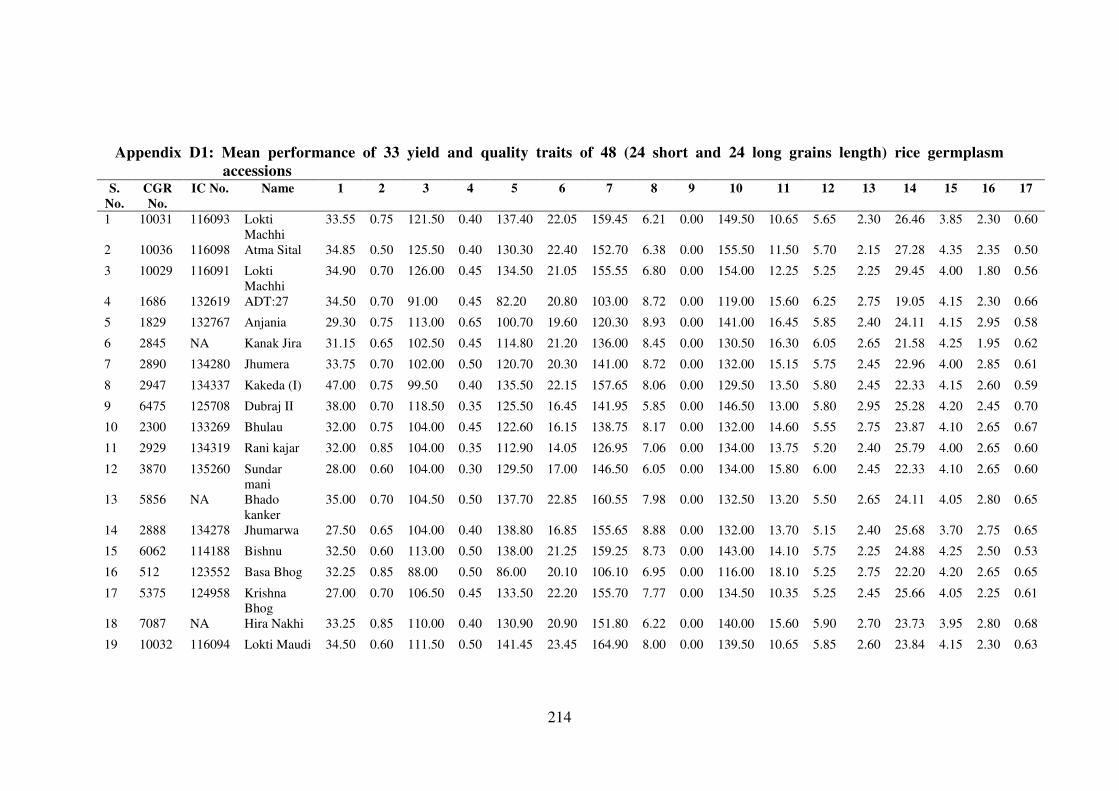
214
Appendix D1: Mean performance of 33 yield and quality traits of 48 (24 short and 24 long grains length) rice germplasm
accessions S.
No.
CGR
No.
IC No. Name 1 2 3 4 5 6 7 8 9 10 11 12 13 14 15 16 17
1 10031 116093 Lokti
Machhi
33.55 0.75 121.50 0.40 137.40 22.05 159.45 6.21 0.00 149.50 10.65 5.65 2.30 26.46 3.85 2.30 0.60
2 10036 116098 Atma Sital 34.85 0.50 125.50 0.40 130.30 22.40 152.70 6.38 0.00 155.50 11.50 5.70 2.15 27.28 4.35 2.35 0.50
3 10029 116091 Lokti
Machhi
34.90 0.70 126.00 0.45 134.50 21.05 155.55 6.80 0.00 154.00 12.25 5.25 2.25 29.45 4.00 1.80 0.56
4 1686 132619 ADT:27 34.50 0.70 91.00 0.45 82.20 20.80 103.00 8.72 0.00 119.00 15.60 6.25 2.75 19.05 4.15 2.30 0.66
5 1829 132767 Anjania 29.30 0.75 113.00 0.65 100.70 19.60 120.30 8.93 0.00 141.00 16.45 5.85 2.40 24.11 4.15 2.95 0.58
6 2845 NA Kanak Jira 31.15 0.65 102.50 0.45 114.80 21.20 136.00 8.45 0.00 130.50 16.30 6.05 2.65 21.58 4.25 1.95 0.62
7 2890 134280 Jhumera 33.75 0.70 102.00 0.50 120.70 20.30 141.00 8.72 0.00 132.00 15.15 5.75 2.45 22.96 4.00 2.85 0.61
8 2947 134337 Kakeda (I) 47.00 0.75 99.50 0.40 135.50 22.15 157.65 8.06 0.00 129.50 13.50 5.80 2.45 22.33 4.15 2.60 0.59
9 6475 125708 Dubraj II 38.00 0.70 118.50 0.35 125.50 16.45 141.95 5.85 0.00 146.50 13.00 5.80 2.95 25.28 4.20 2.45 0.70
10 2300 133269 Bhulau 32.00 0.75 104.00 0.45 122.60 16.15 138.75 8.17 0.00 132.00 14.60 5.55 2.75 23.87 4.10 2.65 0.67
11 2929 134319 Rani kajar 32.00 0.85 104.00 0.35 112.90 14.05 126.95 7.06 0.00 134.00 13.75 5.20 2.40 25.79 4.00 2.65 0.60
12 3870 135260 Sundar
mani
28.00 0.60 104.00 0.30 129.50 17.00 146.50 6.05 0.00 134.00 15.80 6.00 2.45 22.33 4.10 2.65 0.60
13 5856 NA Bhado
kanker
35.00 0.70 104.50 0.50 137.70 22.85 160.55 7.98 0.00 132.50 13.20 5.50 2.65 24.11 4.05 2.80 0.65
14 2888 134278 Jhumarwa 27.50 0.65 104.00 0.40 138.80 16.85 155.65 8.88 0.00 132.00 13.70 5.15 2.40 25.68 3.70 2.75 0.65
15 6062 114188 Bishnu 32.50 0.60 113.00 0.50 138.00 21.25 159.25 8.73 0.00 143.00 14.10 5.75 2.25 24.88 4.25 2.50 0.53
16 512 123552 Basa Bhog 32.25 0.85 88.00 0.50 86.00 20.10 106.10 6.95 0.00 116.00 18.10 5.25 2.75 22.20 4.20 2.65 0.65
17 5375 124958 Krishna
Bhog
27.00 0.70 106.50 0.45 133.50 22.20 155.70 7.77 0.00 134.50 10.35 5.25 2.45 25.66 4.05 2.25 0.61
18 7087 NA Hira Nakhi 33.25 0.85 110.00 0.40 130.90 20.90 151.80 6.22 0.00 140.00 15.60 5.90 2.70 23.73 3.95 2.80 0.68
19 10032 116094 Lokti Maudi 34.50 0.60 111.50 0.50 141.45 23.45 164.90 8.00 0.00 139.50 10.65 5.85 2.60 23.84 4.15 2.30 0.63
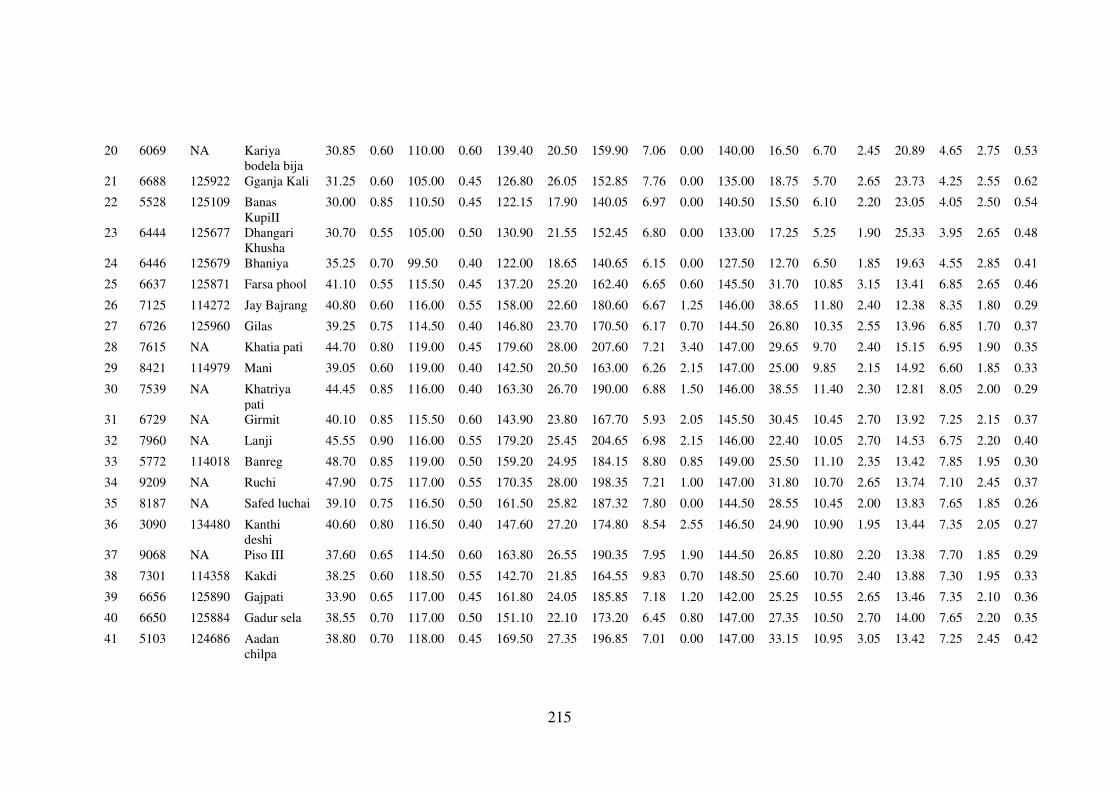
215
20 6069 NA Kariya
bodela bija
30.85 0.60 110.00 0.60 139.40 20.50 159.90 7.06 0.00 140.00 16.50 6.70 2.45 20.89 4.65 2.75 0.53
21 6688 125922 Gganja Kali 31.25 0.60 105.00 0.45 126.80 26.05 152.85 7.76 0.00 135.00 18.75 5.70 2.65 23.73 4.25 2.55 0.62
22 5528 125109 Banas
KupiII
30.00 0.85 110.50 0.45 122.15 17.90 140.05 6.97 0.00 140.50 15.50 6.10 2.20 23.05 4.05 2.50 0.54
23 6444 125677 Dhangari
Khusha
30.70 0.55 105.00 0.50 130.90 21.55 152.45 6.80 0.00 133.00 17.25 5.25 1.90 25.33 3.95 2.65 0.48
24 6446 125679 Bhaniya 35.25 0.70 99.50 0.40 122.00 18.65 140.65 6.15 0.00 127.50 12.70 6.50 1.85 19.63 4.55 2.85 0.41
25 6637 125871 Farsa phool 41.10 0.55 115.50 0.45 137.20 25.20 162.40 6.65 0.60 145.50 31.70 10.85 3.15 13.41 6.85 2.65 0.46
26 7125 114272 Jay Bajrang 40.80 0.60 116.00 0.55 158.00 22.60 180.60 6.67 1.25 146.00 38.65 11.80 2.40 12.38 8.35 1.80 0.29
27 6726 125960 Gilas 39.25 0.75 114.50 0.40 146.80 23.70 170.50 6.17 0.70 144.50 26.80 10.35 2.55 13.96 6.85 1.70 0.37
28 7615 NA Khatia pati 44.70 0.80 119.00 0.45 179.60 28.00 207.60 7.21 3.40 147.00 29.65 9.70 2.40 15.15 6.95 1.90 0.35
29 8421 114979 Mani 39.05 0.60 119.00 0.40 142.50 20.50 163.00 6.26 2.15 147.00 25.00 9.85 2.15 14.92 6.60 1.85 0.33
30 7539 NA Khatriya
pati
44.45 0.85 116.00 0.40 163.30 26.70 190.00 6.88 1.50 146.00 38.55 11.40 2.30 12.81 8.05 2.00 0.29
31 6729 NA Girmit 40.10 0.85 115.50 0.60 143.90 23.80 167.70 5.93 2.05 145.50 30.45 10.45 2.70 13.92 7.25 2.15 0.37
32 7960 NA Lanji 45.55 0.90 116.00 0.55 179.20 25.45 204.65 6.98 2.15 146.00 22.40 10.05 2.70 14.53 6.75 2.20 0.40
33 5772 114018 Banreg 48.70 0.85 119.00 0.50 159.20 24.95 184.15 8.80 0.85 149.00 25.50 11.10 2.35 13.42 7.85 1.95 0.30
34 9209 NA Ruchi 47.90 0.75 117.00 0.55 170.35 28.00 198.35 7.21 1.00 147.00 31.80 10.70 2.65 13.74 7.10 2.45 0.37
35 8187 NA Safed luchai 39.10 0.75 116.50 0.50 161.50 25.82 187.32 7.80 0.00 144.50 28.55 10.45 2.00 13.83 7.65 1.85 0.26
36 3090 134480 Kanthi
deshi
40.60 0.80 116.50 0.40 147.60 27.20 174.80 8.54 2.55 146.50 24.90 10.90 1.95 13.44 7.35 2.05 0.27
37 9068 NA Piso III 37.60 0.65 114.50 0.60 163.80 26.55 190.35 7.95 1.90 144.50 26.85 10.80 2.20 13.38 7.70 1.85 0.29
38 7301 114358 Kakdi 38.25 0.60 118.50 0.55 142.70 21.85 164.55 9.83 0.70 148.50 25.60 10.70 2.40 13.88 7.30 1.95 0.33
39 6656 125890 Gajpati 33.90 0.65 117.00 0.45 161.80 24.05 185.85 7.18 1.20 142.00 25.25 10.55 2.65 13.46 7.35 2.10 0.36
40 6650 125884 Gadur sela 38.55 0.70 117.00 0.50 151.10 22.10 173.20 6.45 0.80 147.00 27.35 10.50 2.70 14.00 7.65 2.20 0.35
41 5103 124686 Aadan
chilpa
38.80 0.70 118.00 0.45 169.50 27.35 196.85 7.01 0.00 147.00 33.15 10.95 3.05 13.42 7.25 2.45 0.42
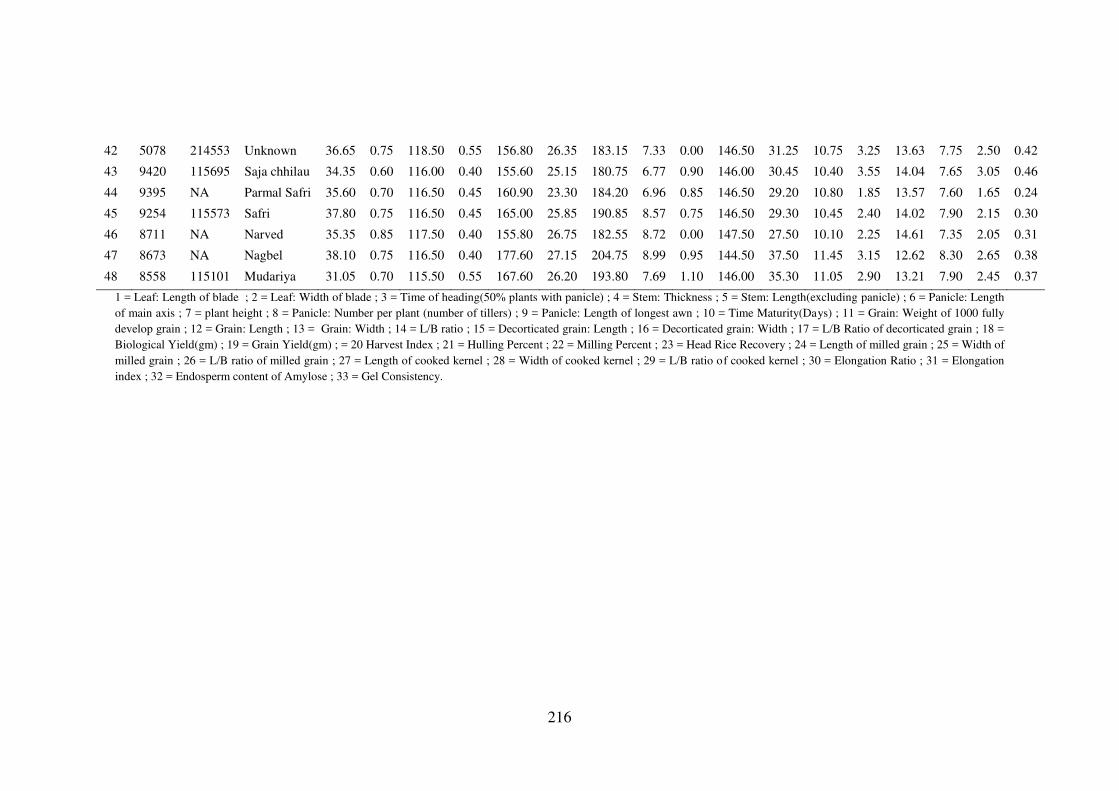
216
42 5078 214553 Unknown 36.65 0.75 118.50 0.55 156.80 26.35 183.15 7.33 0.00 146.50 31.25 10.75 3.25 13.63 7.75 2.50 0.42
43 9420 115695 Saja chhilau 34.35 0.60 116.00 0.40 155.60 25.15 180.75 6.77 0.90 146.00 30.45 10.40 3.55 14.04 7.65 3.05 0.46
44 9395 NA Parmal Safri 35.60 0.70 116.50 0.45 160.90 23.30 184.20 6.96 0.85 146.50 29.20 10.80 1.85 13.57 7.60 1.65 0.24
45 9254 115573 Safri 37.80 0.75 116.50 0.45 165.00 25.85 190.85 8.57 0.75 146.50 29.30 10.45 2.40 14.02 7.90 2.15 0.30
46 8711 NA Narved 35.35 0.85 117.50 0.40 155.80 26.75 182.55 8.72 0.00 147.50 27.50 10.10 2.25 14.61 7.35 2.05 0.31
47 8673 NA Nagbel 38.10 0.75 116.50 0.40 177.60 27.15 204.75 8.99 0.95 144.50 37.50 11.45 3.15 12.62 8.30 2.65 0.38
48 8558 115101 Mudariya 31.05 0.70 115.50 0.55 167.60 26.20 193.80 7.69 1.10 146.00 35.30 11.05 2.90 13.21 7.90 2.45 0.37
1 = Leaf: Length of blade ; 2 = Leaf: Width of blade ; 3 = Time of heading(50% plants with panicle) ; 4 = Stem: Thickness ; 5 = Stem: Length(excluding panicle) ; 6 = Panicle: Length
of main axis ; 7 = plant height ; 8 = Panicle: Number per plant (number of tillers) ; 9 = Panicle: Length of longest awn ; 10 = Time Maturity(Days) ; 11 = Grain: Weight of 1000 fully
develop grain ; 12 = Grain: Length ; 13 = Grain: Width ; 14 = L/B ratio ; 15 = Decorticated grain: Length ; 16 = Decorticated grain: Width ; 17 = L/B Ratio of decorticated grain ; 18 =
Biological Yield(gm) ; 19 = Grain Yield(gm) ; = 20 Harvest Index ; 21 = Hulling Percent ; 22 = Milling Percent ; 23 = Head Rice Recovery ; 24 = Length of milled grain ; 25 = Width of
milled grain ; 26 = L/B ratio of milled grain ; 27 = Length of cooked kernel ; 28 = Width of cooked kernel ; 29 = L/B ratio of cooked kernel ; 30 = Elongation Ratio ; 31 = Elongation
index ; 32 = Endosperm content of Amylose ; 33 = Gel Consistency.
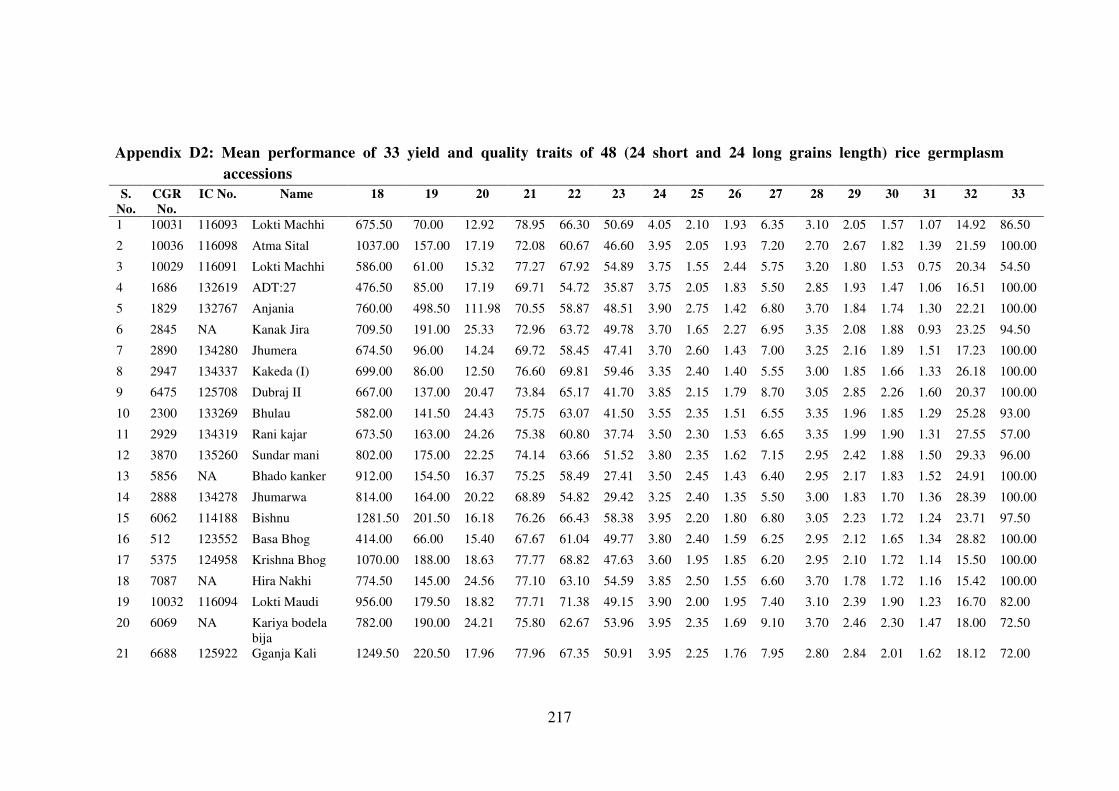
217
Appendix D2: Mean performance of 33 yield and quality traits of 48 (24 short and 24 long grains length) rice germplasm
accessions
S.
No.
CGR
No.
IC No. Name 18 19 20 21 22 23 24 25 26 27 28 29 30 31 32 33
1 10031 116093 Lokti Machhi 675.50 70.00 12.92 78.95 66.30 50.69 4.05 2.10 1.93 6.35 3.10 2.05 1.57 1.07 14.92 86.50
2 10036 116098 Atma Sital 1037.00 157.00 17.19 72.08 60.67 46.60 3.95 2.05 1.93 7.20 2.70 2.67 1.82 1.39 21.59 100.00
3 10029 116091 Lokti Machhi 586.00 61.00 15.32 77.27 67.92 54.89 3.75 1.55 2.44 5.75 3.20 1.80 1.53 0.75 20.34 54.50
4 1686 132619 ADT:27 476.50 85.00 17.19 69.71 54.72 35.87 3.75 2.05 1.83 5.50 2.85 1.93 1.47 1.06 16.51 100.00
5 1829 132767 Anjania 760.00 498.50 111.98 70.55 58.87 48.51 3.90 2.75 1.42 6.80 3.70 1.84 1.74 1.30 22.21 100.00
6 2845 NA Kanak Jira 709.50 191.00 25.33 72.96 63.72 49.78 3.70 1.65 2.27 6.95 3.35 2.08 1.88 0.93 23.25 94.50
7 2890 134280 Jhumera 674.50 96.00 14.24 69.72 58.45 47.41 3.70 2.60 1.43 7.00 3.25 2.16 1.89 1.51 17.23 100.00
8 2947 134337 Kakeda (I) 699.00 86.00 12.50 76.60 69.81 59.46 3.35 2.40 1.40 5.55 3.00 1.85 1.66 1.33 26.18 100.00
9 6475 125708 Dubraj II 667.00 137.00 20.47 73.84 65.17 41.70 3.85 2.15 1.79 8.70 3.05 2.85 2.26 1.60 20.37 100.00
10 2300 133269 Bhulau 582.00 141.50 24.43 75.75 63.07 41.50 3.55 2.35 1.51 6.55 3.35 1.96 1.85 1.29 25.28 93.00
11 2929 134319 Rani kajar 673.50 163.00 24.26 75.38 60.80 37.74 3.50 2.30 1.53 6.65 3.35 1.99 1.90 1.31 27.55 57.00
12 3870 135260 Sundar mani 802.00 175.00 22.25 74.14 63.66 51.52 3.80 2.35 1.62 7.15 2.95 2.42 1.88 1.50 29.33 96.00
13 5856 NA Bhado kanker 912.00 154.50 16.37 75.25 58.49 27.41 3.50 2.45 1.43 6.40 2.95 2.17 1.83 1.52 24.91 100.00
14 2888 134278 Jhumarwa 814.00 164.00 20.22 68.89 54.82 29.42 3.25 2.40 1.35 5.50 3.00 1.83 1.70 1.36 28.39 100.00
15 6062 114188 Bishnu 1281.50 201.50 16.18 76.26 66.43 58.38 3.95 2.20 1.80 6.80 3.05 2.23 1.72 1.24 23.71 97.50
16 512 123552 Basa Bhog 414.00 66.00 15.40 67.67 61.04 49.77 3.80 2.40 1.59 6.25 2.95 2.12 1.65 1.34 28.82 100.00
17 5375 124958 Krishna Bhog 1070.00 188.00 18.63 77.77 68.82 47.63 3.60 1.95 1.85 6.20 2.95 2.10 1.72 1.14 15.50 100.00
18 7087 NA Hira Nakhi 774.50 145.00 24.56 77.10 63.10 54.59 3.85 2.50 1.55 6.60 3.70 1.78 1.72 1.16 15.42 100.00
19 10032 116094 Lokti Maudi 956.00 179.50 18.82 77.71 71.38 49.15 3.90 2.00 1.95 7.40 3.10 2.39 1.90 1.23 16.70 82.00
20 6069 NA Kariya bodela
bija
782.00 190.00 24.21 75.80 62.67 53.96 3.95 2.35 1.69 9.10 3.70 2.46 2.30 1.47 18.00 72.50
21 6688 125922 Gganja Kali 1249.50 220.50 17.96 77.96 67.35 50.91 3.95 2.25 1.76 7.95 2.80 2.84 2.01 1.62 18.12 72.00
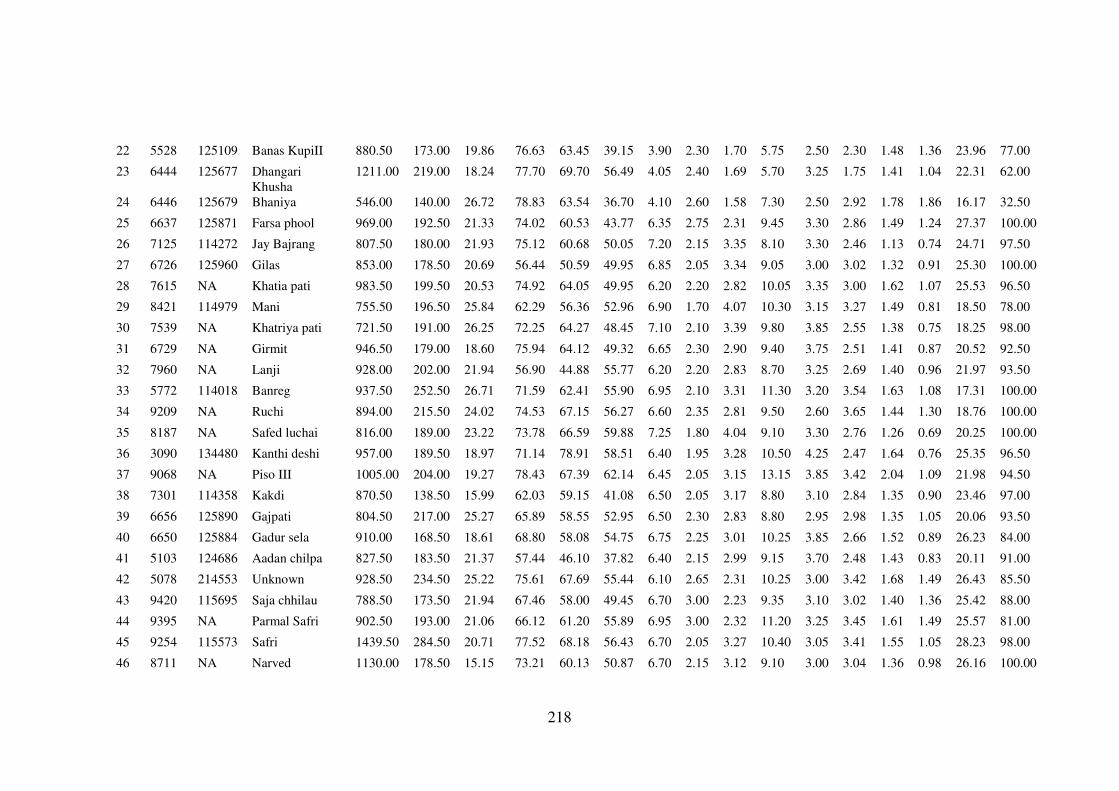
218
22 5528 125109 Banas KupiII 880.50 173.00 19.86 76.63 63.45 39.15 3.90 2.30 1.70 5.75 2.50 2.30 1.48 1.36 23.96 77.00
23 6444 125677 Dhangari
Khusha
1211.00 219.00 18.24 77.70 69.70 56.49 4.05 2.40 1.69 5.70 3.25 1.75 1.41 1.04 22.31 62.00
24 6446 125679 Bhaniya 546.00 140.00 26.72 78.83 63.54 36.70 4.10 2.60 1.58 7.30 2.50 2.92 1.78 1.86 16.17 32.50
25 6637 125871 Farsa phool 969.00 192.50 21.33 74.02 60.53 43.77 6.35 2.75 2.31 9.45 3.30 2.86 1.49 1.24 27.37 100.00
26 7125 114272 Jay Bajrang 807.50 180.00 21.93 75.12 60.68 50.05 7.20 2.15 3.35 8.10 3.30 2.46 1.13 0.74 24.71 97.50
27 6726 125960 Gilas 853.00 178.50 20.69 56.44 50.59 49.95 6.85 2.05 3.34 9.05 3.00 3.02 1.32 0.91 25.30 100.00
28 7615 NA Khatia pati 983.50 199.50 20.53 74.92 64.05 49.95 6.20 2.20 2.82 10.05 3.35 3.00 1.62 1.07 25.53 96.50
29 8421 114979 Mani 755.50 196.50 25.84 62.29 56.36 52.96 6.90 1.70 4.07 10.30 3.15 3.27 1.49 0.81 18.50 78.00
30 7539 NA Khatriya pati 721.50 191.00 26.25 72.25 64.27 48.45 7.10 2.10 3.39 9.80 3.85 2.55 1.38 0.75 18.25 98.00
31 6729 NA Girmit 946.50 179.00 18.60 75.94 64.12 49.32 6.65 2.30 2.90 9.40 3.75 2.51 1.41 0.87 20.52 92.50
32 7960 NA Lanji 928.00 202.00 21.94 56.90 44.88 55.77 6.20 2.20 2.83 8.70 3.25 2.69 1.40 0.96 21.97 93.50
33 5772 114018 Banreg 937.50 252.50 26.71 71.59 62.41 55.90 6.95 2.10 3.31 11.30 3.20 3.54 1.63 1.08 17.31 100.00
34 9209 NA Ruchi 894.00 215.50 24.02 74.53 67.15 56.27 6.60 2.35 2.81 9.50 2.60 3.65 1.44 1.30 18.76 100.00
35 8187 NA Safed luchai 816.00 189.00 23.22 73.78 66.59 59.88 7.25 1.80 4.04 9.10 3.30 2.76 1.26 0.69 20.25 100.00
36 3090 134480 Kanthi deshi 957.00 189.50 18.97 71.14 78.91 58.51 6.40 1.95 3.28 10.50 4.25 2.47 1.64 0.76 25.35 96.50
37 9068 NA Piso III 1005.00 204.00 19.27 78.43 67.39 62.14 6.45 2.05 3.15 13.15 3.85 3.42 2.04 1.09 21.98 94.50
38 7301 114358 Kakdi 870.50 138.50 15.99 62.03 59.15 41.08 6.50 2.05 3.17 8.80 3.10 2.84 1.35 0.90 23.46 97.00
39 6656 125890 Gajpati 804.50 217.00 25.27 65.89 58.55 52.95 6.50 2.30 2.83 8.80 2.95 2.98 1.35 1.05 20.06 93.50
40 6650 125884 Gadur sela 910.00 168.50 18.61 68.80 58.08 54.75 6.75 2.25 3.01 10.25 3.85 2.66 1.52 0.89 26.23 84.00
41 5103 124686 Aadan chilpa 827.50 183.50 21.37 57.44 46.10 37.82 6.40 2.15 2.99 9.15 3.70 2.48 1.43 0.83 20.11 91.00
42 5078 214553 Unknown 928.50 234.50 25.22 75.61 67.69 55.44 6.10 2.65 2.31 10.25 3.00 3.42 1.68 1.49 26.43 85.50
43 9420 115695 Saja chhilau 788.50 173.50 21.94 67.46 58.00 49.45 6.70 3.00 2.23 9.35 3.10 3.02 1.40 1.36 25.42 88.00
44 9395 NA Parmal Safri 902.50 193.00 21.06 66.12 61.20 55.89 6.95 3.00 2.32 11.20 3.25 3.45 1.61 1.49 25.57 81.00
45 9254 115573 Safri 1439.50 284.50 20.71 77.52 68.18 56.43 6.70 2.05 3.27 10.40 3.05 3.41 1.55 1.05 28.23 98.00
46 8711 NA Narved 1130.00 178.50 15.15 73.21 60.13 50.87 6.70 2.15 3.12 9.10 3.00 3.04 1.36 0.98 26.16 100.00
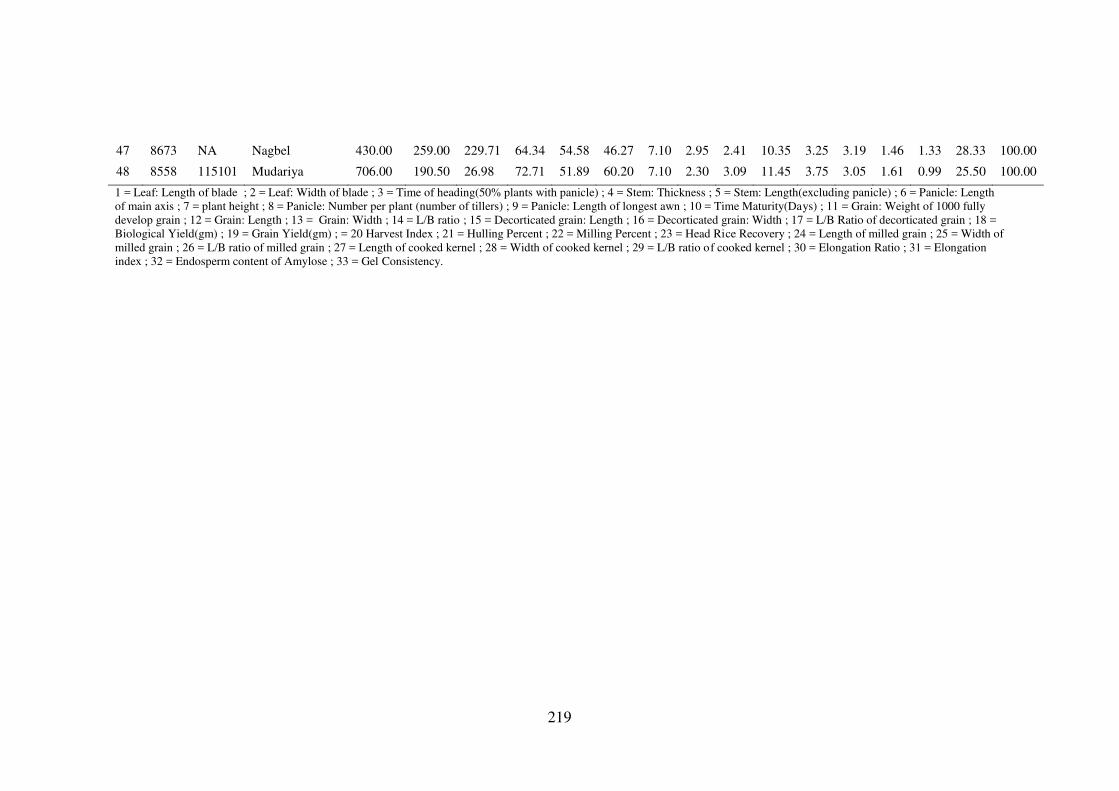
219
47 8673 NA Nagbel 430.00 259.00 229.71 64.34 54.58 46.27 7.10 2.95 2.41 10.35 3.25 3.19 1.46 1.33 28.33 100.00
48 8558 115101 Mudariya 706.00 190.50 26.98 72.71 51.89 60.20 7.10 2.30 3.09 11.45 3.75 3.05 1.61 0.99 25.50 100.00
1 = Leaf: Length of blade ; 2 = Leaf: Width of blade ; 3 = Time of heading(50% plants with panicle) ; 4 = Stem: Thickness ; 5 = Stem: Length(excluding panicle) ; 6 = Panicle: Length
of main axis ; 7 = plant height ; 8 = Panicle: Number per plant (number of tillers) ; 9 = Panicle: Length of longest awn ; 10 = Time Maturity(Days) ; 11 = Grain: Weight of 1000 fully
develop grain ; 12 = Grain: Length ; 13 = Grain: Width ; 14 = L/B ratio ; 15 = Decorticated grain: Length ; 16 = Decorticated grain: Width ; 17 = L/B Ratio of decorticated grain ; 18 =
Biological Yield(gm) ; 19 = Grain Yield(gm) ; = 20 Harvest Index ; 21 = Hulling Percent ; 22 = Milling Percent ; 23 = Head Rice Recovery ; 24 = Length of milled grain ; 25 = Width of
milled grain ; 26 = L/B ratio of milled grain ; 27 = Length of cooked kernel ; 28 = Width of cooked kernel ; 29 = L/B ratio of cooked kernel ; 30 = Elongation Ratio ; 31 = Elongation
index ; 32 = Endosperm content of Amylose ; 33 = Gel Consistency.
220
Appendix E: Microsatellite (SSR) markers used for molecular characterization in 24 short and 24 long grain accessions of rice.
S.
No.
Marker Amplicon
Size
Forward Primer Reverse Primer Chromo-
some No. #
PIC
Value
1 RM 1 67-119 GCGAAAACACAATGCAAAAA GCGTTGGTTGGACCTGAC 1 0.87
2 RM 5 94-138 TGCAACTTCTAGCTGCTCGA GCATCCGATCTTGATGGG 1 0.74
3 RM11 118-151 TCTCCTCTTCCCCCGATC ATAGCGGGCGAGGCTTAG 7 0.49
4 RM 19 192-250 CAAAAACAGAGCAGATGAC CTCAAGATGGACGCCAAGA 12 0.85
5 RM 25 121-159 GGAAAGAATGATCTTTTCATGG CTACCATCAAAACCAATGTTC 8 0.79
6 RM 30 100-140 GGTTAGGCATCGTCACGG TCACCTCACACGACACG 6 0
7 RM 104 222-238 GGAAGAGGAGAGAAAGATGTGTGTCG TCAACAGACACACCGCCACCGC 1 0
8 RM 105 100-141 GTCGTCGACCCATCGGAGCCAC TGGTCGAGGTGGGGATCGGGTC 9 0.59
9 RM 125 105-147 ATCAGCAGCCATGGCAGCGACC AGGGGATCATGTGCCGAAGGCC 7 0.12
10 RM 130 73-81 TGTTGCTTGCCCTCACGCGAAG GGTCGCGTGCTTGGTTTGGTTC 3 0.22
11 RM 132 70-85 ATCTTGTTGTTTCGGCGGCGGC CATGGCGAGAATGCCCACGTCC 3 0.5
12 RM 134 92-94 ACAAGGCCGCGAGAGGATTCCG GCTCTCCGGTGGCTCCGATTGG 7 0.04
13 RM 135 100-150 CTCTGTCTCCTCCCCCGCGTCG TCAGCTTCTGGCCGGCCTCCTC 3 0.81
14 RM 148 190-210 ATACAACATTAGGGATGAGGCTGG TCCTTAAAGGTGGTGCAATGCGAG 3 0.65
15 RM 152 133-157 GAAACCACCACACCTCACCG CCGTAGACCTTCTTGAAGTAG 8 0.64
16 RM 154 148-230 ACCCTCTCCGCCTCGCCTCCTC CTCCTCCTCCTGCGACCGCTCC 2 0.55
17 RM 161 154-187 TGCAGATGAGAAGCGGCGCCTC TGTGTCATCAGACGGCGCTCCG 5 0.28
18 RM 168 96-116 TGCTGCTTGCCTGCTTCCTTT GAAACGAATCAATCCACGGC 3 0.64
19 RM 171 307-347 AACGCGAGGACACGTACTTAC ACGAGATACGTACGCCTTTG 10 0.77
221
20 RM 172 159-165 TGCAGCTGCGCCACAGCCATAG CAACCACGACACCGCCGTGTTG 7 0.49
21 RM 175 80-90 CTTCGGCGCCGTCATCAAGGTG CGTTGAGCAGCGCGACGTTGAC 3 0.15
22 RM 186 115-132 TCCTCCATCTCCTCCGCTCCCG GGGCGTGGTGGCCTTCTTCGTC 3 0.51
23 RM 201 155-350 CTCGTTTATTACCTACAGTACC CTACCTCCTTTCTAGACCGATA 9 0.48
24 RM 215 126-161 CAAAATGGAGCAGCAAGAGC TGAGCACCTCCTTCTCTGTAG 9 0.38
25 RM 218 100-120 TGGTCAAACCAAGGTCCTTC GACATACATTCTACCCCCGG 3 0.64
26 RM 231 157-182 CCAGATTATTTCCTGAGGTC CACTTGCATAGTTCTGCATTG 3 0.55
27 RM 234 133-163 ACAGTATCCAAGGCCCTGG CACGTGAGACAAAGACGGAG 7 0.26
28 RM 242 200-290 AAACACATGCTGCTGACACTTGC TTACTAGATTTACCACGGCCAACG 9 0.32
29 RM 248 75-100 TCCTTGTGAAATCTGGTCCC GTAGCCTAGCATGGTGCATG 7 0.53
30 RM 287 82-118 TTCCCTGTTAAGAGAGAAATC GTGTATTTGGTGAAAGCAAC 11 0.46
31 RM 316 194-216 CTAGTTGGGCATACGATGGC ACGCTTATATGTTACGTCAAC 9 0.55
32 RM 338 178-184 CACAGGAGCAGGAGAAGAGC GGCAAACCGATCACTCAGTC 3 0.35
33 RM 408 112-128 CAACGAGCTAACTTCCGTCC ACTGCTACTTGGGTAGCTGACC 8 0.50
34 RM 422 385-500 TTCAACCTGCATCCGCTC CCATCCAAATCAGCAACAGC 3 0.76
35 RM 431 233-261 TCCTGCGAACTGAAGAGTTG AGAGCAAAACCCTGGTTCAC 1 0.25
36 RM 432 150-187 TTCTGTCTCACGCTGGATTG AGCTGCGTACGTGATGAATG 7 0.76
37 RM 433 216-248 TGCGCTGAACTAAACACAGC AGACAAACCTGGCCATTCAC 8 0.49
38 RM 436 83-134 ATTCCTGCAGTAAAGCACGG CTTCGTGTACCTCCCCAAAC 7 0.66
39 RM 447 95-146 CCCTTGTGCTGTCTCCTCTC ACGGGCTTCTTCTCCTTCTC 8 0.72
40 RM 455 127-144 AACAACCCACCACCTGTCTC AGAAGGAAAAGGGCTCGATC 7 0.79
41 RM 468 250-350 CCCTTCCTTGTTGTGGCTAC TGATTTCTGAGAGCCAACCC 3 0.72
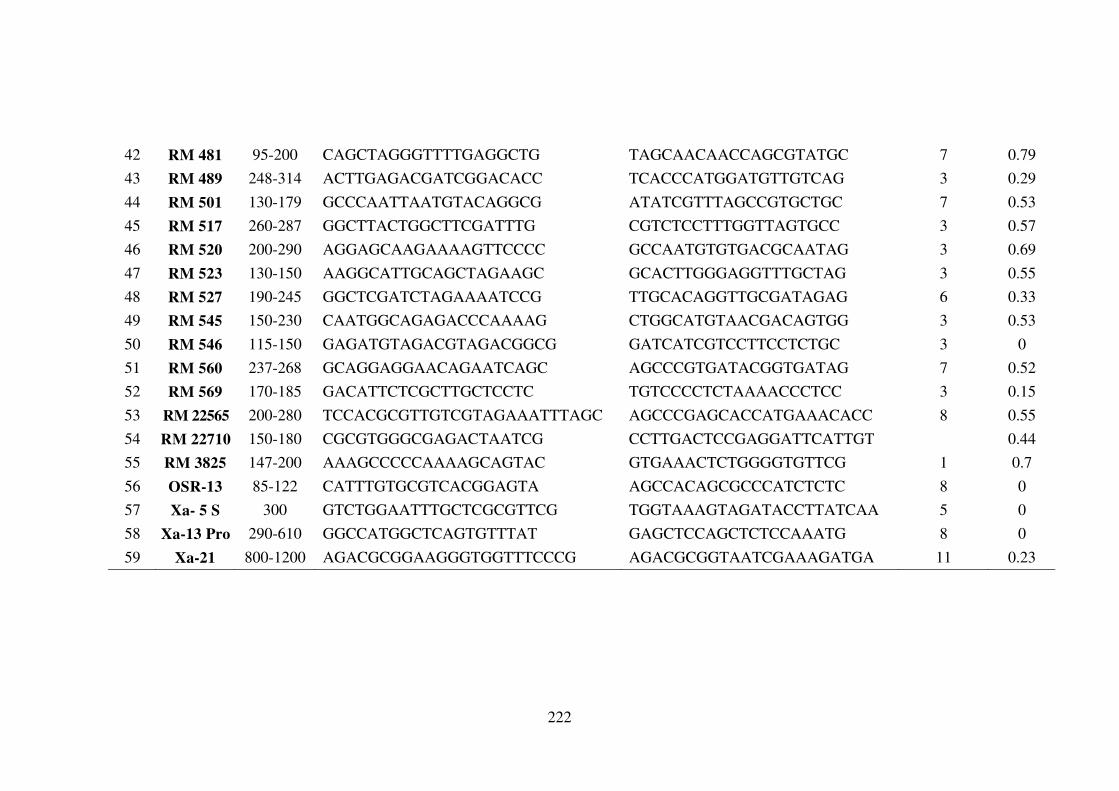
222
42 RM 481 95-200 CAGCTAGGGTTTTGAGGCTG TAGCAACAACCAGCGTATGC 7 0.79
43 RM 489 248-314 ACTTGAGACGATCGGACACC TCACCCATGGATGTTGTCAG 3 0.29
44 RM 501 130-179 GCCCAATTAATGTACAGGCG ATATCGTTTAGCCGTGCTGC 7 0.53
45 RM 517 260-287 GGCTTACTGGCTTCGATTTG CGTCTCCTTTGGTTAGTGCC 3 0.57
46 RM 520 200-290 AGGAGCAAGAAAAGTTCCCC GCCAATGTGTGACGCAATAG 3 0.69
47 RM 523 130-150 AAGGCATTGCAGCTAGAAGC GCACTTGGGAGGTTTGCTAG 3 0.55
48 RM 527 190-245 GGCTCGATCTAGAAAATCCG TTGCACAGGTTGCGATAGAG 6 0.33
49 RM 545 150-230 CAATGGCAGAGACCCAAAAG CTGGCATGTAACGACAGTGG 3 0.53
50 RM 546 115-150 GAGATGTAGACGTAGACGGCG GATCATCGTCCTTCCTCTGC 3 0
51 RM 560 237-268 GCAGGAGGAACAGAATCAGC AGCCCGTGATACGGTGATAG 7 0.52
52 RM 569 170-185 GACATTCTCGCTTGCTCCTC TGTCCCCTCTAAAACCCTCC 3 0.15
53 RM 22565 200-280 TCCACGCGTTGTCGTAGAAATTTAGC AGCCCGAGCACCATGAAACACC 8 0.55
54 RM 22710 150-180 CGCGTGGGCGAGACTAATCG CCTTGACTCCGAGGATTCATTGT 0.44
55 RM 3825 147-200 AAAGCCCCCAAAAGCAGTAC GTGAAACTCTGGGGTGTTCG 1 0.7
56 OSR-13 85-122 CATTTGTGCGTCACGGAGTA AGCCACAGCGCCCATCTCTC 8 0
57 Xa- 5 S 300 GTCTGGAATTTGCTCGCGTTCG TGGTAAAGTAGATACCTTATCAA 5 0
58 Xa-13 Pro 290-610 GGCCATGGCTCAGTGTTTAT GAGCTCCAGCTCTCCAAATG 8 0
59 Xa-21 800-1200 AGACGCGGAAGGGTGGTTTCCCG AGACGCGGTAATCGAAAGATGA 11 0.23
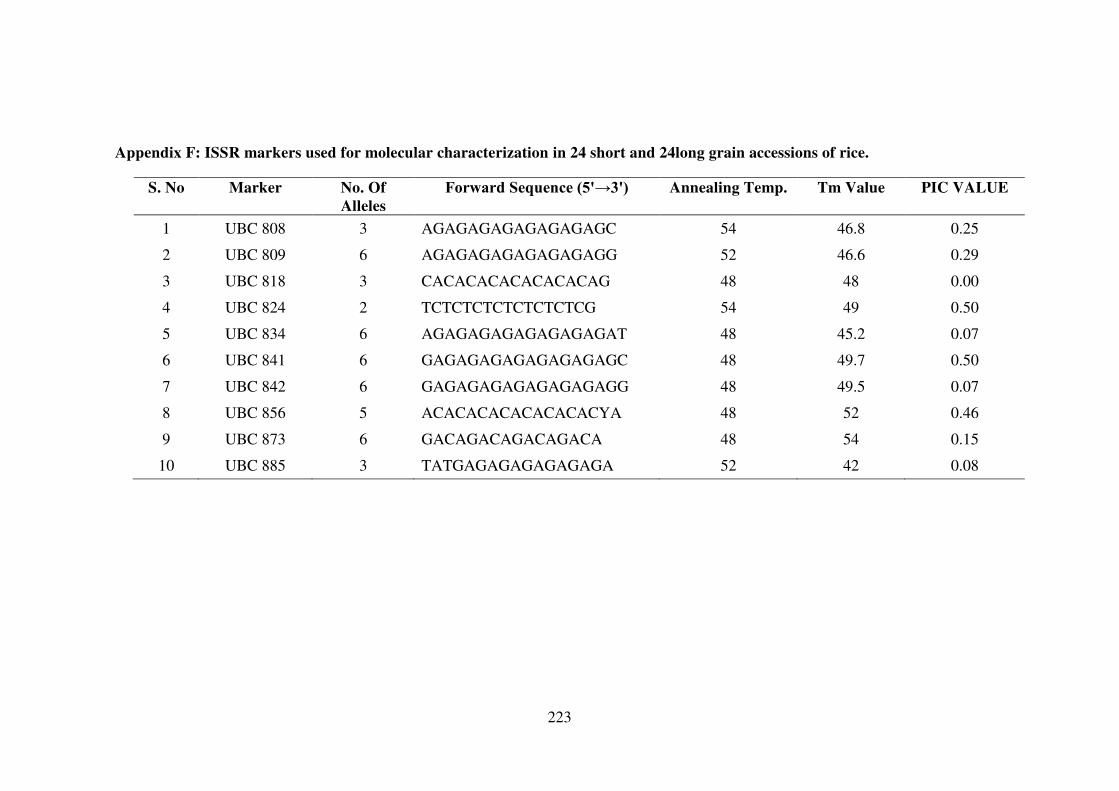
223
Appendix F: ISSR markers used for molecular characterization in 24 short and 24long grain accessions of rice.
S. No Marker No. Of
Alleles
Forward Sequence (5'→3') Annealing Temp. Tm Value PIC VALUE
1 UBC 808 3 AGAGAGAGAGAGAGAGC 54 46.8 0.25
2 UBC 809 6 AGAGAGAGAGAGAGAGG 52 46.6 0.29
3 UBC 818 3 CACACACACACACACAG 48 48 0.00
4 UBC 824 2 TCTCTCTCTCTCTCTCG 54 49 0.50
5 UBC 834 6 AGAGAGAGAGAGAGAGAT 48 45.2 0.07
6 UBC 841 6 GAGAGAGAGAGAGAGAGC 48 49.7 0.50
7 UBC 842 6 GAGAGAGAGAGAGAGAGG 48 49.5 0.07
8 UBC 856 5 ACACACACACACACACYA 48 52 0.46
9 UBC 873 6 GACAGACAGACAGACA 48 54 0.15
10 UBC 885 3 TATGAGAGAGAGAGAGA 52 42 0.08