Embed Size (px)
Citation preview
Technology – Customer Service 600, avenue de la Montagne, Shawinigan (Québec) Canada G9N 7N5
Technical Report
“LED street lighting in the municipality of Saint-Gédéon-de-Beauce within the framework of advanced lighting technologies”
LTE-RT-2011-0076 Public distribution
May 2011
André Laperrière
“LED street lighting in the municipality of Saint-Gédéon-de-Beauce within the framework of advanced lighting technologies”
LTE-RT-2011-0076 Public distribution Copy no ______
Author: André Laperrière
Collaborators: Chrisnel Blot, Spectralux Éric Lachance, Saint-Gédéon-de-Beauce Pierrette Leblanc, Natural Resources Canada Patrick Martineau, Hydro-Québec
Project manager: André Laperrière
Completed within the framework of the project: Advanced lighting technologies J-4024
Applicant: Plateforme Clientèle
Project manager of the business unit: Patrick Martineau
Approved by:
Jocelyn Millette
Manager – Technology – Customer Service
Hydro-Québec Research Institute
“LED street lighting in the municipality of Saint-Gédéon-de-Beauce within the framework of advanced lighting technologies” iii LTE-RT-2011-0076 Public distribution
LIST OF INDIVIDUALS OR GROUPS WITH ACCESS TO THE DOCUMENT
COMPLETE REPORT: COPY
N°
Jocelyn Millette – Manager – Technology – Customer Service 1
My Dung Handfield - Chef – Technology – Customer Service 2
Michel Dostie – Leader Expertise – Energy Use 3
Éric Dumont – Manager, Building Energy 4
André Laperrière - Researcher – LTE 5
Éric Lachance – Mayor, Saint-Gédéon-de-Beauce 6+PDF
Guy Courcelle – LDI Technology group 7
Pierrette Leblanc – Natural Resources Canada 8+PDF
Roger Bellemare – S.C.U.E. – Hydro-Québec 9
Patrick Martineau – S.C.U.E. - Hydro-Québec 10
Omer Lemay – S.C.U.E. – Hydro-Québec 11
Chrisnel Blot – Spectralux 12
Nathalie Blanchard, Optical Design, INO 13
Lighting Committee Hydro-Québec (site Livelink) PDF
LTE library (Original copy)

“LED street lighting in the municipality of Saint-Gédéon-de-Beauce within the framework of advanced lighting technologies” v LTE-RT-2011-0076 Public distribution
Summary
Within the framework of lighting technologies, LED technology is beginning to offer energy savings
opportunities for certain markets. However, like any other new technology, it is important to fully
understand the way it operates, its physical principles, its limits, etc. Regarding road lighting,
several governing bodies, such as the DOE (Department of Energy) in the US have started to
promote the technology. However, some studies have tended to show that LED technology must be
used with caution and that energy savings are not as great as has been suggested in all the cases.
A pilot project was implemented in the municipality of Saint-Gédéon-de-Beauce, and laboratory
tests were concurrently executed by the company Spectralux. During these tests, photometric,
colorimetric and electric aspects were studied, including mesopic correction and night vision,
simultaneously for both LED technology and conventional High Pressure Sodium (HPS) lighting.
This is a new concept according to which the vision is different at night (scotopic or S) at low-level
light than during the day (photopic or P) and consequently, it is possible to adapt the spectral
separation in order to optimize energy savings. In the traditional method, all the calculations are
done on the basis of daylight correction, i.e. photopic correction, when in reality we should be using
mesopic correction, i.e. a correction that lies between the photopic and scotopic ones.
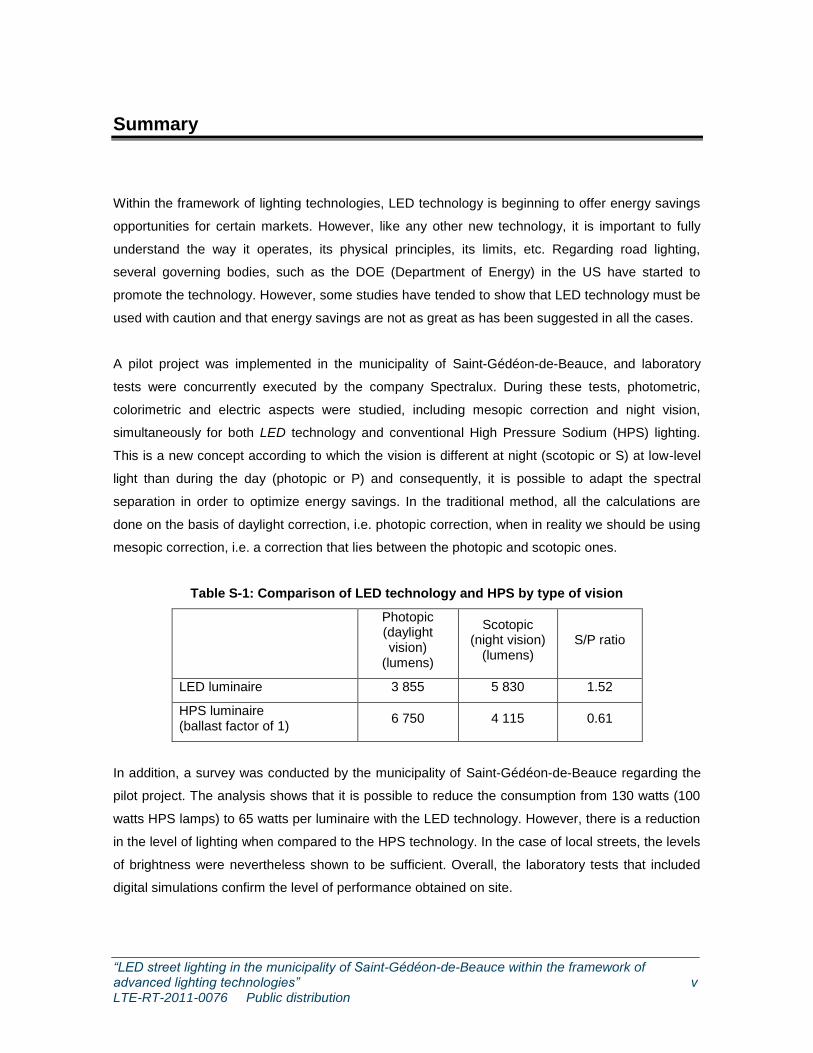
Table S-1: Comparison of LED technology and HPS by type of vision
Photopic (daylight vision)
(lumens)
Scotopic (night vision)
(lumens) S/P ratio
LED luminaire 3 855 5 830 1.52
HPS luminaire (ballast factor of 1)
6 750 4 115 0.61
In addition, a survey was conducted by the municipality of Saint-Gédéon-de-Beauce regarding the
pilot project. The analysis shows that it is possible to reduce the consumption from 130 watts (100
watts HPS lamps) to 65 watts per luminaire with the LED technology. However, there is a reduction
in the level of lighting when compared to the HPS technology. In the case of local streets, the levels
of brightness were nevertheless shown to be sufficient. Overall, the laboratory tests that included
digital simulations confirm the level of performance obtained on site.
“LED street lighting in the municipality of Saint-Gédéon-de-Beauce within the framework of advanced lighting technologies” vi LTE-RT-2011-0076 Public distribution
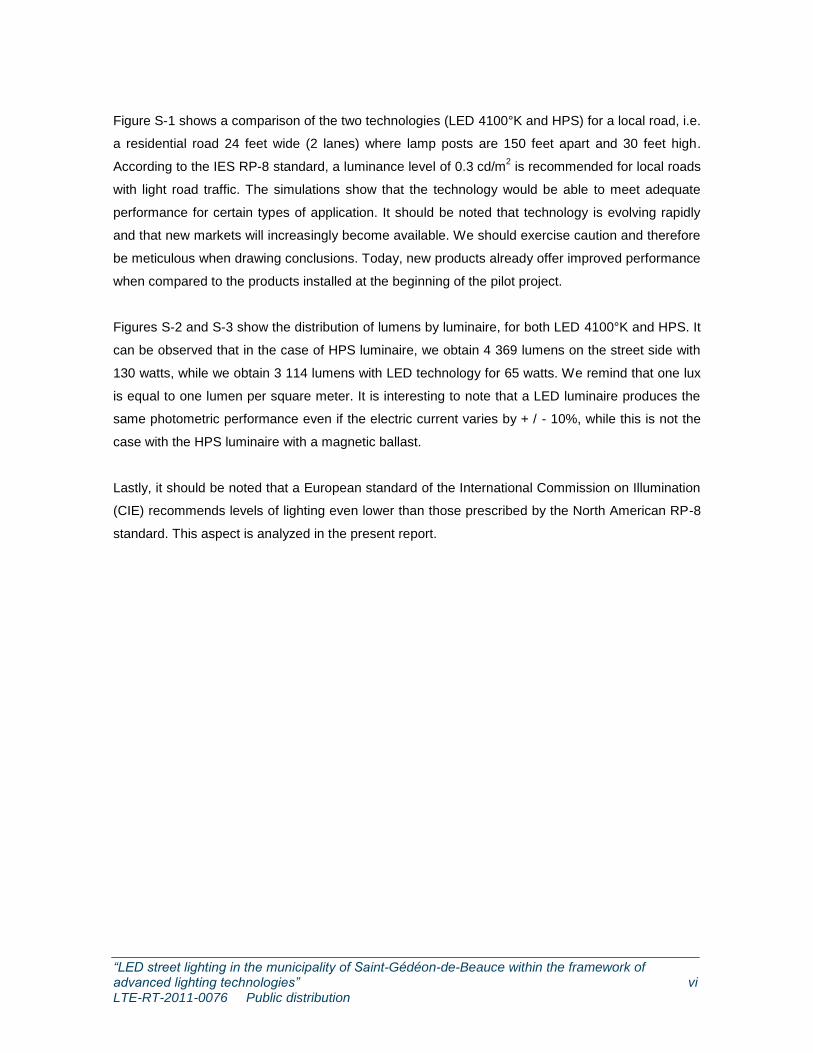
Figure S-1 shows a comparison of the two technologies (LED 4100°K and HPS) for a local road, i.e.
a residential road 24 feet wide (2 lanes) where lamp posts are 150 feet apart and 30 feet high.
According to the IES RP-8 standard, a luminance level of 0.3 cd/m2 is recommended for local roads
with light road traffic. The simulations show that the technology would be able to meet adequate
performance for certain types of application. It should be noted that technology is evolving rapidly
and that new markets will increasingly become available. We should exercise caution and therefore
be meticulous when drawing conclusions. Today, new products already offer improved performance
when compared to the products installed at the beginning of the pilot project.
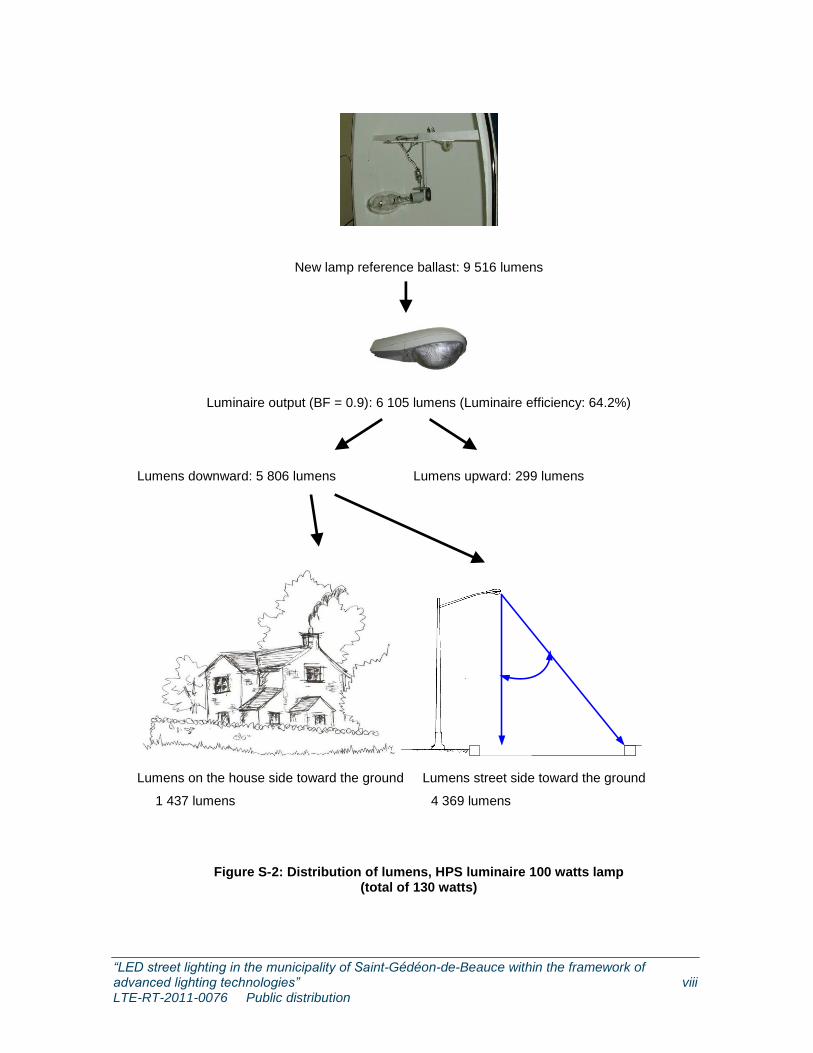
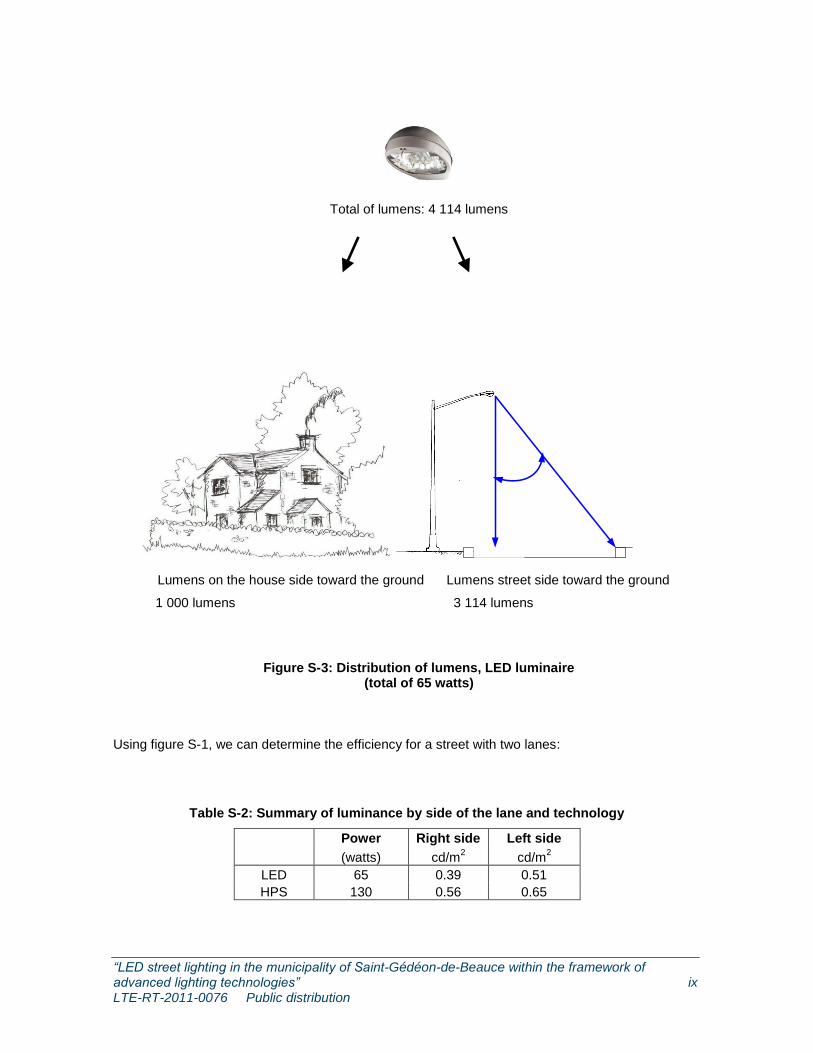
Figures S-2 and S-3 show the distribution of lumens by luminaire, for both LED 4100°K and HPS. It
can be observed that in the case of HPS luminaire, we obtain 4 369 lumens on the street side with
130 watts, while we obtain 3 114 lumens with LED technology for 65 watts. We remind that one lux
is equal to one lumen per square meter. It is interesting to note that a LED luminaire produces the
same photometric performance even if the electric current varies by + / - 10%, while this is not the
case with the HPS luminaire with a magnetic ballast.
Lastly, it should be noted that a European standard of the International Commission on Illumination
(CIE) recommends levels of lighting even lower than those prescribed by the North American RP-8
standard. This aspect is analyzed in the present report.
“LED street lighting in the municipality of Saint-Gédéon-de-Beauce within the framework of advanced lighting technologies” vii LTE-RT-2011-0076 Public distribution
0.65 cd/m2 left side
0.56 cd/m2 right side 0.45 cd/m
2 left side 0.31 cd/m
2 right side
0.51 cd/m2 left side 0.39 cd/m
2 right side
Figure S-1: Calculated initial levels of luminance on local street with 2 lanes (24 feet), with street lamps 150 feet apart and 30 feet high (4100°K)
Mesopic correction
y = - 9.5842 x3 + 13.367 x
2 – 6.9677 x + 2.4287
MULTIPLIER = 1.27
Mesopic correction
y = - 9.5842 x3 + 13.367 x
2 – 6.9677 x + 2.4287
x represents photopic luminance
MULTIPLIER= 1.13
HPS
LED
“LED street lighting in the municipality of Saint-Gédéon-de-Beauce within the framework of advanced lighting technologies” viii LTE-RT-2011-0076 Public distribution
New lamp reference ballast: 9 516 lumens
Luminaire output (BF = 0.9): 6 105 lumens (Luminaire efficiency: 64.2%)
Lumens downward: 5 806 lumens Lumens upward: 299 lumens
Lumens on the house side toward the ground Lumens street side toward the ground
1 437 lumens 4 369 lumens
Figure S-2: Distribution of lumens, HPS luminaire 100 watts lamp (total of 130 watts)
“LED street lighting in the municipality of Saint-Gédéon-de-Beauce within the framework of advanced lighting technologies” ix LTE-RT-2011-0076 Public distribution
Total of lumens: 4 114 lumens
Lumens on the house side toward the ground Lumens street side toward the ground
1 000 lumens 3 114 lumens
Figure S-3: Distribution of lumens, LED luminaire
(total of 65 watts)
Using figure S-1, we can determine the efficiency for a street with two lanes:
Table S-2: Summary of luminance by side of the lane and technology
Power Right side Left side
(watts) cd/m2 cd/m
2
LED 65 0.39 0.51
HPS 130 0.56 0.65
“LED street lighting in the municipality of Saint-Gédéon-de-Beauce within the framework of advanced lighting technologies” x LTE-RT-2011-0076 Public distribution
Efficiency in terms of cd/m2
per Watt can therefore be calculated by dividing average luminance by
electricity consumption.
Table S-3: Efficiency by technology in cd/m2 per Watt of electricity
Power Efficiency right side Efficiency left side
(watts) cd/m2 per Watt cd/m
2 per Watt
LED 65 0.0060 0.0078
HPS 130 0.0043 0.0050
Following this approach, we can therefore obtain the efficiency ratio, changing from HPS to LED.
Table S-4: Increase in efficiency when changing from HPS to LED
Right side ratio Left side ratio
LED/HPS RATIO 1.39 1.57
If the average of the two lanes is calculated, the efficiency increases by 1.5, or close to 50%.
Annual energy savings, in monetary terms, come to $23.69 per street luminaire, for a reduction in
power of 65 watts, from 130 watts to 65 watts.
Lastly, it is hoped that the present report will allow the readers to make an informed choice
concerning new advanced lighting technologies for road lighting.
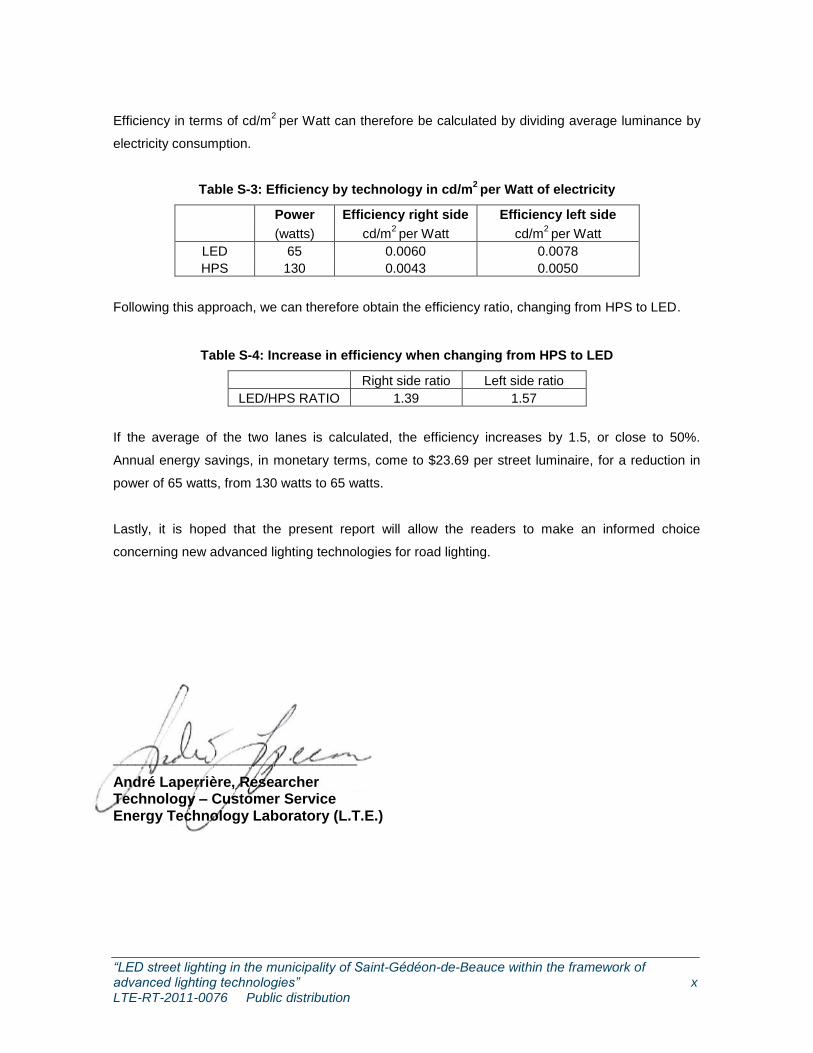
_________________________________
André Laperrière, Researcher Technology – Customer Service Energy Technology Laboratory (L.T.E.)
“LED street lighting in the municipality of Saint-Gédéon-de-Beauce within the framework of advanced lighting technologies” xi LTE-RT-2011-0076 Public distribution
Acknowledgments
Principal author, André Laperrière, would like to thank all the individuals who contributed to the
preparation of this report, including the municipality of Saint-Gédéon-de-Beauce. Lastly, I would like
to acknowledge the Natural Resources Canada’s financial contribution to this project.

“LED street lighting in the municipality of Saint-Gédéon-de-Beauce within the framework of advanced lighting technologies” xiii LTE-RT-2011-0076 Public distribution
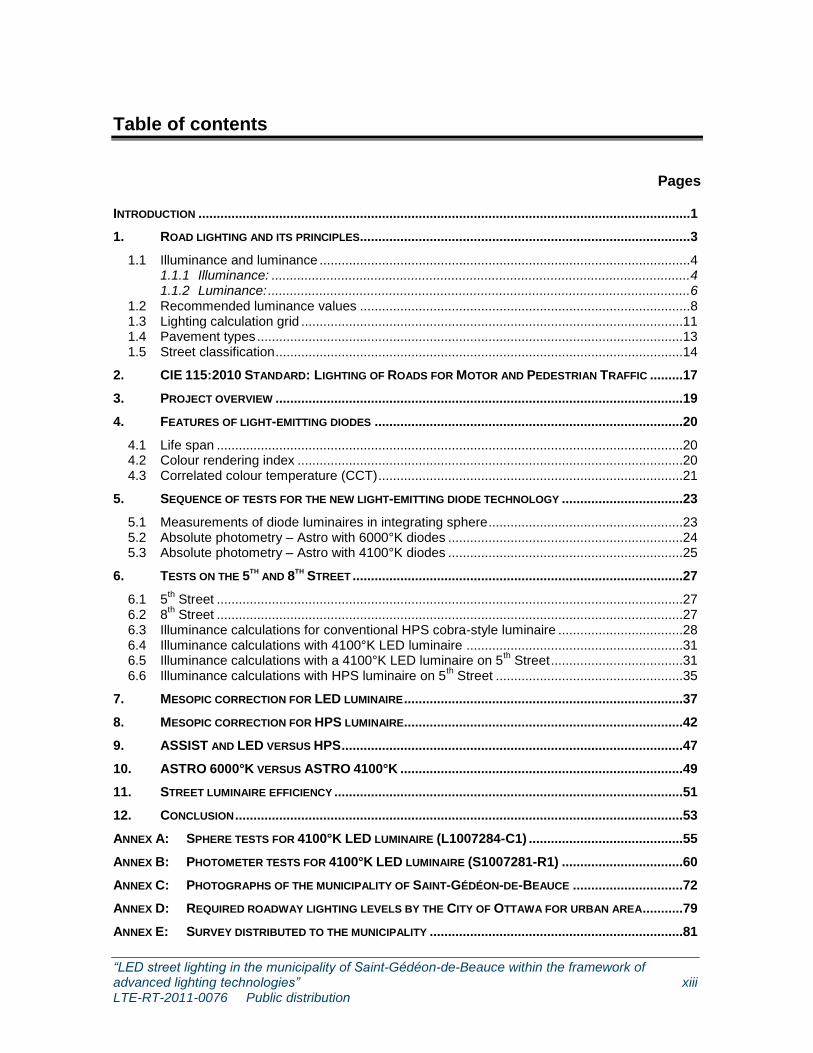
Table of contents
Pages
INTRODUCTION ...................................................................................................................................... 1
1. ROAD LIGHTING AND ITS PRINCIPLES .......................................................................................... 3
1.1 Illuminance and luminance ..................................................................................................... 4 1.1.1 Illuminance: .................................................................................................................. 4 1.1.2 Luminance: ................................................................................................................... 6
1.2 Recommended luminance values .......................................................................................... 8 1.3 Lighting calculation grid ........................................................................................................11 1.4 Pavement types ....................................................................................................................13 1.5 Street classification ...............................................................................................................14
2. CIE 115:2010 STANDARD: LIGHTING OF ROADS FOR MOTOR AND PEDESTRIAN TRAFFIC .........17
3. PROJECT OVERVIEW ...............................................................................................................19
4. FEATURES OF LIGHT-EMITTING DIODES ....................................................................................20
4.1 Life span ...............................................................................................................................20 4.2 Colour rendering index .........................................................................................................20 4.3 Correlated colour temperature (CCT) ...................................................................................21
5. SEQUENCE OF TESTS FOR THE NEW LIGHT-EMITTING DIODE TECHNOLOGY .................................23
5.1 Measurements of diode luminaires in integrating sphere .....................................................23 5.2 Absolute photometry – Astro with 6000°K diodes ................................................................24 5.3 Absolute photometry – Astro with 4100°K diodes ................................................................25
6. TESTS ON THE 5TH
AND 8TH
STREET ..........................................................................................27
6.1 5th Street ...............................................................................................................................27
6.2 8th Street ...............................................................................................................................27
6.3 Illuminance calculations for conventional HPS cobra-style luminaire ..................................28 6.4 Illuminance calculations with 4100°K LED luminaire ...........................................................31 6.5 Illuminance calculations with a 4100°K LED luminaire on 5
th Street ....................................31
6.6 Illuminance calculations with HPS luminaire on 5th Street ...................................................35
7. MESOPIC CORRECTION FOR LED LUMINAIRE ............................................................................37
8. MESOPIC CORRECTION FOR HPS LUMINAIRE............................................................................42
9. ASSIST AND LED VERSUS HPS .............................................................................................47
10. ASTRO 6000°K VERSUS ASTRO 4100°K .............................................................................49
11. STREET LUMINAIRE EFFICIENCY ...............................................................................................51
12. CONCLUSION ..........................................................................................................................53
ANNEX A: SPHERE TESTS FOR 4100°K LED LUMINAIRE (L1007284-C1) ..........................................55
ANNEX B: PHOTOMETER TESTS FOR 4100°K LED LUMINAIRE (S1007281-R1) .................................60
ANNEX C: PHOTOGRAPHS OF THE MUNICIPALITY OF SAINT-GÉDÉON-DE-BEAUCE ..............................72
ANNEX D: REQUIRED ROADWAY LIGHTING LEVELS BY THE CITY OF OTTAWA FOR URBAN AREA ...........79
ANNEX E: SURVEY DISTRIBUTED TO THE MUNICIPALITY .....................................................................81
“LED street lighting in the municipality of Saint-Gédéon-de-Beauce within the framework of advanced lighting technologies” xiv LTE-RT-2011-0076 Public distribution
ANNEX F: SITE MEASUREMENTS OF THE OPERATING STATE ...............................................................83
ANNEX G: SITE MEASUREMENTS OF LED LUMINAIRE LIGHTING ..........................................................85
ANNEX H: ENERGY SAVINGS ............................................................................................................87
ANNEX I: SPECIFICATIONS OF THE CITY OF LOS ANGELES ...............................................................89
“LED street lighting in the municipality of Saint-Gédéon-de-Beauce within the framework of advanced lighting technologies” xv LTE-RT-2011-0076 Public distribution
List of figures
Pages
Figure 1: Principle of light measurement (lux) ..................................................................................... 5
Figure 2: Angles of the observer for illuminance and luminance calculation ...................................... 6
Figure 3: Angles of the observer for the calculation of veiling luminance vL ..................................... 7
Figure 4: Calculation grid for the space between two (2) luminaires .................................................. 9
Figure 5: Calculation grid according to IES RP-8 .............................................................................. 12
Figure 15: Correlated colour temperature ......................................................................................... 21
Figure 16: Overall efficiency for an HPS luminaire in clean condition and new lamp reference ballast
(ballast factor of 1) ............................................................................................................. 29
Figure 17: Overall efficiency of an HPS luminaire in clean condition and new lamp ballast factor of
0.9 ...................................................................................................................................... 30
Figure 18: Lumens distribution for a 4100°K LED luminaire (65 watts total) .................................... 31
Figure 19: Spectral power distribution of LED illuminance for the pilot project ................................. 38
Figure 20: Distribution of luminous flux by type of vision – LED 4100°K .......................................... 40
Figure 21: HPS luminaire installed inside the sphere ....................................................................... 42
Figure 22: Spectral power distribution for HPS luminaire ................................................................. 44
Figure 23: Spectral distribution for HPS luminaire test L1011052-C1 .............................................. 45
Figure 24: Distribution of luminous flux by vision type - HPS ........................................................... 46
Figure 25: Mesopic luminance / photopic luminance ........................................................................ 48
Figure 26: LED mesopic luminance / HPS mesopic luminance ........................................................ 48
Figure 27: Comparison of colour temperatures of LED luminaires ................................................... 49
Figure 28: Spill light ........................................................................................................................... 51
Figure 29: Downward efficiency and total efficiency ......................................................................... 52

“LED street lighting in the municipality of Saint-Gédéon-de-Beauce within the framework of advanced lighting technologies” xvii LTE-RT-2011-0076 Public distribution
List of tables
Pages
Table 1: Levels of lighting according to IES RP-8 ............................................................................... 3
Table 2: Recommended values of luminance ratios and luminance ................................................. 10
Table 3: CIE 115:2010 Lighting of roads for motor and pedestrian traffic and P Class .................... 17
Table 14: Measurements of LED luminaires in integrating sphere ................................................... 23
Table 15: Astro 6000°K diodes on goniophotometer ........................................................................ 24
Table 16: Astro with 4100°K diodes on goniophotometer ................................................................. 25
Table 17: Used HPS luminaire in clean condition and a new lamp on reference ballast.................. 28
Table 18: New HPS lamp on reference ballast ................................................................................. 28
Table 19: Simulation results for 5th Street with 150 feet of spacing between luminaires and 4100°K
LED luminaire..................................................................................................................... 33
Table 20: Simulation results for 5th Street with 170 feet and 190 feet of spacing between 4100°K
LED luminaires ................................................................................................................... 34
Table 21: Simulation results for 5th Street with 150 feet of spacing between luminaires and HPS
luminaire ............................................................................................................................. 36
Table 22: Lumens measured in sphere, LDI LED 4100°K luminaires .............................................. 39
Table 23: Photopic and scotopic lumens by wavelength, LDI LED 4100°K luminaire ...................... 40
Table 24: Summary of measurements in integrating sphere, LED 4100°K luminaire....................... 41
Table 25: Summary of measurements in integrating sphere for HPS luminaires ............................. 42
Table 26: Lumens measured in integrating sphere, HPS luminaire / reference ballast .................... 45
Table 27: Photopic and scotopic lumens according to wavelength, HPS luminaire ......................... 46
Table 28: LED / HPS ratio by luminance level .................................................................................. 47
Table 29: Summary of luminance by side of the lane and technology (including LED mesopic
correction) .......................................................................................................................... 53
Table 30: Efficiency by technology in cd/m2 per electric watt ............................................................ 53
Table 31: Gain in efficiency resulting from the replacement of HPS by LED .................................... 53
“LED street lighting in the municipality of Saint-Gédéon-de-Beauce within the framework of advanced lighting technologies” 1 LTE-RT-2011-0076 Public distribution
Introduction
Within the context of road lighting, the new LED technology is slowly making its way and is
increasingly garnering interest. Consumers are increasingly turning to technology in order to reduce
their energy costs but also to meet the necessary performance standards. It is in this context that a
pilot project took place in the municipality of Saint-Gédéon-de-Beauce, by using LED luminaires of
the company LDI.
With the intention of evaluating this new technology on site, an experiment procedure was
developed. The luminaires were first evaluated in the laboratory by the company Spectralux from
Montreal. During this stage, the tests took place in the laboratory on the integrating sphere as well
as on a goniophotometer. This approach was executed by using both the current High Pressure
Sodium (HPS) technology and the LED technology. Simulation tests were then conducted with the
help of the software Visual Roadway Lighting Tool.
Following this approach and this technological exploration over a period of time, tests were
conducted on site in order to validate the levels of lighting obtained through simulation. This report
has for the objective to gain an understanding of the new technology in a very specific case which is
residential road lighting. The practical objective of the investigation is to determine the potential
energy savings, all the while ensuring the lighting quality obtained.

“LED street lighting in the municipality of Saint-Gédéon-de-Beauce within the framework of advanced lighting technologies” 3 LTE-RT-2011-0076 Public distribution
1. Road lighting and its principles
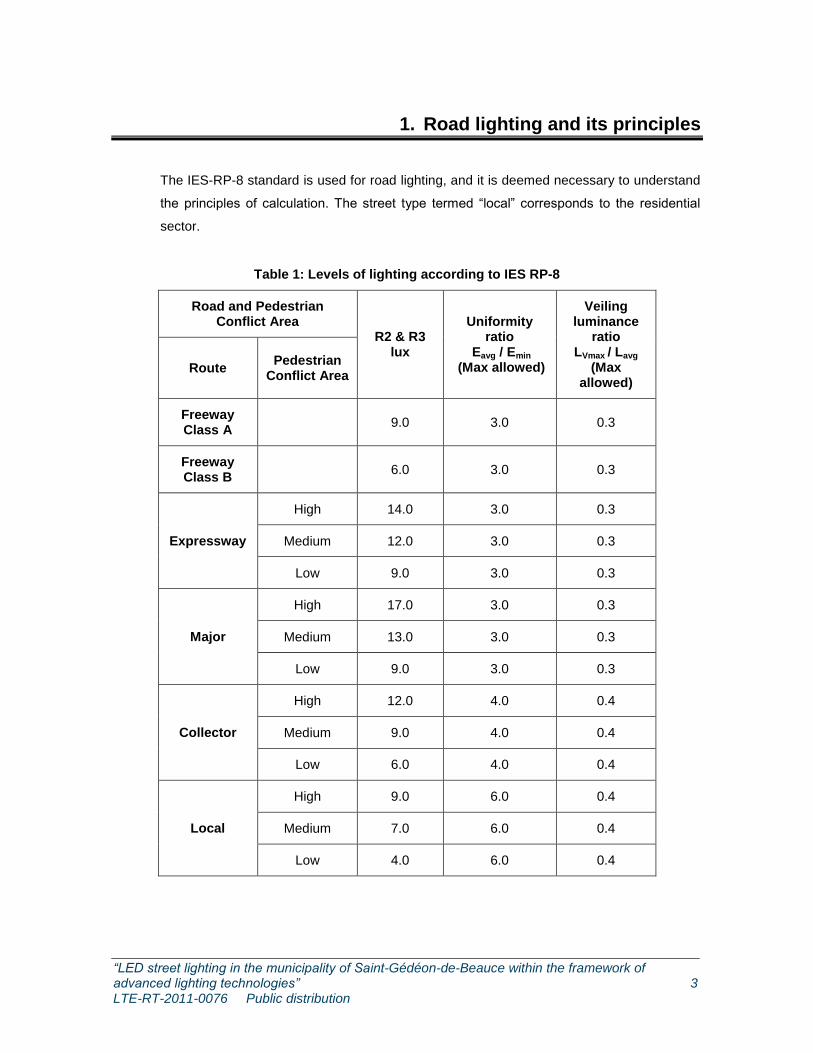
The IES-RP-8 standard is used for road lighting, and it is deemed necessary to understand
the principles of calculation. The street type termed “local” corresponds to the residential
sector.
Table 1: Levels of lighting according to IES RP-8
Road and Pedestrian Conflict Area
R2 & R3 lux
Uniformity ratio
Eavg / Emin
(Max allowed)
Veiling luminance
ratio LVmax / Lavg
(Max allowed)
Route Pedestrian
Conflict Area
Freeway Class A
9.0 3.0 0.3
Freeway Class B
6.0 3.0 0.3
Expressway
High 14.0 3.0 0.3
Medium 12.0 3.0 0.3
Low 9.0 3.0 0.3
Major
High 17.0 3.0 0.3
Medium 13.0 3.0 0.3
Low 9.0 3.0 0.3
Collector
High 12.0 4.0 0.4
Medium 9.0 4.0 0.4
Low 6.0 4.0 0.4
Local
High 9.0 6.0 0.4
Medium 7.0 6.0 0.4
Low 4.0 6.0 0.4
“LED street lighting in the municipality of Saint-Gédéon-de-Beauce within the framework of advanced lighting technologies” 4 LTE-RT-2011-0076 Public distribution
The IESNA RP-8 standard describes the lighting levels in lux according to the type of roadway
surface, type of road as well as the pedestrian conflict area, which is defined as the pedestrian
activities in relation to the number of pedestrians per hour:
High: 100 or more pedestrians per hour
Medium: 11 to 99 pedestrians per hour
Low: 10 or fewer pedestrians per hour
In general, the classification R3 is used for asphalt roadways, which is due to the difference in
material reflectance. According to the IES RP-8 criteria, the method of recommended values
according to the luminance method will be presented later. In order to fully understand the
difference between these two methods, lighting (“illuminance”) and luminance, it is important to refer
to the definition:
The density of the luminous flux on one point of a surface is defined as the luminous flux per unit
area.
1.1 Illuminance and luminance
1.1.1 Illuminance:
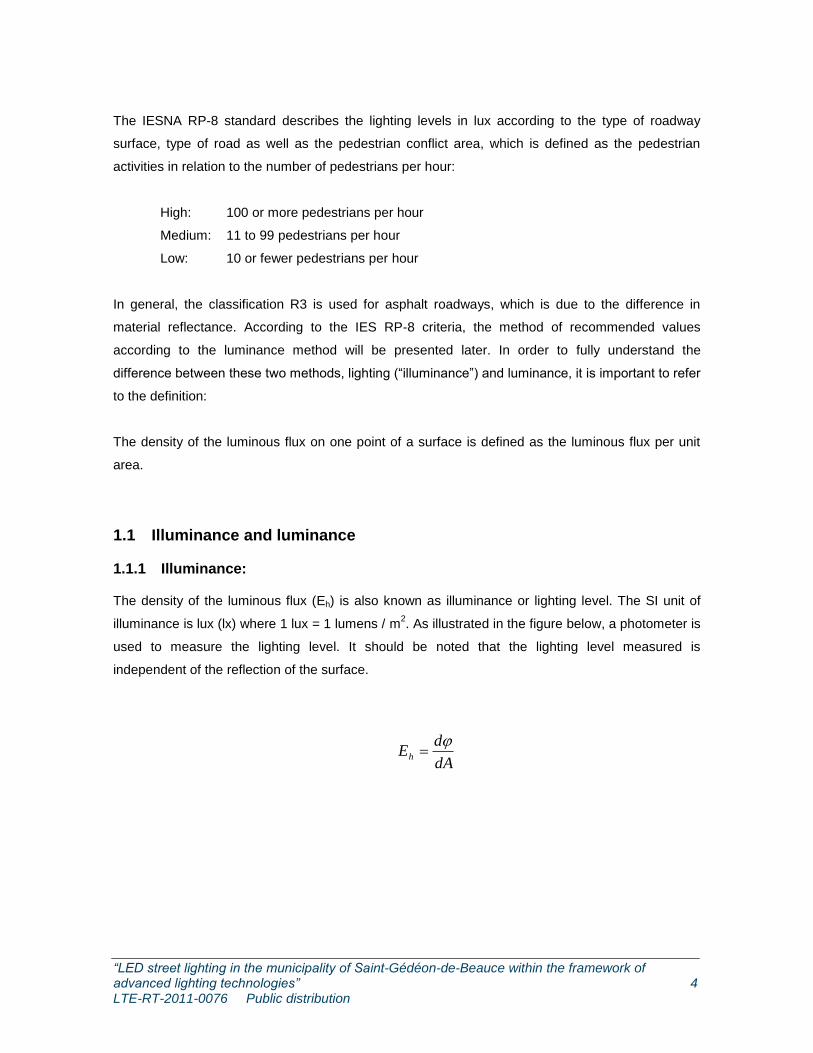
The density of the luminous flux (Eh) is also known as illuminance or lighting level. The SI unit of
illuminance is lux (lx) where 1 lux = 1 lumens / m2. As illustrated in the figure below, a photometer is
used to measure the lighting level. It should be noted that the lighting level measured is
independent of the reflection of the surface.
dA
dEh
“LED street lighting in the municipality of Saint-Gédéon-de-Beauce within the framework of advanced lighting technologies” 5 LTE-RT-2011-0076 Public distribution
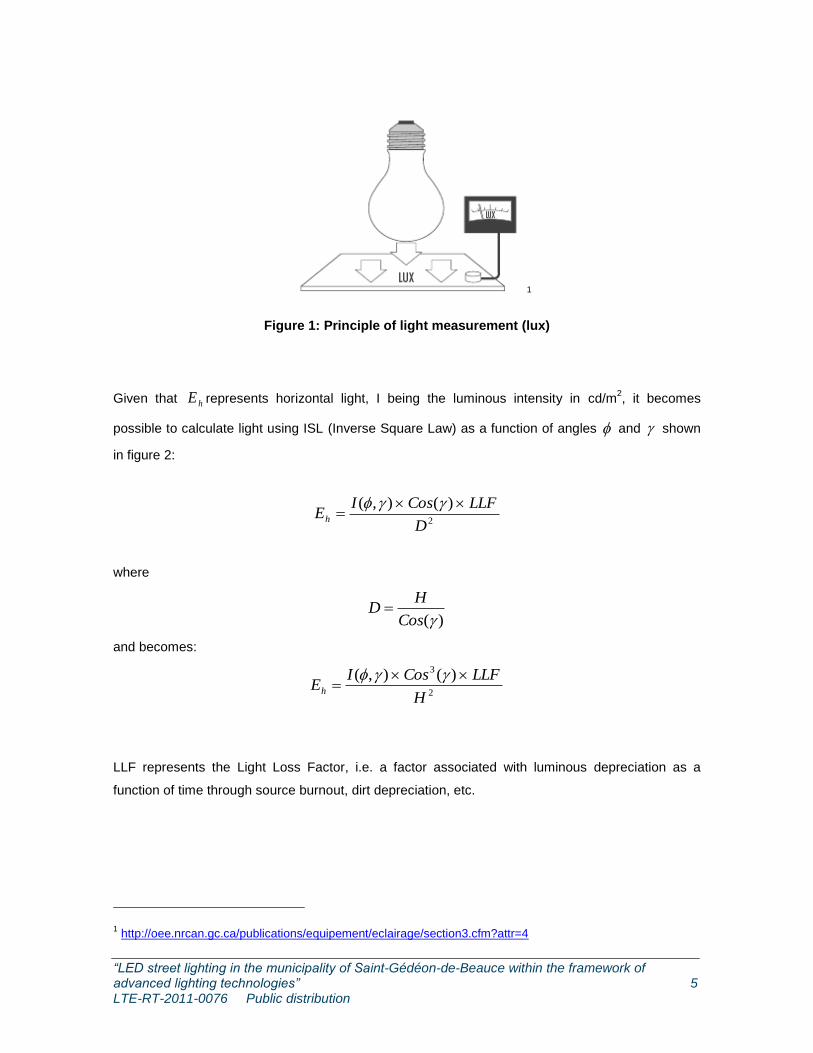
1
Figure 1: Principle of light measurement (lux)
Given that hE represents horizontal light, I being the luminous intensity in cd/m2, it becomes
possible to calculate light using ISL (Inverse Square Law) as a function of angles and shown
in figure 2:
2
)(),(
D
LLFCosIEh
where
)(Cos
HD
and becomes:
2
3 )(),(
H
LLFCosIEh
LLF represents the Light Loss Factor, i.e. a factor associated with luminous depreciation as a
function of time through source burnout, dirt depreciation, etc.
1 http://oee.nrcan.gc.ca/publications/equipement/eclairage/section3.cfm?attr=4
“LED street lighting in the municipality of Saint-Gédéon-de-Beauce within the framework of advanced lighting technologies” 6 LTE-RT-2011-0076 Public distribution
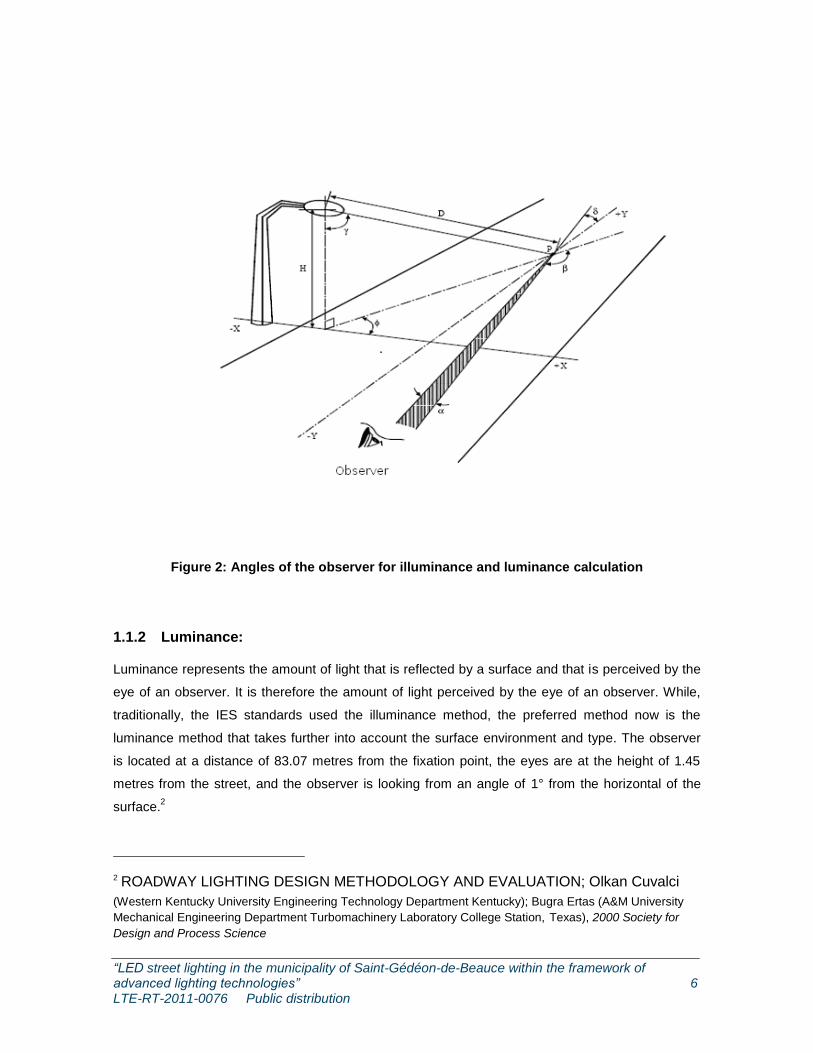
Figure 2: Angles of the observer for illuminance and luminance calculation
1.1.2 Luminance:
Luminance represents the amount of light that is reflected by a surface and that is perceived by the
eye of an observer. It is therefore the amount of light perceived by the eye of an observer. While,
traditionally, the IES standards used the illuminance method, the preferred method now is the
luminance method that takes further into account the surface environment and type. The observer
is located at a distance of 83.07 metres from the fixation point, the eyes are at the height of 1.45
metres from the street, and the observer is looking from an angle of 1° from the horizontal of the
surface.2
2 ROADWAY LIGHTING DESIGN METHODOLOGY AND EVALUATION; Olkan Cuvalci
(Western Kentucky University Engineering Technology Department Kentucky); Bugra Ertas (A&M University
Mechanical Engineering Department Turbomachinery Laboratory College Station, Texas), 2000 Society for
Design and Process Science
“LED street lighting in the municipality of Saint-Gédéon-de-Beauce within the framework of advanced lighting technologies” 7 LTE-RT-2011-0076 Public distribution
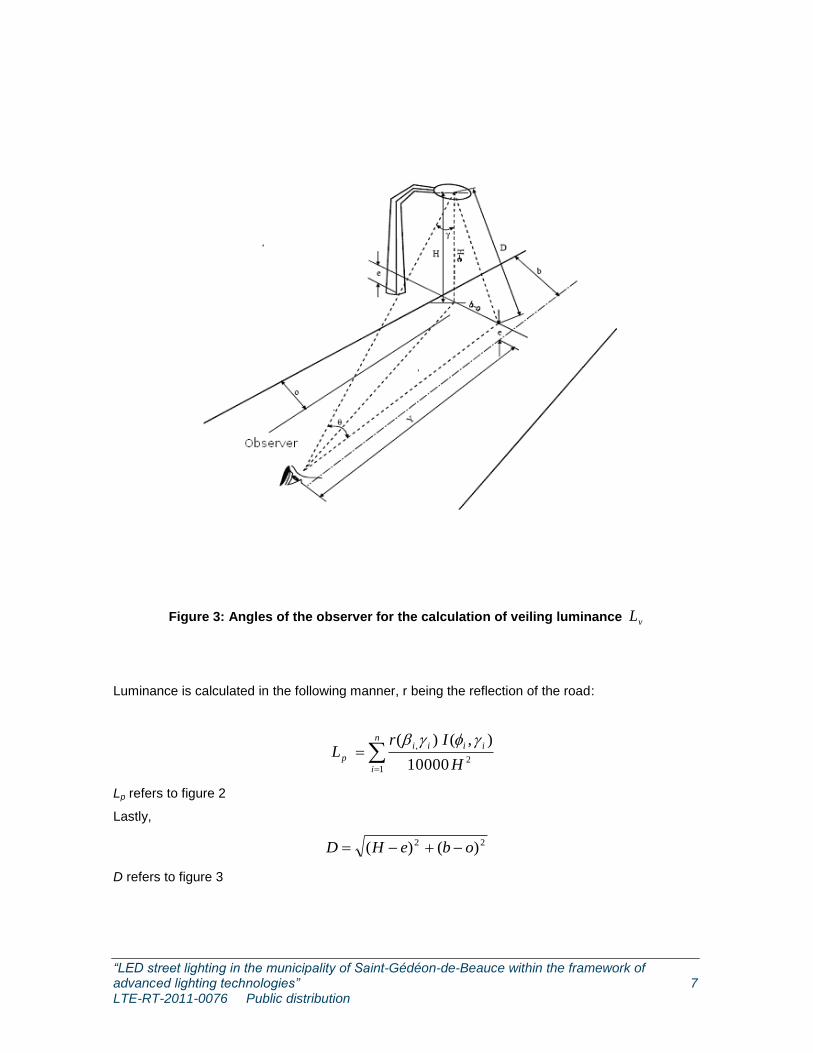
Figure 3: Angles of the observer for the calculation of veiling luminance vL
Luminance is calculated in the following manner, r being the reflection of the road:
n
i
iiii
pH
IrL
12
,
10000
),()(
Lp refers to figure 2
Lastly,
22 )()( obeHD
D refers to figure 3
“LED street lighting in the municipality of Saint-Gédéon-de-Beauce within the framework of advanced lighting technologies” 8 LTE-RT-2011-0076 Public distribution
The luminaire emits light directly to the eye of the observer and consequently produces a reduction
in the visual performance and a feeling of discomfort. Due to this sensation, luminance can be
higher than the actual luminance coming from the reflection of light on the road surface. This veiling
luminance can be calculated empirically in the following way:
5,1
102
v
v
EL
vE being the vertical illuminance on the plane of the observer’s pupil
the angle between the line of sight and luminaire in degrees
The IES method defines the veiling luminance ratio as the maximum value of veiling luminance
divided by the average pavement luminance as a measure of the disability glare or the discomfort
produced by the glare.
1.2 Recommended luminance values
Between two luminaires A and B, it is possible to obtain the following values for each one for the
following twenty (20) points, for example. The concept that needs to be understood is that it is
possible to determine an average value as well as longitudinal uniformity on a grid. We can imagine
a situation where the average value would be higher but the distribution would be very poor.
Consequently, some points would be “dark holes” or some would be too bright, pointing to an
inadequate optimization of the lighting system.
“LED street lighting in the municipality of Saint-Gédéon-de-Beauce within the framework of advanced lighting technologies” 9 LTE-RT-2011-0076 Public distribution
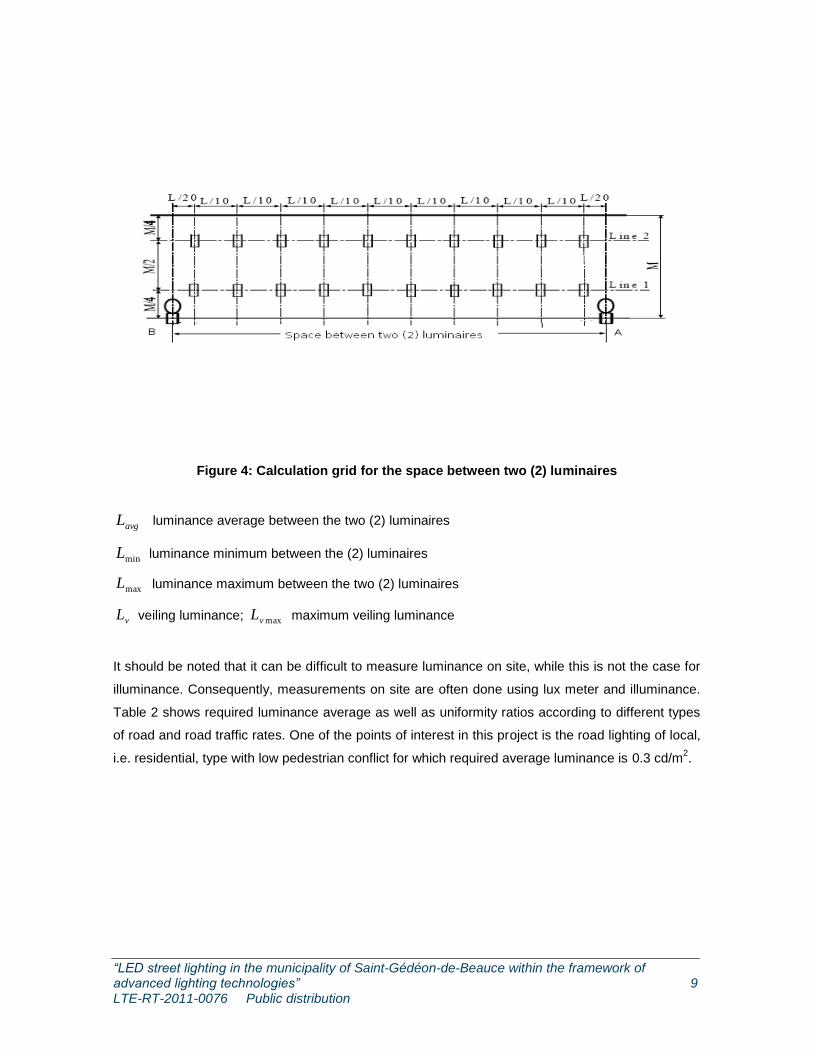
Figure 4: Calculation grid for the space between two (2) luminaires
avgL luminance average between the two (2) luminaires
minL luminance minimum between the (2) luminaires
maxL luminance maximum between the two (2) luminaires
vL veiling luminance; maxvL maximum veiling luminance
It should be noted that it can be difficult to measure luminance on site, while this is not the case for
illuminance. Consequently, measurements on site are often done using lux meter and illuminance.
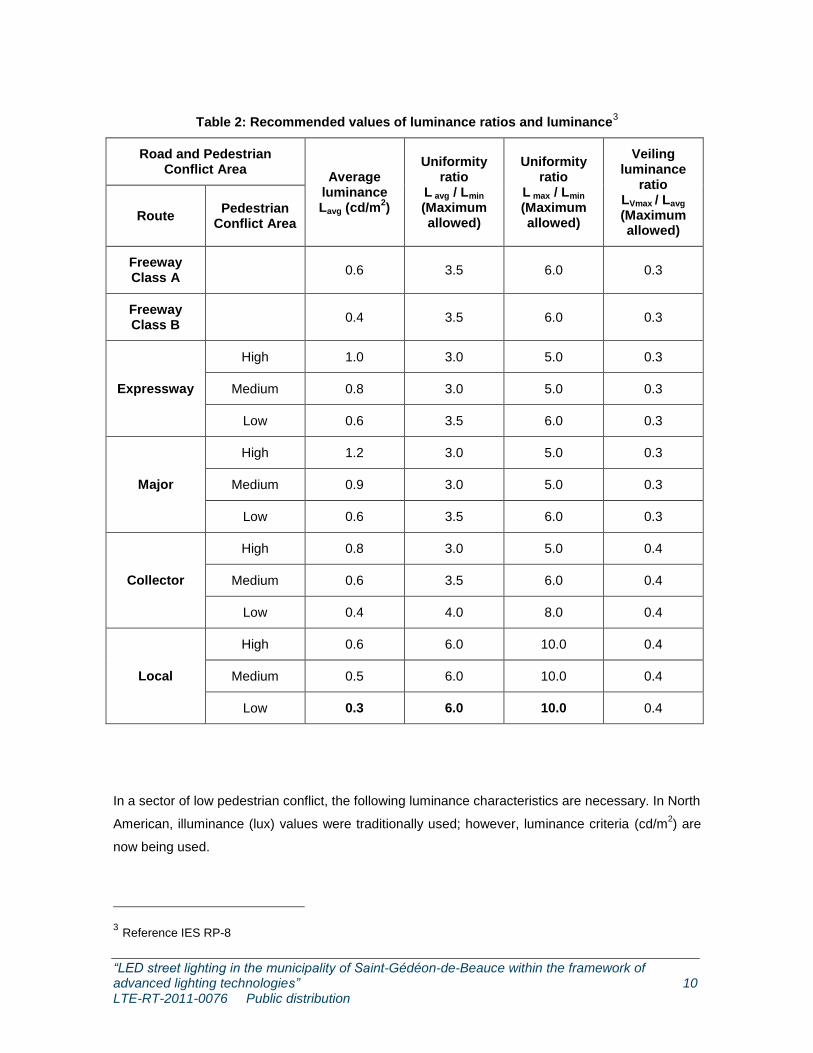
Table 2 shows required luminance average as well as uniformity ratios according to different types
of road and road traffic rates. One of the points of interest in this project is the road lighting of local,
i.e. residential, type with low pedestrian conflict for which required average luminance is 0.3 cd/m2.
“LED street lighting in the municipality of Saint-Gédéon-de-Beauce within the framework of advanced lighting technologies” 10 LTE-RT-2011-0076 Public distribution
Table 2: Recommended values of luminance ratios and luminance3
Road and Pedestrian Conflict Area
Average luminance Lavg (cd/m
2)
Uniformity ratio
L avg / Lmin
(Maximum allowed)
Uniformity ratio
L max / Lmin
(Maximum allowed)
Veiling luminance
ratio LVmax / Lavg
(Maximum allowed)
Route Pedestrian
Conflict Area
Freeway Class A
0.6 3.5 6.0 0.3
Freeway Class B
0.4 3.5 6.0 0.3
Expressway
High 1.0 3.0 5.0 0.3
Medium 0.8 3.0 5.0 0.3
Low 0.6 3.5 6.0 0.3
Major
High 1.2 3.0 5.0 0.3
Medium 0.9 3.0 5.0 0.3
Low 0.6 3.5 6.0 0.3
Collector
High 0.8 3.0 5.0 0.4
Medium 0.6 3.5 6.0 0.4
Low 0.4 4.0 8.0 0.4
Local
High 0.6 6.0 10.0 0.4
Medium 0.5 6.0 10.0 0.4
Low 0.3 6.0 10.0 0.4
In a sector of low pedestrian conflict, the following luminance characteristics are necessary. In North
American, illuminance (lux) values were traditionally used; however, luminance criteria (cd/m2) are
now being used.
3 Reference IES RP-8
“LED street lighting in the municipality of Saint-Gédéon-de-Beauce within the framework of advanced lighting technologies” 11 LTE-RT-2011-0076 Public distribution
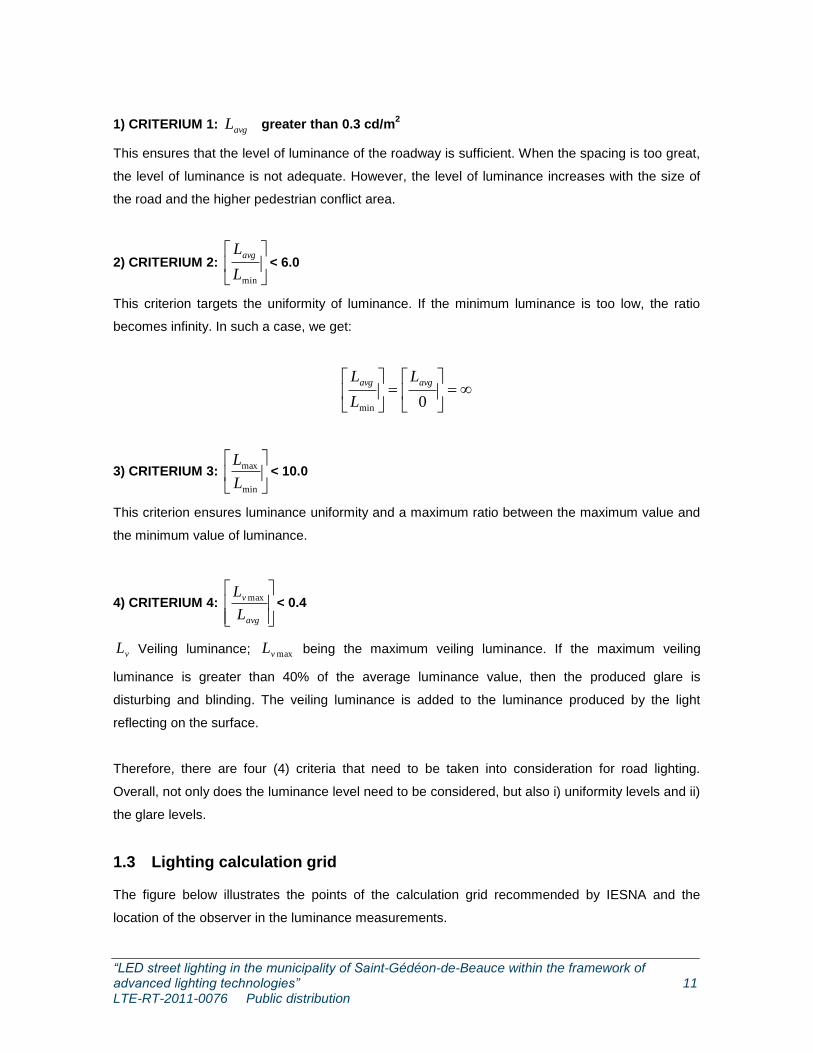
1) CRITERIUM 1: avgL greater than 0.3 cd/m
2
This ensures that the level of luminance of the roadway is sufficient. When the spacing is too great,
the level of luminance is not adequate. However, the level of luminance increases with the size of
the road and the higher pedestrian conflict area.
2) CRITERIUM 2:
minL
Lavg< 6.0
This criterion targets the uniformity of luminance. If the minimum luminance is too low, the ratio
becomes infinity. In such a case, we get:
0min
avgavg L
L
L
3) CRITERIUM 3:
min
max
L
L< 10.0
This criterion ensures luminance uniformity and a maximum ratio between the maximum value and
the minimum value of luminance.
4) CRITERIUM 4:
avg
v
L
L max< 0.4
vL Veiling luminance; maxvL being the maximum veiling luminance. If the maximum veiling
luminance is greater than 40% of the average luminance value, then the produced glare is
disturbing and blinding. The veiling luminance is added to the luminance produced by the light
reflecting on the surface.
Therefore, there are four (4) criteria that need to be taken into consideration for road lighting.
Overall, not only does the luminance level need to be considered, but also i) uniformity levels and ii)
the glare levels.
1.3 Lighting calculation grid
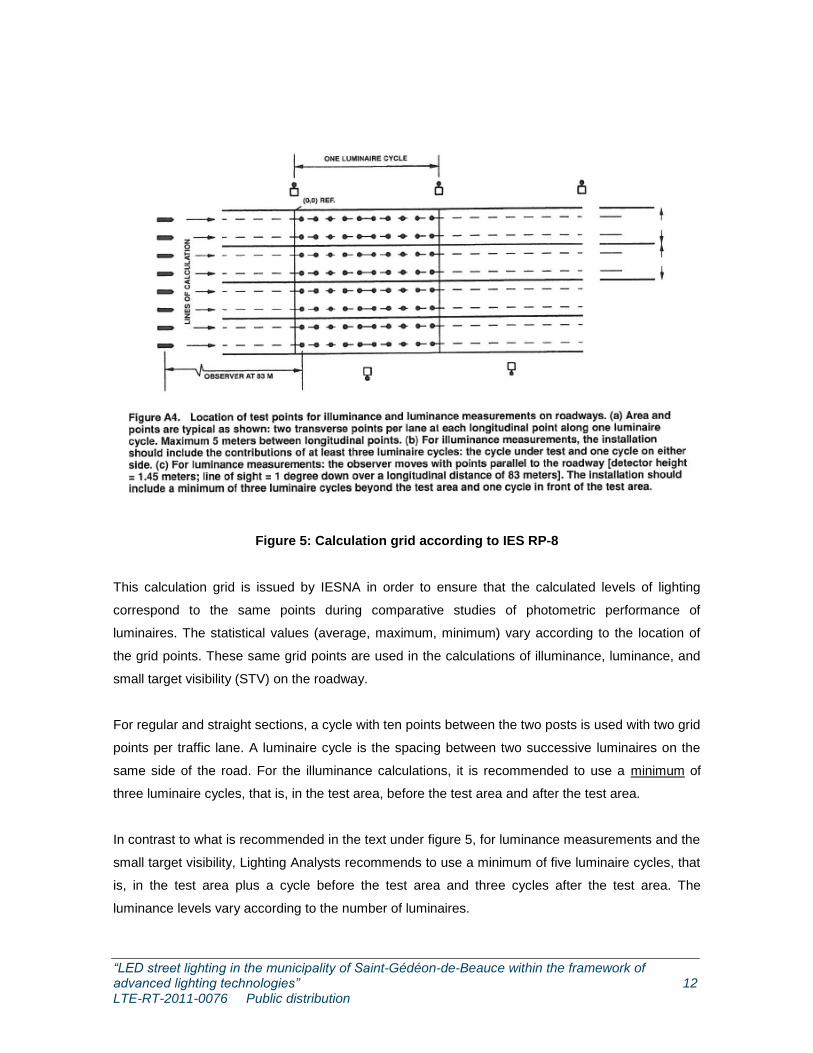
The figure below illustrates the points of the calculation grid recommended by IESNA and the
location of the observer in the luminance measurements.
“LED street lighting in the municipality of Saint-Gédéon-de-Beauce within the framework of advanced lighting technologies” 12 LTE-RT-2011-0076 Public distribution
Figure 5: Calculation grid according to IES RP-8
This calculation grid is issued by IESNA in order to ensure that the calculated levels of lighting
correspond to the same points during comparative studies of photometric performance of
luminaires. The statistical values (average, maximum, minimum) vary according to the location of
the grid points. These same grid points are used in the calculations of illuminance, luminance, and
small target visibility (STV) on the roadway.
For regular and straight sections, a cycle with ten points between the two posts is used with two grid
points per traffic lane. A luminaire cycle is the spacing between two successive luminaires on the
same side of the road. For the illuminance calculations, it is recommended to use a minimum of
three luminaire cycles, that is, in the test area, before the test area and after the test area.
In contrast to what is recommended in the text under figure 5, for luminance measurements and the
small target visibility, Lighting Analysts recommends to use a minimum of five luminaire cycles, that
is, in the test area plus a cycle before the test area and three cycles after the test area. The
luminance levels vary according to the number of luminaires.
“LED street lighting in the municipality of Saint-Gédéon-de-Beauce within the framework of advanced lighting technologies” 13 LTE-RT-2011-0076 Public distribution
The width of a traffic lane is 3.65 meters (12 feet). Transversely (perpendicular to the roadway), the
first grid point of each traffic lane is ¼ of the width of the traffic lane and the increment between the
grid points is ½ the width of the lane, or 1.825 meters (6 feet).
Longitudinally (direction of the traffic), the first grid point of each traffic lane is 1/20 of the spacing
between the luminaires and the increment between two consecutive points of the calculation grid is
equal to 1/10 of the spacing between the luminaires and must not exceed 5 meters.
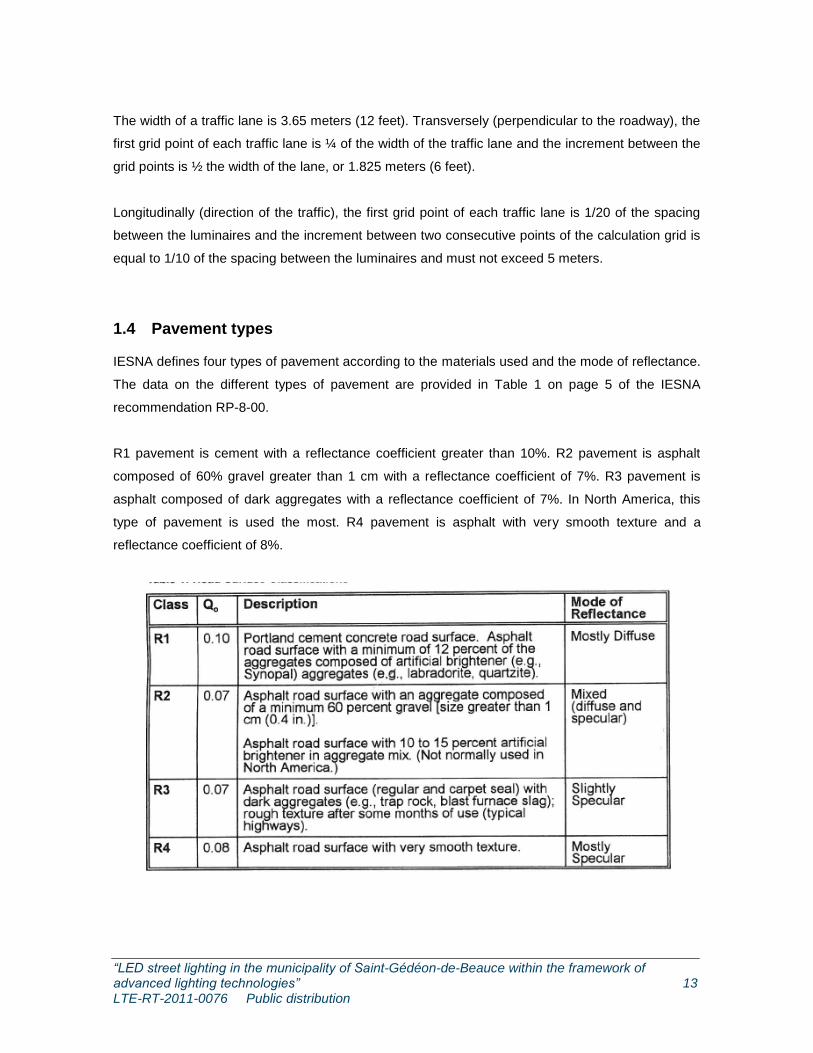
1.4 Pavement types
IESNA defines four types of pavement according to the materials used and the mode of reflectance.
The data on the different types of pavement are provided in Table 1 on page 5 of the IESNA
recommendation RP-8-00.
R1 pavement is cement with a reflectance coefficient greater than 10%. R2 pavement is asphalt
composed of 60% gravel greater than 1 cm with a reflectance coefficient of 7%. R3 pavement is
asphalt composed of dark aggregates with a reflectance coefficient of 7%. In North America, this
type of pavement is used the most. R4 pavement is asphalt with very smooth texture and a
reflectance coefficient of 8%.
“LED street lighting in the municipality of Saint-Gédéon-de-Beauce within the framework of advanced lighting technologies” 14 LTE-RT-2011-0076 Public distribution
1.5 Street classification
According to the Illuminating Engineering Society of North America (IESNA), streets are classified
as major, collector and local. It should be noted that the residential terminology used in this context
is not linked to the number of residences or houses located on the street.
From the geographic point of view, an arterial road crosses through the entire city; a collector street
flows into an arterial road, while a local street flows into a collector street.
In terms of lighting, annual average daily traffic (AADF) per hour and the pedestrian activity are two
parameters used by IESNA to classify a road.
Annual average daily traffic
Annual average daily traffic (AADF) is an estimate of the number of vehicles that circulate on a
street in any given year divided by the number of days in the year. This flow is calculated for both
traffic directions. The AADF is calculated using a statistical method for estimation applied to about
5 000 collector streets at more than 1 500 sites, bringing the total to about 65 000 automatically
recorded days. The observed periods and the frequency vary greatly, from several days at
temporary sites to an entire year at permanent sites.
If the AADF per day is greater than 3 500 vehicles, the road is classified as an arterial road. If the
annual average daily traffic flow per hour is between 1 500 and 3 500 vehicles, the street is
classified as collector. The street is classified as local if the AADF per hour is between 100 and 1
500 vehicles.
Pedestrian activity
Pedestrian activity is defined as the level of car/pedestrian interference. Pedestrian activity is
characterized as low when only a few pedestrians (10 or fewer) tend to cross the street occasionally
at nighttime. Pedestrian activity is said to be medium when a larger number of pedestrians
(between 11 and 99) cross the street occasionally at nighttime. It is said to be high when many
pedestrians (100 and more) cross the street frequently at nighttime.
The number of pedestrians should be counted at nighttime for a given period of one hour on a
typical block or over a distance of 200 meters on both sides of the street at the busiest time
(generally between 6:00pm and 7:00pm, but the actual time could however vary from city to city or
from neighbourhood to neighbourhood).
“LED street lighting in the municipality of Saint-Gédéon-de-Beauce within the framework of advanced lighting technologies” 15 LTE-RT-2011-0076 Public distribution
Periods that are particularly busy, such as the moment when crowds are exiting a movie theatre,
entertainment venues or sport events, should be noted, as well as when bars and stores are closing
at night. Areas that are reserved for pedestrians at intersections or other places constitute a special
case that is referred to as pedestrian conflict as opposed to pedestrian activity.
Therefore, the level of vehicle/pedestrian interference is associated with each of the three street
classifications (arterial, collector and local) in order to determine the required level of lighting. For
example, for the arterial classification, there are three levels of car/pedestrian interference, as well
as for collector and local.

“LED street lighting in the municipality of Saint-Gédéon-de-Beauce within the framework of advanced lighting technologies” 17 LTE-RT-2011-0076 Public distribution
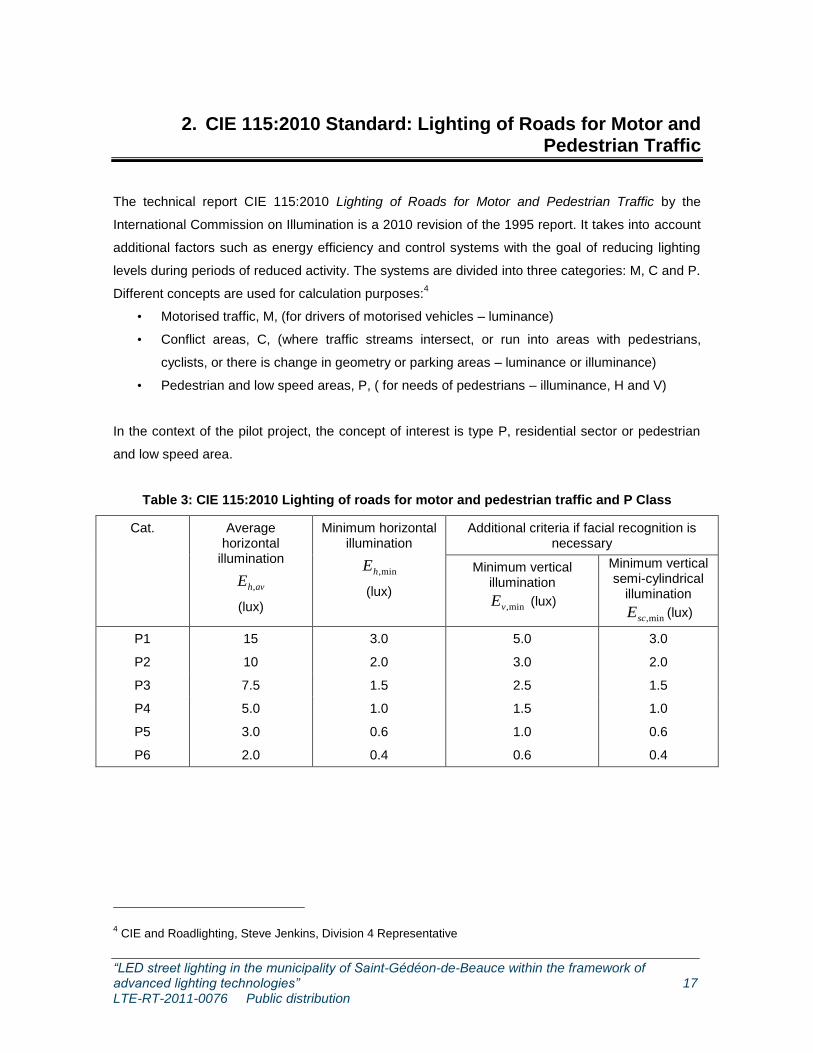
2. CIE 115:2010 Standard: Lighting of Roads for Motor and Pedestrian Traffic
The technical report CIE 115:2010 Lighting of Roads for Motor and Pedestrian Traffic by the
International Commission on Illumination is a 2010 revision of the 1995 report. It takes into account
additional factors such as energy efficiency and control systems with the goal of reducing lighting
levels during periods of reduced activity. The systems are divided into three categories: M, C and P.
Different concepts are used for calculation purposes:4
• Motorised traffic, M, (for drivers of motorised vehicles – luminance)
• Conflict areas, C, (where traffic streams intersect, or run into areas with pedestrians,
cyclists, or there is change in geometry or parking areas – luminance or illuminance)
• Pedestrian and low speed areas, P, ( for needs of pedestrians – illuminance, H and V)
In the context of the pilot project, the concept of interest is type P, residential sector or pedestrian
and low speed area.
Table 3: CIE 115:2010 Lighting of roads for motor and pedestrian traffic and P Class
Cat. Average horizontal
illumination
avhE ,
(lux)
Minimum horizontal illumination
min,hE
(lux)
Additional criteria if facial recognition is necessary
Minimum vertical illumination
min,vE (lux)
Minimum vertical semi-cylindrical
illumination
min,scE (lux)
P1 15 3.0 5.0 3.0
P2 10 2.0 3.0 2.0
P3 7.5 1.5 2.5 1.5
P4 5.0 1.0 1.5 1.0
P5 3.0 0.6 1.0 0.6
P6 2.0 0.4 0.6 0.4
4 CIE and Roadlighting, Steve Jenkins, Division 4 Representative

“LED street lighting in the municipality of Saint-Gédéon-de-Beauce within the framework of advanced lighting technologies” 19 LTE-RT-2011-0076 Public distribution
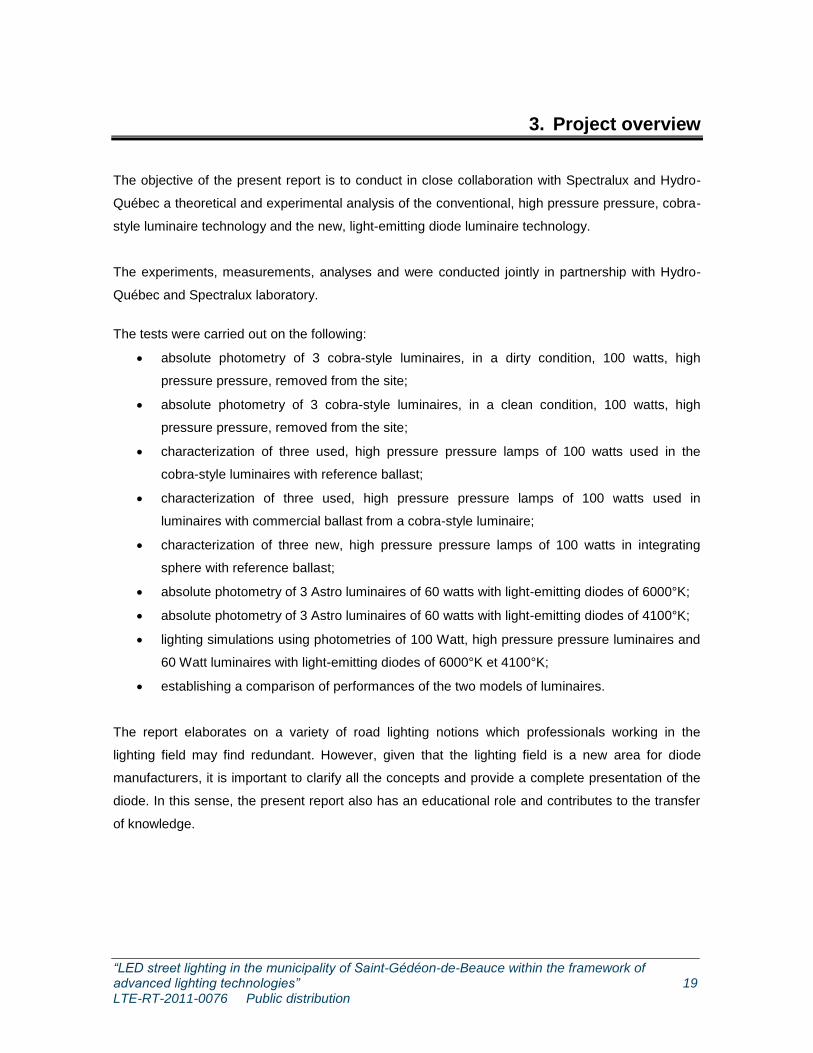
3. Project overview
The objective of the present report is to conduct in close collaboration with Spectralux and Hydro-
Québec a theoretical and experimental analysis of the conventional, high pressure pressure, cobra-
style luminaire technology and the new, light-emitting diode luminaire technology.
The experiments, measurements, analyses and were conducted jointly in partnership with Hydro-
Québec and Spectralux laboratory.
The tests were carried out on the following:
absolute photometry of 3 cobra-style luminaires, in a dirty condition, 100 watts, high
pressure pressure, removed from the site;
absolute photometry of 3 cobra-style luminaires, in a clean condition, 100 watts, high
pressure pressure, removed from the site;
characterization of three used, high pressure pressure lamps of 100 watts used in the
cobra-style luminaires with reference ballast;
characterization of three used, high pressure pressure lamps of 100 watts used in
luminaires with commercial ballast from a cobra-style luminaire;
characterization of three new, high pressure pressure lamps of 100 watts in integrating
sphere with reference ballast;
absolute photometry of 3 Astro luminaires of 60 watts with light-emitting diodes of 6000°K;
absolute photometry of 3 Astro luminaires of 60 watts with light-emitting diodes of 4100°K;
lighting simulations using photometries of 100 Watt, high pressure pressure luminaires and
60 Watt luminaires with light-emitting diodes of 6000°K et 4100°K;
establishing a comparison of performances of the two models of luminaires.
The report elaborates on a variety of road lighting notions which professionals working in the
lighting field may find redundant. However, given that the lighting field is a new area for diode
manufacturers, it is important to clarify all the concepts and provide a complete presentation of the
diode. In this sense, the present report also has an educational role and contributes to the transfer
of knowledge.
“LED street lighting in the municipality of Saint-Gédéon-de-Beauce within the framework of advanced lighting technologies” 20 LTE-RT-2011-0076 Public distribution
4. Features of light-emitting diodes
The luminous flux of a diode and its reverse voltage Vf are characterized by a nominal current
published by the manufacturers. With these two features, it is possible to determine the pair
(luminous flux, power) in order to establish luminous efficacy in lumens per watt.
4.1 Life span
A light-emitting diode does not operate in the same way as a traditional luminous source: it can
last for an extremely long period of time. This explains why, at the beginning of the 2000s, diode
manufacturers were stating that the overall life span of diodes was 100 000 hours. However, the
quantity of the luminous flux decreases with time, so that after a certain threshold a diode is
considered to be inoperative.
Today, diode manufacturers publish shorter life spans, around 60 000 hours. Diode life span is
generally defined as the time it takes for half of a group of diodes to emit less than 70% of the
initial flux. This performance criterion is called L70. This information is generally provided by
diode manufacturers.
4.2 Colour rendering index
The colour rendering index measures the ability of a light source to reproduce colours of objects it
illuminates. The reference source, with a colour rendering index of 100, is an incandescent lamp
which is considered to be a black body.
Initially, the International Commission on Illumination (CIE) defined the colour rendering index as
a capacity of a light source to reproduce 14 colours. Since fluorescent lamps do not reproduce
well red hues, the CIE revised its method to reduce the number of colours from 14 to 8. Due to
the fact that calculated colour rendering indexes do not adequately describe the visual perception
of colour rendering by white light-emitting diodes, the CIE is currently looking for ways to
implement a new metrics which would be adapted to diodes.
“LED street lighting in the municipality of Saint-Gédéon-de-Beauce within the framework of advanced lighting technologies” 21 LTE-RT-2011-0076 Public distribution
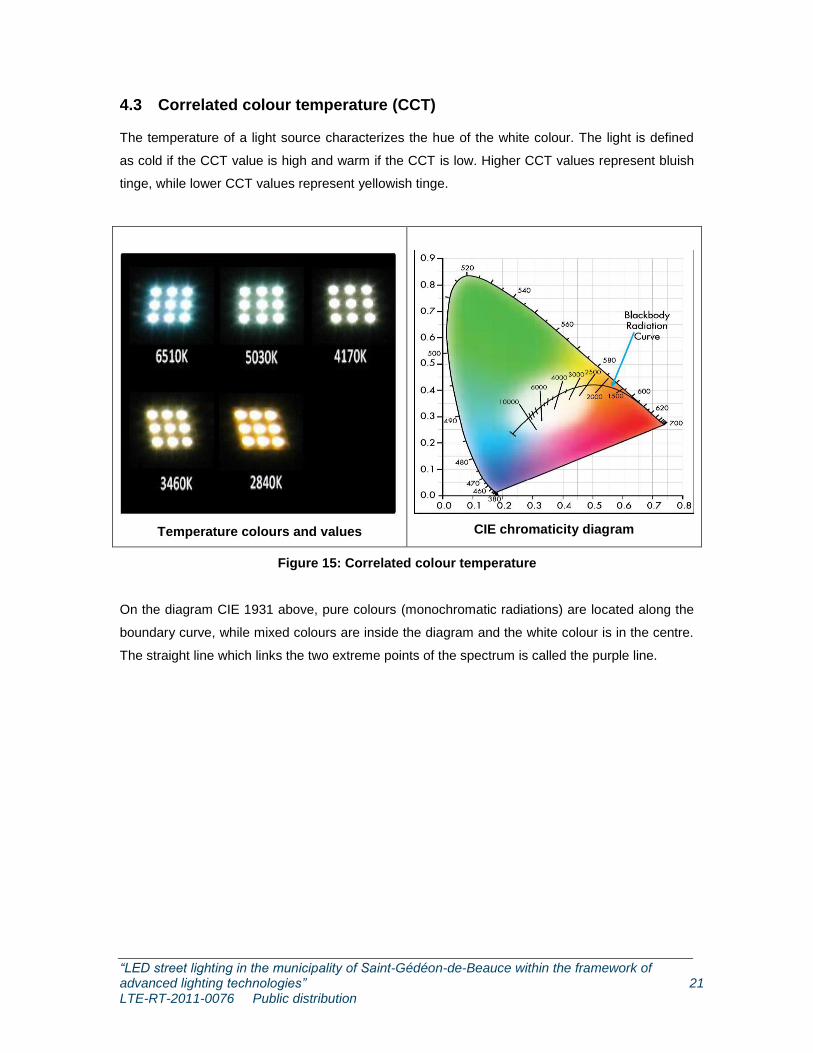
4.3 Correlated colour temperature (CCT)
The temperature of a light source characterizes the hue of the white colour. The light is defined
as cold if the CCT value is high and warm if the CCT is low. Higher CCT values represent bluish
tinge, while lower CCT values represent yellowish tinge.
Temperature colours and values
CIE chromaticity diagram
Figure 15: Correlated colour temperature
On the diagram CIE 1931 above, pure colours (monochromatic radiations) are located along the
boundary curve, while mixed colours are inside the diagram and the white colour is in the centre.
The straight line which links the two extreme points of the spectrum is called the purple line.

“LED street lighting in the municipality of Saint-Gédéon-de-Beauce within the framework of advanced lighting technologies” 23 LTE-RT-2011-0076 Public distribution
5. Sequence of tests for the new light-emitting diode technology
The tests performed on the new light-emitting technology were conducted in the following
sequence:
1. Measurements of 6000°K and 4100°K light-emitting diodes in the integrating sphere
2. Absolute photometry – Astro with 6000°K diodes
3. Absolute photometry – Astro with 4100°K diodes
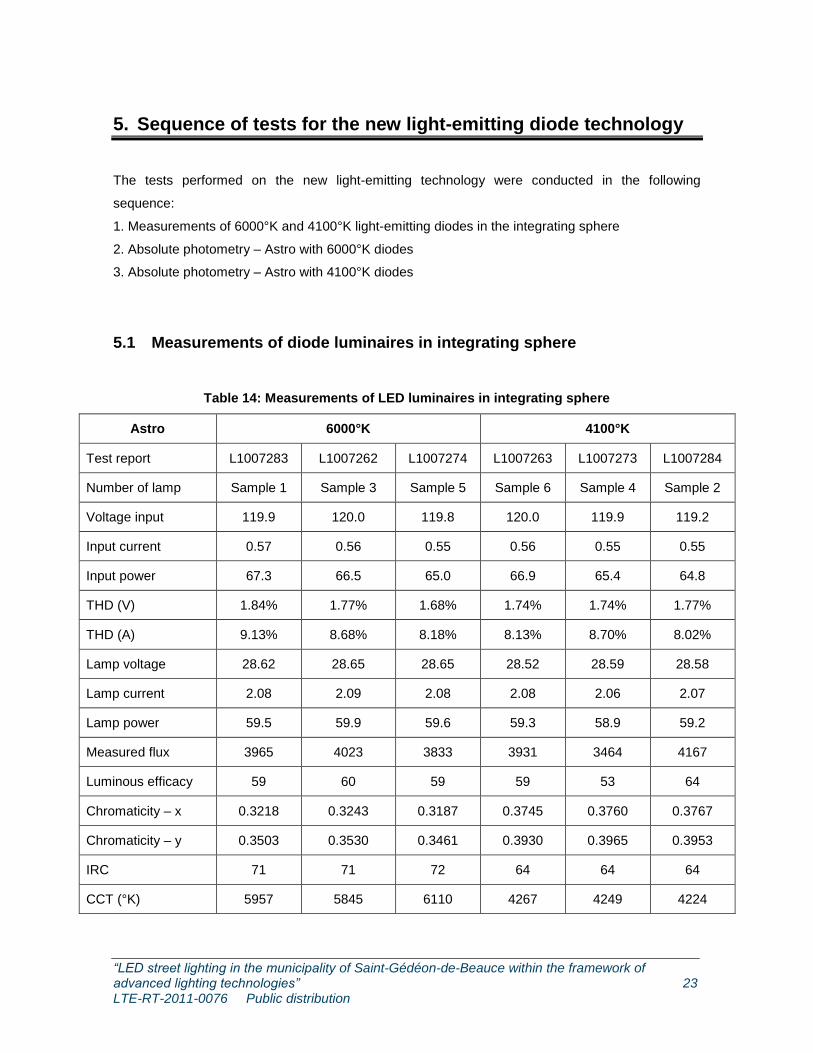
5.1 Measurements of diode luminaires in integrating sphere
Table 14: Measurements of LED luminaires in integrating sphere
Astro 6000°K 4100°K
Test report L1007283 L1007262 L1007274 L1007263 L1007273 L1007284
Number of lamp Sample 1 Sample 3 Sample 5 Sample 6 Sample 4 Sample 2
Voltage input 119.9 120.0 119.8 120.0 119.9 119.2
Input current 0.57 0.56 0.55 0.56 0.55 0.55
Input power 67.3 66.5 65.0 66.9 65.4 64.8
THD (V) 1.84% 1.77% 1.68% 1.74% 1.74% 1.77%
THD (A) 9.13% 8.68% 8.18% 8.13% 8.70% 8.02%
Lamp voltage 28.62 28.65 28.65 28.52 28.59 28.58
Lamp current 2.08 2.09 2.08 2.08 2.06 2.07
Lamp power 59.5 59.9 59.6 59.3 58.9 59.2
Measured flux 3965 4023 3833 3931 3464 4167
Luminous efficacy 59 60 59 59 53 64
Chromaticity – x 0.3218 0.3243 0.3187 0.3745 0.3760 0.3767
Chromaticity – y 0.3503 0.3530 0.3461 0.3930 0.3965 0.3953
IRC 71 71 72 64 64 64
CCT (°K) 5957 5845 6110 4267 4249 4224
“LED street lighting in the municipality of Saint-Gédéon-de-Beauce within the framework of advanced lighting technologies” 24 LTE-RT-2011-0076 Public distribution
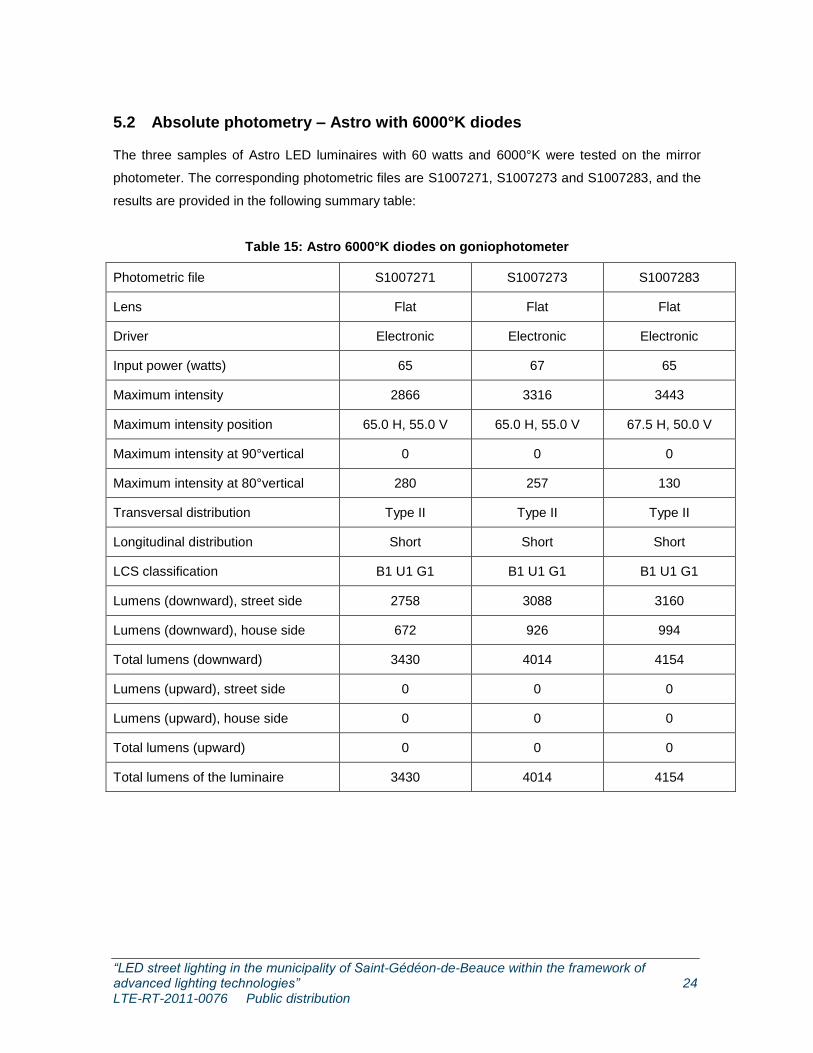
5.2 Absolute photometry – Astro with 6000°K diodes
The three samples of Astro LED luminaires with 60 watts and 6000°K were tested on the mirror
photometer. The corresponding photometric files are S1007271, S1007273 and S1007283, and the
results are provided in the following summary table:
Table 15: Astro 6000°K diodes on goniophotometer
Photometric file S1007271 S1007273 S1007283
Lens Flat Flat Flat
Driver Electronic Electronic Electronic
Input power (watts) 65 67 65
Maximum intensity 2866 3316 3443
Maximum intensity position 65.0 H, 55.0 V 65.0 H, 55.0 V 67.5 H, 50.0 V
Maximum intensity at 90°vertical 0 0 0
Maximum intensity at 80°vertical 280 257 130
Transversal distribution Type II Type II Type II
Longitudinal distribution Short Short Short
LCS classification B1 U1 G1 B1 U1 G1 B1 U1 G1
Lumens (downward), street side 2758 3088 3160
Lumens (downward), house side 672 926 994
Total lumens (downward) 3430 4014 4154
Lumens (upward), street side 0 0 0
Lumens (upward), house side 0 0 0
Total lumens (upward) 0 0 0
Total lumens of the luminaire 3430 4014 4154
“LED street lighting in the municipality of Saint-Gédéon-de-Beauce within the framework of advanced lighting technologies” 25 LTE-RT-2011-0076 Public distribution
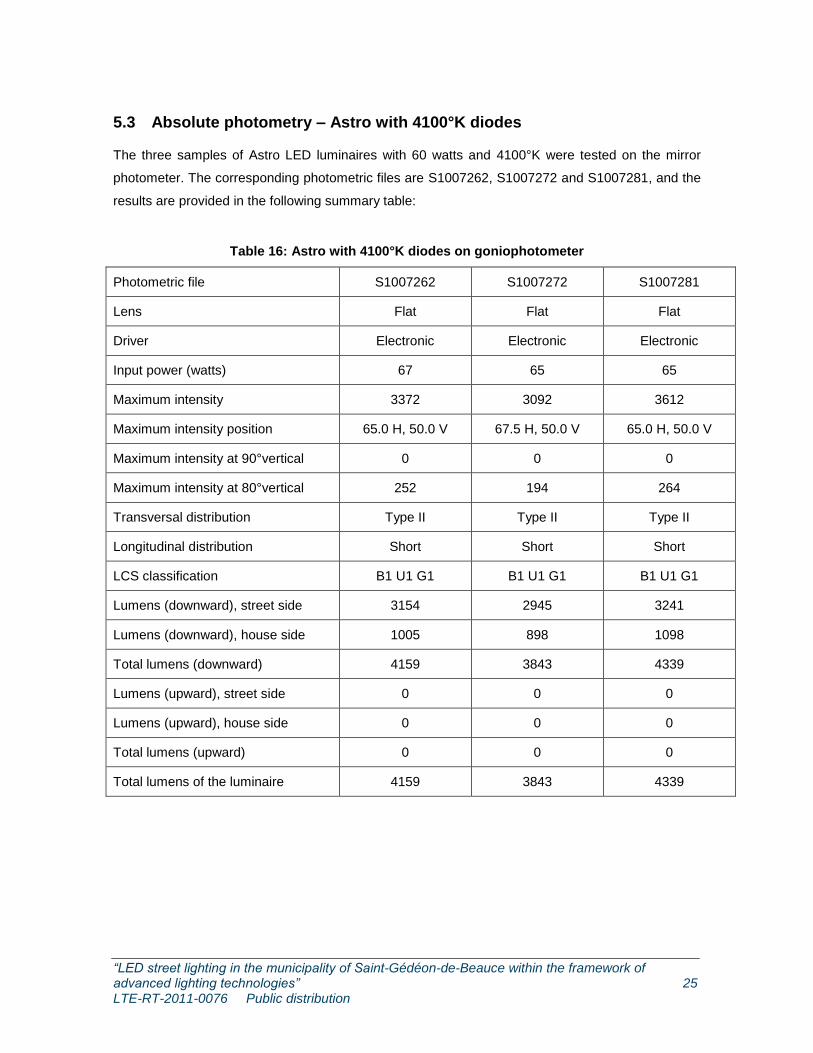
5.3 Absolute photometry – Astro with 4100°K diodes
The three samples of Astro LED luminaires with 60 watts and 4100°K were tested on the mirror
photometer. The corresponding photometric files are S1007262, S1007272 and S1007281, and the
results are provided in the following summary table:
Table 16: Astro with 4100°K diodes on goniophotometer
Photometric file S1007262 S1007272 S1007281
Lens Flat Flat Flat
Driver Electronic Electronic Electronic
Input power (watts) 67 65 65
Maximum intensity 3372 3092 3612
Maximum intensity position 65.0 H, 50.0 V 67.5 H, 50.0 V 65.0 H, 50.0 V
Maximum intensity at 90°vertical 0 0 0
Maximum intensity at 80°vertical 252 194 264
Transversal distribution Type II Type II Type II
Longitudinal distribution Short Short Short
LCS classification B1 U1 G1 B1 U1 G1 B1 U1 G1
Lumens (downward), street side 3154 2945 3241
Lumens (downward), house side 1005 898 1098
Total lumens (downward) 4159 3843 4339
Lumens (upward), street side 0 0 0
Lumens (upward), house side 0 0 0
Total lumens (upward) 0 0 0
Total lumens of the luminaire 4159 3843 4339

“LED street lighting in the municipality of Saint-Gédéon-de-Beauce within the framework of advanced lighting technologies” 27 LTE-RT-2011-0076 Public distribution
6. Tests on the 5th and 8th Street
Astro LED luminaires with 60 watts were installed on the 5th and 8
th Street in Saint-Gédéon-de-
Beauce.
6.1 5th Street
Fifth Street is a residential street with low pedestrian conflict and with a width of 44 feet, consisting
of 10 feet of easement on each side of the two traffic lanes of 24 feet. The pavement is R3 type and
made of asphalt. Lamp posts are mounted on only one side of the street and 9.5 feet from the edge
line with a span of 9.7 feet (including an 8-foot console and a luminous centre of 1.7 feet from the
luminaire). Luminaires are 0.2 feet forward leaning from the edge line and are installed at a
mounting height of 30 feet with spacing that varies between 172 and 207 feet.
6.2 8th Street
Eighth Street is also a residential street with low pedestrian conflict and with a total width of 50 feet,
that is, 13 feet of easement on each side of the two traffic lanes of 24 feet. The pavement is R3 type
and made of asphalt. Lamp posts are mounted on only one side of the street and 13 feet from the
edge line with a span of 9.7 feet (including the 8-foot console and a luminous centre of 1.7 feet from
the luminaire). Luminaires are 3.3 feet from the edge line and are installed at a mounting height of
30 feet with spacing that varies between 103 and 200 feet.
However, there are two lamp posts which are shown without luminaires. The reason why there were
no luminaires on these lamp posts was not specified. The spacing between lamp posts is variable
and is sometimes greater than 6 times the mounting height. In some cases, the spacing is 224 feet
and 372 feet.
We then conducted calculations for illuminance and luminance for these two distinct cases. The first
case corresponds to what is currently in place: 9 lamp posts and 7 luminaires (2 lamp posts being
without luminaires). The second case corresponds to the scenario where one luminaire would be
added to each of the two lamp posts currently without one, bringing the total to 9 lamp posts and 9
luminaires.
“LED street lighting in the municipality of Saint-Gédéon-de-Beauce within the framework of advanced lighting technologies” 28 LTE-RT-2011-0076 Public distribution
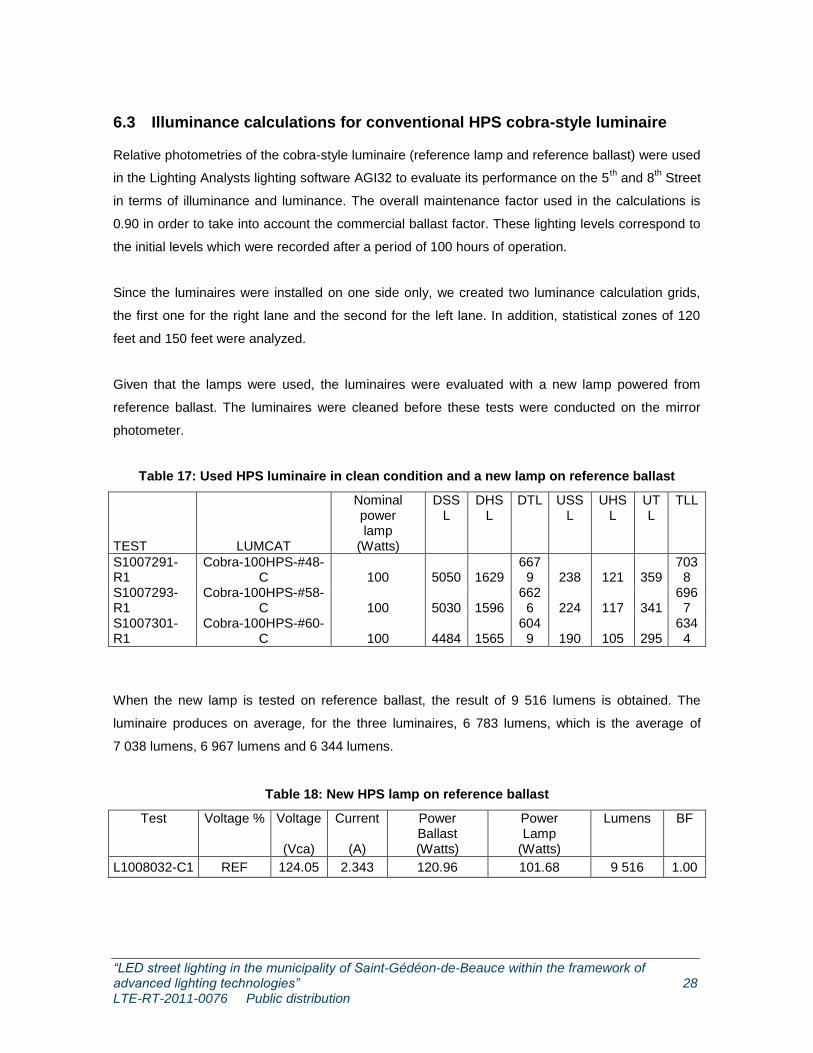
6.3 Illuminance calculations for conventional HPS cobra-style luminaire
Relative photometries of the cobra-style luminaire (reference lamp and reference ballast) were used
in the Lighting Analysts lighting software AGI32 to evaluate its performance on the 5th and 8
th Street
in terms of illuminance and luminance. The overall maintenance factor used in the calculations is
0.90 in order to take into account the commercial ballast factor. These lighting levels correspond to
the initial levels which were recorded after a period of 100 hours of operation.
Since the luminaires were installed on one side only, we created two luminance calculation grids,
the first one for the right lane and the second for the left lane. In addition, statistical zones of 120
feet and 150 feet were analyzed.
Given that the lamps were used, the luminaires were evaluated with a new lamp powered from
reference ballast. The luminaires were cleaned before these tests were conducted on the mirror
photometer.
Table 17: Used HPS luminaire in clean condition and a new lamp on reference ballast
TEST LUMCAT
Nominal power lamp
(Watts)
DSSL
DHSL
DTL USSL
UHSL
UTL
TLL
S1007291-R1
Cobra-100HPS-#48-C 100 5050 1629
6679 238 121 359
7038
S1007293-R1
Cobra-100HPS-#58-C 100 5030 1596
6626 224 117 341
6967
S1007301-R1
Cobra-100HPS-#60-C 100 4484 1565
6049 190 105 295
6344
When the new lamp is tested on reference ballast, the result of 9 516 lumens is obtained. The
luminaire produces on average, for the three luminaires, 6 783 lumens, which is the average of
7 038 lumens, 6 967 lumens and 6 344 lumens.
Table 18: New HPS lamp on reference ballast
Test Voltage % Voltage
(Vca)
Current
(A)
Power Ballast (Watts)
Power Lamp
(Watts)
Lumens BF
L1008032-C1 REF 124.05 2.343 120.96 101.68 9 516 1.00
“LED street lighting in the municipality of Saint-Gédéon-de-Beauce within the framework of advanced lighting technologies” 29 LTE-RT-2011-0076 Public distribution
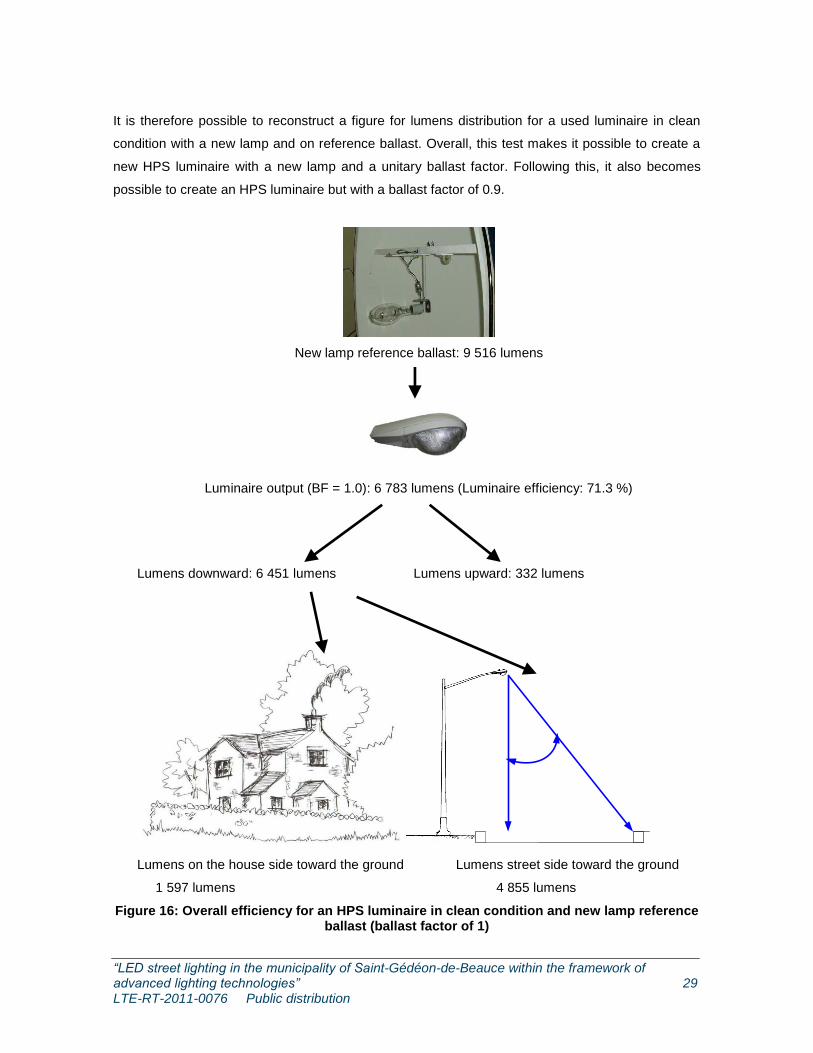
It is therefore possible to reconstruct a figure for lumens distribution for a used luminaire in clean
condition with a new lamp and on reference ballast. Overall, this test makes it possible to create a
new HPS luminaire with a new lamp and a unitary ballast factor. Following this, it also becomes
possible to create an HPS luminaire but with a ballast factor of 0.9.
New lamp reference ballast: 9 516 lumens
Luminaire output (BF = 1.0): 6 783 lumens (Luminaire efficiency: 71.3 %)
Lumens downward: 6 451 lumens Lumens upward: 332 lumens
Lumens on the house side toward the ground Lumens street side toward the ground
1 597 lumens 4 855 lumens
Figure 16: Overall efficiency for an HPS luminaire in clean condition and new lamp reference ballast (ballast factor of 1)
“LED street lighting in the municipality of Saint-Gédéon-de-Beauce within the framework of advanced lighting technologies” 30 LTE-RT-2011-0076 Public distribution
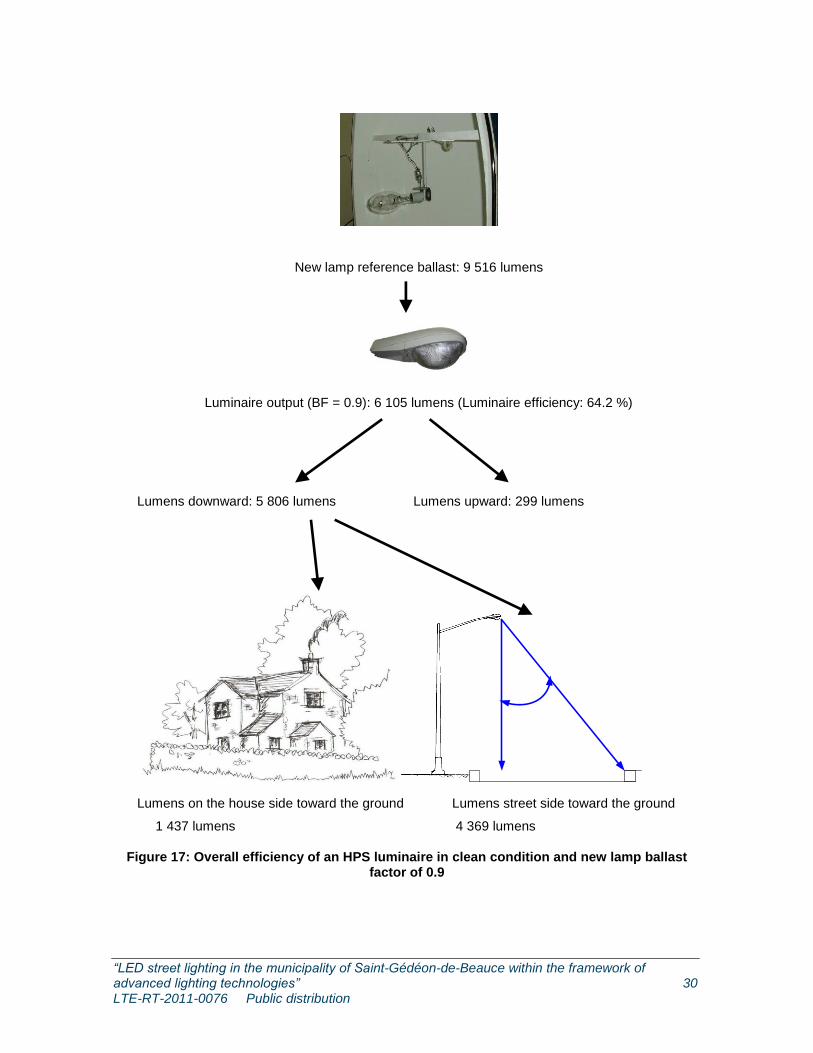
New lamp reference ballast: 9 516 lumens
Luminaire output (BF = 0.9): 6 105 lumens (Luminaire efficiency: 64.2 %)
Lumens downward: 5 806 lumens Lumens upward: 299 lumens
Lumens on the house side toward the ground Lumens street side toward the ground
1 437 lumens 4 369 lumens
Figure 17: Overall efficiency of an HPS luminaire in clean condition and new lamp ballast factor of 0.9
“LED street lighting in the municipality of Saint-Gédéon-de-Beauce within the framework of advanced lighting technologies” 31 LTE-RT-2011-0076 Public distribution
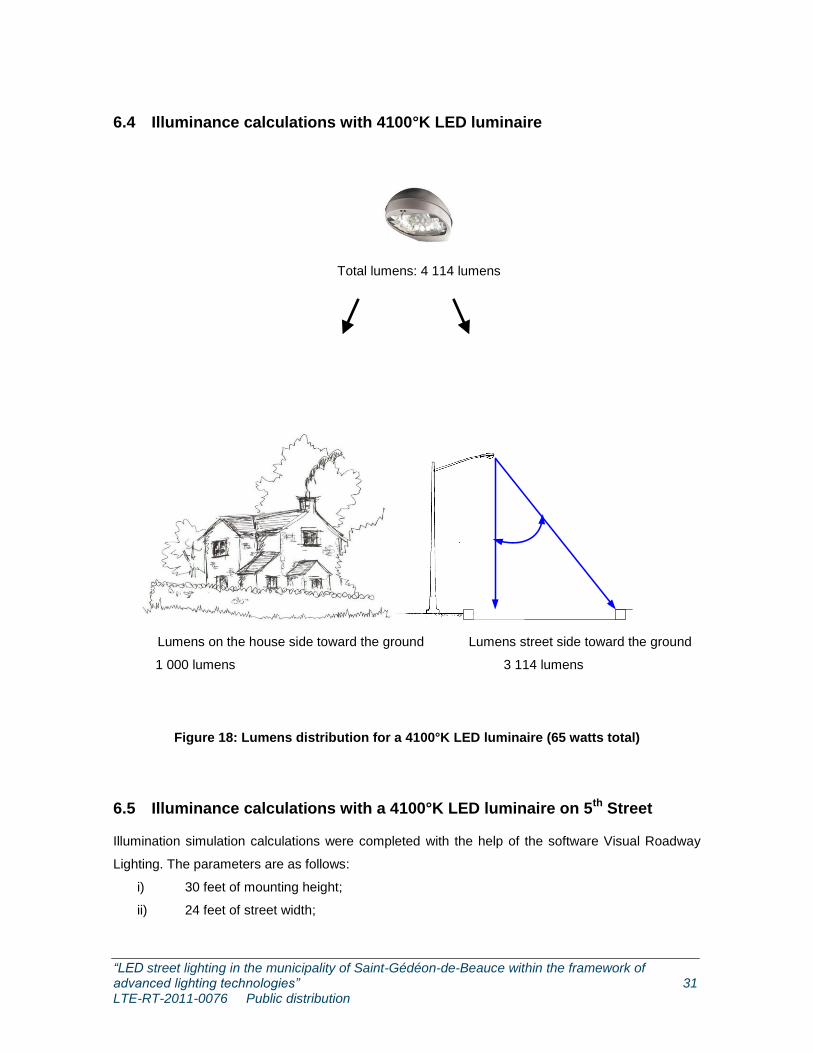
6.4 Illuminance calculations with 4100°K LED luminaire
Total lumens: 4 114 lumens
Lumens on the house side toward the ground Lumens street side toward the ground
1 000 lumens 3 114 lumens
Figure 18: Lumens distribution for a 4100°K LED luminaire (65 watts total)
6.5 Illuminance calculations with a 4100°K LED luminaire on 5th Street
Illumination simulation calculations were completed with the help of the software Visual Roadway
Lighting. The parameters are as follows:
i) 30 feet of mounting height;
ii) 24 feet of street width;
“LED street lighting in the municipality of Saint-Gédéon-de-Beauce within the framework of advanced lighting technologies” 32 LTE-RT-2011-0076 Public distribution
iii) 150 feet of spacing;
iv) The lamp post is 9.5 feet from the edge line. The cross-arm measures 8 feet and the
luminous centre 1.7 feet. Consequently, the span is 0.2 feet (9.7 -9.5 = 0.2 feet).
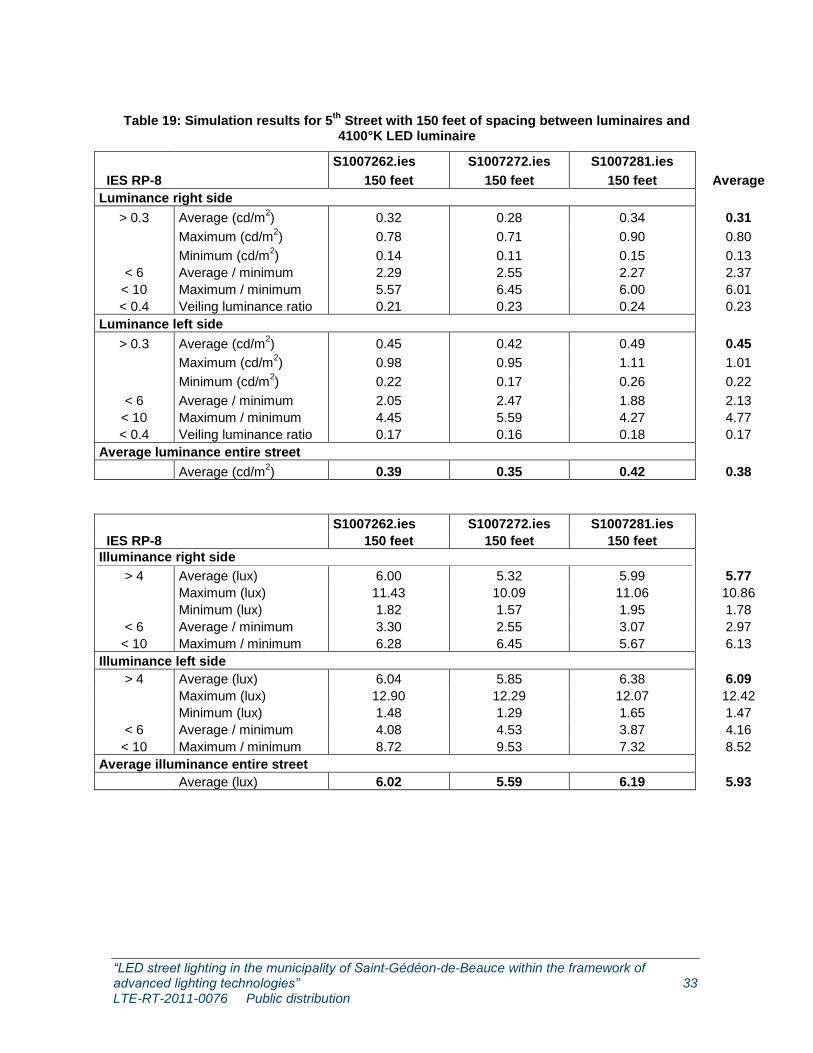
The following three photometric files were selected: S1007262, S1007272 and S100781. The
results are summarized in Table 19. It can be noted that on average for the three luminaires, the
average luminance for the right lane is 0.31 cd/m2 while for the left lane it is 0.45 cd/m
2. In this way,
the necessary minimum of 0.3 cd/m2 is surpassed.
Lastly, it is interesting to note that good uniformity was obtained, i.e. maximum over minimum ratios
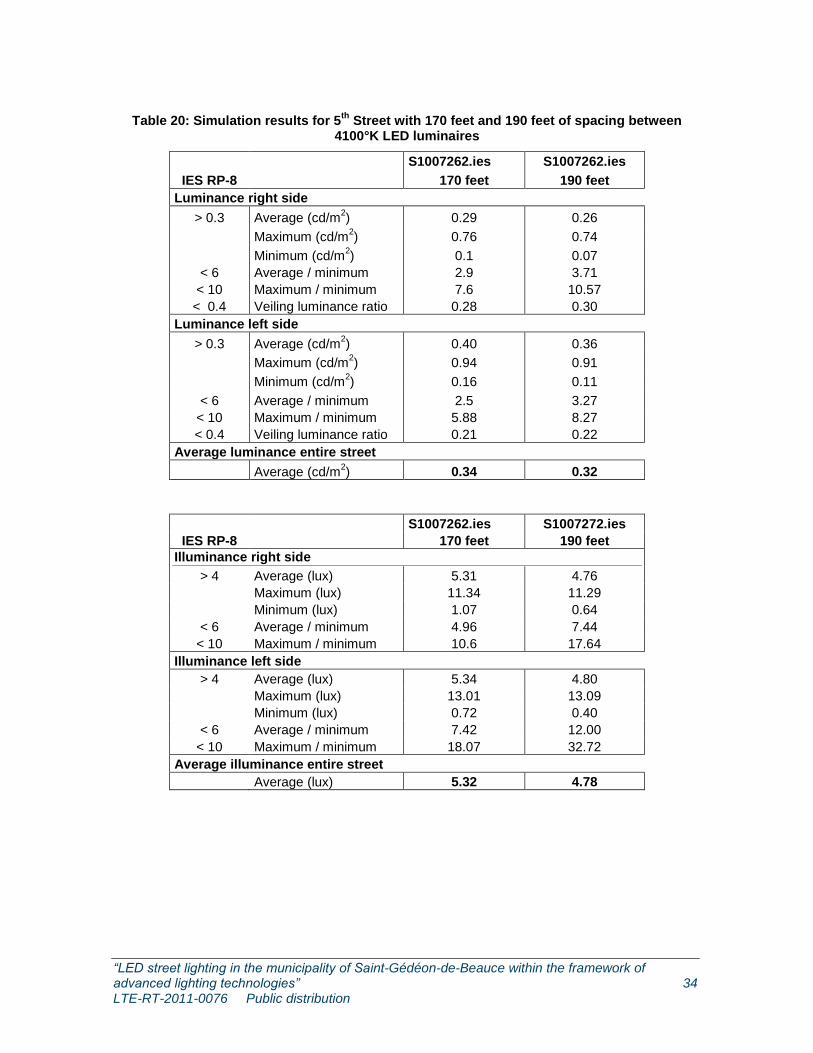
and also the average over minimum ratio with the LED luminaire. In Table 20, the spacing between
the poles was increased to 170 and 190 feet.
“LED street lighting in the municipality of Saint-Gédéon-de-Beauce within the framework of advanced lighting technologies” 33 LTE-RT-2011-0076 Public distribution
Table 19: Simulation results for 5th
Street with 150 feet of spacing between luminaires and 4100°K LED luminaire
S1007262.ies S1007272.ies S1007281.ies
IES RP-8 150 feet 150 feet 150 feet Average
Luminance right side
> 0.3 Average (cd/m2) 0.32 0.28 0.34 0.31
Maximum (cd/m2) 0.78 0.71 0.90 0.80
Minimum (cd/m2) 0.14 0.11 0.15 0.13
< 6 Average / minimum 2.29 2.55 2.27 2.37
< 10 Maximum / minimum 5.57 6.45 6.00 6.01
< 0.4 Veiling luminance ratio 0.21 0.23 0.24 0.23
Luminance left side
> 0.3 Average (cd/m2) 0.45 0.42 0.49 0.45
Maximum (cd/m2) 0.98 0.95 1.11 1.01
Minimum (cd/m2) 0.22 0.17 0.26 0.22
< 6 Average / minimum 2.05 2.47 1.88 2.13
< 10 Maximum / minimum 4.45 5.59 4.27 4.77
< 0.4 Veiling luminance ratio 0.17 0.16 0.18 0.17
Average luminance entire street
Average (cd/m2) 0.39 0.35 0.42 0.38
S1007262.ies S1007272.ies S1007281.ies
IES RP-8 150 feet 150 feet 150 feet
Illuminance right side
> 4 Average (lux) 6.00 5.32 5.99 5.77
Maximum (lux) 11.43 10.09 11.06 10.86
Minimum (lux) 1.82 1.57 1.95 1.78
< 6 Average / minimum 3.30 2.55 3.07 2.97
< 10 Maximum / minimum 6.28 6.45 5.67 6.13
Illuminance left side
> 4 Average (lux) 6.04 5.85 6.38 6.09
Maximum (lux) 12.90 12.29 12.07 12.42
Minimum (lux) 1.48 1.29 1.65 1.47
< 6 Average / minimum 4.08 4.53 3.87 4.16
< 10 Maximum / minimum 8.72 9.53 7.32 8.52
Average illuminance entire street
Average (lux) 6.02 5.59 6.19 5.93
“LED street lighting in the municipality of Saint-Gédéon-de-Beauce within the framework of advanced lighting technologies” 34 LTE-RT-2011-0076 Public distribution
Table 20: Simulation results for 5th
Street with 170 feet and 190 feet of spacing between 4100°K LED luminaires
S1007262.ies S1007262.ies
IES RP-8 170 feet 190 feet
Luminance right side
> 0.3 Average (cd/m2) 0.29 0.26
Maximum (cd/m2) 0.76 0.74
Minimum (cd/m2) 0.1 0.07
< 6 Average / minimum 2.9 3.71
< 10 Maximum / minimum 7.6 10.57
< 0.4 Veiling luminance ratio 0.28 0.30
Luminance left side
> 0.3 Average (cd/m2) 0.40 0.36
Maximum (cd/m2) 0.94 0.91
Minimum (cd/m2) 0.16 0.11
< 6 Average / minimum 2.5 3.27
< 10 Maximum / minimum 5.88 8.27
< 0.4 Veiling luminance ratio 0.21 0.22
Average luminance entire street
Average (cd/m2) 0.34 0.32
S1007262.ies S1007272.ies
IES RP-8 170 feet 190 feet
Illuminance right side
> 4 Average (lux) 5.31 4.76
Maximum (lux) 11.34 11.29
Minimum (lux) 1.07 0.64
< 6 Average / minimum 4.96 7.44
< 10 Maximum / minimum 10.6 17.64
Illuminance left side
> 4 Average (lux) 5.34 4.80
Maximum (lux) 13.01 13.09
Minimum (lux) 0.72 0.40
< 6 Average / minimum 7.42 12.00
< 10 Maximum / minimum 18.07 32.72
Average illuminance entire street
Average (lux) 5.32 4.78
“LED street lighting in the municipality of Saint-Gédéon-de-Beauce within the framework of advanced lighting technologies” 35 LTE-RT-2011-0076 Public distribution
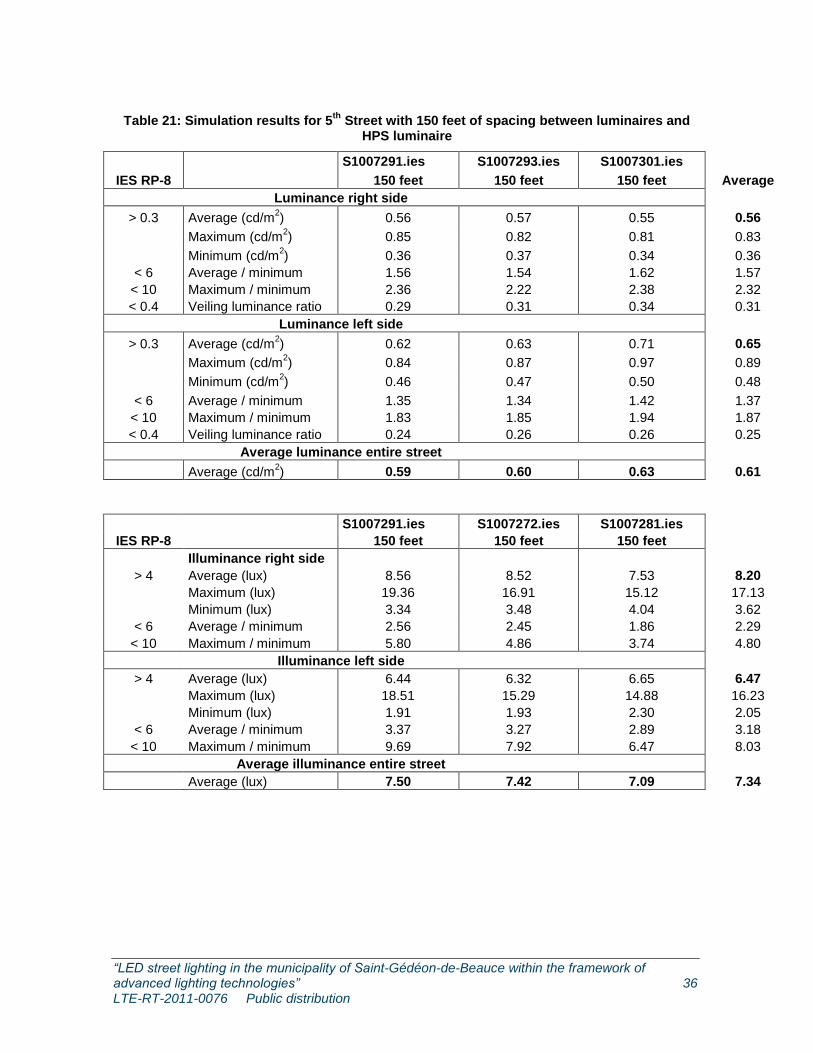
6.6 Illuminance calculations with HPS luminaire on 5th Street
Illuminance simulation calculations were completed using the software Visual Roadway Lighting.
The parameters were as follows:
v) 30 feet of mounting height;
vi) 24 feet of street width;
vii) 150 feet of spacing;
viii) The lamp post is 9.5 feet from the edge line. The cross-arm is 8 feet and the luminous
centre is 1.7 feet. Consequently, the span is 0.2 feet (9.7 -9.5 = 0.2 feet).
The following three photometric files were selected: S1007291, S1007293 and S1007301. It can be
noted that the levels of luminance and illuminance are showing higher than those obtained with
LED technology. However, the light source needlessly produces too much luminance for a street of
residential type and with low traffic. LED technology is proving to be of interest as it reduces the
required levels but still succeeds to reach an adequate level of uniformity.
“LED street lighting in the municipality of Saint-Gédéon-de-Beauce within the framework of advanced lighting technologies” 36 LTE-RT-2011-0076 Public distribution
Table 21: Simulation results for 5th
Street with 150 feet of spacing between luminaires and HPS luminaire
S1007291.ies S1007293.ies S1007301.ies
IES RP-8 150 feet 150 feet 150 feet Average
Luminance right side
> 0.3 Average (cd/m2) 0.56 0.57 0.55 0.56
Maximum (cd/m2) 0.85 0.82 0.81 0.83
Minimum (cd/m2) 0.36 0.37 0.34 0.36
< 6 Average / minimum 1.56 1.54 1.62 1.57
< 10 Maximum / minimum 2.36 2.22 2.38 2.32
< 0.4 Veiling luminance ratio 0.29 0.31 0.34 0.31
Luminance left side
> 0.3 Average (cd/m2) 0.62 0.63 0.71 0.65
Maximum (cd/m2) 0.84 0.87 0.97 0.89
Minimum (cd/m2) 0.46 0.47 0.50 0.48
< 6 Average / minimum 1.35 1.34 1.42 1.37
< 10 Maximum / minimum 1.83 1.85 1.94 1.87
< 0.4 Veiling luminance ratio 0.24 0.26 0.26 0.25
Average luminance entire street
Average (cd/m2) 0.59 0.60 0.63 0.61
S1007291.ies S1007272.ies S1007281.ies
IES RP-8 150 feet 150 feet 150 feet
Illuminance right side
> 4 Average (lux) 8.56 8.52 7.53 8.20
Maximum (lux) 19.36 16.91 15.12 17.13
Minimum (lux) 3.34 3.48 4.04 3.62
< 6 Average / minimum 2.56 2.45 1.86 2.29
< 10 Maximum / minimum 5.80 4.86 3.74 4.80
Illuminance left side
> 4 Average (lux) 6.44 6.32 6.65 6.47
Maximum (lux) 18.51 15.29 14.88 16.23
Minimum (lux) 1.91 1.93 2.30 2.05
< 6 Average / minimum 3.37 3.27 2.89 3.18
< 10 Maximum / minimum 9.69 7.92 6.47 8.03
Average illuminance entire street
Average (lux) 7.50 7.42 7.09 7.34
“LED street lighting in the municipality of Saint-Gédéon-de-Beauce within the framework of advanced lighting technologies” 37 LTE-RT-2011-0076 Public distribution
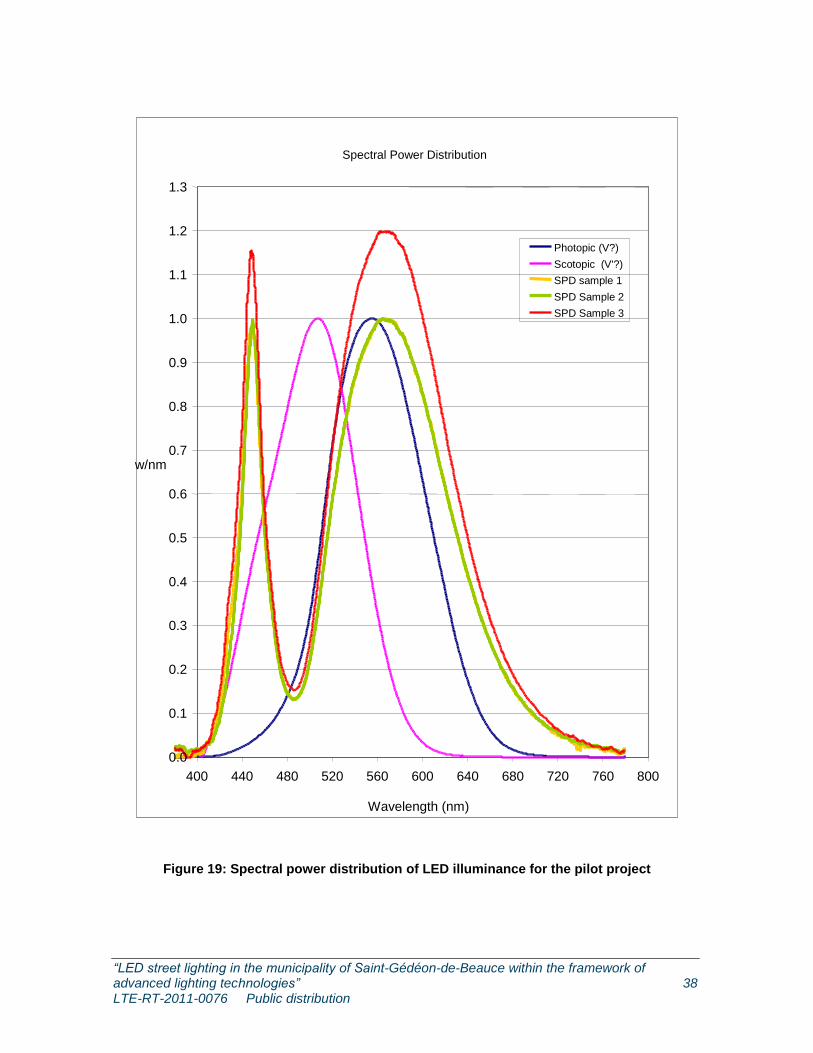
7. Mesopic correction for LED luminaire
Photometry is a measurement of emitted radiant energy weighted by the sensitivity of the human
eye. At photopic levels, the levels of luminous efficacy are weighted by the function V(λ); however,
at night vision, scotopic correction V’(λ) is applied. For mesopic region, illuminance levels are
between 0.001 cd/m2 and 10 cd/m
2, that is, between day vision and night vision.
According to the University of Helsinki, V(λ) correction currently used to evaluate the quantity of
lumens is only applied to conditions for which function V(λ) was obtained:
“It is acknowledged in CIE publication N° 41 (Light as a true visual quantity: principles of measurement, 1978) that: “Since the luminous efficiency function of the human eye is known to vary with a wide variety of viewing conditions, the assessment of radiant power can give accurate values only when the measured light corresponds to conditions under which V(λ) was obtained”.
Where do we need mesopic photometry?
The most relevant mesopic lighting applications are street and road lighting and other outdoor lighting.”
The International Commission on Illumination set up a technical committee CIE TC 1-58 58 “Visual
Performance in the Mesopic Range,” which was involved in MOVE - Mesopic Optimisation of Visual
Efficiency. In September 2010, the CIE published the committee’s work on a photometry system
based on mesopic photometry.5
In North America, the ASSIST model outlines mesopic correction. LED luminaires were evaluated
by taking into account both scotopic correction and photopic correction for three 4100°K samples,
the tests L1007284-C1, L1007273-C1 and L1007263-C1.
5 Recommended System for Mesopic Photometry Based on Visual Performance, International Commission on
Illumination / 01-Sep-2010 / 81 pages ISBN: 9783901906886
“LED street lighting in the municipality of Saint-Gédéon-de-Beauce within the framework of advanced lighting technologies” 38 LTE-RT-2011-0076 Public distribution
Figure 19: Spectral power distribution of LED illuminance for the pilot project
Spectral Power Distribution
0.0
0.1
0.2
0.3
0.4
0.5
0.6
0.7
0.8
0.9
1.0
1.1
1.2
1.3
400 440 480 520 560 600 640 680 720 760 800
Wavelength (nm)
w/nm
Photopic (V?)
Scotopic (V'?)
SPD sample 1
SPD Sample 2
SPD Sample 3
“LED street lighting in the municipality of Saint-Gédéon-de-Beauce within the framework of advanced lighting technologies” 39 LTE-RT-2011-0076 Public distribution
The following equation represents luminous flux in lumens for day vision:
nm
nmdPV
780
380)()(686
where:
P(λ) spectral power density in W/nm
V(λ) photopic correction for day vision
ø luminous flux in lumens for day vision
The following equation represents luminous flux in lumens for night vision:
nm
nmdPV
780
380)()('1699
where:
P(λ) spectral power density in W/nm
V’(λ) scotopic correction for night vision
ø luminous flux in lumens for night vision
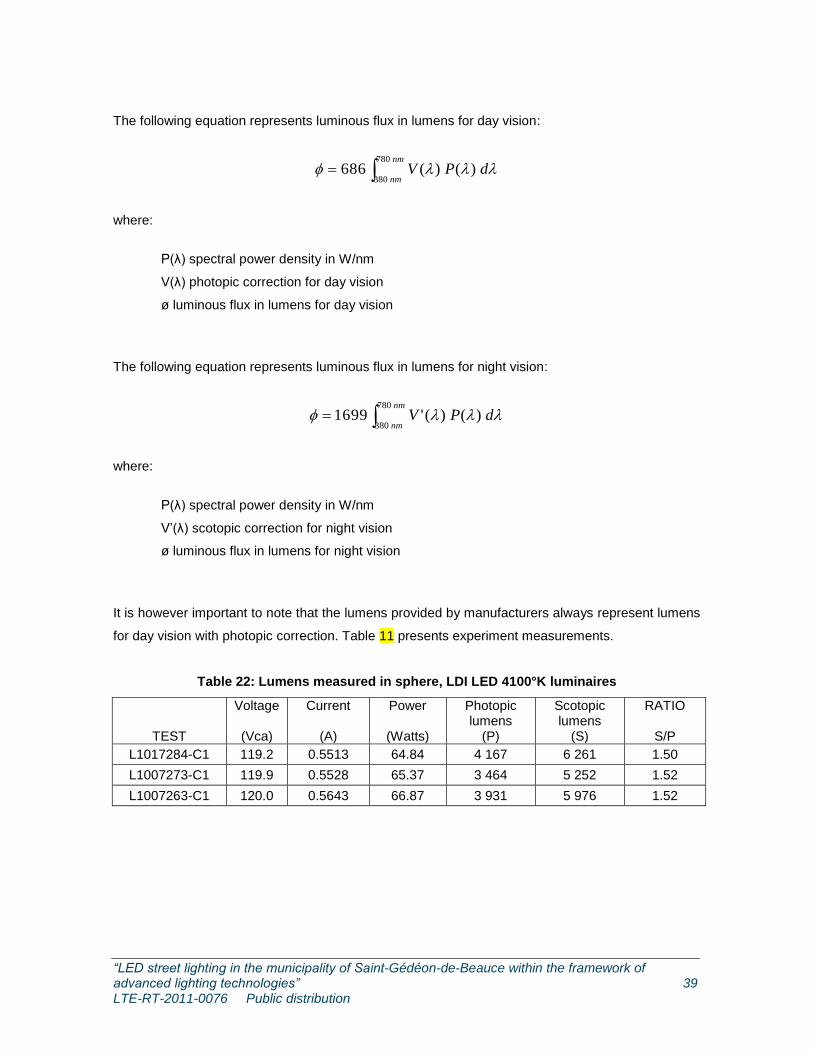
It is however important to note that the lumens provided by manufacturers always represent lumens
for day vision with photopic correction. Table 11 presents experiment measurements.
Table 22: Lumens measured in sphere, LDI LED 4100°K luminaires
TEST
Voltage
(Vca)
Current
(A)
Power
(Watts)
Photopic lumens
(P)
Scotopic lumens
(S)
RATIO
S/P
L1017284-C1 119.2 0.5513 64.84 4 167 6 261 1.50
L1007273-C1 119.9 0.5528 65.37 3 464 5 252 1.52
L1007263-C1 120.0 0.5643 66.87 3 931 5 976 1.52
“LED street lighting in the municipality of Saint-Gédéon-de-Beauce within the framework of advanced lighting technologies” 40 LTE-RT-2011-0076 Public distribution
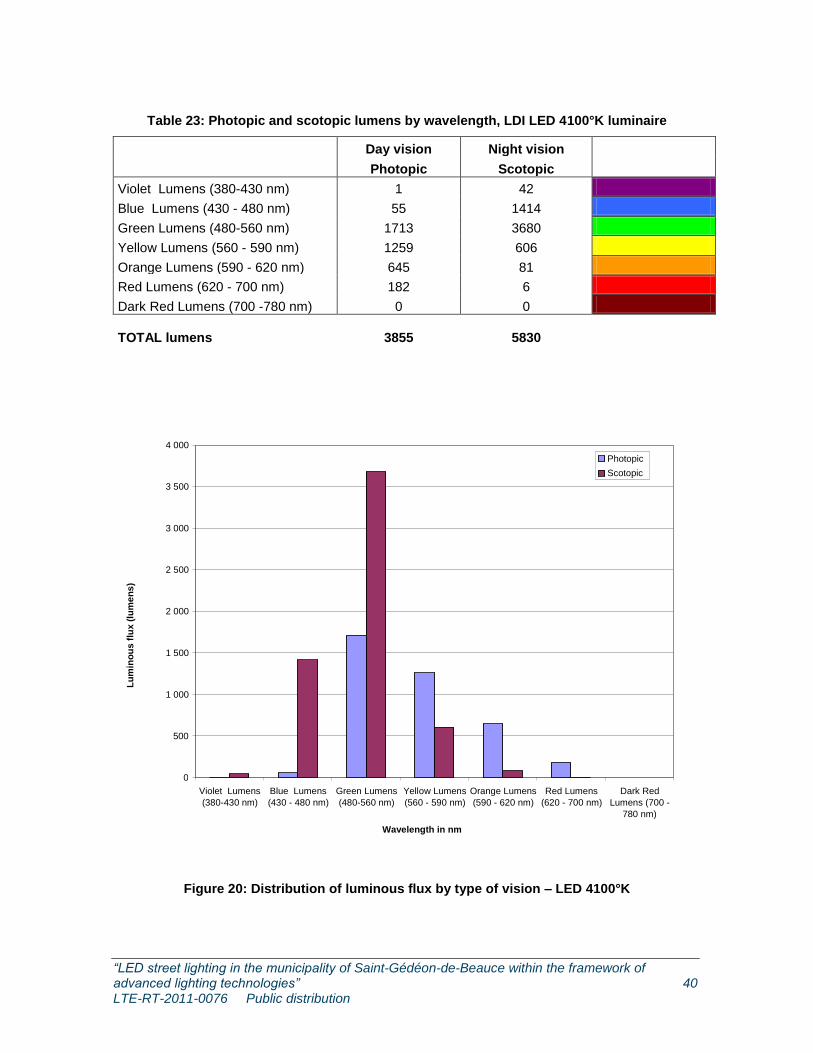
Table 23: Photopic and scotopic lumens by wavelength, LDI LED 4100°K luminaire
Day vision Night vision
Photopic Scotopic
Violet Lumens (380-430 nm) 1 42
Blue Lumens (430 - 480 nm) 55 1414
Green Lumens (480-560 nm) 1713 3680
Yellow Lumens (560 - 590 nm) 1259 606
Orange Lumens (590 - 620 nm) 645 81
Red Lumens (620 - 700 nm) 182 6
Dark Red Lumens (700 -780 nm) 0 0 TOTAL lumens 3855 5830
Figure 20: Distribution of luminous flux by type of vision – LED 4100°K
0
500
1 000
1 500
2 000
2 500
3 000
3 500
4 000
Violet Lumens (380-430 nm)
Blue Lumens (430 - 480 nm)
Green Lumens (480-560 nm)
Yellow Lumens (560 - 590 nm)
Orange Lumens (590 - 620 nm)
Red Lumens (620 - 700 nm)
Dark Red Lumens (700 -
780 nm) Wavelength in nm
Photopic Scotopic
Lu
min
ou
s f
lux (
lum
en
s)
“LED street lighting in the municipality of Saint-Gédéon-de-Beauce within the framework of advanced lighting technologies” 41 LTE-RT-2011-0076 Public distribution
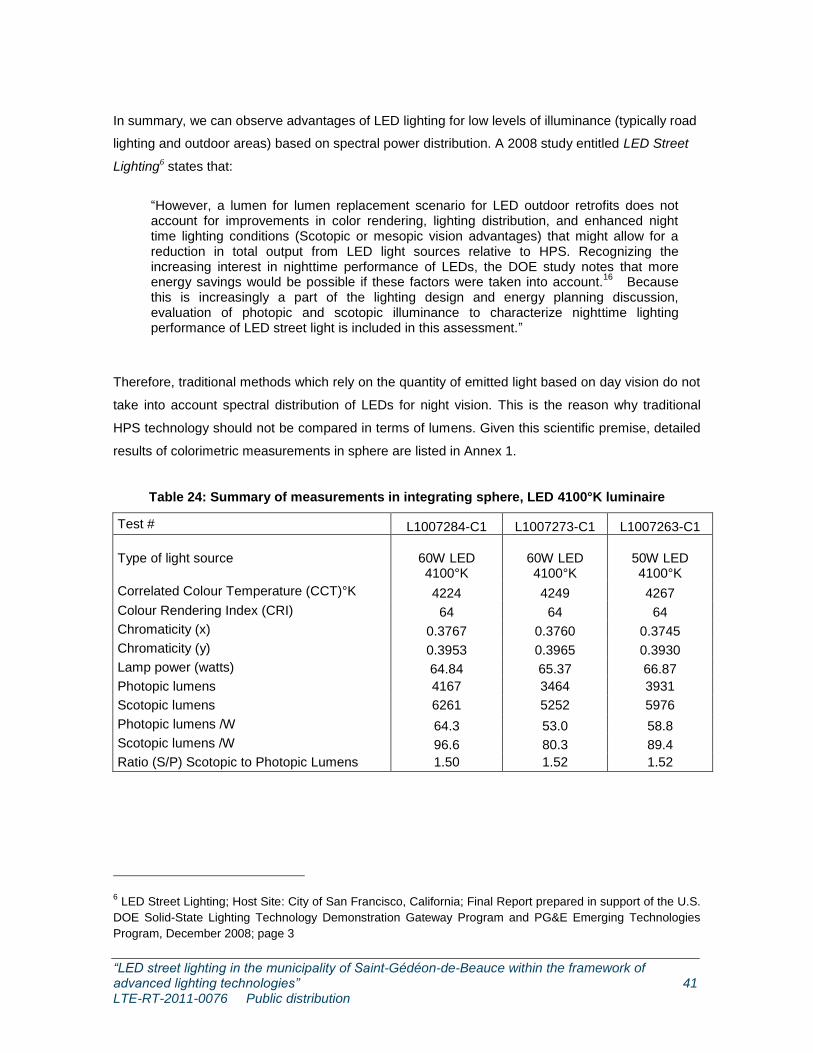
In summary, we can observe advantages of LED lighting for low levels of illuminance (typically road
lighting and outdoor areas) based on spectral power distribution. A 2008 study entitled LED Street
Lighting6 states that:
“However, a lumen for lumen replacement scenario for LED outdoor retrofits does not account for improvements in color rendering, lighting distribution, and enhanced night time lighting conditions (Scotopic or mesopic vision advantages) that might allow for a reduction in total output from LED light sources relative to HPS. Recognizing the increasing interest in nighttime performance of LEDs, the DOE study notes that more energy savings would be possible if these factors were taken into account.
16 Because
this is increasingly a part of the lighting design and energy planning discussion, evaluation of photopic and scotopic illuminance to characterize nighttime lighting performance of LED street light is included in this assessment.”
Therefore, traditional methods which rely on the quantity of emitted light based on day vision do not
take into account spectral distribution of LEDs for night vision. This is the reason why traditional
HPS technology should not be compared in terms of lumens. Given this scientific premise, detailed
results of colorimetric measurements in sphere are listed in Annex 1.
Table 24: Summary of measurements in integrating sphere, LED 4100°K luminaire
Test # L1007284-C1 L1007273-C1 L1007263-C1
Type of light source
60W LED 4100°K
60W LED 4100°K
50W LED 4100°K
Correlated Colour Temperature (CCT)°K 4224 4249 4267
Colour Rendering Index (CRI) 64 64 64
Chromaticity (x) 0.3767 0.3760 0.3745
Chromaticity (y) 0.3953 0.3965 0.3930
Lamp power (watts) 64.84 65.37 66.87
Photopic lumens 4167 3464 3931
Scotopic lumens 6261 5252 5976
Photopic lumens /W 64.3 53.0 58.8
Scotopic lumens /W 96.6 80.3 89.4
Ratio (S/P) Scotopic to Photopic Lumens 1.50 1.52 1.52
6 LED Street Lighting; Host Site: City of San Francisco, California; Final Report prepared in support of the U.S.
DOE Solid-State Lighting Technology Demonstration Gateway Program and PG&E Emerging Technologies
Program, December 2008; page 3
“LED street lighting in the municipality of Saint-Gédéon-de-Beauce within the framework of advanced lighting technologies” 42 LTE-RT-2011-0076 Public distribution
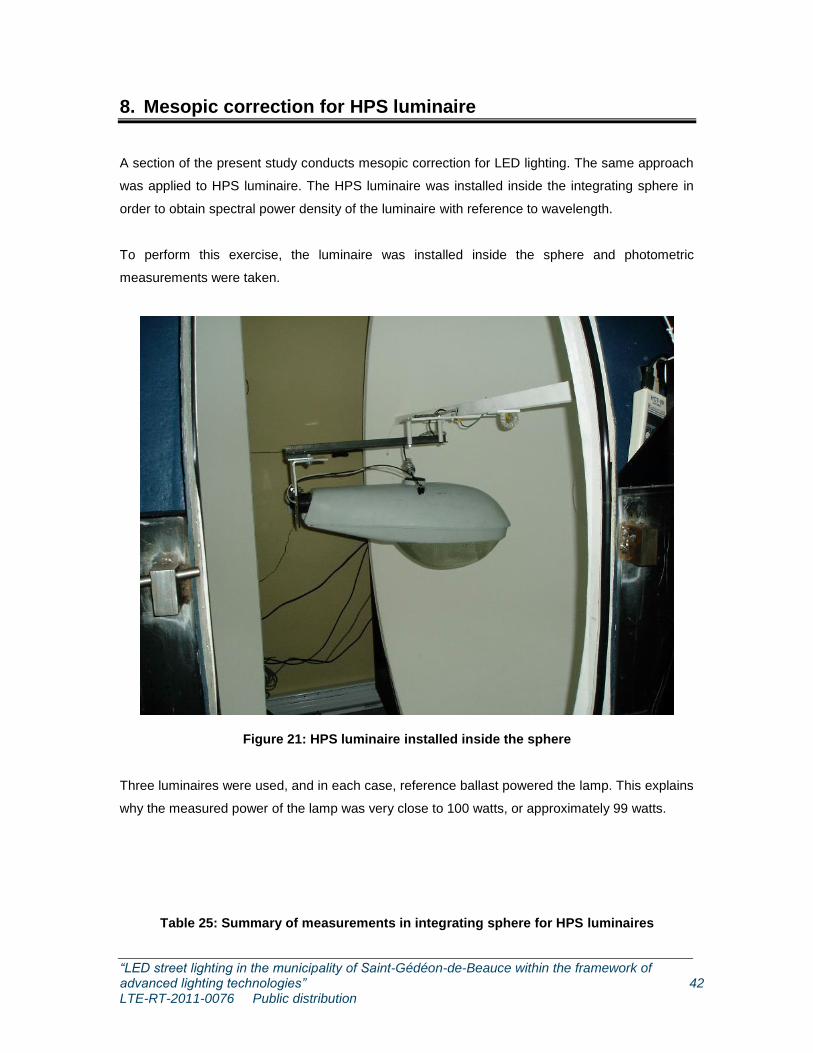
8. Mesopic correction for HPS luminaire
A section of the present study conducts mesopic correction for LED lighting. The same approach
was applied to HPS luminaire. The HPS luminaire was installed inside the integrating sphere in
order to obtain spectral power density of the luminaire with reference to wavelength.
To perform this exercise, the luminaire was installed inside the sphere and photometric
measurements were taken.
Figure 21: HPS luminaire installed inside the sphere
Three luminaires were used, and in each case, reference ballast powered the lamp. This explains
why the measured power of the lamp was very close to 100 watts, or approximately 99 watts.
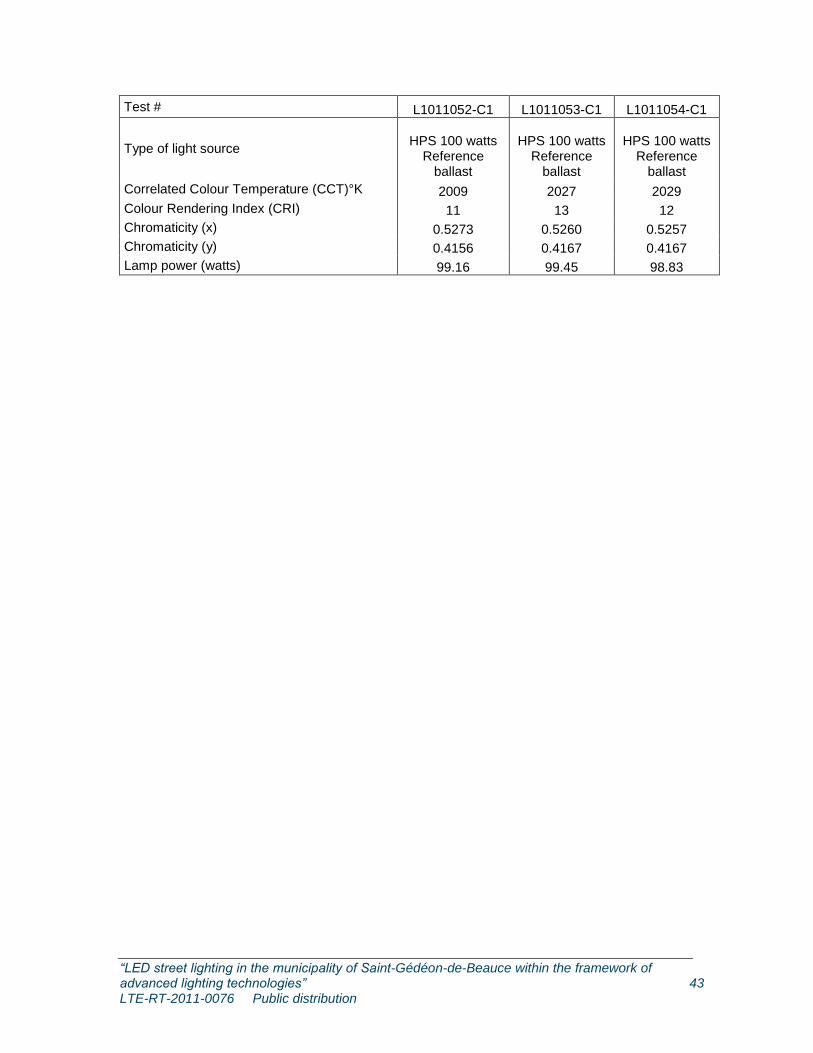
Table 25: Summary of measurements in integrating sphere for HPS luminaires
“LED street lighting in the municipality of Saint-Gédéon-de-Beauce within the framework of advanced lighting technologies” 43 LTE-RT-2011-0076 Public distribution
Test # L1011052-C1 L1011053-C1 L1011054-C1
Type of light source
HPS 100 watts
Reference ballast
HPS 100 watts Reference
ballast
HPS 100 watts Reference
ballast
Correlated Colour Temperature (CCT)°K 2009 2027 2029
Colour Rendering Index (CRI) 11 13 12
Chromaticity (x) 0.5273 0.5260 0.5257
Chromaticity (y) 0.4156 0.4167 0.4167
Lamp power (watts) 99.16 99.45 98.83
“LED street lighting in the municipality of Saint-Gédéon-de-Beauce within the framework of advanced lighting technologies” 44 LTE-RT-2011-0076 Public distribution
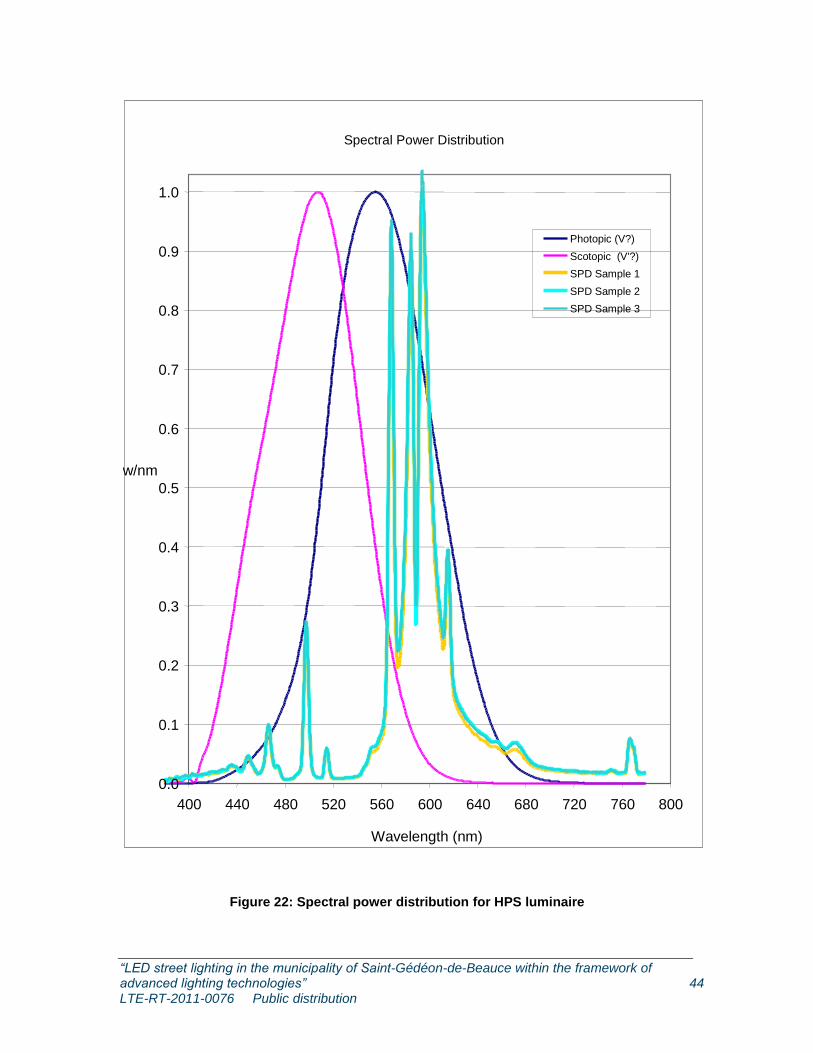
Figure 22: Spectral power distribution for HPS luminaire
Spectral Power Distribution
0.0
0.1
0.2
0.3
0.4
0.5
0.6
0.7
0.8
0.9
1.0
400 440 480 520 560 600 640 680 720 760 800
Wavelength (nm)
w/nm
Photopic (V?)
Scotopic (V'?)
SPD Sample 1
SPD Sample 2
SPD Sample 3
“LED street lighting in the municipality of Saint-Gédéon-de-Beauce within the framework of advanced lighting technologies” 45 LTE-RT-2011-0076 Public distribution
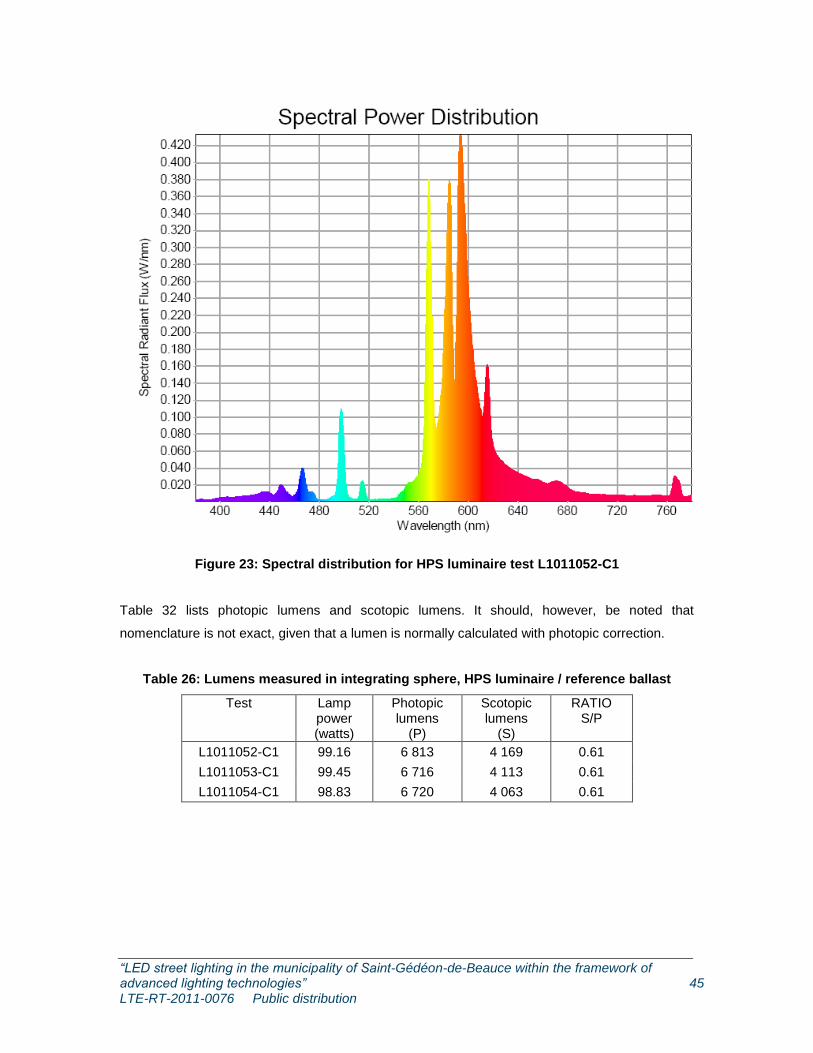
Figure 23: Spectral distribution for HPS luminaire test L1011052-C1
Table 32 lists photopic lumens and scotopic lumens. It should, however, be noted that
nomenclature is not exact, given that a lumen is normally calculated with photopic correction.
Table 26: Lumens measured in integrating sphere, HPS luminaire / reference ballast
Test Lamp power (watts)
Photopic lumens
(P)
Scotopic lumens
(S)
RATIO S/P
L1011052-C1 99.16 6 813 4 169 0.61
L1011053-C1 99.45 6 716 4 113 0.61
L1011054-C1 98.83 6 720 4 063 0.61
“LED street lighting in the municipality of Saint-Gédéon-de-Beauce within the framework of advanced lighting technologies” 46 LTE-RT-2011-0076 Public distribution
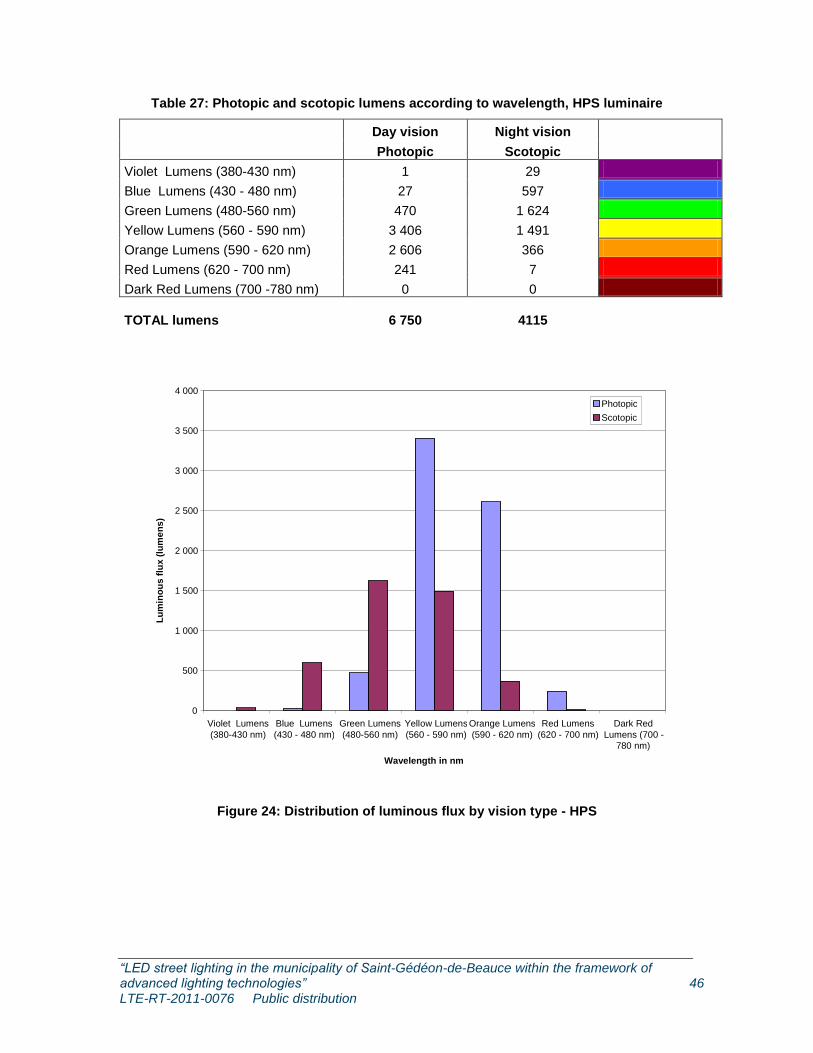
Table 27: Photopic and scotopic lumens according to wavelength, HPS luminaire
Day vision Night vision
Photopic Scotopic
Violet Lumens (380-430 nm) 1 29
Blue Lumens (430 - 480 nm) 27 597
Green Lumens (480-560 nm) 470 1 624
Yellow Lumens (560 - 590 nm) 3 406 1 491
Orange Lumens (590 - 620 nm) 2 606 366
Red Lumens (620 - 700 nm) 241 7
Dark Red Lumens (700 -780 nm) 0 0
TOTAL lumens 6 750 4115
Figure 24: Distribution of luminous flux by vision type - HPS
0
500
1 000
1 500
2 000
2 500
3 000
3 500
4 000
Violet Lumens (380-430 nm)
Blue Lumens (430 - 480 nm)
Green Lumens (480-560 nm)
Yellow Lumens (560 - 590 nm)
Orange Lumens (590 - 620 nm)
Red Lumens (620 - 700 nm)
Dark Red Lumens (700 -
780 nm) Wavelength in nm
Photopic Scotopic
Lu
min
ou
s f
lux (
lum
en
s)
“LED street lighting in the municipality of Saint-Gédéon-de-Beauce within the framework of advanced lighting technologies” 47 LTE-RT-2011-0076 Public distribution
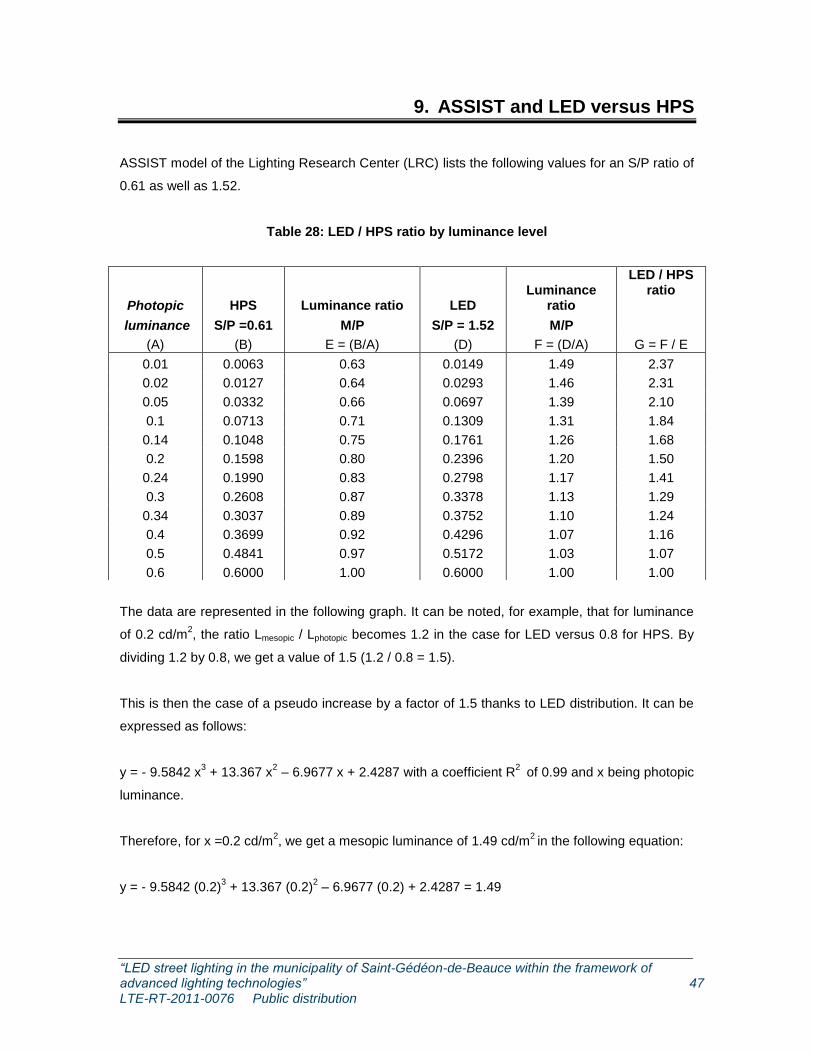
9. ASSIST and LED versus HPS
ASSIST model of the Lighting Research Center (LRC) lists the following values for an S/P ratio of
0.61 as well as 1.52.
Table 28: LED / HPS ratio by luminance level
The data are represented in the following graph. It can be noted, for example, that for luminance
of 0.2 cd/m2, the ratio Lmesopic / Lphotopic becomes 1.2 in the case for LED versus 0.8 for HPS. By
dividing 1.2 by 0.8, we get a value of 1.5 (1.2 / 0.8 = 1.5).
This is then the case of a pseudo increase by a factor of 1.5 thanks to LED distribution. It can be
expressed as follows:
y = - 9.5842 x3 + 13.367 x
2 – 6.9677 x + 2.4287 with a coefficient R
2 of 0.99 and x being photopic
luminance.
Therefore, for x =0.2 cd/m2, we get a mesopic luminance of 1.49 cd/m
2 in the following equation:
y = - 9.5842 (0.2)3 + 13.367 (0.2)
2 – 6.9677 (0.2) + 2.4287 = 1.49
Photopic HPS Luminance ratio LED Luminance
ratio
LED / HPS ratio
luminance S/P =0.61 M/P S/P = 1.52 M/P
(A) (B) E = (B/A) (D) F = (D/A) G = F / E
0.01 0.0063 0.63 0.0149 1.49 2.37
0.02 0.0127 0.64 0.0293 1.46 2.31
0.05 0.0332 0.66 0.0697 1.39 2.10
0.1 0.0713 0.71 0.1309 1.31 1.84
0.14 0.1048 0.75 0.1761 1.26 1.68
0.2 0.1598 0.80 0.2396 1.20 1.50
0.24 0.1990 0.83 0.2798 1.17 1.41
0.3 0.2608 0.87 0.3378 1.13 1.29
0.34 0.3037 0.89 0.3752 1.10 1.24
0.4 0.3699 0.92 0.4296 1.07 1.16
0.5 0.4841 0.97 0.5172 1.03 1.07
0.6 0.6000 1.00 0.6000 1.00 1.00
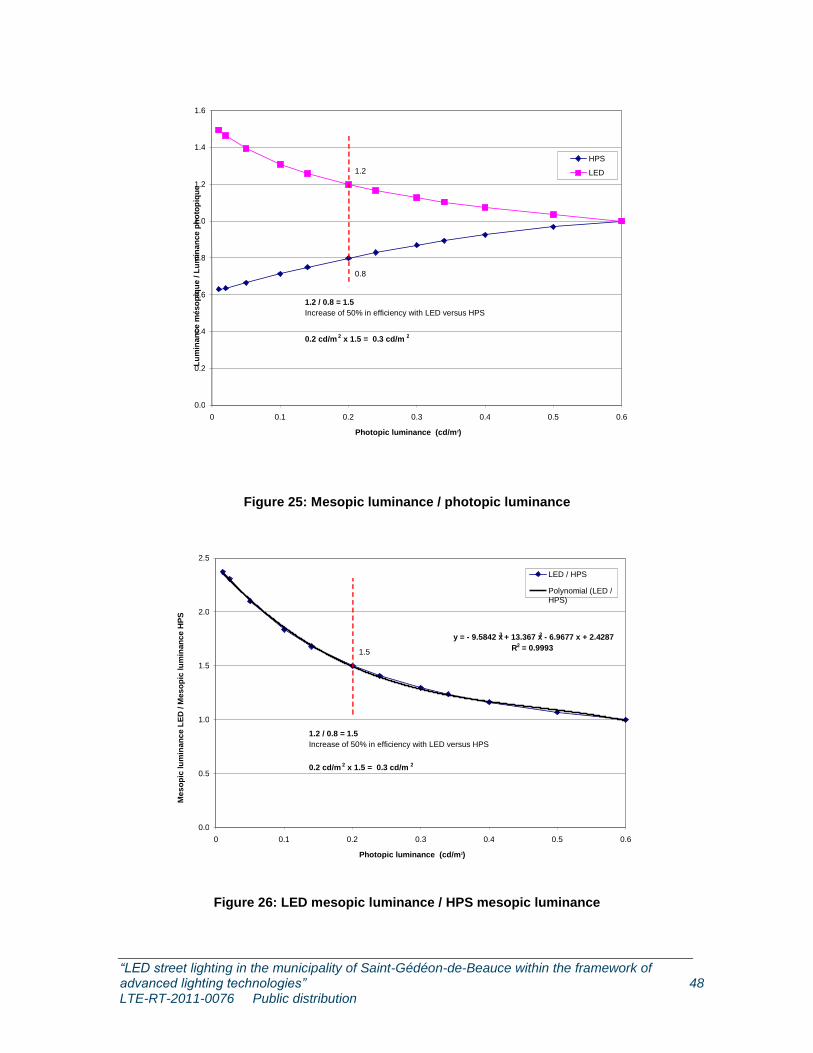
“LED street lighting in the municipality of Saint-Gédéon-de-Beauce within the framework of advanced lighting technologies” 48 LTE-RT-2011-0076 Public distribution
Figure 25: Mesopic luminance / photopic luminance
Figure 26: LED mesopic luminance / HPS mesopic luminance
y = - 9.5842 x 3 + 13.367 x 2 - 6.9677 x + 2.4287 R 2 = 0.9993
0.0
0.5
1.0
1.5
2.0
2.5
0 0.1 0.2 0.3 0.4 0.5 0.6 Photopic luminance (cd/m2)
Me
so
pic
lu
min
an
ce
LE
D / M
es
op
ic lu
min
an
ce
HP
S
LED / HPS
Polynomial (LED / HPS)
1.5
1.2 / 0.8 = 1.5 Increase of 50% in efficiency with LED versus HPS
0.2 cd/m 2 x 1.5 = 0.3 cd/m 2
0.0
0.2
0.4
0.6
0.8
1.0
1.2
1.4
1.6
0 0.1 0.2 0.3 0.4 0.5 0.6 Photopic luminance (cd/m2)
HPS LED 1.2
0.8
1.2 / 0.8 = 1.5 Increase of 50% in efficiency with LED versus HPS
0.2 cd/m 2 x 1.5 = 0.3 cd/m 2
Lu
min
an
ce
mé
so
piq
ue
/ L
um
ina
nce
ph
oto
piq
ue
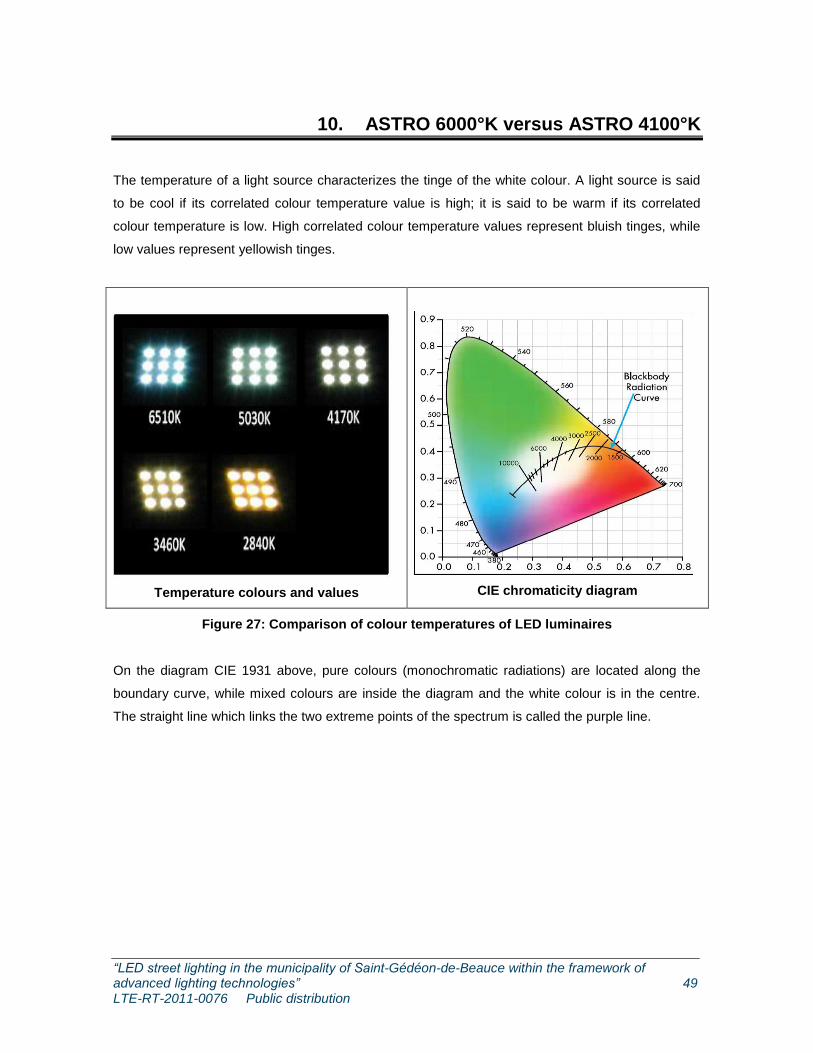
“LED street lighting in the municipality of Saint-Gédéon-de-Beauce within the framework of advanced lighting technologies” 49 LTE-RT-2011-0076 Public distribution
10. ASTRO 6000°K versus ASTRO 4100°K
The temperature of a light source characterizes the tinge of the white colour. A light source is said
to be cool if its correlated colour temperature value is high; it is said to be warm if its correlated
colour temperature is low. High correlated colour temperature values represent bluish tinges, while
low values represent yellowish tinges.
Temperature colours and values
CIE chromaticity diagram
Figure 27: Comparison of colour temperatures of LED luminaires
On the diagram CIE 1931 above, pure colours (monochromatic radiations) are located along the
boundary curve, while mixed colours are inside the diagram and the white colour is in the centre.
The straight line which links the two extreme points of the spectrum is called the purple line.

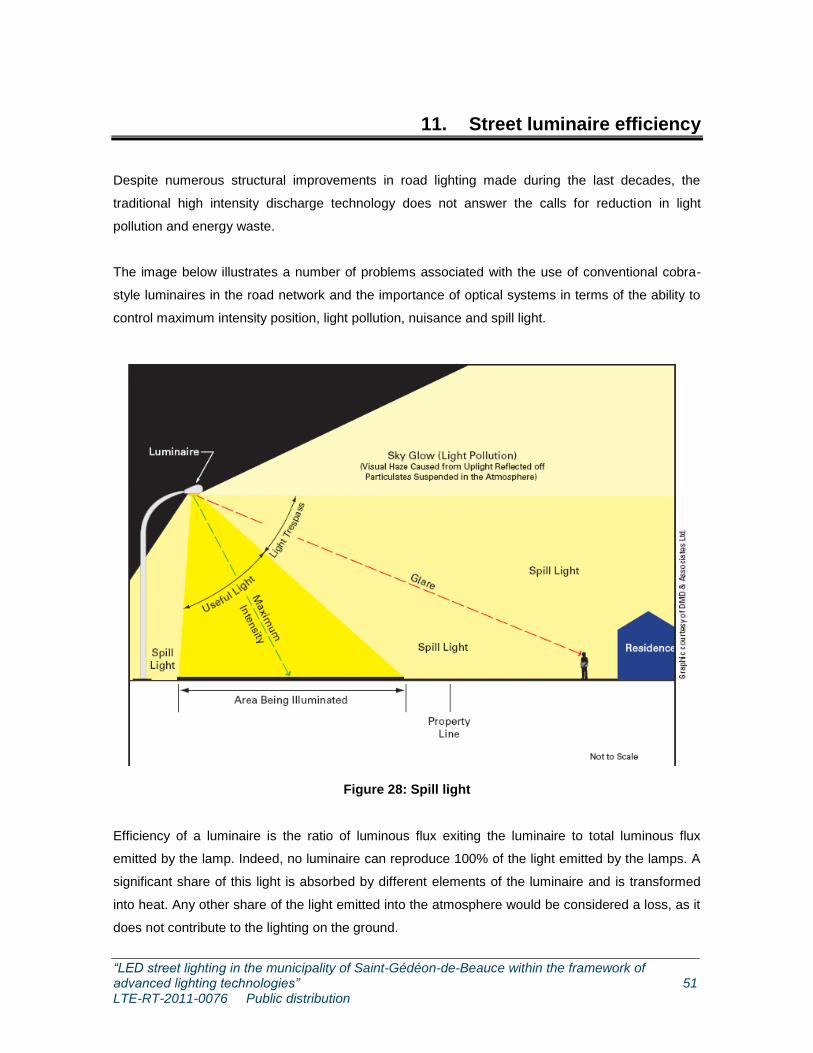
“LED street lighting in the municipality of Saint-Gédéon-de-Beauce within the framework of advanced lighting technologies” 51 LTE-RT-2011-0076 Public distribution
11. Street luminaire efficiency
Despite numerous structural improvements in road lighting made during the last decades, the
traditional high intensity discharge technology does not answer the calls for reduction in light
pollution and energy waste.
The image below illustrates a number of problems associated with the use of conventional cobra-
style luminaires in the road network and the importance of optical systems in terms of the ability to
control maximum intensity position, light pollution, nuisance and spill light.
Figure 28: Spill light
Efficiency of a luminaire is the ratio of luminous flux exiting the luminaire to total luminous flux
emitted by the lamp. Indeed, no luminaire can reproduce 100% of the light emitted by the lamps. A
significant share of this light is absorbed by different elements of the luminaire and is transformed
into heat. Any other share of the light emitted into the atmosphere would be considered a loss, as it
does not contribute to the lighting on the ground.
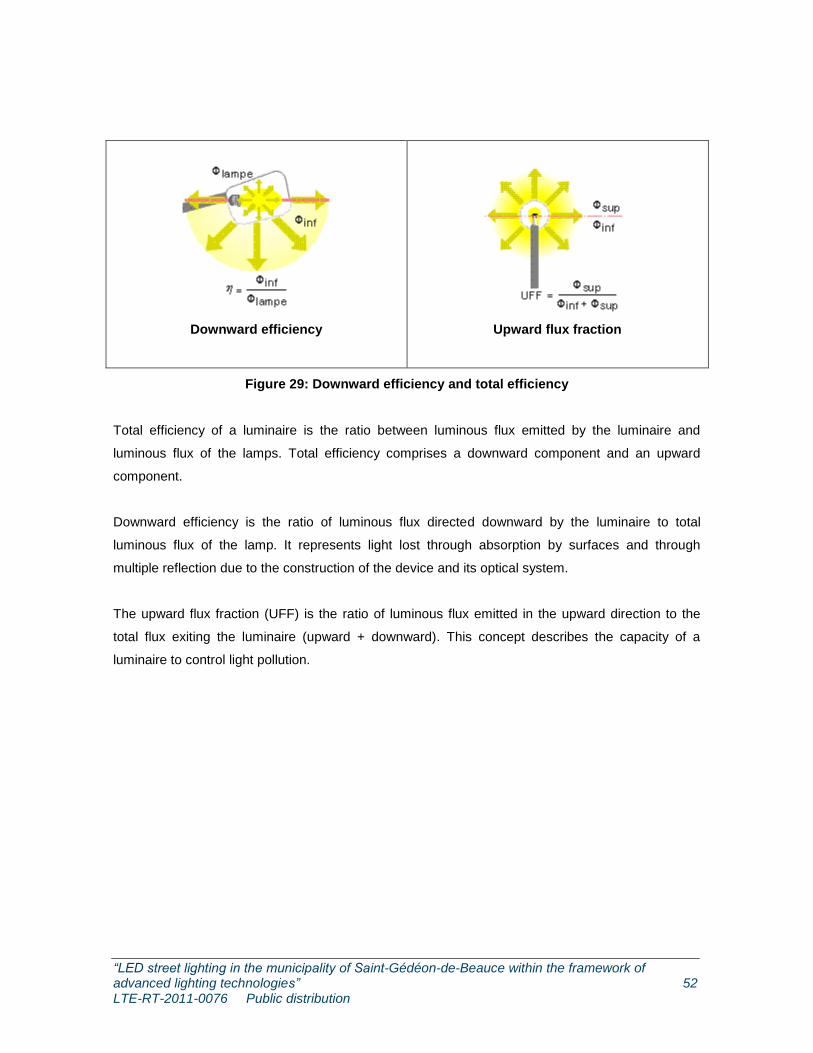
“LED street lighting in the municipality of Saint-Gédéon-de-Beauce within the framework of advanced lighting technologies” 52 LTE-RT-2011-0076 Public distribution
Downward efficiency
Upward flux fraction
Figure 29: Downward efficiency and total efficiency
Total efficiency of a luminaire is the ratio between luminous flux emitted by the luminaire and
luminous flux of the lamps. Total efficiency comprises a downward component and an upward
component.
Downward efficiency is the ratio of luminous flux directed downward by the luminaire to total
luminous flux of the lamp. It represents light lost through absorption by surfaces and through
multiple reflection due to the construction of the device and its optical system.
The upward flux fraction (UFF) is the ratio of luminous flux emitted in the upward direction to the
total flux exiting the luminaire (upward + downward). This concept describes the capacity of a
luminaire to control light pollution.
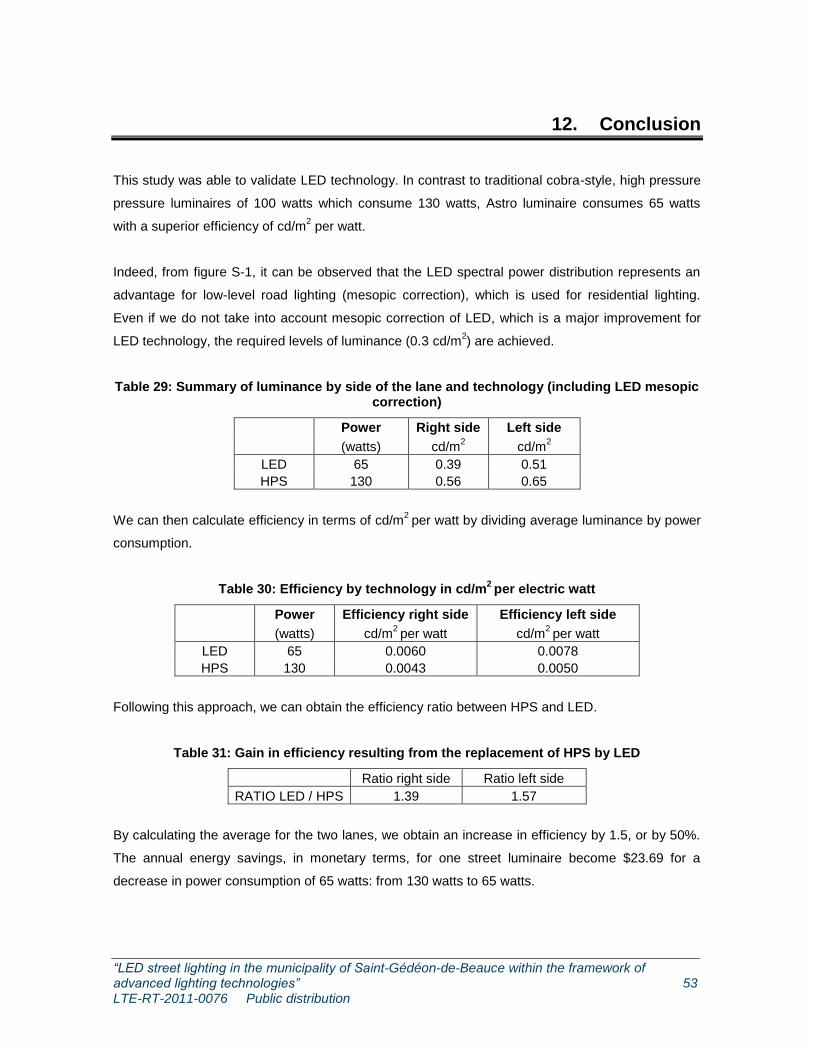
“LED street lighting in the municipality of Saint-Gédéon-de-Beauce within the framework of advanced lighting technologies” 53 LTE-RT-2011-0076 Public distribution
12. Conclusion
This study was able to validate LED technology. In contrast to traditional cobra-style, high pressure
pressure luminaires of 100 watts which consume 130 watts, Astro luminaire consumes 65 watts
with a superior efficiency of cd/m2 per watt.
Indeed, from figure S-1, it can be observed that the LED spectral power distribution represents an
advantage for low-level road lighting (mesopic correction), which is used for residential lighting.
Even if we do not take into account mesopic correction of LED, which is a major improvement for
LED technology, the required levels of luminance (0.3 cd/m2) are achieved.
Table 29: Summary of luminance by side of the lane and technology (including LED mesopic correction)
Power Right side Left side
(watts) cd/m2 cd/m
2
LED 65 0.39 0.51
HPS 130 0.56 0.65
We can then calculate efficiency in terms of cd/m2
per watt by dividing average luminance by power
consumption.
Table 30: Efficiency by technology in cd/m2 per electric watt
Power Efficiency right side Efficiency left side
(watts) cd/m2 per watt cd/m
2 per watt
LED 65 0.0060 0.0078
HPS 130 0.0043 0.0050
Following this approach, we can obtain the efficiency ratio between HPS and LED.
Table 31: Gain in efficiency resulting from the replacement of HPS by LED
Ratio right side Ratio left side
RATIO LED / HPS 1.39 1.57
By calculating the average for the two lanes, we obtain an increase in efficiency by 1.5, or by 50%.
The annual energy savings, in monetary terms, for one street luminaire become $23.69 for a
decrease in power consumption of 65 watts: from 130 watts to 65 watts.
“LED street lighting in the municipality of Saint-Gédéon-de-Beauce within the framework of advanced lighting technologies” 54 LTE-RT-2011-0076 Public distribution
A comparative study shows that an Astro luminaire with a flat lens uses electrical energy better than
a cobra head with a prismatic lens. Average efficiency in cd/m2 per watt of Astro luminaire is 1.5
times greater than the average efficiency of a cobra head with a prismatic lens for a two-lane street.
Moreover, the risk of accident due to the glare is greatly reduced with an Astro luminaire due to its
absolute cutoff.
Road lighting plays a key role in the management of public space. The growing tendency for cities
and municipalities to create a strong local identity is naturally contributing to its management. Within
this context, the perceived quality of lighting and the lamp post design are both considered to be
crucial in the opinion of the citizens.
Instant start lighting, low energy consumption, potential long life span of light-emitting diodes,
reduction in costs for frequent lamp replacement, the absence of mercury and other polluting
materials, the possibility to manage lighting via control systems are all arguments which highlight
the benefit of using this new technology in road lighting. To this we can add the will of the local
communities and companies to considerably reduce CO2 emissions associated with lighting.
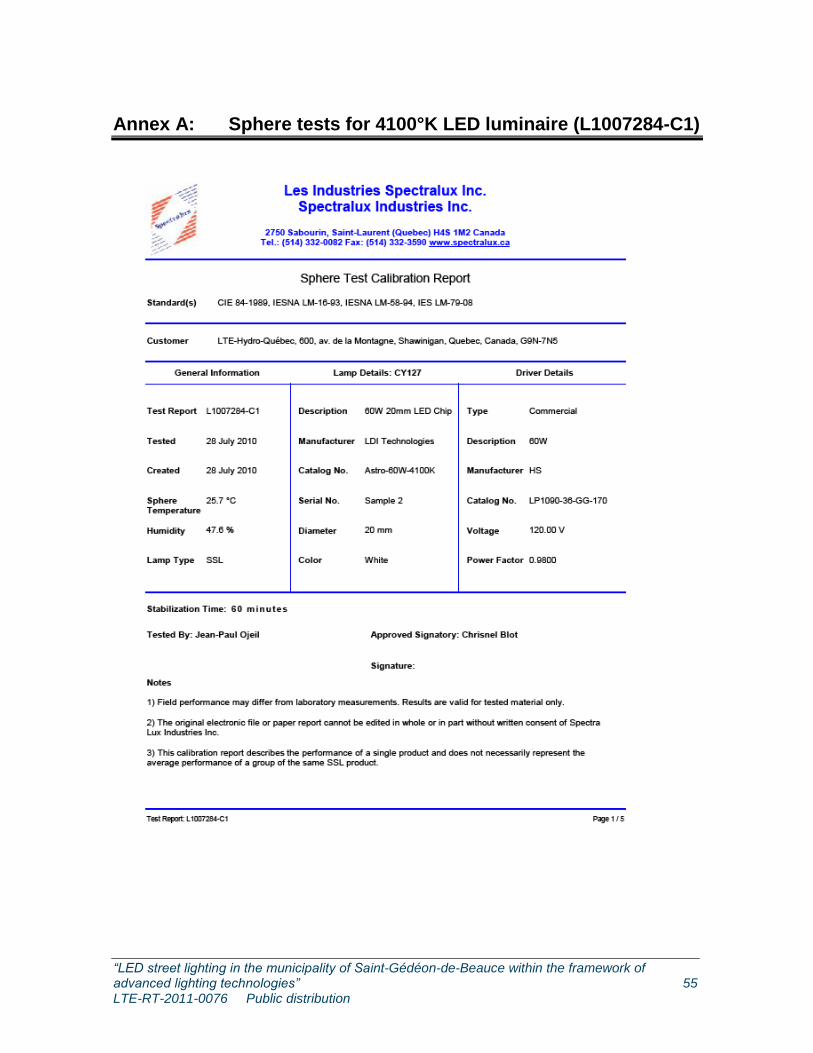
“LED street lighting in the municipality of Saint-Gédéon-de-Beauce within the framework of advanced lighting technologies” 55 LTE-RT-2011-0076 Public distribution
Annex A: Sphere tests for 4100°K LED luminaire (L1007284-C1)
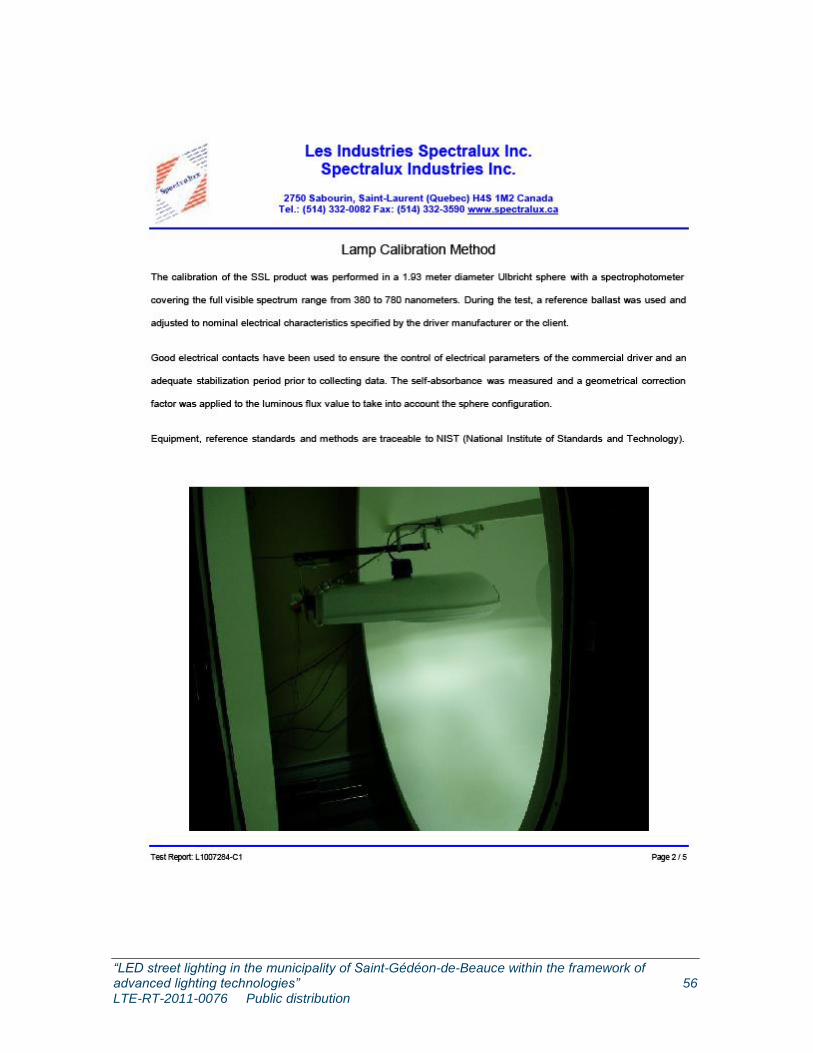
“LED street lighting in the municipality of Saint-Gédéon-de-Beauce within the framework of advanced lighting technologies” 56 LTE-RT-2011-0076 Public distribution
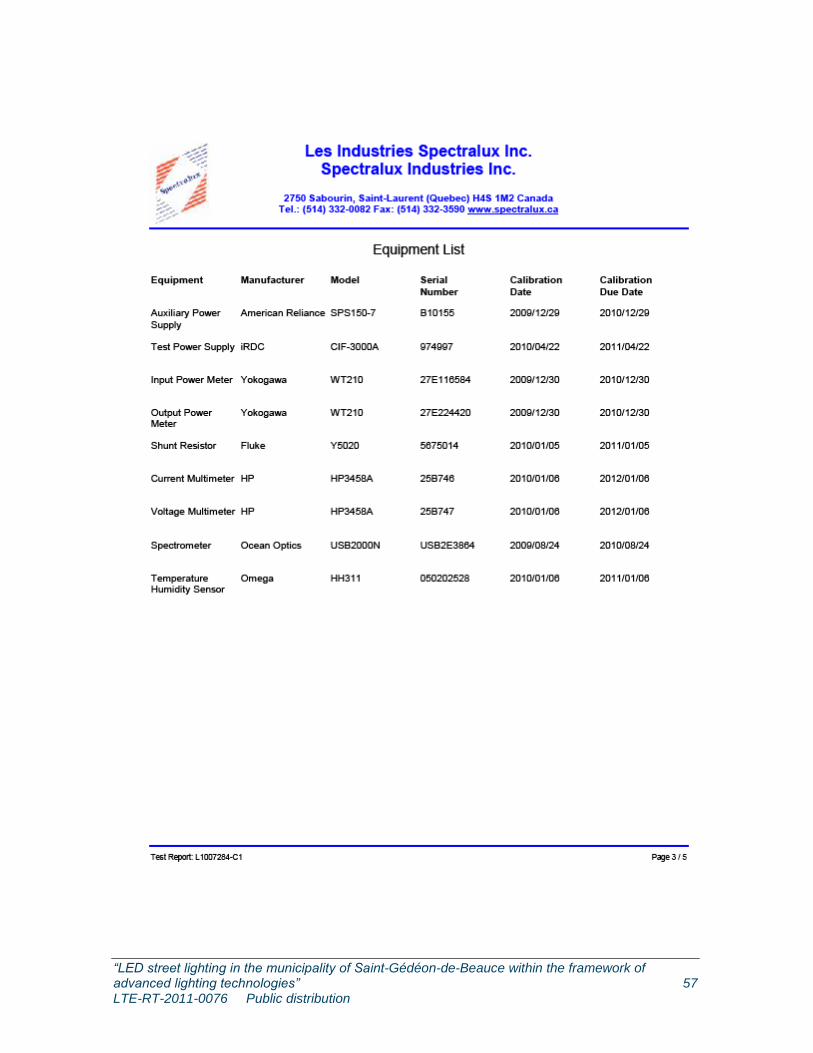
“LED street lighting in the municipality of Saint-Gédéon-de-Beauce within the framework of advanced lighting technologies” 57 LTE-RT-2011-0076 Public distribution
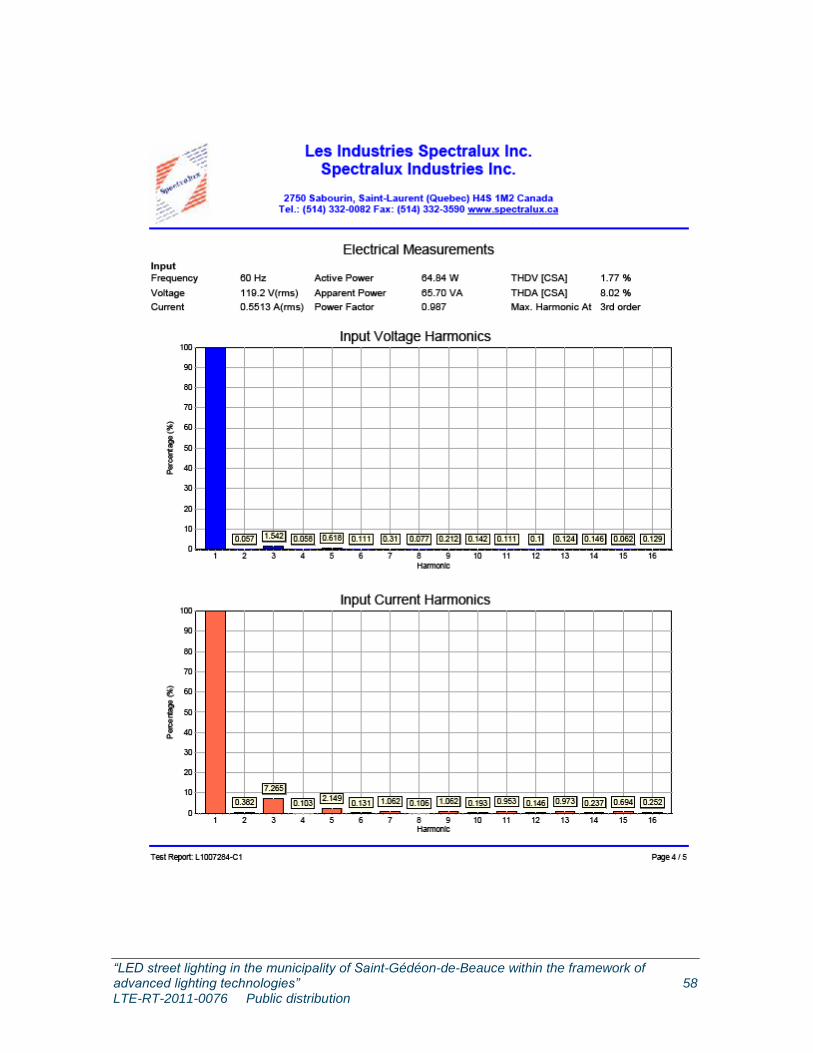
“LED street lighting in the municipality of Saint-Gédéon-de-Beauce within the framework of advanced lighting technologies” 58 LTE-RT-2011-0076 Public distribution
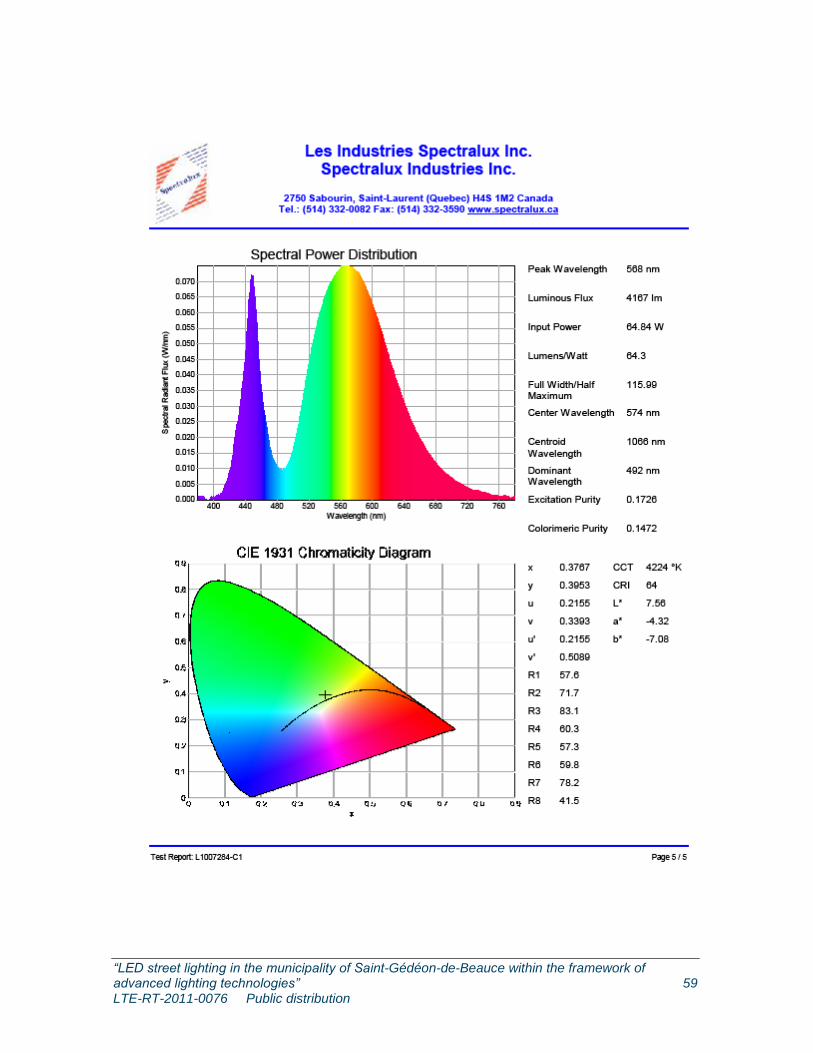
“LED street lighting in the municipality of Saint-Gédéon-de-Beauce within the framework of advanced lighting technologies” 59 LTE-RT-2011-0076 Public distribution
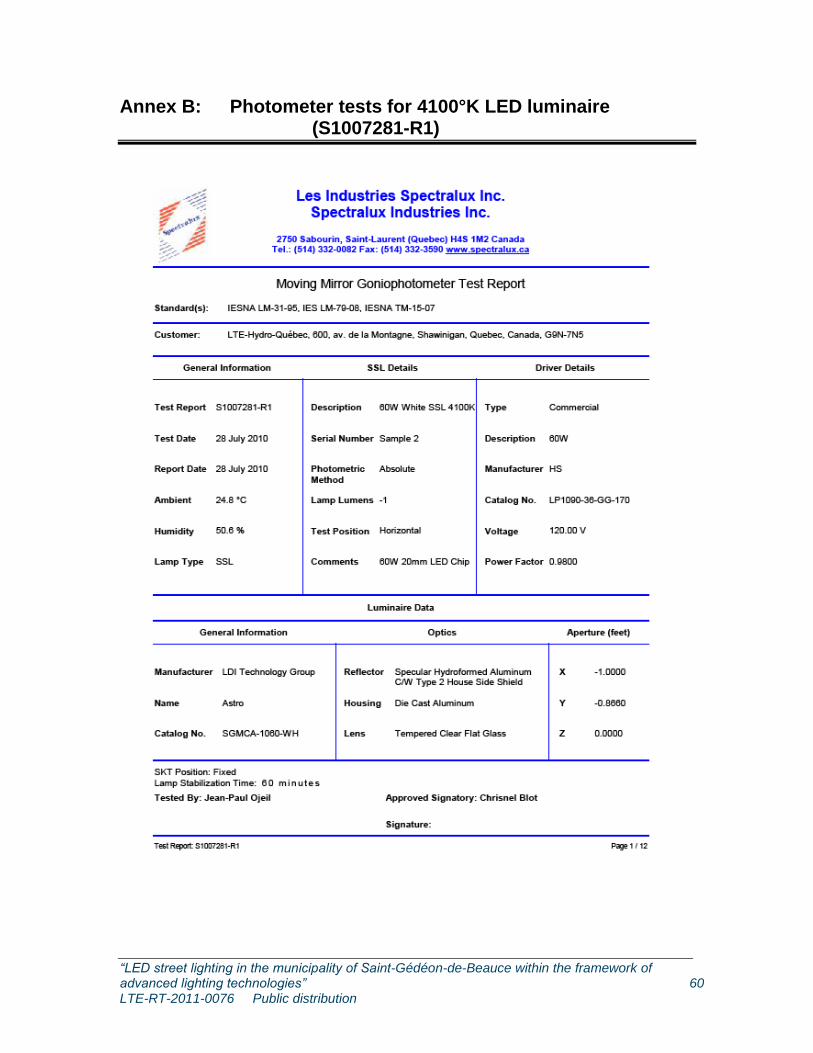
“LED street lighting in the municipality of Saint-Gédéon-de-Beauce within the framework of advanced lighting technologies” 60 LTE-RT-2011-0076 Public distribution
Annex B: Photometer tests for 4100°K LED luminaire (S1007281-R1)
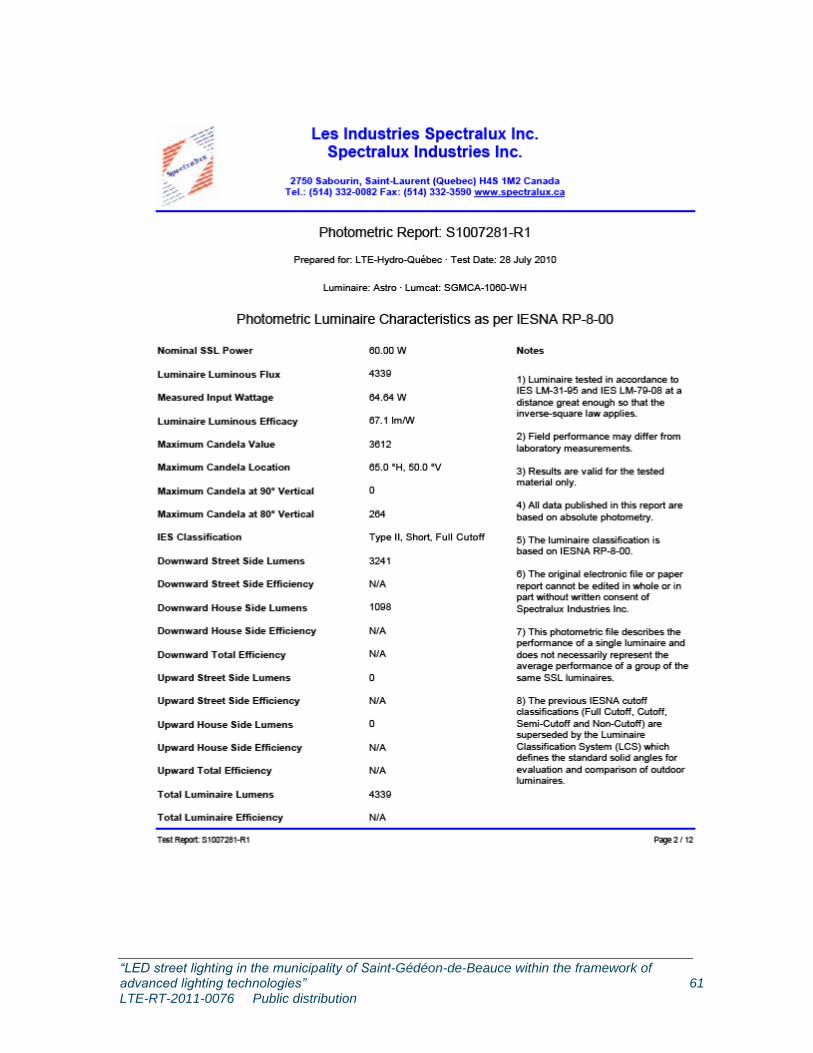
“LED street lighting in the municipality of Saint-Gédéon-de-Beauce within the framework of advanced lighting technologies” 61 LTE-RT-2011-0076 Public distribution
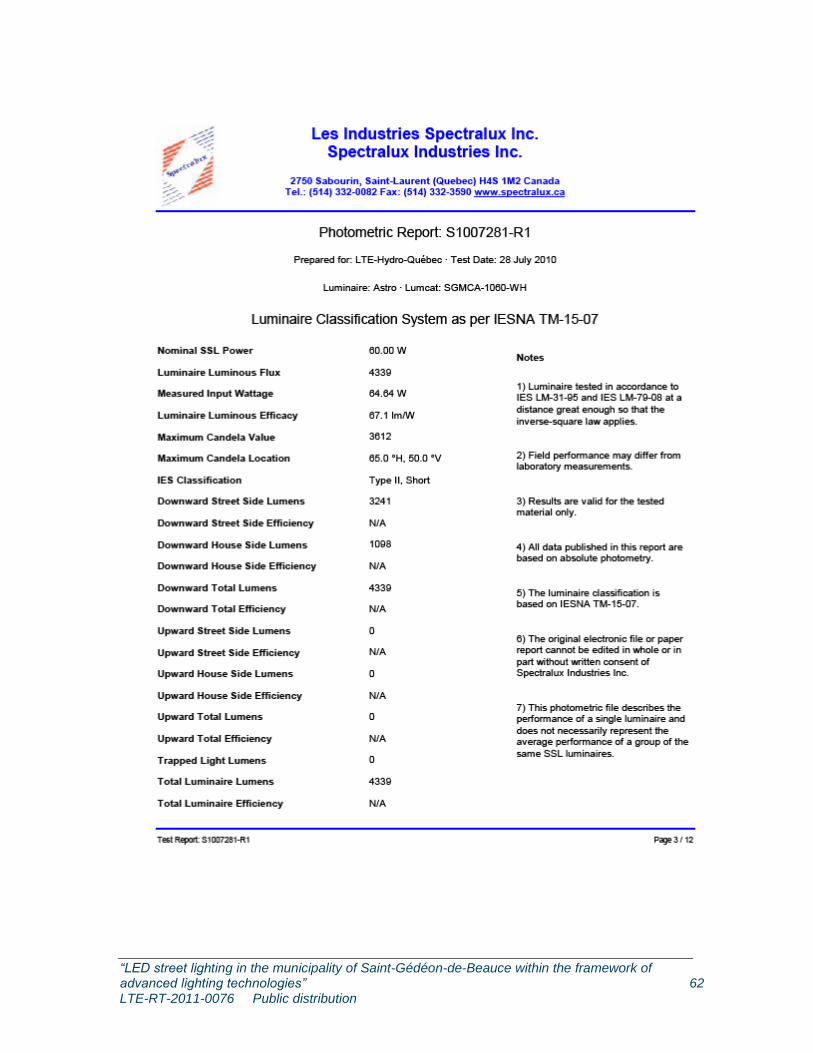
“LED street lighting in the municipality of Saint-Gédéon-de-Beauce within the framework of advanced lighting technologies” 62 LTE-RT-2011-0076 Public distribution
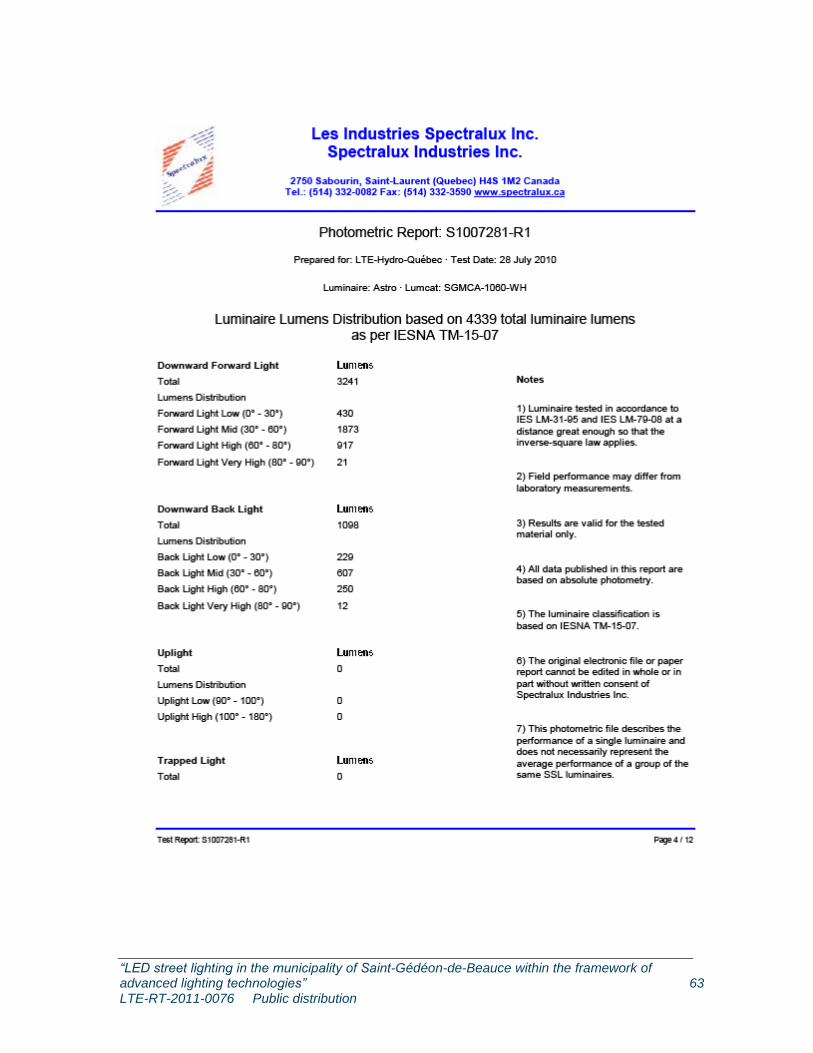
“LED street lighting in the municipality of Saint-Gédéon-de-Beauce within the framework of advanced lighting technologies” 63 LTE-RT-2011-0076 Public distribution
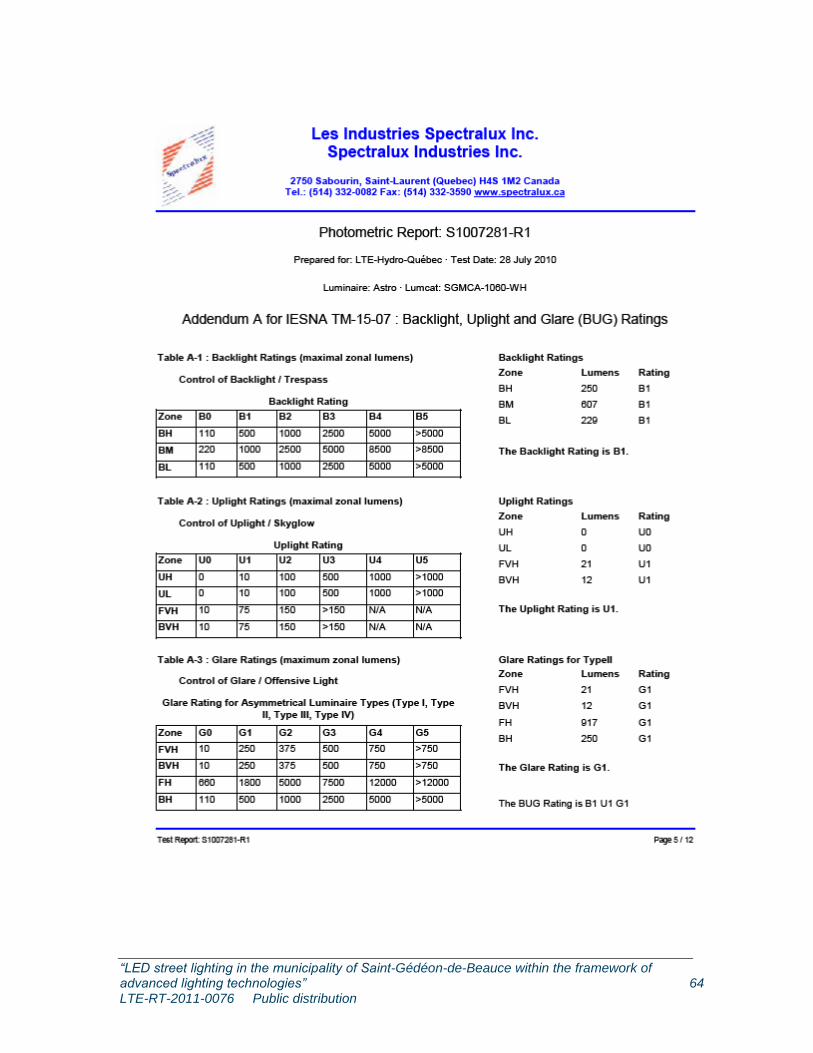
“LED street lighting in the municipality of Saint-Gédéon-de-Beauce within the framework of advanced lighting technologies” 64 LTE-RT-2011-0076 Public distribution
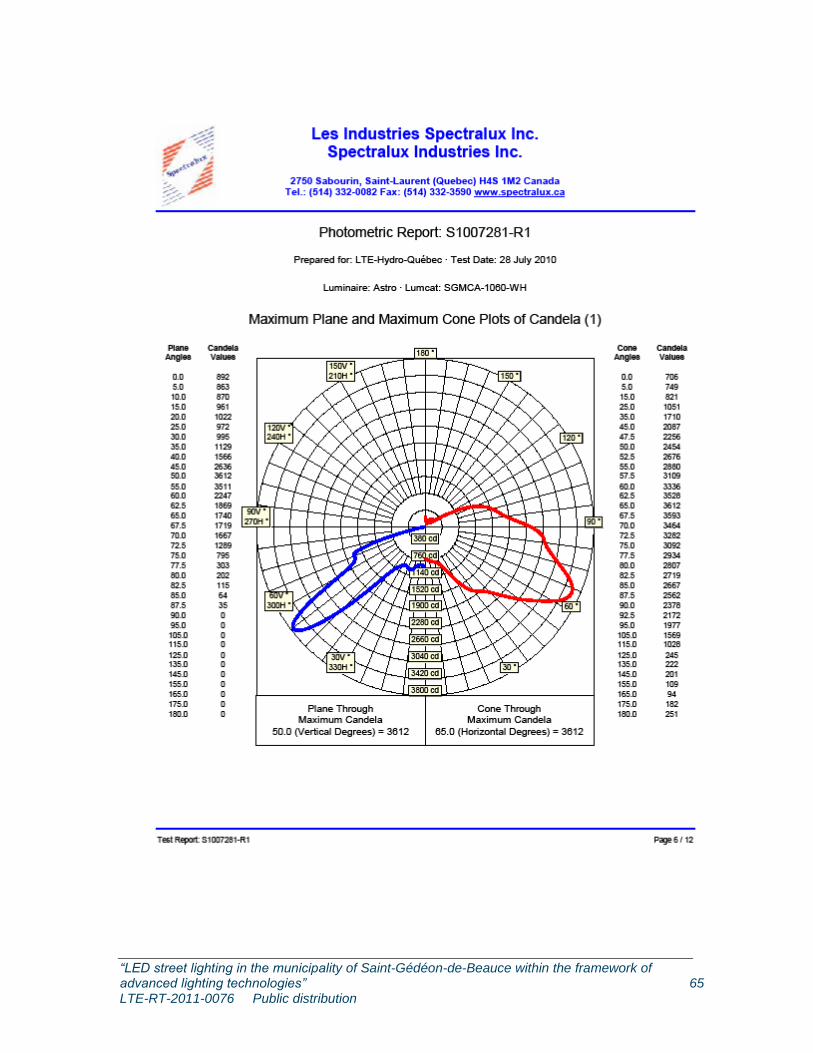
“LED street lighting in the municipality of Saint-Gédéon-de-Beauce within the framework of advanced lighting technologies” 65 LTE-RT-2011-0076 Public distribution
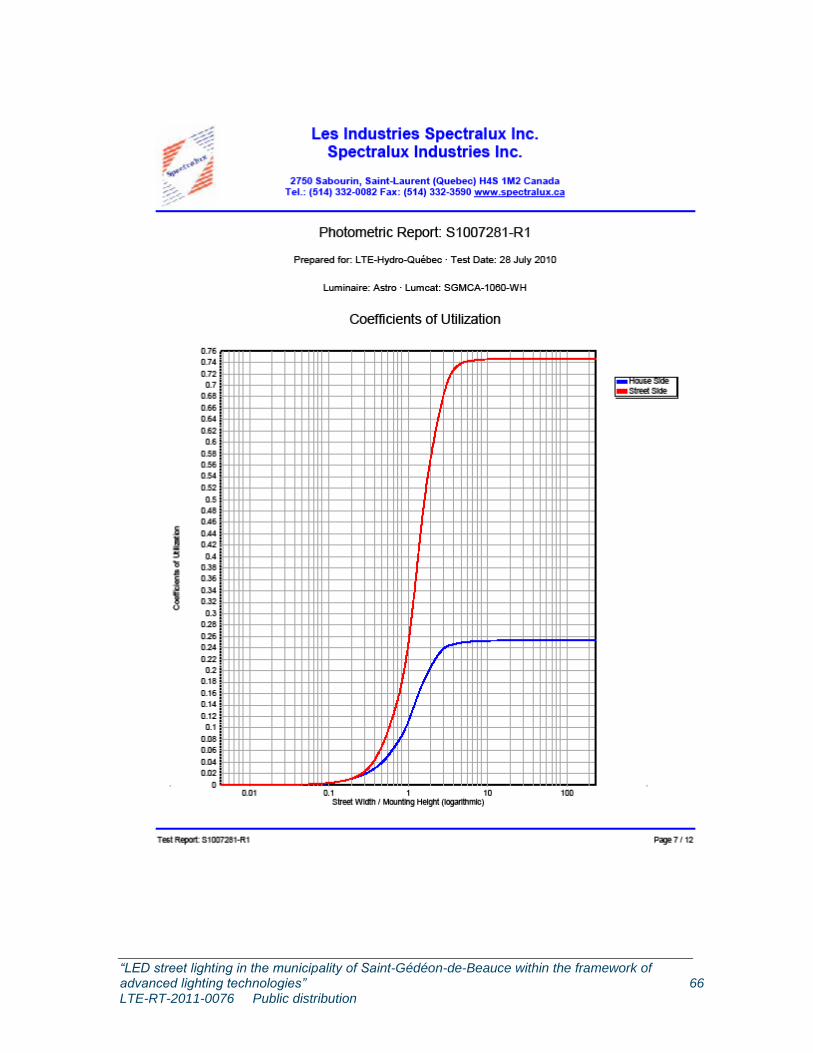
“LED street lighting in the municipality of Saint-Gédéon-de-Beauce within the framework of advanced lighting technologies” 66 LTE-RT-2011-0076 Public distribution
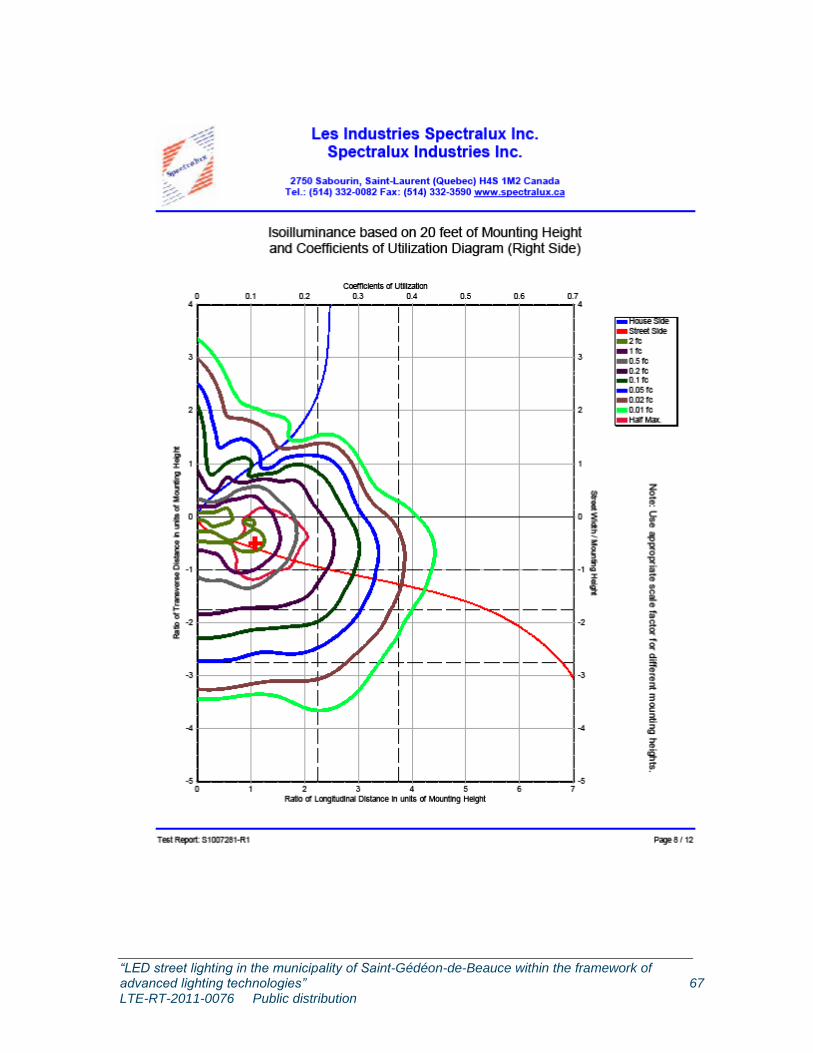
“LED street lighting in the municipality of Saint-Gédéon-de-Beauce within the framework of advanced lighting technologies” 67 LTE-RT-2011-0076 Public distribution
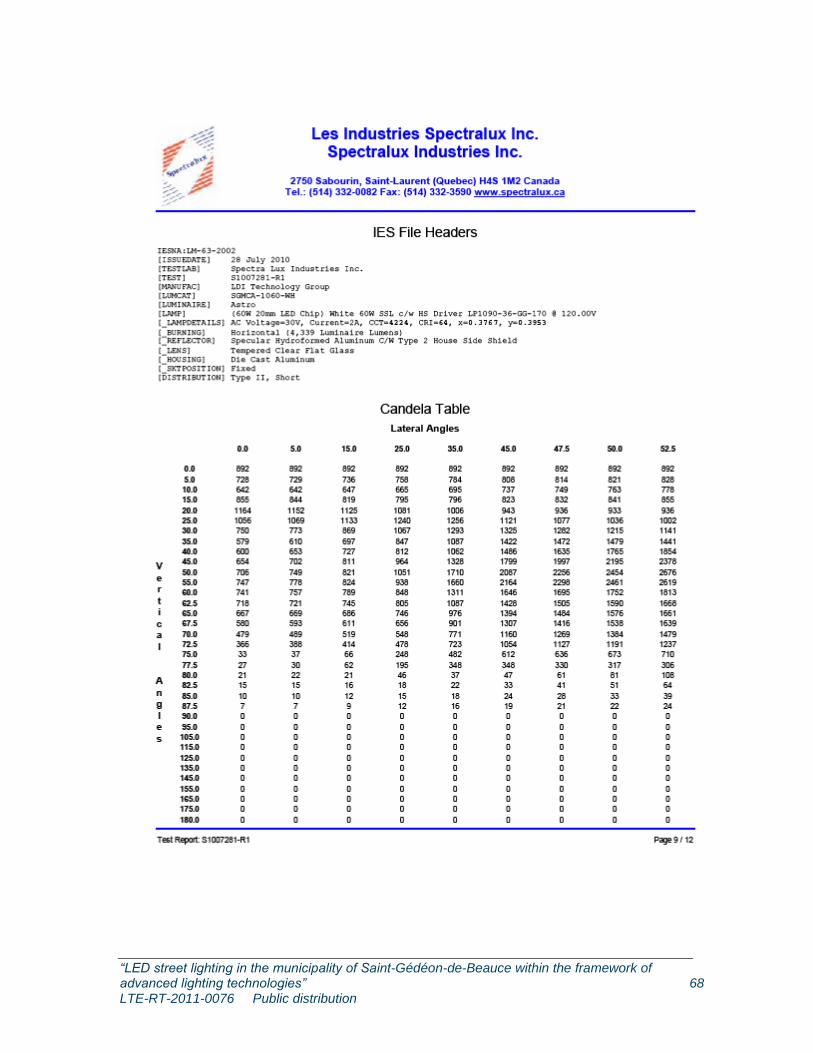
“LED street lighting in the municipality of Saint-Gédéon-de-Beauce within the framework of advanced lighting technologies” 68 LTE-RT-2011-0076 Public distribution
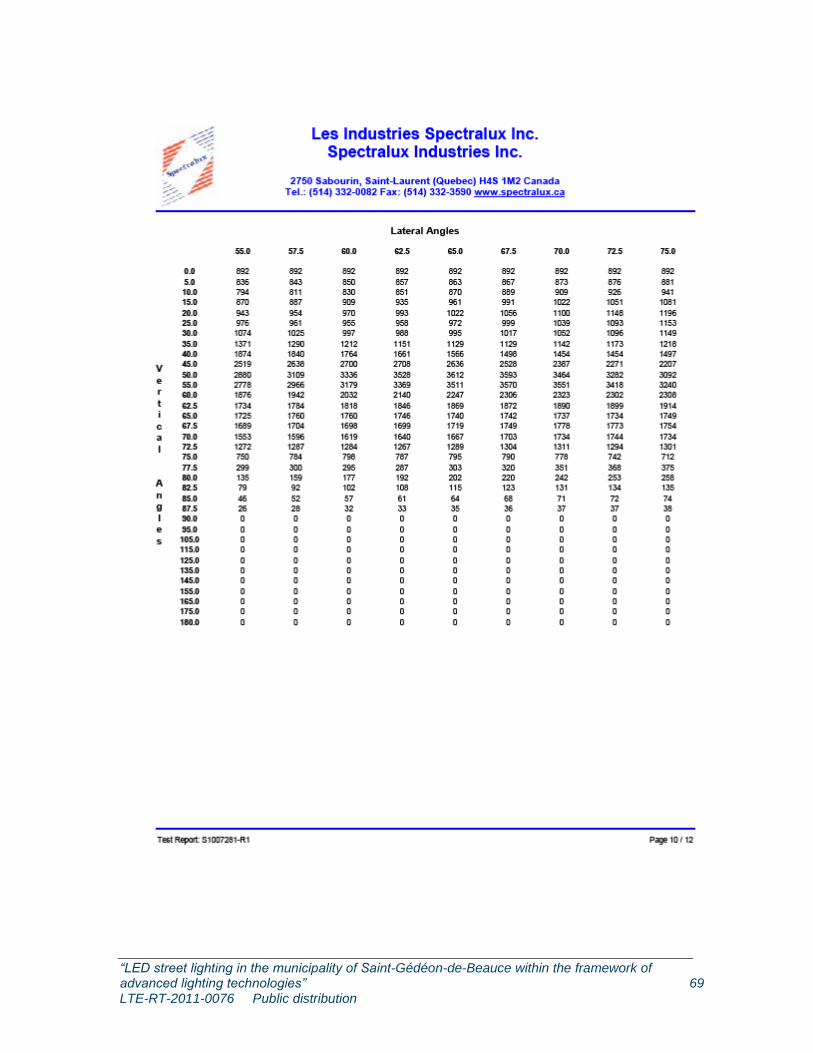
“LED street lighting in the municipality of Saint-Gédéon-de-Beauce within the framework of advanced lighting technologies” 69 LTE-RT-2011-0076 Public distribution
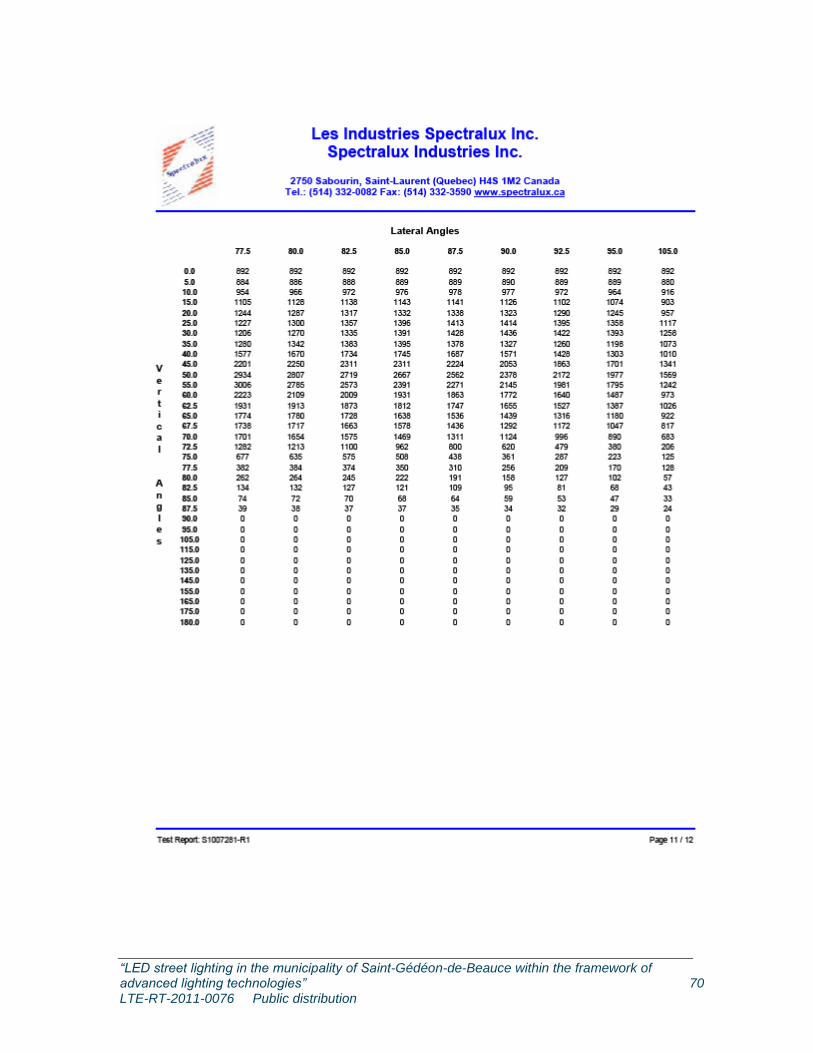
“LED street lighting in the municipality of Saint-Gédéon-de-Beauce within the framework of advanced lighting technologies” 70 LTE-RT-2011-0076 Public distribution
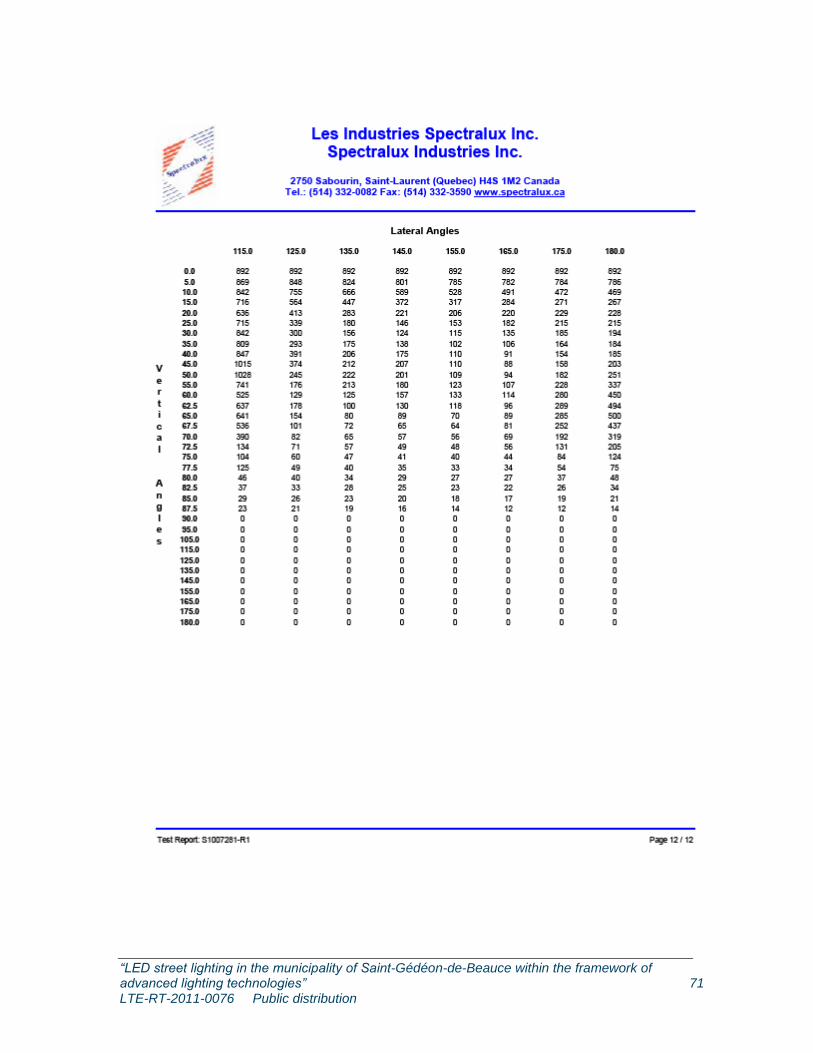
“LED street lighting in the municipality of Saint-Gédéon-de-Beauce within the framework of advanced lighting technologies” 71 LTE-RT-2011-0076 Public distribution
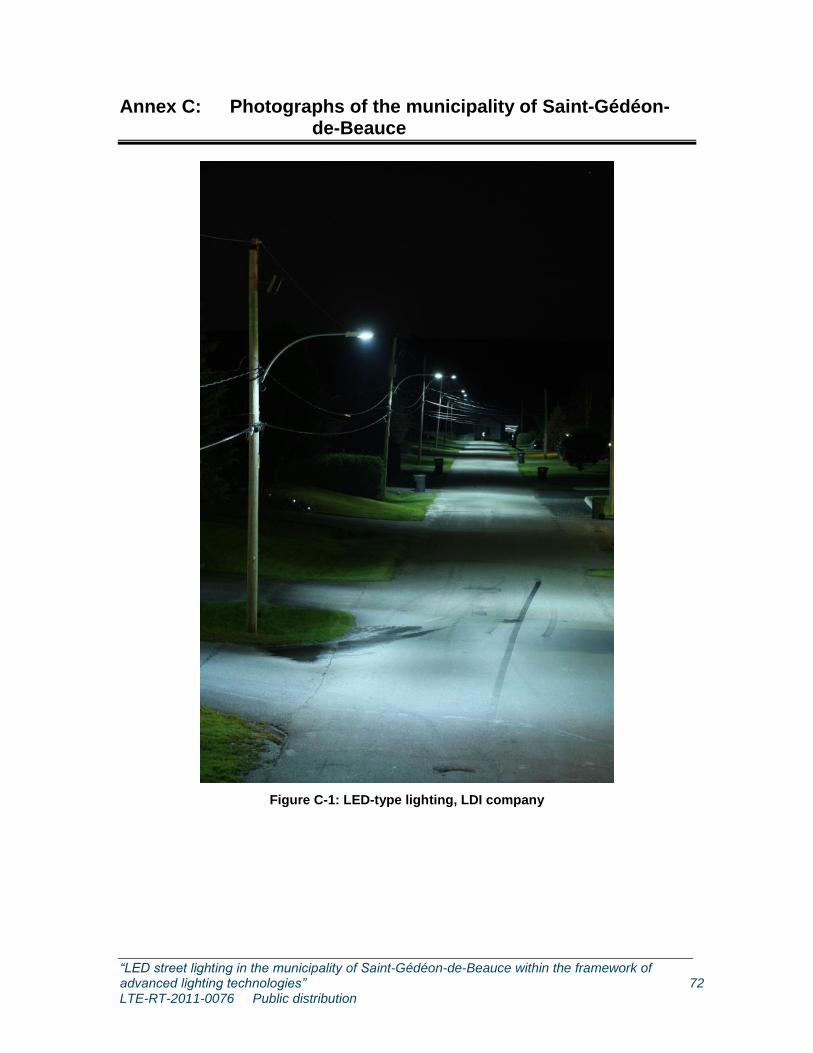
“LED street lighting in the municipality of Saint-Gédéon-de-Beauce within the framework of advanced lighting technologies” 72 LTE-RT-2011-0076 Public distribution
Annex C: Photographs of the municipality of Saint-Gédéon-de-Beauce
Figure C-1: LED-type lighting, LDI company
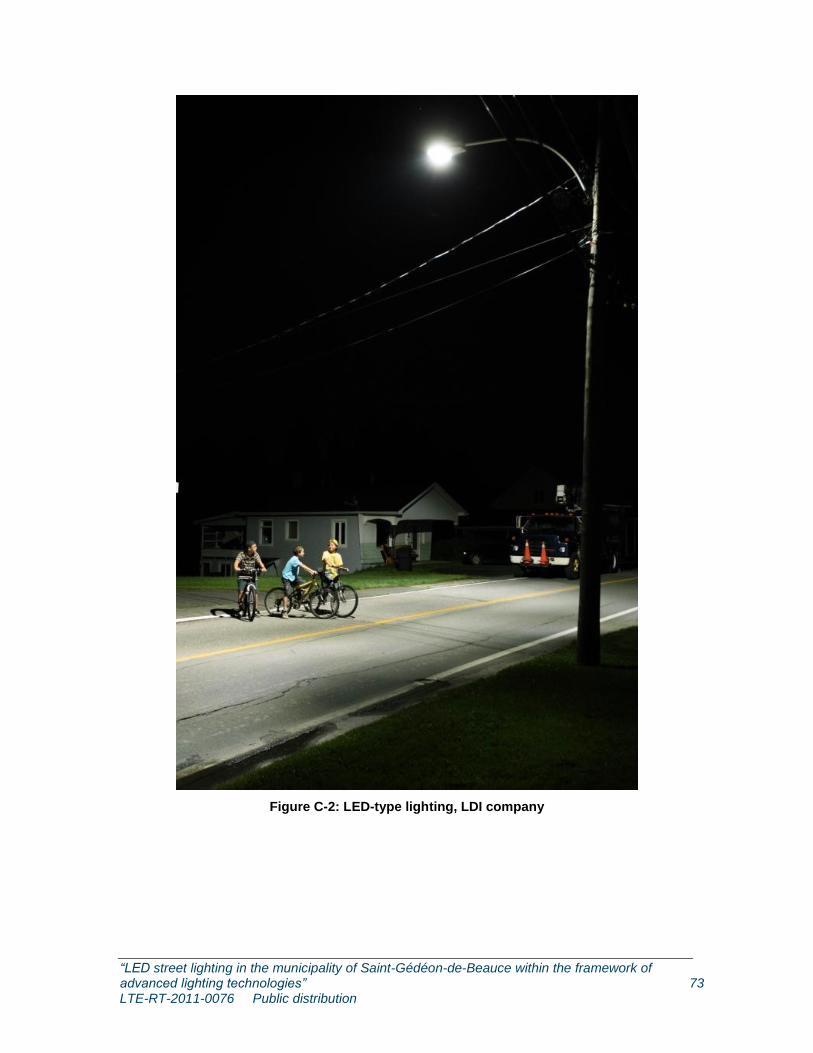
“LED street lighting in the municipality of Saint-Gédéon-de-Beauce within the framework of advanced lighting technologies” 73 LTE-RT-2011-0076 Public distribution
Figure C-2: LED-type lighting, LDI company
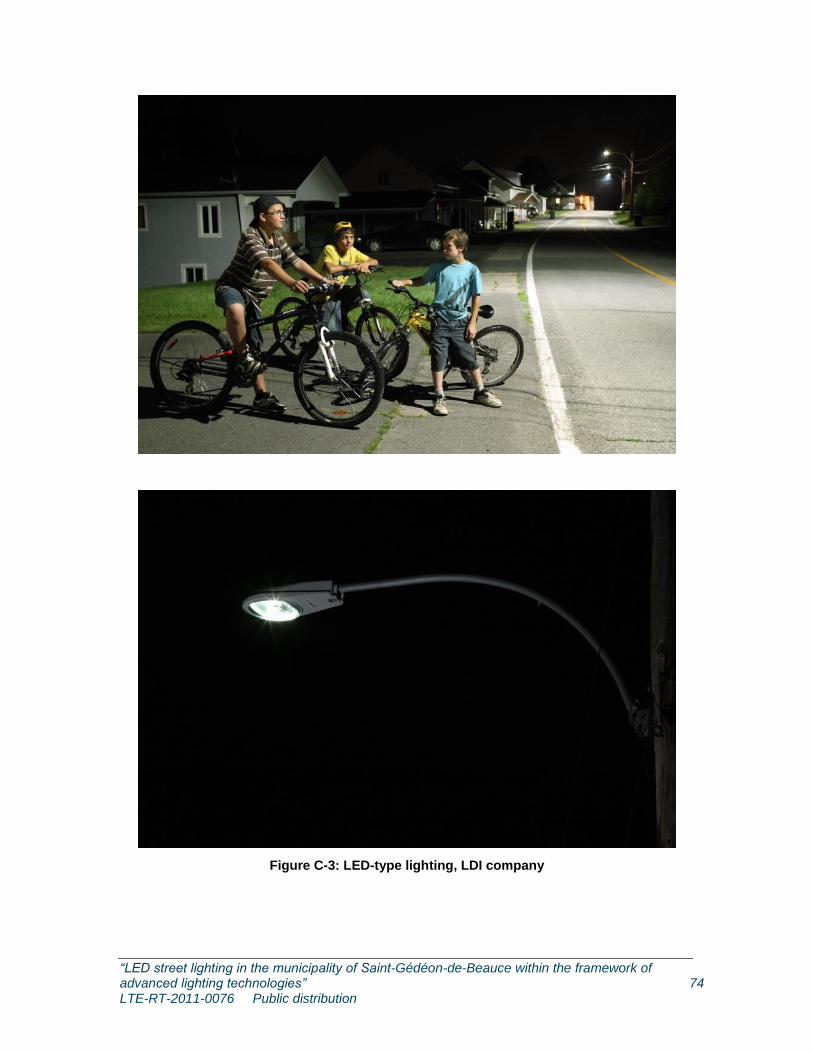
“LED street lighting in the municipality of Saint-Gédéon-de-Beauce within the framework of advanced lighting technologies” 74 LTE-RT-2011-0076 Public distribution
Figure C-3: LED-type lighting, LDI company
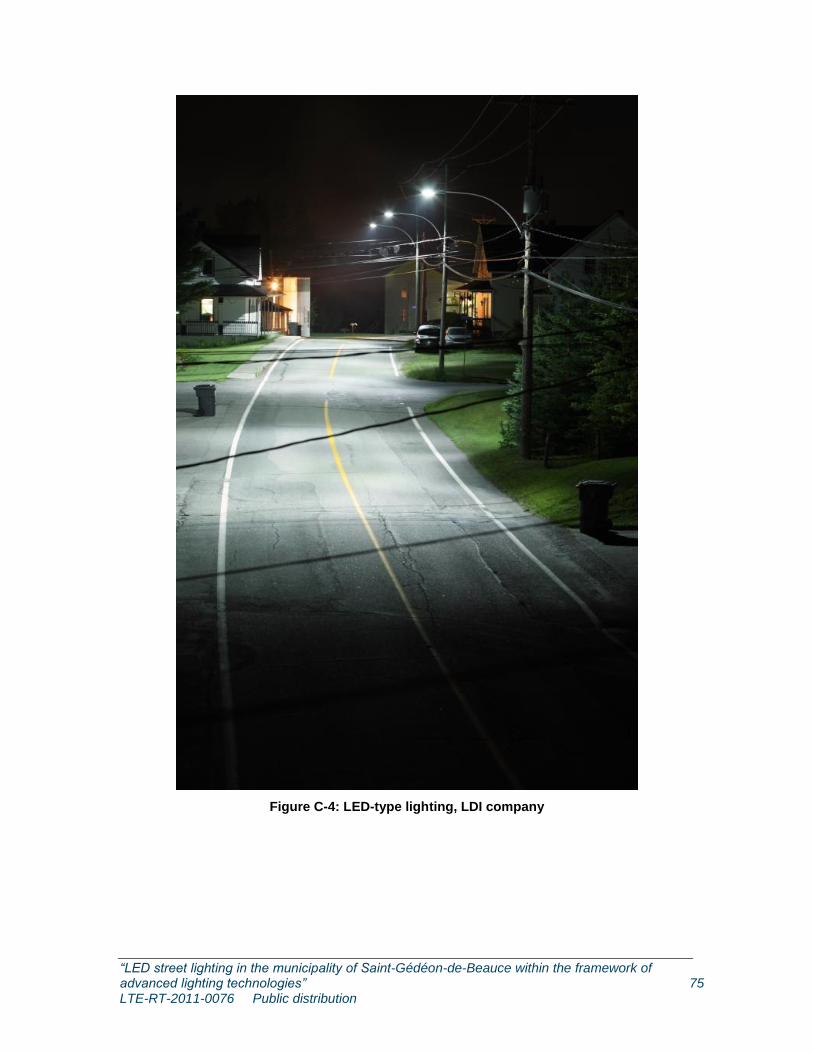
“LED street lighting in the municipality of Saint-Gédéon-de-Beauce within the framework of advanced lighting technologies” 75 LTE-RT-2011-0076 Public distribution
Figure C-4: LED-type lighting, LDI company
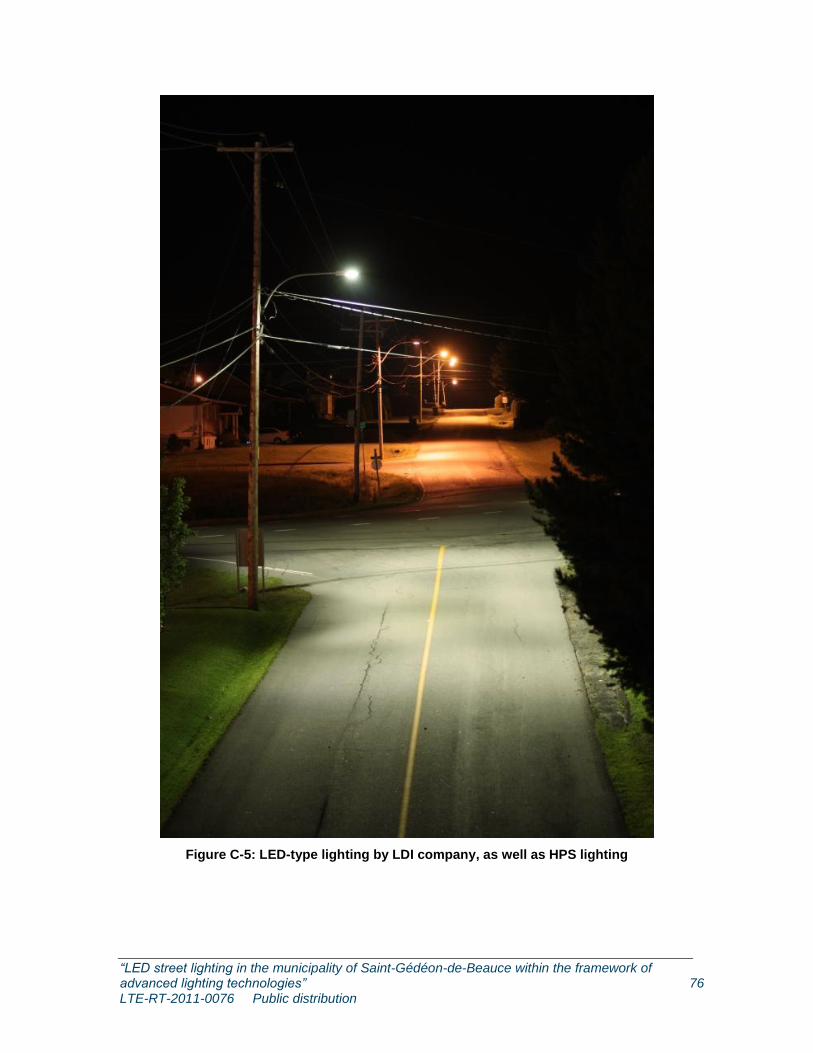
“LED street lighting in the municipality of Saint-Gédéon-de-Beauce within the framework of advanced lighting technologies” 76 LTE-RT-2011-0076 Public distribution
Figure C-5: LED-type lighting by LDI company, as well as HPS lighting
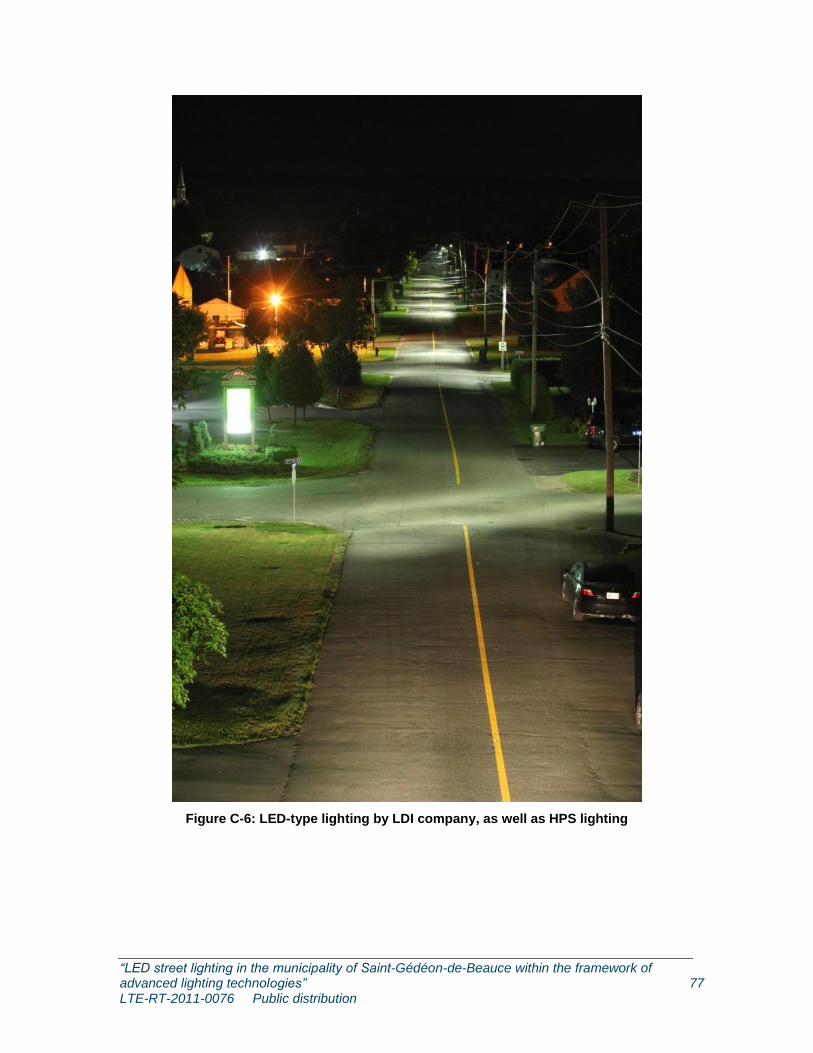
“LED street lighting in the municipality of Saint-Gédéon-de-Beauce within the framework of advanced lighting technologies” 77 LTE-RT-2011-0076 Public distribution
Figure C-6: LED-type lighting by LDI company, as well as HPS lighting

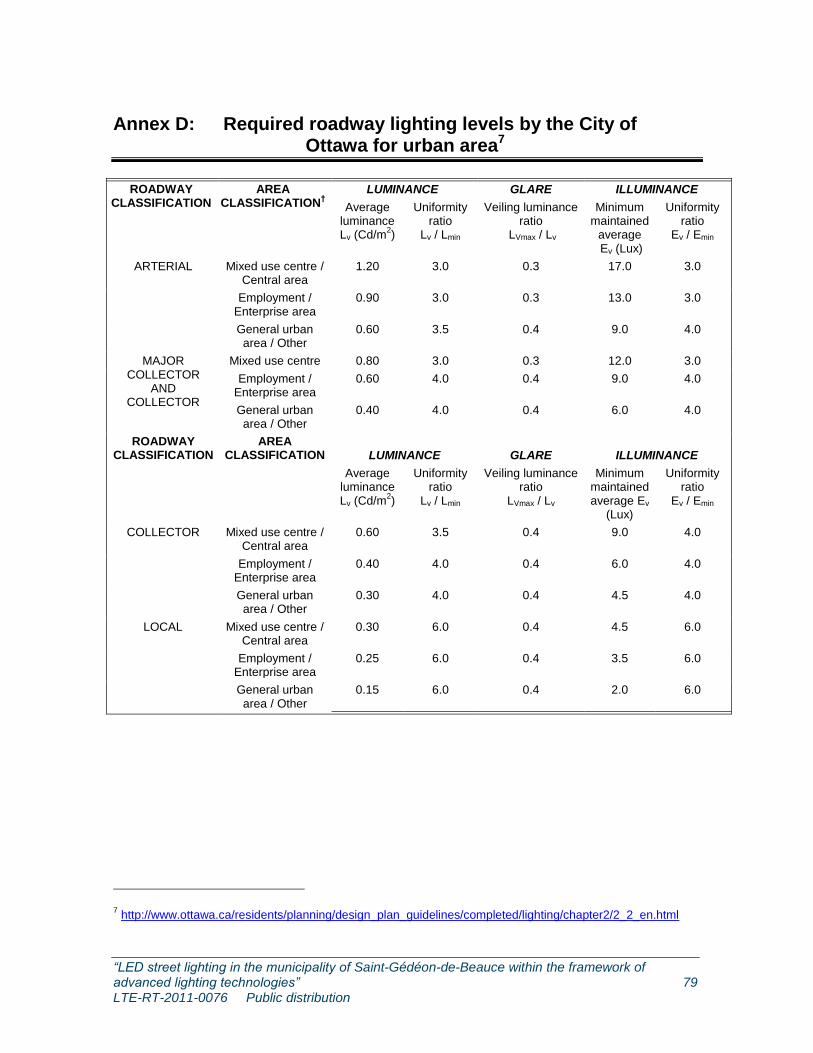
“LED street lighting in the municipality of Saint-Gédéon-de-Beauce within the framework of advanced lighting technologies” 79 LTE-RT-2011-0076 Public distribution
Annex D: Required roadway lighting levels by the City of Ottawa for urban area7
ROADWAY CLASSIFICATION
AREA CLASSIFICATION
†
LUMINANCE GLARE ILLUMINANCE
Average luminance Lv (Cd/m
2)
Uniformity ratio
Lv / Lmin
Veiling luminance ratio
LVmax / Lv
Minimum maintained
average Ev (Lux)
Uniformity ratio
Ev / Emin
ARTERIAL Mixed use centre / Central area
1.20 3.0 0.3 17.0 3.0
Employment / Enterprise area
0.90 3.0 0.3 13.0 3.0
General urban area / Other
0.60 3.5 0.4 9.0 4.0
MAJOR COLLECTOR
AND COLLECTOR
Mixed use centre 0.80 3.0 0.3 12.0 3.0
Employment / Enterprise area
0.60 4.0 0.4 9.0 4.0
General urban area / Other
0.40 4.0 0.4 6.0 4.0
ROADWAY CLASSIFICATION
AREA CLASSIFICATION
LUMINANCE
GLARE
ILLUMINANCE
Average luminance Lv (Cd/m
2)
Uniformity ratio
Lv / Lmin
Veiling luminance ratio
LVmax / Lv
Minimum maintained average Ev
(Lux)
Uniformity ratio
Ev / Emin
COLLECTOR Mixed use centre / Central area
0.60 3.5 0.4 9.0 4.0
Employment / Enterprise area
0.40 4.0 0.4 6.0 4.0
General urban area / Other
0.30 4.0 0.4 4.5 4.0
LOCAL Mixed use centre / Central area
0.30 6.0 0.4 4.5 6.0
Employment / Enterprise area
0.25 6.0 0.4 3.5 6.0
General urban area / Other
0.15 6.0 0.4 2.0 6.0
7 http://www.ottawa.ca/residents/planning/design_plan_guidelines/completed/lighting/chapter2/2_2_en.html

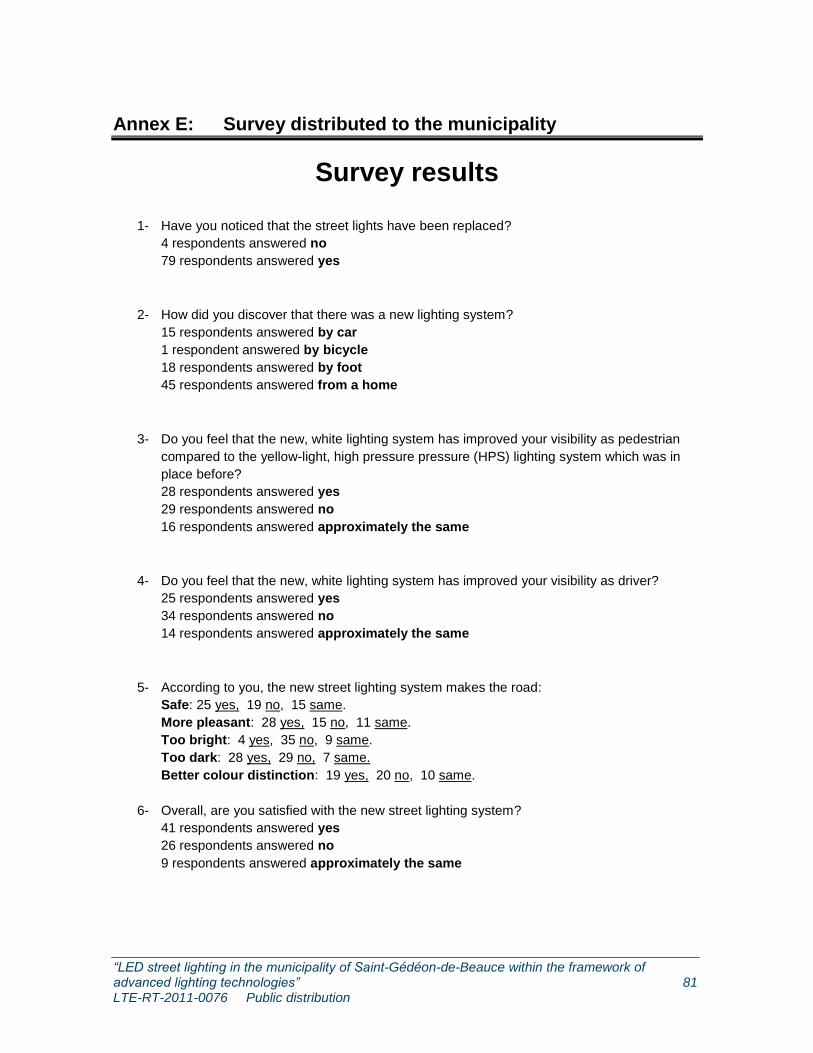
“LED street lighting in the municipality of Saint-Gédéon-de-Beauce within the framework of advanced lighting technologies” 81 LTE-RT-2011-0076 Public distribution
Annex E: Survey distributed to the municipality
Survey results
1- Have you noticed that the street lights have been replaced?
4 respondents answered no
79 respondents answered yes
2- How did you discover that there was a new lighting system?
15 respondents answered by car
1 respondent answered by bicycle
18 respondents answered by foot
45 respondents answered from a home
3- Do you feel that the new, white lighting system has improved your visibility as pedestrian
compared to the yellow-light, high pressure pressure (HPS) lighting system which was in
place before?
28 respondents answered yes
29 respondents answered no
16 respondents answered approximately the same
4- Do you feel that the new, white lighting system has improved your visibility as driver?
25 respondents answered yes
34 respondents answered no
14 respondents answered approximately the same
5- According to you, the new street lighting system makes the road:
Safe: 25 yes, 19 no, 15 same.
More pleasant: 28 yes, 15 no, 11 same.
Too bright: 4 yes, 35 no, 9 same.
Too dark: 28 yes, 29 no, 7 same.
Better colour distinction: 19 yes, 20 no, 10 same.
6- Overall, are you satisfied with the new street lighting system?
41 respondents answered yes
26 respondents answered no
9 respondents answered approximately the same

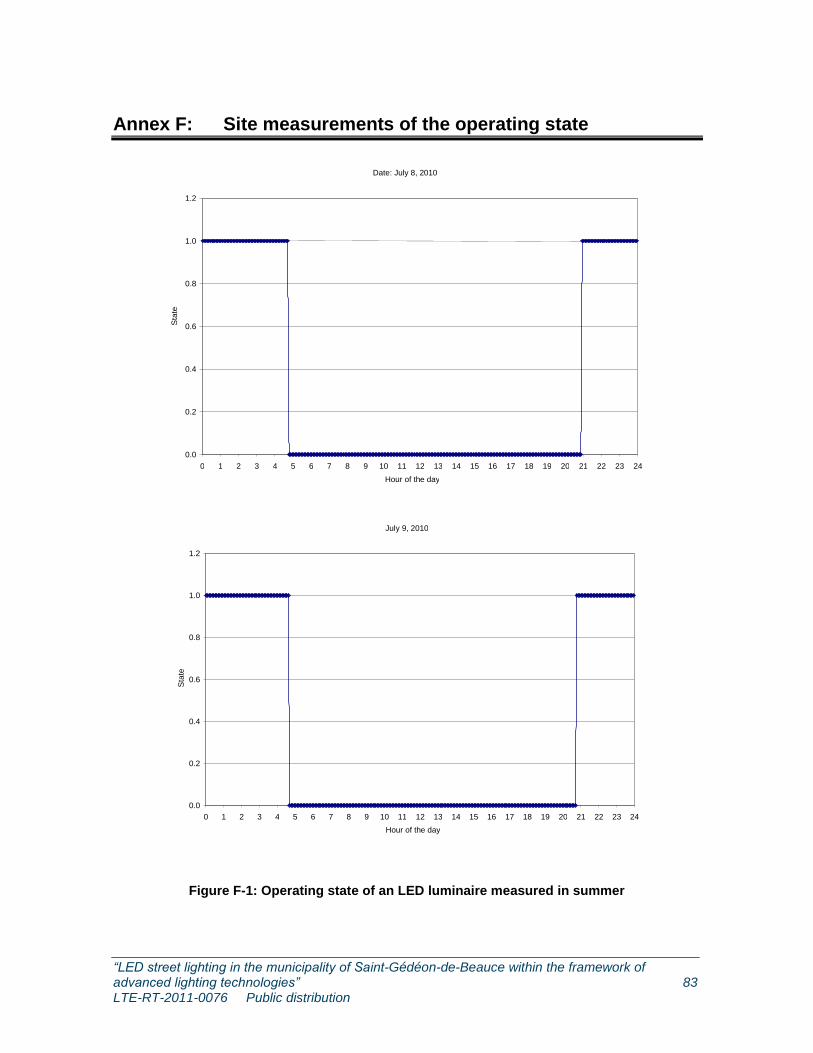
“LED street lighting in the municipality of Saint-Gédéon-de-Beauce within the framework of advanced lighting technologies” 83 LTE-RT-2011-0076 Public distribution
Annex F: Site measurements of the operating state
Figure F-1: Operating state of an LED luminaire measured in summer
July 9, 2010
0.0
0.2
0.4
0.6
0.8
1.0
1.2
0 1 2 3 4 5 6 7 8 9 10 11 12 13 14 15 16 17 18 19 20 21 22 23 24 Hour of the day
Sta
te
Date: July 8, 2010
0.0
0.2
0.4
0.6
0.8
1.0
1.2
0 1 2 3 4 5 6 7 8 9 10 11 12 13 14 15 16 17 18 19 20 21 22 23 24 Hour of the day
Sta
te
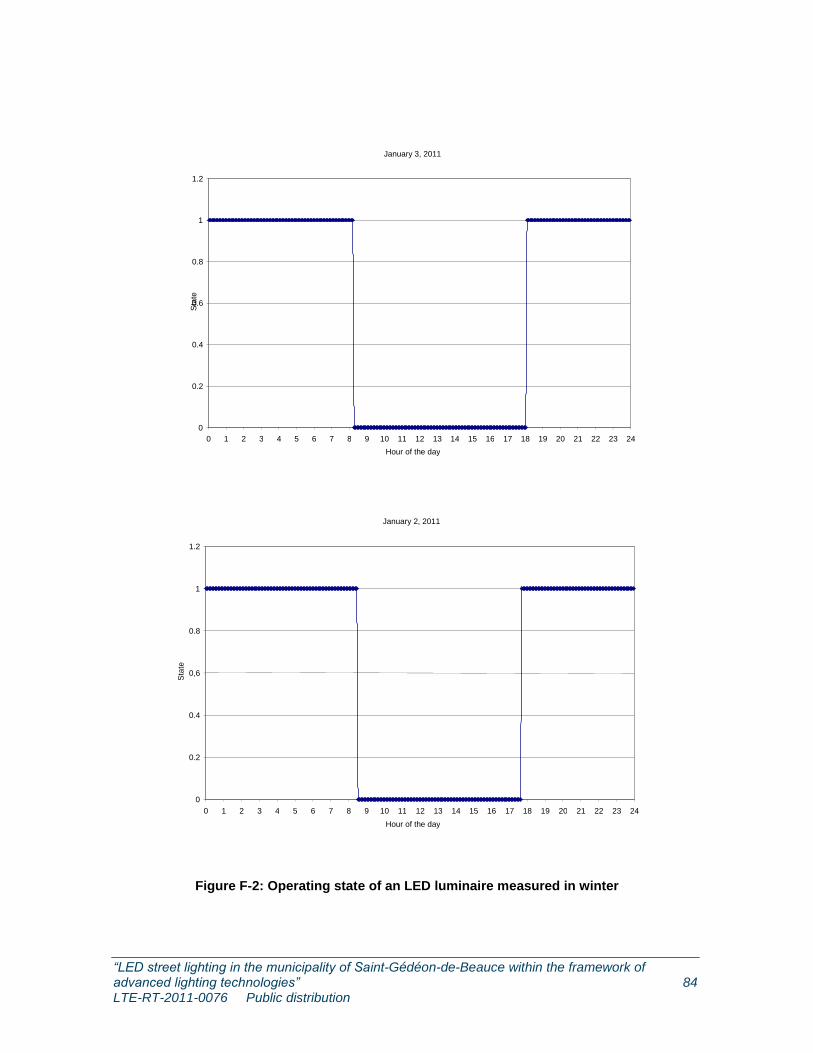
“LED street lighting in the municipality of Saint-Gédéon-de-Beauce within the framework of advanced lighting technologies” 84 LTE-RT-2011-0076 Public distribution
Figure F-2: Operating state of an LED luminaire measured in winter
January 2, 2011
0
0.2
0.4
0,6
0.8
1
1.2
0 1 2 3 4 5 6 7 8 9 10 11 12 13 14 15 16 17 18 19 20 21 22 23 24 Hour of the day
Sta
te
January 3, 2011
0
0.2
0.4
0.6
0.8
1
1.2
0 1 2 3 4 5 6 7 8 9 10 11 12 13 14 15 16 17 18 19 20 21 22 23 24 Hour of the day
Sta
te
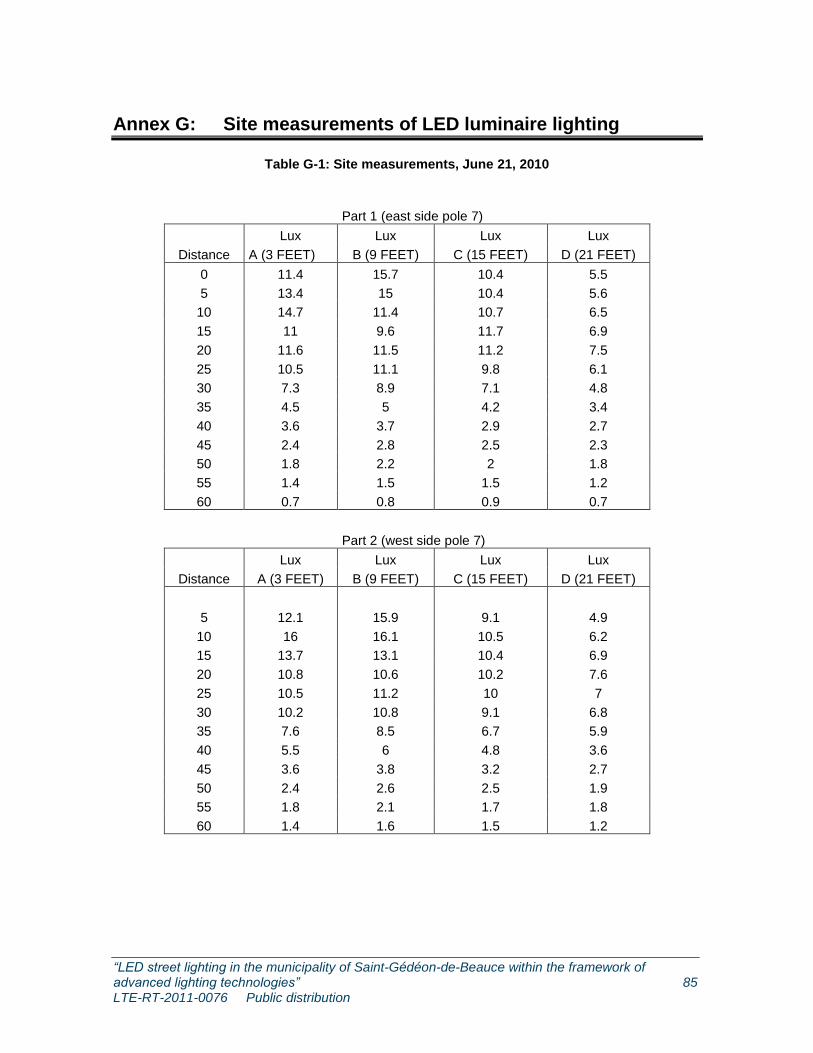
“LED street lighting in the municipality of Saint-Gédéon-de-Beauce within the framework of advanced lighting technologies” 85 LTE-RT-2011-0076 Public distribution
Annex G: Site measurements of LED luminaire lighting
Table G-1: Site measurements, June 21, 2010
Part 1 (east side pole 7)
Lux Lux Lux Lux
Distance A (3 FEET) B (9 FEET) C (15 FEET) D (21 FEET)
0 11.4 15.7 10.4 5.5
5 13.4 15 10.4 5.6
10 14.7 11.4 10.7 6.5
15 11 9.6 11.7 6.9
20 11.6 11.5 11.2 7.5
25 10.5 11.1 9.8 6.1
30 7.3 8.9 7.1 4.8
35 4.5 5 4.2 3.4
40 3.6 3.7 2.9 2.7
45 2.4 2.8 2.5 2.3
50 1.8 2.2 2 1.8
55 1.4 1.5 1.5 1.2
60 0.7 0.8 0.9 0.7
Part 2 (west side pole 7)
Lux Lux Lux Lux
Distance A (3 FEET) B (9 FEET) C (15 FEET) D (21 FEET)
5 12.1 15.9 9.1 4.9
10 16 16.1 10.5 6.2
15 13.7 13.1 10.4 6.9
20 10.8 10.6 10.2 7.6
25 10.5 11.2 10 7
30 10.2 10.8 9.1 6.8
35 7.6 8.5 6.7 5.9
40 5.5 6 4.8 3.6
45 3.6 3.8 3.2 2.7
50 2.4 2.6 2.5 1.9
55 1.8 2.1 1.7 1.8
60 1.4 1.6 1.5 1.2

“LED street lighting in the municipality of Saint-Gédéon-de-Beauce within the framework of advanced lighting technologies” 87 LTE-RT-2011-0076 Public distribution
Annex H: Energy savings
This annex was prepared as additional information to the main report in order to quantify the
potential energy savings.
Concerning the calculations of energy savings, it should be noted that the luminaires are part of an
electrical network that is not measured by a meter. Admittedly, energy is not measured on the
majority of street luminaires. For such cases, the following billing procedure was put in place.
According to the document entitled Distributor’s Rates and Conditions, in chapter 9, rates are fixed
in the following manner in order to determine consumption within the framework of general public
lighting service:
9.4 - Rate
The rate for general public lighting service is 8.82¢ per kilowatthour for the supply of electricity.
9.5 – Determination of consumption
As a rule, the energy consumption is not metered. However, the Distributor may meter the
consumption if it deems appropriate. When it is not metered, the energy consumption is the product of the connected load and 345 hours of monthly utilization.
In the case of tunnels or other facilities that remain lighted 24 hours a day, the energy consumption is the product of the connected load and 720 hours of monthly utilization.
To establish the connected load, the Distributor takes into account the rated power of the bulb and accessories.
By adopting the following hypotheses:
1) Conventional, HPS, 100 watt lamp: 130 watts including ballast loss
2) LED lighting: 55 watts
3) 345 hours per monthly utilization
4) Energy cost: 8.82 ¢ / kWh
Power savings are then 130 – 55 = 75 watts
Annual consumption is then:
“LED street lighting in the municipality of Saint-Gédéon-de-Beauce within the framework of advanced lighting technologies” 88 LTE-RT-2011-0076 Public distribution
75 watts x 345 hours / month x 12 month / year = 310 500 Wh per year or 310 kWh
Annual monetary savings per luminaire are:
310 kWh x 0.0882 $ / kWh = $27.34
In the case where a LED luminaire consumes 65 watts and an HPS luminaire 130 watts, we obtain
65 watts in power savings (130 watts – 65 watts). It is possible to take the monetary savings of
$27.34 that we get when power consumption is reduced to 75 watts, and to cross-multiply to get
monetary savings for a reduction of 65 watts.
$27.34 x (65/75) = $23.69
Annual monetary savings in energy for one street luminaire then become $23.69 for a reduction of
power of 65 watts, from 130 watts to 65 watts.
“LED street lighting in the municipality of Saint-Gédéon-de-Beauce within the framework of advanced lighting technologies” 89 LTE-RT-2011-0076 Public distribution
Annex I: Specifications of the City of Los Angeles
This annex provides specifications for LED luminaires provided by the municipality of Los Angeles,
which undertook a major street-luminaire replacement project in residential sectors. It is interesting
to note that the following specifications were included:
i) Type II and Type III luminaires;
ii) power factor greater than 0.9;
iii) a nominal CCT of 4000°K;8
iv) a minimum IP of IP66.
8 Personal communication, March 2011, Ed Ebrahimian (City of Los Angeles)
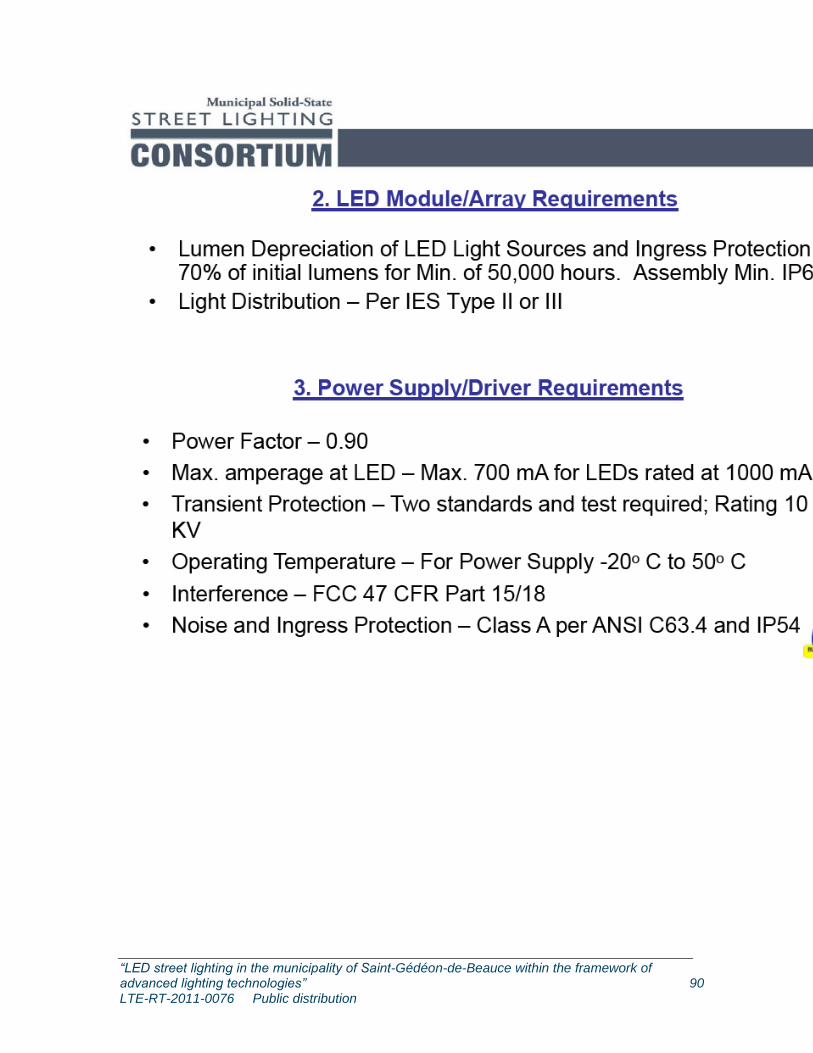
“LED street lighting in the municipality of Saint-Gédéon-de-Beauce within the framework of advanced lighting technologies” 90 LTE-RT-2011-0076 Public distribution
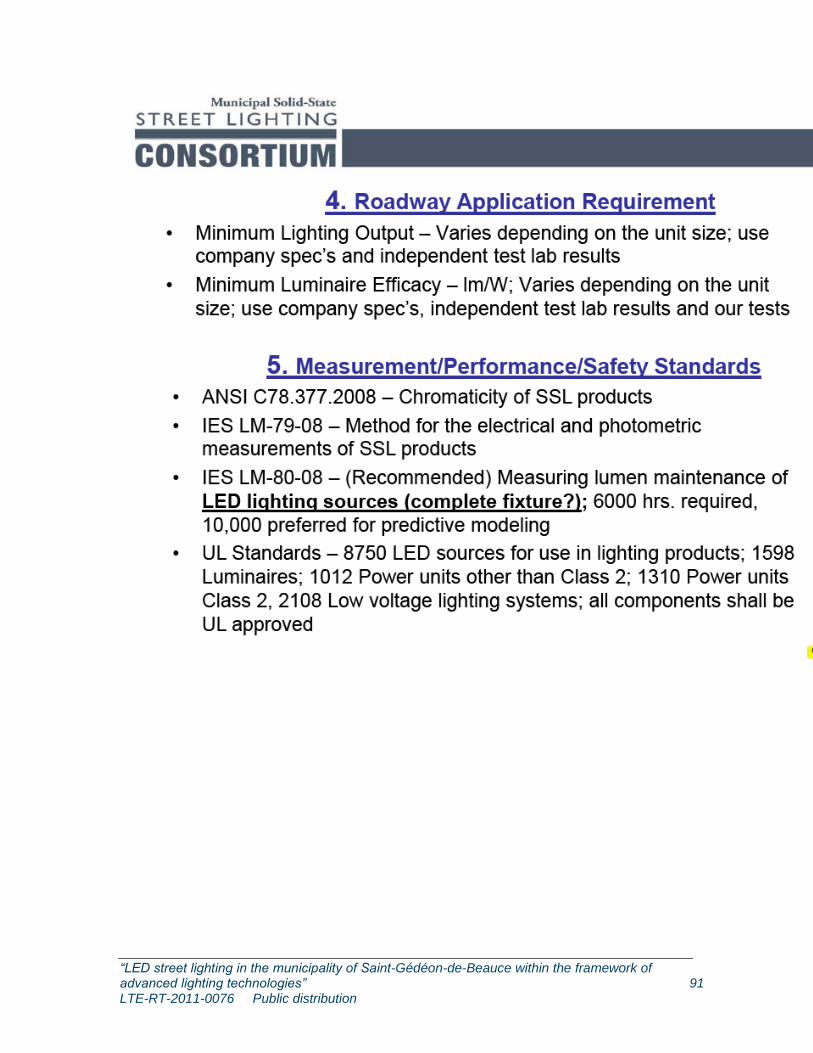
“LED street lighting in the municipality of Saint-Gédéon-de-Beauce within the framework of advanced lighting technologies” 91 LTE-RT-2011-0076 Public distribution

“LED street lighting in the municipality of Saint-Gédéon-de-Beauce within the framework of advanced lighting technologies” 92 LTE-RT-2011-0076 Public distribution
“LED street lighting in the municipality of Saint-Gédéon-de-Beauce within the framework of advanced lighting technologies” 93 LTE-RT-2011-0076 Public distribution