Embed Size (px)
Citation preview

Proceedings World Geothermal Congress 2010 Bali, Indonesia, 25-29 April 2010
1
“Earth Research” 3-Dimensional Geological Modelling of Geothermal Systems in New Zealand – a New Visualisation Tool
Sarah D. Milicich1, Marcos A. van Dam2, Michael D. Rosenberg1, Andrew J. Rae1 and Greg Bignall1 1GNS Science, Wairakei Research Centre, 114 Karetoto Road, Wairakei, Taupo, New Zealand
2Applied Research Associates NZ Ltd., 47 Hereford St, PO Box 3894, Christchurch, New Zealand
Keywords: New Zealand, Taupo Volcanic Zone, 3D modelling, stratigraphy, structural relationships, mineralogy, fluid flow.
ABSTRACT
Diagrammatic 2D representation (i.e., cross-sections and maps) of drillhole data (e.g. stratigraphy, permeable zones, secondary mineral occurrence) and inferences (e.g. hydrology, structural relations) have historically been used for visualisation. Advances have been made using newly developed 3D computer modeling software where we are able to render detailed geological information (e.g., stratigraphy, structure, hydrothermal alteration mineralogy) and overlay it with hydrological data (e.g., temperature, flow data). This provides greater insights into active fluid flow behaviour in the geothermal reservoir, and the thermal and chemical evolution of the geothermal system, leading to greater efficiency in the decision-making processes at all stages of field exploration, reservoir development and production.
“Earth Research” is 3D modelling software that has been developed by ARANZ (a New Zealand-based software development company), with scientific input from GNS Science and Contact Energy Ltd., to image geology and structure of high-temperature geothermal systems of the Taupo Volcanic Zone (TVZ), New Zealand. This visualisation software incorporates user-defined geothermal well information such as geology (e.g., stratigraphy, inferred faulting), hydrothermal alteration mineralogy (e.g., intensity, rank, occurrence), temperatures, pressures, and feed zone locations. 3D visualisation field models that have been utilised for planning exploration drilling strategies and reservoir management of fields already developed for electricity generation.
1. INTRODUCTION
The understanding of a geothermal field benefits from an accurate representation of the geology and structure supporting the geothermal resource. To do this, the spatial relationships of geological volumes need to be represented. Accurate logging and mapping are used to constrain the geology at depth, with 3D geological models increasingly being used to represent and aid interpretation of the relationships between geological units and structures such as faults. Modelling of geology in 3D has been used since the last 1980’s, commonly using the method of Lorensen and Cline (1987), gridding data using a marching cubes meshing algorithm to create isosurfaces. Until recently, geological modelling in geothermal applications has been based on the interpretation of 2D cross sections and
geological maps built up from surface mapping, well log data, seismic surveys and other geophysical surveys. 3D modelling gives the ability to interpolate the geometry of a geological unit or structure at depth from scattered and varied data. 3D visualisation of geological structures is an effective way to create understanding of geological features.
Working with industry partners Contact Energy Ltd and Mighty River Power, 3D modelling is being applied to geothermal fields to aid with interpretation and development of the geothermal resource. In this paper we will focus on the modelling of the geology of Ohaaki Geothermal Field (Figure 1) in the TVZ.
Figure 1: Location of the Ohaaki Geothermal Field, New Zealand.
2. MODEL SPECIFICS
ARANZ has been working in collaboration with GNS Science and Contact Energy Ltd. to develop a 3D modelling tool specific to the geothermal industry. The software extends the functionality of Leapfrog™ (Cowan et al., 2004), a commercial software product developed for the mining industry, with additional tools for modelling geology, hydrothermal alteration, temperature and feed zones in a geothermal environment. This newly developed software is called Earth Research
Milicich et al.
2
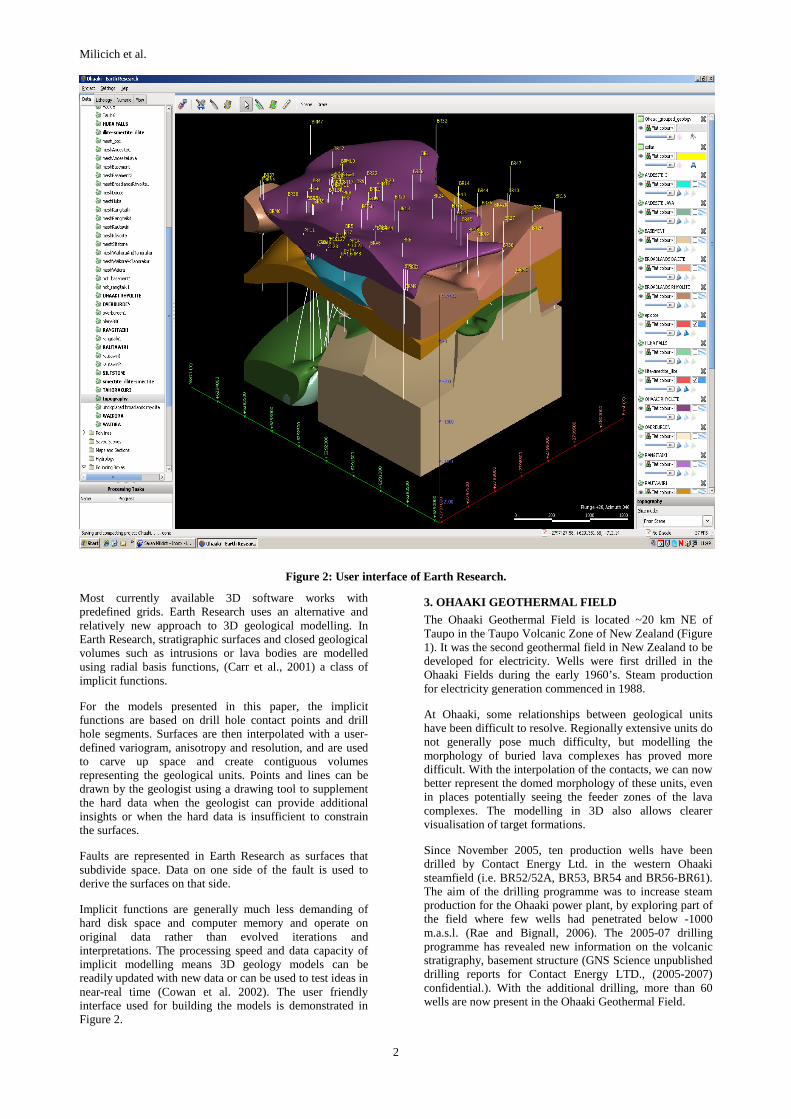
Figure 2: User interface of Earth Research.
Most currently available 3D software works with predefined grids. Earth Research uses an alternative and relatively new approach to 3D geological modelling. In Earth Research, stratigraphic surfaces and closed geological volumes such as intrusions or lava bodies are modelled using radial basis functions, (Carr et al., 2001) a class of implicit functions.
For the models presented in this paper, the implicit functions are based on drill hole contact points and drill hole segments. Surfaces are then interpolated with a user-defined variogram, anisotropy and resolution, and are used to carve up space and create contiguous volumes representing the geological units. Points and lines can be drawn by the geologist using a drawing tool to supplement the hard data when the geologist can provide additional insights or when the hard data is insufficient to constrain the surfaces.
Faults are represented in Earth Research as surfaces that subdivide space. Data on one side of the fault is used to derive the surfaces on that side.
Implicit functions are generally much less demanding of hard disk space and computer memory and operate on original data rather than evolved iterations and interpretations. The processing speed and data capacity of implicit modelling means 3D geology models can be readily updated with new data or can be used to test ideas in near-real time (Cowan et al. 2002). The user friendly interface used for building the models is demonstrated in Figure 2.
3. OHAAKI GEOTHERMAL FIELD
The Ohaaki Geothermal Field is located ~20 km NE of Taupo in the Taupo Volcanic Zone of New Zealand (Figure 1). It was the second geothermal field in New Zealand to be developed for electricity. Wells were first drilled in the Ohaaki Fields during the early 1960’s. Steam production for electricity generation commenced in 1988.
At Ohaaki, some relationships between geological units have been difficult to resolve. Regionally extensive units do not generally pose much difficulty, but modelling the morphology of buried lava complexes has proved more difficult. With the interpolation of the contacts, we can now better represent the domed morphology of these units, even in places potentially seeing the feeder zones of the lava complexes. The modelling in 3D also allows clearer visualisation of target formations.
Since November 2005, ten production wells have been drilled by Contact Energy Ltd. in the western Ohaaki steamfield (i.e. BR52/52A, BR53, BR54 and BR56-BR61). The aim of the drilling programme was to increase steam production for the Ohaaki power plant, by exploring part of the field where few wells had penetrated below -1000 m.a.s.l. (Rae and Bignall, 2006). The 2005-07 drilling programme has revealed new information on the volcanic stratigraphy, basement structure (GNS Science unpublished drilling reports for Contact Energy LTD., (2005-2007) confidential.). With the additional drilling, more than 60 wells are now present in the Ohaaki Geothermal Field.
Milicich et al.
3
3.1 Stratigraphy
The stratigraphy of the western Ohaaki steamfield has been described by Rae et al. (2007) and Rae et al. (2008), and is summarised in Table 1. Drilling in the area since the 1960’s revealed a sequence of lacustrine deposits (Huka Falls Formation), lavas and breccias (Ohaaki Rhyolite, Tahorakuri Andesite and Dacite, Rautawiri Breccia), reworked volcaniclastic sediments, tuff and pumice breccia (Waiora Formation and Tahorakuri Formation) and variably welded pyroclastic formations (Rangitaiki Ignimbrite).
The spatial extent of some geological formations is important to understanding the hydrology of the geothermal resource. Some key formations host the majority of the deep feed zones in the field. The Rangitaiki Ignimbrite hosts major intra-formation feed zones. The deeper volcaniclastic of the Tahorakuri Formation and the intercalations of pebble conglomerate (Waikora Formation) also host intra-formation permeability. The Waikora Formation intercalations may also be important for providing lateral fluid pathways in the deep reservoir. These formations have infilled graben structures resulting from regional faulting. The modelling of these units allows us to find where faulting has allowed thick deposits of this formation to accumulate, allowing clearer visualisation of target formations. Many feed zones at Ohaaki are related to inter-formation contacts. The modelling of these contacts allows these permeable zones to more accurately be targeted.
The shallow lava bodies such as the Ohaaki Rhyolite, Broadlands Rhyolite and Broadlands Dacite commonly provide a host to shallow cool inflows into the geothermal field. The understanding of the morphology and location of
these lavas potentially allows better design of new wells, allowing these units to be cased off.
3.2 Structure
Ohaaki is located in a NE-trending, asymmetrical graben within the Taupo Volcanic Zone (TVZ), with the western side of the fault-bounded trough downthrown to a greater extent than the eastern side. Fault movements have re-enforced the tilted geometry, and controlled the thickness of pyroclastics, lavas and sediments filling the graben. Stratigraphic intersections in wells across the western steamfield reveal the ~140 Ma basement greywacke deepens to the west by several hundred metres, and points to NE-striking, NW-dipping faults that have promoted fluid pathways through to the overlying volcanic succession.
The greywacke basement topographic surface, determined previously using seismic, gravity and well data has been considered to be influenced by major NE-trending normal faults, block faulted down to the northwest (Wood et al., 2001). However, regional NW-trending structures that affect basement rocks cropping out in the Kaimanawa and Urewera Ranges, east of the Taupo Volcanic Zone, must also be considered as having an influence on the basement topography at Ohaaki (Wan and Hedenquist, 1981).
The greywacke basement topographic surface is the unit most clearly affected by faulting. The exact location of these faults is difficult to determine. The modelling of these structures in 3D aids with location of the structures, and allows visualisation where these have extended into the overlying volcaniclastic sequences. This aids field developers to target the regions where faulting might have promoted upflow of fluid into target formations above the greywacke basement.
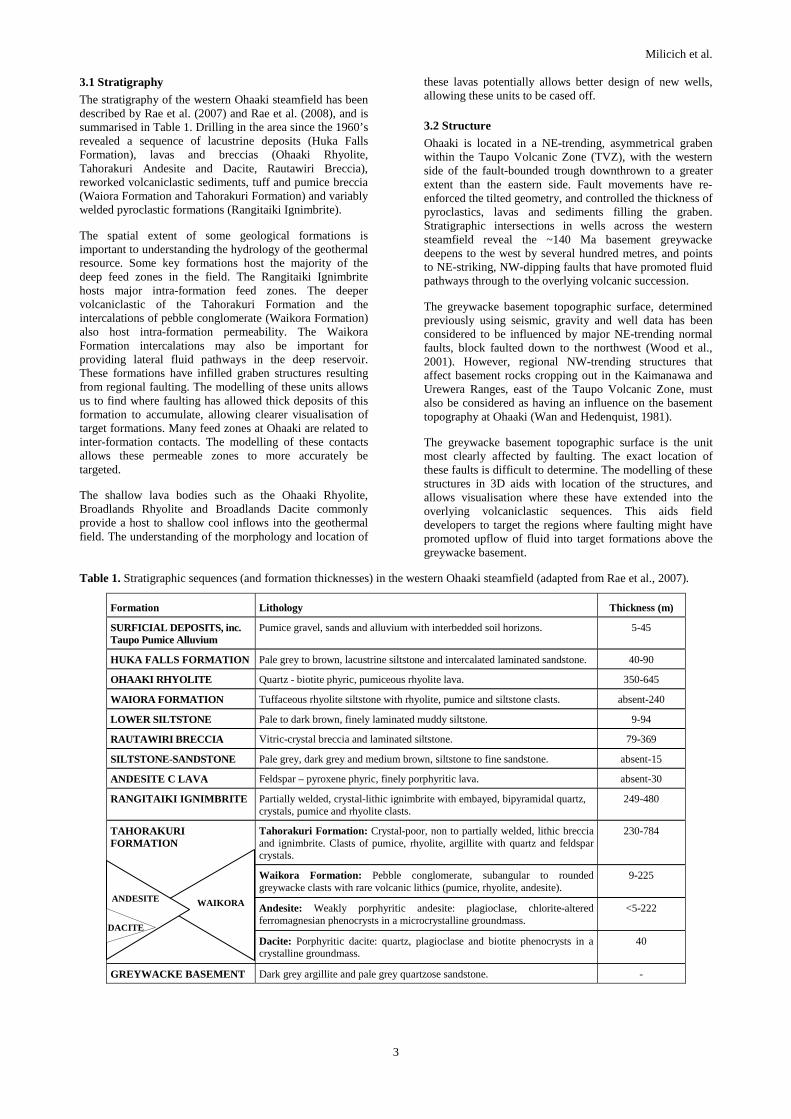
Table 1. Stratigraphic sequences (and formation thicknesses) in the western Ohaaki steamfield (adapted from Rae et al., 2007).
Formation Lithology Thickness (m)
SURFICIAL DEPOSITS, inc. Taupo Pumice Alluvium
Pumice gravel, sands and alluvium with interbedded soil horizons. 5-45
HUKA FALLS FORMATION Pale grey to brown, lacustrine siltstone and intercalated laminated sandstone. 40-90
OHAAKI RHYOLITE Quartz - biotite phyric, pumiceous rhyolite lava. 350-645
WAIORA FORMATION Tuffaceous rhyolite siltstone with rhyolite, pumice and siltstone clasts. absent-240
LOWER SILTSTONE Pale to dark brown, finely laminated muddy siltstone. 9-94
RAUTAWIRI BRECCIA Vitric-crystal breccia and laminated siltstone. 79-369
SILTSTONE-SANDSTONE Pale grey, dark grey and medium brown, siltstone to fine sandstone. absent-15
ANDESITE C LAVA Feldspar – pyroxene phyric, finely porphyritic lava. absent-30
RANGITAIKI IGNIMBRITE Partially welded, crystal-lithic ignimbrite with embayed, bipyramidal quartz, crystals, pumice and rhyolite clasts.
249-480
Tahorakuri Formation: Crystal-poor, non to partially welded, lithic breccia and ignimbrite. Clasts of pumice, rhyolite, argillite with quartz and feldspar crystals.
230-784
Waikora Formation: Pebble conglomerate, subangular to rounded greywacke clasts with rare volcanic lithics (pumice, rhyolite, andesite).
9-225
Andesite: Weakly porphyritic andesite: plagioclase, chlorite-altered ferromagnesian phenocrysts in a microcrystalline groundmass.
<5-222
TAHORAKURI FORMATION
Dacite: Porphyritic dacite: quartz, plagioclase and biotite phenocrysts in a crystalline groundmass.
40
GREYWACKE BASEMENT Dark grey argillite and pale grey quartzose sandstone. -
DACITE
ANDESITE WAIKORA

Milicich et al.
4
3.3 3D Model
Insights on geology and structure from the deep drilling at the Ohaaki Geothermal Field have been used in combination with modelling software Earth Research to develop a 3D model of the geology and structure in the geothermal field.
Figure 3 shows a series of modeled geological units. The greywacke basement, an example of volcaniclastic sediments (Tahorakuri Formation), lava bodies (Ohaaki Rhyolite and Tahorakuri Andesite), and lacustrine sediments (Huka Falls Formation) are visualised. The major NE-trending faults inferred in the greywacke are clear in the top left of the figure, with the basement deepening to the NW of the geothermal field. The basement structure, although inferred in the past, (Milicich et al., 2008; Rae and Bignall, 2006; Rae et al., 2007; Rae et al. 2008), has been difficult to interpret. The ability to visualise this in 3D has allowed the downfaulted blocks in the greywacke to be more clearly defined. The infilling nature of the Tahorakuri and Waikora Formation (top right, Figure 3) can then be visualised. This allows targeting the regions of the field were these formations are at their thickest. The morphology of the Ohaaki Rhyolite is clear, with its domed form and lobate flow features. Potential feeder zones of the rhyolite are visible.
Along with modelling geology, Earth Research can be used to interpolate other surfaces and numeric data. An example is the modeling of clay alteration. Figure 4 shows the interpolation of surface at the transition between smectite and illite-smectite. Other information such as first appearance of epidote has been plotted as a temperature indicator, and distribution of adularia as a permeability indicator.
Visualisation of this kind of data can aid in understanding of the evolution of a geothermal field. Relationships such as heating, cooling and changes in chemistry can start to be visualised across a whole geothermal field, rather than solely at the localized areas around drilled wells.
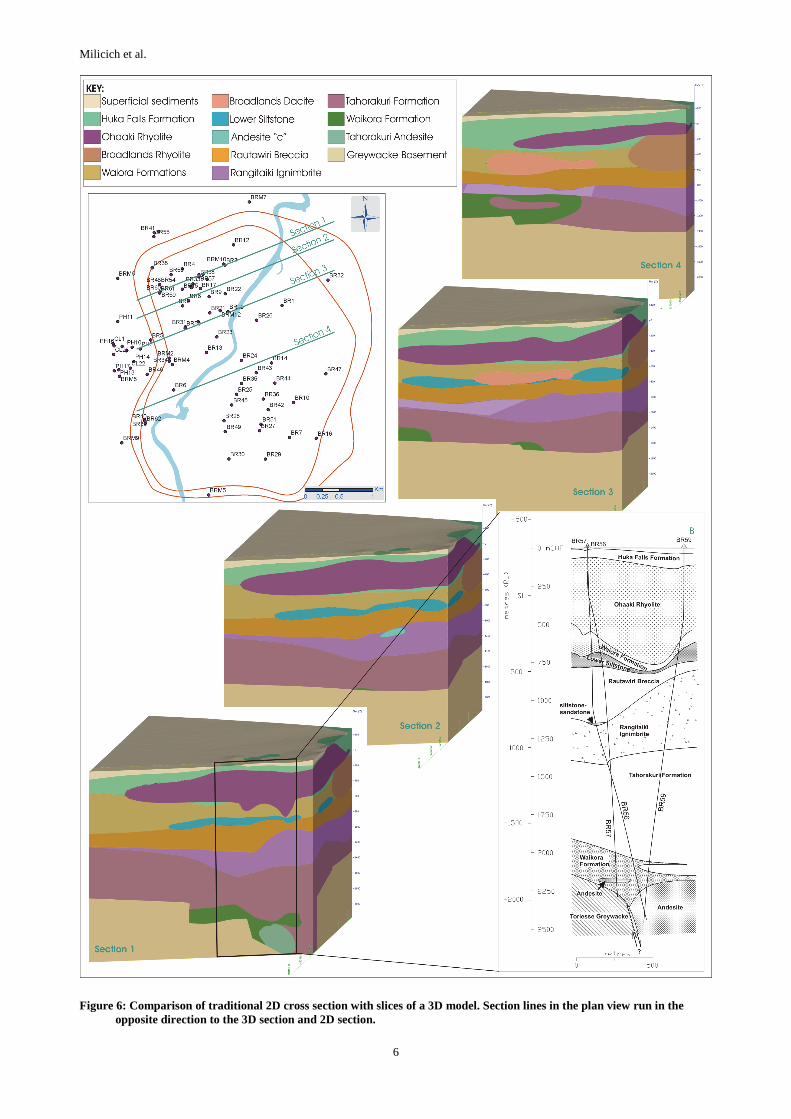
The development of cross sections through the 3D model likely gives a more accurate representation of the geology than traditional 2D sections. Data is easily interpolated in all directions significantly more easily than when 2D sections are built. Errors resulting from projecting well data onto the 2D section are avoided. A comparison of a 2D section drawn through part of Ohaaki is compared with sections cut through the 3D model of the area (Figure 6).
Figure 3: 3D representation of selected geological units within the Ohaaki Geothermal Field (view is towards the SE).

Milicich et al.
5
Figure 4: Blue surface represents the transition between smectite and illite-smectite clays.
4. APPLICATIONS
Earth Research is a tool that allows a visual representation of a geothermal field to be developed in 3D. Along with modelling geology, this software can readily process and present in 3D data such as structure, physical rock properties, temperature, geothermal alteration, and pressure. Known feed zones in drilled wells can be mapped, and potentially correlated across a geothermal field. Geophysical and seismic data can also be input. There is potential to interface with a flow modelling applications. Data produced in the model can be exported in a format compatible with reservoir modelling software.
Earth Research provides field developers and scientists with a flexible tool that should assist with field management and future development strategies. Earth Research can be used as a well targeting tool. Utilising the temperature profiles, feed zone information and known permeabilities of geological formation, highly prospective areas of a geothermal field can be targeted. Once a well location and drilling direction is chosen, a predictive borehole tool can be used to interpret depths geological formations likely to be encountered during drilling (Figure 5). Mapping of alteration across a field can be used to aid interpretation of geophysical data and with comparison of temperature data, can aid in interpretation of evolution of the geothermal resource.
Figure 5: An example of the predictive borehole tool can be used, giving the output of geological formation from the model along the chosen well path.
Milicich et al.
6
Figure 6: Comparison of traditional 2D cross section with slices of a 3D model. Section lines in the plan view run in the opposite direction to the 3D section and 2D section.
Milicich et al.
7
Acknowledgments
GNS Science would like to acknowledge the support of Contact Energy Ltd. in allowing the publication of the Ohaaki data in this paper.
REFERENCES
Bignall, G.: Hotter and deeper: New Zealand’s research programme to harness its deep geothermal resources. Proc. World. Geoth. Cong. (2010).
Bignall, G., Tsuchiya N., and Browne. P.R.L.: Use of illite crystallinity as a temperature indicator in the Orakei Korako Geothermal System, New Zealand. Geoth. Resources Council Trans., 25, (2001). 339-344.
Browne, P.R.L.: Hydrothermal alteration in active geothermal fields. Annu. Rev. Earth. Planet. Sci., 6, (1978), 229-250.
Browne, P.R.L. and Ellis, A.J.: The Ohaaki-Broadlands hydrothermal area, New Zealand: mineralogy and associated geochemistry. Am. J. Sci., 269, (1970), 97-131.
Carr, J.C., Beatson, R.K., Cherrie, J.B., Mitchell, T.J., Fright, W.R., McCallum, B.C. and Evans, T.R.: Reconstruction and representation of 3D objects with radial basis functions. Proc. of the 28th ann.conf. on Computer graphics and interactive techniques. 67 – 76 (2001).
Christenson, B.W., Mroczek, E.K., Kennedy, B.M.. van Soest, M.C., Stewart, M.K. and Lyon G.: Ohaaki reservoir chemistry: characteristics of an arc-type hydrothermal system in the Taupo Volcanic Zone, New Zealand. J. Volcanol. Geoth. Res. 115, (2002), 53-82.
Cowan, E.J., Beatson, R.K., Fright, W.R., McLennan, T.J. and Mitchell, T.J.: Rapid geological modelling. App. Structural Geo. for Mining Expl. and Miing. International Symposium (2002).
Cowan, E.J., Lane, R.G. and Ross, H.J.: Leapfrog's implicit drawing tool: a new way of drawing geological objects of any shape rapidly in 3D. Mining Geo, 2004: innovations in Coal and Metalliferous Mining Geology. Bulletin 41 (2004).
Gravely, D.M., Wilson, C.J.N., Rosenberg, M.D. and Leonard, G.S.: The nature and age of Ohakuri Formation and Ohakuri Group rocks in surface exposures and geothermal drillhole sequences in the central Taupo Volcanic Zone, New Zealand. N. Z. J. Geo. Geophy., 49, (2006), 305-308
Lorensen, W.E. and Cline, H.E.: Marching cubes: a high resolution 3D surface reconstruction algorithm. Computer Graphics. 21 (4), (1982), 163-169.
Milicich, S.D.; Bignall, G.; Rae, A.J.; Rosenberg, M.D.: Lithological and structural controls on fluid flow and hydrothermal alteration in the western Ohaaki Geothermal Field (New Zealand): insights from recent deep drilling. Transactions, Geothermal Resources Council, 32, (2008), 303-307
Rae, A.J.; Bignall, G.: Production well drilling options and geological review: western Ohaaki borefield, Ohaaki. GNS Science consultancy report 2006/9, confidential, (2006).
Rae, A.J., Rosenberg, M.D., Bignall, G., Kilgour, G.N., and Milicich, S.D.: Geological Results of production well drilling in the western steamfield, Ohaaki Geothermal system: 2005 – 2007. 29th NZ Geoth. Work (2007).
Rae, A.J.; Rosenberg, M.D.; Kilgour, G.N.; Milicich, S.D.; Bignall, G.: Geological insights from recent deep drilling at Ohaaki Geothermal Field, New Zealand. 29th PNOC EDC Geoth. Conference, (2008), 55-60.
Simmons, S.F., and Christenson B.W.: Origins of calcite in a boiling geothermal system. Am. J. Sci., 294, (1994), 361-400.
GNS Science unpublished consultancy reports for Contact Energy Ltd, (2005-2007), confidential.
Wan, T-F. and Hedenquist, J.W.: A reassessment of the structural control of the Broadlands geothermal field, New Zealand. 3rd N.Z. Geoth. Workshop, (1981), 195-202.
Wood, C.P., Braithwaite, R.L. and Rosenberg, M.D.,: Basement structure, lithology and permeability at Kawerau and Ohaaki geothermal fields, New Zealand. Geothermics, 30, (2001), 461-481.