Embed Size (px)
DESCRIPTION
Presented at ANZSEE 2012 Conference 'Green Growth or De-growth?', 12-15 November, Bond University, Gold Coast.
Citation preview
Factor Shares from Mining: Remote NT Case Studies
Dr Boyd D Blackwell*, Prof. Brian Dollery**
*Post-doctorial Research Fellow, UNE Business School and CRC REP
**UNE Business School and Director, Centre for Local Government
Presentation made to the 2012 ANZSEE Conference, Green growth or de-growth? 12 – 15
November, 2012, Bond University, Gold Coast
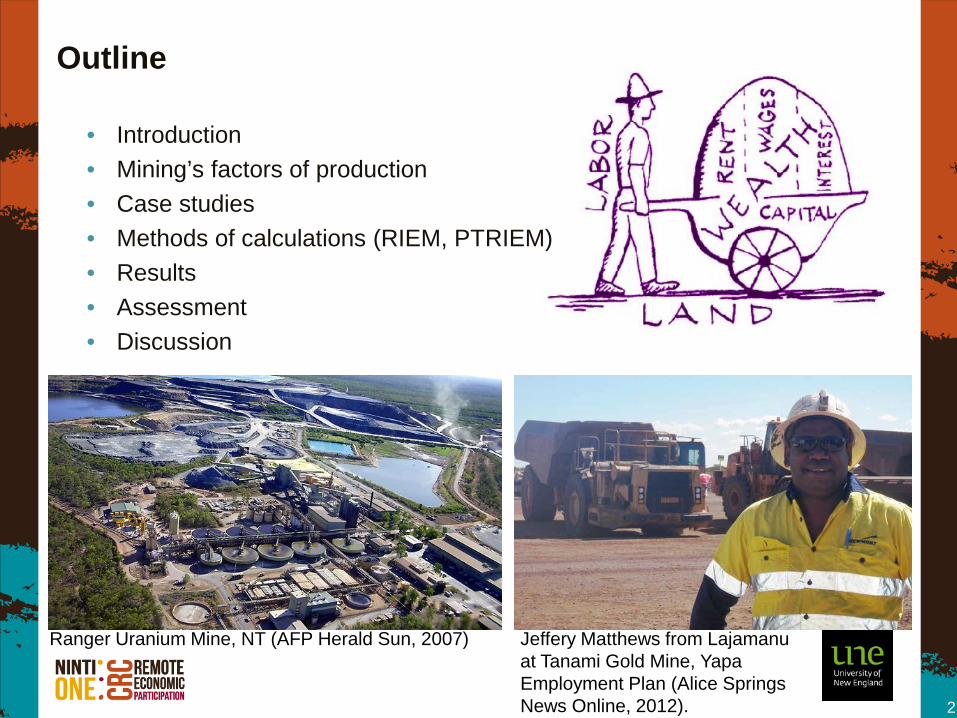
• Introduction • Mining’s factors of production • Case studies • Methods of calculations (RIEM, PTRIEM) • Results • Assessment • Discussion
Outline
2
Ranger Uranium Mine, NT (AFP Herald Sun, 2007) Jeffery Matthews from Lajamanu at Tanami Gold Mine, Yapa Employment Plan (Alice Springs News Online, 2012).
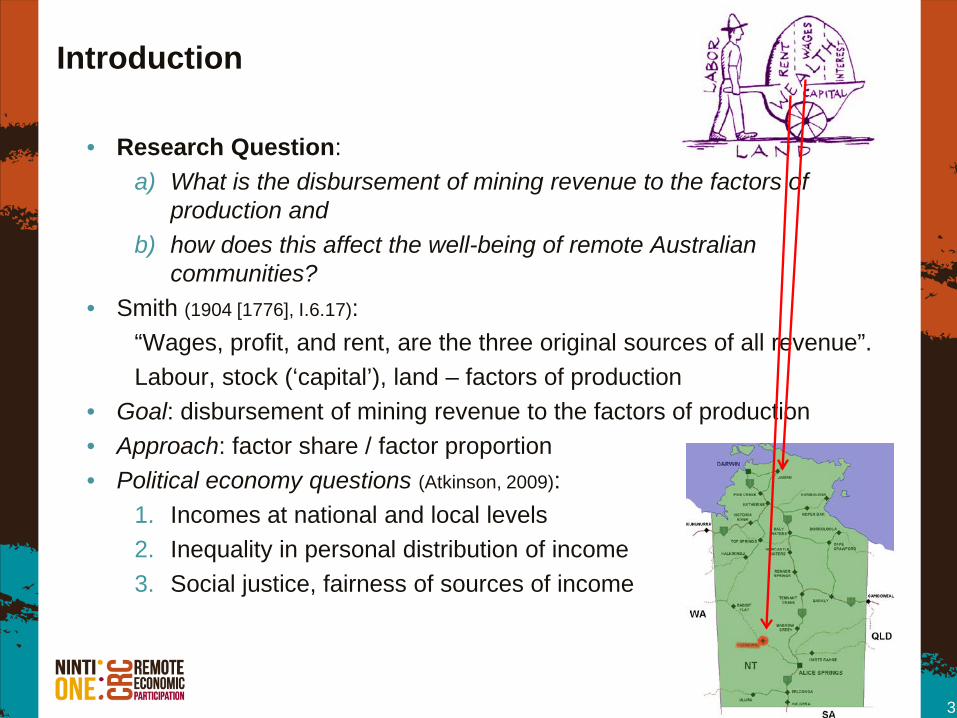
Introduction
• Research Question: a) What is the disbursement of mining revenue to the factors of
production and b) how does this affect the well-being of remote Australian
communities? • Smith (1904 [1776], I.6.17):
“Wages, profit, and rent, are the three original sources of all revenue”. Labour, stock (‘capital’), land – factors of production
• Goal: disbursement of mining revenue to the factors of production • Approach: factor share / factor proportion • Political economy questions (Atkinson, 2009):
1. Incomes at national and local levels 2. Inequality in personal distribution of income 3. Social justice, fairness of sources of income
3
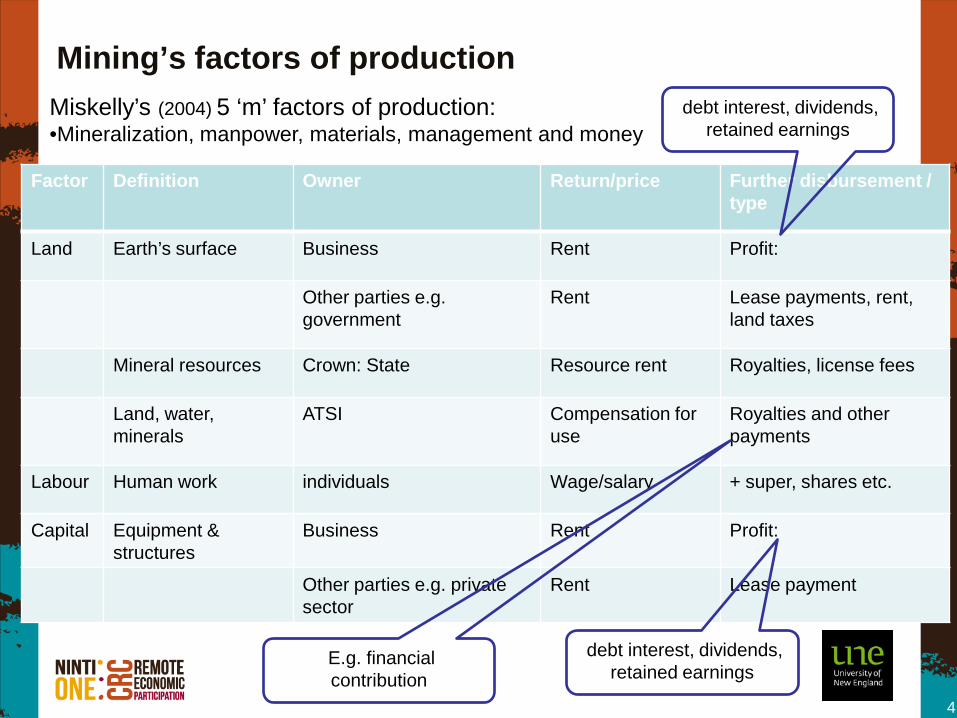
Mining’s factors of production
Factor Definition Owner Return/price
Further disbursement / type
Land Earth’s surface Business Rent Profit:
Other parties e.g. government
Rent Lease payments, rent, land taxes
Mineral resources Crown: State Resource rent Royalties, license fees
Land, water, minerals
ATSI Compensation for use
Royalties and other payments
Labour Human work individuals Wage/salary + super, shares etc.
Capital Equipment & structures
Business Rent Profit:
Other parties e.g. private sector
Rent Lease payment
4
debt interest, dividends, retained earnings
debt interest, dividends, retained earnings
E.g. financial contribution
Miskelly’s (2004) 5 ‘m’ factors of production: •Mineralization, manpower, materials, management and money
Case studies: NT Context
• NT is special • Institutionally • Economically • Historically • Socially • Culturally • Politically • Ecologically, environmentally
• Examples • Institutionally
• Territory • Commonwealth’s role (Guj 2012)
• Uranium • ATSI land • Industrial relations
• Economically (NT Gov’t 2012b, pp. 1-2)
• Small open economy, GSP $16B* • Highly sensitive to shocks* • High output/income per capita* • Natural resources
• Mining • Cultural and natural heritage
5
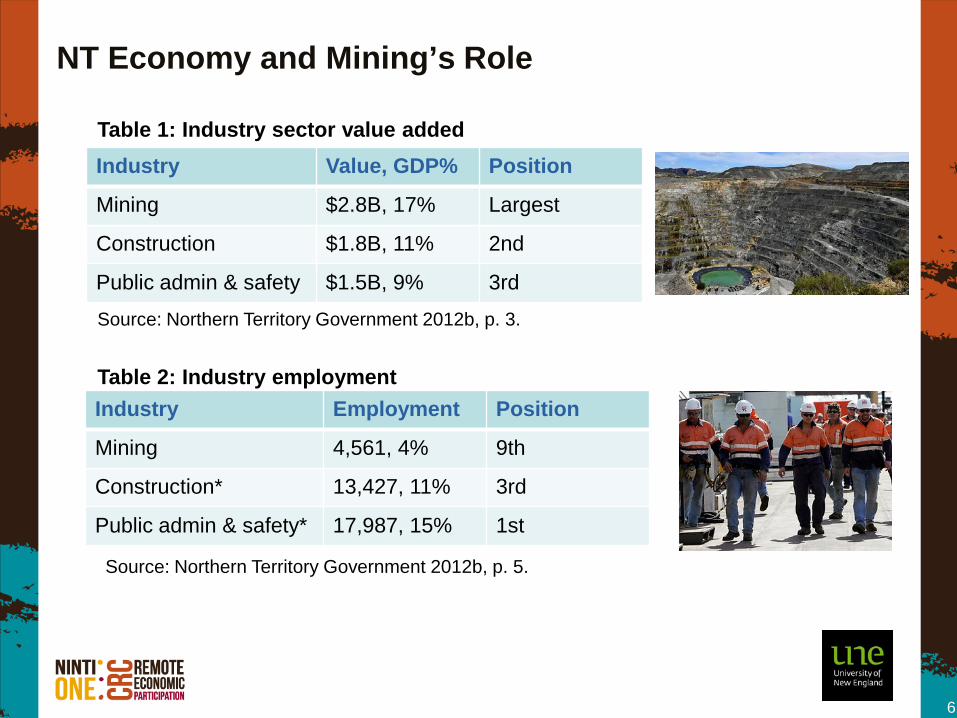
NT Economy and Mining’s Role
Industry Value, GDP% Position
Mining $2.8B, 17% Largest
Construction $1.8B, 11% 2nd
Public admin & safety $1.5B, 9% 3rd
6
Industry Employment Position
Mining 4,561, 4% 9th
Construction* 13,427, 11% 3rd
Public admin & safety* 17,987, 15% 1st
Source: Northern Territory Government 2012b, p. 3.
Table 1: Industry sector value added
Source: Northern Territory Government 2012b, p. 5.
Table 2: Industry employment
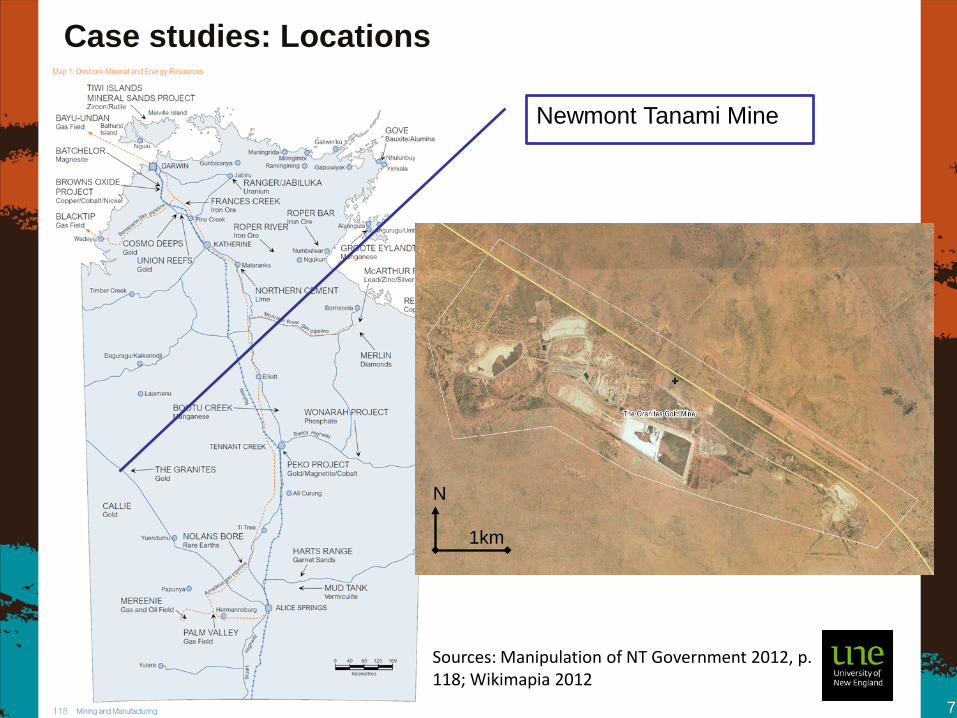
Case studies: Locations
Newmont Tanami Mine
7
Sources: Manipulation of NT Government 2012, p. 118; Wikimapia 2012
1km
N
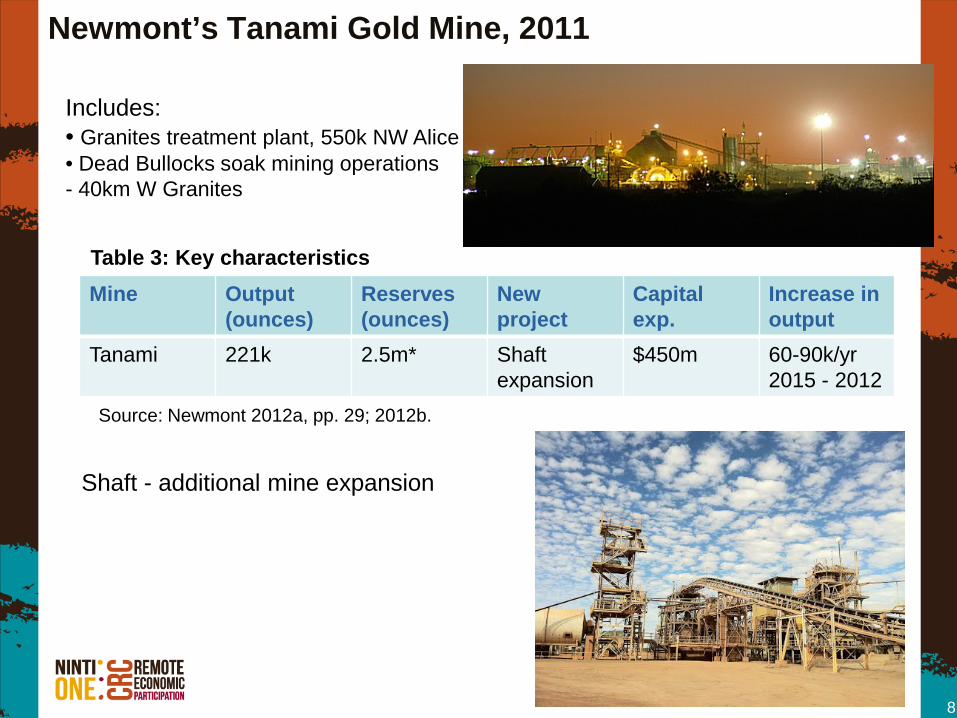
Newmont’s Tanami Gold Mine, 2011
Mine Output (ounces)
Reserves (ounces)
New project
Capital exp.
Increase in output
Tanami 221k 2.5m* Shaft expansion
$450m 60-90k/yr 2015 - 2012
8
Source: Newmont 2012a, pp. 29; 2012b.
Table 3: Key characteristics
Shaft - additional mine expansion
Includes: • Granites treatment plant, 550k NW Alice • Dead Bullocks soak mining operations - 40km W Granites
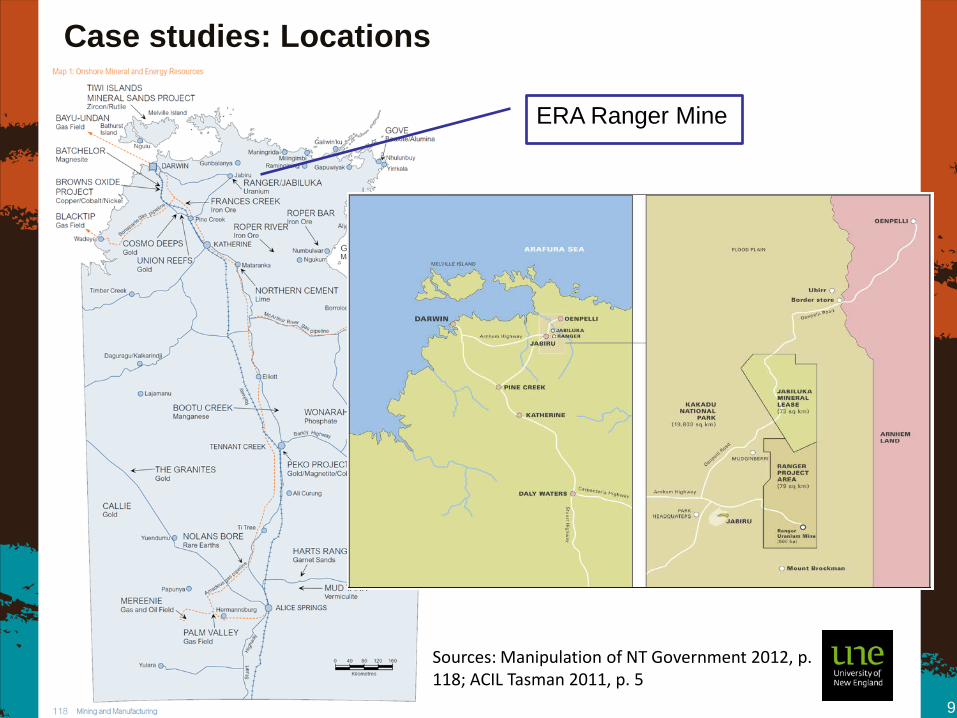
Case studies: Locations
ERA Ranger Mine
9
Sources: Manipulation of NT Government 2012, p. 118; ACIL Tasman 2011, p. 5
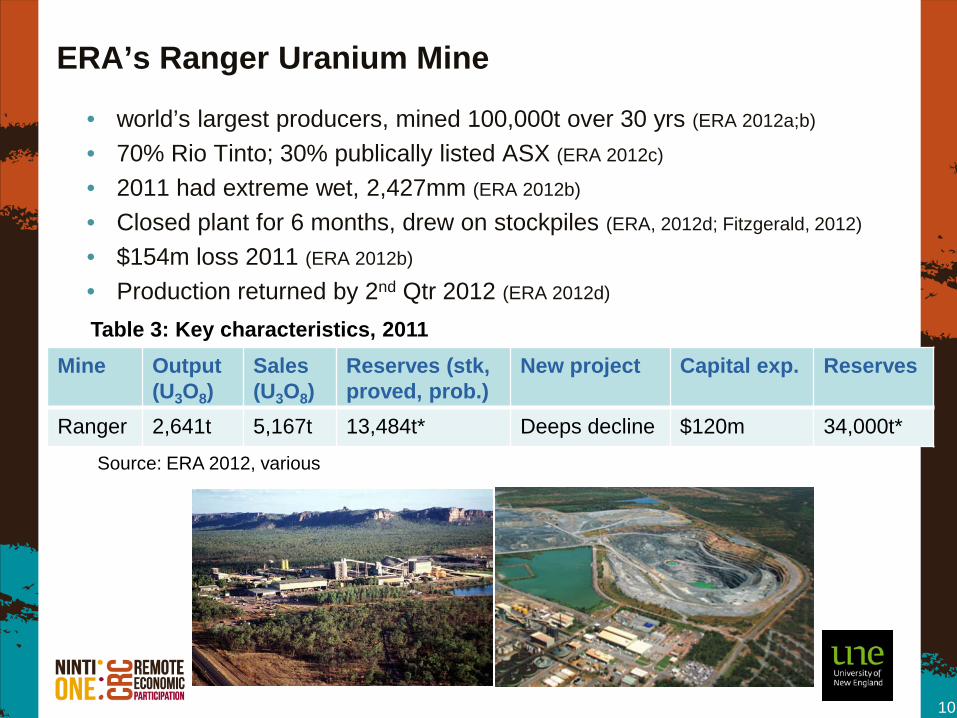
ERA’s Ranger Uranium Mine
• world’s largest producers, mined 100,000t over 30 yrs (ERA 2012a;b)
• 70% Rio Tinto; 30% publically listed ASX (ERA 2012c)
• 2011 had extreme wet, 2,427mm (ERA 2012b)
• Closed plant for 6 months, drew on stockpiles (ERA, 2012d; Fitzgerald, 2012)
• $154m loss 2011 (ERA 2012b)
• Production returned by 2nd Qtr 2012 (ERA 2012d)
10
Mine Output (U3O8)
Sales (U3O8)
Reserves (stk, proved, prob.)
New project Capital exp. Reserves
Ranger 2,641t 5,167t 13,484t* Deeps decline $120m 34,000t*
Source: ERA 2012, various
Table 3: Key characteristics, 2011
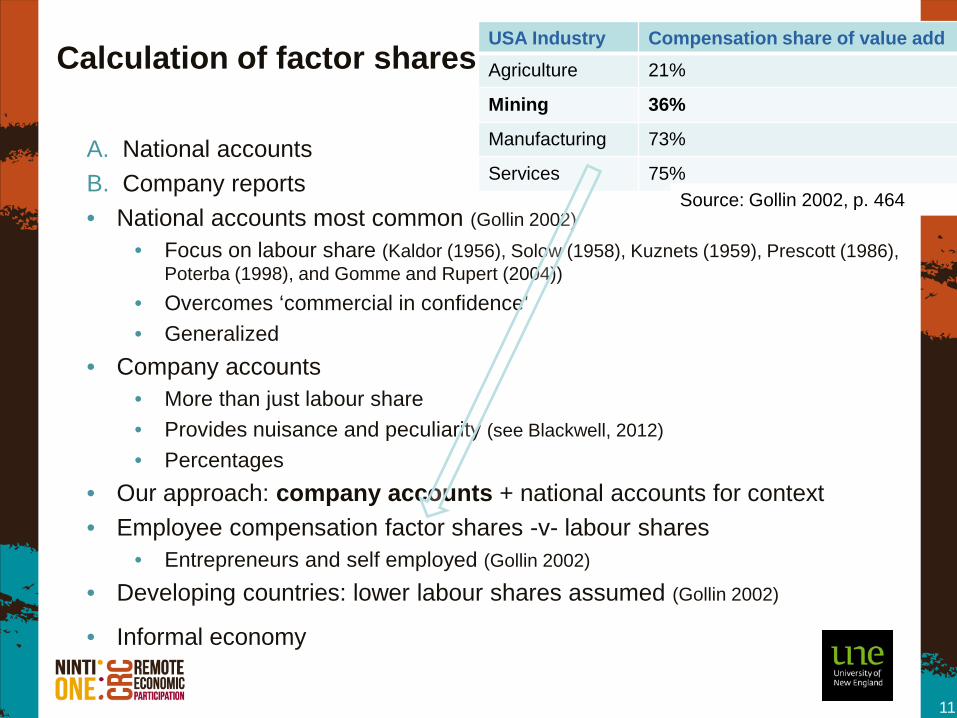
Calculation of factor shares
A. National accounts B. Company reports • National accounts most common (Gollin 2002)
• Focus on labour share (Kaldor (1956), Solow (1958), Kuznets (1959), Prescott (1986), Poterba (1998), and Gomme and Rupert (2004))
• Overcomes ‘commercial in confidence’ • Generalized
• Company accounts • More than just labour share • Provides nuisance and peculiarity (see Blackwell, 2012) • Percentages
• Our approach: company accounts + national accounts for context • Employee compensation factor shares -v- labour shares
• Entrepreneurs and self employed (Gollin 2002)
• Developing countries: lower labour shares assumed (Gollin 2002)
• Informal economy
11
USA Industry Compensation share of value add Agriculture 21%
Mining 36%
Manufacturing 73%
Services 75% Source: Gollin 2002, p. 464
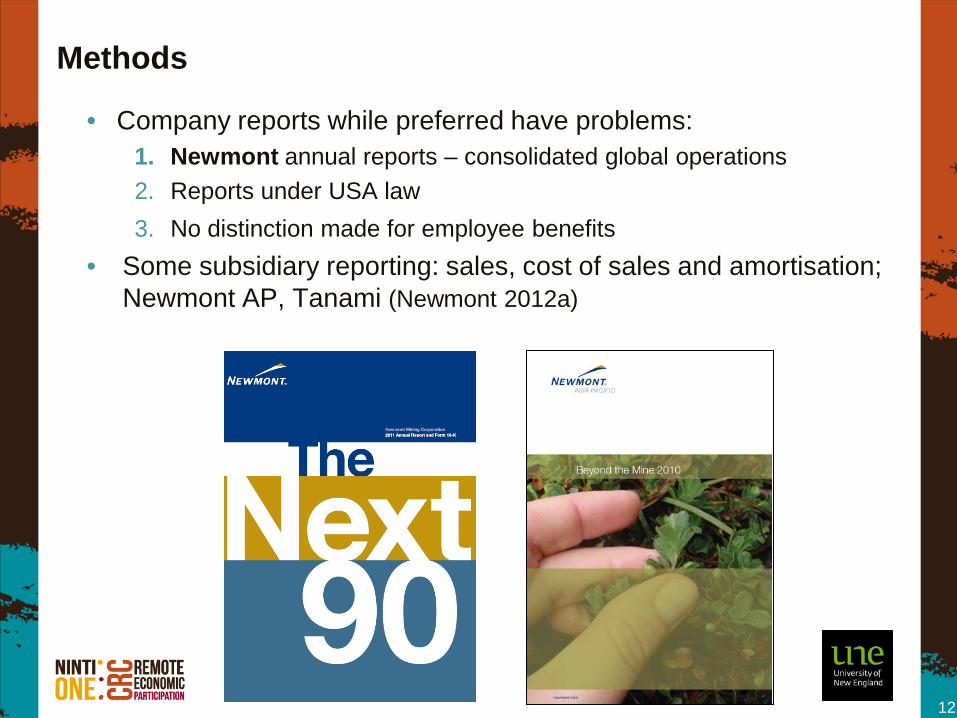
Methods
• Company reports while preferred have problems: 1. Newmont annual reports – consolidated global operations 2. Reports under USA law 3. No distinction made for employee benefits
• Some subsidiary reporting: sales, cost of sales and amortisation; Newmont AP, Tanami (Newmont 2012a)
12
Methods continued…
• ERA: 1. Reports under AUS law 2. Categorizes employee benefits 3. Represents Ranger (no other operations) 4. BUT: 2011/12 very wet – used 2010 instead
• Approach to Newmont: 1. 36% cut of labour from total cost of ‘material’ related
expenses • Based on 37% found for ERA; and 36% from USA Nat Acts
2. Requested an internal Tanami report (K Ellington 2012 pers. comm. Aug, Sep.) • % provided against total expenses not revenues • No % of expenses for taxes or royalties
13
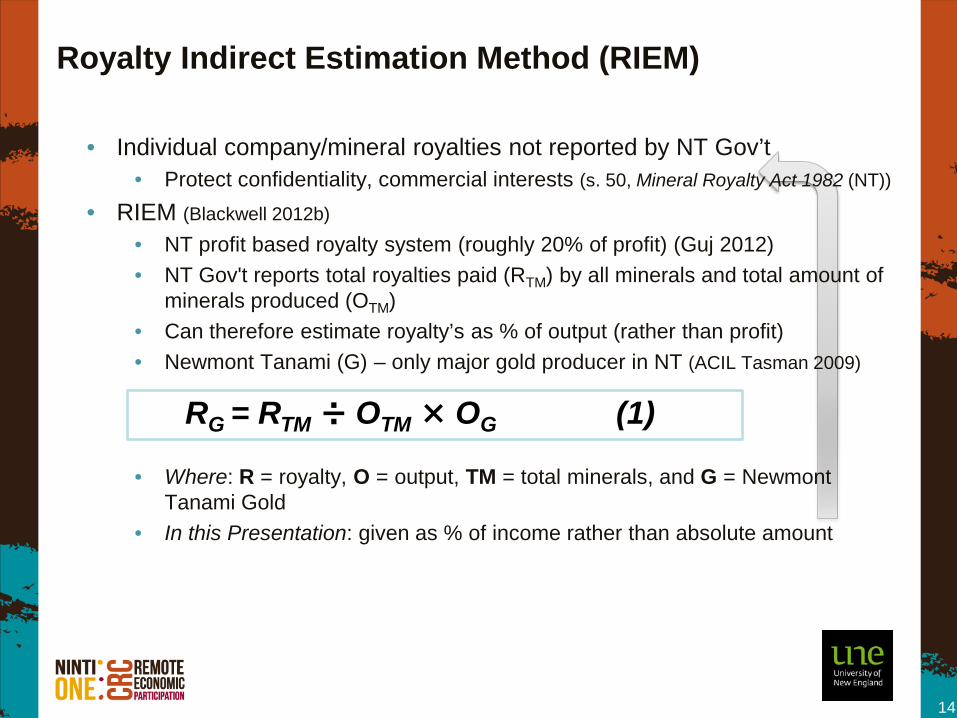
• Individual company/mineral royalties not reported by NT Gov’t • Protect confidentiality, commercial interests (s. 50, Mineral Royalty Act 1982 (NT))
• RIEM (Blackwell 2012b)
• NT profit based royalty system (roughly 20% of profit) (Guj 2012) • NT Gov't reports total royalties paid (RTM) by all minerals and total amount of
minerals produced (OTM) • Can therefore estimate royalty’s as % of output (rather than profit) • Newmont Tanami (G) – only major gold producer in NT (ACIL Tasman 2009)
• Where: R = royalty, O = output, TM = total minerals, and G = Newmont
Tanami Gold • In this Presentation: given as % of income rather than absolute amount
Royalty Indirect Estimation Method (RIEM)
14
RG = RTM ÷ OTM × OG (1)
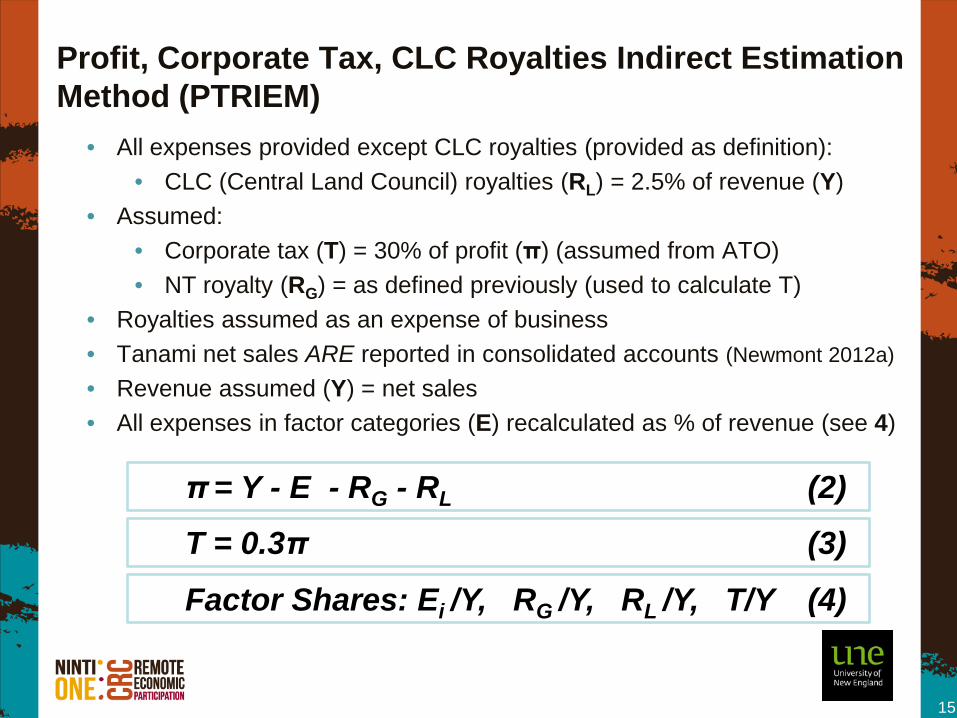
Profit, Corporate Tax, CLC Royalties Indirect Estimation Method (PTRIEM)
• All expenses provided except CLC royalties (provided as definition): • CLC (Central Land Council) royalties (RL) = 2.5% of revenue (Y)
• Assumed: • Corporate tax (T) = 30% of profit (π) (assumed from ATO) • NT royalty (RG) = as defined previously (used to calculate T)
• Royalties assumed as an expense of business • Tanami net sales ARE reported in consolidated accounts (Newmont 2012a) • Revenue assumed (Y) = net sales • All expenses in factor categories (E) recalculated as % of revenue (see 4)
15
π = Y - E - RG - RL (2)
T = 0.3π (3)
Factor Shares: Ei /Y, RG /Y, RL /Y, T/Y (4)
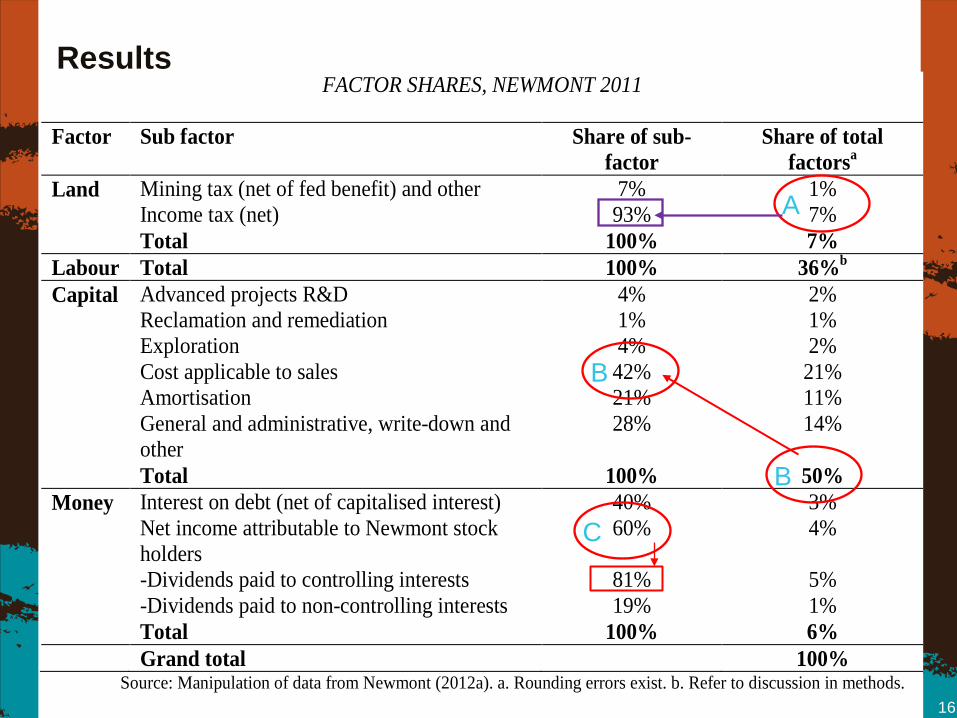
Results
16
FACTOR SHARES, NEWMONT 2011
Factor Sub factor Share of sub-factor
Share of total factorsa
Land Mining tax (net of fed benefit) and other 7% 1% Income tax (net) 93% 7% Total 100% 7% Labour Total 100% 36%b Capital Advanced projects R&D 4% 2% Reclamation and remediation 1% 1% Exploration 4% 2% Cost applicable to sales 42% 21% Amortisation 21% 11%
General and administrative, write-down and other
28% 14%
Total 100% 50% Money Interest on debt (net of capitalised interest) 40% 3%
Net income attributable to Newmont stock holders
60% 4%
-Dividends paid to controlling interests 81% 5% -Dividends paid to non-controlling interests 19% 1% Total 100% 6% Grand total 100%
Source: Manipulation of data from Newmont (2012a). a. Rounding errors exist. b. Refer to discussion in methods.
A
B
B
C
Results cont…
17
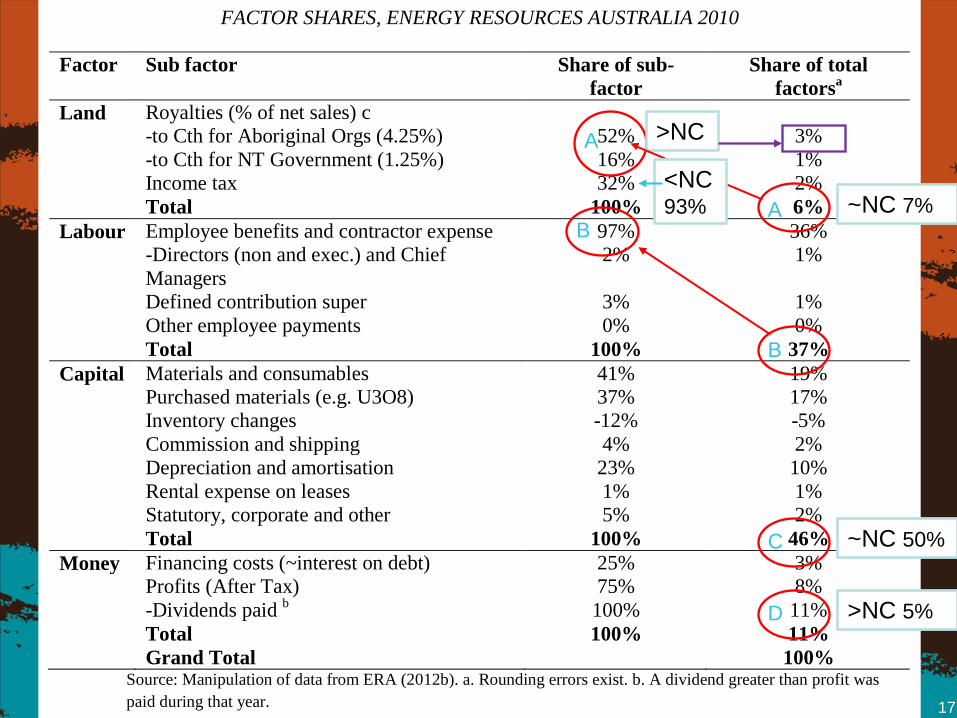
FACTOR SHARES, ENERGY RESOURCES AUSTRALIA 2010
Factor Sub factor Share of sub-factor
Share of total factorsa
Land Royalties (% of net sales) c -to Cth for Aboriginal Orgs (4.25%) 52% 3% -to Cth for NT Government (1.25%) 16% 1% Income tax 32% 2% Total 100% 6% Labour Employee benefits and contractor expense 97% 36% -Directors (non and exec.) and Chief
Managers 2% 1%
Defined contribution super 3% 1% Other employee payments 0% 0% Total 100% 37% Capital Materials and consumables 41% 19% Purchased materials (e.g. U3O8) 37% 17% Inventory changes -12% -5% Commission and shipping 4% 2% Depreciation and amortisation 23% 10% Rental expense on leases 1% 1% Statutory, corporate and other 5% 2% Total 100% 46% Money Financing costs (~interest on debt) 25% 3% Profits (After Tax) 75% 8% -Dividends paid b 100% 11% Total 100% 11% Grand Total 100%
Source: Manipulation of data from ERA (2012b). a. Rounding errors exist. b. A dividend greater than profit was paid during that year.
A ~NC 7%
A >NC
B
B
C ~NC 50%
<NC 93%
D >NC 5%

18
FACTOR SHARES, NEWMONT TANAMI OPERATION 2011
Factor Sub factor Share of sub-factor Share of total factors Land CLC Royalties 30% 3% NT Royalty (considered as a tax) 26% 2% Community Relations 5% 0% Income tax 39% 3% total 100% 8% Labour Wages & Salaries 96% 26% Super Contribution 4% 1% Total 100% 27% Capital Materials & Consumables 35% 21% Inventory Change -3% -2% Depreciation & Amortisation 16% 10% Rental expense on leases 1% 0% Development Capital (Mine Development) 20% 12% Sustaining Capital 25% 16% Exploration 5% 3% Total 100% 61% Money Bank Guarantee Fees 2% 0% Profit 98% 3% Total 100% 3% Grand total 100%
Source: Manipulation of data from Newmont Tanami (K Eglington, 2012, Pers. Comm., 24 August and 5 September).
A 25% > ERA A >ERA 32%
B <ERA/NC 37%,36%
B >ERA/NC 46%,50%
B
B <ERA/NC 11%,6% Static
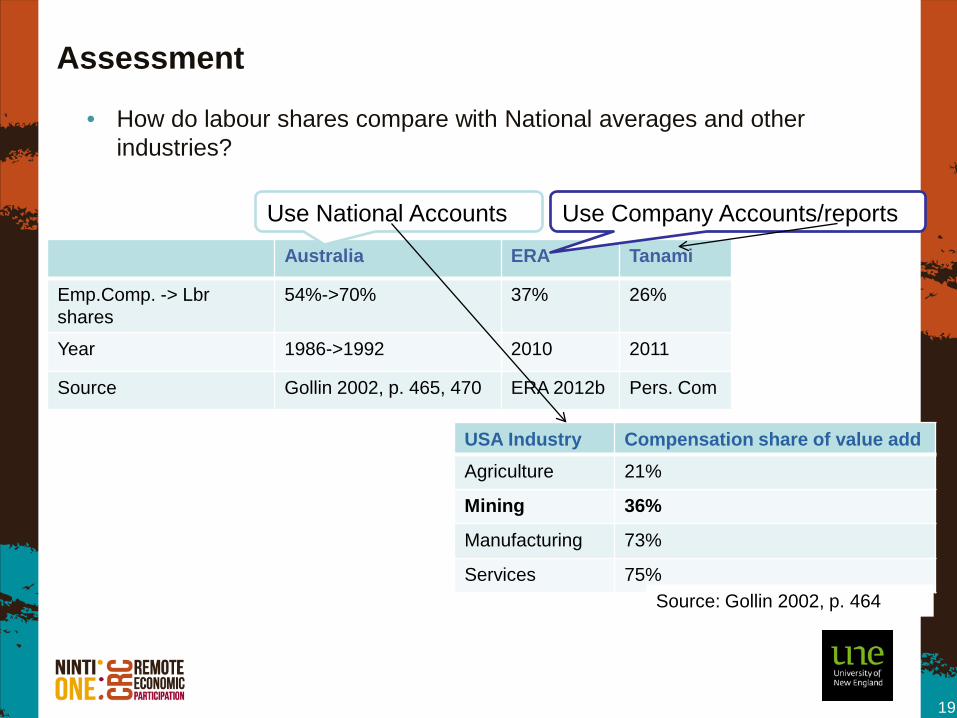
Assessment
Australia ERA Tanami
Emp.Comp. -> Lbr shares
54%->70% 37% 26%
Year 1986->1992 2010 2011
Source Gollin 2002, p. 465, 470 ERA 2012b Pers. Com
19
USA Industry Compensation share of value add Agriculture 21%
Mining 36%
Manufacturing 73%
Services 75% Source: Gollin 2002, p. 464
Use National Accounts Use Company Accounts/reports
• How do labour shares compare with National averages and other industries?
20
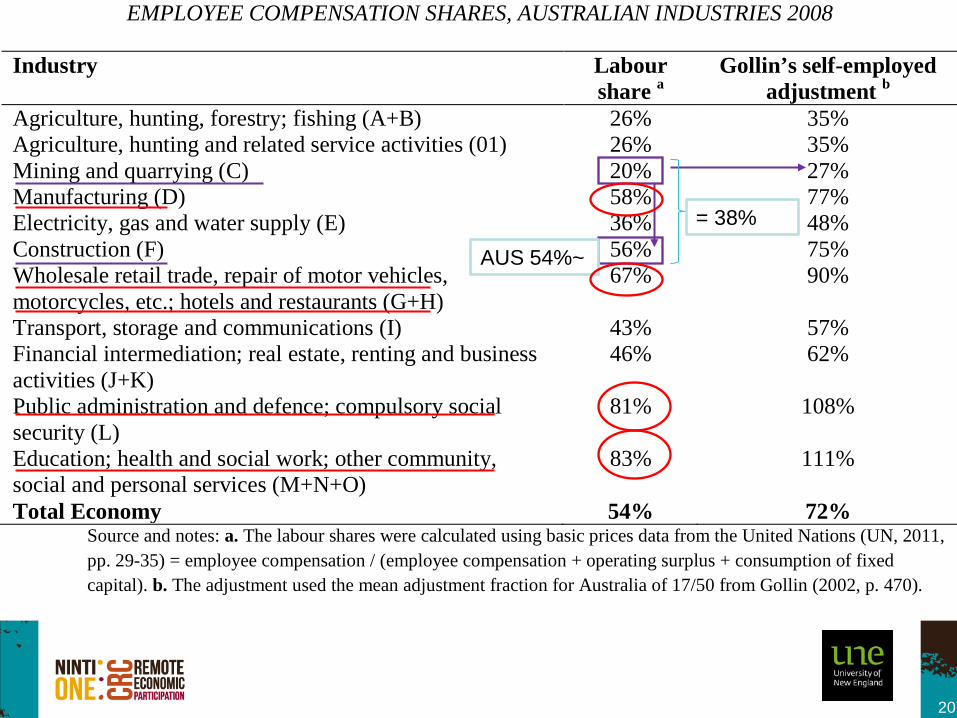
EMPLOYEE COMPENSATION SHARES, AUSTRALIAN INDUSTRIES 2008
Industry Labour share a
Gollin’s self-employed adjustment b
Agriculture, hunting, forestry; fishing (A+B) 26% 35% Agriculture, hunting and related service activities (01) 26% 35% Mining and quarrying (C) 20% 27% Manufacturing (D) 58% 77% Electricity, gas and water supply (E) 36% 48% Construction (F) 56% 75% Wholesale retail trade, repair of motor vehicles, motorcycles, etc.; hotels and restaurants (G+H)
67% 90%
Transport, storage and communications (I) 43% 57% Financial intermediation; real estate, renting and business activities (J+K)
46% 62%
Public administration and defence; compulsory social security (L)
81% 108%
Education; health and social work; other community, social and personal services (M+N+O)
83% 111%
Total Economy 54% 72% Source and notes: a. The labour shares were calculated using basic prices data from the United Nations (UN, 2011, pp. 29-35) = employee compensation / (employee compensation + operating surplus + consumption of fixed capital). b. The adjustment used the mean adjustment fraction for Australia of 17/50 from Gollin (2002, p. 470).
= 38%
AUS 54%~
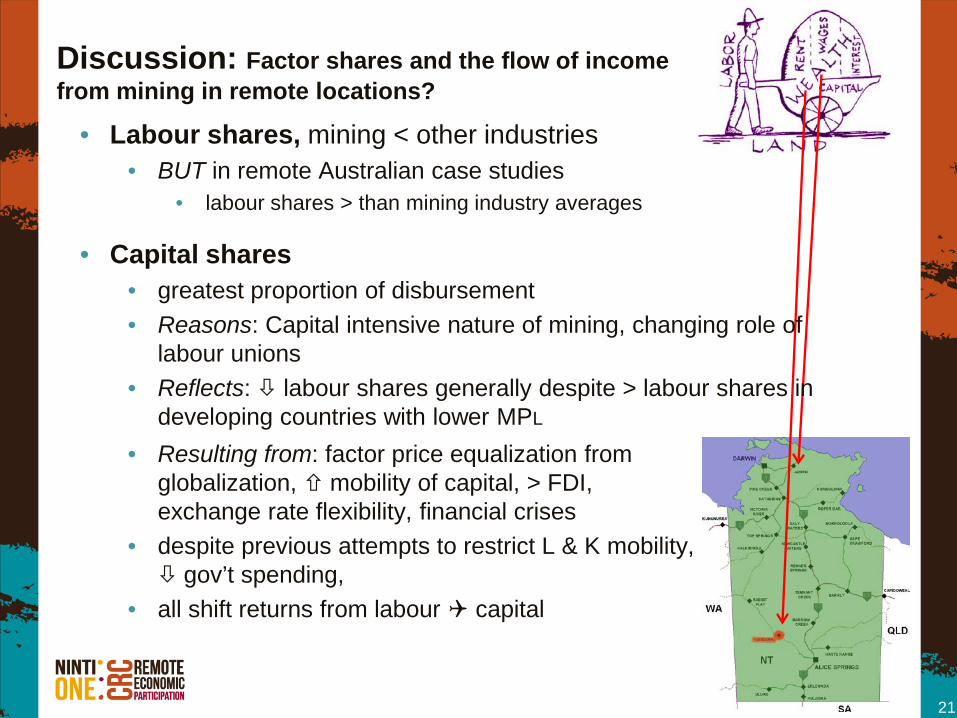
Discussion: Factor shares and the flow of income from mining in remote locations? • Labour shares, mining < other industries
• BUT in remote Australian case studies • labour shares > than mining industry averages
21
• Capital shares • greatest proportion of disbursement • Reasons: Capital intensive nature of mining, changing role of
labour unions • Reflects: labour shares generally despite > labour shares in
developing countries with lower MPL
• Resulting from: factor price equalization from globalization, mobility of capital, > FDI, exchange rate flexibility, financial crises
• despite previous attempts to restrict L & K mobility, gov’t spending,
• all shift returns from labour capital
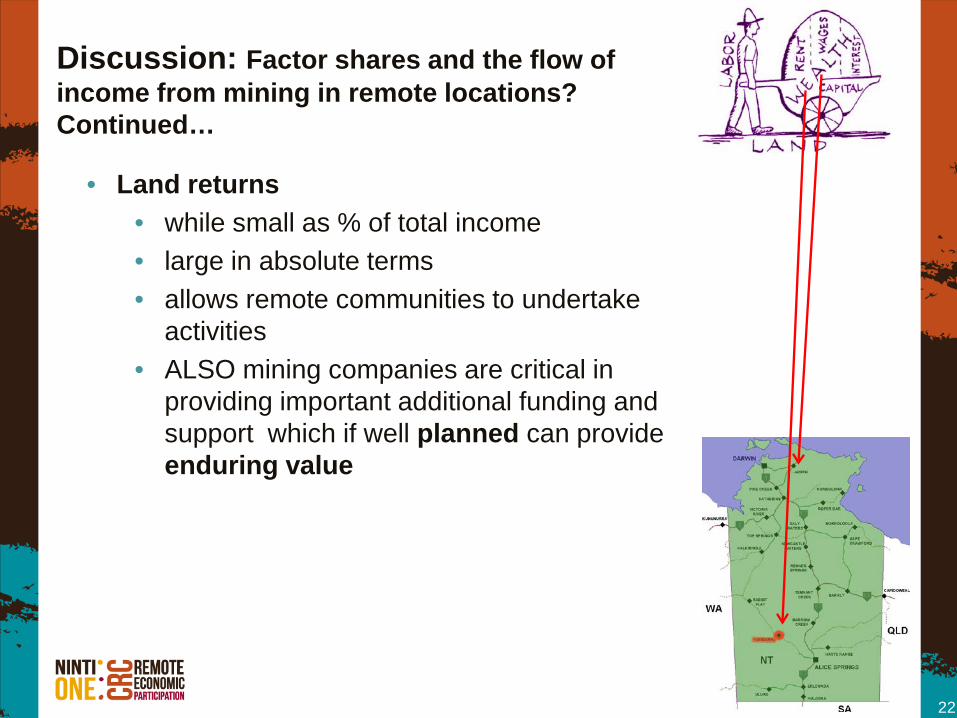
Discussion: Factor shares and the flow of income from mining in remote locations? Continued…
• Land returns • while small as % of total income • large in absolute terms • allows remote communities to undertake
activities • ALSO mining companies are critical in
providing important additional funding and support which if well planned can provide enduring value
22