Embed Size (px)
Citation preview
Antithrombotic Trialists’ CollaborationAntithrombotic Trialists’ Collaboration
An updated collaborative overview of An updated collaborative overview of randomised trials of antiplatelet therapy randomised trials of antiplatelet therapy
among high-risk patientsamong high-risk patients
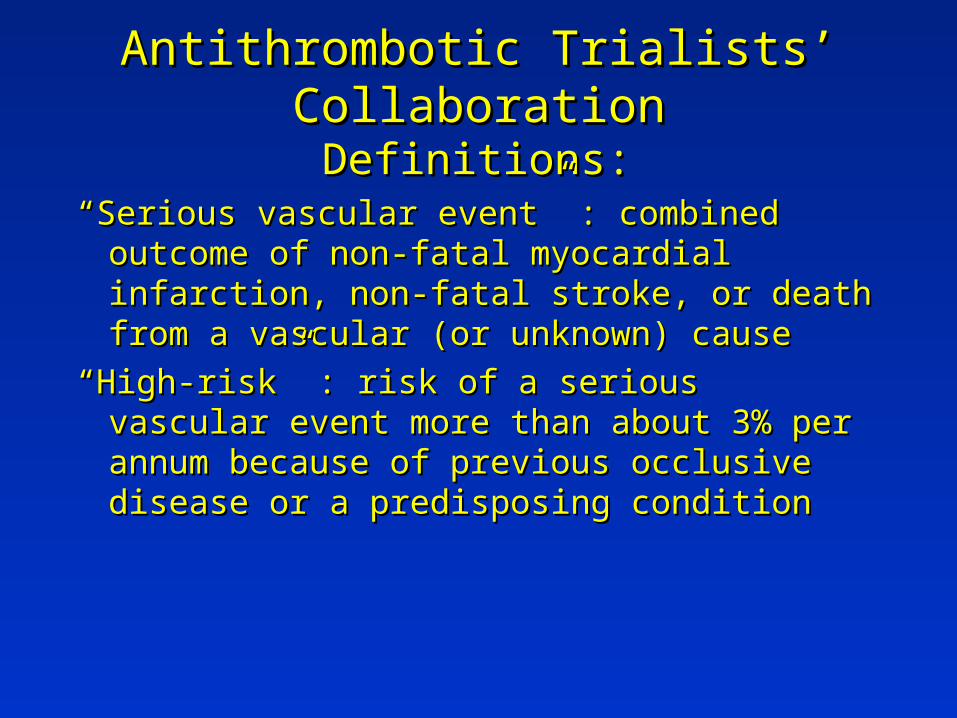
Antithrombotic Trialists’ CollaborationAntithrombotic Trialists’ Collaboration
Definitions:Definitions:““Serious vascular event” : combined outcome of Serious vascular event” : combined outcome of
non-fatal myocardial infarction, non-fatal non-fatal myocardial infarction, non-fatal stroke, or death from a vascular (or unknown) stroke, or death from a vascular (or unknown) cause cause
““High-risk” : risk of a serious vascular event High-risk” : risk of a serious vascular event more than about 3% per annum because of more than about 3% per annum because of previous occlusive disease or a predisposing previous occlusive disease or a predisposing condition condition
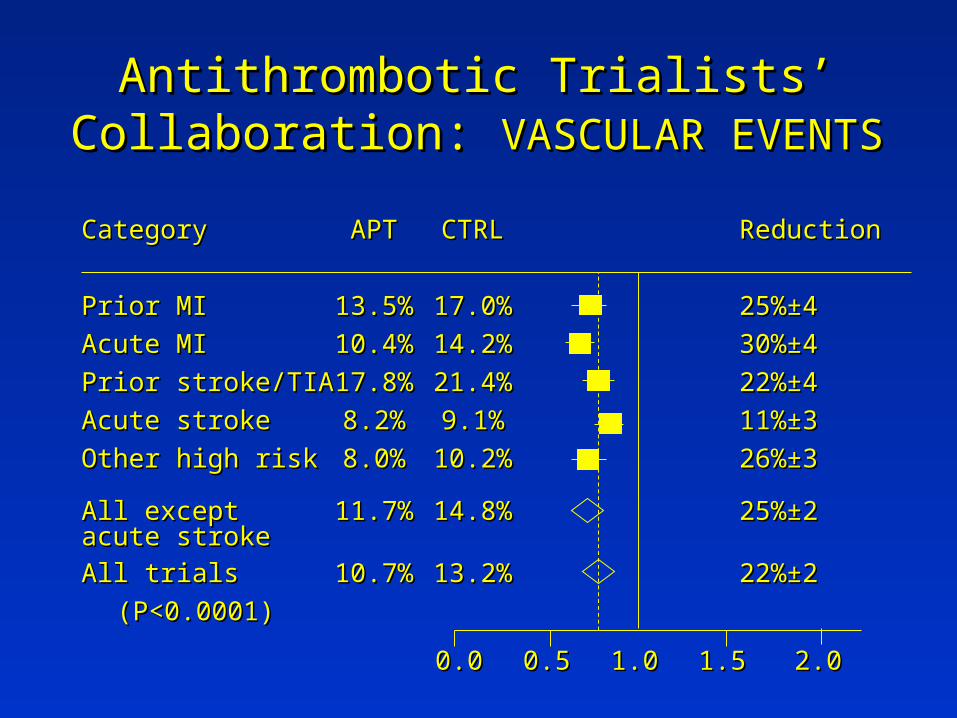
Antithrombotic Trialists’ Collaboration: Antithrombotic Trialists’ Collaboration: VASCULAR EVENTSVASCULAR EVENTS
CategoryCategory APTAPT CTRLCTRL ReductionReduction
Prior MIPrior MI 13.5%13.5% 17.0%17.0% 25%±425%±4
Acute MIAcute MI 10.4%10.4% 14.2%14.2% 30%±430%±4
Prior stroke/TIAPrior stroke/TIA 17.8%17.8% 21.4%21.4% 22%±422%±4
Acute strokeAcute stroke 8.2%8.2% 9.1%9.1% 11%±311%±3
Other high riskOther high risk 8.0%8.0% 10.2%10.2% 26%±326%±3
All except All except 11.7%11.7% 14.8%14.8% 25%±225%±2acute strokeacute stroke
All trialsAll trials 10.7%10.7% 13.2%13.2% 22%±222%±2
(P<0.0001)(P<0.0001)
1.01.00.50.50.00.0 1.51.5 2.02.0
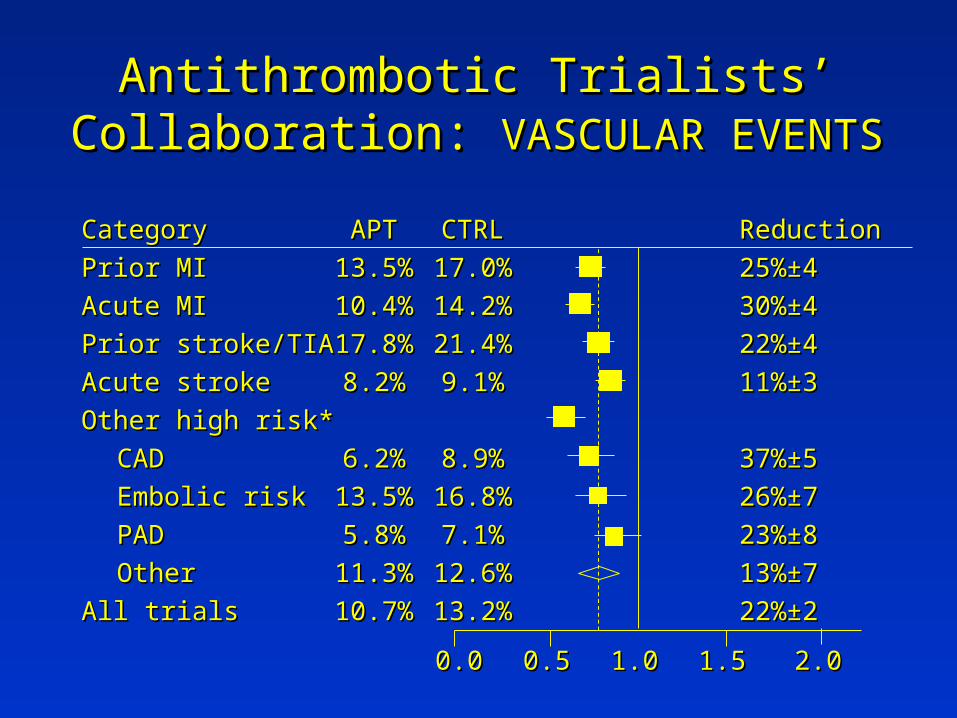
Antithrombotic Trialists’ Collaboration: Antithrombotic Trialists’ Collaboration: VASCULAR EVENTSVASCULAR EVENTS
CategoryCategory APTAPT CTRLCTRL ReductionReduction
Prior MIPrior MI 13.5%13.5% 17.0%17.0% 25%±425%±4
Acute MIAcute MI 10.4%10.4% 14.2%14.2% 30%±430%±4
Prior stroke/TIAPrior stroke/TIA 17.8%17.8% 21.4%21.4% 22%±422%±4
Acute stroke Acute stroke 8.2%8.2% 9.1%9.1% 11%±311%±3
Other high risk*Other high risk*
CADCAD 6.2%6.2% 8.9%8.9% 37%±537%±5
Embolic riskEmbolic risk 13.5%13.5% 16.8%16.8% 26%±726%±7
PADPAD 5.8%5.8% 7.1%7.1% 23%±823%±8
OtherOther 11.3%11.3% 12.6%12.6% 13%±713%±7
All trialsAll trials 10.7%10.7% 13.2%13.2% 22%±222%±2
1.01.00.50.50.00.0 1.51.5 2.02.0
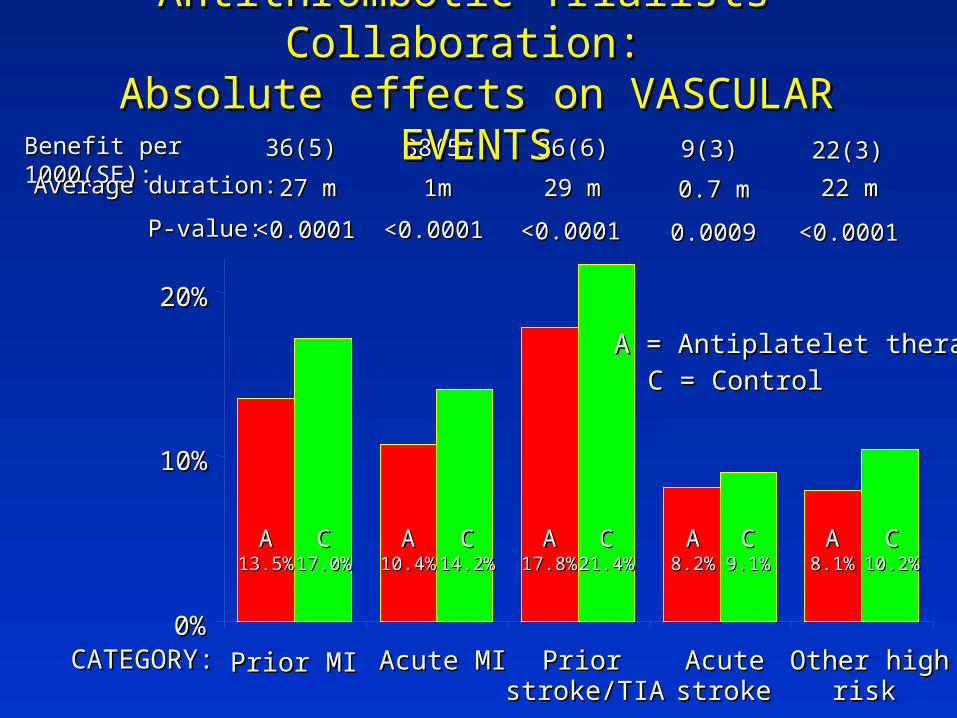
Benefit per 1000(SE):Benefit per 1000(SE):
AA13.5%13.5%
AA10.4%10.4%
AA17.8%17.8%
AA8.2%8.2%
AA8.1%8.1%
CC21.4%21.4%
CC14.2%14.2%
CC17.0%17.0%
CC9.1%9.1%
CC10.2%10.2%
0%0%
10%10%
20%20%
Prior MIPrior MI Acute MIAcute MI PriorPriorstroke/TIAstroke/TIA
AcuteAcutestrokestroke
Other highOther highriskrisk
CATEGORY:CATEGORY:
A = Antiplatelet therapyA = Antiplatelet therapy
C = ControlC = Control
Average duration:Average duration: 27 m27 m
36(5)36(5)
1m1m
38(5)38(5)
29 m29 m
36(6)36(6)
0.7 m0.7 m
9(3)9(3)
22 m22 m
22(3)22(3)
P-value:P-value: <0.0001<0.0001 <0.0001<0.0001 <0.0001<0.0001 0.00090.0009 <0.0001<0.0001
Antithrombotic Trialists’ Collaboration: Antithrombotic Trialists’ Collaboration: Absolute effects on VASCULAR EVENTSAbsolute effects on VASCULAR EVENTS
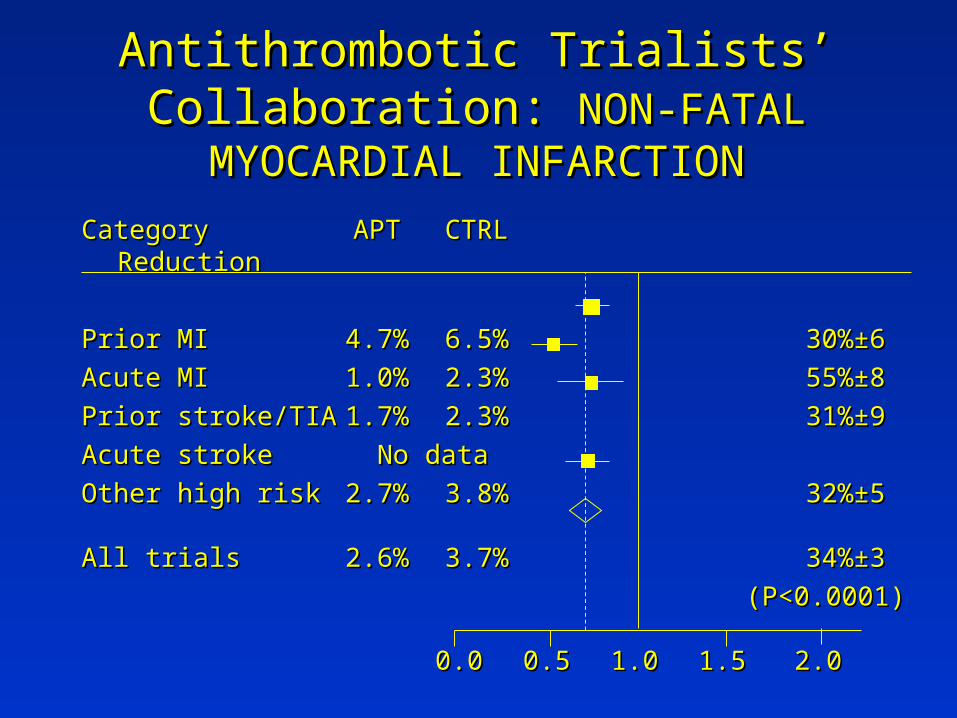
Antithrombotic Trialists’ Collaboration: Antithrombotic Trialists’ Collaboration: NON-FATAL MYOCARDIAL INFARCTIONNON-FATAL MYOCARDIAL INFARCTION
CategoryCategory APTAPT CTRLCTRL ReductionReduction
Prior MIPrior MI 4.7%4.7% 6.5%6.5% 30%±630%±6
Acute MIAcute MI 1.0%1.0% 2.3%2.3% 55%±855%±8
Prior stroke/TIAPrior stroke/TIA 1.7%1.7% 2.3%2.3% 31%±931%±9
Acute strokeAcute stroke No dataNo data
Other high riskOther high risk 2.7%2.7% 3.8%3.8% 32%±532%±5
All trialsAll trials 2.6%2.6% 3.7%3.7% 34%±334%±3
(P<0.0001)(P<0.0001)
1.01.00.50.50.00.0 1.51.5 2.02.0
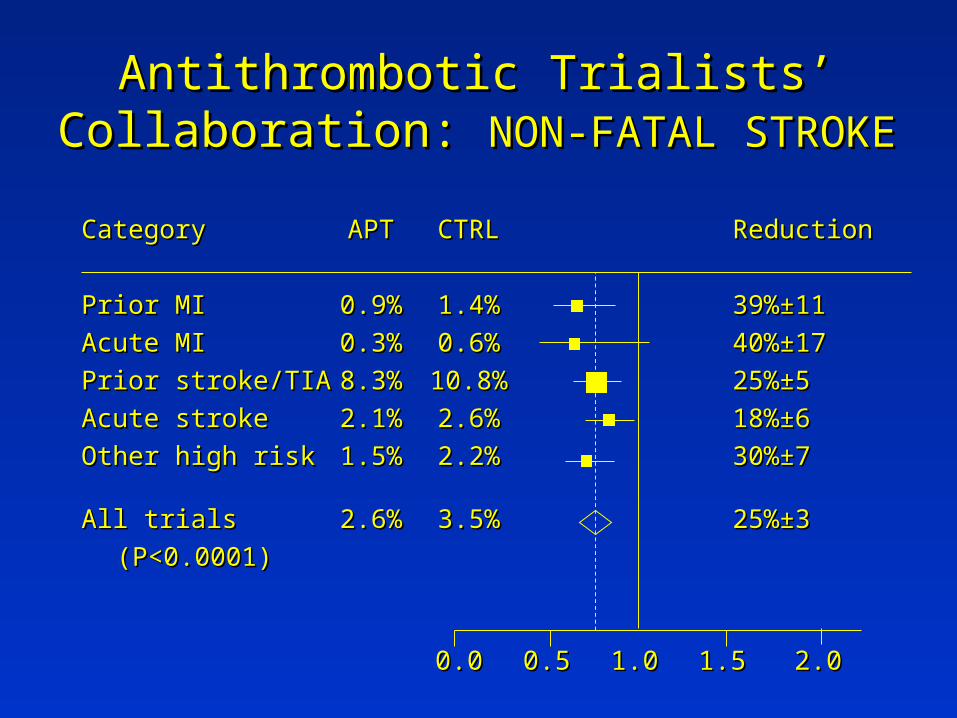
Antithrombotic Trialists’ Collaboration: Antithrombotic Trialists’ Collaboration: NON-FATAL STROKENON-FATAL STROKE
CategoryCategory APTAPT CTRLCTRL ReductionReduction
Prior MIPrior MI 0.9%0.9% 1.4%1.4% 39%±1139%±11
Acute MIAcute MI 0.3%0.3% 0.6%0.6% 40%±1740%±17
Prior stroke/TIAPrior stroke/TIA 8.3%8.3% 10.8%10.8% 25%±525%±5
Acute strokeAcute stroke 2.1%2.1% 2.6%2.6% 18%±618%±6
Other high riskOther high risk 1.5%1.5% 2.2%2.2% 30%±730%±7
All trialsAll trials 2.6%2.6% 3.5%3.5% 25%±325%±3
(P<0.0001)(P<0.0001)
1.01.00.50.50.00.0 1.51.5 2.02.0
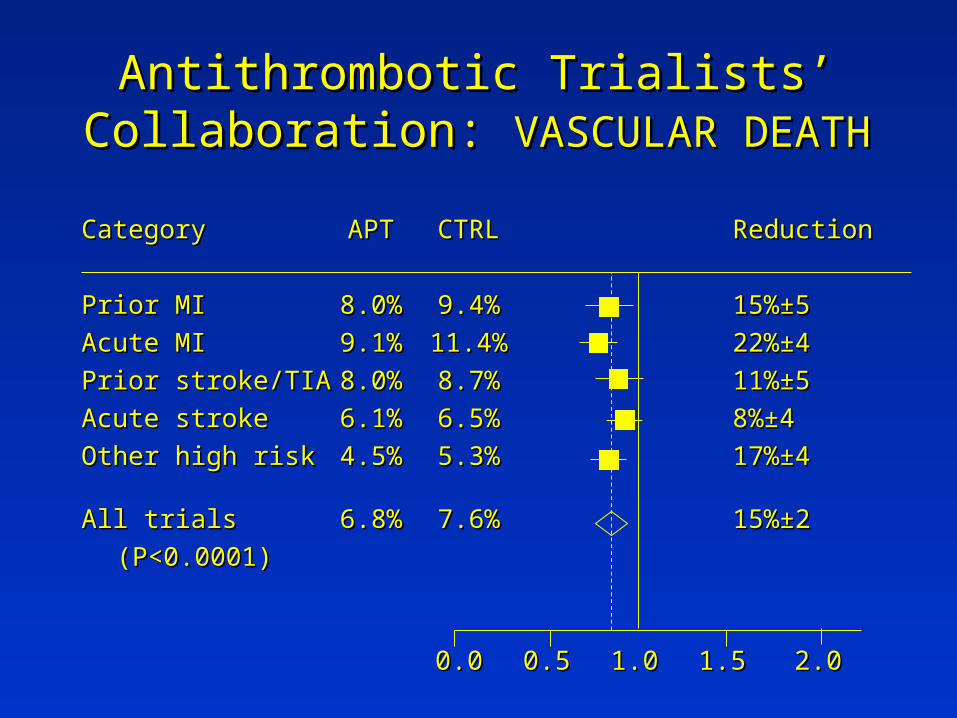
Antithrombotic Trialists’ Collaboration: Antithrombotic Trialists’ Collaboration: VASCULAR DEATHVASCULAR DEATH
CategoryCategory APTAPT CTRLCTRL ReductionReduction
Prior MIPrior MI 8.0%8.0% 9.4%9.4% 15%±515%±5
Acute MIAcute MI 9.1%9.1% 11.4%11.4% 22%±422%±4
Prior stroke/TIAPrior stroke/TIA 8.0%8.0% 8.7%8.7% 11%±511%±5
Acute strokeAcute stroke 6.1%6.1% 6.5%6.5% 8%±48%±4
Other high riskOther high risk 4.5%4.5% 5.3%5.3% 17%±417%±4
All trialsAll trials 6.8%6.8% 7.6%7.6% 15%±215%±2
(P<0.0001)(P<0.0001)
1.01.00.50.50.00.0 1.51.5 2.02.0
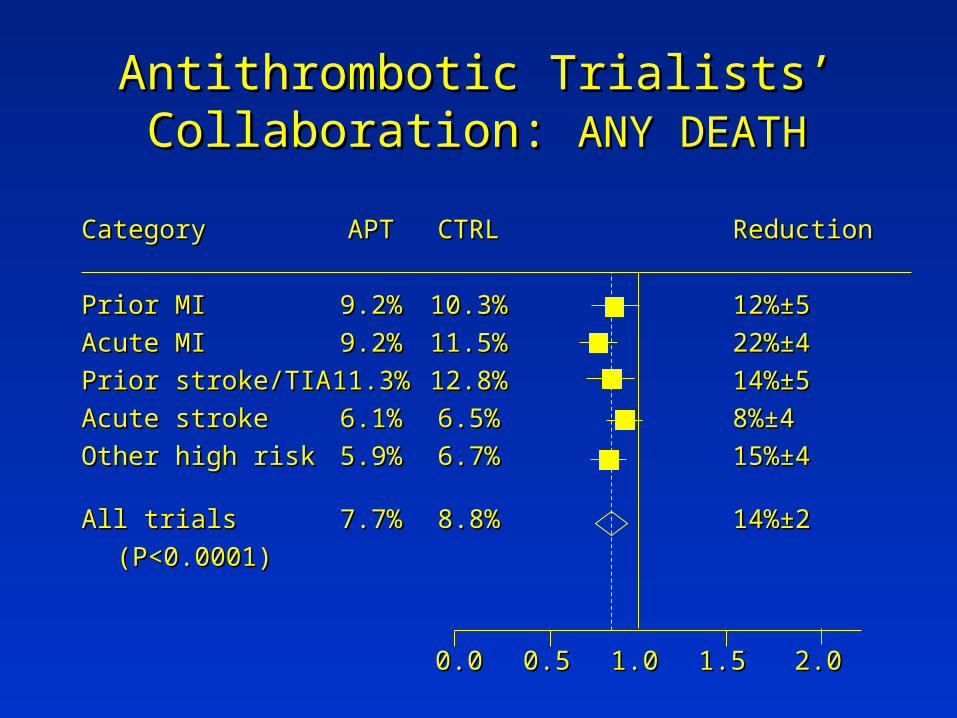
Antithrombotic Trialists’ Collaboration: Antithrombotic Trialists’ Collaboration: ANY DEATHANY DEATH
CategoryCategory APTAPT CTRLCTRL ReductionReduction
Prior MIPrior MI 9.2%9.2% 10.3%10.3% 12%±512%±5
Acute MIAcute MI 9.2%9.2% 11.5%11.5% 22%±422%±4
Prior stroke/TIAPrior stroke/TIA 11.3%11.3% 12.8%12.8% 14%±514%±5
Acute strokeAcute stroke 6.1%6.1% 6.5%6.5% 8%±48%±4
Other high riskOther high risk 5.9%5.9% 6.7%6.7% 15%±415%±4
All trialsAll trials 7.7%7.7% 8.8%8.8% 14%±214%±2
(P<0.0001)(P<0.0001)
1.01.00.50.50.00.0 1.51.5 2.02.0
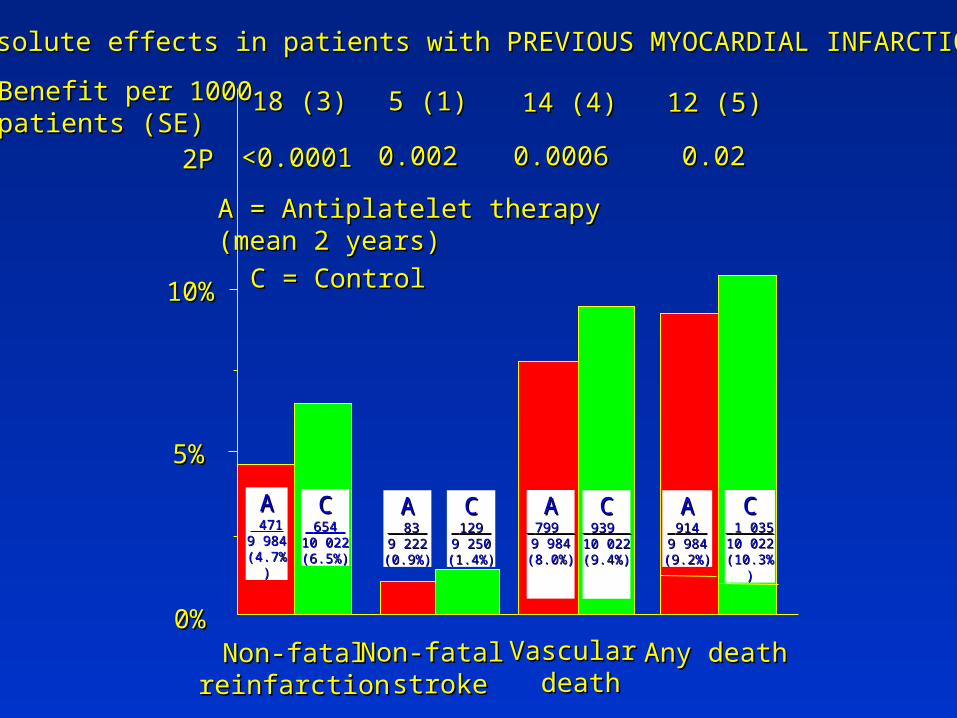
AA 4714719 9849 984(4.7%)(4.7%)
AA 83 83 9 2229 222(0.9%)(0.9%)
AA 799 799 9 9849 984(8.0%)(8.0%)
AA 914 914 9 9849 984(9.2%)(9.2%)
CC 939 939 10 02210 022(9.4%)(9.4%)
CC 129 129 9 2509 250(1.4%)(1.4%)
CC 654 654
10 02210 022(6.5%)(6.5%)
CC 1 035 1 035 10 02210 022(10.3%)(10.3%)
0%0%
5%5%
10%10%
Non-fatalNon-fatalreinfarctionreinfarction
Non-fatal Non-fatal strokestroke
Vascular Vascular deathdeath
A = Antiplatelet therapyA = Antiplatelet therapy(mean 2 years)(mean 2 years)
C = ControlC = Control
Benefit per 1000Benefit per 1000patients (SE)patients (SE)
2P2P <0.0001<0.0001 0.0020.002 0.00060.0006 0.020.02
12 (5)12 (5)18 (3)18 (3) 5 (1)5 (1) 14 (4)14 (4)
Any deathAny death
Absolute effects in patients with PREVIOUS MYOCARDIAL INFARCTIONAbsolute effects in patients with PREVIOUS MYOCARDIAL INFARCTION
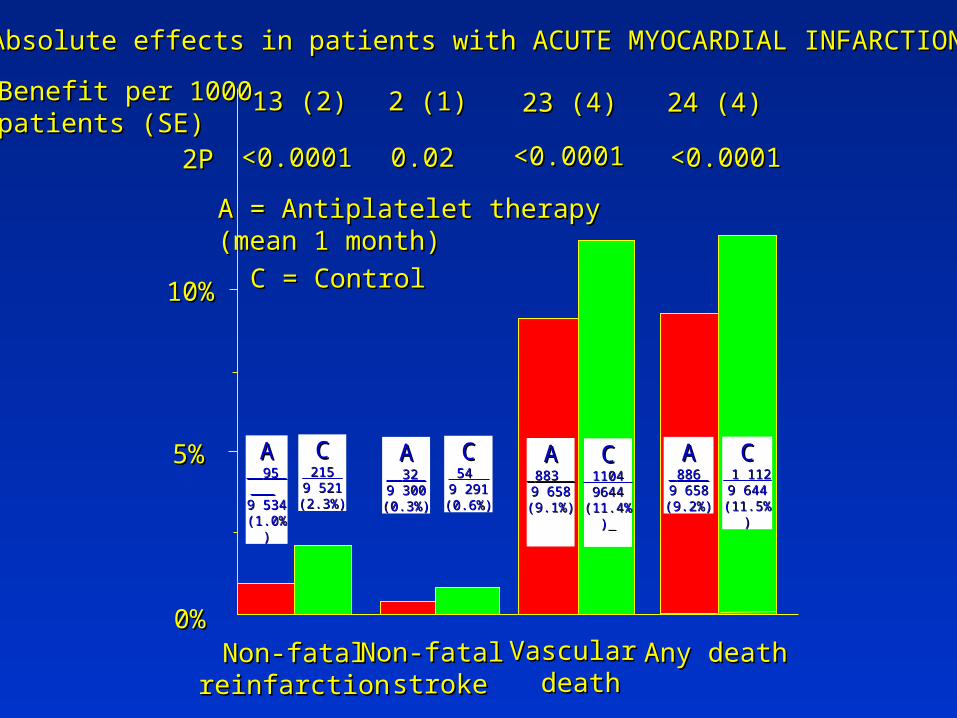
AA 95 95 9 5349 534(1.0%)(1.0%)
AA 32 32 9 3009 300(0.3%)(0.3%)
AA 883 883 9 6589 658(9.1%)(9.1%)
AA 886 886 9 6589 658(9.2%)(9.2%)
CC 1104 1104 96449644
(11.4%)(11.4%)
CC 54 54 9 2919 291(0.6%)(0.6%)
CC 215 215 9 5219 521(2.3%)(2.3%)
CC 1 112 1 112 9 6449 644
(11.5%)(11.5%)
0%0%
5%5%
10%10%
Non-fatalNon-fatalreinfarctionreinfarction
Non-fatal Non-fatal strokestroke
Vascular Vascular deathdeath
A = Antiplatelet therapyA = Antiplatelet therapy(mean 1 month)(mean 1 month)
C = ControlC = Control
Benefit per 1000Benefit per 1000patients (SE)patients (SE)
2P2P <0.0001<0.0001 0.020.02 <0.0001<0.0001 <0.0001<0.0001
24 (4)24 (4)13 (2)13 (2) 2 (1)2 (1) 23 (4)23 (4)
Any deathAny death
Absolute effects in patients with ACUTE MYOCARDIAL INFARCTIONAbsolute effects in patients with ACUTE MYOCARDIAL INFARCTION
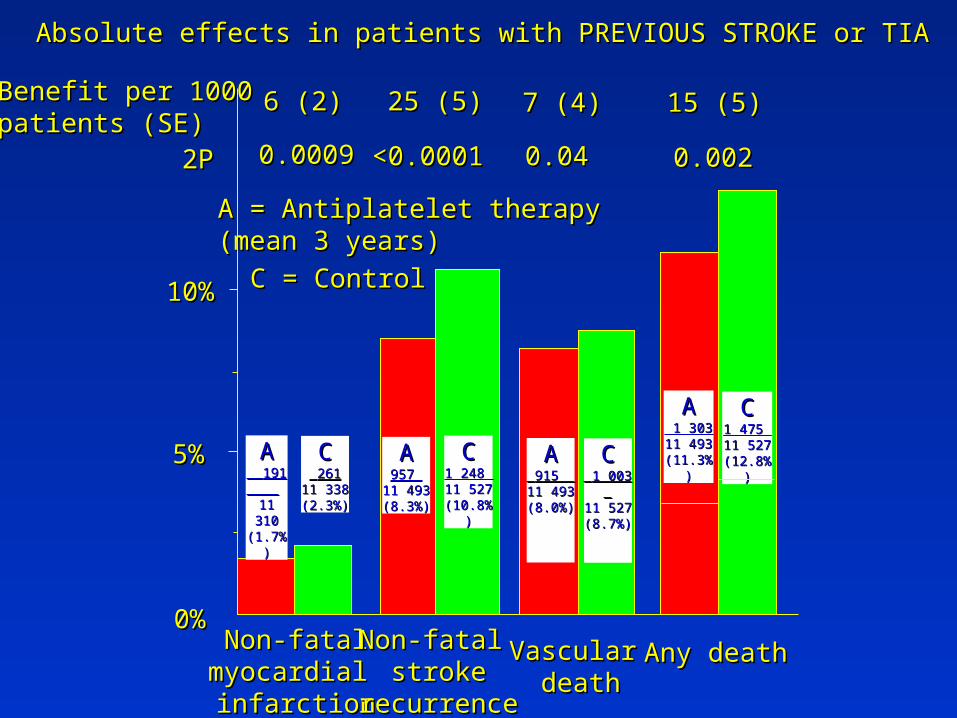
AA 191 191
11 31011 310(1.7%)(1.7%)
AA957 957
11 49311 493(8.3%)(8.3%)
AA 915 915 11 49311 493(8.0%)(8.0%)
AA 1 303 1 303 11 49311 493(11.3%)(11.3%)CC
1 003 1 003 11 52711 527(8.7%)(8.7%)
CC1 248 1 248 11 52711 527(10.8%)(10.8%)
CC 261261
11 33811 338(2.3%)(2.3%)
CC1 475 1 475 11 52711 527(12.8%)(12.8%)
0%0%
5%5%
10%10%
Non-fatalNon-fatalmyocardial myocardial infarctioninfarction
Non-fatal Non-fatal strokestroke
recurrencerecurrence
Vascular Vascular deathdeath
A = Antiplatelet therapyA = Antiplatelet therapy(mean 3 years)(mean 3 years)
C = ControlC = Control
Benefit per 1000Benefit per 1000patients (SE)patients (SE)
2P2P 0.00090.0009 <0.0001<0.0001 0.040.04 0.0020.002
15 (5)15 (5)6 (2)6 (2) 25 (5)25 (5) 7 (4)7 (4)
Any deathAny death
Absolute effects in patients with PREVIOUS STROKE or TIAAbsolute effects in patients with PREVIOUS STROKE or TIA
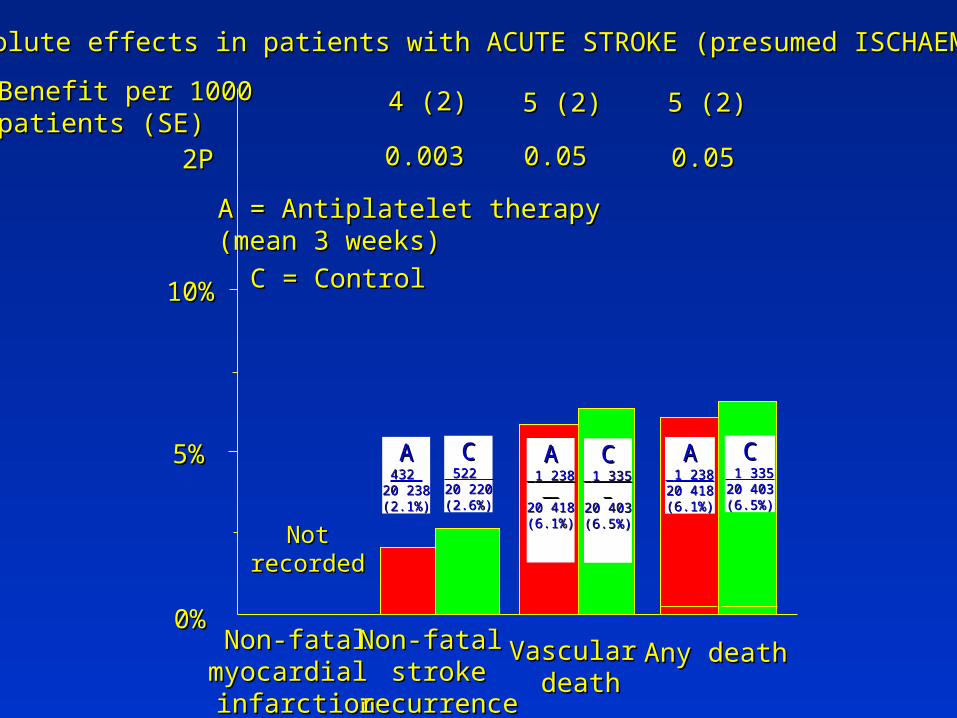
AA432 432
20 23820 238(2.1%)(2.1%)
AA 1 238 1 238 20 41820 418(6.1%)(6.1%)
AA 1 238 1 238 20 41820 418(6.1%)(6.1%)
CC 1 335 1 335 20 40320 403(6.5%)(6.5%)
CC 522 522
20 22020 220(2.6%)(2.6%)
CC 1 335 1 335 20 40320 403(6.5%)(6.5%)
0%0%
5%5%
10%10%
Non-fatalNon-fatalmyocardial myocardial infarctioninfarction
Non-fatal Non-fatal strokestroke
recurrencerecurrence
Vascular Vascular deathdeath
A = Antiplatelet therapyA = Antiplatelet therapy(mean 3 weeks)(mean 3 weeks)
C = ControlC = Control
Benefit per 1000Benefit per 1000patients (SE)patients (SE)
2P2P 0.0030.003 0.050.05 0.050.05
5 (2)5 (2)4 (2)4 (2) 5 (2)5 (2)
Any deathAny death
Absolute effects in patients with ACUTE STROKE (presumed ISCHAEMIC)Absolute effects in patients with ACUTE STROKE (presumed ISCHAEMIC)
NotNotrecordedrecorded
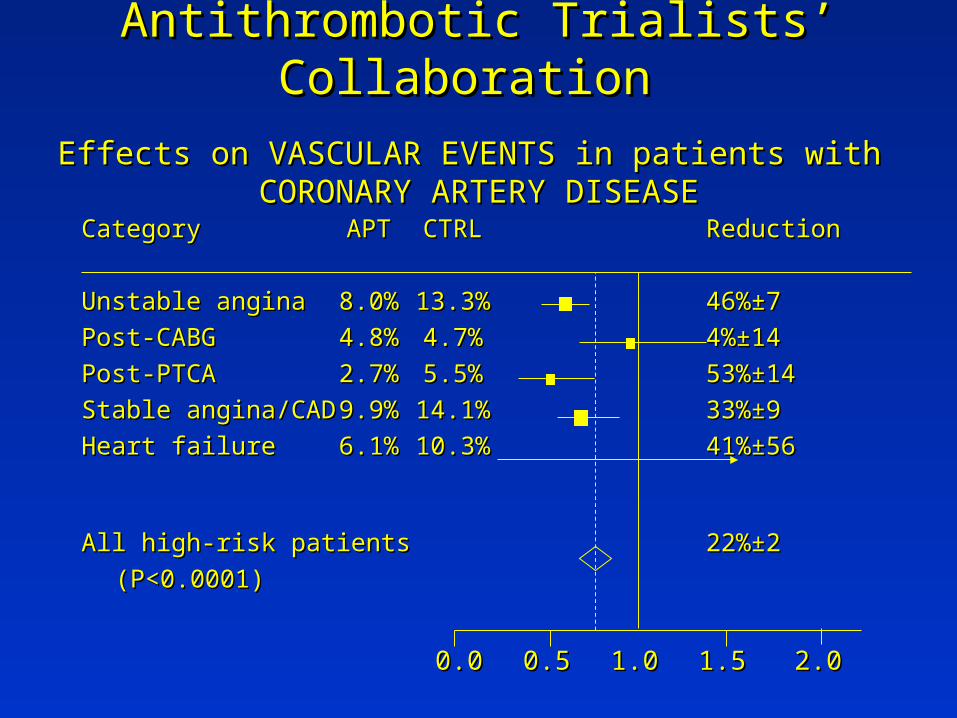
Antithrombotic Trialists’ Collaboration Antithrombotic Trialists’ Collaboration
Effects on VASCULAR EVENTS in patients with Effects on VASCULAR EVENTS in patients with CORONARY ARTERY DISEASECORONARY ARTERY DISEASE
CategoryCategory APTAPT CTRLCTRL ReductionReduction
Unstable anginaUnstable angina 8.0%8.0% 13.3%13.3% 46%±746%±7
Post-CABGPost-CABG 4.8%4.8% 4.7%4.7% 4%±144%±14
Post-PTCAPost-PTCA 2.7%2.7% 5.5%5.5% 53%±1453%±14
Stable angina/CADStable angina/CAD 9.9%9.9% 14.1%14.1% 33%±933%±9
Heart failureHeart failure 6.1%6.1% 10.3%10.3% 41%±5641%±56
All high-risk patientsAll high-risk patients 22%±222%±2
(P<0.0001)(P<0.0001)
1.01.00.50.50.00.0 1.51.5 2.02.0
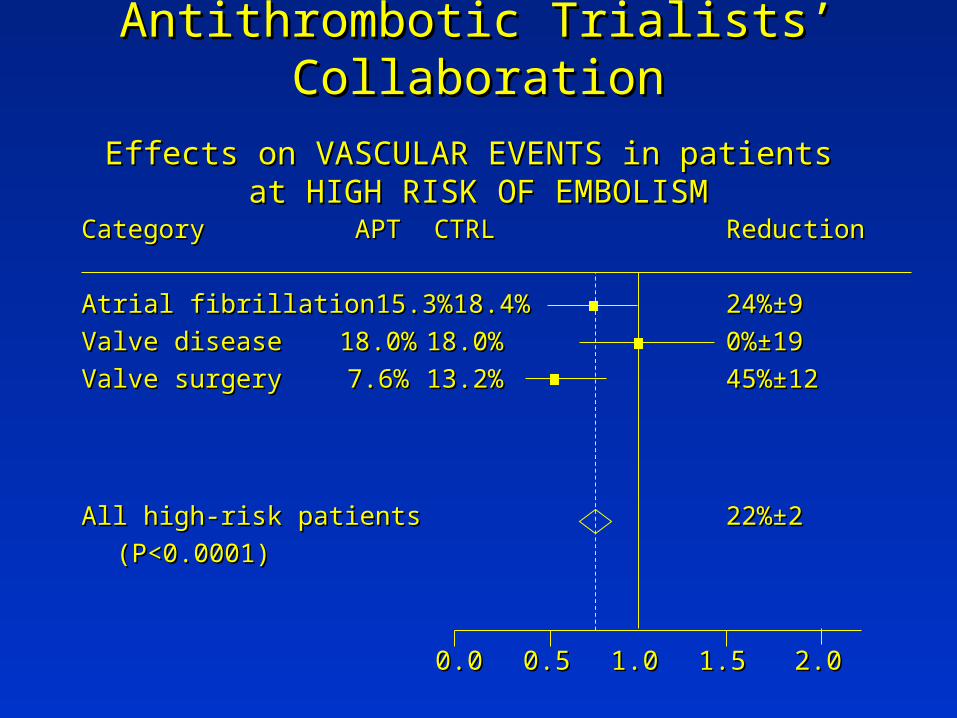
Antithrombotic Trialists’ CollaborationAntithrombotic Trialists’ Collaboration
Effects on VASCULAR EVENTS in patients Effects on VASCULAR EVENTS in patients at HIGH RISK OF EMBOLISMat HIGH RISK OF EMBOLISM
CategoryCategory APTAPT CTRLCTRL ReductionReduction
Atrial fibrillationAtrial fibrillation 15.3%15.3% 18.4%18.4% 24%±924%±9
Valve diseaseValve disease 18.0%18.0% 18.0%18.0% 0%±190%±19
Valve surgeryValve surgery 7.6%7.6% 13.2%13.2% 45%±1245%±12
All high-risk patientsAll high-risk patients 22%±222%±2
(P<0.0001)(P<0.0001)
1.01.00.50.50.00.0 1.51.5 2.02.0
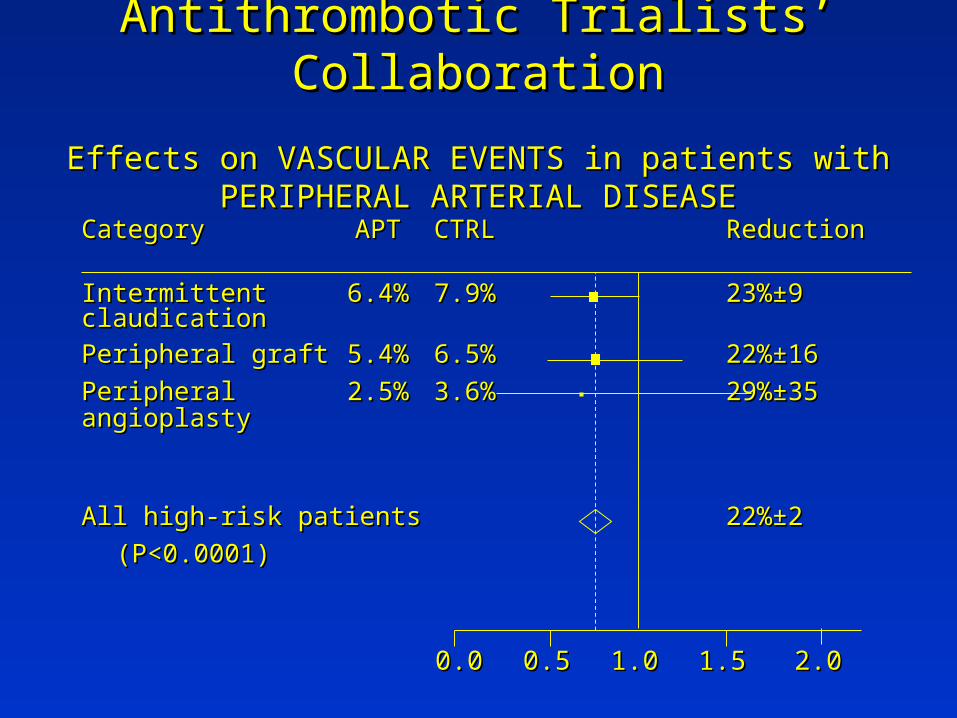
Antithrombotic Trialists’ CollaborationAntithrombotic Trialists’ Collaboration
Effects on VASCULAR EVENTS in patients with PERIPHERAL Effects on VASCULAR EVENTS in patients with PERIPHERAL ARTERIAL DISEASEARTERIAL DISEASE
CategoryCategory APTAPT CTRLCTRL ReductionReduction
IntermittentIntermittent 6.4%6.4% 7.9%7.9% 23%±923%±9claudicationclaudication
Peripheral graftPeripheral graft 5.4%5.4% 6.5%6.5% 22%±1622%±16
PeripheralPeripheral 2.5%2.5% 3.6%3.6% 29%±3529%±35angioplastyangioplasty
All high-risk patientsAll high-risk patients 22%±222%±2
(P<0.0001)(P<0.0001)
1.01.00.50.50.00.0 1.51.5 2.02.0
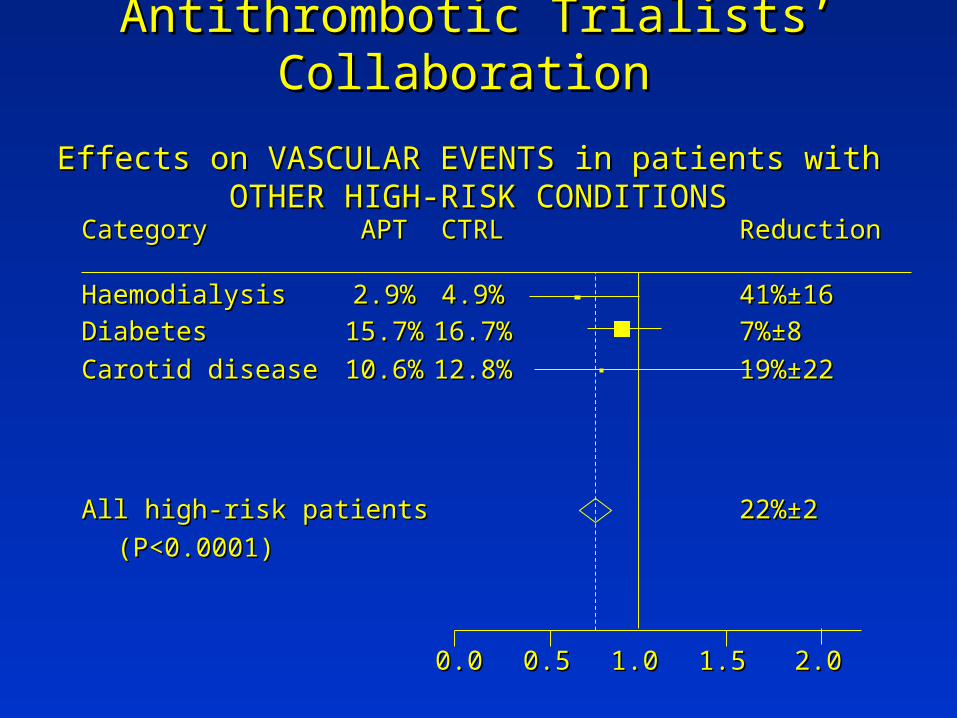
Antithrombotic Trialists’ Collaboration Antithrombotic Trialists’ Collaboration
Effects on VASCULAR EVENTS in patients with Effects on VASCULAR EVENTS in patients with OTHER HIGH-RISK CONDITIONSOTHER HIGH-RISK CONDITIONS
CategoryCategory APTAPT CTRLCTRL ReductionReduction
HaemodialysisHaemodialysis 2.9%2.9% 4.9%4.9% 41%±1641%±16
DiabetesDiabetes 15.7%15.7% 16.7%16.7% 7%±87%±8
Carotid diseaseCarotid disease 10.6%10.6% 12.8%12.8% 19%±2219%±22
All high-risk patientsAll high-risk patients 22%±222%±2
(P<0.0001)(P<0.0001)
1.01.00.50.50.00.0 1.51.5 2.02.0
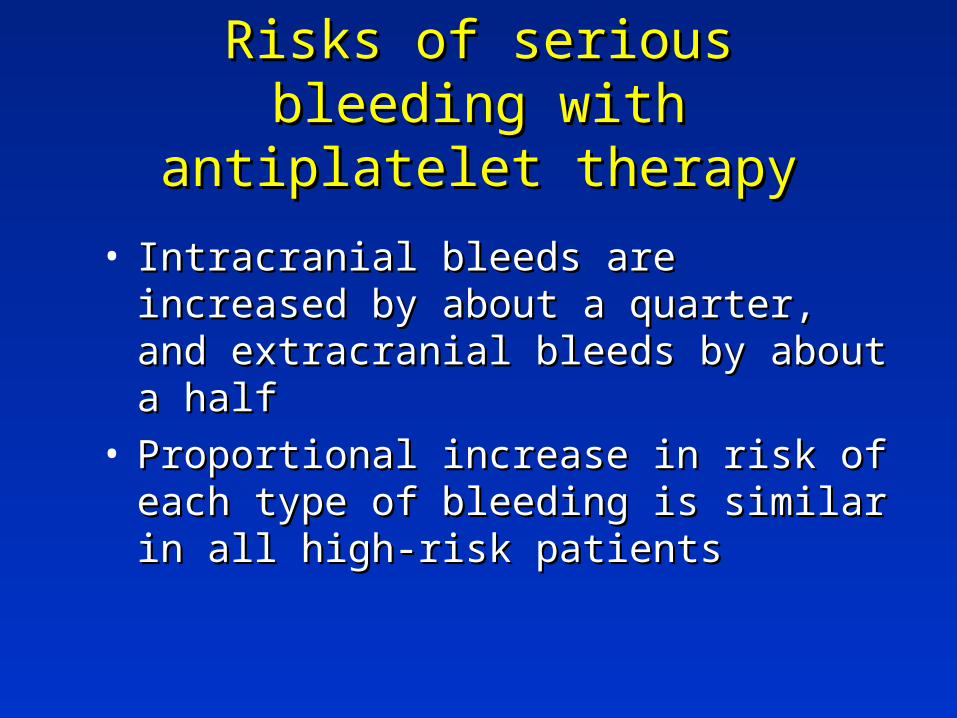
Risks of serious bleeding with Risks of serious bleeding with antiplatelet therapyantiplatelet therapy
• Intracranial bleeds are increased by Intracranial bleeds are increased by about a quarter, and extracranial bleeds about a quarter, and extracranial bleeds by about a halfby about a half
• Proportional increase in risk of each Proportional increase in risk of each type of bleeding is similar in all high-risk type of bleeding is similar in all high-risk patientspatients
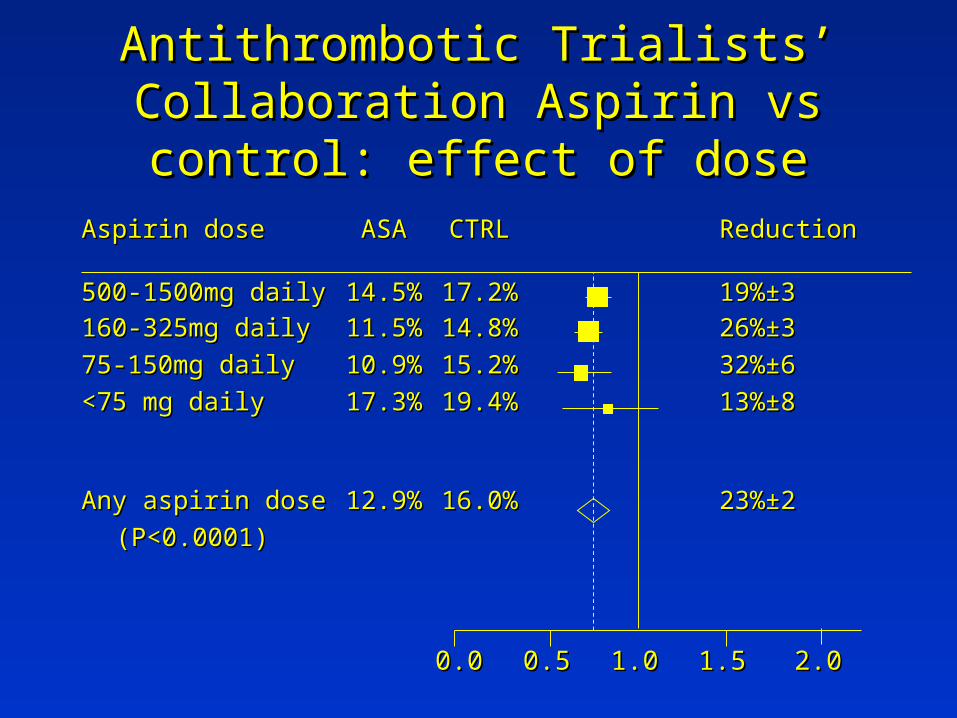
Antithrombotic Trialists’ Collaboration Antithrombotic Trialists’ Collaboration Aspirin vs control: effect of doseAspirin vs control: effect of dose
Aspirin doseAspirin dose ASAASA CTRLCTRL ReductionReduction
500-1500mg daily500-1500mg daily 14.5%14.5% 17.2%17.2% 19%±319%±3
160-325mg daily160-325mg daily 11.5%11.5% 14.8%14.8% 26%±326%±3
75-150mg daily75-150mg daily 10.9%10.9% 15.2%15.2% 32%±632%±6
<75 mg daily<75 mg daily 17.3%17.3% 19.4%19.4% 13%±813%±8
Any aspirin doseAny aspirin dose 12.9%12.9% 16.0%16.0% 23%±223%±2
(P<0.0001)(P<0.0001)
1.01.00.50.50.00.0 1.51.5 2.02.0
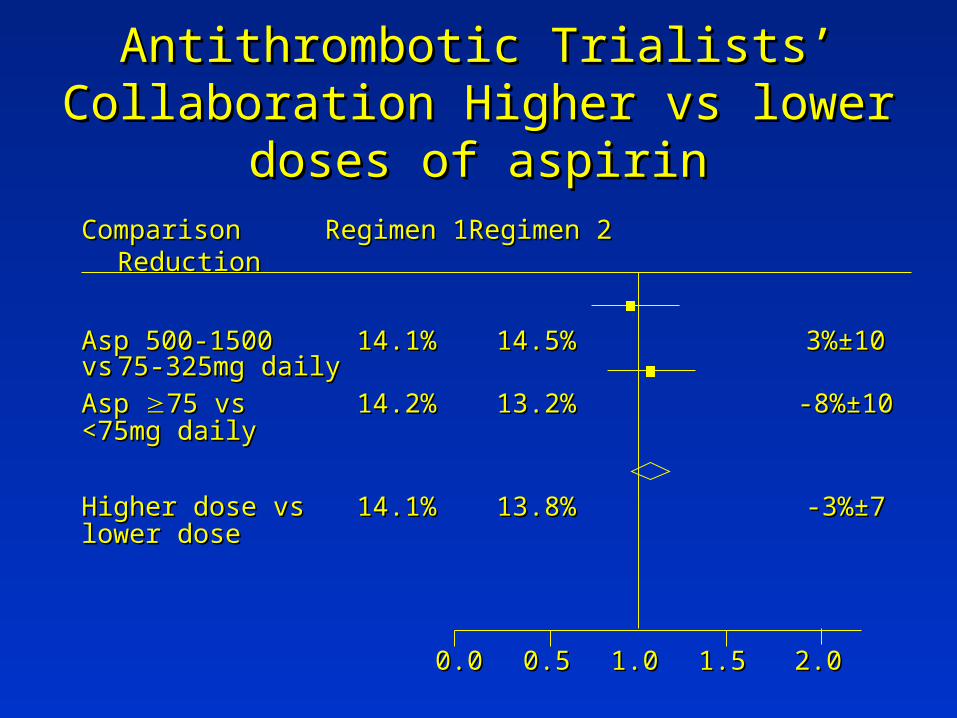
Antithrombotic Trialists’ Collaboration Antithrombotic Trialists’ Collaboration Higher vs lower doses of aspirinHigher vs lower doses of aspirin
ComparisonComparison Regimen 1Regimen 1 Regimen 2Regimen 2 ReductionReduction
Asp 500-1500 Asp 500-1500 14.1%14.1% 14.5%14.5% 3%±103%±10vsvs 75-325mg daily75-325mg daily
Asp Asp 75 vs75 vs 14.2%14.2% 13.2%13.2% -8%±10-8%±10<75mg daily<75mg daily
Higher dose vsHigher dose vs 14.1%14.1% 13.8%13.8% -3%±7-3%±7lower doselower dose
1.01.00.50.50.00.0 1.51.5 2.02.0
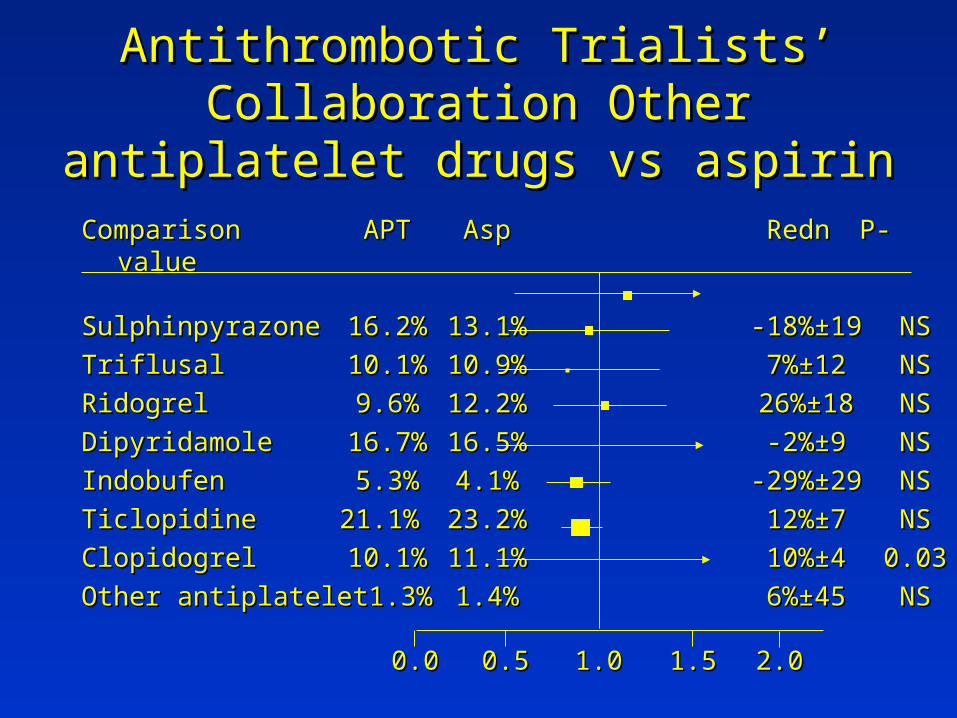
Antithrombotic Trialists’ Collaboration Antithrombotic Trialists’ Collaboration Other antiplatelet drugs vs aspirinOther antiplatelet drugs vs aspirin
ComparisonComparison APTAPT AspAsp Redn Redn P-P-valuevalue
SulphinpyrazoneSulphinpyrazone 16.2%16.2% 13.1%13.1% -18%±19-18%±19 NSNS
TriflusalTriflusal 10.1%10.1% 10.9%10.9% 7%±127%±12 NSNS
RidogrelRidogrel 9.6%9.6% 12.2%12.2% 26%±1826%±18 NSNS
DipyridamoleDipyridamole 16.7%16.7% 16.5%16.5% -2%±9-2%±9 NSNS
IndobufenIndobufen 5.3%5.3% 4.1%4.1% -29%±29-29%±29 NSNS
Ticlopidine Ticlopidine 21.1% 21.1% 23.2%23.2% 12%±712%±7 NSNS
ClopidogrelClopidogrel 10.1%10.1% 11.1%11.1% 10%±410%±4 0.030.03
Other antiplateletOther antiplatelet 1.3%1.3% 1.4%1.4% 6%±456%±45 NSNS
1.01.00.50.50.00.0 1.51.5 2.02.0

Antithrombotic Trialists’ Collaboration Antithrombotic Trialists’ Collaboration Aspirin plus another antiplatelet vs aspirinAspirin plus another antiplatelet vs aspirin
ComparisonComparison APTAPT AspAsp Reduction Reduction
Asp plusAsp plus 11.8%11.8% 12.4%12.4% 6%±66%±6dipyridamoledipyridamole
Asp plusAsp plus 13.4%13.4% 17.3%17.3% 26%±2026%±20sulphinpyrazonesulphinpyrazone
Asp+ ticlopidineAsp+ ticlopidine 4.8%4.8% 5.9%5.9% 20%±2420%±24
Asp + iv IIb/IIIa- Asp + iv IIb/IIIa- 9.9%9.9% 11.8%11.8% 19%±419%±4inhibitorinhibitor
1.01.00.50.50.00.0 1.51.5 2.02.0
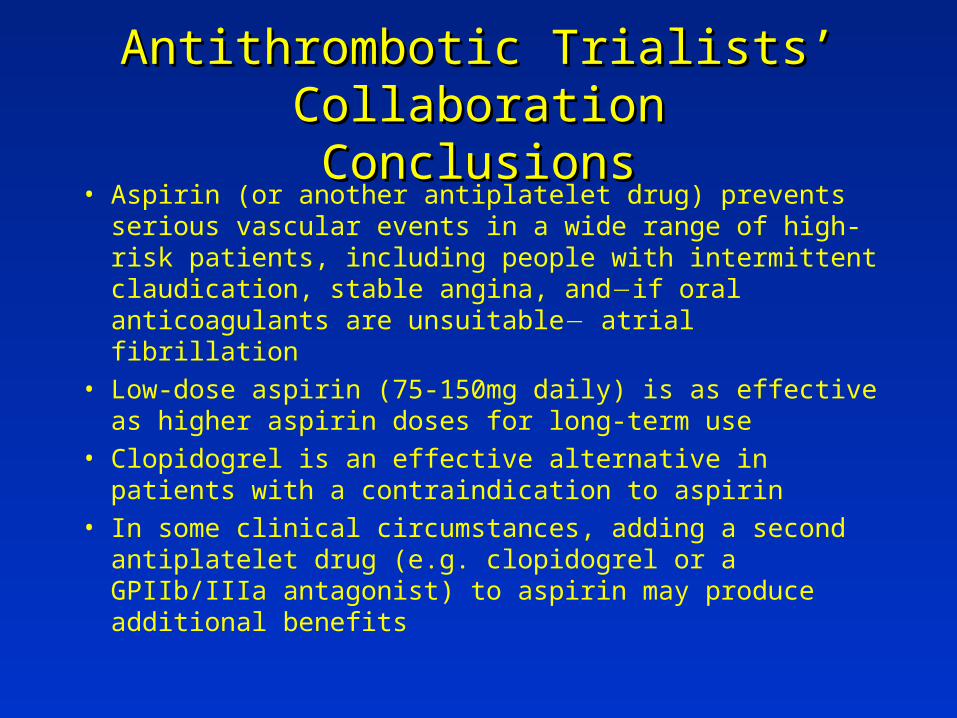
Antithrombotic Trialists’ CollaborationAntithrombotic Trialists’ CollaborationConclusionsConclusions
• Aspirin (or another antiplatelet drug) prevents serious vascular events in a wide range of high-risk patients, including people with intermittent claudication, stable angina, andif oral anticoagulants are unsuitable atrial fibrillation
• Low-dose aspirin (75-150mg daily) is as effective as higher aspirin doses for long-term use
• Clopidogrel is an effective alternative in patients with a contraindication to aspirin
• In some clinical circumstances, adding a second antiplatelet drug (e.g. clopidogrel or a GPIIb/IIIa antagonist) to aspirin may produce additional benefits