Embed Size (px)
Citation preview
ANTIHYPERTENSIVE PROPERTIES OF FLAVONOID-RICH APPLE PEEL EXTRACT, SELECTED FLAVONOIDS AND METABOLITES IN VITRO
by
Nileeka Balasuriya
Submitted in partial fulfilment of the requirements for the degree of Master of Science
at
Dalhousie University Halifax, Nova Scotia
in co-operation with
Nova Scotia Agricultural College
Truro, Nova Scotia
December 2011
© Copyright by Nileeka Balasuriya, 2011

ii
DALHOUSIE UNIVERSITY
NOVA SCOTIA AGRICULTURAL COLLEGE
The undersigned hereby certify that they have read and recommend to the Faculty of Graduate Studies for acceptance a thesis entitled “ANTIHYPERTENSIVE PROPERTIES OF FLAVONOID-RICH APPLE PEEL EXTRACT, SELECTED FLAVONOIDS AND METABOLITES IN VITRO” by Nileeka Balasuriya in partial fulfilment of the requirements for the degree of Master of Science.
Dated: December 12, 2011
Supervisor: _________________________________
Readers: _________________________________
_________________________________
_________________________________

iii
DALHOUSIE UNIVERSITY
AND
NOVA SCOTIA AGRICULTURAL COLLEGE
DATE: December 12, 2011
AUTHOR: Nileeka Balasuriya
TITLE: ANTIHYPERTENSIVE PROPERTIES OF FLAVONOID-RICH APPLE PEEL EXTRACT, SELECTED FLAVONOIDS AND METABOLITES IN VITRO
DEPARTMENT OR SCHOOL: Department of Environmental Sciences
DEGREE: MSc CONVOCATION: May YEAR: 2012
Permission is herewith granted to Dalhousie University to circulate and to have copied for non-commercial purposes, at its discretion, the above title upon the request of individuals or institutions. I understand that my thesis will be electronically available to the public. The author reserves other publication rights, and neither the thesis nor extensive extracts from it may be printed or otherwise reproduced without the author’s written permission. The author attests that permission has been obtained for the use of any copyrighted material appearing in the thesis (other than the brief excerpts requiring only proper acknowledgement in scholarly writing), and that all such use is clearly acknowledged.
_______________________________ Signature of Author

iv
DEDICATIONS
To my beloved parents, my loving sister and brother, For holding me from your love,
For hugging me from your thoughts, For not letting me down at any moment,
Without you this would only be a dream which I could never see infront of my eyes…
v
TABLE OF CONTENTS LIST OF TABLES ........................................................................................................... viii
LIST OF FIGURES ........................................................................................................... ix
ABSTRACT ....................................................................................................................... xi
LIST OF ABBREVIATIONS USED ............................................................................... xii
ACKNOWLEDGEMENT ............................................................................................... xiii
CHAPTER 1.0 INTRODUCTION ................................................................................. 1
CHAPTER 2.0 LITERATURE REVIEW ...................................................................... 4
2.1 Hypertension ............................................................................................................. 4
2.2 Pathogenesis .............................................................................................................. 5
2.3 Renin Angiotensin Aldosterone System (RAAS) ..................................................... 5
2.4 Tissue RAAS ............................................................................................................. 8
2.5 RAAS as a Therapeutic Target .................................................................................. 9
2.6 Angiotensin Converting Enzyme (ACE) ................................................................. 10
2.7 ACE Inhibition ........................................................................................................ 11
2.7.1 Natural ACE Inhibitors Currently in Use ......................................................... 11
2.7.2 Plant Flavonoids as ACE Inhibitors ................................................................. 12
2.7.2.1 Anthocyanins .............................................................................................. 13
2.7.2.2 Flavan-3-ols ............................................................................................... 15
2.7.2.3 Flavonols .................................................................................................... 16
2.7.2.4 Isoflavones ................................................................................................. 18
2.7.2.5 Flavones ..................................................................................................... 19
2.7.2.6 Other Flavonoids ....................................................................................... 20
2.8 Enzyme Kinetic Studies .......................................................................................... 22
2.9 Models of ACE Inhibition ....................................................................................... 23
CHAPTER 3.0 OBJECTIVES ...................................................................................... 26
CHAPTER 4.0 INHIBITION OF ANGIOTENSIN CONVERTING ENZYME BY FLAVONOID-RICH APPLE PEEL EXTRACT, FLAVONOIDS AND SELECTED METABOLITES .......................................................................................... 28
4.1 Abstract ................................................................................................................... 28
4.2 Introduction ............................................................................................................. 29

vi
4.3 Materials and Methods ............................................................................................ 30
4.3.1 Chemicals and Reagents ................................................................................... 30
4.3.2 Sample Preparation for Assays ......................................................................... 31
4.3.2.1 Flavonoid-rich Apple Peel Extract (FAE) ................................................. 31
4.3.2.2 Flavonoids .................................................................................................. 32
4.3.2.3 Quercetin Metabolites ................................................................................ 33
4.3.3 Preparation of Enzyme and Substrate ............................................................... 33
4.3.4. ACE Inhibition ................................................................................................ 33
4.3.4.1 Enzyme Inhibition Assay ............................................................................ 33
4.3.4.2 Measurement of Fluorescence ................................................................... 34
4.3.4.3 Calculation of % Enzyme Inhibition .......................................................... 34
4.3.4.4 Calculation of IC50 Values ......................................................................... 35
4.3.5 Enzyme Kinetic Study ...................................................................................... 35
4.3.5.1 Obtaining Standard Curve for His–Leu ..................................................... 35
4.3.5.2 Enzyme Kinetic Analysis for ACE without Inhibitors ................................ 36
4.3.5.3 Enzyme Kinetic Analysis of Inhibitors ....................................................... 36
4.4 Statistical Analysis .................................................................................................. 37
4.5 Results ..................................................................................................................... 38
4.5.1 Inhibition of ACE ............................................................................................. 38
4.5.2 IC50 Values ....................................................................................................... 45
4.5.3 Enzyme Kinetics ............................................................................................... 45
4.6 Discussion ............................................................................................................... 50
CHAPTER 5.0 EFFECT OF QUERCETIN AND ITS DERIVATIVES ON ACE ACTIVITY IN HUMAN ENDOTHELIAL CELLS ........................................................ 56
5.1 Abstract ................................................................................................................... 56
5.2 Introduction ............................................................................................................. 57
5.3 Materials and Methods ............................................................................................ 58
5.3.1 Human Umbilical Vein Endothelial Cells (HUVEC) ....................................... 58
5.3.2 Chemicals and Reagents ................................................................................... 58
5.3.3 Instruments ....................................................................................................... 59
5.3.4 Preparation of Cell Culture Medium ................................................................ 60
5.3.5 Preparation of Cryopreservation Medium ........................................................ 60
5.3.6 Coating 24-Well Plates with Gelatin ................................................................ 61

vii
5.3.7 Initial Cell Preparation...................................................................................... 61
5.3.8 First Passage ..................................................................................................... 61
5.3.9 Second Passage and Further ............................................................................. 62
5.3.10 Cryopreservation of Cells ............................................................................... 63
5.3.11 Cell Counts and Viability ............................................................................... 63
5.3.12 Treatments for the HUVEC ............................................................................ 63
5.3.12.1 ACE Inhibitors ......................................................................................... 63
5.3.12.2 Preparation of Samples............................................................................ 64
5.3.12.3 Cell Treatments ........................................................................................ 64
5.3.12.4 Effect of DMSO on ACE Activity ............................................................. 65
5.3.12.5 Cell Morphology ...................................................................................... 65
5.3.12.6 Determination of Enzyme Inhibition Using UPLC-MS Analysis of the Product ................................................................................................................... 66
5.3.12.7 Cell Viability Counts ................................................................................ 67
5.3.13 Statistical Analysis ......................................................................................... 67
5.4 Results ..................................................................................................................... 68
5.4.1 Growth of HUVEC ........................................................................................... 68
5.4.2 Effect of DMSO on ACE Activity ................................................................... 68
5.4.3 Detection of Hippuric Acid by UPLC/MS ....................................................... 69
5.4.4 ACE Inhibition ................................................................................................. 70
5.4.5 Cell Morphology............................................................................................... 71
5.5 Discussion ............................................................................................................... 77
CHAPTER 6.0 CONCLUSIONS ................................................................................. 82
6.1 Objectives of the Study ........................................................................................... 82
6.2 ACE Inhibition by FAE, Flavonoids and Metabolites ............................................ 83
6.3 Effect of Selected ACE Inhibitors on Human Endothelial Cell Model .................. 84
6.4 Recommendations for Future Research .................................................................. 85
REFERENCES ................................................................................................................. 88
viii
LIST OF TABLES
Table 2.1: Classification of blood pressure for adults age 18 years or older ...................... 4
Table 2.2: IC50 values of ACE inhibitory flavonoids ........................................................ 21
Table 2.3: IC50 values of ACE inhibition by plant extracts .............................................. 22
Table 4.1: Composition of the FAE prepared from 'Jonagold' apple peels...……..……..32
Table 4.2: Concentration responsive ACE inhibition by FAE in vitro ............................. 39
Table 4.3: Concentration responsive ACE inhibition by flavonols in vitro ...................... 40
Table 4.4: Concentration responsive ACE inhibition by anthocyanins in vitro ................ 41
Table 4.5: Concentration responsive ACE inhibition by flavan-3-ols, flavonones, flavones and isoflavonoids in vitro ................................................................. 42
Table 4.6: Concentration responsive ACE inhibition by quercetin metabolites in vitro .. 43
Table 4.7: Molecular structures of flavonoids .................................................................. 44
Table 4.8: IC50 values of flavonoids for ACE determined using dose response curves ... 45
Table 4.9: Kinetic parameters of the ACE inhibitory activity of FAE, flavonoids and metabolite ........................................................................................................ 49
Table 5.1: Enzyme activity and the % inhibition relative to controls at the presence of different concentrations of inhibitors .............................................................. 71
Table 5.2: Cell viability (% live cells) of HUVEC after 120 min incubation with inhibitors……………………………………………………………………..77
ix
LIST OF FIGURES Figure 2.1: A schematic diagram showing the sequential process of the circulatory renin
angiotensin aldosterone system (RAAS) (Adopted from Vijayaraghavan and Deedwania, 2011)……………………………………………………………..6
Figure 2.2: Chemical structures of selected ACE inhibitors………………………………9
Figure 2.3: Active site of testis ACE with the inhibitor Lisinopril (Adapted from Acharya et al., 2003)…………………………………………………………10
Figure 2.4: Basic structures of selected major flavonoids ……………………………....14
Figure 4.1: Standard curve for His-Leu………………………………………………….36
Figure 4.2: Kinetic behaviour of ACE: Michaleis-Menten (A) and Lineweaver-Burk plot (B)……………………………………………………………………….46
Figure 4.3: Reaction rates for the inhibition of ACE activity by quercetin-3-O-
glucuronic acid and FAE vs substrate concentration (A and B, respectively) and Lineweaver-Burk plots for quercetin-3-O-glucuronic acid and FAE (C and D, respectively)………………………………………………………….47
Figure 4.4: Reaction rates for the inhibition of ACE activity by quercetin-3-O- glucoside and epicatechin vs substrate concentration (A and B, respectively) and Lineweaver-Burk plots for quercetin-3-O-glucoside and epicatechin (C and D, respectively)....……………………………………………………….48
Figure 5.1: The six days experimental setup of treatments for HUVEC………………...65
Figure 5.2: Standard curve of hippuric acid……………………………………………..67
Figure 5.3: ACE activities (mean ± SD) of HUVEC treated at different DMSO concentrations………………………………………………………………..69
Figure 5.4: (a) The UPLC total ion chromatogram for separation of hippuric acid and (b) The mass spectrum of hippuric acid peak at m/z = 178.2………………..70
Figure 5.5: Morphology of cells treated with Captopril with 0.046 µM (A), 0.46 µM (B) and 4.6 µM (C) concentrations at different time points (0, 15, 150 min) 72
Figure 5.6: Morphology of cells treated with FAE with 1 mg/l (A), 10 mg/l (B) and 100 mg/l (C) concentrations at different time points (0, 15, 150 min)………………………………………………………………………......73
x
Figure 5.7: Morphology of cells treated with quercetin with 0.033 µM (A), 0.33 µM (B) and 3.3 µM (C) concentrations at different time points (0, 15, 150 min)……………………………………………………………………..……74
Figure 5.8: Morphology of cells treated with quercetin-3-O-glucoside with 0.021 µM (A), 0.21 µM (B) and 2.1 µM (C) concentrations at different time points (0, 15, 150 min)………………………………………………………………75
Figure 5.9: Morphology of cells treated with quercetin-3-O-glucuronic acid with 0.021 µM (A), 0.21 µM (B) and 2.1 µM (C) concentrations at different time points (0, 15, 150 min)..……………………………………………………...76

xi
ABSTRACT
Hypertension is a major public health problem rising across the globe. Inhibition of angiotensin converting enzyme (ACE) is identified as a main therapeutic target in controlling high blood pressure. The current research study investigated the ACE inhibitory property of a flavonoid-rich apple peel extract (FAE), its constituents, selected flavonoids and some quercetin metabolites using a biochemical assay of ACE inhibition and a human umbilical vein endothelial cell (HUVEC) model. FAE, all the tested flavonoids except genistein, and two quercetin metabolites (quercetin-3-O-glucuronic acid and quercetin-3-O-sulfate) significantly (p < 0.05) inhibited ACE. Enzyme kinetic analysis proved that flavonoids are competitive inhibitors over ACE. In the HUVEC model FAE, quercetin-3-O-glucoside and quercetin-3-O-glucuronic acid significantly (p < 0.05) inhibited ACE. Overall, FAE and most of the flavonoids tested showed ACE inhibition in vitro which needs further investigations using animal and human clinical trials.
xii
LIST OF ABBREVIATIONS USED
ACE Angiotensin converting enzyme Ang I Angiotensin I Ang II Angiotensin II ARB Angiotensin receptor blockers AT1 Angiotensin II type 1 receptor AT2 Angiotensin II type 2 receptor CRD Complete randomize design CVD Cardiovascular disease DF Dilution factor DMEM Dulbecco’s Modified Eagles Medium DMSO Dimethylsulfoxide DW/l Dry weight per liter F Fluorescence FAE Flavonoid-rich apple peel extract FAPGG N-[3-(2-furyl)acryloyl]-L-phenylalanylglycylglycine FBS Fetal bovine serum HCl Hydrochloric acid HHL Hippuryl-L-histidyl-L-leucine His-Leu Histidine-leucine HUVEC Human umbilical vein endothelial cells IC50 Half maximal inhibitory concentration JG Juxtaglomerular apparatus LC-MS Liquid chromatography and mass spectrometry N.D Not determined NaOH Sodium hydroxide NO Nitric oxide PE Plasma protein extravasation Pen-strep Penicillium streptomycin RAAS Renin angiotensin aldosterone system RAEC Rat aortic endothelial cells SD Standard deviation SHR Spontaneously hypertensive rats SH-SY5Y A cell line derived from human neuroblastoma cells SIM Single ion monitoring mode SNS Sympathetic nervous system trypsin-EDTA Trypsin-ethylenediaminetetra acetic acid UPLC/MS Ultra performance liquid chromatography / Mass spectrometry UV Ultraviolet
xiii
ACKNOWLEDGEMENT
First and foremost I am expressing my heartfelt gratitude to my supervisor Dr.
Vasantha Rupasinghe for giving me this wonderful opportunity to pursue my masters
degree under his supervision. This thesis would not have been possible without his
guidance and tremendous support in each and every step. Next I would like to thank my
supervisory committee Dr. Robin Robinson and Dr. David Barrett for helping me in
many ways throughout the project. It is an honor to have Dr. Robin Robinson, Professor
Emeritus of Nova Scotia Agricultural College as a member of my supervisory committee.
My sincere thanks go to the funding agency: Natural Sciences and Engineering Research
Council of Canada (NSERC) for providing the financial support to carry on the research.
I am so thankful to my beloved parents, my sister and brother for always inspiring me
throughout this journey. I am indebted to all my loving friends (especially Surangi
Thilakaratne and Malinda Thilakaratne) who stood beside me giving their fullest support
whenever I need.

1
CHAPTER 1.0 INTRODUCTION
Hypertension is a common progressive disorder leading to chronic diseases like
cardiovascular disease (CVD), stroke, renal disease and diabetes. One quarter of the
world’s adult population is already afflicted with hypertension and the numbers are likely
to increase up to 29% within another decade (Mittal and Singh, 2010). As this chronic
disorder is asymptomatic in nature, unawareness could lead to fatal conditions such as
stroke or heart failure. Frequent measurement of blood pressure is the most convenient
way to detect hypertension. In view of the fact that hypertension is a major causative
factor for development of chronic diseases, prevention and cure are equally important.
Interestingly, hypertension is identified as the most modifiable risk factor in prevention
of many chronic diseases (Jiang and Paul, 1997).
Pathogenesis of hypertension could have many causes. Over-activation of the
renin angiotensin aldosterone system (RAAS) is a prominent factor among all.
Angiotensin converting enzyme (ACE) plays a key role in RAAS by producing
angiotensin II (Ang II), which is a potent vasoconstrictor. Therefore, in the past decade
inhibition of ACE has become a key therapeutic target in the treatment of hypertension.
Common ACE inhibitors currently in use include Captopril, Rampiril, Lisinopril,
Enalapril etc. Due to many unacceptable side effects which are associated with the intake
of most ACE inhibitory drugs, research continue to seek natural alternatives. The ACE
inhibitors are being investigated as dietary supplements which may alleviate
hypertension.
Several classes of plant secondary metabolites have shown ACE inhibitory
properties in vitro. The majority of these compounds belong to the group of plant

2
compounds known as flavonoids. The basic structure of the flavan nucleus undergoes
various chemical reactions (hydroxylation, methoxylation, glycosylation) and gives rise
to different classes of flavonoids like flavones, flavonols, anthocyanins, flavan-3-ols,
isoflavones and flavanones (Rupasinghe, 2008). The synergistic effect of many
compounds present in extracts was found to be effective in ACE inhibition when
compared with single compounds (Persson et al., 2009). However, one of the drawbacks
in in vitro studies is the lack of representation of biological systems. The bioactive
molecules are converted into different types of metabolites when ingested into the body.
Therefore, studying the metabolites of bioactive compounds in vitro could generate more
relevant results to biological systems and compensate for drawbacks.
In addition to the circulatory RAAS, several tissues and organs also have shown
the ability to synthesize Ang II which is called tissue RAAS. Apart from the chemically
driven bio-assays, cell culture model systems are a promising way to investigate both
circulatory and tissue RAAS components. Different kinds of endothelial cell lines are
widely used in ACE inhibitory studies. Umbilical vein endothelial cells from humans
(HUVEC) are the most widely used cell line in many reported studies associated with the
RAAS system (Persson et al., 2009 and Ottaviani et al., 2006).
In general, when a therapeutic agent or drug is developed for CVD from plant
bioactives, more attention should be paid to the structural properties of the bioactive
compounds. Most of the studies conducted on plant-derived ACE inhibitors so far have
not focused sufficiently on the relationship between structure and activity or on the type
of inhibition. In flavonoids, the presence and position of the hydroxyl groups, the
presence and type of the sugar moiety, and the presence of active groups such as

3
carboxylic groups were found to impact the extent of the enzyme inhibition. Flavonoids
were found to interact with the active site of the ACE specifically through the hydroxyl
groups which were present (Wagner et al., 1991).
The current research study focused on screening for a potent ACE inhibitor where
the sources included flavonoid-rich apple peel extract (FAE), subclasses of flavonoids
and selected metabolites of flavonoids. In vitro enzyme inhibition assay and a cell culture
model were used to study the ACE inhibition. The investigated FAE along with a variety
of flavonoids, was designed to assist in identification of promising compounds with the
ability to inhibit ACE. Therefore, the research could provide some preliminary
understanding for future development of an effective dietary supplement for reducing the
risk of hypertension through ACE inhibition.

4
CHAPTER 2.0 LITERATURE REVIEW
2.1 Hypertension
Hypertension is a rising public health problem across the globe. One-quarter of
the world's adult population is afflicted by hypertension and this is likely to increase to
29% by 2025 (Mittal and Singh, 2010). Due to its asymptomatic nature, most people are
not aware that they suffer from hypertension. The unawareness could lead to fatal
conditions such as stroke or heart attack.
The optimal blood pressure for a healthy individual above 18 years of age is
defined as a mean systolic blood pressure < 120 mm Hg and a mean diastolic blood
pressure < 80 mm Hg. Blood pressure values greater than these could further be
categorized according to the level of severity (Table 2.1). The level of blood pressure
varies depending on age, gender, ethnicity, environmental factors and genetics. Average
blood pressure is found to be increasing with age and men are reported to have slightly
higher levels of blood pressure compared to women (Jiang and Paul, 1997).
Table 2.1: Classification of blood pressure for adults age 18 years or older Category Systolic BP (mm Hg) Diastolic BP (mm Hg) Optimal <120 <80
Normal 120-129 80-84
High normal 130-139 85-89
Hypertension
Stage 1 (mild) 140-159 90-99
Stage 2 (moderate) 160-179 100-109
Stage 3 (severe) 180-209 110-119
Stage 4 (very severe) >210 >120
Source: He and Whelton, 1997

5
Hypertension is an independent risk factor for several chronic diseases such as
cardiovascular disease (CVD), stroke, renal disease and diabetes. Therefore, it is of great
importance to identify and treat hypertension in its early stages. Interestingly,
hypertension is identified as the most modifiable risk factor in the prevention of most
chronic diseases (Jiang and Paul, 1997). Life style changes, physical exercise, intake of
healthy diets and stress management are some common approaches for reducing the risk
of hypertension.
2.2 Pathogenesis
The pathology of hypertension could have many causes. For example, increased
activity of the renin angiotensin aldosterone system (RAAS) and the sympathetic nervous
system (SNS), endothelial dysfunction and genetic influence have been implicated
(Oparil et al., 2003). Increased activity of the sympathetic nervous system could trigger
high blood pressure by causing rapid contraction of the heart muscle to increase the
cardiac output, by increasing the fluid retention in kidneys and by increasing the vascular
resistance in blood vessels (Oparil et al., 2003). The impaired production of nitric-oxide
(NO) from the endothelium has also been found to increase the risk of hypertension
where NO is acting as a vasodilator (Taddei et al., 2000). Among these causes, over
activation of RAAS (Figure 2.1) is significant (Hammoud et al., 2007).
2.3 Renin Angiotensin Aldosterone System (RAAS)
The RAAS (Figure 2.1) starts with the production of renin by the juxtaglomerular
(JG) cells of the kidney. Production of renin is regulated by several mechanisms. The
renal baro-receptor mechanism senses the low blood pressure of the afferent arteriole and
generates secretion of renin by JG cells. The changes in chloride ion concentration are

6
sensed by the macula densa cells and trigger the production of renin by JG cells.
Furthermore, sympathetic nervous system activation and negative feedback from
angiotensin II (Ang II) initiate renin secretion (Atlas, 2007).
Figure 2.1: A schematic diagram showing the sequential process of the circulatory renin angiotensin aldosterone system (RAAS) (Adopted from Vijayaraghavan and Deedwania, 2011)
Angiotensinogen
Angiotensin I
Renin
ACE
Angiotensin II
AT1 receptor AT2 receptor (Fetal)
Vasconstriction
Cardiac hypertrophy
Aldosterone synthesis
Sodium reabsorption
SNS activation
Hypertension
Chymase / Cathepsin (Tissue RAAS)
Bradykinin (Vasodilator peptide)
Inactive bradykinin
Liver
Kidney
ARB
ACEI
ACEI
7
Renin cleaves the globular protein, angiotensinogen produced by liver cells, into
angiotensin I (Ang I). Angiotensinogen is continuously produced by the liver cells and is
present in the circulation at a stable concentration. The conversion of angiotensinogen to
Ang I by renin is identified as the rate limiting factor of RAAS where control of renin
activity plays a significant role in controlling RAAS (Atlas, 2007).
Ang I does not trigger any blood pressure increasing functions therefore, it is
considered as an inactive form. Ang I is hydrolyzed by angiotensin converting enzyme
(ACE). The decapeptide (Ang I) is converted into an octapeptide (Ang II) through
cleavage by the N terminal amino acids. Ang II is a potent vasoconstrictor (Atlas, 2007).
The ACE has the ability to breakdown vasodilator peptides, including bradykinin and
kallidin. The overall action of ACE is to promote vasoconstriction. The ACE is a zinc
metallopeptidase produced by endothelial cells (Spyroulias et al., 2004) and exists as a
membrane bound enzyme but can also be found in the circulatory system. The
physiologically important role is provided by the membrane bound form of the enzyme
(Atlas, 2007).
The Ang II is responsible for all the blood pressure increasing mechanisms. Ang
II receptors are present in various tissues. Several subtypes of Ang II receptors have been
identified, of which the type 1 receptor (AT1) is the most prominent. The type 2 (AT2)
receptors are abundant during fetal development and the expression diminishes in the
postnatal period (Atlas, 2007).
The binding of Ang II with AT1 receptor increases vasoconstriction, cardiac
contractility, renal tubular sodium re-absorption, SNS activity and stimulation of
aldosterone synthesis (Atlas, 2007), resulting an increased blood pressure. In spite of the
8
blood pressure increasing mechanisms, Ang II is also responsible for initiating cell
growth and proliferation, inflammatory responses and oxidative stress.
The Ang II stimulates the production of aldosterone by stimulating the zona
glomerulosa of the adrenal cortex. Aldosterone hormone plays a significant role in
maintaining the sodium and potassium balance. Aldosterone facilitates re-absorption of
sodium from the distal tubules of the nephrons and collecting ducts. With the absorption
of sodium, water is reabsorbed; the resulting blood volume increase ultimately raises
blood pressure (Atlas, 2007).
Dysregulation of circulatory RAAS is associated with clinical hypertensive
disorders. Therefore, controlling of circulatory RAAS had been identified as a major
therapeutic target.
2.4 Tissue RAAS
In addition to the circulatory RAAS which plays the prominent role in increasing
blood pressure, several tissues and organs (heart, kidney, brain, adrenal gland, adipose
tissue) have the ability to synthesize Ang II which is referred as tissue RAAS or local
RAAS. The renin enzyme and angiotensinogen are taken up from the circulatory system.
The conversion of Ang I to Ang II occurs via non-ACE-mediated pathways. Enzymes
like cathepsin G and chymases are involved in this conversion in tissue RAAS (Atlas,
2007). However, there is less evidence concerning the exact role of tissue RAAS in the
pathogenesis of hypertension.

9
2.5 RAAS as a Therapeutic Target
There are several targets identified as blocking the dysregulated RAAS. Inhibition
of renin and ACE, blocking the AT1 and aldosterone receptors are among them. The ACE
inhibitors (Figure 2.2) were first developed in the late 1970’s as drugs in treatment of
hypertension. Renin inhibitors were discovered recently. Aliskiren (TekTurnaTM) was the
first renin inhibitor which was approved by the US Food and Drug Administration
(Vijayaraghavan and Deedwania, 2011). Ang II receptor blockers (ARB) target AT1
receptors. The ARBs currently in use include Candesartan, Irbesartan, Losartan and
Telmisartan. Aldosterone antagonists include Spironolactone, Eplerenone and Canrenone
(Vijayaraghavan and Deedwania, 2011).
N
ONH
O
OH
CH3
O O CH3
N
ONH
O
OH
NH2
O
OH
Enalapril Lisinopril
N
O
O
OH
CH3
SH
Captopril
Figure 2.2: Chemical structures of selected ACE inhibitors
10
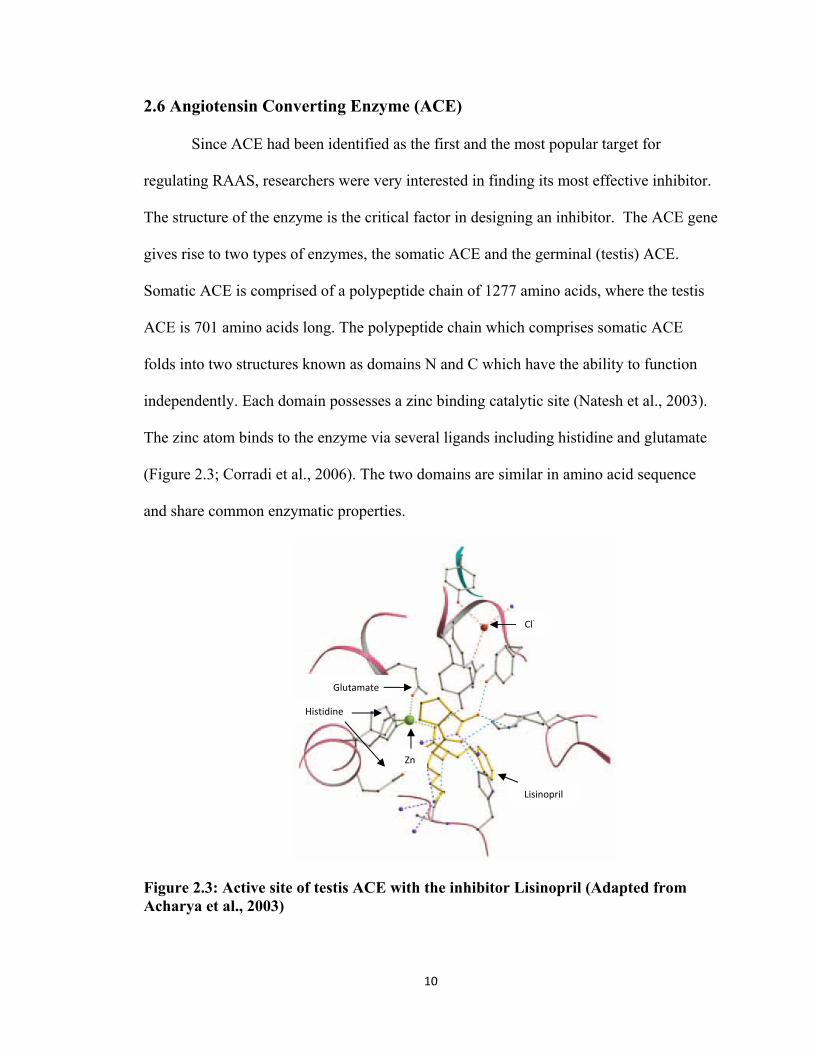
2.6 Angiotensin Converting Enzyme (ACE)
Since ACE had been identified as the first and the most popular target for
regulating RAAS, researchers were very interested in finding its most effective inhibitor.
The structure of the enzyme is the critical factor in designing an inhibitor. The ACE gene
gives rise to two types of enzymes, the somatic ACE and the germinal (testis) ACE.
Somatic ACE is comprised of a polypeptide chain of 1277 amino acids, where the testis
ACE is 701 amino acids long. The polypeptide chain which comprises somatic ACE
folds into two structures known as domains N and C which have the ability to function
independently. Each domain possesses a zinc binding catalytic site (Natesh et al., 2003).
The zinc atom binds to the enzyme via several ligands including histidine and glutamate
(Figure 2.3; Corradi et al., 2006). The two domains are similar in amino acid sequence
and share common enzymatic properties.
Figure 2.3: Active site of testis ACE with the inhibitor Lisinopril (Adapted from Acharya et al., 2003)
Histidine
Glutamate
Zn
Cl‐
Lisinopril
11
2.7 ACE Inhibition
Drugs were first used as ACE inhibitors and they can be divided into three groups
according to their chemical structures, i.e. sulfhydryl containing (Captopril),
dicarboxylate containing (Enalpril, Lisinopril, Ramipril) and phosphate containing
(Fosinopril; Vijayaraghavan and Deedwania, 2011). The first derived ACE inhibitor was
Captopril. The active sulfhydryl group of the drug binds with the zinc atom thereby
inhibiting the binding of the substrate. However, intake of Captopril was associated with
side effects like proteinuria, altered taste and skin rashes. The carboxyl group of
compound inhibitors was produced later as a solution to minimize the side effects. The
carboxyl group has shown higher lipophilicity compared to other active groups and this
was favoured for the binding with ACE (Atlas, 2007). Though improvements were made,
intake of ACE inhibitory drugs causes significant side effects. Other than the above
mentioned, dry cough, angioedema, fetal abnormalities, hypotension, deterioration of
renal function and hyperkalemia were specified (Atlas, 2007).
Due to the side effects of the currently used drugs, new alternatives have been
studied extensively. Research on natural bioactives has gained much attention. Most of
the natural bioactives were derived from food components, plant extracts, marine
products and microorganisms.
2.7.1 Natural ACE Inhibitors Currently in Use
Different types of naturally derived compounds have been investigated for their
ACE inhibitory properties. Protein derivatives are a major group of compounds
investigated as potential ACE inhibitors. They can be divided into three categories as
animal-derived, plant-derived and microorganism-derived peptides. The animal-derived

12
category includes peptides from milk, meat, fish and eggs (Hong et al., 2008). Casein,
whey protein hydrolysates from milk and ovokinin from eggs are reported to be effective
ACE inhibitors in both in vivo and in vitro studies (Hong et al., 2008 and Yamamoto,
1997). Meat and fish proteins are hydrolyzed using different enzymes such as chymases,
and the resulting fractions are used to determine ACE inhibitory properties. Among the
fish species used for deriving ACE inhibitory peptides are bonito, sardine, salmon, hake
and tuna (Cinq-Mars et al., 2007 and Vercruysse et al., 2005). Plant-derived peptides
have also been identified from different sources including soybean, flaxseed, sunflower,
rice and corn (Farzamirad and Aluko, 2008, Guan and Phillips, 2009 and Udenigwe et al.,
2009). There is less evidence on microorganism-derived peptides.
Secondary metabolites produced in plants are another group of natural compounds
which are identified as potential ACE inhibitors. Some terpenoids and polyphenolic
compounds including flavonoids, hydrolysable tannins, xanthones, procyanidins,
caffeolyquinic acid derivatives are found to be effective as natural ACE inhibitors (Kang
et al., 2003 and Loizzo et al., 2007). Most studies have shown that plant extracts rich in
phytochemicals were effective in ACE inhibition. However, identification of compounds
which specifically inhibit ACE is lacking.
2.7.2 Plant Flavonoids as ACE Inhibitors
Flavonoids are the largest group of polyphenolic compounds found in higher
plants (Croft, 1998). Tea, wine, apples, onions, grapes, and oranges are some foods rich
in flavonoids. The biosynthesis of flavonoids occurs in higher plants through the shikimic
acid and malonic acid pathways (Rupasinghe, 2008).The common structure of flavonoids
is comprised of two phenyl rings (A and C rings) joined with three carbons which make a
13
closed pyran ring structure (B ring; D’Archivio et al., 2007). Based on the structural
differences, flavonoids are further subdivided into six sub-groups namely flavanones,
flavones, flavonols, flavan-3-ols, anthocyanins and isoflavones (D’Archivio et al., 2007).
The highly diverse structures of flavonoids show numerous functions in biological
systems. In plants, flavonoids contribute to insect attraction and repulsion through colour
of leaves, fruits and flowers; protection against viral, fungal and bacterial infections and
UV light; nodulation in legume roots etc. (Stevenson and Hurst, 2007).
Flavonoids are effective antioxidants in plants as well as in animals (Croft, 1998).
Flavonoids in the diet are identified as potential risk reducing components for
cardiovascular disease, various cancers, neurodegenerative diseases, etc. (Stevenson and
Hurst, 2007). For example, quercetin-3-O-glucoside, a flavonoid compound ubiquitous in
fruits, has shown a protective effect on human neuroblastoma cells (SH-SY5Y). It limits
oxidative stress through a membrane injury recovery mechanism that is involved in the
up-regulation of genes involved in lipid and cholesterol synthesis (Soundararajan et al.,
2008).
2.7.2.1 Anthocyanins
Anthocyanins are water soluble plant pigments giving rise to red, blue and purple
colours of fruits and vegetables. In plants, they occur as anthocyanidins (aglycone form,
Figure 2.4) and then conjugate with sugars to form anthocyanins (D’Archivio et al.,
2007). Anthocyanins have shown ACE inhibition in vitro. Delphinidin-3-O-
sambubiosides and cyanidin-3-O-sambubiosides isolated from Hibiscus (Hibiscus
sabdariffa L.) extracts have been shown to inhibit ACE in a dose dependent manner
(Ojeda et al., 2010).

14
OH
O
OH
OH
OH
OH A
B
C
O+
OH
OHOH
OH
Flavan-3-ol Anthocyanidin
O
OH
OOH
OH
OH
OH
O
OH
OOH
OH
Flavonol Flavone
Figure 2.4: Basic structures of selected major flavonoids
The IC50 (half maximal inhibitory concentration) values of anthocyanins were
found to be in 100 to 150 µM range (Table 2.2; Ojeda et al., 2010). Similarly, cyanidin-3-
O-β-glucoside isolated from rose species (Rosa damascena) inhibited ACE in vitro.
However, other flavonols isolated from rose extract were not effective ACE inhibitors
when compared to cyanidin-3-O-β-glucoside (Kwon et al., 2010). Bilberry (Vaccinium
myrtillus) extracts rich in major anthocyanins i.e. cyanidin, delphinidin and malvidin,
were investigated for their effect on ACE in a HUVEC model and the ACE activity was
significantly reduced after incubation of cells with bilberry extracts (Persson et al., 2009).
Dietary administration of anthocyanin-rich (cyanidin-3-glucosides, cyanidin-acyl-
glucoside and peonidin-acyl-glucoside) purple corn, purple sweet potato and red radish to
spontaneously hypertensive rats (SHR) decreased their systolic and mean blood pressure
15
(Shindo et al., 2007). The mechanisms behind the reduction of blood pressure by
anthocyanins were reported to be due to their antioxidant activity, preservation of
endothelial nitric oxide, and prevention of serum lipid oxidation. However, ACE
inhibition was not found (Shindo et al., 2007).
The observed ACE inhibitory activity of anthocyanins in vitro could be explained
by the metal chelating ability of flavonoids with hydroxyl groups at 3, 5, 7 and 3΄, 4΄
positions (Kwon et al., 2010 and Persson et al., 2009). The planer structure of the
anthocyanin molecules were considered to be important in metallopeptidase inhibition
(Ojeda et al., 2010). In animals, the absorption rate and the corresponding metabolites of
anthocyanins affect enzyme inhibition. However, a strong correlation between ACE
inhibition in vitro and animal model systems has not been reported.
2.7.2.2 Flavan-3-ols
Flavanols have a saturated C-ring with a hydroxyl group at the C-3 position
(Figure 2.4). They do not exist in glycosylated form as in other flavonoids. They can be
found in both monomer form as catechins and polymer form as procyanidins (D’Archivio
et al., 2007). When ACE was incubated with flavanol-rich food extracts such as
chocolates, tea and wine, a significant correlation between the ACE inhibition and the
concentration of procyanidin and epicatechin was observed (Actis-Goretta et al., 2006).
The ACE inhibition by epicatechins of cocoa could explain the positive relationship
between dark chocolate consumption and reduced high blood pressure (Egan et al.,
2010). The four major catechins, (–)-epicatechin, (–)-epigallocatechin, (–)-
epicatechingallate and (–)-epigallocatechingallate, isolated from tea have also shown a
dose dependent ACE inhibition in a HUVEC culture model (Persson et al., 2006).

16
Pycnogenol, a procyanidin oligomer, isolated from French maritime pine (Pinus
maritime) was also reported as an effective mediator for blood pressure regulation,
possibly by ACE inhibition (Zibadi et al., 2008). These studies suggest that among
flavonoids, flavanols and procyanidins could also act as potent inhibitors of ACE in vitro.
The relationship between the structure of flavanols and ACE inhibitory properties
in vitro has been studied (Ottaviani et al., 2006). Increasing numbers of epicatechin units
in the procyanidins had increased the enzyme inhibition. When tested using HUVEC cell
cultures, tetramers were the most effective enzyme inhibitors compared to dimers and
hexamers of procyanidins (Ottaviani et al., 2006). The monomers of flavanols were found
to be absorbed in the small intestine (García-Cornesa et al., 2009). However, absorption
of procyanidins with higher molecular weight has not clearly been reported. Though the
tetramers were shown to be the most effective in vitro, the dimers were more effective in
biological systems compared to both tetramers and hexamers (Ottaviani et al., 2006).
2.7.2.3 Flavonols
Flavonols (Figure 2.4) are reported to be the most ubiquitous flavonoid sub-group
present in foods. Quercetin, kaempferol and myricetin are the three most common
flavonols in our diet (D’Archivio et al., 2007). The ACE inhibitory property of many
flavonols has been reported. When a bioassay-guided fractionation of extract of stonecrop
(Sedum sarmentosum) was performed, five purified flavonols were found to possess ACE
inhibitory activity (Oh et al., 2004; Table 2.2). Kaempferol-rich stem bark extracts of
Cluster Fig (Ficus racemosa) had a dose-dependent ACE inhibition property in vitro
(Ahmed et al., 2010). Based on an ex vivo experiment conducted using aortic tissues of
male Wistar-Kyoto rats, kaempferol was found to be an effective ACE inhibitor but not

17
resveratrol (Olszanecki et al., 2008), a polyphenol that is abundant in red wine. The
presence of a carbonyl group in the pyran ring of kaempferol is lacking in resveratrol and
this could be a reason for the differences in their ACE inhibitory activity.
However, when strawberry extracts rich in flavonoids were tested for ACE
inhibition in vitro, no ACE inhibition was observed (Pinto et al., 2008). Aqueous extracts
of Gingko biloba, which had quercetin derivatives as the major flavonoids, had higher
ACE inhibitory activity than that of ethanol extracts of Gingko biloba (Pinto et al., 2009).
The aqueous extracts of red currents (Ribes rubrum L.) and black currents (Ribes nigrum
L.) exhibited ACE inhibition in vitro but not the extracts of red and green gooseberries
(Ribes uva-crispa L.; Pinto et al., 2010). The variation in the ACE inhibitory activity of
plant extracts may be due to the type of flavonoids present and their concentrations, the
genetic differences of plant materials and the method of preparation of extracts.
Flavonols act as prominent antioxidants in biological systems. Dietary quercetin
supplementation at 730 mg/d for 28 d was found to be effective in reducing blood
pressure in hypertensive patients in a randomized, double-blind, placebo-controlled,
crossover study (Edwards et al., 2007). In another study, Captopril and quercetin
treatments were given to male Wistar rats separately, whose hypertensive responses were
triggered by Ang I and bradykinin injections. Bradykinin is a physiologically active
peptide that causes blood vessels to enlarge. Both treatments significantly triggered the
hypotensive responses and quercetin was equally effective to Captopril when given orally
or intravenously (Häckl et al., 2002). A significant reduction of plasma ACE due to
quercetin pretreatment (88.7 mol/kg) was reported in this animal study. In contrast,
chronic treatment of quercetin aglycone that was given at 10 mg/kg intraperitoneally for

18
14 d to rats, did not inhibit plasma ACE activity compared to the control group (Neto-
Neves et al., 2010).
ACE is found to be involved in plasma protein extravasation (PE), which is an
important component in neurogenic inflammation (Willie et al., 2001). It is known that
PE can be evoked by substance P which is hydrolyzed by ACE. Similar to the action of
Captopril, dietary supplementation of quercetin can potentiate plasma PE induced by
substance P in the rat urinary bladder, possibly by the inhibition of the peptidase which
hydrolyzes substance P (Nicolau et al., 2003). From the reviewed literature, flavonols
showed potential ACE inhibition both in vitro and in vivo. However, since flavonols are
known to produce sulfate, glucuronide and methylated metabolites in vivo (Rupasinghe et
al., 2010), ACE inhibition by quercetin metabolites (in vitro) requires further
investigation.
2.7.2.4 Isoflavones
Isoflavones are unique flavonoids as they exhibit structural similarity to
mammalian estrogen hormone. They can effectively bind to the estrogen receptor and are
often called phytoestrogens (Jackson et al., 2002). Genistein, daidzein and glycetin are
the most common isoflavones present in plants (D’Archivio et al., 2007). Among them,
genistein is the isoflavone most widely investigated for its health promoting effects. The
major isoflavone in soybean is genistein (Wu and Muir, 2008). Genistein has been
reported for reducing blood pressure in research animal models. For example, genistein
has decreased NaCl-sensitive hypertension in stroke-prone spontaneously hypertensive
rats (Cho et al., 2007).Genistein dose-dependently decreased ACE gene expression and
enzyme activity in rat aortic endothelial cells (RAEC), serum and aorta tissue (Xu et al.,

19
2006). In vitro studies showed a concentration-dependent ACE inhibition by genistein
which was confirmed by others (Montenegro et al., 2009). However, the presence of
isoflavones in ACE inhibitory soybean peptide fractions has not shown any enhanced
enzyme inhibitory effect when compared with the peptide fractions without isoflavones.
Studies have been conducted using research animal models to investigate the in vivo
activity of isoflavones. Pretreatment with a single intravenous injection of genistein 25
mg/kg demonstrated reduced hypertensive responses in hypertensive Wistar rats. The
reduced hypertension was associated with significant reduction of ACE activity in rat
plasma (Montenegro et al., 2009). Another in vivo study had shown that genistein can
down regulate ACE gene expression by interfering with cell signaling pathways (Xu et
al., 2006). However, there are no related studies on the ACE inhibitory effect of two
other soybean isoflavones, daidzein and glycetin.
2.7.2.5 Flavones
There is less information about ACE inhibitory properties of flavones compared
to other types of flavonoids. However, extracts of Roxb (Ailanthus excels (roxb)),
Japanese cedar (Cryptomeria japonica), (Hibiscus sabdariffa) and Senecio species
(Compositae) which are comprised of flavones have shown the ACE inhibitory property
(Table 2.3). The two major flavones of Roxb, apigenin and luteolin, have demonstrated a
dose dependent enzyme inhibition. Compared to luteolin aglycone, luteolin-7-O-
glucoside have reduced enzyme activity comprising to a higher IC50 value (Table 2.2;
Loizzo et al., 2007). The loss of a hydroxyl group at the 7thposition could be the reason
for the decreased enzyme inhibition by the glycoside. The ethanol extracts of the outer
bark of Japanese cedar inhibited ACE in vitro and resulted in an IC50 value of 16 µg/mL.

20
The extract was rich in flavan-3-ols and flavones. The enzyme inhibitory effect could be
a result of the synergistic effect of all compounds present in the extract (Tsutsumi et al.,
1997). Crude hydro alcoholic extract rich in flavones from Hibiscus sabdariffa exhibited
satisfactory enzyme inhibition on ACE but not elastase, trypsin and alpha-chymotrypsin
(Jonadet et al., 1990). As all the studies discussed were investigating the effect of plant
extracts containing flavones, the inhibitory effect could also be due to other constituents
of the extract. Specific focus on isolated flavone compounds and their ACE inhibitory
activity can generate valuable information about the flavones with ACE inhibition
properties.
2.7.2.6 Other Flavonoids
Chalcones are precursor molecules of the biosynthetic pathways of flavonoids
(Rupasinghe et al., 2008). These consist of two phenyl rings joined by a three carbon
open chain. There are numerous evidences concerning beneficial pharmacological
properties of chalcones. Chalcones and their pyrazole derivatives inhibited ACE in a
concentration-dependent manner in vitro (Bonsei et al., 2010). Butein, a chalcone,
supplementation through intravenous injection has been found to reduce the arterial blood
pressure in anesthetized normotensive rats (Kang et al., 2003). The ACE activity
decreased in a dose dependent manner; however, the IC50 value of butein seems to be
significantly greater than other flavonoids (Table 2.2).
21
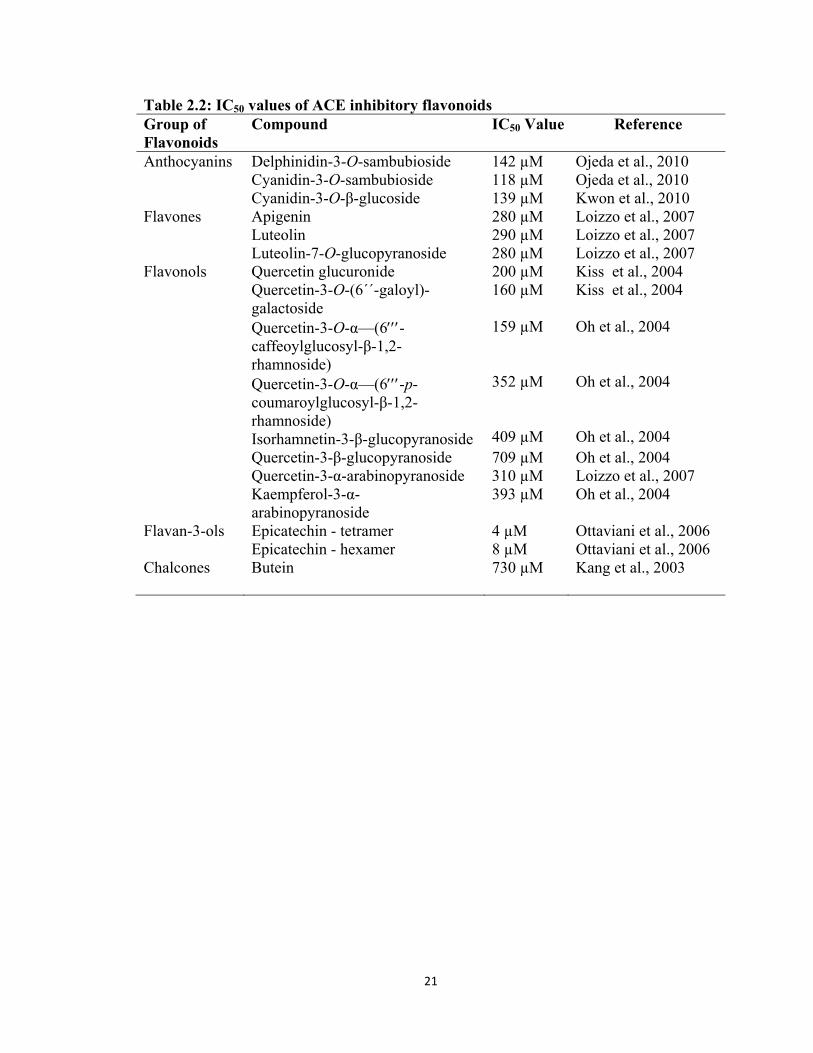
Table 2.2: IC50 values of ACE inhibitory flavonoids Group of Flavonoids
Compound IC50 Value Reference
Anthocyanins Delphinidin-3-O-sambubioside 142 µM Ojeda et al., 2010 Cyanidin-3-O-sambubioside 118 µM Ojeda et al., 2010 Cyanidin-3-O-β-glucoside 139 µM Kwon et al., 2010 Flavones Apigenin 280 µM Loizzo et al., 2007 Luteolin 290 µM Loizzo et al., 2007 Luteolin-7-O-glucopyranoside 280 µM Loizzo et al., 2007 Flavonols Quercetin glucuronide 200 µM Kiss et al., 2004 Quercetin-3-O-(6´´-galoyl)-
galactoside 160 µM Kiss et al., 2004
Quercetin-3-O-α—(6-caffeoylglucosyl-β-1,2-rhamnoside) Quercetin-3-O-α—(6-p- coumaroylglucosyl-β-1,2- rhamnoside) Isorhamnetin-3-β-glucopyranoside
159 µM 352 µM 409 µM
Oh et al., 2004 Oh et al., 2004 Oh et al., 2004
Quercetin-3-β-glucopyranoside 709 µM Oh et al., 2004 Quercetin-3-α-arabinopyranoside 310 µM Loizzo et al., 2007 Kaempferol-3-α-
arabinopyranoside 393 µM Oh et al., 2004
Flavan-3-ols Epicatechin - tetramer 4 µM Ottaviani et al., 2006 Epicatechin - hexamer 8 µM Ottaviani et al., 2006 Chalcones Butein
730 µM
Kang et al., 2003
22
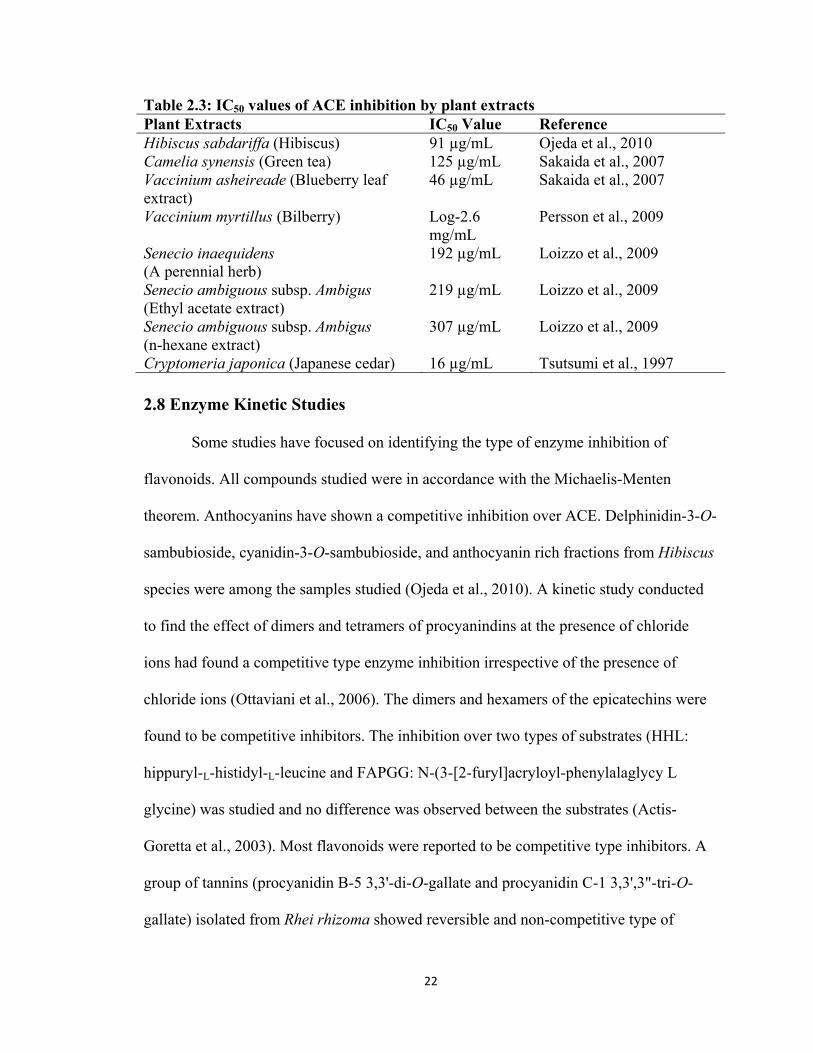
Table 2.3: IC50 values of ACE inhibition by plant extracts Plant Extracts IC50 Value Reference Hibiscus sabdariffa (Hibiscus) 91 µg/mL Ojeda et al., 2010 Camelia synensis (Green tea) 125 µg/mL Sakaida et al., 2007 Vaccinium asheireade (Blueberry leaf extract) Vaccinium myrtillus (Bilberry)
46 µg/mL Log-2.6 mg/mL
Sakaida et al., 2007 Persson et al., 2009
Senecio inaequidens (A perennial herb)
192 µg/mL Loizzo et al., 2009
Senecio ambiguous subsp. Ambigus (Ethyl acetate extract)
219 µg/mL Loizzo et al., 2009
Senecio ambiguous subsp. Ambigus (n-hexane extract)
307 µg/mL Loizzo et al., 2009
Cryptomeria japonica (Japanese cedar) 16 µg/mL Tsutsumi et al., 1997
2.8 Enzyme Kinetic Studies
Some studies have focused on identifying the type of enzyme inhibition of
flavonoids. All compounds studied were in accordance with the Michaelis-Menten
theorem. Anthocyanins have shown a competitive inhibition over ACE. Delphinidin-3-O-
sambubioside, cyanidin-3-O-sambubioside, and anthocyanin rich fractions from Hibiscus
species were among the samples studied (Ojeda et al., 2010). A kinetic study conducted
to find the effect of dimers and tetramers of procyanindins at the presence of chloride
ions had found a competitive type enzyme inhibition irrespective of the presence of
chloride ions (Ottaviani et al., 2006). The dimers and hexamers of the epicatechins were
found to be competitive inhibitors. The inhibition over two types of substrates (HHL:
hippuryl-L-histidyl-L-leucine and FAPGG: N-(3-[2-furyl]acryloyl-phenylalaglycy L
glycine) was studied and no difference was observed between the substrates (Actis-
Goretta et al., 2003). Most flavonoids were reported to be competitive type inhibitors. A
group of tannins (procyanidin B-5 3,3'-di-O-gallate and procyanidin C-1 3,3',3"-tri-O-
gallate) isolated from Rhei rhizoma showed reversible and non-competitive type of
23
inhibition over ACE. The inhibitory kinetics in this case were determined using Dixon
plots (Uchida et al., 1987). There is little evidence associated with the enzyme kinetics of
specific flavonoids compared to other types of natural inhibitors such as peptides
(Udenigwe et al., 2009). Flavan-3-ols and anthocyanins were the only groups identified
on when kinetic studies had been performed in relation to ACE inhibition (Ojeda et al.,
2010).
2.9 Models of ACE Inhibition
By considering the above mentioned studies, it can be noted that both in vitro and
in vivo models have been used to assess the ACE inhibition. In vitro assays are the
starting point of the experimental process. Based on the results, experiments could be
carried out to further confirm the efficacy using in vivo models.
In in vitro models the enzyme reaction takes place in a controlled environment
where optimal conditions for the reaction are provided. A buffer at optimal pH (8.3) is
used to facilitate the enzymatic reaction. However, the physiological pH is 7.3. As the
enzyme is active at body temperature, the reaction mixture should be incubated at 37 oC.
There are a number of methods used to detect the level of enzyme inhibition. Among
them are spectrophotometry, fluorometry, high-performance liquid chromatography
(HPLC), radiochemistry and electrophoresis (Alves et al., 2005 and Lahogue et al.,
2010). As there is less substrate specificity for ACE, several substrates have been
employed for in vitro enzyme inhibitory studies. Two commonly used substrates for
spectrophotometric and HPLC analysis of ACE inhibitory activity are HHL and FAPGG
(Udenigwe et al., 2009 and Wu et al., 2008).The HHL could be used in fluorescence
detection methods of ACE inhibition along with fluorescing agents such as o-

24
pthaldialdehyde (Alves et al., 2005). The conversion of internally quenched fluorogenic
substrates was reported to be very sensitive in the detection of ACE inhibition. o-
Aminobenzoylglycyl-p-nitro-phenylalanylproline (Santendreu et al., 2006) and abz-
peptidyl-Eddnp (Abz: ortho amino benzoic acid. Eddnp: 2,4-dinytrophenyl ethylene
diamine) are two examples of fluorogenic substrates (Alves et al., 2005).
Other than in vitro studies, cell cultures also have been used widely in ACE
inhibition studies. Cell culture system is a cluster of both in vitro and in vivo model
characteristics. The cell is the basic unit of a living organism and the key place where
biological reactions occur. Use of cell culture models provides the advantage of studying
a biological reaction at its origin. However, as these cells are grown under in vitro
conditions, it fails to mimic the exact biological condition.
Different kinds of endothelial cell lines are widely used in ACE inhibitory studies.
Umbilical vein endothelial cells from humans are the most widely used cell line in most
studies (Ottaviani et al., 2006, Persson et al., 2009 and Saijonma et al., 2001). Endothelial
cells play a distinct role in responding to physiological stimuli. They maintain vascular
tone by releasing vasoconstrictors like Ang II and endothelin, balancing it by releasing
vasodilators such as NO (Vijayaraghavan and Deedwania, 2011). The gene regulation of
ACE production by the endothelial cells has not yet been fully identified. It has been
found that steroids (dexamethasone and aldosterone), platelet activating factor and
endothelin-1, induce ACE gene expression in endothelial cells (Saijonma et al., 2001).
The use of umbilical vein endothelial cells has given promising results in ACE
inhibitory studies. The HUVEC were found to provide homogenous cell growth and
similar physiological characteristics of the endothelium (Johnson and Erdos, 1977). The

25
abundance of supply as well as the sterility of the veins favor the use of HUVEC. The
cell identification could be confirmed by using the positive immune staining of von
Willebrand factor and the cobblestone appearance (Ceconi et al., 2007).

26
CHAPTER 3.0 OBJECTIVES
Hypertension is a progressive disorder leading to many chronic diseases. Over-
activation of renin angiotensin aldosterone system (RAAS) plays a significant role in the
pathogenesis of hypertension where angiotensin converting enzyme (ACE) plays a key
role in producing angiotensin II, which is a potent vasconstrictor. The ACE inhibitors are
identified among the most potent antihypertensive drugs. Apart from the treatments on
hypertension, this class of drugs is beneficial for several types of cardiovascular diseases
(CVD) as well. In addressing this issue, scientists were keen to research new therapeutics
with fewer side effects. Plant-based bioactives have gained recognition for their
beneficial health effects over a wide range of chronic diseases. Flavonoids are a major
group of plant secondary metabolites which have long been recognized for their
beneficial health effects. Flavanoids, as well as flavonoid-rich plant extracts, have
recently been studied for their ability to inhibit ACE.
The hypothesis of the current study is flavonoids, their metabolites and fruit
extracts rich in flavonoids can inhibit ACE in vitro. The overall objective is to investigate
the ability of flavonoids (representing all subgroups), a set of selected metabolites of
flavonoids and an apple peel extract rich in flavonoids (FAE), to act as potential ACE
inhibitors, using in vitro assays as well as a cell culture model system. The goal of
incorporating flavonoid metabolites into the study is to understand the relevance of ACE
inhibition by flavonoids in vitro, in relation to the in vivo systems. The specific objectives
include investigation of concentration responsive ACE inhibition, determination of the
type of enzyme inhibition and the IC50 values of those which show concentration
responsive enzyme inhibition. Further, by considering the enzyme activity and the

27
specific structure of flavonoids, attempts were taken to predict their structure function
relationship. A fluorescence-based enzyme inhibition assay was used in determining the
enzyme activity over five selected concentrations of test substances. The prescribed drug
Captopril, was used for the comparison. The second objective was to select the most
promising test material based on the in vitro results and detect their ability to inhibit ACE
using HUVEC line. The cells were incubated with the test compounds in three selected
concentrations and the enzyme activity was determined by analysis of hippuric acid
formation using liquid chromatography and mass spectrometry (LC-MS).

28
CHAPTER 4.0 INHIBITION OF ANGIOTENSIN CONVERTING ENZYME BY FLAVONOID-RICH APPLE PEEL EXTRACT, FLAVONOIDS AND SELECTED METABOLITES
4.1 Abstract Angiotensin converting enzyme (ACE) is a key component in the renin
angiotensin aldosterone system (RAAS) which regulates blood pressure. As the over activation of RAAS is associated with vascular hypertension, ACE inhibition has become a major target for control of hypertension. The research on potential ACE inhibitors is expanding broadly and most is focused on natural bioactives like plant polyphenolics. The current study is investigating the ACE inhibitory property of a flavonoid-rich apple peel extract (FAE) and its constituents, selected flavonoids and some flavonoid metabolites. Enzyme inhibition was determined using a fluorescence based assay in the presence of histidine-L-hippuryl-L-leucine-chloride (HHL) substrate. At the presence of ACE, HHL is cleaved into several products including the dipeptide, histidine-leucine. Histidine-leucine forms a fluorescing adduct at the presence of o-pthaldialdehyde which was quantified fluorimetrically. Among the polyphenolics tested, except for coumarin and genistein, all the flavonoids that were tested showed a significant (p < 0.05), concentration responsive enzyme inhibition. Studying on flavonoid structure-ACE inhibition relationships revealed that the presence of hydroxyl groups and ring B in the flavonoid structure is important for the functionality. The lowest IC50 values were associated with quercetin-3-O-glucoside (71 μM), epicatechin (73 μM) and naringenin (78 μM) respectively. The FAE also exhibited a concentration responsive enzyme inhibition giving an IC50 value of 49 μg/ml. Among the three metabolites tested, only quercetin-3-O-glucuronic acid and quercetin-3-O-sulfate showed concentration responsive enzyme inhibition. Interestingly, the metabolite quercetin-3-O-glucuronic acid (27 μM) was the most effective ACE inhibitor among all the flavonoids and the metabolites. Enzyme kinetic analysis proved that flavonoids show a competitive inhibition over ACE. The results demonstrated that flavonoids have the potential to inhibit ACE in vivo and the inhibitory property depends on the specific structure of each flavonoid.
Keywords: ACE, RAAS, flavonoids, quercetin-3-O-glucoside, hypertension, quercetin-3-O-glucuronic acid,
29
4.2 Introduction
Hypertension is a common progressive disorder leading to several chronic
diseases such as cardiovascular disease (CVD), stroke, renal disease and diabetes. Over
activation of renin angiotensin aldosterone (RAAS) is found to be a major causative
factor in the development of hypertension (Hammoud et al., 2007). The angiotensin
converting enzyme (ACE) plays a significant role in RAAS, by converting the precursor
angiotensin I (Ang I) into angiotensin II (Ang II) which is the peptide responsible for the
mechanisms which increase the blood pressure. Inhibition of ACE is a promising way of
controlling the over activation of RAAS. There are prominent ACE inhibitory drugs
currently in use for treatment of hypertension, including Captopril, Rampiril and Enalpiril
(Quan, 2006). However, research continues to investigate the possibility of inhibiting
ACE by natural bioactive molecules. Plant secondary metabolites such as anthocyanins
(Ojeda et al., 2010), flavanols (Actis-Goretta et al., 2006) and terpenes (Somova et al.,
2003) were found to be exhibiting ACE inhibitory activity. Although there had been
research on natural bioactive molecules to determine the ACE inhibitory property of
these compounds, less attention has been paid to the type of inhibition, structure-activity
relationship and the mode of action of these compounds.
Flavonoids are a diverse group of compounds commonly found in fruits. The
highly diverse structures of flavonoids affect numerous functions in biological systems. A
recent review reveals that most subclasses of flavonoids, as well as plant extracts rich in
flavonoids, are found to be effective ACE inhibitors both in vitro and in vivo (Balasuriya
and Rupasinghe, 2011).

30
Apples are one of the most popular and frequently consumed fruits in the world.
Apples are a rich source of flavonoids with proven health benefits. In North America,
22% of dietary phenolics (mainly flavonoids and phenolic acids) come from consumption
of apples (He and Liu, 2008). The polyphenolic content of apple peel was found to be six
times higher than the flesh (Boyer and Liu, 2004). Apple peel extracts had higher
antioxidant activities compared to apple flesh extracts (He and Liu, 2008). Since the peel
is higher in bioactivity compared to pomace, it is interesting to determine the potential of
apple peel extract to act as an ACE inhibitor.
Dietary flavonoids are subjected to metabolic conversions when ingested. Their
bioactivity determined in vitro was found to be different when compared to the
bioactivity of metabolically converted forms (Santos et al., 2008). Investigating
biological activity of metabolites using in vitro systems could generate more reasonable
and relevant information rather than studying the bioactive compounds in vitro.
Flavonoids such as quercetin are subjected to glucuronidation, sulfation and methylation
when absorbed by vertebrates (Rupasinghe et al., 2010).
In the current study, a flavonoid-rich apple peel extract (FAE), its constituents,
selected flavonoids and metabolites were investigated for their ACE inhibitory property
in vitro. The enzyme kinetic parameters were determined using the selected best
inhibitors.
4.3 Materials and Methods
4.3.1 Chemicals and Reagents
The ACE extracted from rabbit lung, histidine-L-hippuryl-L-leucine-chloride
(HHL), histidine-leucine (His-Leu), NaOH, HCl, ethanol anhydrous, quercetin, quercetin-

31
3-O-glucoside, quercetin-3-O-galactoside, naringenin, Captopril, chrysin and o-
phaldialdehyde were purchased from Sigma Aldrich Canada Ltd. (Oakville, ON,
Canada). Cyanidin-3-O-galactoside and epicatechin were purchased from Indofine
Chemical Company Inc. (Hillsborough, NJ, USA). Cyanidin-3-O-glucoside, cyanidin-3-
O-rhamnoside, quercetin-3-O-rutinoside, quercetin-3-O-rhamnoside and quercetin-4΄-O-
glucoside were obtained from ChromaDex Corporate (Irvine, CA, USA). Catechin and
coumarin were from Fluka Chemicals (Buchs, Switzerland) and were purchased through
Sigma Aldrich, Canada. Borate saline buffer (100 mM boric acid, 1.5 M sodium chloride,
sterile, pH adjusted to 8.3) was ordered from Teknova (Hollister, CA, USA). The in vivo
quercetin metabolites were kindly provided by Dr. Paul Kroon, Project Leader of
Polyphenols and Health, Institute of Food Research, Norwich Research Park, Norwich,
UK.
4.3.2 Sample Preparation for Assays
4.3.2.1 Flavonoid-rich Apple Peel Extract (FAE)
The FAE was extracted from ‘Jonagold’ apple peels according to the method
described by Rupasinghe et al., (2010). The apple peel extract was in the form of freeze
dried powder and the solutions were made by dissolving them in anhydrous ethanol. A
stock solution of 1000 mg DW/l (equals 56 mg of phenolics/l) from the extract was
prepared first and diluted accordingly. The major constituents of the extract was
investigated separately which are discussed in the following sections.
32
4.3.2.2 Flavonoids
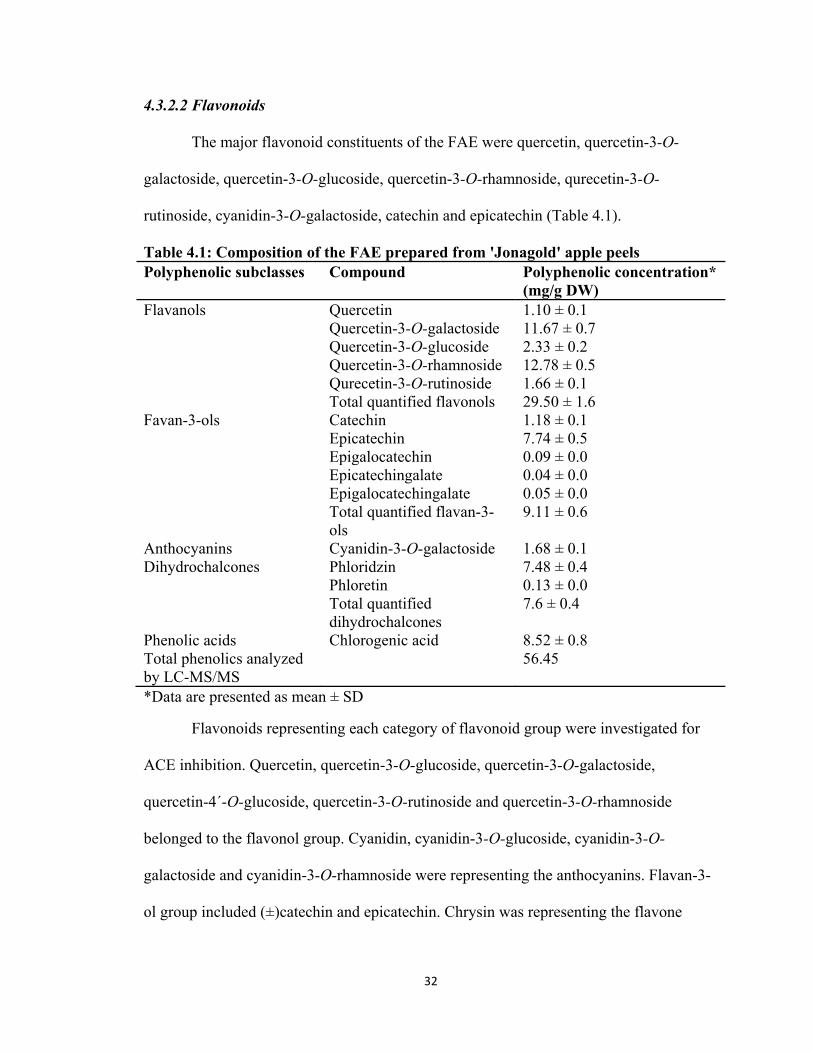
The major flavonoid constituents of the FAE were quercetin, quercetin-3-O-
galactoside, quercetin-3-O-glucoside, quercetin-3-O-rhamnoside, qurecetin-3-O-
rutinoside, cyanidin-3-O-galactoside, catechin and epicatechin (Table 4.1).
Table 4.1: Composition of the FAE prepared from 'Jonagold' apple peels Polyphenolic subclasses Compound Polyphenolic concentration*
(mg/g DW) Flavanols Quercetin 1.10 ± 0.1 Quercetin-3-O-galactoside 11.67 ± 0.7 Quercetin-3-O-glucoside 2.33 ± 0.2 Quercetin-3-O-rhamnoside 12.78 ± 0.5 Qurecetin-3-O-rutinoside 1.66 ± 0.1 Total quantified flavonols 29.50 ± 1.6 Favan-3-ols Catechin 1.18 ± 0.1 Epicatechin 7.74 ± 0.5 Epigalocatechin 0.09 ± 0.0 Epicatechingalate 0.04 ± 0.0 Epigalocatechingalate 0.05 ± 0.0 Total quantified flavan-3-
ols 9.11 ± 0.6
Anthocyanins Cyanidin-3-O-galactoside 1.68 ± 0.1 Dihydrochalcones Phloridzin 7.48 ± 0.4 Phloretin 0.13 ± 0.0 Total quantified
dihydrochalcones 7.6 ± 0.4
Phenolic acids Chlorogenic acid 8.52 ± 0.8 Total phenolics analyzed by LC-MS/MS
56.45
*Data are presented as mean ± SD
Flavonoids representing each category of flavonoid group were investigated for
ACE inhibition. Quercetin, quercetin-3-O-glucoside, quercetin-3-O-galactoside,
quercetin-4΄-O-glucoside, quercetin-3-O-rutinoside and quercetin-3-O-rhamnoside
belonged to the flavonol group. Cyanidin, cyanidin-3-O-glucoside, cyanidin-3-O-
galactoside and cyanidin-3-O-rhamnoside were representing the anthocyanins. Flavan-3-
ol group included (±)catechin and epicatechin. Chrysin was representing the flavone
33
group and naringenin was from the flavanones. Genistein was representing isoflavones.
Coumarin which represents A and C rings of flavonoid compounds was also included for
comparison purposes.
All compounds were dissolved in anhydrous ethanol. Dilution series of each
compound were prepared. The appropriate volumes of compound solutions were
transferred into the Eppendorf tubes, N2 flushed and reconstituted in ethanol and assay
buffer.
4.3.2.3 Quercetin Metabolites
The stock solutions (1000 mg/L) of quercetin metabolites were (quercetin-3΄-
sulphate, quercetin-3-O-glucuronic acid and isorhamnetin-3-O-glucuronic acid) prepared
in anhydrous methanol. The metabolites were reconstituted in ethanol and assay buffer
when used in the ACE assay.
4.3.3 Preparation of Enzyme and Substrate
One unit of enzyme was dissolved in 12 ml of sodium tetraborate buffer (assay
buffer). The enzyme solution was divided into 1 ml portions and stored at -80 oC. Thirty
microliters of enzyme was used in each experimental unit. The substrate solution (7.8
mM) was prepared by dissolving HHL in the assay buffer and stored at -20 oC.
4.3.4. ACE Inhibition
4.3.4.1 Enzyme Inhibition Assay
The ACE inhibitory activity of flavonoids, metabolites and FAE were performed
according to the methods of Cinq-Mars et al. (2007) and Santos et al. (1985), with some
modifications. The substrate (150 µl) was added to reconstituted samples and mixed by
tapping the Eppendorf tubes. Next, 2.5 mU of ACE were added to each experimental

34
unit. The enzyme was mixed by pipetting in and out several times. A blank and a positive
control were used for each experiment. There were no ACE inhibitors present in both
controls. In blanks, all reagents were added except the enzyme and the inhibitors. Thirty
microliters of assay buffer was used to replace the enzyme. In the positive control, all the
reagents were added except the ACE inhibitors. During each experimental run, 10 mg/l
solution of Captopril was also used for comparison. All the experimental units (controls
and samples) were incubated at 37 oC using a shaker oven (Model: HP 50, Appolo
Instrumentation for Molecular Biology, CA, USA) for 1 h. One hundred and fifty
microliters of 0.35 M NaOH was added to each Eppendorf tube to stop the enzyme
reaction after 1 h.
4.3.4.2 Measurement of Fluorescence
One hundred microliters of o-phaldialdehyde was added to each Eppendorf tube
to make the fluorescent adduct. All the experimental units were kept for 10 min at room
temperature to facilitate the reaction. Fifty microliters of 3 M HCl was added to stop the
reaction. Samples (100 µl) were loaded into a 96-well polystyrene plate. Fluorescence
was measured using the FLUOstar OPTIMA plate reader (BMG Labtech Inc., Offenburg,
Germany). Excitation and emission wavelengths used were 360 nm and 500 nm,
respectively.
4.3.4.3 Calculation of % Enzyme Inhibition
The mean fluorescence values of all controls and samples were obtained. The %
inhibition of enzyme was expressed in comparison with the positive control. The
equation is as follows.

35
Percent enzyme inhibition (%) = {1-(Fsample–Fblank)/(Fpositive control – Fblank)}*100
(F: fluorescence)
4.3.4.4 Calculation of IC50 Values
Using Microsoft Excel (2007) linear regression analysis, the dose response data
were used to calculate the IC50 values.
4.3.5 Enzyme Kinetic Study
The four test compounds which gave the highest enzyme inhibition (quercetin-3-
O-glucoside, epicatechin, quercetin-3-O-glucuronic acid, and FAE) were selected for the
enzyme kinetic study.
4.3.5.1 Obtaining Standard Curve for His–Leu
Concentration gradient (0.125, 0.25, 0.5, 1, 2 mM) of His-Leu was prepared. One
hundred microliters of o-phaldialdehyde was added to each and incubated for 10 min at
room temperature. Reaction was stopped by adding of 1 M HCl and the fluorescence was
measured. The obtained fluorescence values were plotted against the His-Leu
concentration to obtain the standard curve (Figure 4.1).

36
Figure 4.1: Standard curve for His-Leu
4.3.5.2 Enzyme Kinetic Analysis for ACE without Inhibitors
A serial dilution (0.125, 0.25, 0.5, 1, 2, 4, 8 mM) of HHL was prepared. The ACE
(2.5 mU) was added to react with 150 µl of each substrate for 1 h at 37 oC. The reaction
was stopped by the addition of 150 µl of NaOH and the formation of fluorescence adduct
was carried out as mentioned above. Using obtained fluorescence values, His-Leu
concentrations were calculated.
4.3.5.3 Enzyme Kinetic Analysis of Inhibitors
Quercetin-3-O-glucoside (21.5 and 215 µM), epicatechin (34.4 and 344 µM),
quecetin-3-O-glucuronic acid (210 µM) and FAE (10 and 100 mg/l) were selected for the
analysis. Each test material was incubated with different concentrations of HHL as
described above. Fluorescence values were used to obtain the His-Leu concentrations.
Kinetic parameters were determined according to Michaelis Menten kinetic model.
37
�
Where, V: reaction rate, Vmax: maximum reaction rate, KM: Michaelis constant, S:
substrate concentration
The reaction rate (formation of His-Leu) was plotted against the different substrate
concentrations to obtain the saturation curves. Lineweaver Burk plots were derived using
the saturation curves to determine the type of inhibition.
Where, V: reaction rate, Vmax: maximum reaction rate, KM: Michaelis constant, S:
substrate concentration,
Kinetic parameters [KM, Vmax, Ki (dissociating / inhibition constant)] were calculated
using Sigma Plot 12 (Systat software, Inc., Chicago, IL, USA) software. Dissociating
constant was determined using the following equation.
Where, mi: slope from linear plot from inhibited reaction, m: slope from linear plot from
non-inhibited reaction, [I]: concentration of inhibitor, Ki: dissociating constant of the
inhibitor
4.4 Statistical Analysis
All treatments were carried on triplicate. Each experiment was run independently
twice, to check the repeatability. Data were analyzed using SAS V8 (Cary, NC, USA).
One way ANOVA was performed in a general linear model at p < 0.05. The assumptions
i.e. normality and constant variance were analyzed using Anderson Darling test and
obtaining the residuals vs fitted values respectively. Independence was achieved through

38
randomization. Multiple means comparisons were carried out using Tukey’s test, and
expressed as mean ± standard deviation (SD).
4.5 Results
4.5.1 Inhibition of ACE
The FAE showed a concentration responsive enzyme inhibition (Table 4.2) with
an IC50 value of 49 μg/ml. When the constituent flavonoids of FAE were investigated
separately, all constituents exhibited concentration responsive enzyme inhibition. Most
sub-groups of flavonoids also showed a concentration responsive enzyme inhibition.
Table 4.3 gives the enzyme inhibition data for quercetin and its glycosides. Among all the
glycosides, the highest % inhibition was associated with quercetin-3-O-glucoside.
Further, several glycosylated forms of cyanidins were investigated for their concentration
responsiveness on ACE inhibition (Table 4.4). All four cyanidins which belong to
anthocyanins i.e. cyanidin, cyanidin-3-O-glucoside, cyanidin-3-O-galactoside and
cyanidin-3-O-rhamnoside showed concentration responsive enzyme inhibition. The two
flavan-3-ols, catechin and epicatechin (Table 4.5) showed higher % of enzyme inhibition
when compared with both groups of flavonols and anthocyanins (Table 4.3 and 4.4).
Chrysin (flavone) and naringenin (flavanone) also showed a concentration responsive
enzyme inhibition (Table 4.5). However, the % inhibition of chrysin is not as high as that
of flavan-3-ols, flavonols and anthocyanins. Coumarin, which is a core skeleton of
flavonoids, and genistein (isoflavone) did not show concentration responsive enzyme
inhibition (Table 4.5). However, the 100 mg/l sample of coumarin and genistein showed
47% and 60% of inhibition, respectively, where inhibition percentages are similar in
value to some other flavonoids. Table 4.7 shows the different structures of flavonoid

39
compounds. The structural differences which exist within compounds lead to the changes
associated with the bioactivity.
Interestingly, among all the flavonoids, FAE constituents and metabolites tested,
quercetin-3-O-glucuronic acid was found to be the most effective ACE inhibitor (Table
4.6). Among the three metabolites tested, only quercetin-3-O-glucuronic acid and
quercetin-3΄-sulphate showed concentration responsive enzyme inhibition.
Captopril showed a concentration dependent inhibition of ACE (Table 4.2).
Interestingly, the concentration range which showed concentration dependent inhibition
was the same for both flavonoids and Captopril. However, the drug showed almost 90%
enzyme inhibition starting from 1 mg/l concentration and reaching a plateau with the
increasing concentrations. In each independent trial, 10 mg/l concentration of drug
showed > 90% enzyme inhibition.
Table 4.2: Concentration responsive ACE inhibition by FAEa in vitro Concentration (mg/l) % Inhibition of ACE FAE Captopril 0.001 29.9 ± 4.1de 47.6 ± 11.6 b
0.01 26.6 ± 6.6 e 68.3 ± 9.6 a 0.1 37.3 ± 3.9 cd 72.9 ± 4.3 a 1 42.7 ± 1.1bc 93.6 ± 8.7 a 10 45.6 ± 1.7 b 91.8 ± 23.7 a
100 64.5 ± 0.5 a 87.6 ± 21.8 a
IC50 values 49 µg/ml 0.02 µM a Data are presented as mean ± SD. Mean with different subscripts in each column are significantly different (p < 0.05)

40
Table 4.3: Concentration responsive ACE inhibition by flavonolsa in vitro Concentration
(mg/l) % Inhibition of ACE
Quercetin Quercetin-3-O-glucoside
Quercetin-3-O-galactoside
Quercetin-3-O-rhamnoside
Quercetin-3-O-rutinoside
Quercetin-4΄- glucoside
0.001 19.1 ± 3.6 cd 42.3 ± 0.8 bc 21.2 ± 8.6 bc 8.7 ± 2.5 c 5.9 ± 4.2 c 9.8 ± 2.3 bc 0.01 12.3 ± 3.8 d 43.4 ± 2.2 bc 14.3 ± 1.4 c 9.3 ± 6.0 c 0.1 ± 2.3 c 5.7 ± 3.9 c 0.1 26.8 ± 5.1 c 39.0 ± 1.1 c 20.6 ± 2.0 bc 10.7 ± 1.8 c 6.7 ± 6.3 c 9.1 ± 6.5 bc 1 17.7 ± 1.3 cd 39.8 ± 4.1 c 13.2 ± 1.4 c 12.8 ± 3.6 c 4.4 ± 4.2 c 16.7 ± 2.3 bc 10 30.2 ± 2.5 b 47.1 ± 1.6 b 24.5 ± 3.7 b 19.6 ± 2.1 b 18.4 ± 3.3 b 8.9 ± 4.7 bc 100 80.1 ± 1.8 a 66.5 ± 3.1 a 56.0 ± 1.5 a 49.6 ± 3.2 a 52.6 ± 1.0 a 37.2 ± 13.1a IC50 values 151 µM 71 µM 180 µM 100 µM 90 µM 211 µM a Data are presented as mean ± SD. Mean with different subscripts in each column are significantly different (p < 0.05)
40

41
Table 4.4: Concentration responsive ACE inhibition by anthocyaninsa in vitro Concentration (mg/l)
% Inhibition of ACE Cyanidin Cyanidin-3-O-
glucoside Cyanidin-3-O-galactoside
Cyanidin-3-O rhamnoside
0.001 21.6 ± 5.8 c 4.00 ± 5.2 cd 6.2 ± 3.8 b 14.4 ± 9.8 b
0.01 16.5 ± 6.8 bc 9.0 ± 2.1 bc 8.0 ± 3.5 b 12.8 ±7.4 b 0.1 8.3 ± 3.6 c 2.4 ± 4.0 d 8.2 ± 1.3 b 13.5 ± 1.8 b 1 18.8 ± 0.8 bc 5.6 ± 3.5 bc 8.3 ± 2.1 b 6.1 ± 7.6 b 10 27.25 ± 6.8 b 10.7 ± 1.5 b 11.1 ± 2.6 b 13.2 ± 7.4 b 100 58.1 ± 1.0 a 32.4 ± 3.8 a 44.6 ± 4.1 a 44.5 ± 7.1 a IC50 values 79 µM 174 µM 206 µM 114 µM a Data are presented as mean ± SD. Mean with different subscripts in each column are significantly different (p < 0.05)

42
Table 4.5: Concentration responsive ACE inhibition by flavan-3-ols, flavonones, flavones and isoflavonoidsa in vitro Concentration
(mg/l) % Inhibition of ACE
Flavan-3-ols Flavanone Flavone Isoflavonoid Epicatechin Catechin Naringenin Chrysin Genistein Coumarin 0.001 0 ± 15.4 c 15.7± 4.2 c 9.8 ± 3.7 c 16.8 ± 4.8 b 17.5 ± 1.1 b 13.0 ± 11.4 b 0.01 0 ± 15.1 c 31.1 ± 2.8 d 11.8 ± 1.1 c 9.3 ± 7.1 b 7.3 ± 2.1 b 9.7± 0.8 bc 0.1 9.9 ± 6.2 b 19.5 ± 3.4 bc 8.0 ± 5.3 c 10.3 ± 1.4 b 2.2 ± 16.0 b 3.5 ± 1.6 bc 1 15.1 ± 4.3 b 19.8± 4.5 bc 13.2 ± 4.8 bc 9.4 ± 5.3 b 5.9 ± 3.2 b 0 ± 3.04 c 10 18.3 ± 2.4 b 23.5± 2.3 b 24.3 ± 1.8 b 17.0 ± 3.1b 3.0 ± 6.6 b 5.7 ± 4.4 bc 100 65.2 ± 2.9 a 47.7 ± 4.3 a 60.1 ± 2.9 a 37.8 ± 2.9 a 59.5 ± 1.8 a 47.3 ± 4.8 a IC50 values 73 µM 109 µM 78 µM 146 µM N.D N.D a Data are presented as mean ± SD. Mean with different subscripts in each column are significantly different (p < 0.05)
42

43
Table 4.6: Concentration responsive ACE inhibition by quercetin metabolitesa in vitro Concentration (mg/l)
% Inhibition of ACE Quercetin-3-O-glucuronic acid
Quercetin-3-O-sulphate
Isorhamnetin-3-O-glucuronic acid
0.001 43.8 ± 4.1 c 10.2 ± 3.1 b 10.5 ± 0.9 ab 0.01 45.7 ± 2.4 c 10.7 ± 11.2 b 10.9 ± 2.8 ab 0.1 44.4 ± 2.1 c 6.5 ± 4.5 b 8.6 ± 1.4 ab 1 47.5 ± 1.6 bc 8.4 ± 2.8 b 5.9 ± 6.1 bc 10 52.6 ± 4.0 b 7.6 ± 5.1 b 3.2 ± 3.9 c 100 75.1 ± 2.6 a 40.4 ± 1.0 a 15.9 ± 2.3 a IC50 values 27 µM 131 µM N.D a Data are presented as mean ± SD. Mean with different subscripts in each column are significantly different (p < 0.05)

44
Table 4.7: Molecular structures of flavonoids Subclass Structure R1 R2 Name Flavonols
O
OO
OH
OH
OH
O
R1
R2
H H Quercetin β-D-glucose H Quercetin-3-
O-glucoside H β-D-glucose Quercetin-4'-
O-glucoside β-D-galactose H Quercetin-3-
O-galactoside β-D-rhamnose
H Quercetin-3-O-rhamnoside
β-D-rutinose H Quercetin-3-O-rutinoside
Anthocyanins
O+
OOH
OH
OH
OH
R1
H - Cyanidins β-D-glucose - Cyanidin-3-
O-glucoside β-D-galactose - Cyanidin-3-
O-galactoside β-D-rhamnose
- Cyanidin-3-O-rhamnoside
Flavan-3-ols
O
OHOH
OH
OH - - Catechin
O
OHOH
OH
OH - - Epicatechin
Flavanone
O
OH
OH
O
OH - - Naringenin
Flavone
O
OH
OH
O
- - Chrysin
Isoflavone O
OOH
OH - - Genistein

45
4.5.2 IC50 Values
The IC50 values calculated are shown in Table 4.8. Quercetin-3-O-glucuronic acid
gave the lowest IC50 value.
Table 4.8: IC50 values of flavonoids for ACE determined using dose response curves Compound IC50 value (μM)
Quercetin 151 Quercetin-3-O-glucoside 71 Quercetin-3-O-galactoside 180 Quercetin-3-O-rutinoside 90 Quercetin-3-O-rhamnoside 100 Quercetin-4΄-O- glucoside Cyanidin
211 79
Cyanidin-3-O-glucoside 174 Cyanidin-3-O-galactoside 206 Cyanidin-3-O-rhamnoside 114 Catechin 109 Epicatechin 73 Naringenin 78 Chrysin Genistein
146 N.D
Quercetin-3-O-glucuronic acid 27 Quercetin-3-O-sulphate Isorhamnetin-3-O-glucuronic acidCoumarin
131 N.D N.D
N.D: Not determined due to the lack of concentration dependent response
4.5.3 Enzyme Kinetics
The FAE, quercetin-3-O-glucoside, epicatechin and queretin-3-O-glucuronic acid
were selected for enzyme kinetic analysis. The ACE showed a Michalelis-Menten
mechanism when enzyme activity was determined using HHL as the substrate (Figure
4.2). Figure 4.3 and 4.4 show the rate of formation of His-Leu, which resulted from the
activity of the enzyme over different concentrations of substrate (HHL) in the presence of
inhibitors. Since the saturation curves obtained are nonlinear, Lineweaver-Burk plots
were created to determine the kinetic parameters (Figure 4.3. C & D and Figure 4.4. C &
D). Kinetic parameters i.e. maximum rate of substrate hydrolysis (VMax) and Michaelis

46
constant (KM) were calculated (Table 4.9). According to the kinetic parameters and
Lineweaver-Burk Plots, quercetin-3-O-glucoside, metabolite and FAE showed a
competitive inhibition over ACE.
[Substrate] (µM)0 2 4 6 8 10
Rea
ctio
n ra
te (µ
mol
/min
)
0.000
0.005
0.010
0.015
0.020
0.025
0.030
0.035
1/[Substrate] (µM)-1 0 1 2 3 4 5
1/R
eact
ion
rate
(µm
ol/m
in)
20
40
60
80
100
120
140
160
Figure 4.2: Kinetic behaviour of ACE: Michaleis-Menten (A) and Lineweaver-Burk plot (B)
A B

47
[Substrate] (µM)
0 2 4 6 8 10
Rea
ctio
n ra
te (µ
mol
/min
)
0.000
0.005
0.010
0.015
0.020
0.025
0.030
0.035
ControlI = 209.6 micromoles
1/[Substrate] (µM)
-1 0 1 2 3 4 5
1/R
eact
ion
rate
(µm
ol/m
in)
50
100
150
200
250
300
350
ControlI = 209.6 micromoles
[Substrate] (µM)
0 2 4 6 8 10
Rea
ctio
n ra
te (µ
mol
/min
)
0.000
0.005
0.010
0.015
0.020
0.025
0.030
0.035
ControlI = 10 mg/LI = 100 mg/L
1/[Substrate] (µM)
-1 0 1 2 3 4 5
1/R
eact
ion
rate
(µm
ol/m
in)
50
100
150
200
250
300
ControlI = 10 mg/LI = 100 mg/L
Figure 4.3: Reaction rates for the inhibition of ACE activity by quercetin-3-O-glucuronic acid and FAE vs substrate concentration (A and B, respectively) and Lineweaver-Burk plots for quercetin-3-O-glucuronic acid and FAE (C and D, respectively)
C A
B D

48
[Substrate] (µM)
0 2 4 6 8 10
Rea
ctio
n ra
te (µ
mol
/min
)
0.000
0.005
0.010
0.015
0.020
0.025
0.030
0.035
ControlI = 21.5 micromolesI = 215.3 micromoles
1/[Substrate] (µM)
-1 0 1 2 3 4 5
1/R
eact
ion
rate
(µm
ol/m
in)
50
100
150
200
250
300
350
ControlI = 21.5 micromolesI = 215.3 micromoles
[Substrate] (µM)
0 2 4 6 8 10
Rea
ctio
n ra
te (µ
mol
/min
)
0.000
0.005
0.010
0.015
0.020
0.025
0.030
0.035
ControlI = 34.42 micromolesI = 344.28 micromoles
1/[Substrate] (µM)
-1 0 1 2 3 4 5
1/R
eact
ion
rate
(µm
ol/m
in)
50
100
150
200
250
300
350
400
ControlI = 34.42 micromolesI = 344.28 micromoles
Figure 4.4: Reaction rates for the inhibition of ACE activity by quercetin-3-O-glucoside and epicatechin vs substrate concentration (A and B, respectively) and Lineweaver-Burk plots for quercetin-3-O-glucoside and epicatechin (C and D, respectively)
C A
B D

49
Table 4.9: Kinetic parameters of the ACE inhibitory activity of FAE, flavonoids and metabolites Compound Concentration KM
(µM)VMAX
(µM/min) Ki (µM)
No inhibitor - 1.8 0.03 - FAE 100 mg/l 2.6 0.04 - 10 mg/l 2.6 0.04 - Quercetin-3-O-glucoside 215.3 µM 3.5 0.03 115.4 21.53 µM 2.1 0.03 19.8 Epicatechin 344.2 µM 4.4 0.04 157.0 34.42 µM 1.9 0.04 34.8 Quercetin-3-O-glucuronic acid 209.6 µM 2.8 0.04 146.6
50
4.6 Discussion
Hypertension is recognized as a major risk factor for the development of many
chronic diseases. Since RAAS plays a significant role in the pathogenesis of
hypertension, ACE inhibitors have long been known for their beneficial effects in
reducing high blood pressure. Flavonoids were identified as bioactive compounds with
cardio-protective effects. In this current study, FAE, different flavonoids and metabolites
acted as ACE inhibitors in vitro.
Plant extracts had been widely studied for ACE inhibition. Green tea, blueberry,
Hibiscus sabdariffa and Senecio inaequidens extracts were reported to inhibit ACE with
IC50 values of 125 µg/ml, 46 µg/ml, 91 µg/ml and 192 µg/ml, respectively (Loizzo et al.,
2007, Ojeda et al., 2010 and Sakaida et al., 2007). The FAE showed a concentration
responsive enzyme inhibition, giving an IC50 value of 49 µg/ml. In comparison with most
plant extracts reported on ACE inhibition, FAE is an effective ACE inhibitor in vitro. It
appears that no study has focused on an apple-based extract. Therefore, this is the first
report to demonstrate that apple peel extract has a high potential to inhibit ACE in vitro.
From the total polyphenolic composition of FAE, more than 50% are flavonoids.
Since the constituent compounds also showed concentration responsive enzyme
inhibition, it can be postulated that flavonoids are responsible for the bioactivity of FAE.
Further, in plant extracts, the synergistic effect of all constituents present i.e. flavonoids,
phenolic acids, triterpenes etc. may enhance their bioactivity. In a study conducted to
assess the effect of bilberry extracts on the ACE inhibitory property, the extract was
found to be a stronger inhibitor compared to the individual compounds alone (Persson et
al., 2009).
51
Since flavonoids being the main target inhibitor for ACE inhibition, flavonoids
representing each subclass were incorporated in the study. Quercetin glycosides
represented the flavonol group. Quercetin is one of the most studied flavonols and well
known for their antioxidant, anti-inflammatory and cardio-protective effects (Erlund,
2004). Quercetin-3-O-glucoside was the most effective ACE inhibitor among all the
flavonoids with an IC50 value of 71 µM. The loss of C-3 hydroxyl group from the
aglycone does not appear to have a significant impact on the extent of enzyme inhibition.
The aglycone quercetin, as well as other glycosides tested, showed higher IC50 values
compared with quercetin-3-O-glucoside. In previous studies, it was reported that the C-3
hydroxyl group does not play a significant role in ACE inhibition (Tsutsumi et al., 1997).
The low ACE inhibitory activity of quercetin-4'-O-glucoside could be due to the loss of 4'
hydroxyl group. Quercetin-4'-O-glucoside is the prominent quercetin glycoside found in
onions and whereas quercetin-3-O-glucoside is prominent in apples and some other fruits.
The common characteristics for all the flavonoid glycosides examined were the presence
of heterocyclic oxygen and C-7, C-5 and C-3΄ hydroxyl groups. The presence of hydroxyl
groups at the C-7 and C-8 positions was found to be effective in ACE inhibition rather
than the hydroxyls attached to other positions of the flavonoid structure (Tsutsumi et al.,
1997). The type of sugar moiety attached to the aglycone did not show a significant
impact on the enzyme inhibition. Since flavonoids are present in glycosylated form in
plants, the dietary flavonoids are usually glycosides (Kroon et al., 2004).
Flavan-3-ols are the prominent flavonoids found in all kinds of tea. Consumption
of tea has long been recognized for its protective effects on cardiovascular diseases (Rio
et al. 2010). Monomeric and polymeric forms of flavan-3-ols were found to be effective
52
ACE inhibitors in vitro (Actis-Goretta et al., 2006). Confirming the previous results
obtained for flavan-3-ols, both catechin and epicatechin showed effective inhibition over
ACE. Next to quercetion-3-O-glucoside, epicatechin showed the lowest IC50 value. The
tetramers and hexamers of catechins were reported to give IC50 values of 4 µM and 6
µM, respectively, which were among the lowest IC50 values reported for flavonoids in
vitro (Ottaviani et al., 2006).
In literature, it has been well reported that anthocyanins and plant extracts rich in
anthocyanins showed ACE inhibition in both in vitro and cell culture model systems
(Ojeda et al., 2010). Among the aglycone and three cyanidin glycosides tested, the lowest
IC50 value was found with the aglycone cyanidin. The IC50 values lie in the same range as
flavonols and flavan-3-ols. As in the above mentioned sub groups of flavonoids, in
anthocyanidins the positions of hydroxyl groups at C-3, C-5, C-7, C-4΄, the ability to
make H bonds with the active site, as well as the planer structure of the cyanidin
molecules were found to play an important role in ACE inhibition (Kwon et al., 2010 and
Ojeda et al., 2010). However, unlike the other two groups, the heterocyclic oxygen
molecule is polarized and forms a flavylium cation in anthocyanins (Persson et al, 2009).
There is less evidence to understand the role of flavillium cation in ACE inhibition.
Naringenin, chrysin and genistein were representing flavanones, flavones and
isoflavones respectively. In all groups, the C-3 hydroxyl group is missing. Both
naringenin and chrysin showed concentration dependent enzyme inhibition, giving IC50
values of 78 μM and 146 μM, respectively. The obtained IC50 values are similar to those
reported so far (Loizzo et al., 2007). Genistein showed ACE inhibitory activity in in vivo

53
models (Montenegro et al., 2009). However, in the current study, genistein did not show
a concentration responsive inhibition.
Coumarin, where there are no hydroxyl groups and a B ring, did not show any
concentration dependent enzyme inhibition. Along with other results, this suggests that in
flavonoids, the presence of the B ring and hydroxyl groups is an essential factor in ACE
inhibition.
The in vitro bioactivity of phytochemicals had been challenged since the in vivo
metabolism significantly alters the structures of the molecules. However, since in vivo
experiments such as animal trials and human trials are expensive and time consuming, in
vitro studies play a vital role in the initial selection of bioactive molecules (Kroon et al.
2004). Bioactive molecules are first subjected to metabolic conversions when absorbed
into the enterocytes of the intestinal wall. Glycosylated bioactives are deglycosylated by
enzymes like lactase phlorizin hydrolase and β-glucosidases before and after being
absorbed into the enterocytes. The absorbed molecules would go through a series of
metabolic conversions including methylation, glucuronidation and sulfation (Rupasinghe
et al., 2010).
By considering the physiological relevance of metabolites, several quercetin
metabolites have been incorporated into this in vitro study of ACE inhibition. The
quercetin metabolism inside the human body has been well-studied. Therefore, three
quercetin metabolites, quercetin-3-O-glucuronic acid, quercetin-3-O-sulphate and
isorhamnetin-3-O-glucuronic acid were incorporated for determining ACE inhibition
property. Interestingly, quercetin-3-O-glucuronic acid gave the lowest IC50 value among
all the compounds and metabolites tested. It is impressive to observe that one of the
54
metabolites acts as a potent inhibitor in the in vitro system. The structure of quercetin-3-
O-glucuronic acid is quite similar to quercetin-3-O-glucoside except for the carboxylic
acid group present in the sugar moiety. Quercetin metabolites were shown to interfere
with RAAS and inhibit ACE activity in vivo. Several studies reported that quercetin can
reduce plasma extravasation by inhibiting ACE and endopeptidases (Cyrino et al., 2002
and Willie et al., 2001). These results could be due to the activity of active metabolites of
quercetin such as quercetin-3-O-glucuronic acid. However, the other two metabolites did
not show a significant impact on ACE inhibition. Though quercetin-3-O-sulphate
exhibited a concentration responsive enzyme inhibition, the percentage inhibition values
were low. Even in previous reports, quercetin-3-O-glucuronic acid was identified as the
most effective metabolite when compared with different forms of other metabolites
(Kroon et al. 2004). Captopril was used as the reference drug throughout the study where
the drug was effective even at low concentrations.
In vitro analysis offers the best opportunity to widen the analysis in different
directions. Investigating the types of enzyme inhibitions, along with their kinetic
parameters could generate valuable information for initiating further developments of
these bioactive molecules as therapeutic targets. Therefore, quercetin-3-O-glucoside,
epicatechin and quercetin-3-O-glucuronic acid which were the most effective inhibitors,
as well as FAE were subjected to kinetic analysis. Two concentrations were selected for
each inhibitor (10 and 100 mg/l) except quercetin-3-O-glucuronic acid due to the scarcity
of test material.
The Vmax and KM for each compound, at different concentrations, were
determined to select the type of inhibition. The Vmax was not significantly altered by each

55
inhibitor which suggests that it was a competitive type of inhibition. According to the
calculated Ki values, the binding affinity of inhibitors to the enzyme did not show much
difference.
In our study, most flavonoids, as well as Captopril, demonstrated a concentration
responsive enzyme inhibition in a range of 0.001 to 100 mg/l. As for the in vivo
condition, the physiological concentrations reported for most bioactive molecules were
very low, being mostly reported in micromolar or nanomolar range. In a research study,
intake of fried onions, which had a quercetin content of 64 mg/g, resulted in 650 nmol/l
of metabolites in plasma after 3 h (Hollman et al., 1996). To have these concentrations
present in the plasma, the intake of flavonoids would be considerably high since they
were metabolized and excreted quickly. After the intake of green tea, catechin
metabolites were found to be excreted within 4 h after food intake (Rio et al., 2010).
To support the results in the in vitro system further research should include in vivo
studies. The current results have identified that flavanoids are moderate ACE inhibitors
compared to the drug Captopril. The most effective inhibitors identified were quercetin-
3-O-glucuronic acid, quercetin-3-O-glucoside and epicatechin. The FAE was found to be
an effective ACE inhibitor in vitro when compared with the other plant extracts. The
extracts, flavonoids and metabolite showed a competitive type enzyme inhibition where
the presence of hydroxyl groups and the B ring were found to be playing an important
role on the observed inhibitory activity of flavonoids.
56
CHAPTER 5.0 EFFECT OF QUERCETIN AND ITS DERIVATIVES ON ACE ACTIVITY IN HUMAN ENDOTHELIAL CELLS
5.1 Abstract The renin angiotensin aldosterone (RAAS) system is a major pathway for
regulating blood pressure in the human body. Angiotensin converting enzyme (ACE) is a key enzyme in RAAS which is responsible for producing angiotensin II which is a potent vasoconstrictor. Inhibition of ACE is a popular target for most antihypertensive drugs currently in use. The ACE is produced by endothelial cells. In the current study, human umbilical vein derived endothelial cells (HUVEC) grown in cultures have been used as a research model system in investigating ACE inhibitory activity of several flavonoids (quercetin, quercetin-3-O-glucoside), a metabolite of quercetin (quercetin-3-O-glucuronic acid) as well as a flavonoid-rich apple peel extract (FAE) in comparison to the antihypertensive drug Captopril. Captopril showed a dose dependent inhibition of ACE where 0.46 µM and higher concentrations showed more than 90% enzyme inhibition. The FAE, quercetin-3-O-glucoside and quercetin-3-O-glucuronic acid significantly (p < 0.05) inhibited ACE when compared to the control. The highest % inhibitions observed for FAE (100 mg/l), quercetin-3-O-glucoside (2.1 µM) and quercetin-3-O-glucuronic acid (2.1 µM) were 81%, 90%, 89% respectively. However, the low concentrations (0.3 µM and 0.03 µM) of quercetin were not effective in the inhibition of ACE. After the cells were treated with inhibitors, the mean viability of cells was > 85%. Overall, FAE, quercetin-3-O-glucoside and quercetin-3-O-glucuronic acid showed promising results on ACE inhibition but will require further confirmation using an in vivo study.
Key words: Renin angiotensin aldosterone system, angiotensin converting enzyme, human umbilical vein endothelial cells, quercetin, flavonoid, apple

57
5.2 Introduction
Hypertension is a leading causative factor for the development of cardiovascular
diseases (CVD). Other than being a risk factor for various chronic illnesses, hypertension
itself is found to cause extreme damage to internal tissues and organs in humans (Sierra
et al., 2011). The underlying mechanisms of pathogenesis of hypertension are closely
associated with the endothelium (Shao et al., 2011). The endothelium consists of a cell
monolayer which acts as a barrier between the circulating blood and the inner vessel wall
cells (Mailloux et al., 2001). Its function is far more than acting as a barrier. The
endothelium is also an important endocrine organ in the human body. Endothelial cells
produce angiotensin converting enzyme (ACE) which is a key enzyme in the renin
angiotensin aldosterone system (RAAS) which is a humoral system involved in the
regulation of blood pressure (Atlas, 2007). The ACE produced by endothelial cells is
found to be anchored into the plasma membrane of the cell through a hydrophobic region
near the C terminus. The enzyme is released to the circulating blood through a regulatory
process (Zisman, 1998). Cultured endothelial cells have been used as a research model
system to study the activity of ACE (Persson et al., 2009). The presence of the enzyme
bound to the membrane, as well as the releasing of enzyme into the medium, provides
easy access to the enzyme.
Angiotensin II (Ang II) is the potent vasoconstrictor of RAAS which plays a
significant role in increasing blood pressure. Since Ang II is produced by the activity of
ACE, it is inevitable that most drugs currently in use are targeting for ACE inhibition
(Vijayaraghavan and Deedwania, 2011). Apart from the drugs, dietary intervention of
certain peptides and phytochemicals has been identified as a promising way of preventing

58
hypertension and controlling pre-hypertensive status (Balasuriya and Rupasinghe, 2011
and Farzamirad and Aluko, 2008).
Apples are the most popular tree fruit consumed in North America and have been
long known for their health beneficial properties. Apple peel is a rich source of bioactive
flavonoids (Boyer and Liu, 2004 and Huber and Rupasinghe, 2009). Consumption of
apples was found to reduce the risk of CVD (Boyer and Liu, 2004).
In the present study, a flavonoid-rich apple peel extract (FAE), two constituents of
FAE, which are quercetin and quercetin-3-O-glucoside and a metabolite of quercetin
which is quercetin-3-O-glucuronic acid, were also investigated on ACE inhibition in
vitro.
5.3 Materials and Methods
5.3.1 Human Umbilical Vein Endothelial Cells (HUVEC)
HUVEC were purchased from American Type Culture Collection (ATCC-CRL-
2873TM) Manassas, VA, USA. The cells were derived from the umbilical vein
endothelium of Homo sapiens (human). The cells were categorized under bio-safety level
one.
5.3.2 Chemicals and Reagents
Cells were grown in Dulbecco’s Modified Eagle’s Medium (DMEM) which was
supplemented with 4 mM L-glutamine, 1 mM sodium pyruvate and 1500 mg/l sodium
bicarbonate. To reduce the chances of microbial contamination of cells, penicillin-
streptomycin (pen-strep) solution which contained 10,000 IU/ml of penicillin and 10.000
µg/ml of streptomycin was used with the medium. Cell culture tested dimethylsulfoxide
(DMSO) was used for cryopreservation of cells and to dissolve the inhibitors. All the
59
above mentioned chemicals were purchased from ATCC, Manassas, VA, USA. Fetal
bovine serum (FBS) was used as a growth supplement with DMEM. A 0.25% trypsin-
ethylenediaminetetra acetic acid (trypsin-EDTA) solution was used as the dissociating
agent for the detachment of adhering cells to the culture flasks. The FBS, trypsin-EDTA,
tryphan blue solution, quercetin-3-O-glucoside, hippuryl-L-histidyl-L-leucine (HHL),
NaOH, HCl and Captopril were purchased from Sigma Aldrich, Canada Ltd. (Oakville,
ON, Canada). Borate saline buffer (100 mM boric acid, 1.5 M NaCl, sterile, pH adjusted
to 8.3) was obtained from Teknova (Hollister, CA). Quercetin-3-O-glucuronic acid was
kindly provided by Dr. Paul Kroon, Project Leader of Polyphenols and Health, Institute
of Food Research, Norwich Research Park, Norwich, UK.
5.3.3 Instruments
A class II – type A2 biological safety cabinet (Model LR2-452) was purchased
from Esco Technologies Inc. Hartboro, PA, USA. The biological safety cabinet was
certified by Con Test Services (Ajax, Ontario) before the starting of experiments. The
CO2 incubator (Model 3074) was purchased from VWR International, West Chester, PA,
USA. The incubator was programmed for monitoring the CO2 levels and temperature
inside the chamber. A humidified environment was maintained by using a water tray with
mili-Q ultra pure water inside the incubator. An inverted microscope: model ECLIPSE
TS 100/ TS 100-F, was purchased from Nikon Instruments Inc. Melville, NY, USA. The
microscope was supported with a Lumenara Infinity camera (1-2 USB, 2.9 Megapixel),
including infinity capture and infinity analyzing software (Infinity Analyze, Lumenara
Corporation, Ottawa, ON, Canada). The cells were preserved in a liquid nitrogen storage

60
facility using a Biocane system purchased from VWR International, West Chester, PA,
USA.
The suppliers of other utensils and equipments were as follows:
Haemocytometer (Bright-Line): Hausser Scientific, Horsham, PA, USA;
Hand held tally counter: Sigma Aldrich, Oakville, ON, Canada;
Stripettor (StripettorTM Plus): Corning Life Sciences, Lowell, MA, USA;
Gelatin coated flasks (T75): Becton Dickinson Labware, Bedford, USA;
Bottle top filters (500 ml, 0.22 µm): Corning Life Sciences, Lowell, MA, USA;
Sterile disposable pipettes (2 ml, 10 ml, 25 ml): Corning Life Sciences, Lowell, MA,
USA;
Cryocanes: Thermo Scientific Rochester, NY, USA;
Cryotubes: Fisher Scientific, Whitby, Ontario, Canada and
Cryogenic vials: Corning Life Sciences, Lowell, MA, USA.
5.3.4 Preparation of Cell Culture Medium
One percent of pen-strep solution and 20% of FBS were added to DMEM. The
content was mixed well and sterile filtered using 22 micron bottle top filters. The medium
was stored in 250 ml sterile graduated bottles and covered with aluminium foil during
storage at 4-8 oC. The medium was thawed at 37 oC before it was used in experiments.
Serum free medium was prepared by adding pen-strep solution into the DMEM.
5.3.5 Preparation of Cryopreservation Medium
One percent of pen-strep solution, 1% cell culture tested DMSO and 20% of FBS
were added to DMEM and sterile filtered. The cryopreservation medium was stored at -
80 oC.
61
5.3.6 Coating 24-Well Plates with Gelatin
Since gelatin coated 24-well plates were not available from the manufacturer, the
plates were manually coated with 0.1% gelatin. The gelatin solution was thawed at 37 oC
and 200 µl of gelatin was poured into each well and kept in the incubator at 37 oC for 30
min. Excess gelatin was removed and the wells were incubated with the medium.
5.3.7 Initial Cell Preparation
Upon receipt of the cell vial, it was thawed in a water bath heated up to 37 oC by
holding the vial in an upright position and keeping the O-ring out of the water level. The
vial was gently shaken during the thawing process for 2 min. The vial was sprayed with
70% of ethanol before placing it into the biological safety cabinet. Seven milliliters of
medium was added into a 50 ml centrifuge tube. The cell content was carefully
transferred to the centrifuge tube and centrifuged at 125 × g for 10 min. The supernatant
was carefully removed without disturbing the cell pellet at the bottom. Ten milliliters of
medium was added into a gelatin coated 75 cm2 flask and thawed at 37 oC for 30 min.
The thawed medium was added into the cell content and mixed by pipetting in and out.
The contents were transferred into the gelatin coated flask and incubated at 37 oC, at 5%
CO2 level. The flask was kept inside the incubator for 24 h without being disturbed. The
medium was changed after 4 days from the initial seeding. The cells were observed under
10X magnification with phase contrast optics using the Eclipse TS 100 - Nikon inverted
microscope.
5.3.8 First Passage
The first passaging was done after nine days from initial passaging where the cells
were grown to a 70% confluence. The cell culture medium was removed and cells were

62
washed with DMEM without FBS. Since the presence of serum can reduce the activity of
trypsin-EDTA, it is necessary to remove the serum before the trypsin-EDTA treatment
(Product information sheet – CRL-2873TM, ATCC, Manassas, VA, USA). Two milliliters
of trypsin-EDTA solution was added to the flask and rocked several times to spread the
trypsin-EDTA solution evenly. The flask was kept inside the incubator at 37 oC since the
trypsin activity is higher at 37 oC than room temperature. The cells were observed in 10
min intervals. The cells could be completely detached from the bottom of the flask after
25-30 min. After the cells were detached from the bottom, 6-7 ml of DMEM was added
into the flask. Upon addition of the medium, the activity of trypsin-EDTA treatment
diminished. The cell content was centrifuged at 125 × g for 10 min. The supernatant was
removed and 10 ml of fresh DMEM medium was added to the centrifuge tube and mixed
by pipetting. Two hundred microliters of the mixed cell suspension were withdrawn for
cell count measurements.
The cell contents were further plated in three flasks. The split ratio was 1:3 where
the cell contents of one flask was divided into three portions and grown in three separate
flasks. Flasks were incubated under the same conditions (37 oC, 5% CO2 level). Cells
were observed daily and medium replenishment was carried out once in each four days.
Once the cells reached a 70% of confluence the cells were passaged for the second time.
5.3.9 Second Passage and Further
The procedure was same as mentioned above. Each flask was passaged into three
flasks using a 1:3 split ratio where one flask of cells was preserved. Upon 70% of
confluence, the cells were split and plated in 24-well plates where each well contained a
cell count of 1.8×10⁴ cells/ml. The third passage of cells was grown in 24-well plates.

63
Later, the frozen cells were re-grown and used with the experiment where those cells
were grown up to the fourth passage.
5.3.10 Cryopreservation of Cells
The cells were centrifuged and the supernatant was removed. The cell pellet was
resuspended in cryopreservation medium. The cell suspension was separated into 1 ml
portions and transferred into 1 ml cryopreservation vials. The vials were labeled and
transferred into -80 oC freezer. After 7 days, the vials were transferred to Biocane liquid
nitrogen storage system.
5.3.11 Cell Counts and Viability
Cell counts were taken using the haemocytometer. Twenty microliters of cell
suspension were incubated with 20 µl of tryphan blue solution and kept at room
temperature. After 10 min, the cell suspension was loaded into the haemocytometer and
cells were counted using a hand-held tally counter. Viable cells were clear and bright
under 10X – phase contrast optics where the dead cells were blue in colour. The viability
counts were obtained using the following equation.
Where the cellavg is the mean cell count of four fields of the haemocytometer, 0.1 µl is the
volume of one field and DF is the dilution factor. The DF for the experiment was one.
5.3.12 Treatments for the HUVEC
5.3.12.1 ACE Inhibitors
Quercetin, quercetin-3-O-glucoside, quercetin-3-O-glucuronic acid, FAE and
Captopril were investigated for their ability to inhibit ACE in the HUVEC model.

64
5.3.12.2 Preparation of Samples
Three concentrations were selected for each compound (Quercetin, quercetin-3-
O-glucoside, quercetin-3-O-glucuronic acid, FAE and Captopril), based on the in vitro
study results (Chapter 4) and the physiologically available concentrations. The selected
concentrations were 1, 10 and 100 mg/l. Other than the extract, flavonoids and
metabolite, Captopril was used as a standard reference for comparison. The same
concentrations were used with Captopril as well.
The compounds were dissolved in a cell culture tested DMSO and the dilutions
hundred microliters were made using DMSO as the diluting agent. The drug was
dissolved in sodium tetra borate buffer (33.4 mM boric acid, 0.5 M NaCl, pH adjusted to
8.3). A blank (no substrate) was used, and a DMSO control were used in each set of
experiments.
5.3.12.3 Cell Treatments
The medium was removed and replaced with FBS free medium 24 h prior to
treatments with the inhibitor (Figure 5.1) where each well contained 1 ml of FBS free
medium.
Prior to treatments, 350 µl of medium were removed from each well. One of
inhibitor at different concentrations, along with the controls, were randomly assigned to
each well. The cells with inhibitors were preincubated for 15 min. After 15 min, 250 µl of
the substrate (HHL) was added to each well, except the blanks. Cells were incubated for
two hours with inhibitors and substrate. After 2 h of incubation, 400 µl of medium were
transferred into labeled Eppendorf tubes. The rest of the medium was stored in -80 oC.
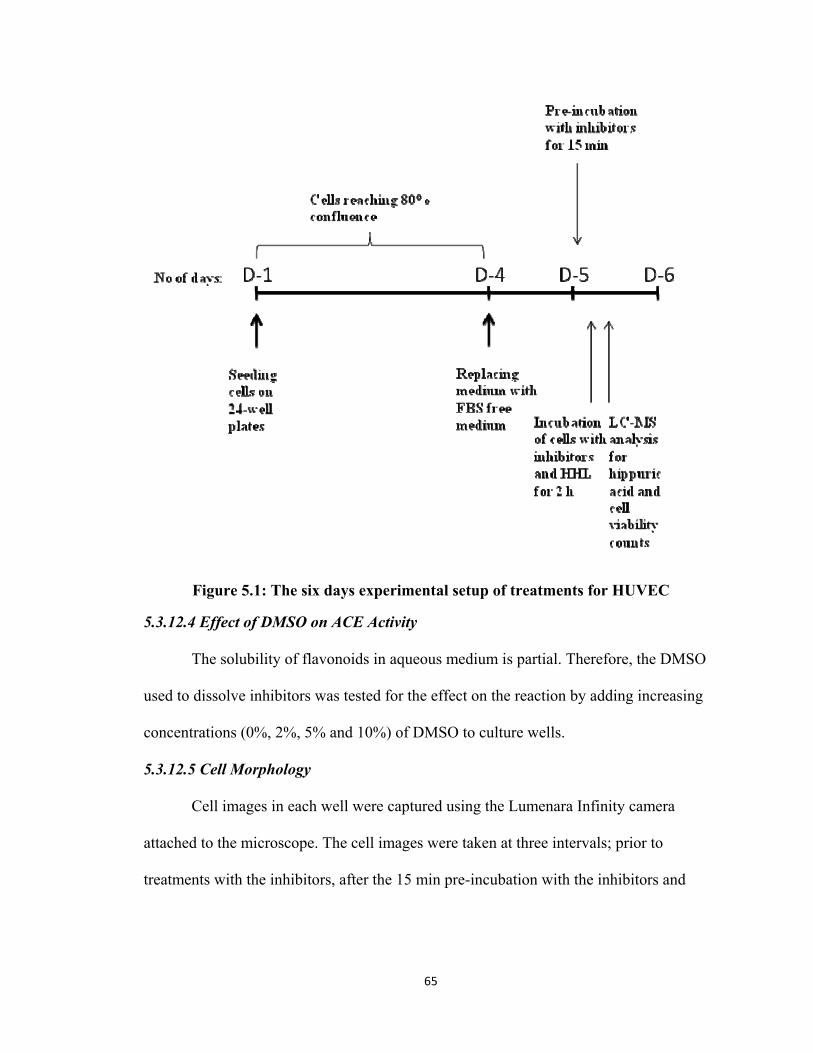
65
Figure 5.1: The six days experimental setup of treatments for HUVEC
5.3.12.4 Effect of DMSO on ACE Activity
The solubility of flavonoids in aqueous medium is partial. Therefore, the DMSO
used to dissolve inhibitors was tested for the effect on the reaction by adding increasing
concentrations (0%, 2%, 5% and 10%) of DMSO to culture wells.
5.3.12.5 Cell Morphology
Cell images in each well were captured using the Lumenara Infinity camera
attached to the microscope. The cell images were taken at three intervals; prior to
treatments with the inhibitors, after the 15 min pre-incubation with the inhibitors and

66
finally, after 2 h incubation with the substrate respectively. The images were recorded
using phase contrast optics under 10X magnification.
5.3.12.6 Determination of Enzyme Inhibition Using UPLC-MS Analysis of the Product
Since ACE is capable of converting HHL into hippuric acid, the formation of
hippuric acid was identified and quantified using ultra performance liquid
chromatography – mass spectrometry analysis (UPLC/MS).
The analysis was performed using a H-class UPLC system (Model CHA Waters
Aquity, Waters Corporation, Milford, MA, USA) equipped with an Aquity BEH C18
(100 mm x 2.1 mm, 1.7 µm) column. The mobile phase consisted of 0.1% (v/v) formic
acid in water (A) and 0.1% (v/v) formic acid (C) in acetonitrile. The flow rate was
maintained at 0.3 ml/min where the injection volume was 2 µl. The multi-linear gradient
profile used was as follows, (t (min), A%, C%): (0.00, 94.0, 6.0), (2.04, 83.5, 16.5),
(2.61, 83.0, 17.0), (3.17, 82.5, 17.5), (3.63, 82.5, 17.5), (4.08, 81.5, 18.5), (4.76, 80.0,
20.0), (6.57, 20.0, 80.0), (8.25, 20.0, 80.0), (12.00, 94.0, 6.0).
Hippuric acid standards were prepared using methanol where the concentrations
were 0.1, 1, 10 and 50 mg/l, respectively. The standard curve obtained is shown in Figure
5.2. The culture medium with hippuric acid (samples) was filtered using 0.2 micron nylon
filters and 200 µl of the filtrate was loaded into UPLC vials supported with inserts.
The MS analysis was performed using a Micromass Quattro micro API MS/MS
system controlled with Masslynx V4.0 data analysis system (Micromass, Cary, NC). The
UPLC/MS was operated in electron spray ionization (ESI) negative mode [M-H+]- where
the hippuric acid ion/charge (m/z) = 178.5 was detected using a single ion monitoring
mode (SIM). The operating conditions for the MS were as follows: capillary voltage-,
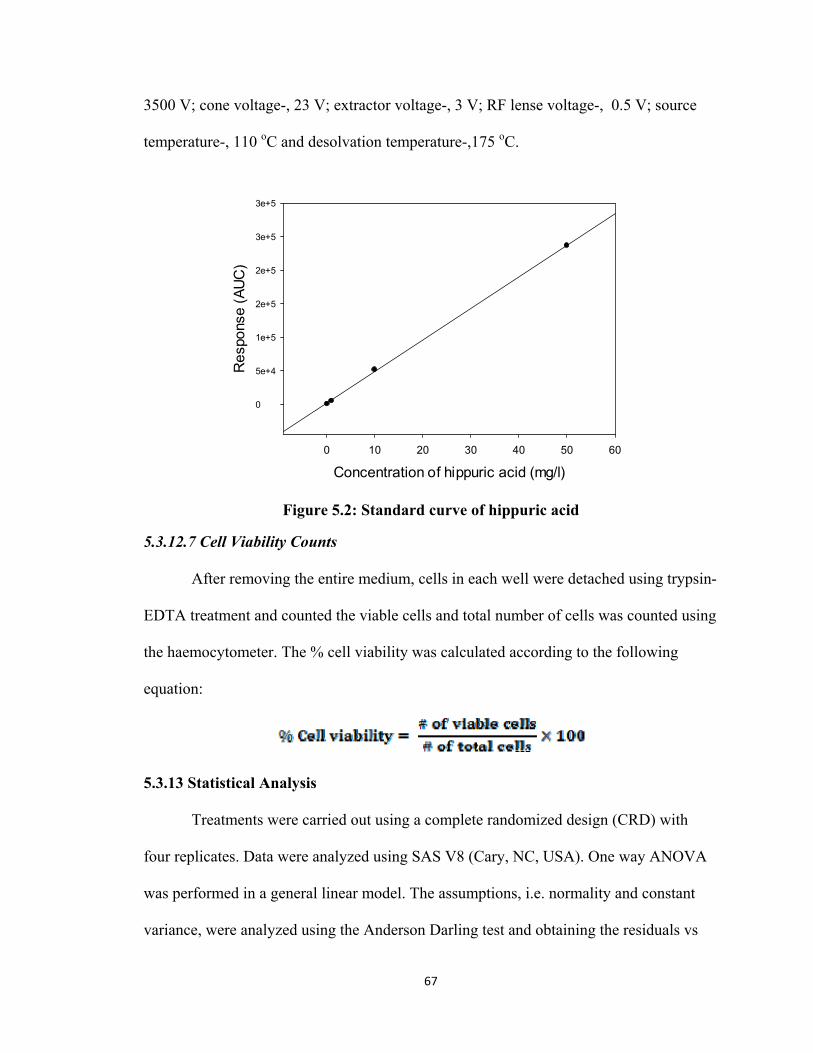
67
3500 V; cone voltage-, 23 V; extractor voltage-, 3 V; RF lense voltage-, 0.5 V; source
temperature-, 110 oC and desolvation temperature-,175 oC.
Concentration of hippuric acid (mg/l)0 10 20 30 40 50 60
Res
pons
e (A
UC)
0
5e+4
1e+5
2e+5
2e+5
3e+5
3e+5
Figure 5.2: Standard curve of hippuric acid
5.3.12.7 Cell Viability Counts
After removing the entire medium, cells in each well were detached using trypsin-
EDTA treatment and counted the viable cells and total number of cells was counted using
the haemocytometer. The % cell viability was calculated according to the following
equation:
5.3.13 Statistical Analysis
Treatments were carried out using a complete randomized design (CRD) with
four replicates. Data were analyzed using SAS V8 (Cary, NC, USA). One way ANOVA
was performed in a general linear model. The assumptions, i.e. normality and constant
variance, were analyzed using the Anderson Darling test and obtaining the residuals vs
68
fitted values respectively. Independence was achieved through randomization. Multiple
means comparisons were carried out using Tukey’s test with a 5% significance level.
5.4 Results
5.4.1 Growth of HUVEC
The HUVEC were polygonal in shape and were grown as a monolayer attached to
the flask bottom. Cells were clearly visible under 10X magnification and phase contrast
optics. The time taken for cell doubling increased with the increasing levels of passaging.
The initial cells received from ATCC multiplied up to a maximum of four passages.
5.4.2 Effect of DMSO on ACE Activity
DMSO is a commonly used solvent for dissolving most insoluble compounds
used in cell-based assays. However, high concentrations of DMSO are toxic to cells.
Therefore, different concentrations of DMSO were incubated with the HUVEC to study
the toxic effect of DMSO on ACE activity. Three concentrations of DMSO, 2%, 5% and
10% (v/v), were compared with the control without DMSO. The enzyme activity was not
influenced by different DMSO concentrations (Figure 5.3). In the current enzyme
inhibition assay, 10% (v/v) DMSO was found to be the appropriate solvent in dissolving
quercetin and its derivatives. When percentages were less than ten, compounds were
partially soluble. Therefore, 10% (v/v) DMSO was selected as the solvent. However,
after the cells were treated with either of the three concentrations of DMSO, it could be
seen that the morphology of cells was slightly altered since the polygonal shape had
become more circular.

69
DMSO concentration
0% 2% 5% 10%
AC
E a
ctiv
ity (E
U*)
0.0
0.5
1.0
1.5
2.0
2.5
Figure 5.3: ACE activities (mean ± SD) of HUVEC treated at different DMSO concentrations
5.4.3 Detection of Hippuric Acid by UPLC/MS
Hippuric acid was detected at m/z ratio of 178.2. The total ion chromatogram (a)
and the mass spectrum (b) of hippuric acid are shown in Figure 5.4.
n=4
(nmol/min)
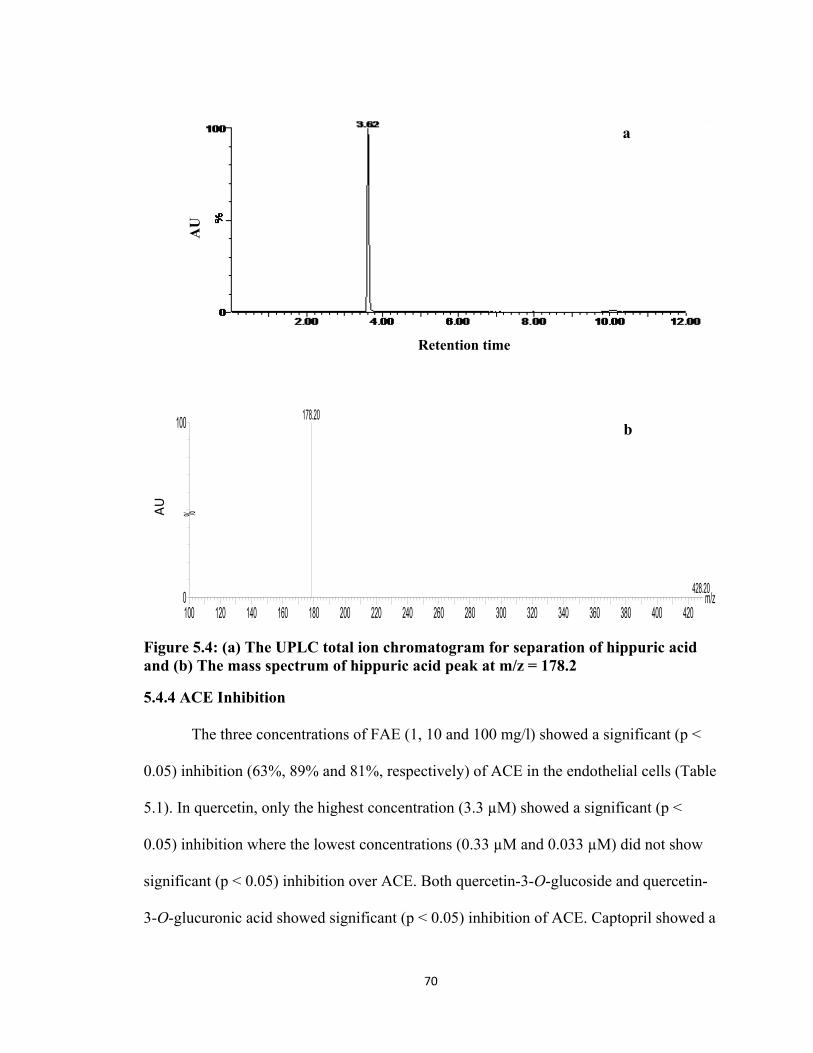
70
m/z100 120 140 160 180 200 220 240 260 280 300 320 340 360 380 400 420
%
0
100Hippuric acid 1 ppm SIM 269 (3.609) SIR of 2 Channels ES-
1.31e4178.20
428.20
Figure 5.4: (a) The UPLC total ion chromatogram for separation of hippuric acid and (b) The mass spectrum of hippuric acid peak at m/z = 178.2
5.4.4 ACE Inhibition
The three concentrations of FAE (1, 10 and 100 mg/l) showed a significant (p <
0.05) inhibition (63%, 89% and 81%, respectively) of ACE in the endothelial cells (Table
5.1). In quercetin, only the highest concentration (3.3 µM) showed a significant (p <
0.05) inhibition where the lowest concentrations (0.33 µM and 0.033 µM) did not show
significant (p < 0.05) inhibition over ACE. Both quercetin-3-O-glucoside and quercetin-
3-O-glucuronic acid showed significant (p < 0.05) inhibition of ACE. Captopril showed a
b
Retention time
AU
a
AU
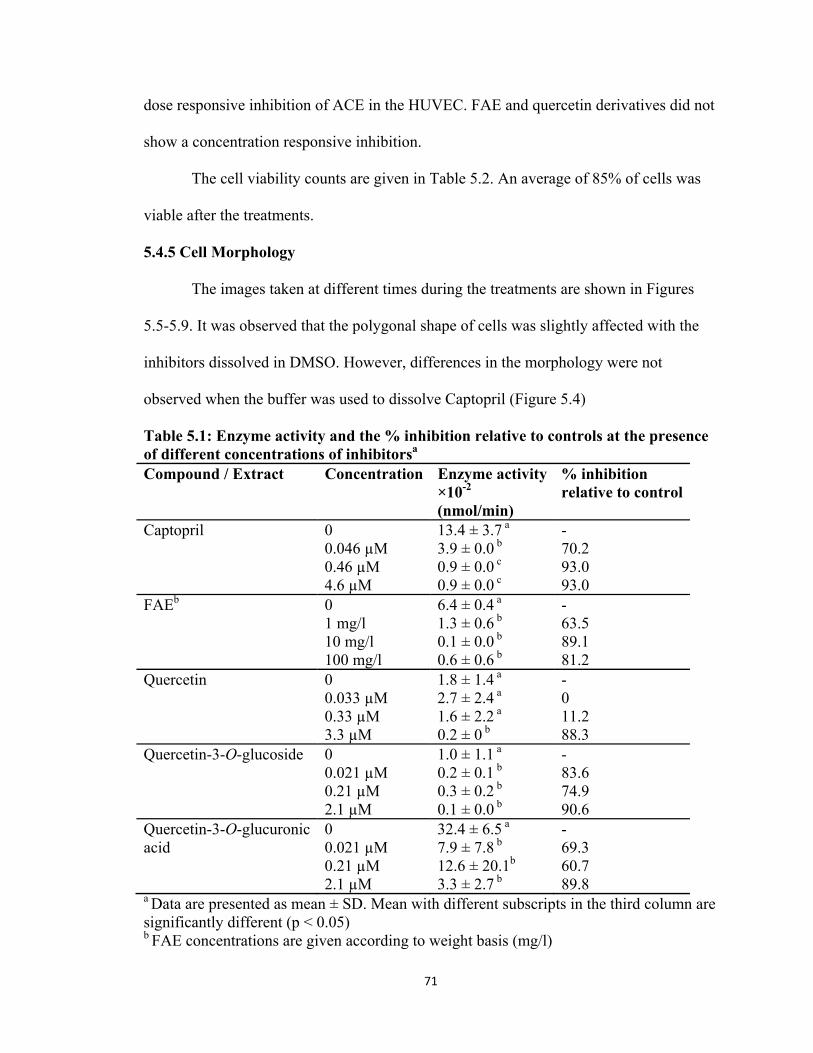
71
dose responsive inhibition of ACE in the HUVEC. FAE and quercetin derivatives did not
show a concentration responsive inhibition.
The cell viability counts are given in Table 5.2. An average of 85% of cells was
viable after the treatments.
5.4.5 Cell Morphology
The images taken at different times during the treatments are shown in Figures
5.5-5.9. It was observed that the polygonal shape of cells was slightly affected with the
inhibitors dissolved in DMSO. However, differences in the morphology were not
observed when the buffer was used to dissolve Captopril (Figure 5.4)
Table 5.1: Enzyme activity and the % inhibition relative to controls at the presence of different concentrations of inhibitorsa Compound / Extract Concentration Enzyme activity
×10-2 (nmol/min)
% inhibition relative to control
Captopril 0 13.4 ± 3.7 a - 0.046 µM 3.9 ± 0.0 b 70.2 0.46 µM 0.9 ± 0.0 c 93.0 4.6 µM 0.9 ± 0.0 c 93.0 FAEb 0 6.4 ± 0.4 a - 1 mg/l 1.3 ± 0.6 b 63.5 10 mg/l 0.1 ± 0.0 b 89.1 100 mg/l 0.6 ± 0.6 b 81.2 Quercetin 0 1.8 ± 1.4 a - 0.033 µM 2.7 ± 2.4 a 0 0.33 µM 1.6 ± 2.2 a 11.2 3.3 µM 0.2 ± 0 b 88.3 Quercetin-3-O-glucoside 0 1.0 ± 1.1 a - 0.021 µM 0.2 ± 0.1 b 83.6 0.21 µM 0.3 ± 0.2 b 74.9 2.1 µM 0.1 ± 0.0 b 90.6 Quercetin-3-O-glucuronic 0 32.4 ± 6.5 a - acid 0.021 µM 7.9 ± 7.8 b 69.3 0.21 µM 12.6 ± 20.1b 60.7 2.1 µM 3.3 ± 2.7 b 89.8 a Data are presented as mean ± SD. Mean with different subscripts in the third column are significantly different (p < 0.05) b FAE concentrations are given according to weight basis (mg/l)
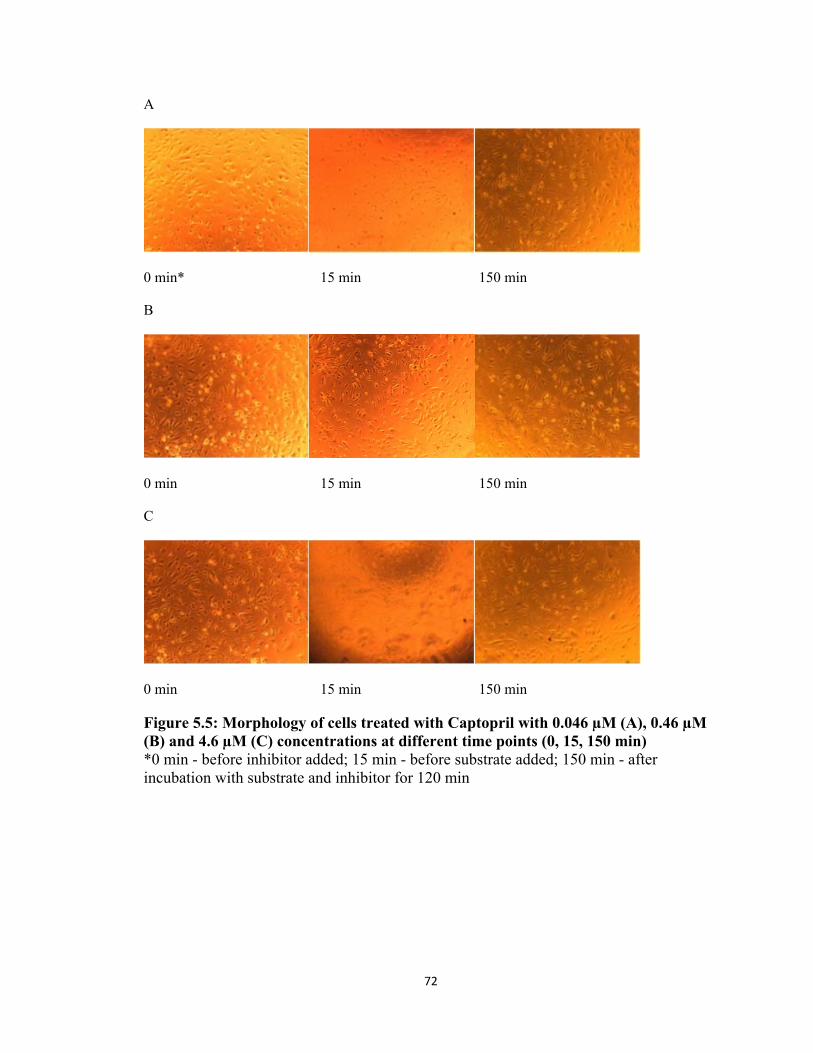
72
A
0 min* 15 min 150 min
B
0 min 15 min 150 min
C
0 min 15 min 150 min
Figure 5.5: Morphology of cells treated with Captopril with 0.046 µM (A), 0.46 µM (B) and 4.6 µM (C) concentrations at different time points (0, 15, 150 min) *0 min - before inhibitor added; 15 min - before substrate added; 150 min - after incubation with substrate and inhibitor for 120 min

73
A
0 min* 15 min 150 min
B
0 min 15 min 150 min
C
0 min 15 min 150 min
Figure 5.6: Morphology of cells treated with FAE with 1 mg/l (A), 10 mg/l (B) and 100 mg/l (C) concentrations at different time points (0, 15, 150 min) *0 min - before inhibitor added; 15 min - before substrate added; 150 min - after incubation with substrate and inhibitor for 120 min
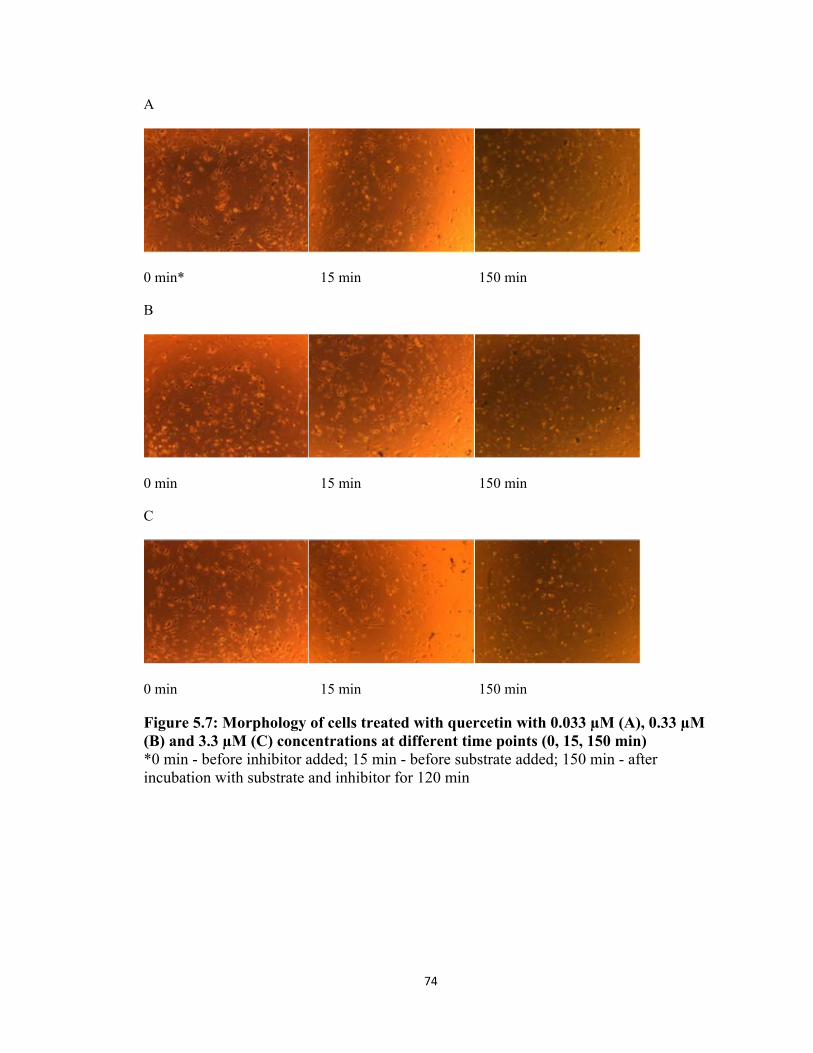
74
A
0 min* 15 min 150 min
B
0 min 15 min 150 min
C
0 min 15 min 150 min
Figure 5.7: Morphology of cells treated with quercetin with 0.033 µM (A), 0.33 µM (B) and 3.3 µM (C) concentrations at different time points (0, 15, 150 min) *0 min - before inhibitor added; 15 min - before substrate added; 150 min - after incubation with substrate and inhibitor for 120 min
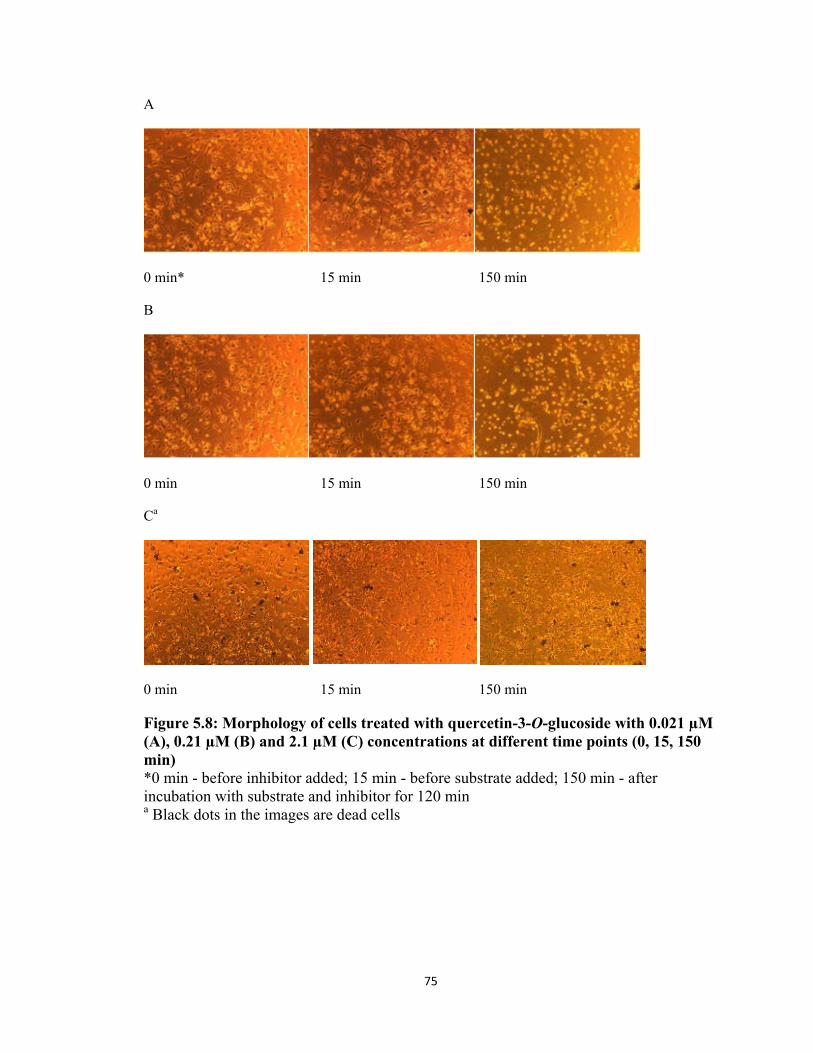
75
A
0 min* 15 min 150 min
B
0 min 15 min 150 min
Ca
0 min 15 min 150 min
Figure 5.8: Morphology of cells treated with quercetin-3-O-glucoside with 0.021 µM (A), 0.21 µM (B) and 2.1 µM (C) concentrations at different time points (0, 15, 150 min) *0 min - before inhibitor added; 15 min - before substrate added; 150 min - after incubation with substrate and inhibitor for 120 min a Black dots in the images are dead cells

76
Aa
0 min* 15 min 150 min
Ba
0 min 15 min 150 min
Ca
0 min 15 min 150 min
Figure 5.9: Morphology of cells treated with quercetin-3-O-glucuronic acid with 0.021 µM (A), 0.21 µM (B) and 2.1 µM (C) concentrations at different time points (0, 15, 150 min) *0 min - before inhibitor added; 15 min - before substrate added; 150 min - after incubation with substrate and inhibitor for 120 min a Black dots in the images are dead cells

77
Table 5.2: Cell viability (% live cells) of HUVEC after 120 min incubation with inhibitors Compound / Extract Concentration % Live cellsCaptopril* Blank
Positive controla95 79
0.046 µM 100 0.46 µM 83 4.6 µM 84 FAE* Blank
Positive control 92 91
1 mg/l 82 10 mg/l 94 100 mg/l 95 Quercetin* Blank
Positive control 80 87
0.033 µM 75 0.33 µM 87 3.3 µM 65 Quercetin-3-O-glucoside* Blank
Positive control 98 80
0.021 µM 69 0.21 µM 100 2.1 µM 96 Quercetin-3-O-glucuronic acid*
Blank Positive control
86 93
0.021 µM 72 0.21 µM 58 2.1 µM 75 *n=4, a positive control: no inhibitors
5.5 Discussion
Flavonoids were identified as cardioprotective phytochemicals (Boyer and Liu,
2004) and their effect on ACE inhibition has been reported in several studies (Actis-
Goretta et al., 2003 and Ojeda et al., 2010). The in vitro ACE activity has been used for
initial identification of several compounds with a high inhibitory action on ACE. The
effect of the selected inhibitors (FAE, quercetin-3-O-glucoside, quercetin-3-O-glucuronic
acid and quercetin) of ACE was further assessed using HUVEC in this study. The
antihypertensive drug Captopril was used as a reference inhibitor.
78
Endothelial cell cultures have been widely used for the screening of ACE
inhibiting analysis in several research studies (Ottaviani et al., 2006 and Persson et al.,
2009). Procyanidins, flavonols as well as several plant extracts i.e. bilberry, tea, ginseng
were identified as possible ACE inhibitors in HUVEC models (Ottaviani et al., 2006,
Persson, et al., 2009 and Persson et al., 2006,).
The FAE showed a significant (p < 0.05) ACE inhibition compared to the positive
control. The synergistic inhibitory effect of all types of flavonoids could explain the
bioactivity observed. In recent studies, different varieties of apple peel extracts were
found to be effective antioxidants (Fattouch et al., 2008), anticarcinogens (Boyer and Liu,
2004) and antimicrobial agents (Fratianni et al., 2011) where the polyphenolics of apple
peel played a major role in the observed bioactivity. The lowest concentration of FAE (1
mg/l) showed a 63% inhibition and the highest concentration (100 mg/l) exhibited 81%
inhibition, which are noteworthy in an in vitro cell model.
The extract FAE was constituted with different types of flavonoids. On a dry
weight basis, one gram of FAE contains 30 mg of flavonols, 11 mg of flavan-3-ols and 2
mg of anthocyanins. The presence of flavonols, flavan-3-ols, anthocyanins and
dihydrochalcones in FAE possibly facilitate the inhibition of ACE. Flavonols were
effective ACE inhibitors in both in vitro and in vivo ACE inhibition studies (Edwards et
al., 2007 and Oh et al., 2004). Tea extracts rich in catechins had inhibited ACE in
HUVEC dose dependently (Persson et al., 2006). Chalcones were also found to be
effective ACE inhibitors in vitro (Bonsei et al., 2010).
However, the bioactivity in vivo may vary due to the complexity of constituents of
any plant extract. In a study conducted by Boyer and Liu (2004), where the
79
bioavailability of apple peel extract and onion extract were compared using a caco-2 cell
line, higher absorption was found from the onion extract compared to the apple peel
extract. High levels of free quercetin and quercetin glucosides, and lesser amounts of
glycosides with lower hydrolyzing ability such as quercetin rhamnoside and quercetin
xyloside, were proved to be in favor for a high bioavailability. Yet, the available
information on bioavailability of apple phytochemicals is scarce and more scientific
evidence is needed to understand the metabolism of quercetin glycosides.
Quercetin and quercetin-3-O-glucoside were two main constituents of FAE. The
effect of these two compounds on ACE inhibition was assessed separately. Quercetin-3-
O-glucoside significantly (p < 0.05) inhibited ACE where in quercetin, only the highest
concentrations (0.33 and 3.3 µM) gave 11% and 88% inhibition, respectively. According
to the previous studies reported (Chapter 4), quercetin showed a moderate inhibition over
ACE when compared with its glucosides. Quercetin was found to be an effective ACE
inhibitor in vivo (Edwards et al., 2007 and Häckl et al., 2002). Being a more lyphophilic
compound, quercetin might not be fully compatible with an aqueous cell system which
would reduce its ability to bind with the soluble form of ACE present in the culture
medium. Meanwhile, the lyphophilicity favors absorption in vivo which could be a reason
for the observed bioactivity in in vivo studies. Quercetin-3-O-glucoside showed 90%
enzyme inhibition at its highest concentration (2.1 µM) and 83% at the lowest (0.021
µM). When absorption rates of quercetin and its glucosides were compared, quercetin-4΄-
glucoside and quercetin-3-O-glucoside were proven to be absorbed to a greater extent
than quercetin in the small intestine (Boyer and Liu, 2004 and Hollman et al., 1996).
Since quercetin-3-O-glucoside proved to be an effective ACE inhibitor in in vitro models

80
and proved to be better absorbed in the small intestine, there is a high chance to act as
ACE inhibitors in vivo. A recent in vivo study has demonstrated that the feeding of the
male Wistar rats with isoquercitrin (quercetin-3-O-glucoside) and isoquercitrin-rich
fractions of Tropaeolum majus L., a Brazillian medicinal plant, significantly reduced
mean arterial pressure and serum ACE activity in Wistar rats (Junior et al., 2011).
The in vitro study results of bioactive molecules have always been challenged as
opposed to in vivo systems due to facts such as absorption, metabolism, bioavailability
and bioactivity of the metabolites. Upon ingestion, bioactive molecules are converted into
methylated, sulfonated and glucuronidated forms when they are absorbed to the
circulation through enterocytes of the small intestine and transferred into the liver cells
through the hepatic vein. In order to make in vitro studies more biologically relevant,
Kroon and others (2004) have suggested incorporating metabolites instead of bioactives
in in vitro analysis. Many studies have been conducted to investigate the absorption,
plasma concentration levels and excretion levels of polyphenolic compounds where a
high variability has been observed among various bioactive molecules (Manach et al.,
2004).
Quercetin-3-O-glucuronic acid is one of the prominent metabolites of quercetin
(Kroon et al. 2004). The metabolite significantly (p < 0.05) inhibited ACE in HUVEC.
The intake dosage and physiologically available concentrations of a metabolite play an
important role on bioactivity. Intake of 275 µmol of flavonoid glycosides resulted in 351
nmol/l of the metabolite quercetin-3-O-glucuronic acid after 0.6 h in an acute human
study (Mullen et al., 2006). In the current study, the lowest concentration of metabolite
(0.021 µM) showed a significant inhibition in vitro. There were several animal and
81
human clinical trials where quercetin and quercetin glucoside treatments had
demonstrated antihypertensive properties via different mechanisms including ACE
inhibition (Edwards et al., 2007, Häckl et al., 2002 and Junior et al., 2011). These study
results provide evidence that quercetin and quercetin-3-O-glucoside can act as potent
hypotensive agents and the metabolite, quercetin-3-O-glucuronic acid plays a prominent
role in blood pressure reduction in the in vivo models. In the current study, Captopril was
selected as a reference and it showed a concentration responsive enzyme inhibition where
0.46 µM and 4.6 µM concentrations showed more than 90% enzyme inhibition.
Overall, the HUVEC model provided some preliminary results on the inhibition
of ACE by the tested inhibitors. The FAE, quercetin-3-O-glucoside and quercetin-3-O-
glucuronic acid showed promising results which need to be confirmed by animal and
human clinical trials.
82
CHAPTER 6.0 CONCLUSIONS
6.1 Objectives of the Study
Hypertension is a key risk factor for the development of cardiovascular diseases
(CVD). It is often referred as the ‘silent killer’ since it has a high tendency to strike
without notice. Therapeutics, as well as life style modifications, are equally important in
the prevention and cure of this chronic disease condition. The role played by ACE
inhibitors in controlling hypertension is enormous. Development of synthetic ACE
inhibitory drugs as well as the identification of naturally-derived dietary components, are
among the main research focus of hypertension related clinical research.
Plant-based bioactives have long been known for their health beneficial
properties. Flavonoid group of bioactives were widely studied as antioxidants and
currently, it is believed that apart from their antioxidant activity, they could promote
health beneficial properties via different mechanisms. The overall objective of this study
was to investigate the ability of flavonoids (representing all subgroups), selected
metabolites of quercetin and an apple peel extract rich in flavonoids (FAE), to act as
potential ACE inhibitors using an in vitro assay as well as a cell culture model system.
The overall objective was subdivided into two specific objectives where the first was to
investigate the ACE inhibitory activity of the above mentioned compounds and an apple
peel extract under in vitro conditions. The in vitro study included the investigation of
concentration responsive ACE inhibition, determining the type of enzyme inhibition and
the IC50 values of those which showed concentration responsive enzyme inhibition.
Based on the results, additional information has been gained in understanding the
structure function relationship of flavonoids on ACE inhibition. The second objective

83
was to select the most promising inhibitors based on the in vitro results and to further
verify the ability to inhibit ACE using a human umbilical vein endothelial cell (HUVEC)
line.
6.2 ACE Inhibition by FAE, Flavonoids and Metabolites
A fluorescence-based assay was used to detect in vitro ACE inhibition. Six
concentrations were selected to determine the dose responsiveness on the enzyme
inhibition. The prescription drug Captopril was used as a reference in each experimental
run. The FAE and its constituent flavonoids showed concentration responsive enzyme
inhibitions. There has been no previously reported research on the ACE inhibitory effect
of an apple-based product or an extract. The current in vitro results highlighted the need
for further investigations on FAE using in vivo model systems. Among the polyphenolics
tested, except for coumarin and genistein, all the representative compounds of sub-classes
of flavonoids that were tested showed concentration responsive enzyme inhibition. The
lowest IC50 values were associated with quercetin-3-O-glucoside, epicatechin and
naringenin. There were three metabolites of quercetin included in this study. Among the
three, two metabolites, queretin-3-O-glucuronic acid and quercetin-3΄-sulphate showed
concentration responsive enzyme inhibition. Interestingly, queretin-3-O-glucuronic acid
was the most effective inhibitor among all the tested compounds which gave an IC50
value of 27 µM. It could be concluded that most flavonoids and FAE as well as
metabolites are effective ACE inhibitors in vitro. The results obtained from the research
with metabolites strengthen the evidence that in in vivo models, quercetin and its
glycosides have high potency to inhibit the circulatory ACE.

84
The FAE, quercetin-3-O-glucoside, epicatechin and queretin-3-O-glucuronic acid
were selected for the enzyme kinetic analysis. The enzyme activity exhibited the typical
Michalelis-Menten enzyme kinetics. According to the kinetic parameters and
Lineweaver-Burk plots, qurcetin-3-O-glucoside, epicatechin, queretin-3-O-glucuronic
acid and FAE were competitive inhibitors of ACE. The presence of the B ring of
flavonoids and the hydroxyl groups present in the flavonoid structures were found to play
an essential role on enzyme inhibition.
6.3 Effect of Selected ACE Inhibitors on Human Endothelial Cell Model
Endothelial cell cultures had been widely used for identification of ACE
inhibitors in many research studies. The FAE, quercetin-3-O-glucoside, quercetin-3-O-
glucuronic acid and quercetin were among the selected inhibitors from the in vitro study.
The FAE, quercetin-3-O-glucoside and quercetin-3-O-glucuronic acid showed a
significant enzyme inhibition when compared with the control, therefore, it can be
concluded that these compounds are potent ACE inhibitors in the endothelial cell model.
The lowest concentration (0.021µM) of quercetin-3-O-glucuronic acid showed 69%
enzyme inhibition. This concentration is lower than the reported biologically active
concentrations of quercetin metabolite in humans (Mullen et al., 2006). In experiments
using quercetin, only the highest concentration (3.3 µM) showed a significant inhibition
over ACE. Captopril effectively inhibited ACE where it showed a concentration-
dependent enzyme inhibition. The results obtained in the in vitro study were reconfirmed
using the endothelial cell model. The FAE, quercetin glycoside as well as the metabolite
were effective inhibitors over the ACE produced by endothelial cells.
85
Both in vitro models provided evidence that the most flavonoids tested and FAE
were able to inhibit ACE. In the in vitro study (experiment one), ACE derived from
rabbit lung and in the cell model, human endothelial cell derived ACE were used. In
literature there had been controversial results associated with flavonoids on ACE
inhibition. The current study support that flavonoids show ACE inhibition in vitro.
Compared to Captopril, the inhibition was at a moderate level. However, the less
solubility of most flavonoids in aqueous medium can interfere with the level of enzyme
inhibition. In FAE, the synergistic effect of different types of flavonoids could be in favor
for the observed bioactivity. The observed enzyme inhibition relating to the metabolite
quercetin-3-O-glucuronic acid in both models, support the fact that flavonols has a high
potential to inhibit ACE in vivo. As most of the ACE inhibitory drugs in use, flavonoids
competitively inhibit ACE.
6.4 Recommendations for Future Research
Several improvements could be made in relation to the cell culture
experimentations. Since the cell membrane integrity was affected by the solvent (10% v/v
DMSO), it might be better to substitute another non-toxic solvent system which has the
ability to dissolve the flavonoids in an aqueous medium. More attention should be paid to
reducing the variability within each experimental unit which may be due to the variation
in cell density of experimental units. Using a high initial cell density as well as selecting
cells from early passages (eg: passage 3), could be useful in overcoming this weakness.
It is important to know the membrane bound and soluble ACE levels for each
experimental unit. A method of quantification of both types of ACE would be beneficial
for the cell based experiments. The same experimental set up could be used to investigate

86
several aspects, including the effect of the inhibitors upon nitric oxide (NO) synthesis and
the expression levels of the gene encoding ACE. An increased level of NO promotes
vasorelaxation and is responsible for reducing blood pressure. If the flavonoids trigger
the production of NO this would become an added advantage apart from the ACE
inhibition.
The in vitro analysis using two different model systems provided the initial
understanding of flavonoids as ACE inhibitors. Development of identified compounds as
a neutraceutical to treat hypertension requires many steps, including animal trials and
human clinical trials. Rodent models such as spontaneously hypertensive rats are quite
popular in hypertensive animal studies. In vitro model systems cannot be used in
understanding the bioavailability of phytochemicals, the metabolites formed in the body
and their biological activity. Therefore, it is essential to confirm the current findings
using animal models. Based on the results of animal studies and safety levels of
flavonoids, human clinical trials could be performed. These are essential for the
development of bioactive-rich apple peel based natural health products or functional
foods with beneficial health claims of antihypertensive properties.
Overall, it can be concluded that FAE shows promising ACE inhibitory properties
in both in vitro biochemical assay and HUVEC cultures where its constituent flavonoids
seems to be responsible for the observed bioactivity. The metabolite and the glucoside of
quercetin, i.e. quercetin-3-O-glucuronic acid and quercetin-3-O-glucoside, respectively,
were the most effective ACE inhibitors among the tested flavonoids and their derivatives.
The flavonoids competitively inhibit ACE where the presence of hydroxyl groups and the

87
B-ring structure may play a significant role in binding with the active site of ACE which
requires further investigations.
88
REFERENCES
Acharya, K.; Sturrock, E.; Riordan, J.; Ehlers, M. ACE revisited: A new target for structure-based drug design. Nat. Rev. Drug Discov. 2003, 2, 891-903.
Actis-Goretta, A.; Ottaviani, J. I.; Keen, C. L.; Fraga, G. Inhibition of angiotensin converting enzyme (ACE) activity by flavan-3-ols and procyanidins. FEBS Lett. 2003, 555, 597-600.
Actis-Goretta, L.; Ottaviani, J. I.; Fraga, C. G. Inhibition of angiotensin converting enzyme activity by flavonol-rich foods. J. Agric. Food Chem. 2006, 54, 229-234.
Ahmed, F.; Siddesha, J. M.; Urooj, A.; Vishwanath, B. S. Radical scavenging and angiotensin converting enzyme inhibitory activities of standardized extracts of Ficus racemosa stem bark. Phytother. Research. 2010, 24, 1839-1843.
Alves, M. F.; Araujo, M. C.; Juliano, M. A.; Oliveira, E. M.; Krieger, J. E.; Casarini, D. E.; Juliano, L.; Carmona, A. K. A continuous florescent assay for the determination of plasma and tissue angiotensin I converting enzyme activity. Braz. J. Med. Biol. Res. 2005, 38, 861-868.
Atlas, S. A. The renin-angiotensin aldosterone system: pathophysiological role and pharmacologic inhibition. J. Manag. Care Pharm. 2007, 13, 9-20.
Balasuriya, B. W. N.; Rupasinghe, H. P. V. Plant flavonoids as angiotensin converting enzyme inhibitors in regulation of hypertension. Func. Foods Health Dis. 2011, 5, 172-188.
Bonsei, M.; Loizzo, M. R.; Statti, G. A.; Michel, S.; Tillequin, F. The synthesis and angiotensin converting enzyme (ACE) inhibitory activity of chalcones and their pyrazole derivatives. Bioorg. Med. Chem. Lett. 2010, 20, 1990-1993.
Boyer, J.; Liu, R. H. Apple phytochemicals and their health benefits. Nutr. J. 2004, 15, 3-5.
Ceconi, C.; Francolini, G.; Bastianon, D.; Gitti, G. L.; Comini, L.; Ferrari, R. Differences in the effect of angiotensin-converting enzyme inhibitors on the rate of endothelial cell apoptosis: in vitro and in vivo studies. Cardiovasc. Drugs Ther. 2007, 21, 423-429.
Cho, T. M.; Peng, N.; Clark, J. T.; Novak, L.; Roysommuti, S.; Prasain, J.; Wyss, J. M. Genistein attenuates the hypertensive effects of dietary NaCl in hypertensive male rats. Endocrinology. 2007, 148, 5396-5402.
Cinq-Mars, C.D; Li-Chan, E. C. Optimizing angiotensin 1-converting enzyme inhibitory activity of Pacific Hake (Merluccius productus) fillet hydrolysate using response surface methodology and ultrafiltration. J. Agric. Food Chem. 2007, 55, 9380-9388.
89
Corradi, H. R.; Schwager, S. L.; Nchinda, A. T.; Sturrock, E. D.; Acharya, K. R. Crystal structure of the N domain of human somatic angiotensin I-converting enzyme provides a structural basis for domain-specific inhibitor design. J. Mol. Biol. 2006, 357, 964-974.
Croft, K. D. The chemistry and biological effects of flavonoids and phenolic acids. Ann. N. Y. Acad. Sci. 1998, 20, 435-442.
Cyrino, L. A. R.; Cardoso, R. C. F.; Hackl, L. P.; Nicolau, M. Effect of quercetin on plasma extravasation in rat CNS and dura mater by ACE and NEP inhibition. Phytother. Res. 2002, 16, 545-549.
D’Archivio, M.; Filesi, C.; Benedetto, R. D.; Gargiulo, R.; Giovannini, C.; Masella, R. Polyphenols, dietary sources and bioavailability. Ann. 1st Super Sanita. 2007, 43, 348-361.
Edwards, R. L.; Lyon, T.; Litwin, S. E.; Rabovsky, A.; Symons, D.; Jalili, T. Quercetin reduces blood pressure in hypertensive subjects. J. Nutr. 2007, 137, 2405-2411.
Egan, B. M.; Laken, M. A.; Donovan, J. L.; Woolson, R. F. Does dark chocolate have a role in the prevention and management of hypertension? Commentary on the evidence. Hypertension. 2010, 55, 1289-1295.
Erlund, I. Review of the flavonoids quercetin, hesperetin, and naringin. Dietary sources, bioactives, bioavailability, and epidemiology. Nutr. Res. 2004, 24, 851-874.
Farzamirad, V.; Aluko, R. T. Angiotensin-converting enzyme inhibition and free radical scavenging properties of cationic peptides derived from soybean protein hydrolysates. Int. J. Food Sci. Nutr. 2008, 59, 428-437.
Fattouch, S.; Caboni, P.; Coroneo, V.; Tuberoso, C.; Angioni, A.; Dessi, S.; Marzouki, N.; Cabras, P. Comparative analysis of polyphenolic profiles and antioxidant and antimicrobial activities of Tunisian pome fruit pulp and peel aqueous acetone extracts. J. Agric. Food Chem. 2008, 13, 1084-1090.
Fratianni, F.; Coppola, R.; Nazzaro, F. Phenolic compositions and antimicrobial and antiquorum sensing activity of an ethanolic extract of peels from the apple cultivar Annurca. J. Med. Food. 2011, 14, 957-963.
García-Cornesa, M. T.; Tribolo, S.; Guyot, S.; Tomás-Barbarán, F. A.; Kroon, P. Oligomeric procyanidins inhibit cell migration and modulate the expression of migration and proliferation associated genes in human umbilical vascular endothelial cells. Mol. Nutr. Food Res. 2009, 53, 266-276.
Guang, C.; Philips, R. D. Plant food derived angiotensin I converting enzyme inhibitory peptides. J. Agric. Food Chem. 2009, 57, 5113-5120.
Häckl, L. P.; Cuttle, G.; Dovichi, S. S.; Lima-Landman, M. T.; Nicolau, M. Inhibition of angiotensin converting enzyme by quercetin alters the vascular response to bradykinin and angiotensin I. Phamacology. 2002, 65, 182-186.

90
Hammoud, R. A.; Vaccari, C. S.; Nagamia, S. H.; Khan, B. V. Regulation of the renin-angiotensin system in coronary atherosclerosis: a review of the literature. Vasc. Health Risk Manag. 2007, 3, 937-945.
He, J.; Whelton, P. K. Epidemiology and prevention of hypertension. Med. Clin. North Am. 1997, 81, 1077-1097.
He, X.; Liu, R. H. Phytochemicals of apple peels: isolation, structure elucidation, and their antiproliferative and antioxidant activities. J. Agric. Food Chem. 2008, 56, 9905-9910.
Hollman, P. C. H.; Gaag, M. V. D.; Mengelers, M. J. B.; Van Triip, J. M. P.; De Vries, J. H. M.; Katan, M. B. Absorption and disposition kinetics of the dietary antioxidant quercetin in man. Free Radic. Biol. Med. 1996, 21, 703-703.
Hong, F.; Ming, L.; Yi, S.; Zhanxia, L.; Yongquan, W.; Chi, L. The antihypertensive effect of peptides: a novel alternative to drugs? Peptides. 2008, 29, 1062-1071.
Huber, G. M.; Rupasinghe, H. P.; Phenolic profiles and antioxidant properties of apple skin extracts. J. Food Sci. 2009, 74, 693-700.
Jackson, C. -J. C.; Dini, J. P.; Lavandier, C.; Rupasinghe, H. P. V.; Faulkner, H.; Poysa, V.; Buzzell, D.; De Grandis, S. Effects of processing on the content and composition of isoflavones during manufacturing of soy beverage and tofu. Process Biochem. 2002, 37, 1117-1123.
Jiang, H.; Paul, W. Epidemiology and prevention of hypertension. Med. Clin. North Am. 1997, 81, 1077-1097.
Johnson, A. R.; Erdös E.G. Metabolism of vasoactive peptides by human endothelial cells in culture. Angiotensin I converting enzyme (kininase II) and angiotensinase. J. Clin. Invest. 1977, 59, 684-695.
Jonadet, M.; Bastide, J.; Bastide, P.; Boyer, B.; Carnat, A. P.; Lamaison, J. L. In vitro enzyme inhibitory and in vivo cardioprotective activities of hibiscus (Hibiscus sabdariffa L.) J. Pharm. Belg. 1990, 45, 120-124.
Junior, A. G.; Gasparotto, F. M.; Lourenço, E. L. B.; Crestani, S.; Stefanello, M. E. A.; Salvador, M. J.; da Silva-Santos, J. E.; Matques, M. C. A.; Kassuya, C. A. L. Antihypertensive effects of isoquercetrin and extracts from Tropaeolum majus L.; evidence for the inhibition of angiotensin converting enzyme. J. Ethnopharmacol. 2011, 134, 363-372.
Kang, D. G.; Kim, Y. C.; Sohn, E. J.; Lee, Y. M.; Lee, A. S.; Yin, M. H.; Lee, H. S. Hypotensive effect of butein via inhibition of angiotensin converting enzyme. Biol. Pharm. Bull. 2003, 26, 1345-1347.

91
Kiss, A.; Kowalski, J.; Melzig, M.F. Compunds from Epilobium angustifolium inhibit the specific metallopeptidases ACE, NEP, and APN. Planta Med. 2004, 70, 919-923.
Kroon, P. A.; Clifford, M. N.; Crozier, A.; Day, A. J.; Donovan, J. L.; Manch, C. How should we assess the effects of exposure to diatery polyphenols in vitro? Am. J. Clin. Nutr. 2004, 80, 15-21.
Kwon, E. K.; Lee, D. Y.; Lee, H.; Kim, D. O.; Baek, N. I.; Kim, Y. E.; Kim, H. Y. Flavonoids from the buds of Rosa damascena inhibit the activity of 3-hydroxy-3-methyl-coenzyme A reductase and angiotensin-I converting enzyme. J. Agric. Food Chem. 2010, 58, 882-886. Lahogue, V.; Réhel, K.; Taupin, L.; Haras, D.; Allaume, P. A HPLC-UV method for the determination of angiotensin I converting enzyme (ACE) inhibitory activity. Food Chem. 2010, 118, 870-875. Loizzo, M. R.; Said, A.; Tundis, R.; Rashed, K.; Statti, G. A.; Hufner, A.; Menichini, F. Inhibition of angiotensin converting enzyme (ACE) by flavonoids isolated from Ailanthus excelsa (Roxb) (Simaroubaceae). Phytother. Res. 2007, 21, 32-36. Loizzo, M. R.; Tundis, R.; Confroti, F., Statti, G. A.; Menichini, F. Inhibition of angiotensin converting enzyme activity by Scenecio species. Pharm. Biol. 2009, 47, 516-520.
Mailloux, A.; Grenet, K.; Bruneel, A.; Bénéteau-Bunat, B.; Vaubourdolle, M.; Baudin, B. Anticancer drugs induce necrosis of human endothelail cells involving both oncosis and apoptosis. Eur. J. Cell Biol. 2001, 80, 442-449.
Manach, C.; Scalbert, A.; Morand, C.; Remesy, C.; Jimenez, L. Polyphenols: food sources and bioavailability. Am. J. Clin. Nutr. 2004, 79, 727-747.
Mittal, B. V.; Singh, A. K. Hypertension in the developing world: challenges and opportunities. Am. J. Kidney Dis. 2010, 55, 590-598. Montenegro, M. F.; Pessa, L. R.; Tanus-Santos, J. E. Isoflavone genistein inhibits the angiotensin-converting enzyme and alters the vascular response to angiotensin I and bradykinin. Eur. J. Pharmacol. 2009, 607, 173-177.
Mullen, W.; Edwards, C. A.; Crozier, A. Absorption, excretion, and metabolite profiling of methyl-, glucuronyl-, glucosyl-, and sulpho-cojugates of quercetin in human plasma and urine after ingestion of onions. Br. J. Nutr. 2006, 96, 107-116.
Natesh, R.; Schwager, S.L.; Sturrock, E. D.; Acharya, K. R. Crystal structure of the human angiotensin converting enzyme-Lisinopril complex. Nature. 2003, 421, 551-554.
Neto-Neves, E. M.; Montenegro, M. F.; Dias-Junior, C. A.; Spiller, F.; Kanashiro, A.; Tanus-Santos, J. E. Chronic treatment with quercetin does not inhibit angiotensin-

92
converting enzyme in vivo or in vitro. Basic Clin. Phamacol. Toxicol. 2010, 107, 825-829. Nicolau, M.; Dovichi, S. S.; Cuttle, G. Pro-inflammatory effect of quercetin by dual blockade of angiotensin converting-enzyme and neutral endopeptidase in vivo. Nutr. Neurosci. 2003, 6, 309-316. Oh, H.; Kang, D. G.; Kwon, J. W.; Kwon, T. H.; Lee, S. Y.; Lee, D. B.; Lee, H. S. Isolation of angiotensin converting enzyme (ACE) inhibitory flavonoids from Sedum sarmentosum. Biol. Pharm. Bull. 2004, 27, 2035-2037. Ojeda, D.; Jiménez-Ferrer, E.; Zamilpa, A.; Herrera-Arellano, A.; Tortoriello, J.; Alvarez, L. Inhibition of angiotensin converting enzyme (ACE) activity by the anthocyanins delphinidin- and cyanidin-3-O-sambubiosides from Hibiscus sabdariffa. J. Ethnopharmacol. 2010, 127, 7-10. Olszanecki, R.; Bujak-Gizycka, B.; Madej, J.; Suski, M.; Wolkow, P. P.; Jawień, J.; Korbut, R. Kaempferol, but not resveratrol inhibits angiotensin converting enzyme. J. Physiol. Phamacol. 2008, 59, 387-392. Oparil, M. D.; Zaman, A.; Calhoun, D. A. Pathogenesis of hypertension. Ann. Intern. Med. 2003, 136, 761-776. Ottaviani, J. I.; Actis-Goretta, L.; Villordo, J. J.; Fraga, C. G. Procyanindin structure defines the extent and specificity of angiotensin I converting enzyme inhibition. Biochimie. 2006, 88, 359-365. Persson, I. A. L.; Persson, K.; Andersson, G. G. Effect of Vaccinum myrtillus and its polyphenols on angiotensin-converting enzyme activity in human endothelial cells. J. Agric. Food Chem. 2009, 57, 4626-4629. Persson, I. A. L.; Joseffsson, M.; Persson, K.; Anderson, R. G. G. Tea flavanols inhibit angiotensin-converting enzyme activity and increase nitric oxide production in human endothelial cells. J. Pharm. Pharmacol. 2006, 58, 1139-1144. Pinto, M. D. S.; Kwon, Y. I.; Apostolidis, E.; Lajolo, F. M.; Genovese, M. I.; Shetty, K. Evaluation of red currants (Ribes rubrum L.) black currents (Ribes nigrum L.) red and green gooseberries (Ribes uva-crispa) for potential management of type 2 diabetes and hypertension using in vitro models. J. Food Biochem. 2010, 34, 639-660. Pinto, M. D. S.; Kwon, Y. I.; Apostolidis, E.; Lajolo, F. M.; Genovese M. I.; Shetty, K. Functionality of bioactive compounds in Brazilian strawberry (Fragaria x Ananassa Duch.) cultivars: evaluation of hyperglycemia and hypertension potential using in vitro models. J. Agric. Food Chem. 2008, 56, 4386-4392.

93
Pinto, M. D. S.; Kwon, Y. I.; Apostolidis, E.; Lajolo, F. M.; Genovese, M. I.; Shetty, K. Potential of Ginkgo biloba L. leaves in the management of hyperglycemia and hypertension using in vitro models. Bioresour. Technol. 2009, 100, 6599-6609.
Quan, A. Fetopathy associated with exposure to angiotensin converting enzyme inhibitors and angiotensin receptor antagonists. Early Hum. Dev. 2006, 82, 23-28.
Rio, D. D.; Calani, L.; Scazzina, F.; Jechiu, L.; Cordero, C.; Brighenti, F. Bioavailability of catechins from ready-to-drink tea. Nutrition. 2010, 26, 528-533.
Rupasinghe, H. P. V. The role of polyphenols in quality, postharvest handling and processing of fruits. In Postharvest Biology and Technology of Fruits, Vegetables, and Flowers, Paliyath, G.; Lurie, S.; Murr, D.; Handa, A., Eds.; Publisher: Wiley-Blackwell. 2008; pp 260-281.
Rupasinghe, H. P. V.; Erkan, N.; Yasmin, A. Antioxidant protection of eicosapentaenoic acid and fish oil oxidation by polyphenolic-enriched apple skin extract. J. Agric. Food Chem. 2010, 58: 1233-1239.
Rupasinghe, H. P. V.; Ronalds, C. M.; Rathgeber, B.; Robinson, R. A. Absorption and tissue distribution of dietary quercetin and quercetin glycosides of apple skin in broiler chickens. J. Sci. Food Agric. 2010, 90, 1172-1178.
Saijonma, O.; Nyman, T.; Fyhrquist, F. Downregulation of angiotensin-converting enzyme by tumor necrosis factor- alpha and interleukin-1beta in cultured human endothelial cells. J. Vasc. Res. 2001, 38, 370-378.
Sakaida, H.; Nagao, K.; Higa, K.; Shirouchi, B.; Inoue, N.; Hidaka, F.; Kai, T. Effect of Vaccinium ashei reade leaves on angiotensin converting enzyme activity in vitro and on systolic blood pressure of spontaneously hypertensive rats in vivo. Biosci. Biotechnol. Biochem. 2007, 71, 2335-2337.
Santos, M.R.; Gomez, R.G.; Justinol, G.C.; Charro, N.; Florenciol, M. H.; Miral, L. Influence of the metabolic profile on the in vivo antioxidant activity of quercetin under a low dosage oral regimen in rats. Br. J. Pharmacol. 2008, 153, 1750-1761. Santos, R. A.; Krieger, E. M.; Greene, L. J. An improved fluorometric assay of rat serum and plasma converting enzyme. Hypertension. 1985, 7, 244-252.
Sentandreu, M. A.; Toldrá, F. A rapid, simple and sensitive fluorescence method for the assay of angiotensin-I converting enzyme. Food Chem. 2006, 97, 546-554.
Shao, D.; Park, J. E. S.; Wort, S. J. The role of endothelin-1 in the pathogenesis of pulmonary arterial hypertension. Pharmacol. Res. 2011, 63, 504-511.

94
Shindo, M.; Kasai, T.; Abe, A.; Konido, Y. Effects of dietary administration of plant derived anthocyanin-rich colours to spontaneously hypertensive rats. J. Nutr. Sci. Vitaminol. 2007, 53, 90-93.
Sierra, C.; Lopez-Soto, A.; Coca, A. Connecting cerebral white matter lesions and hypertensive target organ damage. J. Aging Res. 2011, [Online] Available: http://www.ncbi.nlm.nih.gov/pubmed/21837275, [2011 Sep 14].
Somova, L. O.; Nadar, A.; Rammanan, P.; Shode, F. O. Cardiovascular, antihyperlipidemic and antioxidant effects of oleanolic and ursolic acids in experimental hypertension. Phytomedicine. 2003, 10, 115-121.
Soundararajan, R.; Wishart, A.D.; Rupasinghe, H.P.V.; Arcellana-Panlilio, M.; Nelson, C.M.; Mayne, M.; Robertson, G. S. Quercetin-3-glucoside protects neuroblastoma (SH-SY5Y) cells in vitro against oxidative damage by inducing sterol regulatory element-binding protein-2-mediated cholesterol biosynthesis. J. Biol. Chem. 2008, 284, 2231-2245.
Spyroulias, G. A.; Galanis, A. S.; Pairas, G.; Manessi-Zoupa, E.; Cordopatis, P. Structural features of angiotensin-I converting enzyme catalytic sites: conformational studies in solution, homology models and comparison with other zinc metallopeptidases. Curr. Top. Med. Chem. 2004, 4, 403-429. Stevenson, D. E.; Hurst, R. D. Polyphenolic phytochemicals – just antioxidants or much more? Cell. Mol. Life Sci. 2007, 64, 2900-2916.
Taddei, S.; Galetta, F.; Virdis, A.; Ghiadoni, L.; Salvetti, G.; Franzoni, F.; Giusti, C.; Salvetti, A. Physical activity prevents age-related impairment in nitric oxide availability in elderly athletes. Circulation. 2000, 101, 2896-2901.
Tsutsumi, Y.; Shimada, A.; Miyano, A.; Nishida, T.; Mitsunaga, T. In vitro screening of angiotensin I converting enzyme inhibitors from Japanese cedar (Crptomeria japonica). J. Wood Sci. 1997, 44, 463-468.
Uchida, S.; Ikari, N.; Ohta, M.; Niwa, M.; Nonaka, G.; Nishioka, I.; Ozaki, M. Inhibitory effects of condensed tannins on angiotensin converting enzyme. Jap. J. Pharmacol. 1987, 2, 242-246.
Udenigwe, C. C.; Lin, Y. S.; Hou, W. C.; Aluko, R. E. Kinetics of the inhibition of renin and angiotensin-I converting enzyme by flaxseed protein hydrolysate fractions. J. Func. Foods. 2009, 1, 199-207. Vercruysse, L.; Camp, J. H. V.; Smagghe, G. ACE inhibitory peptides from enzymatic hydrolysates of animal muscle protein: a review. J Agric. Food Chem. 2005, 53, 8106-8115.
Vijayaraghavan, K.; Deedwania, P. Renin-angiotensin-aldosterone blockade for cardiovascular disease prevention. Cardiol. Clin. 2011, 29, 137-156.

95
Wagner, H.; Elbl, G.; Lotter, H.; Guinea, M. Evaluations of natural products as inhibitions of angiotensin-I converting enzyme (ACE). Pharma. Pharmacol. Lett. 1991, 1, 15-18.
Willie, P. R.; Riberio-do-Valle, R. M.; Simoes, C. M. O.; Gabilan, N. H.; Nicalou, M. Effect of quercetin on tachykinin-induced plasma extravasation in rat urinary bladder. Phytother. Res. 2001, 15, 444-446. Wu, J.; Aluko, R. E.; Muir, A. D. Purification of angiotensin I converting enzyme peptides from the enzymatic hydrolysate of defatted canola meal. Food Chem. 2008, 111, 942-950. Wu, J.; Muir, A. D. Isoflavone content and its potential contribution to the antihypertensive activity in soybean angiotensin I converting enzyme inhibitory peptides. J. Agric. Food Chem. 2008, 56, 9899-9904.
Xu, Y. Y.; Yang, C.; Li, S. N. Effects of genistein on angiotensin-converting enzyme in rats. Life Sci. 2006, 79, 828-837.
Yamamoto, N. Antihypertensive peptides derived from food proteins. Biopolymers. 1997, 43, 129-134. Zibadi, S.; Rohdewald, P. J.; Park, D.; Watson, R. R. Reduction of cardiovascular risk factors in subjects with type 2 diabetes by pycongenol supplementation. Nutr. Res. 2008, 28, 315-320.
Zisman, L. S. Inhibiting tissue angiotensin-converting enzyme. A pound of flesh without the blood ? Circulation. 1998, 2788-2790.