Embed Size (px)
Citation preview
behaviorisma framework for dynamic information visualization
A Project submitted in partial satisfaction of the requirementsfor the degree of Master of Arts in Media Arts and Technologies by
Angus Graeme Forbes
Committee in charge:
Professor George Legrady, Chair
Professor Tobias Hollerer
Professor JoAnn Kuchera-Morin
December 1st, 2009

The project of Angus Forbes is approved.
George Legrady
Tobias Hollerer
JoAnn Kuchera-Morin
December 1st, 2009
ii
Abstract
behaviorism is a cross-platform programming framework for developing real-time information vi-sualization and information art projects. It consists of three interconnected core components: asemi-structured graph database, a scene graph / 3D renderer, and a timing graph. The data graphallows developers to model their information ontologically as a set of entities linked together bysemantic relationships. The scene graph lets developers efficiently visualize information using a3-dimensional coordinate system. The timing graph allows users to define dynamic behavior forgraphical and data objects to simplify the sequencing of animations and the scheduling of dataprocessing operations. Additionally, the framework provides various mechanisms to handle thecoordination between these components. A variety of utilities are included to manage common ren-dering, navigation, I/O, deployment, input, and data analysis tasks. Behaviorism is an open sourceproject built in the Java programming language on top of the Java bindings for OpenGL (JOGL2).This thesis describes the behaviorism framework in detail and provides examples of projects thatwere creating using it.
iii
Contents
Abstract iii
1 Introduction 11.1 Problem Statement . . . . . . . . . . . . . . . . . . . . . . . . . . . . . . . . . . . . . 11.2 Relevance of the Research . . . . . . . . . . . . . . . . . . . . . . . . . . . . . . . . . 4
2 Literature Review 82.1 Overview of Graph Databases . . . . . . . . . . . . . . . . . . . . . . . . . . . . . . . 82.2 Overview of Scheduling Mechanisms . . . . . . . . . . . . . . . . . . . . . . . . . . . 112.3 Overview of Graphics Frameworks . . . . . . . . . . . . . . . . . . . . . . . . . . . . 13
2.3.1 Scene Graphs . . . . . . . . . . . . . . . . . . . . . . . . . . . . . . . . . . . . 132.3.2 Art Frameworks . . . . . . . . . . . . . . . . . . . . . . . . . . . . . . . . . . 142.3.3 Information Visualization Frameworks . . . . . . . . . . . . . . . . . . . . . . 15
2.4 Relevance to Behaviorism . . . . . . . . . . . . . . . . . . . . . . . . . . . . . . . . . 16
3 Overview of the Framework 183.1 Graphics components . . . . . . . . . . . . . . . . . . . . . . . . . . . . . . . . . . . . 18
3.1.1 The Scene Graph . . . . . . . . . . . . . . . . . . . . . . . . . . . . . . . . . . 183.1.2 Rendering Layers . . . . . . . . . . . . . . . . . . . . . . . . . . . . . . . . . . 193.1.3 Texture Manager . . . . . . . . . . . . . . . . . . . . . . . . . . . . . . . . . . 193.1.4 Shader Pipeline . . . . . . . . . . . . . . . . . . . . . . . . . . . . . . . . . . . 203.1.5 Font Manager . . . . . . . . . . . . . . . . . . . . . . . . . . . . . . . . . . . . 203.1.6 Cameras . . . . . . . . . . . . . . . . . . . . . . . . . . . . . . . . . . . . . . . 21
3.2 Data components . . . . . . . . . . . . . . . . . . . . . . . . . . . . . . . . . . . . . . 213.2.1 The Data Graph . . . . . . . . . . . . . . . . . . . . . . . . . . . . . . . . . . 213.2.2 Database Managers . . . . . . . . . . . . . . . . . . . . . . . . . . . . . . . . 213.2.3 Web Services . . . . . . . . . . . . . . . . . . . . . . . . . . . . . . . . . . . . 22
3.3 Scheduling components . . . . . . . . . . . . . . . . . . . . . . . . . . . . . . . . . . 223.3.1 The Timing Graph . . . . . . . . . . . . . . . . . . . . . . . . . . . . . . . . . 22
3.4 Input components . . . . . . . . . . . . . . . . . . . . . . . . . . . . . . . . . . . . . 233.4.1 Keyboard Handler . . . . . . . . . . . . . . . . . . . . . . . . . . . . . . . . . 233.4.2 Mouse Handler . . . . . . . . . . . . . . . . . . . . . . . . . . . . . . . . . . . 24
3.5 The Rendering Loop . . . . . . . . . . . . . . . . . . . . . . . . . . . . . . . . . . . . 253.6 Other Components . . . . . . . . . . . . . . . . . . . . . . . . . . . . . . . . . . . . . 25
3.6.1 Utilities . . . . . . . . . . . . . . . . . . . . . . . . . . . . . . . . . . . . . . . 263.6.2 Delivery Methods . . . . . . . . . . . . . . . . . . . . . . . . . . . . . . . . . . 27
iv
3.6.3 Resource Managers . . . . . . . . . . . . . . . . . . . . . . . . . . . . . . . . . 273.6.4 Debugging and Tracing . . . . . . . . . . . . . . . . . . . . . . . . . . . . . . 283.6.5 Garbage Collection . . . . . . . . . . . . . . . . . . . . . . . . . . . . . . . . . 28
4 Core Components 304.1 Geometry . . . . . . . . . . . . . . . . . . . . . . . . . . . . . . . . . . . . . . . . . . 30
4.1.1 Properties of Geoms . . . . . . . . . . . . . . . . . . . . . . . . . . . . . . . . 304.1.2 Types of Geoms . . . . . . . . . . . . . . . . . . . . . . . . . . . . . . . . . . 33
4.2 Data . . . . . . . . . . . . . . . . . . . . . . . . . . . . . . . . . . . . . . . . . . . . . 354.2.1 Properties of Data . . . . . . . . . . . . . . . . . . . . . . . . . . . . . . . . . 364.2.2 Properties of the Data Graph . . . . . . . . . . . . . . . . . . . . . . . . . . . 364.2.3 Types of Data Elements . . . . . . . . . . . . . . . . . . . . . . . . . . . . . . 38
4.3 Behaviors . . . . . . . . . . . . . . . . . . . . . . . . . . . . . . . . . . . . . . . . . . 404.3.1 Properties of Behaviors . . . . . . . . . . . . . . . . . . . . . . . . . . . . . . 414.3.2 Types of Behaviors . . . . . . . . . . . . . . . . . . . . . . . . . . . . . . . . . 424.3.3 Behavior Interfaces . . . . . . . . . . . . . . . . . . . . . . . . . . . . . . . . . 43
5 Example Usage 465.1 Simple Code Examples . . . . . . . . . . . . . . . . . . . . . . . . . . . . . . . . . . . 46
5.1.1 Loading an Image . . . . . . . . . . . . . . . . . . . . . . . . . . . . . . . . . 465.1.2 Loading Data . . . . . . . . . . . . . . . . . . . . . . . . . . . . . . . . . . . . 475.1.3 Creating a Behavior . . . . . . . . . . . . . . . . . . . . . . . . . . . . . . . . 48
5.2 Project Examples . . . . . . . . . . . . . . . . . . . . . . . . . . . . . . . . . . . . . . 485.2.1 Cell Tango . . . . . . . . . . . . . . . . . . . . . . . . . . . . . . . . . . . . . 485.2.2 Coil Maps . . . . . . . . . . . . . . . . . . . . . . . . . . . . . . . . . . . . . . 50
6 Conclusion 51
References 56
v
1 Introduction
This thesis introduces behaviorism, a cross-platform programming framework for developing real-time information visualization and information art projects.
1.1 Problem StatementCreating real-time dynamic data visualization projects commonly requires developing a series ofstrategies to handle tasks involving, among other things, the processing of the data, renderingrepresentations of the data, and user interaction with these representations. Dynamic data is datathat is able to update itself, either as the result of user interaction or because it is mapped toinputs which indicate a changed stated. Additional tasks that need to be handled when usingdynamic data include synchronizing updates to the data and handling the resulting changes tovisual representations following the updates. Animation is a natural way to represent changes indata and ways to manage the animation of data, or to use animation patterns to represent data,become another task the developer must consider.
Alongside these tasks, visualization projects often involve some type of data analytics involvingthe transformation of raw data into a higher level structuring of that data which potentially providesnew meaningful information to the viewer. That is, in addition to managing changing sets of rawdata, the developer may need to create or import tools which are able to perform transformativeanalyses on these sets of data.
Another way in which data can be considered dynamic is that its relationships to other datachanges. The ontological organization of semantic data– data that is contextualized by its rela-tionships to other data– can also change depending on various factors, for example in response tothe results of data analytic processes. In general, there is a range of dynamism in data from beingcompletely static to fully dynamic. Static data is predictable, unchanging, while dynamic data isunpredictable, and constantly in flux. Fully dynamic data can introduce new information and infact generate new types of information.
This thesis explores the nature of these issues and introduces a framework which providesapproaches to address them. This framework includes an embedded graph database and a flexiblescheduling and sequencing mechanism that handles synchronized updates to data and also the
1
animation of graphical objects. These components make it easier for developers to build effectivestrategies to handle information visualization tasks.
The nature of data changes with every project. Its definition depends on the context it is placedin. An item of data is generally thought of as the lowest "atom" of information that we want torepresent visually or let users interact with. As such, data is stored in various forms. Large localsets of data are generally stored in database tables and accessed over a dedicated port via a specialquery language. Remote databases might be accessed via a web services API that returns XMLstreams or JSON data objects. Smaller amounts of data can be stored directly in the file system,or even as a single text file. One of the goals of a visualization is to make it easy for users to seepatterns in data, to combine pieces of discrete data from different sources into something whichis meaningful to reason with and apply. There is no uniform way in which to combine data, andthe creation of combinations of data from various sources and connections between data elementsin effect creates new data, which itself can be potentially combined to create new meaning. Dataprovides meaning by being building blocks for higher-level, more assimilable data. Meaning is alsocreated by imposing connections or relationships between data. It is not the goal of this thesis toexhaustively analyze the pragmatic functionality and philosophical ramifications of data. However,it is important to note that this type of engagement with what the data is for any particular projectis not always a straightforward process, and an information visualization framework should dealwith this issue by not only providing tools (such as XML parsers or hooks to different databases)but also with a flexible conceptual framework for modeling data in any form.
Because of the many forms data can take and the multitude of ways in which it can be repre-sented, information visualization frameworks need to have a versatile graphical rendering system.Moreover, because of the potential to have large amounts of data visualized simultaneously it isimportant for the framework to take advantage of the hardware acceleration provided by a low levelgraphics APIs, such as OpenGL, which uses the dedicated graphics card to render visual elementsto the screen at high frame rates. It may also be necessary to have the option to insert customshaders into the rendering pipeline so that specialized techniques for rendering expensive effects arepossible without slowing down the speed of the rendering.
Certain graphical elements, such as text, lighting, textures, video, and meshes are common fora wide variety of projects. Simplifying the management and rendering of these objects is necessaryfor the rapid development of visualization ideas. At the same time, there are innumerable possibleuses of these elements, and frameworks need to be extensible so that strategies for handling newuses are easy to design. Furthermore, in part because of the potentially dynamic nature of thedata, animation is an integral part of many visualization projects. While animations are often usedas transition effects as views change or as data is added or removed from the visualization, theycan also be used as a representation tool itself. Having simple and robust ways to manage theanimation of data should be an important part of an information visualization framework.
2
Data visualization generally requires some way to interact with the data. Interaction is tradi-tionally done via the keyboard and the mouse. However, different visualization projects may requiredifferent inputs. While it is not possible to provide support for every conceivable type of input, adedicated interface that lets developers map various controllers onto common functions simplifiesthe creation of projects that use unusual interaction devices. While some form of interaction is themost widely practiced way to navigate data, many visualization projects do not wait passively forusers but rather automate various iterations of various views or various subsets of the data. Or theproject requires a combination of user interaction and automatic iterations of data presentation.Furthermore, because the integration of data and visualization needs to be constantly synchronized,the scheduling logic needs to make changes in a concurrent fashion so that underlying data struc-tures are safely modified while being rendered or traversed. Because of the potential for the visualrepresentation to be changed (either automatically or through some type of user interaction) thesystem needs to be able to render changes as quickly as possible, ideally in real-time, or at least insuch a way that the processing of the changes does not cause any noticeable slowness in renderingor responsiveness to user interaction.
While frameworks do exist which mitigate some of these issues, there are some common elementsmissing from most of them. Information visualization as a field tends to focus on visual represen-tation and interaction techniques. Naturally, software development frameworks for informationvisualization in general also reproduce this tendency. As data mining and data analysis techniquesbecome more important as ways in which to filter large data sets into something small enoughto visualize meaningfully and reason about, there is a need to make these techniques available todevelopers when working with data. Representations of data in information visualization frame-works are generally conceived of as unchanging. Even if the data is updated, that change is notconsidered to be an integral part of the data. That is, there is no notion of the data as a dynamicsystem. In many projects interaction with the visual representation of the data updates the viewof the data (by providing more detail, or presenting more or different information on the screen).Less common are systems which let the user create new data by doing such things as annotatingthe data, retrieving new data based on user selection, or synthesizing new information resultingfrom the filtering and analyzing of the data. Interaction with different views of the data create afeedback loop. Information can be both viewed and analyzed and those viewings and analyses inturn create new information which can be then also be visualized and analyzed.
Moreover, if the data is dynamic, it makes sense that the visual representation of the datawould be dynamic as well. Although some frameworks provide animated layout effects, most donot provide full control over the scheduling of graphical animations, as do many authoring softwarepackages (such as Autodesk’s Maya or Adobe’s AfterEffects) and RIA programming languages (suchas Adobe’s Flash or Sun Microsystem’s JavaFX ) via a "timeline" component. Timelines are generallyused to demarcate steps in visual animations. But sequencing updates to the data itself or to
3
analyses of the data may also be necessary. Furthermore, user interaction, layout relationships, andresults of changes in the data can all impact the scheduling. And so timelines themselves need toamenable to dynamic updates from various sources.
Many information visualization platforms center around a toolkit that provides different layoutsfor data presentation. While this offers a certain simplicity when using these platforms, it can hinderdevelopers if they want to create new visualizations. While many system do allow developers toextend the toolkit, the way they are organized sometimes makes it more difficult than necessaryto do so. On the other hand, frameworks that are designed to be very flexible, such as art oraudio-visual frameworks, or game engines generally operate at a lower level and do not have builtin abstractions which make it easy to create new data-centric visualizations without starting fromscratch or importing and integrating outside software packages or libraries.
Another way to think about this range of issues is to define some of the possible requirementsof an ideal information visualization framework. It should: have a highly flexible representation ofdata so that any type of data can be modelled easily; make it easy to both visually represent dataas well as to mine the data and analyze the data; make it easy to dynamically create new data,both by importing it from database tables, flat files, XML streams, et cetera, and also from withinthe project itself as the result of user interaction or the results of data mining and analysis; beeasy to use both when creating simple representations and also when designing new representationsof data; make it easy to make projects that are functional and aesthetic. In short, there remainsa need for further approaches to information visualization and information art. In particular, forframeworks that give developers greater control of the data and that provide robust mechanismsfor scheduling and sequencing visualizations.
1.2 Relevance of the ResearchThe relevance of the research discussed in this thesis is two-fold. First, and more practically, itintroduces an integrated framework for creating dynamic information graphics pieces in both anarts and visualization context. Second, the research explores some of the opportunities that areavailable using an integrated scheduling and sequencing engine to manipulate graphics and data.
The behaviorism framework attempts to address the issues stated in the previous section, andattempts to create programming structures which allow a developer to achieve the goals of an idealframework. By introducing a framework that conflates the modeling, representation, and analysisof data, developers can explore a richer set of options for thinking about the ways in which data canbe visualized and made sense of. While it is out of the scope of this thesis to create a completelyfinished information visualization package, it nonetheless describes a highly extensible softwareframework which facilitates these goals.
In particular, the thesis presents an information visualization framework where data possessescertain kinds of behaviors. These include such things as updates to the data based on changes in
4
time or user interaction, and having scheduled analyses of parts of the data add or sever relationshipsbetween connected data, or strengthen or weaken the existing connections. For instance, certaindata might be dependent on time, and remove themselves from the system after a specified amount oftime had passed. Repeated user interaction with data could cause the system to query remote datarepositories for similar information. Scheduled agents could be set up to sample randomly selectedchunks of data and return analyses of those samples. Yet other agents could be scheduled to analyzethe efficacy of the sampling agents and increase or decrease the rate of sampling accordingly. Logiccould be attached to particular data that causes the data to update itself based on changes to datait is linked to. In short, a host of scheduled or user-initiated operations could cause the local datastore to change both its contents and the semantic relationships between various elements of thedata store.
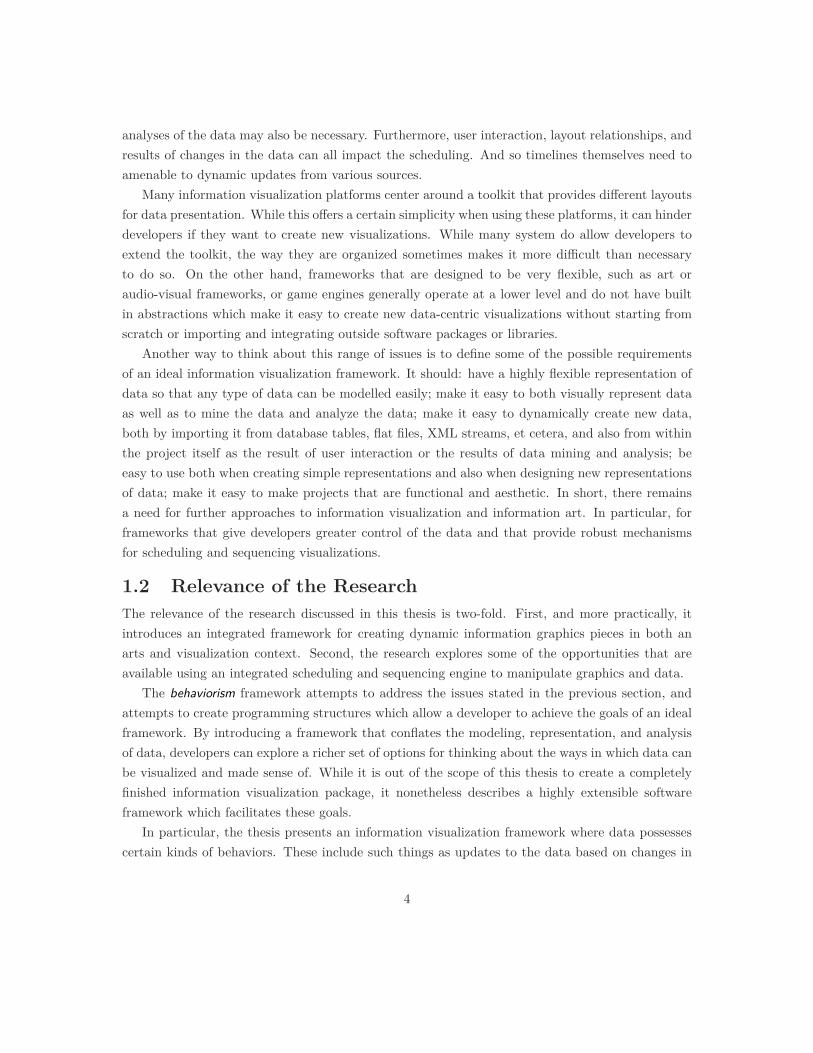
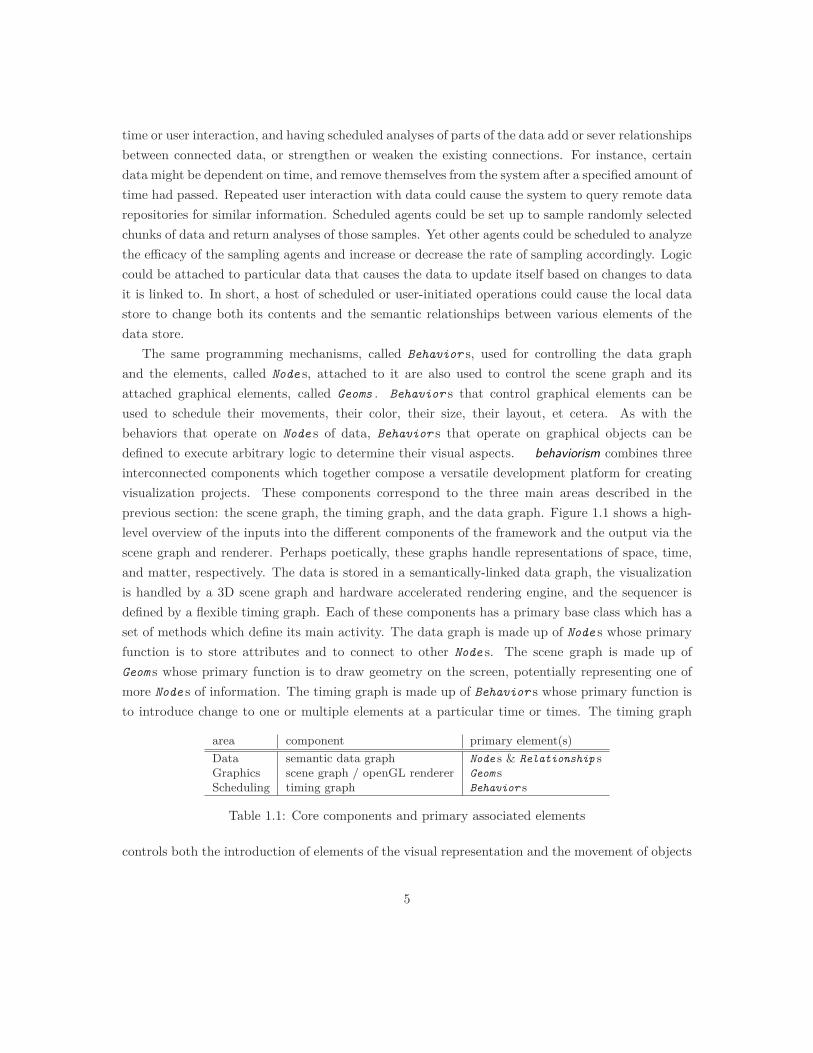
The same programming mechanisms, called Behavior s, used for controlling the data graphand the elements, called Node s, attached to it are also used to control the scene graph and itsattached graphical elements, called Geoms . Behavior s that control graphical elements can beused to schedule their movements, their color, their size, their layout, et cetera. As with thebehaviors that operate on Node s of data, Behavior s that operate on graphical objects can bedefined to execute arbitrary logic to determine their visual aspects. behaviorism combines threeinterconnected components which together compose a versatile development platform for creatingvisualization projects. These components correspond to the three main areas described in theprevious section: the scene graph, the timing graph, and the data graph. Figure 1.1 shows a high-level overview of the inputs into the different components of the framework and the output via thescene graph and renderer. Perhaps poetically, these graphs handle representations of space, time,and matter, respectively. The data is stored in a semantically-linked data graph, the visualizationis handled by a 3D scene graph and hardware accelerated rendering engine, and the sequencer isdefined by a flexible timing graph. Each of these components has a primary base class which has aset of methods which define its main activity. The data graph is made up of Node s whose primaryfunction is to store attributes and to connect to other Node s. The scene graph is made up ofGeom s whose primary function is to draw geometry on the screen, potentially representing one ofmore Node s of information. The timing graph is made up of Behavior s whose primary function isto introduce change to one or multiple elements at a particular time or times. The timing graph
area component primary element(s)Data semantic data graph Node s & Relationship sGraphics scene graph / openGL renderer Geom sScheduling timing graph Behavior s
Table 1.1: Core components and primary associated elements
controls both the introduction of elements of the visual representation and the movement of objects
5
external
data
input devices
screen
output
timing graph
scene graph / renderer
data parser / data graph
input manager
external reality
software reality
time
webservicesfile I/O
databasesetc
mouse, keyboard, wii, audio inputs, sensors, etc
Figure 1.1: Overview of inputs and output to the behaviorism framework
within the visual representation, and it also handles the scheduling of data gathering and dataanalysis. Moreover, the same timing mechanisms control other elements on the timing graph itself.This lets us build complex sequencing logics, or behaviors, out of a composition of various piecesof data, visual elements, and other behaviors.
The following chapters detail the various elements of this framework. Chapter 2 exploresvarious concepts of information visualization related to data, scheduling, and rendering, andexamines existing frameworks that are similar in scope to aspects of this project. Chapter 3 givesan overview of the elements of the behaviorism framework. Chapter 4 looks in detail at the datagraph, the scene graph, and the timing graph– the three core components of the framework. AndChapter 5 provides examples of projects that have been built using this framework, in particularfocusing on how they made use of the core components. Finally, Chapter 6 discusses possiblefuture directions of the behaviorism framework.
6

7
2 Literature Review
behaviorism draws from many concepts introduced in the literature of computer graphics, semanticdatabases, and information visualization, and shares many common features of existing frameworksand projects. This chapter reviews these features as they relate to the design and architectureof behaviorism. This review is not meant to be exhaustive, but rather a cursory sampling whichhighlights prevalent aspects of these various related projects and frameworks.
2.1 Overview of Graph DatabasesThe idea of storing data in a connected graph has existed since at least the 3rd century when thephilosopher Porphyry used a tree to categorize Aristotelian "concepts of substance". Gottlob Fregeand Charles Pierce designed different versions of labelled networks in the creation of first-orderlogic in the late 19th century [50]. Beginning in the 1950s semantic networks began to be usedto describe linguistic structure and knowledge representations. For example, the linguist CharlesFillmore’s 1968 article "The Case for Case" describes converting linguistic representations into"objects which resemble dependency diagrams and tagmemic formulas" [17]. And a text edited byMarvin Minsky in 1968 examines various early approaches to information processing using semanticrepresentations [39]. In particular, an article in that book, "Semantic Memory", by M. Ross Quillian,discusses models of linguistic meaning and storage, examining "representational formats" of "themeanings of words":
[A] word’s full concept is defined in the memory model to be all the nodes that canbe reached by an exhaustive tracing process, originating at its initial, patriarchicaltype node, together with the total sum of relationships among these nodes specified by[...various kinds of] links [46].
By the 1970s, researchers were inventing practical systems for storing semantic networks indatabases. For example, J. Abrial’s paper "Data Semantics" describes "specifications" for storingand interacting with interconnected data containing elementary facts, simple and elaborate rules,and rules which create facts. He presents the semantic database as "the model of an evolving physicalworld", where the definition of an object in the model is "given by the connections it has with otherobjects" [2]. Peter Pin-Shan Chen described a database of interconnected "tuples" in a paper intro-
8
ducing the Entity-Relationship Model as a way to unify relational and network databases [8]. Anda paper by Roussopoulos and Mylopoulos, "Using Semantic Networks for Data Base Management",explores relational schemas for mapping various semantic concepts into a database structure. Inparticular, they define a set of node types that can be used to describe various knowledge domains:
The semantic net is a labelled directed graph where both nodes and edges may belabelled. The labels of nodes will only be used for reference purposes and will usuallybe mnemonic names. The labels of edges, on the other hand, will have a number ofassociated semantic properties and inferences. There are four types of nodes: concepts,events, characteristics and value-nodes which are used to represent ideas making up theknowledge related to a particular data base [48].
The recognition that the meaning for particular domains can be modeled by a small set of nodesand relationships between those nodes has led more recently to computer languages which facilitatethe organization of these models. For instance, OWL (the Web Ontology Language) is an extensiblelanguage that can be used to define ontologies that can encode domain knowledge. The possibility ofstructuring internet resources using a dedicated tagging structure is an ongoing goal of the semanticweb:
The Semantic Web is a vision for the future of the Web in which information is givenexplicit meaning, making it easier for machines to automatically process and integrateinformation available on the Web. [. . . ]Ontologies figure prominently in the emergingSemantic Web as a way of representing the semantics of documents and enabling thesemantics to be used by web applications and intelligent agents. Ontologies can provevery useful for a community as a way of structuring and defining the meaning of themetadata terms that are currently being collected and standardized. Using ontologies,tomorrow’s applications can be "intelligent," in the sense that they can more accuratelywork at the human conceptual level [29].
While the transformation of the internet into a set of interconnected semantically-tagged knowl-edge domains remains incomplete, many smaller scale experiments have been designed which useontological frameworks to organize data into a structure which is geared toward various kinds ofanalysis. Moreover, since many kinds of data do not lend itself to simple relational categorization,for example, social-networks or other types of connected heterogeneous information, semantically-tagged graphs which describe the nodes and their relationships are often more accurate ways oforganizing data that would otherwise be segregated into simplified categories. This type of data iscalled "semi-structured". It is not completely unstructured, like raw text or pixels of video data,but it is too complex do be defined using a few monolithic database tables. Especially in caseswhere the data is evolving, it is not possible to predict an appropriate structuring of the data, sothe structure is in a sense defined by (potentially ad-hoc) relationships between data. Much of therecent literature on semi-structured graph databases examines methods of data mining and patternrecognition using graph theoretic techniques. For instance, a paper from 1994 describes a query
9
language called GraphDB which provides a system for traversing data organized in a graph [27]. Ahost of papers and book chapters also explore the efficacy of data mining via graph databases. Forexample, Washio and Motoda survey different approaches to data mining graphs in a 2003 paper[62]. And Cook and Holder’s 2006 book "Mining Graph Data" includes chapters on both miningalgorithms and visualization techniques [10].
More practically, as many programming blogs have noted, graph databases are closer in natureto the dominant object-oriented paradigm of the most popular programming languages, allowingdevelopers to have a more seamless relationship with the data they need to access [44, 63, 64].By incorporating a graph database developers do not need necessarily to use a separate querylanguage, thus speeding up the development of projects. On the other hand, even the more full-featured graph databases that include their own query languages are sometimes simpler to use thatthan traditional Relational Database Management Systems (RDBMS). While popular frameworkssuch as Hibernate and packages within JavaEE provide more convenient strategies to interact withtraditional RDBMS, a number of systems have been created that incorporate effective methods tomake graph databases as robust and efficient RDMBS in certain scenarios. A survey of populargraph databases finds that they highlight a number of elements such as the ability to model semi-structured data effectively, to be used as a tool for analysis, and provide simpler interfaces fordata traversal. For instance, the databases Jena, Sesame, and AllegroGraph are all RDF (ResourceDescription Framework) graph databases which store information in "triples", as a "subject" node, an"object" node and a "predicate" link that defines a relationship between the nodes. RDF is a subsetof the OWL language which provides a system for representing information on the Web [31]. Thedatabase can be queried with a specialized query language (such as RQL or SPARQL) which allowsdetailed and expressive SQL-like searches to be performed against the data. A recent examinationof the performance of Allegro [22], Jena [36] and Sesame [4] (and other similar graph databases)against large semi-structured data sets was described more or less favorably when executing semanticqueries [47]. In addition to basic storage and querying functionality, these databases also provideadditional tools for working with data. For instance, AllegroGraph includes tools to analyze socialnetworks and support for geospatial data [22]. Additionally, it includes a "reasoner" language whichallows queries to return inferences about the stored data when explicit relationship connection areabsent. A "Web 3.0" example which organizes social events using geographical and temporal dataand social network analysis using this reasoner is described in a recent article by the CEO of thecompany that created AllegroGraph [1].
While the previous examples all are full-featured replacements for traditional databases, anothergraph database, called JUNG (an acronym for the Java Universal Network/Graph Framework)focuses on providing a library of extensible graph analysis tools. In addition to providing graphlayout algorithms and a rich set of network analysis tools, it also has some support for visualizationand interactivity [43]. Yet another graph database, Neo4J, is a more lightweight graph database
10
that emphasizes the ease of use of traversing the data. The core library is small and provides thebasic implementation of the graph database while aiming to be as fast as powerful as enterprise-strength databases. Additional libraries are available which provide, for example, a set of networkanalysis algorithms and tools for transforming ontologies specified by the OWL language into theNeo4j database. As with the other graph databases, data is stored in vertices (called "nodes") whichare connected together by labelled edges (called "relationships"). The database is programmaticallyqueried using "traversers" which decide which paths to investigate and "evaluators" which determinewhich nodes to return. Additionally, the Neo4j database is fully transactional and will indicate ifthe relevant portion of the graph has changed in the middle of being queried. Neo4j does notinclude any visualization components, though the simplicity of its structure would make it easy touse within external network visualization packages [15].
2.2 Overview of Scheduling MechanismsTiming consists of the related events of scheduling– when events happen– and sequencing– in whatorder the events happen. Issues include how to handle events that happen simultaneously andhow to minimize the need for explicit instructions for changes over time. Since the rendering ofgraphics needs to occur as fast as possible, all other tasks need to take place in such a way thatthey do not interrupt or slow the rendering process. For instance, the mouse listener and keyboardlistener generally run in a separate thread from the thread containing the active graphics context.Similarly, calls to external databases, file I/O, and many other processes may take too long, andare also given their own thread to run in which has a lower priority than the rendering thread.However the results of user interaction and data retrieval will need to be available to the otherthreads in a predictable way, and synchronizing access to shared data structures can be a trickyaspect of handling the scheduling of these various tasks. Most high-level languages have commandsor methods to spawn new threads as well as libraries which include concurrent data structureswhich can be safely accessed and updated by more than one thread. For instance, Java 6 includesa concurrent utility package. In that package, scheduled tasks are defined within objects calledExecutors. Various locks, automatically synchronized data structures, thread pools, et cetera, areprovided to manage asynchronous behavior on different threads [55, 25].
Another, higher-level, type of scheduling mechanism involves changing one or more attributesfrom some starting value to an ending value over a specified period of time. In 1971, in order tosimplify the continuous change over time, Burtnyk and Weil introduced the concept of interpolat-ing between two "key frames", which indicate the starting and ending values [7]. Originally used inanimation projects, it was popularized in the Flash scripting language which introduced "tweening"functions to create transition effects and which could be used to "morph" between shapes at startingand ending points. The Flash authoring program, like many other animation frameworks, includesa "timeline" component for setting up the timing of particular events related to animation. Other
11
programming languages dealing in large part with graphics also include similar mechanisms. Forinstance, Alice is an authoring tool and programming environment for developing interactive 3Dscenes that includes simple methods for handling animation. It is geared toward novice program-mers and emphasizes rapid development of content over low-level control of implementation detailsrequiring specialized technical knowledge.
The central thesis of this work is that 3D interactive graphics programming does notneed to be as hard to learn as it is today. It seems clear to many observers in the fieldthat in order to control the behavior of 3D graphical objects, a person needs to possesssophisticated mathematical skills (e.g. vector and matrix algebra, trigonometry) andthat this requirement represents an impenetrable barrier to all but the most technicallyinclined people [9].
In order to find the most effective tools for beginning developers the creators of Alice examineddifferent ways to describe the various components of an interactive 3D environment. In particular,they describe the rationales for designing their scheduler. Each unit in the scheduler is called an"animation", as it schedules only visual updates. Each animation describes a simple operationsuch as scaling or translating which takes place over a set period of time. A simple interpolatingfunction can be attached to an animation to adjust the rate at different points during the animation.Animations can be composed together and then sequenced in order using nestable "DoTogether"and "DoInOrder" commands. The designers of Alice explicitly advocate a single-threaded model toavoid synchronization issues that may arise in compound animations [9]. Although the calculationsrequired for visual updates most likely take place very quickly, using a single-threaded model tocontol a large number of animations could potentially slow down the frame rate of the visualization.Similarly, using this scheduling mechanism for other types of operations (control operations or datagathering operations) could be problematic for the same reason.
Other languages extend the notion of timelines beyond animation. For instance, the lead de-veloper of JavaFX , Chris Oliver, describes how the concept of interpolation and animation can beadapted to non-visual aspects:
[Any] variable may be "animated" - not just those that represent properties of actualvisual elements. Animating a variable amounts to assigning a new value to it "oftenenough" to create the perception of continuous change. For smooth animation of graph-ics "often enough" means at the refresh rate of your display. [. . . The programmer]specifies only the "key" states of a variable at various points along the time dimen-sion, and provides an interpolation function to automatically compute the "in-between"states. [42].
JavaFX includes an animation API built using Timeline and Transition objects. A Timeline
processes its attached KeyFrame s at the appropriate time, executing any action associated withthe KeyFrame . A set of Transition s are built using the Timeline to handle two-dimensional
12
transformations such as rotations and translations. As in Alice (and many other frameworks)Transition s can be defined to run in parallel or sequentially. It is possible to control the Timeline
itself either by using the KeyFrame actions or by specifying a binding of a Timeline control variableto another dynamic variable. The JavaFX 1.2 API documentation also describes the "async" packageto handle tasks that need to run in different threads. Although the JavaFX language is aimed at"Rich Internet Application" developers, it also includes some built in data processing and simplecharts for basic information visualization tasks [56].
2.3 Overview of Graphics FrameworksGraphics frameworks exist for a wide variety of visualization tasks such as graphic design, broadcastor motion graphics, game development, and animation. As a framework for real-time informationvisualization and information art projects, behaviorism includes a 3D scene graph and renderingengine and incorporates elements of art and information visualization frameworks.
2.3.1 Scene GraphsScene graphs have been widely used since at least 1993 when Silicon Graphics released IRIS In-ventor, an graphics engine which used an object-oriented architecture to encapsulate lower-levelgraphics commands [54]. Paul Strauss’ paper outlining IRIS Inventor (later OpenInventor, andthen OpenSceneGraph) included a description of a 3D scene as tree of nodes.
[A] scene is stored as a directed acyclic graph of objects called nodes. Node classes canbe divided into three basic categories: shapes, which represent geometric objects, suchas cubes and spheres; properties, which are attributes of shapes, such as their surfacematerials and drawing styles; and groups, which have children and are used to collectnodes into hierarchies [54].
These hierarchies are used as a way to specify particular transformations or state changes for anumber of objects within a group simultaneously. That is, for instance, instead of repeating atransformation for each unique object in a scene individually, operating upon a common parentof those objects will cause the single transformation to effect its children in the same way. Otheroperations, such as state changes can similarly be used to avoid making extraneous function calls.The scene graph in behaviorism was based in part on David Eberly’s account of designing a 3Dgame engine in which he analyzes the pros and cons of various architectures of rendering systemsand scene graphs in particular [13].
OpenSceneGraph is a widely used scene graph that is developed in C++ and supports featuressuch as view-frustum culling, occlusion culling, small feature culling, Level Of Detail (LOD) nodes,OpenGL state sorting, vertex arrays, and vertex buffer objects. Additionally it provides modules(called "NodeKits") for handling a diverse set of tools such as particle systems, shadows, terrainrendering, rigid body animation, and volume rendering. Bindings for OpenSceneGraph are provided
13
for the Java, Python, and Lua languages [6]. Xith3D is an open source scene graph that replicatesmany of the above features. It is written in Java and thus interacts more easily with the standardJava libraries, including the Swing and AWT user interface libraries. It supports both of the popularJava bindings to OpenGL, JOGL and LWJGL [67]. Another graphics library called VisualizationLibrary is actually not a scene graph per se, but rather a fairly low-level wrapper for basic openGLfunctionality coupled with a set of tools for common visualization techniques, such as shader bindingand volume rendering. The main developer specifically criticizes scene graphs as being an overlysimplistic way to represent graphical objects in a scene:
[Visualization Library] promotes the notion of data structure separation and specializa-tion. Put in simple words, while a uber-scene-graph 3D engine uses a single, overloadeddata structure (usually a DAG) to represent transforms, spatial/visibility relationships,material properties etc, Visualization Library separates these concepts, utilizing for eachof them an optimal domain-specific data structure (possibly referencing each other).This intuitive approach not only provides superior performances but allows you to cus-tomize and extend each aspect independently from all the others [3].
While the behaviorism rendering system does not provide a full range of "domain-specific" datastructures, it does separate the use of a scene graph to represent transformations from the actualrendering process.
2.3.2 Art FrameworksWhile scene graph (or similar) systems are necessary for creating scenes with lots of objects andhigh frame rates, they introduce a complexity that may not be necessary for simpler projects.Frameworks that are intended to help developers create digital artworks generally provide simplewrappers for common components needed to visualize and interact with their projects. A commontrend in art frameworks is to provide a visual programming environment to obviate the need forprogramming altogether. For instance, PD/Gem [45], Max/MSP/Jitter , [12] Field [59], and vvvv[60] all provide a visual programming interface where the user builds their project by stringingtogether boxes that represent functions or triggers. Other frameworks instead require program-ming knowledge, but simplify the process of programming by providing a unified library to handlevisualization and sonification. Processing is a popular framework for creating animated sketchesquickly without requiring an extensive knowledge of programming. It has a very active communityof users and developers. In addition to built-in libraries for graphics, sound, video, many otherlibraries are available for such things as computer vision, reading xml data, webservice, and physicssimulations. While Processing was initially designed in part to create information visualizationprojects [23] it includes minimal support for information visualization tools, focusing instead onmaking it easy to create graphics and to import library modules that automate or simplify some ofthis functionality. OpenFrameworks is a C++ development framework quite similar to Processing
14
in scope. One significant difference is that it doesn’t include a programming environment. Thegraphics commands are very closely tied to openGL, which is the only renderer available [35].
2.3.3 Information Visualization FrameworksInformation visualization frameworks generally combine tools for both the modeling of and vi-sualization of data. These frameworks generally are framed by the concerns described by BenShneiderman in his early work on information visualization and human-computer interaction. Hedefines a common user interaction experience where the user is first presented with an overviewof a data set, then through some form of interaction the user can filter the view and "zoom" toa subset of the data, and finally has the opportunity to request more details about the subset ofdata [52]. Many of these frameworks present a set of layout algorithms that make it easy to createvarious types of views of the data, such as tree maps and network visualizations. More recent papersdescribe different ways of conceptualizing about and interacting with information. For instance,Ben Fry’s Ph.D. thesis envisions a field called "Computational Information Design" which extendsthe traditional information visualization focus by merging together aspects from computer science,statistics, and graphic design. He outlines the necessary steps to create an effective visualizationproject as seven distinct verbs: "acquire, parse, filter, mine, represent, refine, interact." In particu-lar, he notes that many of these steps may loop backwards to previous steps for further acquisition,parsing, filtering, et cetera, through, for example, user interaction or due to results of a miningprocess [24].
Recent prototype frameworks explore new information visualization concepts which explicitlyconceive of a more dynamic relationship with models of data. A framework called Mondrian allowsdevelopers to create and "compose" scripts which transform raw data into visualization widgets[37]. Another framework, called HANNAH, examines the overlap of time-dependent processes withinformation visualization techniques. The authors of the framework explore effective ways to createwhat they term "process visualizations" which incorporate dynamic and temporal data, utilizinganimation effects and three dimensional graphics when necessary. The relationship of informationdisplayed in the process visualization is described by a "process ontology" which is built using anexternal tool [16]. A third prototype information visualization framework, called Aruvi , explicitlyaims to support the process of analytical reasoning. The authors conceive of information visualiza-tion as being split into two separate tasks, "foraging" and "sensemaking", which are used to positand judge hypotheses about the data. Central to their framework is a particular type of navigableinternal database that they term a "knowledge database" which is used to keep track of the accu-racy of the various sensemaking tasks, such as correlations between different data elements whichare visualized as a series of scatterplots [53]. Yet another approach to information visualization, aframework called GGobi , emphasizes the availability of a statistical toolkit which can be used toanalyze the data [58]. A 2004 paper featuring GGobi describes a graph layout plug-in which treat
15
nodes in a graph as multivariate data that can be analyzed using various statistical methods. Inparticular, they describe how the layout of the graph visualization directly results from an analysisof data (for example, using multi-dimensional scaling) so that the visualization mirrors the analy-sis. The paper also describes methods of visualizing and navigating data as a form of "exploratorystatistical data analysis" to evaluate if particular hypotheses might be statistically significant [57].
Although the examples above present intriguing directions for frameworks, they are either notavailable except as prototypes or for other reasons not widely used outside of specialty communitiesof researchers. Certain frameworks however are more commonly used for information visualizationprojects. For instance, Prefuse is a framework which emphasizes data modeling over graphicalrendering, with the idea that developers can use the data model to create their own user interfacesfor interacting with network visualizations. Graph and tree layout algorithms are part of the corePrefuse API. One of the goals of the Prefuse is to provide a set of tools which act upon and respondto changes in the data. The authors describe the toolkit’s "separation of concerns":
[P]refuse introduces abstractions for filtering source data into visualizable content, pro-viding both scalability and representational flexibility, and using composable actions toperform batch processing of this content, for example data transformation, layout, orcolor assignment. Programmers craft visualizations by stringing together actions intoexecutable chains that can then be run to manipulate visual data and perform animation[28].
That is, the visualizations are thought of as direct visual transformations of the data model. Theauthors specifically mention that they see their toolkit building upon the model-view-controlleruser interface paradigm [28]. In this paradigm, the view reflects the current state of the modeland visual changes and animations occur when the data is updated either by some automaticsensing process or in response to user interaction [5, 32]. Another popular framework, VisualizationToolkit, or VTK, is used primarily for visualizing a wide range of scientific data sets includingmedical data, astronomical data, and nanoscale data gathered from Atomic Force Microscopes.The original article introducing VTK describes it as aiming to be an object-oriented toolkit thatis modular, extensible, and easy to use. It includes a number of modules for tasks such as volumerendering, interfacing with various data formats, and image processing, as well as various modellingand computational geometry algorithms [49, 30].
2.4 Relevance to Behaviorismbehaviorism shares much in common with many aspects of the above frameworks. It aims to bean extensible cross-platform programming framework geared toward the creation of informationvisualization and data-centric digital art projects. The primary difference between behaviorism andexisting frameworks is the integration of the timing graph which allows for programmatic controlof both information and visual elements. Chapter 3 outlines the main packages of behaviorism, and
16

Chapter 4 details the timing graph and the integration between the timing graph and the scenegraph and data graph.
17
3 Overview of the Framework
behaviorism is organized around three interwoven areas each with an assocated component: theprocessing of data with the data graph; the rendering of graphics with the scene graph; and thescheduling of events with the timing graph. And associated with each of these areas are variousother aspects of the framework which facilitate using data, rendering graphics, and schedulingactions. Other important elements not directly related to the core components include garbagecollection, debugging methods, and delivery methods.
3.1 Graphics componentsThe behaviorism graphics component uses OpenGL to render visual elements to the screen. Inparticular it uses the Java OpenGL bindings (JOGL2) which is an open source project, originallydeveloped by Sun Microsystems and now continued by independent developers. In addition to fullsupport for OpenGL calls and the GLSL shading language, it includes helper classes for such thingsas integration with the Java2D library and the Swing user interface library which simplifies suchtasks as the handling of keyboard and mouse inputs.
3.1.1 The Scene GraphThe behaviorism scene graph is a lightweight scene graph similar in many ways to those described inChapter 2. All graphical objects, or Geoms , are stored in a tree which is traversed every time a newframe is rendered (typically the speed of the rendering loop is synchronized with the refresh rate ofthe screen). Any transformation applied to a parent node in the tree also affects its children. Unlikemany scene graphs, in behaviorism state changes are not applied during the scene graph traversal.Rather, these are applied within the rendering layers, described below.
The root node of the scene graph is always a special Geom , called the World which defines theglobal properties of the scene as a whole. The primary difference between the World and Geoms isthat the World node has an associated camera which is used to specify the projection matrix andan initial modelview transformation that is then propagated to all attached children nodes.
18
3.1.2 Rendering LayersOne of the initial goals in the earliest scene graphs was to limit the number of changes in stateinformation. Operations such as changing the light, turning blending on or off, and changingmaterial properties are all potentially slow as they may cause the graphics card to flush the renderingpipeline, forcing data to be resent or recalculated. Also, certain states are computationally expensiveso minimizing the time the graphics card is in an expensive state can speed up rendering [40].
In order to minimize both state changes and the time spent in computationally expensive states,behaviorism introduces RenderLayer s as a secondary and distinct component from the scene graph.The scene graph does not actually render anything, rather it decides whether the node is readyto be rendered (i.e., it is visible, within the view frustum, not occluded, et cetera) and whichrendering layer it belongs to. After the entire scene graph as been traversed, we iterate througheach RenderLayer . Each layer has the same state, and thus potentially expensive state calls willonly need to be made once for the entire set of Geoms associated with the layer. The developermust decide which RenderLayer to attach a Geom to. A Geom can only be attached to a singlelayer, but there is no limit in the number of layers that can be created. As an example, we coulddefine of a layer as a grouping of all objects that have a particular set of lighting. Since the state ofthe lights will not change, we only need to set the state once before rendering all of these objects,and then (if necessary) to set it back once they are all rendered. Another layer might describe adifferent set of lighting for another set of objects, and would define its own state change.
Although the RenderLayer s do not minimize all state changes automatically, by introducinga mechanism for the creation of custom layers a developer has the ability to design strategiesappropriate to the rendering issue at hand. In simple cases when the state does not change asingle default layer can be used for all Geoms . Additionally, RenderLayer s can be used as a sortingmechanism. In various instances, such as for proper blending effects, it is important to sort a setof objects from the object furthest from the camera to the closest. Other times the opposite istrue. For instance, if the graphics card has depth testing turned on then sorting from front to backwill reduce "overdraw" since occluded objects (which would be drawn after the object or objectsoccluding them) do not need to be rendered [40]. Another example where sorting might be usefulis in a 2D applications where objects on a plane are given a particular ordering to indicate which isdrawn topmost drawn when there is overlap. behaviorism includes a set of commonly used sortingalgorithms and provides an interface to create custom ones.
3.1.3 Texture ManagerA texture is a block of data representing an image or other information stored directly on thegraphics card. Textures, especially those holding images and video frames, can take up a substantialamount of memory, so it is necessary to manage how and when they are loaded and destroyed.Because textures are passed to the graphics card for optimized rendering, the normal Java garbage
19
collection does not apply, so special care needs to be taken to ensure that textures that are nolonger needed are properly disposed of. Additionally, a texture should be loaded only one time,and re-used if, for instance, it is applied to multiple Geoms .
The TextureManager serves a central switching agency to handle various types of Textures.Simple textures, like images, are loaded once. Dynamic textures, such as Video need to be updated24 times per second (depending on the encoding). Textures are also often used as data structuresor off-screen rendering buffers, especially when used in conjunction with shader programs. TheTextureManager stores all textures inside a hash-backed Set. Any addition or removal from thisSet happens at the beginning of the rendering loop. Following that, any necessary updates to thetexture elements in the Set may occur. At this point, they are available to be used by the Geoms
as the scene graph is traversed.This explicit split between the timing of the updating of the textures and the traversal of the
scene graph is necessary as the rendering loop is optimized to run in a single thread. The initialloading of texture data from disk or a remote server happens in a background thread, but theapplication of the data to an OpenGL texture occurs in the display loop when the OpenGL contextis active.
3.1.4 Shader Pipelinebehaviorism includes a simple wrapper for invoking GLSL shader programs and for binding data(via textures) onto the shaders. There are three types of shaders: vertex shader, fragment shaders,and geometry shaders. Vertex shaders process individual points and their associated data (colors,normals, and texture coordinates). Fragment shaders interpolate between these points and processthe individual pixels that are rendered to the display buffer. Geometry shaders have the abilityto generate a limited number of new points from the input vertices. Shaders are used for a widevariety of rendering techniques such as shadow mapping, volume rendering, and image processing[41]. Additionally, behaviorism provides support for chaining the shaders together using a techniqueknown as "ping-ponging" in which a fragment shader writes to an offscreen buffer instead of theactive display buffer. Two of these offscreen buffers can be set up where each take turns acting asthe input and output to an arbitrary number of shader programs. After the shader processing iscomplete, the final output offscreen buffer is rendered in the main display buffer. This techniquemakes use of FrameBufferObjects, a special extension to the OpenGL interface [11, 26].
3.1.5 Font ManagerThe JOGL bindings include a utility class which lets users load a font into a set of textures. Thesetextures can be placed in the scene as desired. The font manager allows you to load fonts in variousformats as needed. A font can be loaded at a specific size if the user knows exactly where it willbe placed. Or it can be loaded at a range of different sizes if the text will be positioned in various
20
places in the scene. Loading different sizes allows the text the be rendered differently at differentdistances from the camera, interpolating between the specified sizes as needed to ensure that thetext always looks sharp. Once a particular font size and style is loaded it is stored in a hash tableso that it can be retrieved quickly when it is needed again. Specific utility methods are availablefor determining the best font size for a particular region embedded in 3D space.
3.1.6 CamerasThe base World class has an associated camera attached to it which defines the projection matrixand the initial modelview matrix. All cameras have a common set of methods to change the fieldof view, the aspect ratio, and the near and far planes, or to change the projection matrix directly.Additionally, the camera can be moved or rotated as desired through a set of methods, or bysetting the modelview matrix directly. The movement of the camera can be also animated usingvarious Behavior s. By default, each World will utilize a default camera which has 6-degrees offreedom for zooming, panning, tilting functionality and which is controllable via keyboard andmouse inputs. Custom cameras can be created which extend or limit the range of motions of thecamera. For instance, one included camera, CamOrbit , will always point at and rotate around aspecified point, maintaining a specified distance from that point. Additional cameras can be createdwhich maintain a specific distance from a Geom so that when the Geom moves the camera movesalong with it. Another version of a camera uses quaternions to govern its motion which may usefulfor certain types of interpolation during a camera animation [40].
3.2 Data componentsbehaviorism provides extensible managers for handling external data and either using it directly ortransforming it into a node or set of nodes that can be attached to the data graph with definedrelationships and weights.
3.2.1 The Data GraphThe graph database lets developers create an ontology of interconnected data linked by specifiedrelationships. Data can be added manually into the graph or specific queries can be set up usingdatabase calls or webservices APIs to import the data at particular times. Once data is contextu-alized within the data graph it can be bound to a Geom so that a visual representation of it alwaysreflects it attributes. The data graph can be traversed and analyzed to collect or mine information.The data graph can continually change based on user input, elapsed time, external data queries, orthe results of scheduled analyses.
3.2.2 Database Managersbehaviorism bundles JDBC drivers to the common MySQL and PostGres databases. Additionally,some convenience methods have been provided which let developers create SQL queries quickly. No
21
attempt has been made to create a persistance model of a database– although a developer could ofcourse use a package to do so if needed. Rather, transformation methods are available which copythe data into memory where it can then be attached to the data graph.
3.2.3 Web Servicesbehaviorism includes wrappers to the public APIs for two common web services– the Flickr API andthe YouTube API– as examples of how to link webservices to the behaviorism data graph. TheseAPIs make it easy to search for images and videos, as well as to grab comments and folksonomictags from this media. Many other web service APIs exist, most of which return data in XMLor JSON format. These APIs are not currently included in behaviorism as many other librariesfacilitate the parsing of these formats. Developers can examine the Flickr and YouTube handlers asexamples when creating customt integrations between data from web services and the behaviorismframework. An external library called Flickrj [14] is used by behaviorism to handle the sessionbetween the client computer and the Flickr webservices API [18]. A translation component parsesthe data objects that store information about flickr users, photos, and tags and wraps them intonodes that can be placed in the data graph. Once the session is established, it is easy to requestmore detailed information about users or photos, and also to search for photos based on tags, aswell as perform other types of searches against the Flickr database. YouTube also has an APIwhich allows developers to query the immense amount of videos available at their site. The APIallows developers to search for videos, comments, channels, tags and users. Similarly to the Flickrwebservices component, a parser is able to transform results from searches via the YouTube APIinto nodes that can be attached to the data graph.
3.3 Scheduling components3.3.1 The Timing GraphThe timing graph allows developers to schedule arbitrary logic at specified times onto any object orgroup of objects attached to the scene graph or the data graph, or to the timing graph itself. Thesescheduled events are called Behavior s. The scheduled event control simple actions, such as addingor removing a graphics object to or from the scene graph, as well as more complicated actionssuch as traversing the dataset and analyzing some subset of the collected Node s. Some examplesof basic Behavior s that act upon objects attached to the scene graph include scaling, translating,and rotating the objects (and their children) over a set period of time. A Behavior can include acomposition of a number of these more basic operations. A slightly more involved example whichillustrates composed Behavior acting on a graphical object is a "fade out" transition which dimsan object at a particular rate (by reducing its alpha value) and then removes it from the scene andfinally destroys it, disposing of its resources. A single Behavior can also be attached to multipleobjects simultaneously, so that, using the above example, multiple objects can fade out and be
22
destroyed with a single behavior. Also, multiple Behavior s can be attached to a single object,even if the Behavior s are of the same type. For instance, to model the trajectory of a projectile,numerous translation Behavior s could be applied to the object that model the wind, gravity, andthe direction and speed of the projectile.
The basic logic of all Behavior s is that they occur once a given time has passed. Behavior scan be set up to repeat so that after occurring they are immediately rescheduled. Other Behavior soperate within a range of time, updating the object (or objects) based upon how much time haspassed. Additionally, Behavior s can be applied to other behaviors to create "second-order" func-tions upon an object or set of objects. For instance, a first Behavior might bounce an objectbetween two coordinates every 10 seconds. A second Behavior could be attached to the firstBehavior which would increase the rate of the first Behavior by 100% over those 60 seconds, sothat after one minute had passed, the bounce would only take 5 seconds to get from the first to thesecond coordinate. This is a contrived example, but one can imagine situations where it is easierto separate a function into two parts rather than try to encode the entire logic as a single function.
Fundamentally, every operation on an object is a Behavior . This allows flexibility in thinkingabout timed events, and it also introduces a natural separation between updating the objects andrendering them. All Behavior s are updated at the beginning of the display loop. That way allBehavior s can effect the data and graphical objects, avoiding most synchronization issues. If aBehavior is expected to take a long time while executing some logic then the Behavior can berun on a background thread and the updates will only occur at the beginning of the rendering looponce the execution is finished.
3.4 Input componentsbehaviorism is set up to respond to various inputs. Traditional inputs include the mouse and thekeyboard. Additional custom inputs that have been used with behaviorism include the Wii Remoteand the 3D Space Navigator as well as OSC messages and microphone input.
3.4.1 Keyboard HandlerThe keyboard input is separated into four different types: global keys, custom keys, keys thatchange modes, and keys specific to a certain mode. Key inputs are processed in that respectiveorder. Global keys are processed directly on the GUI thread as they signal messages that directlyeffect the shutdown of application or alter the window containing the application. Custom keys aredefined by the user as needed. These can include anything that is specific to a particular application.Mode keys are by default the F1 through F9 keys which toggle the default behavior of the arrowkeys and number keys. F1, for instance, signals that the arrow keys will change the translation ofeither the selected object (or the camera if no object is selected). F5 turns the debugging mode onor off. While the debugging mode is on, the number keys become activated and signal that various
23
types of debugging information should be displayed. For example, pressing "1" in debugging modewill display the frames per second in the lower left of the screen.
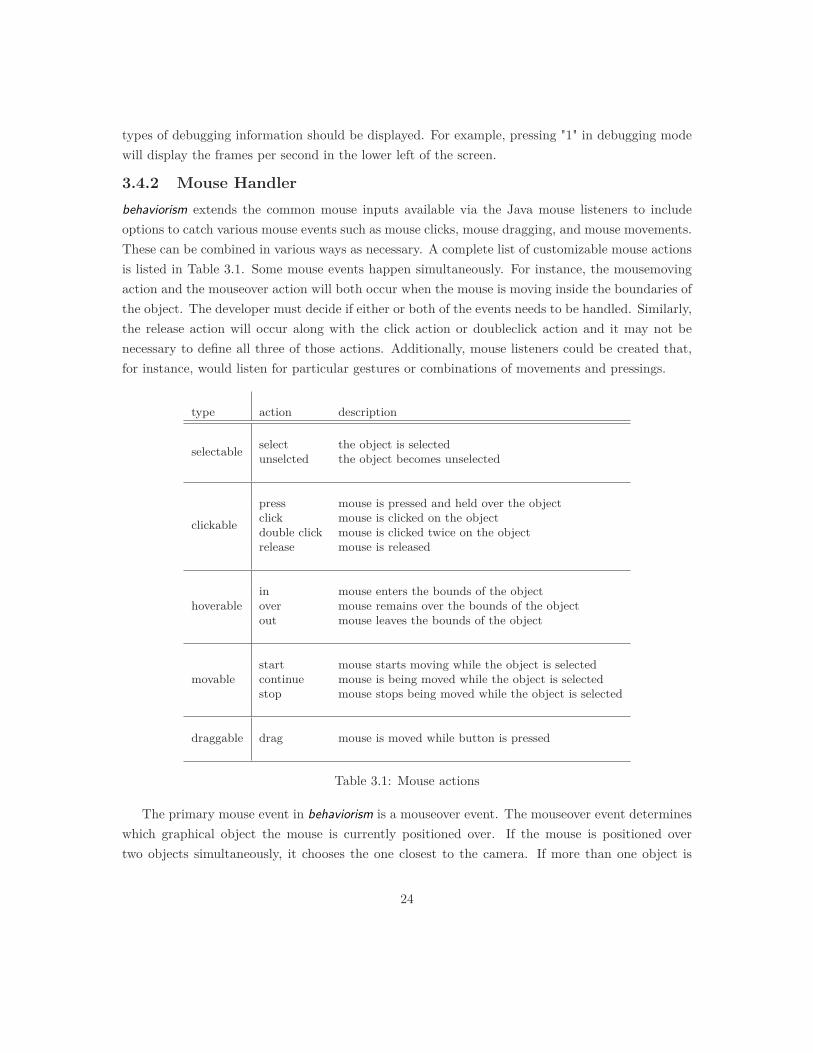
3.4.2 Mouse Handlerbehaviorism extends the common mouse inputs available via the Java mouse listeners to includeoptions to catch various mouse events such as mouse clicks, mouse dragging, and mouse movements.These can be combined in various ways as necessary. A complete list of customizable mouse actionsis listed in Table 3.1. Some mouse events happen simultaneously. For instance, the mousemovingaction and the mouseover action will both occur when the mouse is moving inside the boundaries ofthe object. The developer must decide if either or both of the events needs to be handled. Similarly,the release action will occur along with the click action or doubleclick action and it may not benecessary to define all three of those actions. Additionally, mouse listeners could be created that,for instance, would listen for particular gestures or combinations of movements and pressings.
type action description
selectable select the object is selectedunselcted the object becomes unselected
clickable
press mouse is pressed and held over the objectclick mouse is clicked on the objectdouble click mouse is clicked twice on the objectrelease mouse is released
hoverablein mouse enters the bounds of the objectover mouse remains over the bounds of the objectout mouse leaves the bounds of the object
movablestart mouse starts moving while the object is selectedcontinue mouse is being moved while the object is selectedstop mouse stops being moved while the object is selected
draggable drag mouse is moved while button is pressed
Table 3.1: Mouse actions
The primary mouse event in behaviorism is a mouseover event. The mouseover event determineswhich graphical object the mouse is currently positioned over. If the mouse is positioned overtwo objects simultaneously, it chooses the one closest to the camera. If more than one object is
24
equidistant from the camera, then it will choose by a z-order, if it is defined, or at random if not.Once an object is chosen, we examine which object this chosen object is registered to. For example,the border of a video object might be registered to the video itself so that clicking on the borderwill invoke the video object’s methods which respond to a mouse click. That is, clicking on theborder will have the same behavior as clicking directly on the video. Each object can overwritethe default mouse actions (for most Geom s the default actions do not do anything). For instance, aclick on a video object could toggle the video to start or stop. If the mouse is not over any object,then by default the clicking and dragging of the mouse control the camera.
The mouse input runs in a separate thread from the display thread so that the mouse inputdoes not interrupt the display thread. Rather, at the end of every iteration of the display thread,we check to see what mouse events have occurred and process them accordingly.
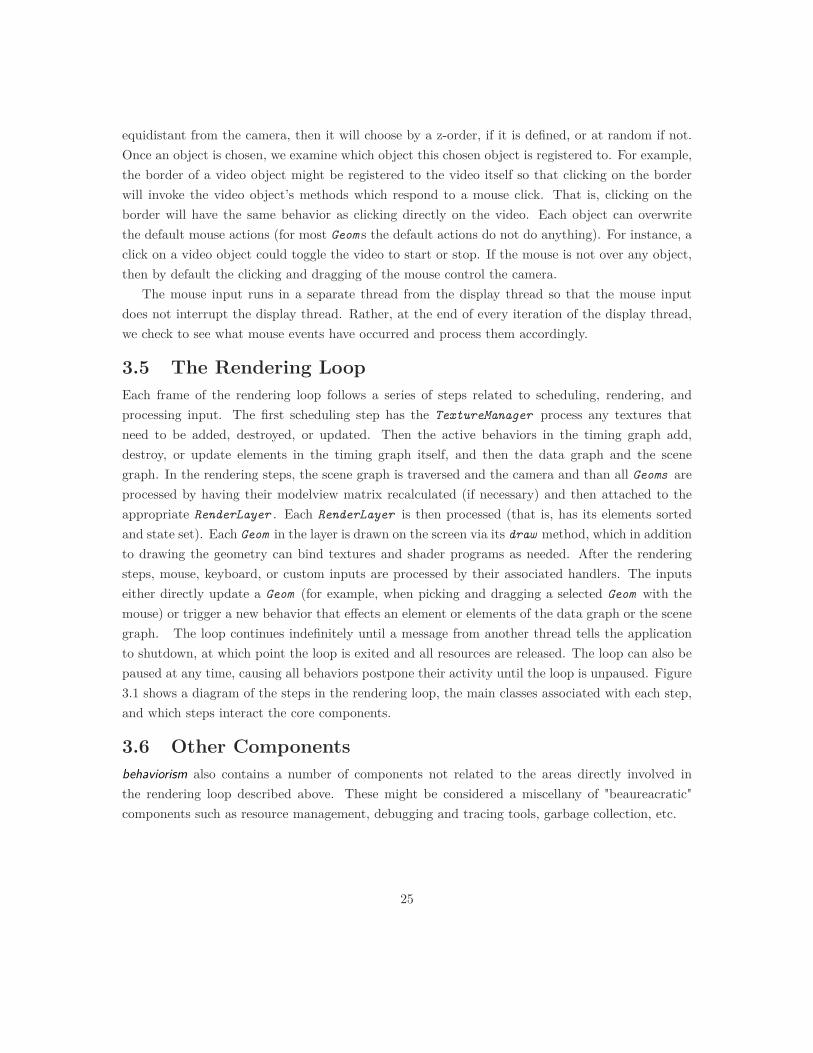
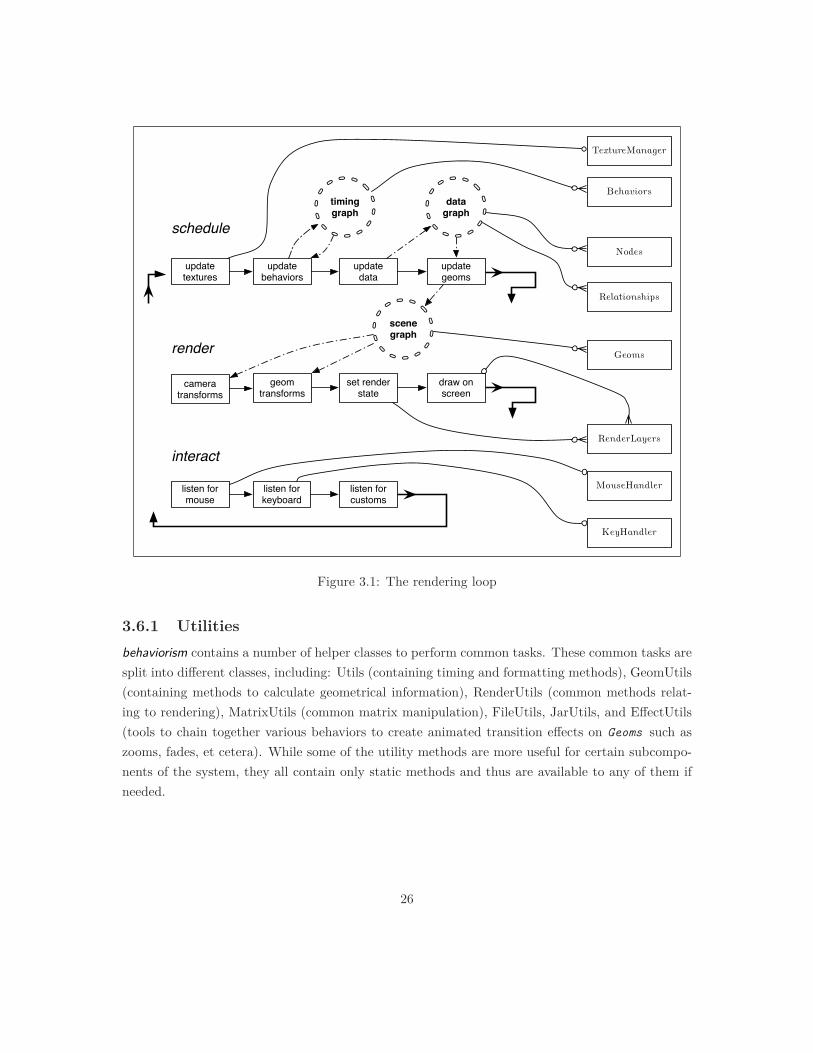
3.5 The Rendering LoopEach frame of the rendering loop follows a series of steps related to scheduling, rendering, andprocessing input. The first scheduling step has the TextureManager process any textures thatneed to be added, destroyed, or updated. Then the active behaviors in the timing graph add,destroy, or update elements in the timing graph itself, and then the data graph and the scenegraph. In the rendering steps, the scene graph is traversed and the camera and than all Geoms areprocessed by having their modelview matrix recalculated (if necessary) and then attached to theappropriate RenderLayer . Each RenderLayer is then processed (that is, has its elements sortedand state set). Each Geom in the layer is drawn on the screen via its draw method, which in additionto drawing the geometry can bind textures and shader programs as needed. After the renderingsteps, mouse, keyboard, or custom inputs are processed by their associated handlers. The inputseither directly update a Geom (for example, when picking and dragging a selected Geom with themouse) or trigger a new behavior that effects an element or elements of the data graph or the scenegraph. The loop continues indefinitely until a message from another thread tells the applicationto shutdown, at which point the loop is exited and all resources are released. The loop can also bepaused at any time, causing all behaviors postpone their activity until the loop is unpaused. Figure3.1 shows a diagram of the steps in the rendering loop, the main classes associated with each step,and which steps interact the core components.
3.6 Other Componentsbehaviorism also contains a number of components not related to the areas directly involved inthe rendering loop described above. These might be considered a miscellany of "beaureacratic"components such as resource management, debugging and tracing tools, garbage collection, etc.
25
Nodes
scene graph
Relationships
timing graph
data graph
RenderLayers
MouseHandler
KeyHandler
TextureManager
listen for customs
update textures
update data
update geoms
update behaviors
geom transforms
set render state
draw on screen
listen for mouse
listen for keyboard
camera transforms
Geoms
Behaviors
schedule
render
interact
Figure 3.1: The rendering loop
3.6.1 Utilitiesbehaviorism contains a number of helper classes to perform common tasks. These common tasks aresplit into different classes, including: Utils (containing timing and formatting methods), GeomUtils(containing methods to calculate geometrical information), RenderUtils (common methods relat-ing to rendering), MatrixUtils (common matrix manipulation), FileUtils, JarUtils, and EffectUtils(tools to chain together various behaviors to create animated transition effects on Geoms such aszooms, fades, et cetera). While some of the utility methods are more useful for certain subcompo-nents of the system, they all contain only static methods and thus are available to any of them ifneeded.
26
3.6.2 Delivery Methodsbehaviorism can be set up to deliver an application in one of three ways: as a stand alone application,as an application which is delivered over the web, or as an applet that runs inside of a browser.Running an application in the normal way requires the inclusion of the behaviorism JAR file, aswell as the native resources specific to a platform required by the Java OpenGL bindings. Sincebindings are available for all common platforms, it is easy to create and distribute a cross-platfromapplication. For webstart and applet delivery of a project that uses the behaviorism framework, onecan modify the JNLP and HTML files provided by Sun Microsystems. Webstart works withoutany issues, however are a few more issues pop-up when providing the application as an applet,as there are slight differences between different browsers. Some of these issues include needing toaccept security certificates, different versions of Java not being supported on certain browsers, anddifferent browsers having issues with recognizing the lifecycle of an applet. Examples are providedwith behaviorism that work on the main browsers for the three major platforms.
3.6.3 Resource Managersbehaviorism contains a system to load in various resources as needed by the application. Becausethere are different delivery methods, the resource manager by default tries the following approachesin order when loading in any resource. First, it will look on disk in a folder that is the same nameas the application: "<user directory>/<application name>/<application name>.properties" Thiswill fail if either the path to the file does not exist, or the web-based delivery method doesn’t havesecurity permissions to access the local file directory. Secondly, it will look for an available JARfile. The main application, no matter how it is delivered, is always packaged as a single JAR filewhich contains all the custom user code and may include custom resources such as images, fonts,property files, et cetera. Third, it will look to see if the developer has provided a location to loadresources from a remote server. These remote resources can be bundled together in a single JARfile or as a collection of individual files. Of course, this default sequence of loading resources can beoverridden to point directly to a specific file path, for instance, or to find necessary resources usingsome other customized method.
The types of resources that are commonly loaded in include a properties file to control basicaspects of the behaviorism project, such as such as whether or not the display window should takeup the entire screen or instead have a specified frame size and position. It also is used commonlyto specify specialized fonts which may not be available on every client system, images and othermedia which are needed for the project application, as well as information to connect to databasesor to interface with webservices. Other resources include shader programs which need to be loadedin order to be invoked from the client code. A number of basic example shaders are included inthe behaviorism library for simple image processing. Custom ones will need to be provided as aresource.
27
3.6.4 Debugging and TracingIn order to speed up the debugging process, all classes in the behaviorism framework use the Sim-pleLog logging framework [33]. SimpleLog allows coders to selectively turn on or off debugging andtrace information for specified classes and packages. This can greatly aid in resolving bugs in aproject. For instance, many bugs are noticed only after the project has gone into production andthe developer may no longer be present. Having the ability to look at a detailed log file enable thedeveloper to empirically reason about issues without needing to be on-site. Since the code basefor behaviorism is relatively small and since it runs only as a client there is no need for the extracomplexity a more full-featured logging framework, such as the popular log4j, that a more complexserver application might require.
3.6.5 Garbage CollectionJava 6.0 includes a number of options when choosing an automatic garbage collector that frees upresources that are no longer in use. The default collector is geared toward server applications andattempts to run as infrequently as possible, with occasional pauses that halt the application com-pletely while these resources are examined and freed. Since behaviorism is a real-time application,this is potentially unacceptable, as even very brief pauses of a few milliseconds are enough to causethe rendering loop to seem uneven and to render frames at less that real time rates. There area number of different strategies available to avoid these pauses. One strategy is to increase theheap size of available memory to a large amount hoping that it never gets filled during the lifetimeof the application. If there is enough memory available and the application doesn’t consume thatmuch memory over a brief lifetime, then this is the simplest strategy. Of course, if the applicationneeds to run uninterrupted over the space of a few days or even a few hours or longer, then this isunlikely to work. Once the heap is full, the garbage collector will potentially pause for up to a halfa minute or so (depending on the heap size) while it sorts out what resources are no longer needed.Another strategy is to use a concurrent or parallel garbage collector. Concurrent collectors runintermittently to collect smaller amounts of data much more often, well before the heap is filled.Parallel collectors run continuously on another core, constantly analyzing when memory can befreed. In practice, both of these strategies appear to produce the same results. In general, theywork well enough to produce real-time frame rates, but occasionally there is a slight brief dip whilethe collector is cleaning up garbage or, in the case of the parallel collector, while communicating tothe main application. A third strategy is to manually invoke the garbage collector at particular safemoments during the program where a slight pause will not affect the visualization (for instance,because nothing is animating at that particular moment). This works well in practice, but it maybe hard to predict when these moments occur, and there is no guarantee by the Java Virtual Ma-chine that this invocation will occur immediately. A final strategy is to use the Java RealTimeSystem which adds real time threads which cannot be interrupted by garbage collection. Using this
28

system adds some complexity to the framework as all resources in the display thread will have toexplicitly managed or at least explicitly prioritized. The default collector for behaviorism projectsis the concurrent collector, or, if available, the G1 collector which is a newly released collector whichcombines aspects of the parallel collector and the concurrent collector.
29
4 Core Components
behaviorism is made up of three interlocking core components of the framework: the data graph,the scene graph, and the timing graph. The data graph stores pieces of data as Node s and connectsthose data through Relationship s. The scene graph stores visual elements within a hierarchy ofmodelviews. The timing graph stores scheduled events that update elements in the data graph andthe scene graph. Node s of data are created the data graph from parsing the results of queries toexternal databases. The creation and visual appearance of Geoms is in part based on the structureof the data graph and the information in the Node s. The timing graph is defined initially by thedeveloper, but Behavior s can also be created or altered by user input, or by examinations of thedata graph and the scene graph. In other words, there is a two-way relationship between each of thecomponents whereby elements of one component can control elements within the other components.
4.1 GeometryAny object that can be attached to the scene graph is called "Geometry" since having some geometricrepresentation within the scene is the primary requirement for being visualized. All Geometryclasses extend from an abstract base class called Geom . All the basic Geometry classes in thebehaviorism framework begin with the word "Geom", such as GeomVideo or GeomCircle , etc. AGeom is located in space using a coordinate system relative to its parent. The root of the scene graphis a special Geom called a World . The World object has no parent, and its relative coordinate systemderives from the position of an associated Camera object, which is itself positioned in absolutecoordinates.
4.1.1 Properties of GeomsAll Geoms share a number of basic properties, defined by a set of variables and methods to updatethese variables: They can be positioned in space, selected or "picked" by various inputs, overlaidwith one or more textures, be bound to one or more shaders, have animation attached, and canbe associated with one or more nodes of data. Some of these properties can be ignored or set todefault values, or they can be customized or extended for specific situations.
30
4.1.1.1 Transformable
A transformation changes the modelview matrix the Geom . Each modelview is multiplied by itsparent’s modelview so that the each Geom is defined relative to the coordinate system of its parent.The modelview encodes information about the translation, the rotation, and the scaling of theGeom . In addition to these basic change of coordinates and scale, each Geom has a defined defaultrotation point and default scale point. These points define whether a rotation or scaling operationshould occur at the center of the object (in which case the object would rotate around its center,or scale equally in all directions) or at another point. These points do not necessarily need tobe within the bounds of the Geom which makes it easy, for example, to define a rotation aroundanother Geom . These points can be updated at any time.
This abstract base Geom class includes the basic methods for transforming objects which can beaccessed from any other class. These methods handle such things as sizing, position, and rotation–The full set of methods is listed in Table ??. When a Geom is updated via one of these methods,it does not change the modelview immediately, rather an atomic flag is changed to indicate thatthe modelview of the Geom (and thus all of its children) needs to be recalculated. During thenext traversal of the scene graph all updates to the translation, rotation, and scaling of the Geom
are handled via a call to a private method called transform , and the flag indicating a need forrecalculation is turned off. This simple concurrent locking mechanism prevents clashes betweenthe rendering thread and any other thread that is trying to change the values of a Geom . It alsoprevents any unnecessary calculations from being performed, as the modelview will not change if nochanges have occurred to the Geom or any of it ancestors. If the modelview of the Camera attachedto the root World node changes, then each element attached to entire scene graph will also need tobe updated.
4.1.1.2 Selectable
Each Geom that is visible in the scene graph is potentially able to be picked by an input device,such as the mouse or the Wii controller. In addition to basic selection, a variety of listeners can beset to listen to various input actions. These include being selected or unselected, checking whetheran input button is being pressed and held down, checking if an input button has been pressedone or multiple times, checking if an input button is released, checking to see if the mouse hasentered over the Geom for the first time, checking to see if the mouse is continuing to hover overthe Geom , checking to see if the mouse has moved outside the bounds of the Geom , checking to seeif the mouse has started or stopped moving or is continuing to move over the bounds of the Geom ,checking to see if a wheel input has been moved up or down, and finally checking to see if the mousebutton is being dragged, where a button is being pressed and the mouse is moved at the same time.Furthermore, each of these input events can be set-up to trigger actions on other Geoms , ratherthan the currently selected Geom . This can make it easy to have an entire group of Geoms act in
31
the same way, regardless of which one is currently picked. More complicated scenarios are also easyto design.
4.1.1.3 Texturable
Each Geom can have one or more textures attached to it. If a texture is attached to the Geom , thenit will be rendered over the bounds of the Geom . If multiple textures are attached, then by defaultthey will be blended together. Of course, for more complex shapes and custom texturing strategies,users have the option of creating a new Geom class or extending an existing one to fine tune thetexturing behavior.
4.1.1.4 Shadable
Each Geom can have one or more shader programs attached to it. In the draw method of the Geom
the shader programs are bound to the OpenGL context so that all vertices and associated data arepassed to a custom shader. Additionally, a number of convenience methods are provided to makeit easy to pass in other variables that might be needed by the shader for various calculations. Thetypes of variables that can be passed are either or the type "uniform" (which means they are globalover the entire execution of the shader program) or of the type "attribute" (which means that theycan be updated for each vertex that is passed in). Using the "uniform" method, entire textures canbe made available to the shader program. These textures can be actual pixel data, or they canrepresent any type of 1D, 2D or 3D data as desired.
Additionally, multiple shader programs can be chained together using a technique called "ping-ponging" which writes the output of the shader program (the fragment shader) to an off-screenframe rather than to the current rendering frame. Data in this off-screen frame can then be passedinto a new shader program. The ping-pong metaphor describes the technique of providing twooff-screen buffers and swapping between them for each link in the chain of shader programs. Thatis, a texture written into Buffer 1 which is then passed into program 1. Program 1 writes intobuffer 2, and then buffer 1 cleared. Buffer 2 is then passed into program 2 and program 2 writesback to buffer 1, which can then be passed into another program 3. This bouncing buffers processcan continue for as long as needed. In practice, long chains of shaders can slow down the displayloop, and often the off-screen buffers are made to be smaller than the screen size to speed up theprocessing.
4.1.1.5 Controllable
Each Geom can have one or more discrete or interpolated temporal events control the appearance,state, animation, color, position, and in fact every aspect of the Geom . These events can be triggeredby time or by the states of data associated with it. The logic which governs the changes is encodedin objects called Behavior s. Multiple Geoms can share one or more Behavior s, making it easy tocontrol a set of Geoms simultaneously. Behavior s can be defined to affect the children of the Geom
32
they are linked to as well, so that an operation on a parent Geom in the scene graph will updatethe children Geoms as well.
4.1.1.6 Reflective
Each Geom can be set up to reflect a piece or pieces of data within one or more Node s so that thevisual manifestation of the Geom is based upon this data. If the data changes, then the way theGeom is rendered will be altered as well.
4.1.1.7 Other Properties
Less central properties which are available to all Geoms include color, material, and lighting. Ad-ditionally, various default state parameters such as blending information and depth testing can bespecified on a per Geom basis.
Although the RenderLayer s, described in Chapter 3, are the preferred way to handle state, theremay be times when it is easier or necessary to specify the state for a particular object individually.In these cases, the specific state of the Geom will override the state of the RenderLayer it belongs to.If no state is defined, then it will be assumed that the Geom is using the state of the RenderLayer
it is attached to.
4.1.2 Types of GeomsThe behaviorism framework includes a number of basic Geom classes. A developer can extend eitherthe basic Geom class or any of the provided subclasses to create custom graphical object withwhatever kinds of features are necessary. All Geom s are required to overwrite a draw method,which is called each frame after a complete scene graph traversal has occurred. The basic Geom sdefine shapes, media components, and text.
4.1.2.1 Shapes
The most general category of Geom s are those which simply draw basic shapes. These shapesinclude primitives, such as points, lines, rectangles, polygons. The lines, rectangles, and polygonsare composed of some number of GeomPoint s, so that manipulating those points will have the effectof altering the Geom that is defined by those points. The family of shapes provided with the GLUTinterface as well as those defined by quadric equations in the GLU interface are also available.Additionally, the GLU interface includes a package for non-uniform rational B-spline (or NURBS)which can be used to model any curve [65, 66].
4.1.2.2 Images
The most common forms of media are simple images and videos, encoded in a variety of differentformats. A GeomImage is created using a loaded texture and a specified width and height. Theimage can be forced to stretch to fit the specified with and height, or the aspect ratio of thetexture can be preserved and the image will be centered within the width and height provided.
33
Alternatively, only a width can be provided, and the height will be automatically determined fromthe aspect ratio of the texture (or vice versa).
In order to preserve memory, the same texture can be used to create more than one GeomImage .Textures are loaded using the JOGL TextureIO interface, which automatically handles the decodingof many different compression schemes. If more specialized control over the loading of texturesis needed, it is easy to create custom loading mechanisms instead of relying on the TextureIO
methods. The TextureManager component that is included with behaviorism automatically handlesthe loading of textures on a different thread than the display loop so that loading textures (whichcan take time to process) will not stall the animation. Once the image is loaded into memory, thepixel data can be transferred to an OpenGL texture almost instantly. Although not part of thecore behaviorism framework, example demos are provided which show how to extend the GeomImage
class to perform image processing and image analysis using a shader program or a chain of shaderprograms.
4.1.2.2.1 Videos
A GeomVideo is created using a special video texture object with a specified width and height. Thevideo texture object, TextureVideo , uses a library created by Sun called Java Media Componentswhich will be offically included in the next version of Java [38]. Java Media Components uses nativecodecs when possible to play video files. There are codec packs available for OS X, Windows, andLinux which increase the number of native formats available to a platform to include for instanceOgg Theora, Quicktime, and Windows Media formats. Java Media Components will also play non-native codecs, such as the ubiquitous FLV (Flash video) format [56]. Thus, it is possible to embedvideos for playback within the scene on all the major platforms. More complicated interaction withthe videos, such as backward playback, or defining loop points, unfortunately currently cannotalways be handled in exactly the same way on all platforms. The behaviorism framework includesa binding to this library that copies the decoded video data onto an OpenGL texture. Becausethe display loop runs faster than the video frames are updated (generally a video plays at 24 or 30frames per second), TextureVideo has a simple mechanism to update the video texture only whennecessary. Each frame of the display loop it checks to see if the video output has been updated.If it has not, then the current video data is re-rendered. If it has, then we load that data intomemory and, once it is finished, copy it over to the OpenGL texture during the next display loop.As with the image texture associated with the GeomImage , the video texture associated with theGeomVideo can be passed to shader programs for further processing, or can be manipulated inother ways. Currently, there is no direct way to manipulate the audio data. The Java MediaComponents handles all audio playback, automatically synchronizing it with the video playback.In addition to playing a video, the GeomVideo class has default controls for starting and stoppingplayback, making use of the "clickable" interface available to all Geom s. Various examples are also
34
available that explore other ways to interact with a video, for instance to create "tape loops" atcertain points in the video, or to "scrub" the video while seeking through it by moving the mouse.A TextureVideo object that wraps the fobs4jmf library (which itself is a wrapper for the ffmpeglibrary) is also available [61], and may be preferable in some cases for certain video formats, but issomewhat more complicated to set up and does not work as well as a cross-platform solution.
4.1.2.3 Text
behaviorism has extensive support for creating textual objects which can be placed within a 3Dscene. For simple text rendering, a developer can use the GeomSimpleText class, deciding on thefont and font size and attaching it directly to the World node without translating it along the z-axisor rotating it around the x or y-axes. This will ensure that the text looks perfectly sharp. However,if the GeomSimpleText moves from this plane, then the text will have the tendency to look fuzzierthe further away it is from its ideal position. By default, the renderer uses antistropic filteringwhich mitigates this issue somewhat. But for text that moves dynamically a better solution is touse the more general GeomText class which has built in level-of-detail functionality, automaticallychoosing an appropriate font size to maintain sharpness wherever the text is positioned. This worksby centering the text object in the middle of the screen and reversing any rotation so that the entiretext object is in a parallel xy-plane to the camera coordinate system. At this point we can calculatethe actual pixel size of the text object and determine the ideal font size that would cause the text tofill the box most appropriately. Once we know the best font size we then use it when drawing at theoriginal position in 3D space. Of course, loading in every font at every size would be prohibitivelyslow and memory intensive, so instead we pre-load a small subset of font sizes for each of the fontfamilies we are concerned with and choose the one that most closely fits the bounds of the text box.Since this will be close to the ideal sharpness, normal antistropic filtering will work well enough tomake the text look sharp. Developers can choose to increase the resolution of the level of detail,if needed, at the expense of loading more fonts, increasing the memory requirements and possiblyincreasing the start-up time of the project.
More complicated examples of text management included in the example projects include textobjects that handle multiple lines of text, and text object that fit each character of text along acurve defined by a GeomPath .
4.2 DataData in behaviorism is semi-structured and linked together by semantic relationships, ontologicallydefined by the developer for a particular visualization task. In some cases (especially with sim-pler non-dynamic data), the data graph component can be ignored completely and all necessaryinformation can be stored directly within a Geom class and manipulated with Behavior s that actdirectly upon Geoms . For more involved data, this layer of representation is useful for conceptually
35
organizing the data and also for traversing the data for data processing and analysis.
4.2.1 Properties of DataData objects, called Node s, have only two necessary properties. First, they are categorizable, andcan be assigned to one or more Category objects. Second, they are linkable, via Relationship s,to other Node s, which embeds them within the data graph. However, the basic abstract Node classcan be extended by adding any attributes necessary to describe the data it contains.
4.2.2 Properties of the Data GraphThe data graph can be used for different purposes. For instance it can be used as a local repositoryof some portion of remote data that we are interested in visualizing. It can also be used as a dynamicmodel of locally generated information (for simulations, knowledge representations, et cetera). Thedata graph has a number of properties which make it adaptable to various purposes and able torepresent different kind of data: it can contain arbitrary types of data, the data is connected bysemantic links, it can be traversed, filtered and analyzed through special Node s, and it is dynamicboth in that it can receive new information from external sources, and in that it contain data thatitself fluctuates in response to external sources, user input, or as the result of intrinsic propertiesthat cause it to change in some way over time.
4.2.2.1 Heterogeneous
The data graph can contain any type of data Node . Each individual Node is a grouping of moregranular attributes. The attachment of a Node to the data graph with one or more Relationship scontextualizes it semantically. New types of data are able to be added at any time, provided theymeet the constraints of the Node interface– having a Category and linking to other Node s in thedata graph.
4.2.2.2 Semantic
Each Node of data keeps track not only of its connections to other Nodes, but also the type ofRelationship and the strength of that Relationship it has to each of those Node s. By defaultall Node s that are connected to each other are tagged with the basic default semantic notion "isconnected to". Richer Relationship s can be defined when necessary. Any textual marker can beused to distinguish one Relationship from another. Moreover, a single connection between twonodes can involve multiple semantic connections. Different weightings can also be used to indicatethe strength of the Relationship . By default, the weightings range between -1.0 to +1.0, where anegative number indicates an inverse relationship. A Relationship can extended to have additionalattributes beyond the relationship type and the weight to describe more involved connections. EachRelationship is in fact a special kind of Node , which means it must have a specified Category .The links it has to other objects is slightly different however. Each Relationship has a default link
36
to the Node s it is establishing a relationship to. These links are called the parent link and the childlink. These links are special links which can not be extended and are not weighted. Other linksbetween a Relationship and other Node s or other Relationship s can be defined if necessary.For most applications, this is an added layer of abstraction and is not needed.
4.2.2.3 Traversable
Each Node is embedded within the data graph via its links to other Node s. A developer cancreate examination of the data graph that start from any point by following a series of links. Theframework includes a Collector object which defines the way in which the data graph is traversed.The Collector objects traverse the graph from a specified starting point (or starting points) usingeither a depth first, breadth first, or custom strategy to visit each node in the graph (up to aspecified depth), retrieving the Node s as they are visited. As nodes may be connected via differenttypes of Relationship s, and because there are potentially many ways to traverse between any twoNode s, a list of Node s and Relationship s is created to keep track of paths that have already beenfollowed.
4.2.2.4 Filterable
The Collector objects allow different "cuts" or subgraphs of the data graph to be created. Duringa traversal, a Collector uses two types of Filter s: one to decide if a path should be taken, and asecond to decide if a Node should be collected. The Filter s can be designed to match on varioustypes of elements or thresholds. For instance, a path might only be traversed if it is of a certaintype of Relationship , or if it has a weight above a certain value, or some combination of thetwo. Similarly, a Node might only be collected if it passes a filter designed to match only certainCategory s or instances of that Category that have particular values, or Node s that have a certainRelationship with a neighboring Node . The Collector can return either a collection of Node sor the subgraph itself (which can then be analyzed or refined with further filtering).
4.2.2.5 Analyzable
Once a Collector has finished traversing a portion of the data graph and collected a set of Node s,this set can be examined using a specified set of rules. Types of analysis include such basic things asstatistical relevance (frequency, various stats tests, etc), and also the Analyzer can be customizedfor various things like image processing, et cetera. Creating an Analyzer and attaching it to a setof Node s produces a result which is itself a piece of data within the data graph. Because of this,multi-order analysis can occur. That is an Analysis of other analysis can be defined, traversed,filtered, et cetera.
4.2.2.6 Dynamic
In addition to having certain types of Node s which create new information and add it to the datagraph, the data graph can also change as it searches for and discovers new information. For example,
37
via a database query or from a reply to call to a webservice API. When new data is found, it willbe attached to the data graph accordingly. Collectors and Analyzers that are defined to examineNode s that match the new data will automatically be updated as well. The entire data graph isset up to be concurrent so that any changes will be handled in a synchronized manner so that, forinstance, visualizations of the graph will not be interrupted when a change occurs. The data thatis represented in the graph can also be intrinsically dynamic, updating itself over time with out anyexternal events to trigger the change.
4.2.3 Types of Data Elements
4.2.3.1 Categories
The two basic elements that can be attached to the data graph are Node s and Relationship s.These elements are distinguished by having a particular Category attached to them. TheseCategory s are used in traversing and filtering the Node s and Relationship s. While a singleCategory generally is used to represent a particular class of Node s, they can also be used toorganize Node s in other ways. A Node can belong to multiple Category s if needed.
4.2.3.2 Nodes
Node s hold particular kinds of information. The arbitrary information is not directly attached tothe data graph, as it only makes sense in direct context of a single Node . For instance, a VideoNode
might contain fields that indicate its title, username, encoding, and path. The VideoNode encap-sulates all of this information. It is placed in the data graph because we are curious about therelationships between the entire set of fields which define this video and, for instance, the entireset of fields which define other videos. Now if we are trying to model the connection between,say, videos and users, we might remove a field of information from the VideoNode to create a newCategory of Node called a UserNode . It is up to the developer to determine which informationconstitutes an independently meaningful category and which only makes sense in direct relation toa single Node , in which case it would be extraneous to create the overhead of a new Category ofNode .
4.2.3.3 Relationships
Relationship s, as described above, are links that connect two Node s together. A Relationship
is itself a special type of Node which automatically contains two special Relationship s, aParentRelationship and a ChildRelationship . These special Relationship s can not be ex-tended, and they themselves have no links.
Each Relationship is of a particular Category which defines the type of relationship it is. Therelationship has a textual description which for clarity should probably describe the relationshipbetween the child and its parent. As a simple example, the relationship between a parent VideoNode
and a child UserNode might be described textually as "posted by" so that we could read that the
38
specified video was "posted by" the specified user. A reverse relationship could also be created whichmight use the text "posted", so we could read that the specified user "posted" the specified video.For simpler connections where directionality is not important, we can define a single relationshipwhich automatically creates the parent-child connection in both directions. The textual descriptionwould describe a more general type of relationship, such as "connects" or "is attached to".
Relationship s can also have weights assigned to them to indicate the strength of the rela-tionship between two Node s. These weights can be used in the filtering and analysis of the graphto reason about the connections. And Relationship s can be extended to include other types ofinformation about the relationship between Node s if necessary. Special Filter s and Analyzer scan be developed to processes this extra information.
4.2.3.4 Planes
Because the data graph can become quite dense with both Node s and the results of Collector sand Analyzer s, the behaviorism framework includes the ability to create objects called Plane s.Plane s are special views of the data graph that include only certain types of data objects. ThesePlanes can be used to separate out certain Category s or the results of particular Collector s orAnalyzer s (described below). The objects in the Plane are still connected to the data graph asnormal, but are organized in a more convenient way for various purposes, such as meta-analysis orstatistical sampling. Planes are essentially subgraphs of the data graph which may or may not beconnected.
4.2.3.5 Filterers
A Filter is a simple class containing an method which matches a Node against particular pa-rameters. The parameters can be basic, such as an indicator that a Node or Relationship is onea particular set of Category s. Or it can more complicated, checking to see if a particular Node
has particular data, or particular Relationship s above certain weights. Filterer s are objectscomposed of one or more Filter s which are used to make decisions when traversing, collecting, oranalyzing the graph.
4.2.3.6 Collectors
Collector s are the primary way to traverse the data graph. They are constructed using var-ious Filters which control both which paths can be traversed as well as which Node s andRelationship s are retrieved by the Collector . A Collector becomes a special Node in thedata graph which has a link to each of the Node s it has collected. A special subgraph Collector
can also create a Plane to hold the entire subgraph it has traversed. The subgraph Collector
differs from a normal Collector in that it will not traverse the links of Node that does not passthe specfied Filter s.
39
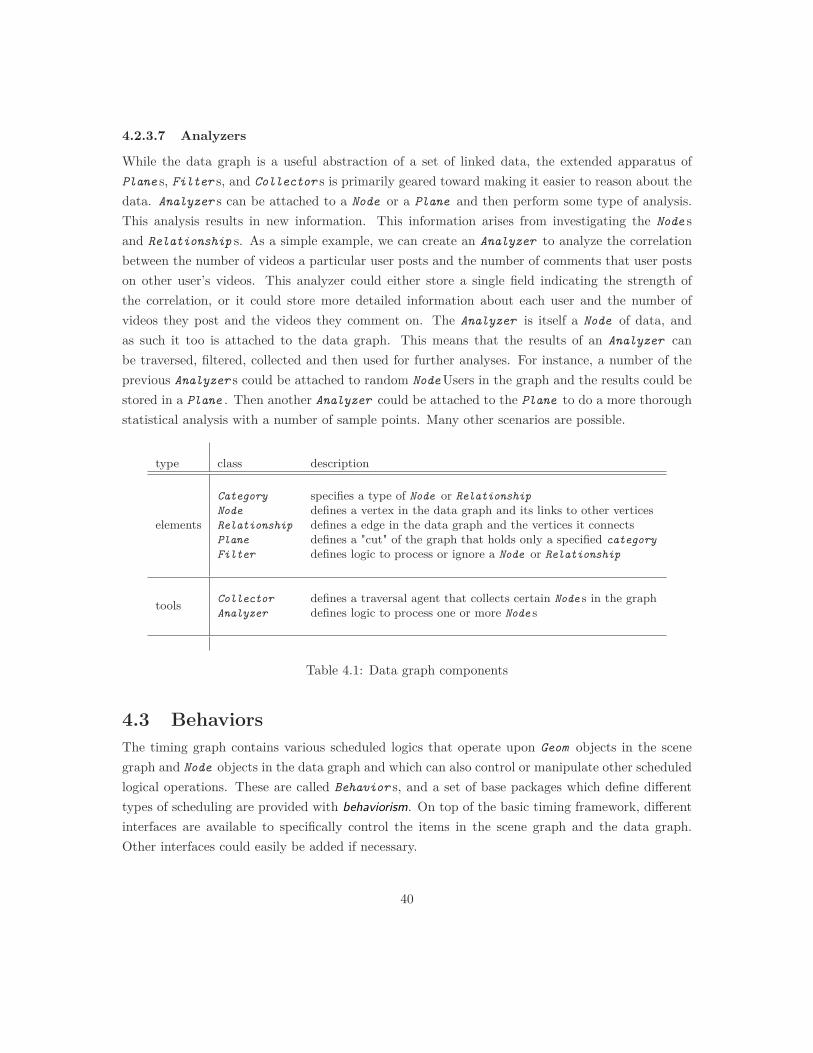
4.2.3.7 Analyzers
While the data graph is a useful abstraction of a set of linked data, the extended apparatus ofPlane s, Filter s, and Collector s is primarily geared toward making it easier to reason about thedata. Analyzer s can be attached to a Node or a Plane and then perform some type of analysis.This analysis results in new information. This information arises from investigating the Node sand Relationship s. As a simple example, we can create an Analyzer to analyze the correlationbetween the number of videos a particular user posts and the number of comments that user postson other user’s videos. This analyzer could either store a single field indicating the strength ofthe correlation, or it could store more detailed information about each user and the number ofvideos they post and the videos they comment on. The Analyzer is itself a Node of data, andas such it too is attached to the data graph. This means that the results of an Analyzer canbe traversed, filtered, collected and then used for further analyses. For instance, a number of theprevious Analyzer s could be attached to random NodeUsers in the graph and the results could bestored in a Plane . Then another Analyzer could be attached to the Plane to do a more thoroughstatistical analysis with a number of sample points. Many other scenarios are possible.
type class description
elements
Category specifies a type of Node or RelationshipNode defines a vertex in the data graph and its links to other verticesRelationship defines a edge in the data graph and the vertices it connectsPlane defines a "cut" of the graph that holds only a specified categoryFilter defines logic to process or ignore a Node or Relationship
tools Collector defines a traversal agent that collects certain Node s in the graphAnalyzer defines logic to process one or more Node s
Table 4.1: Data graph components
4.3 BehaviorsThe timing graph contains various scheduled logics that operate upon Geom objects in the scenegraph and Node objects in the data graph and which can also control or manipulate other scheduledlogical operations. These are called Behavior s, and a set of base packages which define differenttypes of scheduling are provided with behaviorism. On top of the basic timing framework, differentinterfaces are available to specifically control the items in the scene graph and the data graph.Other interfaces could easily be added if necessary.
40
The aim of providing scheduled building blocks of logic is to be able to make it simple to programcomplex operations and also to make it easy to to think about and customize the various parts ofa complex operation. To that end, Behavior s are designed to have the following properties: theycan be stacked onto multiple elements; multiple Behavior s can be chained together to composemore complex actions; they are flexible in that they can contain arbitrary logic; they are mutableand both the strength and type of effect they have on elements can change; and they are relativein that they do not interfere with other behaviors from concurrently changing the same element.
4.3.1 Properties of Behaviors
4.3.1.1 Stackable
A single Behavior can affect multiple Geoms or Behavior s simultaneously.
4.3.1.2 Chainable
Multiple Behavior s can be chained together so that their composition can operate upon a one ormore Geoms or Behavior s or Node s simultaneously.
4.3.1.3 Flexible
A Behavior can be customized to encode any logic, from something as simple as checking thecurrent time to something more complicated such as checking the arrangement of some set ofGeoms . Operations whose logic could potentially take a long time to process can be put into aseparate thread so that the rendering loop will not be compromised. This flexibility applies boththe ways in which a behavior can be composed/extended/customized (as programming code), andthe ways in which it can be used/applied (within the program).
4.3.1.4 Mutable
In addition to Behavior s operating upon Geoms attached to scene graph and Node s attached tothe data graph, Behavior s can also operate on other Behavior s, which themselves may act uponother Behavior s. In this way, a behavior can be updated to alter its timing or logic.
4.3.1.5 Relative
A Behavior ’s operation does not block the operations of other Behavior s (unless desired). Asimple example of this relativity would be a Behavior that moves a Geom from the point (0,0) tothe point (5,0) over 10 seconds. This Behavior is set up to translate 5 units in the x direction, butit does not guarantee that it will end at the point (5,0), as a second Behavior might be attachedto the same Geom which translates the Geom along some other trajectory. A behavior does notkeep track of an absolute position, but instead a percentage of time that has gone by. For instance,in the example above, if, say, .1 seconds had passed between the current iteration of the displayloop and the previous iteration then the Behavior would determine that a 1% change along thetrajectory had occurred. Since the trajectory was 5 units in the positive x direction, this would
41
add 1% of 5 units = .2 units in the positive x direction to the Geom. In other words, the Behavior
has no reference to the position of the Geom, it simply adds a small increment to it each frame asspecified. That is, the Behavior is completely decoupled from the Geom or other Behavior it isaffecting.
4.3.2 Types of BehaviorsThe behaviors are categorized into three sections based on scheduling, and then each of those isfurther divided based on whether they affect Geoms , Node s or other Behavior s. The different typesof behaviors include those that are continuous, discrete, or intermittent (described below). In orderto attach the behavior to a Geom , Node or another Behavior , a Behavior must implement eitherthe interface GeomUpdater , NodeUpdater , or BehaviorUpdater (or some combination of them).Additionally, if some other use for a Behavior arises, a user could potentially create their ownupdating interface and have their custom Behavior implement that instead of (or in addition to)the provided interfaces.
Each Behavior is scheduled to begin and end at a particular time. The time is marked at thestart of each iteration of the rendering loop, and the first steps of the rendering loop uses that timeto determine the scheduling of each Behavior . For Behavior s that carry out intensive logic whichmight potentially slow down the frame rate of the renderer, it is also possible to place a Behavior
to run in separate thread. The Behavior will be activated when the current time is greater thanor equal to the scheduled time.
All Behavior s can be scheduled to repeat indefinitely or for a certain number of times. Addi-tionally, the action they take upon repeating can be modified as needed. The value the Behavior
is affecting can be reset if needed, and the direction of the Behavior can be reversed.
4.3.2.1 Continuous Behaviors
A "continuous" Behavior is one which interpolates a value or a set of values across a span of time.The most basic version of a continuous Behavior simply determines what percentage of time haspassed between its activation time and its deactivation time. If the activation time is ta, and thedeactivation time td is ta plus the length of the action. For instance, if the length of the action isone second, then at time ta+ 500ms the simple continuous behavior would return a value of .5 (for50%). And in general the return percentage is (tx − ta)/(td − ta) where tx ranges between ta andtd. In other words, it performs a basic linear interpolation.
4.3.2.1.1 Easing Functions
A set of common easing functions are also included with behaviorism. By attaching an easingfunction to the simple continuous behavior we create a new value from the raw percentage oftime passed between activation and deactivation. Easing functions are commonly used for pleasingtransition effects, but they can in fact be used for any purpose. A variety of common easing
42
functions, such as sine, quintic, bouncing, et cetera, are included with behaviorism that can beattached to either or both the beginning or end of the interpolation. The behaviorism frameworkalso includes a class for creating easing functions from a spline curve using as many points asdesired, as well a from a set of line segments. It is also easy to create custom easing functions asneeded.
4.3.2.2 Discrete Behaviors
A "discrete" Behavior changes the state of a set of discrete variables associated with a Behavior
or a Geom. For instance, a behavior might send a pulse to a Geom at particular intervals totrigger its visibility within the scene. The basic discrete Behavior s include, in order of complexity,BehaviorSimple , BehaviorPulse , BehaviorSwitch , and BehaviorCount . More useful behaviorscan be built from these building blocks. Each of these behaviors can also be reversible or repeatable.For instance, a BehaviorCount that is set to count from one to five can be reversed and repeatedso that it counts between one and five forever.
4.3.2.3 Intermittent Behaviors
An "intermittent" Behavior combines the continuous and discrete behaviors allowing a user tospecify particular times at which to update a set of variables within a specified range.
4.3.3 Behavior InterfacesIn general, unless custom functionality is required, Behavior s extends from base classes whichimplement a particular interface which defines the type of elements it works with. Each of theinterface requires an update method which describes the logic necessary to update the desiredaspects of a particular elelment. The GeomUpdater interface updates Geoms ; the NodeUpdater
interface updates Node s; the BehaviorUpdater updates other Behavior s. The rendering loop usesthese interfaces organize the Behavior s when updating elements attached to the data graph, thescene graph, and the timing graph.
4.3.3.1 The GeomUpdater Interface
If a behavior implements the GeomUpdater interface then any active Geom attached to the scenegraph that is also attached to that Behavior will execute a method called updateGeom , requiredby the GeomUpdater interface. This system allows a single Behavior to affect multiple Geoms
simultaneously, if desired. Likewise, A single Geom can have multiple Behavior s attached, even ifthe Behavior is of the same class. The idea is that a Behavior represents an unfixed abstract forcethat can be combined with a number of other forces without respect to any necessary grounding. Asa simple example, we can attach a BehaviorTranslate to an object to move it from point A to pointB. At the same time, we could attach a second Behavior that extends from BehaviorTranslate
to the same object to represent a gravitational force. And we could also attach a third Behavior
that also extends from BehaviorTranslate that might represent a wind resistance. By so doing
43
we could easily set up a physical simulation of, say, a projectile being fired on a windy day. Thatis, even though we are moving an object from a specified point to another. These points are notnecessary proscribed by a rigid timeline, but can be decided by a multitude of different forces,each modeled with different Behavior instances. Of course, these forces do not need to representphysical models; they are flexible enough to be building blocks for any number of concepts.
4.3.3.2 The NodeUpdater Interface
The NodeUpdater interface is also similar to the GeomUpdater interface, checking to see if a par-ticular operation should occur at a certain time. The difference between Geom s and Node s, for one,is that Geom s need to be re-rendered every frame of the display loop and so every one is examinedevery frame. On the other hand, most Node s will probably not change every frame. At the begin-ning of each display loop we look at all active behaviors. The ones that are attached to Node s willcheck to see if it is time for that Node to be updated in some way. Various types of Behavior scan be attached to Node s. Often the data graph functions as a local repository of information thatis stored in another location, for instance, an SQL database or the file system or a webservicesdatabase. Behavior s can be set up to retrieve new information from these sources at given timesbased upon information gathered from the data graph. For instance, a Collector of Node s mightbe used to search the YouTube video database for similar items. If new items are found, they areattached to the data graph. Another example might be to have a Behavior that checks to see ifsome Node s or Relationship s are old or outdated and to have the Behavior remove it from thedata graph. Still another example is to have a behavior re-run an analysis on a particular Node orset of Node s to determine if the results have changed. Since Geom s can have data attached to themand may have their drawing methods determined by this data, a behavior that updates an analysisnode will have a ripple effect that changes the visual rendering as well. A final example is to havea behavior which samples the data graph. Since the data graph might be too large to convenientlyanalyze for particular properties, a behavior which samples certain locations of the data graph atcertain times is be useful for certain statistical tests. Behaviors which update these behaviors arethemselves useful is certain cases, and they are described in the section below.
4.3.3.3 The BehaviorUpdater Interface
Similarly to the GeomUpdater and NodeUpdater interface described above, the BehaviorUpdater
interface allows a Behavior to be attached to any active Behavior . This allows for programmaticsequencing and control of the scheduling and timing of the objects in the scene graph. Behavior simplementing this interface can alter various aspects of other Behavior s including the timing, rate,and even their functionality. For instance, one Behavior might be set up to bounce an object backand forth along a trajectory every 10 seconds. A second Behavior could be modified to alter theoriginal behavior such that the speed of that trajectory changes from 10 seconds to 4 seconds overa period of 1 minute. That is, every 10 seconds, the speed of the trajectory increases by a rate
44
of 1 second. As with the continuous BehaviorGeom s, the continuous BehaviorBehavior s can beaggregated as desired, so that for instance two BehaviorSpeed s might act as a composite functionbuilt out of two acceleration functions. As an example of how this might work, we set up twoBehaviorSpeeds that cancel each other out. One that increases the speed by 100%, and anotherthan decreases the speed by 50%. If these Behavior s start at the same time and have the samelength of operation, then they will in effect cancel each other out, and the BehaviorGeom s that areattached to these Behavior s will maintain their original speed.
Behavior s can also programmatically create and add new Behavior s, or remove existing be-haviors, to Geoms . As a simple example, we can imagine a Behavior that tells a Geom to movetoward some other Geom if a certain condition is met. If that condition is no longer met, thenperhaps the Geom now should move away the other Geom . We can easily model this using ourframework by creating a Behavior that listens to an Analyzer node on the data graph, when theanalysis changes (for whatever reason) it can tell the Behavior that is moving the Geom to no movein the opposite direction. In some cases, it will make sense to use normal programming strategiesto define meta-Behavior s of this sort, in other cases it may be convenient to have this option.
45
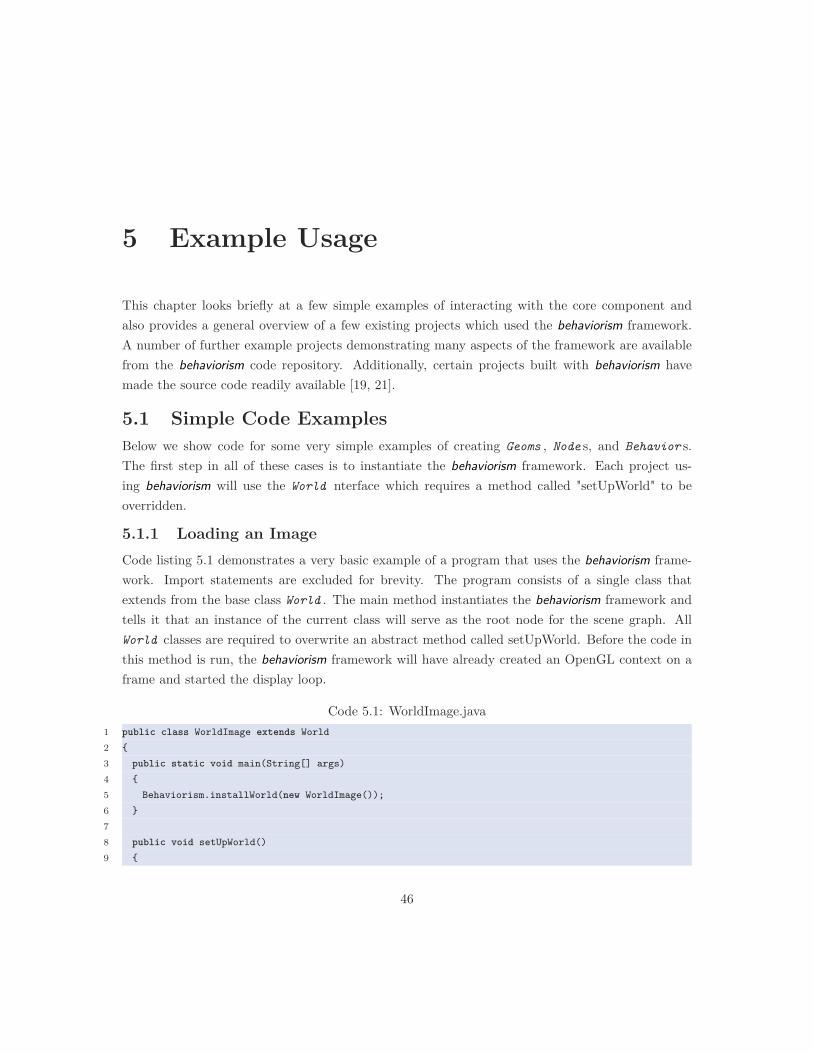
5 Example Usage
This chapter looks briefly at a few simple examples of interacting with the core component andalso provides a general overview of a few existing projects which used the behaviorism framework.A number of further example projects demonstrating many aspects of the framework are availablefrom the behaviorism code repository. Additionally, certain projects built with behaviorism havemade the source code readily available [19, 21].
5.1 Simple Code ExamplesBelow we show code for some very simple examples of creating Geoms , Node s, and Behavior s.The first step in all of these cases is to instantiate the behaviorism framework. Each project us-ing behaviorism will use the World nterface which requires a method called "setUpWorld" to beoverridden.
5.1.1 Loading an ImageCode listing 5.1 demonstrates a very basic example of a program that uses the behaviorism frame-work. Import statements are excluded for brevity. The program consists of a single class thatextends from the base class World . The main method instantiates the behaviorism framework andtells it that an instance of the current class will serve as the root node for the scene graph. AllWorld classes are required to overwrite an abstract method called setUpWorld. Before the code inthis method is run, the behaviorism framework will have already created an OpenGL context on aframe and started the display loop.
Code 5.1: WorldImage.java1 public class WorldImage extends World2 {3 public static void main(String[] args)4 {5 Behaviorism.installWorld(new WorldImage());6 }78 public void setUpWorld()9 {
46
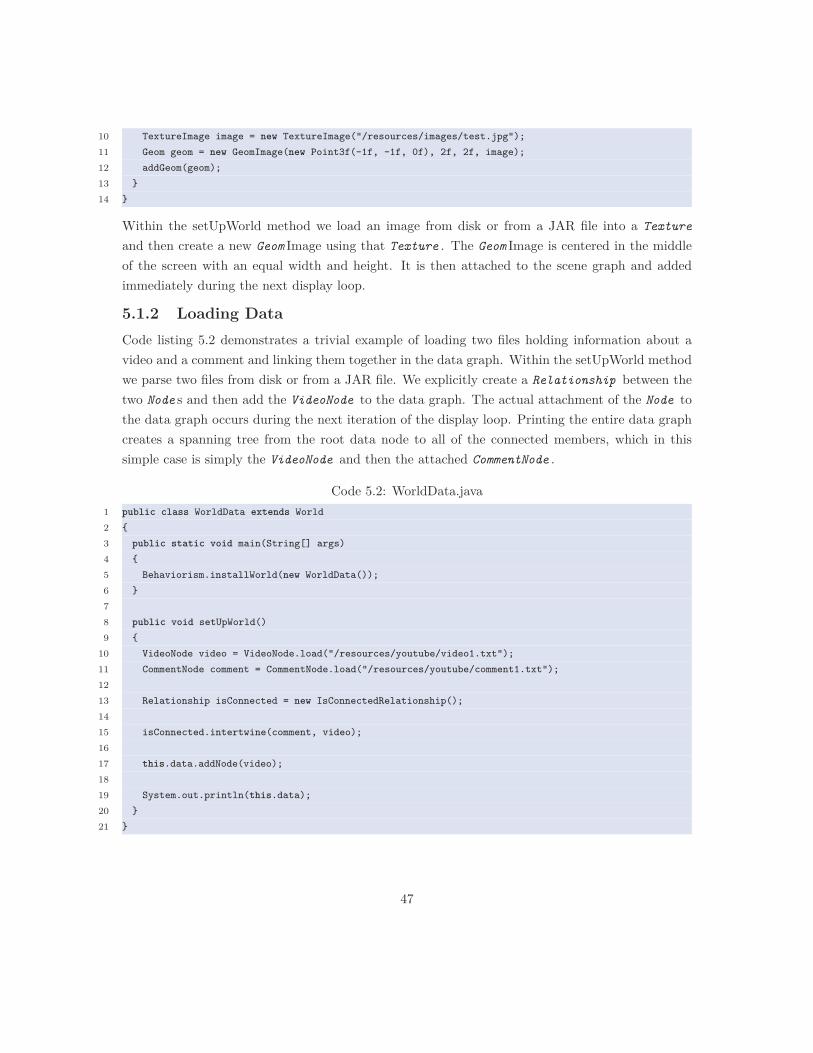
10 TextureImage image = new TextureImage("/resources/images/test.jpg");11 Geom geom = new GeomImage(new Point3f(-1f, -1f, 0f), 2f, 2f, image);12 addGeom(geom);13 }14 }
Within the setUpWorld method we load an image from disk or from a JAR file into a Texture
and then create a new Geom Image using that Texture . The Geom Image is centered in the middleof the screen with an equal width and height. It is then attached to the scene graph and addedimmediately during the next display loop.
5.1.2 Loading DataCode listing 5.2 demonstrates a trivial example of loading two files holding information about avideo and a comment and linking them together in the data graph. Within the setUpWorld methodwe parse two files from disk or from a JAR file. We explicitly create a Relationship between thetwo Node s and then add the VideoNode to the data graph. The actual attachment of the Node tothe data graph occurs during the next iteration of the display loop. Printing the entire data graphcreates a spanning tree from the root data node to all of the connected members, which in thissimple case is simply the VideoNode and then the attached CommentNode .
Code 5.2: WorldData.java1 public class WorldData extends World2 {3 public static void main(String[] args)4 {5 Behaviorism.installWorld(new WorldData());6 }78 public void setUpWorld()9 {
10 VideoNode video = VideoNode.load("/resources/youtube/video1.txt");11 CommentNode comment = CommentNode.load("/resources/youtube/comment1.txt");1213 Relationship isConnected = new IsConnectedRelationship();1415 isConnected.intertwine(comment, video);1617 this.data.addNode(video);1819 System.out.println(this.data);20 }21 }
47
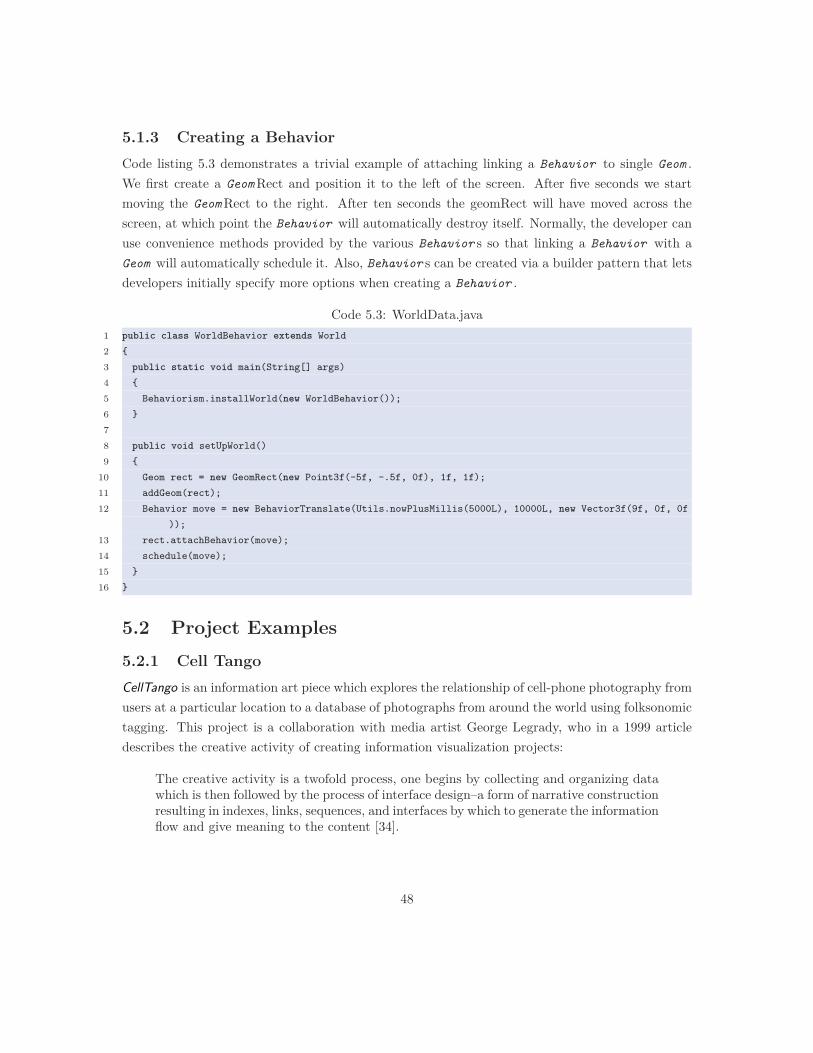
5.1.3 Creating a BehaviorCode listing 5.3 demonstrates a trivial example of attaching linking a Behavior to single Geom .We first create a GeomRect and position it to the left of the screen. After five seconds we startmoving the GeomRect to the right. After ten seconds the geomRect will have moved across thescreen, at which point the Behavior will automatically destroy itself. Normally, the developer canuse convenience methods provided by the various Behavior s so that linking a Behavior with aGeom will automatically schedule it. Also, Behavior s can be created via a builder pattern that letsdevelopers initially specify more options when creating a Behavior .
Code 5.3: WorldData.java1 public class WorldBehavior extends World2 {3 public static void main(String[] args)4 {5 Behaviorism.installWorld(new WorldBehavior());6 }78 public void setUpWorld()9 {
10 Geom rect = new GeomRect(new Point3f(-5f, -.5f, 0f), 1f, 1f);11 addGeom(rect);12 Behavior move = new BehaviorTranslate(Utils.nowPlusMillis(5000L), 10000L, new Vector3f(9f, 0f, 0f
));13 rect.attachBehavior(move);14 schedule(move);15 }16 }
5.2 Project Examples5.2.1 Cell TangoCellTango is an information art piece which explores the relationship of cell-phone photography fromusers at a particular location to a database of photographs from around the world using folksonomictagging. This project is a collaboration with media artist George Legrady, who in a 1999 articledescribes the creative activity of creating information visualization projects:
The creative activity is a twofold process, one begins by collecting and organizing datawhich is then followed by the process of interface design–a form of narrative constructionresulting in indexes, links, sequences, and interfaces by which to generate the informationflow and give meaning to the content [34].
48
Users interact with the installation via their cell phones by sending photos and tags to a dedicatedemail address which forwards the information to a Flickr account. The software then checks Flickrevery few seconds to see if new user-submitted photos have arrived. CellTango uses the behaviorismframework to simplify a number of tasks such as animation, web services, data navigation andrepresentation. In each of these cases Behavior s are used both to schedule the entire sequence ofdata retrieval and animation as well as to manage the individual visual updates within the scene.The CellTango project extends the World lass and includes a custom scheduler that communicateswith Flickr using the FlickrAPI wrapper. The results of the FlickrAPI requests are parsed andstored in the data graph, which are then used by the different animations in various ways.
For example, in one view, the "Fireworks" view, custom Behavior s are used to animate themovement of a photo from the bottom of the screen into the center so that it looks somewhat likethe arc of a firework. A Geom is created off-screen, positioned randomly along the x-axis. This Geom
has an attached node which links to a PhotoNode within the data graph. A trajectory is chosenand then a Behavior attached to the Geom so that the geom moves smoothly along the trajectorywithin a certain number of milliseconds. At the same time a second Behavior is attached to theGeom which controls the spin of the Geom as it moves along the trajectory. These two Behavior sare synchronized to start and stop at the same time. When the Geom reaches the end of thetrajectory, it chooses a small number of tags that are connected to the photo node and createsGeoms representing these tags. Behavior s are attached to these tag Geoms which stream out fromit for a short length of time. When this streaming end, The TagNode s attached to the Geoms aretraversed and a small number of photos connected to the tag are retrieved and attached to thescene.
Although this is a relatively simple visualization to describe, in nonetheless requires the creationof a number of Geoms and Behavior s which are connected to Node s in the data graph. In stage1, recent photo Node s are gathered from data graph; photo Geoms created from photo Node s;trajectory Behavior attached to photo Geoms , and spin Behavior s are attached to photo Geoms .In stage 2, a subset of related tags gathered from data graph using photo Node as entry; tag Geoms
created from the tag nodes; and translation Behavior attached to photo Geoms . In stage 3, a subsetof related photos gathered from data graph using tag Node as entry; photo Geoms created fromphoto Node s; and translate Behavior s are attached to photo Geoms . In stage 4, a fade Behavior
is attached to original photo Geom , which propagates through the scene graph and thus fades theentire "firework". Although this simple firework animation is made up of a number of discrete parts,they are easy to program and coordinate.
Another view uses an incremental bin-packing algorithm to place photos in a tightly fittingcover across the entire screen. A traversal of the data graph retrieves a subset of recent photosand a union of related tags to this subset. The aspect ratios of each photo and tag are sent tothe bin-packing algorithm which determines the layout. Once this is done, Behavior s are used to
49
time the creation of photo Geoms and their addition of photos into the layout. As in the previousview, behaviors are used to time the execution of other behaviors which make changes to the visualelements. The meta-Behavior s are attached to the World tself, and have access to all the elementsin the scene that are attached to the World And thus a meta Behavior can reason about theelements in the scene when scheduling other Behavior s. For instance, after all of the photos andtags are positioned in the scene using the bin packing algorithm and an amount of time has passedthe Geoms closest to the bottom of the screen fall of the screen and are destroyed. This is repeatedlyfollowed by the next closest until all the Geoms are gone.
5.2.2 Coil MapsThe coil map algorithm is an animated variation of a tree map [51] that shows temporal changesin a geographical representation. This algorithm was used in one of the 3-screen visualizations forthe project DataFlow designed by George Legrady Studio. It is currently installed in the corporateheadquarters of Corporate Executive Board (CEB) in Washington, DC. Data representing thenumber of elements related to user interaction on the CEB website is stored within the data graph,such as geographical location of the user, what kind of account they have, search terms they usedto find particular documents, and what section of the CEB website they are searching. New data isretrieved every 5 minutes from a centralized SQL database and outdated data is purged once it isan hour old. At the start of each iteration of the geographical visualization a sample of the searchesfrom the last hour is collected. The visualization begins with a map of the world broken into 2048∗3cells. Each of the search samples are processed in order and the cell containing the location expandsdistorting the world map slightly. After a number of samples has have been processed it is easyto tell which parts of the world have active users. As in the previous demo Behavior s are usedboth to sequence the order of data processing and the scheduling of Behavior s that update thevisual appearance of the map. After all the samples are processed, each of the Behavior s used tochange the visual appearance are "rewound" at a faster rate, and the coil map "unwinds" back toits original state. Because each of the visual behaviors runs asynchronously and because the speedof the cell expansion animation may be slower than the rate of processing new samples, the overalleffect is that the map changes in a fluid manner.
50
6 Conclusion
The behaviorism framework is still in some ways a work in progress. However, at the same time,it has been used to create a variety of projects which have been shown in museums, galleries, andconferences including, among others: the Davis Museum at Wellesley College; the National ScienceFoundation in Washington, DC; the International Symposium of Electronic Arts; the Beall Centerat UC Irvine; the eARTS festival in Shanghai, China; and at Le Theatre Scene Nationale de Poitiers,France. The projects are stable and run indefinitely (more or less) without incident. Moreover,they have been easier to create than they would have otherwise if each one needed to build toolsfrom scratch or to integrate disparate libraries to achieve the same functionality.
While the idea of using a data graph to store and traverse information is of course not new, theintegration of flexible Behavior s with the semantic data graph creates exciting potentials to beexplored. In particular, it may allow developers to think of the data graph as more than merely adifferent kind of database, but also a tool for modelling dynamic systems. Likewise, scene graphs arewidely available, but the integration with the behaviorism timing graph makes it easier to programanimate and reason about visual objects. While the primary goal of behaviorism is to provide aframework for making aesthetic interactive information visualization pieces, projects that use it cannot only represent existing data, but analyze it, reason about, and create it.
The primary way in which behaviorism grows is through the creation of new projects. Theseprojects, each with different requirements, push the boundaries of the framework, which has led toa more flexible and integrated conception of data and scheduling. Using behaviorism in differenttypes of projects would no doubt push hitherto unforeseen boundaries. Of course, part of theusefulness of the framework is that it is lightweight and it is unclear if attempting to integratefurther components or to extend the existing ones would create unneeded complexity.
Some parts of the framework overlap with the popular Processing framework, also written inJava. Since that community has created libraries for a wide variety of tasks, it makes sense tocontribute aspects of this framework so that they could integrate with existing functionality. Forinstance, the video library created for behaviorism which uses the Java Media Components has beenported to Processing [20]. Adapting the core components so that are accessible from within theProcessing rendering loop might be useful for certain projects. That is, behaviorism could be used
51
as a library, available to other frameworks, while still being a standalone framework.The data graph created for behaviorism is quite lightweight and stores everything in memory.
While this is acceptable for small projects, for large projects with lots of information, this requireslots of communication with an external database or file system as only a portion of the data canbe available at any given time. Another graph database, Neo4j , is becoming more widely used andhas proven to be robust using billions of nodes using a disk-based storage manager [15]. It mightmake sense to adapt the analyzers, collectors, and planes of the behaviorism data graph to directlyextend from the neo4j library.
One aspect of behaviorism that was discussed briefly in chapter 5 is the availability of a separate"examples" package. In addition to providing demonstrations of some of the basic functionality,it also contains examples of dynamic layout algorithms including a bin-packing algorithm and ananimated treemap algorithm (called a coil map). While the aim of these example algorithms isto illustrate to developers how they can create their own visualizations, it would nonetheless beuseful to include a wider selection of examples which utilize the behaviorism components. Similarly,while different projects have used the data graph to perform analyses of data, it would be useful toexplicitly include a range of data analysis demonstrations in the examples package.
The latest snapshots of behaviorism and the examples package can be downloaded from the coderepository located at http://github.com/angusforbes/behaviorism.
52
References
[1] Jans Aasman. Social network analysis and geotemporal reasoning in a web 3.0 world.Computational Science and Engineering, IEEE International Conference on, 4:546–548, 2009.
[2] J. R. Abrial. Data semantics. In J. W. Klimbie and K. L. Koffeman, editors, Data basemanagement : proceedings of the IFIP Workshop Conference on Data Base Management,pages 1–60, New York, 1974. American Elsevier.
[3] Michele Bosi. Visualization library: A lightweight c++ opengl middleware for 2d/3dgraphics. <http://www.visualizationlibrary.com>, November 2009.
[4] J. Broekstra, A. Kampman, and F. Van Harmelen. Sesame: A generic architecture for storingand querying rdf and rdf schema. Lecture Notes in Computer Science, pages 54–68, 2002.
[5] S. Burbeck. Applications programming in smalltalk-80 (tm): How to usemodel-view-controller (mvc), 1987.<http://st-www.cs.uiuc.edu/users/smarch/st-docs/mvc.html>, 1987.
[6] D. Burns and R. Osfield. Open scene graph a: Introduction, b: Examples and applications.In Proceedings of the IEEE Virtual Reality 2004. IEEE Computer Society Washington, DC,USA, 2004.
[7] N. Burtnyk and M. Wein. Computer generated key frame animation. Journal of the Societyof Motion Picture and Television Engineers, 80(3):149–153, 1971.
[8] Peter Pin-Shan Chen. The entity-relationship model—toward a unified view of data. ACMTrans. Database Syst., 1(1):9–36, 1976.
[9] Matthew J. Conway. Alice: Easy-to-Learn 3D Scripting for Novices. PhD thesis, Universityof Virginia, 1997.
[10] Diane J. Cook and Lawrence B. Holder. Mining graph data. Wiley-Interscience, HobokenN.J., 2007.
[11] Jay T. L. Cornwall. Efficient multiple pass, multiple output algorithms on the gpu. In 2ndEuropean Conference on Visual Media Production, pages 253–262, 2005.
[12] Cycling ’74. Max / msp / jitter. <http://cycling74.com/products/maxmspjitter/>,November 2009.
[13] David H. Eberly. 3D game engine architecture: engineering real-time applications with WildMagic. Morgan Kaufman Publishers, Amsterdam, 2005.
53
[14] Anthony Eden. flickrj. <http://flickrj.sourceforge.net>, November 2009.
[15] Emil Eifrem. Neo4j, the graph database. <http://neo4j.org>, November 2009.
[16] Katja Einsfeld, Achim Ebert, and Jurgen Wolle. Hannah: A vivid and flexible 3d informationvisualization framework. International Conference on Information Visualisation, pages720–725, 2007.
[17] Charles J. Fillmore. The case for case. In E. Bach and R. Harms, editors, Universals inLinguistic Theory. Holt, Rinehart & Winston, New York, 1968.
[18] Flickr. Flickr services. <http://www.flickr.com/services/api/>, 2009.
[19] Angus Graeme Forbes. behaviorism code repository.<http://github.com/angusforbes/behaviorism>, November 2009.
[20] Angus Graeme Forbes. jmcvideo 1.2 : Java media components library for jogl & processing.<http://www.mat.ucsb.edu/ a.forbes/PROCESSING/jmcvideo/>, November 2009.
[21] Angus Graeme Forbes. Portfolio 2009. <http://www.mat.ucsb.edu/~a.forbes>, September2009.
[22] Franz Inc. Allegrograph rdfstore. <http://www.franz.com/agraph/allegrograph>, November2009.
[23] Benjamin Jotham Fry. Organic information design. Master’s thesis, Massachusets Instituteof Technology, 1997.
[24] Benjamin Jotham Fry. Computational information design. PhD thesis, MassachusettsInstitute of Technology, 2004.
[25] B. Goetz, T. Peierls, J. Bloch, J. Bowbeer, D. Holmes, and D. Lea. Java concurrency inpractice. Addison-Wesley, 2006.
[26] Simon Green. The opengl framebuffer object extension. Technical report, Game DevelopersConference, 2005.
[27] Ralf Hartmut Güting. Graphdb: Modeling and querying graphs in databases. In VLDB ’94:Proceedings of the 20th International Conference on Very Large Data Bases, pages 297–308,San Francisco, CA, USA, 1994. Morgan Kaufmann Publishers Inc.
[28] Jeffrey Heer, Stuart K. Card, and James A. Landay. prefuse: a toolkit for interactiveinformation visualization. In CHI ’05: Proceedings of the SIGCHI conference on Humanfactors in computing systems, pages 421–430, New York, NY, USA, 2005. ACM.
[29] Jeff Heflin. Owl web ontology language uses cases and requirements.<http://www.w3.org/TR/webont-req/>, February 2004.
[30] Kitware, Inc. The visualization toolkit. <http://www.vtk.org>, November 2009.
[31] Graham Klyne and Jeremy J. Carroll. Resource description framework (rdf): Concepts andabstract syntax. <http://www.w3.org/TR/2004/REC-rdf-concepts-20040210/>, February2004.
54
[32] G.E. Krasner and S.T. Pope. A description of the model-view-controller user interfaceparadigm in the smalltalk-80 system. Journal of Object Oriented Programming, 1(3):26–49,1988.
[33] Graham Lea. Simple log, a logging anti-framework. <https://simple-log.dev.java.net>, 2009.
[34] George Legrady. Intersecting the virtual and the real: Space in interactive mediainstallations. Wide Angle, 21(1):104–113, 1999.
[35] Zach Lieberman, Theodore Watson, and Arturo Castro. Openframeworks.<http://www.openframeworks.cc>, November 2009.
[36] Brian McBride. Jena: A semantic web toolkit. IEEE Internet Computing, pages 55–59, 2002.
[37] Michael Meyer, Tudor Gîrba, and Mircea Lungu. Mondrian: an agile informationvisualization framework. In SoftVis ’06: Proceedings of the 2006 ACM symposium onSoftware visualization, pages 135–144, New York, NY, USA, 2006. ACM.
[38] Alex Miller. Java 7. <http://tech.puredanger.com/java7>, November 2009.
[39] Marvin L. Minsky. Semantic Information Processing. MIT Press, 1969.
[40] Tomas Möller, Eric Haines, and Naty Hoffman. Real-time rendering. A.K. Peters, Wellesley,Mass., 3rd ed edition, 2008.
[41] Hubert Nguyen. Gpu gems 3. Addison-Wesley Professional, 2007.
[42] Chris Oliver. Chris oliver’s weblog. <http://blogs.sun.com/chrisoliver>, December 11, 2008.
[43] Joshua O’Madadhain, Danyel Fisher, and Tom Nelson. Jung: Java universal network/graphframework. <http://jung.sourceforge.net/>, April 2009.
[44] "Princess Polymath". Graph databases are the new black.<http://www.princesspolymath.com>, June 2009.
[45] Miller Puckette. Pure data: recent progress. In Proceedings of the Third IntercollegeComputer Music Festival, pages 1–4. Citeseer, 1997.
[46] M.R. Quillian. Semantic memory. In Marvin L. Minksy, editor, Semantic InformationProcessing, pages 227–270. MIT press, 1969.
[47] Kurt Rohloff, Mike Dean, Ian Emmons, Dorene Ryder, and John Sumner. An evaluation oftriple-store technologies for large data stores. In Robert Meersman, Zahir Tari, and PilarHerrero, editors, OTM Workshops, volume 4806 of Lecture Notes in Computer Science, pages1105–1114. Springer, 2007.
[48] Nicholas Roussopoulos and John Mylopoulos. Using semantic networks for data basemanagement. In VLDB ’75: Proceedings of the 1st International Conference on Very LargeData Bases, pages 144–172, New York, NY, USA, 1975. ACM.
[49] W.J. Schroeder, K.M. Martin, and W.E. Lorensen. The design and implementation of anobject-oriented toolkit for 3D graphics and visualization. In Proceedings of the 7th conferenceon Visualization’96. IEEE Computer Society Press Los Alamitos, CA, USA, 1996.
55
[50] Stuart C. Shapiro. Encyclopedia of Artificial Intelligence. John Wiley & Sons, Inc., NewYork, NY, USA, 1992.
[51] B. Shneiderman. Tree visualization with tree-maps: 2-d space-filling approach. ACMTransactions on graphics (TOG), 11(1):92–99, 1992.
[52] Ben Shneiderman. Designing the user interface: strategies for effective human-computerinteraction. Addison-Wesley Longman Publishing Co., Inc. Boston, MA, USA, 1997.
[53] Yedendra Babu Shrinivasan and Jarke J. van Wijk. Supporting the analytical reasoningprocess in information visualization. In CHI ’08: Proceeding of the twenty-sixth annualSIGCHI conference on Human factors in computing systems, pages 1237–1246, New York,NY, USA, 2008. ACM.
[54] Paul S. Strauss. Iris inventor, a 3d graphics toolkit. ACM SIGPLAN Notices,28(10):192–200, 1993.
[55] Sun Microsystems. Java standard edition 6 api specification.<http://java.sun.com/javase/6/docs/api/>, November 2009.
[56] Sun Microsystems. Javafx 1.2 api, November 2009.
[57] Deborah F. Swayne, Andreas Buja, and Duncan Temple Lang. Exploratory visual analysis ofgraphs in GGobi. In Jaromir Antoch, editor, CompStat: Proceedings in ComputationalStatistics, 16th Symposium. Physica-Verlag, 2004.
[58] Deborah F. Swayne, Duncan Temple Lang, Andreas Buja, and Dianne Cook. GGobi:evolving from XGobi into an extensible framework for interactive data visualization.Computational Statistics & Data Analysis, 43:423–444, 2003.
[59] The OpenEnded Group. field: a development environment for making digital art.<http://openendedgroup.com/field/>, November 2009.
[60] VVVV group. Vvvv: a multipurpose toolkit,. <http://vvvv.org>, November 2009.
[61] José San Pedro Wandelmer. Fobs c++ wrapper for ffmpeg. <http://fobs.sourceforge.net>,June 2008.
[62] Takashi Washio and Hiroshi Motoda. State of the art of graph-based data mining. SIGKDDExplor. Newsl., 5(1):59–68, 2003.
[63] Scott Wheeler. On building a stupidly fast graph database. <http://blog.directededge.com>,February 2009.
[64] Hank Williams. Graphs: A better database abstraction.<http://whydoeseverythingsuck.com>, March 28, 2008.
[65] M. Woo, J. Neider, T. Davis, and D. Shreiner. OpenGL programming guide: the official guideto learning OpenGL, version 1.2. Addison-Wesley Longman Publishing Co., Inc. Boston,MA, USA, 1999.
[66] R.S. Wright and B. Lipchak. OpenGL superbible. Sams Indianapolis, IN, USA, 2004.
[67] Xith3D developers. Home of the xith3d project. <http://xith.org>, November 2009.
56