Embed Size (px)
Citation preview
Integrated Master Degree in Chemical Engineering
Antifoam in Food Industrial Application
Understanding of the Mechanism and Product Development
Master Thesis
by
Catarina Ferreira Lucas de Sousa
Developed within the course unit of Dissertation
Performed in
GOVI N.V.
FEUP’s supervisor: Professor José Luís Cabral da Conceição Figueiredo
GOVI’s Supervisor: Industrial Engineer Ilse Hostens
Chemical Engineering Department
February, 2013
Antifoam in Food Industrial Application
ii
Antifoam in Food Industrial Application
iii
CONFIDENTIAL NOTICE – IMPORTANT – PLEASE READ FIRST
This document may contain confidential information proprietary to GOVI NV. It is
therefore strictly forbidden to publish, cite or make public in any way this document
or any part of this without the express written permission by GOVI NV. Under no
circumstance this document may be communicated to or put at the disposal of third
parties; photocopying or duplicating it in any other way is strictly prohibited.
Disregarding the confidential nature of this document may cause irremediable
damage to GOVI NV.
NOTA CONFIDENCIAL – IMPORTANTE – POR FAVOR LER PRIMEIRO
Este documento pode conter informação confidencial propriedade da GOVI NV.
Portanto é estritamente proibido publicar, citar ou tornar público de qualquer forma
este documento ou qualquer parte dele sem a expressa permissão escrita pela GOVI
NV. Sob nenhuma circunstância este documento pode ser comunicado a ou posto à
disposição de uma terceira parte; fotocopiar ou duplicar este de qualquer forma é
estritamente proibido. Desconsiderando a natureza confidencial deste documento
pode causar danos irremediáveis para a GOVI NV.
All the work presented in this document is subject to a confidentiality agreement
between the company and the student. All technical information available in the
company on the chemicals and methods used was made available to the author of
this thesis. All the work was revised to ensure that no information pertaining to the
company would be used for other purposes.
Antifoam in Food Industrial Application
iv
Acknowledgments
I would like to thank all the people at GOVI that in one way or another contributed to
the accomplishment of my work, especially to my supervisor Ilse Hostens for her
patience, availability, constant incentive and support. For their empathy given to the
foreign students and the possibility given by the company to make this internship
possible.
To my fellow colleagues, Luísa and Mafalda, that lived this experience with me, for
their companionship, support, incentive and unconditional help through time.
To Professor José Luís Figueiredo, my supervisor at FEUP, for his advices, availability,
time and support.
To Professor Luís Miguel Madeira, for his availability and for giving me this
opportunity.
To my beloved friends who accompanied me during my academic journey, helping me
when I needed it, especially Raquel, Luísa, Sara, Sofia and João.
And finally a big thank you to my parents, sister and Nuno for their love,
unconditional support and incentive in every moment of my life.
Antifoam in Food Industrial Application
v
Resumo
O principal objetivo do presente trabalho incidiu sobre o desenvolvimento de um
produto anti-espuma, baseado no que a empresa retém actualmente no mercado,
que fosse de acordo com as imposições colocadas pelo consumidor. Foi dado a
entender, por um consumidor, que o produto comercializado possuía falhas
substanciais após um curto período de compra/fabrico. Com recurso a várias análises
que visavam a resolução do problema, os requisitos impostos foram cumpridos e
chegou-se à composição ideal de um produto anti-espuma bastante melhorado e com
bons resultados.
Ao longo do trabalho vários testes, baseados em análise bibliográfica, foram
utilizados como forma de distinção entre os vários produtos formulados. Os valores
ótimos primordiais como os valores de pH, da temperatura da água, a percentagem
ideal de sílica na solução, entre outros, foram encontrados pela assimilação dos
vários resultados obtidos e a diferenciação dos vários tipos de produtos anti-espuma
formulados assim conseguida.
O novo produto cumpre então todas as condições impostas pelo consumidor tendo
alcançado resultados melhores do que os obtidos com o produto comercializado, o
que leva a uma possível reposição de mercado.
Palavras-chave: Antifoaming, Foam film, Defoaming, Foaming.
Antifoam in Food Industrial Application
vi
Abstract
The main purpose of the present work focused on the development of an antifoaming
product, based on the one that the company has currently on the market, in an
attempt to fulfill the requirements defined by the consumer. It was noticed by a
consumer that the commercialized product had substantial flaws after a short period
of usage. After profound research and experimentation the requirements have been
met and the ideal product composition with good results was reached.
After intensive study, several tests were selected and applied to differentiate the
various formulated products. The optimum values such as the pH value, the water
temperature, the ideal silica percentage on the solution, among others, were found
by the assimilation of the various results obtained, allowing a clear distinction of the
formulated antifoam products.
The new product meets all the specifications defined by the consumer and since it
has accomplished better results than the commercialized one it may lead to a
possible market replacement.
Keywords: Antifoaming, Foam film, Defoaming, Foaming.
Antifoam in Food Industrial Application
vii
Declaração
Declara, sob compromisso de honra, que este trabalho é original e que todas
as contribuições não originais foram devidamente referenciadas com identificação da
fonte.
XCatarina Sousa
Antifoam in Food Industrial Application
viii
TABLE OF CONTENTS
Table of Contents .............................................................................. viii
List of Figures .................................................................................... xi
List of Tables ................................................................................... xiii
Notation and Acronyms ........................................................................ xiv
Chapter 1 .......................................................................................... 1
Introduction .................................................................................... 1
1.1 Context ............................................................................... 1
1.2 GOVI N.V. - Company Presentation .............................................. 1
1.3 State of art .......................................................................... 2
1.3.1 Brief history .................................................................... 2
1.3.2 Foam systems .................................................................. 2
1.3.3 Types of Antifoams ............................................................ 3
1.3.4 Fast and Slow antifoams ..................................................... 3
1.3.5 Antifoaming/Defoaming mechanism ........................................ 4
1.4 Thesis Purpose ...................................................................... 8
1.5 Thesis Arrangement ................................................................ 8
Chapter 2 .......................................................................................... 9
Test methods for antifoaming/defoaming effectiveness ................................ 9
2.1 Antifoaming cylinder test (Internal test method) .............................. 9
2.1.1 Summary ........................................................................ 9
2.1.2 Significance and use .......................................................... 9
2.1.3 Material ......................................................................... 9
2.1.4 Procedure ..................................................................... 10
2.2 Standard test method (ASTM – E2407, 2009) ................................... 11
2.2.1 Summary ....................................................................... 11
2.2.2 Significance and use ......................................................... 11
Antifoam in Food Industrial Application
ix
2.2.3 Material ........................................................................ 11
2.2.4 Procedure ..................................................................... 12
2.2.5 Calculations ................................................................... 12
2.3 Antifoaming/defoaming Ultra-turrax T50 test (Internal test method) ..... 13
2.3.1 Summary ....................................................................... 13
2.3.2 Significance and use ......................................................... 13
2.3.3 Material ........................................................................ 13
2.3.4 Procedure ..................................................................... 14
2.3.5 Calculations ................................................................... 15
2.4 Assimilating pump test (Internal test method) ................................ 15
2.4.1 Summary ....................................................................... 15
2.4.2 Significance and use ......................................................... 15
2.4.3 Material ........................................................................ 16
2.4.4 Procedure ..................................................................... 16
Chapter 3 ......................................................................................... 17
Results and Discussion ....................................................................... 17
3.1 Reference antifoaming agent .................................................... 17
3.2 GOVI’s Oil based Antifoaming Agent ............................................ 18
3.2.1 Optimum storage temperature ............................................. 18
3.2.2 Optimum water pH value and temperature .............................. 20
3.2.3 Optimum silica type and mass percentage ............................... 22
3.2.4 Optimum oil type ............................................................. 24
3.2.5 Optimum tensioactive ....................................................... 25
3.3 Upgrade of GOVI’s oil based antifoaming agent ............................... 27
3.3.1 Antifoaming cylinder method (Internal test method) ................... 27
3.3.2 Standard Test Method (ASTM – E2407, 2009) ............................. 27
3.3.3 Antifoaming/defoaming ultra-turrax T50 test (Internal test method) 28
3.4 Silicone oil based antifoaming agent ........................................... 30
Antifoam in Food Industrial Application
x
3.5 Sample behavior on assimilating pump test ................................... 32
Chapter 4 ......................................................................................... 34
Conclusions and future Work ............................................................... 34
Chapter 5 ......................................................................................... 36
Work References .............................................................................. 36
Chapter 6 ......................................................................................... 37
Appendix ....................................................................................... 37
Antifoam in Food Industrial Application
xi
LIST OF FIGURES
Figure 1 - Company’s commercial logo. ...................................................... 1
Figure 2 - Photomicrograph of detergent foam.[3] ........................................... 2
Figure 3 - Foam evolution after foaming, comparison of the fast and slow antifoams.
[5].................................................................................................... 4
Figure 4 – Stages of foam evolution in the presence of slow antifoam [Foam height as
a function of time, Hf(t)] [4] ..................................................................... 4
Figure 5 – Narrowing of the PBs and nodes through stage I. [4] ............................ 5
Figure 6 – Stretching of the nodes and transport of the antifoam droplets to the PBs.
[4].................................................................................................... 5
Figure 7 – Illustration of the antifoaming/defoaming mechanism of silica/oil droplets
in an aqueous foam: 1.) Draining foam; 2.) Entry of the defoamer droplet into the
foam interface and spreading; 3.) Bridging between adjacent foam films; 4.)
Dewetting; 5.) Rupture of the foam film. [6] ................................................. 6
Figure 8 – Schematic presentation of the entry of an oily globule at the foam film
surface. [5] ......................................................................................... 7
Figure 9 - Foam volume as a function of time for RAP on the first and fourth week. 17
Figure 10 - Foam volume as a function of time for the sample 0120178.53 on the first
and fourth week (storage at room temperature). .......................................... 18
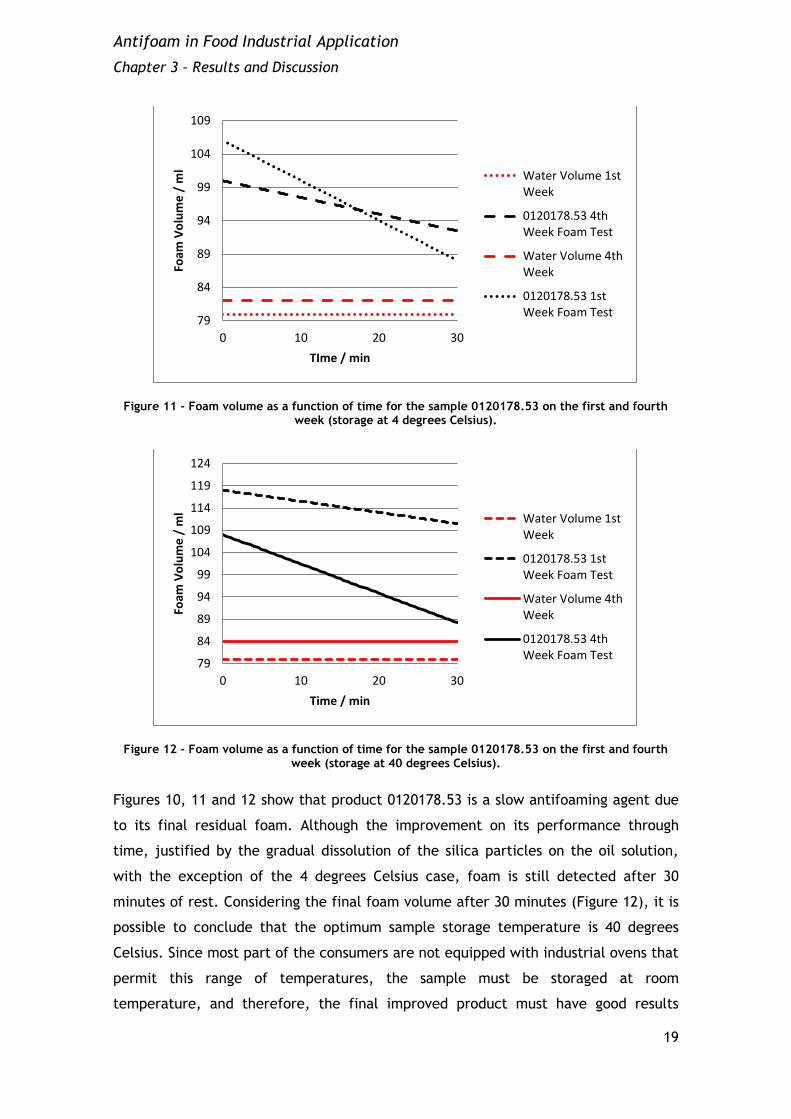
Figure 11 - Foam volume as a function of time for the sample 0120178.53 on the first
and fourth week (storage at 4 degrees Celsius). ........................................... 19
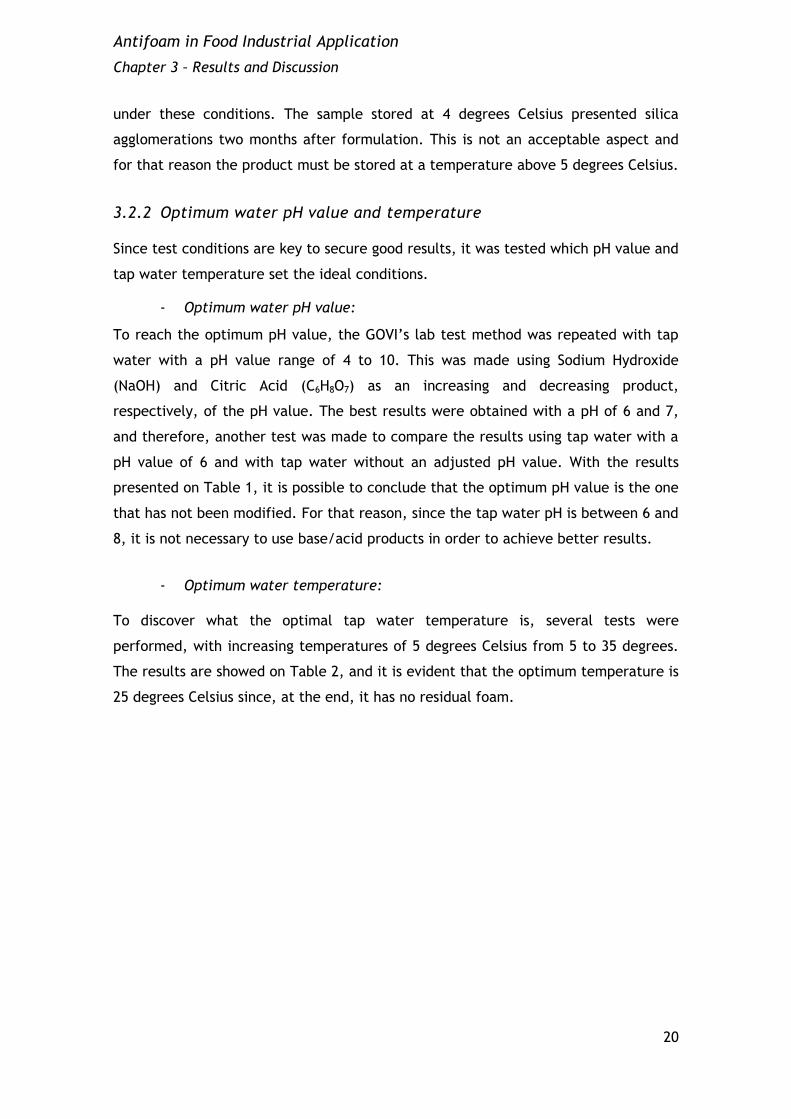
Figure 12 - Foam volume as a function of time for the sample 0120178.53 on the first
and fourth week (storage at 40 degrees Celsius). .......................................... 19
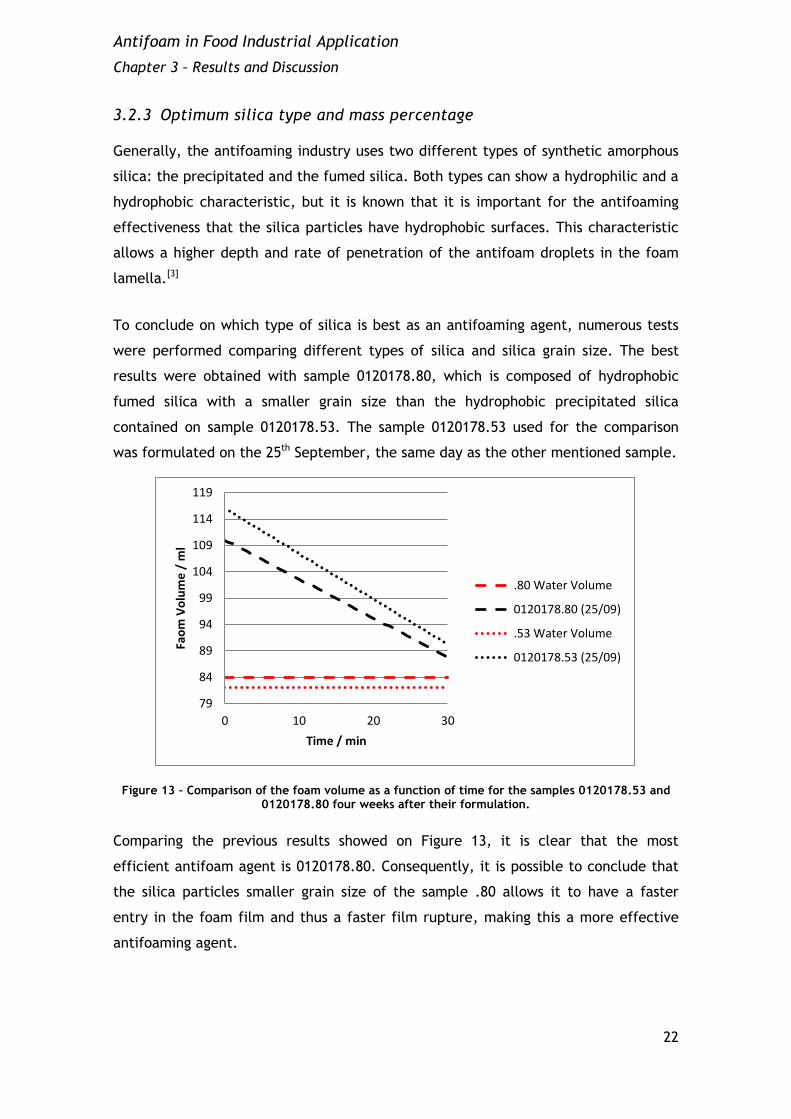
Figure 13 – Comparison of the foam volume as a function of time for the samples
0120178.53 and 0120178.80 four weeks after their formulation. ........................ 22
Figure 14 – Comparison of the foam volume as a function of time for samples .53,
.74, .75, .76, .77, .78 and .79 to compare the connection between the silica mass
percentage and its effectiveness. ............................................................ 23
Figure 15 - Comparison of the foam volume as a function of time for the samples
0120178.79 and 0120178.116. ................................................................. 24
Antifoam in Food Industrial Application
xii
Figure 16 - Comparison of the foam volume as a function of time for samples .53, .87
and .92 in order to select the best oil type is. ............................................. 25
Figure 17 - Comparison of the foam volume as a function of time for the samples .53,
.79 and .110 with the aim of discovering which the best tensioactive type is. ........ 26
Figure 18 – Solution’s surface aspect after adding the sample 0120178.110. .......... 26
Figure 19 - Comparison of the foam volume as a function of time for samples
0120178.53 and 0120178.79 using the antifoaming cylinder test. ....................... 27
Figure 20 - Comparison of the foam volume as a function of time for samples
0120178.79 and 0120178.190 with one drop of FA. ........................................ 30
Figure 21 - Comparison of the foam volume as a function of time for samples
0120178.79 and 0120178.190 with two drops of FA. ....................................... 31
Figure 22 - Comparison of the foam volume as a function of time for samples
0120178.79 and 0120178.190 with three drops of FA. ..................................... 31
Figure 23 – Residual foam volume of the blank solution after 30 minutes of rest. .... 32
Figure 24 – Results obtained with the blank solution on the assimilating pump test
method. .......................................................................................... 32
Figure 25 - Results obtained with the fresh starch/antifoaming solution on the
assimilating pump test method. .............................................................. 33
Figure 26 - Results obtained with the fresh starch/0120178.190 solution on the
assimilating pump test method. .............................................................. 37
Figure 27 - Results obtained with the fresh starch/0120178.116 solution on the
assimilating pump test method. .............................................................. 37
Figure 28 - Results obtained with the fresh starch/0120178.110 solution on the
assimilating pump test method. .............................................................. 37
Antifoam in Food Industrial Application
xiii
LIST OF TABLES
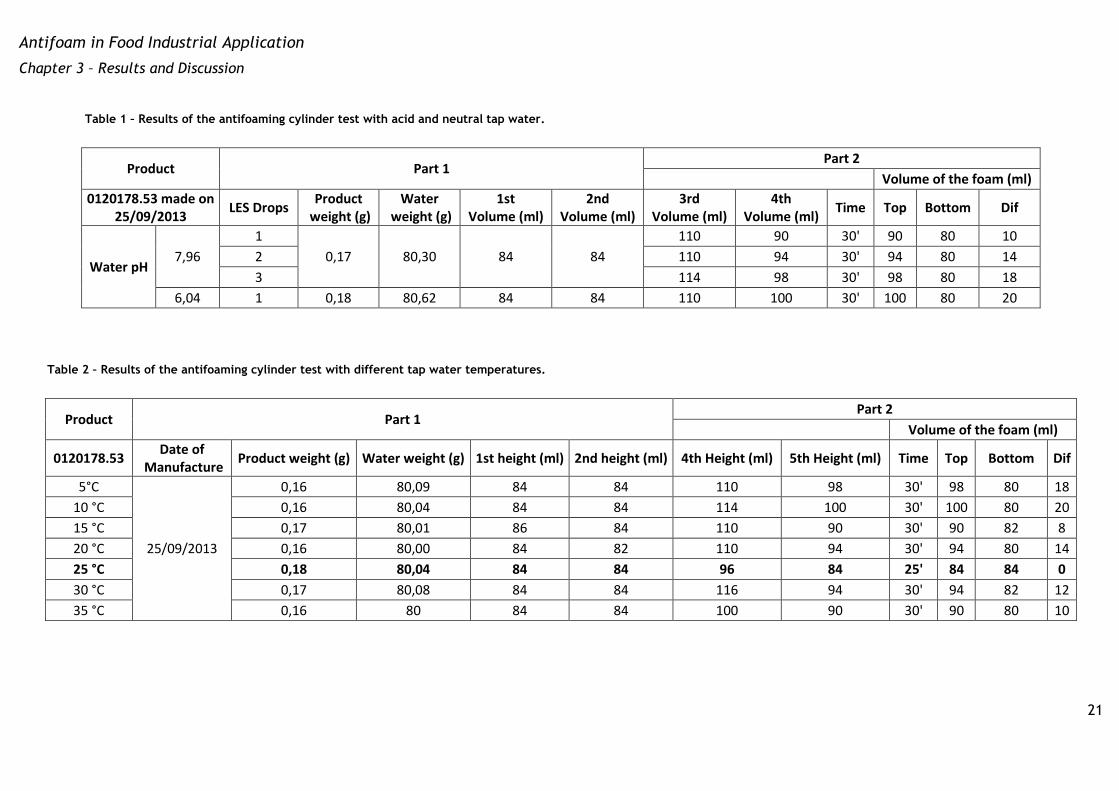
Table 1 – Results of the antifoaming cylinder test with acid and neutral tap water. . 21
Table 2 – Results of the antifoaming cylinder test with different tap water
temperatures. ................................................................................... 21
Table 3 – Results of the samples 0120178.53 and 0120178.79 using the Standard Test
Method (Blender Test Method). ............................................................... 28
Table 4 - Results of the samples 0120178.53 and 0120178.79 using the antifoaming
ultra-turrax T50 test. ........................................................................... 29
Table 5 - Results of the samples 0120178.53 and 0120178.79 using the defoaming
ultra-turrax T50 test. ........................................................................... 29
Antifoam in Food Industrial Application
xiv
NOTATION AND ACRONYMS
– Bridging coefficient;
– Entering coefficient;
– Ending foam volume;
– Initial foam volume;
– Foam Reduction;
– Foam height;
– Residual foam height;
– Capillary pressure;
– Spreading coefficient;
– Foam volume;
⁄ – Surface tension at the oil/air interface;
⁄ – Surface tension at the water/air interface;
⁄ – Surface tension at the water/oil interface;
AF – Antifoaming;
FA – Foaming Agent;
PBs – Plateau Borders;
RAP – External Reference Antifoaming Product;
1
CHAPTER 1
INTRODUCTION
This introductory chapter aims at describing the context involving the present work,
including the relevant literature review, and also regards the thesis organization in
its 6 Chapters.
1.1 CONTEXT
The prevention of the foaming dates back to the beginning of 20th century using
mechanical devices to suppress it. These ways were expensive due to the energy that
they required for their applications, and there so, to reduce the costs, chemical
methods were preferred to destroy foam. Since the late 1940s the antifoaming
agents were commercialized and found many applications in the pharmaceutical
industry, medicine, food industry, chemical industry, etc. From that time, the lab
research on the foam inhibitors begun and several works have been published. [1]
This work’s aim is to improve one of the company’s antifoaming agents that has been
commercialized and has a bad feedback from the customer. This product is applied
on a food industry department, and it was proposed a development of a new product
formulation in order to satisfy the customer needs.
1.2 GOVI N.V. - COMPANY PRESENTATION
GOVI N.V. is a family owned company that was created in 1910. It is dedicated to the
manufacturer of engineered process-chemicals that are supplied to a variety of
industries and the main production sites are located in Belgium, Italy, Serbia and
Russia. The company’s focus is to improve the existing self-made products and to
develop new products that are better performing and economically competitive. [2]
Figure 1 - Company’s commercial logo.
Antifoam in Food Industrial Application
Chapter 1 - Introduction
2
1.3 STATE OF ART
This work is based on two types of antifoaming agents, the oil based and the silicone
oil based antifoams. It was implemented four different test methods for
effectiveness of those antifoaming agents using different components on their
formulations. Therefore, this section addresses the relevant state of the art
concerning the antifoaming agents and the theoretical part that they follow.
1.3.1 Brief history
In general, the formation of stable foam causes problems in most industrial
processes, affecting directly the quality of the final product, reducing the carrying
capacity of containers or causing pumping problems, among others. That is why there
is a constant needing of antifoaming agents to reduce or completely eliminate the
volume of undesired foam. [3],[4]
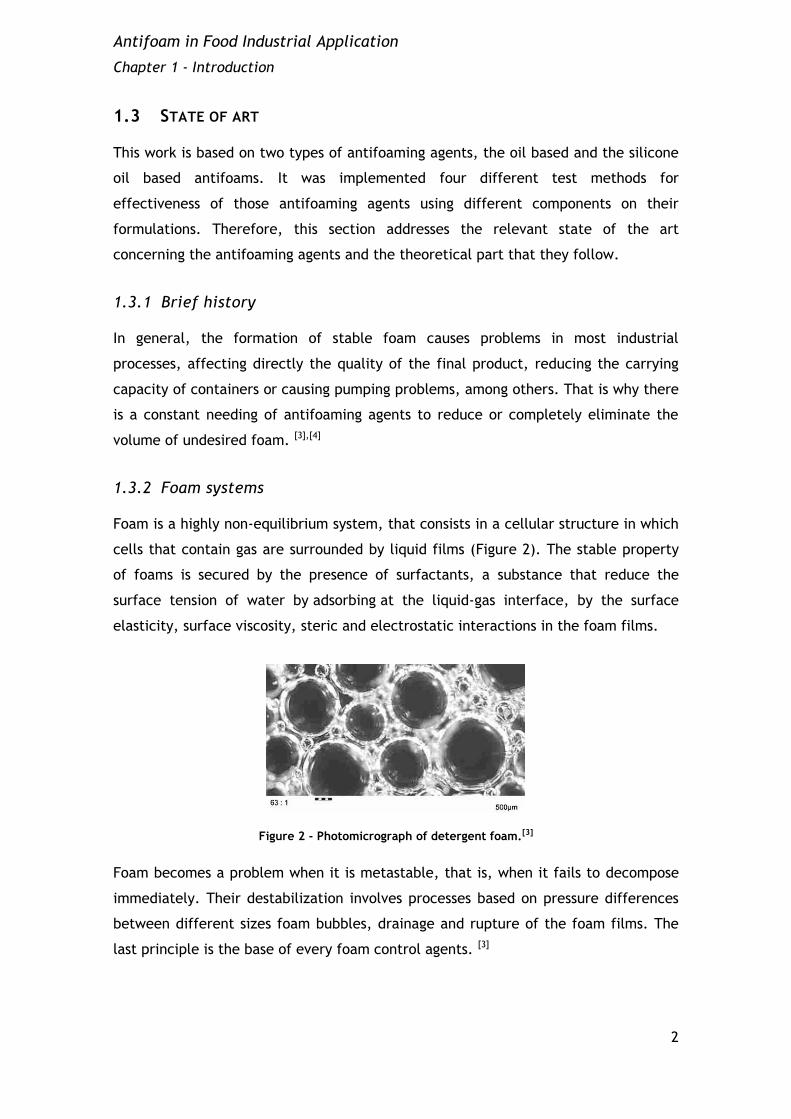
1.3.2 Foam systems
Foam is a highly non-equilibrium system, that consists in a cellular structure in which
cells that contain gas are surrounded by liquid films (Figure 2). The stable property
of foams is secured by the presence of surfactants, a substance that reduce the
surface tension of water by adsorbing at the liquid-gas interface, by the surface
elasticity, surface viscosity, steric and electrostatic interactions in the foam films.
Figure 2 - Photomicrograph of detergent foam.[3]
Foam becomes a problem when it is metastable, that is, when it fails to decompose
immediately. Their destabilization involves processes based on pressure differences
between different sizes foam bubbles, drainage and rupture of the foam films. The
last principle is the base of every foam control agents. [3]
Antifoam in Food Industrial Application
Chapter 1 - Introduction
3
1.3.3 Types of Antifoams
An efficient foam control agent uses appropriate hydrophobic solid particles, oil
drops or oil-solid compounds, depending on the specific foaming agent (surfactants,
proteins or soluble polymers). When all the antifoaming entities are dispersed in the
solution, they are called as “heterogeneous” antifoams. On the other hand, in some
specific cases, the foaming agent can also work as a suppression agent. In that case,
the antifoam agent is called “homogeneous”, less efficient antifoam compared with
the first one but with various advantages:
- Low costs;
- No residual stains on the final product;
- Food compatibility;
- Etc.
One of the biggest disadvantages of this type of antifoam is the fact that it is very
system-dependent, and the system conditions are difficult to predict and maintain as
optimum. [5]
1.3.4 Fast and Slow antifoams
The antifoams classification is divided into two large groups, which differ on the
location where the antifoam enters the air/water surface and begin the foam
destruction process, and consequently in their time scales.
Fast antifoams involve a foam film rupture mechanism that usually leads to complete
foam destruction within seconds and reduces the foaminess of the surfactant
solutions. Therefore these antifoams are preferred when the complete foam
suppressing is needed.
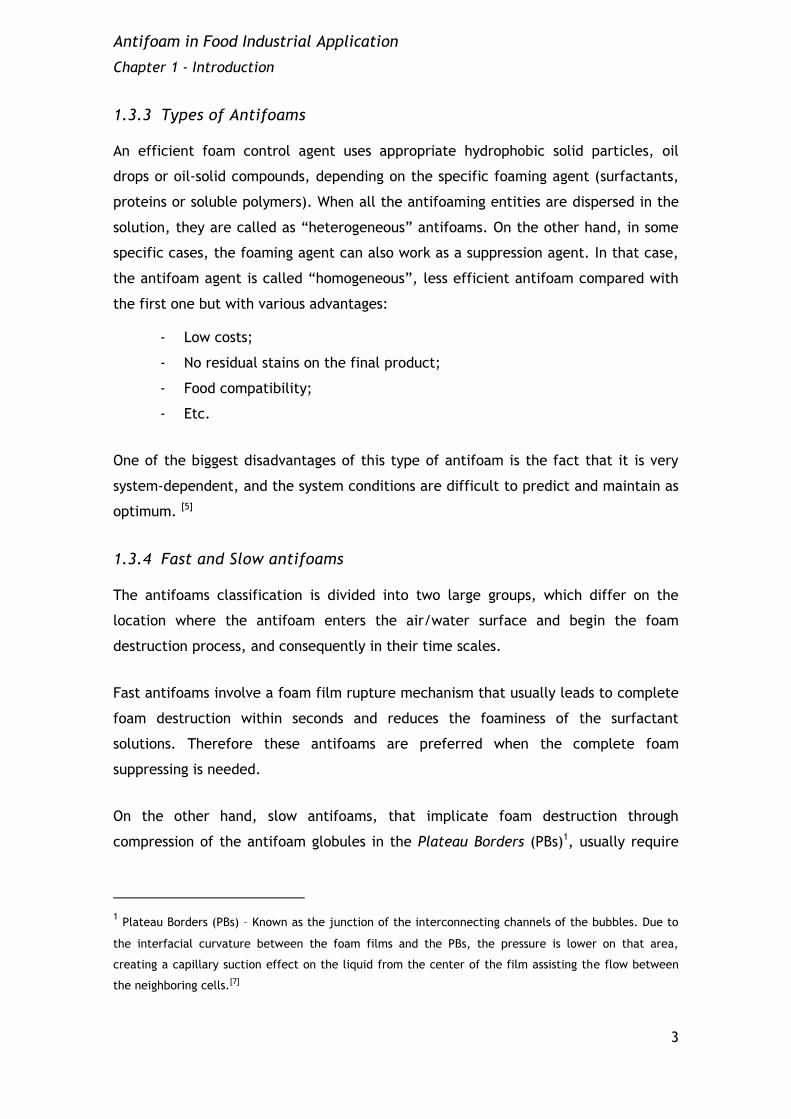
On the other hand, slow antifoams, that implicate foam destruction through
compression of the antifoam globules in the Plateau Borders (PBs)1, usually require
1 Plateau Borders (PBs) – Known as the junction of the interconnecting channels of the bubbles. Due to
the interfacial curvature between the foam films and the PBs, the pressure is lower on that area,
creating a capillary suction effect on the liquid from the center of the film assisting the flow between
the neighboring cells.[7]
Antifoam in Food Industrial Application
Chapter 1 - Introduction
4
many minutes or hours, due to the slow water drainage from the foam and residual
long-standing foam that remains on the last stage of the foam decay. [4],[5]
Figure 3 - Foam evolution after foaming, comparison of the fast and slow antifoams. [5]
The Figure 3 illustrates the difference referred before.
1.3.5 Antifoaming/Defoaming mechanism
- Slow Antifoams:
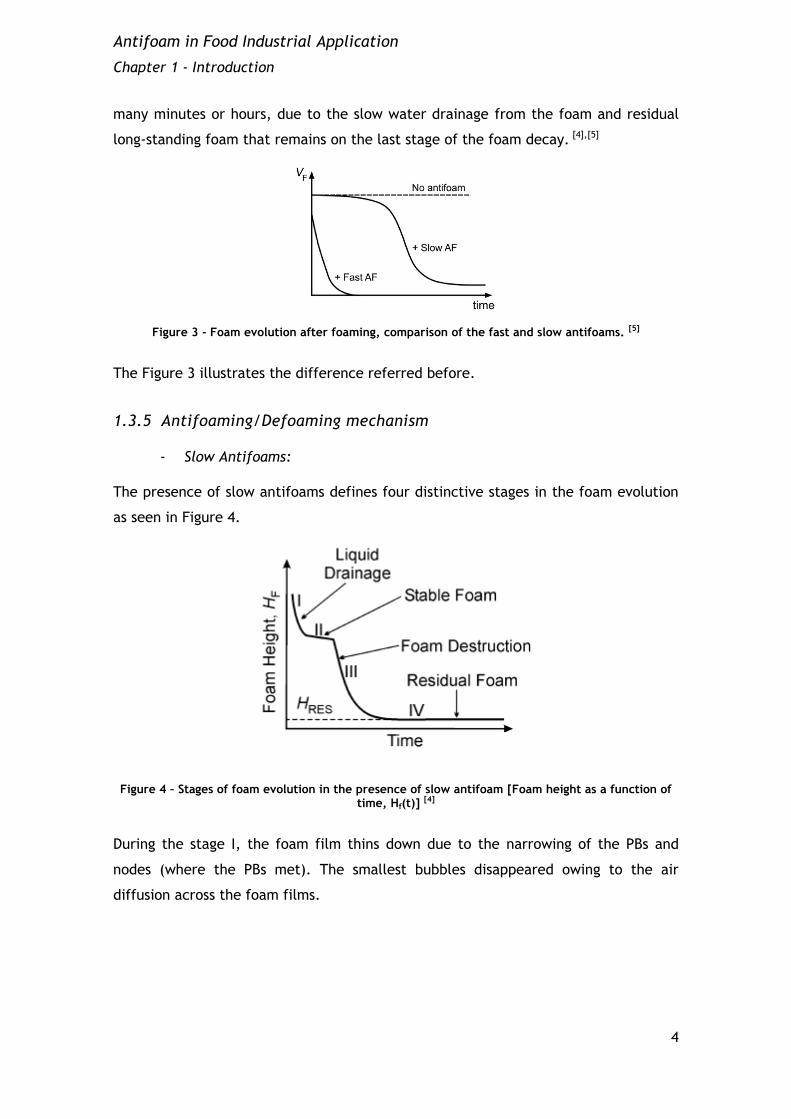
The presence of slow antifoams defines four distinctive stages in the foam evolution
as seen in Figure 4.
Figure 4 – Stages of foam evolution in the presence of slow antifoam [Foam height as a function of time, Hf(t)]
[4]
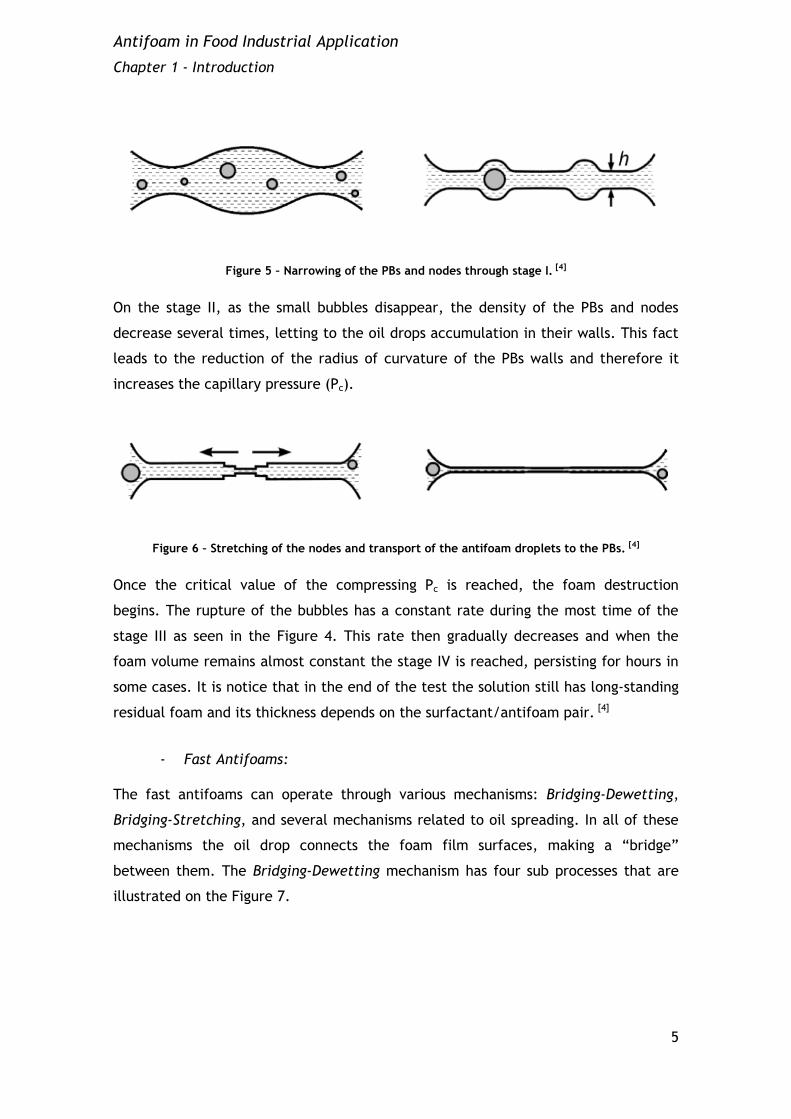
During the stage I, the foam film thins down due to the narrowing of the PBs and
nodes (where the PBs met). The smallest bubbles disappeared owing to the air
diffusion across the foam films.
Antifoam in Food Industrial Application
Chapter 1 - Introduction
5
Figure 5 – Narrowing of the PBs and nodes through stage I. [4]
On the stage II, as the small bubbles disappear, the density of the PBs and nodes
decrease several times, letting to the oil drops accumulation in their walls. This fact
leads to the reduction of the radius of curvature of the PBs walls and therefore it
increases the capillary pressure (Pc).
Figure 6 – Stretching of the nodes and transport of the antifoam droplets to the PBs. [4]
Once the critical value of the compressing Pc is reached, the foam destruction
begins. The rupture of the bubbles has a constant rate during the most time of the
stage III as seen in the Figure 4. This rate then gradually decreases and when the
foam volume remains almost constant the stage IV is reached, persisting for hours in
some cases. It is notice that in the end of the test the solution still has long-standing
residual foam and its thickness depends on the surfactant/antifoam pair. [4]
- Fast Antifoams:
The fast antifoams can operate through various mechanisms: Bridging-Dewetting,
Bridging-Stretching, and several mechanisms related to oil spreading. In all of these
mechanisms the oil drop connects the foam film surfaces, making a “bridge”
between them. The Bridging-Dewetting mechanism has four sub processes that are
illustrated on the Figure 7.
Antifoam in Food Industrial Application
Chapter 1 - Introduction
6
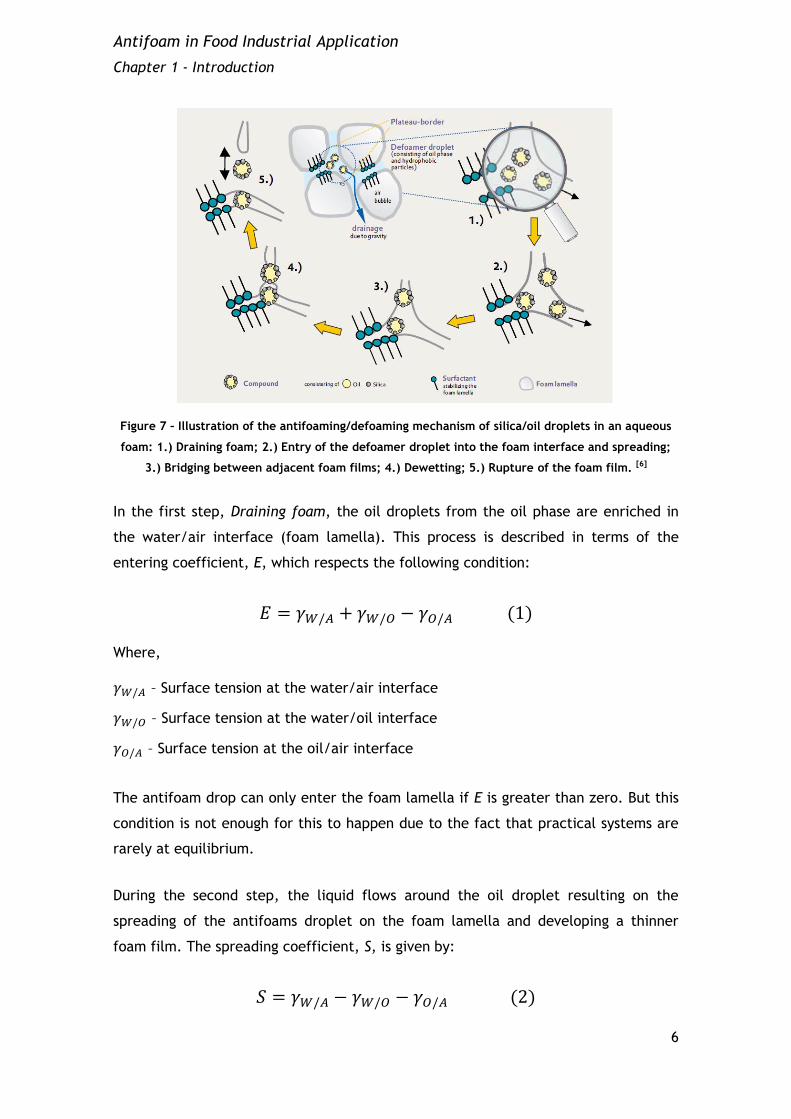
Figure 7 – Illustration of the antifoaming/defoaming mechanism of silica/oil droplets in an aqueous
foam: 1.) Draining foam; 2.) Entry of the defoamer droplet into the foam interface and spreading;
3.) Bridging between adjacent foam films; 4.) Dewetting; 5.) Rupture of the foam film. [6]
In the first step, Draining foam, the oil droplets from the oil phase are enriched in
the water/air interface (foam lamella). This process is described in terms of the
entering coefficient, E, which respects the following condition:
Where,
– Surface tension at the water/air interface
– Surface tension at the water/oil interface
– Surface tension at the oil/air interface
The antifoam drop can only enter the foam lamella if E is greater than zero. But this
condition is not enough for this to happen due to the fact that practical systems are
rarely at equilibrium.
During the second step, the liquid flows around the oil droplet resulting on the
spreading of the antifoams droplet on the foam lamella and developing a thinner
foam film. The spreading coefficient, S, is given by:
Antifoam in Food Industrial Application
Chapter 1 - Introduction
7
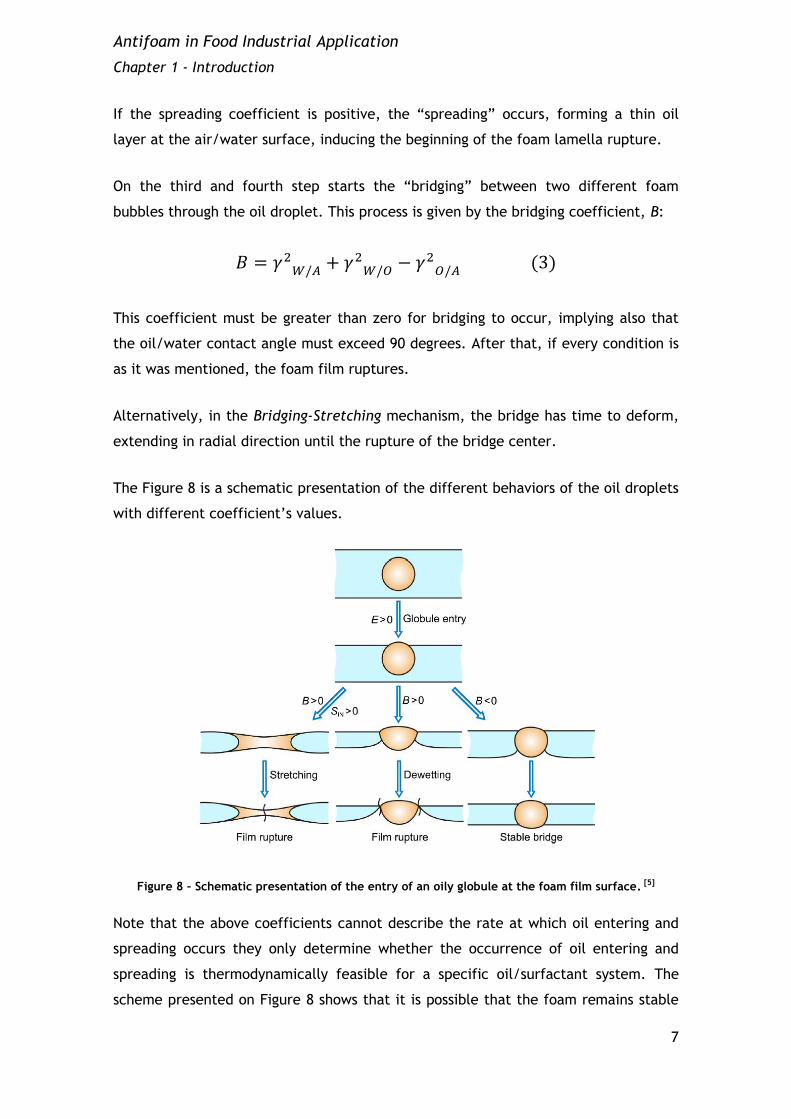
If the spreading coefficient is positive, the “spreading” occurs, forming a thin oil
layer at the air/water surface, inducing the beginning of the foam lamella rupture.
On the third and fourth step starts the “bridging” between two different foam
bubbles through the oil droplet. This process is given by the bridging coefficient, B:
This coefficient must be greater than zero for bridging to occur, implying also that
the oil/water contact angle must exceed 90 degrees. After that, if every condition is
as it was mentioned, the foam film ruptures.
Alternatively, in the Bridging-Stretching mechanism, the bridge has time to deform,
extending in radial direction until the rupture of the bridge center.
The Figure 8 is a schematic presentation of the different behaviors of the oil droplets
with different coefficient’s values.
Figure 8 – Schematic presentation of the entry of an oily globule at the foam film surface. [5]
Note that the above coefficients cannot describe the rate at which oil entering and
spreading occurs they only determine whether the occurrence of oil entering and
spreading is thermodynamically feasible for a specific oil/surfactant system. The
scheme presented on Figure 8 shows that it is possible that the foam remains stable
Antifoam in Food Industrial Application
Chapter 1 - Introduction
8
even when the entering coefficient is positive. It happens when the bridging
coefficient is negative, and therefore the film rupture does not occur. [3],[5],[8],[9]
1.4 THESIS PURPOSE
This work aim is to improve the current GOVI antifoaming on the market satisfying
the existing consumer’s needs.
In order to achieve the improved formulation various test were made and the
optimum conditions were found, solving the problem of the product’s efficiency lost
through time.
1.5 THESIS ARRANGEMENT
This thesis is organized in 6 chapters. After this introductory Chapter presenting the
context involving the thesis, in Chapter 2 is described the implemented methods in
this work used to analyze the performance of the tested antifoaming agents. Chapter
3 provides the results and their individual discussion that allowed to conclude which
were the best conditions and product formulation that truly satisfied the customer
needs. Chapter 4 refers to the major conclusions of this work and future
improvements. Chapter 5 and 6 regard the references and the appendix,
respectively.
9
CHAPTER 2
TEST METHODS FOR ANTIFOAMING/DEFOAMING EFFECTIVENESS
With the aim to determine the effectiveness of antifoaming products four different
methods were implemented in this work.
Generally, an antifoaming effectiveness test method comprehends two different
phases, the incorporation of the antifoaming product in an aqueous solution and the
addition of the foaming agent in the previous solution aiming to a comparison of the
formed foam in the presence of various antifoam agents. This chapter presents the
four different tests methods used in this work to compare the antifoams efficiency.
2.1 ANTIFOAMING CYLINDER TEST (INTERNAL TEST METHOD)
2.1.1 Summary
This method describes a qualitative method to evaluate the capacity of antifoaming
agents in aqueous surfactant solutions.
A certain mass percentage of an anionic tensioactive surfactant, a Foaming Agent
(FA), is added to a water/antifoam agent solution. The foam is generated with 20
handshakes of a 250 ml cylinder, and after 30 minutes of rest, any remaining foam is
measured.[10]
2.1.2 Significance and use
This test is designed to determine the ability of a material to eliminate undesirable
foam that can be generated in many food and chemical industries. It could be used
to determine the relative effectiveness of one antifoaming agent versus another.[10]
2.1.3 Material
- Apparatus:
o Cylinder – The cylinder should have a 250 ml volume;
o Cylinder plastic caps;
o Disposable polyethylene pipet (7 ml volume);
Antifoam in Food Industrial Application
Chapter 2 - Test methods for antifoaming/defoaming effectiveness
10
o Electronic balance accurate to 0,01 g;
o Beaker – The volume is adjusted by the number of samples;
o pH/temperature measure equipment;
o Stopwatch.
- Reagents:
o Antifoaming agent – material to be tested;
o Hard/Tap water stock – The water must be at 25 Celsius degrees,
with a hardness no higher than 400 ppm, and a pH between 6 and
8;
o Surfactant solution – Use a 28% [%( m/m)] FA solution.
2.1.4 Procedure
- Part I:
o Put the cylinder on the electronic balance and with the help of a
disposable pipet measure 0,16 g of the antifoaming agent
(approximately 5 drops);
o Tare the scale and add to the cylinder 80 g of the tap water (note
the respective volume);
o Close the cylinder with a plastic cap, and shake it up 20 times and
register the respective volume.
- Part II:
o Add to the cylinder one drop of the surfactant solution, using a
disposable pipet, close again and shake it up 20 more times;
o Once you stop shaking, start the stopwatch a note the volume of
the higher layer of foam (initial top layer foam volume);
o Observe the foam, and after 30 minutes note the top (ending top
layer foam volume) and the bottom volume of the foam film (if the
foam disappears at the center of the foam film, record the time of
the stop watch and each top and bottom volume of the foam film).
o Add one more drop of surfactant solution to the cylinder and
repeat the steps above. Do it one more time, until you have a total
of 3 drops of FA solution on the cylinder.
Antifoam in Food Industrial Application
Chapter 2 - Test methods for antifoaming/defoaming effectiveness
11
o Dispose of the used surfactant/antifoaming agent solutions and
thoroughly clean the test apparatus to prevent their carryover to
the next determination.[10]
2.2 STANDARD TEST METHOD (ASTM – E2407, 2009)
2.2.1 Summary
This method describes a qualitative method to evaluate the capacity of defoaming
agents in aqueous surfactant solutions.
A dilute surfactant solution is placed on a high-speed blender, and its mixture
generates a certain quantity of foam. After the addition of the defoaming agent and
one minute of gentle agitation, the remaining foam is compared with the previous
volume. The ability of the defoaming agent to reduce foam is expressed as a percent
foam reduction.[10]
2.2.2 Significance and use
A defoaming agent is a material that eliminates or suppresses foam that already has
been formatted. For the present work this defoaming test was applied on the
formulated antifoam products. This allowed the comparison of the defoaming
capacity of different antifoaming agents.[10]
2.2.3 Material
- Apparatus:
o Blender – With a 1,2 l glass cup, at least;
o Disposable polyethylene pipet (7 ml volume);
o Electronic balance accurate to 0,01 g;
o Beaker;
o pH/temperature measure equipment;
o Stopwatch.
- Reagents:
o Antifoaming/defoaming agent – material to be tested;
o Surfactant Solution - Tap water solution with a concentration of 1
gram of foaming agent per liter of solution; The water must be at
Antifoam in Food Industrial Application
Chapter 2 - Test methods for antifoaming/defoaming effectiveness
12
25 Celsius degrees, with a hardness no higher than 400 ppm, and a
pH between 6 and 8; [10]
2.2.4 Procedure
- Part I:
o Add to the blender cup 250 ml of the surfactant solution, start the
blender on the maximum power and turn it off after 30 seconds.
Let it rest for 3 minutes allowing the separation of the foam and
the liquid, recording the volume of the created foam (Initial foam
volume);
- Part II:
o Add 200 ppm of the defoaming/antifoaming agent (approximately 2
drops), start the blender on the lower power capacity and turn it
off after 1 minute. Let it rest for 6 minutes and record the
final/remaining foam volume (Ending foam volume);
o Dispose of the used surfactant/defoaming agent solutions and
thoroughly clean the test apparatus to prevent their carryover to
the next determination. [10]
2.2.5 Calculations
The equation below describes the percentage of foam reduction due to the addition
of a defoamer/antifoam product to a solution that produces undesirable foam. [10]
Where,
/ % – Foam reduction;
/ ml – Initial foam volume;
/ ml – Ending foam volume;
Antifoam in Food Industrial Application
Chapter 2 - Test methods for antifoaming/defoaming effectiveness
13
2.3 ANTIFOAMING/DEFOAMING ULTRA-TURRAX T50 TEST (INTERNAL TEST
METHOD)
2.3.1 Summary
This method, as the first one, describes a qualitative method to evaluate the
capacity of antifoaming/defoaming agents in aqueous surfactant solutions.
- Application in antifoaming agents:
A certain mass percentage of FA is added to a water and antifoam agent solution.
The foam is generated with a high speed industrial blender, and after 6 minutes of
rest, any remaining foam is measured.
- Application in defoaming agents:
A dilute surfactant solution is placed on an industrial high-speed blender, and its
mixture generates a certain quantity of foam. After the addition of the defoaming
agent and one minute of gentle agitation, the remaining foam is compared with the
previous volume. The ability of the defoaming agent to reduce foam is expressed as a
percent foam reduction.
2.3.2 Significance and use
As the first method, this test is designed to determine the ability of a material to
eliminate undesirable foam and it could be used to determine the relative
effectiveness of one antifoaming/defoaming agent versus another.
2.3.3 Material
- Apparatus:
o Plastic beaker – Volume of 1800 ml;
o Industrial blender Ultra-turrax T50;
o Disposable polyethylene pipet (7 ml volume);
o Electronic balance accurate to 0,01 g;
o pH/temperature measure equipment;
o Stopwatch.
Antifoam in Food Industrial Application
Chapter 2 - Test methods for antifoaming/defoaming effectiveness
14
- Reagents:
o Application in antifoaming agents:
Antifoaming agent – material to be tested;
Hard/Tap water stock – The water must be at 25 Celsius
degrees, with a hardness no higher than 400 ppm, and a pH
between 6 and 8;
Surfactant solution – Use a 28% [%( m/m)] FA solution.
o Application in defoaming agents:
Defoaming agent – material to be tested;
Surfactant Solution - Tap water solution with a
concentration of 1 gram of foaming agent per liter of
solution; The water must be at 25 Celsius degrees, with a
hardness no higher than 400 ppm, and a pH between 6 and
8;
2.3.4 Procedure
Application in antifoaming agents:
- Part I:
o Put the plastic beaker on the electronic balance and with the help
of a disposable pipet measure 1,8 g of the antifoaming agent;
o Tare the scale and add to the beaker 900 g of the tap water;
o Mix, with the ultra-turrax T50, the previous mixture for 1 minute
with the equipment on its minimum power capacity (not higher
than 4000 rpm), and let it rest for 3 minutes recording the
respective volume.
- Part II:
o Add to the beaker 11 drops of FA solution, using a disposable pipet,
mix it for 30 seconds (power of the equipment not lower than 6000
rpm) and let it rest for 6 minutes recording the final foam volume.
o Dispose of the used surfactant/antifoaming agent solutions and
thoroughly clean the test apparatus to prevent their carryover to
the next determination.
Antifoam in Food Industrial Application
Chapter 2 - Test methods for antifoaming/defoaming effectiveness
15
Application in defoaming agents:
- Part I:
o Add to the plastic beaker 900 ml of the surfactant solution, mixing
it with the industrial blender at 6000 rpm and turn it off after 30
seconds. Let it rest for 3 minutes allowing the separation of the
foam and the liquid, recording the volume of the created foam;
- Part II:
o Add 200 ppm of the defoaming/antifoaming agent (approximately 6
drops), start the industrial blender on the lower power capacity
(not higher than 4000 rpm) and turn it off after 1 minute. Let it
rest for 6 minutes and record the final/remaining foam volume;
o Dispose of the used surfactant/defoaming agent solutions and
thoroughly clean the test apparatus to prevent their carryover to
the next determination. [10]
2.3.5 Calculations
This method’s calculations follow the same equation given in the standard test
method, Equation 4 of the present work. This is only applied on the defoaming
effectiveness measure part. [10]
2.4 ASSIMILATING PUMP TEST (INTERNAL TEST METHOD)
2.4.1 Summary
This test method describes qualitatively the effectiveness of a certain antifoam
agent diluted on a fresh starch solution that it is pumped under high velocity.
A certain quantity of a fresh starch/antifoaming solution is pumped within the same
recipient and after 10 minutes the remaining foam on the surface is compared with
the foam formed while using the blank solution, a fresh starch solution without the
addition of antifoaming agent, and other antifoaming agent’s solutions.
2.4.2 Significance and use
This method was applied due to the fact that one major consumer of the company’s
antifoaming was not completely satisfied. This client uses the antifoam agent to
Antifoam in Food Industrial Application
Chapter 2 - Test methods for antifoaming/defoaming effectiveness
16
avoid the formation of undesirable foam through a high pressure water potato cutting
process. The water used to cut the potatoes is recirculated on the facilities for one
day before its replacement by a fresh one. The durability of the antifoaming
effectiveness was questioned since after a few days it did not meet its requirements.
2.4.3 Material
- Apparatus:
o 250 ml glass beakers;
o Pump – Flow rate of 0,26 l·min-1;
o Retort stand clamps;
o 60 ml syringe;
o Heating plate.
- Reagents:
o Fresh starch solution – Peel and chop 1,5 kg of potatoes and add
2500 ml of tap water, mix it and let it rest for 24 hours;
o Antifoaming agent – material to be tested;
o Tap/Hard water;
o Distillated water.
2.4.4 Procedure
- Previously wash the pump interior and its tubes with hot and cold
distillated water letting each one circulated for at least ten minutes,
avoiding any remaining contaminators;
- Make a fresh starch/antifoaming solution with a concentration of 2 g·l-1;
- Replace the water in the tubes with the previous solution with the help of
a syringe;
- Start the pump, avoiding cavitation, and close the let out clamp so the
exit fluid gets more velocity;
- Let the solution circulate for 10 minutes and take a picture to compare
with the final results of other antifoam samples.
17
CHAPTER 3
RESULTS AND DISCUSSION
This chapter includes the paramount results obtained, which have led to the
fulfillment of the main objective of this work. Some of the results mentioned were
unsatisfying and not essential to this work conclusion, thus they were not
represented to avoid the accumulation of information on one graph that could lead
to a difficult interpretation.
3.1 REFERENCE ANTIFOAMING AGENT
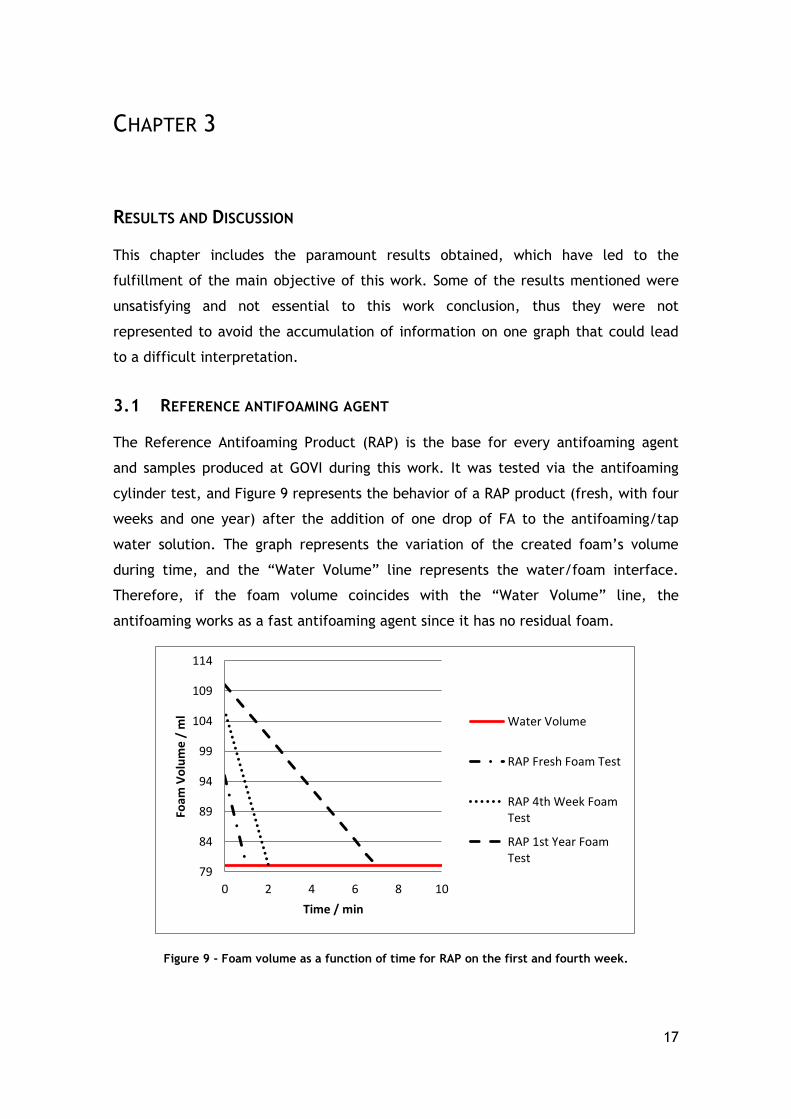
The Reference Antifoaming Product (RAP) is the base for every antifoaming agent
and samples produced at GOVI during this work. It was tested via the antifoaming
cylinder test, and Figure 9 represents the behavior of a RAP product (fresh, with four
weeks and one year) after the addition of one drop of FA to the antifoaming/tap
water solution. The graph represents the variation of the created foam’s volume
during time, and the “Water Volume” line represents the water/foam interface.
Therefore, if the foam volume coincides with the “Water Volume” line, the
antifoaming works as a fast antifoaming agent since it has no residual foam.
Figure 9 - Foam volume as a function of time for RAP on the first and fourth week.
79
84
89
94
99
104
109
114
0 2 4 6 8 10
Foam
Vo
lum
e /
ml
Time / min
Water Volume
RAP Fresh Foam Test
RAP 4th Week FoamTest
RAP 1st Year FoamTest
Antifoam in Food Industrial Application
Chapter 3 – Results and Discussion
18
As seen in Figure 9, RAP behaves as a fast antifoaming agent since it has no residual
final foam, and its action takes less than 10 minutes. The difference between tests is
explained by the degradation that normally all antifoaming products have through
time, usually 6 months after its formulation.
3.2 GOVI’S OIL BASED ANTIFOAMING AGENT
The main antifoaming product produced in GOVI, the 0120178.53, is an oil based
antifoam that contains a tensioactive and silica powder as the hydrophobic
component. This product required alterations in its composition in order to improve
its antifoam capacity.
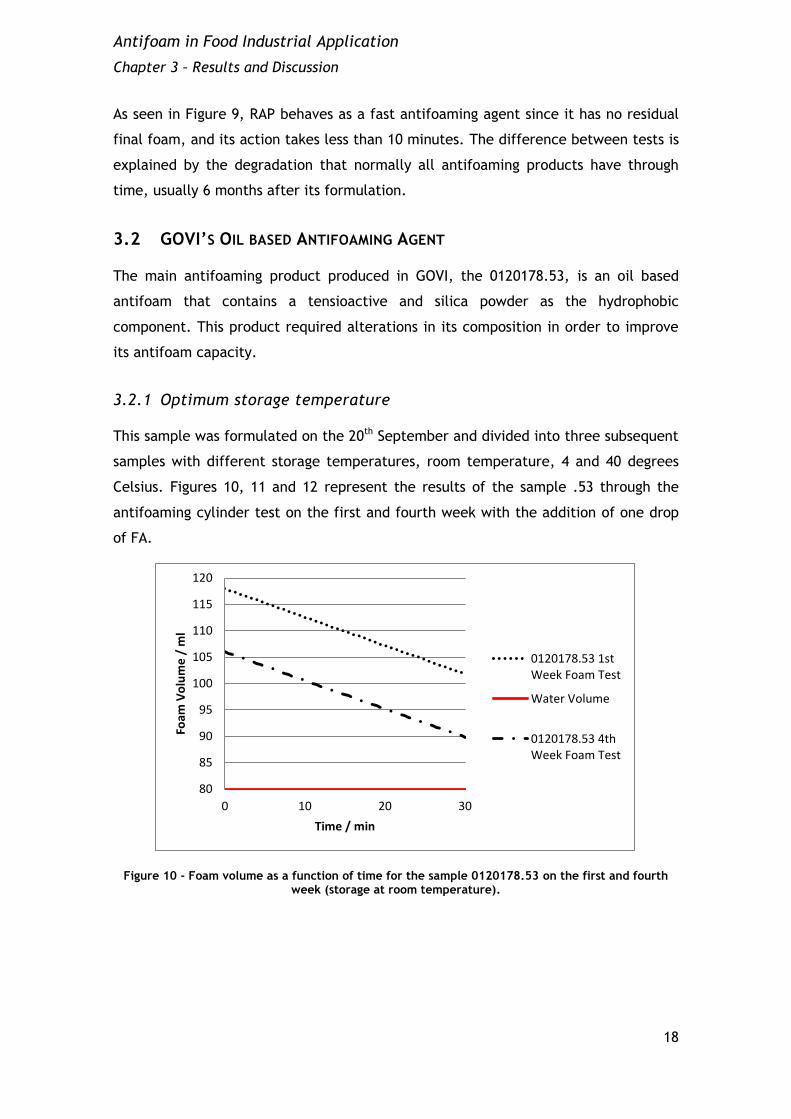
3.2.1 Optimum storage temperature
This sample was formulated on the 20th September and divided into three subsequent
samples with different storage temperatures, room temperature, 4 and 40 degrees
Celsius. Figures 10, 11 and 12 represent the results of the sample .53 through the
antifoaming cylinder test on the first and fourth week with the addition of one drop
of FA.
Figure 10 - Foam volume as a function of time for the sample 0120178.53 on the first and fourth week (storage at room temperature).
80
85
90
95
100
105
110
115
120
0 10 20 30
Foam
Vo
lum
e /
ml
Time / min
0120178.53 1stWeek Foam Test
Water Volume
0120178.53 4thWeek Foam Test
Antifoam in Food Industrial Application
Chapter 3 – Results and Discussion
19
Figure 11 - Foam volume as a function of time for the sample 0120178.53 on the first and fourth week (storage at 4 degrees Celsius).
Figure 12 - Foam volume as a function of time for the sample 0120178.53 on the first and fourth week (storage at 40 degrees Celsius).
Figures 10, 11 and 12 show that product 0120178.53 is a slow antifoaming agent due
to its final residual foam. Although the improvement on its performance through
time, justified by the gradual dissolution of the silica particles on the oil solution,
with the exception of the 4 degrees Celsius case, foam is still detected after 30
minutes of rest. Considering the final foam volume after 30 minutes (Figure 12), it is
possible to conclude that the optimum sample storage temperature is 40 degrees
Celsius. Since most part of the consumers are not equipped with industrial ovens that
permit this range of temperatures, the sample must be storaged at room
temperature, and therefore, the final improved product must have good results
79
84
89
94
99
104
109
0 10 20 30
Foam
Vo
lum
e /
ml
TIme / min
Water Volume 1stWeek
0120178.53 4thWeek Foam Test
Water Volume 4thWeek
0120178.53 1stWeek Foam Test
79
84
89
94
99
104
109
114
119
124
0 10 20 30
Foam
Vo
lum
e /
ml
Time / min
Water Volume 1stWeek
0120178.53 1stWeek Foam Test
Water Volume 4thWeek
0120178.53 4thWeek Foam Test
Antifoam in Food Industrial Application
Chapter 3 – Results and Discussion
20
under these conditions. The sample stored at 4 degrees Celsius presented silica
agglomerations two months after formulation. This is not an acceptable aspect and
for that reason the product must be stored at a temperature above 5 degrees Celsius.
3.2.2 Optimum water pH value and temperature
Since test conditions are key to secure good results, it was tested which pH value and
tap water temperature set the ideal conditions.
- Optimum water pH value:
To reach the optimum pH value, the GOVI’s lab test method was repeated with tap
water with a pH value range of 4 to 10. This was made using Sodium Hydroxide
(NaOH) and Citric Acid (C6H8O7) as an increasing and decreasing product,
respectively, of the pH value. The best results were obtained with a pH of 6 and 7,
and therefore, another test was made to compare the results using tap water with a
pH value of 6 and with tap water without an adjusted pH value. With the results
presented on Table 1, it is possible to conclude that the optimum pH value is the one
that has not been modified. For that reason, since the tap water pH is between 6 and
8, it is not necessary to use base/acid products in order to achieve better results.
- Optimum water temperature:
To discover what the optimal tap water temperature is, several tests were
performed, with increasing temperatures of 5 degrees Celsius from 5 to 35 degrees.
The results are showed on Table 2, and it is evident that the optimum temperature is
25 degrees Celsius since, at the end, it has no residual foam.
Antifoam in Food Industrial Application
Chapter 3 – Results and Discussion
21
Table 1 – Results of the antifoaming cylinder test with acid and neutral tap water.
Product Part 1 Part 2
Volume of the foam (ml)
0120178.53 made on 25/09/2013
LES Drops Product
weight (g) Water
weight (g) 1st
Volume (ml) 2nd
Volume (ml) 3rd
Volume (ml) 4th
Volume (ml) Time Top Bottom Dif
Water pH 7,96
1
0,17 80,30 84 84
110 90 30' 90 80 10
2 110 94 30' 94 80 14
3 114 98 30' 98 80 18
6,04 1 0,18 80,62 84 84 110 100 30' 100 80 20
Table 2 – Results of the antifoaming cylinder test with different tap water temperatures.
Product Part 1 Part 2
Volume of the foam (ml)
0120178.53 Date of
Manufacture Product weight (g) Water weight (g) 1st height (ml) 2nd height (ml) 4th Height (ml) 5th Height (ml) Time Top Bottom Dif
5°C
25/09/2013
0,16 80,09 84 84 110 98 30' 98 80 18
10 °C 0,16 80,04 84 84 114 100 30' 100 80 20
15 °C 0,17 80,01 86 84 110 90 30' 90 82 8
20 °C 0,16 80,00 84 82 110 94 30' 94 80 14
25 °C 0,18 80,04 84 84 96 84 25' 84 84 0
30 °C 0,17 80,08 84 84 116 94 30' 94 82 12
35 °C 0,16 80 84 84 100 90 30' 90 80 10
Antifoam in Food Industrial Application
Chapter 3 – Results and Discussion
22
3.2.3 Optimum silica type and mass percentage
Generally, the antifoaming industry uses two different types of synthetic amorphous
silica: the precipitated and the fumed silica. Both types can show a hydrophilic and a
hydrophobic characteristic, but it is known that it is important for the antifoaming
effectiveness that the silica particles have hydrophobic surfaces. This characteristic
allows a higher depth and rate of penetration of the antifoam droplets in the foam
lamella.[3]
To conclude on which type of silica is best as an antifoaming agent, numerous tests
were performed comparing different types of silica and silica grain size. The best
results were obtained with sample 0120178.80, which is composed of hydrophobic
fumed silica with a smaller grain size than the hydrophobic precipitated silica
contained on sample 0120178.53. The sample 0120178.53 used for the comparison
was formulated on the 25th September, the same day as the other mentioned sample.
Figure 13 – Comparison of the foam volume as a function of time for the samples 0120178.53 and 0120178.80 four weeks after their formulation.
Comparing the previous results showed on Figure 13, it is clear that the most
efficient antifoam agent is 0120178.80. Consequently, it is possible to conclude that
the silica particles smaller grain size of the sample .80 allows it to have a faster
entry in the foam film and thus a faster film rupture, making this a more effective
antifoaming agent.
79
84
89
94
99
104
109
114
119
0 10 20 30
Fao
m V
olu
me
/ m
l
Time / min
.80 Water Volume
0120178.80 (25/09)
.53 Water Volume
0120178.53 (25/09)
Antifoam in Food Industrial Application
Chapter 3 – Results and Discussion
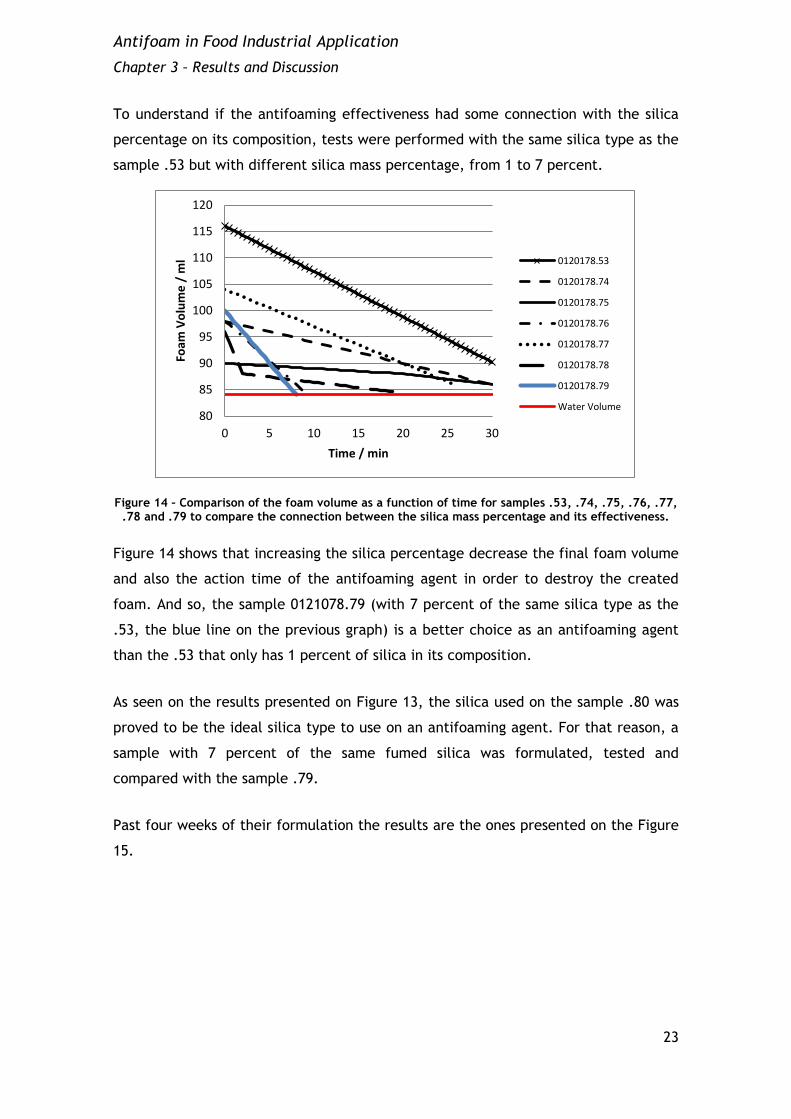
23
To understand if the antifoaming effectiveness had some connection with the silica
percentage on its composition, tests were performed with the same silica type as the
sample .53 but with different silica mass percentage, from 1 to 7 percent.
Figure 14 – Comparison of the foam volume as a function of time for samples .53, .74, .75, .76, .77, .78 and .79 to compare the connection between the silica mass percentage and its effectiveness.
Figure 14 shows that increasing the silica percentage decrease the final foam volume
and also the action time of the antifoaming agent in order to destroy the created
foam. And so, the sample 0121078.79 (with 7 percent of the same silica type as the
.53, the blue line on the previous graph) is a better choice as an antifoaming agent
than the .53 that only has 1 percent of silica in its composition.
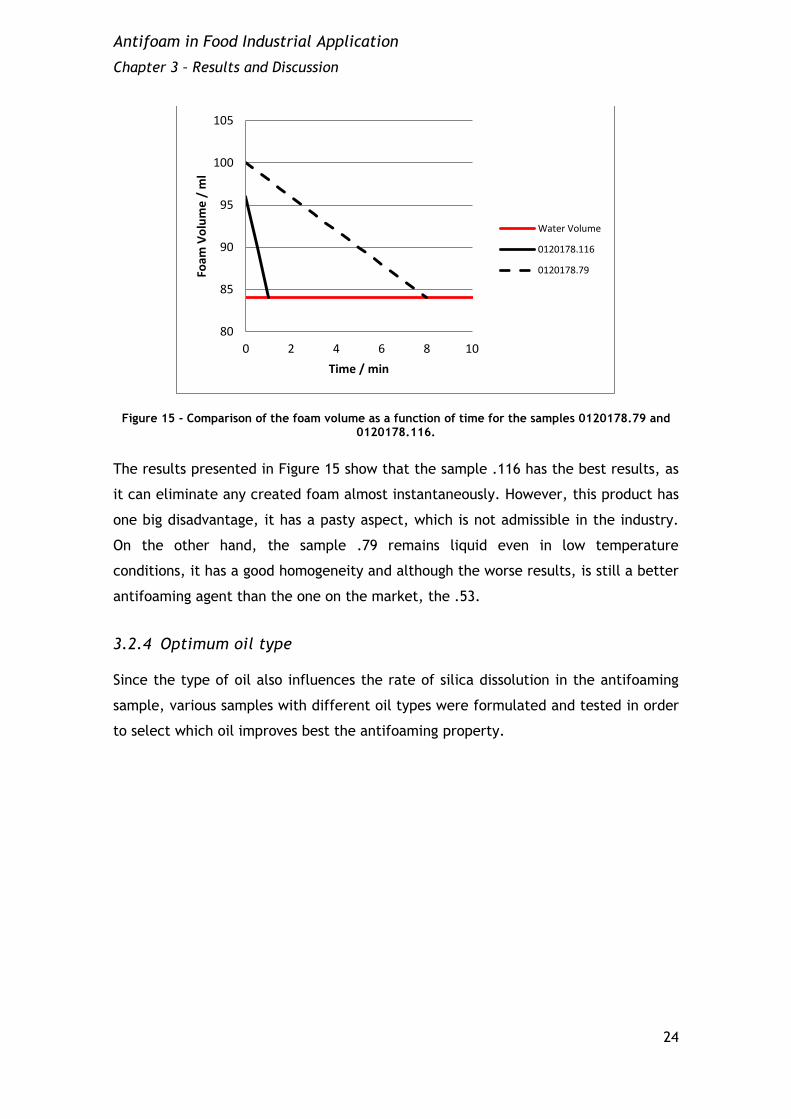
As seen on the results presented on Figure 13, the silica used on the sample .80 was
proved to be the ideal silica type to use on an antifoaming agent. For that reason, a
sample with 7 percent of the same fumed silica was formulated, tested and
compared with the sample .79.
Past four weeks of their formulation the results are the ones presented on the Figure
15.
80
85
90
95
100
105
110
115
120
0 5 10 15 20 25 30
Foam
Vo
lum
e /
ml
Time / min
0120178.53
0120178.74
0120178.75
0120178.76
0120178.77
0120178.78
0120178.79
Water Volume
Antifoam in Food Industrial Application
Chapter 3 – Results and Discussion
24
Figure 15 - Comparison of the foam volume as a function of time for the samples 0120178.79 and 0120178.116.
The results presented in Figure 15 show that the sample .116 has the best results, as
it can eliminate any created foam almost instantaneously. However, this product has
one big disadvantage, it has a pasty aspect, which is not admissible in the industry.
On the other hand, the sample .79 remains liquid even in low temperature
conditions, it has a good homogeneity and although the worse results, is still a better
antifoaming agent than the one on the market, the .53.
3.2.4 Optimum oil type
Since the type of oil also influences the rate of silica dissolution in the antifoaming
sample, various samples with different oil types were formulated and tested in order
to select which oil improves best the antifoaming property.
80
85
90
95
100
105
0 2 4 6 8 10
Foam
Vo
lum
e /
ml
Time / min
Water Volume
0120178.116
0120178.79
Antifoam in Food Industrial Application
Chapter 3 – Results and Discussion
25
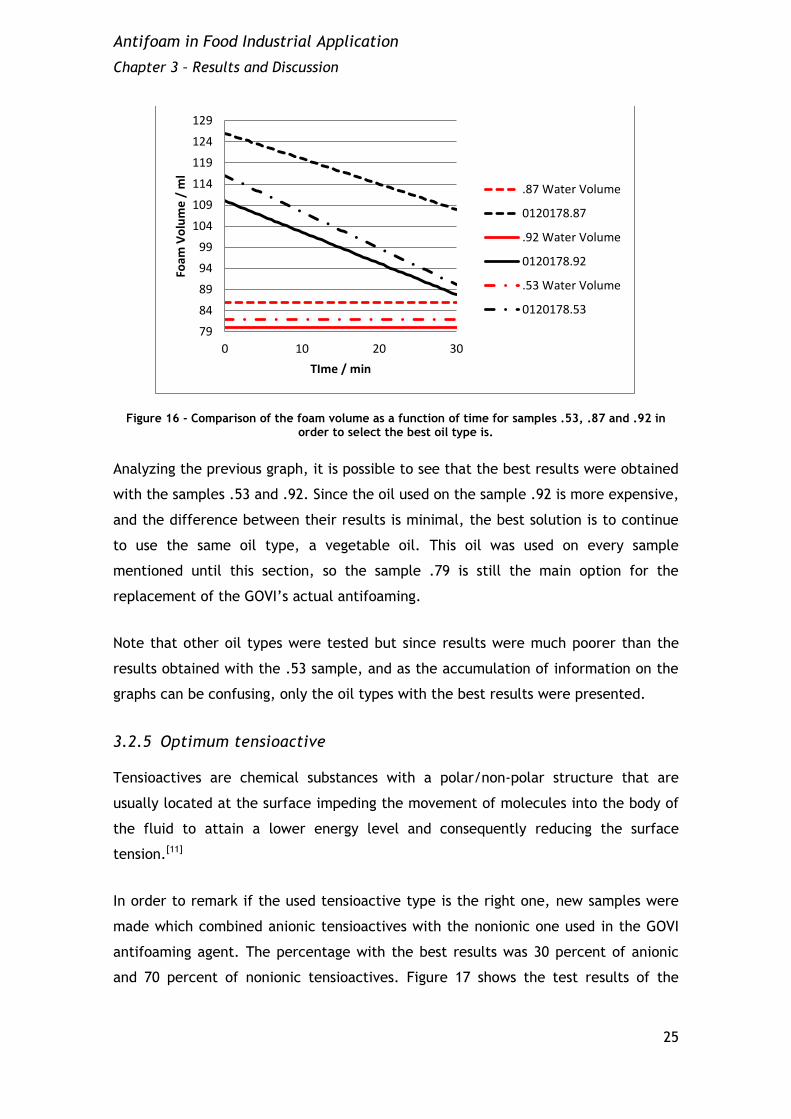
Figure 16 - Comparison of the foam volume as a function of time for samples .53, .87 and .92 in order to select the best oil type is.
Analyzing the previous graph, it is possible to see that the best results were obtained
with the samples .53 and .92. Since the oil used on the sample .92 is more expensive,
and the difference between their results is minimal, the best solution is to continue
to use the same oil type, a vegetable oil. This oil was used on every sample
mentioned until this section, so the sample .79 is still the main option for the
replacement of the GOVI’s actual antifoaming.
Note that other oil types were tested but since results were much poorer than the
results obtained with the .53 sample, and as the accumulation of information on the
graphs can be confusing, only the oil types with the best results were presented.
3.2.5 Optimum tensioactive
Tensioactives are chemical substances with a polar/non-polar structure that are
usually located at the surface impeding the movement of molecules into the body of
the fluid to attain a lower energy level and consequently reducing the surface
tension.[11]
In order to remark if the used tensioactive type is the right one, new samples were
made which combined anionic tensioactives with the nonionic one used in the GOVI
antifoaming agent. The percentage with the best results was 30 percent of anionic
and 70 percent of nonionic tensioactives. Figure 17 shows the test results of the
79
84
89
94
99
104
109
114
119
124
129
0 10 20 30
Foam
Vo
lum
e /
ml
TIme / min
.87 Water Volume
0120178.87
.92 Water Volume
0120178.92
.53 Water Volume
0120178.53
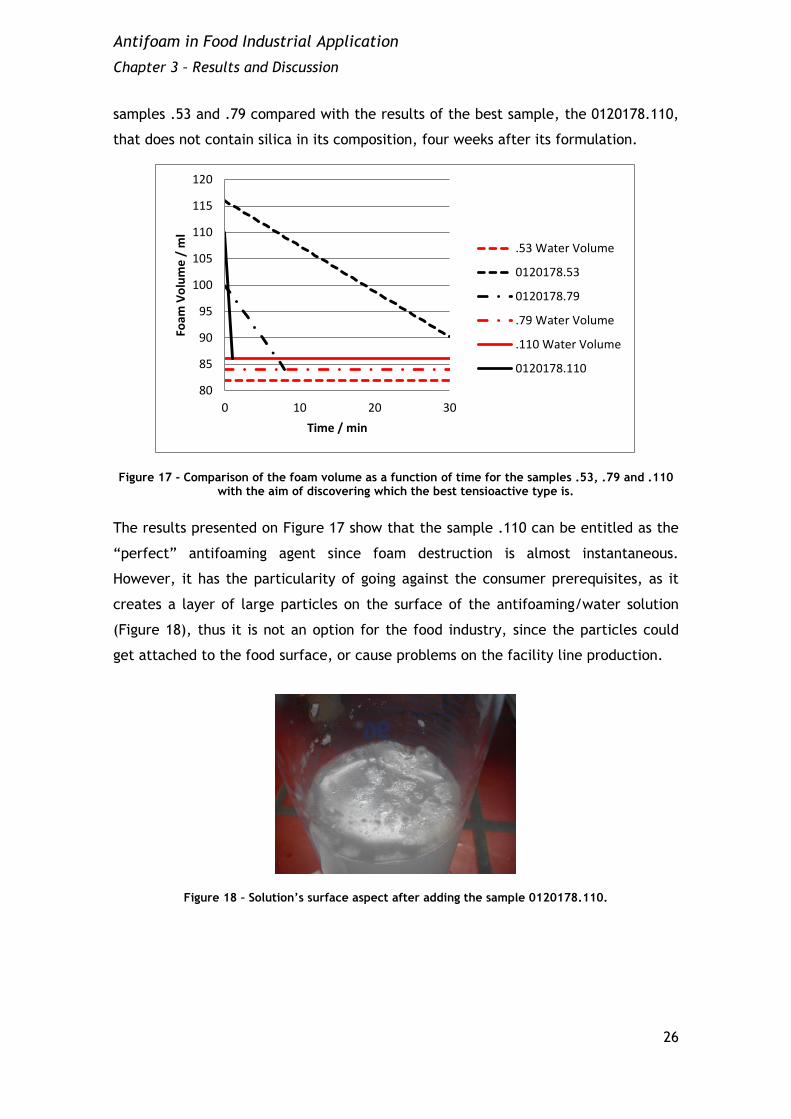
Antifoam in Food Industrial Application
Chapter 3 – Results and Discussion
26
samples .53 and .79 compared with the results of the best sample, the 0120178.110,
that does not contain silica in its composition, four weeks after its formulation.
Figure 17 - Comparison of the foam volume as a function of time for the samples .53, .79 and .110 with the aim of discovering which the best tensioactive type is.
The results presented on Figure 17 show that the sample .110 can be entitled as the
“perfect” antifoaming agent since foam destruction is almost instantaneous.
However, it has the particularity of going against the consumer prerequisites, as it
creates a layer of large particles on the surface of the antifoaming/water solution
(Figure 18), thus it is not an option for the food industry, since the particles could
get attached to the food surface, or cause problems on the facility line production.
Figure 18 – Solution’s surface aspect after adding the sample 0120178.110.
80
85
90
95
100
105
110
115
120
0 10 20 30
Foam
Vo
lum
e /
ml
Time / min
.53 Water Volume
0120178.53
0120178.79
.79 Water Volume
.110 Water Volume
0120178.110
Antifoam in Food Industrial Application
Chapter 3 – Results and Discussion
27
3.3 UPGRADE OF GOVI’S OIL BASED ANTIFOAMING AGENT
From results shown on the previous sub-chapter it is possible to choose the best
replacement of the actual GOVI’s antifoaming agent, always minding the limitations
imposed by the client. It has to be a food approved and oil based product that has
better results than the current one.
For that, the antifoaming 0120178.79 was the one selected. This section summarizes
the results obtained in all the tests mentioned in this work that compare the GOVI’s
antifoaming agent and the replacement sample.
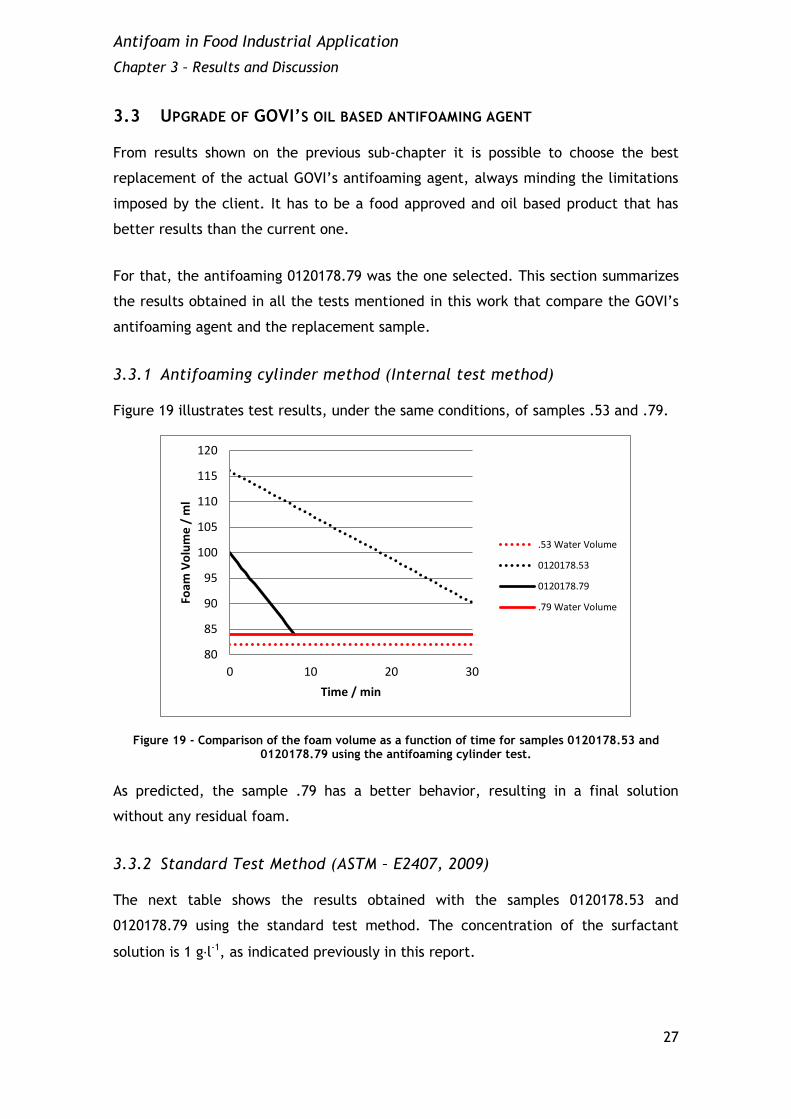
3.3.1 Antifoaming cylinder method (Internal test method)
Figure 19 illustrates test results, under the same conditions, of samples .53 and .79.
Figure 19 - Comparison of the foam volume as a function of time for samples 0120178.53 and 0120178.79 using the antifoaming cylinder test.
As predicted, the sample .79 has a better behavior, resulting in a final solution
without any residual foam.
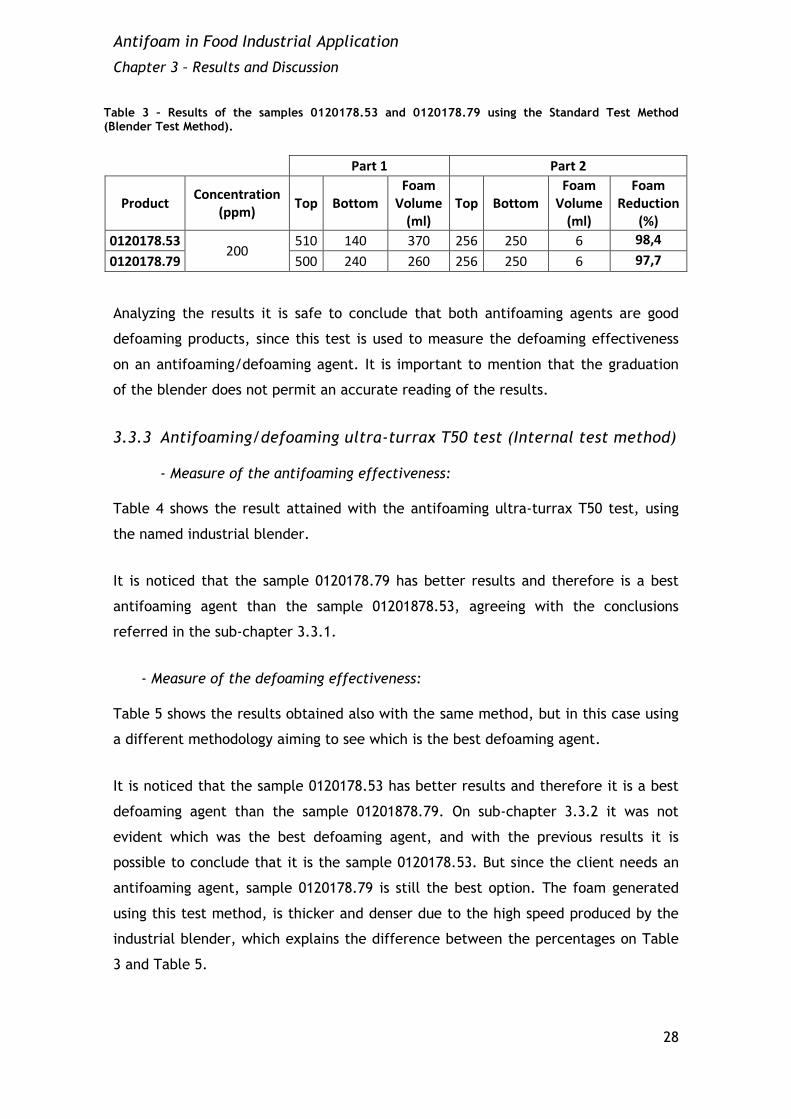
3.3.2 Standard Test Method (ASTM – E2407, 2009)
The next table shows the results obtained with the samples 0120178.53 and
0120178.79 using the standard test method. The concentration of the surfactant
solution is 1 g·l-1, as indicated previously in this report.
80
85
90
95
100
105
110
115
120
0 10 20 30
Foam
Vo
lum
e /
ml
Time / min
.53 Water Volume
0120178.53
0120178.79
.79 Water Volume
Antifoam in Food Industrial Application
Chapter 3 – Results and Discussion
28
Table 3 – Results of the samples 0120178.53 and 0120178.79 using the Standard Test Method (Blender Test Method).
Part 1 Part 2
Product Concentration
(ppm) Top Bottom
Foam Volume
(ml) Top Bottom
Foam Volume
(ml)
Foam Reduction
(%)
0120178.53 200
510 140 370 256 250 6 98,4
0120178.79 500 240 260 256 250 6 97,7
Analyzing the results it is safe to conclude that both antifoaming agents are good
defoaming products, since this test is used to measure the defoaming effectiveness
on an antifoaming/defoaming agent. It is important to mention that the graduation
of the blender does not permit an accurate reading of the results.
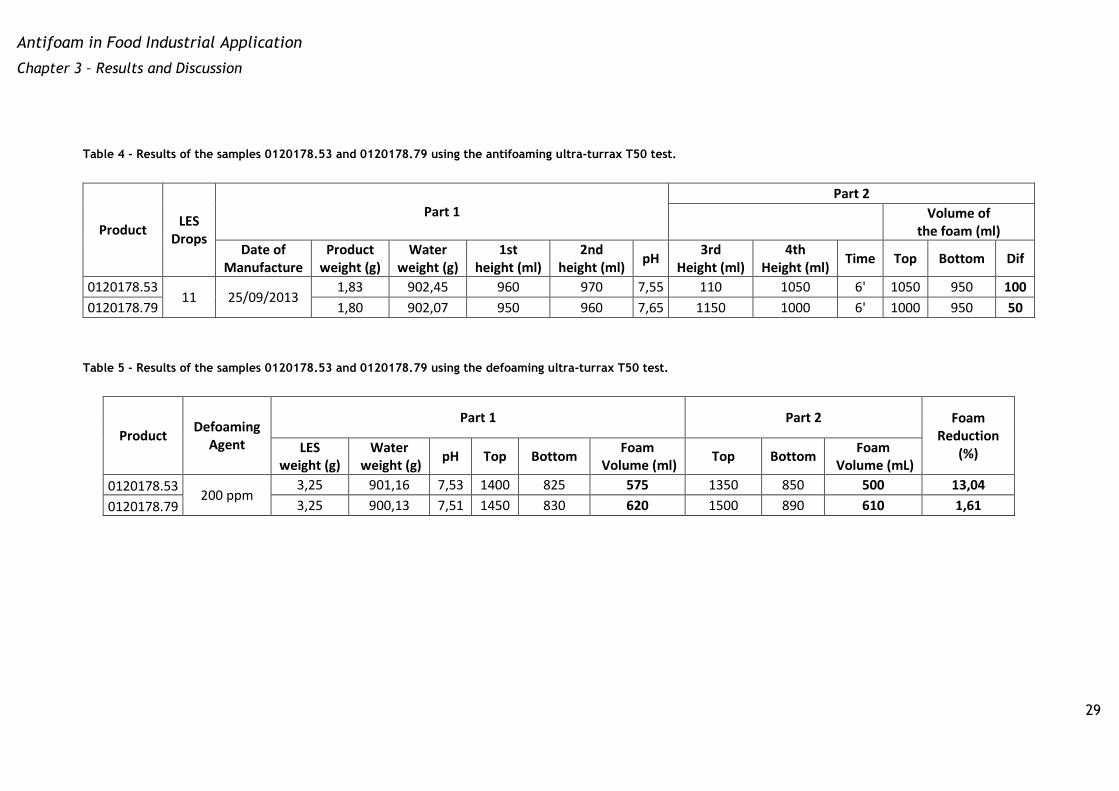
3.3.3 Antifoaming/defoaming ultra-turrax T50 test (Internal test method)
- Measure of the antifoaming effectiveness:
Table 4 shows the result attained with the antifoaming ultra-turrax T50 test, using
the named industrial blender.
It is noticed that the sample 0120178.79 has better results and therefore is a best
antifoaming agent than the sample 01201878.53, agreeing with the conclusions
referred in the sub-chapter 3.3.1.
- Measure of the defoaming effectiveness:
Table 5 shows the results obtained also with the same method, but in this case using
a different methodology aiming to see which is the best defoaming agent.
It is noticed that the sample 0120178.53 has better results and therefore it is a best
defoaming agent than the sample 01201878.79. On sub-chapter 3.3.2 it was not
evident which was the best defoaming agent, and with the previous results it is
possible to conclude that it is the sample 0120178.53. But since the client needs an
antifoaming agent, sample 0120178.79 is still the best option. The foam generated
using this test method, is thicker and denser due to the high speed produced by the
industrial blender, which explains the difference between the percentages on Table
3 and Table 5.
Antifoam in Food Industrial Application
Chapter 3 – Results and Discussion
29
Table 4 - Results of the samples 0120178.53 and 0120178.79 using the antifoaming ultra-turrax T50 test.
Product LES
Drops
Part 1 Part 2
Volume of
the foam (ml)
Date of Manufacture
Product weight (g)
Water weight (g)
1st height (ml)
2nd height (ml)
pH 3rd
Height (ml) 4th
Height (ml) Time Top Bottom Dif
0120178.53 11 25/09/2013
1,83 902,45 960 970 7,55 110 1050 6' 1050 950 100
0120178.79 1,80 902,07 950 960 7,65 1150 1000 6' 1000 950 50
Table 5 - Results of the samples 0120178.53 and 0120178.79 using the defoaming ultra-turrax T50 test.
Product Defoaming
Agent
Part 1 Part 2 Foam Reduction
(%) LES weight (g)
Water weight (g)
pH Top Bottom Foam
Volume (ml) Top Bottom
Foam Volume (mL)
0120178.53 200 ppm
3,25 901,16 7,53 1400 825 575 1350 850 500 13,04
0120178.79 3,25 900,13 7,51 1450 830 620 1500 890 610 1,61
Antifoam in Food Industrial Application
Chapter 3 – Results and Discussion
30
3.4 SILICONE OIL BASED ANTIFOAMING AGENT
The silicone oil based antifoaming agents have a lower surface tension comparing to
the other materials. For that reason, the thermodynamic requirements, the
spreading, penetration and bridging coefficients are all positives in most cases. If
they are present as antifoam emulsions they spread out particularly well and
homogeneously in aqueous liquids. As a result, the silicone antifoaming can be used
at a much lower dosage and the products can be used over a wide range of
temperatures. Although silicone oil based antifoams cost more to produce than the
oil based ones, they have more versatility and high efficiencies.[12]
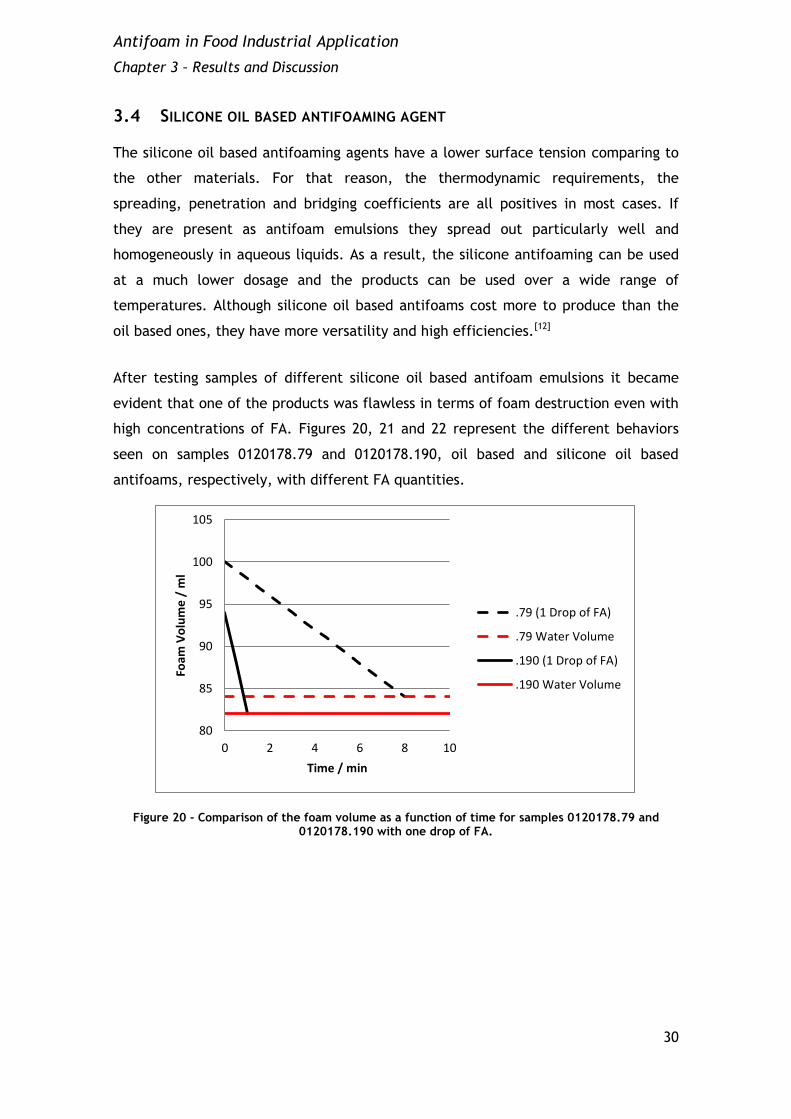
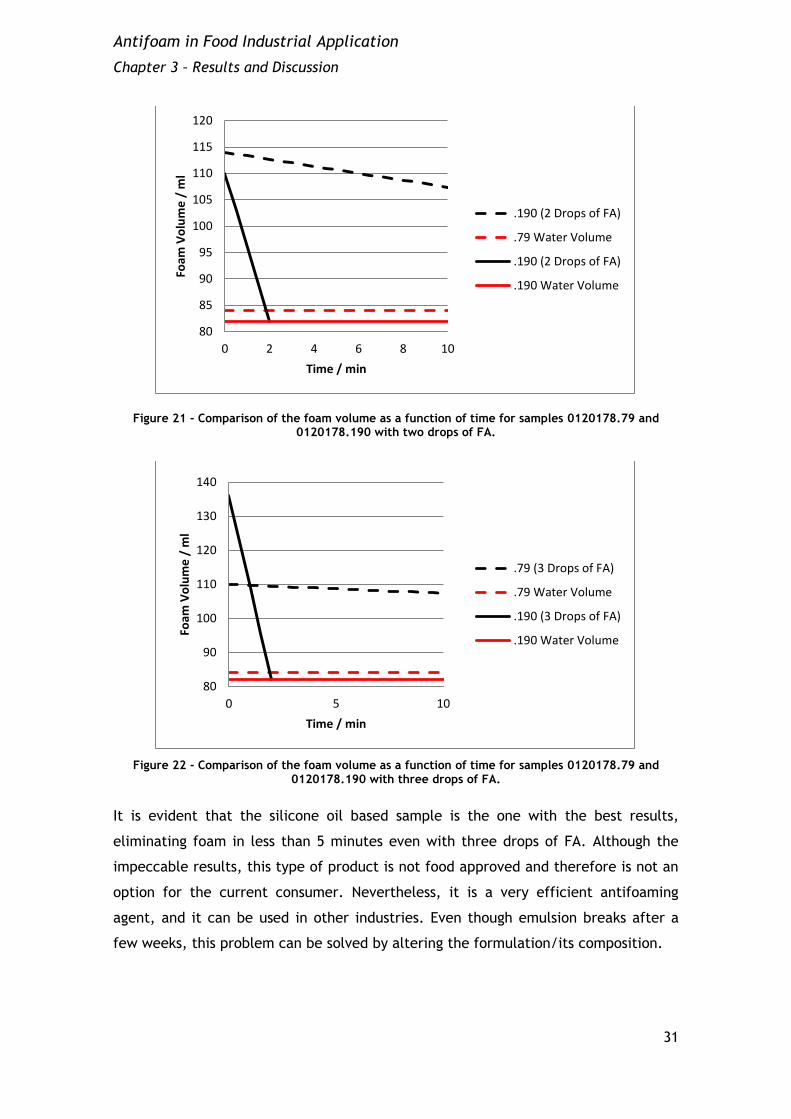
After testing samples of different silicone oil based antifoam emulsions it became
evident that one of the products was flawless in terms of foam destruction even with
high concentrations of FA. Figures 20, 21 and 22 represent the different behaviors
seen on samples 0120178.79 and 0120178.190, oil based and silicone oil based
antifoams, respectively, with different FA quantities.
Figure 20 - Comparison of the foam volume as a function of time for samples 0120178.79 and 0120178.190 with one drop of FA.
80
85
90
95
100
105
0 2 4 6 8 10
Foam
Vo
lum
e /
ml
Time / min
.79 (1 Drop of FA)
.79 Water Volume
.190 (1 Drop of FA)
.190 Water Volume
Antifoam in Food Industrial Application
Chapter 3 – Results and Discussion
31
Figure 21 - Comparison of the foam volume as a function of time for samples 0120178.79 and 0120178.190 with two drops of FA.
Figure 22 - Comparison of the foam volume as a function of time for samples 0120178.79 and 0120178.190 with three drops of FA.
It is evident that the silicone oil based sample is the one with the best results,
eliminating foam in less than 5 minutes even with three drops of FA. Although the
impeccable results, this type of product is not food approved and therefore is not an
option for the current consumer. Nevertheless, it is a very efficient antifoaming
agent, and it can be used in other industries. Even though emulsion breaks after a
few weeks, this problem can be solved by altering the formulation/its composition.
80
85
90
95
100
105
110
115
120
0 2 4 6 8 10
Foam
Vo
lum
e /
ml
Time / min
.190 (2 Drops of FA)
.79 Water Volume
.190 (2 Drops of FA)
.190 Water Volume
80
90
100
110
120
130
140
0 5 10
Foam
Vo
lum
e /
ml
Time / min
.79 (3 Drops of FA)
.79 Water Volume
.190 (3 Drops of FA)
.190 Water Volume
Antifoam in Food Industrial Application
Chapter 3 – Results and Discussion
32
3.5 SAMPLE BEHAVIOR ON ASSIMILATING PUMP TEST
Since the main objective of this work is to replace the current antifoaming agent
that GOVI has on the market, a test method was elaborated to compare the behavior
of a fresh starch solution (blank solution) with and without the improved antifoaming
agent. The test is called assimilating pump test which is described on chapter two of
the present work.
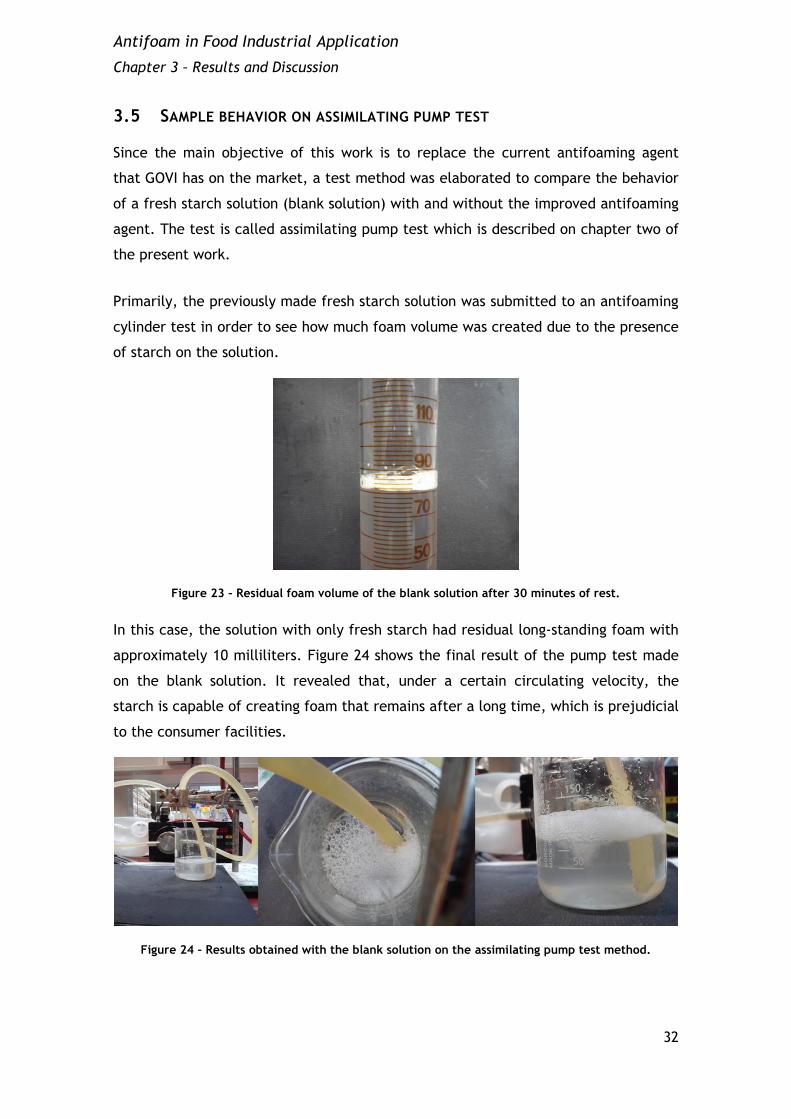
Primarily, the previously made fresh starch solution was submitted to an antifoaming
cylinder test in order to see how much foam volume was created due to the presence
of starch on the solution.
Figure 23 – Residual foam volume of the blank solution after 30 minutes of rest.
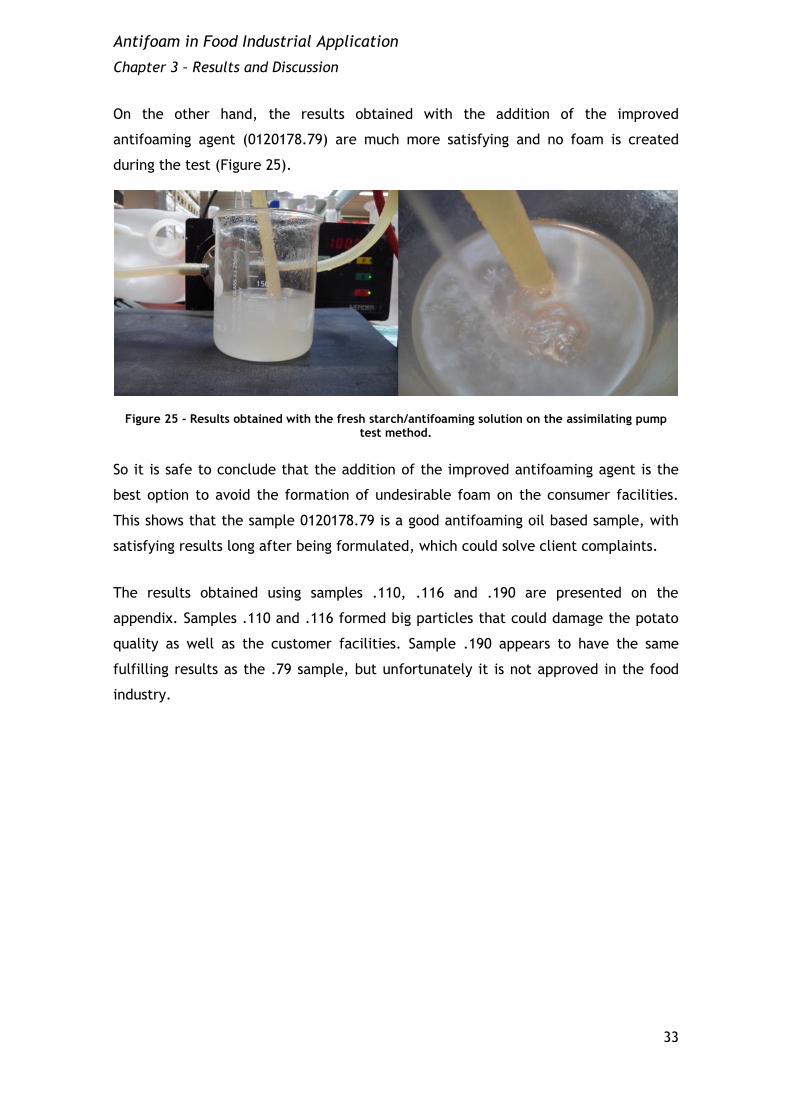
In this case, the solution with only fresh starch had residual long-standing foam with
approximately 10 milliliters. Figure 24 shows the final result of the pump test made
on the blank solution. It revealed that, under a certain circulating velocity, the
starch is capable of creating foam that remains after a long time, which is prejudicial
to the consumer facilities.
Figure 24 – Results obtained with the blank solution on the assimilating pump test method.
Antifoam in Food Industrial Application
Chapter 3 – Results and Discussion
33
On the other hand, the results obtained with the addition of the improved
antifoaming agent (0120178.79) are much more satisfying and no foam is created
during the test (Figure 25).
Figure 25 - Results obtained with the fresh starch/antifoaming solution on the assimilating pump test method.
So it is safe to conclude that the addition of the improved antifoaming agent is the
best option to avoid the formation of undesirable foam on the consumer facilities.
This shows that the sample 0120178.79 is a good antifoaming oil based sample, with
satisfying results long after being formulated, which could solve client complaints.
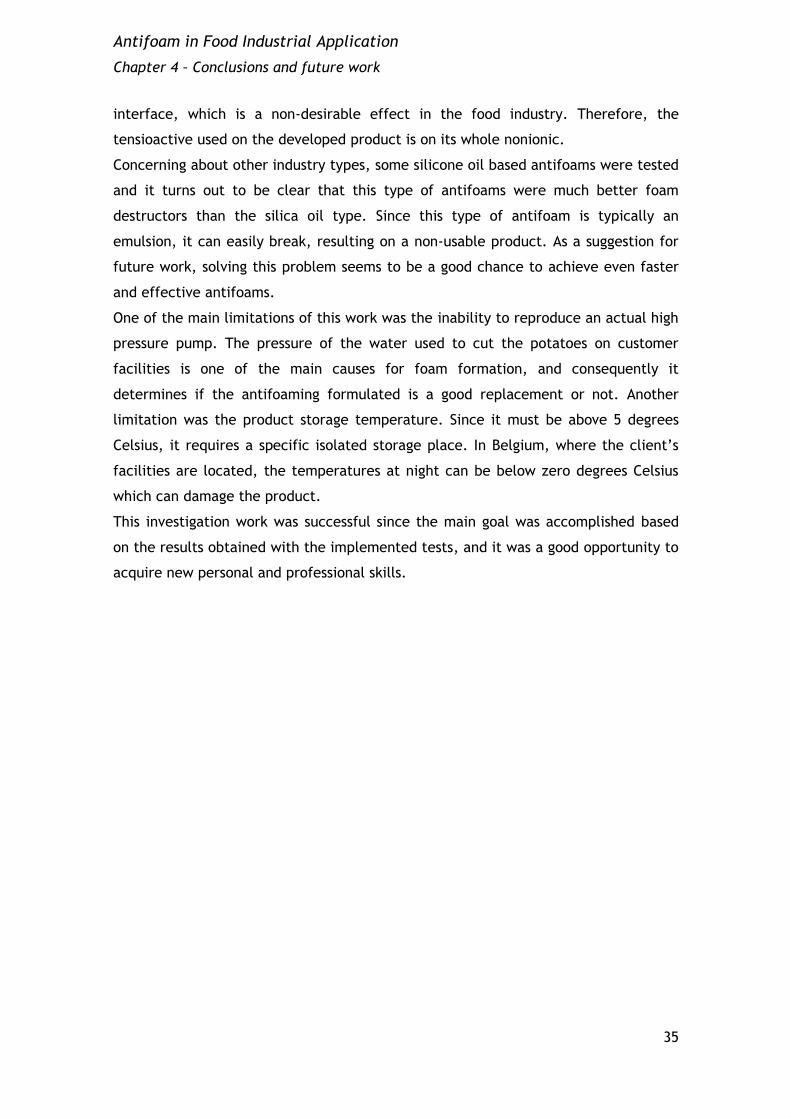
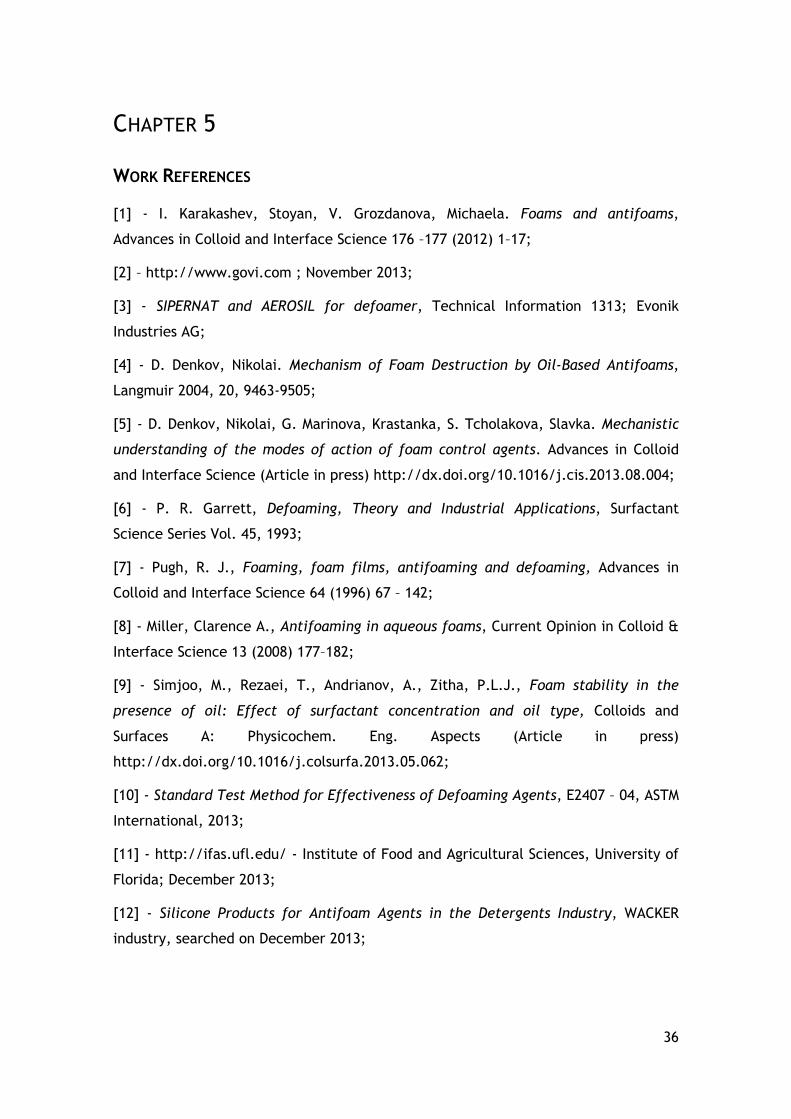
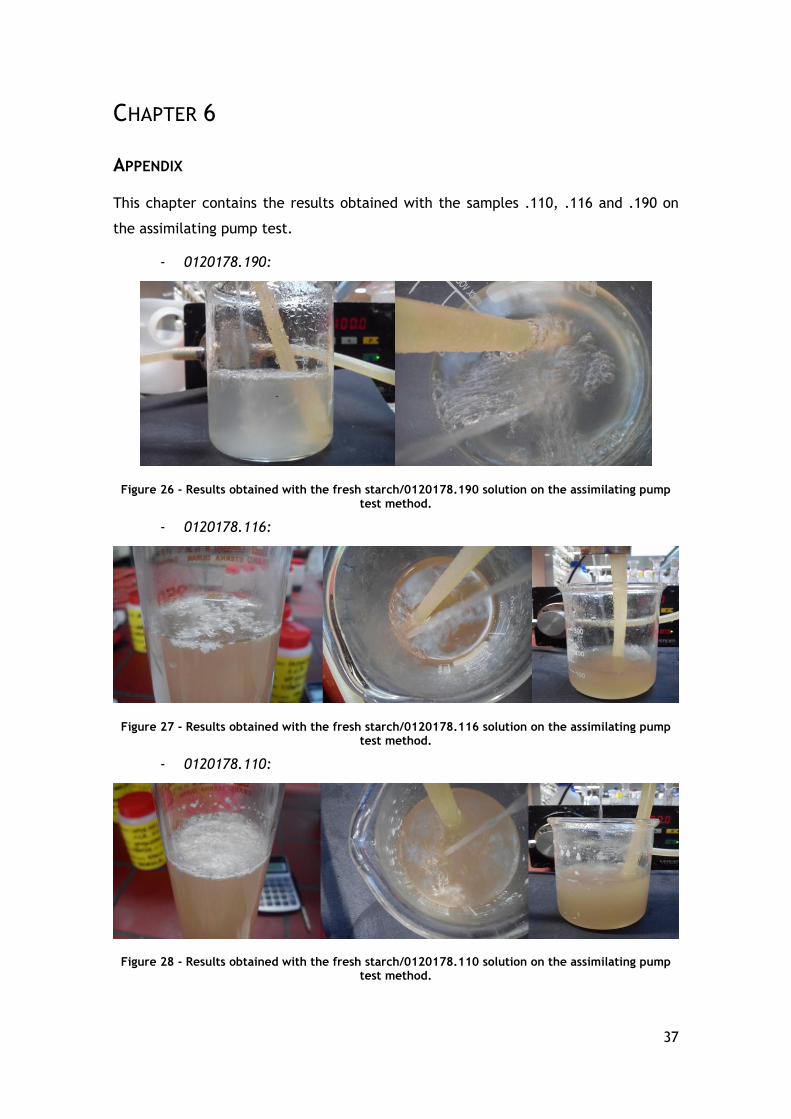
The results obtained using samples .110, .116 and .190 are presented on the
appendix. Samples .110 and .116 formed big particles that could damage the potato
quality as well as the customer facilities. Sample .190 appears to have the same
fulfilling results as the .79 sample, but unfortunately it is not approved in the food
industry.
34
CHAPTER 4
CONCLUSIONS AND FUTURE WORK
This work was aimed to develop an antifoaming product, based on the one that the
company has currently on the market, in an attempt to improve the latest and fulfill
the costumer upcoming needs This new version had to be able to combine durability,
efficiency, be food approved and still present a homogeneous appearance at room
temperature storage.
In order to deliver an antifoaming with such characteristics range, several test
methods were implemented with the purpose of determining which were the
optimum conditions that could lead to an ideal antifoaming product with better
results than the one currently on the market. After this investigation, one of the
tested formulas was found to be the best replacement since it fulfills all the
requirements of the unsatisfied customer. This sample, the 0120178.79, is an oil
based antifoam, and for it, food approved, that has a stable and homogeneous aspect
trough time at a room temperature storage. After one month of tests the results
were still satisfying, unlike the sample of the commercialized product, and therefore
the product can possibly be a good replacement that could improve client
satisfaction.
The results obtained showed which were the optimum conditions to achieve ideal
antifoaming properties. The optimum temperature storage for the product is 40
degrees Celsius. Since it is a difficult temperature mark to the majority of
companies, a room storage temperature is not option to exclude, as the results
showed that although performance is worse, the difference is not that significant.
The optimum pH values are between a range of 6 and 8. As tap water fits this range,
all of the tests were made using tap water without previous pH regulation. The ideal
water temperature is 25 degrees Celsius, and the optimum silica percentage is 7
percent. Since the best silica type, hydrophobic fumed silica, generates a sample
with a non-acceptable viscosity, the replacement product has in its formulation the
same silica of the one that is commercialized, hydrophobic precipitated silica.
Regarding the optimum oil type and keeping in mind that it has to be food approved,
the one with best results was a vegetable oil. The optimum tensioactive type, 30
percent of anionic and 70 percent of nonionic tensioactives, had good results but
unfortunately it has the disadvantage of creating big particles on the water/air
Antifoam in Food Industrial Application
Chapter 4 – Conclusions and future work
35
interface, which is a non-desirable effect in the food industry. Therefore, the
tensioactive used on the developed product is on its whole nonionic.
Concerning about other industry types, some silicone oil based antifoams were tested
and it turns out to be clear that this type of antifoams were much better foam
destructors than the silica oil type. Since this type of antifoam is typically an
emulsion, it can easily break, resulting on a non-usable product. As a suggestion for
future work, solving this problem seems to be a good chance to achieve even faster
and effective antifoams.
One of the main limitations of this work was the inability to reproduce an actual high
pressure pump. The pressure of the water used to cut the potatoes on customer
facilities is one of the main causes for foam formation, and consequently it
determines if the antifoaming formulated is a good replacement or not. Another
limitation was the product storage temperature. Since it must be above 5 degrees
Celsius, it requires a specific isolated storage place. In Belgium, where the client’s
facilities are located, the temperatures at night can be below zero degrees Celsius
which can damage the product.
This investigation work was successful since the main goal was accomplished based
on the results obtained with the implemented tests, and it was a good opportunity to
acquire new personal and professional skills.
36
CHAPTER 5
WORK REFERENCES
[1] - I. Karakashev, Stoyan, V. Grozdanova, Michaela. Foams and antifoams,
Advances in Colloid and Interface Science 176 –177 (2012) 1–17;
[2] – http://www.govi.com ; November 2013;
[3] - SIPERNAT and AEROSIL for defoamer, Technical Information 1313; Evonik
Industries AG;
[4] - D. Denkov, Nikolai. Mechanism of Foam Destruction by Oil-Based Antifoams,
Langmuir 2004, 20, 9463-9505;
[5] - D. Denkov, Nikolai, G. Marinova, Krastanka, S. Tcholakova, Slavka. Mechanistic
understanding of the modes of action of foam control agents. Advances in Colloid
and Interface Science (Article in press) http://dx.doi.org/10.1016/j.cis.2013.08.004;
[6] - P. R. Garrett, Defoaming, Theory and Industrial Applications, Surfactant
Science Series Vol. 45, 1993;
[7] - Pugh, R. J., Foaming, foam films, antifoaming and defoaming, Advances in
Colloid and Interface Science 64 (1996) 67 – 142;
[8] - Miller, Clarence A., Antifoaming in aqueous foams, Current Opinion in Colloid &
Interface Science 13 (2008) 177–182;
[9] - Simjoo, M., Rezaei, T., Andrianov, A., Zitha, P.L.J., Foam stability in the
presence of oil: Effect of surfactant concentration and oil type, Colloids and
Surfaces A: Physicochem. Eng. Aspects (Article in press)
http://dx.doi.org/10.1016/j.colsurfa.2013.05.062;
[10] - Standard Test Method for Effectiveness of Defoaming Agents, E2407 – 04, ASTM
International, 2013;
[11] - http://ifas.ufl.edu/ - Institute of Food and Agricultural Sciences, University of
Florida; December 2013;
[12] - Silicone Products for Antifoam Agents in the Detergents Industry, WACKER
industry, searched on December 2013;
37
CHAPTER 6
APPENDIX
This chapter contains the results obtained with the samples .110, .116 and .190 on
the assimilating pump test.
- 0120178.190:
Figure 26 - Results obtained with the fresh starch/0120178.190 solution on the assimilating pump test method.
- 0120178.116:
Figure 27 - Results obtained with the fresh starch/0120178.116 solution on the assimilating pump test method.
- 0120178.110:
Figure 28 - Results obtained with the fresh starch/0120178.110 solution on the assimilating pump test method.