Embed Size (px)
Citation preview
JOURNAL OF FINANCIAL AND QUANTITATIVE ANALYSIS Vol. 50, No. 4, Aug. 2015, pp. 647–669COPYRIGHT 2015, MICHAEL G. FOSTER SCHOOL OF BUSINESS, UNIVERSITY OF WASHINGTON, SEATTLE, WA 98195doi:10.1017/S0022109015000381
Anticipating the 2007–2008 Financial Crisis:Who Knew What and When Did They Know It?
Biljana Adebambo, Paul Brockman, and Xuemin (Sterling) Yan∗
Abstract
We examine the ability of three groups of informed market participants to anticipate the2007–2008 financial crisis. Institutional investors and financial analysts exhibit someawareness of the impending crisis in their preference for nonfinancial stocks over financialstocks. In contrast, corporate insiders of financial firms appear to be completely unaware ofthe timing and extent of the financial crisis. Net purchases by managers of financial firmsexceed those by managers of nonfinancial firms over the entire 2006–2008 period. Ourresults add considerable weight to the argument that the financial crisis was more a case offlawed judgment than flawed incentives.
I. Introduction
The 2007–2008 financial crisis created the largest economic disruption sincethe Great Depression. It resulted in the collapse of financial institutions, the bailoutof banks by governments, and severe downturns in stock markets around theworld. By any measure of economic activity (e.g., employment, gross domes-tic product, and asset values), the 2007–2008 financial crisis, the so-called GreatRecession, ranks uncomfortably close to the Great Depression. A large body ofwork has emerged to examine the causes and consequences of the recent financialcrisis. Much of this research focuses on the banking sector, liquidity problems,policy reactions, and the real effects of the financial crisis.1 The purpose of thisstudy is to contribute to our understanding of financial crises by analyzing thebehavior of major market participants before and during the Great Recession.Specifically, we investigate the ability of three groups of informed market partic-ipants, that is, institutional investors, financial analysts, and corporate insiders, toforecast the impending crisis.
∗Adebambo, [email protected], University of San Diego, School of Business Administra-tion, San Diego, CA 92110; Brockman, [email protected], Lehigh University, College of Businessand Economics, Bethlehem, PA 18015; and Yan (corresponding author), [email protected], Univer-sity of Missouri, Trulaske College of Business, Columbia, MO 65211. We thank Stephen Brown (theeditor) and two anonymous referees for their helpful comments.
1See, for example, Campello, Graham, and Harvey (2010), Ivashina and Scharfstein (2010),Longstaff (2010), Erkens, Hung, and Matos (2012), and Gorton and Metrick (2012) and referencestherein.
647

648 Journal of Financial and Quantitative Analysis
Previous studies have examined the informational role of institutionalinvestors, financial analysts, and corporate insiders during normal market con-ditions. These studies draw conflicting conclusions about the extent to whichinstitutions, analysts, and insiders are informed. Several studies show that institu-tional trading predicts future earnings and stock returns (e.g., Nofsinger and Sias(1999), Ali, Durtschi, and Trombley (2004), and Yan and Zhang (2009)), whereasothers find an inverse relation between institutional demand and future returns(e.g., Cai and Zheng (2004), Dasgupta, Prat, and Verardo (2011)). Similarly,many studies find that changes in analyst recommendations are informative ofsubsequent stock returns (e.g., Womack (1996), Jegadeesh, Kim, Krische, andLee (2004)), whereas others contend that analyst recommendations are unin-formed (e.g., Altinkilic and Hansen (2009)). Finally, several studies find that trad-ing by corporate insiders earns abnormal returns (e.g., Rozeff and Zaman (1988),Lakonishok and Lee (2001)), whereas others document zero or even negative ab-normal performance by insiders (e.g., Eckbo and Smith (1998), Chakravarty andMcConnell (1999)).
In addition to these mixed results regarding the predictive abilities of institu-tions, analysts, and insiders, no previous study has examined their predictive abil-ities during an extreme financial crisis. One of the difficulties faced by researchersduring normal market conditions is the lack of identifiable and significant eventsthat would prompt intensive information-based trading. We overcome this dif-ficulty by focusing on the recent financial crisis, a significant event with largewealth effects, thereby increasing the power of our tests for private information.During the 2007–2008 crisis, the stock market in general and the financial sectorin particular suffered substantial losses.2 If institutional investors, financial ana-lysts, and corporate insiders possessed superior knowledge about the impendingcrisis, we would expect them to have acted on it.
Although the degree to which market participants are able to anticipatefinancial crises is an open empirical question, Piotroski and Roulstone (2004) pro-vide an analytical framework from which to structure our analysis. Their studyexamines the relative abilities of institutions, analysts, and insiders to processfirm-level, industry-level, and market-level information. They find that financialanalysts have a comparative advantage at the industry level, whereas corporate in-siders have a comparative advantage at the firm level. The comparative advantageof institutional investors is less straightforward, because it depends on whether theinstitution represents an insider (firm-level advantage) or outsider (market-leveladvantage). Because the 2007–2008 financial crisis originated in the financialsector and then spread to the overall market, we expect that financial analysts arein the best position to anticipate this industry-level meltdown. In contrast, we ex-pect that corporate insiders’ firm-level information advantage is unlikely to havegiven them advance warning of an industry-based crisis. Finally, the predictiveability of institutions should lie somewhere between that of analysts and insid-ers, because institutional investors have comparative advantages at the aggregatemarket level.
2From June 2007 to Dec. 2008, financial stocks lost, on average, nearly 60% of their market value,whereas nonfinancial stocks lost less than 40%.

Adebambo, Brockman, and Yan 649
In addition to generating evidence on the predictive ability of informedmarket participants, our results have direct implications for the ongoing debateabout the role of financial firm executives. The critical issue in this debate iswhether the disastrous outcomes of 2007–2008 were caused by financial firmexecutives’ exploitation of a fundamentally flawed incentive system or by whatproved to be bad decision making after the fact. Johnson (2011) summarizes thisdebate as follows:
One view of executives at our largest banks in the run-up to the crisisof 2008 is that they were hapless fools. Unaware of how financial inno-vation had created toxic products and made the system fundamentallyunstable, they blithely piled on more debt and inadvertently took ongreater risks. The alternative view is that these people were more knavesthan fools. They understood to a large degree what they and their com-panies were doing, and they kept at it up until the last minute—and insome cases beyond—because of incentives they might receive.
The debate of “knaves versus fools” has important consequences for corpo-rate policy and regulatory changes, as well as for civil and criminal liabilities. Em-pirical evidence that might shed light on this issue is only at the beginning stages,and rather mixed to date. Bhagat and Bolton (2013) support the knaves’ view byarguing that poorly designed incentive packages encouraged financial executivesto knowingly take on excessive risk. In contrast, Fahlenbrach and Stulz (2011)lean toward the fools’ view by arguing that the financial crisis was the result of“unexpected poor outcomes.” These poor outcomes are the result of a bad drawfrom an ex post viewpoint and not the result of excessive risk taking or the pur-suit of private gains at shareholder expense on an ex ante basis.3 Which of thesetwo narratives, knaves or fools, best captures actual executive behavior before andduring the crisis is an open empirical question. Our empirical results add consid-erable weight to this debate by examining insider trading among financial firmexecutives.
Our first set of empirical tests examines the ability of institutional investorsto anticipate the financial crisis. We investigate the levels of and changes in insti-tutional ownership of financial versus nonfinancial firms for the 12-quarter periodbefore and during the financial crisis (2006–2008). Our results show that institu-tional investors significantly underweight financial firms relative to nonfinancialfirms (by 23.31% to 25.48%) in each of the 12 quarters under investigation. Whenexamining cumulative trading since the beginning of 2006, we find evidence thatinstitutions, particularly short-term institutions and top-performing institutions,exhibit some predictive ability for the financial crisis. Overall, we conclude thatinstitutional investors had some knowledge of the impending financial crisis.
Our second set of empirical tests investigates the ability of financial ana-lysts to anticipate the financial crisis. We examine analyst recommendations for
3Cheng, Raina, and Xiong (2014) reach similar conclusions about the role of financial managers inthe related housing market bubble. In a related paper, Cheng, Hong, and Scheinkman (2015) show thatexecutive compensation and firm risk can be positively correlated, even in the absence of managerialentrenchment.
650 Journal of Financial and Quantitative Analysis
financial versus nonfinancial firms. Our results show that analyst recommenda-tions are significantly lower for financial firms relative to nonfinancial firms inevery month of our 36-month period. In addition, we find weak evidence that an-alysts are more likely to downgrade financial firms relative to nonfinancial firmsleading up to the financial crisis. Taken together, the analyst results suggest that fi-nancial analysts exhibit some awareness of the financial sector weaknesses aroundthe crisis period.
Our third and perhaps most interesting set of empirical tests examines theability of corporate insiders to anticipate the financial crisis. Our results show thatinsiders of financial firms have higher net purchases than insiders of nonfinancialfirms in every 6-month interval of our sample period. Whereas insiders of non-financial firms are net sellers over the entire sample period, insiders of financialfirms are net buyers in half of these 6-month intervals. Even during the periodswhen financial firm insiders are net sellers, the magnitude of their net sellingis significantly smaller than that of their nonfinancial firm counterparts. Theseinsider trading results are striking. Corporate insiders of financial firms revealsignificantly more optimism in their trading patterns than do the insiders of non-financial firms. Contrary to the popular view that bank executives exploited theirprivileged inside information during the financial crisis, our results demonstratethat these executives were net accumulators of their own company stock relativeto executives in nonfinancial firms.
Several concurrent papers examine the role of institutional investors and cor-porate insiders in the recent financial crisis (e.g., Manconi, Massa, and Yasuda(2012), Ben-David, Franzoni, and Moussawi (2012), and Erkens et al. (2012)).Our paper differs from these studies in two important ways. First, we performour analysis at the aggregate (i.e., industry) level, rather than at the individualfirm level. Although there are large variations across financial firms, the recentfinancial crisis is primarily an aggregate phenomenon driven by macro and sys-temic risk rather than firm-specific risk. Second, we draw most of our inferencesfrom comparing financial firms with nonfinancial firms, rather than by examin-ing financial firms in isolation. This research design helps control for unobservedfactors that might influence both financial and nonfinancial firms while exploitingthe facts that i) the 2007–2008 crisis originated in the finance sector, and ii) finan-cial firms suffered substantially greater losses than nonfinancial firms during thecrisis.
Our study makes several contributions to the literature and provides relevantevidence to ongoing policy debates. First, this is the first comprehensive study thatanalyzes the degree to which informed market participants are able to anticipatesevere economic and financial shocks. Although researchers could not performsuch an analysis for the Great Depression due to data constraints, we are ableto examine the question of “who knew what and when did they know it” for theGreat Recession.
Second, we provide new evidence that institutional investors and financialanalysts expressed their concerns about a possible crisis by underweighting finan-cial stocks or by giving significantly more negative recommendations to financialfirms than to nonfinancial firms. Our finding regarding financial analysts, in par-ticular, is consistent with the implications of Piotroski and Roulstone’s (2004)

Adebambo, Brockman, and Yan 651
study that financial analysts have a relative information advantage at the industryor market level. The authors argue that “financial analysts are outsiders who gen-erally have less access to firm-level idiosyncratic information than either man-agement or significant institutional investors. As such, analysts could focus theirefforts on obtaining and mapping industry- and market-level information intoprices” (p. 1121). Our findings support this argument by showing that financialanalysts appeared anxious about the overall financial sector during the run-up tothe crisis.
Third, we show that the insiders of financial firms made significantlyhigher net purchases than their nonfinancial firm counterparts. This finding isconsistent with a growing body of evidence (e.g., Fahlenbrach and Stulz (2011),Cheng et al. (2014)) suggesting that the financial crisis was more the resultof flawed judgment (or a bad draw) than flawed managerial incentives. Thisconclusion suggests that recent regulatory proposals designed to restructuremanagerial incentives as a means of preventing future financial crises are unlikelyto succeed.
The remainder of this paper proceeds as follows: Section II describes ourdata and provides descriptive statistics. Section III presents the empirical results.Section IV concludes the study.
II. Data Sources, Sample Construction, and DescriptiveStatistics
A. Data Sources and Sample Construction
We obtain data on institutional quarterly holdings from the ThomsonFinancial Network (TFN) 13F Holdings database for the period from 2006:Q1to 2008:Q4. In addition to analyzing all institutional investors as a single group,we separately examine short-term institutions, hedge funds, and top-performinginstitutions. We follow Yan and Zhang (2009) and classify an institution as ashort-term institution if its turnover over the past 4 quarters ranks in the toptercile of all institutions. We classify an institution as a hedge fund if itsname in the TFN database matches a name from the Center for InternationalSecurities and Derivatives Markets (CISDM) hedge fund database. We classifyan institution as a top-performing institution if its 4-factor alpha (based onCarhart (1997)) estimated over the past 36 months ranks in the top tercile of allinstitutions.
We merge the institutional holdings data with the Compustat database toobtain the book value of common equity and common stock dividends and withthe Center for Research in Security Prices (CRSP) monthly database to obtainStandard Industrial Classification (SIC) code, price, return, shares outstanding,and volume information. We restrict our study to common stocks (CRSP sharecode 10 or 11) and use SIC codes to determine whether a firm belongs to thefinancial industry. We follow the definition of financial firm provided in the U.S.Securities and Exchange Commission (SEC) Emergency Order from Sept. 18,2008; specifically, financial firms include companies with the SIC codes 6000,6011, 6020–6022, 6025, 6030, 6035–6036, 6111, 6140, 6144, 6200, 6210–6211,
652 Journal of Financial and Quantitative Analysis
6231, 6282, 6305, 6310–6311, 6320–6321, 6324, 6330–6331, 6350–6351, 6360–6361, 6712, and 6719.4,5
We obtain analyst recommendations from the Institutional Brokers’ EstimateSystem (IBES) database. Analysts report their recommendations using differentrating scales. However, IBES changes those scales to maintain a standard set ofrecommendations with five values, ranging from 1= strong buy to 5= strong sell.We re-code this recommendation system so that larger numbers indicate betterratings (i.e., 1 = strong sell and 5 = strong buy).
We use the TFN Insider database to obtain information on insider trades. TheSEC requires insiders to report their trades within 2 business days of the transac-tion date. We restrict our insider trading analysis to management only. FollowingLakonishok and Lee (2001), we define a firm’s management group to include theCEO, CFO, chairperson of the board, directors, officers, presidents, and vice pres-idents (TFN role codes CEO, CFO, CB, D, O, P, VP). To focus on information-driven trading, we exclude all transactions related to the exercise of executivestock options (i.e., the acquisition and subsequent disposition of company stock).Following Lakonishok and Lee (2001), we apply several filters to the insider trad-ing data to ensure accuracy. We exclude all transactions that are less than 100shares or more than 20% of shares outstanding, as well as transactions with pricesthat differ by more than 20% of the closing price.
B. Descriptive Statistics
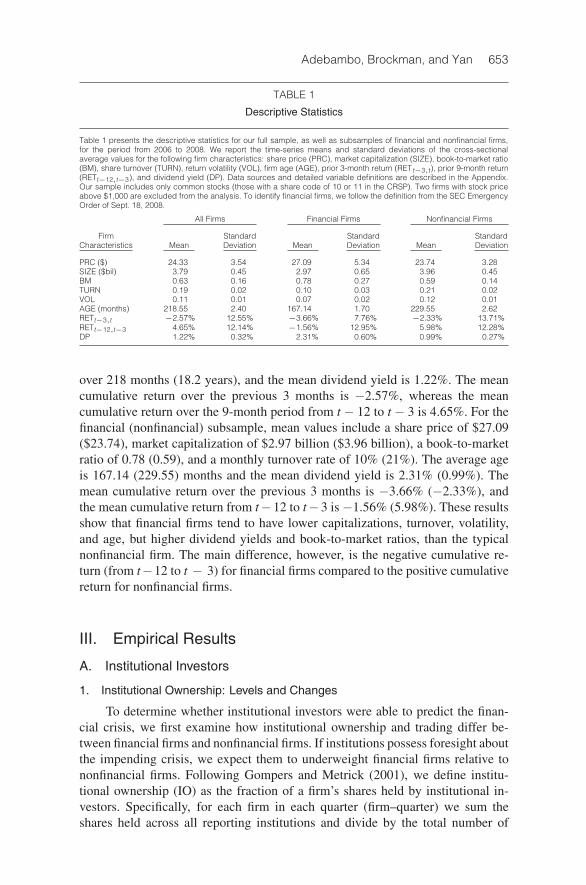
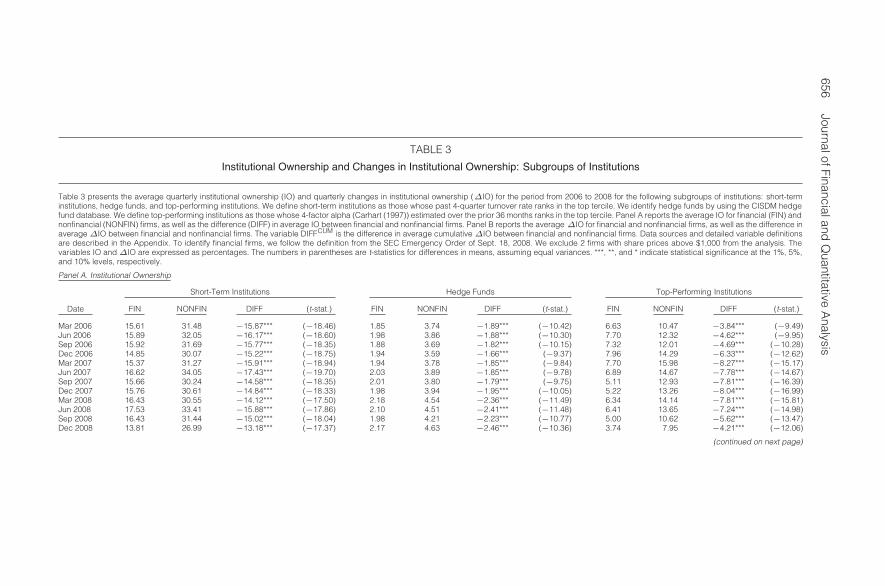
In Table 1 we present descriptive statistics for our full sample, as well as forsubsamples of financial and nonfinancial firms. We report the time-series meanand standard deviation of cross-sectional average values for the following firmcharacteristics: share price (PRC), market capitalization (SIZE), book-to-marketratio (BM), share turnover (TURN), return volatility (VOL), firm age (AGE),previous 3-month return (RETt−3,t), previous 9-month return (RETt−12,t−3), anddividend yield (DP).6 More detailed variable definitions are provided in theAppendix.
For the full sample, the mean values include a share price of $24.33, mar-ket capitalization of $3.79 billion, a book-to-market ratio of 0.63, and a monthlyturnover rate of 19%. The average age since initial public offering is a little
4We replicate all empirical results using two alternative definitions of financial firms, onedefinition that is more restrictive than the SEC definition and a second definition that is less re-strictive than the SEC definition. Our more restrictive definition is based on that of Flannery,Kwan, and Nimalendran (2004) and includes only those firms with SIC codes from 6021 to6025 and from 6710 to 6712. Our less restrictive definition includes all firms with SIC codesfrom 6000 to 6999. The empirical results based on both alternative definitions are consistent withthose reported herein. Due to space limitations, we provide these results in an Internet Appendix(available at www.jfqa.org).
5In addition to financial versus nonfinancial firms, we also compare Troubled Asset Relief Pro-gram (TARP) firms to non-TARP firms. The findings are consistent with those of the financial versusnonfinancial firms (i.e., institutions and analysts show some ability to identify financially vulnerablefirms before the onset of the crisis). We present the TARP versus non-TARP results in our InternetAppendix.
6We exclude two financial firms from the analysis because their stock prices are above $1,000 pershare. We winsorize DP at the 99th percentile and BM at the 1st and 99th percentiles.
Adebambo, Brockman, and Yan 653
TABLE 1
Descriptive Statistics
Table 1 presents the descriptive statistics for our full sample, as well as subsamples of financial and nonfinancial firms,for the period from 2006 to 2008. We report the time-series means and standard deviations of the cross-sectionalaverage values for the following firm characteristics: share price (PRC), market capitalization (SIZE), book-to-market ratio(BM), share turnover (TURN), return volatility (VOL), firm age (AGE), prior 3-month return (RETt−3,t), prior 9-month return(RETt−12,t−3), and dividend yield (DP). Data sources and detailed variable definitions are described in the Appendix.Our sample includes only common stocks (those with a share code of 10 or 11 in the CRSP). Two firms with stock priceabove $1,000 are excluded from the analysis. To identify financial firms, we follow the definition from the SEC EmergencyOrder of Sept. 18, 2008.
All Firms Financial Firms Nonfinancial Firms
Firm Standard Standard StandardCharacteristics Mean Deviation Mean Deviation Mean Deviation
PRC ($) 24.33 3.54 27.09 5.34 23.74 3.28SIZE ($bil) 3.79 0.45 2.97 0.65 3.96 0.45BM 0.63 0.16 0.78 0.27 0.59 0.14TURN 0.19 0.02 0.10 0.03 0.21 0.02VOL 0.11 0.01 0.07 0.02 0.12 0.01AGE (months) 218.55 2.40 167.14 1.70 229.55 2.62RETt−3,t −2.57% 12.55% −3.66% 7.76% −2.33% 13.71%RETt−12,t−3 4.65% 12.14% −1.56% 12.95% 5.98% 12.28%DP 1.22% 0.32% 2.31% 0.60% 0.99% 0.27%
over 218 months (18.2 years), and the mean dividend yield is 1.22%. The meancumulative return over the previous 3 months is −2.57%, whereas the meancumulative return over the 9-month period from t − 12 to t − 3 is 4.65%. For thefinancial (nonfinancial) subsample, mean values include a share price of $27.09($23.74), market capitalization of $2.97 billion ($3.96 billion), a book-to-marketratio of 0.78 (0.59), and a monthly turnover rate of 10% (21%). The average ageis 167.14 (229.55) months and the mean dividend yield is 2.31% (0.99%). Themean cumulative return over the previous 3 months is −3.66% (−2.33%), andthe mean cumulative return from t−12 to t−3 is−1.56% (5.98%). These resultsshow that financial firms tend to have lower capitalizations, turnover, volatility,and age, but higher dividend yields and book-to-market ratios, than the typicalnonfinancial firm. The main difference, however, is the negative cumulative re-turn (from t−12 to t − 3) for financial firms compared to the positive cumulativereturn for nonfinancial firms.
III. Empirical Results
A. Institutional Investors
1. Institutional Ownership: Levels and Changes
To determine whether institutional investors were able to predict the finan-cial crisis, we first examine how institutional ownership and trading differ be-tween financial firms and nonfinancial firms. If institutions possess foresight aboutthe impending crisis, we expect them to underweight financial firms relative tononfinancial firms. Following Gompers and Metrick (2001), we define institu-tional ownership (IO) as the fraction of a firm’s shares held by institutional in-vestors. Specifically, for each firm in each quarter (firm–quarter) we sum theshares held across all reporting institutions and divide by the total number of
654 Journal of Financial and Quantitative Analysis
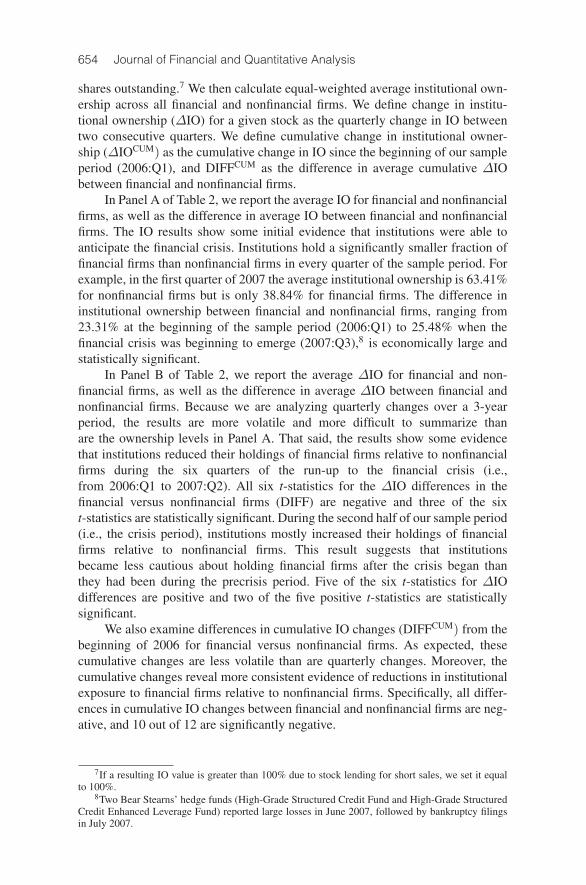
shares outstanding.7 We then calculate equal-weighted average institutional own-ership across all financial and nonfinancial firms. We define change in institu-tional ownership (ΔIO) for a given stock as the quarterly change in IO betweentwo consecutive quarters. We define cumulative change in institutional owner-ship (ΔIOCUM) as the cumulative change in IO since the beginning of our sampleperiod (2006:Q1), and DIFFCUM as the difference in average cumulative ΔIObetween financial and nonfinancial firms.
In Panel A of Table 2, we report the average IO for financial and nonfinancialfirms, as well as the difference in average IO between financial and nonfinancialfirms. The IO results show some initial evidence that institutions were able toanticipate the financial crisis. Institutions hold a significantly smaller fraction offinancial firms than nonfinancial firms in every quarter of the sample period. Forexample, in the first quarter of 2007 the average institutional ownership is 63.41%for nonfinancial firms but is only 38.84% for financial firms. The difference ininstitutional ownership between financial and nonfinancial firms, ranging from23.31% at the beginning of the sample period (2006:Q1) to 25.48% when thefinancial crisis was beginning to emerge (2007:Q3),8 is economically large andstatistically significant.
In Panel B of Table 2, we report the average ΔIO for financial and non-financial firms, as well as the difference in average ΔIO between financial andnonfinancial firms. Because we are analyzing quarterly changes over a 3-yearperiod, the results are more volatile and more difficult to summarize thanare the ownership levels in Panel A. That said, the results show some evidencethat institutions reduced their holdings of financial firms relative to nonfinancialfirms during the six quarters of the run-up to the financial crisis (i.e.,from 2006:Q1 to 2007:Q2). All six t-statistics for the ΔIO differences in thefinancial versus nonfinancial firms (DIFF) are negative and three of the sixt-statistics are statistically significant. During the second half of our sample period(i.e., the crisis period), institutions mostly increased their holdings of financialfirms relative to nonfinancial firms. This result suggests that institutionsbecame less cautious about holding financial firms after the crisis began thanthey had been during the precrisis period. Five of the six t-statistics for ΔIOdifferences are positive and two of the five positive t-statistics are statisticallysignificant.
We also examine differences in cumulative IO changes (DIFFCUM) from thebeginning of 2006 for financial versus nonfinancial firms. As expected, thesecumulative changes are less volatile than are quarterly changes. Moreover, thecumulative changes reveal more consistent evidence of reductions in institutionalexposure to financial firms relative to nonfinancial firms. Specifically, all differ-ences in cumulative IO changes between financial and nonfinancial firms are neg-ative, and 10 out of 12 are significantly negative.
7If a resulting IO value is greater than 100% due to stock lending for short sales, we set it equalto 100%.
8Two Bear Stearns’ hedge funds (High-Grade Structured Credit Fund and High-Grade StructuredCredit Enhanced Leverage Fund) reported large losses in June 2007, followed by bankruptcy filingsin July 2007.
Adebambo, Brockman, and Yan 655
TABLE 2
Institutional Ownership and Changes in Institutional Ownership
Table 2 presents the average quarterly institutional ownership (IO) and quarterly changes in institutional ownership (ΔIO)for the period from 2006 to 2008. Panel A reports the average IO for financial (FIN) and nonfinancial (NONFIN) firms, aswell as the difference (DIFF) in average IO between financial and nonfinancial firms. Panel B reports the average ΔIO forfinancial and nonfinancial firms, as well as the difference in average ΔIO between financial and nonfinancial firms. Thevariable DIFFCUM is the difference in average cumulative ΔIO between financial and nonfinancial firms. Data sourcesand detailed variable definitions are described in the Appendix. To identify financial firms, we follow the definition fromthe SEC Emergency Order of Sept. 18, 2008. We exclude two firms with share prices above $1,000 from the analysis. Thevariables IO andΔIO are expressed as percentages. The numbers in parentheses are t-statistics for differences in means,assuming equal variances. ***, **, and * indicate statistical significance at the 1%, 5%, and 10% levels, respectively.
Panel A. Institutional Ownership
Date FIN NONFIN DIFF (t-stat.)
Mar 2006 36.44 59.75 −23.31*** (−17.17)Jun 2006 36.95 60.69 −23.75*** (−17.58)Sep 2006 37.52 61.62 −24.10*** (−17.71)Dec 2006 38.92 62.78 −23.86*** (−17.27)Mar 2007 38.84 63.41 −24.57*** (−18.07)Jun 2007 39.72 65.05 −25.32*** (−18.34)Sep 2007 40.99 66.47 −25.48*** (−17.84)Dec 2007 40.65 65.07 −24.42*** (−17.64)Mar 2008 39.55 64.20 −24.65*** (−17.74)Jun 2008 40.40 65.05 −24.64*** (−17.73)Sep 2008 40.12 64.60 −24.48*** (−17.65)Dec 2008 37.58 61.79 −24.21*** (−17.47)
Panel B. Changes in Institutional Ownership
Date FIN NONFIN DIFF (t-stat.) DIFFCUM (t-stat.)
Mar 2006 1.13 1.58 −0.45 (−1.52) −0.45 (−1.52)Jun 2006 0.41 0.85 −0.44 (−1.39) −0.88** (−2.12)Sep 2006 0.69 1.20 −0.51** (−1.92) −1.48*** (−3.04)Dec 2006 1.43 1.66 −0.23 (−0.74) −1.65*** (−3.09)Mar 2007 0.13 0.75 −0.62** (−1.96) −2.34*** (−4.02)Jun 2007 1.04 1.99 −0.95*** (−3.35) −3.38*** (−5.41)Sep 2007 1.86 1.71 0.15 (0.43) −3.03*** (−4.38)Dec 2007 −0.64 −1.65 1.01*** (2.69) −2.10*** (−3.00)Mar 2008 −0.11 0.08 −0.18 (−0.59) −2.15*** (−2.86)Jun 2008 0.62 0.61 0.01 (0.02) −2.26*** (−2.88)Sep 2008 0.09 0.03 0.06 (0.20) −2.20*** (−2.72)Dec 2008 −2.00 −3.00 0.99** (2.41) −1.08 (−1.27)
2. Short-Term Institutions, Hedge Funds, and Top-Performing Institutions
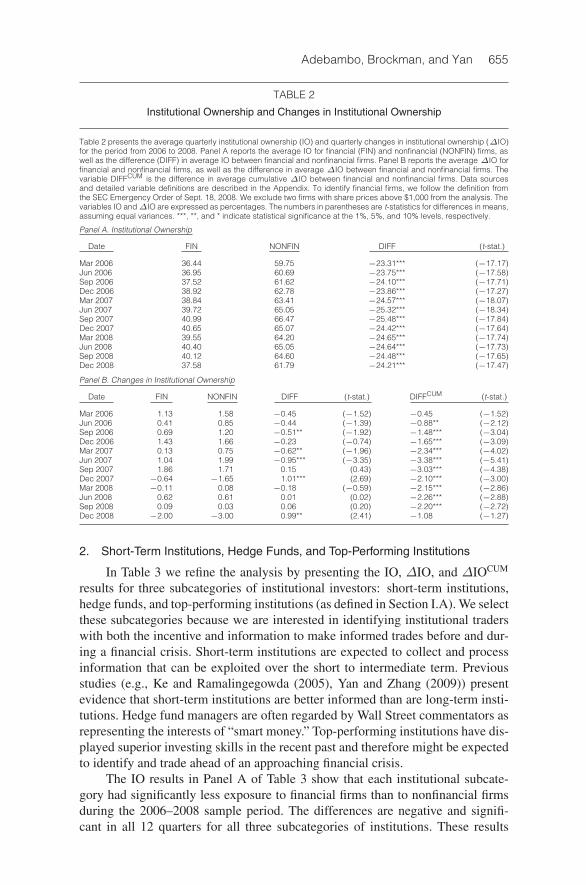
In Table 3 we refine the analysis by presenting the IO, ΔIO, and ΔIOCUM
results for three subcategories of institutional investors: short-term institutions,hedge funds, and top-performing institutions (as defined in Section I.A). We selectthese subcategories because we are interested in identifying institutional traderswith both the incentive and information to make informed trades before and dur-ing a financial crisis. Short-term institutions are expected to collect and processinformation that can be exploited over the short to intermediate term. Previousstudies (e.g., Ke and Ramalingegowda (2005), Yan and Zhang (2009)) presentevidence that short-term institutions are better informed than are long-term insti-tutions. Hedge fund managers are often regarded by Wall Street commentators asrepresenting the interests of “smart money.” Top-performing institutions have dis-played superior investing skills in the recent past and therefore might be expectedto identify and trade ahead of an approaching financial crisis.
The IO results in Panel A of Table 3 show that each institutional subcate-gory had significantly less exposure to financial firms than to nonfinancial firmsduring the 2006–2008 sample period. The differences are negative and signifi-cant in all 12 quarters for all three subcategories of institutions. These results
656JournalofFinancialand
Quantitative
Analysis
TABLE 3
Institutional Ownership and Changes in Institutional Ownership: Subgroups of Institutions
Table 3 presents the average quarterly institutional ownership (IO) and quarterly changes in institutional ownership (ΔIO) for the period from 2006 to 2008 for the following subgroups of institutions: short-terminstitutions, hedge funds, and top-performing institutions. We define short-term institutions as those whose past 4-quarter turnover rate ranks in the top tercile. We identify hedge funds by using the CISDM hedgefund database. We define top-performing institutions as those whose 4-factor alpha (Carhart (1997)) estimated over the prior 36 months ranks in the top tercile. Panel A reports the average IO for financial (FIN) andnonfinancial (NONFIN) firms, as well as the difference (DIFF) in average IO between financial and nonfinancial firms. Panel B reports the average ΔIO for financial and nonfinancial firms, as well as the difference inaverageΔIO between financial and nonfinancial firms. The variable DIFFCUM is the difference in average cumulativeΔIO between financial and nonfinancial firms. Data sources and detailed variable definitionsare described in the Appendix. To identify financial firms, we follow the definition from the SEC Emergency Order of Sept. 18, 2008. We exclude 2 firms with share prices above $1,000 from the analysis. Thevariables IO andΔIO are expressed as percentages. The numbers in parentheses are t-statistics for differences in means, assuming equal variances. ***, **, and * indicate statistical significance at the 1%, 5%,and 10% levels, respectively.
Panel A. Institutional Ownership
Short-Term Institutions Hedge Funds Top-Performing Institutions
Date FIN NONFIN DIFF (t-stat.) FIN NONFIN DIFF (t-stat.) FIN NONFIN DIFF (t-stat.)
Mar 2006 15.61 31.48 −15.87*** (−18.46) 1.85 3.74 −1.89*** (−10.42) 6.63 10.47 −3.84*** (−9.49)Jun 2006 15.89 32.05 −16.17*** (−18.60) 1.98 3.86 −1.88*** (−10.30) 7.70 12.32 −4.62*** (−9.95)Sep 2006 15.92 31.69 −15.77*** (−18.35) 1.88 3.69 −1.82*** (−10.15) 7.32 12.01 −4.69*** (−10.28)Dec 2006 14.85 30.07 −15.22*** (−18.75) 1.94 3.59 −1.66*** (−9.37) 7.96 14.29 −6.33*** (−12.62)Mar 2007 15.37 31.27 −15.91*** (−18.94) 1.94 3.78 −1.85*** (−9.84) 7.70 15.98 −8.27*** (−15.17)Jun 2007 16.62 34.05 −17.43*** (−19.70) 2.03 3.89 −1.85*** (−9.78) 6.89 14.67 −7.78*** (−14.67)Sep 2007 15.66 30.24 −14.58*** (−18.35) 2.01 3.80 −1.79*** (−9.75) 5.11 12.93 −7.81*** (−16.39)Dec 2007 15.76 30.61 −14.84*** (−18.33) 1.98 3.94 −1.95*** (−10.05) 5.22 13.26 −8.04*** (−16.99)Mar 2008 16.43 30.55 −14.12*** (−17.50) 2.18 4.54 −2.36*** (−11.49) 6.34 14.14 −7.81*** (−15.81)Jun 2008 17.53 33.41 −15.88*** (−17.86) 2.10 4.51 −2.41*** (−11.48) 6.41 13.65 −7.24*** (−14.98)Sep 2008 16.43 31.44 −15.02*** (−18.04) 1.98 4.21 −2.23*** (−10.77) 5.00 10.62 −5.62*** (−13.47)Dec 2008 13.81 26.99 −13.18*** (−17.37) 2.17 4.63 −2.46*** (−10.36) 3.74 7.95 −4.21*** (−12.06)
(continued on next page)

Ad
ebam
bo,B
rockman,and
Yan
657
TABLE 3 (continued)
Institutional Ownership and Changes in Institutional Ownership: Subgroups of Institutions
Panel B. Changes in Institutional Ownership
Short-Term Institutions Hedge Funds Top-Performing Institutions
DIFF DIFFCUM DIFF DIFFCUM DIFF DIFFCUM
Date FIN NONFIN (t-stat.) (t-stat.) FIN NONFIN (t-stat.) (t-stat.) FIN NONFIN (t-stat.) (t-stat.)
Mar 2006 0.71 1.34 −0.63** −0.63** 0.20 0.36 −0.16** −0.16*** −1.51 −0.71 −0.80*** −0.80***(−2.43) (−2.43) (−2.23) (−2.23) (−2.77) (−2.77)
Jun 2006 0.23 0.46 −0.24 −0.84*** 0.13 0.15 −0.01 −0.14 1.01 1.88 −0.87*** −1.67***(−1.02) (−2.67) (−0.20) (−1.49) (−3.71) (−5.10)
Sep 2006 −0.06 −0.44 0.38 −0.52 −0.08 −0.13 0.05 −0.08 −0.34 −0.31 −0.03 −1.70***(1.38) (−1.36) (0.81) (−0.77) (−0.16) (−5.17)
Dec 2006 −1.12 −1.37 0.25 −0.31 0.06 −0.07 0.13 −0.01 0.63 2.36 −1.73*** −3.47***(0.91) (−0.73) (1.65) (−0.07) (−7.25) (−8.94)
Mar 2007 0.57 1.22 −0.64** −0.99** −0.01 0.17 −0.18** −0.17 −0.28 1.68 −1.96*** −5.38***(−2.50) (−2.17) (−2.25) (−1.25) (−8.54) (−12.45)
Jun 2007 1.21 2.78 −1.57*** −2.69*** 0.10 0.19 −0.09 −0.22 −0.82 −1.35 0.53** −4.77***(−5.87) (−5.23) (−1.21) (−1.54) (1.86) (−10.52)
Sep 2007 −0.93 −3.91 2.98*** 0.45 −0.03 −0.03 0.00 −0.20 −1.69 −1.79 0.10 −4.53***(8.91) (−0.83) (0.03) (−1.25) (0.35) (−9.89)
Dec 2007 0.06 0.42 −0.36 0.02 0.00 0.17 −0.17** −0.35*** 0.08 0.45 −0.36 −4.69***(−1.38) (0.03) (−2.13) (−2.19) (−1.45) (−9.88)
Mar 2008 0.97 0.01 0.96*** 0.99 0.24 0.63 −0.40*** −0.75*** 1.26 0.91 0.35 −4.22***(3.31) (1.69) (−4.34) (−4.28) (1.33) (−8.80)
Jun 2008 0.90 2.85 −1.95*** −0.99 −0.09 0.00 −0.09 −0.84*** −0.16 −0.47 0.31 −3.78***(−5.78) (−1.63) (−0.99) (−4.75) (1.24) (−7.85)
Sep 2008 −0.92 −1.93 1.01*** −0.01 −0.09 −0.26 0.17** −0.66*** −1.45 −3.01 1.57*** −2.07***(3.26) (−0.02) (2.39) (−3.80) (5.82) (−4.52)
Dec 2008 −2.45 −4.63 2.18*** 2.16*** 0.21 0.44 −0.22** −0.80*** −1.08 −2.69 1.61*** −0.26(7.06) (3.62) (−2.13) (−3.92) (6.38) (−0.57)
658 Journal of Financial and Quantitative Analysis
are consistent with the findings in Table 2 and confirm that major subcategoriesof sophisticated institutional traders had relatively low holdings of financial firmscompared with nonfinancial firms heading into and during the financial crisis. OurΔIO and ΔIOCUM results in Panel B of Table 3 are less straightforward to sum-marize due to the volatile nature of quarterly changes. But again, as in Table 2,there are some discernible patterns. First, top-performing institutions exhibit thestrongest evidence of timing ability in the run-up to the financial crisis. Theseinstitutions significantly reduced their exposure to financial firms relative to non-financial firms in four out of six quarters, resulting in a cumulative reduction of4.77% between Jan. 2006 and June 2007. Second, short-term institutions also re-duced their exposure to financial firms relative to nonfinancial firms in the run-upto the financial crisis (significant in 3 out of 6 quarters). We also note that duringthe second half of the sample period (i.e., in the midst of the crisis) short-terminstitutional ownership toggled back and forth between large negative and largepositive changes. Finally, hedge funds tended to decrease their exposures to finan-cial firms significantly more in the second half of the period. This pattern couldbe the result of redemptions on the part of nervous limited partners, as suggestedby Ben-David et al. (2012).
3. Regression Analysis
Overall, our univariate findings in Tables 2 and 3 provide some initial ev-idence that institutions were aware of potential trouble in the financial sectorbefore the outbreak of the crisis. Although the univariate results indicate thatinstitutions prefer nonfinancial to financial firms prior to and during the financialcrisis, prior literature identifies several variables that influence institutional pref-erences for stocks (e.g., Gompers and Metrick (2001)). It may be that these pref-erences, rather than information about the impending financial crisis, are actuallydriving the results. To control for this possibility, we follow Gompers and Metrickand estimate the following cross-sectional regression in each quarter:
IOi,t or ΔIOi,t,t+1 = β0 + β1FINi,t + β2SIZEi,t + β3BMi,t(1)
+β4RETi,t−3,t + β5RETi,t−12,t−3 + β6TURNi,t
+β7VOLi,t + β8AGEi,t + β9PRCi,t + β10DPi,t
+β11SP500i,t + ei,t,
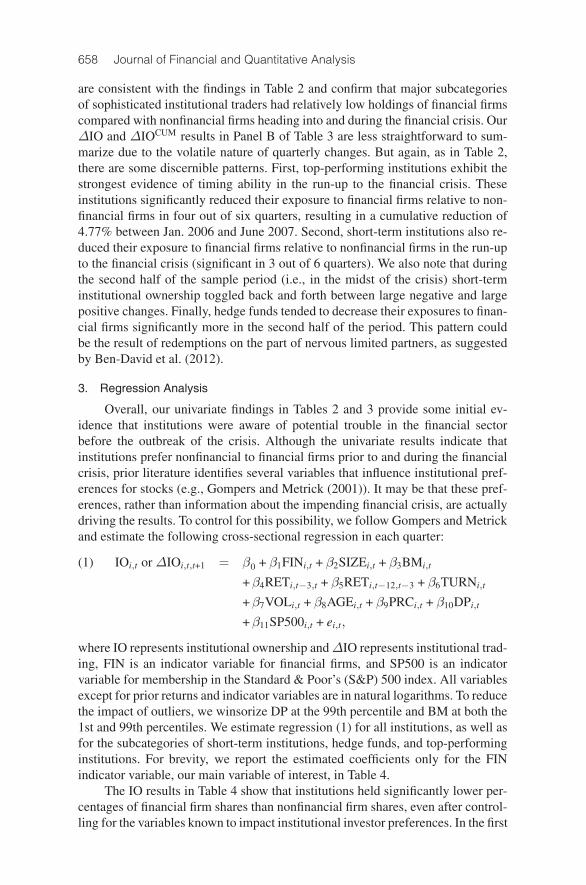
where IO represents institutional ownership andΔIO represents institutional trad-ing, FIN is an indicator variable for financial firms, and SP500 is an indicatorvariable for membership in the Standard & Poor’s (S&P) 500 index. All variablesexcept for prior returns and indicator variables are in natural logarithms. To reducethe impact of outliers, we winsorize DP at the 99th percentile and BM at both the1st and 99th percentiles. We estimate regression (1) for all institutions, as well asfor the subcategories of short-term institutions, hedge funds, and top-performinginstitutions. For brevity, we report the estimated coefficients only for the FINindicator variable, our main variable of interest, in Table 4.
The IO results in Table 4 show that institutions held significantly lower per-centages of financial firm shares than nonfinancial firm shares, even after control-ling for the variables known to impact institutional investor preferences. In the first
Adebambo, Brockman, and Yan 659
TABLE 4
Cross-Sectional Regressions of Institutional Ownership and Changes in InstitutionalOwnership
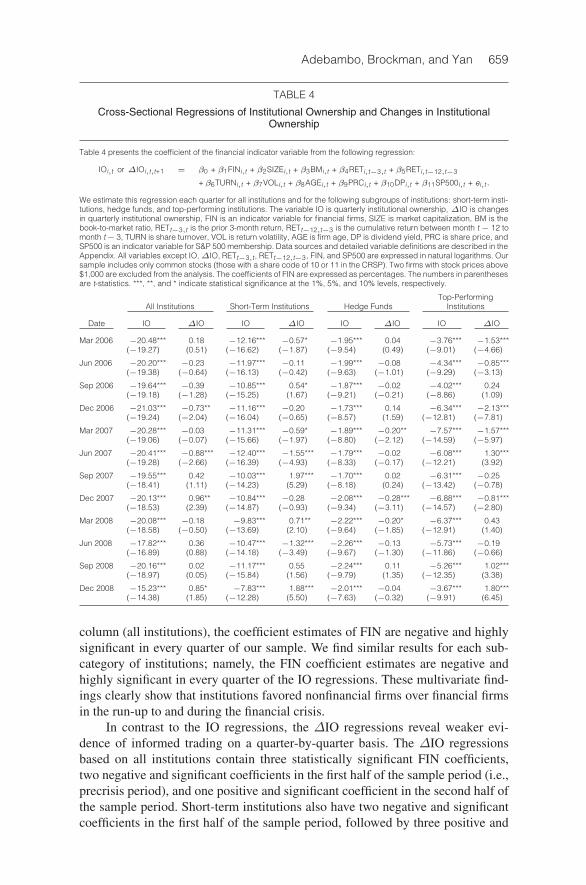
Table 4 presents the coefficient of the financial indicator variable from the following regression:
IOi,t or ΔIOi,t,t+1 = β0 + β1FINi,t + β2SIZEi,t + β3BMi,t + β4RETi,t−3,t + β5RETi,t−12,t−3
+ β6TURNi,t + β7VOLi,t + β8AGEi,t + β9PRCi,t + β10DPi,t + β11SP500i,t + ei,t.
We estimate this regression each quarter for all institutions and for the following subgroups of institutions: short-term insti-tutions, hedge funds, and top-performing institutions. The variable IO is quarterly institutional ownership, ΔIO is changesin quarterly institutional ownership, FIN is an indicator variable for financial firms, SIZE is market capitalization, BM is thebook-to-market ratio, RETt−3,t is the prior 3-month return, RETt−12,t−3 is the cumulative return between month t− 12 tomonth t− 3, TURN is share turnover, VOL is return volatility, AGE is firm age, DP is dividend yield, PRC is share price, andSP500 is an indicator variable for S&P 500 membership. Data sources and detailed variable definitions are described in theAppendix. All variables except IO,ΔIO, RETt−3,t , RETt−12,t−3, FIN, and SP500 are expressed in natural logarithms. Oursample includes only common stocks (those with a share code of 10 or 11 in the CRSP). Two firms with stock prices above$1,000 are excluded from the analysis. The coefficients of FIN are expressed as percentages. The numbers in parenthesesare t-statistics. ***, **, and * indicate statistical significance at the 1%, 5%, and 10% levels, respectively.
Top-PerformingAll Institutions Short-Term Institutions Hedge Funds Institutions
Date IO ΔIO IO ΔIO IO ΔIO IO ΔIO
Mar 2006 −20.48*** 0.18 −12.16*** −0.57* −1.95*** 0.04 −3.76*** −1.53***(−19.27) (0.51) (−16.62) (−1.87) (−9.54) (0.49) (−9.01) (−4.66)
Jun 2006 −20.20*** −0.23 −11.97*** −0.11 −1.99*** −0.08 −4.34*** −0.85***(−19.38) (−0.64) (−16.13) (−0.42) (−9.63) (−1.01) (−9.29) (−3.13)
Sep 2006 −19.64*** −0.39 −10.85*** 0.54* −1.87*** −0.02 −4.02*** 0.24(−19.18) (−1.28) (−15.25) (1.67) (−9.21) (−0.21) (−8.86) (1.09)
Dec 2006 −21.03*** −0.73** −11.16*** −0.20 −1.73*** 0.14 −6.34*** −2.13***(−19.24) (−2.04) (−16.04) (−0.65) (−8.57) (1.59) (−12.81) (−7.81)
Mar 2007 −20.28*** −0.03 −11.31*** −0.59* −1.89*** −0.20** −7.57*** −1.57***(−19.06) (−0.07) (−15.66) (−1.97) (−8.80) (−2.12) (−14.59) (−5.97)
Jun 2007 −20.41*** −0.88*** −12.40*** −1.55*** −1.79*** −0.02 −6.08*** 1.30***(−19.28) (−2.66) (−16.39) (−4.93) (−8.33) (−0.17) (−12.21) (3.92)
Sep 2007 −19.55*** 0.42 −10.03*** 1.97*** −1.70*** 0.02 −6.31*** −0.25(−18.41) (1.11) (−14.23) (5.29) (−8.18) (0.24) (−13.42) (−0.78)
Dec 2007 −20.13*** 0.96** −10.84*** −0.28 −2.08*** −0.28*** −6.88*** −0.81***(−18.53) (2.39) (−14.87) (−0.93) (−9.34) (−3.11) (−14.57) (−2.80)
Mar 2008 −20.08*** −0.18 −9.83*** 0.71** −2.22*** −0.20* −6.37*** 0.43(−18.58) (−0.50) (−13.69) (2.10) (−9.64) (−1.85) (−12.91) (1.40)
Jun 2008 −17.82*** 0.36 −10.47*** −1.32*** −2.26*** −0.13 −5.73*** −0.19(−16.89) (0.88) (−14.18) (−3.49) (−9.67) (−1.30) (−11.86) (−0.66)
Sep 2008 −20.16*** 0.02 −11.17*** 0.55 −2.24*** 0.11 −5.26*** 1.02***(−18.97) (0.05) (−15.84) (1.56) (−9.79) (1.35) (−12.35) (3.38)
Dec 2008 −15.23*** 0.85* −7.83*** 1.88*** −2.01*** −0.04 −3.67*** 1.80***(−14.38) (1.85) (−12.28) (5.50) (−7.63) (−0.32) (−9.91) (6.45)
column (all institutions), the coefficient estimates of FIN are negative and highlysignificant in every quarter of our sample. We find similar results for each sub-category of institutions; namely, the FIN coefficient estimates are negative andhighly significant in every quarter of the IO regressions. These multivariate find-ings clearly show that institutions favored nonfinancial firms over financial firmsin the run-up to and during the financial crisis.
In contrast to the IO regressions, the ΔIO regressions reveal weaker evi-dence of informed trading on a quarter-by-quarter basis. The ΔIO regressionsbased on all institutions contain three statistically significant FIN coefficients,two negative and significant coefficients in the first half of the sample period (i.e.,precrisis period), and one positive and significant coefficient in the second half ofthe sample period. Short-term institutions also have two negative and significantcoefficients in the first half of the sample period, followed by three positive and

660 Journal of Financial and Quantitative Analysis
significant coefficients and one negative and significant coefficient in the secondhalf. Hedge funds have one negative and significant coefficient in the first half ofthe period and two negative and significant coefficients in the second half. As inTable 3, the top-performing institutions show the strongest ability to anticipatethe financial crisis, with four negative and significant coefficients in the precrisisperiod. They then reverse their aversion to financial stock in the second half of theperiod, with three positive and significant coefficients and one negative and signif-icant coefficient. During the last quarter of 2008, in particular, top-performing andshort-term institutions made fairly aggressive moves into financial sector stocks.One possible explanation is that top-performing and short-term institutions an-ticipated that the government would bail out the troubled financial institutions(i.e., through the TARP).
On the whole, these regression results are similar to the univariate results.Institutional investors seem to have had the foresight to underweight financialfirms relative to nonfinancial firms before the financial crisis.9 Although the find-ings suggest that institutions were informed with respect to the vulnerability ofthe financial sector, we find less clear evidence that institutions were able to timeadverse market moves on a quarter-by-quarter basis. The results suggest that in-stitutions possessed general, if vague, knowledge of the impending crisis.
B. Financial Analysts
1. Analyst Recommendations
Our first set of results is based on average analyst recommendations. Foreach month in our sample period, we obtain the most recent recommendation fora given firm issued by an analyst within the previous 12 months. The consensusrecommendation is the average of all outstanding recommendations for a givenstock. Similar to our previous analyses, we focus on differences between financialfirms and nonfinancial firms. If analysts are informed about the financial crisis, weexpect that the average consensus analyst recommendations for financial firmswill be significantly lower than those for nonfinancial firms.
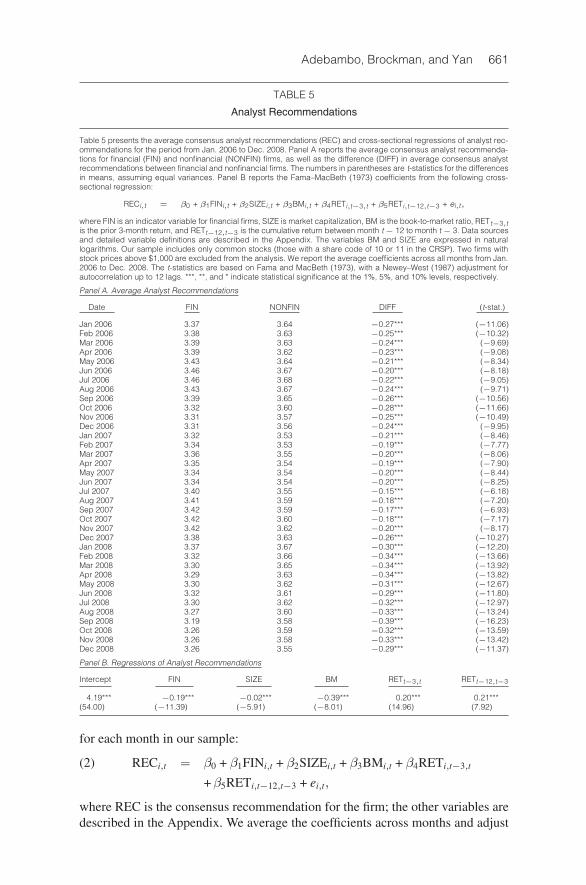
The results in Panel A of Table 5 show that analyst recommendations aresignificantly lower for financial firms than for nonfinancial firms in every monthof our sample. These findings are consistent with considerable foresight on thepart of financial analysts. Not only are the differences negative and significantin each month (ranging from −0.15 to −0.39), but the absolute values of thet-statistics are quite large (ranging from −6.18 to −16.23).
To ensure that our univariate results are not driven by other variables thatanalysts rely on when issuing recommendations (Jegadeesh et al. (2004)), weexamine how analyst recommendations for financials versus nonfinancials differwhile controlling for firm size, book-to-market ratio, and prior stock returns. Inparticular, we estimate the following Fama–MacBeth (1973) type of regression
9We also perform difference-in-differences analyses that compare institutional investors’ under-weighting of financial firms during the crisis period to their underweighting of financial firms during anoncrisis benchmark period. These regression results confirm that institutional investors underweightfinancial firms significantly more during the crisis than during a noncrisis benchmark period. We pro-vide these difference-in-differences results in our Internet Appendix.
Adebambo, Brockman, and Yan 661
TABLE 5
Analyst Recommendations
Table 5 presents the average consensus analyst recommendations (REC) and cross-sectional regressions of analyst rec-ommendations for the period from Jan. 2006 to Dec. 2008. Panel A reports the average consensus analyst recommenda-tions for financial (FIN) and nonfinancial (NONFIN) firms, as well as the difference (DIFF) in average consensus analystrecommendations between financial and nonfinancial firms. The numbers in parentheses are t-statistics for the differencesin means, assuming equal variances. Panel B reports the Fama–MacBeth (1973) coefficients from the following cross-sectional regression:
RECi,t = β0 + β1FINi,t + β2SIZEi,t + β3BMi,t + β4RETi,t−3,t + β5RETi,t−12,t−3 + ei,t,
where FIN is an indicator variable for financial firms, SIZE is market capitalization, BM is the book-to-market ratio, RETt−3,tis the prior 3-month return, and RETt−12,t−3 is the cumulative return between month t− 12 to month t− 3. Data sourcesand detailed variable definitions are described in the Appendix. The variables BM and SIZE are expressed in naturallogarithms. Our sample includes only common stocks (those with a share code of 10 or 11 in the CRSP). Two firms withstock prices above $1,000 are excluded from the analysis. We report the average coefficients across all months from Jan.2006 to Dec. 2008. The t-statistics are based on Fama and MacBeth (1973), with a Newey–West (1987) adjustment forautocorrelation up to 12 lags. ***, **, and * indicate statistical significance at the 1%, 5%, and 10% levels, respectively.
Panel A. Average Analyst Recommendations
Date FIN NONFIN DIFF (t-stat.)
Jan 2006 3.37 3.64 −0.27*** (−11.06)Feb 2006 3.38 3.63 −0.25*** (−10.32)Mar 2006 3.39 3.63 −0.24*** (−9.69)Apr 2006 3.39 3.62 −0.23*** (−9.08)May 2006 3.43 3.64 −0.21*** (−8.34)Jun 2006 3.46 3.67 −0.20*** (−8.18)Jul 2006 3.46 3.68 −0.22*** (−9.05)Aug 2006 3.43 3.67 −0.24*** (−9.71)Sep 2006 3.39 3.65 −0.26*** (−10.56)Oct 2006 3.32 3.60 −0.28*** (−11.66)Nov 2006 3.31 3.57 −0.25*** (−10.49)Dec 2006 3.31 3.56 −0.24*** (−9.95)Jan 2007 3.32 3.53 −0.21*** (−8.46)Feb 2007 3.34 3.53 −0.19*** (−7.77)Mar 2007 3.36 3.55 −0.20*** (−8.06)Apr 2007 3.35 3.54 −0.19*** (−7.90)May 2007 3.34 3.54 −0.20*** (−8.44)Jun 2007 3.34 3.54 −0.20*** (−8.25)Jul 2007 3.40 3.55 −0.15*** (−6.18)Aug 2007 3.41 3.59 −0.18*** (−7.20)Sep 2007 3.42 3.59 −0.17*** (−6.93)Oct 2007 3.42 3.60 −0.18*** (−7.17)Nov 2007 3.42 3.62 −0.20*** (−8.17)Dec 2007 3.38 3.63 −0.26*** (−10.27)Jan 2008 3.37 3.67 −0.30*** (−12.20)Feb 2008 3.32 3.66 −0.34*** (−13.66)Mar 2008 3.30 3.65 −0.34*** (−13.92)Apr 2008 3.29 3.63 −0.34*** (−13.82)May 2008 3.30 3.62 −0.31*** (−12.67)Jun 2008 3.32 3.61 −0.29*** (−11.80)Jul 2008 3.30 3.62 −0.32*** (−12.97)Aug 2008 3.27 3.60 −0.33*** (−13.24)Sep 2008 3.19 3.58 −0.39*** (−16.23)Oct 2008 3.26 3.59 −0.32*** (−13.59)Nov 2008 3.26 3.58 −0.33*** (−13.42)Dec 2008 3.26 3.55 −0.29*** (−11.37)
Panel B. Regressions of Analyst Recommendations
Intercept FIN SIZE BM RETt−3,t RETt−12,t−3
4.19*** −0.19*** −0.02*** −0.39*** 0.20*** 0.21***(54.00) (−11.39) (−5.91) (−8.01) (14.96) (7.92)
for each month in our sample:
RECi,t = β0 + β1FINi,t + β2SIZEi,t + β3BMi,t + β4RETi,t−3,t(2)
+β5RETi,t−12,t−3 + ei,t,
where REC is the consensus recommendation for the firm; the other variables aredescribed in the Appendix. We average the coefficients across months and adjust
662 Journal of Financial and Quantitative Analysis
the resulting standard errors for heteroskedasticity and autocorrelation for up to12 monthly lags using the Newey–West (1987) procedure. Our main variable ofinterest is the FIN dummy variable.
We report the results from regression model (2) in Panel B of Table 5. The es-timated FIN coefficient (−0.19) is negative and significant (t-statistic = −11.39).This finding confirms that analyst recommendations were significantly lower forfinancial firms than for nonfinancial firms during the period from 2006:01 to2008:12, after controlling for other known variables that affect analyst recom-mendations.10,11
2. Changes in Analyst Recommendations
Our next set of results is based on changes in analyst recommendations. Theresults in Panel A of Table 6 show that monthly changes in analyst recommen-dations are quite volatile during this 3-year period. The differences (DIFF) inmonthly changes in analyst recommendations between financial and nonfinancialfirms are statistically significant at the 10% level or better in approximately half ofthe months (17 out of 36), and slightly more than half of these significant differ-ences are negative (10 out of 17). The differences in cumulative changes in analystrecommendations (DIFFCUM) reveal a more consistent pattern; that is, there are18 negative and significant differences and 0 positive and significant differences.
Although we hesitate to draw strong conclusions based on volatile monthlychanges, the results do show more negative recommendation changes for financialfirms relative to nonfinancial firms. This overall trend toward negative differencesis more apparent when viewing the cumulative changes in analyst recommen-dations. There are 18 instances of negative and significant differences in cumu-lative changes in analyst recommendations between financial and nonfinancialfirms and not a single instance of a positive and significant difference in cumu-lative changes. It should be noted, however, that most of the significantly nega-tive DIFFCUM values occur after the financial crisis had begun (especially afterNov. 2007). That is, this result captures more of a reaction to the crisis than a pre-diction of the crisis. There is a shorter 4- to 5-month run of significantly negativeDIFFCUM values before the crisis period.
Next, we examine changes in analyst recommendations for financials versusnonfinancials in a regression setting while controlling for firm size, book-to-market ratio, and prior stock returns. We estimate the following Fama–MacBeth(1973) type of regression for each month in our sample:
ΔRECi,t,t+1 = β0 + β1FINi,t + β2SIZEi,t + β3BMi,t + β4RETi,t−3,t(3)
+β5RETi,t−12,t−3 + ei,t,
10We also perform difference-in-differences analyses that compare analyst recommendations forfinancial versus nonfinancial firms during the financial crisis to their relative (i.e., financial versus non-financial firms) recommendations during a noncrisis benchmark period. The difference-in-differencesregressions confirm that analyst recommendations for financial firms are significantly lower (relativeto nonfinancial firms) during the crisis than during a noncrisis benchmark period. We present theseresults in our Internet Appendix.
11Our results are similar if we use the sample period 2006:01 to 2007:06.

Adebambo, Brockman, and Yan 663
TABLE 6
Changes in Analyst Recommendations
Table 6 presents the average change in analyst recommendations (ΔREC) and cross-sectional regressions of changes inanalyst recommendations for the period from Jan. 2006 to Dec. 2008. Panel A reports the averageΔREC for financial (FIN)and nonfinancial (NONFIN) firms, as well as the difference (DIFF) in average ΔREC between financial and nonfinancialfirms. The variable DIFFCUM is the difference in average cumulativeΔREC between financial and nonfinancial firms. Thenumbers in parentheses are t-statistics for the differences in means, assuming equal variances. Panel B reports Fama–MacBeth (1973) coefficients from the following cross-sectional regression:
ΔRECi,t,t+1 = β0 + β1FINi,t + β2SIZEi,t + β3BMi,t + β4RETi,t−3,t + β5RETi,t−12,t−3 + ei,t,
where FIN is an indicator variable for financial firms, SIZE is market capitalization, BM is the book-to-market ratio, RETt−3,tis the prior 3-month return, and RETt−12,t−3 is the cumulative return between month t−12 and month t−3. Data sourcesand detailed variable definitions are described in the Appendix. The variables BM and SIZE are expressed in naturallogarithms. Our sample includes only common stocks (those with a share code of 10 or 11 in the CRSP). Two firms withstock prices above $1,000 are excluded from the analysis. We report the average coefficients across all months from Jan.2006 to Dec. 2008. The t-statistics are based on Fama and MacBeth (1973), with a Newey–West (1987) adjustment forautocorrelation up to 12 lags. ***, **, and * indicate statistical significance at the 1%, 5%, and 10% levels, respectively.
Panel A. Average Changes in Analyst Recommendations
Date FIN NONFIN DIFF (t-stat.) DIFFCUM (t-stat.)
Jan 2006 −0.10 −0.08 −0.02 (−0.18) −0.02 (−0.18)Feb 2006 0.02 0.00 0.02 (0.58) 0.00 (−0.03)Mar 2006 0.00 −0.01 0.01 (0.44) 0.02 (0.30)Apr 2006 0.00 −0.01 0.01 (0.51) 0.03 (0.69)May 2006 0.06 0.03 0.03 (1.78) 0.07 (1.71)Jun 2006 0.02 0.03 −0.01 (−0.60) 0.03 (0.87)Jul 2006 −0.02 0.02 −0.03 (−2.19) 0.00 (0.01)Aug 2006 −0.02 0.00 −0.02 (−1.38) −0.02 (−0.69)Sep 2006 −0.03 −0.02 −0.02 (−1.84) −0.04 (−1.32)Oct 2006 −0.10 −0.04 −0.06 (−4.97) −0.09 (−3.30)Nov 2006 0.00 −0.02 0.02 (2.18) −0.06 (−2.23)Dec 2006 −0.02 −0.01 0.00 (−0.46) −0.06 (−2.49)Jan 2007 0.01 0.00 0.02 (1.91) −0.04 (−1.80)Feb 2007 0.02 0.01 0.01 (1.53) −0.03 (−1.38)Mar 2007 0.01 0.02 −0.01 (−1.04) −0.03 (−1.36)Apr 2007 0.00 −0.01 0.01 (0.87) −0.03 (−1.26)May 2007 0.00 0.00 0.00 (−0.04) −0.05 (−2.12)Jun 2007 0.01 0.00 0.01 (1.16) −0.03 (−1.44)Jul 2007 0.03 0.00 0.03 (2.76) −0.01 (−0.29)Aug 2007 0.00 0.03 −0.03 (−3.14) −0.04 (−1.46)Sep 2007 −0.01 0.00 0.00 (−0.62) −0.04 (−1.62)Oct 2007 −0.04 −0.02 −0.02 (−2.11) −0.03 (−1.06)Nov 2007 −0.01 0.01 −0.02 (−1.59) −0.04 (−1.40)Dec 2007 −0.04 0.00 −0.04 (−5.07) −0.07 (−2.68)Jan 2008 −0.02 0.01 −0.04 (−3.33) −0.09 (−3.34)Feb 2008 −0.04 −0.01 −0.03 (−3.29) −0.12 (−4.60)Mar 2008 −0.01 0.00 −0.01 (−0.81) −0.13 (−4.81)Apr 2008 0.00 −0.02 0.02 (1.81) −0.11 (−4.07)May 2008 0.00 −0.01 0.01 (0.84) −0.10 (−3.83)Jun 2008 0.02 0.00 0.01 (1.89) −0.08 (−3.03)Jul 2008 −0.02 0.00 −0.03 (−2.92) −0.12 (−4.36)Aug 2008 −0.02 −0.01 −0.01 (−0.78) −0.11 (−4.04)Sep 2008 −0.06 −0.01 −0.05 (−5.38) −0.17 (−6.22)Oct 2008 0.06 0.01 0.05 (4.38) −0.12 (−4.64)Nov 2008 0.00 −0.01 0.01 (1.31) −0.09 (−3.53)Dec 2008 −0.02 −0.03 0.01 (0.76) −0.07 (−2.72)
Panel B. Regressions of Changes in Analyst Recommendations
Intercept FIN SIZE BM RETt−3,t RETt−12,t−3
−4.85*** −0.29 0.22*** −0.74 −0.46 0.52(−3.56) (−0.82) (3.56) (−0.62) (−0.48) (1.05)
whereΔREC is the average change in recommendation for a stock across the an-alysts who issued recommendations within the past 12 months; all other variablesare described in the Appendix. Panel B of Table 6 shows that the estimated FINcoefficient (−0.29) is negative and insignificant. In summary, we find a negativeand significant relation between analyst recommendations and financial firms in

664 Journal of Financial and Quantitative Analysis
regression (2) and a negative but insignificant relation between changes in analystrecommendations and financial firms in regression (3).
C. Corporate Insiders
After finding some confirmatory evidence that outsiders (i.e., institutions andanalysts) possessed superior information about the vulnerability of the financialsector, we now focus our analysis on corporate insiders. Corporate insiders wouldpresumably have the best information about what is going on inside their firms.Furthermore, many commentators in the popular press maintain that insiders offinancial institutions sold their company shares in expectation of the financialcrisis. As discussed in the Introduction, the critical issue in this debate is whetherthe executives of financial firms behaved more as knaves or fools during thefinancial crisis.
The knave argument states that flawed incentives allowed executives to(knowingly) take on excessive debt in an effort to maximize personal wealthwhile risking shareholder wealth. Because these executives were fully aware oftheir excessive risk taking, they also would have been fully prepared to aban-don ship (sell shares) at the first sign of trouble. The fool argument states thatfinancial executives did not knowingly subject their firms to excessive risks. Theymight have exercised poor judgment or might have simply gotten a bad drawfrom a random distribution, but they did not anticipate financial collapse. For-tunately, these competing narratives have completely opposite implications withrespect to insider trading. If most financial firm executives behave as knaves, thenwe should find significantly more insider selling before and during the financialcrisis when compared with nonfinancial firm executives; if most financial exec-utives behaved as fools, then there should be no significant difference betweenthe trading patterns of insiders at financial firms and insiders at nonfinancialfirms.
1. Univariate Analysis
Following Lakonishok and Lee (2001), we measure insider trading as netinsider purchases over the previous 6 months divided by total shares outstand-ing (NIT). In particular, for each firm-month we sum purchases (sales) across allmanagement insiders who traded in the past 6 months. We subtract sales frompurchases and divide by total shares outstanding. The choice of shares outstand-ing as opposed to total transactions used by Lakonishok and Lee is driven by datafrequency and the cross-sectional nature of our analysis. If no insider traded inthe prior 6 months, the NIT variable is set to 0.
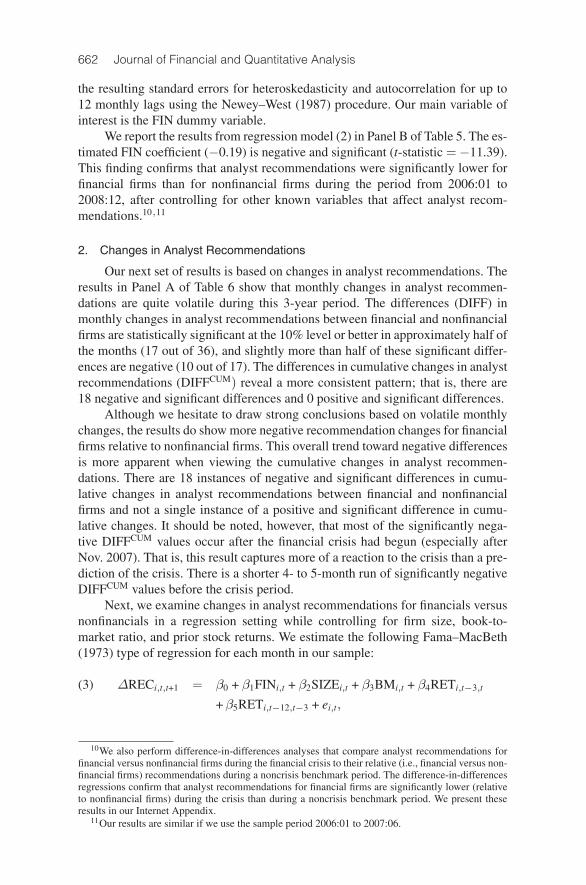
We first examine differences in mean insider trading for financial versusnonfinancial firms during 6 half-year intervals from Jan. 2006 to Dec. 2008. Wepresent the results of this analysis in Table 7. The results are striking. The insid-ers of financial firms consistently buy more (sell less) of their company sharesthan do the insiders of nonfinancial firms. Differences in net insider purchases(financial minus nonfinancial firm purchases) are positive in all 6 half-year trad-ing intervals and statistically significant in 4 of the 6 half-year periods. Whereasnonfinancial firm insiders are net sellers during the entire sample period, financial
Adebambo, Brockman, and Yan 665
TABLE 7
Insider Trading
Table 7 presents the average insider trading for the period from 2006 to 2008. We include only trades by the firm’s man-agement (TFN role code= CEO, CFO, CO, CB, P, D, VP, and O) and exclude option-related trades. The variable NIT is theratio of net insider dollar purchases (dollar purchases minus dollar sales) over the previous 6 months divided by the firm’smarket capitalization. Data sources and detailed variable definitions are described in the Appendix. This table reportsthe average NIT for financial (FIN) and nonfinancial (NONFIN) firms, as well as the difference (DIFF) in average NIT be-tween financial and nonfinancial firms. To identify financial firms, we follow the definition from the SEC Emergency Order ofSept. 18, 2008. The numbers in parentheses are Student’s t-statistics for differences in means, assuming equal variances.***, **, and * indicate statistical significance at the 1%, 5%, and 10% levels, respectively.
Date FIN NONFIN DIFF (t-stat.)
Jun 2006 −0.04 −0.12 0.08** (2.05)Dec 2006 −0.07 −0.10 0.04 (0.90)Jun 2007 −0.03 −0.13 0.11*** (2.86)Dec 2007 0.06 −0.06 0.12*** (4.10)Jun 2008 0.05 −0.02 0.08*** (2.99)Dec 2008 0.04 −0.01 0.05 (1.43)
firms’ insiders become net buyers in the latter half of this period.12 This evidenceis contrary to the popular view that insiders of financial firms exploited their infor-mation advantage by selling company shares before the general public learned thefull extent of their companies’ poor performance. Indeed, the trading behavior offinancial firm insiders shows that they believed their companies to be undervaluedrelative to nonfinancial firms both before and during the financial crisis.
2. Multivariate Analysis
Next, we explore insider trading between financial and nonfinancial firms ina multivariate setting by including control variables. We estimate the followingcross-sectional regression:
NITi,t−6,t = β0 + β1FINi,t−6 + β2SIZEi,t−6 + β3BMi,t−6(4)
+ β4RETi,t−30,t−6 + ei,t,
where the dependent variable, NIT, represents net insider purchases over theprevious 6 months divided by total shares outstanding. The other independentvariables are described in the Appendix. We estimate 6 regressions, one for eachhalf-year period.
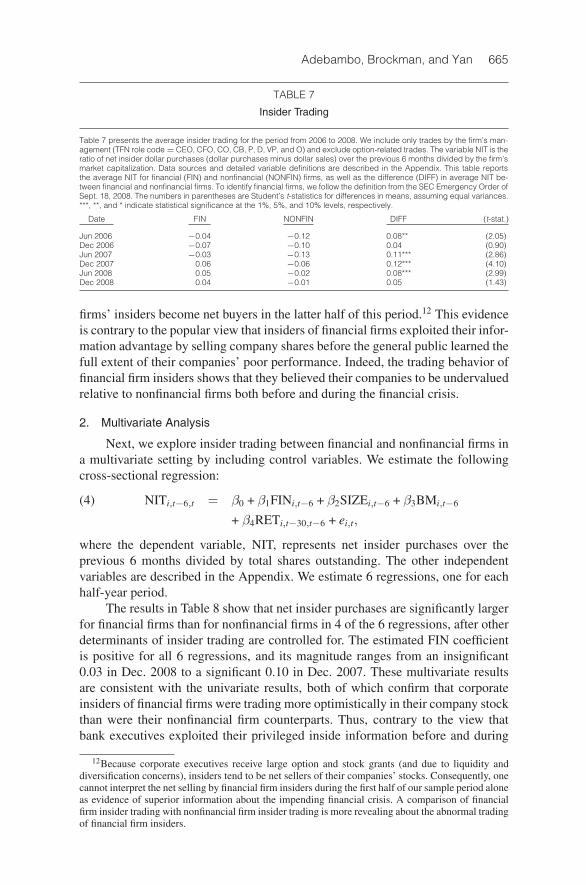
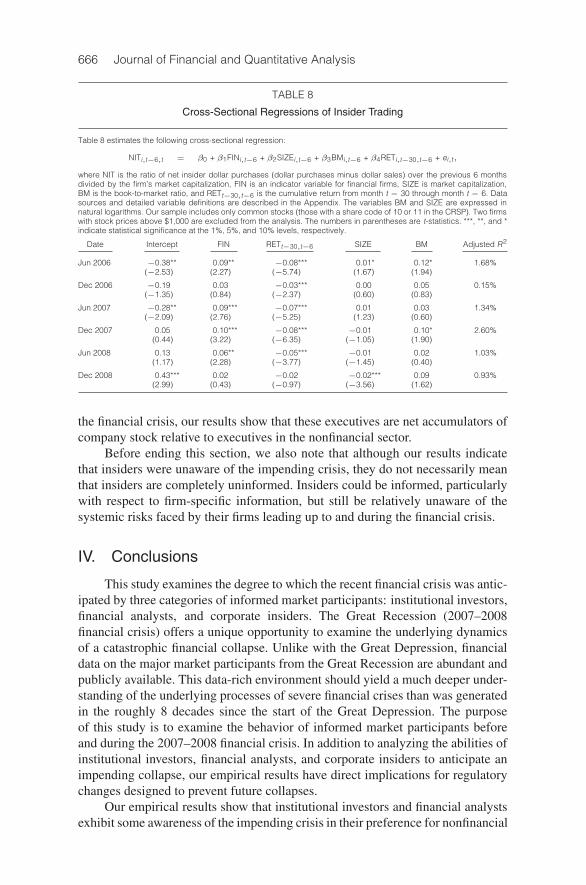
The results in Table 8 show that net insider purchases are significantly largerfor financial firms than for nonfinancial firms in 4 of the 6 regressions, after otherdeterminants of insider trading are controlled for. The estimated FIN coefficientis positive for all 6 regressions, and its magnitude ranges from an insignificant0.03 in Dec. 2008 to a significant 0.10 in Dec. 2007. These multivariate resultsare consistent with the univariate results, both of which confirm that corporateinsiders of financial firms were trading more optimistically in their company stockthan were their nonfinancial firm counterparts. Thus, contrary to the view thatbank executives exploited their privileged inside information before and during
12Because corporate executives receive large option and stock grants (and due to liquidity anddiversification concerns), insiders tend to be net sellers of their companies’ stocks. Consequently, onecannot interpret the net selling by financial firm insiders during the first half of our sample period aloneas evidence of superior information about the impending financial crisis. A comparison of financialfirm insider trading with nonfinancial firm insider trading is more revealing about the abnormal tradingof financial firm insiders.
666 Journal of Financial and Quantitative Analysis
TABLE 8
Cross-Sectional Regressions of Insider Trading
Table 8 estimates the following cross-sectional regression:
NITi,t−6,t = β0 + β1FINi,t−6 + β2SIZEi,t−6 + β3BMi,t−6 + β4RETi,t−30,t−6 + ei,t,
where NIT is the ratio of net insider dollar purchases (dollar purchases minus dollar sales) over the previous 6 monthsdivided by the firm’s market capitalization, FIN is an indicator variable for financial firms, SIZE is market capitalization,BM is the book-to-market ratio, and RETt−30,t−6 is the cumulative return from month t − 30 through month t − 6. Datasources and detailed variable definitions are described in the Appendix. The variables BM and SIZE are expressed innatural logarithms. Our sample includes only common stocks (those with a share code of 10 or 11 in the CRSP). Two firmswith stock prices above $1,000 are excluded from the analysis. The numbers in parentheses are t-statistics. ***, **, and *indicate statistical significance at the 1%, 5%, and 10% levels, respectively.
Date Intercept FIN RETt−30,t−6 SIZE BM Adjusted R2
Jun 2006 −0.38** 0.09** −0.08*** 0.01* 0.12* 1.68%(−2.53) (2.27) (−5.74) (1.67) (1.94)
Dec 2006 −0.19 0.03 −0.03*** 0.00 0.05 0.15%(−1.35) (0.84) (−2.37) (0.60) (0.83)
Jun 2007 −0.28** 0.09*** −0.07*** 0.01 0.03 1.34%(−2.09) (2.76) (−5.25) (1.23) (0.60)
Dec 2007 0.05 0.10*** −0.08*** −0.01 0.10* 2.60%(0.44) (3.22) (−6.35) (−1.05) (1.90)
Jun 2008 0.13 0.06** −0.05*** −0.01 0.02 1.03%(1.17) (2.28) (−3.77) (−1.45) (0.40)
Dec 2008 0.43*** 0.02 −0.02 −0.02*** 0.09 0.93%(2.99) (0.43) (−0.97) (−3.56) (1.62)
the financial crisis, our results show that these executives are net accumulators ofcompany stock relative to executives in the nonfinancial sector.
Before ending this section, we also note that although our results indicatethat insiders were unaware of the impending crisis, they do not necessarily meanthat insiders are completely uninformed. Insiders could be informed, particularlywith respect to firm-specific information, but still be relatively unaware of thesystemic risks faced by their firms leading up to and during the financial crisis.
IV. Conclusions
This study examines the degree to which the recent financial crisis was antic-ipated by three categories of informed market participants: institutional investors,financial analysts, and corporate insiders. The Great Recession (2007–2008financial crisis) offers a unique opportunity to examine the underlying dynamicsof a catastrophic financial collapse. Unlike with the Great Depression, financialdata on the major market participants from the Great Recession are abundant andpublicly available. This data-rich environment should yield a much deeper under-standing of the underlying processes of severe financial crises than was generatedin the roughly 8 decades since the start of the Great Depression. The purposeof this study is to examine the behavior of informed market participants beforeand during the 2007–2008 financial crisis. In addition to analyzing the abilities ofinstitutional investors, financial analysts, and corporate insiders to anticipate animpending collapse, our empirical results have direct implications for regulatorychanges designed to prevent future collapses.
Our empirical results show that institutional investors and financial analystsexhibit some awareness of the impending crisis in their preference for nonfinancial
Adebambo, Brockman, and Yan 667
stocks over financial stocks. Institutional investors underweighted financial firmsrelative to nonfinancial firms, and financial analysts gave consistently lowerrecommendations for financial firms compared with nonfinancial firms. Theseanalyst-related results are consistent with Piotroski and Roulstone’s (2004) claimthat financial analysts have an information advantage at the industry level.
Although institutions and analysts could see the industry-level “forest” andact accordingly, bank executives appear to have focused on individual firm-level“trees.” Our results show that the executives of financial firms were buying moreand selling less of their own companies than were the executives of nonfinancialfirms, both before and during the financial crisis. Our finding that financial firmmanagers were net purchasers during the height of the crisis casts considerabledoubt on Johnson’s (2011) knave narrative, as well as on proposed regulationsdesigned to prevent future crises by curtailing knave behavior.
Appendix. Data Sources and Variable Definitions
Our study combines data from several sources. We obtain data on quarterly institu-tional holdings from the TFN 13F database. We obtain analyst recommendations from theIBES database. Insider trading data are from the TFN Insider database. Book values ofcommon equity and common stock dividends are from Compustat. The SIC code, price,return, shares outstanding, and volume information are from the CRSP monthly database.
Our sample includes only common stocks (CRSP share code 10 or 11) for the periodfrom Jan. 2006 through Dec. 2008. Following the definition from the SEC EmergencyOrder of Sept. 18, 2008, we identify financial firms as those with the following SIC codes:6000, 6011, 6020–6022, 6025, 6030, 6035–6036, 6111, 6140, 6144, 6200, 6210–6211,6231, 6282, 6305, 6310–6311, 6320–6321, 6324, 6330–6331, 6350–6351, 6360–6361,6712, and 6719. The variables used throughout the article are as follows:
IO: Institutional ownership, fraction of shares outstanding held by institutional investors,from the TFN 13F database and the CRSP.
ΔIO: Change in institutional ownership between two consecutive quarters.REC: Consensus analyst recommendation of all analysts following a firm, based on the
most recent recommendation issued by an analyst in the prior 12 months, from theIBES.
ΔREC: Change in consensus analyst recommendation between 2 consecutive months.NIT: Ratio of net insider dollar purchases (dollar purchases minus dollar sales) over the
previous 6 months divided by the firm’s market capitalization, from the TFN In-sider database and the CRSP. We include only trades by the firm’s management (rolecode = CEO, CFO, CO, CB, P, D, VP, and O) and exclude option-related trades.
FIN: Indicator variable that takes a value of 1 if a firm is classified as a financial firm basedon the SEC Emergency Order of Sept. 18, 2008.
SIZE: Market capitalization, calculated as share price times shares outstanding, from theCRSP.
AGE: Firm age, the number of months since the first return appeared in the CRSP.DP: Dividend yield, calculated as the ratio of common dividends divided by share price,
from Compustat and the CRSP. Winsorized at the 99th percentile.BM: Book-to-market ratio, calculated using book value of equity for the fiscal year ended
in year t − 1, divided by market capitalization as of Dec. 31 of year t − 1, fromCompustat and the CRSP. Winsorized at the 1st and 99th percentiles.
PRC: End-of-month share price from the CRSP.TURN: Average monthly share turnover (monthly share trading volume divided by total
shares outstanding) over the preceding 3 months, from the CRSP.VOL: Return volatility, standard deviation of monthly returns over the previous 24 months,
from the CRSP.
668 Journal of Financial and Quantitative Analysis
SP500: Indicator variable that equals 1 if a firm belongs to the S&P 500 Index, from theCRSP.
RETt−3,t: Cumulative return over the past 3 months, from the CRSP.RETt−12,t−3: Cumulative return between month t − 12 and month t − 3, from the CRSP.RETt−30,t−6: Cumulative return between month t − 30 and month t − 6, from the CRSP.
ReferencesAli, A.; C. Durtschi; B. Lev; and M. Trombley. “Changes in Institutional Ownership and Subsequent
Earnings Announcement Abnormal Returns.” Journal of Accounting, Auditing, and Finance, 19(2004), 221–248.
Altinkilic, O., and R. Hansen. “On the Information Role of Analyst Recommendations.” Journal ofAccounting and Economics, 48 (2009), 17–36.
Ben-David, I.; F. Franzoni; and R. Moussawi. “Hedge Fund Stock Trading in the Financial Crisis of2007–2008.” Review of Financial Studies, 25 (2012), 1–54.
Bhagat, S., and B. Bolton. “Bank Compensation and Capital Requirements Reform.” Working Paper,University of Colorado at Boulder (2013).
Cai, F., and L. Zheng. “Institutional Trading and Stock Returns.” Finance Research Letters, 1 (2004),178–189.
Campello, M.; J. Graham; and C. Harvey. “The Real Effects of Financial Constraints: Evidence froma Financial Crisis.” Journal of Financial Economics, 97 (2010), 470–487.
Carhart, M. “On Persistence in Mutual Fund Performance.” Journal of Finance, 52 (1997), 57–82.Chakravarty, S., and J. McConnell. “Does Insider Trading Really Move Stock Prices?” Journal of
Financial and Quantitative Analysis, 34 (1999), 191–209.Cheng, I.-H.; H. Hong; and J. A. Scheinkman. “Yesterday’s Heroes: Compensation and Creative
Risk-Taking.” Journal of Finance, 70 (2015), 839–879.Cheng, I.-H.; S. Raina; and W. Xiong. “Wall Street and the Housing Bubble.” American Economic
Review, 104 (2014), 2797–2829.Dasgupta, A.; A. Prat; and M. Verardo. “Institutional Trade Persistence and Long-Term Equity
Returns.” Journal of Finance, 66 (2011), 635–653.Eckbo, B. E., and D. Smith. “The Conditional Performance of Insider Trades.” Journal of Finance, 53
(1998), 467–498.Erkens, D. H.; M. Hung; and P. Matos. “Corporate Governance in the 2007–2008 Financial Crisis:
Evidence from Financial Institutions Worldwide.” Journal of Corporate Finance, 18 (2012),389–411.
Fahlenbrach, R., and R. M. Stulz. “Bank CEO Incentives and the Credit Crisis.” Journal of FinancialEconomics, 99 (2011), 11–26.
Fama, E., and J. MacBeth. “Risk, Return, and Equilibrium: Empirical Tests.” Journal of PoliticalEconomy, 81 (1973), 607–636.
Flannery, M. J.; S. H. Kwan; and M. Nimalendran. “Market Evidence on the Opaqueness of BankingFirms’ Assets.” Journal of Financial Economics, 71 (2004), 419–460.
Gompers, P. A., and A. Metrick. “Institutional Investors and Equity Prices.” Quarterly Journal ofEconomics, 116 (2001), 229–259.
Gorton, G., and A. Metrick. “Securitized Banking and the Run on Repo.” Journal of FinancialEconomics, 104 (2012), 425–451.
Ivashina, V., and D. Scharfstein. “Bank Lending during the Financial Crisis of 2008.” Journal ofFinancial Economics, 97 (2010), 319–338.
Jegadeesh, N.; J. Kim; S. D. Krische; and C. M. C. Lee. “Analyzing the Analysts: When Do Recom-mendations Add Value?” Journal of Finance, 59 (2004), 1083–1124.
Johnson, S. “Ship of Knaves.” New York Times, Online Economix Section (Feb. 10, 2011).Ke, B., and S. Ramalingegowda. “Do Institutional Investors Exploit the Post-Earnings Announcement
Drift?” Journal of Accounting and Economics, 39 (2005), 25–53.Lakonishok, J., and I. Lee. “Are Insider Trades Informative?” Review of Financial Studies, 14 (2001),
79–111.Longstaff, F. “The Subprime Credit Crisis and Contagion in Financial Markets.” Journal of Financial
Economics, 97 (2010), 436–450.Manconi, A.; M. Massa; and A. Yasuda. “The Role of Institutional Investors in Propagating the Crisis
of 2007–2008.” Journal of Financial Economics, 104 (2012), 491–518.Newey, W. K., and K. D. West. “A Simple, Positive Semidefinite, Heteroskedasticity and Autocorre-
lation Consistent Covariance Matrix.” Econometrica, 55 (1987), 703–708.

Adebambo, Brockman, and Yan 669
Nofsinger, J., and R. Sias. “Herding and Feedback Trading by Institutional and Individual Investors.”Journal of Finance, 54 (1999), 2263–2295.
Piotroski, J. D., and D. T. Roulstone. “The Influence of Analysts, Institutional Investors, and Insid-ers on the Incorporation of Market, Industry, and Firm-Specific Information into Stock Prices.”Accounting Review, 79 (2004), 1119–1151.
Rozeff, M., and M. Zaman. “Market Efficiency and Insider Trading: Evidence from Growth and ValuePortfolios.” Journal of Finance, 53 (1988), 701–716.
Womack, K. “Do Brokerage Analysts’ Recommendations Have Investment Value?” Journal ofFinance, 51 (1996), 137–167.
Yan, X., and Z. Zhang. “Institutional Investors and Equity Returns: Are Short-Term Institutions BetterInformed?” Review of Financial Studies, 22 (2009), 893–924.