Embed Size (px)
Citation preview
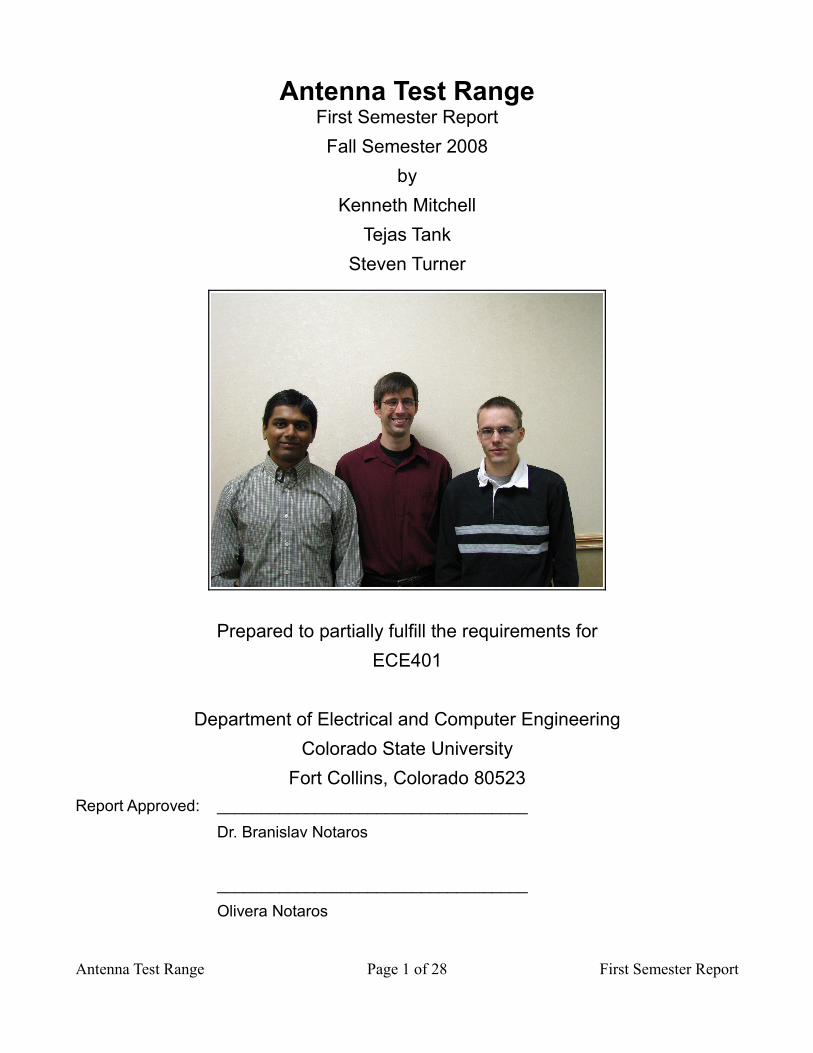
Antenna Test RangeFirst Semester Report
Fall Semester 2008by
Kenneth MitchellTejas Tank
Steven Turner
Prepared to partially fulfill the requirements forECE401
Department of Electrical and Computer EngineeringColorado State University
Fort Collins, Colorado 80523Report Approved: ___________________________________
Dr. Branislav Notaros
___________________________________Olivera Notaros
Antenna Test Range Page 1 of 28 First Semester Report

AbstractThe primary purpose of this interdisciplinary senior design project is to design and build an affordable and working antenna test range to be used as a classroom tool and in many different applications. We will integrate numerous advanced research tools and knowledge from electromagnetic theory, antennas, RF/microwaves, electronics, communications, computer hardware, control, power, mathematics, computational algorithms, and programming. In addition to research the work will be developmental, design, analysis, modeling, simulation, programming, building, budgeting, purchasing, installation, assessment, and testing at the system, device, component, and processor levels. Upon completion of this senior design project, it is hoped to have a fully functional antenna test range set up, and operating in the Antenna Test Lab room on the CSU campus. This system will consist of the various components described in this document.
Antenna Test Range Page 2 of 28 First Semester Report
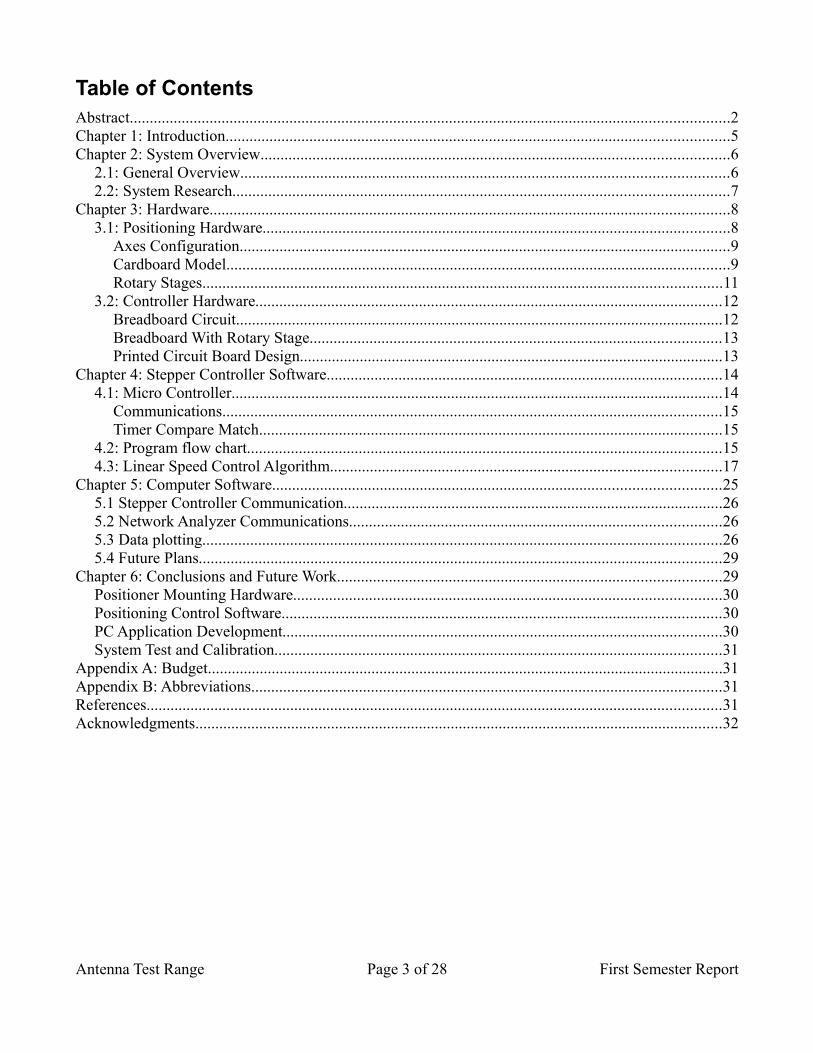
Table of ContentsAbstract......................................................................................................................................................2Chapter 1: Introduction..............................................................................................................................5Chapter 2: System Overview.....................................................................................................................6
2.1: General Overview..........................................................................................................................62.2: System Research............................................................................................................................7
Chapter 3: Hardware..................................................................................................................................83.1: Positioning Hardware.....................................................................................................................8
Axes Configuration...........................................................................................................................9Cardboard Model..............................................................................................................................9Rotary Stages..................................................................................................................................11
3.2: Controller Hardware.....................................................................................................................12Breadboard Circuit..........................................................................................................................12Breadboard With Rotary Stage.......................................................................................................13Printed Circuit Board Design..........................................................................................................13
Chapter 4: Stepper Controller Software...................................................................................................144.1: Micro Controller...........................................................................................................................14
Communications.............................................................................................................................15Timer Compare Match....................................................................................................................15
4.2: Program flow chart.......................................................................................................................154.3: Linear Speed Control Algorithm..................................................................................................17
Chapter 5: Computer Software................................................................................................................255.1 Stepper Controller Communication...............................................................................................265.2 Network Analyzer Communications.............................................................................................265.3 Data plotting..................................................................................................................................265.4 Future Plans...................................................................................................................................29
Chapter 6: Conclusions and Future Work................................................................................................29Positioner Mounting Hardware...........................................................................................................30Positioning Control Software..............................................................................................................30PC Application Development..............................................................................................................30System Test and Calibration................................................................................................................31
Appendix A: Budget.................................................................................................................................31Appendix B: Abbreviations......................................................................................................................31References................................................................................................................................................31Acknowledgments....................................................................................................................................32
Antenna Test Range Page 3 of 28 First Semester Report
List of FiguresIllustration 1: Regions of Radiation...........................................................................................................6Illustration 2: Far Field Approximation.....................................................................................................6Illustration 3: $28,000 positioner...............................................................................................................7Illustration 4: $18,000 positioner...............................................................................................................7Illustration 5: 2-D configuration design.....................................................................................................9Illustration 6: Cardboard model...............................................................................................................11Illustration 7: 8" and 5" Rotary Stages.....................................................................................................11Illustration 8: Breadboard Circuit............................................................................................................12Illustration 9: Breadboard with 5" motor.................................................................................................13Illustration 10: PCB Design.....................................................................................................................14Illustration 11: Micro Controller Programmer.........................................................................................15Illustration 12: Stepper Controller Flow Chart........................................................................................16Illustration 13: Stepper Plots....................................................................................................................19Illustration 14: Step Output......................................................................................................................19Illustration 15: Small Move Speed...........................................................................................................23Illustration 16: PC Application................................................................................................................26Illustration 17: Cartesian representation of Gain in dB scale..................................................................27Illustration 18: Radiation pattern with a linear scale...............................................................................27Illustration 19: Far field pattern...............................................................................................................29
List of TablesTable 1: Controller Test Output................................................................................................................17Table 2: Budget........................................................................................................................................31
Antenna Test Range Page 4 of 28 First Semester Report
Chapter 1: IntroductionA great deal of research can be done using an antenna test range for there exists many applications. They include the research of new electromagnetic materials and their RF properties. New electromagnetic materials can be placed within an antenna test range and analysis can be done to determine characteristics about it including is radio frequency properties. Next using an antenna test range one can validate theoretical or computational models for an antenna to predict or obtain a better understanding as to their behavior and applications. From this once a new concept is designed it too can be tested and put under analysis to run simulations and experiment with. Other applications include electromagnetic scattering and small-scale models of such things like cars and aircraft. For further development on stealth technology radar profiling can be done on a small-scale aircraft before it is realized on a large scale level. There are a number of various types of test ranges. These seem to be mostly classified as far field, near field, and compact ranges. The far field test ranges were the first developed, and were used to study the antennas at large distances which simulated real world situations. The near field test ranges were developed because of the large space required for far field test ranges. Techniques were developed that allowed antennas to be tested at distances of about 3 to 10 wavelengths. These results could then be transformed to the far field. The Compact Antenna Test Range (CATR) uses a reflector to create a field that approximates the plane wave of the far field. The Illustration one shows different regions of radiation. The fields from a source can be approximated by a multi-pole expansion. These terms can be written as a product of spherical Bessel functions that vary with distance r. For a large value of r the Bessel 05/27/08 Page 3 of 14 Antenna Test Range function will decay as 1/r which represents the far field. Other components must be factored in as the r value approaches the near field. The next term is called the induction term and varies as 1/r2. For a very small value of r, the electrostatic term should be taken into account. This term varies as 1/r3. By the principle of reciprocity the same pattern should be observed weather the antenna is transmitting or receiving. In the far field the relationships between the field patterns and current distributions usually involve trigonometric functions or Fourier transforms.
Antenna Test Range Page 5 of 28 First Semester Report
Illustration 1: Regions of Radiation
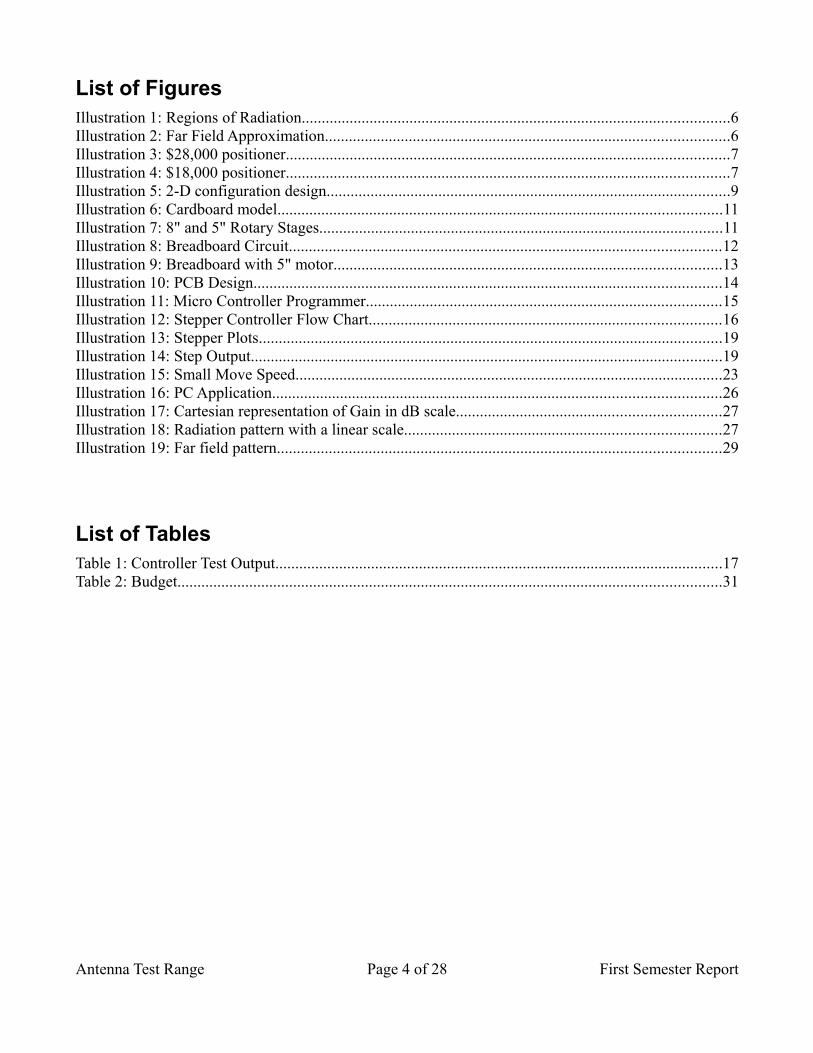
The far field distance is typically approximated to be greater than 2D2/ λ, where λ is the wavelength and D is the antenna diameter. This ensures the phase variation is small enough to obtain satisfactory results. See IEEE-Std-149-1979 for suggested far field measurement standards.
Chapter 2: System Overview
2.1: General OverviewAn antenna test range consists of two antennas sending and receiving signals in different positions while gathering and receiving data. One antenna is known as the antenna under test which will be a three axes system and is where all the primary controls will be done for our project. The other antenna is known as the transmitting or probe antenna which will be equipped with one polarization axis. A PC program will communicate back and forth from a stepper driver board commanding different stages connected to various axes on the positoner. As of right now a move command is sent by the user with a desired number of steps for a given stage to move. Once finished the stage stops and the stepper driver board displays the position of the stage. For further developing the antenna test range system a vector network analyzer must also be incorporated into the system. From here the PC program will communicate back and forth with the vector network analyzer sending and gathering measurements at various positions while the system is in operation. Some parameters that could be measured include input impedance, polarization, directivity, gain, radiation pattern, and beam width.
2.2: System ResearchThe primary goal of our project is to design and implement an affordable, working, multi-axis
Antenna Test Range Page 6 of 28 First Semester Report
Illustration 2: Far Field Approximation
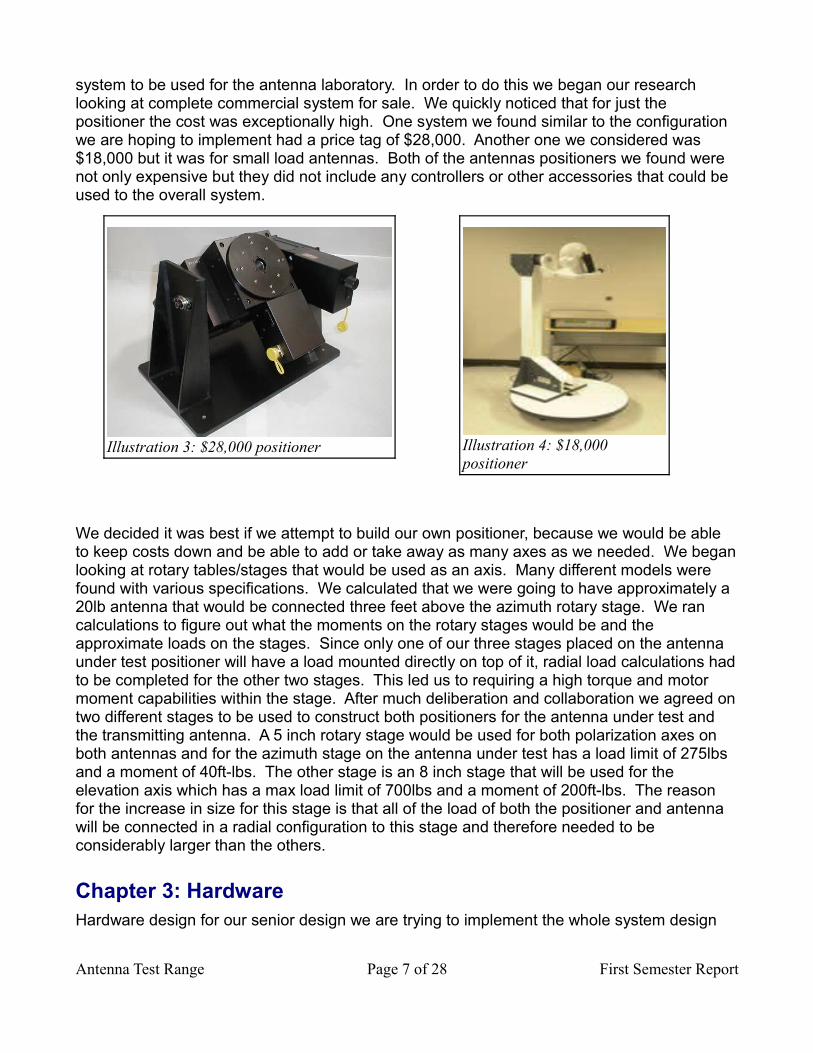
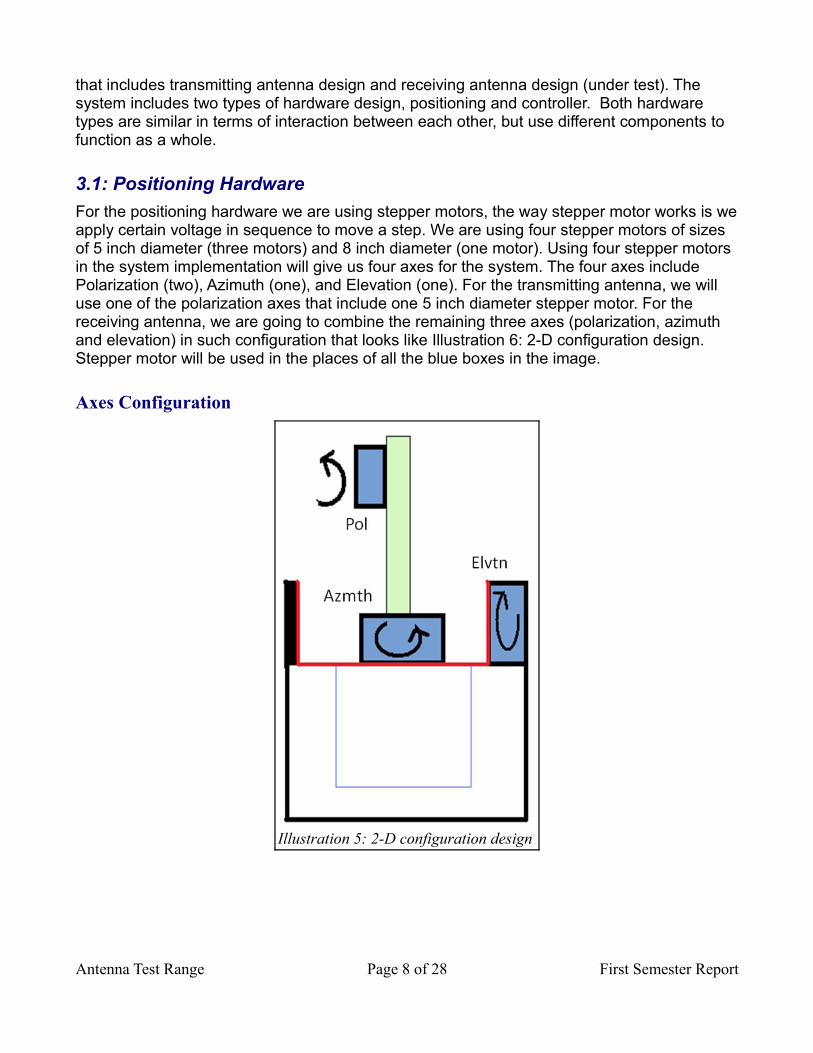
system to be used for the antenna laboratory. In order to do this we began our research looking at complete commercial system for sale. We quickly noticed that for just the positioner the cost was exceptionally high. One system we found similar to the configuration we are hoping to implement had a price tag of $28,000. Another one we considered was $18,000 but it was for small load antennas. Both of the antennas positioners we found were not only expensive but they did not include any controllers or other accessories that could be used to the overall system.
We decided it was best if we attempt to build our own positioner, because we would be able to keep costs down and be able to add or take away as many axes as we needed. We began looking at rotary tables/stages that would be used as an axis. Many different models were found with various specifications. We calculated that we were going to have approximately a 20lb antenna that would be connected three feet above the azimuth rotary stage. We ran calculations to figure out what the moments on the rotary stages would be and the approximate loads on the stages. Since only one of our three stages placed on the antenna under test positioner will have a load mounted directly on top of it, radial load calculations had to be completed for the other two stages. This led us to requiring a high torque and motor moment capabilities within the stage. After much deliberation and collaboration we agreed on two different stages to be used to construct both positioners for the antenna under test and the transmitting antenna. A 5 inch rotary stage would be used for both polarization axes on both antennas and for the azimuth stage on the antenna under test has a load limit of 275lbs and a moment of 40ft-lbs. The other stage is an 8 inch stage that will be used for the elevation axis which has a max load limit of 700lbs and a moment of 200ft-lbs. The reason for the increase in size for this stage is that all of the load of both the positioner and antenna will be connected in a radial configuration to this stage and therefore needed to be considerably larger than the others.
Chapter 3: HardwareHardware design for our senior design we are trying to implement the whole system design
Antenna Test Range Page 7 of 28 First Semester Report
Illustration 3: $28,000 positioner Illustration 4: $18,000 positioner
that includes transmitting antenna design and receiving antenna design (under test). The system includes two types of hardware design, positioning and controller. Both hardware types are similar in terms of interaction between each other, but use different components to function as a whole.
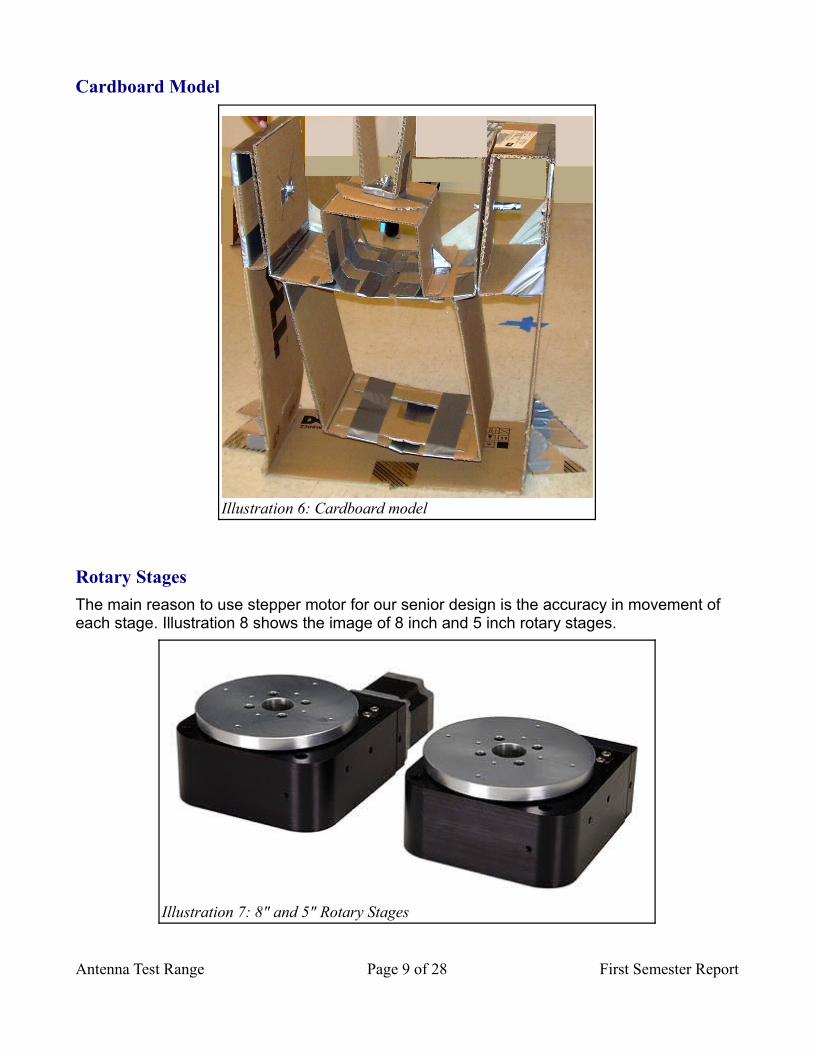
3.1: Positioning HardwareFor the positioning hardware we are using stepper motors, the way stepper motor works is we apply certain voltage in sequence to move a step. We are using four stepper motors of sizes of 5 inch diameter (three motors) and 8 inch diameter (one motor). Using four stepper motors in the system implementation will give us four axes for the system. The four axes include Polarization (two), Azimuth (one), and Elevation (one). For the transmitting antenna, we will use one of the polarization axes that include one 5 inch diameter stepper motor. For the receiving antenna, we are going to combine the remaining three axes (polarization, azimuth and elevation) in such configuration that looks like Illustration 6: 2-D configuration design. Stepper motor will be used in the places of all the blue boxes in the image.
Axes Configuration
Antenna Test Range Page 8 of 28 First Semester Report
Illustration 5: 2-D configuration design
Cardboard Model
Rotary StagesThe main reason to use stepper motor for our senior design is the accuracy in movement of each stage. Illustration 8 shows the image of 8 inch and 5 inch rotary stages.
Antenna Test Range Page 9 of 28 First Semester Report
Illustration 6: Cardboard model
Illustration 7: 8" and 5" Rotary Stages
• The 5 inch motors has gearing ratio of 72:1 that gives us 14,400 Steps / Revolution.• The 8 inch motor has gearing ratio of 80:1 that gives us 16,000 Steps / Revolution.
Having so many steps per revolutions, we can be very accurate with our stage movement. Next step in this part of project will be to carry out the hardware design with actual mounting.
3.2: Controller HardwareFor the controller hardware in this senior design, the main goal was to design a Printed Circuit Board (PCB) that controls the positioning of each axis. We started off with building our own breadboard circuit design as shown on Illustration 9.
Breadboard Circuit
Illustration 8 shows an AVR Atmega168 micro controller along with a breadboard power supply, and a serial port programmer.This system is running at 20MHz using a ceramic resonator and was programmed in C using the free WinAVR package that includes the GCC compiler for use with the AVR microprocessors. This system operating at 20MHz requires 5 volts, but if the clock is slowed
Antenna Test Range Page 10 of 28 First Semester Report
Illustration 8: Breadboard Circuit
down to below 10MHz it can be operated at down to 2.7 volts.This system has built in timers, and counters that can be used for reading encoders. Also included are PWM modules than can be used to drive the DC motors at variable speeds through use of a circuit such as an H-bridge. We could use these features to create a board that would control the position of one axis of the positioning system that would be interfaced to a computer through the serial port. Also shown is a FT232 breakout board that is used to convert TTL serial to USB. This maps to a virtual serial port on a computer. This would make it possible to communicate with the system through the USB port.
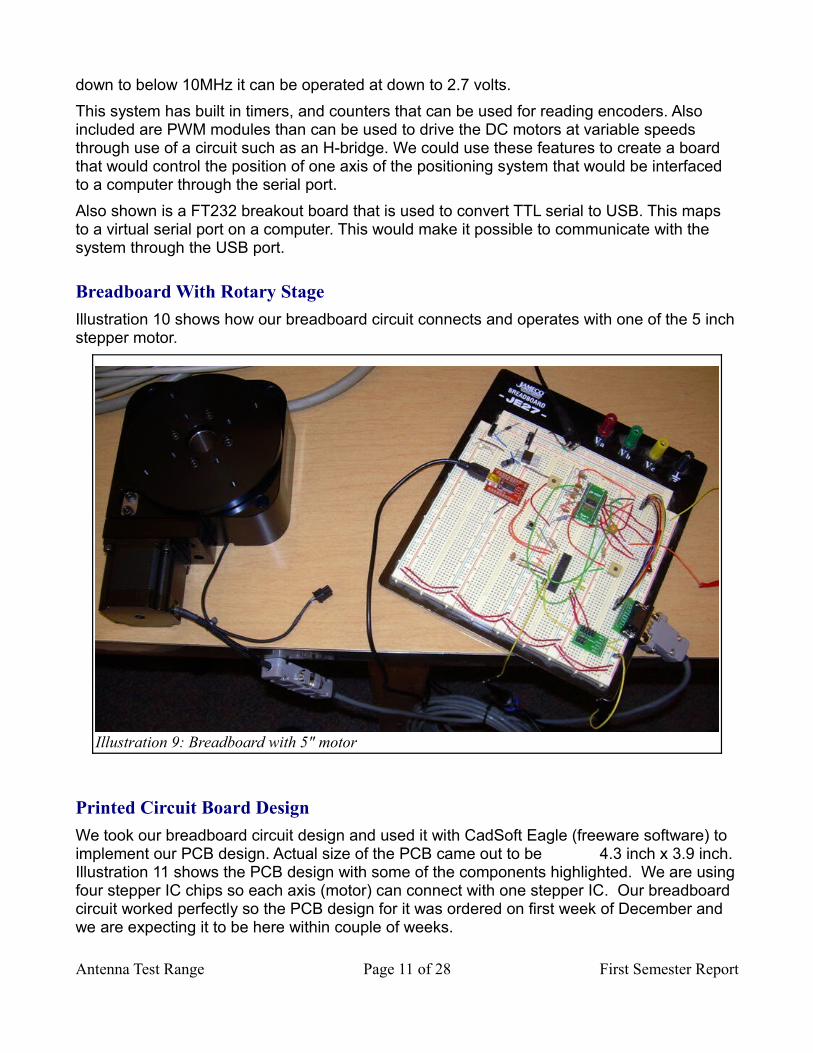
Breadboard With Rotary StageIllustration 10 shows how our breadboard circuit connects and operates with one of the 5 inch stepper motor.
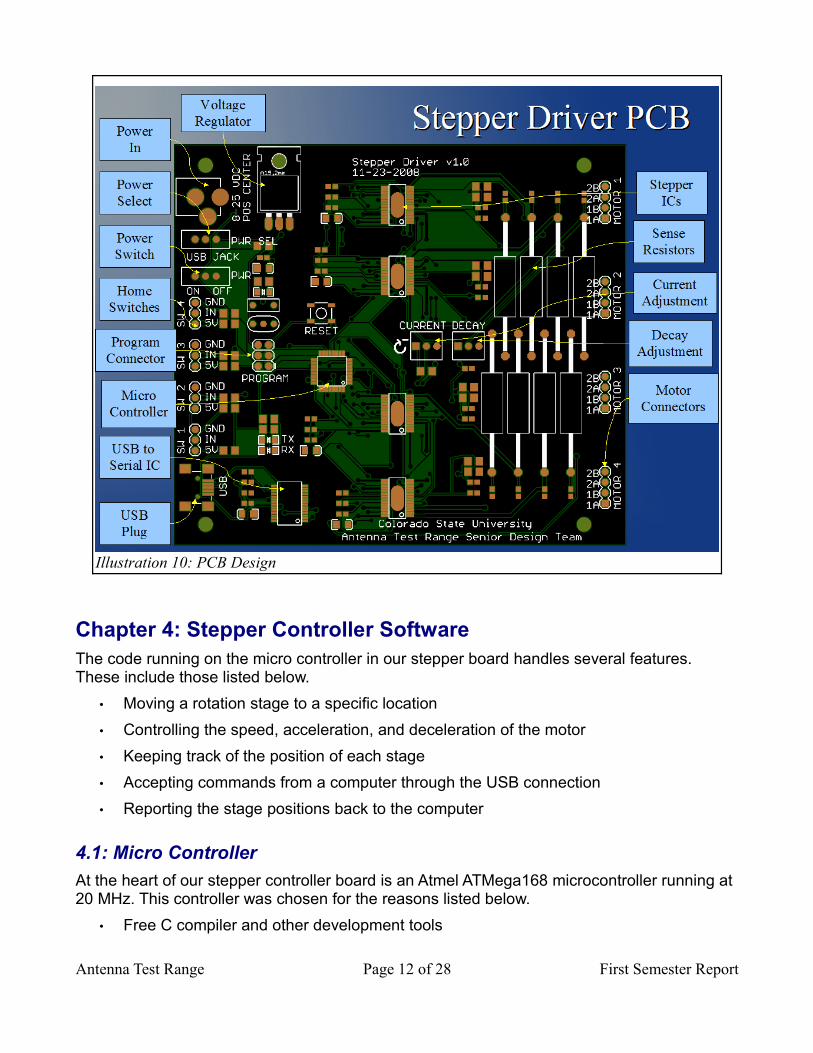
Printed Circuit Board DesignWe took our breadboard circuit design and used it with CadSoft Eagle (freeware software) to implement our PCB design. Actual size of the PCB came out to be 4.3 inch x 3.9 inch. Illustration 11 shows the PCB design with some of the components highlighted. We are using four stepper IC chips so each axis (motor) can connect with one stepper IC. Our breadboard circuit worked perfectly so the PCB design for it was ordered on first week of December and we are expecting it to be here within couple of weeks.
Antenna Test Range Page 11 of 28 First Semester Report
Illustration 9: Breadboard with 5" motor
Chapter 4: Stepper Controller SoftwareThe code running on the micro controller in our stepper board handles several features. These include those listed below.
• Moving a rotation stage to a specific location• Controlling the speed, acceleration, and deceleration of the motor• Keeping track of the position of each stage• Accepting commands from a computer through the USB connection• Reporting the stage positions back to the computer
4.1: Micro ControllerAt the heart of our stepper controller board is an Atmel ATMega168 microcontroller running at 20 MHz. This controller was chosen for the reasons listed below.
• Free C compiler and other development tools
Antenna Test Range Page 12 of 28 First Semester Report
Illustration 10: PCB Design
• Team member with personal experience• High performance• Easy to use
The program was writing in C using tools provided by the WinAVR package. The Eclipse IDE was used to aid in the software development. Once the program was compiled it is downloaded using the AVRISP mkII In-System Programmer. This programmer plugs into a PC USB port, and a 6 pin header on the embedded system.
CommunicationsCommunications to the computer were handled using the UART built into the micro controller configured to run at 19,200 baud. The TTL serial signals are converted to USB using the FT232RL IC chip.
Timer Compare MatchOur algorithm uses the timer module in the micro controller to have precise control of the speed, acceleration, and deceleration of the motor. Our main clock runs at 20 MHz, but we have configured the timer to run at the clock rate divided by 64 which is 312.5 KHz.A 16 bit output compare register is loaded with a number. This number is then compared to the value stored in the timer register. When these numbers match, the timer compare interrupt is triggered. The movement of the motor is handled entirely by this interrupt service routine once the initial calculations are performed. The output compare register is loaded with the next value required for the movement, and the timer register is reset. If the motor was accelerating then this value would be smaller than the current value for a faster interrupt time.
4.2: Program flow chartA block diagram of the program flow is shown below.
Antenna Test Range Page 13 of 28 First Semester Report
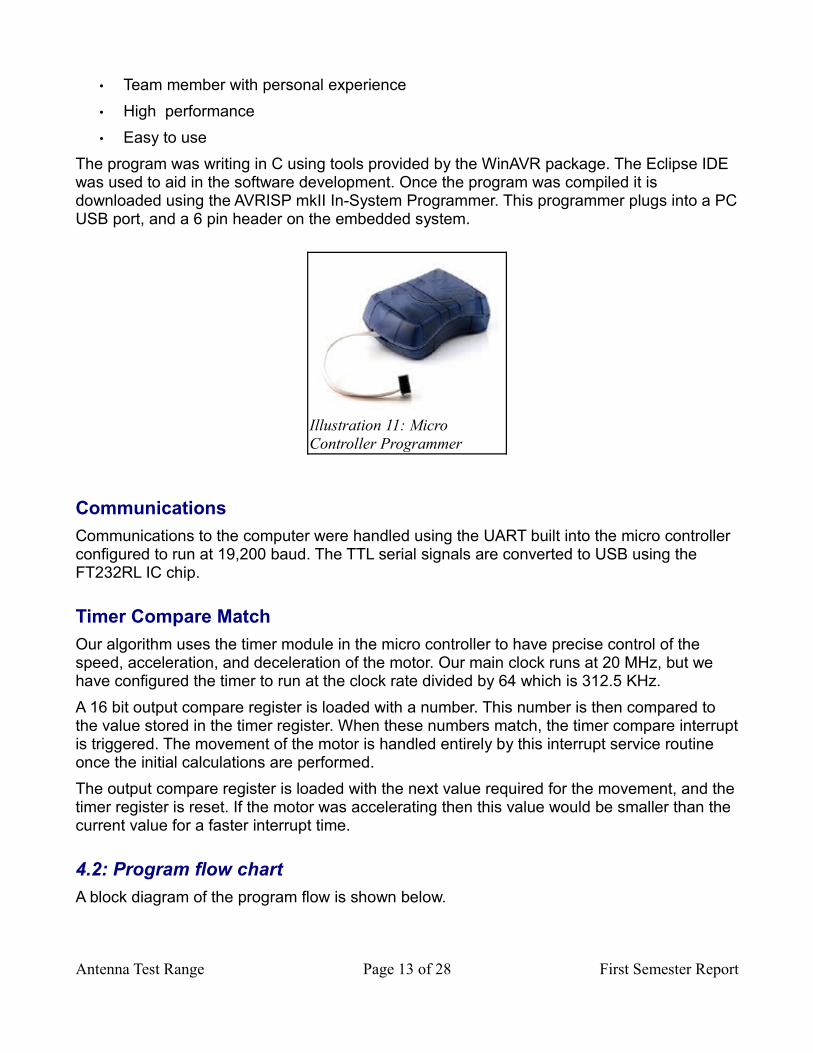
Illustration 11: Micro Controller Programmer
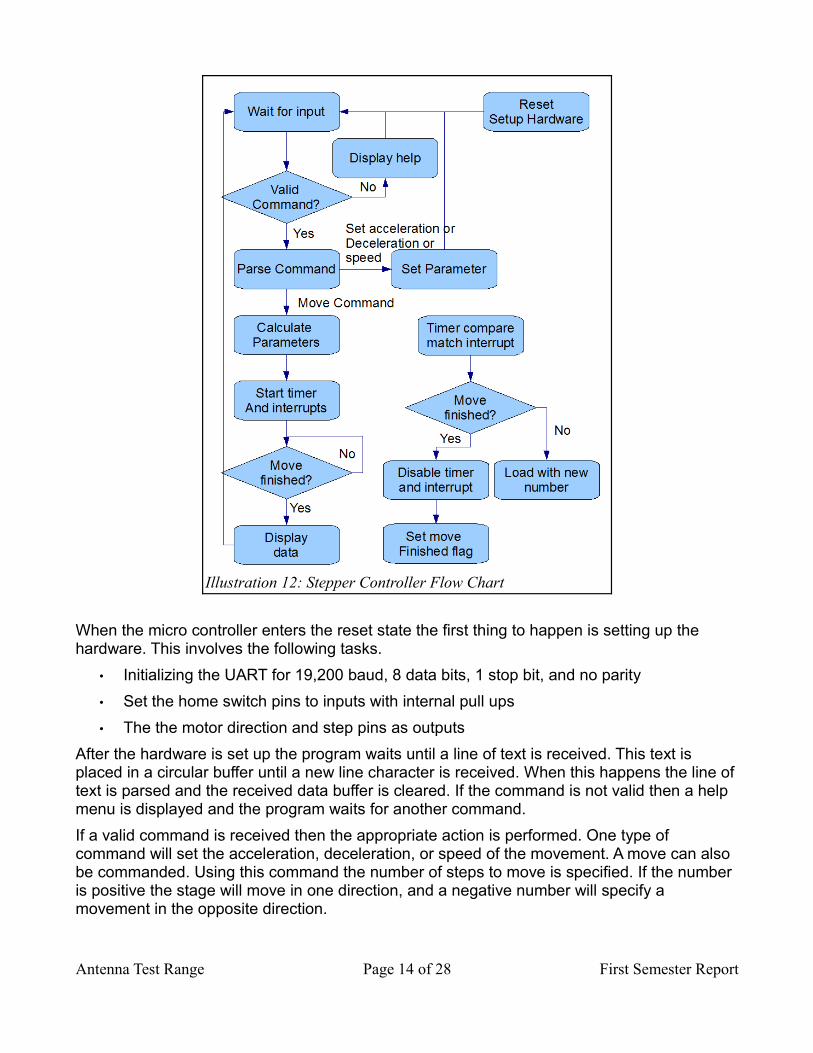
When the micro controller enters the reset state the first thing to happen is setting up the hardware. This involves the following tasks.
• Initializing the UART for 19,200 baud, 8 data bits, 1 stop bit, and no parity• Set the home switch pins to inputs with internal pull ups• The the motor direction and step pins as outputs
After the hardware is set up the program waits until a line of text is received. This text is placed in a circular buffer until a new line character is received. When this happens the line of text is parsed and the received data buffer is cleared. If the command is not valid then a help menu is displayed and the program waits for another command.If a valid command is received then the appropriate action is performed. One type of command will set the acceleration, deceleration, or speed of the movement. A move can also be commanded. Using this command the number of steps to move is specified. If the number is positive the stage will move in one direction, and a negative number will specify a movement in the opposite direction.
Antenna Test Range Page 14 of 28 First Semester Report
Illustration 12: Stepper Controller Flow Chart
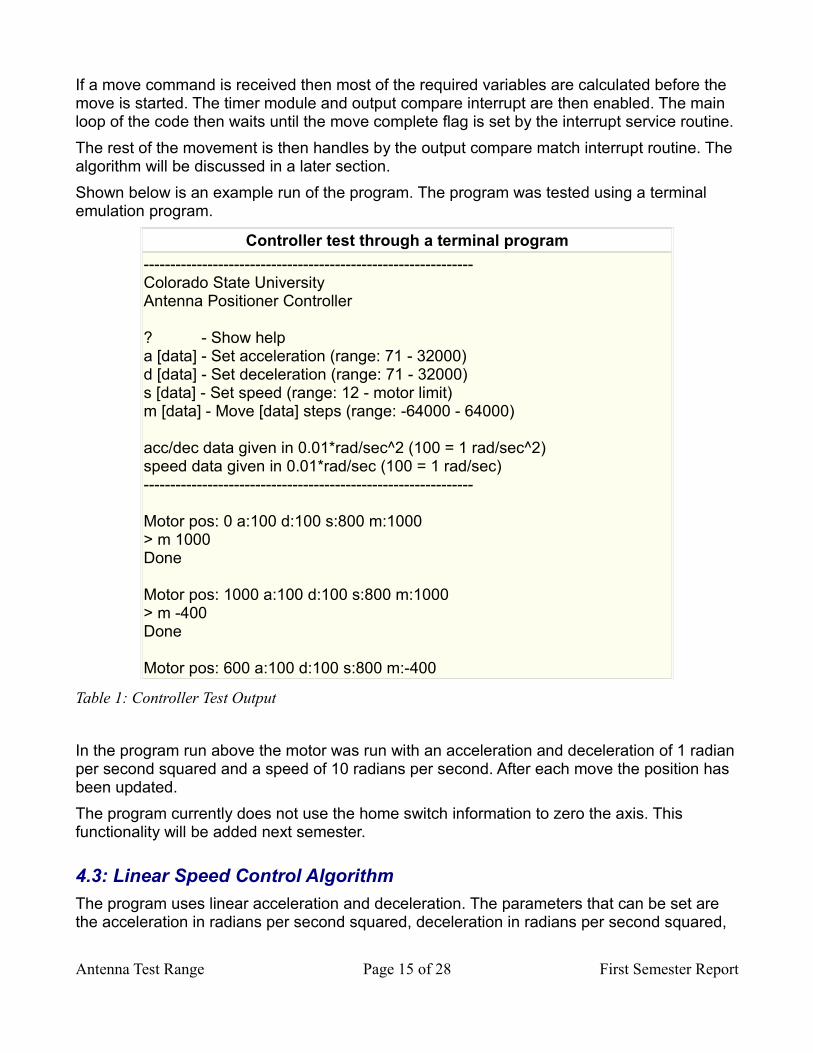
If a move command is received then most of the required variables are calculated before the move is started. The timer module and output compare interrupt are then enabled. The main loop of the code then waits until the move complete flag is set by the interrupt service routine. The rest of the movement is then handles by the output compare match interrupt routine. The algorithm will be discussed in a later section.Shown below is an example run of the program. The program was tested using a terminal emulation program.
Controller test through a terminal program--------------------------------------------------------------Colorado State UniversityAntenna Positioner Controller
? - Show helpa [data] - Set acceleration (range: 71 - 32000)d [data] - Set deceleration (range: 71 - 32000)s [data] - Set speed (range: 12 - motor limit)m [data] - Move [data] steps (range: -64000 - 64000)
acc/dec data given in 0.01*rad/sec^2 (100 = 1 rad/sec^2)speed data given in 0.01*rad/sec (100 = 1 rad/sec)--------------------------------------------------------------
Motor pos: 0 a:100 d:100 s:800 m:1000> m 1000Done
Motor pos: 1000 a:100 d:100 s:800 m:1000> m -400Done
Motor pos: 600 a:100 d:100 s:800 m:-400
Table 1: Controller Test Output
In the program run above the motor was run with an acceleration and deceleration of 1 radian per second squared and a speed of 10 radians per second. After each move the position has been updated.The program currently does not use the home switch information to zero the axis. This functionality will be added next semester.
4.3: Linear Speed Control AlgorithmThe program uses linear acceleration and deceleration. The parameters that can be set are the acceleration in radians per second squared, deceleration in radians per second squared,
Antenna Test Range Page 15 of 28 First Semester Report
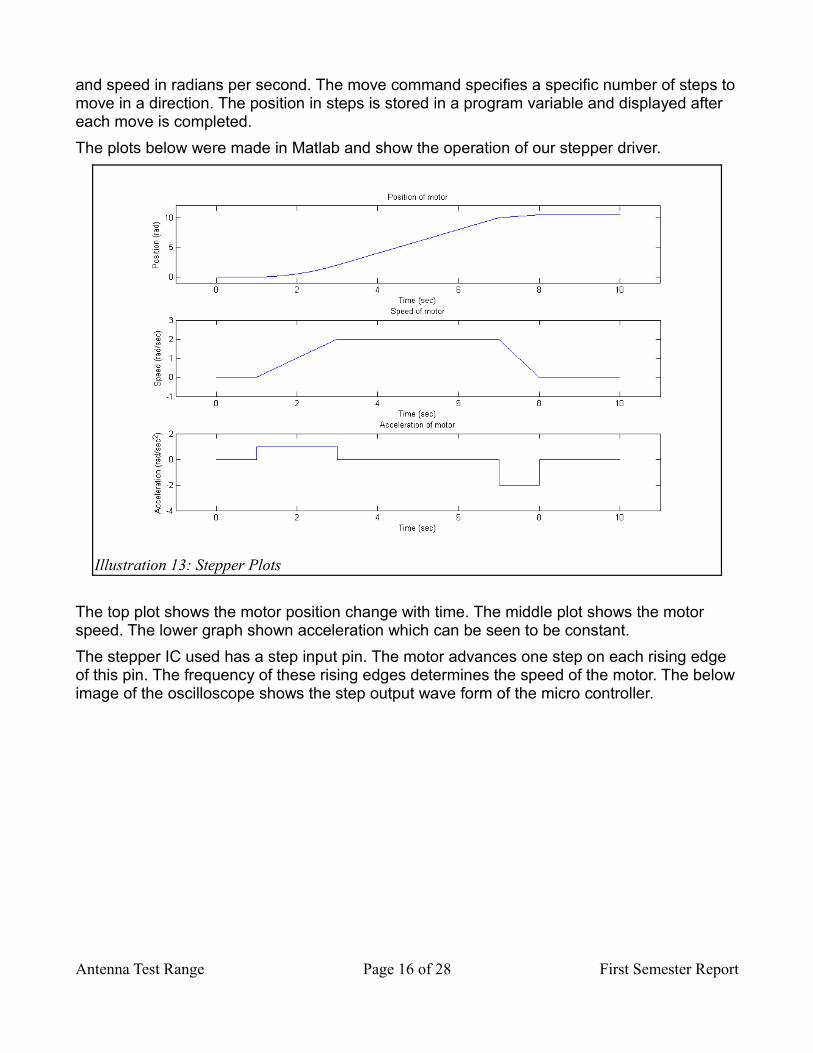
and speed in radians per second. The move command specifies a specific number of steps to move in a direction. The position in steps is stored in a program variable and displayed after each move is completed.The plots below were made in Matlab and show the operation of our stepper driver.
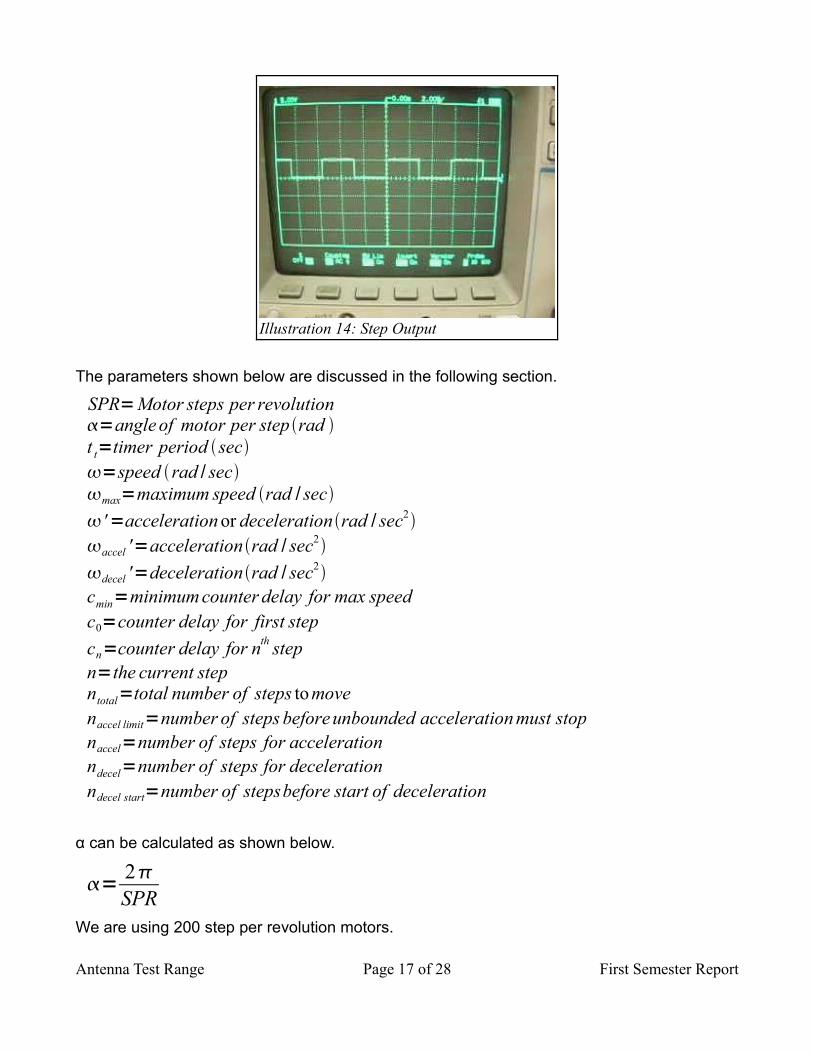
The top plot shows the motor position change with time. The middle plot shows the motor speed. The lower graph shown acceleration which can be seen to be constant.The stepper IC used has a step input pin. The motor advances one step on each rising edge of this pin. The frequency of these rising edges determines the speed of the motor. The below image of the oscilloscope shows the step output wave form of the micro controller.
Antenna Test Range Page 16 of 28 First Semester Report
Illustration 13: Stepper Plots
The parameters shown below are discussed in the following section.
SPR=Motor steps per revolution=angle of motor per step rad t t=timer period sec=speed rad / secmax=maximum speed rad / sec '=acceleration or decelerationrad / sec2accel '=accelerationrad / sec2decel '=decelerationrad / sec2cmin=minimum counter delay for max speedc0=counter delay for first stepcn=counter delay for nth stepn=the current stepntotal=total number of steps to movenaccel limit=number of steps beforeunbounded acceleration must stopnaccel=number of steps for accelerationndecel=number of steps for decelerationndecel start=number of stepsbefore start of deceleration
α can be calculated as shown below.
= 2SPR
We are using 200 step per revolution motors.
Antenna Test Range Page 17 of 28 First Semester Report
Illustration 14: Step Output
= 100
The time delay between stepper pulses control the speed of the motor by using the timer module. This means that the next time delay value must be calculated and loaded into the output compare register after each interrupt. This time delay depends on the frequency of the counter, and the value stored into the output compare register. The frequency of the counter can be configured, but is not changed during the program. The counter module in our design is set at a rate of the main clock divided by 64. This is 312.5 Khz.The speed of the motor is given by the equation below where ω' is the acceleration.
t =∫0
t
' d = ' t (1)
The motor position θ(t) is given below which is also equal to nα.
t =∫0
t
d
t =∫0
t
' d
t =12 ' t 2=n
(2)
Solving for t gives the time at which the step should occur for the specified acceleration.
12 ' t 2=n
t 2=2n '
t=2n'
(3)
This equation is the time to the nth step pulse. Now we need to solve for the time between two pulses.
Antenna Test Range Page 18 of 28 First Semester Report
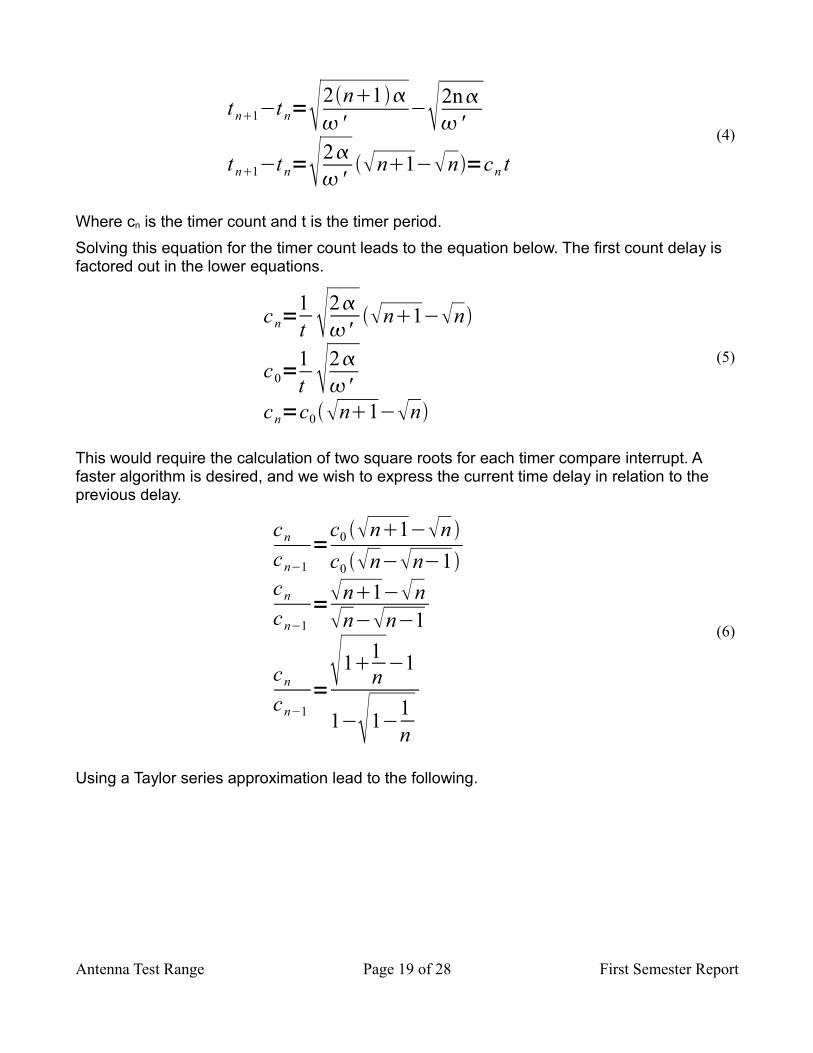
t n1−t n=2n1 '
−2n '
t n1−t n=2 '
n1−n=cn t
(4)
Where cn is the timer count and t is the timer period. Solving this equation for the timer count leads to the equation below. The first count delay is factored out in the lower equations.
cn=1t 2
' n1−n
c0=1t 2
'cn=c0n1−n
(5)
This would require the calculation of two square roots for each timer compare interrupt. A faster algorithm is desired, and we wish to express the current time delay in relation to the previous delay.
cn
cn−1=
c0 n1−n c0 n−n−1
cn
cn−1=n1−nn−n−1
cn
cn−1=11
n −1
1−1−1n
(6)
Using a Taylor series approximation lead to the following.
Antenna Test Range Page 19 of 28 First Semester Report
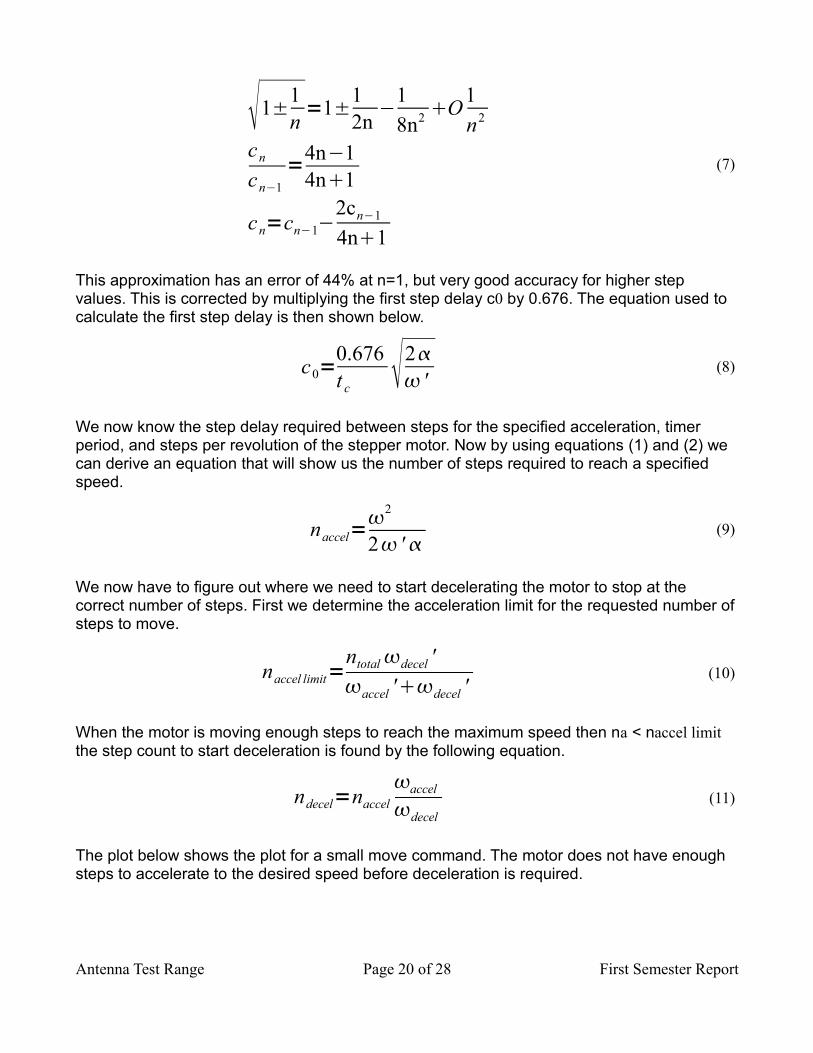
1±1n =1±1
2n −18n2 O1
n2
cn
cn−1=4n−1
4n1
cn=cn−1−2cn−1
4n1
(7)
This approximation has an error of 44% at n=1, but very good accuracy for higher step values. This is corrected by multiplying the first step delay c0 by 0.676. The equation used to calculate the first step delay is then shown below.
c0=0.676t c 2
' (8)
We now know the step delay required between steps for the specified acceleration, timer period, and steps per revolution of the stepper motor. Now by using equations (1) and (2) we can derive an equation that will show us the number of steps required to reach a specified speed.
naccel=2
2 ' (9)
We now have to figure out where we need to start decelerating the motor to stop at the correct number of steps. First we determine the acceleration limit for the requested number of steps to move.
naccel limit=ntotal decel 'accel 'decel '
(10)
When the motor is moving enough steps to reach the maximum speed then na < naccel limit the step count to start deceleration is found by the following equation.
ndecel=naccelaccel
decel (11)
The plot below shows the plot for a small move command. The motor does not have enough steps to accelerate to the desired speed before deceleration is required.
Antenna Test Range Page 20 of 28 First Semester Report
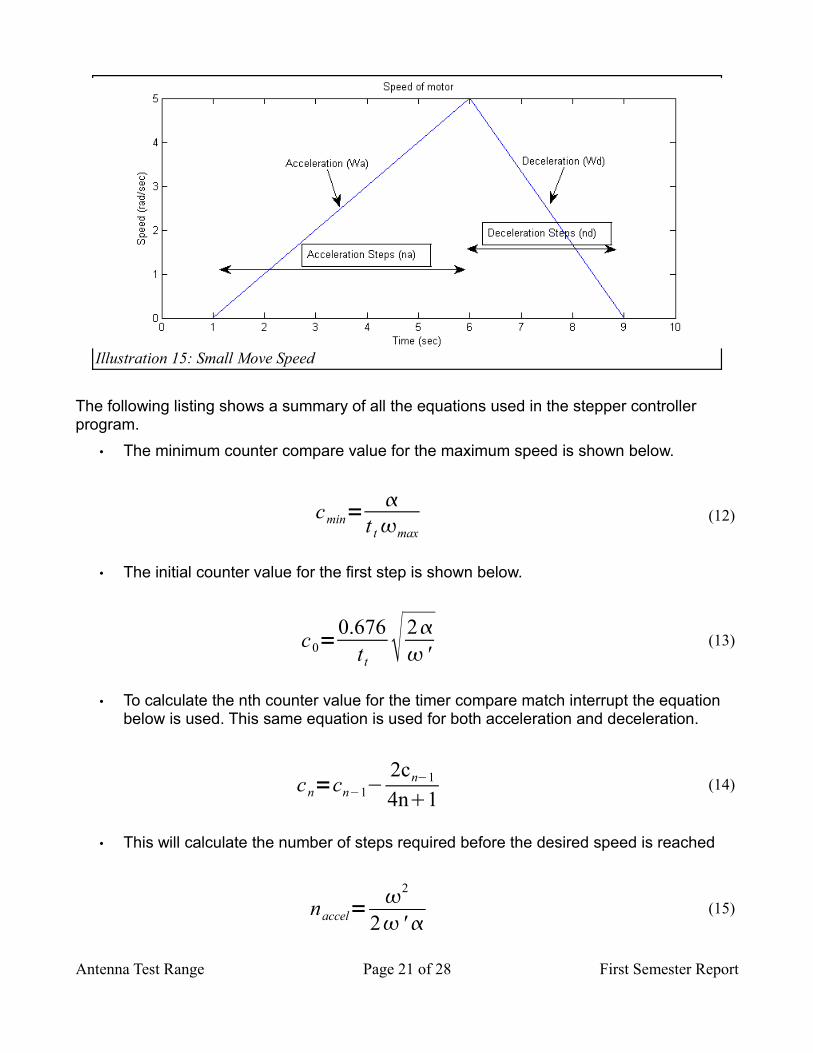
The following listing shows a summary of all the equations used in the stepper controller program.
• The minimum counter compare value for the maximum speed is shown below.
cmin=
t t max (12)
• The initial counter value for the first step is shown below.
c0=0.676
t t 2 '
(13)
• To calculate the nth counter value for the timer compare match interrupt the equation below is used. This same equation is used for both acceleration and deceleration.
cn=cn−1−2cn−1
4n1 (14)
• This will calculate the number of steps required before the desired speed is reached
naccel=2
2 ' (15)
Antenna Test Range Page 21 of 28 First Semester Report
Illustration 15: Small Move Speed
• Calculate the step value for the maximum speed that can be achieved.
naccel limit=ntotal decel '
accel 'decel ' (16)
• If this is less that the number of steps required to reach the specified speed then the motor will not reach the maximum speed. The deceleration step count is calculated as below.
ndecel=naccel limit−ntotal (17)
• If this is larger then we will have a constant speed portion of the movement. The step value to start decelerating is shown below.
ndecel=−naccel∗accel 'decel '
(18)
• The deceleration start value is then calculated.
ndecel start=ntotalndecel (19)
Chapter 5: Computer SoftwareThe second part to our software is the application running on a desktop computer. This will be the major focus for our next semester plans. This application is responsible for several tasks.
• Send commands to the stepper controller board to move the positioners• Receive the position data from the controller board• Send commands to the vector network analyzer• Receive measurements from the network analyzer• Display the data in a meaningful manner• Provide data export options
A screen shot of our first attempt at the PC application is shown below. This application was written in Java using the NetBeans IDE. This application was a very basic shell that did not have much functionality built in. It was able to send and receive data through the serial port. There were also working controls that could be set to show the antenna position.
Antenna Test Range Page 22 of 28 First Semester Report
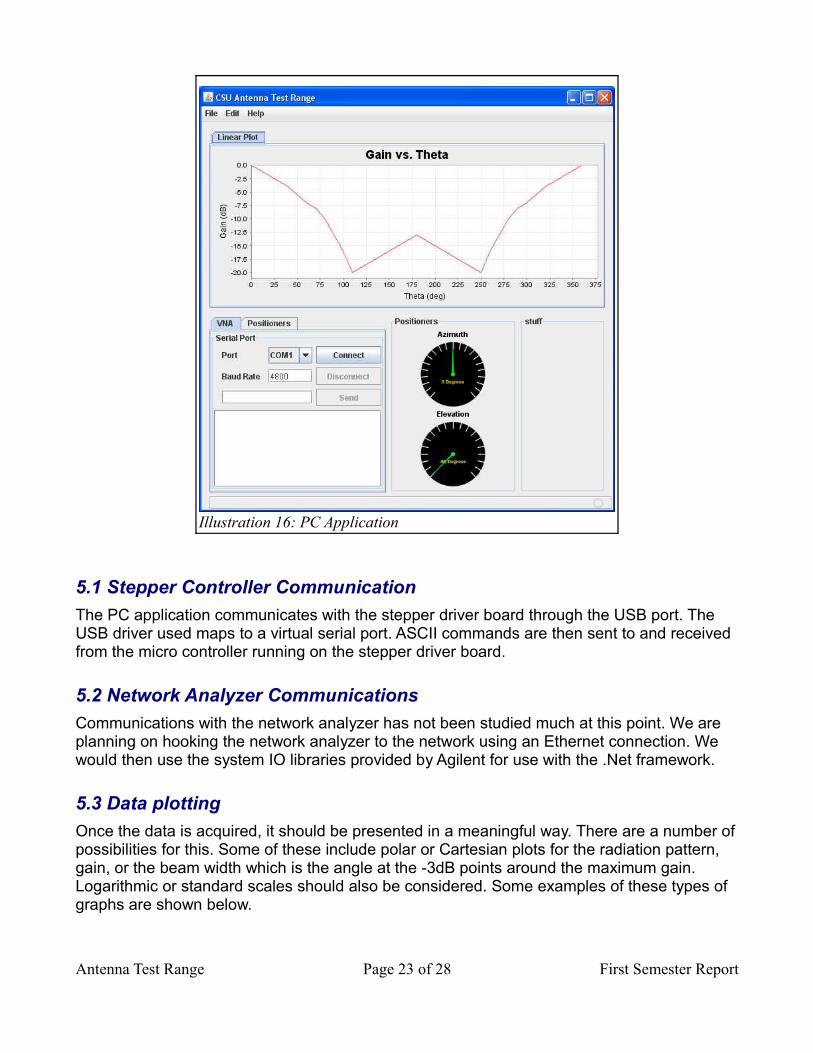
5.1 Stepper Controller CommunicationThe PC application communicates with the stepper driver board through the USB port. The USB driver used maps to a virtual serial port. ASCII commands are then sent to and received from the micro controller running on the stepper driver board.
5.2 Network Analyzer CommunicationsCommunications with the network analyzer has not been studied much at this point. We are planning on hooking the network analyzer to the network using an Ethernet connection. We would then use the system IO libraries provided by Agilent for use with the .Net framework.
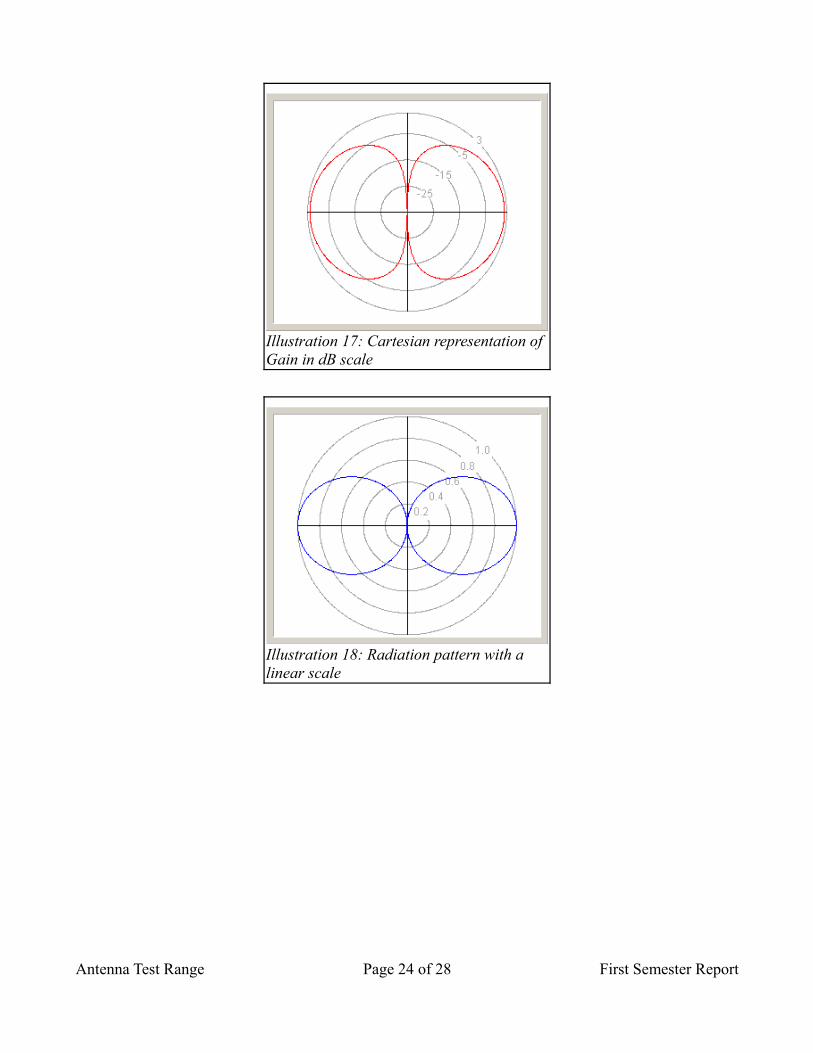
5.3 Data plottingOnce the data is acquired, it should be presented in a meaningful way. There are a number of possibilities for this. Some of these include polar or Cartesian plots for the radiation pattern, gain, or the beam width which is the angle at the -3dB points around the maximum gain. Logarithmic or standard scales should also be considered. Some examples of these types of graphs are shown below.
Antenna Test Range Page 23 of 28 First Semester Report
Illustration 16: PC Application
Antenna Test Range Page 24 of 28 First Semester Report
Illustration 17: Cartesian representation of Gain in dB scale
Illustration 18: Radiation pattern with a linear scale
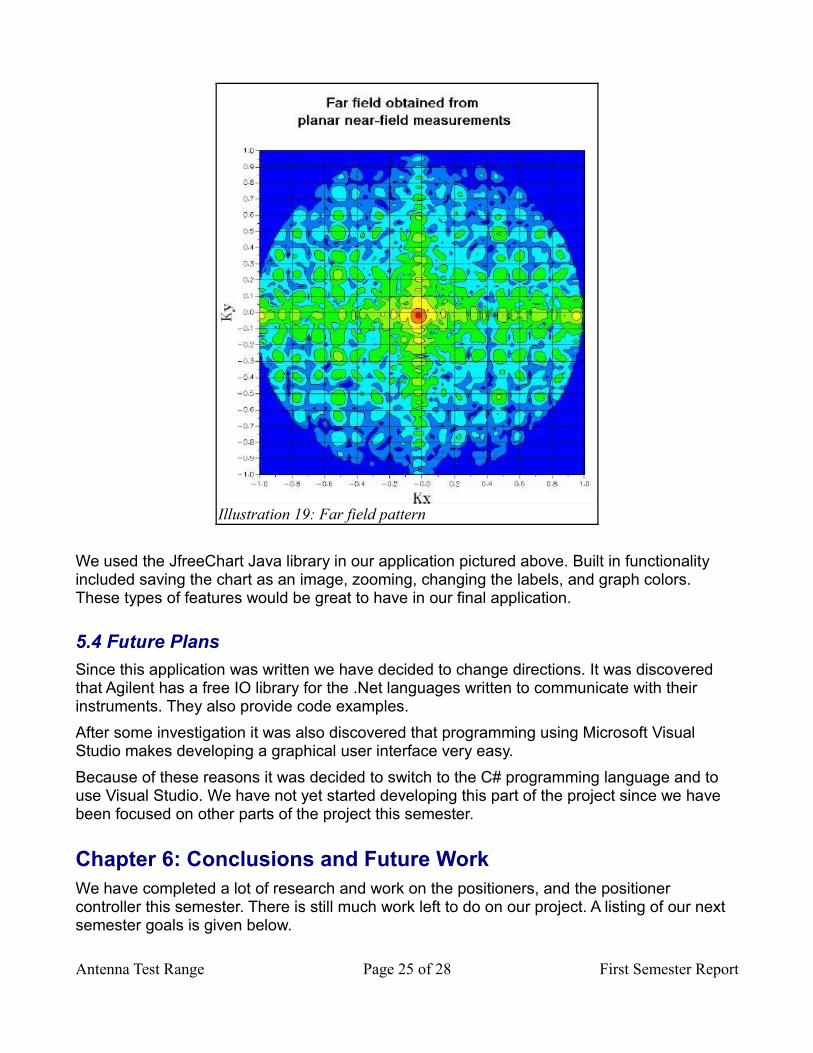
We used the JfreeChart Java library in our application pictured above. Built in functionality included saving the chart as an image, zooming, changing the labels, and graph colors. These types of features would be great to have in our final application.
5.4 Future PlansSince this application was written we have decided to change directions. It was discovered that Agilent has a free IO library for the .Net languages written to communicate with their instruments. They also provide code examples.After some investigation it was also discovered that programming using Microsoft Visual Studio makes developing a graphical user interface very easy.Because of these reasons it was decided to switch to the C# programming language and to use Visual Studio. We have not yet started developing this part of the project since we have been focused on other parts of the project this semester.
Chapter 6: Conclusions and Future WorkWe have completed a lot of research and work on the positioners, and the positioner controller this semester. There is still much work left to do on our project. A listing of our next semester goals is given below.
Antenna Test Range Page 25 of 28 First Semester Report
Illustration 19: Far field pattern
Build the positioner mounting hardwareCompletion of positioning control software for four-axis rotational RF scanning systemCommunication with vector network analyzerRF data acquisition and processing softwareRF cabling throughout the systemPower cabling and power suppliesCalibration of source antennas
Positioner Mounting HardwareOne goal for next semester is to find a way of getting our positioner mounting hardware manufactured by someone. This will give us our complete polarization over azimuth over elevation positioner.Our stepper controller board is currently being manufactured. Time will be dedicated to assembly and testing of the board.
Positioning Control SoftwareWe have a working micro controller program running on our stepper controller board, but it will require some modifications. The home switches are not currently read, and a home function will need to be created to zero the position of the stage.Also on the agenda is a function to specify movements, and report position in a more coherent format.We also need to modify the program to be able to control multiple axes. It is currently set up to only handle one stage.
PC Application DevelopmentThis will be the major focus for our next semester plans. This application is responsible for several tasks.Send commands to the stepper controller board to move the positionersReceive the position data from the controller boardSend commands to the vector network analyzerReceive measurements from the network analyzerDisplay the data in a meaningful mannerProvide data export optionsWe have not done much work in this area of our project yet. The work that we have done will not be entirely applicable since we have changed programming languages.
Antenna Test Range Page 26 of 28 First Semester Report
The first task we take on will probably be developing the part of the application responsible for sending and receiving commands from the stepper controller board. After this task is completed we will move on to communicating with the vector network analyzer. We will have a functional system at that point, and then the focus will be on improving functionality, and usability.We will add a better graphical user interface, and data plotting capabilities in order to better visualize the data. We would also like to add data export capabilities.
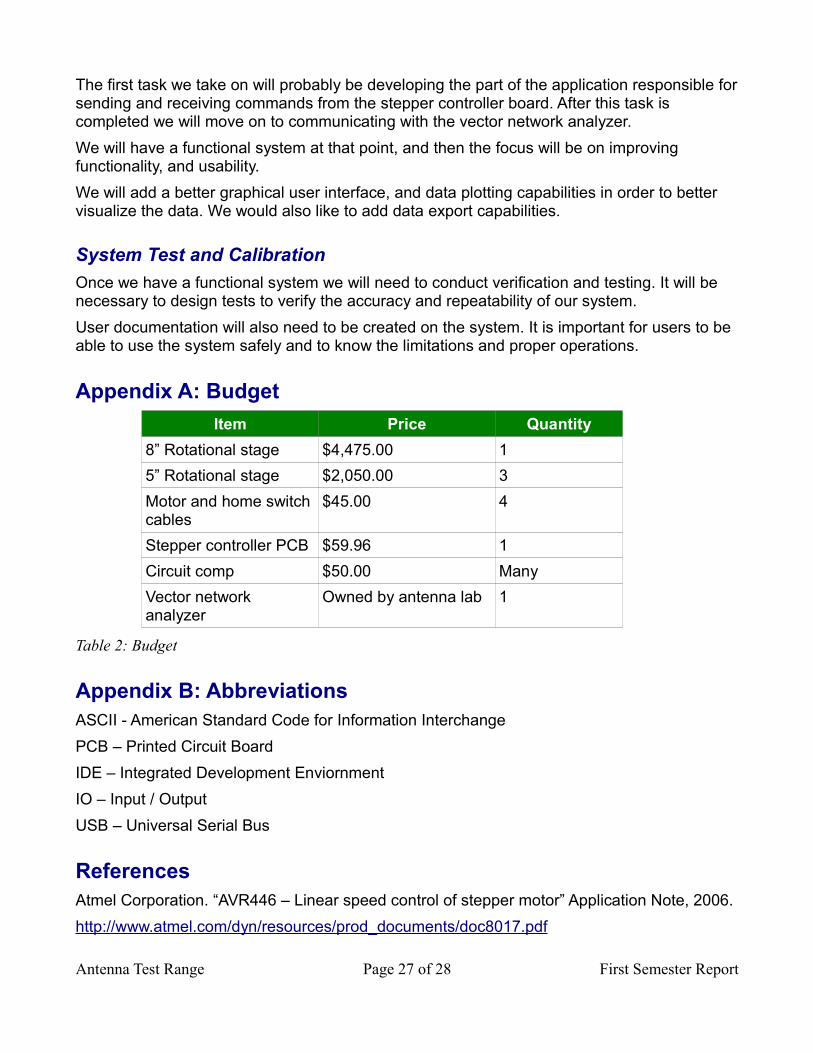
System Test and CalibrationOnce we have a functional system we will need to conduct verification and testing. It will be necessary to design tests to verify the accuracy and repeatability of our system.User documentation will also need to be created on the system. It is important for users to be able to use the system safely and to know the limitations and proper operations.
Appendix A: BudgetItem Price Quantity
8” Rotational stage $4,475.00 15” Rotational stage $2,050.00 3Motor and home switch cables
$45.00 4
Stepper controller PCB $59.96 1Circuit comp $50.00 ManyVector network analyzer
Owned by antenna lab 1
Table 2: Budget
Appendix B: AbbreviationsASCII - American Standard Code for Information InterchangePCB – Printed Circuit BoardIDE – Integrated Development EnviornmentIO – Input / OutputUSB – Universal Serial Bus
ReferencesAtmel Corporation. “AVR446 – Linear speed control of stepper motor” Application Note, 2006.http://www.atmel.com/dyn/resources/prod_documents/doc8017.pdf
Antenna Test Range Page 27 of 28 First Semester Report
Austin, David. “Generate stepper-motor speed profiles in real time” Embedded Systems Programming, 2005.http://www.embedded.com/columns/technicalinsights/56800129?_requestid=126831
AcknowledgmentsWe would like to thank the following people for their assistance through the semester.
• Dr. Branislav Notaros• Olivera Notaros• Eve Klopf• Carlos Flores
Antenna Test Range Page 28 of 28 First Semester Report


![Design of Ionofree Micro Strip Quad Helix Antenna for ... · antenna, bifilar helices antenna, microstrip antenna, quadrafilar helix antenna. ... Helical antenna [1],[2] is broadband](https://img.pdfslide.us/doc/110x75/5b9506e809d3f2ea5c8b5a04/design-of-ionofree-micro-strip-quad-helix-antenna-for-antenna-bifilar-helices.jpg)