Embed Size (px)
Citation preview

Answers in which people report 80% confidence. Only 65% are correct.
(Lichtenstein, Fischhoff
& Phillips, 1982)Answers in which people report 80% confidence; only 65% are correct.
Calibr
ation
line
(tru
e a
ccu
racy)
(confidence)
Overconfidence
Participants answer
“trivia” questions
Report confidence
(subjective probability)
of being correct
Instructed to be
calibrated
(sometimes with
incentives)
Introduction Example Results VariantsEvolutionModel

(confidence)
Interpretation:
overestimating
accuracy of private
information
Studied in many
papers (Oskamp,
1965; …)
Recent surveys:
Griffin & Brenner
(2004), Skala (2008)
Rational Explanations
Answers in which people report 80% confidence. Only 65% are correct.
(Lichtenstein, Fischhoff
& Phillips, 1982)Answers in which people report 80% confidence; only 65% are correct.
Calibr
ation
line
(tru
e a
ccu
racy)
(confidence)
Overconfidence
Introduction Example Results VariantsEvolutionModel
3
Motivation (1)
Existing economic models assume overconfidence
Directly (Odean, 98, Gervais & Odean, 01), Sandroni & Squintani, 07)
Positive utility from good self esteem (Compte & Postlewaite, 04;
Köszegi, 06; Weinberg, 09)
3
Strategic interaction overconfidence
Risk-averse principals prefer overconfident agents
Introduction Example Results VariantsEvolutionModel
4
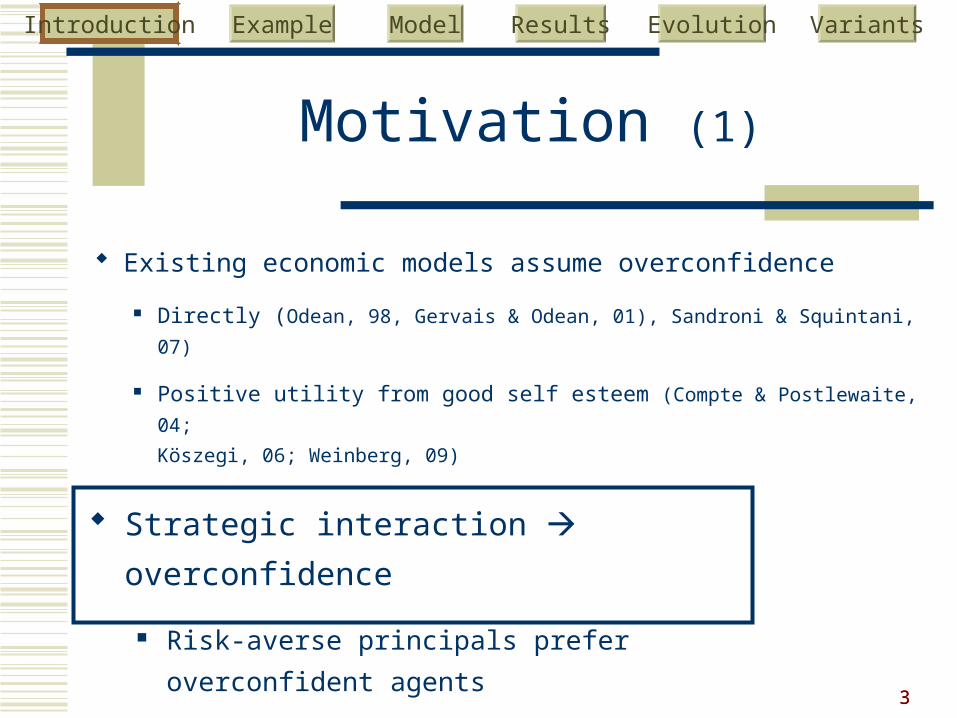
Motivation (2)
Existing Evolutionary foundations for overconfidence:
Group selection (Bernardo & Welch, 01): improve aggregation of
information a few overconfident agents survive
Second-best outcome; compensates another bias (e.g., excess risk
aversion): Wang (91), Blume & Easly (92), Waldman (94)
4
Gene’s interest in diversification overconfidence
First-best outcome, individual selection, everyone is overconfident
Introduction Example Results VariantsEvolutionModel
555
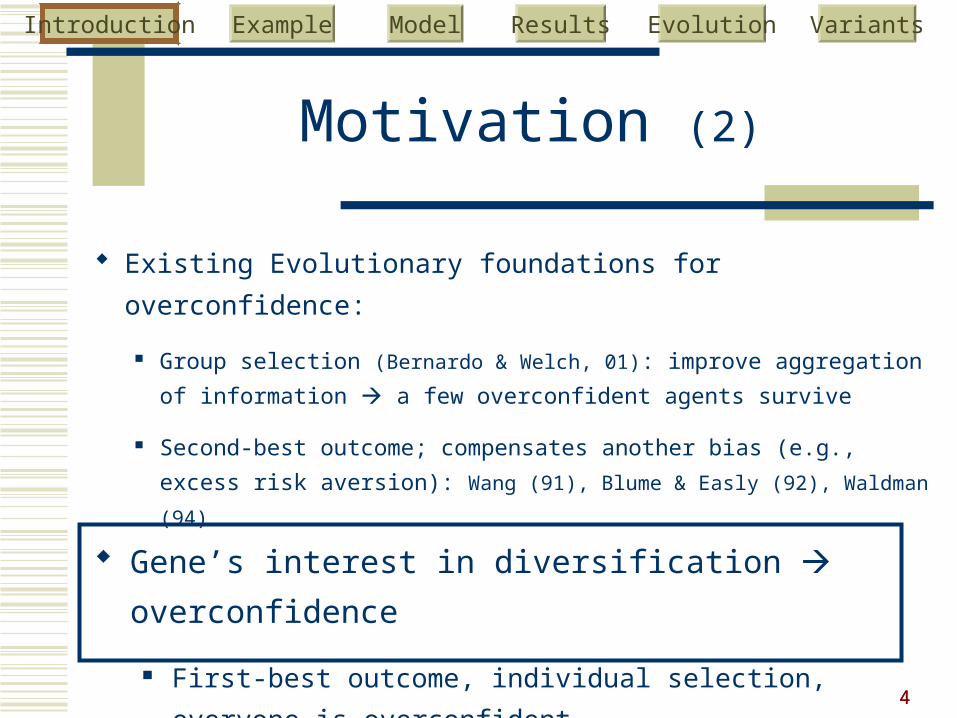
Contents
Introduction
Motivating example
Model
Results
Evolutionary stability
Variants and Extensions
5
Introduction Example Results VariantsEvolutionModel
6
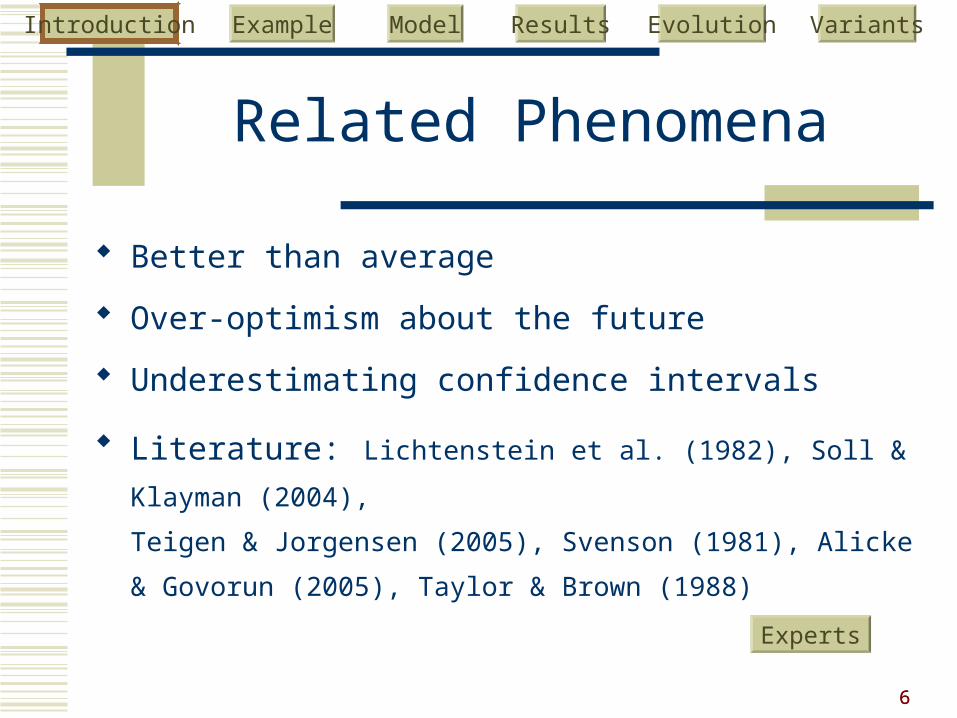
Related Phenomena
Better than average
Over-optimism about the future
Underestimating confidence intervals
Literature: Lichtenstein et al. (1982), Soll & Klayman (2004),
Teigen & Jorgensen (2005), Svenson (1981), Alicke & Govorun (2005),
Taylor & Brown (1988)
6
Experts
Introduction Example Results VariantsEvolutionModel

7
Motivating Example
7
Introduction Example Results VariantsEvolutionModel
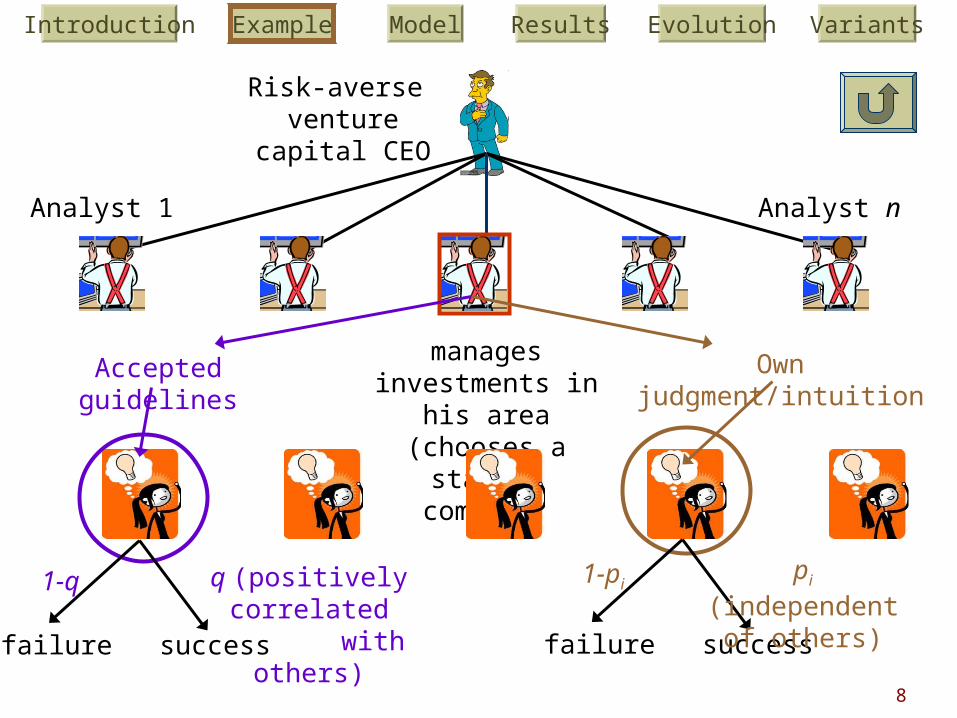
8
Risk-averse venture capital CEO
manages investments in his area (chooses a
startup company)
Accepted guidelines Own judgment/intuition
failure success
q (positively correlated with others)
1-q
successfailure
pi (independentof others)
1-pi
Analyst 1 Analyst n
Introduction Example Results VariantsEvolutionModel

99
Model
Introduction Example Results VariantsEvolutionModel
10
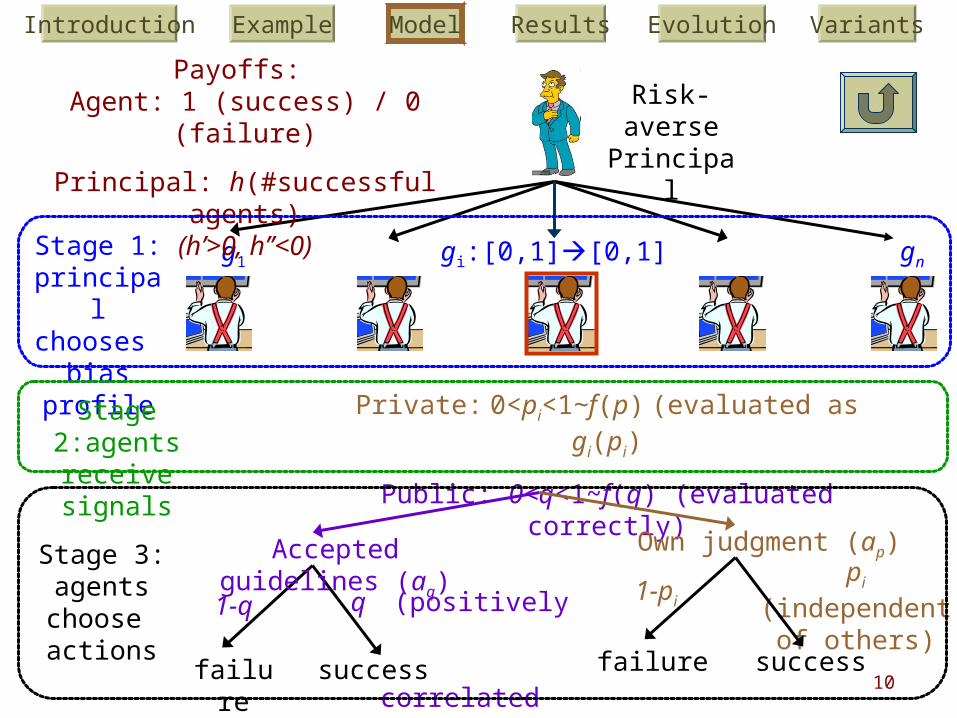
Risk-averse Principal
g1 gi:[0,1][0,1] gn
Payoffs: Agent: 1 (success) / 0 (failure)
Principal: h(#successful agents)(h’>0, h’’<0)
Stage 1:principal chooses
bias profile
Stage 2:agentsreceive signals
Private: 0<pi<1~f(p) (evaluated as gi(pi)
Public: 0<q<1~f(q) (evaluated correctly)
pi (independentof others)1-q
failure success
q (positively correlated
with others) successfailure
1-pi
Accepted guidelines (aq) Own judgment (ap)Stage 3:agentschoose actions
Introduction Example Results VariantsEvolutionModel
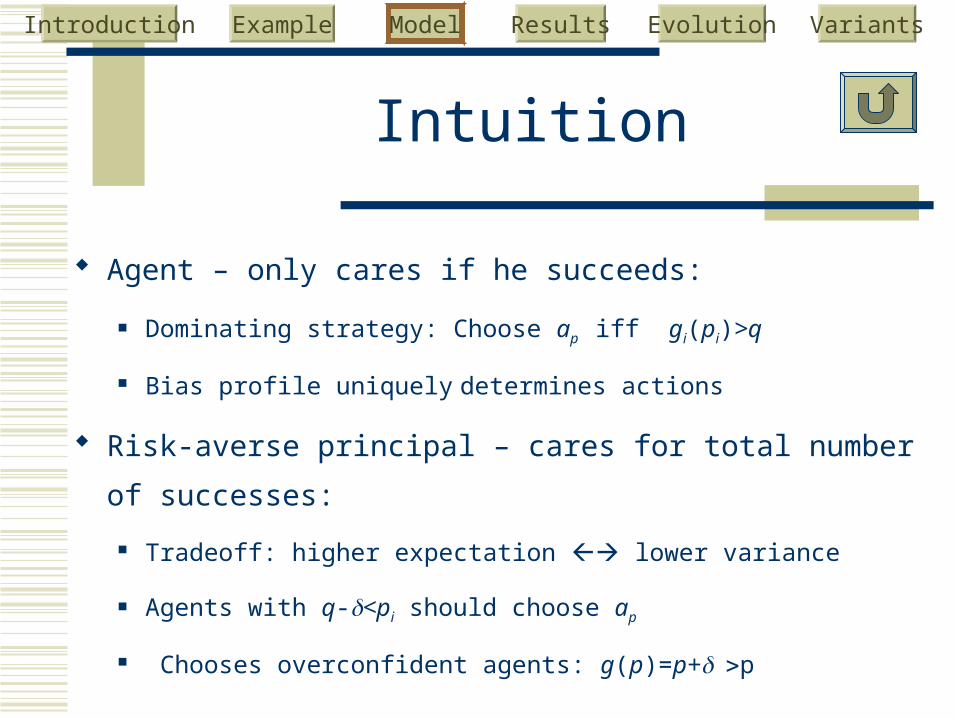
Intuition
Agent – only cares if he succeeds:
Dominating strategy: Choose ap iff gi(pi)>q
Bias profile uniquely determines actions
Risk-averse principal – cares for total number of successes:
Tradeoff: higher expectation lower variance
Agents with q-<pi should choose ap
Chooses overconfident agents: g(p)=p+p
Introduction Example Results VariantsEvolutionModel

- correlation between agents that choose aq
Benchmark: =1
(all agents that follow aq succeed or fail together)
Comments
Why not using monetary incentives?
Risk-neutral stock owners informal mechanisms
Correlation
Introduction Example Results VariantsEvolutionModel
Technical assumption: decreasing absolute risk aversion

13
Results
13
Introduction Example Results VariantsEvolutionModel

14
Main Result
Unique optimal bias profile exists:
Homogenous profile: i gi=g
Represents overconfidence (g (p)>p, 0<p<1)
Induces the first-best payoff
Strictly better than any other profile
Depends only on h & fp
Asymptotic result (sufficiently many agents) 14
Details
Existence
Contrary
Uniqueness
Introduction Example Results VariantsEvolutionModel
Intuition
15
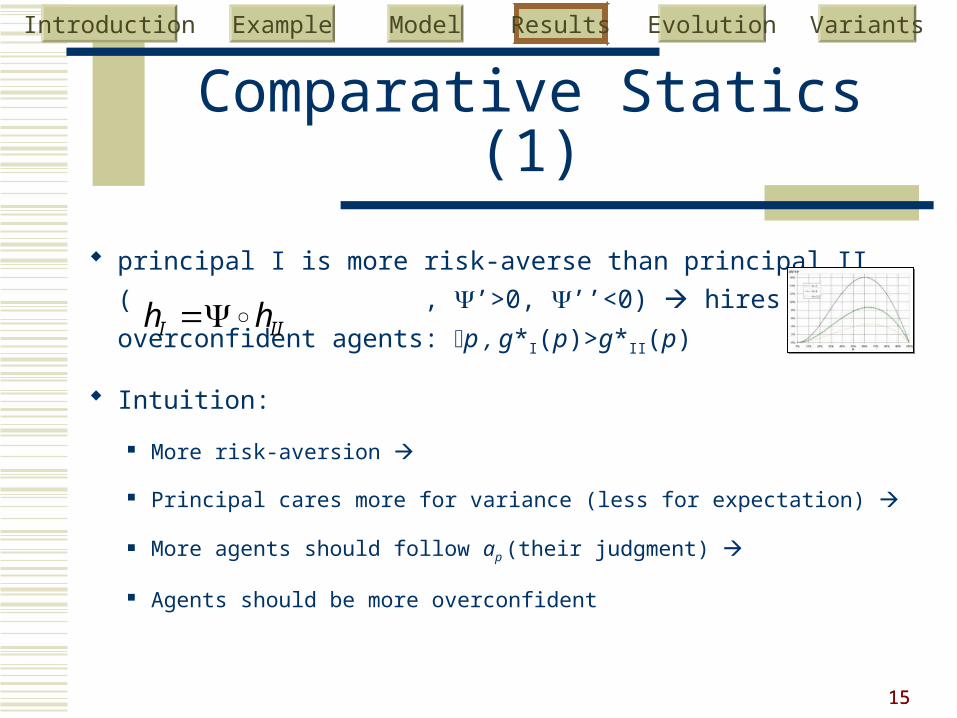
Comparative Statics (1)
principal I is more risk-averse than principal II
( , ’>0, ’’<0) hires more
overconfident agents: p , g*I(p)>g*II(p)
Intuition:
More risk-aversion
Principal cares more for variance (less for expectation)
More agents should follow ap (their judgment)
Agents should be more overconfident15
I IIh h
Introduction Example Results VariantsEvolutionModel

16
Comparative Statics (2)
If (correlation) becomes larger the principal hires more
overconfident agents
Intuition:
Higher correlation
More aggregate risk from aq (following guidelines)
More agents should follow ap
Agents should be more overconfident
16
Introduction Example Results VariantsEvolutionModel
Correlation

17
Comparative Statics (3)
Harder tasks (accurate signals are less likely) induce
more overconfidence
Hard-easy effect (Lichtenstein, et al., 1982; Moore & Healy, 2008)
Intuition:
Principal wants agents with the most accurate private signals to
choose ap
In an harder environment, each pi is more likely to be among the
most accurate
17
Introduction Example Results VariantsEvolutionModel
Overconfidence & Evolutionary Stability
18
Introduction Example Results VariantsEvolutionModel

19
g1
Each type induces a (possibly random)
bias function
Agentsreceive signals
Private: 0<pi<1~f(pi) (evaluated as gi(pi)
Public: 0<q<1~f(p) (evaluated correctly)
Which type will survivein the long run?
pi (independentof others)
1-q
failure success
q (positively correlated
with others) successfailure
1-pi
Conformity (aq) Own judgment (ap)Each agentmakes an important decision
Payoff (fitness): Agent: H (success) / L (failure)
gi:[0,1][0,1] gn
Evolutionary Model (Only Agents)
Introduction Example Results VariantsEvolutionModel

202020
Intuition
#offspring : product of the average fitness in each generation
The type that maximizes the geometric mean of the average
fitness prevails the population (large population, long run)
Evolutionary dynamics behaves as it were a risk-averse
principal with logarithmic utility:
h(#successful agents)=ln(average fitness)
Lewontin & Cohen (1969), Mcnamara (1995), Robson (1996)
20
Introduction Example Results VariantsEvolutionModel

212121
Results (1)
In the long run all agents are overconfident
Overconfidence level depend on the potential gain
D=(H-L)/L, fp
Explains finding such as Yates et al. (2002): Different societies
present different levels of overconfidence
21
Introduction Example Results VariantsEvolutionModel

222222
Results (2)
Larger D (more important decisions) induces more
overconfidence (Sieber, 1974)
Intuition: larger D more aggregate risk in aq more overconfidence
When g(p)~ 1, p is much smaller (for large D-s)
False certainty effect (Fischhoff et al., 1977) : people are often wrong
when certain in their private information
Results hold for any CRRA utility
22
Introduction Example Results VariantsEvolutionModel
23
Variants & Extensions
Social welfare
Risk averse agents
Agents as experts
Costly private signals
Bias w.r.t. the public signal
Choosing the number of agents
Underestimating variance
Underusing base rates23
Example
k alternatives
g* interpretation
Introduction Example Results VariantsEvolutionModel
363636
Summary
Explaining overconfidence as the result of diversification
Novel evolutionary foundation of overconfidence and its
observed properties (1st best, no other bias, no group selection)
Demonstrate why principals prefer overconfident agents in
some strategic interactions
E.g., CEO and analysts in a venture capital
36
Future Research
Introduction Example Results VariantsEvolutionModel

373737
Future Research
Applying the model to voting / career-motivated experts
Noisy signals about the quality of the candidates
Each voter (also) wishes to vote correctly
Social planner wishes that most voters vote correctly
Requires relaxing a few technical assumptions:
Non-risk-averse principal (e.g., step functions in voting)
(Ex-ante) asymmetric agents
Small number of agents
More general signaling systems (p1,…,pk; q1,…,qk)37
Introduction Example Results VariantsEvolutionModel

Optimal g in the CRRA Case (with perfect correlation)
51
Introduction Example Results VariantsEvolutionModel

Hard-Easy Effect(Lichtenstein,
Fischhoff & Phillips,
1982)
Calibr
ation
line
(tru
e a
ccu
racy)
(confidence)
Hard tasks
Easy tasks

565656
Related Literature (Models of Overconfidence)
Conflict with future selves (Bénabou & Tirole ,QJE 2002)
Positive emotions improve performance / utility: Compte & Postlewaite (AER 2004), Köszegi (2006), Weinberg (2009)
Taking credit for lucky successes (Gervais & Odean, 2001)
Apparent overconfidence due to unbiased random errors Van Den Steen (AER 2004), Moore (2007), Benoit & Dubra (2008)
Influence of overconfident agents Odean (JoF 1998), Sandroni & Squintani (AER 2007)
Evolutionary foundations: Bernardo & Welch (2001), Blume & Easly
(1992), Wang (1991), Waldman (AER 1994)56
Introduction Example Results VariantsEvolutionModel
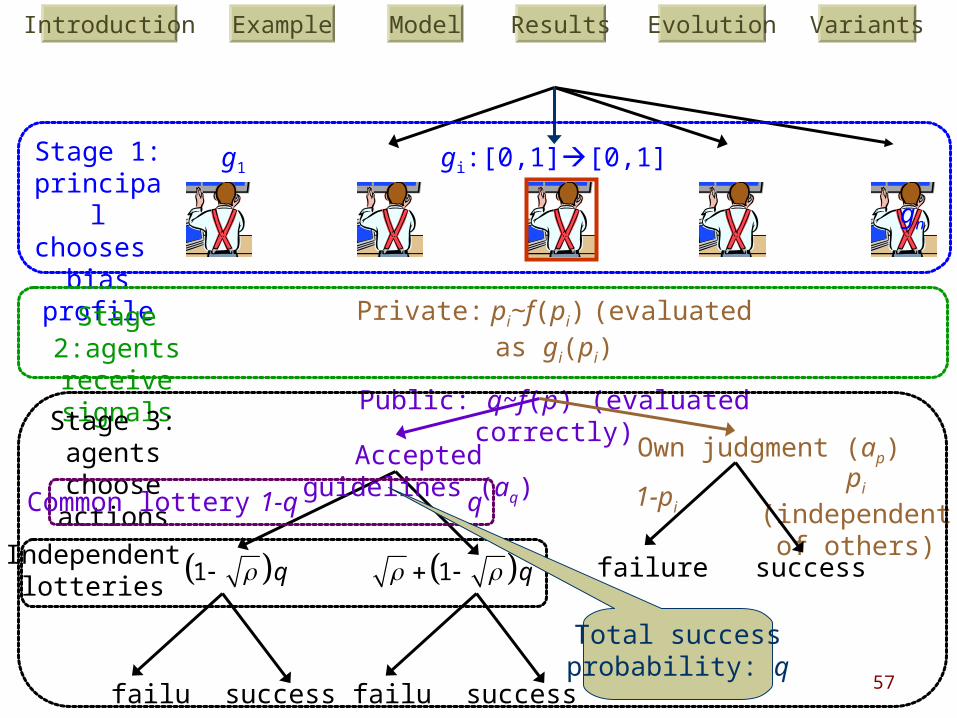
57
g1 gi:[0,1][0,1]
gn
Stage 1:principal chooses
bias profile
Stage 2:agentsreceive signals
Private: pi~f(pi) (evaluated as gi(pi)
Public: q~f(p) (evaluated correctly)
pi (independentof others)1-q
failure success
successfailure
1-pi
Accepted guidelines (aq) Own judgment (ap)Stage 3: agentschoose actions
q
failure success
Common lottery
1 q 1 qIndependent lotteries
Introduction Example Results VariantsEvolutionModel
Total successprobability: q