Embed Size (px)
Citation preview
Anomalous diffusion and power-law relaxation of the time averaged mean squared
displacement in worm-like micellar solutions
This article has been downloaded from IOPscience. Please scroll down to see the full text article.
2013 New J. Phys. 15 045011
(http://iopscience.iop.org/1367-2630/15/4/045011)
Download details:
IP Address: 141.89.176.204
The article was downloaded on 18/04/2013 at 06:46
Please note that terms and conditions apply.
View the table of contents for this issue, or go to the journal homepage for more
Home Search Collections Journals About Contact us My IOPscience
Anomalous diffusion and power-law relaxation of thetime averaged mean squared displacement inworm-like micellar solutions
Jae-Hyung Jeon1, Natascha Leijnse2, Lene B Oddershede2
and Ralf Metzler1,3,4
1 Department of Physics, Tampere University of Technology, 33101 Tampere,Finland2 Niels Bohr Institute, University of Copenhagen, 2100 København Ø, Denmark3 Institute for Physics and Astronomy, University of Potsdam,14476 Potsdam-Golm, GermanyE-mail: [email protected]
New Journal of Physics 15 (2013) 045011 (16pp)Received 20 November 2012Published 17 April 2013Online at http://www.njp.org/doi:10.1088/1367-2630/15/4/045011
Abstract. We report the results of single tracer particle tracking by opticaltweezers and video microscopy in micellar solutions. From careful analysisin terms of different stochastic models, we show that the polystyrene tracerbeads of size 0.52–2.5µm after short-time normal diffusion turn over to performanomalous diffusion of the form 〈r2(t)〉 ' tα with α ≈ 0.3. This free anomalousdiffusion is ergodic and consistent with a description in terms of the generalizedLangevin equation with a power-law memory kernel. With optical tweezerstracking, we unveil a power-law relaxation over several decades in time to thethermal plateau value under the confinement of the harmonic tweezer potential,as predicted previously (Phys. Rev. E 85 021147 (2012)). After the subdiffusivemotion in the millisecond range, the motion becomes faster and turns either backto normal Brownian diffusion or to even faster superdiffusion, depending on thesize of the tracer beads.
4 Author to whom any correspondence should be addressed.
Content from this work may be used under the terms of the Creative Commons Attribution 3.0 licence.Any further distribution of this work must maintain attribution to the author(s) and the title of the work, journal
citation and DOI.
New Journal of Physics 15 (2013) 0450111367-2630/13/045011+16$33.00 © IOP Publishing Ltd and Deutsche Physikalische Gesellschaft

2
Contents
1. Introduction 22. Experimental and theoretical background 3
2.1. Materials and methods . . . . . . . . . . . . . . . . . . . . . . . . . . . . . . 32.2. Ensemble and time averaged mean squared displacements . . . . . . . . . . . . 42.3. Anomalous diffusion under confinement . . . . . . . . . . . . . . . . . . . . . 5
3. Results 73.1. Short-time confined motion measured by optical tweezers . . . . . . . . . . . . 73.2. Long-time free diffusion measured by video tracking . . . . . . . . . . . . . . 10
4. Discussion 13Acknowledgments 15References 15
1. Introduction
Following Robert Brown’s original studies of microscopic particles ejected by pollen grains [1],it was Jean Perrin at the Sorbonne in Paris who developed advanced protocols for extensivesingle particle tracking [2]. Perrin’s experiments relied on relatively short trajectories suchthat he used ensemble averages over many individual particle displacements to compute thediffusion constant of the tracer particles. A few years later Ivar Nordlund at the University ofUppsala came up with the idea of following a single mercury droplet over long times throughprojection of the particle motion onto a moving film [3]. Nordlund’s method allowed him tocalculate the diffusion coefficient via the time average of an individual droplet’s trajectory,without the need to average over many, not completely identical particles. Today, the trackingof single tracer particles or even single, labelled molecules has become a standard tool to probethe dynamics of tracers in living biological cells or other microscopic systems [4, 5].
Single particle tracking has become the tool of choice to investigate the effect of molecularcrowding, the superdense environment present in the cytoplasm of living biological cells.Molecular crowding may reach a volume occupation of up to 40% by biomacromolecules,and thus cause major changes of the motion of large biopolymers and artificial tracers as wellas the function of enzymes [6–8]. Indeed, the observed motion of freely diffusing moleculesand tracers in living cells exhibits significant deviations from the linear time dependence ofthe mean squared displacement (MSD) 〈r2(t)〉 ' t characteristic of Brownian motion. Instead,anomalous diffusion [9–11] of the form 〈r2(t)〉 ' tα with 0< α < 1 has been widely reported.Thus, fluorescently labelled messenger RNA molecules in Escherichia coli (E. coli) bacteriacells subdiffuse with α ≈ 0.7 even when altering the physiological conditions or disrupting thebacterium’s cytoskeletal internal structure [12]. Similar findings, with different values of α,were reported for the motion of DNA loci in E. coli [13], lipid granules [14, 15], viruses [16]and for chromosomal end parts (telomeres) in eukaryotic nuclei [17]. Anomalous diffusion inthe cytoplasm of living cells was also reported from studies using fluorescence correlationspectroscopy [18, 19]. In artificially crowded control environments anomalous diffusion isconsistently observed [18, 20–22]. Finally, the crowding in cellular membranes also givesrise to anomalous diffusion phenomena [23, 24], as also observed in extensive simulationstudies [25–28].
New Journal of Physics 15 (2013) 045011 (http://www.njp.org/)
3
Here we report new results from single particle tracking of polystyrene microbeads inmicellar solutions. Worm-like micelles are long cylindrical objects self-assembled by cationicsurfactants [29]. In a semi-dilute regime above a critical concentration c∗, worm-like micellesform a transient polymer network, where segments of micelle polymers constantly break andrecombine in several ways depending on the micellar concentration. Microrheology studieshave shown that under this condition the worm-like micelles behave like a typical viscoelasticmaterial [29–31]. Combining results from tracking with an optical tweezers setup and a moreconventional video microscopy tracking assay, we show that in the millisecond range even ata low micellar concentration of 1% weight the tracers exhibit anomalous diffusion consistentwith motion in a viscoelastic environment as described by the generalized Langevin equationwith a power-law kernel. The anomalous diffusion exponent characterizing the bead motionis α ≈ 0.3. Moreover, we demonstrate that under confinement as exerted on the tracer beadsby the Hookean restoring force of the optical tweezer, we observe a power-law relaxationto the equilibrium plateau value, as opposed to the conventional exponential relaxation. Thisobservation is consistent with recent analytical and numerical results [32]. Finally, we showthat at long times the majority of beads move normally (α ≈ 1). However, similar to previousexperimental findings in micellar solutions [33] some larger beads also show superdiffusivemotion (α > 1).
After presenting the experimental system and a primer on theoretical models for anomalousdiffusion in section 2, we report the results from the optical tweezers and video trackingexperiments in section 3. Finally, in section 4 we discuss the results and draw conclusions.
2. Experimental and theoretical background
2.1. Materials and methods
2.1.1. Worm-like micelles. Worm-like micelles were mixed according to a protocol from [34].Cetylpyridinium chloride (CPyCl, Sigma, acts as a surfactant) and sodium salicylate (NaSal,Sigma, strongly binding counter ions) were mixed and dissolved in 0.5 M NaCl. For the micelleconcentration of 1 wt% we used molar concentrations of 0.06 mol l−1 CPyCl, 0.03 mol l−1 NaSaldissolved in 0.5 mol l−1 NaCl in Milli-Q water. The samples were equilibrated for at least 1 dayprior to measurements and stored at room temperature. All experiments were conducted at roomtemperature. The micelle concentration of 1 wt% implies that the solution is in the semi-diluteregime (c > c∗, c∗
∼ 0.3 wt %) in which micelles are entangled.Physically, worm-like micelles are elongated self-assembled structures formed by a
spontaneous aggregation of surfactant molecules (amphiphiles). Their viscoelastic propertiesdepend on their concentration and the electrolytes in the solvent. Under the current conditions,the micelles grow into elongated tubular structures which constantly break and re-form, similarto the ongoing polymerization/depolymerization in certain polymers [29].
2.1.2. Preparation of samples. The micelles were mixed with 0.4% of a solution of uncoatedpolystyrene beads (0.52, 0.96 2.5µm, Bangs Labs) dissolved in Millipore water. 100µl ofthe final mixture was added to a clean coverslip (24 × 50 mm2, #1.5, Menzel–Glaser) bottomin between two strips of vacuum grease. In order to create a chamber, a clean coverslip(18 × 18 mm2, #1, Menzel–Glaser) was tightly pressed on top. Care was taken not to induce
New Journal of Physics 15 (2013) 045011 (http://www.njp.org/)
4
air bubbles inside the micelles/bead sample. The sample sides were sealed with vacuum greaseto create a closed chamber.
2.1.3. Optical tweezers tracking. The motion of beads in worm-like micellar solutions wasrecorded using optical tweezers tracking with photodiode detection resulting in a time resolutionof 4.5 × 10⁻⁵ s. The optical trap was implemented in an inverted microscope (Leica DMIRBE)where the laser beam (Nd:YVO4 (5W Spectra Physics BL106C, λ= 1064 nm, TEM∞)) wastightly focused by a water immersion objective (Leica, HCX PL APO, 63×, NA = 1.2, CORR CS). The laser light scattered by the moving beads passing the sample was collected by acondenser (Leica, P1 1.40 oil S1) and focused on the back focal plane of a quadrant photodiode(S5981, Hamamatsu). Data were acquired by a data acquisition card (NI PCI-6040E) at asampling frequency of 22 kHz and processed by custom written LabVIEW programs (LabVIEW2010, National Instruments). The laser power was kept relatively low (63 mW at the exit of thelaser of which ∼ 65%, 41 mW, reached the sample) with a typical measurement time of 3 s.The temperature increase related to absorption of the laser light is expected to be well below1 ◦C [35, 36]. The laser was focused on a bead (which was at least 5µm away from any surfaceof the chamber) and positioned such that the bead was in the centre of the weak harmonicpotential exerted by the optical trap [37]. The voltage output from the photodiode is linearlyrelated to the small displacement of the bead with respect to the laser focus. In order to convertthe voltage output from the photodiode to metric distance, knowledge about the viscosity ofthe medium surrounding the bead would be required. As this parameter is unknown, the MSDdata for optical trapping tracking are given in arbitrary units. The three orthogonal translationaldirections are uncorrelated and all measurements were taken in two dimensions.
2.1.4. Single particle tracking. In order to track the motion of a bead at longer time scales thanis possible by optical tweezers tracking, we imaged the beads using bright field microscopy. Themicroscope setup was the same as for the optical tweezers tracking but images were acquiredwith an AVT Pike F100B camera (Allied Vision Technologies) and SmartView (Allied VisionTechnologies) acquisition software. Approximately 225 frames per second were recordedduring a total measurement time of ∼40 s. Bead trajectories were obtained using the MOSAIKImage J single particle tracking tool [38].
2.2. Ensemble and time averaged mean squared displacements
To quantify the average diffusive behaviour of tracer particles, the conventional approach isthe ensemble averaged (EA) MSD. The EA MSD is defined from the trajectories ri(t) of thediffusing particles (labelled with the index i) in terms of the distance from their initial positionri(0),
〈r2(t)〉 =1
N
N∑i=1
(ri(t)− ri(0))2. (1)
Here N is the total number of measured particles. Alternatively, the diffusion of an individualparticle can be quantified from the single trajectory r(t) via the time averaged (TA) MSDas [39, 40]
δ2(1)=1
T −1
∫ T −1
0(r(t +1)− r(t))2 dt, (2)
New Journal of Physics 15 (2013) 045011 (http://www.njp.org/)
5
where 1 is the lag time and T is the total measurement time. Thus the TA MSD is constructedfrom the particle displacement during the time lag 1 accumulated over the entire trajectory.For Brownian motion both definitions are always equivalent, δ2(1)= 〈r2(1)〉, if only themeasurement time T is sufficiently long [39, 40]. More care has to be taken when weencounter anomalous diffusion. While stochastic motion of the viscoelastic type as describedmathematically by fractional Brownian motion or the generalized Langevin equation with apower-law memory kernel (see below) are ergodic and self-averaging, and thus EA MSD andTA MSD are equivalent for long T [32, 41, 42], transiently non-ergodic behaviour occurs whenthe tracer particle engages with the confinement [32]. For anomalous diffusion of the continuoustime random walk (CTRW) type involving scale-free distributions of waiting times [10, 43, 44],EA MSD and TA MSD are never equivalent. In fact, already for free motion the associatedTA MSD δ2(1)'1/T 1−α scales linearly with 1 despite the underlying anomalous motion(〈r2(t)〉 ' tα), and shows a pronounced scatter of amplitudes [39, 40, 45–48]. The discrepancybetween EA MSD and TA MSD for this type of anomalous diffusion is intimately connected tothe phenomenon of weak ergodicity breaking [49–52].
For shorter time series, the TA MSD of an individual tracer may become quite erratic, inparticular, for larger values of the lag time1 approaching the overall measurement time T . Thebehaviour may be smoothed by calculation of the trajectory-to-trajectory average⟨
δ2(1)⟩=
1
N
N∑i=1
δ2i (1) (3)
obtained from individual TA MSD δ2i (1). This averaging procedure is useful to estimate the
scaling of the TA MSD curve from many individual TA MSD curves.In what follows, we concentrate on one dimension of the observed two-dimensional (2D)
motion for simplicity.
2.3. Anomalous diffusion under confinement
To model diffusion under the confinement exerted by the optical tweezers, we recall that to agood approximation this optical trap effects a harmonic potential on a dielectric object in itsfocus. The polystyrene beads thus experience the quadratic potential U (x)= kx2/2 with thestiffness k, which depends on the absorption and scattering properties of the medium as wellas the size and refractive index of the beads. In the experiment, the trap is initially focusedon the bead corresponding to x(0)= 0. Recently this problem has been studied for severalanomalous diffusion models in terms of the TA MSD, showing that the TA MSD exhibitsdifferent relaxation profiles depending on diffusion models, and thus the origin of the underlyingdiffusive process can be identified by the relaxation profile. The main results are summarizedbelow.
2.3.1. Overdamped Brownian motion. In regular Brownian motion under confinement in thepotential U (x), the EA MSD at long times approaches the saturation value 〈x2
〉th = kBT /k,where kBT represents thermal energy at temperature T . The relaxation to this stationary valueoccurs in the form
δ2(1)= 2〈x2〉th(1 − e−k1/γ ) (4)
New Journal of Physics 15 (2013) 045011 (http://www.njp.org/)
6
except in the vicinity of 1= T [32]. Here γ is the friction coefficient of the particle. Thus anexponential decay profile is expected for ordinary Brownian diffusion. Note the factor of 2 atequilibrium compared to the EA MSD, which is due to the definition (2) of the TA MSD [32]. Inequation (4), we also assumed that the measurement time is sufficiently long (ideally, T → ∞)such that the process can be assumed to be self-averaging and the single time average (4) ispractically indistinguishable from that of other trajectories, δ2
i (1).
2.3.2. Continuous time random walk. Subdiffusive CTRW is a non-ergodic anomalousdiffusion model that is characterized by multiple trapping events [10, 43, 44]. The distribution oftrapping times is of asymptotic power-law form ψ(s)∼ s−1−α, where 0< α < 1, such that theresulting motion in free space becomes subdiffusive with the scaling 〈r2(t)〉 ∼ tα. The resultingdiverging characteristic waiting time
∫∞
0 τψ(τ)dτ leads to the violation of ergodicity for theseprocesses, as there is no scale compared to which the limit of long times (large number ofjumps) could be defined. In the case of subdiffusive CTRW dynamics of confined motion in thepotential U (x), the TA MSD of a particle starting at the flat bottom of the parabolic potentialscales linearly with the lag time,⟨
δ2(1)⟩'
1
T 1−α, (5)
as long as1 is sufficiently short [39, 40, 53]. Without further knowledge about the dynamics ofthe system, the linear scaling δ2(1)∼1with the lag time in equation (5) would erroneously leadto the assumption that one observes normal Brownian motion. Analysis with complementarystatistical tools is therefore important [15, 24, 54, 55]. Note also that in equation (5) we used theadditional average (3) over many trajectories, as subdiffusive CTRW processes are no longerself-averaging and display significant fluctuations around the mean (3) [39, 42, 46]. Once theparticle engages with the confinement, instead of approaching the thermal value a second power-law with exponent 1 −α emerges [39, 40, 53],⟨
δ2(1)⟩'
(1
T
)1−α
. (6)
Phenomen (5) and (6) were indeed observed for the anomalous motion of lipid granules insideliving yeast cells [15] and in the membrane walls of human cells [56]. One can also identifyCTRW-like anomalous diffusion by its ageing property: at a fixed lag time, the TA MSDdecreases as T α−1 with the measurement time T , as demonstrated for the motion of proteinchannels in the cell wall of living human kidney cells [24]. Moreover, the effect of a timedifference between the system preparation and start of the measurement was recently discussed[57].
2.3.3. Fractional Langevin equation. The fractional Langevin equation (FLE) is a generalizedLangevin equation driven by power-law correlated Gaussian noise and with a power-lawmemory kernel [41, 58]. In free one-dimensional space the FLE reads
md2x(t)
dt2= −γ
∫ t
0dt ′
|t − t ′|−α dx
dt ′+ ηξ(t), (7)
where the correlated Gaussian noise ξ(t) satisfies 〈ξ(t)〉 = 0 and 〈ξ(t)ξ(t ′)〉 = (2 −α)(1 −α)
Kα|t − t ′|−α with 0< α < 1 at t 6= t ′ (where Kα is a generalized diffusion coefficient
New Journal of Physics 15 (2013) 045011 (http://www.njp.org/)
7
of the dimension [cm2/sα]), and its proportionality constant is chosen to be η =√γ kBT /[(2 −α)(1 −α)Kα] satisfying the fluctuation–dissipation theorem. Its solution shows
that FLE motion is ballistic, δ2(1)∼12, below the momentum relaxation time and becomessubdiffusive, δ2(1)∼1α (0< α < 1), in the overdamped limit [41, 42]. In this limit thestochastic behaviour of FLE motion is equivalent to subdiffusive fractional Brownianmotion [27, 41], where the subdiffusion is characterized by its anti-persistent motion, i.e.⟨
dx(t)dt
dx(t ′)dt ′
⟩∼ α(α− 1)|t − t ′
|α−2. It is known that the FLE-like ergodic anomalous diffusion can
arise in a viscoelastic medium due to the memory effect [59, 60].Confined FLE motion has the TA MSD [32]
δ2(1)= 2〈x2〉th
(1 − Eα
[−
k
γ0(1 −α)1α
])(8)
in the overdamped limit. Eα(z)=∑
∞
i=0 zi/0(1 +αi) is the Mittag–Leffler function and 0(z)is the gamma function. At short lag times we thus observe free, ergodic anomalous diffusionδ2(1)'1α. It can be shown that in the long-time limit the TA MSD is simplified to [32]
δ2(1)∼ 2〈x2〉th
(1 −
γ
k1α
). (9)
Therefore, a power-law decay of the relaxation profile to the stationary plateau δ2(1)→ 2〈x2〉th
is expected for FLE-like anomalous diffusion, in contrast to the exponential relaxation (4)observed for Brownian diffusion and the power-law growth of the TA MSD (6) for CTRW.
3. Results
We first discuss the results of the optical tweezers tracking setup, which covers the time rangefrom sub-milliseconds to seconds, before turning to video tracking in the time window fromhundreds of milliseconds to some 100 seconds. These complementary techniques thus provideinformation on the particle motion over more than six decades in time. Moreover, we obtainvaluable insight into the relaxation behaviour of the tracer in the harmonic trap of the opticaltweezer.
3.1. Short-time confined motion measured by optical tweezers
The tracking data from the optical tweezers setup allows us to study the turnover from free toconfined motion of individual polystyrene beads immersed in the worm-like micellar solution.Figure 1 illustrates the TA MSD curves (2) of ten individual beads of diameters d = 0.52µm(green), 0.96µm (red) and 2.5µm (blue) at 1 wt% concentration of worm-like micelles. Inthe figure the thick black lines represent the trajectory-to-trajectory average 〈δ2(1)〉 from tenindividual TA MSD curves for each bead size. Clearly for all three groups of curves individualTA MSDs δ2(1) nicely follow the trend given by the average behaviour. At the same time,we observe some moderate trajectory-to-trajectory amplitude scatter in each group of data. Thescatter in δ2 appears to increase with the bead size.
As we show, the immersed beads illustrate anomalous confined motion, which cannot beexplained by the simple picture of a corralled Brownian particle, i.e. a Brownian particle underconfinement. To see this, we note that for short lag times of the order of 0.1 ms, when the beadsare not yet influenced by the restoring force of the optical tweezers, the TA MSDs exhibit the
New Journal of Physics 15 (2013) 045011 (http://www.njp.org/)
8
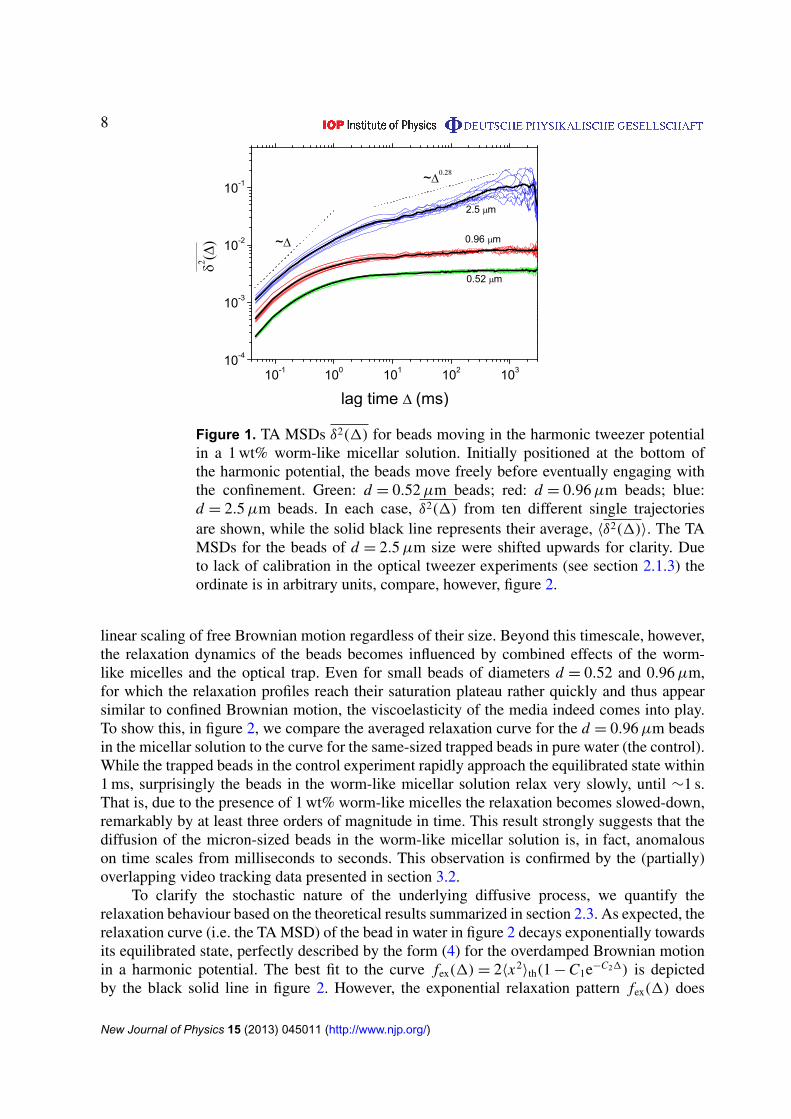
Figure 1. TA MSDs δ2(1) for beads moving in the harmonic tweezer potentialin a 1 wt% worm-like micellar solution. Initially positioned at the bottom ofthe harmonic potential, the beads move freely before eventually engaging withthe confinement. Green: d = 0.52µm beads; red: d = 0.96µm beads; blue:d = 2.5µm beads. In each case, δ2(1) from ten different single trajectoriesare shown, while the solid black line represents their average, 〈δ2(1)〉. The TAMSDs for the beads of d = 2.5µm size were shifted upwards for clarity. Dueto lack of calibration in the optical tweezer experiments (see section 2.1.3) theordinate is in arbitrary units, compare, however, figure 2.
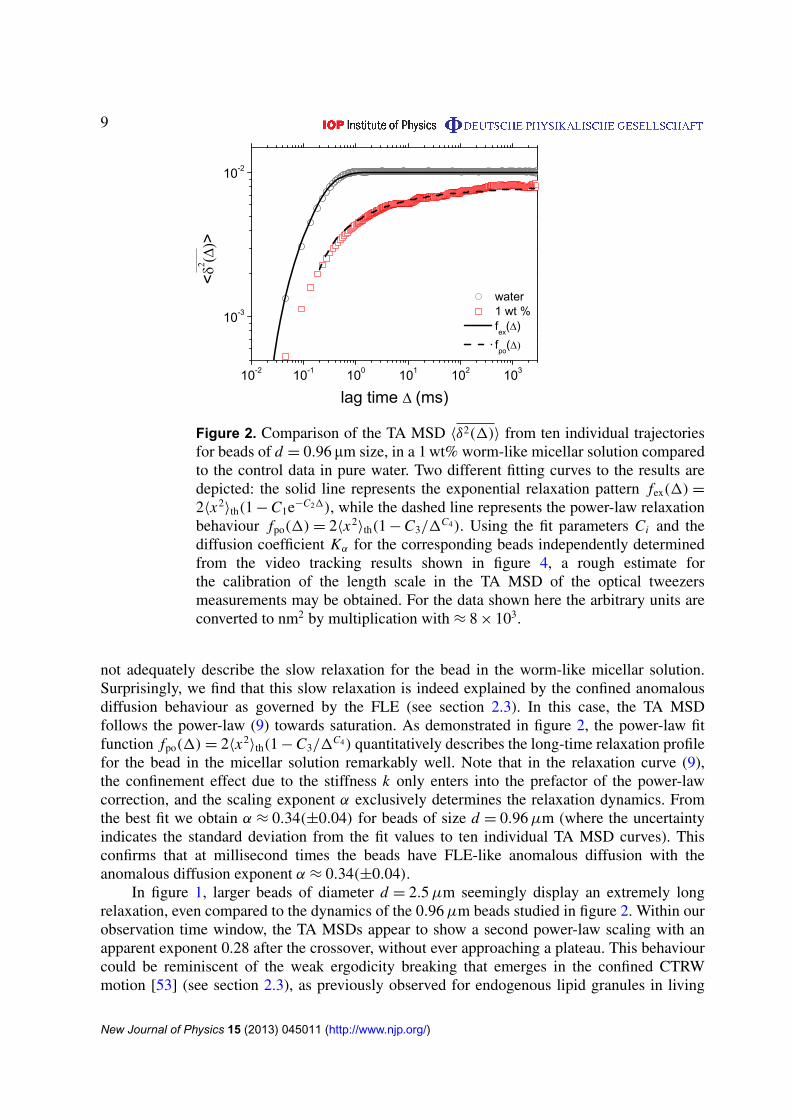
linear scaling of free Brownian motion regardless of their size. Beyond this timescale, however,the relaxation dynamics of the beads becomes influenced by combined effects of the worm-like micelles and the optical trap. Even for small beads of diameters d = 0.52 and 0.96µm,for which the relaxation profiles reach their saturation plateau rather quickly and thus appearsimilar to confined Brownian motion, the viscoelasticity of the media indeed comes into play.To show this, in figure 2, we compare the averaged relaxation curve for the d = 0.96µm beadsin the micellar solution to the curve for the same-sized trapped beads in pure water (the control).While the trapped beads in the control experiment rapidly approach the equilibrated state within1 ms, surprisingly the beads in the worm-like micellar solution relax very slowly, until ∼1 s.That is, due to the presence of 1 wt% worm-like micelles the relaxation becomes slowed-down,remarkably by at least three orders of magnitude in time. This result strongly suggests that thediffusion of the micron-sized beads in the worm-like micellar solution is, in fact, anomalouson time scales from milliseconds to seconds. This observation is confirmed by the (partially)overlapping video tracking data presented in section 3.2.
To clarify the stochastic nature of the underlying diffusive process, we quantify therelaxation behaviour based on the theoretical results summarized in section 2.3. As expected, therelaxation curve (i.e. the TA MSD) of the bead in water in figure 2 decays exponentially towardsits equilibrated state, perfectly described by the form (4) for the overdamped Brownian motionin a harmonic potential. The best fit to the curve fex(1)= 2〈x2
〉th(1 − C1e−C21) is depictedby the black solid line in figure 2. However, the exponential relaxation pattern fex(1) does
New Journal of Physics 15 (2013) 045011 (http://www.njp.org/)
9
Figure 2. Comparison of the TA MSD 〈δ2(1)〉 from ten individual trajectoriesfor beads of d = 0.96 lm size, in a 1 wt% worm-like micellar solution comparedto the control data in pure water. Two different fitting curves to the results aredepicted: the solid line represents the exponential relaxation pattern fex(1)=
2〈x2〉th(1 − C1e−C21), while the dashed line represents the power-law relaxation
behaviour fpo(1)= 2〈x2〉th(1 − C3/1
C4). Using the fit parameters Ci and thediffusion coefficient Kα for the corresponding beads independently determinedfrom the video tracking results shown in figure 4, a rough estimate forthe calibration of the length scale in the TA MSD of the optical tweezersmeasurements may be obtained. For the data shown here the arbitrary units areconverted to nm2 by multiplication with ≈ 8 × 10³.
not adequately describe the slow relaxation for the bead in the worm-like micellar solution.Surprisingly, we find that this slow relaxation is indeed explained by the confined anomalousdiffusion behaviour as governed by the FLE (see section 2.3). In this case, the TA MSDfollows the power-law (9) towards saturation. As demonstrated in figure 2, the power-law fitfunction fpo(1)= 2〈x2
〉th(1 − C3/1C4) quantitatively describes the long-time relaxation profile
for the bead in the micellar solution remarkably well. Note that in the relaxation curve (9),the confinement effect due to the stiffness k only enters into the prefactor of the power-lawcorrection, and the scaling exponent α exclusively determines the relaxation dynamics. Fromthe best fit we obtain α ≈ 0.34(±0.04) for beads of size d = 0.96µm (where the uncertaintyindicates the standard deviation from the fit values to ten individual TA MSD curves). Thisconfirms that at millisecond times the beads have FLE-like anomalous diffusion with theanomalous diffusion exponent α ≈ 0.34(±0.04).
In figure 1, larger beads of diameter d = 2.5µm seemingly display an extremely longrelaxation, even compared to the dynamics of the 0.96µm beads studied in figure 2. Within ourobservation time window, the TA MSDs appear to show a second power-law scaling with anapparent exponent 0.28 after the crossover, without ever approaching a plateau. This behaviourcould be reminiscent of the weak ergodicity breaking that emerges in the confined CTRWmotion [53] (see section 2.3), as previously observed for endogenous lipid granules in living
New Journal of Physics 15 (2013) 045011 (http://www.njp.org/)
10
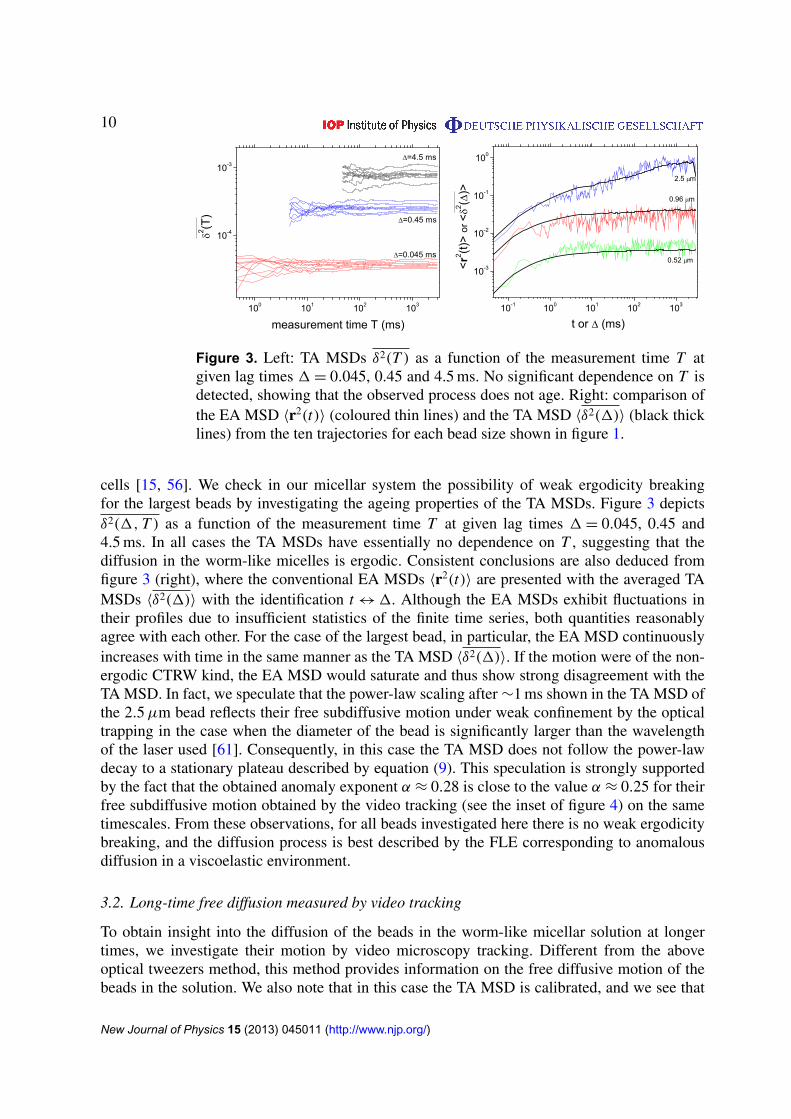
Figure 3. Left: TA MSDs δ2(T ) as a function of the measurement time T atgiven lag times 1= 0.045, 0.45 and 4.5 ms. No significant dependence on T isdetected, showing that the observed process does not age. Right: comparison ofthe EA MSD 〈r2(t)〉 (coloured thin lines) and the TA MSD 〈δ2(1)〉 (black thicklines) from the ten trajectories for each bead size shown in figure 1.
cells [15, 56]. We check in our micellar system the possibility of weak ergodicity breakingfor the largest beads by investigating the ageing properties of the TA MSDs. Figure 3 depictsδ2(1, T ) as a function of the measurement time T at given lag times 1= 0.045, 0.45 and4.5 ms. In all cases the TA MSDs have essentially no dependence on T , suggesting that thediffusion in the worm-like micelles is ergodic. Consistent conclusions are also deduced fromfigure 3 (right), where the conventional EA MSDs 〈r2(t)〉 are presented with the averaged TAMSDs 〈δ2(1)〉 with the identification t ↔1. Although the EA MSDs exhibit fluctuations intheir profiles due to insufficient statistics of the finite time series, both quantities reasonablyagree with each other. For the case of the largest bead, in particular, the EA MSD continuouslyincreases with time in the same manner as the TA MSD 〈δ2(1)〉. If the motion were of the non-ergodic CTRW kind, the EA MSD would saturate and thus show strong disagreement with theTA MSD. In fact, we speculate that the power-law scaling after ∼1 ms shown in the TA MSD ofthe 2.5µm bead reflects their free subdiffusive motion under weak confinement by the opticaltrapping in the case when the diameter of the bead is significantly larger than the wavelengthof the laser used [61]. Consequently, in this case the TA MSD does not follow the power-lawdecay to a stationary plateau described by equation (9). This speculation is strongly supportedby the fact that the obtained anomaly exponent α ≈ 0.28 is close to the value α ≈ 0.25 for theirfree subdiffusive motion obtained by the video tracking (see the inset of figure 4) on the sametimescales. From these observations, for all beads investigated here there is no weak ergodicitybreaking, and the diffusion process is best described by the FLE corresponding to anomalousdiffusion in a viscoelastic environment.
3.2. Long-time free diffusion measured by video tracking
To obtain insight into the diffusion of the beads in the worm-like micellar solution at longertimes, we investigate their motion by video microscopy tracking. Different from the aboveoptical tweezers method, this method provides information on the free diffusive motion of thebeads in the solution. We also note that in this case the TA MSD is calibrated, and we see that
New Journal of Physics 15 (2013) 045011 (http://www.njp.org/)
11
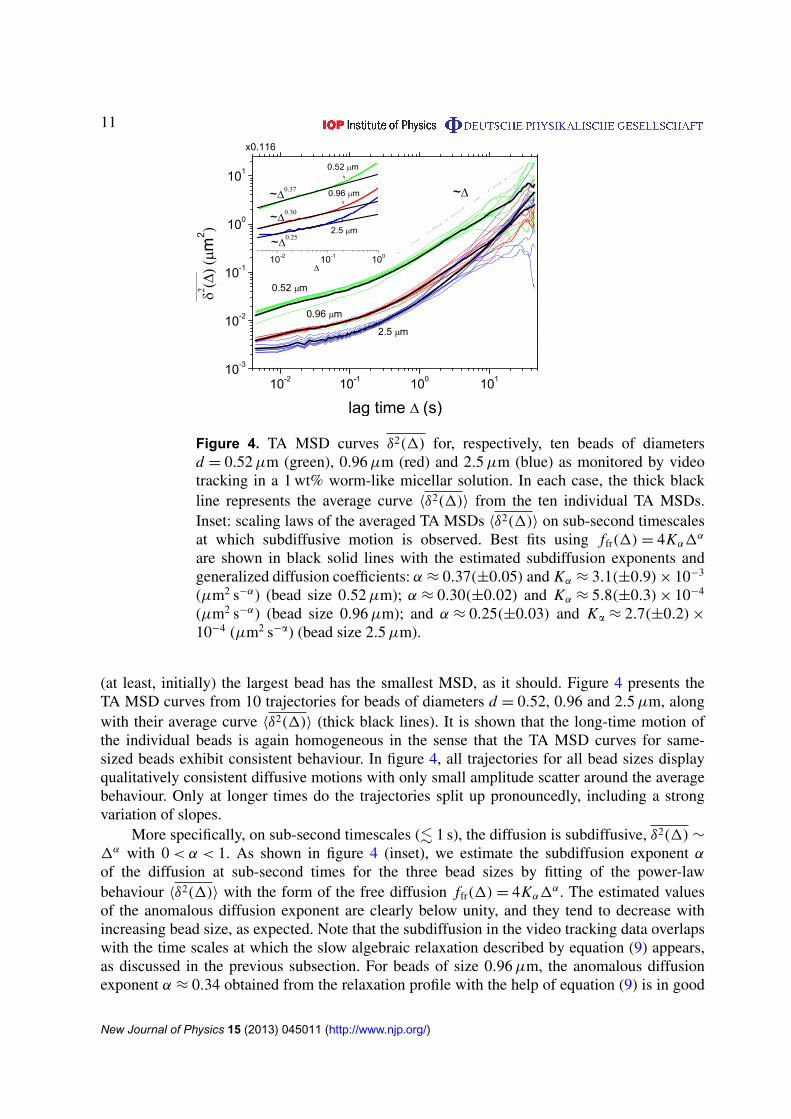
Figure 4. TA MSD curves δ2(1) for, respectively, ten beads of diametersd = 0.52µm (green), 0.96µm (red) and 2.5µm (blue) as monitored by videotracking in a 1 wt% worm-like micellar solution. In each case, the thick blackline represents the average curve 〈δ2(1)〉 from the ten individual TA MSDs.Inset: scaling laws of the averaged TA MSDs 〈δ2(1)〉 on sub-second timescalesat which subdiffusive motion is observed. Best fits using ffr(1)= 4Kα1
α
are shown in black solid lines with the estimated subdiffusion exponents andgeneralized diffusion coefficients: α ≈ 0.37(±0.05) and Kα ≈ 3.1(±0.9)× 10−3
(µm2 s−α) (bead size 0.52µm); α ≈ 0.30(±0.02) and Kα ≈ 5.8(±0.3)× 10−4
(µm2 s−α) (bead size 0.96µm); and α ≈ 0.25(±0.03) and Ka ≈ 2.7(±0.2)×10−4 (µm2 s−a) (bead size 2.5µm).
(at least, initially) the largest bead has the smallest MSD, as it should. Figure 4 presents theTA MSD curves from 10 trajectories for beads of diameters d = 0.52, 0.96 and 2.5µm, alongwith their average curve 〈δ2(1)〉 (thick black lines). It is shown that the long-time motion ofthe individual beads is again homogeneous in the sense that the TA MSD curves for same-sized beads exhibit consistent behaviour. In figure 4, all trajectories for all bead sizes displayqualitatively consistent diffusive motions with only small amplitude scatter around the averagebehaviour. Only at longer times do the trajectories split up pronouncedly, including a strongvariation of slopes.
More specifically, on sub-second timescales (. 1 s), the diffusion is subdiffusive, δ2(1)∼
1α with 0< α < 1. As shown in figure 4 (inset), we estimate the subdiffusion exponent αof the diffusion at sub-second times for the three bead sizes by fitting of the power-lawbehaviour 〈δ2(1)〉 with the form of the free diffusion ffr(1)= 4Kα1
α. The estimated valuesof the anomalous diffusion exponent are clearly below unity, and they tend to decrease withincreasing bead size, as expected. Note that the subdiffusion in the video tracking data overlapswith the time scales at which the slow algebraic relaxation described by equation (9) appears,as discussed in the previous subsection. For beads of size 0.96µm, the anomalous diffusionexponent α ≈ 0.34 obtained from the relaxation profile with the help of equation (9) is in good
New Journal of Physics 15 (2013) 045011 (http://www.njp.org/)
12
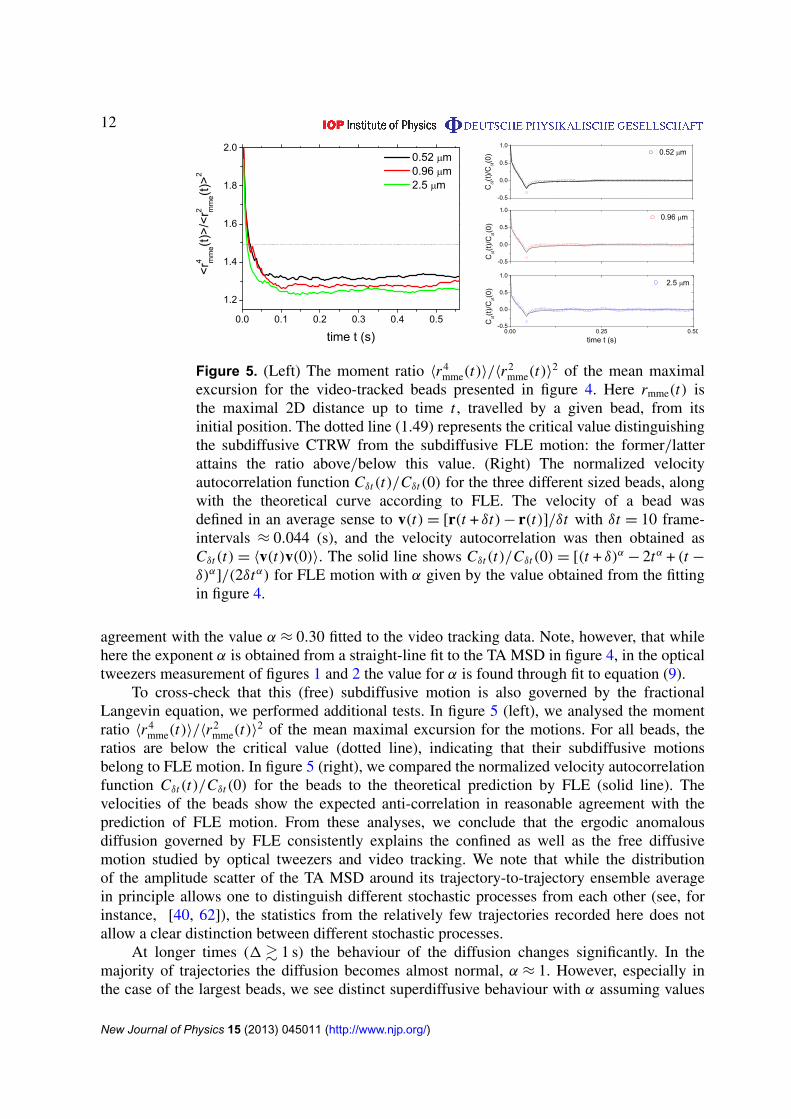
Figure 5. (Left) The moment ratio 〈r 4mme(t)〉/〈r
2mme(t)〉
2 of the mean maximalexcursion for the video-tracked beads presented in figure 4. Here rmme(t) isthe maximal 2D distance up to time t , travelled by a given bead, from itsinitial position. The dotted line (1.49) represents the critical value distinguishingthe subdiffusive CTRW from the subdiffusive FLE motion: the former/latterattains the ratio above/below this value. (Right) The normalized velocityautocorrelation function Cδt(t)/Cδt(0) for the three different sized beads, alongwith the theoretical curve according to FLE. The velocity of a bead wasdefined in an average sense to v(t)= [r(t + δt)− r(t)]/δt with δt = 10 frame-intervals ≈ 0.044 (s), and the velocity autocorrelation was then obtained asCδt(t)= 〈v(t)v(0)〉. The solid line shows Cδt(t)/Cδt(0)= [(t + δ)α − 2tα + (t −
δ)α]/(2δtα) for FLE motion with α given by the value obtained from the fittingin figure 4.
agreement with the value α ≈ 0.30 fitted to the video tracking data. Note, however, that whilehere the exponent α is obtained from a straight-line fit to the TA MSD in figure 4, in the opticaltweezers measurement of figures 1 and 2 the value for α is found through fit to equation (9).
To cross-check that this (free) subdiffusive motion is also governed by the fractionalLangevin equation, we performed additional tests. In figure 5 (left), we analysed the momentratio 〈r 4
mme(t)〉/〈r2mme(t)〉
2 of the mean maximal excursion for the motions. For all beads, theratios are below the critical value (dotted line), indicating that their subdiffusive motionsbelong to FLE motion. In figure 5 (right), we compared the normalized velocity autocorrelationfunction Cδt(t)/Cδt(0) for the beads to the theoretical prediction by FLE (solid line). Thevelocities of the beads show the expected anti-correlation in reasonable agreement with theprediction of FLE motion. From these analyses, we conclude that the ergodic anomalousdiffusion governed by FLE consistently explains the confined as well as the free diffusivemotion studied by optical tweezers and video tracking. We note that while the distributionof the amplitude scatter of the TA MSD around its trajectory-to-trajectory ensemble averagein principle allows one to distinguish different stochastic processes from each other (see, forinstance, [40, 62]), the statistics from the relatively few trajectories recorded here does notallow a clear distinction between different stochastic processes.
At longer times (1& 1 s) the behaviour of the diffusion changes significantly. In themajority of trajectories the diffusion becomes almost normal, α ≈ 1. However, especially inthe case of the largest beads, we see distinct superdiffusive behaviour with α assuming values
New Journal of Physics 15 (2013) 045011 (http://www.njp.org/)
13
above 1, albeit not for all of the trajectories. The observed superdiffusion persists up to the endof the measured time window, and the largest beads even become absolutely faster than thesmallest beads.
4. Discussion
In this work, we investigated the diffusive behaviour of micron-sized beads immersed inaqueous solutions of worm-like micelles based on single-trajectory analyses using opticaltweezers and video tracking setups. Our motivation is to obtain insight into the diffusion incomplex fluids, in particular, crowded media. To perform experiments in controllable artificialenvironments is vital towards understanding the even more complex environment inside livingbiological cells. While we here obtain results at shorter times that are consistent with the motionin viscoelastic media, the bivariate behaviour (normal versus superdiffusion) at longer times toour knowledge has not been observed in this context.
At very short times (sub-millisecond) the observed beads perform normal Browniandiffusion. This could simply mean that the motion of the beads in the relatively low micelleconcentration of 1 wt% is not yet hindered and corresponds to the motion in a simple liquid. Onthe range of milliseconds the motion turns anomalous, with subdiffusion exponents of the orderof α ≈ 0.3 for all observed beads. This subdiffusion was shown to be consistently describedwith the motion in a viscoelastic environment as described by the FLE. Finally, at around 1 sthe motion accelerates and becomes Brownian or even superdiffusive. The latter occurs mainlyfor the largest beads.
In early studies based on diffusing wave spectroscopy [30, 31], diffusion in worm-likemicellar solutions was interpreted such that the micron-sized beads perform confined Brownianmotion on time scales from sub-milliseconds to milliseconds (as described by the form (4)).After entrapment in their ‘cage’, at longer times in the second range the stuck beads againperform Brownian motion, such that the worm-like micelle system behaves like a simple liquid.Based on this interpretation, the obtained EA MSD curve was described by the functional form
〈r2(t)〉 = 6R2(1 − e−(K0t/R2)β )1/β(
1 +Km
R2t
)(10)
where K0 and Km are, respectively, the microscopic (short-time) and macroscopic (long-time)diffusion constants of the beads, and R is the effective size of the cage. In this expression,the additional fitting exponent β was introduced to account for the subdiffusive scaling in theintermediate time scale, which is not explained within the scheme of ordinary Brownian motion.
However, our study based on single-particle tracking experiments convincingly shows thatsuch simple corralled Brownian motion is not an appropriate scenario for the observed diffusion.On time scales at which the system is viscoelastic, the diffusion should rather be understood asanomalous diffusion governed by the FLE. This is highlighted in the relaxation dynamics of thebeads trapped by optical tweezers. For beads immersed in the worm-like micellar solution, therelaxation curve shows a distinct power-law-like decay lasting over several decades in time, aspredicted previously for confined FLE motion [32]. This slow, anomalous relaxation partiallyoverlaps with the measured free anomalous diffusion in the video tracking experiments. Wenote that while we identify FLE as the best known stochastic model for bead motion on theobserved time scales, it cannot explain the free Brownian motion of beads at shorter timesand the coupled Brownian motion of beads and micelles at longer times. A complete model will
New Journal of Physics 15 (2013) 045011 (http://www.njp.org/)
14
incorporate these two regimes and the respective turnovers. However, such a model is not withinthe scope of this study.
Importantly, our experiments suggest that the viscoelastic property of the media indeedleads to FLE-like anomalous diffusion for the embedded particle, characterized by algebraicallydecaying spatial correlations of random displacements and ergodicity. Although there are someclues that the FLE-like anomalous diffusion is closely connected to the viscoelasticity [13, 22],to the best of our knowledge, a systematic study is presented here for the first time showingexperimental evidence for the power-law relaxation dynamics of the TA MSD. Thus, whilefree anomalous motion governed by the FLE is ergodic and 〈r2(1)〉 = 〈δ2(1)〉, when the testparticle engages with the confinement this equivalence is (transiently) broken. This has profoundconsequences for the interpretation of the dynamic relaxation in the presence of confinement andthe related time scale(s).
What can we say about the occurrence of normal and superdiffusive motion at longer times?While at the moment we do not have conclusive evidence, we may speculate that the smallerbeads experience a regular liquid-like environment, in which they exhibit normal diffusion. Thiscould indeed be related to the depolymerization/polymerization of the micelle aggregates. If onaverage the micelle aggregates rearrange such that there are sufficiently large holes, the smallerbeads may be able to move more isotropically and homogeneously, similar to smaller beads incross-linked actin meshes [63]. The superdiffusion of larger beads may be closely related tothe self-recombination of worm-like micelles in the diffusion-controlled regime, during whichfragmented worm-like micelles tend to recombine with their original partners [33, 64, 65]. Theinduced longitudinal stress may lead to the superdiffusion of a bead beyond a certain size whenit has no way to escape from its cage and thus moves along with the recombining micelles.However, this effect clearly needs more detailed investigation. We note that for superdiffusiveprocesses, finite T-effects may cause a wide spread of the apparent slopes of the TA MSD [66].This observation may indicate that a significant fraction of the trajectories of larger beads areindeed superdiffusive.
What can we learn with respect to the diffusion of intracellular particles in living cellsfrom our experiments? We saw previously with the same experimental tools that in vivo anom-alous diffusion of lipid granules in fission yeast [15] and human cells [56] shows CTRW-likemotion characterized by weak ergodicity breaking. These granules are of a size comparable tothe polystyrene beads used here. Due to the complexity of intracellular environments, it is chal-lenging to deduce the origin of weak ergodicity breaking. Our present study suggests that theviscoelasticity of the cytoplasmic fluid alone may not be sufficient to explain the observed mo-tion, and that either molecular shapes, physical properties specific to the crowding environment,or even various nonspecific interactions may well play a crucial role. Also, previous investiga-tions [67] have shown that the cellular metabolism exerts a major influence on transport mech-anisms inside living cells. Hence, the absence of metabolism in in vitro networks may explaincertain differences in the anomalous diffusion observed between in vitro and in vivo systems.
Finally, we note that our approach using complementary measurement methods providesa significant advantage. While conventional video tracking delivers information about the freemotion over quite a large time window, optical tweezers tracking allows access to shorter timescales and finer spatial resolution. At the same time we also obtain additional information.As shown here the relaxation dynamics to the thermal value of the MSD delivers significantinformation, in the present case allowing us to decide in favour of the FLE dynamics ofviscoelastic diffusion from the observed power-law relaxation.
New Journal of Physics 15 (2013) 045011 (http://www.njp.org/)

15
Acknowledgments
We acknowledge funding from the Lundbeck Foundation Center for Biomembranes inNanomedicine (CBN) and the Academy of Finland within the Finland Distinguished Professor(FiDiPro) programme.
References
[1] Brown R 1828 Phil. Mag. 4 161[2] Perrin J 1909 Ann. Chim. Phys. 18 1[3] Nordlund I 1914 Z. Phys. Chem. 87 40[4] Brauchle C, Lamb D and Michaelis J 2010 Single Particle Tracking and Single Molecule Energy Transfer
(Weinheim: Wiley-VCH)[5] Xie X S, Choi P J, Li G-W, Lee N K and Lia G 2008 Ann. Rev. Biophys. 37 417[6] Zimmermann S B and Trach S O 1991 J. Mol. Biol. 222 599[7] Ellis R J and Minton A P 2003 Nature 425 27[8] McGuffee S R and Elcock A H 2010 PLoS Comput. Biol. 6 e1000694[9] Bouchaud J-P and Georges A 1990 Phys. Rep. 195 127
[10] Metzler R and Klafter J 2000 Phys. Rep. 339 1[11] Metzler R and Klafter J 2004 J. Phys. A: Math. Gen. 37 R161[12] Golding I and Cox E C 2006 Phys. Rev. Lett. 96 098102[13] Weber S, Spakowitz A J and Theriot J A 2010 Phys. Rev. Lett. 104 238102[14] Caspi A, Granek R and Elbaum M 2000 Phys. Rev. Lett. 85 5655[15] Jeon J-H, Tejedor V, Burov S, Barkai E, Selhuber-Unkel C, Berg-Sørensen K, Oddershede L and Metzler R
2011 Phys. Rev. Lett. 106 048103[16] Seisenberger G, Ried M U, Endreß T, Buning H, Hallek M and Brauchle C 2001 Science 294 1929[17] Bronstein I, Israel Y, Kepten E, Mai S, Shav-Tal Y, Barkai E and Garini Y 2009 Phys. Rev. Lett. 103 018102[18] Weiss M, Elsner M, Kartberg F and Nilsson T 2004 Biophys. J. 87 3518[19] Vercamman J, Martens G and Engelborghs Y 2007 Springer Ser. Fluoresc. 4 323[20] Banks D and Fradin C 2005 Biophys. J. 89 2960[21] Pan W, Fibelo L, Pham N D Q, Galin O, Uzunova V V and Vekilov P G 2009 Phys. Rev. Lett. 102 058101[22] Szymanski J and Weiss M 2009 Phys. Rev. Lett. 103 038102[23] Weiss M, Hashimoto H and Nilsson T 2003 Biophys. J. 84 4043[24] Weigel A V, Simon B, Tamkun M M and Krapf D 2011 Proc. Natl Acad. Sci. USA 108 6438[25] Kneller G R, Baczynski K and Pasenkiewicz-Gierula M 2011 J. Chem. Phys. 135 141105[26] Akimoto T, Yamamoto E, Yasuoja K, Hirano Y and Yasui M 2011 Phys. Rev. Lett. 107 178103[27] Jeon J-H, Martinez-Seara Monne H, Javanainen M and Metzler R 2012 Phys. Rev. Lett. 109 188103[28] Javanainen M, Hammaren H, Monticelli L, Jeon J-H, Metzler R and Vattulainen I 2013 Faraday Discuss.
161 397[29] Dreiss C A 2007 Soft Matter 3 956[30] Galvan-Miyoshi J, Delgado J and Castillo R 2008 Eur. Phys. J. E 26 369[31] Bellour M, Skouri M, Munch J-P and Hebraud P 2002 Eur. Phys. J. E 8 431[32] Jeon J-H and Metzler R 2012 Phys. Rev. E 85 021147[33] Ott A, Bouchaud J-P, Langevin D and Urbakh W 1990 Phys. Rev. Lett. 65 2201[34] Buchanan M, Atakhorrami M, Palierne J F and Schmidt C F 2005 Macromolecules 38 8840[35] Peterman E, Gittes F and Schmidt C F 2003 Biophys. J. 84 1308[36] Bendix P M, Reihani S N S and Oddershede L B 2010 ACS Nano 4 2256[37] Richardson A C, Reihani S N S and Oddershede L B 2008 Opt. Express 16 15709[38] Sbalzarini I F and Koumoutsakos P 2005 J. Struct. Biol. 151 182
New Journal of Physics 15 (2013) 045011 (http://www.njp.org/)
16
[39] Barkai E, Garini Y and Metzler R 2012 Phys. Today 65 29[40] Burov S, Jeon J-H, Metzler R and Barkai E 2011 Phys. Chem. Chem. Phys. 13 1800[41] Deng W and Barkai E 2009 Phys. Rev. E 79 011112[42] Jeon J-H and Metzler R 2010 Phys. Rev. E 81 021103[43] Montroll E W and Weiss G H 1965 J. Math. Phys. 6 167[44] Scher H and Montroll E W 1975 Phys. Rev. B 12 2455[45] Lubelski A, Sokolov I M and Klafter J 2008 Phys. Rev. Lett. 100 250602[46] He Y, Burov S, Metzler R and Barkai E 2008 Phys. Rev. Lett. 101 058101[47] Sokolov I M, Heinsalu E, Hanggi P and Goychuk I 2009 Europhys. Lett. 86 30009[48] Boyer D, Dean D S, Mejıa-Monasterio C and Oshanin G 2012 Phys. Rev. E 85 031136[49] Bouchaud J-P 1992 J. Phys. I 2 1705[50] Bel G and Barkai E 2005 Phys. Rev. Lett. 94 240602[51] Rebenshtok A and Barkai E 2007 Phys. Rev. Lett. 99 210601[52] Lomholt M A, Zaid I M and Metzler R 2007 Phys. Rev. Lett. 98 200603[53] Burov S, Metzler R and Barkai E 2010 Proc. Natl Acad. Sci. USA 107 13228[54] Tejedor V, Benichou O, Voituriez R, Jungmann R, Simmel F, Selhuber-Unkel C, Oddershede L and Metzler
R 2010 Biophys. J. 98 1364[55] Magdziarz M, Weron A, Burnecki K and Klafter J 2009 Phys. Rev. Lett. 103 180602[56] Leijnse N, Jeon J-H, Loft S, Metzler R and Oddershede LB 2012 Eur. Phys. J. Spec. Top. 204 75[57] Schulz J H P, Barkai E and Metzler R 2013 Phys. Rev. Lett. 110 020602[58] Lutz E 2001 Phys. Rev. E 64 051106[59] Goychuk I 2009 Phys. Rev. E 80 046125[60] Sokolov I M 2012 Soft Matter 8 9043[61] Rohrbach A 2005 Phys. Rev. Lett. 95 168102[62] Jeon J H and Metzler R 2010 J. Phys. A 43 252001[63] Wong I Y, Gardel M L, Reichman D R, Weeks E R, Valentine M T, Bausch A R and Weitz D A 2004 Phys.
Rev. Lett. 92 178101[64] Ganapathy R, Sood A K and Ramaswamy S 2007 Europhys. Lett. 77 18007[65] Angelico R, Ceglie A, Olsson U, Palazzo G and Ambrosone L 2006 Phys. Rev. E 74 031403[66] Godec A and Metzler R 2013 Phys. Rev. Lett. 110 020603[67] Winther T, Xu L, Berg-Sørensen K, Brown S and Oddershede LB 2009 Biophys. J. 97 1
New Journal of Physics 15 (2013) 045011 (http://www.njp.org/)