Embed Size (px)
Citation preview

August 22, 2014 Dear Parents/Community Members of Cornerstone Health+ Technology High School,
We are pleased to present you with the Annual Education Report (AER) which provides key information on the 2013-2014 educational progress for Cornerstone Charter Health High. The AER addresses the complex reporting information required by Federal and State laws. The school’s report contains information about student assessment, accountability and teacher quality. If you have any questions about the AER, please contact Mr. Michael Griffie, Principal, for assistance at the phone number below.
The AER is available for you to review electronically by visiting the following web site:
http://www.cornerstonecharters.org/pdfs/hhs/AnnualEducationReport_CHS.pdf or you may review a copy in the Main office.
The state has identified some schools with the status of Reward, Focus or Priority. A “Reward School” is one that is outperforming other schools in achievement growth, or is performing better than other schools with a similar student population. A “Focus School” is one that has a large achievement gap in 30% of its student achievement scores. A “Priority School” is one whose achievement and growth is in the lowest 5% of all schools in the state.
Cornerstone Health+ Technology High School has not been given one of these labels. The school is taking the following steps to accelerate student achievement:
1. Continue to analyze demographic, perception, student achievement, and program and process data to identify areas of need. 2. Differentiate instruction for all students. 3. Provide additional instructional support for students at-risk of not meeting challenging State standards through small group or one-on-one instruction and extended learning time beyond regular school hours, including after school and summer. 4. Provide additional instructional support for students at-risk of not meeting challenging State standards through providing high quality, on-going professional development for teachers and support staff.
Process of Assigning Pupils: Cornerstone Health + Technology High School is a state-funded, public school academy. Therefore, there is no cost to attend the Academy. The school is open to any child wishing to attend. Students must be age-appropriate for their respective grade, and they must reside in the state of Michigan. By law, the school cannot restrict enrollment based on selection criteria. The school can, however, limit the total number of students who may attend the school. If the number of applications exceeds the number of offered seats, a random selection process will determine who attends the school. Status of School Improvement Plan: Over the past two years we are proud of the many successes that we have had at Cornerstone Health + Technology High School. Our student population continued to grow and expand through the open enrollment/lottery procedure. Our School Improvement Plan (SIP) has been accepted by the State of Michigan as a good model for improvement. Via our data-driven SIP we will address our challenges in student achievement/gaps and overall customer satisfaction.

Description of our school: This is a new high school experience unlike any other. Cornerstone Health + Technology High School was created from the ground up, in partnership with industry experts like the Detroit Medical Center and Beaumont Hospital, along with Technology leaders in the area, to combine the best of individualized instruction, blended learning, and real-world experiences. Cornerstone Health + Technology High School delivers a rigorous college-prep curriculum while ensuring relevance to current and future demands of career options in the health care industry.
Curriculum: Cornerstone Health + Technology High School’s rigorous instructional program is aligned with Michigan’s Common Core State Standards and is established for K-12 in English Language Arts and Literacy in History, Social Studies, and Mathematics. The Common Core Standards can be accessed via internet at www.corestandards.org Cornerstone Health + Technology High School uses the Curriculum Trak as a tool for its entire curriculum mapping & aligning and a copy of curriculum is available in the main office.
NWEA- MAP Scores: One-hundred percent of our instructional staff are highly qualified
and certified in their area of specialty Cornerstone Charter Health + Technology High School didn’t have any NWEA MAP scores to report for 2012-13.
Parent-Teacher Conferences: We have an active and engaged Parent Teacher Organization and a very good turnout for the Parent-Teacher Conferences.
Parent Teacher Conference
Attendance
Percentage attended
Conference 2013-14 2012-2013
Fall 94 95
Winter 90 95
Spring 90 97
Average 91 96
For Cornerstone Charter Health + Technology High School:
THE NUMBER AND PERCENT OF POSTSECONDARY ENROLLMENTS (DUAL ENROLLMENT):
None
THE NUMBER OF COLLEGE EQUIVALENT COURSES OFFERED (AP/IB): None
THE NUMBER AND PERCENTAGE OF STUDENTS ENROLLED IN COLLEGE EQUIVALENT
COURSES (AP/IB): None
THE NUMBER AND PERCENTAGE OF STUDENTS RECEIVING A SCORE LEADING TO COLLEGE
CREDIT: None
We at Cornerstone Health + Technology High School are pleased with the growth that our school has made and we will continue to strive to improve upon that success. Sincerely, Michael Griffie, Principal

08/22/2014
Annual Education ReportCornerstone Health School
Michigan Educational Assessment Program (MEAP)
Subject Grade Testing Group School Year State %StudentsProficient
District %StudentsProficient
% Advanced(Level 1)
% Proficient(Level 2)
% PartiallyProficient (Level3)
% Not Proficient(Level 4)
No Data to Display
Page 1 of A service of the Center for Educational Performance and Information21

08/22/2014
Annual Education ReportCornerstone Health School
Michigan Merit Examination (MME)
Subject Grade Testing Group School Year State %StudentsProficient
District %StudentsProficient
% Advanced(Level 1)
% Proficient(Level 2)
% PartiallyProficient (Level3)
% Not Proficient(Level 4)
No Data to Display
Page 2 of A service of the Center for Educational Performance and Information21

08/22/2014
Annual Education ReportCornerstone Health School
Michigan Educational Assessment Program Access (MEAP - Access)
Subject Grade Testing Group School Year State % StudentsProficient
District % StudentsProficient
% Exceeded % Met % Progressing
No Data to Display
Page 3 of A service of the Center for Educational Performance and Information21

08/22/2014
Annual Education ReportCornerstone Health School
MI-Access Functional Independence
Subject Grade Testing Group School Year State % StudentsProficient
District % StudentsProficient
% Surpassed(Level 1)
% Attained (Level2)
% Emerging (Level3)
No Data to Display
Page 4 of A service of the Center for Educational Performance and Information21

08/22/2014
Annual Education ReportCornerstone Health School
MI-Access Supported Independence
Subject Grade Testing Group School Year State % StudentsProficient
District % StudentsProficient
% Surpassed(Level 1)
% Attained (Level2)
% Emerging (Level3)
No Data to Display
Page 5 of A service of the Center for Educational Performance and Information21

08/22/2014
Annual Education ReportCornerstone Health School
MI-Access Participation
Subject Grade Testing Group School Year State % StudentsProficient
District % StudentsProficient
% Surpassed(Level 1)
% Attained (Level2)
% Emerging (Level3)
No Data to Display
Page 6 of A service of the Center for Educational Performance and Information21
08/22/2014
Annual Education ReportCornerstone Health School
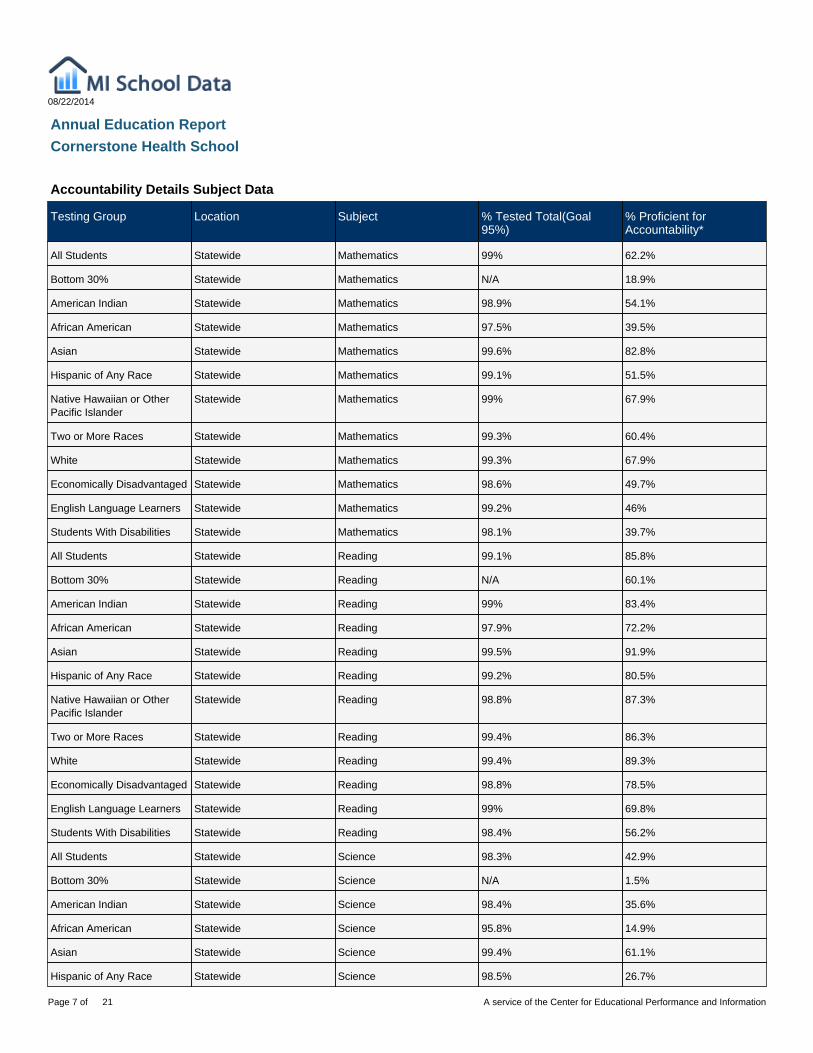
Accountability Details Subject Data
Testing Group Location Subject % Tested Total(Goal95%)
% Proficient forAccountability*
All Students Statewide Mathematics 99% 62.2%
Bottom 30% Statewide Mathematics N/A 18.9%
American Indian Statewide Mathematics 98.9% 54.1%
African American Statewide Mathematics 97.5% 39.5%
Asian Statewide Mathematics 99.6% 82.8%
Hispanic of Any Race Statewide Mathematics 99.1% 51.5%
Native Hawaiian or OtherPacific Islander
Statewide Mathematics 99% 67.9%
Two or More Races Statewide Mathematics 99.3% 60.4%
White Statewide Mathematics 99.3% 67.9%
Economically Disadvantaged Statewide Mathematics 98.6% 49.7%
English Language Learners Statewide Mathematics 99.2% 46%
Students With Disabilities Statewide Mathematics 98.1% 39.7%
All Students Statewide Reading 99.1% 85.8%
Bottom 30% Statewide Reading N/A 60.1%
American Indian Statewide Reading 99% 83.4%
African American Statewide Reading 97.9% 72.2%
Asian Statewide Reading 99.5% 91.9%
Hispanic of Any Race Statewide Reading 99.2% 80.5%
Native Hawaiian or OtherPacific Islander
Statewide Reading 98.8% 87.3%
Two or More Races Statewide Reading 99.4% 86.3%
White Statewide Reading 99.4% 89.3%
Economically Disadvantaged Statewide Reading 98.8% 78.5%
English Language Learners Statewide Reading 99% 69.8%
Students With Disabilities Statewide Reading 98.4% 56.2%
All Students Statewide Science 98.3% 42.9%
Bottom 30% Statewide Science N/A 1.5%
American Indian Statewide Science 98.4% 35.6%
African American Statewide Science 95.8% 14.9%
Asian Statewide Science 99.4% 61.1%
Hispanic of Any Race Statewide Science 98.5% 26.7%
Page 7 of A service of the Center for Educational Performance and Information21

08/22/2014
Annual Education ReportCornerstone Health School
Accountability Details Subject Data
Testing Group Location Subject % Tested Total(Goal95%)
% Proficient forAccountability*
Native Hawaiian or OtherPacific Islander
Statewide Science 99.1% 48.4%
Two or More Races Statewide Science 98.9% 40.6%
White Statewide Science 98.9% 50.1%
Economically Disadvantaged Statewide Science 97.4% 26.4%
English Language Learners Statewide Science 98.4% 11.2%
Students With Disabilities Statewide Science 97.2% 16.1%
All Students Statewide Social Studies 97.3% 57.3%
Bottom 30% Statewide Social Studies N/A 9.1%
American Indian Statewide Social Studies 97.7% 49.7%
African American Statewide Social Studies 93.6% 28.4%
Asian Statewide Social Studies 99.1% 74.4%
Hispanic of Any Race Statewide Social Studies 97.5% 42.7%
Native Hawaiian or OtherPacific Islander
Statewide Social Studies 98.9% 65.5%
Two or More Races Statewide Social Studies 98.2% 53.8%
White Statewide Social Studies 98.2% 64.5%
Economically Disadvantaged Statewide Social Studies 95.8% 40.4%
English Language Learners Statewide Social Studies 97.5% 22.7%
Students With Disabilities Statewide Social Studies 92.3% 21.7%
All Students District Social Studies <30 <30
African American District Social Studies <30 <30
Two or More Races District Social Studies
Economically Disadvantaged District Social Studies <30 <30
Students With Disabilities District Social Studies
All Students Statewide Writing 98.5% 73.2%
Bottom 30% Statewide Writing N/A 26.5%
American Indian Statewide Writing 98.5% 63.2%
African American Statewide Writing 96.4% 54.4%
Asian Statewide Writing 99% 86%
Hispanic of Any Race Statewide Writing 98.8% 64.3%
Native Hawaiian or OtherPacific Islander
Statewide Writing 99% 76.6%
Page 8 of A service of the Center for Educational Performance and Information21
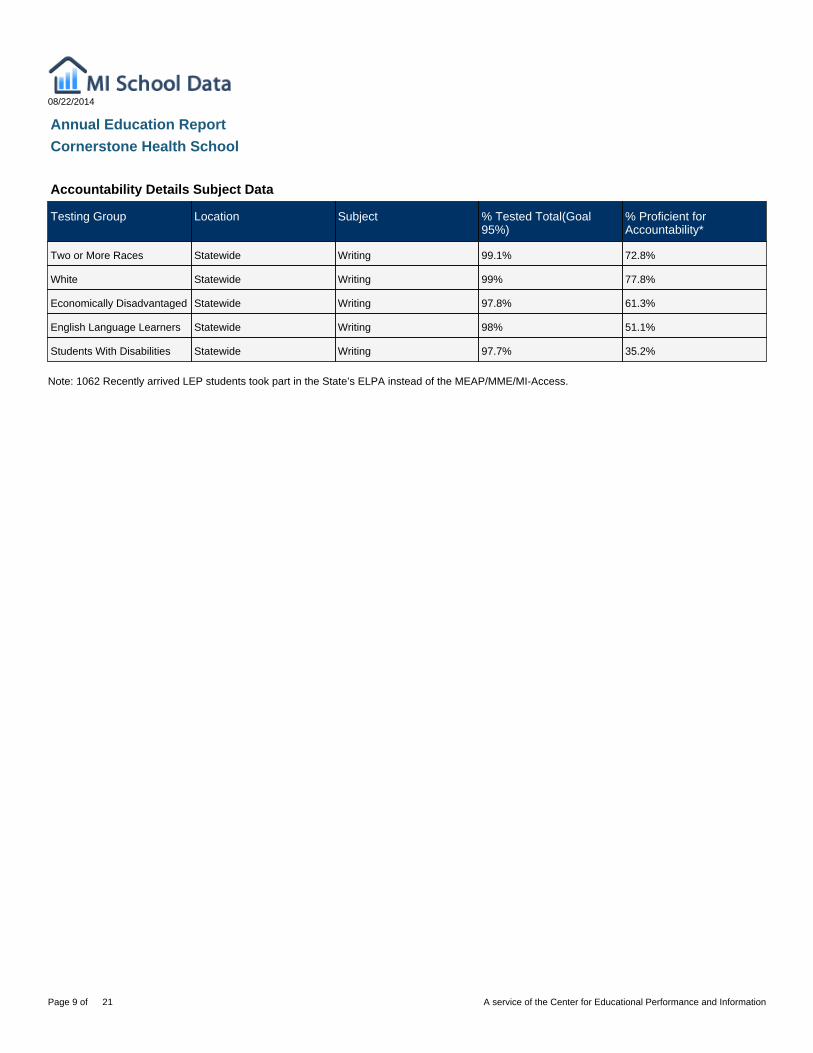
Note: 1062 Recently arrived LEP students took part in the State’s ELPA instead of the MEAP/MME/MI-Access.
08/22/2014
Annual Education ReportCornerstone Health School
Accountability Details Subject Data
Testing Group Location Subject % Tested Total(Goal95%)
% Proficient forAccountability*
Two or More Races Statewide Writing 99.1% 72.8%
White Statewide Writing 99% 77.8%
Economically Disadvantaged Statewide Writing 97.8% 61.3%
English Language Learners Statewide Writing 98% 51.1%
Students With Disabilities Statewide Writing 97.7% 35.2%
Page 9 of A service of the Center for Educational Performance and Information21
* All data based on students enrolled for a full academic year.
08/22/2014
Annual Education ReportCornerstone Health School
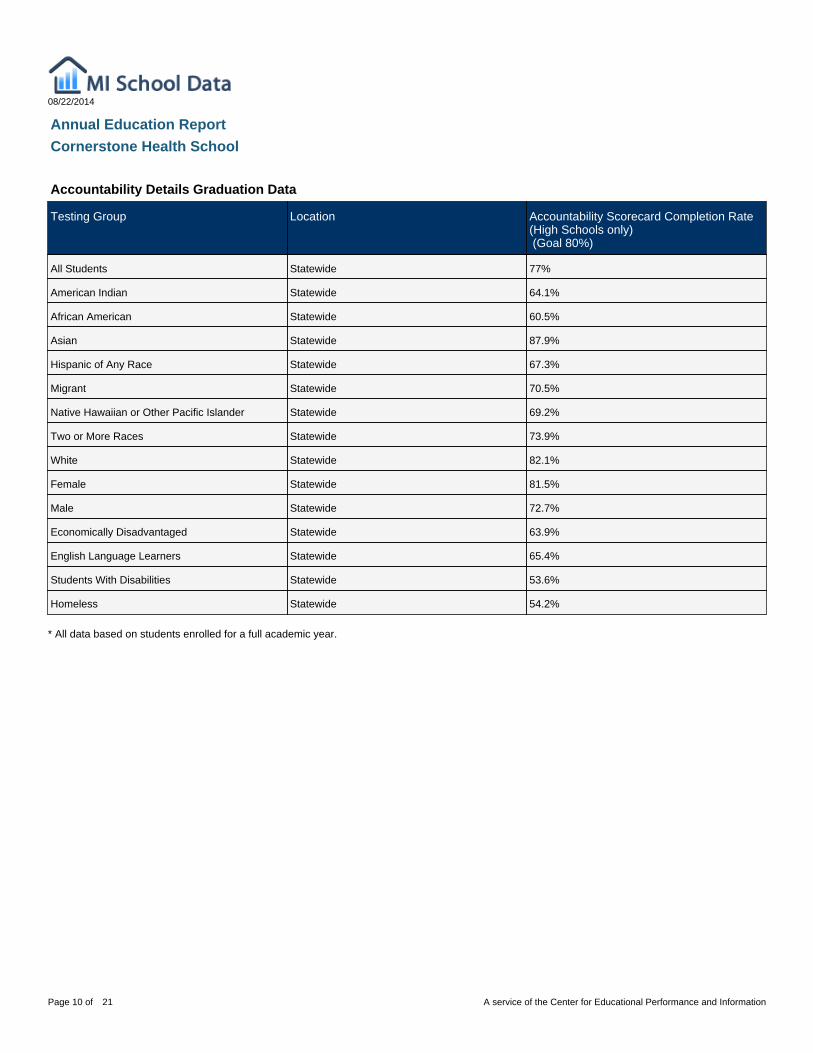
Accountability Details Graduation Data
Testing Group Location Accountability Scorecard Completion Rate(High Schools only) (Goal 80%)
All Students Statewide 77%
American Indian Statewide 64.1%
African American Statewide 60.5%
Asian Statewide 87.9%
Hispanic of Any Race Statewide 67.3%
Migrant Statewide 70.5%
Native Hawaiian or Other Pacific Islander Statewide 69.2%
Two or More Races Statewide 73.9%
White Statewide 82.1%
Female Statewide 81.5%
Male Statewide 72.7%
Economically Disadvantaged Statewide 63.9%
English Language Learners Statewide 65.4%
Students With Disabilities Statewide 53.6%
Homeless Statewide 54.2%
Page 10 of A service of the Center for Educational Performance and Information21

* All data based on students enrolled for a full academic year.
08/22/2014
Annual Education ReportCornerstone Health School
Accountability Details Attendance Data
Testing Group Location Attendance Rate (Goal 90%)
All Students Statewide 94.3%
All Students District 88%
Page 11 of A service of the Center for Educational Performance and Information21

08/22/2014
Annual Education ReportCornerstone Health School
Accountability Status District Data
DistrictName
ReadingStatus
ReadingScore
WritingStatus
WritingScore
Math Status Math Score ScienceStatus
ScienceScore
SocialStudiesStatus
SocialStudiesScore
OverallStatus
OverallScore
CornerstoneHealth School
Green 2 Orange 2
Page 12 of A service of the Center for Educational Performance and Information21

08/22/2014
Annual Education ReportCornerstone Health School
Accountability Status School Data
DistrictName
SchoolName
Title 1Status
ReadingStatus
ReadingScore
WritingStatus
WritingScore
MathStatus
MathScore
ScienceStatus
ScienceScore
SocialStudiesStatus
SocialStudiesScore
OverallStatus
OverallScore
Cornerstone HealthSchool
Cornerstone HealthSchool
Green 2 Orange 2
Page 13 of A service of the Center for Educational Performance and Information21

Professional Qualifications are defined by the State and may include information such as the degrees of public school teachers (e.g., percentage ofteachers with Bachelors Degrees or Masters Degrees) or the percentage of fully certified teachers
08/22/2014
Annual Education ReportCornerstone Health School
Teacher Quality - Qualification
Other B.A. M.A. P.H.D.
Professional Qualifications ofAll Public Elementary andSecondary School Teachersin the District
0 4 3 0
Teacher Quality - Class
District Aggregate High-Poverty Schools Low-Poverty Schools
Percentage of Core AcademicSubject Elementary and SecondarySchool Classes not Taught by HighlyQualified Teachers
0.0% 0.0% 0.0%
Teacher Quality - Provisional
Certification Percent
Percentage of Public Elementary and Secondary School Teachers in theDistrict with Emergency Certification
0%
Page 14 of A service of the Center for Educational Performance and Information21
‡ Reporting Standards not met. Note: Observed differences are not necessarily statistically significant. Detail may not sum to total because of rounding.SOURCE: U.S. Department of Education. Institute for Education Sciences. National Center for Education Statistics. National Assessment Program(NAEP) 2013 Mathematics Achievement.
08/22/2014
Annual Education ReportCornerstone Health School
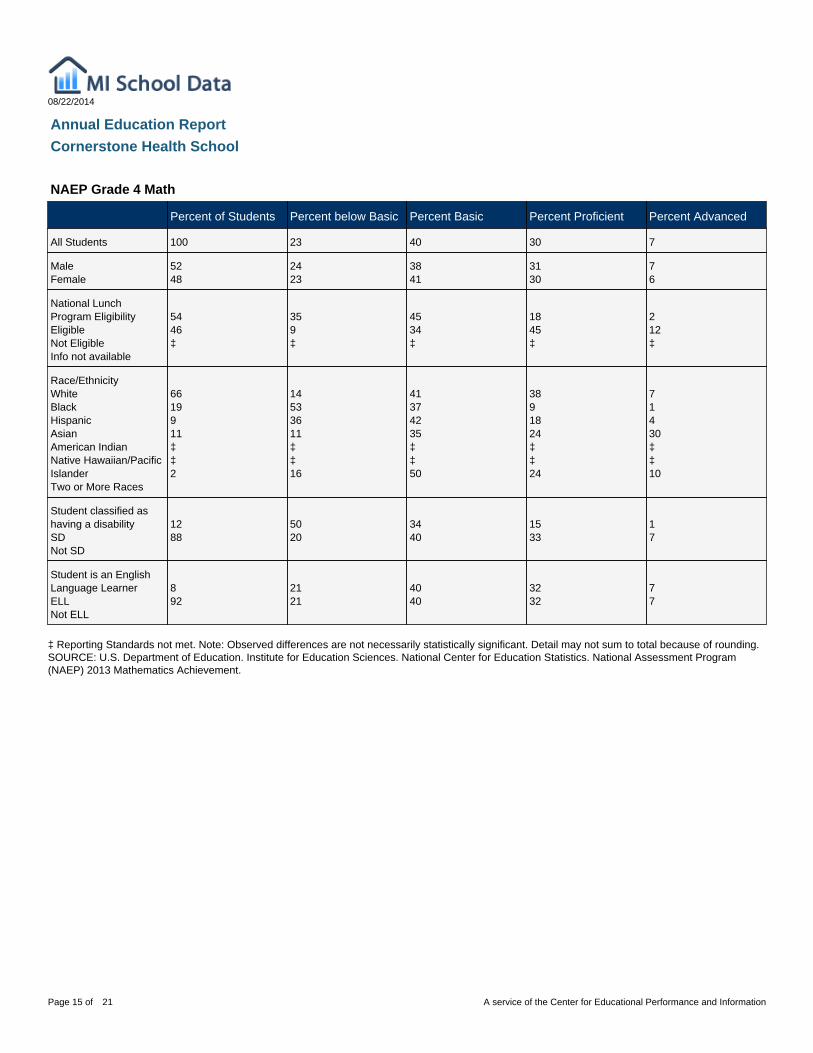
NAEP Grade 4 Math
Percent of Students Percent below Basic Percent Basic Percent Proficient Percent Advanced
All Students 100 23 40 30 7
MaleFemale
5248
2423
3841
3130
76
National LunchProgram EligibilityEligibleNot EligibleInfo not available
5446‡
359‡
4534‡
1845‡
212‡
Race/EthnicityWhiteBlackHispanicAsianAmerican IndianNative Hawaiian/PacificIslanderTwo or More Races
6619911‡‡2
14533611‡‡16
41374235‡‡50
3891824‡‡24
71430‡‡10
Student classified ashaving a disabilitySDNot SD
1288
5020
3440
1533
17
Student is an EnglishLanguage LearnerELLNot ELL
892
2121
4040
3232
77
Page 15 of A service of the Center for Educational Performance and Information21

‡ Reporting Standards not met. NOTE: Observed differences are not necessarily statistically significant. Detail may not sum to total because ofrounding. SOURCE: U.S. Department of Education. Institute for Education Sciences. National Center for Education Statistics. National AssessmentProgram (NAEP) 2013 Mathematics Achievement.
08/22/2014
Annual Education ReportCornerstone Health School
NAEP Grade 8 Math
Percent of Students Percent below Basic Percent Basic Percent Proficient Percent Advanced
All Students 100 30 40 23 7
MaleFemale
5248
3128
3842
2324
86
National LunchProgram EligibilityEligibleNot EligibleInfo not available
46540
46160
38420
14320
2100
Race/EthnicityWhiteBlackHispanicAsianAmerican IndianNative Hawaiian/PacificIslanderTwo or More Races
7216631
2
21645112000
43293528000
2961330000
71130000
Student classified ashaving a disabilitySDNot SD
1288
5020
3440
1433
27
Student is an EnglishLanguage LearnerELLNot ELL
397
7428
2441
224
07
Page 16 of A service of the Center for Educational Performance and Information21

‡ Reporting Standards not met. NOTE: Observed differences are not necessarily statistically significant. Detail may not sum to total because ofrounding. SOURCE: U.S. Department of Education. Institute for Education Sciences. National Center for Education Statistics. National AssessmentProgram (NAEP) 2013 Mathematics Achievement.
08/22/2014
Annual Education ReportCornerstone Health School
NAEP Grade 12 Math
Percent of Students Percent below Basic Percent Basic Percent Proficient Percent Advanced
All Students 100 34 41 23 2
MaleFemale
5149
3235
4142
2622
11
National LunchProgram EligibilityEligibleNot EligibleInfo not available
35640
54220
37440
9320
020
Race/EthnicityWhiteBlackHispanicAsianAmerican IndianNative Hawaiian/PacificIslanderTwo or More Races
761453101
26685826000
42273332000
305935000
2007000
Student classified ashaving a disabilitySDNot SD
991
7830
1943
325
02
Student is an EnglishLanguage LearnerELLNot ELL
298
033
041
024
02
Page 17 of A service of the Center for Educational Performance and Information21

# Rounds to zero ‡ Reporting Standards not met. NOTE: Observed differences are not necessarily statistically significant. Detail may not sum to total because ofrounding. SOURCE: U.S. Department of Education, Institute of Education Sciences, National Center for Education Statistics, National Assessment ofEducational Progress (NAEP), 2013 Reading Assessment.
08/22/2014
Annual Education ReportCornerstone Health School
NAEP Grade 4 Reading
Percent of Students Percent below Basic Percent Basic Percent Proficient Percent Advanced
All Students 100 36 33 25 6
MaleFemale
5050
3120
3737
2837
46
National LunchProgram EligibilityEligibleNot EligibleInfo not available
35640
37190
39360
22380
270
Race/EthnicityWhiteBlackHispanicAsianAmerican IndianNative Hawaiian/PacificIslanderTwo or More Races
661893100
28614723000
35273232000
29111832000
81313000
Student classified ashaving a disabilitySDNot SD
793
6623
2532
934
05
Student is an EnglishLanguage LearnerELLNot ELL
298
025
037
033
05
Page 18 of A service of the Center for Educational Performance and Information21
# Rounds to zero ‡ Reporting Standards not met. NOTE: Observed differences are not necessarily statistically significant. Detail may not sum to total because ofrounding. SOURCE: U.S. Department of Education, Institute of Education Sciences, National Center for Education Statistics, National Assessment ofEducational Progress (NAEP), 2013 Reading Assessment.
08/22/2014
Annual Education ReportCornerstone Health School
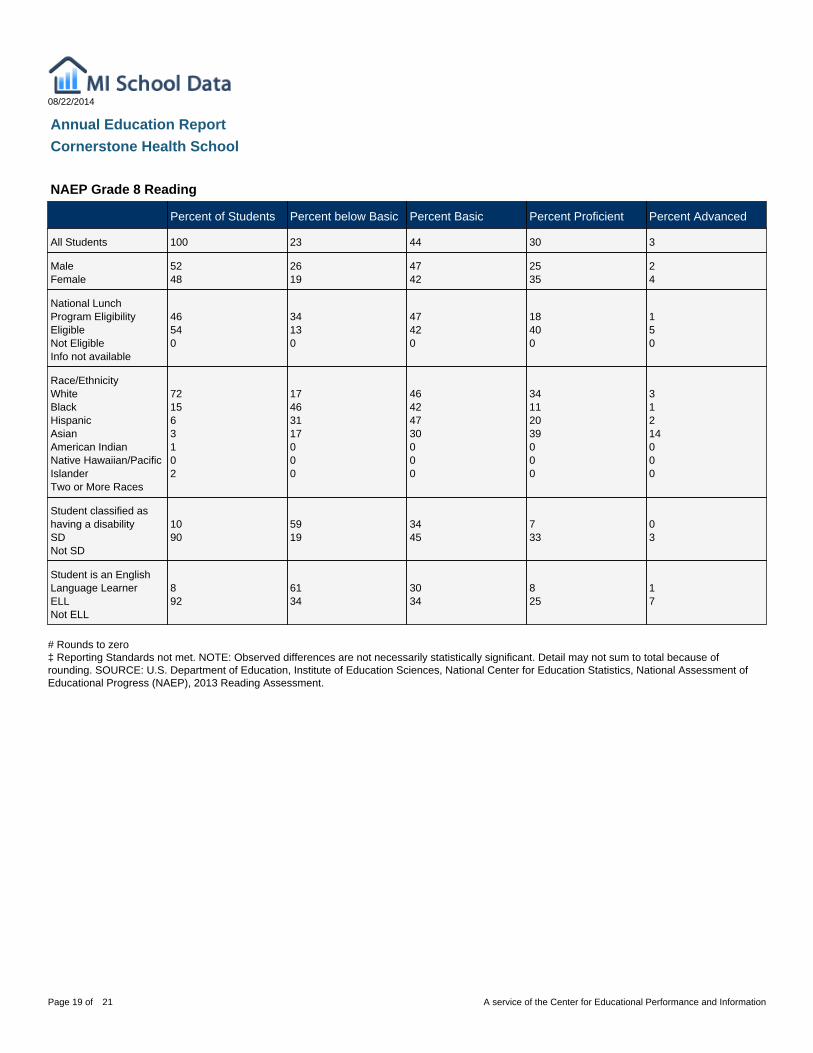
NAEP Grade 8 Reading
Percent of Students Percent below Basic Percent Basic Percent Proficient Percent Advanced
All Students 100 23 44 30 3
MaleFemale
5248
2619
4742
2535
24
National LunchProgram EligibilityEligibleNot EligibleInfo not available
46540
34130
47420
18400
150
Race/EthnicityWhiteBlackHispanicAsianAmerican IndianNative Hawaiian/PacificIslanderTwo or More Races
721563102
17463117000
46424730000
34112039000
31214000
Student classified ashaving a disabilitySDNot SD
1090
5919
3445
733
03
Student is an EnglishLanguage LearnerELLNot ELL
892
6134
3034
825
17
Page 19 of A service of the Center for Educational Performance and Information21

# Rounds to zero ‡ Reporting Standards not met. NOTE: Observed differences are not necessarily statistically significant. Detail may not sum to total because ofrounding. SOURCE: U.S. Department of Education, Institute of Education Sciences, National Center for Education Statistics, National Assessment ofEducational Progress (NAEP), 2013 Reading Assessment.
08/22/2014
Annual Education ReportCornerstone Health School
NAEP Grade 12 Reading
Percent of Students Percent below Basic Percent Basic Percent Proficient Percent Advanced
All Students 100 26 5 27 5
MaleFemale
5050
3120
3737
2837
46
National LunchProgram EligibilityEligibleNot EligibleInfo not available
35641
37190
39360
22380
270
Race/EthnicityWhiteBlackHispanicAsianAmerican IndianNative Hawaiian/PacificIslanderTwo or More Races
761453100
20523421000
38364426000
36122141000
60112000
Student classified ashaving a disabilitySDNot SD
793
6623
2538
834
15
Student is an EnglishLanguage LearnerELLNot ELL
298
025
037
033
05
Page 20 of A service of the Center for Educational Performance and Information21

08/22/2014
Annual Education ReportCornerstone Health School
NAEP Participation Data
Grade Subject Participation Rate forStudents withDisabilities
Standard Error Participation Rate forLimited EnglishProficient Students
Standard Error
4 MathReading
8773
1.93.7
9590
2.02.5
8 MathReading
8476
3.63.3
8483
5.24.0
Page 21 of A service of the Center for Educational Performance and Information21