Embed Size (px)
Citation preview
Annual Update: Spring 2013
Committee on Scholarships, Awards and Student Aid
Professor Charles E. Daye, Chair
March 8, 2013
Scholarships, Awards, and Student Aid Committee
Charge and Composition:
The committee is appointed by the Chancellor. It establishes policy for scholarship and student aid funds, monitors the operations of the Office of Scholarships and Student Aid, and advises the Chancellor on matters regarding scholarships and other forms of student aid.

Committee Membership, 2012-13
Name and Department Term(s)Faculty/Staff/StudentsCharles Daye, Chair (Law) 2003-13Todd Austell (Chemistry) 2010-13Cheryl Jones (Nursing) 2010-13Donald Hornstein (Law) 2008-14Judy Adamson (Dramatic Art) 2011-14Tara Moon (Medicine) 2010-13Dennis Williams (Pharmacy) 2004-13George Lensing (English) 2009-13Fred Clark (Romance Languages) 2009-13Winston Crisp (Student Affairs) Ex officioSteve Farmer (Admissions) Ex officioShirley Ort (Student Aid) Ex officioDylan Glatt-Dowd (Graduate Student) 2012-13Chris Scanzoni (Undergraduate) 2012-13William Bennett (Undergraduate) 2012-15Travis Crayton (Undergraduate) 2012-13

The role of the Office of Scholarships and Student Aid (OSSA) is to support the instructional mission of the University by . . .
Removing financial barriers for students
Recognizing and rewarding academic
talent, thereby
Furthering mutual goals of “equity” and “excellence”
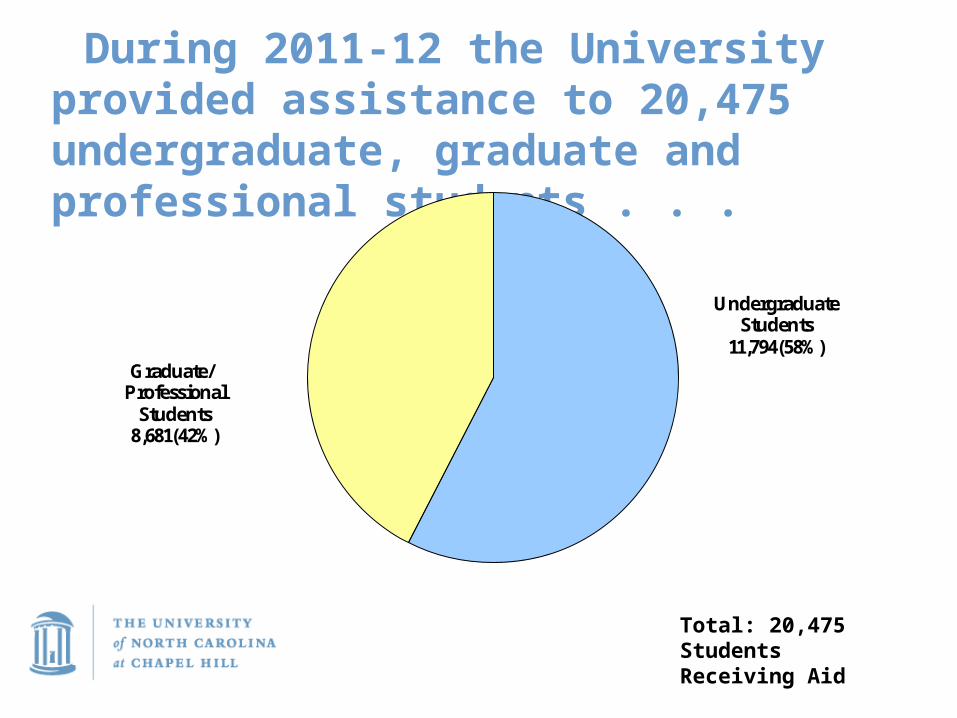
During 2011-12 the University provided assistance to 20,475 undergraduate, graduate and professional students . . .
Undergraduate Students
11,794(58%)Graduate/ Professional
Students8,681(42%)
Total: 20,475 Students Receiving Aid
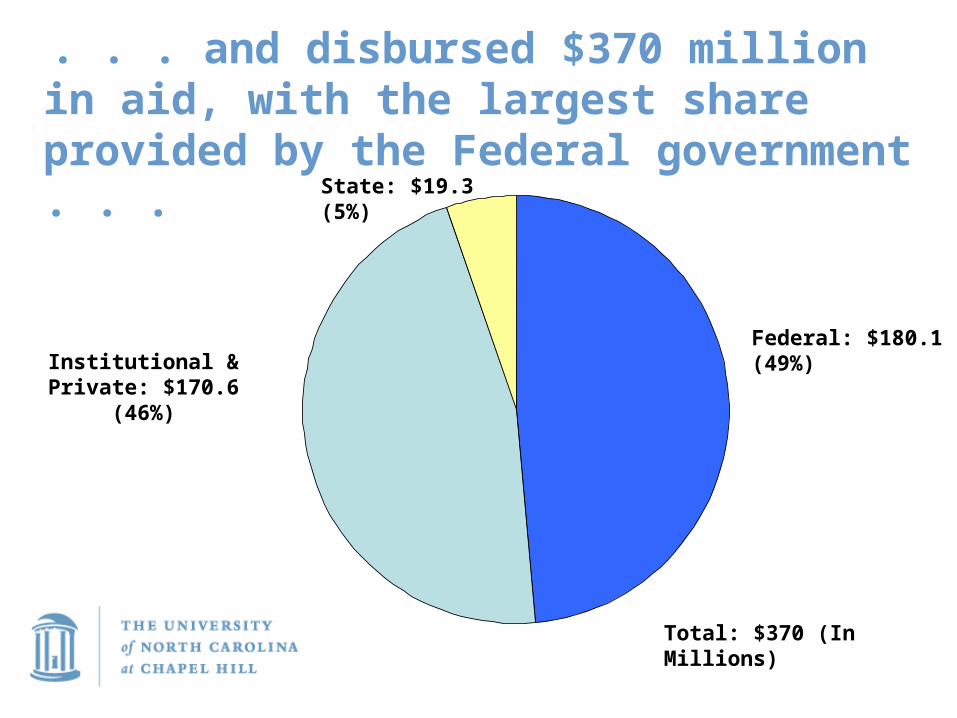
. . . and disbursed $370 million in aid, with the largest share provided by the Federal government . . .
Total: $370 (In Millions)
State: $19.3 (5%)
Federal: $180.1 (49%)Institutional &
Private: $170.6 (46%)
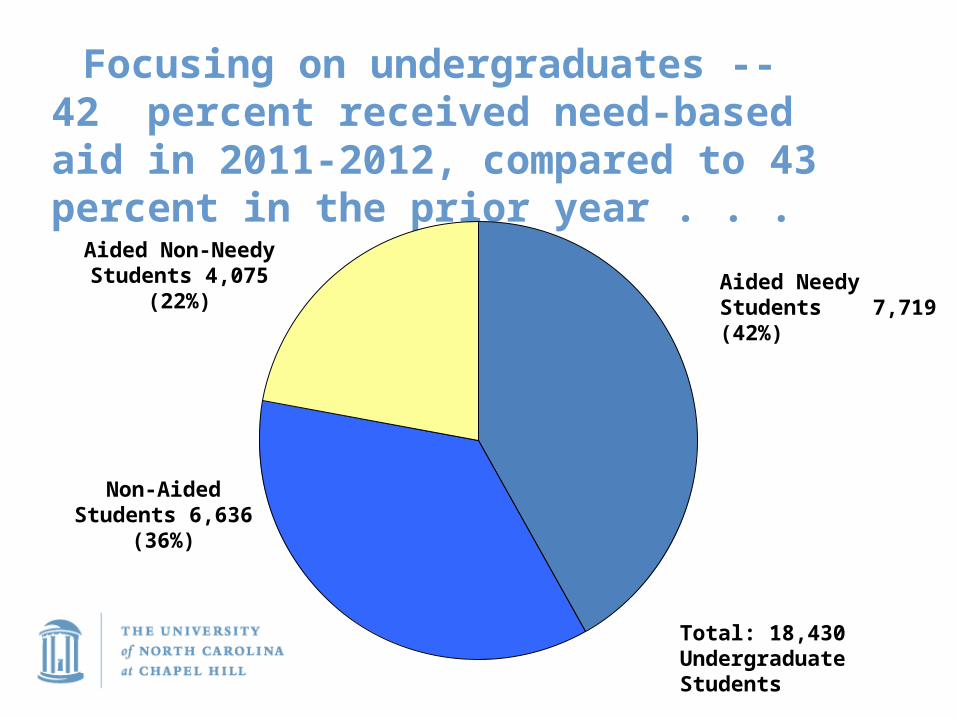
Focusing on undergraduates -- 42 percent received need-based aid in 2011-2012, compared to 43 percent in the prior year . . .
Total: 18,430 Undergraduate Students
Aided Needy Students 7,719 (42%)
Non-Aided Students 6,636
(36%)
Aided Non-Needy Students 4,075
(22%)
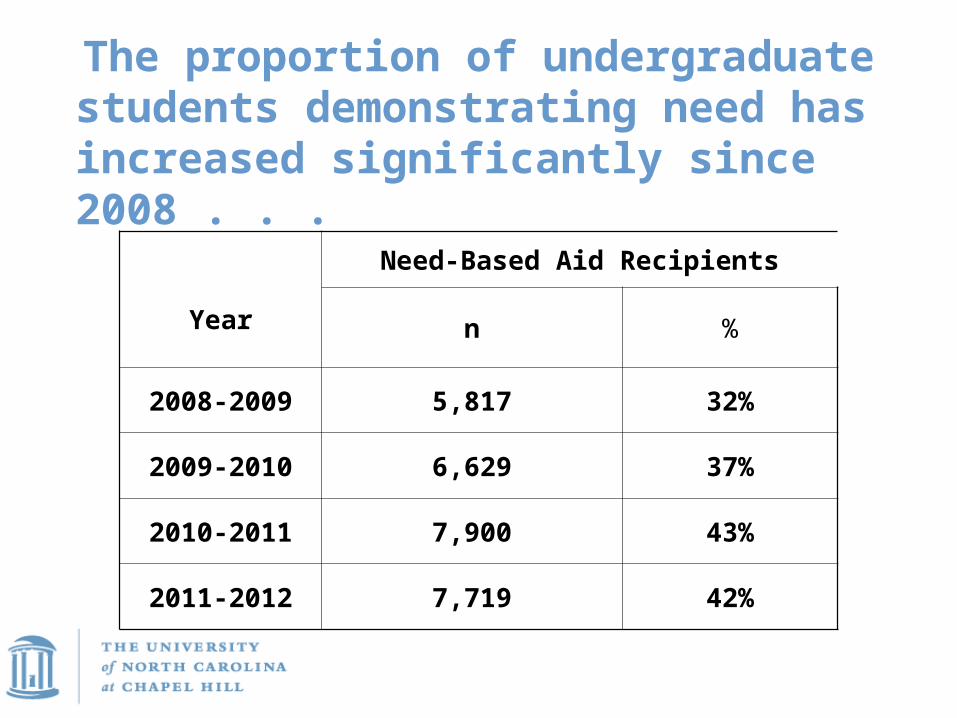
The proportion of undergraduate students demonstrating need has increased significantly since 2008 . . .
Year
Need-Based Aid Recipients
n %
2008-2009 5,817 32%
2009-2010 6,629 37%
2010-2011 7,900 43%
2011-2012 7,719 42%

The average amount of financial aid disbursed to an undergraduate receiving need-based aid in 2011-12 was quite generous . . .
Loans (24%)
Work-Study (2%)
Grants & Scholarships (74%)
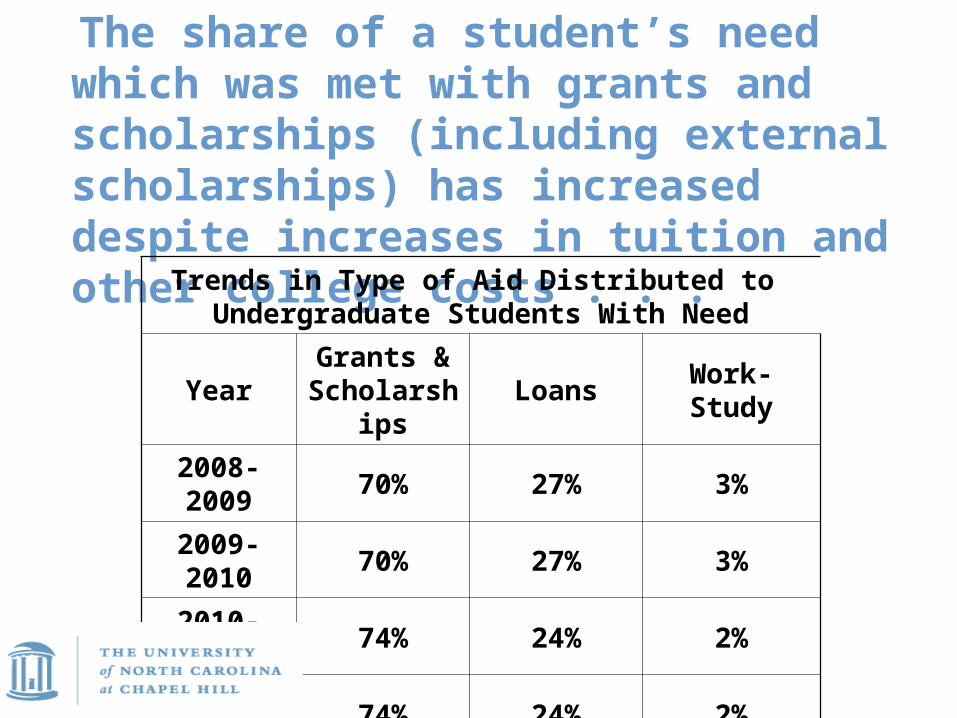
The share of a student’s need which was met with grants and scholarships (including external scholarships) has increased despite increases in tuition and other college costs . . . Trends in Type of Aid Distributed to
Undergraduate Students With Need
YearGrants & Scholars
hipsLoans
Work-Study
2008-2009
70% 27% 3%
2009-2010
70% 27% 3%
2010-2011
74% 24% 2%
2011-2012
74% 24% 2%
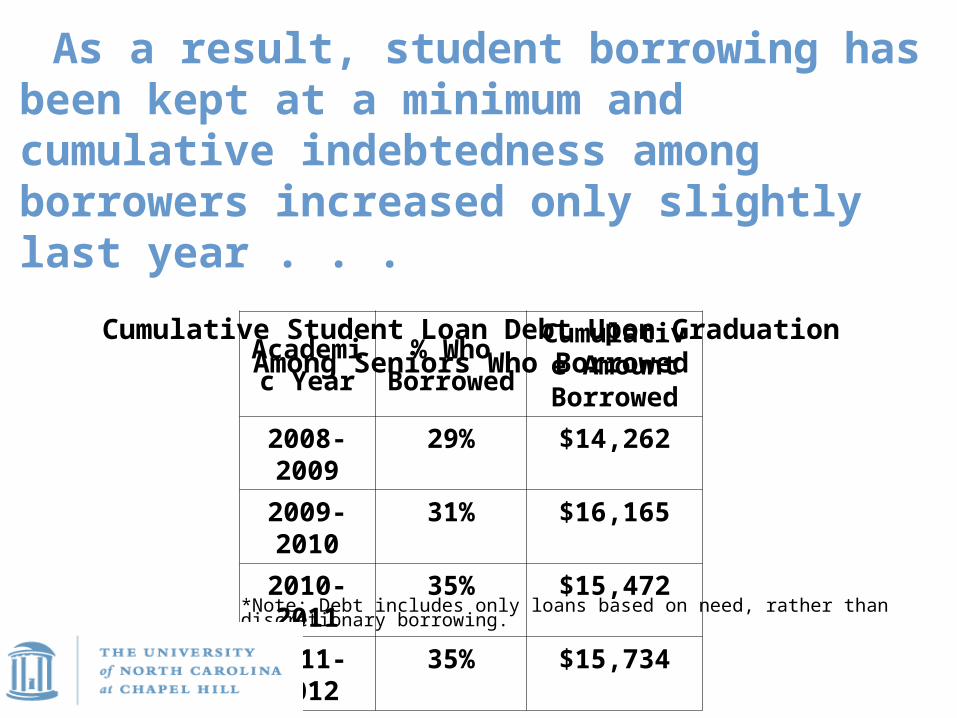
As a result, student borrowing has been kept at a minimum and cumulative indebtedness among borrowers increased only slightly last year . . .
Cumulative Student Loan Debt Upon GraduationAmong Seniors Who Borrowed
Academic Year
% Who Borrowe
d
Cumulative Amount Borrowed
2008-2009
29% $14,262
2009-2010
31% $16,165
2010-2011
35% $15,472
2011-2012
35% $15,734
*Note: Debt includes only loans based on need, rather than discretionary borrowing.
$0
$2,000
$4,000
$6,000
$8,000
$10,000
$12,000
$14,000
$16,000
$18,000
$20,000
2001-02 2002-03 2003-04 2004-05 2005-06 2006-07 2007-08 2008-09 2009-10 2010-11 2011-12
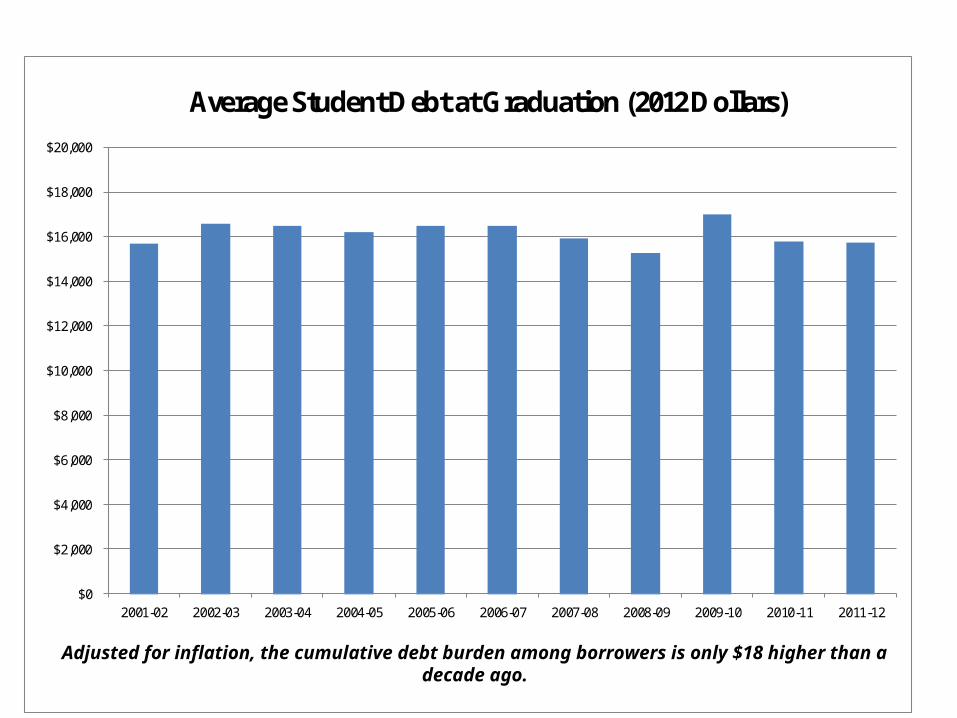
Average Student Debt at Graduation (2012 Dollars)
Adjusted for inflation, the cumulative debt burden among borrowers is only $18 higher than a decade ago.
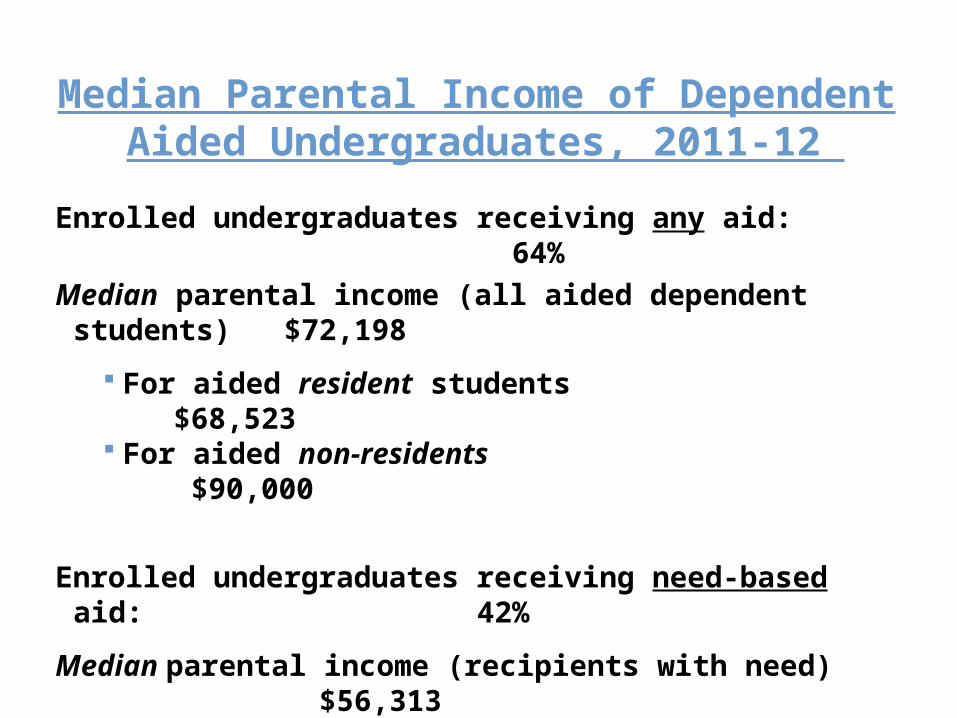
Median Parental Income of Dependent Aided Undergraduates,
2011-12
Enrolled undergraduates receiving any aid: 64%
Median parental income (all aided dependent students) $72,198
For aided resident students $68,523 For aided non-residents $90,000
Enrolled undergraduates receiving need-based aid: 42%
Median parental income (recipients with need) $56,313
For aided resident students $53,360For aided non-residents$75,706For Carolina Covenant® Scholars $24,246
(Average family size was 4 throughout; median for N. C.
resident is $68,987)

A slow-growth economy Continuing unemployment Uncertain state funding Discussion about cutting state grant
program Likely cuts to federal student aid
programs Expected increases in college costs
Carolina must work hard to maintain favorable financial aid patterns – and raise private money – given the challenges we face . . .

Ten Year Comparison of Scholarship and Financial Aid (Need and Non-Need-Based)
Awards: All Students (Undergraduate,
Graduate/Professional) 2001-2002
2010-2011
2011-2012
Total Aid Awarded (in millions)
$136.1 $351.2 $370.0
Number of Students 12,394 20,362 20,475
Average Award$10,981 $17,248 $18,073
Funds by SourceFederal 55% 49% 49%
State 9 6 5
Institutional/Private 36 45 46
Funds by TypeScholarships/Grants 44% 54% 53%
Work-Study 1 1 1
Loans 55 45 46
Source: Office of Scholarships and Student Aid/Office of Institutional Research (February 2013)


Questions and Discussion
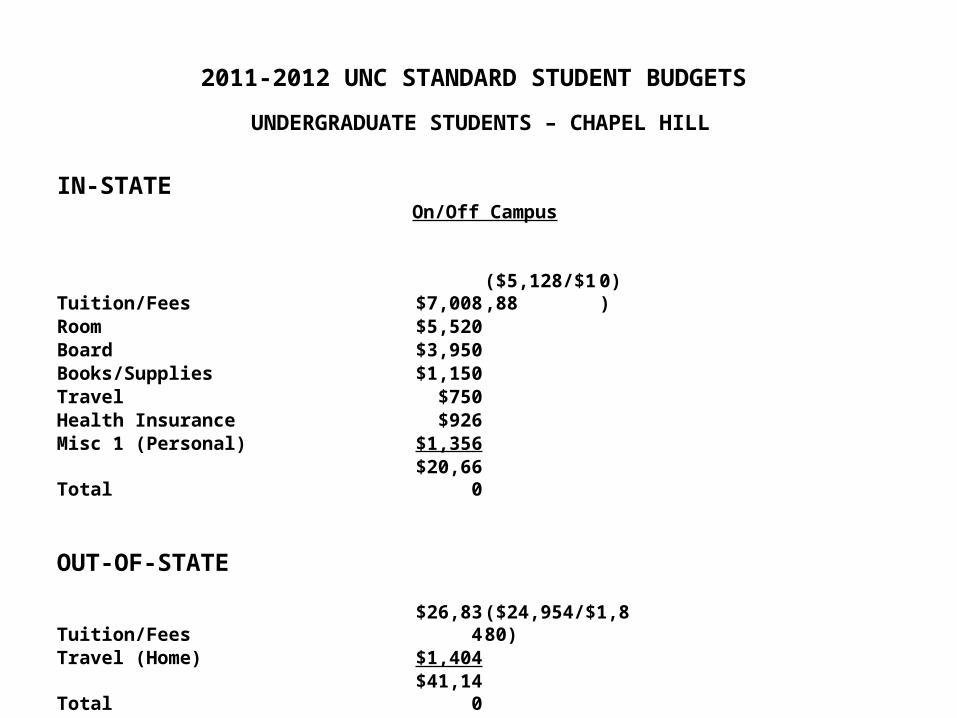
2011-2012 UNC STANDARD STUDENT BUDGETS
UNDERGRADUATE STUDENTS – CHAPEL HILL
IN-STATEOn/Off Campus
Tuition/Fees $7,008 ($5,128/$1,88 0))Room $5,520Board $3,950Books/Supplies $1,150Travel $750Health Insurance $926Misc 1 (Personal) $1,356Total $20,660
OUT-OF-STATE
Tuition/Fees $26,834($24,954/$1,880)Travel (Home) $1,404Total $41,140

Academic Year% Who
BorrowedCurrent Dollar
Amount BorrowedConstant Dollar
Amount
2001-2002 23% $12,314 $15,716
2002-2003 31% $13,291 $16,584
2003-2004 34% $13,579 $16,504
2004-2005 34% $13,801 $16,224
2005-2006 32% $14,487 $16,499
2006-2007 34% $14,912 $16,512
2007-2008 31.5% $14,936 $15,927
2008-2009 28.8% $14,262 $15,263
2009-2010 30.8% $16,165 $17,020
2010-2011 34.7% $15,472 $15,792
2011-2012 34.8% $15,734 $15,734