Embed Size (px)
Citation preview
NSW Department of Education & Training
4118
2010 Annual School Report Moree East Public School
1
Our school at a glance
Students
At Moree East Public School we aim to provide a welcoming environment where everyone has the chance to shine. Every student is supported and encouraged to give their best and cultural diversity is celebrated.
Student enrolments, Kindergarten to Year 6, at the end of 2010 totalled 136. Of these enrolments 58 were female (43%) and 78 were male (57%).
Staff
The staff at Moree East Public School are a dedicated, creative and highly qualified team that are committed to providing a quality education for all students.
All teaching staff meet the professional requirements for teaching in NSW public schools.
Messages
Principal’s message
Moree East Public School is a welcoming and friendly school with an extremely dedicated staff, who provide a quality education for students from Kindergarten to Year 6.
Professional learning for staff was a strong priority in 2010, particularly for our New Scheme teachers. It has been pointed out on a number of occasions that the atmosphere of the school was noticeably calmer this year and this is due in part to a more highly trained staff implementing
quality learning programs that engage the students.
2010 was a year that saw many positive changes to the infrastructure of the school. The Federal Governments Building Education Revolution (BER) program funded the building of a new hall and canteen, which are programmed for completion in early 2011. The infant’s toilet block was in an extreme state of disrepair so it was demolished and replaced with a brand new toilet block. In addition the weatherboard buildings in the infants department were given a new lease of life with a fresh coat of paint inside and out and a new underground sprinkler system was installed on the oval.
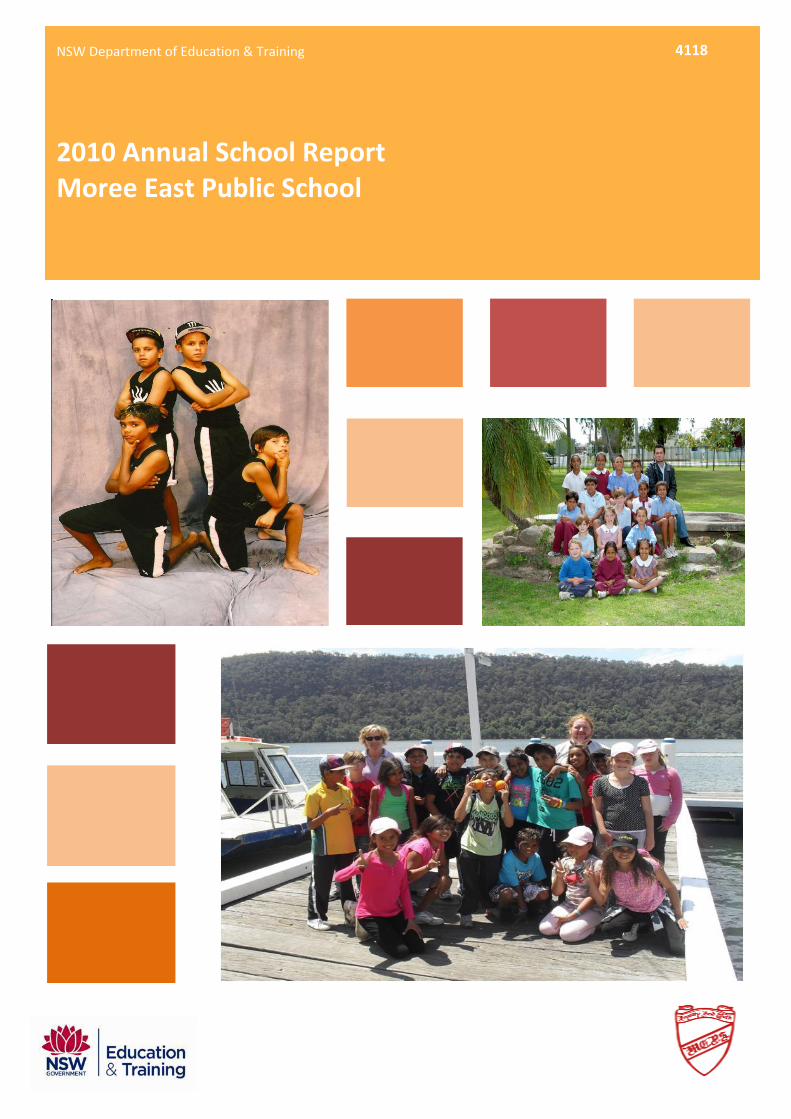
The students at Moree East PS continue to excel in the Creative Arts, particularly dancing, both traditional and modern. They also celebrated many notable achievements in the sporting arena.
I certify that the information in this report is the result of a rigorous school self-evaluation process and is a balanced and genuine account of the school’s achievements and areas for development.
Melinda Mikaere
P & C and/or School Council message
The role of the P & C has changed dramatically this year with the canteen being rescinded back under the supervision of the School’s Principal. In past years the school canteen was a reliable fundraiser but with limitations in accordance with the ‘healthy eating’ programs and the extra work involved with having a paid employee, the current P & C were unable to continue the day to day running of the canteen.
P & C fundraising was limited this year, due to many factors, including lack of support within the community, clashes with school fundraisers and building construction proving to be a hazard for night-time events.
The P & C have great respect for the efforts of Schools as Community Centres Co-ordinator, Mrs Annabelle Simpson as she has worked hard to develop positive relationships with the community through different projects such as MEPS Playgroup and the Sisters Group.
Mrs Leah Smith
2
Student representative’s message
I have greatly enjoyed my years at Moree East PS as it provided me with many wonderful opportunities, both educational and extra-curricular.
The School Captains, Vice-Captains and members of the Student Representative Council (SRC) attended the New England Leadership Conference in Tamworth this year, where we learnt a lot about how to be a good leader and the finer points of public speaking.
Every week the School Captains and Vice-Captains chair the whole school assembly, which allows us to practice our public speaking skills and improves our self-confidence.
The SRC organize and run a number of fundraising activities, which allow us to buy new equipment for the school as well as assist different charities.
Allan McKenzie, School Captain 2010
School context
Student information
It is a requirement that the reporting of information for all students must be consistent with privacy and personal information policies.
Student enrolment profile
There has been a steady decline in student enrolments since 2006. This decline in enrolments could in part be attributed to a reported decline in the population within the Moree Plains shire over the last few years. For a variety of reasons, such as drought and lack of employment, many families are being forced to relocate to other areas.
Student attendance profile
The following graph illustrates that the average student attendance at Moree East PS is below both Regional and State levels. These statistics are impacted significantly by the transient nature of our student population and a small percentage of students with exceptionally poor attendance patterns.
Management of non-attendance
Moree East PS has a comprehensive attendance policy with a variety of strategies for addressing student attendance. Student absences are followed up daily with phone calls from the Aboriginal Education Officers and compulsory attendance letters are sent home weekly by the classroom teacher. Students with regular non-attendance are referred to the School Learning Support Team, who implement individual attendance plans in consultation with parents and students. The Learning Support Team can also refer students to the Home School Liason Officers and Community Liason Officer, who work within the region to support parents and students to improve student attendance.
The school has also allocated four hours a week for a member of staff to monitor attendance and implement strategies for improving attendance. High attendance is recognized and rewarded on a weekly basis with awards and a prize draw
0
100
200
300
2006 2007 2008 2009 2010
Stu
den
ts
Year
Enrolments
Male Female
0102030405060708090
100
2007 2008 2009 2010
Att
end
ance
rat
e
Year
Student attendance rates
School Region State DET
3
entitling two students to a canteen voucher. A major prize draw is also conducted on the last day of each term.
Class sizes
In March 2003 the Government announced its commitment to publish primary class sizes in annual school reports in order to provide parents with as much local information as possible.
The following table shows our class sizes as reported at the 2010 class size audit conducted on Wednesday 17 March 2010.
Roll Class
Year Total per Year
Total in Class
1-24 1 16 16 K-23 K 18 18 2-21 2 20 20
5/6-11 5 10 23 5/6-11 6 13 23 3/4-20 3 10 19 3/4-20 4 9 19 3/4-10 3 10 18 3/4-10 4 8 18 5/6-12 5 11 22 5/6-12 6 11 22
Structure of classes
In 2010, Moree East had a total of 7 classes. The Primary classes were structured as stage composites to allow for more even class sizing and greater flexibility with gender mix, peer groupings and behavioural needs.
Staff information
It is a requirement that the reporting of information for all staff must be consistent with privacy and personal information policies
In 2009, there were 15 teachers, including specialist, temporary, part-time and permanent, employed at the school. The level of teaching experience ranged from first year out teachers to teachers with over 20 years of teaching experience.
The school used their own funds to upgrade one of the Assistant Principal positions to a non-teaching Deputy Principal position. This position was filled by Mrs Vicki Quast, who brought with her a wealth of teaching experience and knowledge, particularly in the area of literacy. Mrs Quast focused on building teacher capacity and improving quality teaching and learning
programs. Funds were also used to engage two extra temporary teachers to increase the number of classes from six to seven and to release the other Assistant Principal from face to face teaching, during semester two, to support and monitor the different welfare programs implemented in the school.
All teaching staff meet the professional requirements for teaching in NSW public schools. All staff are provided with opportunities to attend a range of on-going professional learning courses in order to maintain the high level of teaching expertise expected by the school, the community and the NSW Department of Education.
Staff establishment
Position Number
Principal 1
Assistant Principal(s) 2 Classroom Teachers 4 Primary Part-time Teacher 0.3 Primary Teacher RFF 0.252 Teacher of Reading Recovery 0.5 Support Teacher Learning Assistance 1.7 Teacher Librarian 0.2 Counsellor – District Guidance Officer 1 Primary Priority School Funding Scheme 0.2 Itinerant Primary Teacher Learning Assistance
1
Primary AP Learning Difficulties 1 Primary Integration Teacher 1 School Administrative & Support Staff 3.986 Total 18.138
The National Education Agreement requires schools to report on Indigenous composition of their workforce.
Moree East Public School employs a number of indigenous staff. This includes the Principal, four classroom teachers, one Schools Administrative Officer, two Aboriginal Education Officers and
4
two part-time temporary Student Learning Support Officers.
Teacher qualifications
All teaching staff meet the professional requirements for teaching in NSW public schools.
Enter text here
Qualifications % of staff
Degree or Diploma 100% Postgraduate 42%
Financial summary
This summary covers funds for operating costs and does not involve expenditure areas such as permanent salaries, building and major maintenance.
Date of financial summary: 30/11/2010
Income $
Balance brought forward 177 726.38
Global funds 165 275.41
Tied funds 269 696.90
School & community sources 18 021.30
Interest 10 081.08
Trust receipts 27 881.26
Canteen 44 501.40
Total income 713 183.73
ExpenditureTeaching & learning
Key learning areas 9 160.46
Excursions 6 214.60
Extracurricular dissections 8 058.36
Library 5 213.52
Training & development 1 737.28
Tied funds 269 783.08
Casual relief teachers 35 872.43
Administration & office 54 320.26
School-operated canteen 43 416.96
Utilities 67 445.27
Maintenance 20 478.65
Trust accounts 28 418.83
Capital programs 0.00
Total expenditure 550 119.70
Balance carried forward 163 064.03
A full copy of the school’s 2010 financial statement is tabled at the annual general meetings of the School Council and/or the parent body. Further details concerning the statement can be obtained by contacting the school.
School performance 2010
Primary school is a time for children to enjoy trying new skills and experiences. At Moree East PS, students have access to a wide variety of innovative programs that recognize and foster individual interests and talents.
Achievements
The school has continued to provide a range of experiences and activities that enrich student learning. In 2010 some of these were:
Harmony Day and NAIDOC Day activities that celebrated the cultural diversity and traditions within our community.
‘Parent Welcome’ picnic and a K-2 teddy bears picnic.
A number of out of uniform fundraiser days such as ‘Crazy Hair Day’, ‘Talk like a Pirate Day’, ‘Dress as your Favourite Footy Player Day’.
Easter Hat Parade for students in Years K-2.
Weekly Merit Award assemblies where Principals Awards and Bronze, Silver and Gold Awards were presented.
‘You Can Do It’ Rewards Days twice a term with fun activities such as kite making, for students on Bronze, Silver and Gold levels.
Community Observances such as Anzac Day and Rememberance Day.
Whole school participation in events promoting good health such as the Premier’s Sporting Challenge, Golden Circle Fun Run and Jump Rope for Heart.
An exciting, school visit by celebrity chef Glenn Austin. Glenn demonstrated to students, how to prepare a simple chicken dish and make pasta from scratch. He cooked food for all of the students and staff and provided the ingredients free of charge.
Participation in Education Week and Book Week activities including dressing up as your favourite book character and a book fair.
5
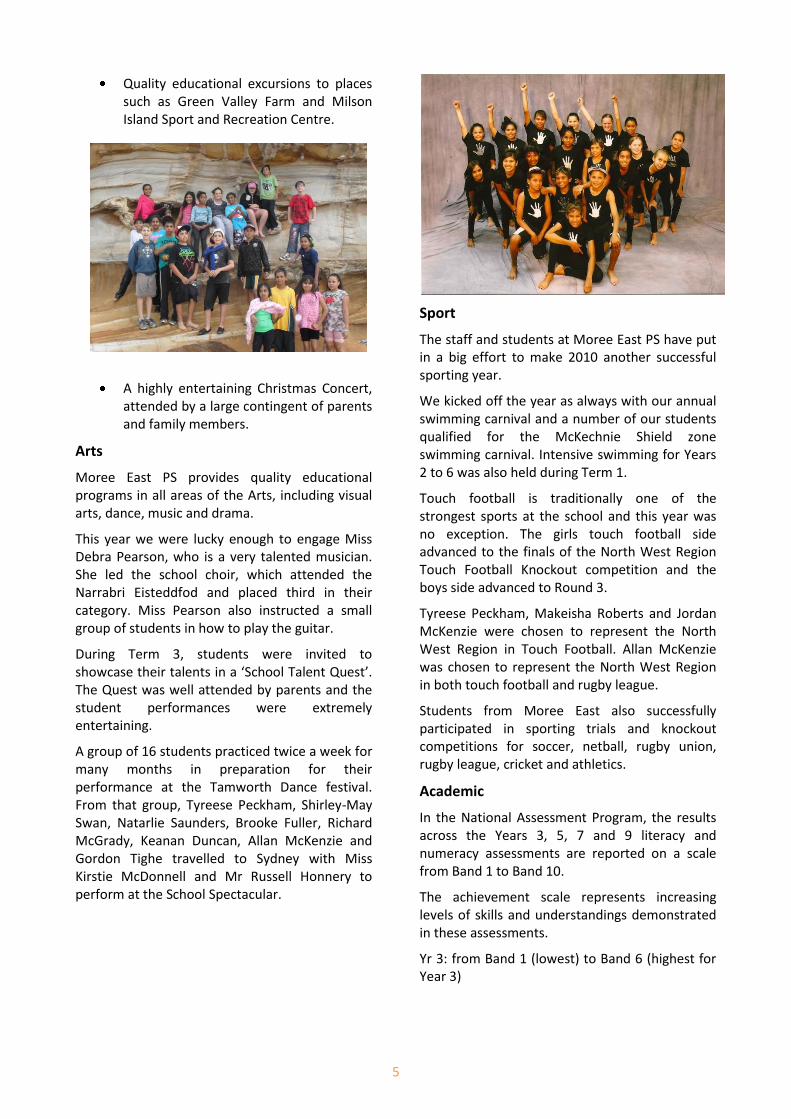
Quality educational excursions to places such as Green Valley Farm and Milson Island Sport and Recreation Centre.
A highly entertaining Christmas Concert, attended by a large contingent of parents and family members.
Arts
Moree East PS provides quality educational programs in all areas of the Arts, including visual arts, dance, music and drama.
This year we were lucky enough to engage Miss Debra Pearson, who is a very talented musician. She led the school choir, which attended the Narrabri Eisteddfod and placed third in their category. Miss Pearson also instructed a small group of students in how to play the guitar.
During Term 3, students were invited to showcase their talents in a ‘School Talent Quest’. The Quest was well attended by parents and the student performances were extremely entertaining.
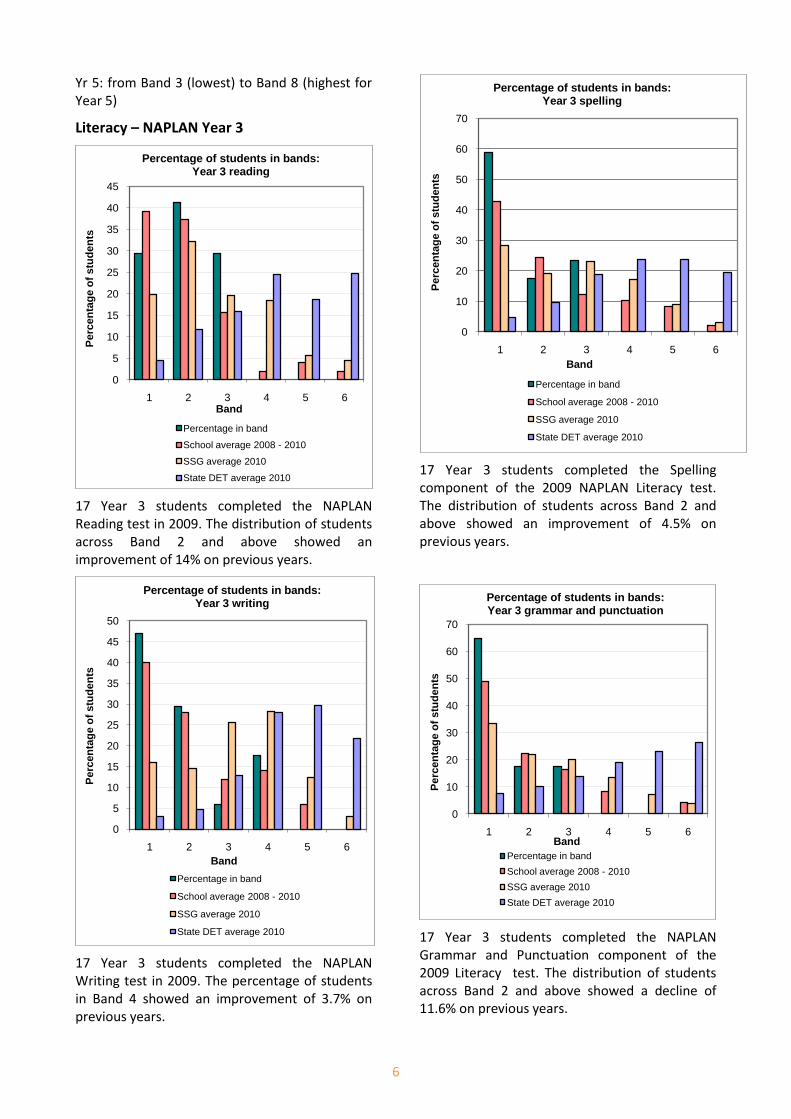
A group of 16 students practiced twice a week for many months in preparation for their performance at the Tamworth Dance festival. From that group, Tyreese Peckham, Shirley-May Swan, Natarlie Saunders, Brooke Fuller, Richard McGrady, Keanan Duncan, Allan McKenzie and Gordon Tighe travelled to Sydney with Miss Kirstie McDonnell and Mr Russell Honnery to perform at the School Spectacular.
Sport
The staff and students at Moree East PS have put in a big effort to make 2010 another successful sporting year.
We kicked off the year as always with our annual swimming carnival and a number of our students qualified for the McKechnie Shield zone swimming carnival. Intensive swimming for Years 2 to 6 was also held during Term 1.
Touch football is traditionally one of the strongest sports at the school and this year was no exception. The girls touch football side advanced to the finals of the North West Region Touch Football Knockout competition and the boys side advanced to Round 3.
Tyreese Peckham, Makeisha Roberts and Jordan McKenzie were chosen to represent the North West Region in Touch Football. Allan McKenzie was chosen to represent the North West Region in both touch football and rugby league.
Students from Moree East also successfully participated in sporting trials and knockout competitions for soccer, netball, rugby union, rugby league, cricket and athletics.
Academic
In the National Assessment Program, the results across the Years 3, 5, 7 and 9 literacy and numeracy assessments are reported on a scale from Band 1 to Band 10.
The achievement scale represents increasing levels of skills and understandings demonstrated in these assessments.
Yr 3: from Band 1 (lowest) to Band 6 (highest for Year 3)
6
Yr 5: from Band 3 (lowest) to Band 8 (highest for Year 5)
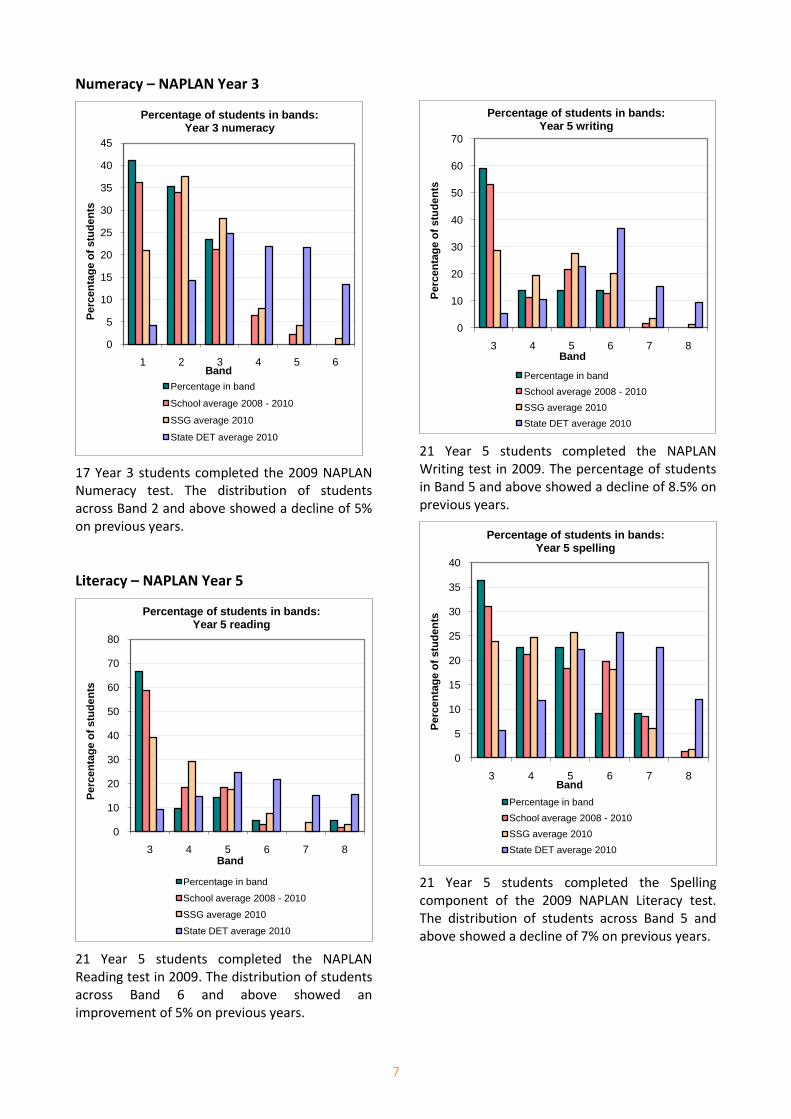
Literacy – NAPLAN Year 3
17 Year 3 students completed the NAPLAN Reading test in 2009. The distribution of students across Band 2 and above showed an improvement of 14% on previous years.
17 Year 3 students completed the NAPLAN Writing test in 2009. The percentage of students in Band 4 showed an improvement of 3.7% on previous years.
17 Year 3 students completed the Spelling component of the 2009 NAPLAN Literacy test. The distribution of students across Band 2 and above showed an improvement of 4.5% on previous years.
17 Year 3 students completed the NAPLAN Grammar and Punctuation component of the 2009 Literacy test. The distribution of students across Band 2 and above showed a decline of 11.6% on previous years.
0
5
10
15
20
25
30
35
40
45
1 2 3 4 5 6
Per
cen
tag
e o
f st
ud
ents
Band
Percentage of students in bands: Year 3 reading
Percentage in band
School average 2008 - 2010
SSG average 2010
State DET average 2010
0
5
10
15
20
25
30
35
40
45
50
1 2 3 4 5 6
Per
cen
tag
e o
f st
ud
ents
Band
Percentage of students in bands: Year 3 writing
Percentage in band
School average 2008 - 2010
SSG average 2010
State DET average 2010
0
10
20
30
40
50
60
70
1 2 3 4 5 6
Per
cen
tag
e o
f st
ud
ents
Band
Percentage of students in bands: Year 3 spelling
Percentage in band
School average 2008 - 2010
SSG average 2010
State DET average 2010
0
10
20
30
40
50
60
70
1 2 3 4 5 6
Per
cen
tag
e o
f st
ud
ents
Band
Percentage of students in bands: Year 3 grammar and punctuation
Percentage in band
School average 2008 - 2010
SSG average 2010
State DET average 2010
7
Numeracy – NAPLAN Year 3
17 Year 3 students completed the 2009 NAPLAN Numeracy test. The distribution of students across Band 2 and above showed a decline of 5% on previous years.
Literacy – NAPLAN Year 5
21 Year 5 students completed the NAPLAN Reading test in 2009. The distribution of students across Band 6 and above showed an improvement of 5% on previous years.
21 Year 5 students completed the NAPLAN Writing test in 2009. The percentage of students in Band 5 and above showed a decline of 8.5% on previous years.
21 Year 5 students completed the Spelling component of the 2009 NAPLAN Literacy test. The distribution of students across Band 5 and above showed a decline of 7% on previous years.
0
5
10
15
20
25
30
35
40
45
1 2 3 4 5 6
Per
cen
tag
e o
f st
ud
ents
Band
Percentage of students in bands: Year 3 numeracy
Percentage in band
School average 2008 - 2010
SSG average 2010
State DET average 2010
0
10
20
30
40
50
60
70
80
3 4 5 6 7 8
Per
cen
tag
e o
f st
ud
ents
Band
Percentage of students in bands: Year 5 reading
Percentage in band
School average 2008 - 2010
SSG average 2010
State DET average 2010
0
10
20
30
40
50
60
70
3 4 5 6 7 8
Per
cen
tag
e o
f st
ud
ents
Band
Percentage of students in bands: Year 5 writing
Percentage in band
School average 2008 - 2010
SSG average 2010
State DET average 2010
0
5
10
15
20
25
30
35
40
3 4 5 6 7 8
Per
cen
tag
e o
f st
ud
ents
Band
Percentage of students in bands: Year 5 spelling
Percentage in band
School average 2008 - 2010
SSG average 2010
State DET average 2010
8
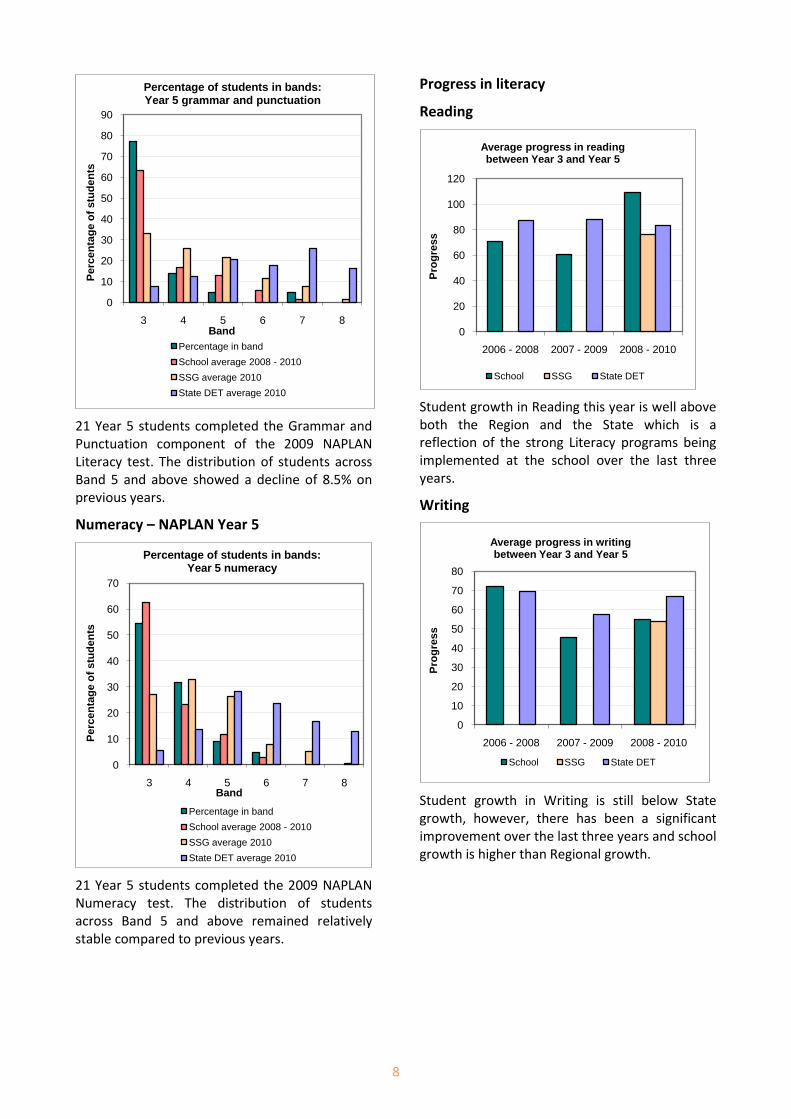
21 Year 5 students completed the Grammar and Punctuation component of the 2009 NAPLAN Literacy test. The distribution of students across Band 5 and above showed a decline of 8.5% on previous years.
Numeracy – NAPLAN Year 5
21 Year 5 students completed the 2009 NAPLAN Numeracy test. The distribution of students across Band 5 and above remained relatively stable compared to previous years.
Progress in literacy
Reading
Student growth in Reading this year is well above both the Region and the State which is a reflection of the strong Literacy programs being implemented at the school over the last three years.
Writing
Student growth in Writing is still below State growth, however, there has been a significant improvement over the last three years and school growth is higher than Regional growth.
0
10
20
30
40
50
60
70
80
90
3 4 5 6 7 8
Per
cen
tag
e o
f st
ud
ents
Band
Percentage of students in bands: Year 5 grammar and punctuation
Percentage in band
School average 2008 - 2010
SSG average 2010
State DET average 2010
0
10
20
30
40
50
60
70
3 4 5 6 7 8
Per
cen
tag
e o
f st
ud
ents
Band
Percentage of students in bands: Year 5 numeracy
Percentage in band
School average 2008 - 2010
SSG average 2010
State DET average 2010
0
20
40
60
80
100
120
2006 - 2008 2007 - 2009 2008 - 2010
Pro
gre
ss
Average progress in reading between Year 3 and Year 5
School SSG State DET
0
10
20
30
40
50
60
70
80
2006 - 2008 2007 - 2009 2008 - 2010
Pro
gre
ss
Average progress in writingbetween Year 3 and Year 5
School SSG State DET
9
Spelling
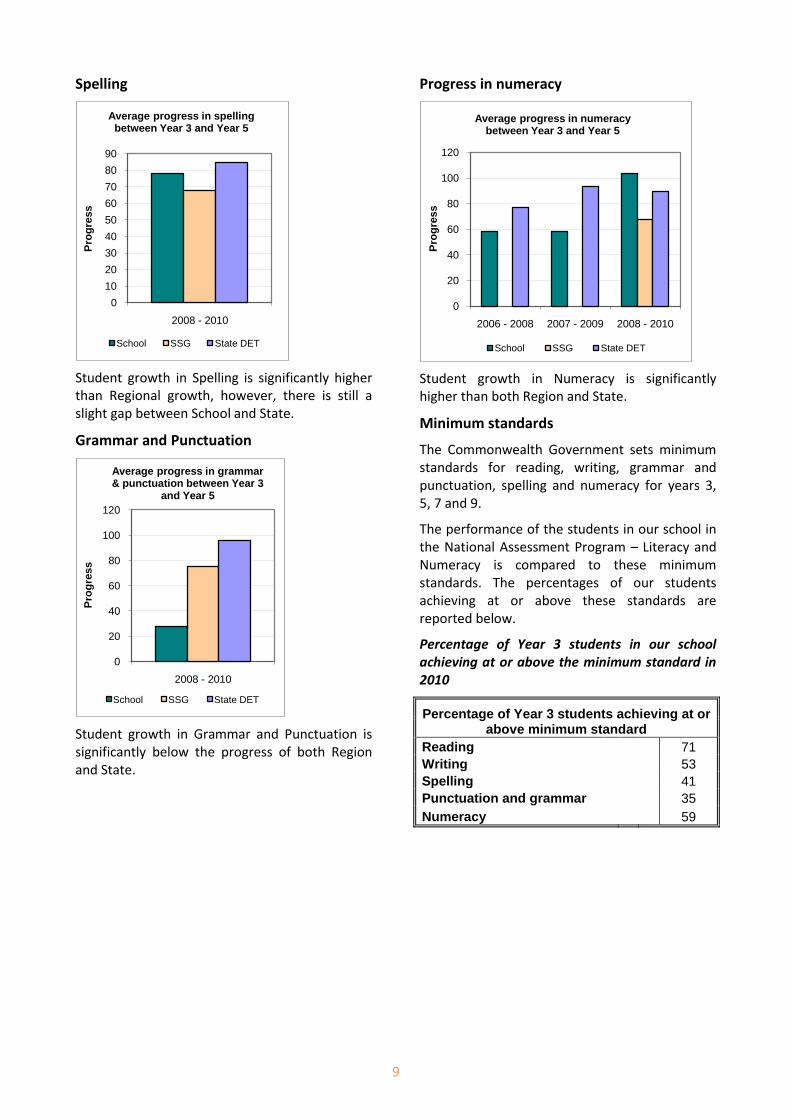
Student growth in Spelling is significantly higher than Regional growth, however, there is still a slight gap between School and State.
Grammar and Punctuation
Student growth in Grammar and Punctuation is significantly below the progress of both Region and State.
Progress in numeracy
Student growth in Numeracy is significantly higher than both Region and State.
Minimum standards
The Commonwealth Government sets minimum standards for reading, writing, grammar and punctuation, spelling and numeracy for years 3, 5, 7 and 9.
The performance of the students in our school in the National Assessment Program – Literacy and Numeracy is compared to these minimum standards. The percentages of our students achieving at or above these standards are reported below.
Percentage of Year 3 students in our school achieving at or above the minimum standard in 2010
Percentage of Year 3 students achieving at or above minimum standard
Reading 71 Writing 53 Spelling 41 Punctuation and grammar 35 Numeracy 59
0
10
20
30
40
50
60
70
80
90
2008 - 2010
Pro
gre
ss
Average progress in spellingbetween Year 3 and Year 5
School SSG State DET
0
20
40
60
80
100
120
2008 - 2010
Pro
gre
ss
Average progress in grammar & punctuation between Year 3
and Year 5
School SSG State DET
0
20
40
60
80
100
120
2006 - 2008 2007 - 2009 2008 - 2010
Pro
gre
ss
Average progress in numeracybetween Year 3 and Year 5
School SSG State DET
10
Percentage of Year 5 students in our school achieving at or above the minimum standard in 2010
Percentage of Year 5 students achieving at or above minimum standard
Reading 33 Writing 41 Spelling 64 Punctuation and grammar 23 Numeracy 45
Significant programs and initiatives
PAS Funding has enabled the school to upgrade one of the existing Assistant Principal positions to a Deputy Principal position. The school also employed two temporary teachers, one to enabling the Assistant Principal to be non-teaching and one to form another class above establishment. The Deputy Principal being responsible for staff professional learning and in class support and the Assistant Principal works predominantly in the area of Student Engagement to co-ordinate all aspects of student well being including behaviour, attendance and the development of PLPs for all students.
CAP funding enabled students to access special events throughout the state and region. These events included The Schools Spectacular, Leadership conferences and training, Technology Camps and excursions.
This funding also contributed to staff being able to attend high quality professional learning throughout the region.
PSP funding contributed to the Literacy and Numeracy initiatives planned by the school. Staff professional learning and the purchase of appropriate resources to enhance student learning were key areas supported by the funds.
PSP also supported the participation of parents and the community in school events. Workshops on Literacy, Numeracy, Technology and Curriculum were offered to the school community on a regular basis.
Schools as Community Centres is well established in the school. The following programs support students and help to maintain and improve community relations:
MEPS Playgroup for young mothers
Hearing and Vision Screenings for Kindergarten and Year 1 students
Breakfast Club for students, three times a week.
A specialist teacher employed to facilitate an extended transition program for students starting Kindergarten.
A weekly gathering, in the school, of a women’s group. The women’s group make regular donations to the school and lend assistance at events such a NATSI day.
The Moree Neighbourhood Centre Lunch Program provides healthy lunches for students in need on a daily basis, free of charge.
Joblink Employment Program provides unemployed community members the opportunity to gain work experience in an educational setting. The participants gain experience as Teacher’s Aides, Library Assistants, General Assistants and Clerical Officers.
Beyond the Line Program initiative is supported by the staff at Moree East PS. Student teachers from Newcastle University visited the school, observed lessons and spent time with class teachers. This program highlights the advantages of teaching in rural communities.
The Keys Room This is an integral component of the You Can Do It social skills program. It provides students with individual and small group support, improving both academic and behavioural aspects of their development; this program has contributed to the reduction of student’s suspensions and increased student engagement in learning.
Aboriginal education
Aboriginal education has a very high priority for the school. Additional programs such as PAS reinforce the school’s emphasis on literacy, numeracy, attendance and student welfare programs. A strong Aboriginal perspective is applied through all aspects of the curriculum. NAIDOC Week celebrations involved all students participating in Aboriginal cultural activities supported by parents, carers and community members.
Students have participated in cultural and dance programs during the year.
11
All students have Personal Learning Plans developed in consultation with parents, students and class teachers.
Norta Norta funding was used to provide Aboriginal students not attaining national benchmarks with additional tuition in the areas of literacy and numeracy.
Moree East PS participated in the Regional Digital Elders Project this year. The aim of the project was to preserve the precious stories of our Aboriginal Elders. The students interviewed and filmed several local elders about their experiences at school, in particular the ‘Moree Mission School’. A curriculum resource was also compiled to accompany the digital resource to be used in classrooms for future generations.
Multicultural education
Students participated in Harmony Day celebrations at school. They learnt about the contributions other cultures have made to the Australian identity. In addition each class was allocated a country and students studied their country for 5 weeks prior to Harmony Day. On Harmony Day they shared what they had learnt, cooked traditional dishes and dressed in traditional costume.
Respect and responsibility
The school is committed to providing programs which ensure the students are taught skills to assist them in developing and applying the values of respect and responsibility.
The implementation of the You Can Do It Program in 2010 continued to reinforce these values through teaching students to understand and use the five keys of:
Getting along Confidence
Organisation Persistence Resilience
The Student Representative Council continued to provide students with the opportunity to develop leadership skills. It also provided the student body an avenue to actively contribute to decision- making and fundraising that benefitted the school and wider community.
Progress on 2010 targets
Target 1
Increase students’ NAPLAN Reading performance, between Year 3 and Year 5 closer to the national growth benchmarks in the literacy strand of inferential comprehension.
Our achievements include:
Student growth in Literacy, in 2010 was close to 50% higher than student growth in Literacy in 2009.
In 2010 Student growth in Literacy at Moree East PS exceeded both Regional and State progress by up to 20%.
Target 2
Increase students’ NAPLAN performance, between Year 3 and Year 5, closer to the national growth benchmarks in the strand of Numeracy.
Our achievements include:
Student growth in Numeracy, in 2010 was over 40% higher than student growth in Numeracy in 2009.
In 2010, student growth in Numeracy at Moree East PS exceeded both Regional and State progress by up to 30%.
Key evaluations
It is a requirement for all NSW public schools to conduct at least two annual evaluations – one related to educational and management practice and the other related to curriculum. In 2010 our school carried out evaluations of Reading and School Culture.
Educational and management practice
School Culture
Background
A target in 2009 was to develop a school culture that respects and responds to every student’s aspirations, gender, culture and learning potential, therefore we decided to conduct a survey to assist in assessing our progress with this target.
Findings and conclusions
Overall, the responses indicated an improvement in school culture. It was felt that the staff
12
generally have a good understanding of the context of the school community and they respond appropriately. Over 90% of staff and students stated that they are proud of the school.
Staff reported concerns about the lack of community involvement within the school and the high level of student absence.
Future directions
A goal for 2011 will be to build up the school P&C as well as increase the level of community involvement within the school. We aim to have a functioning ‘Men’s Group,’ to support students as well as undertake beautification projects within the school and a gardening group and art group that utilize the talents of some of our community members.
The school will again allocate time each week for a member of staff to oversee the strategies being implemented to improve attendance.
Curriculum
Reading – Inferential Comprehension
Background
It was felt that the school needed to assess their teaching of inferential comprehension as NAPLAN results for this strand have been a concern for the last few years.
Findings and conclusions
The school is extremely well resourced and teachers are well supported by the Executive. Staff also had good access to professional learning in this area.
The implementation of Reading to Learn in the upper primary classes has been effective in teaching inferential comprehension.
Teachers are very strong at teaching literal comprehension however more time and resources need to be spent teaching students how to answer inferential comprehension questions. This was also reflected in the 2010 NAPLAN literacy results.
Future directions
The school is committed to improving its approach to the teaching of comprehension, in particular inferential comprehension and will take a whole school approach to producing high quality programming in this area, which includes a strong focus on building and extending student
vocabulary and broadening their general knowledge.
Parent, student, and teacher satisfaction
In 2010 the school sought the opinions of parents, students and teachers about the school.
Their responses are presented below.
Both staff and students felt that the school is continually looking for ways to improve it’s performance and regularly fine-tunes its processes and procedures. They also felt that the school celebrates achievement well.
There were positive comments about the changing culture of the school. The students and staff felt happier being at school. Parents, students and staff stated they felt welcomed and valued as members of the school community.
Student attendance was a concern for parents and staff. Parents and staff also considered the decline in student enrolments an area of major concern.
Professional learning The staff at Moree East Public School were well supported in their professional development and accessed numerous Professional Learning opportunities throughout the year. All Professional Learning is based on individual needs and the School Management Plan. Staff accessed training in a number of different areas, including Reading to Learn, New Scheme Accreditation, Quality Teaching, Literacy development strategies, Best Start, NAPLAN analysis, behaviour management, ICT and Literacy on Track. All staff received personal support from the Deputy Principal in programming, assessment for learning and all other areas of professional development.
School development 2009 – 2011
Moree East Public School will continue to develop the capacity of teaching staff to deliver high quality, engaging educational experiences for our students.
Targets for 2011
13
Target 1
Increase the number of Year 3 and Year 5 students performing in higher bands of the NAPLAN Literacy and Numeracy Test by 5%
Strategies to achieve this target include:
Use whole school planning processes such as NAPLAN result analysis to identify aspects of literacy and numeracy underperformance.
Personalised learning plans to address identified areas of weakness in literacy and numeracy.
Continued implementation of a consistent K-6 numeracy program based on the North Coast model and collaboration and training in each stage to develop joint explicit teaching criteria and best practice strategies for Numeracy.
Focus on the Teaching and Learning Cycle with assessment for learning as the basis for all programming.
Our success will be measured by:
Increased percentages of students in bands 5 and 6 of the NAPLAN.
School based testing, such as the Count Me In Too SENA test indicating improvement over time.
Criteria based marking to assess work samples.
Target 2
The Quality Teaching Framework will be imbedded in all aspects of teaching and learning evident in all teaching programs and students work samples
Strategies to achieve this target include:
Train staff and monitor the implementation of engaging, relevant lessons.
Staff trained in curriculum differentiation.
Teachers undertaking professional learning to enhance the implementation of school initiatives effectively. All teachers to have an annual professional learning plan.
Employ temporary teacher to enable the Deputy Principal to become a non-teaching position in order to build teacher capacity to provide high quality learning opportunities for all students across all curriculum areas, including connected classroom activities.
Our success will be measured by:
Teaching observations of quality, engaging lessons and decreased behaviour disruptions in the classroom.
Teacher programs demonstrating aspects of the Quality Teaching Framework, particularly higher order thinking, relevance and Aboriginal perspectives.
Staff able to identify changes in teaching practices that have contributed to increased achievement levels of student learning outcomes.
An increase in students achieving stage appropriate outcomes.
About this report
In preparing this report, the self-evaluation committee has gathered information from evaluations conducted during the year and analysed other information about the school's practices and student learning outcomes. The self-evaluation committee and school planning committee have determined targets for the school's future development.
Mrs Barbara Beattie, Principal
Mrs Melinda Mikaere, Assistant Principal
Mrs Vicki Quast, Relieving Deputy Principal
Mrs Judith Mills, School Administration Manager
Mrs Leigh Smith, P&C President
School contact information
Moree East Public School
Adelaide Street, Moree 2400
Ph: 02 67521733
Fax: 02 67521553
Email: [email protected]
Web: [email protected]
14
School Code: 4118
Parents can find out more information about Annual School Reports, how to interpret information in the reports and have the opportunity to provide feedback about these reports at: http://www.schools.nsw.edu.au/asr