Embed Size (px)
Citation preview

Annual Route Report
2017 Operating Data
Prepared for: Board of Directors Final 4/26/2018
Upon request, alternative formats of this document will
be produced for people with disabilities. Please call 325-
6094 or TTY (509) 232-6555 or email

Annual Route Report 2 Spokane Transit Authority Final 4/26/2018
Table of Contents Executive Summary ....................................................................................................................................... 3
Section I: Route Performance ....................................................................................................................... 6
Route Performance Overview ................................................................................................................................... 6
Route Performance Standards .................................................................................................................................. 6
Performance Standard I: Ridership ...................................................................................................................... 7
Performance Standard 2: Equivalent Energy Consumption ................................................................................. 8
Performance Standard 3: Fares............................................................................................................................ 9
Summary of 2017 Route Performance ................................................................................................................... 10
Fixed-Routes Meeting All Three Standards ........................................................................................................ 10
Fixed-Routes Unable to Meet One of Three Standards ..................................................................................... 11
Fixed-Routes Unable to Meet Two of Three Standards ..................................................................................... 12
Fixed-Routes Unable to Meet All Three Standards ............................................................................................ 12
Consecutive Year Analysis ....................................................................................................................................... 13
Improvement Watch List .................................................................................................................................... 13
Remediation Plan ............................................................................................................................................... 14
Section II: Route Indicators ......................................................................................................................... 16
Route Indicator Definitions ..................................................................................................................................... 17
Section III: Universal Transit Access Pass (UTAP) ........................................................................................ 20
UTAP Rates Calculation ........................................................................................................................................... 20
UTAP Rates Schedule .............................................................................................................................................. 22
Appendix ..................................................................................................................................................... 23
Section I .................................................................................................................................................................. 23
2017 Route Performance Results ....................................................................................................................... 23
2017/2016 Route Performance Results Comparison ......................................................................................... 24
2017/2016 Boardings Per Revenue Hour Comparison Chart ............................................................................. 25
2017/2016 Energy Benchmark Comparison Chart ............................................................................................. 26
2017/2016 Fares Benchmark Comparison Chart ............................................................................................... 27
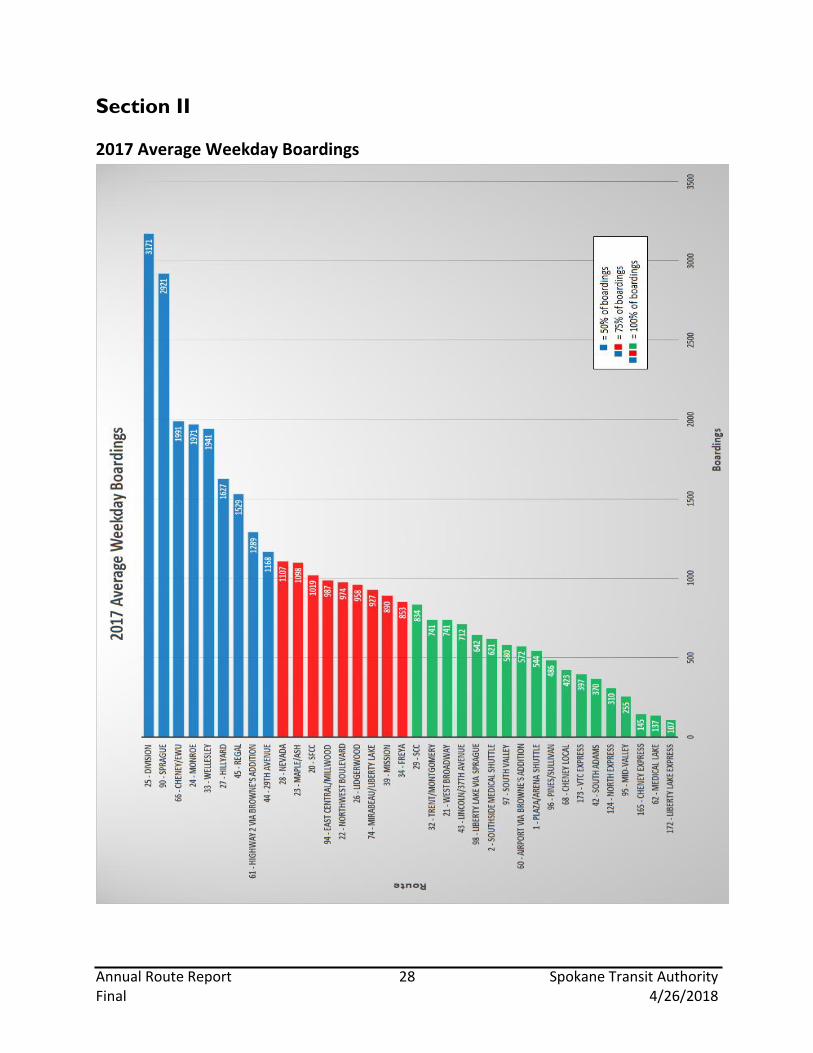
Section II ................................................................................................................................................................. 28
2017 Average Weekday Boardings .................................................................................................................... 28
2017 Total Annual Boardings Comparison to 2016 ............................................................................................ 29

Annual Route Report 3 Spokane Transit Authority Final 4/26/2018
Executive Summary
The Annual Route Report is published each year to inform Spokane Transit staff, the public, and
Board of Directors of the performance of each route compared to three performance
standards: Ridership, Equivalent Energy Consumption, and Fares. Customers expect Spokane
Transit to provide reliable and convenient service in a courteous, cost-effective manner. For
Spokane Transit to ensure the reliability, consistency, and proper development of its transit
services, it must continually evaluate and understand the strengths and weaknesses of the
products offered.
This year marks the ninth Annual Route Report and reflects Spokane Transit’s ongoing
commitment to monitor its performance to ensure the effectiveness and efficiency of Spokane
Transit’s 36 transit routes and to promote overall system improvement through careful
measurement of established performance benchmarks and standards listed in this report. It
should be noted that two new routes (Routes 95 and 172) were created in 2017.
The report is organized into three sections. Section I contains 2017 route performance results,
analysis of consecutive years (2017/2016) and identifies which routes fall below the minimum
standards for those years. Section II contains route indicators including route length, seated
capacity, revenue hours, revenue miles, unallocated cost, average passenger trip length,
passenger boardings, passenger miles, and annual fare revenue. Section III contains information
related to the Universal Transit Access Pass (UTAP) program. The UTAP program enables
members of an organization access to fixed-route transit service through a contract with STA.
Service is paid for based on the actual fare pass usage of its members. Finally, the Appendix
contains tables summarizing the performance results of each section of the report.
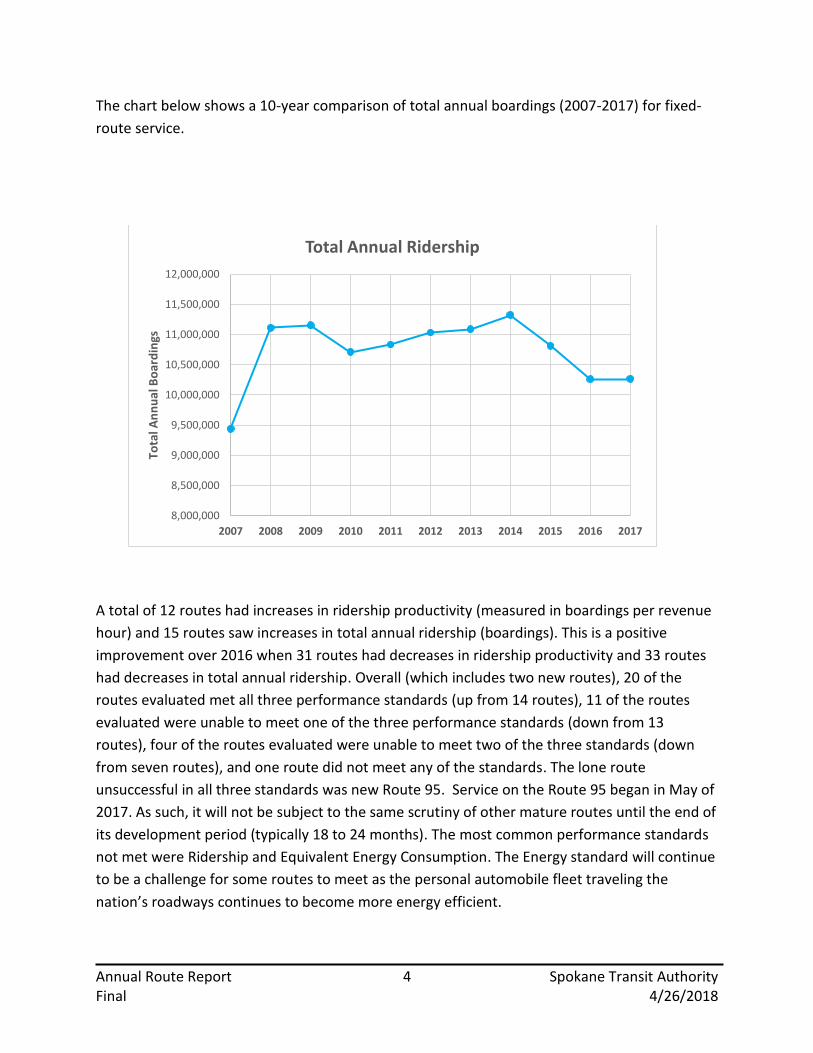
Ridership in 2017 ended the year basically flat with a 0.3% increase compared to ridership in
2016. STA is currently conducting several marketing/communication initiatives to restore
ridership in the most productive markets while some of the other negative ridership effects will
be offset as STA Moving Forward improvements are implemented in the coming years. The
ongoing effect of lower fuel prices was again exacerbated by continued road construction
throughout the Public Transportation Benefit Area (PTBA) in 2017. The lack of snow and ice
conditions in November and December also had an effect on ridership as STA normally
experiences a bump in ridership during inclement weather. It is important to note that ridership
is still approximately 9% higher than it was in 2007.
Annual Route Report 4 Spokane Transit Authority Final 4/26/2018
The chart below shows a 10-year comparison of total annual boardings (2007-2017) for fixed-
route service.
A total of 12 routes had increases in ridership productivity (measured in boardings per revenue
hour) and 15 routes saw increases in total annual ridership (boardings). This is a positive
improvement over 2016 when 31 routes had decreases in ridership productivity and 33 routes
had decreases in total annual ridership. Overall (which includes two new routes), 20 of the
routes evaluated met all three performance standards (up from 14 routes), 11 of the routes
evaluated were unable to meet one of the three performance standards (down from 13
routes), four of the routes evaluated were unable to meet two of the three standards (down
from seven routes), and one route did not meet any of the standards. The lone route
unsuccessful in all three standards was new Route 95. Service on the Route 95 began in May of
2017. As such, it will not be subject to the same scrutiny of other mature routes until the end of
its development period (typically 18 to 24 months). The most common performance standards
not met were Ridership and Equivalent Energy Consumption. The Energy standard will continue
to be a challenge for some routes to meet as the personal automobile fleet traveling the
nation’s roadways continues to become more energy efficient.
8,000,000
8,500,000
9,000,000
9,500,000
10,000,000
10,500,000
11,000,000
11,500,000
12,000,000
2007 2008 2009 2010 2011 2012 2013 2014 2015 2016 2017
Tota
l An
nu
al B
oar
din
gs
Total Annual Ridership

Annual Route Report 5 Spokane Transit Authority Final 4/26/2018
Any route that falls below the minimum standard for any one of the three performance
standards for two consecutive years will be considered out of compliance. These routes are
placed on an out of compliance list followed by a remediation plan that states possible
solutions in order to improve performance. The remediation plan may correspond with the
Service Implementation Plan (Section 5 of the current Transit Development Plan) where
feasible while some routes will continue to be monitored even though they are out of
compliance due to long term improvements contained in STA Moving Forward plan.

Annual Route Report 6 Spokane Transit Authority Final 4/26/2018
Section I: Route Performance
Route Performance Overview
In December 2009, the Spokane Transit Board of Directors adopted the Fixed-Route Service
Design Guidelines to guide the planning, implementation, and monitoring of fixed-route transit
service in order to steer Spokane Transit staff through the 2010/2011 service reductions. These
guidelines and standards were ultimately merged into the Fixed Route element and Annex I
Fixed-Route Performance Standards contained in Connect Spokane: A Comprehensive Plan for
Public Transportation adopted by the Board of Directors in July of 2010.
An essential part of the required performance monitoring is to evaluate operating data for the
prior year of service. This section uses operating data from 2017. As a snapshot of the system
and individual routes, this report is an essential tool for evaluating and planning for
improvements in transit service.
Routes are rated annually against three performance standards: Ridership, Comparable Energy
Consumption, and Fares. Each of these standards has a benchmark score which is calculated
annually. A route which meets a performance standard’s benchmark in either or both of the
previous two years is considered to meet that performance standard. (In other words, a single
year of substandard performance is not considered a failure in this report.)
The Appendix shows a table comparing 2017 with 2016 and summarizes whether each route
passed or was unable to meet a particular benchmark. Furthermore, it is noted under the
Consecutive Year Analysis section whether a route did not meet a performance measure for
consecutive years.
Route Performance Standards
As stated in Connect Spokane, any route that falls below the minimum standard for any one of
the three performance standards for two consecutive years will be considered out of
compliance. The Consecutive Year Analysis section contains a list of routes out of compliance.
New service will be evaluated following its development period, typically 18 to 24 months. A
partial year of operation (e.g. if a route begins operating in May or September) will not be
counted against a route’s compliance with these standards. There are two routes that this
applies to. Route 95 began service in May 2017 and Route 172 began service in September
2017.

Annual Route Report 7 Spokane Transit Authority Final 4/26/2018
As stated previously, the performance standards measure the success of the fixed-route service
based upon the three performance standards. Routes are compared against annual benchmark
scores set for routes similar in service type and/or vehicle types. The service types and
performance standards used are explained below.
Performance Standard I: Ridership
Ridership is a critical metric for evaluating the system’s effectiveness to serve people and the
places to which they travel. STA may desire to serve a particular facility, location, or
community, but the route may still fail to attract ridership. In such cases, it is important to
identify why the route is not performing well and what steps can be taken to remediate the
route. See Consecutive Year Analysis section for a remediation plan for routes out of
compliance.
One of the best indicators of potential performance is a route’s relation to the CBD (Central
Business District). A route which serves the CBD has more connectivity than other routes.
Consequently, it must meet a higher expectation due to the downtown Plaza’s finite number of
bus bays and overall capacity. Accordingly, use of the Plaza’s capacity should be focused on
routes with a higher level of effectiveness in terms of ridership.
The metric used for ridership is Boardings per Revenue Hour. Revenue hours represent the
hours the bus is in service. Boardings per Revenue Hour are calculated by dividing the annual
boardings of a route by the annual revenue hours of that same route. The chart below shows a
10-year comparison of total annual revenue hours (2007-2017) for fixed-route service.
Ridership benchmarks are based upon the average Boardings per Revenue Hour for all basic
routes that intersect the CBD.
350,000
360,000
370,000
380,000
390,000
400,000
410,000
420,000
430,000
440,000
450,000
2007 2008 2009 2010 2011 2012 2013 2014 2015 2016 2017
Re
ven
ue
Ho
urs
Total Annual Revenue Hours

Annual Route Report 8 Spokane Transit Authority Final 4/26/2018
Ridership benchmarks for specific service types are calculated as follows:
Basic routes intersecting the CBD must meet a minimum ridership benchmark that is one-half standard deviation below the average of the basic CBD routes. In 2017 that average was 23.51 Boardings per Revenue Hour. This equates to a benchmark of 19.68 Boardings per Revenue Hour. This benchmark was 20.52 in 2016.
Basic routes NOT intersecting the CBD must meet a minimum ridership benchmark one-half that for basic routes that do intersect the CBD. This equates to a benchmark of 9.84 Boardings per Revenue Hour in 2017. This benchmark was 10.26 in 2016.
Commuter Peak routes must meet a minimum ridership benchmark one-half standard deviation above the average of the basic routes. This equates to a benchmark of 27.34 Boardings per Revenue Hour in 2017 (27.74 in 2016). For routes that operate as a function of what would otherwise be out-of-service time on a route (“Commuter Peak – Subordinate”) the standard is equal to one-third the Commuter Peak benchmark. For 2017, this equates to a benchmark of 9.11 Boardings per Revenue Hour (9.25 in 2016). Routes 165 and 172 (new in 2017) are the only routes classified as Commuter Peak – Subordinate.
STA may consider modifying the calculation of the Commuter Peak standard because it
continues to be a challenge for express routes to meet the standard. Route 165 meets the
standard only because it has been designated a “Commuter Peak – Subordinate” route which
results in a lower benchmark to meet. The route is technically not a true express route due to
the number of stops in the City of Cheney and it will be discontinued in September 2018. Route
174 was renumbered Route 74 and renamed Mirabeau/Liberty Lake in September 2017. The
route was also reclassified as a basic route intersecting the CBD due to added mid-day
frequency. As a result, the route finally met the ridership standard.
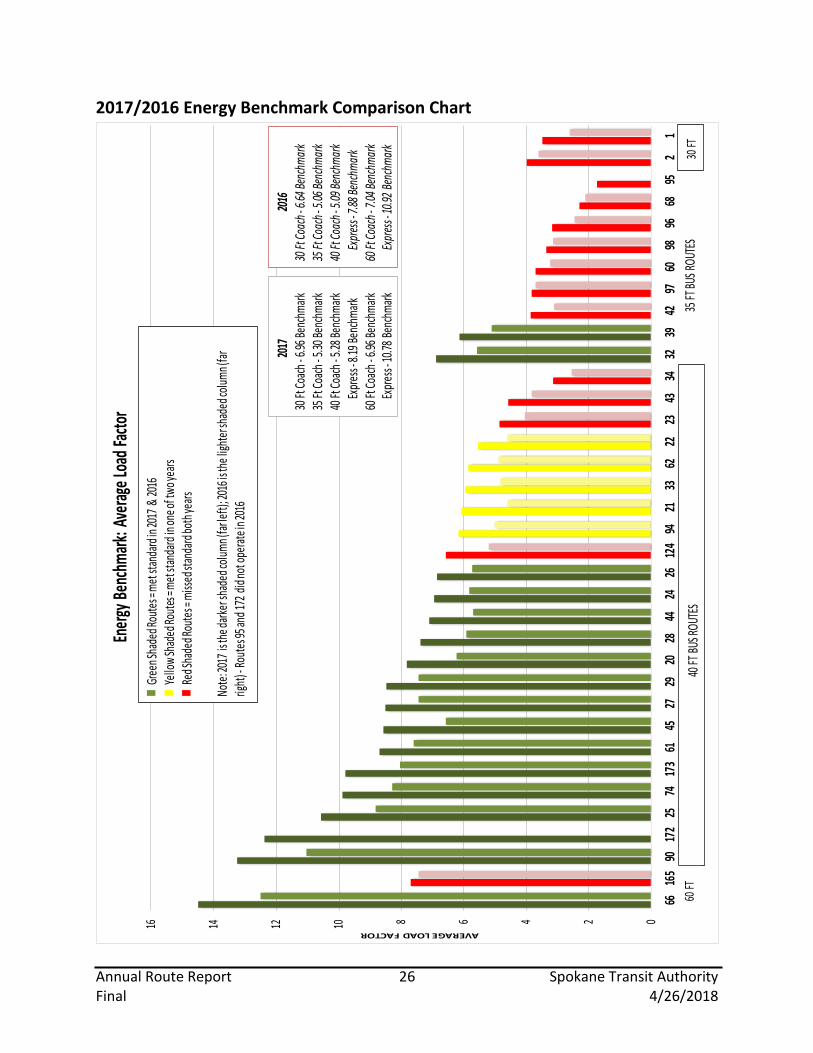
Performance Standard 2: Equivalent Energy Consumption
There is great potential in the use of mass transit over the personal automobile to conserve
energy and lessen human impact on the environment. Typically, energy consumption is shown
by the number of single-occupancy vehicle (SOV) trips reduced by the use of mass transit, but
this measure does not take into account that a transit bus is much heavier than a personal
vehicle and consumes more energy per vehicle mile.
The Equivalent Energy Consumption standard relates to the duration of a passenger’s ride time
on a vehicle. As stated in Connect Spokane, a bus route should at minimum perform equally to
the private automobile in terms of energy consumed per mile traveled for each passenger. The
private automobile is improving in efficiency each year. For example, in 2000 the fuel economy
in terms of miles per gallon was 21.9 mpg and that number is 26.2 mpg in 2015 (number used
in this report because that is the most recent data available).
Annual Route Report 9 Spokane Transit Authority Final 4/26/2018
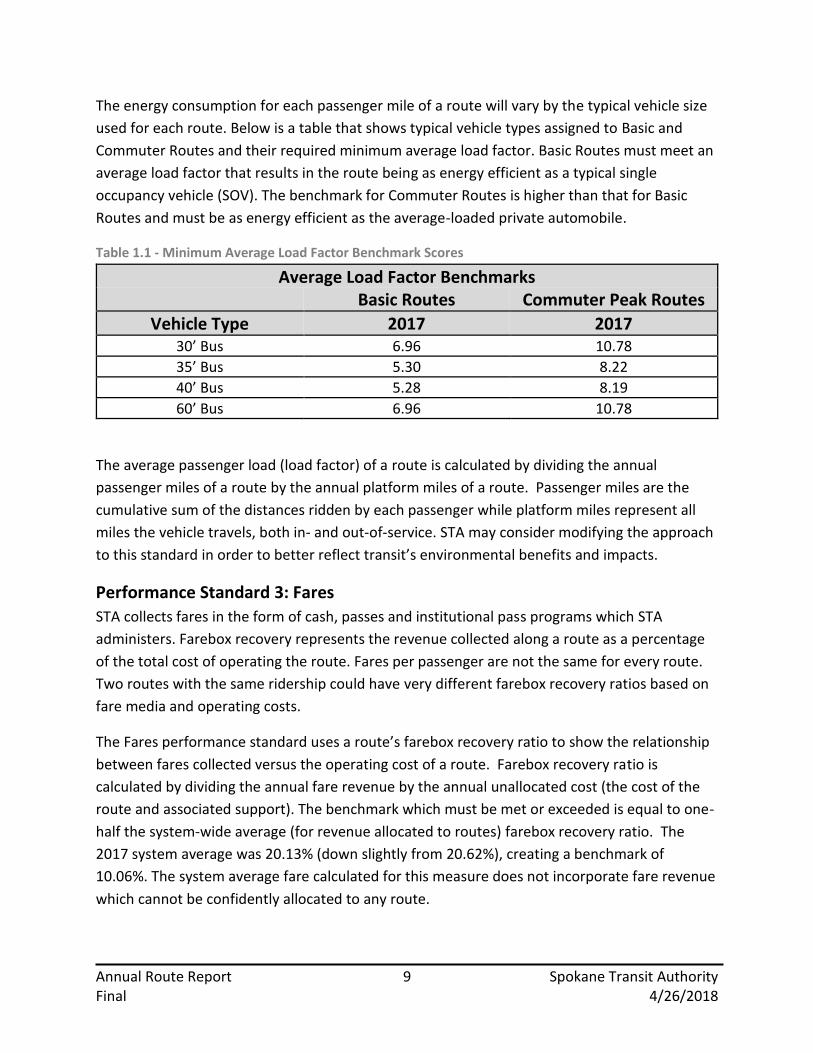
The energy consumption for each passenger mile of a route will vary by the typical vehicle size
used for each route. Below is a table that shows typical vehicle types assigned to Basic and
Commuter Routes and their required minimum average load factor. Basic Routes must meet an
average load factor that results in the route being as energy efficient as a typical single
occupancy vehicle (SOV). The benchmark for Commuter Routes is higher than that for Basic
Routes and must be as energy efficient as the average-loaded private automobile.
Table 1.1 - Minimum Average Load Factor Benchmark Scores
Average Load Factor Benchmarks Basic Routes Commuter Peak Routes
Vehicle Type 2017 2017 30’ Bus 6.96 10.78
35’ Bus 5.30 8.22
40’ Bus 5.28 8.19
60’ Bus 6.96 10.78
The average passenger load (load factor) of a route is calculated by dividing the annual
passenger miles of a route by the annual platform miles of a route. Passenger miles are the
cumulative sum of the distances ridden by each passenger while platform miles represent all
miles the vehicle travels, both in- and out-of-service. STA may consider modifying the approach
to this standard in order to better reflect transit’s environmental benefits and impacts.
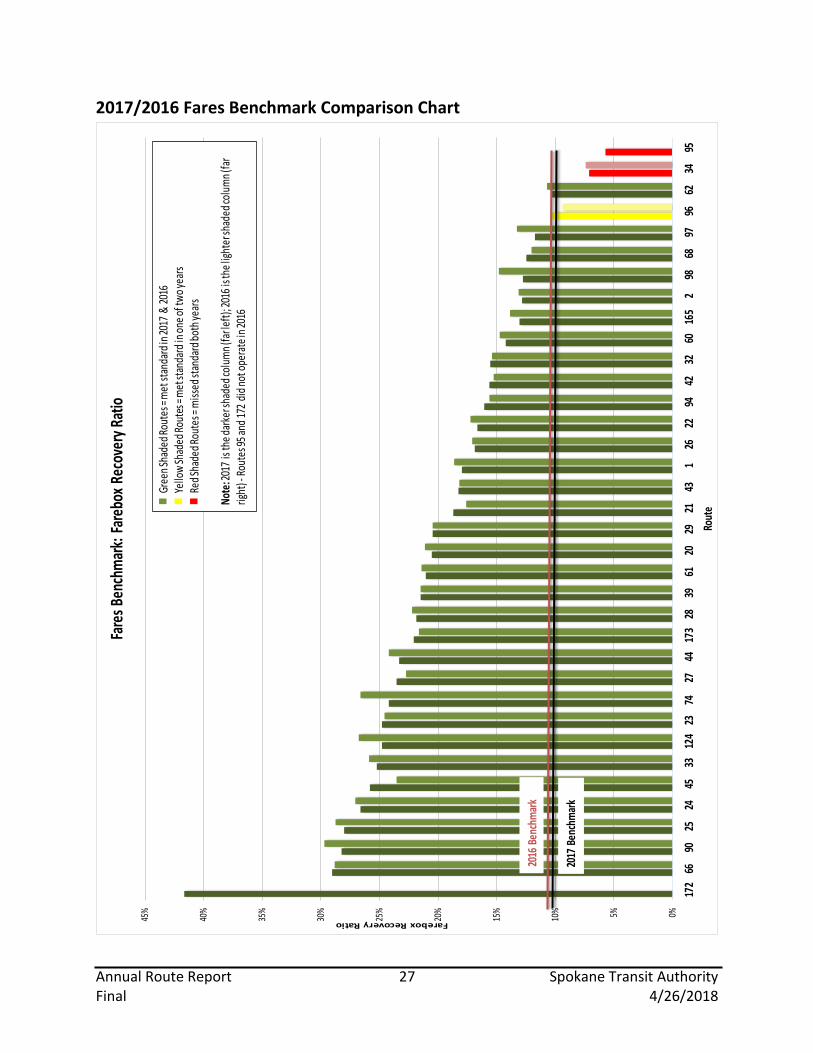
Performance Standard 3: Fares
STA collects fares in the form of cash, passes and institutional pass programs which STA
administers. Farebox recovery represents the revenue collected along a route as a percentage
of the total cost of operating the route. Fares per passenger are not the same for every route.
Two routes with the same ridership could have very different farebox recovery ratios based on
fare media and operating costs.
The Fares performance standard uses a route’s farebox recovery ratio to show the relationship
between fares collected versus the operating cost of a route. Farebox recovery ratio is
calculated by dividing the annual fare revenue by the annual unallocated cost (the cost of the
route and associated support). The benchmark which must be met or exceeded is equal to one-
half the system-wide average (for revenue allocated to routes) farebox recovery ratio. The
2017 system average was 20.13% (down slightly from 20.62%), creating a benchmark of
10.06%. The system average fare calculated for this measure does not incorporate fare revenue
which cannot be confidently allocated to any route.

Annual Route Report 10 Spokane Transit Authority Final 4/26/2018
Summary of 2017 Route Performance
The following section outlines the performance of all routes subject to performance monitoring
for 2017. A route will be considered to have been unable to meet a performance standard if it is
not in compliance for two consecutive years. Please refer to the Appendix for a detailed
breakdown of each of the three performance standards for all routes and for a table comparing
2017 with 2016 that summarizes whether each route passed or was unable to meet a particular
benchmark for each year. Further detailed analysis is contained in the coming section titled
Consecutive Year Analysis. This includes a watch list of routes that may require corrective action
in the future. As noted before, it will be difficult for some routes to meet the Equivalent Energy
Consumption Standard due to the short route length thereby producing very low average trip
lengths which produces lower annual passenger miles. Passengers can only travel limited
distances on these routes. For example, the outbound distance for Route 1 Plaza/Arena Shuttle
is only 1.19 miles. Because the typical vehicle size on the route is a 30 foot bus, the benchmark
is higher at 6.96. Furthermore, some routes have excess revenue hours because they take on
more recovery/layover time for partner routes within the interline causing the partner routes
to perform better. One such case is Route 34 Freya; however, the route still needs to be
performing better due to its 15 minute frequency. The route takes on most of the recovery time
for the entire City Loop as set up in the Trapeze scheduling software. It is important to take this
into deliberate consideration when proposing potential service changes that would improve
performance.
Fixed-Routes Meeting All Three Standards
Table 1.2 indicates routes that met STA’s standards for Ridership, Equivalent Energy
Consumption, and Fares for 2017. Twenty routes met all three standards which is up from 14
routes. New to the list are Routes 21 Broadway, 22 Northwest Blvd, 33 Wellesley, 74
Mirabeau/Liberty Lake (formerly 174), 94 East Central/Millwood and 172 Liberty Lake Express
(new route). Route 74 made the list due to reclassifying the route from Commuter Peak to Basic
because 30 minute mid-day weekday frequency was added to the route in 2017. As a result, the
route was able to meet the Ridership standard. Of the routes on the list below, Routes 21
Broadway, 27 Hillyard, 28 Nevada, 32 Trent/Montgomery, 33 Wellesley, 39 Mission, 45 Regal,
74 Mirabeau/Liberty Lake, and 94 East Central/Millwood had increases in total boardings over
2016, with Routes 21 and 45 leading the way with 6.6% and 8.4% increases respectively.
Although a route may meet all three standards, the route may still be a candidate for future
revisions as the future High Performance Transit Network begins to take shape and STA Moving
Forward projects are implemented in the coming years.
Annual Route Report 11 Spokane Transit Authority Final 4/26/2018
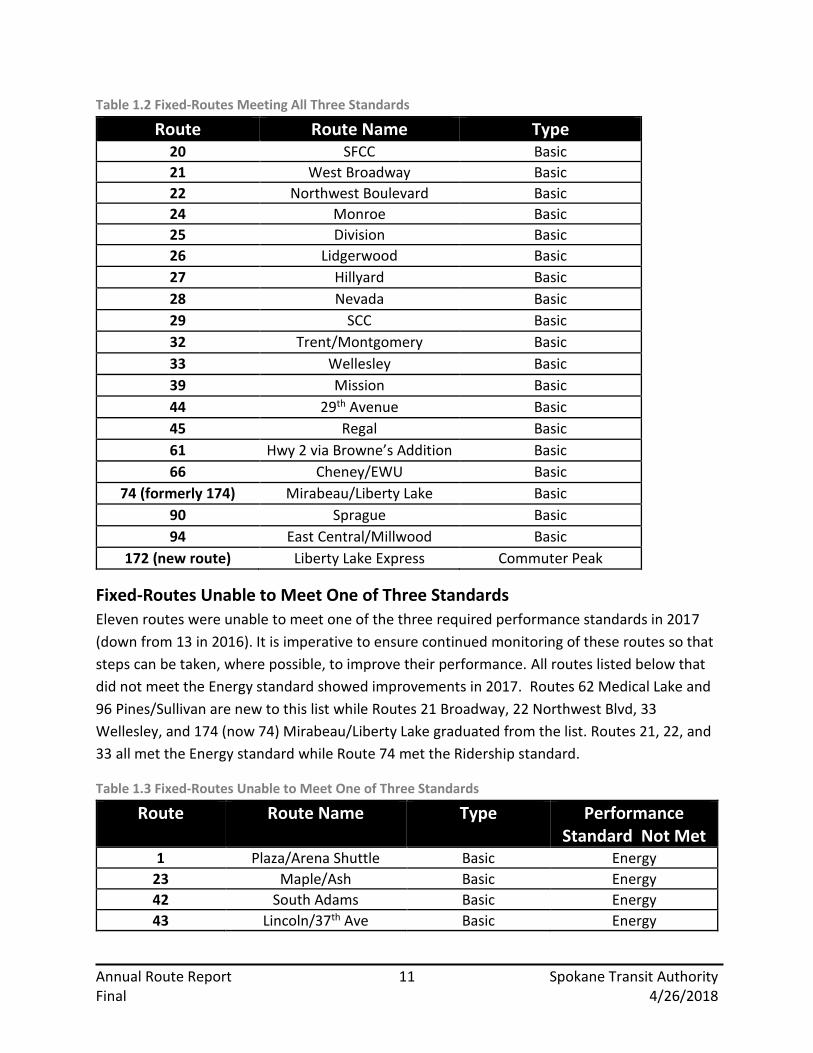
Table 1.2 Fixed-Routes Meeting All Three Standards
Route Route Name Type 20 SFCC Basic
21 West Broadway Basic
22 Northwest Boulevard Basic
24 Monroe Basic
25 Division Basic
26 Lidgerwood Basic
27 Hillyard Basic
28 Nevada Basic
29 SCC Basic
32 Trent/Montgomery Basic
33 Wellesley Basic
39 Mission Basic
44 29th Avenue Basic
45 Regal Basic
61 Hwy 2 via Browne’s Addition Basic
66 Cheney/EWU Basic
74 (formerly 174) Mirabeau/Liberty Lake Basic
90 Sprague Basic
94 East Central/Millwood Basic
172 (new route) Liberty Lake Express Commuter Peak
Fixed-Routes Unable to Meet One of Three Standards
Eleven routes were unable to meet one of the three required performance standards in 2017
(down from 13 in 2016). It is imperative to ensure continued monitoring of these routes so that
steps can be taken, where possible, to improve their performance. All routes listed below that
did not meet the Energy standard showed improvements in 2017. Routes 62 Medical Lake and
96 Pines/Sullivan are new to this list while Routes 21 Broadway, 22 Northwest Blvd, 33
Wellesley, and 174 (now 74) Mirabeau/Liberty Lake graduated from the list. Routes 21, 22, and
33 all met the Energy standard while Route 74 met the Ridership standard.
Table 1.3 Fixed-Routes Unable to Meet One of Three Standards
Route Route Name Type Performance Standard Not Met
1 Plaza/Arena Shuttle Basic Energy
23 Maple/Ash Basic Energy
42 South Adams Basic Energy
43 Lincoln/37th Ave Basic Energy
Annual Route Report 12 Spokane Transit Authority Final 4/26/2018
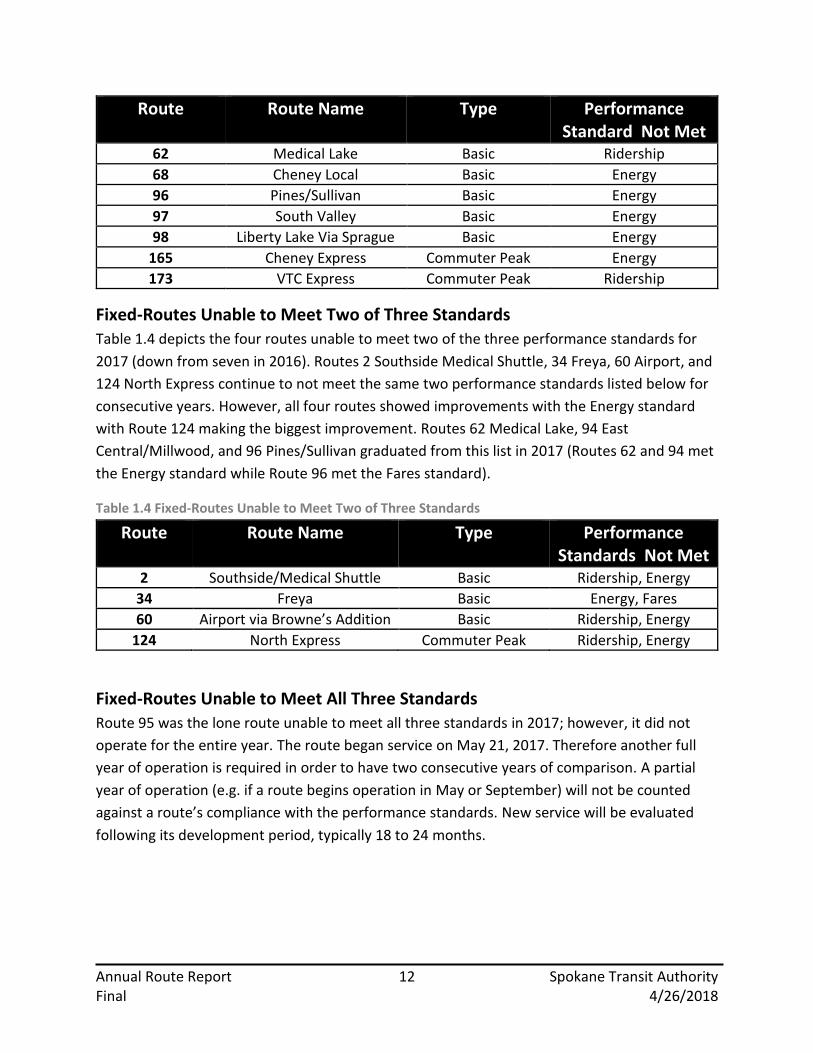
Route Route Name Type Performance Standard Not Met
62 Medical Lake Basic Ridership
68 Cheney Local Basic Energy
96 Pines/Sullivan Basic Energy
97 South Valley Basic Energy
98 Liberty Lake Via Sprague Basic Energy
165 Cheney Express Commuter Peak Energy
173 VTC Express Commuter Peak Ridership
Fixed-Routes Unable to Meet Two of Three Standards
Table 1.4 depicts the four routes unable to meet two of the three performance standards for
2017 (down from seven in 2016). Routes 2 Southside Medical Shuttle, 34 Freya, 60 Airport, and
124 North Express continue to not meet the same two performance standards listed below for
consecutive years. However, all four routes showed improvements with the Energy standard
with Route 124 making the biggest improvement. Routes 62 Medical Lake, 94 East
Central/Millwood, and 96 Pines/Sullivan graduated from this list in 2017 (Routes 62 and 94 met
the Energy standard while Route 96 met the Fares standard).
Table 1.4 Fixed-Routes Unable to Meet Two of Three Standards
Route Route Name Type Performance Standards Not Met
2 Southside/Medical Shuttle Basic Ridership, Energy
34 Freya Basic Energy, Fares
60 Airport via Browne’s Addition Basic Ridership, Energy
124 North Express Commuter Peak Ridership, Energy
Fixed-Routes Unable to Meet All Three Standards
Route 95 was the lone route unable to meet all three standards in 2017; however, it did not
operate for the entire year. The route began service on May 21, 2017. Therefore another full
year of operation is required in order to have two consecutive years of comparison. A partial
year of operation (e.g. if a route begins operation in May or September) will not be counted
against a route’s compliance with the performance standards. New service will be evaluated
following its development period, typically 18 to 24 months.

Annual Route Report 13 Spokane Transit Authority Final 4/26/2018
Consecutive Year Analysis
Standards imply accountability, comparison, and remediation in the event of non-compliance.
As stated earlier, any route that falls below the minimum standard for any one of the three
performance standards for two consecutive years will be considered out of compliance. A
partial year of operation (e.g. if a route begins operating in May or September) will not be
counted against a route’s compliance with these standards. This applies to Route 95 which
began service in May 2017 and will not be listed below.
Improvement Watch List
Table 1.5 shows the current watch list of routes out of compliance for two consecutive years.
The “X” indicates what standard the route was unable to meet for consecutive years. It should
be noted that Routes 94 East Central/Millwood and 74 Mirabeau/Liberty Lake (formerly Route
174) both met the Ridership standard in 2017 and were taken off the list. Route 96
Pines/Sullivan met the Fares standard in 2017 for the first time in four years but is still on the
list due to not meeting the Energy standard. Route 34 Freya narrowly met the Ridership
standard again in 2017 despite operating with 15 minute weekday frequency.
Table 1.5 Improvement Watch List
Route 2017 Standard Not Met 2016 Standard Not Met
Ridership Energy Fares Ridership Energy Fares
1 X X
2 X X X X
23 X X
34 X X X X
42 X X
43 X X
60 X X X X
62 X X X
68 X X
96 X X X
97 X X
98 X X
124 X X X X
165 X X
173 X X

Annual Route Report 14 Spokane Transit Authority Final 4/26/2018
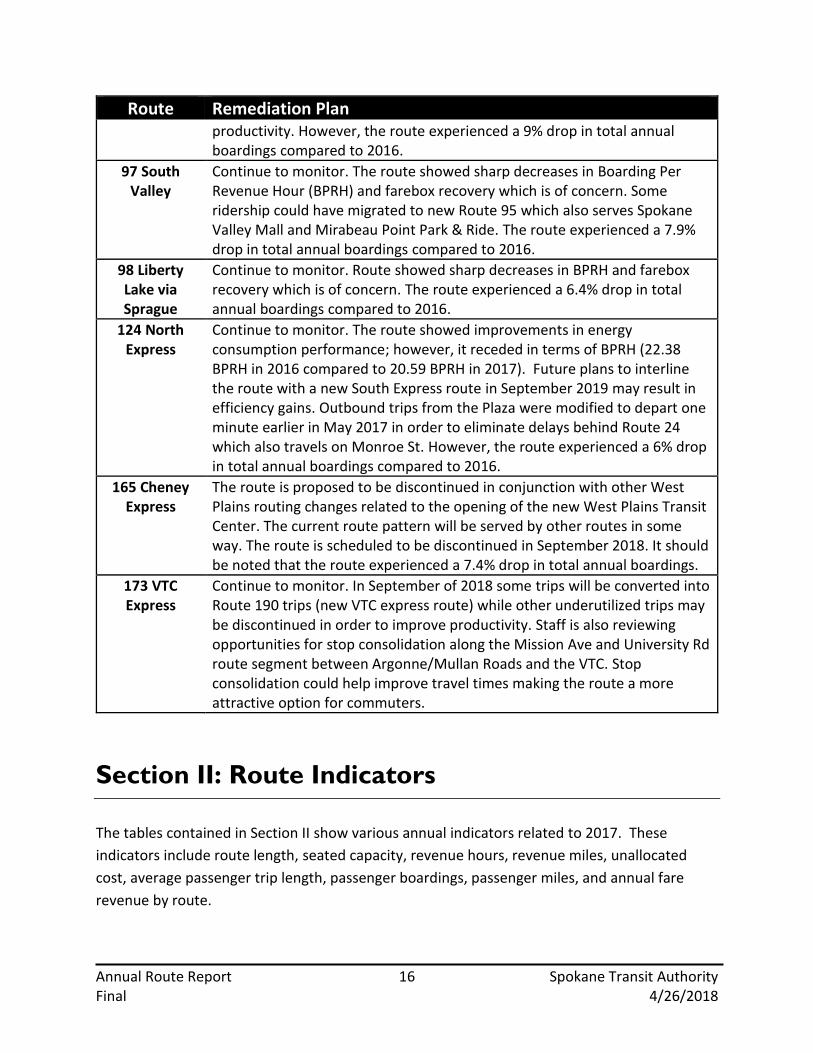
Remediation Plan
Table 1.6 indicates the plan of remediation related to each of the routes that did not meet one
or more standard for consecutive years. Many of these routes have been on the list for seven
consecutive years.
Table 1.6 Remediation Plan
Route Remediation Plan 1 Plaza/Arena
Shuttle Continue to monitor and work with Downtown Spokane Partnership, the third party in the contract with STA and the Public Facilities District, to continue to pursue strategies to re-invigorate marketing to downtown businesses that benefit from this service. The outbound one-way loop pattern was modified to provide a more direct trip back to the Arena Lot in September 2017. This could be a contributing factor to why there was a 1.1% increase in total annual boardings compared to 2016. Consider modifying energy benchmark.
2 Southside Medical Shuttle
Continue to monitor. Performance may be improved by extending the route to serve the new U-District bike and pedestrian bridge as planned to connect to the South University District. This improvement is scheduled to be implemented in September 2018. Consider modifying energy benchmark.
23 Maple/Ash Continue to monitor. The route continues to perform well with 31.01 Boardings Per Revenue Hour (BPRH) in 2017, an improvement over 2016 (30.29 BPRH). Plans to extend to Indian Trail end-of-line on all trips (weekdays and weekends) would likely yield longer passenger trips thereby improving the performance for the Energy standard. This improvement is scheduled to be implemented in September 2018. The route is also proposed to be modified to serve Boone Ave between Monroe and Maple/Ash Streets.
34 Freya Continue to monitor. The route continues to underperform in all three categories; however, it did narrowly meet the Ridership benchmark again in 2017 with a lower overall benchmark for routes not traveling to the CBD. Some of the resources on the route may be redirected to serve 17th Ave between Ray and Perry streets by reducing the frequency to 30 minutes. The current City Loop route segment from South Hill Park & Ride north to Spokane Community College does not justify 15 minute weekday frequency. Subject to public input and board action this change could take place in September 2019 with the implementation of the Monroe-Regal HPT Line (interlining of routes 24 and 44, a portion of 45) which will impact the entire City Loop and other South Hill routes.
42 South Adams
Continue to monitor. Route showed improvements with both the Ridership and the Energy standards. All routes serving the South Hill are subject to revisions in September 2019 with the implementation of the Monroe-Regal HPT Line.

Annual Route Report 15 Spokane Transit Authority Final 4/26/2018
Route Remediation Plan 43
Lincoln/37th Ave
Continue to monitor. Route showed improvements with both the Ridership and the Energy standards. All routes serving the South Hill are subject to revisions in September 2019 with the implementation of the Monroe-Regal HPT Line.
60 Airport via Browne’s Addition
Continue to monitor. The route serves the airport (a major regional destination) and likely would perform worse if it did not travel through Browne’s Addition. Much of the current routing (minus the airport) will be served by the Central City Line in September 2021. The route was extended to serve Airway Heights/Northern Quest Casino on weekends in May 2017 which could improve productivity in the near term. However, the route has excessive layover at the end-of-the-line on weekends in order to preserve the Route 61 frequency offset through Browne’s Addition. The long layover decreases overall productivity.
62 Medical Lake
Continue to monitor. Current service was approved with the September 2011 service change. As stated in Board Resolution No. 675-11, “the Route 62 final recommendation is an exception to the Board’s Comprehensive Plan policy to provide Basic Interurban service at a minimum frequency on weekdays (FR Policy 4.0) and will not likely adhere to approved performance standards.” Given the current route structure, adding more service (revenue hours) would reduce the route’s performance compared to the standards. The construction of the West Plains Transit Center located at Exit 272 of I-90 would address this issue by creating a new route that would serve Medical Lake (connecting the city to Airway Heights in September 2020) with a Basic Interurban route that has lower productivity standards because the route would not travel to the CBD. In the near term, Route 62 is proposed to be modified to discontinue travel on I-90 and would have terminals at Medical Lake Center and the new West Plains Transit Center. This is set to be implemented in September 2018 pending STA Board approval of the Final Recommendation.
68 Cheney Local
Continue to monitor. Energy standard will be difficult to meet due to the short route length thereby producing very low average trip lengths which produces lower annual passenger miles. Passengers can only travel limited distances on this route. Route 68 is proposed to be modified to serve Simpson Pkwy/McKeehan Way and the Presley Dr/Salnave Rd loop with seven-days a week all day service. This could improve productivity by simplifying the route pattern and increasing ridership along the Presley Dr/Salnave Rd loop, which is currently only served weekdays during the peak period via Route 165. These improvements are scheduled to be implemented in September 2018.
96 Pines/Sullivan
Continue to monitor. The route was modified to eliminate out of direction travel to Mirabeau Park & Ride in May 2017 which could improve
Annual Route Report 16 Spokane Transit Authority Final 4/26/2018
Route Remediation Plan productivity. However, the route experienced a 9% drop in total annual boardings compared to 2016.
97 South Valley
Continue to monitor. The route showed sharp decreases in Boarding Per Revenue Hour (BPRH) and farebox recovery which is of concern. Some ridership could have migrated to new Route 95 which also serves Spokane Valley Mall and Mirabeau Point Park & Ride. The route experienced a 7.9% drop in total annual boardings compared to 2016.
98 Liberty Lake via Sprague
Continue to monitor. Route showed sharp decreases in BPRH and farebox recovery which is of concern. The route experienced a 6.4% drop in total annual boardings compared to 2016.
124 North Express
Continue to monitor. The route showed improvements in energy consumption performance; however, it receded in terms of BPRH (22.38 BPRH in 2016 compared to 20.59 BPRH in 2017). Future plans to interline the route with a new South Express route in September 2019 may result in efficiency gains. Outbound trips from the Plaza were modified to depart one minute earlier in May 2017 in order to eliminate delays behind Route 24 which also travels on Monroe St. However, the route experienced a 6% drop in total annual boardings compared to 2016.
165 Cheney Express
The route is proposed to be discontinued in conjunction with other West Plains routing changes related to the opening of the new West Plains Transit Center. The current route pattern will be served by other routes in some way. The route is scheduled to be discontinued in September 2018. It should be noted that the route experienced a 7.4% drop in total annual boardings.
173 VTC Express
Continue to monitor. In September of 2018 some trips will be converted into Route 190 trips (new VTC express route) while other underutilized trips may be discontinued in order to improve productivity. Staff is also reviewing opportunities for stop consolidation along the Mission Ave and University Rd route segment between Argonne/Mullan Roads and the VTC. Stop consolidation could help improve travel times making the route a more attractive option for commuters.
Section II: Route Indicators
The tables contained in Section II show various annual indicators related to 2017. These
indicators include route length, seated capacity, revenue hours, revenue miles, unallocated
cost, average passenger trip length, passenger boardings, passenger miles, and annual fare
revenue by route.
Annual Route Report 17 Spokane Transit Authority Final 4/26/2018
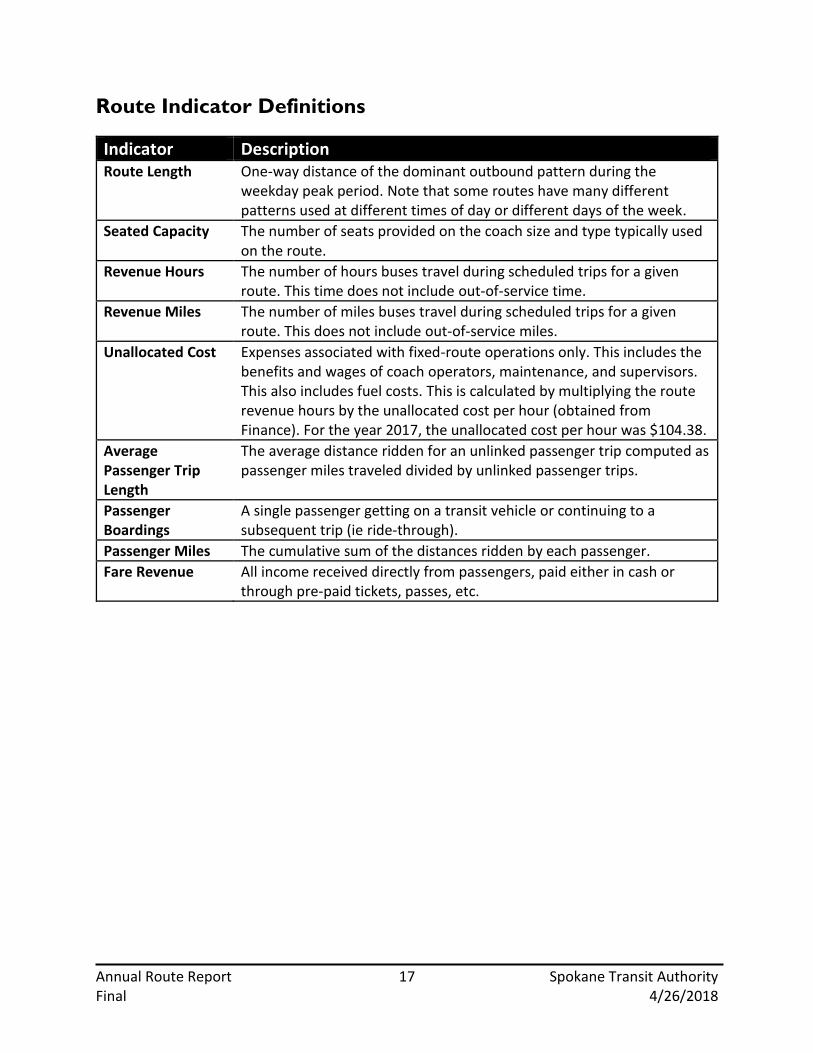
Route Indicator Definitions
Indicator Description Route Length One-way distance of the dominant outbound pattern during the
weekday peak period. Note that some routes have many different patterns used at different times of day or different days of the week.
Seated Capacity The number of seats provided on the coach size and type typically used on the route.
Revenue Hours The number of hours buses travel during scheduled trips for a given route. This time does not include out-of-service time.
Revenue Miles The number of miles buses travel during scheduled trips for a given route. This does not include out-of-service miles.
Unallocated Cost Expenses associated with fixed-route operations only. This includes the benefits and wages of coach operators, maintenance, and supervisors. This also includes fuel costs. This is calculated by multiplying the route revenue hours by the unallocated cost per hour (obtained from Finance). For the year 2017, the unallocated cost per hour was $104.38.
Average Passenger Trip Length
The average distance ridden for an unlinked passenger trip computed as passenger miles traveled divided by unlinked passenger trips.
Passenger Boardings
A single passenger getting on a transit vehicle or continuing to a subsequent trip (ie ride-through).
Passenger Miles The cumulative sum of the distances ridden by each passenger.
Fare Revenue All income received directly from passengers, paid either in cash or through pre-paid tickets, passes, etc.

Annual Route Report 18 Spokane Transit Authority Final 4/26/2018
Table 2.1 Route Length, Seated Capacity, Revenue Hours, Revenue Miles, and Unallocated Costs
Route Route Name
One Way
Route Length
Typical Seated
Capacity
Annual
Revenue Hours
Annual
Revenue Miles
Annual
Unallocated Cost
1 Plaza/Arena 1.19 26 6,202 30,788 647,340.75$
2 Southside Medical Shuttle 2.84 26 9,944 63,926 1,037,982.90$
20 SFCC 4.01 39 9,087 133,866 948,492.71$
21 West Broadway 2.94 39 8,674 63,741 905,339.93$
22 Northwest Boulevard 8.31 39 12,548 153,767 1,309,742.50$
23 Maple/Ash 9.10 39 9,957 145,076 1,039,303.31$
24 Monroe 5.02 39 16,786 167,848 1,752,077.80$
25 Division 9.18 39 30,016 352,743 3,133,061.73$
26 Lidgerwood 8.51 39 13,746 153,214 1,434,794.95$
27 Hillyard 10.25 39 16,997 207,436 1,774,122.85$
28 Nevada 8.61 39 12,212 151,212 1,274,725.09$
29 SCC 4.01 39 8,261 76,514 862,306.14$
32 Trent/Montgomery 7.46 32 9,956 138,155 1,039,246.94$
33 Wellesley 8.80 39 16,153 276,205 1,686,100.24$
34 Freya 6.18 39 20,324 189,907 2,121,460.87$
39 Mission 6.92 32 8,651 95,529 902,998.69$
42 South Adams 2.08 32 4,634 33,617 483,686.48$
43 Lincoln/37th Avenue 6.73 39 9,191 124,494 959,327.35$
44 29th Avenue 4.02 39 10,364 133,607 1,081,815.20$
45 Regal 6.84 39 14,067 160,868 1,468,264.40$
60 Airport via Browne's Addition 7.41 32 9,736 149,311 1,016,278.13$
61 Hwy 2 via Browne's Addition 13.48 39 15,067 293,389 1,572,680.93$
62 Medical Lake 20.08 39 3,404 82,783 355,325.18$
66 Cheney/EWU 17.05 62 20,411 522,458 2,130,512.71$
68 Cheney Local 6.41 32 7,101 86,650 741,200.29$
74 Mirabeau/Liberty Lake 18.58 39 10,893 281,083 1,137,047.87$
90 Sprague 7.98 39 24,079 308,516 2,513,412.99$
94 East Fifth/Millwood 11.05 39 14,719 194,797 1,536,350.43$
95 Mid-Valley 8.22 32 6,514 91,994 679,889.57$
96 Pines/Sullivan 9.32 32 10,862 170,477 1,133,806.87$
97 South Valley 9.66 32 11,246 175,494 1,173,823.03$
98 Liberty Lake via Sprague 9.14 32 12,112 166,016 1,264,222.38$
124 North Express 8.93 39 3,809 60,909 397,609.52$
165 Cheney Express 20.98 62 2,893 62,494 301,932.72$
172 Liberty Lake Express 16.38 39 256 7,266 26,757.81$
173 VTC Express 10.01 39 4,212 86,399 439,650.65$

Annual Route Report 19 Spokane Transit Authority Final 4/26/2018
Table 2.2 Average Passenger Trip Length, Passenger Boardings, Passenger Miles, and Fare Revenue
Route Route Name
Average Passenger
Trip Length
Annual
Passenger Boardings
Annual
Passenger Miles
Annual Fare
Revenue
1 Plaza/Arena 0.77 137,631 115,476 116,199.42$
2 Southside Medical Shuttle 1.38 173,004 260,353 132,891.30$
20 SFCC 3.39 287,516 1,062,592 194,906.72$
21 West Broadway 1.63 222,547 394,835 168,904.90$
22 Northwest Boulevard 2.88 282,159 885,155 217,981.88$
23 Maple/Ash 2.28 308,742 765,908 257,409.60$
24 Monroe 1.99 567,062 1,231,181 465,888.59$
25 Division 3.70 1,002,087 4,043,280 878,537.33$
26 Lidgerwood 3.77 275,123 1,130,845 241,816.12$
27 Hillyard 3.50 485,812 1,851,758 417,497.90$
28 Nevada 3.50 314,551 1,201,119 278,646.96$
29 SCC 2.61 245,001 696,750 176,220.80$
32 Trent/Montgomery 4.37 216,572 1,030,592 161,485.13$
33 Wellesley 2.85 555,230 1,722,550 424,629.18$
34 Freya 2.44 240,284 637,847 149,654.47$
39 Mission 2.21 255,196 613,408 194,204.42$
42 South Adams 1.11 108,445 131,218 75,540.62$
43 Lincoln/37th Avenue 2.58 211,865 596,071 174,732.09$
44 29th Avenue 2.66 328,968 954,564 251,949.64$
45 Regal 3.05 452,362 1,503,784 378,593.98$
60 Airport via Browne's Addition 2.90 179,054 566,432 144,472.08$
61 Hwy 2 via Browne's Addition 6.22 398,887 2,704,193 330,643.42$
62 Medical Lake 12.99 34,661 490,545 36,371.99$
66 Cheney/EWU 14.65 538,512 8,597,263 618,653.96$
68 Cheney Local 2.10 120,464 276,056 92,344.02$
74 Mirabeau/Liberty Lake 12.86 234,440 3,232,502 274,769.19$
90 Sprague 4.22 918,432 4,227,630 710,050.63$
94 East Fifth/Millwood 4.11 293,842 1,315,004 246,074.12$
95 Mid-Valley 3.42 48,275 179,985 38,729.67$
96 Pines/Sullivan 3.75 140,939 575,915 116,076.72$
97 South Valley 3.72 172,983 701,329 137,850.26$
98 Liberty Lake via Sprague 3.17 189,680 655,881 160,611.20$
124 North Express 6.40 78,439 547,379 98,492.01$
165 Cheney Express 12.83 36,759 513,901 39,307.43$
172 Liberty Lake Express 16.33 7,796 138,705 11,150.21$
173 VTC Express 8.76 100,339 957,687 96,986.72$

Annual Route Report 20 Spokane Transit Authority Final 4/26/2018
Section III: Universal Transit Access Pass (UTAP)
This section is intended to make available the going rates for services provided under the Universal Transit Access Pass (UTAP) Program effective July 1, 2018.
According to Spokane Transit’s Tariff Policy, UTAP is an annual program made available on a
contractual basis in which all members of an organization have unlimited access to STA
services. The organization pays a fee that allows all identified members of their organization to
use STA services for the contracted time period. Eligible participants must be identifiable by an
identification card that is readable by STA fare collection equipment. The number of these
programs is dependent on the capacity of STA’s fare collection equipment.
The contract price is based on each unlinked trip taken by members of the program. The
charge for each unlinked trip is calculated based on an established rate for each route in STA’s
system. A rate sheet for each route is published annually and included in the annual contract
update.
The participating organization is billed monthly for the previous month’s trips. However, in
order to allow participating organizations to budget, contracts will also include a “not to
exceed” total price for an annual contract. The “not to exceed” fee will be calculated by STA
prior to each contract period. Actual monthly ridership may result in the cost of the contract to
be lower than the “not to exceed” fee.
UTAP Rates Calculation
Overall, the UTAP direct utility rates are based on the direct expenses required to provide a
typical unlinked passenger trip by each route, applying direct operating expenses to the seated
capacity of buses in service. This cost per seat mile calculated for each route is applied to the
average passenger trip length to arrive at the expenses directly utilized by a passenger.
Additionally, a base rate is applied uniformly to all routes that takes into account the expenses
incurred in directly administering fixed-route operations, including dispatching, road
supervisors and scheduling. The base utility rate calculation for 2017 is shown below.
𝑩𝒂𝒔𝒆 𝑼𝒕𝒊𝒍𝒊𝒕𝒚 𝑹𝒂𝒕𝒆 (𝑩) =𝐵𝑎𝑠𝑒 𝐸𝑥𝑝𝑒𝑛𝑠𝑒𝑠
𝑃𝑎𝑠𝑠𝑒𝑛𝑔𝑒𝑟𝑠=
$4,119,975
10,264,971=
$0.40
𝑝𝑎𝑠𝑠𝑒𝑛𝑔𝑒𝑟
There are several steps and many variables that are used to generate each route’s direct utility
rate. The first step is to determine direct expenses for each route by applied uniform direct
costs per revenue hour and revenue mile commensurate on actual revenue hours and revenue
miles operated in a year. The common inputs for this variable are shown below using 2017 NTD

Annual Route Report 21 Spokane Transit Authority Final 4/26/2018
reported annual data. Route-specific revenue hours and revenue miles data for 2017 can be
found in Section II of this report.
𝑫𝒊𝒓𝒆𝒄𝒕 𝑪𝒐𝒔𝒕 𝒑𝒆𝒓 𝑹𝒆𝒗𝒆𝒏𝒖𝒆 𝑯𝒐𝒖𝒓 (𝑹) =𝐷𝑖𝑟𝑒𝑐𝑡 𝑂𝑝𝑒𝑟𝑎𝑡𝑖𝑛𝑔 𝐸𝑥𝑝𝑒𝑛𝑠𝑒𝑠
𝑅𝑒𝑣𝑒𝑛𝑢𝑒 𝐻𝑜𝑢𝑟𝑠=
$28,529,611
405,164=
$70.41
𝑟𝑒𝑣𝑒𝑛𝑢𝑒 ℎ𝑜𝑢𝑟
𝑫𝒊𝒓𝒆𝒄𝒕 𝑪𝒐𝒔𝒕 𝒑𝒆𝒓 𝑹𝒆𝒗𝒆𝒏𝒖𝒆 𝑴𝒊𝒍𝒆 (𝑴) = 𝐷𝑖𝑟𝑒𝑐𝑡 𝑀𝑎𝑖𝑛𝑡𝑒𝑛𝑎𝑛𝑐𝑒 𝐸𝑥𝑝𝑒𝑛𝑠𝑒𝑠
𝑅𝑒𝑣𝑒𝑛𝑢𝑒 𝑀𝑖𝑙𝑒𝑠=
$9,639,976
5,590,733=
$1.72
𝑚𝑖𝑙𝑒
𝑫𝒊𝒓𝒆𝒄𝒕 𝑹𝒐𝒖𝒕𝒆 𝑬𝒙𝒑𝒆𝒏𝒔𝒆𝒔 (𝑫𝒏) = 𝑹 × 𝑅𝑜𝑢𝑡𝑒 𝑅𝑒𝑣𝑒𝑛𝑢𝑒 𝐻𝑜𝑢𝑟𝑠 + 𝑴 × 𝑅𝑜𝑢𝑡𝑒 𝑅𝑒𝑣𝑒𝑛𝑢𝑒 𝑀𝑖𝑙𝑒𝑠
Next, route expenses are applied to the seat miles provided by each route based upon the total
revenue miles traveled for each route multiplied by the seated capacity of the typical coach size
and type used on a route. Route-specific seated capacity for 2017 can be found in Section II of
this report.
𝑹𝒐𝒖𝒕𝒆 𝑺𝒆𝒂𝒕 𝑴𝒊𝒍𝒆𝒔 (𝑺𝒏) = 𝑅𝑜𝑢𝑡𝑒 𝑅𝑒𝑣𝑒𝑛𝑢𝑒 𝑀𝑖𝑙𝑒𝑠 × 𝑅𝑜𝑢𝑡𝑒 𝑆𝑒𝑎𝑡𝑒𝑑 𝐶𝑎𝑝𝑎𝑐𝑖𝑡𝑦
𝑹𝒐𝒖𝒕𝒆 𝑫𝒊𝒓𝒆𝒄𝒕 𝑪𝒐𝒔𝒕 𝒑𝒆𝒓 𝑺𝒆𝒂𝒕 𝑴𝒊𝒍𝒆 (𝑪𝒏) =𝑫𝒏
𝑺𝒏
Finally, the direct utility rate is determined by multiplying the direct cost per seat-mile by the
average passenger trip length calculated for that route. Average passenger trip length by route
for 2017 is found in Section II of this report.
𝑹𝒐𝒖𝒕𝒆 𝑫𝒊𝒓𝒆𝒄𝒕 𝑼𝒕𝒊𝒍𝒊𝒕𝒚 𝑹𝒂𝒕𝒆 (𝑼𝒏) = 𝑪𝒏 × 𝑅𝑜𝑢𝑡𝑒 𝐴𝑣𝑒𝑟𝑎𝑔𝑒 𝑃𝑎𝑠𝑠𝑒𝑛𝑔𝑒𝑟 𝑇𝑟𝑖𝑝 𝐿𝑒𝑛𝑔𝑡ℎ
The base utility rate (B) is then subtracted from the cost of an adult single ride fare ($1.75) in
order to calculate a not-to-exceed rate. Based upon 2017, the direct utility rates for Routes 62
Medical Lake, 74 Mirabeau/Liberty Lake, and 172 Liberty Lake Express were capped at $1.35 in
accordance with this methodology. It should be noted that Paratransit trips taken in the UTAP
program are charged the full rate of an adult single rider fare ($1.75).

Annual Route Report 22 Spokane Transit Authority Final 4/26/2018
UTAP Rates Schedule
Based on the preceding variables and data for calendar year 2017, the UTAP direct utility rates
effective July 1, 2018 are published below.
Table 3.1 Direct Utility Rate - Effective July 1, 2018
Route Route Name
Direct Utility Rate
(per Boarding)
1 Plaza/Arena Shuttle 0.47$
2 Southside Medical Shuttle 0.67$
20 SFCC 0.57$
21 West Broadway 0.47$
22 Northwest Boulevard 0.55$
23 Maple/Ash 0.38$
24 Monroe 0.45$
25 Division 0.73$
26 Lidgerwood 0.78$
27 Hillyard 0.67$
28 Nevada 0.67$
29 SCC 0.62$
32 Trent/Montgomery 0.93$
33 Wellesley 0.43$
34 Freya 0.58$
39 Mission 0.56$
42 South Adams 0.40$
43 Lincoln/37th 0.46$
44 29th Ave 0.49$
45 Regal 0.62$
60 Airport via Browne's Addition 0.57$
61 Airway Heights via Browne's Addition 0.85$
62 Medical Lake 1.35$
66 Cheney/EWU 1.06$
68 Cheney Local 0.49$
74 Mirabeau/Liberty Lake 1.35$
90 Sprague 0.78$
94 East Central/Millwood 0.74$
95 Mid-Valley 0.72$
96 Pines/Sullivan 0.73$
97 South Valley 0.72$
98 Liberty Lake via Sprague 0.68$
124 North Express 1.01$
165 Cheney Express 1.03$
172 Liberty Lake Express 1.35$
173 VTC Express 1.16$
X New or Special Event Route 0.72$
B Base Utility Rate 0.40$
P Paratransit Utility Rate 1.75$

Annual Route Report 23 Spokane Transit Authority Final 4/26/2018
Appendix
Section I
2017 Route Performance Results
Route Route Name Benchmark Actual Benchmark Actual Benchmark Actual
1 Plaza/Arena 19.68 22.19 6.96 3.48 10.06% 17.95%
2 Southside Medical Shuttle 19.68 17.40 6.96 3.98 10.06% 12.80%
20 SFCC 19.68 31.64 5.28 7.83 10.06% 20.55%
21 West Broadway 19.68 25.66 5.28 6.05 10.06% 18.66%
22 Northwest Boulevard 19.68 22.49 5.28 5.52 10.06% 16.64%
23 Maple/Ash 19.68 31.01 5.28 4.83 10.06% 24.77%
24 Monroe 19.68 33.78 5.28 6.94 10.06% 26.59%
25 Division 19.68 33.39 5.28 10.55 10.06% 28.04%
26 Lidgerwood 19.68 20.01 5.28 6.86 10.06% 16.85%
27 Hillyard 19.68 28.58 5.28 8.50 10.06% 23.53%
28 Nevada 19.68 25.76 5.28 7.37 10.06% 21.86%
29 SCC 19.68 29.66 5.28 8.48 10.06% 20.44%
32 Trent/Montgomery 9.84 21.75 5.30 6.86 10.06% 15.54%
33 Wellesley 9.84 34.37 5.28 5.95 10.06% 25.18%
34 Freya 9.84 11.82 5.28 3.14 10.06% 7.05%
39 Mission 19.68 29.50 5.30 6.12 10.06% 21.51%
42 South Adams 19.68 23.40 5.30 3.86 10.06% 15.62%
43 Lincoln/37th Avenue 19.68 23.05 5.28 4.55 10.06% 18.21%
44 29th Avenue 19.68 31.74 5.28 7.11 10.06% 23.29%
45 Regal 19.68 32.16 5.28 8.56 10.06% 25.79%
60 Airport via Browne's Addition 19.68 18.39 5.30 3.69 10.06% 14.22%
61 Hwy 2 via Browne's Addition 19.68 26.47 5.28 8.70 10.06% 21.02%
62 Medical Lake 19.68 10.18 5.28 5.85 10.06% 10.24%
66 Cheney/EWU 19.68 26.38 6.96 14.49 10.06% 29.04%
68 Cheney Local 9.84 16.96 5.30 2.27 10.06% 12.46%
74 (174) Mirabeau/Liberty Lake 19.68 21.52 5.28 9.87 10.06% 24.17%
90 Sprague 19.68 38.14 5.28 13.26 10.06% 28.25%
94 East Fifth/Millwood 19.68 19.96 5.28 6.16 10.06% 16.02%
95 Mid-Valley 9.84 7.41 5.30 1.73 10.06% 5.70%
96 Pines/Sullivan 9.84 12.98 5.30 3.15 10.06% 10.24%
97 South Valley 9.84 15.38 5.30 3.81 10.06% 11.74%
98 Liberty Lake via Sprague 9.84 15.66 5.30 3.34 10.06% 12.70%
124 North Express 27.34 20.59 8.19 6.56 10.06% 24.77%
165 Cheney Express 9.11 12.71 10.78 7.68 10.06% 13.02%
172 Liberty Lake Express 27.34 30.41 8.19 12.38 10.06% 41.67%
173 VTC Express 27.34 23.82 8.19 9.77 10.06% 22.06%
Did not meet benchmark
Ridership Energy Fares

Annual Route Report 24 Spokane Transit Authority Final 4/26/2018
2017/2016 Route Performance Results Comparison
Route Route Name 2017 2016 2017 2016 2017 2016
1 Plaza/Arena PASS PASS NOT MET NOT MET PASS PASS
2 Southside Medical Shuttle NOT MET NOT MET NOT MET NOT MET PASS PASS
20 SFCC PASS PASS PASS PASS PASS PASS
21 West Broadway PASS PASS PASS NOT MET PASS PASS
22 Northwest Boulevard PASS PASS PASS NOT MET PASS PASS
23 Maple/Ash PASS PASS NOT MET NOT MET PASS PASS
24 Monroe PASS PASS PASS PASS PASS PASS
25 Division PASS PASS PASS PASS PASS PASS
26 Lidgerwood PASS PASS PASS PASS PASS PASS
27 Hillyard PASS PASS PASS PASS PASS PASS
28 Nevada PASS PASS PASS PASS PASS PASS
29 SCC PASS PASS PASS PASS PASS PASS
32 Trent/Montgomery PASS PASS PASS PASS PASS PASS
33 Wellesley PASS PASS PASS NOT MET PASS PASS
34 Freya PASS PASS NOT MET NOT MET NOT MET NOT MET
39 Mission PASS PASS PASS PASS PASS PASS
42 South Adams PASS PASS NOT MET NOT MET PASS PASS
43 Lincoln/37th Avenue PASS PASS NOT MET NOT MET PASS PASS
44 29th Avenue PASS PASS PASS PASS PASS PASS
45 Regal PASS PASS PASS PASS PASS PASS
60 Airport via Browne's Addition NOT MET NOT MET NOT MET NOT MET PASS PASS
61 Hwy 2 via Browne's Addition PASS PASS PASS PASS PASS PASS
62 Medical Lake NOT MET NOT MET PASS NOT MET PASS PASS
66 Cheney/EWU PASS PASS PASS PASS PASS PASS
68 Cheney Local PASS PASS NOT MET NOT MET PASS PASS
74 Mirabeau/Liberty Lake PASS NOT MET PASS PASS PASS PASS
90 Sprague PASS PASS PASS PASS PASS PASS
94 East Fifth/Millwood PASS NOT MET PASS NOT MET PASS PASS
95 Mid-Valley NOT MET DNO NOT MET DNO NOT MET DNO
96 Pines/Sullivan PASS PASS NOT MET NOT MET PASS NOT MET
97 South Valley PASS PASS NOT MET NOT MET PASS PASS
98 Liberty Lake via Sprague PASS PASS NOT MET NOT MET PASS PASS
124 North Express NOT MET NOT MET NOT MET NOT MET PASS PASS
165 Cheney Express PASS PASS NOT MET NOT MET PASS PASS
172 Liberty Lake Express PASS DNO PASS DNO PASS DNO
173 VTC Express NOT MET NOT MET PASS PASS PASS PASS
DNO = Did Not Operate
Ridership Benchmark Energy Benchmark Fares Benchmark

Annual Route Report 25 Spokane Transit Authority Final 4/26/2018
2017/2016 Boardings Per Revenue Hour Comparison Chart
051015202530354045
9024
2545
4420
2329
3927
6166
2821
4243
221
7426
9460
262
3332
6898
9796
3495
173
124
172
165
BPRHRi
ders
hip
Benc
hmar
k: B
oard
ings
Per
Rev
enue
Hou
r (B
PRH
)
CBD
RO
UTE
SEX
PRES
S RO
UTE
S
2016
Ben
chm
ark
NO
N -
CBD
RO
UTE
S
nG
reen
Sha
ded
Rout
es =
met
sta
ndar
d in
201
7&
201
6n
Yello
w S
hade
d Ro
utes
= m
etst
anda
rd in
one
of t
wo
year
sn
Red
Shad
ed R
oute
s = m
isse
d st
anda
rd b
oth
year
s
Not
e: 2
017
is th
e da
rker
sha
ded
colu
mn
(far
left
); 2
016
is th
e lig
hter
shad
edco
lum
n (f
ar ri
ght)
-Ro
utes
95
and
172
did
not o
pera
te in
201
6
2017
Ben
chm
ark
2017
Ben
chm
ark
Annual Route Report 26 Spokane Transit Authority Final 4/26/2018
2017/2016 Energy Benchmark Comparison Chart
0246810121416
6616
590
172
2574 (174
)173
6145
2729
2028
4424
2612
494
2133
6222
2343
3432
3942
9760
9896
6895
21
AVERAGE LOAD FACTOREn
ergy
Ben
chm
ark:
Ave
rage
Load
Fact
or
nGr
een S
hade
d Rou
tes =
met
stan
dard
in 20
17&
2016
nYe
llow
Shad
ed Ro
utes
= met
stand
ard i
n one
of tw
o yea
rsn
Red S
hade
d Rou
tes =
miss
ed st
anda
rd bo
th ye
ars
Note
: 201
7 is
the d
arke
r sha
dedc
olum
n (fa
r left)
; 201
6 is t
he lig
hter
shad
edco
lum
n (fa
r rig
ht) -
Rout
es 95
and 1
72 d
id no
t ope
rate
in 20
16
40FT
BUS R
OUTE
S35
FTBU
SROU
TES
30 FT
60 FT
2017
30 Ft
Coac
h -6.9
6 Ben
chm
ark
35 Ft
Coac
h -5.3
0 Ben
chm
ark
40 Ft
Coac
h -5.2
8 Ben
chm
ark
Expr
ess -
8.19 B
ench
mar
k60
FtCo
ach -
6.96 B
ench
mar
kEx
pres
s -10
.78 B
ench
mar
k
2016
30 Ft
Coac
h -6.6
4 Ben
chm
ark
35 Ft
Coac
h -5.0
6 Ben
chm
ark
40 Ft
Coac
h -5.0
9 Ben
chm
ark
Expr
ess -
7.88 B
ench
mar
k60
FtCo
ach -
7.04 B
ench
mar
kEx
pres
s -10
.92 B
ench
mar
k
Annual Route Report 27 Spokane Transit Authority Final 4/26/2018
2017/2016 Fares Benchmark Comparison Chart
0%5%10%
15%
20%
25%
30%
35%
40%
45%
172
6690
2524
4533
124
2374
2744
173
2839
6120
2921
431
2622
9442
3260
165
298
6897
9662
3495
Farebox Recovery Ratio
Rout
e
Fare
s Be
nchm
ark:
Far
ebox
Rec
over
y Ra
tio
nGr
een
Shad
ed R
oute
s = m
et st
anda
rd in
2017
& 2
016
nYe
llow
Shad
ed R
oute
s = m
et st
anda
rd in
one
of t
wo
year
sn
Red
Shad
ed R
oute
s = m
isse
d st
anda
rd b
oth
year
s
Not
e: 20
17 is
the
dark
er sh
aded
colu
mn
(far
left
); 20
16 is
the
light
er sh
aded
colu
mn
(far
rig
ht) -
Rout
es 95
and
172
did
not
ope
rate
in 20
16
2017
Ben
chm
ark
2016
Ben
chm
ark
Annual Route Report 28 Spokane Transit Authority Final 4/26/2018
Section II
2017 Average Weekday Boardings

Annual Route Report 29 Spokane Transit Authority Final 4/26/2018
2017 Total Annual Boardings Comparison to 2016
Route Total 2017 Total 2016 Change % Change1 - Plaza/Arena Shuttle 137,631 136,107 1,524 1.1%
2 - Southside Medical Shuttle 173,004 182,127 -9,123 -5.0%
20 - SFCC 287,516 292,909 -5,393 -1.8%
21 - West Broadway 222,547 208,707 13,840 6.6%
22 - Northwest Boulevard 282,159 293,753 -11,594 -3.9%
23 - Maple/Ash 308,742 314,787 -6,045 -1.9%
24 - Monroe 567,062 572,399 -5,337 -0.9%
25 - Division 1,002,087 1,039,165 -37,078 -3.6%
26 - Lidgerwood 275,123 290,391 -15,268 -5.3%
27 - Hillyard 485,812 470,076 15,736 3.3%
28 - Nevada 314,551 311,520 3,031 1.0%
29 - SCC 245,001 246,706 -1,705 -0.7%
32 - Trent/Montgomery 216,572 213,793 2,779 1.3%
33 - Wellesley 555,230 539,948 15,282 2.8%
34 - Freya 240,284 232,674 7,610 3.3%
39 - Mission 255,196 247,508 7,688 3.1%
42 - South Adams 108,445 104,605 3,840 3.7%
43 - Lincoln/37th Avenue 211,865 208,508 3,357 1.6%
44 - 29th Avenue 328,968 332,942 -3,974 -1.2%
45 - Regal 452,362 417,380 34,982 8.4%
60 - Airport via Browne's Addition 179,054 170,775 8,279 4.8%
61 - Highway 2 via Browne's Addition 398,887 404,173 -5,286 -1.3%
62 - Medical Lake 34,661 36,666 -2,005 -5.5%
66 - Cheney/EWU 538,512 564,357 -25,845 -4.6%
68 - Cheney Local 120,464 118,397 2,067 1.7%
74 - Mirabeau/Liberty Lake 234,440 230,174 4,266 1.9%
90 - Sprague 918,432 951,082 -32,650 -3.4%
94 - East Central/Millwood 293,842 288,662 5,180 1.8%
95 - Mid-Valley 48,275 0 48,275 ------
96 - Pines/Sullivan 140,939 154,795 -13,856 -9.0%
97 - South Valley 172,983 187,741 -14,758 -7.9%
98 - Liberty Lake via Sprague 189,680 202,566 -12,886 -6.4%
124 - North Express 78,439 83,469 -5,030 -6.0%
165 - Cheney Express 36,759 39,691 -2,932 -7.4%
172 - Liberty Lake Express 7,796 0 7,796 ------
173 - VTC Express 100,339 101,151 -812 -0.8%
*Total 10,264,971 10,261,816 3,155 0.03%
*Total annual ridership includes ridership from special events that cannot be attributed to specific routes