Embed Size (px)
Citation preview

ANNUAL REVIEW AND
CONSOLIDATED FINANCIAL STATEMENTS
FOR THE YEAR ENDED 31 DECEMBER 2017
FARM AFRICA LIMITED
REGISTERED CHARITY NO: 326901
REGISTERED COMPANY NO: 01926828

2
CONTENTS
OFFICERS AND ADVISORS ................................................................................................ 3
REPORT FROM THE CHAIR AND CHIEF EXECUTIVE ...................................................... 5
ANNUAL REPORT OF THE BOARD OF TRUSTEES .......................................................... 6
FARM AFRICA’S 2017 PERFORMANCE ............................................................................. 6
FARM AFRICA’S WORK AND IMPACT ................................................................................ 6
VALUE FOR MONEY APPROACH ................................................................................. 17
PUBLIC BENEFIT ........................................................................................................... 17
STRATEGY AND GOALS ................................................................................................... 18
2016 – 2020 STRATEGY ................................................................................................ 18
ORGANISATIONAL PERFORMANCE ................................................................................ 20
2018 OBJECTIVES ......................................................................................................... 22
FINANCIAL REVIEW .......................................................................................................... 24
2017 FINANCE OVERVIEW ............................................................................................ 24
GOING CONCERN ......................................................................................................... 26
ORGANISATIONAL INFORMATION .................................................................................. 27
CHARITABLE OBJECTS................................................................................................. 27
VISION, MISSION & VALUES ......................................................................................... 27
LEGAL STRUCTURE ...................................................................................................... 28
GOVERNANCE AND ORGANISATIONAL STRUCTURE ............................................... 28
SUBSIDIARIES ............................................................................................................... 29
POLICIES & LEGAL INFORMATION .................................................................................. 30
GRANT-MAKING POLICY ............................................................................................... 30
SAFEGUARDING POLICY .............................................................................................. 30
REMUNERATION POLICY ............................................................................................. 31
RESERVES POLICY ....................................................................................................... 31
FUNDRAISING DISCLOSURE ........................................................................................ 32
INVESTMENT POLICY ................................................................................................... 32
RISK MANAGEMENT ..................................................................................................... 32
CHARITY GOVERNANCE CODE ................................................................................... 33
STATEMENT OF TRUSTEES’ RESPONSIBILITIES .......................................................... 33
INDEPENDENT AUDITOR’S REPORT TO THE MEMBERS OF FARM AFRICA LIMITED 35
CONSOLIDATED STATEMENT OF FINANCIAL ACTIVITIES ........................................ 38
CONSOLIDATED & CHARITY BALANCE SHEETS ........................................................ 39
CONSOLIDATED STATEMENT OF CASHFLOWS ......................................................... 40
NOTES TO THE STATEMENT OF CASHFLOWS .......................................................... 40
NOTES TO THE CONSOLIDATED FINANCIAL STATEMENTS ..................................... 41
3
OFFICERS AND ADVISORS
PATRON
Michael Palin CBE
PRESIDENT
Sir Martin Wood OBE FRS DL
TRUSTEES/DIRECTORS
Richard Macdonald CBE (chair)
Professor Jonathan Kydd (deputy chair)
John Shaw (treasurer)
John Young (board secretary)
Nick Allen (appointed May 2018)
Judith Batchelar
Minette Batters (appointed October 2017)
Colin Brereton
Serena Brown
Carey Ngini
Jan Bonde Nielsen
Charles Reed
John Reizenstein
Laketch Mikael
Tim Smith (appointed June 2017)
MEMBERS OF THE FINANCE RISK & AUDIT COMMITTEE
John Shaw (chair)
John Young
Kenneth Macharia (non-trustee member)
Paul Dillon-Robinson (non-trustee member)
Nick Allen (non-trustee member – appointed September 2017)
MEMBERS OF THE PROGRAMME ADVISORY COMMITTEE
Professor Jonathan Kydd (chair)
Serena Brown
Laketch Mikael (appointed March 2017)
John Morton (non-trustee member)
Gill Shepherd (non-trustee member – appointed March 2017)
John Mumford (non-trustee member– appointed March 2017)
MEMBERS OF THE NOMINATION AND REMUNERATION COMMITTEE
Richard Macdonald
Jonathan Kydd
John Shaw
John Young
CHIEF EXECUTIVE
Nicolas Mounard
4
REGISTERED OFFICE & PRINCIPAL OFFICE
9th Floor, Bastion House
140 London Wall
London EC2Y 5DN
AUDITORS
Crowe Clark Whitehill LLP
Chartered Accountants and Registered Auditor
St Bride’s House, 10 Salisbury Square
London EC4Y 8EH
BANKERS
Barclays Bank PLC
1 Churchill Place
London E14 5HP
UBS AG
London Branch
3 Finsbury Avenue
EC2M 2AN
LAWYERS
Hogan Lovells International LLP
Atlantic House
Holborn Viaduct
London EC1A 2FG

5
REPORT FROM THE CHAIR AND CHIEF EXECUTIVE
Farm Africa reached 2.9 million people, more than ever before, in 2017.
But that’s only half the equation. We’re equally proud that we helped
local communities sustainably manage 700,000 hectares of forests and
rangeland.
There is an inherent and inescapable tension between agriculture and environmental
conservation. People living in rural areas need to grow food to eat and earn an income. But
crop and livestock farming are resource-hungry and can have a devastating impact on the
environment, which in turn drives down agricultural yields.
Over hundreds of years, forests have been burnt or cut down to clear space to grow crops.
Overgrazing has turned verdant rangelands barren. The degradation of forests and
rangelands, which are no longer able to buffer temperature extremes, absorb water and hold
onto topsoil, have reduced the productivity of local farms, making it harder for farmers to
earn a living.
Developing innovative solutions to finding the right balance between producing food and
conserving the environment is at the heart of Farm Africa’s work. Now, more than ever, as
food production is threatened by rising populations, a dwindling resource base and a
changing climate, our top priority is to find an effective balance between farming and nature.
In eastern Africa, where hunger levels are high and productivity is low, boosting the
productivity of smallholder farmers and connecting them better to markets are vital. But the
environmental cost of farming must be minimised. Future generations’ ability to thrive
depends on the sustainable management of soils, forests, grazing lands and water
resources today.
At Farm Africa, we measure our impact in terms of producers’ increased agricultural yields,
higher incomes and stronger links to markets, but also in terms of the sustainable
management of land, water and soils.
This report focuses on seven of our projects active in 2017, across four countries. Each
presents a unique set of social and environmental challenges. We highlight how we have
worked to achieve an optimal balance between our dual, and often conflicting, aims of
reducing poverty in rural communities and protecting the environment for years to come.
We hope you enjoy reading the report and finding out more about the impact of the work we
achieved in 2017. Our ability to deliver impact is only possible thanks to the generosity of our
donors. On behalf of the communities and landscapes we serve in rural Africa: thank you.
Richard Macdonald CBE, Chair
Nicolas Mounard, CEO

6
ANNUAL REPORT OF THE BOARD OF TRUSTEES
The board of trustees of Farm Africa Limited, which is also its board of directors, hereby
presents its report (incorporating the strategic review and the directors’ report) together with
the financial statements for the year ended 31 December 2017.
FARM AFRICA’S 2017 PERFORMANCE
The first section of the annual report looks back at our performance in 2017. This covers
three areas: firstly, our impact, which covers the difference we’re making across eastern
Africa, and a more detailed review of the inherent tension between agriculture and
environmental conservation through five case studies of our work. The second part of the
report covers our organisation-wide performance, including our performance against the
goals we set in 2017. The third section of our annual report covers our financial
performance.
FARM AFRICA’S WORK AND IMPACT
Beneficiary data
2017 was another record year for Farm Africa in terms of the number of people we were able
to reach.
The people we reach come from a range of backgrounds, and the term ‘farmer’ is often an
inadequate way to describe them. Our projects touch the lives of men, women and children,
who may belong to farming families, who may rely on specific ecosystems we have helped
to transform, or who merely have benefited from the growth in a specific value chain through
obtaining a job.
0
500,000
1,000,000
1,500,000
2,000,000
2,500,000
3,000,000
3,500,000
2013 2014 2015 2016 2017
Graph to show total people reached by year

7
Case study 1: Building resilience in the Ethiopian lowlands
In Ethiopia’s drylands, access to grass and water is of paramount
importance to pastoralist communities who traditionally migrate with their
herds. Our Market Approaches to Resilience project has empowered
herders to protect the landscapes they rely on, while creating resilient,
sustainable livelihoods.
As the primary source of cattle feed, rangelands play a vitally important role in sustaining the
livelihoods of pastoralists and ensuring long-term food security. But in many rangeland
ecosystems in the Ethiopian lowlands, deforestation, rising demand for water resources,
overstocking of livestock, uncontrolled grazing and crop agriculture have reduced the
availability of dry season grazing and water for livestock and human consumption. Poor soil
quality puts drylands at risk of flooding.
Increasing climate variability threatens to pose more challenges to pastoralists and agro-
pastoralists already living on the edge of survival in this most challenging of environments.
Households are responding to drought or flooding, with ‘negative coping strategies’, such as
selling assets, like cattle, or taking their children out of school.
Farm Africa’s ‘Market Approaches to Resilience’ (MAR) project, implemented in partnership
with Mercy Corps, has the twin aims of rehabilitating the environment and creating more
resilient and sustainable livelihoods, ensuring that the communities are able to anticipate,
absorb and adapt to climate shocks. The project, which is part of the BRACED programme
funded with UK aid from the UK government, is located in the Afar, Somali and Southern
Nations, Nationalities, and Peoples’ regional states.
Anticipating climate shocks
A dearth of accurate weather information has left many people in lowland Ethiopia in the
dark about looming climate shocks that could have a serious impact on their ability to raise
livestock and grow crops.
The MAR project works with 224 village-level Early Warning and Environmental Committees,
increasing the quality of information available to them and their understanding of it. In 2017,
we installed a total of 25 digital weather stations, which now broadcast weather and climate
information to 354 radio listener groups in 10 different languages via national and local radio
stations. Equipped with reliable projections of future weather patterns, pastoralists can
anticipate changes and develop adaptation plans accordingly, such as cattle destocking and
water conservation activities.
Restoring landscapes
We have trained a total of 476 community leaders in natural resource management, which
has led to over 40,000 hectares of watersheds, rangelands and forests now being
sustainably managed.
In Derashe in SNNPR state, we helped 7,000 households launch a community effort to
restore their rangeland. Thirty-nine hectares of land were closed off and 50,000 tree
seedlings and two types of fast-growing grass pasture varieties were planted there.
Protected from human and agricultural interference for a year, the previously barren land
rehabilitated itself. Eroded topsoil was restored, indigenous trees and vegetation flourished

8
once more and lost plant species, known for their medicinal and nutritional benefits,
returned.
The newly planted grass has enabled the community to start an environmentally friendly
business selling cut grass to pastoralists, who are now able to feed their cattle within
shelters instead of letting them roam the rangeland. The community also plans to start honey
production now bees have returned to the area.
The restoration of the rangeland has reduced soil erosion, which in turn has put nearby Lake
Chamo at lower risk of sedimentation and pollution that could cause significant damage to
fish and water quality, and has saved large swathes of lowland farmland from flooding.
Diversifying livelihoods
The MAR project has helped families reduce the risk of relying on pastoralism by building up
savings and diversifying their incomes.
Through access to Village Savings and Loan Associations (VSLAs), community members
are able to save and take out short-term loans in times of economic distress. The project has
established 327 VSLAs with 6,284 members. As of December 2017, these VSLAs held
savings of the equivalent of £74,906 and had lent a total of £21,456 to members.
Regions Somali Afar North
Omo
South
Omo
Total
Birr
£
Number of VSLA groups 56 83 85 103 327 NA
Number of VSLA members
1,074 1,675 1,587 1,948 6,284 NA
Amount of VSLA savings
615,525 939,002 839,366 377,625 2,771,518 74,906
Amount of VSLA loans disbursed to members
77,750 228,150 317,620 170,370 793,890 21,456
Number of households accessing loans
1,035 2,110 377 689 4,211 NA
Amount of MFI loans taken
4,563,000 5,275,000 4,820,000 2,859,000 17,517,000 473,432
Average loan amount per households
4,409 2,500 12,785 4,149 4,160 112
A large amount of the money saved by the VSLAs has been used as deposits with
microfinance institutions (MFIs), to enable households to directly access loans from the
MFIs. A total of 4,211 households have taken out loans from MFIs at an average of £112 per
household. These loans have enabled many women to become economically active for the
first time, earning money from a variety of activities, such as selling clothes or opening small
food shops.
“This year, our area was hit by a particularly severe drought. The pasture reserves saved us
from losing our cattle! The result is amazing. Not only trees and pasture, even herbal plants
that we once thought were long gone have re-emerged.” Ato Kifle, a resident of Gatto
district, Gamo Gofa Zone, SNNPR, Ethiopia

9
Case study 2: Protecting land. Protecting livestock. Protecting
futures.
In Ethiopia’s Bale Eco-region, deforestation in the highlands is lowering
the flow of water to the lowlands. Faced with drought, pastoralists living
in the lowlands exacerbate pressure on the forest by taking their animals
there to graze. We work in both the forested highlands and lowland
grazing lands helping break this vicious cycle.
The Bale Eco-region, an area covering 22,000 km2, is home to three million people and 26%
of Ethiopia’s endemic species and holds a carbon stock of 213 million tonnes. The region
and the area downstream are both crucial to international environmental protection efforts.
Widespread deforestation, the conversion of forests to farmland, unsustainable timber
extraction and over-grazing of livestock is threatening Bale Eco-region’s very existence as
well as its unique flora and fauna.
Lowland communities are predominantly pastoralists whose livelihoods are dependent on
livestock farming, whereas highland communities also farm agricultural crops and earn
income through forest products such as timber, coffee and honey. With funding from the
European Union’s Supporting Horn of Africa Resilience initiative and the Jersey Overseas
Aid Commission, Farm Africa is working to protect the environment in the Bale Eco-region
and boost livelihoods for inhabitants in a sustainable way.
Restoring grazing land
Restoring rangelands in the lowlands is key to ensuring that pastoralists reduce their
dependence on the precious highland forest ecosystems. Year upon year, Mohammed and
Kadiya Hassan, pastoralist farmers living in the lowlands of Ethiopia’s Bale Eco-region, used
to take their children out of school every dry season and travel to the forest highlands
searching for pasture for their cattle and camels.
By relying on the lush mountain forests to feed their cattle, goats and camels, the family
risked contributing to deforestation.
We have helped pastoralists like Mohammed and Kadiya establish rangeland management
co-operatives, which introduced practices such as rotational grazing, so that the grass could
regenerate in the rainy season, and clearance of thorny weeds that stop grass from growing.
The restored grazing land means the family now remains in the lowlands year-round and no
longer encroaches on the endangered forest.
Highland Ecosystem Livelihoods: Mixed crop and livestock farming, forest products
Mid – altitude Ecosystem
Livelihoods: Mixed crop and livestock farming
Lowland Ecosystem
Livelihoods: Predominantly livestock farming
10
In total, the project has brought 3,500 km2 (16%) of the eco-region under improved
rangeland management, ensuring a sustainable resource for livestock owners.
Livestock productivity
As well as improving grazing land, the project has boosted livestock productivity through a
combination of breeding, access to water, animal health and market opportunities. The aim
is to change from a low input / low output model of livestock raising that puts too much
pressure on rangeland to using more productive breeds.
We have trained Community Animal Health Workers, who now deliver services such as
vaccinations, dehorning and hoof cutting and addressing parasites and other diseases to at
least 40,000 livestock a month. We have also cross-bred the local Borena breed of cow with
Jersey cows, a breed that produces milk yields triple that of local Bale breeds, up to six litres
per cow per day.
The project has constructed four ponds between 6500m3 and 8000m3 in size. These provide
improved water to over 800 households and their livestock, resulting in improved health for
both people and cattle and reduced travel to water sources, all of which increases livestock
productivity, increases household labour efficiency, and helps keep children in school. We
also opened a livestock market centre, which provides over 12,000 households with a route
to selling their livestock and produce, enabling them to fetch higher prices by connecting to
buyers from across the region and country.
Reducing deforestation
We have helped stem deforestation by helping the community develop forest-friendly
businesses, such as beekeeping and forest coffee production. These businesses have
provided economic incentives to reduce the land clearance that was previously occurring.
Tree planting and the introduction of improved cook stoves have also helped to reduce the
unsustainable harvest of fuelwood.
“It took three days of walking to get to the forest. It was difficult for my children to do this
journey, so they travelled on the back of mules and I went on foot…. sometimes our calves
would die on the journey.” Kadiya
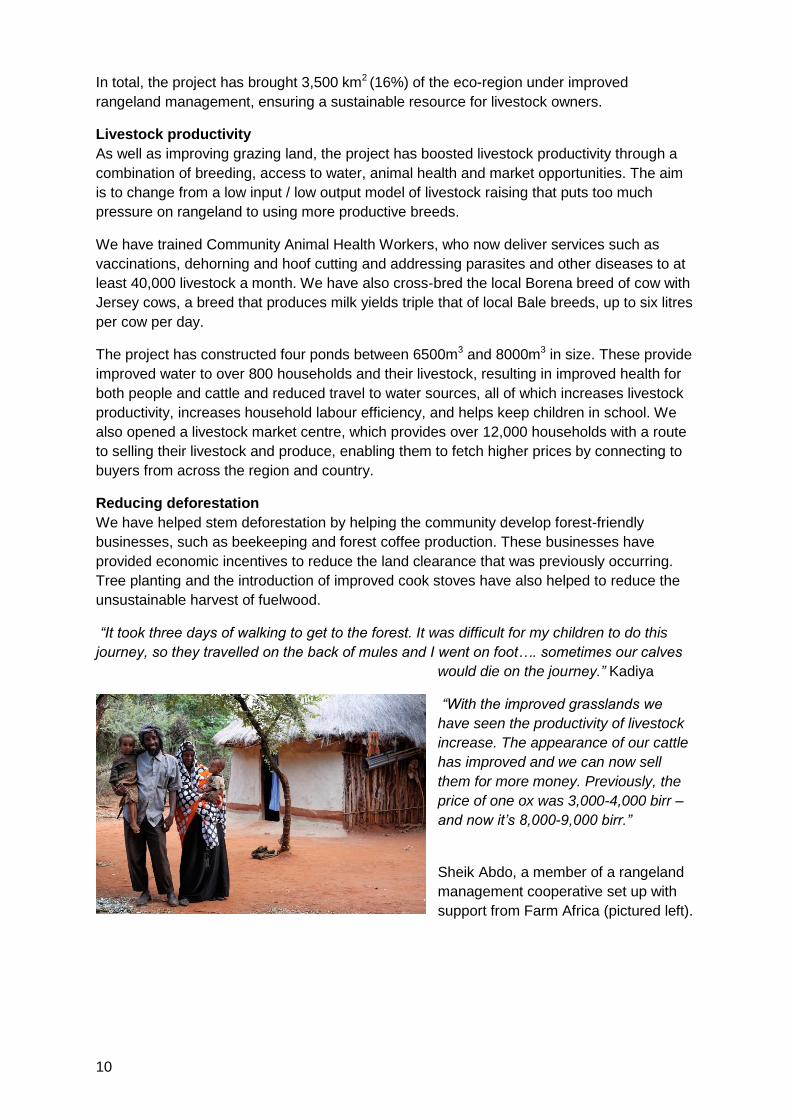
“With the improved grasslands we
have seen the productivity of livestock
increase. The appearance of our cattle
has improved and we can now sell
them for more money. Previously, the
price of one ox was 3,000-4,000 birr –
and now it’s 8,000-9,000 birr.”
Sheik Abdo, a member of a rangeland
management cooperative set up with
support from Farm Africa (pictured left).

11
Case study 3: Sustainable coffee cooperatives
Some of the world’s best coffee is grown in Ethiopian forests, the
birthplace of Arabica coffee. Yet many coffee farmers are trapped in
poverty. Fetching an appropriate price for wild coffee helps create an
incentive for forest communities to protect the trees under which coffee
plants thrive.
Ethiopia is the world's fifth largest producer of coffee. About 40-45% of its highly regarded
Arabica beans come from coffee that grows wild in forests. As an industry, coffee can be
hugely lucrative: it employs 15 million Ethiopians and makes up some 28% of the country's
yearly exports. Yet all too often small farmers are unable to sell their coffee for a good price
due to poor coffee quality, lack of access to high-value markets and an inability to add value
to the raw product with processes such as sorting and packaging.
Since December 2014, Farm Africa has worked in western Ethiopia helping a total of 5,000 farmers organised into 22 small-scale cooperatives develop the skills and knowledge needed to access high-value markets.
Training in coffee tree rejuvenation and quality assurance has helped improve the quality
and quantity of coffee produced, while training in processing, grading and marketing has
helped cooperatives access the high-value markets their forest coffee deserves. The coffee
grown by farmers involved in the project is now being sold into the international speciality
coffee market, with members of the Oromia Coffee Union travelling to Seattle, the US centre
of speciality coffee, to seal a deal with Atlas and Twin in 2017.
By supporting forest-friendly businesses, we are helping reduce deforestation and ultimately,
helping to tackle climate change.
We assessed the cooperatives’ long-term viability as commercial entities by analysing the
financial sustainability and business efficiency of 10 cooperatives working with 2,400 farmers
during the 2017 harvest. Highlights of the findings were:
The project’s 5,000 farmers produced 200 metric tonnes (MT) of forest coffee in
2017;
Over 21 MT of speciality forest coffee have been sold to international premium
markets in the US and UK, generating over 1,250,000 Ethiopian birr (Br)
(approximately £33,000) of revenue for over 800 farmers;
48 MT of high-quality forest coffee was sold for above-market prices within
Ethiopia, generating over 2,858,400 Br (£76,500) of revenue for the farmers; and
15 cooperatives in two zones were supported to access, and repay, over
1,850,000 Br (approximately £49,000) of working capital loans to invest in
processing and transport facilities that would add value to their forest coffee.
Analysis of the data enabled us to identify the key characteristics of successful coffee
cooperatives. Perhaps unsurprisingly, size matters. The more coffee a cooperative sells, and
buys, from its farmers, the more its profits increase, as does its profitability. The analysis
found that increasing the volume of coffee-cherry produced per member, rather than having
a large membership base, led to the most profitable model.

12
Refining our approach
The analysis provided valuable insight into the challenges the cooperatives faced, and
enabled us to offer targeted support focused on overcoming these blockages. After
discovering that some cooperatives were having to wait two months to have their coffee
processed at local processing facilities, we were able to find additional processors to work
with. By early 2018, waiting time had been reduced by two weeks. Delays to sales were
being caused by a lack of local data on the premium coffee market-prices, so we worked to
increase the competition for cooperatives’ produce and increase the market turnover speed
by introducing cooperatives to new international and local buyers.
Representatives of the Oromia Coffee Union, Atlas and Twin
seal a deal for the export of coffee from Ethiopia to the US.
“As women, we never used to be involved in these activities,
so it’s good to have this opportunity now. I hope more and
more women come and join these activities. If I hadn’t had my
training I wouldn’t have the opportunities I have now.”
Munaja, a coffee farmer involved in the project

13
Case study 4: Growing futures
Farm Africa is helping young farmers in western Kenya escape poverty
by developing profitable horticulture businesses using sustainable
farming methods that protect the land they farm.
In 2016, nearly 80% of Kenyans were less than 35 years old; and nearly one in five young
people of working age were jobless. In a country where agriculture is key to the economy,
contributing 26% of the Gross Domestic Product, providing 65% of the export earnings, and
employing more than 70% of rural people, farming should be offering a solution to youth
unemployment1.
Launched in 2016, our Growing Futures project, funded by Aldi, helps young people build
profitable agribusinesses that capitalise on the booming demand for Kenyan fruits and
vegetables. Farm Africa has helped 421 young farmers in 23 youth groups grow and sell
French beans, snow peas, kale, tomatoes, nightshade and cabbages to domestic and
international markets. We’ve helped them source seeds and high-quality inputs, improve
irrigation, grading and storage facilities, and build their links to markets.
Boosting productivity and production
Regular survey data from farmers shows that productivity (measured in kilograms produced
per acre) for French beans and kale increased by 9% and 77% respectively between
November 2016 and August 2017. Due to increased productivity, and an increase in the
number of farmers growing these crops, total production also increased by 61% and 181% to
60 metric tonnes (MT) of French beans and 85 MT of kale respectively, in the same time
frame.
Challenges to increasing production included unusually heavy rain during the long rainy
season, which caused flooding, water logging and fungal and bacterial infections. In
contrast, during the dry season from October to December many farmers were unable to
plant crops due to a lack of irrigation. We have implemented a number of measures to help
farmers maximise their yields whatever the weather. The introduction of a text messaging
service now prompts farmers to take note of impending weather forecasts. An exchange visit
to a drier region in eastern Kenya equipped farmers with knowledge on how to successfully
manage water in the dry season.
Building links to market
To date, we’ve helped farmer groups set up 19 export contracts, guaranteeing a market for
their produce. We’ve provided training on financial literacy, helping farmers gain access to
credit from micro-finance institutions and village savings and loans associations, and helped
farmer groups write business plans detailing when they will plant and sell to known markets
in 2018.
Protecting the environment
We have trained the farmers on GLOBAL Good Agricultural Practice (GLOBALGAP)
standards, which require that production methods ensure food safety and traceability,
environmental protection and workers’ health and welfare.
1 http://www.fao.org/kenya/fao-in-kenya/kenya-at-a-glance/en/

14
We are excited to report that in November 2017, 100 farmers passed external audits to
become GLOBALGAP certified, giving them access to larger buyers and more lucrative
export markets.
The project’s environmental footprint is now being minimised with the use of charcoal
coolers, which preserve produce and reduce food waste. We’re training farmers to minimise
water pollution by handling crop protection chemicals over a soak pit, so they don’t leach into
the environment. We are also helping some farmers to install drip irrigation, an
environmentally friendly type of irrigation which minimises water and nutrient losses.
Project expansion
With funds from Medicor Foundation and UK aid, the successful Growing Futures project will
be scaled up in 2018, reaching an additional 4,900 farmers in western Kenya.
“After accessing the knowledge from the training I went through, I had to enlarge my
projections of tomatoes and French beans. After selling I got money, which I use to send my
children to school and buy food. The nutrition of our family is better than it was before: we
can now have a balanced diet. I have also been able to buy a piece of land and manage my
fields. I have benefited a lot from the project.”
Joseph, a farmer taking part in the Growing Futures
“Hearing the impact that being part of Growing Futures has had on young farmers’ lives left
us hugely inspired.”
Jonathan Neale, Aldi UK

15
Case study 5: Cutting food waste and boosting trade
About one third of the food produced in the world every year is wasted2.
This takes its toll on the environment, meaning a waste of land, water
and energy put into production, as well as a loss of potential income for
farmers. In Tanzania and Uganda, we’re helping rice, maize and beans
farmers increase their incomes by cutting food waste and boosting trade.
While Tanzania and Uganda typically produce a surplus of staple crops every year,
neighbouring Kenya only grows enough maize to feed itself one year in five. With funding
from UK aid from the UK government, Farm Africa’s FoodTrade project helps Tanzanian and
Ugandan smallholder farmers increase their profits by cutting post-harvest losses,
aggregating their staple crops and selling them in bulk to large-scale buyers within and
across borders.
In partnership with the local NGO Rural Urban Development Initiatives (RUDI) and the
Belgian-based international NGO Rikolto, we’re helping farmers store grain in warehouses
certified as meeting international standards, so that crops can be kept dry and are less
susceptible to fungal infections and pest
infestation, both common results of poor
storage. This means less food goes to waste,
which benefits both the environment and
farmers’ profits, as well as addressing food
security. Safe in the knowledge that food won’t
rot or be eaten by pests while in the
warehouses, farmers are able to wait for prices
to go up to sell their crops.
We have worked with 72,848 farmers through aggregation warehouses, increasing their
awareness of the East African Community grain standards required of staple crops,
especially those destined for export, and providing training on how to achieve these
standards.
We’ve also worked with staff from 85 warehouses to build business skills and access market
information, to help them better decide when to sell and at what price. Linkage with The East
African Grain Council’s (EAGC) RATIN software provides free, daily text messages on
current grain prices in specific localities.
To further support grain aggregation we have helped farmers gain access to credit to invest
in their businesses. In Mbeya in southern Tanzania, Mbuyuni Farmers’ Association attracted
a consortium of buyers, input suppliers and banks who signed a tripartite agreement allowing
the farmers to use aggregated crops in warehouses as collateral to access loans and inputs
on credit. Yara International, an international input supplier, agreed to supply fertiliser on
credit, which the farmers would pay back after receiving the revenue from the sale of their
crops. The National Microfinance Bank committed to lend one billion Tanzanian shillings
(about £316,000) to the farmers who had a sales agreement with a buyer to buy a milling
machine. This will allow the 1,316 member farmers to add value to their unprocessed rice
(paddy) by milling it into clean rice, which sells for a higher price.
2 http://www.fao.org/save-food/resources/keyfindings/en/
Where is food wasted?
Whilst in Europe food waste is
common at retail and consumer level,
in eastern Africa food tends to be lost
at post-harvest and processing levels,
so the producers bear the greatest
financial burden.

16
Cumulatively, 100,738 MT of grains were traded under the project over two years. Farmers
supported by the project who aggregated and improved their post-harvest handling of grain
achieved on average higher prices than other farmers who sold at farm gate.
"If you sell individually, it is not good. If you sell collectively, you get a bigger market. The
price is good because the buyer gets a bigger volume at the same time. It is better to wait to
sell the maize when the price is higher. The village aggregation centre is good because I can
leave the maize there and forget about it. I don’t have to worry about rats and mice." Frida
Elisante Sarakikya, a farmer working with Farm Africa and Rikolto in northern
Tanzania
“I look for buyers for the crops. I use social networks and telephone and I visit them and take
samples of the crops. I compare the different prices and move to different markets in Arusha
and Dar es Salaam and choose the best price. Compared to farmers selling crops
themselves at their farms, we get much better prices.” Victor Simon Kaaya, aged 25,
manager of the Uwamale cooperative warehouse in northern Tanzania

17
VALUE FOR MONEY APPROACH
During 2017 we have continued to apply the VfM (value for money) framework developed in
2013 to track, manage and improve the VfM of our work. Our framework is grounded in the
widely-used ‘3Es’3 approach, but
expands the components of VfM to
incorporate sustainability and learning.
Sustainability is vital for achieving VfM
in the work we do: if a project’s results
do not last beyond our direct
involvement, it cannot be said to
deliver good VfM. We also recognised
the need for a stronger organisational
focus on learning and feedback loops.
The expectation is that greater VfM
will be achieved over time if the
learning from one context is shared
and systematically influences the
design of another.
VfM in practice: FoodTrade
The most important aspect of VfM for Farm Africa is delivering value to the people we work
with. A great example of this during 2017 is through our FoodTrade programme where the
figures have been obtained from the independent final evaluation report.4
Under the FoodTrade programme, farmers supported by Farm Africa adopted improved
post-harvest practices and grading standards.
This contributed to a 22% average increase in prices ($0.35/kg to $0.426/kg) for the
100,738 MT traded by FoodTrade smallholders under the programme.
In generating $7.6 million of new farm-gate value, Farm Africa invested a £3.0million (c$4.2
million) activity budget to generate a 181% return on investment.
Crucially, this quantifies the benefits already achieved. By continuing to follow the improved
practices farmers will continue to benefit for many harvest seasons to come.
PUBLIC BENEFIT
Charity trustees have a duty to report in the trustees’ annual report on their charity’s public
benefit. They should demonstrate that:
The benefits generated by the activities of the charity are clear. This report sets out in
some detail the activities which Farm Africa has carried out in the year to further each
of our strategic objectives;
The benefits generated relate to the objectives of the charity. All activities undertaken
are intended to further Farm Africa’s charitable objectives; and
3 Economy, efficiency and effectiveness
4 For further details of FoodTrade see case study 5 in the Impact section.

18
The people who receive support are entitled to do so according to criteria set out in
the charity’s objectives. All Farm Africa projects are centred around rural African
farmers (pastoralists, agro-pastoralists, smallholders and forest-dwellers), the target
beneficiary group specified in our first charitable object.
The trustees have therefore satisfied themselves that Farm Africa meets the public benefit
requirements and they confirm that they have taken due regard of guidance contained in the
Charity Commission’s general guidance on public benefit and the specific guidance on the
prevention or relief of poverty for the public benefit where applicable.
STRATEGY AND GOALS
2016 – 2020 STRATEGY
During 2016 Farm Africa finalised our new strategy for the period 2016 - 2020 called ‘Driving
prosperity through agriculture.’
“The central idea which guides our strategy is that investing in smallholder
farming is the number one way to tackle poverty in rural Africa.”
This depends upon making agriculture work better, using natural resources well and creating
stronger markets for what farmers produce.
Therefore Farm Africa aims to be the leading technical specialist NGO in the fields of
agriculture, natural resources and markets – which we refer to as the pillars of our approach
– as illustrated in the graphic below.
19
2016 – 2020 STRATEGIC GOALS
How do we plan to do this? Our eight strategic goals
Goal 1: To be a leading specialist NGO
We will define ourselves as an agriculture, environment and market engagement specialist in
a landscape featuring mainly generalist NGOs and generalist private consultancies.
Goal 2: To comprehensively codify our approach
We will codify, strengthen and disseminate our approach and tools by collating the cutting
edge knowledge of our technical staff and drawing upon existing best practice from across
our portfolio of projects.
Goal 3: To strengthen our commercial expertise
We will deepen our understanding of agricultural value chains and the stakeholders and
businesses that operate within them. We will increase our ability to facilitate trade.
Goal 4: To develop an organisational monitoring and evaluation (M&E)
framework
Currently our M&E framework is mainly project specific, with different indicators and
measurements for different projects. We will create an organisational M&E framework to
measure, aggregate and analyse our overall successes and impact.
Goal 5: To build a high performance culture
We will improve our cross-departmental ways of working. We will enhance our knowledge
management capacity. We will role out an organisational learning and development
framework.
Goal 6: To ensure sustainable income streams
With the ending of the PPA funding we expect to shift from a funding model financed more
by restricted funding than unrestricted funding. We will ensure our central operating costs
are highly lean and efficient. We will look to improve our cost recovery on institutional
funding income.
Goal 7: To embrace digital
We need to progressively move direct marketing to digital to engage new audiences and
recruit new supporters efficiently and effectively.
Goal 8: Expand our footprint
We aim to expand our footprint in Africa to manage bigger programmes, reach more farmers
and generate more impact.
More detail on these and all our future plans is given in Farm Africa’s Strategic plan which
can be downloaded from our website www.farmafrica.org/strategy.

20
ORGANISATIONAL PERFORMANCE
2017 was the second full year of Farm Africa’s strategic plan. This plan identified eight key
priority areas. These priority areas are broken down into a set of annual goals. The progress
we have made against the 2017 goals are described below.
Strategic objective
Annual goal Outcome
Impact objectives (Supporting strategic goals 1,4)
Achieving impact at scale
Small changes are not enough. That means scaling up. During 2017 we will reach more than 2m people for the first time.
Farm Africa reached 2.9m people in 2017, the largest number ever.
We will sign one regional grant with a value of at least £3.0m.
During 2017 Farm Africa secured a £4m grant to work on livestock-related livelihoods in Uganda and Ethiopia.
We will consolidate our strong project level impact metrics into a set of organisational level impact metrics, which will be published in our 2017 impact report.
Farm Africa’s Annual Impact Report was published in June: https://www.farmafrica.org/downloads/2017/farm-africa-impact-report-2016.pdf Key numbers from the impact report. Agriculture
77% increase in kale productivity in
western Kenya;
Community Animal Health Workers in
Bale, Ethiopia reached 40,000
livestock a month;
Environment
700,000 hectares of forests and
rangeland sustainably managed;
25 digital weather stations installed in
Ethiopia;
Markets
937 village savings and loans
associations supported;
21 metric tonnes (MT) of Ethiopian
speciality forest coffee sold to
international markets; and
72,848 Ugandan and Tanzanian
farmers aggregated 100,000 MT of
staple crops.
Organisation objectives (Supporting strategic goals 2,3,7)
Roll out the approach work
We will invest time in documenting and sharing our tried and tested approaches in subjects ranging from forest management to aquaculture to international trade so they can be effectively and consistently replicated, not just by us, but by others who share our
All of Farm Africa’s approach papers were finalised. This totalled 9, not 12 as originally planned as several were aggregated.

21
Strategic objective
Annual goal Outcome
vision. This will culminate in a set of 12 approach papers. Each of these 12 papers will have an internal version and a published external version. The approach papers will be underpinned by a set of at least 50 tools, which will be used in our projects to maximise effective project delivery.
The approach papers are all published on Farm Africa’s website : https://www.farmafrica.org/agriculture/agriculture-1 https://www.farmafrica.org/environment/environment-1 https://www.farmafrica.org/business/business-1
Deepen our partnerships with the private sector
Farmers’ abilities to build thriving businesses depend on well-functioning markets. We will scale up work with a wide range of private sector organisations from those providing agricultural inputs or access to finance to companies acting as gateways to international export markets.
In Kenya we worked with VegPro to help farmers sell French beans, kale and cabbages internationally. In Ethiopia we worked with several MFIs (Micro Finance Institutes) to improve access to credit for pastoralists.
We will deepen our expertise and level of partnership with commercial coffee companies, in particular connecting Ethiopian produced forest coffee with export markets.
We helped the Oromia Coffee Union to secure a deal for the sale of specialist coffee with Atlas and Twin in 2017. Full details are contained in the case study 3 in the annual report.
We aim to sign significant partnerships with at least two corporate organisations from the food industry with a value of £500k per annum.
We agreed two significant corporate partnerships. The first with Aldi – working on the growing futures project (described in the case study). The second with Waitrose in Kenya through the Waitrose Foundation.
Develop our digital communication
We will recruit a lead digital specialist to help us harness the power of digital communications to engage with new audiences, share the lessons we learn and shine a spotlight on the stories of farmers whose lives we’ve changed.
We recruited a Digital Manager and have begun a digital transformation project to integrate digital into all aspects of our work.
Financial goals (Supporting strategic goals 5,6)
Income & fundraising
We aim to raise a total of £13.0m, including unrestricted income of £2.0m, restricted income of £7.9m and income from Sidai of £3.1m.
We raised a total of £14.7m, £1.7m above our target.
We will also integrate our funding strategy with our digital strategy and corporate partnership development in order to broaden out our income streams.
We appointed a Digital Manager during 2017 to lead on this work. We began to integrate digital marketing into our fundraising campaigns.
Sustainable financial model
The end of the PPA funding period requires Farm Africa to shift its financial model to a different basis.
Outcomes in line with goals (see below page)
22
Strategic objective
Annual goal Outcome
We will pursue four factors to achieve this transition to a sustainable financial model post PPA: We will increase our cost recovery from £0.9m to £1.2m;
We will improve the net margin on our unrestricted fundraising
We will increase the volume of restricted grants we bid for by at least 25%; and
We will reduce our central cost structure by 16% (£0.7m) from 2015 levels.
The 2017 financial results achieved the following:
Cost recovery increased by 32% to £1.2m in line with our ambitious target;
The net margin on unrestricted fundraising increased to £1.3m;
We reduced our central cost structure by 14% (over £0.6m) from their 2015 levels.
Innovation (Supporting strategic goal 8)
We will build on our strong track record of innovative thinking. We’ll focus on how we can effect systemic change, and strive to build stronger and deeper links between our work in different locations, so that our programmes work in synergy, increasing our regional impact.
Our SHARE programme is an example of Farm Africa’s innovative approach. SHARE takes a whole ecosystem approach to maximise the benefits of all stakeholders and manage the tension between environmental sustainability and agriculture in a holistic way. Refer to case study 2 for more details.
2018 OBJECTIVES
To aid our planning, we have broken down the strategic goals into a set of annual objectives.
These objectives are more specific and time-bound than the strategic goals – and represent
the key steps for Farm Africa in the next year towards achieving the strategic goals. We
have grouped the objectives into the areas of impact, organisation, finance and innovation
and cross referenced which strategic goals they underpin.
Strategic objective Annual goal
Impact goal
Achieving impact at scale
Small changes are not enough. That means scaling up. During 2018 we will reach more than 3m people for the first time.
We aim to sign grants and contracts with a total value of £25m during 2018.
We will plan for geographical expansion into at least one new country.

23
Strategic objective Annual goal
Impact goal
Technical excellence
We will develop a knowledge hub which combines our knowledge of agriculture, landscapes (soil, water and climate) and markets within three value chains. We will expand our network of sector specialist consultants in order to access the highest level of expertise to support our programme delivery.
Deepen our partnerships with the private sector
We will partner with at least one private sector organisation to integrate their supply chain and development and sustainability work within eastern Africa.
We will bid for and aim to secure one commercial contract to deliver a technical assistance agricultural support programme within eastern Africa.
Develop our digital strategy
We will continue our digital transformation project to ensure digital is integrated into all aspects of our work.
Income & fundraising
We will raise £2.0m in unrestricted funding.
We will deepen our partnership with the World’s 50 Best Restaurants to promote the links between food and development.
Sustainable financial & organisational model
We will produce and begin to implement a three year growth plan (covering the period 2018 – 2020). We will ensure best practice in our policies and processes around safeguarding.
Innovation We will look to undertake a project exploring the impact of child labour
& modern slavery within agricultural value chains and identifying what
can be done to tackle this.

24
FINANCIAL REVIEW
2017 FINANCE OVERVIEW
In financial terms 2017 was a year of transition for Farm Africa’s financial model. The
central challenge was to create a stable financial model without DFID Programme
Partnership Arrangement (PPA) funding, previously worth over £1.2m per year. Our strategy
is based on three core strands:
Increasing the level of cost recovery on our programmes. Cost recovery was £1.2m
in 2017, up 32% on 2016 and in line with our ambitious target;
Increasing net margin on unrestricted fundraising. Net margin on unrestricted
fundraising rose from £0.9m in 2016 to £1.3m in 2017; and
Reducing our central cost structure, Central costs5 were reduced by a further £0.1m
in 2017, and are now £0.5m lower than in 2015.
In this year’s financial statements, for the first time, we have analysed our charitable
expenditure based upon Farm Africa’s three programmatic pillars of agriculture, business,
and the environment6. This showed 49% of our charitable activities related to supporting
farmers in market based activities, with 24% on agricultural activities and 27% on
environmental conservation work.
INCOME
Total income has decreased to £14.7m (2016: £17.9m), an overall decrease of £3.2m. The
decrease was predominantly due to £2.3m of PPA funding received in 2016 (nil in 2017),
and lower grant income in Sidai, our social enterprise subsidiary in Kenya.
Fundraising income increased to £2.3m (2016: £2.1m), due primarily to a £270k increase in
legacy income.
Our project income, which is principally income from government, institutional and other
major donors, decreased to £10.4m (2016: £11.6m). This was mainly due to the timing of
income receipts (in particular the SHARE project funded by the EU, where a tranche of
funding was received in 2016 including for 2017 activities).
5 Defined as fundraising costs and support costs 6 Excluding Farm Africa’s subsidiary social enterprise, Sidai.
Chart to show proportion of Farm Africa's activities
Agriculture Market engagement Natural resource management
25
Farm Africa broadened our funding base during 2017 with new grants from Packard
Foundation, the International Livestock Research Institute, and Conservation International.
EXPENDITURE
Our total expenditure has remained steady, declining by £0.1m to £16.4m (2016: £16.5m).
Spend on charitable activities increased from £15.6m to £15.7m, driven by the growth of our
project portfolio and a strong focus on timely project implementation.
Fundraising expenditure decreased slightly to £0.8m (2016: £0.9m) to reflect our strategic
focus on improving the net margin from fundraising income and by reducing the costs and
activities associated with new individual donor recruitment.
FINANCIAL RESULTS
Farm Africa reported a deficit of £1.55m of which £0.87m was a deficit on restricted
funds and £0.68m was a deficit on unrestricted funds. This was in line with the financial
plans and budget set for 2017. There were three distinct elements within the overall financial
result:
1. Restricted funds. The restricted fund deficit was planned and budgeted due to
differences in timing across financial years between the grant income and grant
expenditure for a number of institutional donor grants.
2. Farm Africa unrestricted funds. Deficit of £0.17m as per transition plan post PPA.
3. Sidai unrestricted funds. As part of Sidai’s business plan and growth strategy, and
in line with many developing social businesses, Sidai has not yet achieved
profitability in its commercial trading arm. Sidai’s trading losses in 2017 were £0.60m.
Sidai continued to invest in building its brand, expanding its reach and developing
Sidai own branded products. This analysis is shown in the table below which
disaggregates Farm Africa’s consolidated unrestricted funds into these two elements.
The table on the following page analyses the overall 2017 unrestricted funds deficit between
the portion relating to the underlying Farm Africa charity (and trading subsidiary), and the
portion relating to Sidai.

26
RESERVES
As at 31 December 2017, total reserves were £4.6m (2016: £6.2m). This is broken down
into restricted reserves of £3.6m and unrestricted reserves of £1.0m.
The unrestricted reserves of £1.0m are comprised of three elements. Firstly, the parent
charity’s unrestricted funds remained stable at £1.7m. Secondly, £0.17m of our
unrestricted funds are designated to facilitate the transition of Farm Africa’s unrestricted
funding after the PPA grant has finished (we designated £0.35m in 2016, of which £0.18m
was utilised in 2017 and the remainder is earmarked to fund our growth plans). Finally, Sidai
has a net deficit of £0.92m (2016: deficit £0.42m) reflecting the business expansion funded
predominantly by debt finance and reflecting a net liability position.
In summary, we begin 2018 in a solid financial position with reserves necessary to deliver
our ambitious goals for growth through the new strategy.
GOING CONCERN
We have set out above a review of financial performance and the charity’s reserves position.
We believe that we have adequate financial reserves to continue to deliver against our plans
and adequate resources to continue in operational existence for the foreseeable future. We
CONSOLIDATED STATEMENT OF FINANCIAL ACTIVITIES
For the year ended 31 December 2017
Sidai Group
Farm Africa
Charity &
Trading Ltd Total
Unrestricted
funds
Unrestricted
funds
Unrestricted
funds
£'000 £'000 £'000
INCOME FROM
Donations and legacies 2,266 2,266
Charitable activities
Social enterprise trading income 1,968 1,968
Other trading activities 41 41
Investment income 1 1
Other income 20 20
Total income 1,968 2,328 4,296
EXPENDITURE ON
Raising funds 766 766
Charitable activities
Social enterprises 2,565 2,565
Agriculture 496 496
Business 736 736
Environment 509 509
Total expenditure on charitable activities 2,565 1,741 4,306
Total expenditure 2,565 2,507 5,072
Net income / (expenditure) for the year
before minority interest (597) (179) (776)
Net income / (expenditure) for the year
after minority interest (499) (179) (678)

27
believe that there are no material uncertainties that call into doubt the charity’s ability to
continue. The accounts have therefore been prepared on the basis that the charity is a going
concern.
ORGANISATIONAL INFORMATION
This section includes important information about Farm Africa and how we operate as an
organisation. It covers our:
charitable objects; which define in law the aims of the charity;
vision, mission and values; which cover what we are trying to achieve and how we
aim to achieve it;
legal structure; the legal form which Farm Africa operates within; and
governance and management structure; which outlines how the organisation is
managed and important decisions are made and scrutinised.
CHARITABLE OBJECTS
While there has been huge progress in bringing global poverty levels down, sub-Saharan
Africa has benefitted the least. Today, almost half of the world’s extreme poor live in sub-
Saharan Africa. The vast majority work in agriculture in rural areas. We tackle the three big
challenges trapping people in rural Africa in poverty: ineffective agriculture, environmental
destruction and their lack of access to markets.
This work is guided by our charitable objects:
to relieve the poverty of farmers, agricultural workers and herders enabling them to
improve the effective management of their natural resources;
to promote the improvement of agriculture, horticulture, food production, storage and
distribution and conduct research in these subjects. To publish the results of such
research and to disseminate knowledge for the benefit of the public and to encourage
skill and industry in husbandry;
to promote the improvement of livestock and poultry and the prevention and
eradication of disease therein; and
to promote the education of the public in, and the furthering of, the interests of
agriculture, horticulture, arboriculture, apiculture, animal husbandry and related
industries.
We implement these objects through pursuing our organisational vision and mission:
VISION, MISSION & VALUES
OUR VISION: a prosperous rural Africa.
OUR MISSION: we reduce poverty permanently by unleashing African farmers’
abilities to grow their incomes and manage their natural resources sustainably.
We have been working in eastern Africa for 30 years and currently have programmes in
Ethiopia, Kenya, Tanzania and Uganda. We focus on crops, livestock and forestry and have
a track record of world-class technical expertise and delivery. We take a holistic systems
approach, recognising the differing aims of different stakeholders to protect the natural
environment and maximise the economic benefits from farming.

28
We are recognised for the quality of our 200 plus staff in eastern Africa who work closely
with rural communities to ensure an approach that combines a deep understanding of the
local culture and context coupled with a solid knowledge in our fields of expertise.
We are known for delivering projects that produce long-term sustainable solutions grounded
in robust evidence. Combined with our innovative thinking, this approach has enabled us to
increase our impact in helping Africa’s farmers escape poverty.
OUR VALUES: we believe smallholder farmers can and will play a key role in
achieving rural prosperity in Africa.
We deliver this by:
being experts in our field: delivering insightful and impactful evidence-based
solutions;
pushing boundaries: being creative with old and new solutions and approaches;
acting for the long-term: building relationships and delivering long-lasting change
for farmers;
working flexibly: taking advantage of the most effective solutions, whether from
communities, the private sector, civil sector or government; and
sharing knowledge with others: reaching more farmers than we could alone and
ensuring effective technologies are widely accessed.
LEGAL STRUCTURE
Farm Africa is a registered charity (registration number 326901) and is constituted as a
company registered in England and Wales and limited by guarantee (registration number
01926828) approved & adopted on 29 May 1985 and last updated by special resolution on
23 June 2004. Its objects and powers are set out in its Memorandum and Articles of
Association. Details of Farm Africa’s subsidiary entities are included in note 13 to the
accounts.
TAX STATUS
Farm Africa has charitable status and is exempt from corporation tax as all of its income is
charitable and is applied for charitable purposes.
AUDITOR APPOINTMENT
A resolution concerning the reappointment of Crowe Clark Whitehill LLP as auditors will be
proposed at the Farm Africa annual general meeting of 5 July 2018.
GOVERNANCE AND ORGANISATIONAL STRUCTURE
Farm Africa’s officers and advisers are as shown on pages 3 to 4 of this report.
Mr Michael Palin CBE and Sir Martin Wood OBE FRS DL both kindly agreed to continue as
patron and president respectively of Farm Africa during 2018.
Farm Africa is governed by a board of trustees based in the UK and authority is delegated by
them to the chief executive to manage the organisation. Changes to the board of trustees
are shared in the officers and advisors section on page 3.
Trustee recruitment is undertaken through a range of routes dependent on the identified
needs. For example, when seeking a trustee with audit experience, we have targeted
advertising through selected accountancy firms. This is followed by an interview process with
a panel of trustees and approval by the board. The trustees are then formally elected by the
members at the next annual general meeting. New trustees receive a personalised

29
induction, including briefings from the chair, chief executive and other senior management
team members. They are encouraged to visit our project work when the opportunity arises.
Trustees also receive ongoing training, either one to one or through briefings at board
meetings and as and when specific training needs are identified.
The finance risk and audit committee (FRAC) meets regularly under the chairmanship of
John Shaw, Farm Africa’s Treasurer. FRAC normally comprises at least two trustees,
together with external members as required. FRAC agrees the external audit plan, reviews
the external auditor’s management letter and monitors the implementation of resulting
actions. FRAC also undertakes a detailed review of the annual budget, quarterly
management accounts, the risk register and the annual review and accounts before their
submission to the board. It approves the annual internal audit plan and oversees the
implementation of recommendations arising from internal audit reports.
The programme advisory committee (PAC) met throughout 2017 under the chairmanship of
Professor Jonathan Kydd. PAC comprises at least two trustee members and external
members from a wide range of disciplines. PAC has two objectives:
to ensure, on behalf of the board, that systems are in place to monitor programme
quality and strategic fit, and
to provide management with advice and a sounding-board on aspects of its
programme work.
The nomination and remuneration committee also continued its work during the year. It is
chaired by Richard Macdonald and comprises no fewer than three trustees appointed by the
board, with the chief executive and director of resources as non-voting members of the
committee. The committee takes responsibility for identifying and proposing new board
members and for their induction, support and development. It also approves salary
increments for the senior management team and the annual cost of living increase for UK
staff, and makes a recommendation to the board on the salary of the chief executive.
We are supported by Farm Africa USA Inc which is a US non-profit 501(c)(3) organisation
that promotes and improves agriculture, natural resource management and food production
in an effort to alleviate hunger and poverty in Africa.
SUBSIDIARIES
During 2017, Farm Africa had two directly owned and active subsidiaries:
Sidai Africa Limited, which acts as an investment holding company for Sidai Africa
(Kenya) Limited, our veterinary franchise operation in Kenya, and
Farm Africa Trading Limited, which enables us to receive sponsorship income from
corporate partners in a tax efficient manner.
The detailed results for our active subsidiaries are shown in note 13. Farm Africa Trading
made a loss for the year of £22,000 (2016: loss of £12,000). Our corporate sponsorship
income is variable as it is dependent on the number of high profile events in a particular year
and thus results in variable results across different financial years. We expect Farm Africa
Trading to make a profit in 2018 and for significant growth in our corporate partnerships.
During 2017, Sidai Africa (Kenya) Limited, the wholly owned subsidiary of Sidai Africa
Limited, made a loss for the year of £580,000 (2016 loss of £969,000). Like many growing
businesses Sidai continued to invest in growth by building its brand, expanding its reach and

30
developing Sidai own branded products. Sidai’s strategy is to continue to grow and is
seeking external investment to facilitate this growth.
POLICIES & LEGAL INFORMATION
The final section of the annual report covers important policies and legal information which
give more technical insight into how Farm Africa operates.
GRANT-MAKING POLICY
Farm Africa works with a number of delivery or implementation partners. These are generally
structured where Farm Africa is the lead grant recipient and the delivery partners act as sub-
grant recipients.
Partner selection is done on a grant by grant basis. The criteria for partner selection includes
specialist expertise that will broaden Farm Africa’s technical expertise (for example, the
International Water Management Institute), geographical reach to enable more effective
programme delivery (for example, Vredeseilanden in Uganda), and a complementary core
competence.
Before a formal grant agreement is signed all potential grantees are subject to a due
diligence process based upon the OCAT (Organisational Capacity Assessment Tool).
A signed grant agreement is put in place with all partners, which covers joint ways of
working, delivery criteria and reporting requirements. Grant reporting requirements are
generally governed by Farm Africa’s grant agreement with the primary donor.
SAFEGUARDING POLICY
During the period since the previous annual report, Farm Africa have reviewed our
safeguarding policy and processes. Farm Africa is committed to:
promote good practice and work in a way that prevents harm, abuse and coercion
occurring;
ensure that any allegations of abuse or suspicions are investigated promptly and
robustly. And where the allegation is proven it will be dealt with appropriately;
take any action within our powers to stop abuse occurring and ensure the person
who has experienced the abuse receives appropriate; and
be transparent and open by reporting any cases of abuse to the appropriate
authorities.
In order to create a working environment that safeguards our beneficiaries, Farm Africa will:
promote the rights of the people we work with to live free from abuse and coercion;
ensure the well-being of the people we work with;
manage our work in a way that promotes safety and prevents abuse;
recruit staff safely, ensuring employment references are obtained;
ensure that all staff sign up to Farm Africa’s code of conduct and safeguarding policy;
and
provide effective management for staff through supervision, support and training.

31
REMUNERATION POLICY
Farm Africa is determined to reach as many smallholder farmers and their families as we
possibly can. We do not compete with salaries in the private sector but our salaries are
pitched at a level to allow us to attract effective, energetic and innovative leaders who will
enable us to increase our impact and achieve our vision of a prosperous rural Africa.
Farm Africa had an annual income of £15m, has a track record of world class technical
expertise and delivery and has around 200 staff internationally. This provides the
organisational context in which to set our remuneration policy.
Farm Africa aims to pay around the median level for a charity of our size; for this purpose we
benchmark all salaries in the UK and internationally annually against sector-specific salary
surveys and cross-reference them against local cost of living indices. This data is translated
into salary scales for the UK and each operational country and approved by Farm Africa’s
senior team. All staff are paid in line with these salary scales.
The nomination and remuneration committee uses the benchmark data to review and fix
annual senior salary increases. We believe that our senior salaries paid as a result of this
process are a proper reflection of the skills, knowledge and experience required to run an
organisation like ours. The bandings for senior staff remuneration are disclosed in Note 10.
RESERVES POLICY
The board has determined that Farm Africa needs unrestricted reserves for the following
purposes:
to provide working capital and manage seasonality of income, for the effective
running of the organisation;
to protect against unrestricted income fluctuations;
to protect against unforeseen project expenditure due to working in inherently risky
situations and to manage foreign exchange volatility; and
to enable Farm Africa to invest in unforeseen funding and growth opportunities
should it choose to do so.
The board considers that unrestricted reserves target should be set by applying the following
methodology:
income risk: an assessment of the percentage risk in each unrestricted income
stream (including forecast hub recovery and co-funding) of between 5% and 40%
dependent on source; and
programmatic expenditure: an assessment of the unplanned unrestricted expenditure
needs being calculated as 5 - 7% of projected restricted expenditure.
This methodology translated to an unrestricted reserves target of £1.3m at 31 December
2017. This compares with an actual figure of unrestricted funds, including those designated,
of £1.9m.7
Through prudent financial management Farm Africa’s reserves are £600k above the target
level. The trustees have carefully considered the right balance between ensuring a strong
and stable financial footing for Farm Africa and putting funds to use to further support
farmers.
7 These are the unrestricted reserves figures for the parent, excluding Sidai’s reserves.

32
FUNDRAISING DISCLOSURE
In 2017 Farm Africa conducted all of its fundraising practices “in house” and did not engage
any agency to provide fundraising acquisition on its behalf. Farm Africa raises funds from
individuals, events, corporate partners and trusts and foundations. All fundraising activity
was overseen by the Director of External Relations and all activity was compliant with the
Fundraising Regulator.
Farm Africa is a voluntary member of the Fundraising Regulator and as such ensures
compliance with the Fundraising Code of Conduct.
Farm Africa did not receive any formal complaints in relation to its fundraising in 2017 but
does have a complaints procedure in place which can be actioned if required to do so.
In order to protect vulnerable people, Farm Africa ensures that all communication with
donors is recorded on a secure database. Should there be any concerns that a supporter is
vulnerable, as per Farm Africa’s safeguarding policy, appropriate action is taken to prevent
requests for donations from these supporters.
INVESTMENT POLICY
Farm Africa has an agreed investment policy covering both programme-related investments
and assets held to fund planned expenditure. As the majority of Farm Africa’s funds are held
to support planned expenditure the aim of the investment policy is to minimise risk and
protect capital security and therefore such assets are held as cash, invested to obtain a yield
where possible.
Farm Africa’s policy towards programme-related investments (PRI) is to be open towards
PRIs subject to assessing a number of tests. These tests are (1) the PRI must primarily be
focused on Farm Africa’s social impact, (2) the PRI should be in the area of expertise (in
particularly African agricultural value chains), (3) subject to the assessment of a business
case by the board – in particular to assess financial sustainability on a case by case basis.
The business case will also include the financing mechanism needed for the PRI investment,
(4) the level of governance and management involvement associated with the PRI.
RISK MANAGEMENT
The board is responsible for ensuring that there is an appropriate process for the
management of any risks faced by Farm Africa. Assisted by senior staff, the board regularly
reviews and assesses the major risks to which Farm Africa is exposed, in particular those
relating to the operations and finances of the organisation, and receives a report regarding
the status of those risks and the mitigating actions and controls that are in place.
The four most significant risk areas identified by the board are:
maintaining financial strength and sustainability;
reliance on a small number of key staff and managing significant organisational
change;
political and security risks arising in the countries where we operate; and
ensuring high quality, timely programmatic delivery in challenging operating contexts.
The external environment in which Farm Africa works is inherently risky. The security
situation in some parts of eastern Africa is difficult and NGO regulation in our countries of
operation is becoming more burdensome. Farm Africa seeks to manage the resulting risks

33
by spreading its work over a number of countries and contexts and by sourcing funding from
as wide a variety of funders as possible.
The strategic goals address all the main risk areas, recognising the inherent risk within the
operations. A regular programme of internal audit provides additional support for the trustees
in considering the effectiveness of key controls in place to manage risk.
Farm Africa’s approach is to recognise and accept an appropriate level of risk, in particular
ensuring that risk management does not deter innovation and learning. The board fully
supports this strategy, and is satisfied that the management systems in place provide
reasonable assurance that identifiable risks are managed appropriately.
CHARITY GOVERNANCE CODE
In order to follow best practice in standards of charity governance, Farm Africa completed a
self assessment against the updated Charity Governance Code. The core substance of the
code consists of seven key principles. These are underpinned by the core role and
responsibility of the trustees:
1. Organisational purpose
2. Leadership
3. Integrity
4. Decision-making, risk and control
5. Board effectiveness
6. Diversity
7. Openness and accountability
Self-assessment summary
Overall Farm Africa meets a very significant proportion of the recommended and best
practice for governance contained within the code across the seven areas;
There is some room for enhancing reporting of both project performance and impact
metrics to the board;
There are some incremental improvements to be made to our governance
processes: such as ensuring the FRAC chair meets with the auditors independently
of senior management on an annual basis, and establishing a central register of
policies and processes; and
There is the potential to define and codify Farm Africa’s overall approach to
transparency.
STATEMENT OF TRUSTEES’ RESPONSIBILITIES
The trustees (who are also the directors for the purposes for company law) are responsible
for preparing the directors' report and the financial statements in accordance with applicable
law and regulations.
Company law requires the directors to prepare financial statements for each financial year.
Under that law the directors have elected to prepare the financial statements in accordance
with United Kingdom generally accepted accounting practice (United Kingdom accounting
standards) and applicable law.
Under company law the directors must not approve the financial statements unless they are
satisfied that they give a true and fair view of the state of affairs of the company and the
group and of the profit or loss of the group for that period. In preparing these financial
statements, the directors are required to:

34
select suitable accounting policies and then apply them consistently;
make judgments and accounting estimates that are reasonable and prudent;
state whether applicable UK Accounting Standards have been followed, subject to
any material departures disclosed and explained in the financial statements; and
prepare the financial statements on the going concern basis unless it is inappropriate
to presume that the company will continue in business.
The directors are responsible for keeping adequate accounting records that are sufficient to
show and explain the company's transactions and disclose with reasonable accuracy at any
time the financial position of the company and enable them to ensure that the financial
statements comply with the Companies Act 2006. They are also responsible for
safeguarding the assets of the company and hence for taking reasonable steps for the
prevention and detection of fraud and other irregularities.
The trustees are responsible for the maintenance and integrity of the corporate and financial
information included on the charitable company’s website. Legislation in the United Kingdom
governing the preparation and dissemination of financial statements may differ from
legislation in other jurisdictions.
So far as the trustees are aware, there is no relevant audit information of which the
charitable company’s auditor is unaware. The trustees have taken all the steps that they
ought to have taken as trustees in order to make themselves aware of any relevant audit
information and to establish that the charitable company’s auditor is aware of that
information.
Approved by the board of trustees of Farm Africa Limited on
including, in their capacity as company directors, the strategic report contained therein, and
signed on its behalf by
Richard Macdonald CBE, chair

35
INDEPENDENT AUDITOR’S REPORT TO THE MEMBERS OF FARM
AFRICA LIMITED
Opinion
We have audited the financial statements of Farm Africa Limited for the year ended 31
December 2017 which comprise the Group Statement of Financial Activities, the Group and
Charity Balance Sheets, the Group Statement of Cash Flows and notes to the financial
statements, including a summary of significant accounting policies. The financial reporting
framework that has been applied in their preparation is applicable law and United Kingdom
Accounting Standards, including Financial Reporting Standard 102 The Financial Reporting
Standard applicable in the UK and Republic of Ireland (United Kingdom Generally Accepted
Accounting Practice).
This report is made solely to the charitable company’s members, as a body, in accordance
with Chapter 3 of Part 16 of the Companies Act 2006. Our audit work has been undertaken
so that we might state to the charitable company’s members those matters we are required
to state to them in an auditor’s report and for no other purpose. To the fullest extent
permitted by law, we do not accept or assume responsibility to anyone other than the
charitable company and the charitable company’s members as a body, for our audit work, for
this report, or for the opinions we have formed.
In our opinion the financial statements:
give a true and fair view of the state of the group’s and the charitable company’s
affairs as at 31 December 2017 and of the group’s incoming resources and
application of resources for the year then ended;
have been properly prepared in accordance with United Kingdom Generally
Accepted Accounting Practice; and
have been prepared in accordance with the requirements of the Companies Act
2006.
Basis for opinion
We conducted our audit in accordance with International Standards on Auditing (UK) (ISAs
(UK)) and applicable law. Our responsibilities under those standards are further described in
the Auditor’s responsibilities for the audit of the financial statements section of our report.
We are independent of the group in accordance with the ethical requirements that are
relevant to our audit of the financial statements in the UK, including the FRC’s Ethical
Standard, and we have fulfilled our other ethical responsibilities in accordance with these
requirements. We believe that the audit evidence we have obtained is sufficient and
appropriate to provide a basis for our opinion.
Conclusions relating to going concern
We have nothing to report in respect of the following matters in relation to which the ISAs
(UK) require us to report to you where:
the trustees’ use of the going concern basis of accounting in the preparation of the
financial statements is not appropriate; or
the trustees have not disclosed in the financial statements any identified material
uncertainties that may cast significant doubt about the group’s or the charitable
company’s ability to continue to adopt the going concern basis of accounting for a

36
period of at least twelve months from the date when the financial statements are
authorised for issue.
Other information
The trustees are responsible for the other information. The other information comprises the
information included in the annual report, other than the financial statements and our
auditor’s report thereon. Our opinion on the financial statements does not cover the other
information and, except to the extent otherwise explicitly stated in our report, we do not
express any form of assurance conclusion thereon.
In connection with our audit of the financial statements, our responsibility is to read the other
information and, in doing so, consider whether the other information is materially inconsistent
with the financial statements or our knowledge obtained in the audit or otherwise appears to
be materially misstated. If we identify such material inconsistencies or apparent material
misstatements, we are required to determine whether there is a material misstatement in the
financial statements or a material misstatement of the other information. If, based on the
work we have performed, we conclude that there is a material misstatement of this other
information, we are required to report that fact.
We have nothing to report in this regard.
Opinions on other matters prescribed by the Companies Act 2006
In our opinion based on the work undertaken in the course of our audit
the information given in the trustees’ report, which includes the directors’ report and
the strategic report prepared for the purposes of company law, for the financial year
for which the financial statements are prepared is consistent with the financial
statements; and
the strategic report and the directors’ report included within the trustees’ report have
been prepared in accordance with applicable legal requirements.
Matters on which we are required to report by exception
In light of the knowledge and understanding of the group and the charitable company and
their environment obtained in the course of the audit, we have not identified material
misstatements in the strategic report or the directors’ report included within the trustees’
report.
We have nothing to report in respect of the following matters in relation to which the
Companies Act 2006 requires us to report to you if, in our opinion:
the parent company has not kept adequate accounting records; or
the parent company financial statements are not in agreement with the accounting
records and returns; or
certain disclosures of trustees' remuneration specified by law are not made; or
we have not received all the information and explanations we require for our audit.
Responsibilities of trustees
As explained more fully in the trustees’ responsibilities statement set out on page 33 the
trustees (who are also the directors of the charitable company for the purposes of company

37
law) are responsible for the preparation of the financial statements and for being satisfied
that they give a true and fair view, and for such internal control as the trustees determine is
necessary to enable the preparation of financial statements that are free from material
misstatement, whether due to fraud or error.
In preparing the financial statements, the trustees are responsible for assessing the group’s
or the charitable company’s ability to continue as a going concern, disclosing, as applicable,
matters related to going concern and using the going concern basis of accounting unless the
trustees either intend to liquidate the charitable company or to cease operations, or have no
realistic alternative but to do so.
Auditor’s responsibilities for the audit of the financial statements
Our objectives are to obtain reasonable assurance about whether the financial statements
as a whole are free from material misstatement, whether due to fraud or error, and to issue
an auditor’s report that includes our opinion. Reasonable assurance is a high level of
assurance, but is not a guarantee that an audit conducted in accordance with ISAs (UK) will
always detect a material misstatement when it exists. Misstatements can arise from fraud or
error and are considered material if, individually or in the aggregate, they could reasonably
be expected to influence the economic decisions of users taken on the basis of these
financial statements.
A further description of our responsibilities for the audit of the financial statements is located
on the Financial Reporting Council’s website at: www.frc.org.uk/auditorsresponsibilities. This
description forms part of our auditor’s report.
Nicola May
Senior Statutory Auditor
For and on behalf of
Crowe Clark Whitehill LLP
Statutory Auditor
London

38
CONSOLIDATED STATEMENT OF FINANCIAL ACTIVITIES
(incorporating Income and Expenditure account) for the year ended 31 December 2017
2017 2016
Unrestricted Restricted Total Unrestricted Restricted Total
Note funds funds funds Funds Funds funds
£’000 £’000 £’000 £’000 £’000 £’000
INCOME FROM
Donations and legacies 2 2,266 - 2,266 4,374 - 4,374
Charitable activities
General - 9,654 9,654 - 10,348 10,348
Social enterprise trading income
1,968 766 2,734 1,787 1,287 3,074
Total income from charitable activities
3 1,968 10,420 12,388 1,787 11,635 13,422
Other trading activities 4 41 - 41 65 - 65
Investments 4 1 - 1 4 - 4
Other income 4 20 - 20 35 - 35
Total income 4,296 10,420 14,716 6,265 11,635 17,900
EXPENDITURE ON
Raising funds 6 766 - 766 904 - 904
Charitable activities
Social enterprise 2,565 895 3,460 2,870 450 3,320
Agriculture 496 2,476 2,972 1,065 2,192 3,257
Business 736 5,222 5,958 1,233 3,857 5,090
Environment 509 2,781 3,290 1,010 2,930 3,940
Total expenditure on charitable activities
7 4,306 11,374 15,680 6,178 9,429 15,607
Total expenditure 5,072 11,374 16,446 7,082 9,429 16,511
Net income/ (expenditure) for the year
5 (776) (954) (1,730) (817) 2,206 1,389
(Surplus)/ deficit attributable to the minority
98 19 117 173 (134) 39
(Surplus)/ deficit attributable to the parent
(678) (935) (1,613) (644) 2,072 1,428
Other recognised gains and losses
Exchange differences on revaluation of subsidiary
18 - 64 64 - 22 22
Transfers between funds
Net movements on funds (678) (871) (1,549) (644) 2,094 1,450
Total funds brought forward
1,644 4,522 6,166 2,288 2,428 4,716
Total funds carried forward
18 966 3,651 4,617 1,644 4,522 6,166
All the above results derived from continuing activities. There are no recognised gains and
losses other than those stated above. The notes on pages 41 to 57 form an integral part of
these financial statements.

39
CONSOLIDATED & CHARITY BALANCE SHEETS
As at 31 December 2017
Notes 2017 2017 2016 2016
Group Charity Group Charity
£’000 £’000 £’000 £’000
FIXED ASSETS
Tangible assets 11 521 28 507 41
Intangible assets 12 28 - 36 -
Investments (social) 13 - 1 - 1
549 29 543 42
CURRENT ASSETS
Stock: goods for resale 329 - 452 -
Debtors 14 1,102 1,100 1,786 1,705
Cash at bank and in hand 5,276 4,475 5,819 4,830
Short term deposits 617 617 637 637
7,324 6,192 8,694 7,172
Creditors
Amounts falling due within one year
15 (2,075) (984) (1,827) (965)
Net current assets 5,249 5,208 6,867 6,207
Total assets less current liabilities 5,798 5,237 7,410 6,249
Creditors: amounts falling due in more than one year
16 (1,016) - (739) -
Provisions for liabilities and charges
17 (233) (233) (278) (278)
NET ASSETS 4,549 5,004 6,393 5,971
Net assets attributable to the minority interest
19 68 (227)
4,617 6,166
THE FUNDS OF THE CHARITY
Restricted funds 18 3,651 3,078 4,522 3,904
Unrestricted funds 18
- General funds 1,717 1,755 1,717 1,717
- Designated funds (strategic investment)
171 171 350 350
- Designated funds (Sidai) (922) - (423) -
TOTAL FUNDS 18 4,617 5,004 6,166 5,971
Approved by the board and authorised for issue on 31 May 2018 and signed on their behalf
by:
Richard Macdonald John Shaw
Chairman Treasurer
Registered Company No: 01926828
The notes on pages 41 to 57 form an integral part of these financial statements.
The deficit for the financial year dealt with in the financial statements of the parent company
was £968,000.

40
CONSOLIDATED STATEMENT OF CASHFLOWS
For the year ended 31 December 2017
Notes 2017 2016
£’000 £’000
Cash flows from operating activities: Net cash (used in) / provided by operating activities
A (595) 2,532
Cash flows from investing activities:
Dividends, interest, and rents from investments 1 4
Disposal of tangible fixed assets and capital grants 29 125
Purchase of tangible fixed assets and capital grants (275) (260)
Net cash (used in) investing activities (245) (131)
Cash flows from financing activities:
Cash inflows from new borrowing 277 261
Net cash provided by financing activities
277 261
Change in cash and cash equivalents in the reporting period
(563) 2,662
Cash and cash equivalents at the beginning of the reporting period
6,456 3,794
Cash and cash equivalents at the end of the reporting period
5,893 6,456
NOTES TO THE STATEMENT OF CASHFLOWS
A. RECONCILIATION OF CASH FLOWS FROM OPERATING ACTIVITIES
2017 2016
£’000 £’000
Net (expenditure) / income for the reporting period (as per the Statement of Financial Activities)
(1,730) 1,389
Adjustments for: Depreciation 137 112
(Profit) on the disposal of fixed assets (11) -
Decrease in debtors 684 427
Increase in creditors falling due within one year 248 420
(Decrease) / increase in provisions (45) 98
Decrease in stocks 123 90
Dividends, interest and rents from investments (1) (4)
Net cash (used in) / provided by operating activities (595) 2,532
B. ANALYSIS OF CASH AND CASH EQIVALENTS 2017 2016
£’000 £’000
Short term deposits held in UK 617 637
Cash at bank and in hand in the UK and overseas 5,276 5,819
5,893 6,456

41
NOTES TO THE CONSOLIDATED FINANCIAL STATEMENTS
1. ACCOUNTING POLICIES
The charity is a private limited company (registered number 1926828) which is incorporated
and domiciled in the UK. The address of the registered office is 9th floor, Bastion House, 140
London Wall, London, EC2Y 5DN. The charity is a public benefit entity. More detail on how
the trustees have satisfied themselves that Farm Africa has met the public benefit
requirements is given in the trustees report on pages 17 to 18.
a) Basis of accounting
The consolidated financial statements have been prepared under the historical cost
convention and in accordance with the charities SORP (FRS102), applicable accounting
standards and the Companies Act 2006. The financial statements have been prepared on a
going concern basis as discussed in the trustee’s report on pages 26 to 27. There are no
material uncertainties about the charity’s ability to continue as a going concern.
The results and balance sheet of the charitable company’s subsidiaries have been
consolidated using the acquisition method of accounting and minority interest is shown as a
separate line in the financial statements. The results of subsidiary undertakings are included
from the date of acquisition. The charity has taken advantage of the exemptions in FRS 102
from the requirements to present a charity only Cash Flow Statement and certain disclosures
about the charity’s financial instruments.
No statement of financial activities is presented for the charitable company alone as the
results of the subsidiary companies are separately identified within the group accounts and
the charitable company is exempt from presenting such a statement under s408 Companies
Act 2006. The net deficit of the charitable company was £968,000 (2016: net surplus
£1,021,000)8.
b) Key areas of estimation uncertainty
In the application of the charity’s accounting policies, trustees are required to make
judgements, estimates and assumptions about the carrying values of assets and liabilities
that are not readily apparent from other sources. The estimates and underlying assumptions
are based on historical experience and other factors which are considered to be relevant.
Actual results may differ from these estimates.
The estimates and underlying assumptions are reviewed on an on-going basis. Revisions to
accounting estimates are recognised in the period in which the estimate is revised if the
revision affects only that period or in the period of the revision and future periods if the
revision affects the current and future periods.
In the view of the trustees, no assumptions concerning the future or estimation uncertainty
affecting assets and liabilities at the balance sheet date are likely to result in a material
adjustment to their carrying amounts in the next financial year.
8 The overall result of the charitable company is a combination of the unrestricted and restricted fund surplus or
deficit. The nature of the restricted grants and timing of income recognition of restricted income vary significantly year by year. For example in some years restricted grant funding is received in advance on a number of grants and in others the income already received is spent. Therefore there are significant variations in the overall surplus or deficit of the charitable company.

42
c) Fund accounting
Funds held by the charitable company are:
restricted funds – these are funds which are subject to specific conditions imposed by
the donors or when funds are raised for particular restricted purposes,
unrestricted funds: general – these are funds which can be used in accordance with the
charitable objects at the discretion of the trustees, and
unrestricted funds: designated – these are funds which the trustees have designated for
a particular use.
d) Income
Income, including donations, gifts and legacies, gifts in kind and grants are recognised
where there is entitlement, there is probability of receipt and the amount is measurable.
In respect of legacy income we consider this to be the earlier of (a) receipt of the income;
and (b) grant of probate, confirmation from the executors that there are sufficient assets in
the estate (after settling any liabilities) to pay the legacy, and that any conditions attached to
the legacy are either within the control of the charity or have been met. Additionally with
regard to residuary legacies we consider the amount is measurable where it has been
calculated independently by the executors and the estate’s assets can be measured with
sufficient reliability.
Tax recovered from income received under gift aid is recognised when the related income is
recognised and is allocated to the income category to which the income relates. Where
income is received in advance of the point of recognition it is deferred.
Gifts in kind for use by the charity and donated services are included in the accounts at their
approximate market value at the date of receipt. No amount has been included in the
financial statements for services donated by volunteers.
When donors specify that donations and grants given to the charitable company must be
used in future accounting periods, the income is deferred until those periods.
Income from other trading activities is recognised as it is earned, that is as the related goods
or services are provided.
Investment and rental income are recognised on a receivable basis.
e) Expenditure
Expenditure is recognised when a liability is incurred. Irrecoverable VAT is included within
the expense item to which it relates.
Expenditure on charitable activities is reported as a functional analysis of the work
undertaken by Farm Africa, against our two strategic outcomes of building income and food
security and natural resource management. Under these headings are included grants
payable and costs of activities performed directly by the charitable company, together with
associated support costs. These costs include salaries and associated employment costs
including pensions and any termination payments required.
Grants payable to other institutions for development projects are included in the statement of
financial activities when funds are transferred to these institutions on the basis that future
funds are only payable upon receipt of satisfactory expenditure reports for all amounts
previously advanced.

43
Expenditure on raising funds comprises salaries, direct expenditure and overhead costs of
UK based staff who promote fundraising from all sources including institutional donors,
trusts, companies and individuals.
Support costs include UK central functions, and have been allocated to cost categories on a
basis consistent with the level of activity.
f) Pension costs
The charitable company operates a defined contribution group personal pension plan for the
benefit of its employees, and also makes payments to other defined contribution schemes
for employees who are not members of the group scheme. Pension costs are recognised in
the month in which the related payroll payments are made.
g) Foreign currencies
The functional currency of Farm Africa is considered to be pounds sterling because that is
the currency of the primary economic environment in which the group operates. The
consolidated financial statements are presented in pounds sterling.
Transactions in foreign currencies are recognised at the rate of exchange at the date of the
transaction or at an average exchange rate for the month. All non-sterling current assets and
liabilities are translated into sterling at the exchange rate on the balance sheet date. All
exchange differences are recognised through the statement of financial activities.
h) Operating leases
Rental payments under operating leases are charged as expenditure incurred evenly over
the term of the lease. The benefit of any reverse premium received is also spread evenly
over the term of the lease.
i) Fixed assets
Fixed assets used within specific projects and purchased from funds donated for those
projects are not capitalised but are written off on acquisition as direct project expenditure.
This policy is employed as ownership of the property does not always pass to Farm Africa
upon project completion. The initial cost of fixed assets purchased within the last four years
and presently employed in current projects is referred to in note 11.
All other assets costing more than £500 are included in the financial statements as fixed
assets at cost less depreciation. Depreciation has been calculated to write off the cost of
tangible fixed assets by equal instalments over their expected useful lives as follows:
Leasehold improvements over the life of the lease
Vehicles 25% per annum
Computer equipment 33% per annum
Machinery & machinery 25% per annum
Where the recoverable amount of a tangible asset is found to be below its net book value,
the asset is written down to its recoverable amount and the loss on impairment is charged to
the relevant expenditure category in the statement of financial assets. Where an asset is not
primarily used to generate income its impairment is assessed by reference to its service
potential on its initial acquisition. The charitable company currently has no tangible fixed
assets to which impairment provisions apply.
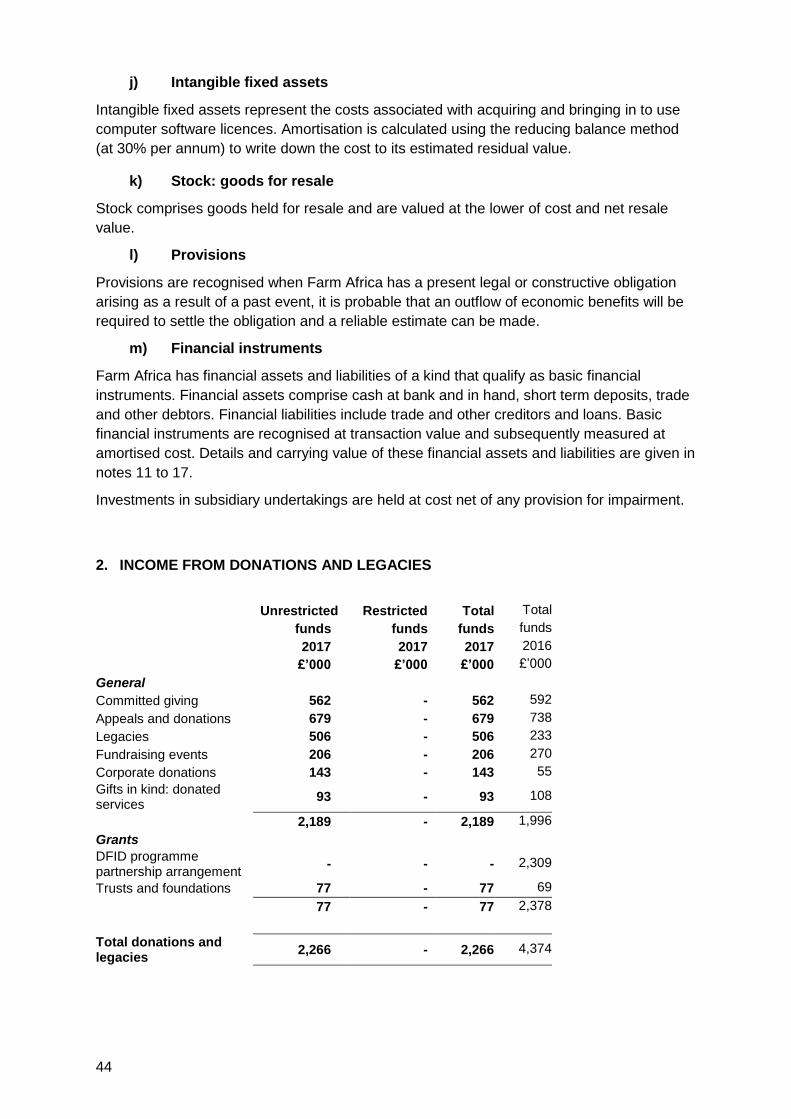
44
j) Intangible fixed assets
Intangible fixed assets represent the costs associated with acquiring and bringing in to use
computer software licences. Amortisation is calculated using the reducing balance method
(at 30% per annum) to write down the cost to its estimated residual value.
k) Stock: goods for resale
Stock comprises goods held for resale and are valued at the lower of cost and net resale
value.
l) Provisions
Provisions are recognised when Farm Africa has a present legal or constructive obligation
arising as a result of a past event, it is probable that an outflow of economic benefits will be
required to settle the obligation and a reliable estimate can be made.
m) Financial instruments
Farm Africa has financial assets and liabilities of a kind that qualify as basic financial
instruments. Financial assets comprise cash at bank and in hand, short term deposits, trade
and other debtors. Financial liabilities include trade and other creditors and loans. Basic
financial instruments are recognised at transaction value and subsequently measured at
amortised cost. Details and carrying value of these financial assets and liabilities are given in
notes 11 to 17.
Investments in subsidiary undertakings are held at cost net of any provision for impairment.
2. INCOME FROM DONATIONS AND LEGACIES
Unrestricted Restricted Total Total
funds funds funds funds
2017 2017 2017 2016
£’000 £’000 £’000 £’000
General
Committed giving 562 - 562 592
Appeals and donations 679 - 679 738
Legacies 506 - 506 233
Fundraising events 206 - 206 270
Corporate donations 143 - 143 55
Gifts in kind: donated services
93 - 93 108
2,189 - 2,189 1,996
Grants
DFID programme partnership arrangement
- - - 2,309
Trusts and foundations 77 - 77 69
77 - 77 2,378
Total donations and legacies
2,266 - 2,266 4,374

45
3. INCOME FROM CHARITABLE ACTIVITIES:
Restricted funds
Restricted funds
2017 2016
Grants from government, institutional and other similar donors £’000 £’000
Adeso 51 454
Agricultural Markets Development Trust 394 -
Ajahma Charitable Trust 60 60
Aldi 90 78
Amref 60 56
Ashden Trust - 52
Barr Foundation 161 -
Bill & Melinda Gates Foundation 607 818
Big Lottery Fund 86 166
Comic Relief 310 529
Conservation International 92 -
European Union 161 1,444
Embassy of Ireland to Ethiopia - 160
Food and Agricultural Organisation of the United Nations - 48
Guernsey Overseas Aid Commission 29 -
Jersey Overseas Aid Commission - 78
ICRISAT 76 -
ILRI 93 -
Mark Anthony Trust 25 -
Medicor Foundation 93 -
Netherlands Embassy of Kenya 1,075 1,050
Packard Foundation 133 -
Palladium 54 -
Red Een Kind 126 75
Royal Norwegian Embassy 189 636
Slovak Aid 219 -
SOS Sahel 224 313
Swedish International Development Co-operation Agency 1,781 1,294
Waitrose Foundation 44 -
UK aid from the Department for International Development – Building resilience & food secure households in Tigray
66 133
UK aid from the Department for International Development - BRACED 2,856 2,914
UK aid from the Department for International Development - FoodTrade
1,202 1,200
Other international agencies and other donors 63 77
Total grants from government, institutional and other similar donors
10,420 11,635
Other social enterprise trading income* 1,968 1,787
Total income from charitable activities 12,388 13,422
All income from charitable activities is restricted except where indicated *.

46
4. OTHER INCOME
Unrestricted Restricted Total Total
funds funds funds funds
2017 2017 2017 2016
£’000 £’000 £’000 £’000
Other trading activities
Community fundraising - - - 1
Trading 41 - 41 64
41 - 41 65
Investment income
Deposit interest 1 - 1 4
1 - 1 4
Other income
Sub-lease of office space and other miscellaneous income
9 - 9 -
Profit on sale of assets 11 - 11 35
20 - 20 35
62 - 62 104
5. NET INCOME FOR THE YEAR
Total Total
This is stated after charging: 2017 2016
£’000 £’000
Depreciation and amortisation 137 112
Payments under operating leases 34 63
Auditor’s remuneration for the annual external audit:
Charitable company Subsidiary companies
25 11
24 12
6. EXPENDITURE ON RAISING FUNDS
2017 2016
£’000 £’000
Donations and legacies
Fundraising costs 614 767
Support costs allocated (note 9) 49 57
663 824
Charitable activities
Fundraising costs 15 24
Support costs allocated (note 9) 1 2
16 26
Other trading activities
Fundraising costs 81 50
Support costs allocated (note 9) 6 4
87 54
Total 766 904

47
7. EXPENDITURE ON CHARITABLE ACTIVITIES
Operational Grants Support Total Total
programmes payable costs* 2017 2016
£’000 £’000 £’000 £’000 £’000
(note 8) (note 9)
Social enterprises 3,460 - - 3,460 3,320
Agriculture 1,976 775 221 2,972 3,257
Business 3,730 1,783 445 5,958 5,086
Environment 2,052 993 245 3,290 3,944
11,218 3,551 911 15,680 15,607
The sub-headings used to analyse expenditure on charitable activities have been revised to align with
the organisation’s three strategic and programmatic pillars: agriculture, business, and the
environment. The sub-heading corresponding to our social enterprise in Kenya remains unchanged.
* It is not appropriate to split support costs between activities undertaken directly and grant making
activities due to the method of operation of the programme support team.
8. GRANTS TO PARTNER ORGANISATIONS
2017 2016
£000 £000
Europe
Self Help Africa - 1,125
Ethiopia projects
SOS Sahel 88 -
PHE Ethiopia Consortium 85 127
International Water Management Institute 128 308
Frankfurt Zoological Society 186 434
Mercy Corps 1,330 624
Lion’s Head Global Partners 72 -
LTS International 74 -
Union of Ethiopia Women Charitable Association 127 -
Assosa Environmental Protection Association - 20
Kenya projects
Kitui Development Centre - 47
BoP Innovation Centre 185 66
Centre for Development Innovation 22 18
Larive International B.V. 123 65
Stichting PUM 34 40
World Fish Centre 48 33
Tanzania projects
Agrics 44 -
Cosita 67 86
Inades 142 137
Mviwata 9 41
Trufood 1 30
VredesEilanden Country Office (East Africa) 239 92

48
Rural Urban Development Initiatives 168 290
Sokoine University Graduate Entrepreneurs Co-operative 94 46
Uganda projects
Katine 6 -
SORUDA 14 -
VredesEilanden Country Office (East Africa) 265 200
3,551 3,829
Grants were payable during the year to partners working on restricted projects. At year end there
were six payments totalling £575,000 outstanding to Mercy Corps, VredesEilanden Country Office
(East Africa), PHE Ethiopia Consortium, International Water Management Institute, Lion’s Head
Global Partners and LTS International (2016: £546,000 outstanding to Mercy Corps).
9. ANALYSIS OF SUPPORT COSTS
Mgt Office Finance HR Gov Total Total
costs costs & IT costs costs 2017 2016
£’000 £’000 £’000 £’000 £’000 £’000 £’000
Charitable activities
Agriculture 37 46 99 28 11 221 224
Business 74 93 199 56 23 445 350
Environment 41 51 110 31 12 245 271
152 190 408 115 46 911 845
Expenditure on raising funds
Donations and legacies 8 11 21 6 3 49 58
Charitable activities - - 1 - - 1 2
Other trading activities 1 1 3 1 - 6 4
9 12 25 7 3 56 64
161 202 433 122 49 967 909
Support costs allocated are UK costs only. They have been apportioned proportionally to activity.
Overseas office costs have been directly attributed to the costs of delivering charitable activities in
country.
10. EMPLOYEES
2017 2016
£’000 £’000
Staff costs
Wages and salaries (including life assurance)
Overseas contracted staff 3,884 3,373
UK contracted staff 1,386 1,681
5,270 5,054
Social security costs 142 175
Pension costs 79 50
5,491 5,279

49
Wages and salaries includes £nil (2016: £33,000) of redundancy and termination payments which are
paid out in accordance with our redundancy policy and the legal requirements of each country we
work in.
The key management personnel of the charitable company comprise the Chief Executive, the Director
of Resources, the Director of External Relations, the Director of Programmes, and Country Directors.
The total employee benefits paid to these individuals (including employer’s pension and national
insurance) was £585,000 (2016 re-stated: £678,000).
2017 2016
No. No.
Employees with remuneration in the range of £60,001 to £70,000 3 1
Employees with remuneration in the range of £70,001 to £80,000 2 3
Employees with remuneration in the range of £80,001 to £90,000 - 3
Employees with remuneration in the range of £90,001 to £100,000 1 -
The average number of employees of the charitable company during the year analysed by function
were:
2017 2016
No. No.
Overseas contracted staff
Farm Africa 155 139
Sidai Kenya 94 60
UK contracted staff:
Fundraising and communications 13 17
Programmes support 6 11
Management and administration of charity 10 9
278 236
Neither the trustees nor any persons connected with them have received any remuneration
during the current or preceding year.
Two trustees were reimbursed £3,000 (2016: £3,000) in travel expenses incurred on behalf of
the organisation. In addition, £7,000 travel costs were paid directly to suppliers (2016:
£12,000) in respect of one non-UK based trustee travelling to board meetings in the UK. The
cost incurred by the charity for the trustee indemnity insurance was £1,000 in 2017 (2016:
£1,000).
Farm Africa makes contributions for its employees to various defined contribution schemes.
The amount of contributions due to these schemes at the year end 31 December 2017 was
£11,000 (2016: £76,000).
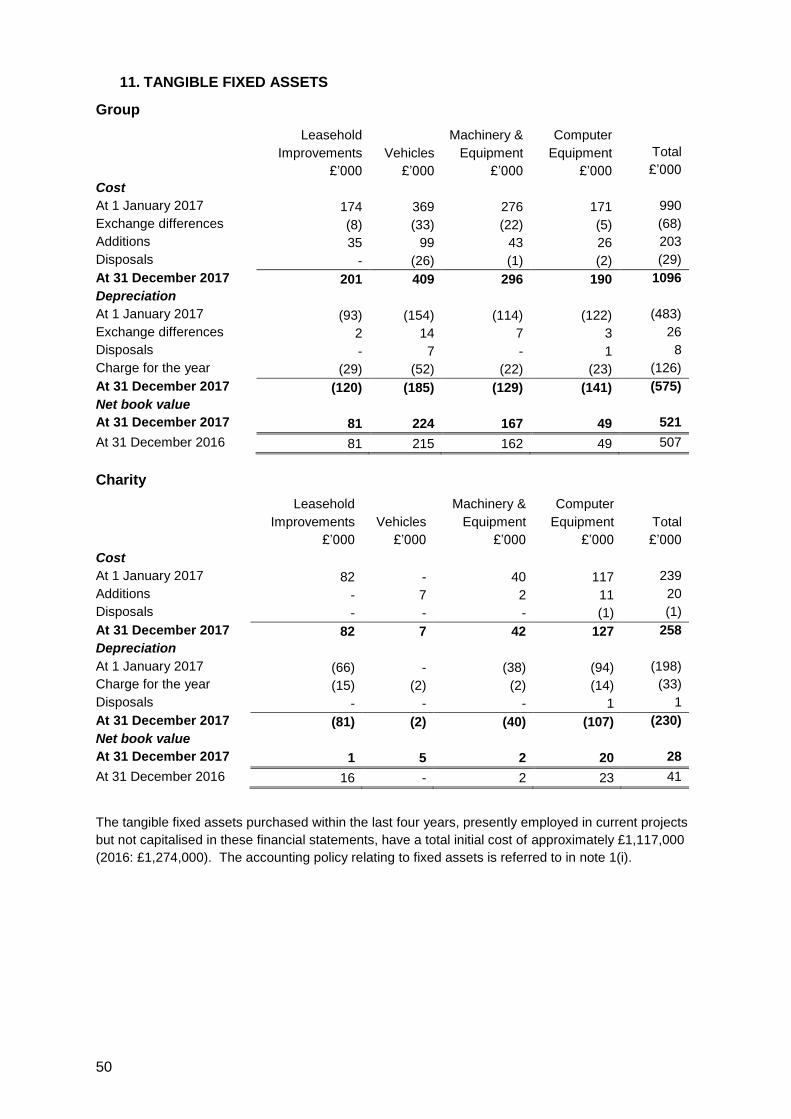
50
11. TANGIBLE FIXED ASSETS
Group
Leasehold Machinery & Computer
Improvements Vehicles Equipment Equipment Total
£’000 £’000 £’000 £’000 £’000
Cost
At 1 January 2017 174 369 276 171 990
Exchange differences (8) (33) (22) (5) (68)
Additions 35 99 43 26 203
Disposals - (26) (1) (2) (29)
At 31 December 2017 201 409 296 190 1096
Depreciation
At 1 January 2017 (93) (154) (114) (122) (483)
Exchange differences 2 14 7 3 26
Disposals - 7 - 1 8
Charge for the year (29) (52) (22) (23) (126)
At 31 December 2017 (120) (185) (129) (141) (575)
Net book value
At 31 December 2017 81 224 167 49 521
At 31 December 2016 81 215 162 49 507
Charity
Leasehold Machinery & Computer
Improvements Vehicles Equipment Equipment Total
£’000 £’000 £’000 £’000 £’000
Cost
At 1 January 2017 82 - 40 117 239
Additions - 7 2 11 20
Disposals - - - (1) (1)
At 31 December 2017 82 7 42 127 258
Depreciation
At 1 January 2017 (66) - (38) (94) (198)
Charge for the year (15) (2) (2) (14) (33)
Disposals - - - 1 1
At 31 December 2017 (81) (2) (40) (107) (230)
Net book value
At 31 December 2017 1 5 2 20 28
At 31 December 2016 16 - 2 23 41
The tangible fixed assets purchased within the last four years, presently employed in current projects
but not capitalised in these financial statements, have a total initial cost of approximately £1,117,000
(2016: £1,274,000). The accounting policy relating to fixed assets is referred to in note 1(i).

51
12. INTANGIBLE FIXED ASSETS
Group
Software
£’000
Cost
At 1 January 2017 64
Exchange differences (6)
Additions 6
Disposals -
At 31 December 2017 64
Amortisation
At 1 January 2017 (28)
Exchange differences 3
Charge for the year (11)
Disposals -
At 31 December 2017 (36)
Net book value
At 31 December 2017 28
At 31 December 2016 36
Intangible fixed assets comprise acquired application software for accounting, sales and payroll.
There are no intangible fixed assets held by the Charity.
13. INVESTMENTS
Investment in subsidiary undertakings
£’000
Net book value
At 1 January 2017 Increase / (decrease) in investment value At 31 December 2017
1 - 1
Company
Country of incorporation
Proportion of voting rights and ordinary share capital held
Nature of business
Farm Africa Trading Limited (company number: 7398449)*
UK 100% owned by Farm Africa
Trading activities
Farm Africa Enterprises Limited (company number: 9359340)*
UK 100% owned by Farm Africa
Holding company
Sidai Africa Limited (formerly Farm Africa Enterprises Limited) (company number: 7401522)*
UK 84% owned by Farm Africa Enterprises Limited
Holding company
Farm Africa Intellectual Property Limited (company number: 7401279)*
UK 100% owned by Farm Africa
IP and registered trade marks
Sidai Africa (Kenya) Limited (formerly Sidai Africa Limited)**
Kenya 796,073 shares owned by Sidai Africa & 1 share owned by Farm Africa
9
Provision of veterinary services
9 Sidai Africa (Kenya) Limited is 100% owned by Sidai Africa Limited. Sidai Africa is 84% owned by Farm Africa
and 16% owned by the AH Lundin Foundation.
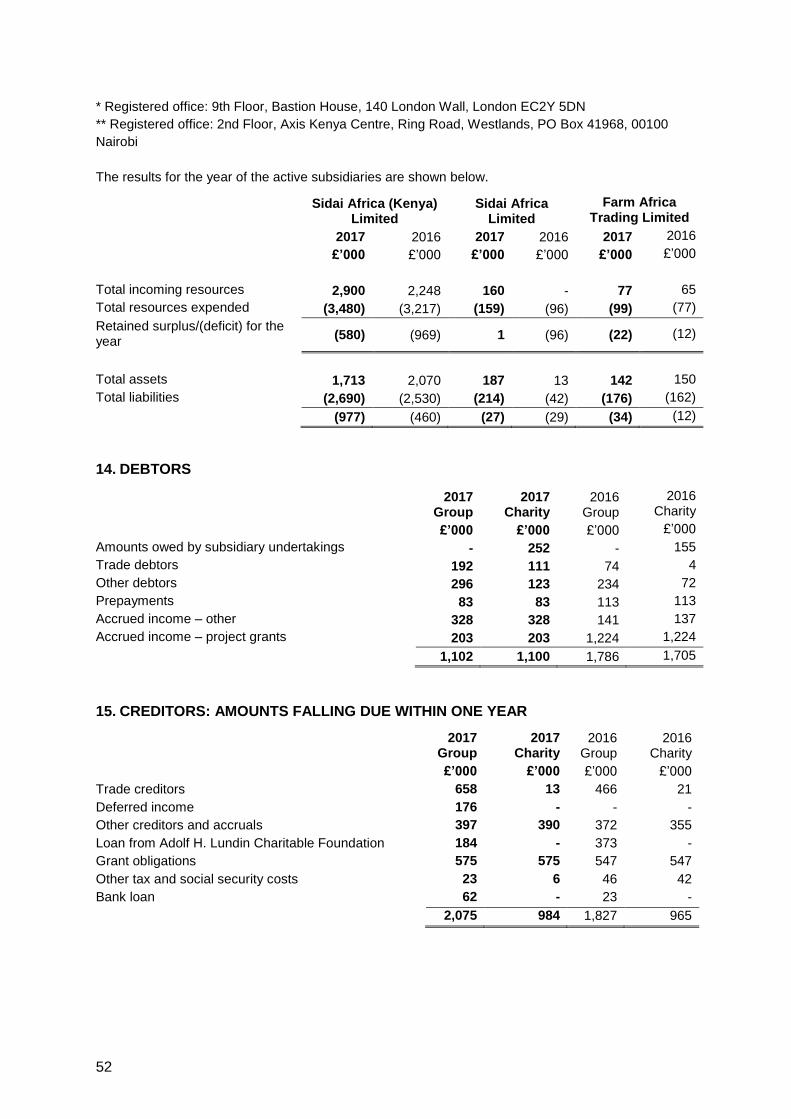
52
* Registered office: 9th Floor, Bastion House, 140 London Wall, London EC2Y 5DN
** Registered office: 2nd Floor, Axis Kenya Centre, Ring Road, Westlands, PO Box 41968, 00100
Nairobi
The results for the year of the active subsidiaries are shown below.
Sidai Africa (Kenya)
Limited Sidai Africa
Limited
Farm Africa Trading Limited
2017 2016 2017 2016 2017 2016
£’000 £’000 £’000 £’000 £’000 £’000
Total incoming resources 2,900 2,248 160 - 77 65
Total resources expended (3,480) (3,217) (159) (96) (99) (77)
Retained surplus/(deficit) for the year
(580) (969) 1 (96) (22) (12)
Total assets 1,713 2,070 187 13 142 150
Total liabilities (2,690) (2,530) (214) (42) (176) (162)
(977) (460) (27) (29) (34) (12)
14. DEBTORS
2017
Group 2017
Charity 2016
Group
2016 Charity
£’000 £’000 £’000 £’000
Amounts owed by subsidiary undertakings - 252 - 155
Trade debtors 192 111 74 4
Other debtors 296 123 234 72
Prepayments 83 83 113 113
Accrued income – other 328 328 141 137
Accrued income – project grants 203 203 1,224 1,224
1,102 1,100 1,786 1,705
15. CREDITORS: AMOUNTS FALLING DUE WITHIN ONE YEAR
2017 Group
2017 Charity
2016 Group
2016 Charity
£’000 £’000 £’000 £’000
Trade creditors 658 13 466 21
Deferred income 176 - - -
Other creditors and accruals 397 390 372 355
Loan from Adolf H. Lundin Charitable Foundation 184 - 373 -
Grant obligations 575 575 547 547
Other tax and social security costs 23 6 46 42
Bank loan 62 - 23 -
2,075 984 1,827 965

53
Charity and Group 2017 2016
£’000 £’000
At 1 January 546 -
Grants paid to partners in settlement of obligations at year-end (546) -
New grant obligations 575 546
As at 31 December 575 546
16. CREDITORS: AMOUNTS FALLING DUE IN MORE THAN ONE YEAR
2017
Group 2017
Charity 2016
Group
2016 Charity
£’000 £’000 £’000 £’000
Loan from the Adolf H. Lundin Charitable foundation to Sidai Africa (Kenya) Limited
1,016 - 739 -
The above loan represents three loan agreements. The first is a 5 year $1m loan facility signed in
October 2014. The repayment is required to be paid on a half yearly basis, with the first repayment
instalment to be paid on the date which is six months following the drawdown end date. The loan
accrues interest at a rate of 7% per annum.
The second and third represent $180,000 and $260,000 loan facilities signed on 20 April 2016 and 13
July 2016 respectively. The repayment is required to be paid on a half yearly basis, with the first
repayment instalment to be paid on the date which is six months following the drawdown end date.
The loan accrues interest at a rate of 9% per annum.
17. PROVISIONS FOR LIABILITIES AND CHARGES
Charity and Group Sever-ance
Payment by
Results
Legal actions
South Sudan
Dilaps Total 2017
Total 2016
£’000 £’000 £’000 £’000 £’000 £’000 £’000
At 1 January 82 90 57 34 15 278 180
Amounts released to the statement of financial activities - - (8) - -
(8) (176)
Amount charged to the statement of financial activities 88 - - - - 88 274
Amounts used during the year (98) - (27) - - (125) -
As at 31 December 72 90 22 34 15 233 278
Provisions comprise the following:
- Contract severance provisions for staff on non-UK contracts. Under employment law in some of
the countries where Farm Africa operates there is an entitlement to severance payments when
an employee leaves. The amount payable is determined by the salary and length of service of
each employee. The provision represents the accumulated entitlements of all such employees.
The provision is released when payments are made to employees upon their departure from
Farm Africa.

54
- A provision in respect of a grant containing a payment by results (PBR) element. The provision
represents a proportion of the grant income which could be withheld by the donor if performance-
related targets for the grant were not met. The provision is released once the grant agreement
expires and the project has concluded.
- Provisions for potential costs arising from legal actions overseas. The provision represents a
prudent estimate of the potential future cost in the event that Farm Africa is not successful. This
is calculated taking in to account the probability of an adverse outcome to Farm Africa and an
estimate of the size of the financial impact. Provisions are released once legal actions are
concluded.
- A provision for probable future costs in respect of Farm Africa’s previous activities in South
Sudan (Farm Africa ceased operations in South Sudan due to the unstable operating context).
The provision includes an estimate of costs relating to the storage and repatriation of project
documentation. The provision will be released once the documents have been repatriated to the
UK, or once it no longer becomes necessary to do so, and there are no other probable liabilities.
- Dilapidation provisions to cover estimated future costs of restoring properties to their required
condition at the end of their lease. The provision will be released at the end of the lease, based
on dilapidation costs required, provided the lease is not renewed.
18. MOVEMENTS IN FUNDS
At
1 January 2017
Income Expenditure On
revaluation Minority
Interest10
At 31 December
2017
£’000 £’000 £’000 £’000 £’000 £’000
Ethiopian programmes 3,054 5,801 (6,017) - - 2,838
Kenyan programmes 131 1,791 (1,809) - - 113
Tanzanian programmes 546 1,973 (2,572) - - (53)
Uganda programmes 61 89 (81) - - 69
Sidai programme 619 766 (895) 64 19 573
Forestry programme 59 - - - - 59
Other miscellaneous restricted funds
52 - - - - 52
Movement on restricted reserves
4,522 10,420 (11,374) 64 19 3,651
Designated funds – strategic investment
350 - (179) - - 171
Designated funds – Sidai Africa
(423) 1,968 (2,565) - 98 (922)
General funds 1,717 2,328 (2,328) - - 1,717
Movement on unrestricted reserves
1,644 4,296 (5,072) - 98 966
Total movement on reserves 6,166 14,716 (16,446) 64 117 4,617
The movement on restricted reserves represents the net of monies received and expended on
projects which are funded by grants from specific donors. The movement on restricted funds above
has been aggregated by country. A more detailed analysis by individual fund is available on request.
Negative balances are only carried forward on funds where there is a reasonable expectation that
funds will be received in a future period from a donor or funder to meet the costs incurred.
10 This relates to the 16% share owned by the AH Lundin Foundation

55
As at 31 December 2016, we chose to designate £350,000 for to smooth the transition in Farm
Africa’s unrestricted funds budget following the completion of the PPA funding period. In 2017 we
utilised £165,000 of this designated fund for certain costs incurred during the transition phase. As at
31 December 2017 the remaining balance on this fund was £185,000.
The designated funds set aside for Sidai Africa represent the net assets of the subsidiary within the
consolidated financial statements less any restricted funds received specifically to fund Sidai’s
activities.
The movements in funds in 2016 are presented below.
At
1 January 2016
Income Expenditure On
revaluation Minority
Interest11
At 31 December
2016
£’000 £’000 £’000 £’000 £’000 £’000
Ethiopian programmes 1,962 6,667 (5,575) - - 3,054
Kenyan programmes 266 1,578 (1,713) - - 131
Tanzanian programmes 191 2,043 (1,688) - - 546
Uganda programmes 4 60 (3) - - 61
Sidai programme (106) 1,287 (450) 22 (134) 619
Forestry programme 59 - - - - 59
Other miscellaneous restricted funds
52 - - - - 52
Movement on restricted reserves
2,428 11,635 (9,429) 22 (134) 4,522
Designated funds – strategic investment
560 2,309 (2,519) - - 350
Designated funds – Sidai Africa
486 1,787 (2,869) - 173 (423)
General funds 1,242 2,169 (1,694) - - 1,717
Movement on unrestricted reserves
2,288 6,265 (7,082) - 173 1,644
Total movement on reserves
4,716 17,900 (16,511) 22 39 6,166
19. MINORITY INTEREST
Unrestricted Restricted Total
Funds Funds Funds
£’000 £’000 £’000
At 1 January 2017 (60) 287 227
Movement in the year (87) (72) (159)
At 31 December 2017 (147) 215 68
11 This relates to the 16% share owned by the AH Lundin Foundation

56
20. NET ASSETS ANALYSIS (GROUP)
Unrestricted Restricted Total
Funds Funds Funds
Fund balances at 31 December 2017 £’000 £’000 £’000
are represented by:
Tangible and intangible fixed assets 549 549
Net current assets 417 3,651 4,068
966 3,651 4,617
Unrestricted
Restricted
Total
Funds Funds Funds
Fund balances at 31 December 2016 £’000 £’000 £’000
are represented by:
Tangible and intangible fixed assets 543 543
Net current assets 1,101 4,522 5,623
1,644 4,522 6,166
21. CONSTITUTION
The charitable company, which is limited by guarantee, does not have share capital and is constituted
as a charity. Every member undertakes to contribute an amount not exceeding £2 in the event of
winding-up. The income and property of the charitable company cannot be transferred to the
members by way of dividend.
22. COMMITMENTS: OPERATING LEASES
At 31 December 2017, Farm Africa has the following commitments under non-cancellable operating
leases:
Equipment Property 2017 Total
2016 Total
£’000 £’000 £’000 £’000
In less than 1 year 12 99 111 93
Between one and five years 28 29 57 67
Later than five years -
-
-
-
40
128
168
160
23. RELATED PARTY TRANSACTIONS
There were no related party transactions requiring disclosure other than transactions with subsidiaries
(2016: none).
Farm Africa charged a service fee of £26,000 (2016: £11,000) and also paid costs totalling £10,000
(2016: £3,000) on behalf of Sidai Africa. At 31 December 2017, Sidai Africa owed £62,000 (2016:
£14,000) to Farm Africa.
Farm Africa has historically paid a number of items on behalf of Sidai Africa (Kenya) and Sidai Africa
(Kenya) on behalf of Farm Africa. At 31 December 2017 Sidai Africa (Kenya) owed Farm Africa
£26,000 in respect of these items (2016: £9,000).

57
Farm Africa Limited charged a management fee of £19,000 (2016: £16,000) to Farm Africa Trading
Limited. At 31 December 2017, Farm Africa Trading owed £173,000 (2016: £148,000) to Farm Africa
Limited. Farm Africa Trading will make a donation of £nil (2016: £nil) to Farm Africa in 2016.
24. PARENT COMPANY RESULT
The parent company generated a deficit of £968,000 (2016: surplus £1,021,000).
The overall result of the charitable company is a combination of the unrestricted and restricted fund
surplus or deficit. The nature of the restricted grants and timing of income recognition of restricted
income vary significantly year by year. For example in some years restricted grant funding is received
in advance on a number of grants and in others the income already received is spent. Therefore there
are significant variations in the overall surplus or deficit of the charitable company.
25. PENSION COSTS
As at 31 December 2017, Farm Africa operated one defined contribution scheme in the UK, provided
by Friends Life part of the Aviva Group. It also makes contributions into other individual employee
pension schemes. Farm Africa paid contributions at a rate of 7% of employee salary during the
accounting period.
The pension cost included in the Statement of Financial Activities for UK employees was £79,000
(2016: £103,000).
26. LEGACIES
There were no legacies (2016: £nil) notified to the charity that did not meet the recognition criteria,
and therefore all legacies notified to the charity been accounted for within these financial statements.
27. CAPITAL COMMITMENTS
There were no capital commitments outstanding as at 31 December 2017 (2016: none).