Embed Size (px)
Citation preview

Annual Results for the year ended 31 December 2016
Press Release
Tony Durrant, Chief Executive, commented:
“Premier has a robust business which continues to deliver excellent operational performance. In 2016 we achieved
record production, maintained a low operating cost base and completed the highly value adding acquisition of
E.ON’s UK upstream portfolio. Significant progress was made on our operated Catcher project which will deliver a
further step change in our production levels once on-stream later this year. Our complex refinancing has created
uncertainty and volatility but is now nearing completion. Looking forward, our strong and growing cash flows will
reduce our debt and in due course allow us to invest in new projects to deliver value for all our stakeholders.”
Operational highlights
• Record production of 71.4 kboepd, an increase of 24% on the prior year (2015: 57.6 kboepd)
• High operating efficiency of 91%
• E.ON’s UK upstream portfolio outperforming; payback now anticipated in 2017 1H
• Cost base reset; opex of $15.8/boe; Catcher capex reduced by 29%
• 2P reserves and 2C resources increased to 835 mmboe (2015: 758 mmboe)
Financial highlights
• Profit after tax of US$122.6 million (2015: loss after tax US$1.1 billion), including a tax credit of US$522.0
million
• Cash flows from operations of US$431.4 million (2015: US$809.5 million)
• Capex of US$678.1 million, significantly below budget
• Net debt of $2.8 billion as at year-end (2015: $2.2 billion); reduced since peak in Q3 2016
• Cash and undrawn facilities of US$593 million
Refinancing
• Total debt facilities preserved and maturities extended to 2021 and beyond
• Completion of refinancing expected by end of May, as previously guided
• As separately announced today, RCF, Term Loan, USPP and convertible bondholders have locked up to refi-
nancing terms
Outlook
• 2017 production guidance maintained at 75 kboepd, before any contribution from Catcher
• 2017 opex and capex guidance of <$16/boe and US$390 million, respectively
• Catcher on schedule for 2017 first oil; improved field production profile now anticipated
• Greater Tolmount Area value significantly enhanced; offshore FEED commenced
• High impact Zama exploration prospect in Mexico to spud in Q2 2017
• Net cash flow positive at the forward curve in 2017; debt reduction accelerating once Catcher on-stream
ENQUIRIES
Premier Oil plc Tel: + 44 (0)20 7730 1111
Tony Durrant
Richard Rose
Bell Pottinger Tel: + 44 (0)20 3772 2500
Lorna Cobbett
Henry Lerwill

Annual Results for the year ended 31 December 2016
A presentation to analysts will be held at 9am today at the offices of Premier Oil, 23 Lower Belgrave Street, London
SW1W 0NR and will be webcast live on the company’s website at www.premier-oil.com. A copy of this announce-
ment is available for download from our website at www.premier-oil.com.

Annual Results for the year ended 31 December 2016
CHIEF EXECUTIVE OFFICER’S REVIEW
Against what has been a challenging backdrop, Premier delivered a strong operational performance in 2016,
resulting in record production of 71.4 kboepd, up 24 per cent on 2015, with production in the fourth quarter
averaging over 80 kboepd. This was driven by contributions from the E.ON UK E&P (E.ON) portfolio and its successful
integration into our UK business unit and new production from the Solan field. It was also helped by outperformance
from our operated assets in Asia and high operating efficiency of 91 per cent across the portfolio.
UK production doubled during the year to 33.0 kboepd, underpinned by the new contributions from the E.ON
portfolio and the Solan field. Production from the E.ON assets exceeded our acquisition case, contributing 17.1
kboepd to Group production over the eight months from 28 April to 31 December 2016. This was driven by
outperformance from both the Huntington field and the long life Elgin-Franklin field where there is an ongoing infill
drilling programme. Babbage and Wytch Farm also delivered a strong performance in 2016, underpinned by high
operating efficiency of over 90 per cent. Profits from UK production continue to be sheltered by Premier’s brought
forward tax loss and allowance position.
First oil from the Solan field was achieved in April, marking a significant milestone for the Group. The second
producer was brought on-stream in August. Production from the field has been lower than anticipated due to poor
reservoir performance from the eastern area of the field. Most recently, a decision has been taken to contract a
drilling rig to carry out the first planned workover of the first production well (P1) during the summer of 2017. The
field is currently producing at around 9 kbopd with the P1 well on free-flow. This will be supplemented by ESP
(pump) support following the summer workover.
Singapore demand for our Indonesian gas was strong during 2016. Our operated Natuna Sea Block A again captured a
market share within its principal gas sales contract (GSA1) considerably ahead of its contractual share, while there was
record demand for our gas under our second gas sales contract (GSA2). Across the border in Vietnam, performance from
the Premier-operated Chim Sáo field exceeded expectations, both in terms of reservoir deliverability and operating
efficiency, with a successful well intervention programme also helping to mitigate natural decline from the field. Significant
upside remains at Chim Sáo and we look forward to executing an infill drilling programme in 2017 to help maximise
production levels from the field. Chim Sáo reserves have again been revised upwards.
In 2017, we expect Group production to be higher at 75 kboepd, unchanged from previous guidance and before any
contribution from Catcher which we expect to come on-stream later this year. The increase in production from our
existing producing assets reflects a full year contribution from the E.ON portfolio and the Solan field, partially offset

Annual Results for the year ended 31 December 2016
by natural decline in the Group’s Pakistan fields and in certain of our UK fields.
2016 saw us increase our proven and probable (2P) reserves, on a working interest basis, to 353 mmboe (2015:
332 mmboe) and our total 2P reserves and 2C resources to 835 mmboe (2015: 758 mmboe). The increase in our 2P
reserves was driven by our acquisition of the E.ON portfolio and an upward revision in our estimate of 2P reserves at
Chim Sáo following better than anticipated reservoir performance and an extension to forecast field life. These
additions more than offset the impact of 2016 production and a downward revision to our Solan 2P reserve
estimates due to poorer than anticipated reservoir performance. The increase in our 2C resources of 56 mmboe was
principally as a result of the 50 per cent interest in the Tolmount field acquired with the E.ON portfolio.
Premier’s operating costs were US$15.8 boe (2015: US$15.5/boe), significantly below budget as a result of ongoing
cost reduction initiatives, successful contract renegotiations and strict management of discretionary spend. With a
large portion of our costs Sterling denominated, we also benefitted from the weaker Sterling Dollar exchange rate.
Significant reductions in operating costs have been achieved over the last two years. While it is likely to be difficult to
push through further contractor rate reductions given current service sector margins, additional cost reductions will
come from other approaches such as collaboration and efficiency savings. Premier instigated such initiatives in 2016
and expects to build on these during 2017.
The progress that has been made on the Catcher project during 2016 and the 29 per cent capex reduction secured to
date is testament to the hard work, skill and capability of the project team and our contractors. All nine wells drilled
to date have come in at or above prognosis and we now expect to deliver an improved production profile from a
reduced well count. All of the key elements of the subsea equipment have been installed, ready for the arrival of the
FPSO. The construction of the FPSO is largely complete and the focus is now on completing the yard-based pre-
commissioning and commissioning work scopes ahead of a mid-year sailaway. Premier continues to target
production start-up for later this year. Once on-stream the Catcher field, with an expected plateau rate of over
50 kboepd, will provide another step change in our production levels, generating enhanced, tax-free cash flows for
the Group.
With rising production and over 700 mmboe of discovered but undeveloped 2P reserves and 2C resources, we have
significant optionality within our portfolio to maintain and grow production and deliver value for our stakeholders. In
a depressed commodity price environment, the lower cost projects with a rapid pay-back have been prioritised. For
2017, this includes an infill drilling programme in Vietnam, which has a payback of less than six months, as well as
incremental projects in Indonesia, which were sanctioned post period end by Premier’s Board, to backfill our existing
gas sales contracts.
Annual Results for the year ended 31 December 2016
The Tolmount field is looking increasingly attractive and is likely to provide our next phase of growth. It meets our
economic thresholds even at low gas prices, accelerates the use of our UK tax losses and allowances and fits well
with our financial profile. There is also significant upside, currently estimated at over 400 Bcf, beyond the main
development in the Greater Tolmount Area. The development concept was selected post period end with a nine
month front end engineering design (FEED) programme now underway.
Premier’s largest pre-development project is Sea Lion Phase 1 in the Falkland Islands. The Sea Lion project as a whole
has the potential to be transformational for the Group with around 400 mmboe (net to Premier) to be developed
over several phases. FEED on Sea Lion Phase 1 was largely completed in 2016 and saw the breakeven cost of the
project lowered significantly from US$55/bbl to less than US$45/bbl, while the capex to first oil was reduced from
US$1.8 billion to US$1.5 billion. With the economics of the project considerably improved, Premier is now working to
secure a funding solution for the development. Commercial and fiscal discussions with the Falkland Islands
Government are also progressing.
In light of current capital allocation priorities, Premier’s exploration activities have reduced considerably and our
portfolio has become more concentrated on a few key proven but under-explored plays or basins. In particular, we
exercised our option to increase our equity stake to 25 per cent in Block 7 in Mexico at the end of 2016 and expect
to drill the large amplitude-supported Zama prospect there in Q2 2017. We also exited our 35 per cent interest in
Block FZA-M-90 in the Foz do Amazonas Basin in December (subject to ANP approval) enabling us to focus our
Brazilian exploration efforts on our core area position in the Ceará basin, where we have acquired 4,000 square
kilometres (km2) of fast track seismic data.
One of the key achievements of the year was our successful acquisition and integration of the E.ON portfolio which builds on
our track record of acquiring assets at low points in commodity cycles. The acquisition significantly enhanced the Group’s UK
North Sea asset base and creates considerable operating, cost and tax synergies within our existing UK business. At a price of
US$120 million, the acquisition is expected to reach pay-back in 2017 1H, earlier than anticipated, and we now value the
E.ON portfolio at very substantially more than the acquisition cost. This is partly as a result of higher commodity prices but
also as a result of improving asset profiles, due to production outperformance or, as in the case of Tolmount, following
further work on the project.
We continue to look to dispose of non-core assets, such as our Pakistan business or certain assets from the E.ON portfolio
where formal sales processes are ongoing. In addition, we will look to reduce our equity interests in certain projects where
we can realise upfront cash to accelerate debt reduction.

Annual Results for the year ended 31 December 2016
The acquisition of the E.ON portfolio, via debt funding, and the prolonged period of depressed commodity prices
saw us enter discussions with our various lending groups in 2016 to undertake a full refinancing of our existing
facilities. The number of parties involved and the fact that most of our lenders rank pari passu (which gave rise to
complex inter-creditor issues) meant that those negotiations took longer than anticipated. Nonetheless, we are close
to locking up all of our lending groups to the amended terms. The lock up of the creditors to the terms of the
refinancing marks a major milestone for Premier with the refinancing defining future reduction of debt but also
allowing us to plan for future investment in selective new projects. Final completion of the refinancing is targeted
for the end of May 2017.
As at year end, we retained cash and undrawn facilities of US$593 million. This was as a result of record production
together with the benefit of our hedging programme, low operating costs secured by ongoing cost reduction
initiatives and delivery of a capital investment programme below budget. Net debt stood at $2.8 billion at the end of
2016, down from its peak reached in Q3 2016, and we expect to continue to be net cash flow positive (after capex
and planned disposals) at current oil prices. This debt reduction will accelerate once the Catcher field is on-stream.
As we enter 2017 with improving commodity prices, our focus is on maintaining our strong production performance
and competitive cost base while delivering our operated Catcher project on schedule and below budget. In order to
plan and protect our cash flows, we will continue to hedge our oil and gas production with the aim of locking in oil
prices at levels at which we will be free cash flow positive. Our positive cash flow will be prioritised towards reducing
our debt so as to enable the Group to achieve a leverage ratio of 3x EBITDA by the end of 2018 and, where future
cash flows allow, to selectively invest in new projects to deliver future value for all stakeholders.
Tony Durrant
Chief Executive Officer

Annual Results for the year ended 31 December 2016
BUSINESS UNIT REVIEWS
UNITED KINGDOM
The UK delivered a step change in production in 2016, achieving a year-end exit rate of over 45 kboepd, more than double
that of 2015. This was driven by high operating efficiency, a contribution from the E.ON assets (which continue to exceed
expectations) and new Solan production. Looking ahead, the Catcher project remains on schedule for first oil in 2017 with
total capex now estimated at $1.6 billion, 29 per cent lower than at sanction, while the development scheme for the
Tolmount gas project was selected post period end.
Production
Production from Premier’s UK fields averaged 33.0 kboepd (2015: 16.7 kboepd), double that of 2015. Production
from the E.ON assets exceeded the Group’s acquisition case of 15 kboepd, averaging 17.1 kboepd for the eight
months from 28 April 2016 to 31 December 2016. Production from the operated Huntington field averaged
10.8 kboepd (2015: 6.2 kboepd) during 2016. The step up in production reflects Premier’s increased equity position
to 100 per cent (due to the acquisition of the E.ON assets at the end of April 2016 and the default of the minority
partners in 2015), high operating efficiency of over 90 per cent and strong reservoir performance. Premier is
currently in discussions with Teekay, the owner of the FPSO, to extend the firm charter period beyond April 2018
with a revised rate structure.
Production from the non-operated Elgin-Franklin fields, which was acquired as part of the acquisition of the E.ON
assets, increased during the year, benefitting from an ongoing infill drilling campaign and strong winter gas demand,
averaging 5.5 kboepd for the eight months from 28 April to 31 December 2016 and 6.5 kboepd in Q4 2016. This
strong performance was tempered by periodic oil export restrictions placed on the field over the summer as a result
of ongoing maintenance on the Forties Production System (FPS). The non-operated Glenelg field (Premier 18.57 per
cent), a satellite field within the Elgin-Franklin area, came back on-stream at the end of May following a successful
well workover of the G10 well. The field was producing over 20 kboepd (gross) when not impacted by export
restrictions but was subsequently shut in in late September as a result of a blocked scale inhibitor line. A remediation
programme is being implemented by the operator to reinstate production. The Premier-operated Babbage field,
acquired as part of the acquisition of the E.ON portfolio, also outperformed, producing consistently at rates of above
3 kboepd driven by high uptime of more than 90 per cent and continued good reservoir performance. The platform
is in the process of moving to normally unmanned operations which is expected to reduce field operating costs in
2017. Post period end, a successful well intervention campaign was undertaken to maximise production from the
Babbage field.
Annual Results for the year ended 31 December 2016
First oil from the Solan field was achieved on 12 April 2016 and the second producer was brought on-stream on 18
August 2016. Average production for 2016 was impacted by poorer than expected reservoir performance in the
eastern part of the field which is limiting water injection and production rates from the second producer (P2). A
decision has been taken to contract the Transocean Spitzbergen, which has been working in the area close to Solan,
to install two ESPs in P1 following the failure of the existing single ESP during February. The planned work
programme will restore P1 production to at least 10 kbopd from mid-year. The field is currently producing around 9
kbopd with P1 on free flow. Meanwhile, a number of options continue to be studied to increase water injection into
the reservoir with the aim of supporting higher production levels. Premier has already implemented some of the
more short-term, lower capex projects, such as increases to platform pump capacity. While incremental production
increases can be gained from such remedial work, it is possible that another well or a side-track would be required in
order to gain a more material uplift in production rates and improve recovery. The Solan team are monitoring
production behaviour to better delineate recovery from the existing wells and to define the scope of a potential
drilling programme for 2018. Operating efficiency of the facilities was good during 2016 and, to date, eight tanker
liftings have been successfully completed.
Production from the Premier-operated Balmoral area averaged 2.1 kboepd (2015: 3.1 kboepd), impacted by a
commercial disagreement between partners at the start of 2016 (subsequently resolved) and intermittent oil export
restrictions due to FPS maintenance. Operating costs were US$49 million (2015: US$64 million), down 23 per cent on
the prior period, benefitting from a weaker Sterling Dollar exchange rate and as a result of a focused cost reduction
programme, offshore and onshore.
Production from the non-operated Wytch Farm field averaged 5.1 kboepd (2015: 5.2 kboepd), benefitting from the
well maintenance work carried out in the second half of 2015 which partially offset modest reservoir decline. The
field operator delivered significant cost savings during 2016 which resulted in operating costs of US$26m net (2015:
US$32m), down 19 per cent on the prior year. Production from the non-operated Kyle field was maintained at 2.0
kboepd (2015: 2.0 kboepd), slightly ahead of expectations.
UK unit operating costs for the year were US$24/boe (2015: US$ 30/boe), driven by start-up and acquisition of lower
opex fields such as Solan, Elgin-Franklin and Babbage and further cost reductions across Premier’s existing UK
portfolio, particularly at Wytch Farm and Balmoral. This figure includes certain one-off costs following on from the
acquisition of the E.ON portfolio. Going forward, UK unit operating costs are expected to trend downwards towards
US$20/boe as Premier benefits from a full annual contribution from the lower opex Elgin-Franklin and Solan fields
and as higher opex fields are decommissioned.
Annual Results for the year ended 31 December 2016
Development
Catcher
Good progress was made on the Premier-operated Catcher project during 2016 which remains on schedule to
deliver first oil in 2017 2H. 2016 saw the total capex estimate for the project reduce to $1.6 billion, a 29 per cent
reduction on the original sanctioned estimate. Savings were secured across subsea and drilling activities and as a
result of the lower Sterling Dollar exchange rate. Premier’s forward cost exposure has reduced significantly with
remaining capex to first oil of around $100 million (net to Premier), the majority of which relates to the ongoing
drilling programme.
The 2016 subsea installation campaign commenced in April and saw the successful installation of the risers, bundles,
towheads, manifolds, midwater arches along with the buoy and mooring system. Hook-up of all of the risers and
umbilicals was also completed during 2016. 14 different construction vessels were deployed on the field over several
phases while, at the peak of activities in May, there were seven vessels present in the field. Final spool tie-ins were
completed in November, concluding the planned 2016 subsea campaign under budget. The major elements of the
subsea campaign are now complete with only short campaigns required in 2017 to tie-in wells as they become
available from the drilling programme and to support commissioning operations once the FPSO has been installed.
Drilling activities using the Ensco 100 rig have continued to yield positive results. During 2016, CCP3 and CTP1 on the
Catcher template, BP3 and BP5 on the Burgman template and VP2 and VP3 on the Varadero template were completed,
validating Premier’s expected reservoir interpretation from the three drill centres. VP4 on the Varadero template was
completed post period end. Based on test results to date, the length of net pay encountered by the seven production wells
has been overall 30 per cent longer than forecast while the anticipated initial production delivery rate of each well is on
average 40 per cent higher than predicted. As a result of these positive well results, Premier remains encouraged about the
overall recovery from the Catcher fields and also forecasts a reduced well count from that envisaged at sanction.
Fabrication of the Catcher FPSO hull and topsides was completed in Asia with the Stern Terra Block and Forward
Terra Block successfully delivered to the Keppel Benoi yard in Singapore in June and July respectively. The hull
mating operation was carried out and the welding of the two blocks completed in August. Fabrication of all of the
topside modules has been completed with the final topside unit lifted onto the vessel in November. The construction
phase of the FPSO is now largely complete and the focus is now on final integration and the completion of yard-
based pre-commissioning and commissioning work scopes. Sailaway is expected mid-year with Premier continuing
to target oil production start-up for later this year.

Annual Results for the year ended 31 December 2016
Pre-development
Premier acquired a 50 per cent operated interest in the Greater Tolmount Area where the Group sees the potential
for the development of up to 1 Tcf, including the fully appraised Tolmount main structure of 540 Bcf and upside at
Tolmount East and Tolmount Far East, estimated to hold 220 Bcf and 150 Bcf of gas resource respectively. Tolmount
will provide the next phase of growth for Premier in the UK, with significantly improved economics benefitting from
a higher gas price than the E.ON acquisition case.
During 2016, Premier carried out conceptual studies and engineering work on a number of development options for
the Tolmount main structure. This included optimisation of the project from a subsurface, facilities, pipeline, host
terminal and commercial perspective. In February 2017, the development concept, comprising a standalone
normally unmanned installation (NUI) and a new gas export pipeline to shore, was selected. It is envisaged that the
initial phase, which will target the Tolmount main structure, will recover 540 Bcf (P50 estimate) of gas from four
producing wells. The offshore FEED contracts were awarded post period end and FEED is expected to take 9 months
with project sanction targeted for Q1 2018. It is estimated that capex to first gas will be around US$550 million,
although Premier is currently engaging with the contractor market with a view to enhancing returns and reducing
further upfront capex on the project. In addition, following unsolicited offers of interest from a number of parties,
Premier has instigated a process to identify possible investors for a 20 per cent interest in the Tolmount project.
Exploration
The Laverda/Slough prospect, near the Catcher area was drilled in April 2016. The commitment well encountered 13
feet of net oil bearing Tay sands at Laverda, in line with pre-drill expectations, but did not encounter any indications
of hydrocarbons in the deeper, high risk Slough prospect.
In July, the Ocean Valiant rig spudded the Bagpuss prospect in the Outer Moray Firth. The well encountered 41 feet
of hydrocarbon-bearing sand within a 68 feet hydrocarbon column. The well was plugged and abandoned. Premier
subsequently sold its interest in the licence to Reach Halibut Limited.
In December 2016, the Rowan Gorilla VII jack-up rig spudded the Ravenspurn North Deep well, which is testing the
deep Carboniferous play underlying the Ravenspurn North field in the Southern Gas Basin; if successful, it could pro-
vide material follow-on opportunities for Premier within its Southern Gas Basin portfolio, in addition to helping to
prolong the life of the Ravenspurn area fields. Premier is fully carried on its 5 per cent interest in the well.
Premier continues to actively manage its UK exploration portfolio with nine UK licences relinquished or sold in 2016
and associated cost savings realised. While Premier has relinquished much of E.ON’s exploration acreage, some of its
Southern North Sea prospects are attractive. Premier plans to mature the work programmes on these select licences

Annual Results for the year ended 31 December 2016
during 2017, along with further exploration prospects on its current production licences.
INDONESIA
The Premier-operated Natuna Sea Block A fields outperformed in 2016 delivering a robust production performance of 13.0
kboepd, up 6 per cent on 2015, underpinned by an increased market share of 44 per cent within GSA1 and strong Singapore
demand for gas deliveries under GSA2. This, together with low operating costs of US$8/boe, resulted in the Indonesian
business unit generating strong positive net cash flows for the Group.
Production and development
Net production from Indonesia in 2016 on a working interest basis increased to 14.3 kboepd (2015: 13.9 kboepd),
with higher production from the Premier-operated Natuna Sea Block A fields offset, in part, by lower production
from the non-operated Kakap fields. Operating efficiency remained high at over 90 per cent.
Gas supply by contract
GSA1 GSA2 GSA5
BBtud (gross) 2016 2015 2016 2015 2016 2015
Anoa1 132 133 – – – –
Gajah Baru2 – – 94 77 11 13
Total Block A 132 133 94 77 11 13
Kakap 17 23 – – – –
Total 149 156 94 77 11 13
1 Includes production from the Pelikan field.
2 Includes production from the Naga field.
Premier sold an average of 237 BBtud (gross) (2015: 223 BBtud) from its operated Natuna Sea Block A fields during
2016. Singapore demand for gas sold under GSA1 remained robust, averaging 297 BBtud (2015: 311 BBtud) during
2016. Premier’s Anoa and Pelikan fields delivered 132 BBtud, capturing 44 per cent (2015: 43 per cent) of GSA1
deliveries, above Natuna Sea Block A’s contractual share of 41 per cent. Natuna Sea Block A’s contractual share for
2017 has been increased to 47 per cent.
Gajah Baru and Naga delivered record production of 94 BBtud under GSA2, up 22 per cent on the prior year,
representing 100 per cent nomination delivery by Premier. Gas deliveries from Gajah Baru and Naga under the
Domestic Swap Agreement (DSA), which resumed in September following an extension of the DSA to end December
Annual Results for the year ended 31 December 2016
2016, averaged 11 BBtud (2015: 13 BBtud). The Gajah Baru compressor reconfiguration project, aimed at maximising
deliverability from the Gajah Baru, Pelikan and Naga fields, was successfully completed in December 2016 and will
extend plateau production from these fields.
Gas sales from the non-operated Kakap field averaged 17 BBtud (2015: 23 BBtud) while gross liquids production was
2.7 kbopd (2015: 3.5 kbopd), reflecting natural decline from existing wells. Gross liquids production from the Anoa
field was stable at 1.4 kbopd (2015: 1.4 kbopd), underpinned by successful well intervention work.
Premier continues to benefit from a low cost base in Indonesia, as a result of an on-going cost reduction campaign.
Based on current production levels, Natuna Sea Block A is well placed to deliver operating costs of around US$8/boe
into the medium term.
During 2016, FEED was completed on the Bison, Iguana and Gajah Puteri (BIGP) fields which marks the next generation of
Natuna Sea Block A projects to support Premier’s long-term gas contracts into Singapore. Premier’s Board sanctioned BIGP
post period end. An invitation to tender for long lead items has been issued and delivery of first gas is targeted for Q3 2019.
Premier has identified several infill drilling candidates at Gajah Baru with drilling currently modelled to commence in
2018 while preparations are underway to recomplete the WL-5x well which made the Lama discovery under Anoa in
2012 and to tie it into production in Q3 2017.
Evaluation of potential development scenarios for the 2014 Kuda Laut and Singa Laut discoveries on the Premier
operated Tuna Block is ongoing. These include gas offtakes via the West Natuna Transportation System to Singapore
and Indonesia or through existing infrastructure in Vietnam. Post period end, Premier was granted a three-year
extension to the exploration period of the licence. This will allow time for Premier to undertake further appraisal
drilling and also to establish a commercial development concept for the field, ahead of submitting a Plan of
Development.
Exploration and appraisal
Premier continues to mature a number of Lama Play leads and prospects to a drillable status on its operated Natuna
Sea Block A acreage and seismic reprocessing is currently scheduled for 2017 to enhance the seismic imaging over
the Lama Play area.

Annual Results for the year ended 31 December 2016
VIETNAM
A robust production performance, combined with continued low operating costs, resulted in the Vietnam business
generating net positive operating cash flows during 2016. Further, Chim Sáo’s remaining 2P reserves were materially
increased at the end of the year as a result of better than expected reservoir performance and the lower lease rate secured
for the Chim Sáo vessel resulting in an extended field life.
Production
Production from the Premier-operated Block 12W, which contains the Chim Sáo and Dua fields, averaged 16.2
kboepd (2015: 16.9 kboepd) with high uptime, better than expected reservoir performance and a successful well
intervention programme helping to mitigate natural decline from the fields.
Since taking over direct management of production operations in 2015, Premier has prioritised root-cause analysis of
all events that lead to loss of production. This knowledge has improved the efficiency of planned maintenance
programmes, enhanced the availability of key systems and enabled competency development for the crew. The
outcome is that Chim Sáo operating efficiency exceeded 90 per cent in 2016.
The 2016 well intervention programme included bringing a deep reservoir on to production in the Chim Sáo North
West area and the reservoir stimulation of three oil wells and a water injector well in the main field area. Planning is
underway for a programme of further well stimulations in 2017. In addition, a two-well infill drilling programme,
scheduled to commence in August 2017, will further help to maximise the field’s production levels.
During 2016, Premier has continued to review all of its contracts with the aim of securing cost reductions and
efficiencies throughout its Vietnam operation. Notably, in December 2016, Premier in its capacity as operator of
Block 12W completed a revised FPSO charter party agreement securing a reduction in the Chim Sáo FPSO lease rate
effective from 1 November 2015 and an extension to the firm charter period.
Strong production performance, low operating costs and the continuing premiums to the Brent oil price commanded
by Chim Sáo crude contributed to a positive net operating cash flow from the Vietnam business unit in 2016. In
addition, as a result of the strong reservoir performance from the field to date and the anticipated extended field life
facilitated by a lower FPSO lease rate, Premier has revised upwards its estimates of Chim Sáo’s remaining net 2P
reserves by 13 mmboe to 31 mmboe.
Annual Results for the year ended 31 December 2016
PAKISTAN
Premier’s Pakistan business has performed significantly ahead of forecast in 2016 with net cash flow more than twice the
budgeted level. The average realised price was $2.8/mscf while operating costs remained low at around $0.6/mscf.
Production and development
Production in Pakistan averaged 7.5 kboepd (47.4 mmscfd) (2015: 9.7 kboepd (60.2 mmscfd)), from Premier’s six
non-operated producing gas fields. The fall in production reflects natural decline in all of the gas fields. This was
partially offset by a successful well intervention campaign at the Zamzama field which significantly arrested the
decline rate of this field. As a result, production from the Zamzama field was significantly ahead of expectations for
the period and underpinned the outperformance of the Pakistan business unit.
Mmscfd 2016 2015
Bhit 8.4 11.4
Badhra 5.8 7.7
Qadirpur 16.1 17.8
Kadanwari 5.4 9.8
Zamzama 11.3 13.0
Zarghun South 0.4 0.5
Total 47.4 60.2
Further work is planned for 2017 to offset the natural decline at the Badhra and Kadanwari fields. A well intervention
programme, consisting of three wells, is planned for the Badhra field while a well intervention programme as well as
two development wells are planned for the Kadanwari field.
Portfolio management
During 2016, Premier agreed terms with a preferred bidder for the sale of its Pakistan business. However, the bidder
was unable to put in place the necessary funding arrangements and the exclusivity period ended. Premier reopened
the process to a limited group of potential buyers. The economic date of the transaction is now expected to be 1
January 2017 with Premier retaining 2016 net cash flows.
Annual Results for the year ended 31 December 2016
MAURITANIA
Production and development
Production from the Chinguetti field averaged 368 bopd (2015: 415 bopd) net to Premier. The fall in production was
driven by natural decline from the existing wells. In view of the low oil price and resulting marginal cash flows, the
joint venture partners are targeting cessation of production from the field in 2017. To this end, the operator
submitted an abandonment and decommissioning plan to the Government of Mauritania in June 2016.
THE FALKLAND ISLANDS
FEED for the Premier-operated Sea Lion Phase 1 project progressed well during 2016. The estimated breakeven price of the
project is now less than $45/bbl, down from $55/bbl at the end of 2015. The focus is now on progressing funding
alternatives for the project.
Development
During 2016, Premier undertook FEED on the Sea Lion Phase 1 development. Phase 1 is expected to recover 220
mmbbls from the north-east and north-west sections of the field located in the PL032 licence area. FEED contracts
were awarded to SBM Offshore for the FPSO, Subsea 7 for the subsea installation, NOV for the flexible flowlines and
One Subsea for the subsea production system.
Over the course of 2016, the four main contractors worked collaboratively with Premier and also with candidate well
services and logistics contractors to optimise the facilities design and installation methodology. This included the
optimisation of the single drill centre subsea layout to reduce installation costs. As a result of this work, Premier has
reduced its pre-first oil capex estimate from $1.8 billion to $1.5 billion.
Premier has also seen significant reductions in its estimates of field support services, including supply boats,
helicopters and shuttle tankers. Consequently, field operating costs for Sea Lion are now estimated at $15/bbl, down
from over $20/bbl, while the total project breakeven cost has reduced to just below $45/bbl from $55/bbl.
Premier has assembled bid packages for drilling, subsea production systems and certain logistics items, which are
ready to be issued to the market when appropriate in order to convert current proposals, derived through extensive
market engagement, into binding agreements.
In 2016, Premier secured approval from the Falkland Islands Government for an extension to the Sea Lion Discovery
Area licence to April 2020. The focus is now on securing an appropriate funding solution for Phase 1 of the project.
Annual Results for the year ended 31 December 2016
The overall strategy to develop the North Falklands Basin remains a phased development solution, starting with Sea
Lion Phase 1 which will develop 220 mmbbls in PL032. A subsequent Phase 2 development will recover a further 300
mmbbls from the remaining reserves in PL032 and the satellite accumulations in the north of the adjacent PL004.
There is also a further 250 mmbbls of low risk, near field exploration potential which could be included in either the
Phase 1 or Phase 2 developments. Phase 3 will entail the development of the Isobel/Elaine fan complex in the south
of PL004, subject to further appraisal drilling.
Exploration
In January 2016, Premier completed its exploration programme in the North Falklands Basin with the successful re-
drill of the Isobel Deep well. The well confirmed the oil discovery encountered in the original Isobel Deep well and, in
addition, discovered new hydrocarbons in additional sandstones.
EXPLORATION
Premier has continued to reshape and focus its exploration portfolio on under-explored but proven hydrocarbon basins
with the potential to develop into new business units in 2018 and beyond. Priority is being given to lower cost operating
environments whilst reducing exposure elsewhere. Premier plans to drill the large Zama structure in Mexico in Q2 2017.
MEXICO
During 2016, the Mexico Joint Venture reprocessed the existing 3D seismic data and matured a number of prospects
across its Blocks 2 and 7 in the Sureste Basin as candidates to be drilled in 2017 and 2018. In particular, Premier and
its partners completed the technical evaluation of their Block 7 acreage including the amplitude-supported Zama
prospect which has a well-defined flat spot, an indicator of potential hydrocarbons. A rig has been contracted to drill
the low-risk Zama Prospect in the second quarter of 2017 with the overall Zama structure estimated to have a P90-
P10 gross unrisked resource range of 100-500 mmboe (the majority of which is on Block 7).
Premier currently holds a carried 10 per cent interest in Block 2, whilst on Block 7 Premier elected to exercise its option to
increase its equity to a 25 per cent paying interest in December 2016, subject to the Mexican government (CNH) approval.
Premier continues to evaluate opportunities for growth in Mexico.
BRAZIL
Premier received 4,000km2 of fast-track seismic data across all three of its Ceará Basin blocks in 2016. This data is
being interpreted to map promising plays and prospects for future drilling locations on the blocks. Final processed
broadband seismic data is due to be delivered in April 2017 and well locations will be selected from this during the
course of 2017.

Annual Results for the year ended 31 December 2016
Premier continues to leverage its position as the largest acreage holder in the Ceará Basin, along with its growing
experience in Brazil, to coordinate operational synergies. In 2016, the installation of offshore buoys and moorings for
a collaborative meteorological and oceanographic data campaign was completed to gather the data required for
obtaining drilling licences in the basin. This data gathering operation is one of many joint operator initiatives that
Premier is either participating in or leading in the Ceara basin, helping to reduce costs.
In August 2016, Premier obtained a licence extension from the Brazilian Government (ANP) to July 2019 on its
operated licences CE-M-717 and 665. A similar extension was also obtained by Total, Operator of licence CE-M-661.
The extensions will enable Premier to realise further cost synergies with other operators in the Equatorial Margin
with drilling operations planned for the first half of 2019.
In the Foz do Amazonas basin, Premier completed its evaluation of new 3D seismic data across block FZA-M-90 and
decided to exit. Premier’s 35 per cent interest in the block was transferred to operating partner Quieroz Galvão E&P.
The farm-out agreement for this block was completed in December 2016 and is awaiting the final approval of the
ANP.
Portfolio management
Premier has continued to focus its exploration efforts on under-explored but proven hydrocarbon basins. In light of
current capital allocations, Premier’s exploration portfolio has become increasingly concentrated. Over the course of
2016, Premier successfully relinquished or sold 16 licences, including a number of licences acquired as part of the
acquisition of the E.ON portfolio. A further 11 licences are scheduled for relinquishment subject to government
approvals. In particular, Premier exited its 35 per cent interest in Block FZA-M-90 in the Foz do Amazonas Basin in
December (subject to ANP approval) enabling the Group to focus its Brazilian exploration efforts on its core licences
in the Ceará basin.
Premier has also successfully exited its position in Iraq (subject to final government approval) and the Saharawi Arab
Democratic Republic.
Annual Results for the year ended 31 December 2016
Financial Review
Context
Consistent with the last two years, 2016 continued to provide a challenging macro-economic environment. Against
this backdrop, however, operational performance remained strong with production for the full year averaging 71.4
kboepd and averaging more than 80kboepd during Q4 2016. This increase was driven by the successful completion
of the acquisition of the E.ON portfolio and first oil from the Solan field. We continue to actively manage operating
costs which, at $15.8/bbl, are below what had been budgeted for the year, benefitting from tight cost control, a
weakened GBP exchange rate and high operating efficiency of over 90 per cent across the portfolio.
In addition, during 2016 we commenced discussions with our lending groups on the terms of our existing finance
facilities. In February 2017 we reached an agreement in principle with our lender groups on revised terms. The
revised terms include amendments to our financial covenants, deferral of final maturity dates to May 2021 and
beyond and a margin uplift on interest payable to the lenders. The process of finalising the revised refinancing and
implementation documents is ongoing and completion of the refinancing is expected by the end of May 2017. Once
finalised, the agreed terms will give Premier sufficient liquidity to operate in the current oil price environment,
deliver our sanctioned projects and to continue to invest in the wider business at appropriate levels of equity
interests.
Business Performance
Business performance (US$ million) 2016 2015
Operating loss (145.9) (707.8)
Amortisation and depreciation 340.3 326.7
Impairment charge on oil and gas properties 556.2 1,023.7
Exploration expense and pre-licence costs 58.4 109.0
Reduction in decommissioning estimates (75.7) –
Acquisition of subsidiaries:
Excess of fair value over consideration (228.5) –
Costs related to the acquisition 21.6 –
EBITDAX 526.4 751.6
EBITDAX for the year was US$526.4 million compared to US$751.6 million for 2015. The lower EBITDAX is mainly due
to lower realised oil prices, including a reduction in the value of our oil hedges settled in the year, partially offset by
an increase in volumes lifted following the acquisition of the E.ON assets and first oil from Solan.
Annual Results for the year ended 31 December 2016
Acquisition of the E.ON assets
In April 2016, Premier completed the acquisition of the E.ON assets for cash consideration of US$135.0 million,
including working capital adjustments. The acquisition was accounted for as a business combination under the
requirements of IFRS 3 Business Combinations and the assets and liabilities acquired have been fair valued on the
date of completion utilising Premier’s corporate assumptions for oil and gas prices, reserves estimates and discount
rates. The fair value of the net assets acquired was US$363.5 million resulting in an excess of fair value over
consideration of US$228.5 million. The excess of fair value over consideration has arisen primarily due to E.ON’s
strategic decision to exit the UK and Norway E&P sectors and Premier’s willingness to take over the entire UK
upstream operation. Separately, costs related to the acquisition of US$21.6 million have been recognised in the
period. This is made up of acquisition costs of US$5.6 million and the recognition of a post-acquisition settlement of
US$16.0 million related to redundancy costs.
Income statement
Production and commodity prices
Group production on a working interest basis averaged 71.4 kboepd compared to 57.6 kboepd in 2015. Higher
production year-on-year is a result of first oil from the Solan asset and the uplift in production from the E.ON assets
acquired in the year. Entitlement production for the period was 66.1 kboepd (2015: 53.4 kboepd).
Premier realised an average oil price for the year of US$44.1/bbl (2015: US$52.6/bbl). Post hedging, realised oil
prices increased to US$52.2/bbl (2015: US$79.0/bbl).
In the UK, average prices achieved for National Balancing Point gas (“NBP”) were 41.5 pence/therm pre-hedging and
47.6 pence/therm post-hedging. Average gas prices for the Group’s non-UK assets were US$4.6 per thousand
standard cubic feet (mscf) (2015: US$5.9/mscf). Gas prices in Singapore, linked to high sulphur fuel oil (HSFO) pricing
and in turn, therefore, linked to crude oil pricing, averaged US$7.8/mscf (2015: US$8.0/mscf) pre-hedging, and
increased to US$8.6mscf post-hedging. The average price for Pakistan gas (where only a portion of the contract
formulae is linked to energy prices) was US$2.8/mscf (2015: US$3.9/mscf).
Total sales revenue from all operations fell to US$983.4 million (2015: US$1,067.2 million), due to the fall in average
realised prices post-hedging, offsetting higher year-on-year production.

Annual Results for the year ended 31 December 2016
Operating costs
Cost of sales comprises cost of operations, change in lifting position, inventory movement, royalties and
amortisation and depreciation of property, plant and equipment (‘PP&E’). Cost of sales for the Group was US$767.1
million for 2016, compared to US$661.0 million for 2015.
Operating costs 2016 2015
Cost of operations (US$ million) 412.8 323.6
Unit cost of operations ($ per barrel) 15.8 15.5
Amortisation of oil and gas properties (US $million) 332.2 315.9
Unit amortisation rate ($ per barrel) 12.7 14.8
As a result of the weaker sterling exchange rate and continued cost savings across the business, operating costs of
$15.8/bbl are 10 per cent below budget. We have maintained costs at these low levels due to improved operating
efficiency across several of the Group’s assets and continued reductions in underlying cost from further contract
reductions with suppliers, including our revised FPSO arrangements on Chim Sáo.
Impairment of oil and gas properties
An impairment charge of US$652.2 million (pre-tax) has been recognised in the income statement relating to the
Solan field in the UK North Sea (US$443.7 million post-tax). The impairment charge is driven by a reduction in the 2P
reserves expected to be recovered from the asset over its economic life and a US$5/bbl reduction in the Group’s
long term oil price assumption to US$75 (real)/bbl. The impairment charge is partially offset by the recognition of a
reversal of impairment credit of US$96.0 million, pre-tax (US$60.0 million post-tax). The reversal has been
recognised on the Huntington and Kyle assets in the UK, the Chim Sáo asset in Vietnam and the Kadanwari asset in
Pakistan. The reversal of impairment is principally caused by an increase in the short term oil price assumption,
based off the forward curve as at the balance sheet date, and an increase in Chim Sáo 2P reserves. After recognition
of a net impairment charge of US$556.2 million (US$383.7 on a post-tax basis) there is US$2,726.2 million capitalised
in relation to PP&E assets and US$240.8 million for goodwill.
Revision in decommissioning estimates
The weakness in sterling dollar exchange rate at 31 December has been the principal cause of a US$75.7 million gain
being credited to the income statement in respect of revised decommissioning estimates. Whilst any positive foreign
exchange revision would generally have been credited to the decommissioning asset in the balance sheet, the
Annual Results for the year ended 31 December 2016
majority relates in this case to late life UK assets which have been fully depreciated. As such, a significant portion of
this revision has been taken as a credit to the income statement in the period.
Exploration expenditure and pre-licence costs
Exploration expense and pre-licence expenditure costs amounted to US$58.4 million (2015: US$109.0 million). This
includes the write-offs relating to the Laverda, Slough and Bagpuss prospects drilled in 2016 and costs that had been
capitalised in relation to the Foz licence interest in Brazil. After recognition of these expenditures, the exploration
and evaluation asset remaining on the balance sheet at 31 December 2016 is US$1,011.4 million, principally for the
Sea Lion and Tolmount assets.
General and administrative expenses
Net G&A costs to the Group of US$24.1 million (2015: US$14.4 million) increased year on year due to the inclusion of
E.ON’s unallocated G&A for the period since the completion of the acquisition. Underlying G&A, without the
acquisition, would have fallen year on year and total net G&A costs to the group in 2017 are expected to return to
2015 levels.
Finance gains and charges
Interest revenue and finance gains reduced to US$13.2 million from US$40.7 million in 2015. The principal reason for
this reduction is that, following the acquisition of the remaining share of Solan in 2015, interest receivable is no
longer being recognised on the loan to JV partner. Gross finance costs, before interest capitalisation, have increased
from US$219.4 million to US$293.7 million. Interest costs capitalised decreased from US$58.8 million to US$34.0
million reflecting the finalisation of the Solan development.
Taxation
The Group’s total tax credit for 2016 is US$522.0 million (2015: US$241.1 million charge) which comprises a current
tax charge for the period of US$42.0 million and a non-cash deferred tax credit for the period of US$564.0
million. The high effective tax rate for the year is significantly impacted by a number of UK specific items. The most
significant of these is a tax credit of US$455.8 million due to recognition of UK tax losses and allowances in the
period, driven by an anticipated increase in future profitability from the acquisition of the E.ON assets. This has been
partially offset by a charge of US$161.2 million in relation to the supplementary charge rate from 20 per cent to 10
per cent during the year, with the adverse impact of this change mitigated by US$27.1 million as the rate applicable
to the reversal of certain temporary differences on decommissioning remained unchanged. A credit of US$61.0m has
also been recognised for a ring fence expenditure supplement claim made during the year in the UK.

Annual Results for the year ended 31 December 2016
Finally, an element of the Group’s UK impairment charge for the year does not attract a deferred tax offset which
reduces the associated credit by approximately US$63.2 million. After adjusting for the net impact of the above
items of US$319.1 million, the underlying Group tax charge for the period is a credit of US$202.9 million and an
effective tax rate of 52 per cent.
The Group has a net deferred tax asset of US$1,111.4 million at 31 December 2016 (2015: US$678.3 million).
Profit after tax
Profit after tax is US$122.6 million (2015: loss of US$1,103.8 million) resulting in a basic earnings per share of 24.0
cents from continuing and discontinued operations (2015: loss of 216.1 cents).
Cash flows
Cash flow from operating activities was US$431.4 million (2015: US$809.5 million) after accounting for tax payments
of US$60.9 million (2015: US$94.0 million).
Capital expenditure in 2016 totalled US$678.1 million (2015: US$1,070.1 million).
Capital expenditure (US$ million) 2016 2015
Fields/development projects 548.6 847.4
Exploration and evaluation 126.6 216.8
Other 2.9 5.9
Total 678.1 1,070.1
The principal development projects were the Solan and Catcher fields in the UK. Exploration expenditure mainly
related to our exploration campaign in the Falkland Islands, which concluded in Q1 2016, and Brazil. In addition,
payments related to decommissioning in the period were US$62.3 million and included a one off US$53 million catch
up payment into escrow for future decommissioning of Chim Sáo, the balance of which is held within non-current
other receivables.
Annual Results for the year ended 31 December 2016
Balance sheet position
Net debt
Net debt at 31 December 2016, excluding Letters of Credit, amounted to US$2,765.2 million (2015: US$2,242.2
million), with cash resources of US$255.9 million (2015: US$401.3 million).
Net debt (US$ million) 2016 2015
Cash and cash equivalents1 255.9 401.3
Convertible bonds2 (237.4) (232.9)
Other debt2 (2,783.7) (2,410.6)
Total net debt (2,765.2) (2,242.2)
1 Includes JV partners share of cash of US$46.4 million and cash collateral for Mexico exploration of US$6.6 million.
2 The carrying amounts of the convertible bonds and the other long-term debt on the balance sheet are stated net of the unamortised portion of the issue costs
of US$0.1 million (2015: US$0.3 million) and debt arrangement fees of US$17.5 million (2015: US$28.1 million) respectively.
Long-term borrowings consist of convertible bonds, UK retail bonds, senior loan notes and bank debt. The £100.0
million and US$150.0 million term loans maturing in November 2017 have been classified as short term on the
balance sheet. Once the Group’s refinancing is completed, maturity of both of these loans will be extended out to
May 2021.
Premier retains significant cash, at 31 December 2016, of US$255.9 million and undrawn facilities of US$390.0
million, giving Liquidity of US$592.9 million (31 December 2015: US$1,251.3 million), once cash of US$53.0 million
held on behalf of our JV partners is removed from the calculation of Liquidity.
Decommissioning Funding
As part of the E.ON acquisition, Premier entered into a separate Decommissioning Liability Agreement with E.ON,
whereby E.ON agreed to part fund Premier’s share of decommissioning the Johnston and Ravenspurn North assets.
Under the terms of the agreement, E.ON will reimburse 70 per cent of the decommissioning costs between a range
of the net decommissioning costs of the two assets above £40 million up to a ceiling of £130 million. This results in a
maximum possible funding of £63.0 million from E.ON. At 31 December 2016, a long-term decommissioning funding
asset of US$66.7 million has, therefore, been recognised based on the year end sterling dollar exchange rate.

Annual Results for the year ended 31 December 2016
Provisions
The Group’s decommissioning provision increased to US$1,325.4 million at 31 December 2016, up from
US$1,062.6 million at the end of 2015. The increase is driven by the recognition of a long term provision for
decommissioning related to the E.ON assets of US$427.9 million, which has been partially offset by a reduction for
the UK assets driven by the weakening of the GBP:USD exchange rate at 31 December 2016.
Non-IFRS measures
The Group uses certain measures of performance that are not specifically defined under IFRS or other generally
accepted accounting principles. These non-IFRS measures used within this Financial Review are EBITDAX, Operating
cost per barrel, Net Debt and Liquidity and are defined in the glossary.
Financial risk management
Commodity prices
At 31 December 2016, the Group had 1.5 mmbbls of open oil swaps at an average price of $45.8/bbl. The fair value
of these oil swaps at 31 December 2016 was a liability of US$18.3 million (2015: asset of US$98.0 million), which is
expected to be released to the income statement during 2017 as the related barrels are lifted. Furthermore, in
December 2016, the Group paid total premiums of US$4.6 million to enter into oil option agreements for 1.8 mmbls
at an average price of $50.7/bbl. These options will be settled during 2017 and are an asset on the Group’s balance
sheet with a fair value at 31 December 2016 of US$3.5 million. Included within physically delivered oil sales contracts
are a further 1.7 mmbls of oil that will be sold for an average fixed price of $55.3/bbl during 2017 as these barrels
are delivered.
In addition, the Group has forward UK gas sales for 132 mm therms at an average price of 48 pence/therm at 31
December 2016 that will be physically settled during 2017 and into H1 2018. The fair value of this asset at 31
December 2016 was US$10.0 million.
During 2016, forward oil sales of 5.3 mmbbls, forward gas sales of 36 mm therms and forward fuel oil sales of 72,000
mt expired resulting in a net credit of US$117.0 million (2015: US$278.9 million) which has been included in sales
revenue for the year.
Foreign exchange
Premier’s functional and reporting currency is US dollars. Exchange rate exposures relate only to local currency
receipts, and expenditures within individual business units. Local currency needs are acquired on a short-term basis.
At the year end, the Group recorded a mark-to-market loss of US$57.4 million on its outstanding foreign exchange
contracts (2015: loss of US$19.1 million). The Group currently has £150.0 million retail bonds, €60.0 million long-

Annual Results for the year ended 31 December 2016
term senior loan notes and a £100.0 million term loan in issuance which have been hedged under cross currency
swaps in US dollars at average fixed rates of US$1.64:£ and US$1.39:€.
Interest rates
The Group has various financing instruments including senior loan notes, convertible bonds, UK retail bonds, term
loans and revolving credit facilities. As at year end, 52 per cent of total borrowings is fixed or has been fixed using
the interest rate swap markets. On average, the cost of drawn funds for the year was 4.6 per cent. Mark-to-market
credits on interest rate swaps amounted to US$1.0 million (2015: credit of US$7.7 million), which are recorded as
movements in other comprehensive income.
Insurance
The Group undertakes a significant insurance programme to reduce the potential impact of physical risks associated
with its exploration, development and production activities. Business interruption cover is purchased for a
proportion of the cash flow from producing fields for a maximum period of 18 months. During 2016, claims
amounting to US$91.0 million (gross) were agreed and settled in relation to exploration drilling in the Falkland
Islands.
Going concern
The Group monitors its funding position and its liquidity risk throughout the year to ensure it has access to sufficient
funds to meet forecast cash requirements. Cash forecasts are regularly produced based on, inter alia, the Group’s
latest life of field production and expenditure forecasts, management’s best estimate of future commodity prices
(based on recent forward curves, adjusted for the Group’s hedging programme) and the Group’s borrowing facilities.
Sensitivities are run to reflect different scenarios including, but not limited to, changes in oil and gas production
rates, possible reductions in commodity prices and delays or cost overruns on major development projects. This is
done to identify risks to liquidity and covenant compliance and enable management to formulate appropriate and
timely mitigation strategies.
At year-end, the Group continued to have significant headroom on its borrowing facilities. However, whilst the
Group continues to have sufficient liquidity available under these existing facilities, the Group’s projections currently
indicate that without an amendment to the covenant limits a breach of one of the financial covenants applicable to
the Group’s borrowing facilities is likely to arise in respect of the next covenant testing period which, as part of the
lender discussions outlined below, has been deferred on a rolling one month basis and is due to be tested for the 12
month period ending 31 March 2017. If there is a breach of a financial covenant, under the existing terms of the
Group’s financing facilities the Group’s debt holders on all of the Group’s facilities will have the right to request
repayment of the outstanding debt and to cancel the relevant facilities.
Annual Results for the year ended 31 December 2016
Discussions with Premier’s lending groups on the terms of a refinancing are substantially progressed and a long form
term sheet has been agreed with advisers to the principal lending groups and the Coordinating Committee of the
Revolving Credit Facility (“RCF”) banks. The terms of the expected refinancing are summarised in note 12 to the
financial statements. The process to finalise a lock-up agreement with the lenders in respect of the refinancing is also
well advanced. Once this has been agreed the process of a Court Scheme of Arrangement will commence alongside
an investment circular process to obtain shareholder approval.
The risk that the expected refinancing will not be approved by Premier’s lending groups and shareholders or that the
covenant test will not continue to be deferred until approval is received constitutes a material uncertainty that may
cast significant doubt upon the use of the going concern basis of accounting. However, the Directors have a
reasonable expectation that the refinancing will be completed on the terms that have been negotiated and also that
the covenant testing period under the Group’s existing facilities will continue to be deferred on a rolling one month
basis until the refinancing is finalised. On the assumption that the refinancing of the Group’s facilities is finalised as
expected, the Group’s projections indicate that, unless there are significant falls in prevailing oil prices or forecast
production levels, the Group will have sufficient liquidity and will be able to operate within the revised financial
covenants for a period of at least 12 months from the date of finalising the 2016 Annual Report and Accounts.
Accordingly, after making enquiries and considering the risks and uncertainties described above, the Directors have a
reasonable expectation that the Group and Company will have adequate resources to continue in operational
existence for the foreseeable future, being at least the next 12 months and, therefore, continue to adopt the going
concern basis of accounting in preparing these consolidated financial statements.
Business risks
Premier’s business may be impacted by various risks leading to failure to achieve strategic targets for growth, loss of
financial standing, cash flow and earnings, and reputation. Not all of these risks are wholly within the Company’s
control and the Company may be affected by risks which are not yet manifest or reasonably foreseeable. Effective
risk management is critical to achieving our strategic objectives and protecting our personnel, assets, the
communities where we operate and with whom we interact and our reputation. Premier therefore has a
comprehensive approach to risk management.
A critical part of the risk management process is to assess the impact and likelihood of risks occurring so that
appropriate mitigation plans can be developed and implemented. Risk severity matrices are developed across
Premier’s business to facilitate assessment of risk. The specific risks identified by project and asset teams, business
units and corporate functions are consolidated and amalgamated to provide an oversight of key risk factors at each

Annual Results for the year ended 31 December 2016
level, from operations through business unit management to the Executive Committee and the Board.
For all the known risks facing the business, Premier attempts to minimise the likelihood and mitigate the impact.
According to the nature of the risk, Premier may elect to take or tolerate risk, treat risk with controls and mitigating
actions, transfer risk to third parties, or terminate risk by ceasing particular activities or operations. Premier has a
zero tolerance to financial fraud or ethics non-compliance, and ensures that HSES risks are managed to levels that
are as low as reasonably practicable, whilst managing exploration and development risks on a portfolio basis.
The Group has identified its significant risks for the next 12 months as being:
• Continued oil price weakness
• Cash generation and ability to fund existing and planned projects
• Loss of value if projects are deferred
• Continued underperformance from the Solan field
• Failure to deliver Catcher to schedule
• Political and security instability in countries of current and planned activity
• Failure to engage constructively with the Oil and Gas Authority and other relevant bodies
• Timing and uncertainty of decommissioning liabilities
• Financial viability of key suppliers and partners
• Ability to maintain core competencies
Further information detailing the way in which these risks are mitigated is provided on the Company’s website
www.premier-oil.com.
Richard Rose
Finance Director

Annual Results for the year ended 31 December 2016
Consolidated Income Statement
For the year ended 31 December 2016
2016
$ million
2015
$ million
Continuing operations
Sales revenues 983.4 1,067.2
Other operating (costs) / income (6.1) 31.9
Cost of sales (767.1) (661.0)
Impairment charge on oil and gas properties (556.2) (1,023.7)
Reduction in decommissioning estimates 75.7 -
Exploration expense (48.0) (95.4)
Pre-licence exploration costs (10.4) (13.6)
Excess of fair value over costs of acquisition 228.5 -
Costs related to the acquisition of subsidiaries (21.6) -
Profit on disposal of non-current assets - 1.2
General and administration costs (24.1) (14.4)
Operating loss (145.9) (707.8)
Share of profit/(loss) in associate 1.8 (1.9)
Interest revenue, finance and other gains 13.2 40.7
Finance costs, other finance expenses and losses (259.7) (160.6)
Loss before tax (390.6) (829.6)
Tax 522.0 (241.1)
Profit/(loss) for the year from continuing operations 131.4 (1,070.7)
Discontinued operations
Loss for the year from discontinued operations1 (8.8) (33.1)
Profit/(loss) after tax 122.6 (1,103.8)
Earnings/(loss) per share (cents):
From continuing operations
Basic 25.7 (209.6)
Diluted 25.4 (209.6)
From continuing and discontinued operations
Basic 24.0 (216.1)
Diluted 23.7 (216.1) 1 Discontinued operations relate to the disposal of the Norway business unit which completed in December 2015

Annual Results for the year ended 31 December 2016
Consolidated Statement of Comprehensive Income
For the year ended 31 December 2016
2016
$ million
2015
$ million
Profit / (loss) for the year 122.6 (1,103.8)
Cash flow hedges on commodity swaps:
(Losses) / gains arising during the year (38.3) 164.4
Less: reclassification adjustments for gains in the year (92.4) (278.9)
(130.7) (114.5)
Tax relating to components of other comprehensive income 56.1 76.0
Cash flow hedges on interest rate and foreign exchange swaps 3.3 19.8
Exchange differences on translation of foreign operations 3.0 (37.0)
Gains/(losses) on long-term employee benefit plans1 0.2 (0.1)
Other comprehensive expense (68.1) (55.8)
Total comprehensive income/(expense) for the year 54.5 (1,159.6) 1 Only item above not expected to be reclassified subsequently to profit and loss account.
All comprehensive income is attributable to the equity holders of the parent.

Annual Results for the year ended 31 December 2016
Consolidated Balance Sheet
As at 31 December 2016
2016
$ million
2015
$ million
Non-current assets:
Intangible exploration and evaluation assets 1,011.4 749.7
Property, plant and equipment 2,726.2 2,611.7
Goodwill 240.8 240.8
Investment in associate 6.2 5.3
Long-term receivables 143.4 12.0
Deferred tax assets 1,304.0 871.6
5,432.0 4,491.1
Current assets:
Inventories 22.3 20.8
Trade and other receivables 315.1 274.4
Derivative financial instruments 34.9 118.3
Cash and cash equivalents 255.9 401.3
628.2 814.8
Total assets 6,060.2 5,305.9
Current liabilities:
Trade and other payables (412.6) (472.0)
Short-term provisions (56.1) (24.8)
Derivative financial instruments * (57.2) (2.2)
Short-term debt (273.0) –
Deferred income (27.3) (20.9)
(826.2) (519.9)
Net current (liabilities) / assets (198.0) 294.9

Annual Results for the year ended 31 December 2016
Consolidated Balance Sheet (continued)
As at 31 December 2016
2016
$ million
2015
$ million
Non-current liabilities:
Long-term debt (2,730.5) (2,615.1)
Deferred tax liabilities (192.6) (193.3)
Deferred income (88.1) (87.6)
Derivative financial instruments * (101.6) (74.3)
Long-term provisions (1,312.1) (1,080.9)
(4,424.9) (4,051.2)
Total liabilities (5,251.1) (4,571.1)
Net assets 809.1 734.8
Equity and reserves:
Share capital 106.7 106.7
Share premium account 275.4 275.4
Merger reserve 374.3 374.3
Retained earnings 122.3 46.3
Other reserves (69.6) (67.9)
809.1 734.8
* Includes prior year derivative financial instruments of US$74.3 million which have been reclassified as long-term in the prior year to reflect the maturity of these instruments

Annual Results for the year ended 31 December 2016
Consolidated Statement of Changes in Equity
For the year ended 31 December 2016
Other reserves
Share
capital
$ million
Share
premium
account
$ million
Retained
earnings2
$ million
Merger
reserve
$ million
Capital
redemption
reserve
$ million
Translation
reserves
$ million
Equity
reserve
$ million
Total
$ million
At 1 January 2015 106.7 275.4 1,142.3 374.3 8.1 (48.7) 14.1 1,872.2
Purchase of ESOP Trust
shares - - (0.9) - - - - (0.9)
Provision for share-based
payments - - 23.0 - - - - 23.0
Transfer between reserves1 - - 4.5 - - - (4.5) -
Loss for the year - - (1,103.8) - - - - (1,103.8)
Other comprehensive
expense - - (18.8) - - (37.0) - (55.8)
At 1 January 2016 106.7 275.4 46.3 374.3 8.1 (85.7) 9.6 734.7
Purchase of ESOP Trust
shares - - 0.2 - - - - 0.2
Provision for share-based
payments - - 19.7 - - - - 19.7
Transfer between reserves1 - - 4.6 - - - (4.6) -
Profit for the year - - 122.6 - - - - 122.6
Other comprehensive
expense - - (71.1) - - 3.0 - (68.1)
At 31 December 2016 106.7 275.4 122.3 374.3 8.1 (82.7) 5.0 809.1
1 The transfer between reserves relates to the non-cash interest on the convertible bonds, less the amortisation of the issue costs that were
charged directly against equity.

Annual Results for the year ended 31 December 2016
Consolidated Cash Flow Statement
For the year ended 31 December 2016
2016
$ million
2015
$ million
Net cash from operating activities 431.4 809.5
Investing activities:
Capital expenditure (678.1) (992.2)
Acquisition of subsidiaries (135.0) -
Cash balance acquired in the period 24.9 -
Decommissioning funding (62.3) -
Disposal of oil and gas properties (8.8) 219.6
Loan to joint venture partner - (77.9)
Net cash used in investing activities (859.3) (850.5)
Financing activities:
Purchase of ESOP Trust shares 0.2 (0.9)
Proceeds from drawdown of bank loans 435.0 775.0
Debt arrangement fees (26.3) (9.6)
Repayment of long-term bank loans - (300.0)
Repayment of senior loan notes - (209.4)
Interest paid (126.3) (91.6)
Net cash from financing activities 282.6 163.5
Currency translation differences relating to cash and cash equivalents (0.1) (13.0)
Net (decrease) / increase in cash and cash equivalents (145.4) 109.5
Cash and cash equivalents at the beginning of the year 401.3 291.8
Cash and cash equivalents at the end of the year 255.9 401.3

Annual Results for the year ended 31 December 2016
NOTES TO THE PRELIMINARY FINANCIAL STATEMENTS
For the year ended 31 December 2016
1. General information
Premier Oil plc is a limited liability company incorporated in Scotland and listed on the London Stock Exchange. The
address of the registered office is 4th Floor, Saltire Court, 20 Castle Terrace, Edinburgh, EH1 2EN, United Kingdom.
This preliminary announcement was authorised for issue in accordance with a resolution of the Board of Directors on
8 March 2017.
The financial information for the year ended 31 December 2016 set out in this announcement does not constitute
statutory accounts within the meaning of section 434 of the Companies Act 2006. Statutory accounts for the year
ended 31 December 2015 were approved by the Board of Directors on 24 February 2016 and delivered to the
Registrar of Companies and those for 2016 will be delivered following the company’s Annual General Meeting
(AGM). The auditor has reported on the 2016 accounts; the report was unqualified, but did include a reference to a
matter to which the auditor drew attention by way of emphasis of matter around going concern.
Basis of preparation
The financial information has been prepared in accordance with the recognition and measurement criteria of
International Financial Reporting Standards (IFRS) adopted for use in the European Union. However, this
announcement does not itself contain sufficient information to comply with IFRS. The company will publish full
financial statements that comply with IFRS in April 2017.
The financial information has been prepared under the historical cost convention except for the revaluation of
financial instruments and certain oil and gas properties at the transition date to IFRS. These financial statements are
presented in US dollars since that is the currency in which the majority of the group’s transactions are denominated.
The financial information has been prepared on the going concern basis. Further information relating to the use of
the going concern assumption, including details of a related material uncertainty due to the risk of a covenant
breach prior to finalisation of the refinancing process, is provided in the “Going Concern” section of the Financial
Review.
Accounting policies
The accounting policies applied in this announcement are consistent with those of the annual financial statements
for the year ended 31 December 2015, as described in those annual financial statements. A number of amendments
to existing standards and interpretations were applicable from 1 January 2016. The adoption of these amendments
did not have a material impact on the group’s financial statements for the year ended 31 December 2016.
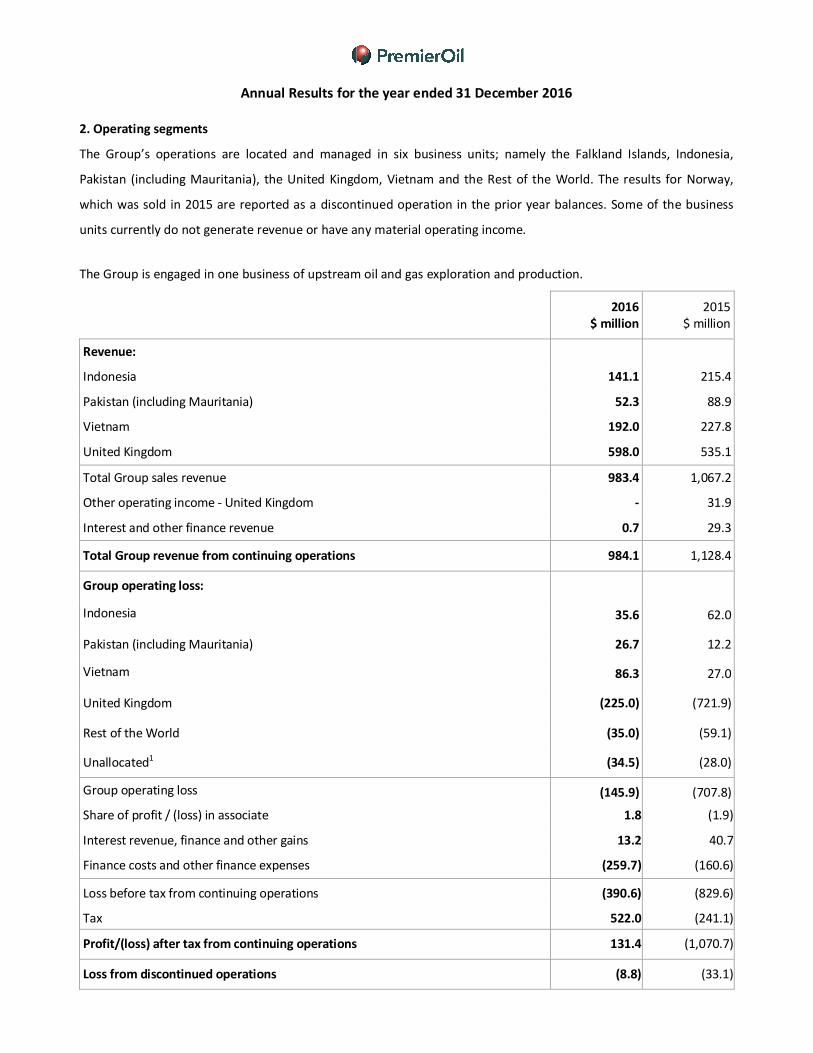
Annual Results for the year ended 31 December 2016
2. Operating segments
The Group’s operations are located and managed in six business units; namely the Falkland Islands, Indonesia,
Pakistan (including Mauritania), the United Kingdom, Vietnam and the Rest of the World. The results for Norway,
which was sold in 2015 are reported as a discontinued operation in the prior year balances. Some of the business
units currently do not generate revenue or have any material operating income.
The Group is engaged in one business of upstream oil and gas exploration and production.
2016
$ million
2015
$ million
Revenue:
Indonesia 141.1 215.4
Pakistan (including Mauritania) 52.3 88.9
Vietnam 192.0 227.8
United Kingdom 598.0 535.1
Total Group sales revenue 983.4 1,067.2
Other operating income - United Kingdom - 31.9
Interest and other finance revenue 0.7 29.3
Total Group revenue from continuing operations 984.1 1,128.4
Group operating loss:
Indonesia 35.6 62.0
Pakistan (including Mauritania) 26.7 12.2
Vietnam 86.3 27.0
United Kingdom (225.0) (721.9)
Rest of the World (35.0) (59.1)
Unallocated1 (34.5) (28.0)
Group operating loss (145.9) (707.8)
Share of profit / (loss) in associate 1.8 (1.9)
Interest revenue, finance and other gains 13.2 40.7
Finance costs and other finance expenses (259.7) (160.6)
Loss before tax from continuing operations (390.6) (829.6)
Tax 522.0 (241.1)
Profit/(loss) after tax from continuing operations 131.4 (1,070.7)
Loss from discontinued operations (8.8) (33.1)
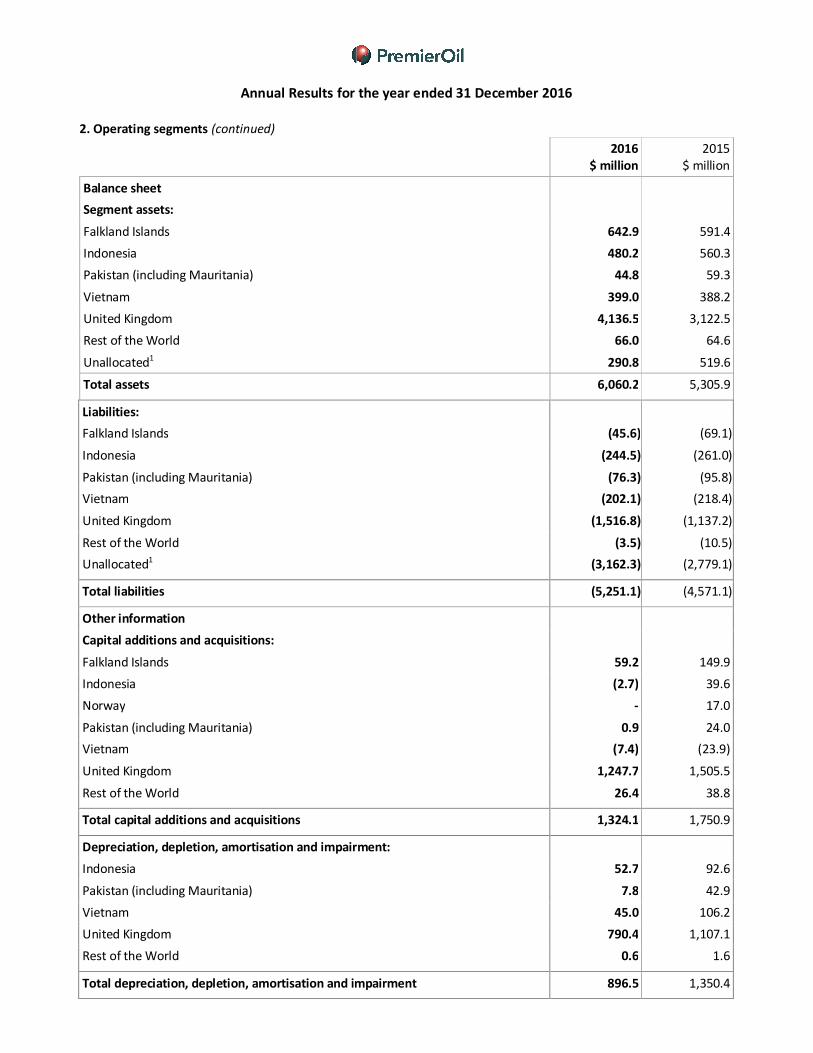
Annual Results for the year ended 31 December 2016
2. Operating segments (continued)
2016
$ million
2015
$ million
Balance sheet
Segment assets:
Falkland Islands 642.9 591.4
Indonesia 480.2 560.3
Pakistan (including Mauritania) 44.8 59.3
Vietnam 399.0 388.2
United Kingdom 4,136.5 3,122.5
Rest of the World 66.0 64.6
Unallocated1 290.8 519.6
Total assets 6,060.2 5,305.9
Liabilities:
Falkland Islands (45.6) (69.1)
Indonesia (244.5) (261.0)
Pakistan (including Mauritania) (76.3) (95.8)
Vietnam (202.1) (218.4)
United Kingdom (1,516.8) (1,137.2)
Rest of the World (3.5) (10.5)
Unallocated1 (3,162.3) (2,779.1)
Total liabilities (5,251.1) (4,571.1)
Other information
Capital additions and acquisitions:
Falkland Islands 59.2 149.9
Indonesia (2.7) 39.6
Norway - 17.0
Pakistan (including Mauritania) 0.9 24.0
Vietnam (7.4) (23.9)
United Kingdom 1,247.7 1,505.5
Rest of the World 26.4 38.8
Total capital additions and acquisitions 1,324.1 1,750.9
Depreciation, depletion, amortisation and impairment:
Indonesia 52.7 92.6
Pakistan (including Mauritania) 7.8 42.9
Vietnam 45.0 106.2
United Kingdom 790.4 1,107.1
Rest of the World 0.6 1.6
Total depreciation, depletion, amortisation and impairment 896.5 1,350.4
Annual Results for the year ended 31 December 2016
2. Operating segments (continued) 1 Unallocated expenditure, assets and liabilities include amounts of a corporate nature and not specifically attributable to a geographical segment. These items
include corporate general and administration costs, pre-licence exploration costs, cash and cash equivalents, mark-to-market valuations of commodity contracts and
interest rate swaps, convertible bonds and other short-term and long-term debt.
Out of the total Group worldwide sales revenues of US$983.4 million (2015: US$1,067.2 million), revenues of
US$598.0 million (2015: US$535.1 million) arose from sales of oil and gas to customers located in the UK.
Included in assets arising from the United Kingdom segment are non-current assets (excluding deferred tax assets) of
US$2,640.6 million (2015: US$2,137.5 million) located in the UK. Included in depreciation, depletion, amortisation
and impairment are impairment charges in relation to the UK (net US$587.8 million) and impairment reversals for
Vietnam (US$25.9 million) and Pakistan (US$5.7 million).
Revenue from three customers (2015: two customers) each exceeded 10 per cent of the Group’s consolidated
revenue and amounted to US$155.4 million and US$157.4 million, arising from sales of crude oil (2015: US$132.5
million) and US$112.0 million arising from sales of gas (2015: US$166.7 million) across all operating segments.
3. Cost of sales
2016
$ million
2015
$ million
Operating costs 412.8 323.6
Gas purchases 12.4 -
Stock underlift movement (12.1) (11.4)
Royalties 13.7 22.1
Amortisation and depreciation of property, plant and equipment:
- Oil and gas properties 332.2 315.9
- Other fixed assets 8.1 10.8
767.1 661.0
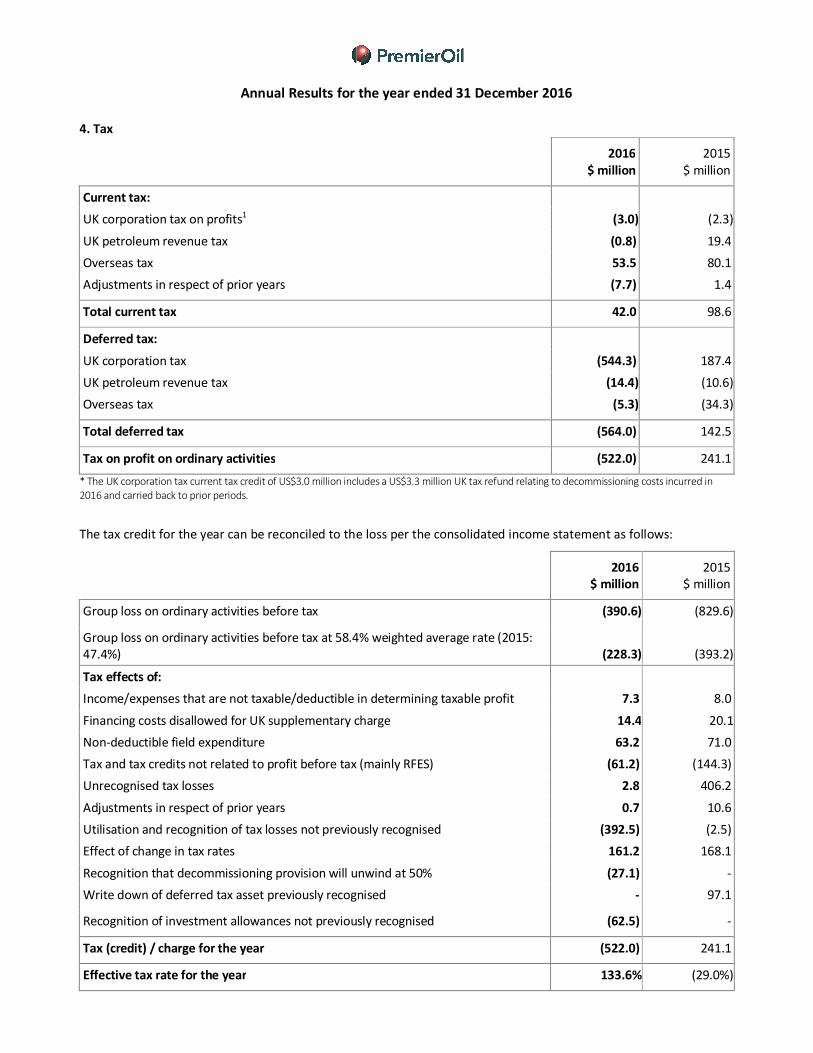
Annual Results for the year ended 31 December 2016
4. Tax
2016
$ million
2015
$ million
Current tax:
UK corporation tax on profits1 (3.0) (2.3)
UK petroleum revenue tax (0.8) 19.4
Overseas tax 53.5 80.1
Adjustments in respect of prior years (7.7) 1.4
Total current tax 42.0 98.6
Deferred tax:
UK corporation tax (544.3) 187.4
UK petroleum revenue tax (14.4) (10.6)
Overseas tax (5.3) (34.3)
Total deferred tax (564.0) 142.5
Tax on profit on ordinary activities (522.0) 241.1
* The UK corporation tax current tax credit of US$3.0 million includes a US$3.3 million UK tax refund relating to decommissioning costs incurred in
2016 and carried back to prior periods.
The tax credit for the year can be reconciled to the loss per the consolidated income statement as follows:
2016
$ million
2015
$ million
Group loss on ordinary activities before tax (390.6) (829.6)
Group loss on ordinary activities before tax at 58.4% weighted average rate (2015:
47.4%) (228.3) (393.2)
Tax effects of:
Income/expenses that are not taxable/deductible in determining taxable profit 7.3 8.0
Financing costs disallowed for UK supplementary charge 14.4 20.1
Non-deductible field expenditure 63.2 71.0
Tax and tax credits not related to profit before tax (mainly RFES) (61.2) (144.3)
Unrecognised tax losses 2.8 406.2
Adjustments in respect of prior years 0.7 10.6
Utilisation and recognition of tax losses not previously recognised (392.5) (2.5)
Effect of change in tax rates 161.2 168.1
Recognition that decommissioning provision will unwind at 50% (27.1) -
Write down of deferred tax asset previously recognised - 97.1
Recognition of investment allowances not previously recognised (62.5) -
Tax (credit) / charge for the year (522.0) 241.1
Effective tax rate for the year 133.6% (29.0%)

Annual Results for the year ended 31 December 2016
4. Tax (continued)
The weighted average rate is calculated based on the tax rates weighted according to the profit or loss before tax
earned by the Group in each jurisdiction. The change in the weighted average rate year-on-year relates to the mix of
profit and loss in each jurisdiction. The tax credit not related to profit before tax includes the impact of a UK ring
fence expenditure supplement claim in the UK (US$61 million).
The deferred tax credit arises largely as a result of the recognition of UK tax losses and investment allowances
(US$455.8 million) after an increase in the estimated future profitability of the group's UK assets following the
acquisition of the E.ON North Sea business. This has been partially offset by a charge of US$161.2 million in relation
to the supplementary charge rate change from 20 per cent to 10 per cent during the year, with the adverse impact
of this change mitigated by US$27.1 million as the rate applicable to the reversal of certain temporary differences on
decommissioning remained unchanged.
The future effective tax rate for the Group is impacted by the mix of jurisdictions in which Premier operates (with
corporation tax rates ranging from 20 per cent to 55 per cent), assumptions around future oil prices and changes to
tax rates and legislation.

Annual Results for the year ended 31 December 2016
5. Deferred tax
2016
$ million
2015
$ million
Deferred tax assets 1,304.0 871.6
Deferred tax liabilities (192.6) (193.3)
1,111.4 678.3
At 1 January
2016
$ million
Exchange
movements
$ million
Acquisition
Accounting
29 April 2016
$ million
(Charged)/
credited to
income
statement
$ million
Credited to
retained
earnings
$ million
At 31
December
2016
$ million
UK deferred corporation tax:
Fixed assets and allowances (581.0) - (371.2) 232.6 - (719.6)
Decommissioning 378.8 - 172.3 (156.6) - 394.5
Deferred petroleum revenue tax 7.2 - - (7.2) - -
Tax losses and allowances 1,129.4 - 33.5 397.2 - 1,560.1
Other - - (0.7) 65.1 - 64.4
Derivative financial instruments (49.1) 0.3 (21.2) 13.2 56.1 (0.7)
Total UK deferred corporation
tax 885.3 0.3 (187.3) 544.3 56.1 1,298.7
UK deferred petroleum revenue
tax1 (14.4) - - 14.4 - -
Overseas deferred tax2 (192.6) - - 5.3 - (187.3)
Total 678.3 0.3 (187.3) 564.0 56.1 1,111.4
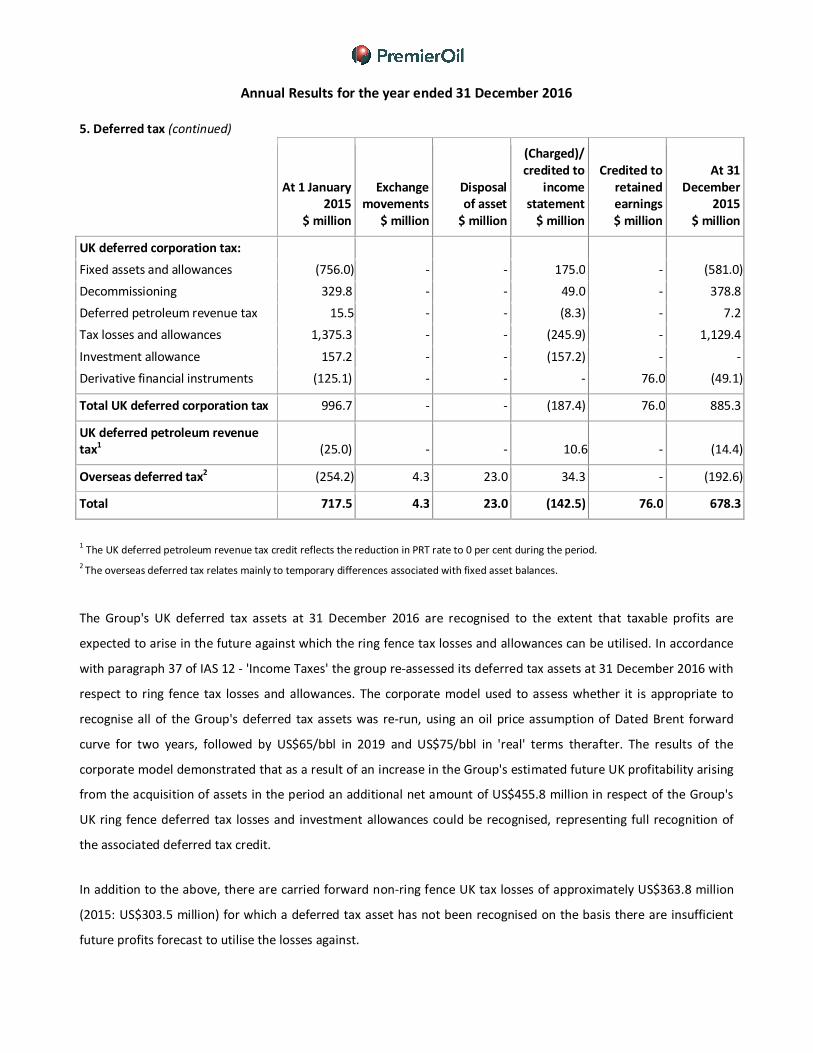
Annual Results for the year ended 31 December 2016
5. Deferred tax (continued)
At 1 January
2015
$ million
Exchange
movements
$ million
Disposal
of asset
$ million
(Charged)/
credited to
income
statement
$ million
Credited to
retained
earnings
$ million
At 31
December
2015
$ million
UK deferred corporation tax:
Fixed assets and allowances (756.0) - - 175.0 - (581.0)
Decommissioning 329.8 - - 49.0 - 378.8
Deferred petroleum revenue tax 15.5 - - (8.3) - 7.2
Tax losses and allowances 1,375.3 - - (245.9) - 1,129.4
Investment allowance 157.2 - - (157.2) - -
Derivative financial instruments (125.1) - - - 76.0 (49.1)
Total UK deferred corporation tax 996.7 - - (187.4) 76.0 885.3
UK deferred petroleum revenue
tax1 (25.0) - - 10.6 - (14.4)
Overseas deferred tax2 (254.2) 4.3 23.0 34.3 - (192.6)
Total 717.5 4.3 23.0 (142.5) 76.0 678.3
1 The UK deferred petroleum revenue tax credit reflects the reduction in PRT rate to 0 per cent during the period.
2 The overseas deferred tax relates mainly to temporary differences associated with fixed asset balances.
The Group's UK deferred tax assets at 31 December 2016 are recognised to the extent that taxable profits are
expected to arise in the future against which the ring fence tax losses and allowances can be utilised. In accordance
with paragraph 37 of IAS 12 - 'Income Taxes' the group re-assessed its deferred tax assets at 31 December 2016 with
respect to ring fence tax losses and allowances. The corporate model used to assess whether it is appropriate to
recognise all of the Group's deferred tax assets was re-run, using an oil price assumption of Dated Brent forward
curve for two years, followed by US$65/bbl in 2019 and US$75/bbl in 'real' terms therafter. The results of the
corporate model demonstrated that as a result of an increase in the Group's estimated future UK profitability arising
from the acquisition of assets in the period an additional net amount of US$455.8 million in respect of the Group's
UK ring fence deferred tax losses and investment allowances could be recognised, representing full recognition of
the associated deferred tax credit.
In addition to the above, there are carried forward non-ring fence UK tax losses of approximately US$363.8 million
(2015: US$303.5 million) for which a deferred tax asset has not been recognised on the basis there are insufficient
future profits forecast to utilise the losses against.
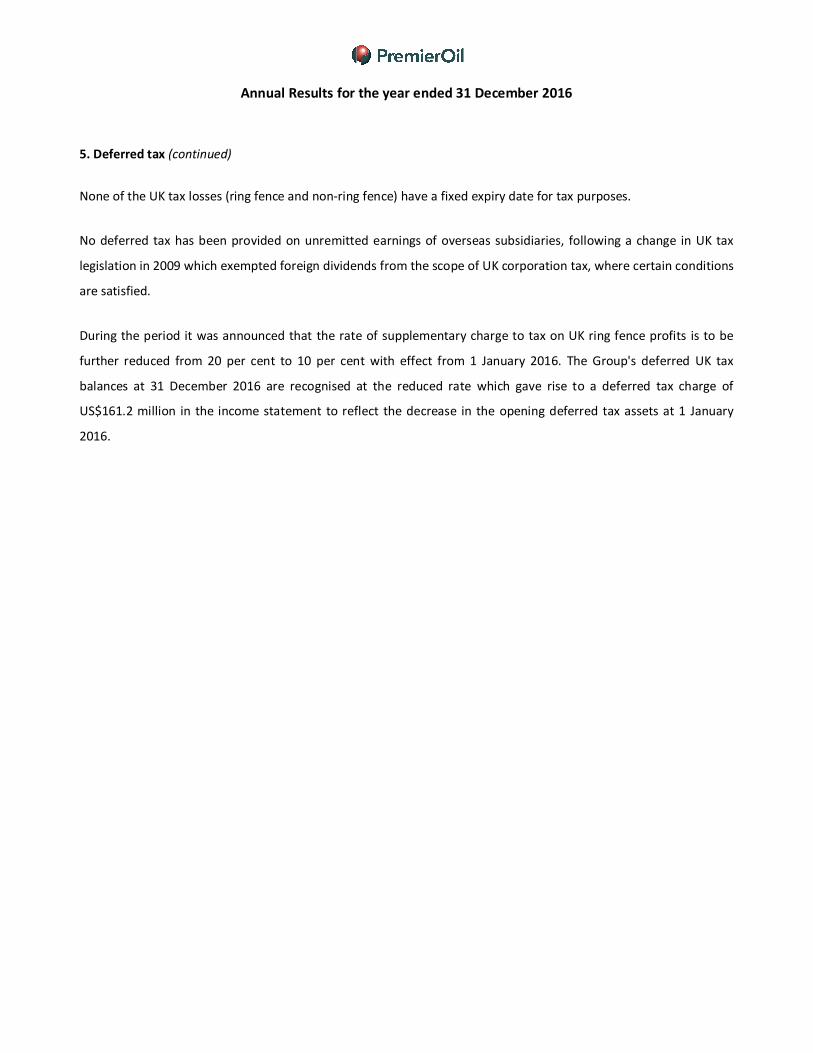
Annual Results for the year ended 31 December 2016
5. Deferred tax (continued)
None of the UK tax losses (ring fence and non-ring fence) have a fixed expiry date for tax purposes.
No deferred tax has been provided on unremitted earnings of overseas subsidiaries, following a change in UK tax
legislation in 2009 which exempted foreign dividends from the scope of UK corporation tax, where certain conditions
are satisfied.
During the period it was announced that the rate of supplementary charge to tax on UK ring fence profits is to be
further reduced from 20 per cent to 10 per cent with effect from 1 January 2016. The Group's deferred UK tax
balances at 31 December 2016 are recognised at the reduced rate which gave rise to a deferred tax charge of
US$161.2 million in the income statement to reflect the decrease in the opening deferred tax assets at 1 January
2016.

Annual Results for the year ended 31 December 2016
6. Acquisition of subsidiaries
On 28 April 2016, the Group acquired 100 per cent of the share capital of E.ON E&P UK Ltd (“EPUK”), a wholly owned
subsidiary of E.ON SE, a German listed utility. The acquisition of EPUK brings additional high quality assets to
Premier’s UK North Sea business, the opportunity for cost and operating synergies in the North Sea, more balanced
production portfolio and adds significant immediate production and cash flow.
The Group reached agreement on the acquisition on 13 January 2016 and was approved by Premier shareholders on
25 April 2016. Premier paid total cash consideration of US$135.0 million, including working capital adjustments. The
acquisition has been accounted for as a business combination. The fair values of the identifiable assets and liabilities
acquired were reported as provisional in our half-year report and have now been finalised for the purposes of full
year 2016 financial statements.
The fair values of the oil and gas properties and intangible exploration and evaluation assets acquired have been
determined using valuation techniques based on discounted cash flows using forward curve commodity prices at the
acquisition date, a discount rate based on market observable data and cost and production profiles consistent with
the proved and probable reserves acquired with each asset. The financial instruments acquired have been valued
using our forward curve oil and gas price assumptions at the date of the acquisition. The decommissioning
provisions recognised are based on Premier’s internal estimates.

Annual Results for the year ended 31 December 2016
6. Acquisition of subsidiaries (continued)
The fair value of the identifiable assets and liabilities of EPUK as at the date of acquisition were:
Provisional fair
value as
included in the
half-year
report
$ million
Adjustment
$ million
Final fair value
$ million
Assets
Intangible exploration and evaluation assets 105.7 94.1 199.8
Oil and gas properties 600.0 - 600.0
Other fixed assets 7.1 - 7.1
Long-term decommissioning funding asset 85.9 (2.6) 83.3
Inventory 2.7 - 2.7
Trade and other receivables 51.4 - 51.4
Derivative financial instruments 59.4 - 59.4
Cash and cash equivalents 24.9 - 24.9
937.1 91.5 1,028.6
Liabilities
Trade and other payables (50.0) - (50.0)
Decommissioning obligations – current (13.7) - (13.7)
Decommissioning obligations – non-current (565.9) 151.7 (414.2)
Deferred tax liabilities (65.6) (121.6) (187.2)
(695.2) 30.1 (665.1)
Total identifiable net assets acquired at fair value 241.9 121.6 363.5
Total consideration (135.0) - (135.0)
Excess of fair value over cost (negative goodwill) 106.9 121.6 228.5
The adjustments to the provisional half-year value predominantly relate to an increase in the fair value of the Tolmount field recog-
nised within exploration and evaluation assets and a reduction in the decommissioning estimates for several of the fields acquired
to align Premier’s estimates either with those of the field operator or E.ON’s underlying decommissioning cost estimate. The reduc-
tion in the decommissioning estimate for the Ravenspurn North and Johnston fields has resulted in an adjustment to the fair value
of the long-term decommissioning funding receivable from E.ON. Deferred tax has been recognised on the above adjustments.

Annual Results for the year ended 31 December 2016
6. Acquisition of subsidiaries (continued)
The excess of the fair value of the net assets acquired over the purchase consideration has arisen primarily due to
E.ON’s strategic decision to exit the UK and Norway E&P sectors, and Premier’s willingness to acquire the entire UK
business. This been recognised immediately in the consolidated income statement.
From the date of acquisition to 31 December 2016, EPUK contributed US$201.9 million to Group revenue and in-
creased the Group’s loss before tax by US$40.9 million. If the acquisition of EPUK had taken place at the beginning
of the year, EPUK’s contribution to Group revenue for the year ended 31 December 2016 would have been US$336.1
million and it would have increased the Group’s loss before tax by US$43.9 million.
Costs related to the acquisition represent transaction costs of US$5.6 million and the recognition of a settlement
provision of US$16.0 million in respect of employee costs. This settlement was fully utilised in the second half of
2016.
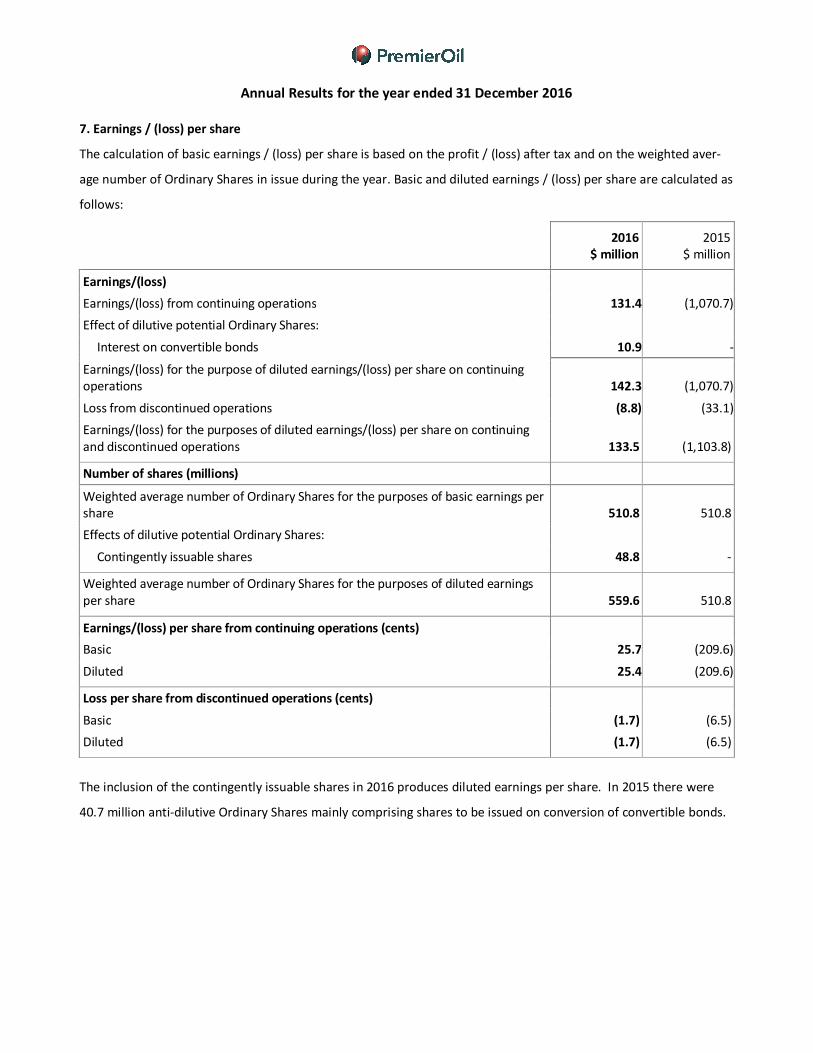
Annual Results for the year ended 31 December 2016
7. Earnings / (loss) per share
The calculation of basic earnings / (loss) per share is based on the profit / (loss) after tax and on the weighted aver-
age number of Ordinary Shares in issue during the year. Basic and diluted earnings / (loss) per share are calculated as
follows:
2016
$ million
2015
$ million
Earnings/(loss)
Earnings/(loss) from continuing operations 131.4 (1,070.7)
Effect of dilutive potential Ordinary Shares:
Interest on convertible bonds 10.9 -
Earnings/(loss) for the purpose of diluted earnings/(loss) per share on continuing
operations 142.3 (1,070.7)
Loss from discontinued operations (8.8) (33.1)
Earnings/(loss) for the purposes of diluted earnings/(loss) per share on continuing
and discontinued operations 133.5 (1,103.8)
Number of shares (millions)
Weighted average number of Ordinary Shares for the purposes of basic earnings per
share 510.8 510.8
Effects of dilutive potential Ordinary Shares:
Contingently issuable shares 48.8 -
Weighted average number of Ordinary Shares for the purposes of diluted earnings
per share 559.6 510.8
Earnings/(loss) per share from continuing operations (cents)
Basic 25.7 (209.6)
Diluted 25.4 (209.6)
Loss per share from discontinued operations (cents)
Basic (1.7) (6.5)
Diluted (1.7) (6.5)
The inclusion of the contingently issuable shares in 2016 produces diluted earnings per share. In 2015 there were
40.7 million anti-dilutive Ordinary Shares mainly comprising shares to be issued on conversion of convertible bonds.
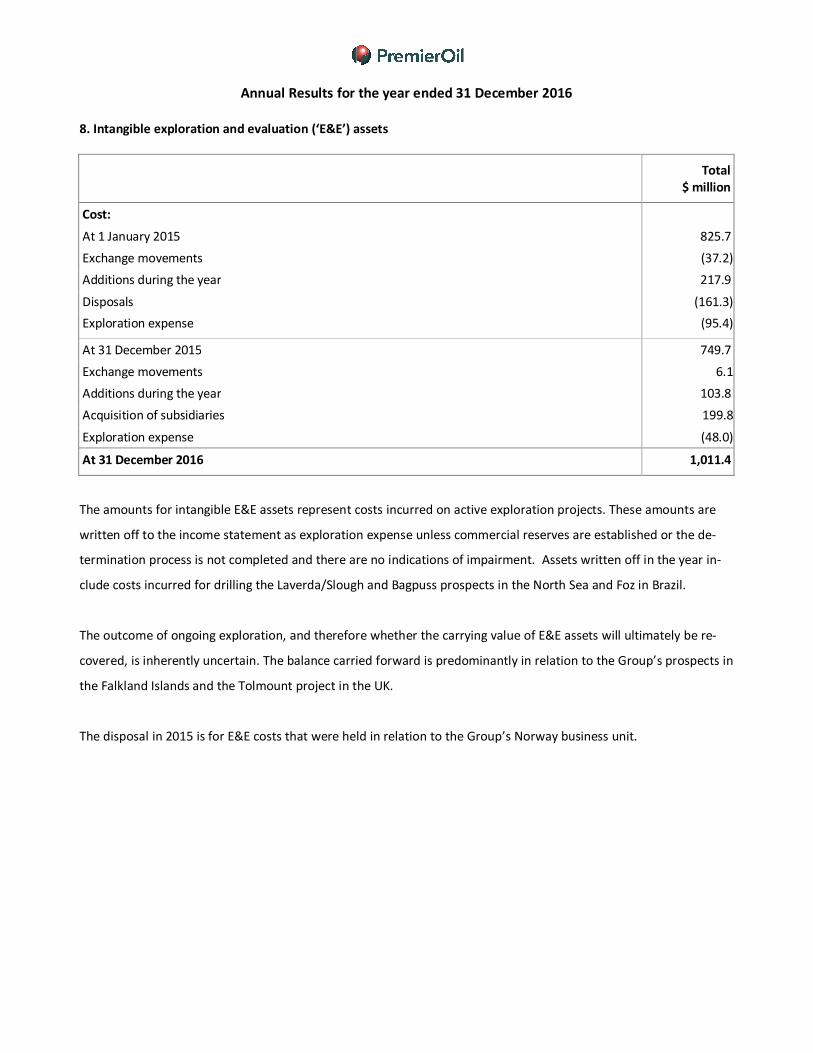
Annual Results for the year ended 31 December 2016
8. Intangible exploration and evaluation (‘E&E’) assets
Total
$ million
Cost:
At 1 January 2015 825.7
Exchange movements (37.2)
Additions during the year 217.9
Disposals (161.3)
Exploration expense (95.4)
At 31 December 2015 749.7
Exchange movements 6.1
Additions during the year 103.8
Acquisition of subsidiaries 199.8
Exploration expense (48.0)
At 31 December 2016 1,011.4
The amounts for intangible E&E assets represent costs incurred on active exploration projects. These amounts are
written off to the income statement as exploration expense unless commercial reserves are established or the de-
termination process is not completed and there are no indications of impairment. Assets written off in the year in-
clude costs incurred for drilling the Laverda/Slough and Bagpuss prospects in the North Sea and Foz in Brazil.
The outcome of ongoing exploration, and therefore whether the carrying value of E&E assets will ultimately be re-
covered, is inherently uncertain. The balance carried forward is predominantly in relation to the Group’s prospects in
the Falkland Islands and the Tolmount project in the UK.
The disposal in 2015 is for E&E costs that were held in relation to the Group’s Norway business unit.
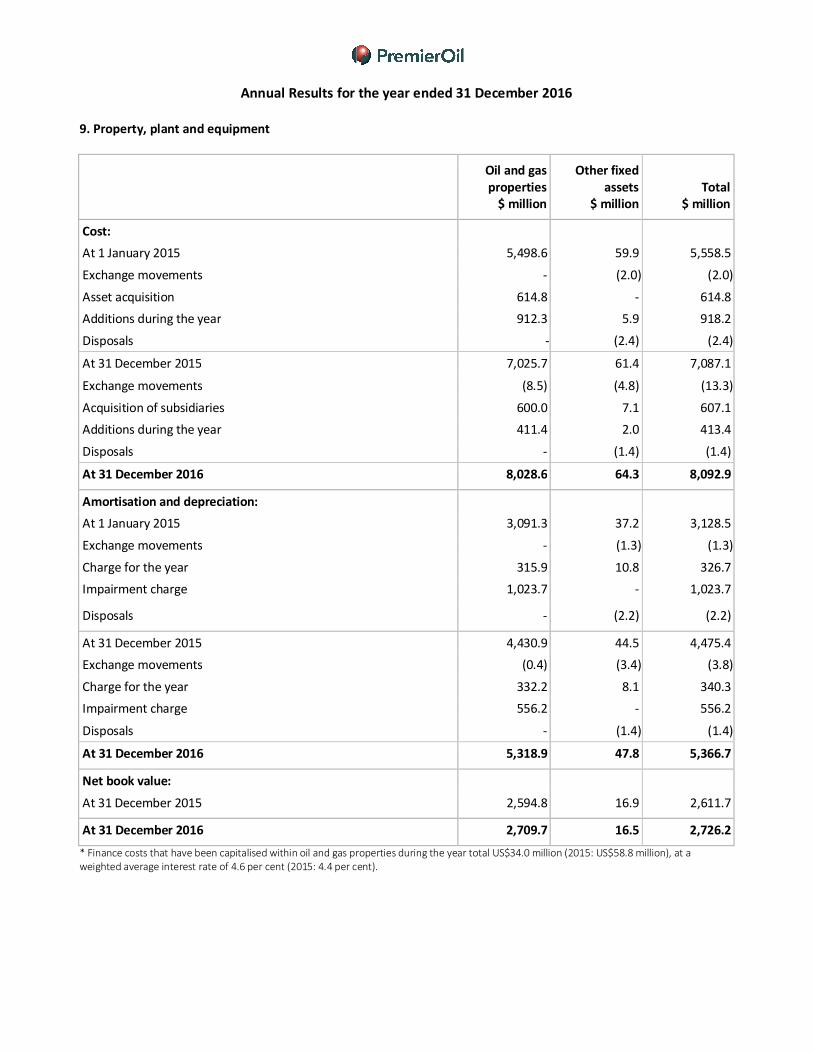
Annual Results for the year ended 31 December 2016
9. Property, plant and equipment
Oil and gas
properties
$ million
Other fixed
assets
$ million
Total
$ million
Cost:
At 1 January 2015 5,498.6 59.9 5,558.5
Exchange movements - (2.0) (2.0)
Asset acquisition 614.8 - 614.8
Additions during the year 912.3 5.9 918.2
Disposals - (2.4) (2.4)
At 31 December 2015 7,025.7 61.4 7,087.1
Exchange movements (8.5) (4.8) (13.3)
Acquisition of subsidiaries 600.0 7.1 607.1
Additions during the year 411.4 2.0 413.4
Disposals - (1.4) (1.4)
At 31 December 2016 8,028.6 64.3 8,092.9
Amortisation and depreciation:
At 1 January 2015 3,091.3 37.2 3,128.5
Exchange movements - (1.3) (1.3)
Charge for the year 315.9 10.8 326.7
Impairment charge 1,023.7 - 1,023.7
Disposals - (2.2) (2.2)
At 31 December 2015 4,430.9 44.5 4,475.4
Exchange movements (0.4) (3.4) (3.8)
Charge for the year 332.2 8.1 340.3
Impairment charge 556.2 - 556.2
Disposals - (1.4) (1.4)
At 31 December 2016 5,318.9 47.8 5,366.7
Net book value:
At 31 December 2015 2,594.8 16.9 2,611.7
At 31 December 2016 2,709.7 16.5 2,726.2
* Finance costs that have been capitalised within oil and gas properties during the year total US$34.0 million (2015: US$58.8 million), at a
weighted average interest rate of 4.6 per cent (2015: 4.4 per cent).

Annual Results for the year ended 31 December 2016
9. Property, plant and equipment (continued)
Other fixed assets include items such as leasehold improvements, motor vehicles and office equipment. In April
2016, Premier completed the acquisition of E.ON E&P UK Limited.
Amortisation and depreciation of oil and gas properties is calculated on a unit-of-production basis, using the ratio of
oil and gas production in the period to the estimated quantities of proved and probable reserves on an entitlement
basis at the end of the period plus production in the period, on a field-by-field basis. Proved and probable reserves
estimates are based on a number of underlying assumptions including oil and gas prices, future costs, oil and gas in
place and reservoir performance, which are inherently uncertain. Management uses established industry techniques
to generate its estimates and regularly references its estimates against those of joint venture partners or external
consultants. However, the amount of reserves that will ultimately be recovered from any field cannot be known with
certainty until the end of the field’s life.
Impairment charge
The impairment charge in the current year relates to the Solan asset in the UK. The impairment charge of US$652.2
million was calculated by comparing the future discounted pre-tax cash flows expected to be derived from produc-
tion of commercial reserves (the value-in-use) against the carrying value of the asset. The future cash flows were
estimated using an oil price assumption equal to the Dated Brent forward curve in 2017 and 2018, and US$65/bbl in
2019 and US$75/bbl in ‘real’ terms thereafter (2015: long-term price of US$80 real/bbl) and were discounted using a
pre-tax discount rate of 8 per cent for the UK assets (2015: 8 per cent) and 12.5 per cent for the non-UK assets
(2015: 12.5 per cent). Assumptions involved in impairment measurement include estimates of commercial reserves
and production volumes, future oil and gas prices, discount rate and the level and timing of expenditures, all of
which are inherently uncertain.
The principal cause of the impairment charge being recognised in the year is a reduction in the 2P reserves expected
to be recovered from the asset over its economic life and the reduction in the long term oil price assumption to
US$75/bbl (real). The recoverable amount of the Solan asset based on its estimated value-in-use assumption set out
above is US$570.4 million.
Annual Results for the year ended 31 December 2016
9. Property, plant and equipment (continued)
Reversal of previously recognised impairment charges
Under the requirements of IAS 36, if there is an indication that a factor that resulted in an impairment charge may
have changed or been reversed, then the previously recognised impairment charge may no longer exist or may have
decreased. For a number of assets, due to an increase in the near term oil price assumption (based on the Dated
Brent Forward Curve), we have reassessed the recoverable amount of the asset to assess whether an increase in the
recoverable amount (value-in-use) is indicative of a reversal of a previously recognised impairment charge. The fu-
ture cash flows were determined using the same assumptions as those used for the impairment charge outlined
above.
A reversal of impairment of US$96.0 million has been credited to the income statement for the year, which has par-
tially offset the impairment charge recognised. The reversal of impairment relates to Huntington (UK, US$50.0 mil-
lion), Chim Sáo (Vietnam, US$25.9 million), Kyle (UK, US$14.4 million) and Kadanwari (Pakistan, US$5.7 million). An
increase in the short term oil price assumption and an increase in the 2P reserves on Chim Sáo have driven the re-
versal of impairment recognised. The recoverable amounts of the assets at 31 December 2016 were Huntington,
US$61.8 million; Chim Sáo, US$583.1 million; Kyle, US$31.9 million; and, Kadanwari, US$9.1 million.
Goodwill
Goodwill of US$240.8 million has been specifically assigned to the Catcher field in the UK, which is considered the
cash-generating unit for the purposes of any impairment testing of this goodwill. The Group tests goodwill annually
for impairment, or more frequently if there are indications that goodwill might be impaired. The recoverable
amounts are determined from value-in-use calculations with the same key assumptions as noted above for the im-
pairment calculations. The discount rate used is 8 per cent (2015: 8 per cent). The value-in-use forecast takes into
consideration cash flows which are expected to arise during the life of the Catcher field as a whole, currently ex-
pected to be around 2030. This period exceeds five years but is believed to be appropriate as it is underpinned by
estimates of commercial reserves provided by in-house reservoir engineers using industry standard reservoir estima-
tion techniques. The headroom between the recoverable amount and the carrying amount, including the goodwill is
US$143.2 million. If the discount rate was 1% higher or if the long term oil price assumption was US$5/bbl lower,
being reasonably possible changes in key assumptions, no impairment charge would arise.

Annual Results for the year ended 31 December 2016
9. Property, plant and equipment (continued)
Sensitivity
A 1 per cent increase in the discount rates used when determining the value-in-use for each oil and gas property
would result in a further impairment charge of approximately US$28.3 million. A US$5/bbl reduction in the long-
term oil price (to US$70/bbl (real)) would increase the impairment charge by approximately US$58.0 million. The
value of the reversal of impairment recognised in the year would be unaffected by either an increase in the discount
rate by 1 per cent or a reduction in the long-term oil price assumption to US$70/bbl (real).
10. Deferred income
In June 2015, Premier received US$100.0 million from FlowStream in return for granting them 15 per cent of produc-
tion from the Solan field until sufficient barrels have been delivered to achieve the rate of return within the agree-
ment. This balance is being released to the income statement within revenue as barrels are delivered to Flow-
Stream from production from Solan. The balance has reduced by US$7.9 million during the year reflecting barrels
delivered to FlowStream in the period since first oil from Solan. This has been offset by the finance charge for the
year of US$14.9 million.
The portion of the deferred income that is expected to be delivered to FlowStream within the next 12 months has
been classified as a current liability.
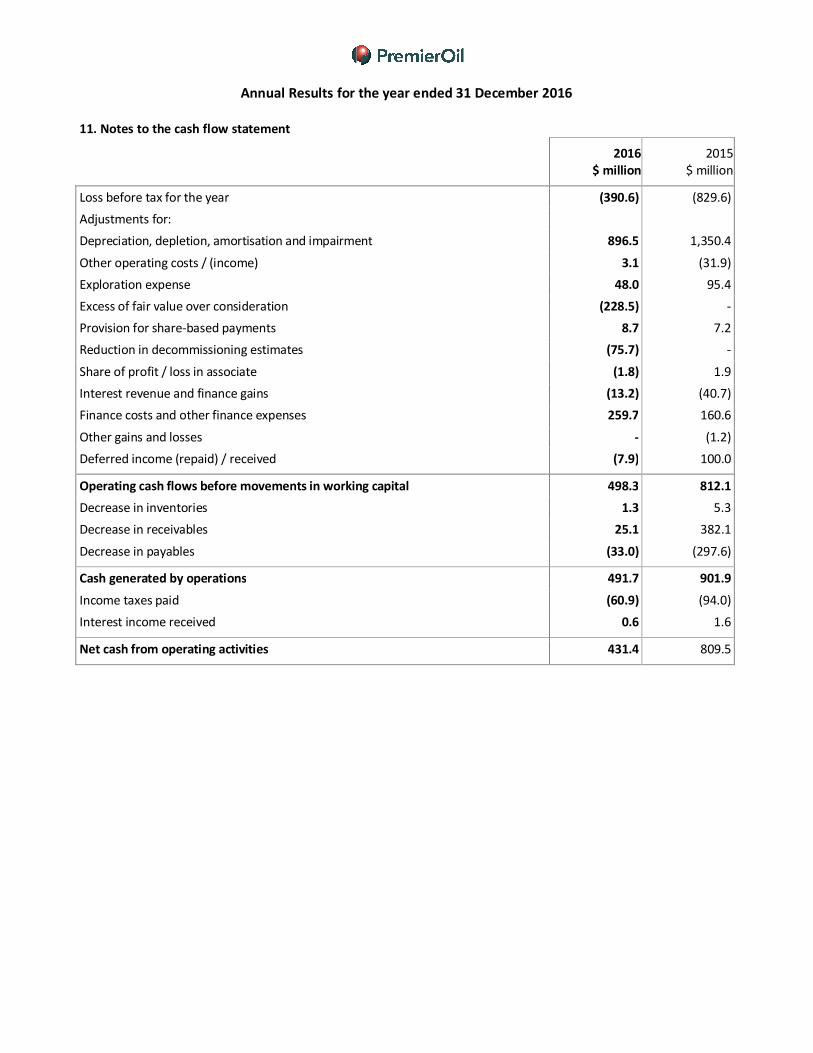
Annual Results for the year ended 31 December 2016
11. Notes to the cash flow statement
2016
$ million
2015
$ million
Loss before tax for the year (390.6) (829.6)
Adjustments for:
Depreciation, depletion, amortisation and impairment 896.5 1,350.4
Other operating costs / (income) 3.1 (31.9)
Exploration expense 48.0 95.4
Excess of fair value over consideration (228.5) -
Provision for share-based payments 8.7 7.2
Reduction in decommissioning estimates (75.7) -
Share of profit / loss in associate (1.8) 1.9
Interest revenue and finance gains (13.2) (40.7)
Finance costs and other finance expenses 259.7 160.6
Other gains and losses - (1.2)
Deferred income (repaid) / received (7.9) 100.0
Operating cash flows before movements in working capital 498.3 812.1
Decrease in inventories 1.3 5.3
Decrease in receivables 25.1 382.1
Decrease in payables (33.0) (297.6)
Cash generated by operations 491.7 901.9
Income taxes paid (60.9) (94.0)
Interest income received 0.6 1.6
Net cash from operating activities 431.4 809.5

Annual Results for the year ended 31 December 2016
11. Notes to the cash flow statement (continued)
Analysis of changes in net debt:
2016
$ million
2015
$ million
a) Reconciliation of net cash flow to movement in net debt:
Movement in cash and cash equivalents (145.4) 109.5
Proceeds from drawdown of long-term bank loans (435.0) (775.0)
Repayment of long-term bank loans - 300.0
Repayment of senior loan notes - 209.4
Non-cash movements on debt and cash balances (predominantly FX) 57.4 36.1
Increase in net debt in the year (523.0) (120.0)
Opening net debt (2,242.2) (2,122.2)
Closing net debt (2,765.2) (2,242.2)
b) Analysis of net debt:
Cash and cash equivalents 255.9 401.3
Borrowings (3,021.1) (2,643.5)
Total net debt (2,765.2) (2,242.2)
12. Subsequent Events
Refinancing
In February 2017, Premier announced the following:
• Agreement of representatives of its Private Lenders to a long form term sheet, subject to credit approvals
• Agreement of revised key terms between Premier and representatives of its convertible bond holders, sub-
ject to agreement by the Private Lenders
• Proposed amended terms to its retail bonds
In return the lenders will receive a revised security and covenant package, benefits from enhanced economics and
exercise certain governance controls.
The long form term sheet has been circulated to the lenders under the Company’s Revolving Credit Facility (“RCF”),
term loan, Schuldschein and US Private Placement notes (“USPP”) (together the “Private Lenders”) for formal credit
committee approval with lock-up agreements expected to be received during March 2017. Revised financing docu-
mentation will now be finalised with completion of the refinancing currently anticipated by the end of May 2017.

Annual Results for the year ended 31 December 2016
12. Subsequent Events (continued)
Key terms of the refinancing
The RCF, term loan, US Private Placement notes (USPP) and Schuldschein notes.
Proposed amendments have been largely agreed with the Co-ordinating Committee of the RCF Group and repre-
sentatives of the other Private Lenders as follows:
• Confirmation of total existing facilities of US$3.9 billion with drawn capacity preserved
• Alignment of final maturity dates to 31 May 2021
• Amendment of Premier’s financial covenants, currently anticipated to be net debt to EBITDA cover ratio test
to 9.5x until end 2017 reducing to 5.0x at the end of 2018, before returning to 3.0x from the beginning of
2019
• Interest cover ratio reduced to 1.50x before increasing to 3.0x in 2019
• Covenant net debt (which includes issued letters of credit) to be less than US$2.95 billion by end 2018
Enhanced economics for lenders, including:
• A margin uplift of 1.5 per cent over existing pricing with an additional 1 per cent for the Schuldschein lenders
for conversion of their existing bilateral facilities into an English law-based syndicated facility
• Amendment fees of 1 per cent with an additional 0.5 per cent for the Schuldschein lenders
• Equity warrants representing up to 90 million new shares, being 15 per cent of Premier’s issued shares (en-
larged for the potential new issue) at a price of 42.75 pence per share, equivalent to 7.6 per cent dilution
based on the latest closing share price. The warrants will have a five year term. Alternatively, lenders will
have the option to take up synthetic warrants in the form of a deferred fee of comparable value to the equi-
ty warrants. Take-up of the synthetic warrants will reduce the number of new shares to be issued under the
equity warrants
• Crystallisation of the make-whole on the USPP to be calculated at the completion date of the refinancing
A security package which provides priority over unsecured creditors, in addition a portion of the RCF and certain
other debt obligations of up to US$800 million will receive super-senior status.
Certain governance controls including:
• Annual approval of Premier’s overall capex and exploration budgets
• Final sanction of significant new projects
• Certain approval rights in respect of acquisitions and disposals
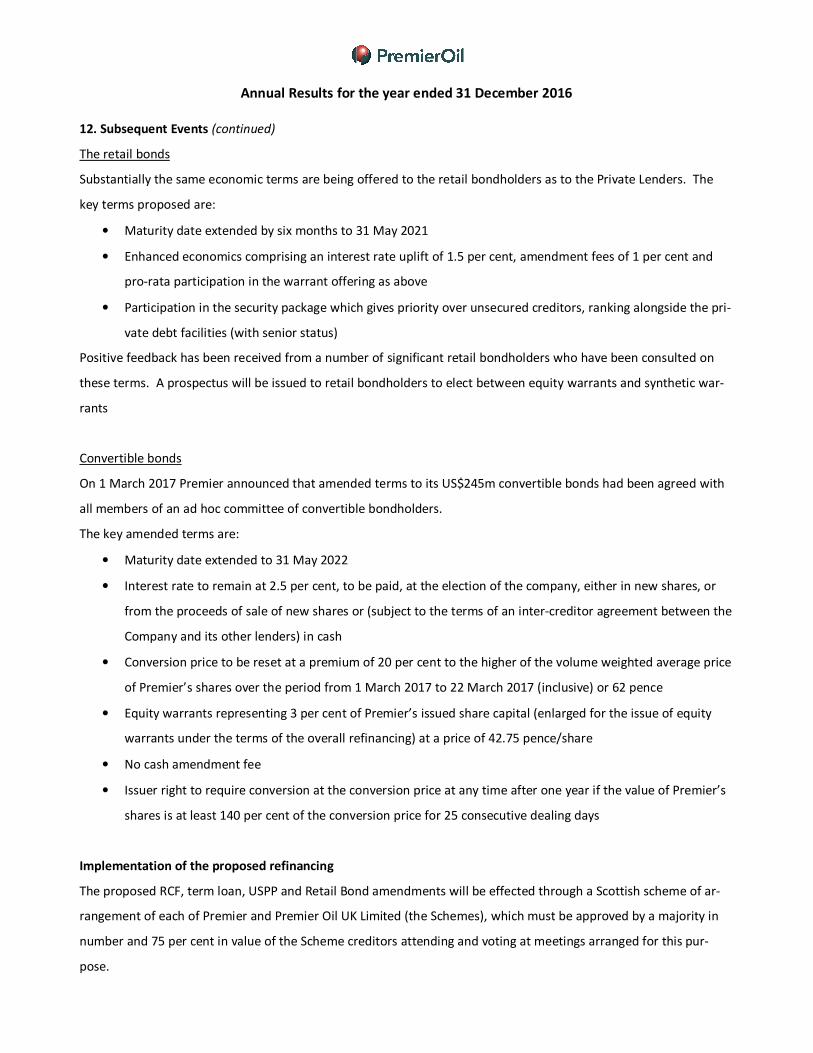
Annual Results for the year ended 31 December 2016
12. Subsequent Events (continued)
The retail bonds
Substantially the same economic terms are being offered to the retail bondholders as to the Private Lenders. The
key terms proposed are:
• Maturity date extended by six months to 31 May 2021
• Enhanced economics comprising an interest rate uplift of 1.5 per cent, amendment fees of 1 per cent and
pro-rata participation in the warrant offering as above
• Participation in the security package which gives priority over unsecured creditors, ranking alongside the pri-
vate debt facilities (with senior status)
Positive feedback has been received from a number of significant retail bondholders who have been consulted on
these terms. A prospectus will be issued to retail bondholders to elect between equity warrants and synthetic war-
rants
Convertible bonds
On 1 March 2017 Premier announced that amended terms to its US$245m convertible bonds had been agreed with
all members of an ad hoc committee of convertible bondholders.
The key amended terms are:
• Maturity date extended to 31 May 2022
• Interest rate to remain at 2.5 per cent, to be paid, at the election of the company, either in new shares, or
from the proceeds of sale of new shares or (subject to the terms of an inter-creditor agreement between the
Company and its other lenders) in cash
• Conversion price to be reset at a premium of 20 per cent to the higher of the volume weighted average price
of Premier’s shares over the period from 1 March 2017 to 22 March 2017 (inclusive) or 62 pence
• Equity warrants representing 3 per cent of Premier’s issued share capital (enlarged for the issue of equity
warrants under the terms of the overall refinancing) at a price of 42.75 pence/share
• No cash amendment fee
• Issuer right to require conversion at the conversion price at any time after one year if the value of Premier’s
shares is at least 140 per cent of the conversion price for 25 consecutive dealing days
Implementation of the proposed refinancing
The proposed RCF, term loan, USPP and Retail Bond amendments will be effected through a Scottish scheme of ar-
rangement of each of Premier and Premier Oil UK Limited (the Schemes), which must be approved by a majority in
number and 75 per cent in value of the Scheme creditors attending and voting at meetings arranged for this pur-
pose.

Annual Results for the year ended 31 December 2016
12. Subsequent Events (continued)
Schuldschein lenders and the convertible bondholders will each consider and, if they so decide, consent to the terms
of the refinancing outside of the Scheme process.
The refinancing will require shareholder approval in respect of the potential issue of the warrant shares and shares
that could be issued as a result of the change to the convertible bond conversion price. The approval will be sought
at a general meeting.
13. External audit
This preliminary announcement is consistent with the audited financial statements of the group for the year-ended
31 December 2016.
14. Publication of financial statements
It is anticipated that the full Annual Report and Financial Statements will be published in April 2017. Copies will be
available from this date at the Company’s head office, 23 Lower Belgrave Street, London SW1W 0NR, and on the
Company’s website (www.premier-oil.com).
15. Annual General Meeting
The Annual General Meeting will be held at the King’s Fund, 11-13 Cavendish Square, London W1G 0AN on Wednes-
day 17 May 2017 at 11:00 am

Annual Results for the year ended 31 December 2016
Glossary
Non-IFRS measures
The Group uses certain measures of performance that are not specifically defined under IFRS or other generally ac-
cepted accounting principles. These non-IFRS measures are EBITDAX, Operating cost per barrel, Net Debt and Li-
quidity and are defined below.
· EBITDAX: Earnings before interest, tax, depreciation, amortisation, impairment, exploration spend and re-
duction in decommissioning estimates. In the current year it also excludes negative goodwill that arose on
the E.ON acquisition. Determined by adjusting operating profit / (loss) for the year. This is a useful indicator
of underlying business performance and is a key metric in the calculation of one of our financial covenants.
· Operating cost per barrel: Operating costs for the year divided by working interest production. This is a use-
ful indicator of ongoing operating costs from the Group’s producing assets.
· Net Debt: The net of cash and cash equivalents and short and long term debt recognised on the balance
sheet. This is an indicator of the Group’s indebtedness, capital structure and a key metric used in the calcu-
lation of one of our financial covenants.
· Liquidity: The sum of cash and cash equivalents on the balance sheet, and the undrawn amounts available
to the Group on our principal facilities, including letter of credit facilities, less our JV partners’ share of cash
balances. This is a key measure of the Group’s financial flexibility and ability to fund day to day operations.
Each of the above non-IFRS measures are presented within the Financial Review with detail on how they are recon-
ciled to the statutory financial statements

Annual Results for the year ended 31 December 2016
OIL AND GAS RESERVES
Working interest reserves at 31 December 2016
Working interest basis
Falkland Islands Indonesia
Pakistan/
Mauritania UK Vietnam Total
Oil
and
NGLs Gas
Oil
and
NGLs Gas
Oil
and
NGLs Gas
Oil
and
NGLs Gas
Oil
and
NGLs Gas
Oil
and
NGLs Gas
Oil, NGLs
and gas
mmbbls bcf mmbbls bcf mmbbls bcf mmbbls bcf mmbbls bcf mmbbls bcf mmboe
Group proved plus probable reserves:
At 1 January 2016 128.0 43.8 2.0 250.4 0.3 79.8 104.1 33.5 17.9 29.4 252.3 436.9 331.9
Revisions1
(1.5) - (0.1) 19.1 (0.1) 11.9 (5.9) (7.6) 10.3 13.4 2.7 36.8 9.7
Discoveries and
extensions – – – – – – – – – – – – –
Acquisitions and
divestments1 – – - - - - 14.0 126.7 - - 14.0 126.7 37.8
Production - - (0.3) (26.1) (0.1) (17.4) (9.0) (16.6) (4.4) (7.2) (13.8) (67.3) (26.1)
At 31 December 2016 126.5 43.8 1.6 243.4 0.1 74.3 103.2 136.0 23.8 35.6 255.2 533.1 353.3
Total Group developed and undeveloped reserves
Proved on production - - 0.9 127.7 0.1 46.8 33.7 54.4 17.2 23.1 51.9 252.0 98.3
Proved
approved/justified for
development 102.8 28.5 0.4 47.3 - - 24.0 33.2 2.3 5.9 129.5 114.9 151.1
Probable on
production - - 0.1 23.7 - 27.5 20.3 37.3 3.0 2.5 23.4 91.0 39.4
Probable
approved/justified for
development 23.7 15.3 0.2 44.7 - - 25.2 11.1 1.3 4.1 50.4 75.2 64.5
At 31 December 2016 126.5 43.8 1.6 243.4 0.1 74.3 103.2 136.0 23.8 35.6 255.2 533.1 353.3
Notes:
1 Revisions to reserves are based on re-evaluation of production performance, drilling results and future plans in Chim Sáo and Dua
(Vietnam); Anoa, Gajah Baru, Pelikan, Naga & Kakap (Indonesia); Catcher Area, Solan, B-Block, Kyle & Wytch Farm (UK), Bhit and
Qadirpur (Pakistan)
2 Discoveries in Laverda are not classified as reserves and do not appear in this table
3 Acquisition of E.ON assets in the UK account for the entire acquisition reserve addition
4 Proved plus portable gas includes 95 bcf of fuel gas reserves
Premier Oil plc categorises petroleum resources in accordance with the 2007 SPE/WPC/AAPG/SPEE Petroleum Resource Management System
(‘SPE PRMS’).
Proved and probable reserves are based on operator, third party reports and internal estimates and are defined in accordance with the State-
ment of Recommended Practice (‘SORP’) issued by the Oil Industry Accounting Committee (‘OIAC’), dated July 2001.
The Group provides for amortisation of costs relating to evaluated properties based on direct interests on direct interests on an entitlement
basis, which incorporates the terms of the PSCs in Indonesia, Vietnam and Mauritania. On an entitlement basis reserves were 332.3 mmboe as
at 31 December 2016 (2015: 315.5 mmboe). This was calculated at year-end 2016, using an oil price assumption equal to US$58bbl in 2017,
US$58/bbl in 2018, US$65/bbl in 2019 and US$75/bbl in ‘real’ terms thereafter.


![Consolidated Financial Results Year ended March 31, 2015 ... · June 30, 2015 Consolidated Financial Results Fiscal Year ended March 31, 2015 [IFRS] April 1, 2014 – March 31, 2015](https://img.pdfslide.us/doc/110x75/5b3be1787f8b9a0e628d3ac2/consolidated-financial-results-year-ended-march-31-2015-june-30-2015-consolidated.jpg)