Embed Size (px)
Citation preview

1
Press Release
Annual Results for the year ended 31 December 2012
Premier Oil plc (“Premier” or “the company”), a leading FTSE 250 independent upstream company,
announces its results for the year ended 2012.
Highlights
Operational
2012 production of 57.7 kboepd (2011: 40.4 kboepd), an increase of 43 per cent;
Huntington field expected on-stream at the end of the month
Reserves and resources increased to 773 mmboe (2011: 513 mmboe), an increase of 51
per cent
Four development projects – Solan, Pelikan, Naga and Dua – achieved final approvals in
2012, on track for first oil/gas in 2014
Significant progress made on the operated Catcher field with the development concept
formally agreed in December and key contract negotiations under way
Successful entry into the Falkland Islands; Sea Lion development planning progressing to
mid-year 2013 concept selection
Play-opening acreage added in Vietnam, Falklands and Iraq; group prospective resources
now in excess of 2.5 bnboe (2011: 1.6 bnboe)
Financial
For the fifth successive year, record profit after tax of US$252.0 million (2011: US$171.2
million), an increase of 47 per cent
Operating cash flow of US$808.2 million (2011: US$485.9 million), an increase of 66 per
cent
Subject to AGM approval, initial dividend payment of 5 pence per share (2011: nil),
reflecting confidence in strong rising cash flows
Year-end net debt of US$1,110.4 million (2011: US$744.0 million) with stable gearing of 36
per cent (2011: 36 per cent)
Cash and undrawn facilities (including letters of credit) of US$1.1 billion (2011: US$1.1
billion) with extended debt maturities

2
Outlook
2013 production guidance of 65-70 kboepd re-affirmed; run rate of 75 kboepd once
Huntington and Rochelle on-stream
Key project milestones expected in 2013, including completion of the first phase of Solan
development drilling, final sanction of the Catcher project and concept selection for the Sea
Lion project
15 firm exploration and appraisal wells planned for 2013; five high impact wells targeting in
excess of 150 mmboe, including Luno II (spudded); Matang and Bonneville well results
expected imminently
Maturing play-opening prospects in Kenya, Norway, the Falkland Islands and Iraq for
2014/15 drilling
Simon Lockett (Chief Executive), commented:
"Premier has built a strong asset portfolio which will act as a springboard for significant further
growth over the medium-term. We have a number of development projects coming on-stream in the
short-term, an exploration portfolio with increasing materiality and another key leg to our business
as a result of our entry into the Falkland Islands.
Over the last seven years, our team has transformed the size and profitability of our business; the
strategy we put in place in 2005 has delivered this growth. The next three years will see a further
transformation of the business as we increase production and generate significantly greater cash
flows."
Mike Welton, Chairman Simon Lockett, Chief Executive Officer
21 March 2013
ENQUIRIES
Premier Oil plc Tel: +44 (0)20 7730 1111
Simon Lockett
Tony Durrant
Pelham Bell Pottinger Tel: +44 (0)20 7861 3232
Gavin Davis
Henry Lerwill
A presentation to analysts and investors will be held at 10.00am today at the offices of Premier Oil’s Falkland Islands Business Unit, 157-197 Buckingham Palace Road, London SW1W 9SP. A live webcast of this presentation will be available via Premier’s website at www.premier-oil.com.
Disclaimer This results announcement contains certain forward-looking statements that are subject to the usual risk factors and uncertainties associated with the oil and gas exploration and production business. Whilst the group believes the expectations reflected herein to be reasonable in light of the information available to it at this time, the actual outcome may be materially different owing to factors beyond the group’s control or otherwise within the group’s control but where, for example, the group decides on a change of plan or strategy. Accordingly, no reliance may be placed on the figures contained in such forward-looking statements.
Annual Results for the year ended 31 December 2012
3
CHAIRMAN’S STATEMENT
The industry context
2012 was a year of difficult macroeconomic conditions and depressed capital markets. The
energy industry, however, has performed strongly and continues to present opportunities for
growth. Signs of recovery in western economies and world financial markets are at an early
stage, but it is encouraging to start 2013 on a stronger note. Commodity prices have remained
remarkably stable, providing a healthy backdrop for continuing investment and new
opportunities. Although costs are rising in some areas, good projects are still earning attractive
rates of return.
Premier's performance
Premier has again achieved strong growth in the value of the underlying assets of the
business. In 2012 we increased production by 43 per cent, cash flow by 66 per cent and report
record profitability for a fifth successive year. Reserves and resources now amount to 773
million barrels of oil equivalent (mmboe) compared to 513 mmboe at the end of 2011. Four
new projects also received development approval during the course of the year. While we
invested in excess of US$250 million in acquisitions and US$772 million in development and
exploration projects during the year, balance sheet gearing remained stable at 36 per cent and
is well within our target range. We continue to have good access to several sources of debt
capital, both reducing our average cost of debt and extending its maturity. This strong
operational and financial performance supports continuing investment in new opportunities, an
increasingly material exploration programme and the initiation of a dividend payout for the year.
Premier's growth plans
Building on the new fields which came on-stream in Indonesia and Vietnam in late 2011, 2012
saw a significant increase in group production. 2012 average production of 57.7 thousand
barrels of oil equivalent per day (kboepd) will rise to a run rate of around 75 kboepd as two new
fields, Huntington and Rochelle, come on-stream. Looking further ahead, we have made
significant steps in progressing the Solan and Catcher projects, which are expected on-stream
in 2014 and 2016 respectively. These new fields, together with our existing producing areas,
will underpin our medium-term production target of 100,000 boepd.
We continue to invest in new project opportunities where we see the potential for attractive
returns for shareholders. We are delighted to have secured the operatorship and a large equity
interest in the Sea Lion field in the Falkland Islands. Our project team is already working
closely with both the Falkland Islands and the UK Governments to deliver an approved
development plan by the middle of 2014. We also look forward to our first exploration
Annual Results for the year ended 31 December 2012
4
campaign in the Falkland Islands which further builds up our increasingly material drilling
programme.
Our 2012 exploration programme delivered successes in the UK, Pakistan and Indonesia.
These are valuable additions to the portfolio due to their proximity to existing producing assets.
In the UK Central North Sea, our exploration drilling programme attempted to replicate the
successes we had in the Catcher area in previous years. However, with the exception of the
Carnaby discovery in a new play area west of the Catcher development, the programme was
unsuccessful. This serves to underline the necessity, as we grow our production and
development asset base, to identify new basin opportunities for future exploration away from
the more mature areas in the North Sea and South East Asia. Our exploration and new
venture teams have done an excellent job in identifying and negotiating entry into such
opportunities offshore Kenya, in the North Falklands Basin, in the Phu Khanh basin in Vietnam,
in the Mandal High area in Norway and in Southern Iraq. Over the course of 2012, the team
added approximately 1 billion barrels of oil equivalent (bnboe) of prospective resources to the
portfolio. We look forward to maturing these for drilling over the next two to three years.
Success in any of these locations, because of the nature of their play-opening potential, will be
transformational for Premier.
Focus of the Board
As the group and its scope of operations expand, the Board has taken a number of initiatives to
ensure longer-term plans can be delivered successfully. A comprehensive strategy review
incorporating asset profiles, capital allocation and funding plans was completed in the first half
of 2012 and has been reviewed again by the Board in the first quarter of 2013.
Significant progress has been made in the way in which risks are identified, analysed and
mitigated throughout our operations, reporting back to the Board via the Audit and Risk
Committee. The Board's Nomination Committee has, with the help of the senior management
team, taken new initiatives in succession planning, career development and competency
programmes. Members of the Remuneration Committee have held a number of meetings with
key shareholders and advisory bodies to ensure that our remuneration policies achieve an
appropriate balance between reward for our investors and incentives for our employees. At the
Board level, we continue to devote significant time to the management of the critical issues of
health, safety and the environment. The group's improving record in all of these areas is
testament to this effort. However, the tragic accident in December in which a crew member on
an emergency standby vessel close to our Balmoral facilities lost his life in extreme weather, is
a sad reminder of the need for constant vigilance and determination by all industry participants.

Annual Results for the year ended 31 December 2012
5
Returns to shareholders
We recognise that the upstream industry is a sector in which substantial capital growth can be
achieved by companies focused on short-term exploration success. Such exploration activity
yields potentially attractive but inconsistent returns. It is our objective to provide investors with
consistent growth, above that of the major companies in our industry, but with the potential for
higher returns through our exploration activities.
Premier's share price today stands higher than at 1 January 2012 and over a five-year period
has significantly outperformed the FTSE AII Share Oil and Gas Producers Index. However, we
recognise that the share price has not kept pace with the growth in value of the underlying
assets of the business. The onus is on the Board and the executive team to deliver on our
growth plan and to demonstrate an improved return on our exploration programme, so that a
higher market rating will be achieved.
The Board has also considered again our policy in respect of shareholder distribution. As
foreshadowed at the Annual General Meeting in May 2012, the Board intends to propose a
2012 dividend of five pence per share, to be approved by shareholders at the June 2013
Annual General Meeting. The level of future payouts will depend on the progression of cash
flow over time and the capital required to fund our investment opportunities, but the Board
believes that the payment of a sustainable dividend underlines our confidence in rising cash
flows, the strength of our balance sheet and the quality of our asset base. It is a reward too for
the loyalty of our shareholders. We also thank our employees, all of whom participate as
shareholders through our employee long-term incentive plans, for all of their hard work in 2012.
We all look forward to 2013 and the continuing growth in the company as it achieves its
medium-term aspirations.
Mike Welton
Chairman

Annual Results for the year ended 31 December 2012
6
CHIEF EXECUTIVE’S REVIEW
Business model
We focus on growing the underlying value of the business through disciplined investment in
high quality projects. Our skill set and experience give us the confidence and capability to take
on complex operated development projects, typically offshore and utilising floating production
systems. We believe in offering our investors and our employees continuing growth
opportunities reflected in rising production targets. We will judge ourselves, and invite others to
judge us, by the growth in our net asset value (NAV) per share year-on-year without relying on
a rising oil price. We target in excess of 10 per cent NAV growth per share per year and, over
the seven-year period to end-2012, have achieved in excess of 15 per cent. Going forward we
will source this growth from the development of existing assets, new acquisitions and material
organic exploration, while maintaining a strong balance sheet so that we are well-placed to take
advantage of attractive opportunities as they arise.
Our achievements over time
In the five-year period since 2007, we have generated impressive growth in all key financial and
operational metrics which define our business. Our growing undeveloped reserves and
resource base will support substantial future growth.
Growth
2007 – 2012 (%) Annualised (%)
Revenues 144 19.5
Cash flow 200 24.6
Production 61 10.0
Reserves and resources 109 15.9
Return on capital 98 14.6
Our growth rates have significantly exceeded the 54 per cent rise in the oil price over the same
five year period. The majority of this growth has been financed by the re-investment of
internally generated cash flows or new debt funding. With some US$1.1 billion of cash and
undrawn facilities on hand and a gearing ratio stable at 36 per cent, our balance sheet
continues to provide a strong platform for further material growth.

Annual Results for the year ended 31 December 2012
7
Our operations in 2012
Reservoir performance from all our producing fields in 2012 was encouraging and generated a
43 per cent increase in working interest production year-on-year.
Production (boepd)
Working interest Entitlement
2012 2011 2012 2011
Indonesia 14,200 11,450 8,800 8,600
Pakistan 15,600 15,100 15,600 15,100
Mauritania 600 650 500 550
UK 12,100 10,300 12,100 10,300
Vietnam 15,200 2,900 14,600 3,100
Total 57,700 40,400 51,600 37,650
Well productivity was supported by improved facility uptime in the UK, Indonesia and Pakistan.
We continue to work on the re-development of the Kyle field in the UK which has been shut
down since December 2011 following a severe North Sea storm. The supply of additional gas
to the Indonesian domestic market which would have generated further gas sales remains
under discussion with the Indonesian authorities. These two factors reduced 2012 production
by around 4,000 boepd, though value will be recovered by a combination of insurance
proceeds and future production. Equipment issues at our Chim Sáo field in Vietnam, notably
with power supply, prevented the full application of water injection, limiting our production rates
from the field. This is being addressed and overall the field continues to produce above the
level originally anticipated in our field development plan.
First oil from the Huntington field is expected at the end of March, in line with our 2013 budget.
After a ramp up period, the field is expected to produce 25-30 kboepd (gross), following a
successful development drilling programme. The smaller Rochelle field (Premier share: 15 per
cent) is now expected on-stream around mid-year after storm damage to the initial
development well. The rig is currently drilling the Rochelle West well and will return to Rochelle
East after first gas.
Further significant milestones were achieved within our development portfolio during the year,
especially on our operated development projects. The Pelikan and Naga projects, which will
sustain and grow our position in the Singapore gas market, received development approvals
and will add to existing volumes in the Natuna Sea from 2014 onwards. The Dua and Solan
fields received project sanction during the course of the year and are progressing well towards
first oil in 2014. On our operated Catcher development in the UK North Sea, concept selection
was formally agreed in December and various tenders are now under way for key contracts.
We expect to submit the field development plan for approval to the UK Government once these

Annual Results for the year ended 31 December 2012
8
tender processes are complete. Targeted first oil date will be driven by the contract negotiation
process, notably for the floating production, storage and offtake vessel (FPSO). Elsewhere, we
increased our equity interest in the Bream area in Norway and are working with the revised
partnership group to finalise development plans. In Mauritania, the partnership submitted a
development plan for the Banda gas field, though this remains subject to final agreement on a
gas sales contract.
Investment in the Falkland Islands
In line with our stated strategy, we were delighted to acquire operatorship and a significant
equity interest in the Sea Lion development project in the Falkland Islands during the course of
the year. With some 350 million barrels of appraised oil, a clear fit with our development skills
and an attractive fiscal regime, this is a substantial opportunity for Premier. It is also exciting to
work in an environment where there is such strong support from both the Falkland Islands and
the UK Governments. The location of the islands raises logistical and infrastructure
challenges. However, the resourcefulness of our own project team members and that of the
Falkland Islanders gives us every confidence that these can be more than adequately
addressed. Building on the work that our partner Rockhopper Exploration plc (Rockhopper)
had already commenced, we expect to make key development concept decisions during the
course of 2013, with final development approval targeted for mid-2014. This should facilitate
first oil from the Sea Lion field during 2017. Whilst the geology of the North Falklands Basin is
complex, we also see a large number of prospects and leads which offer potential for future
exploration. We are working closely with the Rockhopper team to define the targets for the
next exploration programme, now expected in late 2014 or early 2015.
Reserves and resources
The Falkland Islands transaction contributed significantly to a 51 per cent increase in reserves
and resources year-on-year. While the Sea Lion field has been fully appraised, our reserve
booking policy dictates that resources associated with the field will not be booked into the
reserves category until further development milestones have been achieved.
As at 31 December 2012, proven and probable (2P) reserves, on a working interest basis, were
292 mmboe (2011: 284 mmboe) giving a reserve replacement ratio of 134 per cent.
Proven and probable (2P) reserves
(mmboe)
2P reserves and 2C contingent resources
(mmboe) 1 January 2012 284 513 Production (21) (21) Net additions and revisions 29 281 31 December 2012 292 773

Annual Results for the year ended 31 December 2012
9
The percentage of liquids in total reserves and resources has increased to 67 per cent (2011:
51 per cent). Given that the price we receive for our Indonesian gas volumes exported to
Singapore is linked to oil prices, around 88 per cent of our resource base is effectively oil-price
driven. Our current development portfolio is dominated by oil-based projects.
Exploration
Premier's exploration programme over time has generated notable successes. Indeed, the
largest projects in our portfolio - our gas reserves in the Natuna Sea, our Chim Sáo oil field in
Vietnam, our Catcher field in the UK - come from Premier exploration drilling initiatives. In
2009 we set a goal of adding 200 mmboe of net 2P reserves over a five-year period. Based on
discoveries to date, the follow-on potential which they have generated and the programme still
to come, we are confident that this objective will be achieved.
We added four discoveries to the portfolio during 2012. The Carnaby discovery adds additional
reserves on the Catcher block and is encouraging for the ongoing exploitation of the smaller
accumulations around the Catcher field itself. The Catcher area near-field exploration has
commenced in 2013 with the drilling of the Bonneville prospect. The Anoa Deep well,
underneath our existing Anoa facilities in the Natuna Sea, opened up a new play, the Lama
play, which extends across a wide area within Premier's Natuna Sea acreage. Plans to follow
up on this success with a new drilling campaign in 2014 and 2015 are advanced. In Pakistan,
two notable successes were recorded with the K-30 well on the Kadanwari lease and the BBN-
1 well on the Badhra field. These two discoveries added 116 billion cubic feet (bcf) (gross) and
have both been brought into production post-discovery.
However, we recognise the need to update the portfolio as prospects are drilled out and as
areas like the UK North Sea become mature. This is why we have taken steps to add new
areas in Kenya, Iraq, the Falkland Islands, deeper water acreage in Vietnam and the Mandal
High area in Norway. We believe in targeting play-opening opportunities which, on success,
will deliver not just one discovery but will open up a series of prospects and leads. Success in
any of these areas would lead to multiple opportunities and reduced risk over time. Such new
acreage additions in 2012 were significant with a total of 30 new licences, amounting to net
acreage gain of 11,800 km2.
In 2013, Premier plans to drill 15 exploration and appraisal wells. This includes five high
impact exploration wells targeting in excess of 150 mmboe, including the Luno II well which is
currently drilling on the south west margin of the Utsira High, and the Lacewing well, Premier’s
first high pressure high temperature well in the North Sea. In addition, we look forward to the
results of the Kuda Laut and Singa Laut wells in Indonesia and the Ca Voi exploration well in
Vietnam. The latter is a true frontier exploration well with the potential to open up a new play in

Annual Results for the year ended 31 December 2012
10
Eastern Vietnam. We also hope to replicate our near field exploration success achieved in
2012 by the drilling of six near field wells in 2013, including the Matang well in Indonesia and
the Bonneville well in the UK North Sea, both of which are currently drilling.
Our organisation
We continuously review the structure of our organisation to get the most out of our assets and
to optimise project delivery. During 2012 we reorganised our teams into six country units - UK,
Norway, Indonesia, Vietnam, Pakistan and the Falkland Islands - reflecting the growing critical
mass of those units and the need to have strong local presence in all our key business areas.
At the same time our exploration teams now report directly to a central exploration function,
pulling together all the technical skills in the group into one team and allowing us to make better
informed choices about where to allocate our exploration funds. We continue to believe that
our organisational model - strong local units supported by a head office team, focused on
critical decision points - will deliver our ambitious medium and long-term goals.
Annual Results for the year ended 31 December 2012
11
BUSINESS UNIT REVIEWS
FALKLAND ISLANDS
Premier's entry into the Falkland Islands was completed in Q4 2012. Our primary focus
is to develop the estimated 300 mmboe Sea Lion field, currently targeted for project
sanction mid-2014. Working closely with Rockhopper, we have also defined the lead
and prospect inventory such that a minimum of three exploration wells are now planned
for 2014/2015.
Development
In July 2012, Premier agreed to farm-in to 60 per cent of Rockhopper’s licence interests in the
Falkland Islands, including the Sea Lion development project. Following the approval of the
Falkland Islands Government, the deal was completed in October with an initial cash payment
of US$231 million. In addition, Premier will pay an exploration carry of up to US$48 million and,
subject to field development plan approval, a development carry of up to US$722 million.
These are fully-funded from a combination of existing cash resources, facilities and cash flow
from operations. Premier and Rockhopper also agreed jointly to pursue exploration
opportunities in the Falkland Islands and analogous plays in selected areas offshore Southern
Africa.
The Sea Lion field is located on the Falklands Plateau, 220 kilometres north of the Falkland
Islands and lies in 450 metres of water. The geological setting is a north-south Atlantic failed rift
with primarily early Cretaceous to Tertiary fill in a typical half graben structure with a large
bounding fault in the east. The Sea Lion accumulation is close to the eastern margin. Stacked
Early Cretaceous lacustrine fan reservoirs contain waxy 28 degree API crude oil. Oil-in-place is
estimated to be over 1.1 billion barrels with 300 million barrels (gross) recoverable. Including
the discoveries at Casper and Casper South, the transaction added approximately 230 million
barrels of net contingent resources.
The Sea Lion field is expected to be developed by drilling and completing subsea wells in
manifold clusters tied back via flexible risers to an anchored FPSO. Water injection and gas
and produced water handling facilities will be provided on the FPSO. Gas will be used for fuel
or re-injected to boost recovery. Shuttle tankers will collect the crude oil and ship to
international markets. Gross estimated capital expenditure costs remain unchanged at US$5
billion. Premier will fund its share from rising cash flows.
On 1 November, Premier formally became operator of all of the licence interests previously
operated by Rockhopper, thereby becoming the operator of the Sea Lion development project.
A new dedicated project team is undertaking detailed planning of development drilling and the
specification and sourcing of production facilities prior to commencing front-end engineering
design. Notably, an FPSO market enquiry, which included visits to ship yards, has been

Annual Results for the year ended 31 December 2012
12
undertaken to assess options of conversions or new builds to meet the design life criteria.
Technical reviews have also been undertaken to study the option of gas lift instead of hydraulic
submersible pumps while design studies of flow line systems have been completed. Health,
safety and environmental management plans are being set to safeguard the development and
operations phases. Concept selection is targeted for mid-2013 while project sanction is planned
for mid-2014 with first oil targeted for Q3 2017. Once on-stream, the Sea Lion development is
expected to add 50,000 barrels of oil per day (bopd) of production net to Premier.
Exploration
Since the announcement of the farm-in in July 2012, Premier has been working closely with
Rockhopper to define the prospect inventory within its acreage in the North Falklands Basin.
To date, we have technical agreement on a programme of between three and six exploration
wells for the next drilling programme, which is targeted for 2014/15, subject to rig availability.
Wells currently included in the proposed programme include play-opening wells targeting
prospects beneath the existing Sea Lion sands, prospects from independent feeder systems
along the east flank of the basin, as well as Sea Lion look-alike prospects.
Premier has received notification from the Falkland Islands Government that licences PL023
and PL024 (Premier interest 60.0 per cent) have been extended to November 2013 pending
further seismic interpretation work and that licences PL003 and PL004 (Premier interest 4.5 per
cent) have been extended to May 2016 with the addition of a one well commitment.
INDONESIA
Our key asset in Indonesia remains the operated Natuna Sea Block A. With both further
development and exploration activity in the area, we are planning to build on our
existing strong share of the Singapore gas market. Through our interests in Block A
Aceh and ongoing programme of exploration new venture work, we are seeking to take
advantage of our long-established relationships and gas marketing expertise to increase
our in-country presence.
Production and development
During 2012, the Premier-operated Natuna Sea Block A (Block A) sold an overall average of
217 billion British thermal units per day (BBtud) (gross) (2011: 161 BBtud) from its gas export
facilities, a 35 per cent increase, due to a full-year of production from the new Gajah Baru
facility and the established Anoa field.
The Anoa facility continued to increase its market share of sales under the first gas sales
agreement (GSA1) delivering 7.5 per cent over its contractual market share of 36.9 per cent. In
addition, three Anoa development wells were drilled and put on production in 2012, adding 36
million standard cubic feet per day (mmscfd) of gas deliverability. The non-operated Kakap
block contributed a further 33 BBtud (gross) (2011: 42 BBtud). Gross liquids production from

Annual Results for the year ended 31 December 2012
13
the Block A Anoa field was steady at an average 2,400 bopd (2011: 2,400 bopd) with a further
3,500 bopd (2011: 3,400 bopd) from Kakap. Overall, production from Indonesia was up
substantially to 14,200 boepd (2011: 11,450 boepd) on a working interest basis.
The Pelikan and Naga projects, also on Block A, were sanctioned in April 2012 and are now in
full execution mode. The contract for the engineering, procurement, construction and
installation of two wellhead platforms and connecting pipelines was awarded in May 2012. The
two projects will involve drilling six new development wells to develop an expected 150 bcf of
gas reserves. First gas will be delivered in 2014 to supply existing Indonesia and Singapore
sales contracts.
In parallel, a major brownfield development project, to upgrade the compression facilities on the
Block A Anoa gas production facility, has also progressed through its first phase. In 2012, two
cantilever deck extensions, housing a new gas compressor and turbine generator, were
fabricated and installed on the Anoa platform. 2013 will see a second major offshore campaign,
during which the existing compression equipment will be reconfigured for low pressure
production. The project, when complete in September 2013, will extend the field plateau for
another three years and develop 200 bcf of gross field reserves.
On the non-operated Block A Aceh, work continued on the gas development project. The focus
has been on improving the economics such that the project can be sanctioned by year-end.
The tendering process for most facilities is complete with current efforts towards securing
higher gas prices with end buyers and the Indonesian Government progressing well. First gas
is targeted for Q3 2015.
Exploration
Premier carried out exploration in five production sharing contracts (PSC) in Indonesia: Natuna
Sea Block A, Kakap, Tuna, Block A Aceh and Buton. In 2012, Premier drilled three exploration
wells on its Indonesian acreage, one of which was successful and opened up a new play.
The Anoa Deep-1 well, drilled as an exploratory tail to the Anoa WL-5X development well,
discovered gas below the Anoa field. The well flowed over 17 mmscf/d of gas from fractured
sandstones of the Lama Formation. The discovery of gas in the Lama sands provides
additional gas resources that can be dedicated to existing gas sales agreements and opens up
a new proven play type which can be pursued across Premier’s Block A and adjacent West
Natuna areas. Prospect development continued in Natuna Sea Block A with the overall
prospect inventory being upgraded through seismic reprocessing on selected prospects and
prospect development in the newly proven Lama play. Premier expects to start to drill out these
prospects in 2014/15.

Annual Results for the year ended 31 December 2012
14
The Biawak Besar-1 well on Natuna Sea Block A was drilled to test a stratigraphic trap which
was assessed on seismic data to have a good possibility of containing gas. Biawak Besar-1
encountered good reservoir development and gas shows but was not deemed commercial.
In the Buton PSC, Premier participated in the Benteng-1 exploration well which was aimed at
discovering oil in limestone reservoirs in the Cretaceous Tobelo formation. While the well was
successful in proving an oil presence in the area with oil shows in the Miocene Tondo
limestones, no commercial oil accumulation was found. Premier and partners will not continue
exploring in the Buton PSC and the licence will be relinquished shortly.
In the Block A Aceh PSC in Northern Sumatra, the Matang-1 exploration well was spudded in
late November 2012. The objective of the Matang-1 well is to discover gas resources in a
Miocene Peutu limestone reservoir. The drilling of the top seal sequence has taken longer than
expected with the results now anticipated by the end of March.
In 2011 exploration wells Gajah Laut Utara-1 and Belut Laut-1 were drilled in the Tuna PSC to
test the Miocene and Oligocene potential of two prospects. The wells did not find commercial
hydrocarbons but, utilising the information gained, two new prospects, Kuda Laut and Singa
Laut, were matured in 2012. These prospects are approved for drilling in 2013 with the Kuda
Laut-1 and Singa Laut-1 wells expected to spud in the second half of the year.
During the year Premier maintained an active programme of exploration new ventures work
aimed at capturing new licences. This work entailed a number of regional basin studies as well
as three formal joint studies carried out in conjunction with the Indonesian Government agency
MIGAS.
NORWAY
Premier was awarded four new exploration licences through the APA 2011 round in
January 2012 and continued to mature a number of prospects towards drill decisions in
2013. The company also built on its acreage position in and around the Mandal High
area through the acquisition of three operated licences, which completed in February
2012, and the award of the Skala exploration licence in the APA 2012 round. In addition,
the company increased its interest in the Bream field development and the adjacent
block at attractive pricing.
Development
In August, Premier acquired a 20 per cent interest in PL407, which contains the Bream field,
and a 40 per cent equity interest in the adjacent PL406 licence on the Norwegian Continental
Shelf. This increased Premier’s share in the Bream project to 40 per cent and the company’s
operated interest in PL406, which contains the Mackerel oil discovery and the Herring
exploration prospect, to 80 per cent. Premier paid an upfront consideration of US$10 million

Annual Results for the year ended 31 December 2012
15
with further payments of up to US$17.5 million contingent upon certain milestones being
reached.
Engineering studies for the subsea systems and wells for Bream were completed during 2012
but the studies carried out for the lifetime extension and upgrade of the FPSO targeted for the
field demonstrated that the vessel was not suitable. The joint venture partnership has
investigated alternative production facility options and a new build vessel has been identified.
Commercial negotiations are underway with the contractor for this vessel and it is expected that
front end engineering studies will start in the second quarter of 2013.
During 2012, Premier completed subsurface evaluations for the Mackerel discovery. Based on
the current results, a subsea tie-back to the Bream FPSO is the most economic solution. An
exploration well on the adjacent prospect, Herring, is also planned to be drilled as part of the
development project.
Project sanction and submission of development plans to the authorities for the Bream
development is expected in early 2014. First oil is targeted for 2017 with an initial production
rate of approximately 14,000 boepd net to Premier.
Elsewhere in Norway, commercial discussions have been held with field owners in the Frøy
area with the intent of developing a central processing hub for a number of discoveries close to
Frøy. This has proved a slow process, however the pace is expected to pick up in 2013 with
equity alignment discussions taking place with the operator of a nearby field.
Exploration
Work continued in 2012 to evaluate the Grosbeak discovery in PL378. The partnership is
participating in an area forum that is evaluating the best way of developing the resources in the
area. In addition, a significant oil discovery (Skarfjell) was made in the adjacent licence in 2012.
Current mapping indicates that a significant portion of Skarfjell extends into PL378 and
preparations for appraisal drilling have been initiated.
In February 2012, Premier completed its acquisition of three operated exploration licences.
These licences are close to Premier’s existing Freki licence and are on the margin of the
Mandal High in the Southern Norwegian North Sea. Evaluation of this acreage has so far
resulted in a drill recommendation being brought forward to our partners in PL539 and we are
awaiting a licence decision shortly. Premier built further on its acreage position in and around
the Mandal High through the APA 2012 Licensing Round in which it was awarded a 20 per cent
operated interest in the Skala exploration licence in January 2013. As a result, Premier now
has access to around 200 mmbbls of net prospective resources on and around the Mandal
High.

Annual Results for the year ended 31 December 2012
16
In the operated licence PL622 a 3D survey was successfully acquired during the summer in co-
operation with PGS.
Looking forward, the Luno II exploration well in PL359 in the North Sea offshore Norway
spudded in March 2013 and the results of the well are expected by the end of April. The well is
looking to prove up the Jurassic reservoir sandstones to the south of the Edvard Greig field and
is targeting a gross mean unrisked prospective resource of 120 mmboe.
PAKISTAN
Natural decline in production from our producing fields in Pakistan has again been more
than offset by successful infill drilling and step-out exploration. Further potential will be
tested during 2013. Premier is also seeking, through a programme of pilot wells at
Kadanwari, to test the tight gas potential in deeper horizons.
Production and development
Average working interest production in Pakistan during 2012 was 15,600 boepd net to Premier,
three per cent higher than in 2011 (15,100 boepd), despite the start of natural production
decline in some existing wells. The higher production was mainly due to successful infill drilling
and the tie-in of exploration and development wells in the Kadanwari and Bhit/Badhra gas
fields.
Production from the Qadirpur gas field was broadly stable in 2012, averaging 3,700 boepd net
to Premier compared to 3,750 boepd in 2011. This was due to the good performance of the
wellhead compressors and to the better than expected support from the extended reach wells
drilled in the northern part of the reservoir. Specifically, the development wells QP-44, QP-45,
QP-46 and HRL-6 were successfully drilled, completed and tied-in to production in 2012 while
QP-48 and QP-49 are currently being drilled. In addition, the Government of Pakistan has
approved a new price for Qadirpur gas, increasing it by 11 per cent, applicable with effect from
December 2012.
Production from the Kadanwari gas field averaged 2,600 boepd net to Premier during 2012, 27
per cent higher than in 2011. This was as a result of sustained production from K-19 and the
increase in field production following the tie-in to facilities of the successful exploration wells K-
27 and K-28 and the K-29 development well.
The pilot programme at Kadanwari to test the tight gas potential in the Lower Goru formation is
ongoing. The K-3 DirB vertical well has been tested and is currently being tied-in to the facilities
while the testing of the K-1 DirA vertical well commenced in January. Six tight sand intervals
were fracked and tested separately at the K-3 DirB well with total initial flow of 3.4 mmscfd
which reduced to 1.8 mmscfd upon clean up. This proved that all the tight intervals in the
Kadanwari area can flow gas after fracking, while the G-Sand and B-Sand have demonstrated

Annual Results for the year ended 31 December 2012
17
relatively better flow potentials. These two intervals are being tested in the K-1 DirA well where
preliminary results are encouraging as the G-Sand flowed 0.5 mmscfd prior to clean up. All
fracked B-Sand intervals also flowed gas to the surface while rates are likely to improve after
further rigless clean up. The G-Sand will be targeted in the K-31H horizontal pilot well in 2013.
The Zamzama gas field produced 5,800 boepd net to Premier during 2012 (2011: 5,800
boepd). This was mainly due to continuous good performance of front-end compressors and
the Zam-8 infill well being tied-in ahead of schedule. Sub-surface studies were completed in
early 2012, following which two infill wells, Zam-8 and Zam-9, were drilled back-to-back in the
second half of the year. While the Zam-8 infill well was tied-in to the system in November, first
gas from the Zam-9 infill well was achieved in January 2013.
Production from the Bhit/Badhra gas fields was stable in 2012, averaging 3,500 boepd net to
Premier. This was mainly due to the successful drilling and tie in of the Badhra B North-1
exploration well. In addition, the Bhit-15 development well, which was spudded on 4 November,
was tied-in to the facilities in January 2013, further helping to offset the natural decline from the
existing wells on the Bhit/Badhra gas fields.
A revised development plan for the Zarghun South gas field was submitted to the Pakistan
Government in May 2012 following certification of 64 bcf of tight gas in the Dunghan formation
and 12 bcf of conventional gas in the Chiltan/Mughalkot formations by independent consultants
DeGolyer and MacNaughton. The revised development plan has been approved for
application of premium ‘Tight Gas Policy’ prices and, as a result, the joint venture commenced
development work on the project early in 2013. All costs pertaining to Premier’s 3.75 per cent
interest in the project are carried by the operator.
Exploration
Two exploration wells, K-30 on the Kadanwari gas field, and Badhra B North-1 (BBN-1) on the
Badhra gas field, were drilled in 2012. Both wells were successful and have subsequently been
tied-in to infrastructure.
The K-30 exploration well was spudded in January 2012 and tested gas with a flow rate of 52
mmscfd through a 60/64 inch choke. The well was tied-in to the system in April 2012.
Following this better than expected result, two more wells are planned in 2013 in the eastern
part of the existing lease.
The BBN-1 well was drilled in September 2012 and made a significant gas discovery in the
Kirthar Foldbelt. The well was drilled to a total depth of 2,450 metres and encountered a new
sand interval, 44 metres thick, in the Mughalkot reservoir formation which tested gas at a flow
rate of 31 mmscfd. The well was tied-in to the Bhit facilities in November. The joint venture has
agreed to drill an appraisal well, Badhra B North-1 West, in Q2 2013 to assess the full potential

Annual Results for the year ended 31 December 2012
18
of the 100 bcf discovery as part of an appraisal programme submitted to the Government. The
planned Badhra-6 development well will be deepened in 2013 to test the potential of the Parh
Limestone. In addition, the Badhra South-1 Deep exploration well will be drilled in 2013 to test
the potential of a deeper lead at the Lower Goru level.
MAURITANIA
Production and development
In Mauritania, 2012 working interest production from the Chinguetti field averaged 600 bopd
(2011: 650 bopd) with a natural decline in the field production.
The undeveloped discovery, Tevet, in PSC B will continue to be held by joint venture partners
till May 2013 while development studies are on-going to make a “develop or drop” decision.
In September 2012, the joint venture submitted an application for grant of an Exclusive
Exploitation Authorisation (EAA) for the Banda field along with a gas field development plan
(FDP) and Declaration of Commerciality to the Government of Mauritania, subject to various
conditions precedent. Subsequently, the Government has approved the FDP and awarded the
EAA in January 2013. Gas sales arrangements and payment guarantees for Banda are
currently under discussion with prospective buyers.
The Tiof discovery was relinquished in November 2012, being sub-commercial, with a request
to the Government that the partnership group is re-engaged in the event of a future satellite
development of the field.
Exploration
The consolidation of Premier’s exploration licences offshore Mauritania was finalised in 2011
with the grant of a new licence, PSC C-10, in which Premier has an equity of 6.23 per cent.
Site surveys were completed over two potential drilling locations, and a final decision on the
candidate for the first of two commitment wells will be made in the first half of 2013. The well is
scheduled for drilling in the fourth quarter of 2013.
Annual Results for the year ended 31 December 2012
19
UNITED KINGDOM
The pipeline of development projects in our UK portfolio will drive continuing growth for
a number of years. Our principal focus will be the successful execution of these
projects. We will also pursue exploration opportunities where the balance of risk and
reward meets in-house objectives.
Production and development
Production from Premier’s UK fields increased to 12,100 boepd compared to 10,300 boepd
during 2011 despite no contribution from the Kyle field. The Banff FPSO, which handles Kyle
production, was damaged during exceptionally bad weather at the end of 2011. Since then it
has been off location while repairs are undertaken. The increased production in the North Sea
can be attributed to significantly higher uptime at the Balmoral facility, positive results from the
Scott field well intervention programme and our increased stake in the Wytch Farm asset.
Production from Premier’s Balmoral area averaged 4,500 bopd during 2012 compared to 3,750
bopd in 2011. An active year of work culminated in a highly successful HSE KP4 audit during
August, in which a significant improvement in overall integrity was noted. Safety performance at
the Premier-operated Balmoral floating production vessel also improved in 2012 with a marked
reduction in incident frequency and severity.
At the end of 2011, Premier increased its equity in the Wytch Farm field to 30.1 per cent.
Upgrades to the process plant and improvements to management systems have facilitated
increased production efficiency. An infill drilling programme commenced in February 2012,
ahead of schedule, and has resulted in the completion of three new wells and seven
workovers.
On the Huntington field the six well development programme was successfully completed in
July 2012 with three of the four producers coming in above expectations. The FPSO Voyageur
Spirit sailed away in September and all five risers have subsequently been installed. Adverse
weather conditions late in the fourth quarter delayed the commissioning and installation
programme. However, the DSV Polaris is nearing completion of the final subsea tie-in in
preparation for first oil, which is anticipated by the end of the month.
On the Rochelle project the subsea pipeline and umbilical installation programme and
upgrades to the host Scott platform were successfully progressed in 2012. The East Rochelle
well, the first of the two development wells, was damaged during a North Sea storm in
February 2013. As a result, drilling operations were suspended safely pending further analysis
and the order of the development wells was reversed with the Prospect rig spudding the West
Rochelle well in February. First gas from the Rochelle field is now expected either at the end of
the second quarter or in the third quarter.
Annual Results for the year ended 31 December 2012
20
Significant progress was achieved on our UK-operated development assets. Premier was
appointed operator of the Solan field, which is located West of Shetland, on 31 January 2012.
The Solan project received full DECC and partner approvals in April 2012 and is now in full
execution mode with all of the significant contracts awarded. The platform is currently being
fabricated in Fife, Scotland while the fabrication of the subsea tank is being undertaken in
Dubai. Phase 1 of the development drilling is on track to commence in April 2013; the heavy lift
installation work is planned for the summer of 2014. First oil is targeted for the fourth quarter of
2014 with an initial production rate of 24,000 bopd (Premier equity 60 per cent).
In January 2012, Premier completed its acquisition of Encore Oil plc which resulted in the
company taking over operatorship of the Catcher project and increasing its stake in the project
to 50 per cent. The development concept, which was formally approved by the joint venture in
December, consists of a leased FPSO with subsea tie-backs. The project has now entered the
design phase and the tender process with the FPSO providers and for the subsea facilities
front end engineering and design (FEED) is under way. The design phase is expected to be
completed in the third quarter of 2013 and it is anticipated that the partnership will move to joint
venture sanction thereafter. Timing of first oil from the Catcher field is dependent on the results
of the FPSO tender process. Premier is currently modelling as the second half of 2016..
Exploration
In 2012, Premier drilled seven exploration wells in the UK North Sea, primarily focused on
extending the successes of previous years’ drilling in the Catcher licence across a wider area
of the Central North Sea basin. This resulted in success with the Carnaby well, the first well
drilled to date on the western part of the Catcher block, which encountered 51 feet of net oil in
excellent quality sandstones. The remaining UK exploration wells that targeted this play in
2012 were either dry or encountered non-commercial discoveries. As a result, the strategy will
now focus exclusively on the prospectivity within the Greater Catcher area. In particular, the
Bonneville well spudded in early March with the results expected shortly.
In addition to Bonneville, Premier will drill one other well, Lacewing, in the UK Central North
Sea in 2013. Lacewing is targeting Triassic reservoirs and is Premier’s first high pressure high
temperature well. In 2012, Premier transferred a 37.2 per cent interest in Block 23/22b to
ConocoPhillips in exchange for a carry for the Lacewing well. As a result, Premier’s retained
equity in the well is 20.2 per cent. The well, which will be drilled using the Maersk Resilient rig,
is expected to spud in April.
In the 27th UK Licensing Round, the company was awarded a total of 12 licences (six
operated), building on our acreage position in the UK North Sea. In particular, Premier was
awarded four operated licences adjacent to the Catcher area, which offer both near-field and

Annual Results for the year ended 31 December 2012
21
deeper exploration potential. In addition, Premier reached an agreement with EnCounter Oil
(the former management team of EnCore Oil plc) jointly to pursue several Mesozoic prospects
and leads, primarily in the Inner Moray Firth. Premier also secured a non-operated licence
interest in the west of Shetland Basin. It is anticipated that the leads and prospects identified on
this newly captured acreage will be matured during 2013, with drilling in 2014 and beyond.
VIETNAM
There is much still to be gained from optimisation of the Chim Sáo and nearby Dua oil
fields. We will continue to test the prospectivity on block 07/03 to the south of Chim Sáo
and look forward to the Ca Voi exploration well in the first half of 2013, a potential play-
opener for the under-explored Phu Khanh basin.
Production and Development
The Premier-operated Chim Sáo field was brought on-stream at the end of 2011 and the first
full year of oil and gas production from the field was accomplished safely. 2012 production from
the field averaged 15,200 boepd (net to Premier), ahead of the original development plans. The
price of oil cargoes sold from the field during the year averaged in excess of US$4.50 per
barrel (/bbl) over Brent.
The Chim Sáo development drilling programme, which comprised nine producing wells and six
injection wells, was completed safely and under budget in April 2012. This programme was
followed by three additional wells aimed at capturing upside resources identified during
development. Two wells were targeted at a fault terrace to the north west of the field: one was
successful and commenced production at approximately 3,000 bopd in August; the second
well, targeting a separate fault segment to the north, was dry. Separately, a third well was
drilled to accelerate production from a shallow reservoir with larger reserves than initially
evaluated and was brought on-stream in September at a rate of about 2,000 bopd.
The Chim Sáo field is currently producing 30 kbopd, some 5 kbopd ahead of expectation at
sanction, with potential for further increases to deliverability when power constraints currently
impacting the FPSO are resolved. The plan is to add power generation capacity to allow the
water injection pumps to sustain reservoir pressure at higher production levels, and the
compressors to export higher volumes of associated gas.
The development of the Premier-operated Dua oil field as a three well subsea tie-back to the
Chim Sáo facilities received partner sanction in the second quarter of 2012 and Prime
Ministerial approval in August. Installation of the main pipeline commenced in February 2013.
The field, which is forecast to average a gross production rate of 8-10 kboepd in the first 12
months, is expected on-stream in 2014.
Annual Results for the year ended 31 December 2012
22
Exploration
In July 2012, Premier agreed to farm-in to the Origin Energy-operated Block 121, in the
northern part of the under-explored Phu Khanh Basin, offshore central Vietnam, for a 40 per
cent working interest. The farm-in received Government approval in February 2013. Premier
will pay its participating interest share in the drilling of the high risk Ca Voi prospect which is
planned for May 2013. The prospectivety of Block 121 centres on the untested Oligocene play
fairway which Premier recognises as being geologically similar to the Cau formation that it has
successfully explored in Blocks 12W and 07/03 in the Nam Con Son Basin.
Immediately after the high risk Ca Voi well, the Ocean General will move to drill CRD-3X, which
will appraise the Cá Rồng Đỏ (CRD) discovery, on Block 07/03. The rig will then move to spud
the wildcat exploration well on the Silver Sillago prospect also on Block 07/03 in mid-2013. The
well, 07-CD-1X, will evaluate the petroleum potential of a new sub-basin within the overall Nam
Con Son Basin. The Ocean General will then move to Indonesia where it will spud the Kuda
Laut well on the Premier-operated Tuna Block.
NEW COUNTRY EXPLORATION
In addition to exploration in the existing business unit areas, Premier looks to open up new
frontier geographies in targeted new countries where the geology is assessed to be similar to
that of the existing business units where Premier has built expertise. The acreage accessed is
dominated by deepwater environments where an exploration success has the potential to
transform the resource base of the company. To date Premier has exposure to frontier
exploration acreage in selected areas of Africa and the Middle East. We continue to evaluate
new areas for potential entry in 2013.
In East Africa, Premier has equity interests in two blocks offshore Kenya, Blocks L10A and
L10B. Processing and interpretation of 2D and 3D seismic data on these blocks continued
throughout 2012, and a new 2,250 km2 3D seismic acquisition programme took place over the
western part of the blocks in late 2012. A prospect inventory is being prepared with a view to
drilling the first exploration well in 2014 or potentially in the fourth quarter 2013.
In November 2012, Premier was formally awarded a 30 per cent non-operated interest in Iraq’s
Block 12. Block 12, an 8,000 square kilometre block in the foreland of the Zagros fold belt up
dip from producing fields, lies in a frontier part of one of the world’s more prolific oil and gas
basins. The forward plan on Block 12 is to reprocess the existing seismic data in 2013 and
then acquire new seismic data in 2014. Subject to the interpretation of the new seismic an
exploration well will be drilled in 2015 or 2016.
In Egypt, following the drilling of the Cherry prospect in the North Red Sea 1 licence in 2011,
Premier has decided to relinquish its equity share of the licence. Premier has also withdrawn

Annual Results for the year ended 31 December 2012
23
from the South Darag block in the Gulf of Suez, due to the lack of formal Government approval
of the licence award.
Premier’s exploration rights in the Daora, Haouza, Mahbes, Mijek and Laguara blocks offshore
the Saharawi Arab Democratic Republic (SADR) remain under force majeure, awaiting
resolution of sovereignty under a United Nations mandated process.

Annual Results for the year ended 31 December 2012
24
FINANCIAL REVIEW
Economic background
Oil prices for the year as a whole were unusually stable, averaging US$111.7/bbl against
US$111.3/bbl for 2011, and trading in a range of US$126.7/bbl to US$88.7/bbl. Premier's
portfolio of crudes traded at a weighted average of US$3.5/bbl premium to Brent, boosted by
favourable prices for our Chim Sáo crude in the Asian markets. Premier's average realisations
for the year were US$111.4/bbl (2011: US$111.9/bbl) influenced by the timing of actual crude
oil liftings. After taking into account the effect of hedging contracts, this reduced to
US$107.5/bbl (2011: US$89.6/bbl).
Average gas prices for the group were US$8.34 per thousand standard cubic feet (mscf) (2011:
US$8.51/mscf). Gas prices in Singapore, linked to High Sulphur Fuel Oil (HSFO) pricing and in
turn, therefore, linked to crude oil pricing, averaged US$18.7/mscf (2011: US$19.5/mscf).
Average prices for Pakistan gas (where only a portion of the contract formulae is linked to
energy prices) was US$4.3/mscf (2011: US$3.8/mscf).
Income statement
Production in 2012 averaged 57.7 kboepd (2011: 40.4 kboepd) on a working interest basis. On
an entitlement basis, which under the terms of our PSCs allows for additional Government take
at higher oil prices, production was 51.6 kboepd (2011: 37.7 kboepd). Working interest gas
production averaged 180 mmscfd (2011: 153 mmscfd) or approximately 54 per cent of total
production.
Total sales revenue from all operations reached a new record level of US$1,408.7 million
(2011: US$826.8 million), driven by higher production and the sustained high oil prices. Cost of
sales rose to US$742.4 million (2011: US$414.9 million). Unit operating costs were US$16.2
per barrel of oil equivalent boe (2011: US$15.9/boe) and amounted to US$342.4 million (2011:
US$235.2 million). The operating costs per boe in Pakistan and Indonesia remained stable,
increased marginally in the UK and were significantly reduced in Vietnam due to one-off
production start up costs in the prior year. Underlying unit amortisation (excluding impairment)
rose to US$16.4/boe (2011: US$13.8/boe) reflecting increased production from Vietnam, which
has a higher amortisation charge per boe compared to the group average.
Exploration expense and pre-licence expenditure costs amounted to US$157.7 million (2011:
US$187.5 million) and US$29.2 million (2011: US$23.0 million) respectively. This includes the
write-off of the following exploration wells: a Chim Sáo North West well in Vietnam; Benteng in
Indonesia, and the Spaniards, East Fyne, Stingray, Cyclone, Bluebell and Coaster wells in the
North Sea. Net administrative costs were US$24.2 million against 2011 of US$25.8 million.
Annual Results for the year ended 31 December 2012
25
Operating profits were US$455.2 million (2011: US$175.6 million). Finance costs and other
charges, net of interest revenue and other gains, were US$107.6 million (2011: US$68.1
million). The increase reflects historically low levels of interest rates on cash deposits,
increased gross debt levels to fund development projects in Asia and the UK, and in the latter
parts of 2012, the US$231 million funding for the acquisition of the Sea Lion discovery in the
Falkland Islands. The charge for the unwinding of the discounted decommissioning provision
increased to US$33.2 million (2011: US$28.3 million) reflecting increased provisions for future
decommissioning as industry cost estimates rise.
Pre-tax profits of US$359.9 million (2011: US$141.5 million) also show a positive adjustment of
US$14.2 million in respect of the group’s commodity hedge portfolio (2011: US$34.0 million).
This represents the unwinding of prior year provisions in respect of our embedded oil hedging
programme, which finished at the end of 2012.
The group tax charge for 2012 is US$107.9 million, an effective tax rate of 30 per cent of our
profit before tax. The group’s theoretical tax rate is close to 50 per cent, a higher taxation rate
in the UK being offset by lower rates in Vietnam and Pakistan. The 2012 tax charge is reduced
as a result of a deferred tax credit in the UK, arising from the Ring Fence Expenditure
Supplement (RFES) allowance and the small field allowance for the group’s Solan field. The
group has an estimated US$1.9 billion of carried forward UK corporation tax allowances, which
will be utilised against UK ring fence profits over time, and are therefore reflected in the
deferred tax asset position at the year end.
Profit after tax is a record US$252.0 million (2011: US$171.2 million) resulting in basic earnings
per share of 47.9 cents (2011: 36.6 cents).
Dividend
The Board is proposing a dividend of five pence per share (2011: nil). This dividend is subject
to shareholder approval at the Annual General Meeting to be held in London on 7 June 2013.
If approved, the dividend will be paid on 14 June 2013 to shareholders on the register as of
17 May 2013.
Cash flow
Cash flow from operating activities was US$808.2 million (2011: US$485.9 million) after
accounting for tax payments of US$233.1 million (2011: US$44.0 million). The higher cash flow
and tax payments reflect increased production in Gajah Baru, Indonesia and Chim Sáo,
Vietnam.

Annual Results for the year ended 31 December 2012
26
Capital expenditure in 2012 totalled US$771.6 million (2011: US$660.5 million).
Capital expenditure (US$ million) 2012 2011
Fields/development projects 569.0 428.1
Exploration and evaluation 187.1 228.2
Other 15.5 4.2
Total 771.6 660.5
The principal field and development projects were Solan, Huntington and Rochelle in the UK,
Naga and Pelikan in Indonesia and Dua in Vietnam, together with drilling and compression
projects in Pakistan.
Exploration and evaluation spend includes costs principally related to the exploration drilling
activities in the UK, Vietnam, Pakistan and Norway.
Acquisitions and disposals
In January, the company completed the acquisition of EnCore Oil plc (EnCore). Shareholders
representing 93.5 per cent of EnCore’s shares elected to take new Premier shares, resulting in
the company paying a total of £14.1 million (US$21.6 million) in cash to EnCore shareholders
and issuing 60,931,514 new Ordinary Shares to those who elected to take the share
alternative.
Prior to completion of the EnCore transaction, the company reached an agreement to on-sell
the 16.6 per cent interest in the Cladhan area, which it acquired via the EnCore acquisition, for
an adjusted consideration of US$52.4 million. This on-sale was completed in March 2012.
In May, Premier agreed to acquire a 20 per cent interest in PL407 and a 40 per cent interest in
the adjacent PL406 licence on the Norwegian Continental Shelf. These interests increased
Premier's share of the Bream development project to 40 per cent and the company’s operated
interest in PL406 to 80 per cent. PL406 contains the Mackerel discovery and the Herring
prospect, which could form part of the Bream area development in the future. Upfront
consideration for the acquisition was US$10.0 million with contingent payments of US$17.5
million payable upon certain project outcomes. The acquisition was completed in July 2012.
Also in July, Premier announced it had agreed to farm-in to 60 per cent of Rockhopper
Exploration plc's (Rockhopper) licence interests in the Falkland Islands, including the Sea Lion
development project. The initial payment was US$231.0 million in cash. In addition, Premier
will pay an exploration carry of up to US$48.0 million and, subject to field development plan
approval, a development carry of up to US$722.0 million. Premier has also agreed to provide

Annual Results for the year ended 31 December 2012
27
additional stand-by funding to complete the project. In the event that Rockhopper chooses to
draw down on this facility, Premier will take an enhanced share of entitlement production and
cash flows from the Sea Lion and related fields. This enhanced share continues until Premier
realises a 15 per cent post tax internal rate of return on its investment. Thereafter cash flows
are shared pro-rata to equity interests. Premier’s investment in Sea Lion and related fields will
be funded from a combination of Premier's existing cash resources and facilities and future
cash flow from operations. Premier and Rockhopper have also agreed to pursue jointly
exploration opportunities in the Falkland Islands and analogous plays in selected areas
offshore Southern Africa. The transaction, accounted for as an asset purchase, was completed
in October 2012.
Balance sheet position
Net debt at 31 December 2012 amounted to US$1,110.4 million (2011: US$744.0 million), with
cash resources of US$187.4 million (2011: US$309.1 million).
Net debt (US$ million) 2012 2011
Cash and cash equivalents 187.4 309.1
Convertible bonds (220.2) (228.2)
Other debt* (1,077.6) (824.9)
Total net debt (1,110.4) (744.0)
* Other debt includes €100.0 million of long-term senior notes, which are valued at year-end US$1.319:€ spot
rate. However these will be redeemed at an average of US$1.397:€ due to cross currency swap arrangements.
In February 2012, additional bank facilities of US$350.0 million were negotiated and a second
issue of senior loan notes was completed. This second issue, with maturities of seven, 10 and
12 years, amounted to US$202.0 million and €25.0 million. A US$175.0 million term bank loan
was repaid during March 2012.
In October 2012, further to an offer from the company, holders representing 98.13 per cent of
the total principal amount of the US$250 million guaranteed convertible bonds due in 2014
(representing a principal amount of approximately US$245.3 million) elected to exchange their
existing bonds for guaranteed convertible bonds due in July 2018. The new bonds have a
conversion price of US$7.00 (£4.34) per share and a coupon of 2.5 per cent. This compares
with the old convertible bonds, which had a conversion price of US$6.69 per share and a
coupon of 2.875 per cent. Following completion of the Exchange Offer, Premier exercised its
right under the terms and conditions of the old bonds to redeem the remaining outstanding
bonds (in an aggregate amount of approximately US$4.7 million) at par plus accrued interest.

Annual Results for the year ended 31 December 2012
28
Cash and undrawn facilities, including letter of credit facilities, were approximately US$1,100
million at 31 December.
Financial risk management
Commodity prices
The Board’s commodity pricing and hedging policy continues to be to lock in oil and gas prices
for a proportion of expected future production at a level which ensures that investment
programmes for sanctioned projects are adequately funded. Where investment requirements
are well covered by cash flows without hedging, it is recognised that there may be an
advantage, in periods of strong commodity prices in locking in a portion of forward production
at favourable prices on a rolling forward 12-18 month basis.
At year-end, therefore 3.0 million barrels of Dated Brent oil were hedged through forward sales
for 2013 at an average price of US$109.0/bbl. This volume represents approximately 25 per
cent of the group’s expected liquids entitlement production in 2013. 48,000 metric tonnes (mt)
of HSFO, which drives our gas contract pricing in Singapore, was subject to collars covering
the period to mid-2013 with a cap of US$500/mt (equivalent to around US$85/bbl). An
additional 96,000 mt have been sold under monthly forward sales contracts for 2013 at an
average price of US$657/mt. These two hedges cover approximately 32 per cent of our
expected Indonesian gas working interest production for 2013.
During 2012, embedded oil price collars and forward oil sales of 3.9 million barrels, and fuel oil
collars and forward sales for 246,000 mt expired at a cost of US$60.7 million (2011: US$119.1
million) which has been offset against sales revenue.
Oil hedge collars are incorporated within the pricing terms of physical off take agreements,
avoiding the requirement to revalue them for accounting purposes. A credit of US$9.6 million
(2011: US$28.0 million) occurred in respect of past mark-to-market provisions for oil hedges,
which have now fully expired.
Foreign exchange
Premier’s functional and reporting currency is US dollars. Exchange rate exposures relate only
to local currency receipts, and expenditures within individual business units. Local currency
needs are acquired on a short-term basis. During the year, the group recorded a gain of
US$1.5 million on such short-term hedging (2011: loss of US$0.4 million). In 2012, the group
also issued €25.0 million long-term senior loan notes which have been hedged under a cross
currency swap in US dollars at a fixed rate of US$1.328:€.
Annual Results for the year ended 31 December 2012
29
Interest rates
Although the group’s borrowing facilities are defined in floating rate terms, a majority of its
current drawings have been converted to fixed interest rates using the interest rate swap
markets. On average, therefore, the cost of drawn bank funds for the year was 4.6 per cent.
Mark-to-market movements on these interest rate swaps amounted to US$2.5 million (2011:
charge of US$6.4 million), which was credited to other comprehensive income.
Cash balances are invested in short-term bank deposits and AAA rated liquidity funds, subject
to Board approved limits and with a view to spreading counterparty risks.
Insurance
The group undertakes a significant insurance programme to reduce the potential impact of
physical risks associated with its exploration, development and production activities. Business
interruption cover is purchased for a proportion of the cash flow from producing fields for a
maximum period of 18 months. Due to exceptionally bad weather in December 2011, the Banff
FPSO – which handled Kyle production – lost its anchors and the risers were severely
damaged, stopping Kyle production for the foreseeable future. A claim for business interruption
insurance and property damage is being negotiated with the underwriters.
Going concern
The group monitors its capital position and its liquidity risk regularly throughout the year to
ensure it has sufficient funds to meet forecast cash requirements. Sensitivities are run to reflect
the latest expectations of expenditures, forecast oil and gas prices, and other negative
economic scenarios. This is done to manage the risk of funds shortfalls or covenant breaches
and to ensure the group’s ability to continue as a going concern.
Despite economic volatility, the directors consider the expected operating cash flows of the
group and the headroom provided by the available borrowing facilities give them confidence
that the group has adequate resources to continue as a going concern. As a result, they
continue to adopt the going concern basis in preparing the 2012 Annual Report and Financial
Statements.
Business risks
Premier’s business may be impacted by various risks leading to failure to achieve strategic
targets for growth, loss of financial standing, cash flow and earnings, and reputation. Not all of
these risks are wholly within the company’s control and the company may be affected by risks
which are not yet manifest or reasonably foreseeable.
Effective risk management is critical to achieving our strategic objectives and protecting our
assets, personnel and reputation and therefore Premier has a comprehensive approach to risk
management.

Annual Results for the year ended 31 December 2012
30
A critical part of the risk management process is to assess the impact and likelihood of risks
occurring so that appropriate mitigation plans can be developed and implemented. Risk
severity matrices are developed across Premier’s business to facilitate assessment of risk. The
specific risks identified by departments, project teams, corporate functions and business units
are consolidated to provide an oversight of key risk factors at each level, from operating level
through business unit management to Executive Committee and the Board.
For all the known risks facing the business, Premier attempts to minimise the likelihood and
mitigate the impact. According to the nature of the risk, Premier may elect to tolerate risk, treat
risk with controls and mitigating actions, transfer risk to third parties, or terminate risk by
ceasing particular activities or operations. Premier has a zero tolerance to financial fraud or
ethics non-compliance, and ensures HSES risks are managed to levels as low as reasonably
practicable whilst managing exploration and development risks on a portfolio basis.
The group has identified its principal risks for the next 12 months as being:
health, safety, environment and security (HSES);
production and development delivery;
exploration success and reserves addition;
host Government – political and fiscal risks;
commodity price volatility;
organisational capability;
joint venture partner alignment; and
financial discipline and governance.
Further information detailing the way in which these risks are mitigated is provided on the
company’s website (www.premier-oil.com)
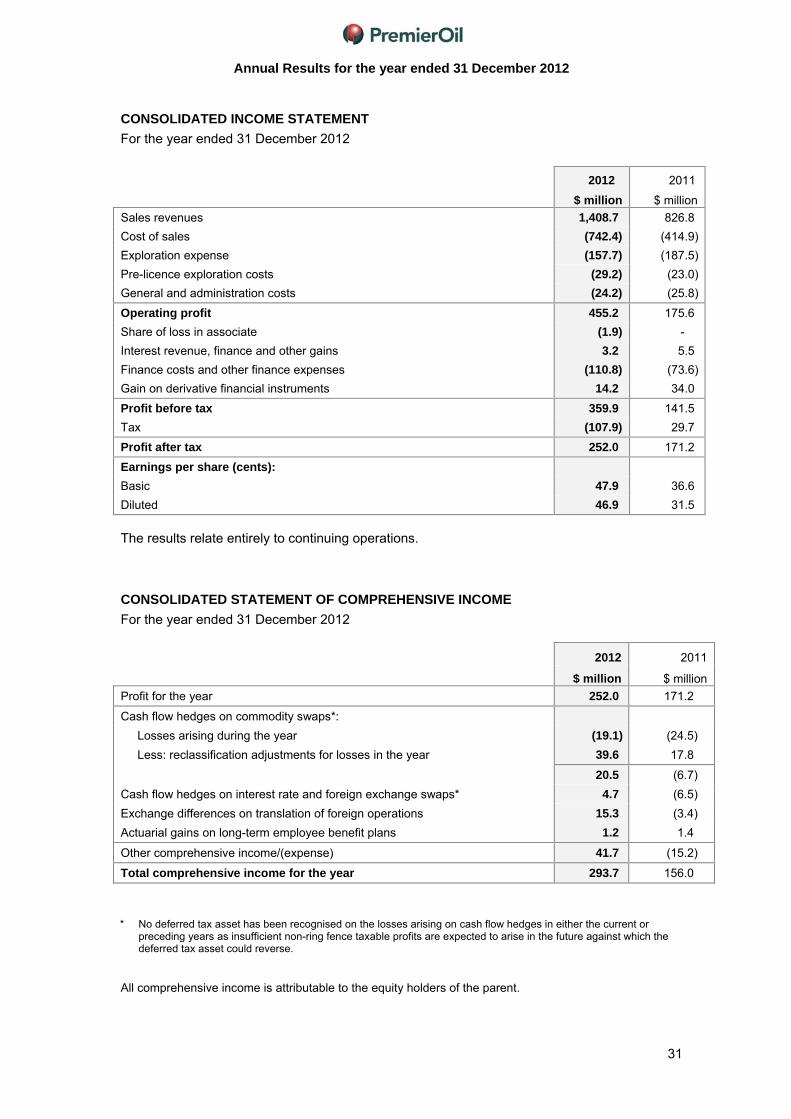
Annual Results for the year ended 31 December 2012
31
CONSOLIDATED INCOME STATEMENT
For the year ended 31 December 2012
2012 2011
$ million $ million
Sales revenues 1,408.7 826.8
Cost of sales (742.4) (414.9)
Exploration expense (157.7) (187.5)
Pre-licence exploration costs (29.2) (23.0)
General and administration costs (24.2) (25.8)
Operating profit 455.2 175.6
Share of loss in associate (1.9) -
Interest revenue, finance and other gains 3.2 5.5
Finance costs and other finance expenses (110.8) (73.6)
Gain on derivative financial instruments 14.2 34.0
Profit before tax 359.9 141.5
Tax (107.9) 29.7
Profit after tax 252.0 171.2
Earnings per share (cents):
Basic 47.9 36.6
Diluted 46.9 31.5
The results relate entirely to continuing operations. CONSOLIDATED STATEMENT OF COMPREHENSIVE INCOME
For the year ended 31 December 2012
2012 2011
$ million $ million
Profit for the year 252.0 171.2
Cash flow hedges on commodity swaps*:
Losses arising during the year (19.1) (24.5)
Less: reclassification adjustments for losses in the year 39.6 17.8
20.5 (6.7)
Cash flow hedges on interest rate and foreign exchange swaps* 4.7 (6.5)
Exchange differences on translation of foreign operations 15.3 (3.4)
Actuarial gains on long-term employee benefit plans 1.2 1.4
Other comprehensive income/(expense) 41.7 (15.2)
Total comprehensive income for the year 293.7 156.0
All comprehensive income is attributable to the equity holders of the parent.
* No deferred tax asset has been recognised on the losses arising on cash flow hedges in either the current or preceding years as insufficient non-ring fence taxable profits are expected to arise in the future against which the deferred tax asset could reverse.

Annual Results for the year ended 31 December 2012
32
CONSOLIDATED BALANCE SHEET
As at 31 December 2012
2012 2011
$ million $ million
Non-current assets:
Intangible exploration and evaluation assets 658.0 315.5
Property, plant and equipment 2,692.9 2,257.8
Goodwill 240.8 -
Investment in associates 6.1 -
Long-term employee benefit plan surplus 4.2 -
Long-term receivables 2.5 -
Deferred tax assets 568.9 500.8
4,173.4 3,074.1
Current assets:
Inventories 34.6 27.7
Trade and other receivables 351.3 389.9
Tax recoverable 87.1 39.5
Derivative financial instruments 9.8 49.1
Cash and cash equivalents 187.4 309.1
670.2 815.3
Total assets 4,843.6 3,889.4
Current liabilities:
Trade and other payables (450.0) (381.2)
Current tax payable (114.9) (146.5)
Short-term borrowings - (183.7)
Provisions (68.8) (35.1)
Derivative financial instruments (43.8) (154.8)
Deferred revenue - (8.4)
(677.5) (909.7)
Net current liabilities (7.3) (94.4)
Non-current liabilities:
Convertible bonds (219.6) (226.5)
Other long-term debt (1,064.4) (626.5)
Deferred tax liabilities (297.1) (219.1)
Long-term provisions – decommissioning (613.3) (565.4)
Long-term employee benefit plan deficit (18.2) (18.6)
(2,212.6) (1,656.1)
Total liabilities (2,890.1) (2,565.8)
Net assets 1,953.5 1,323.6
Equity and reserves:
Share capital 110.5 98.8
Share premium account 649.2 274.5
Retained earnings 1,150.1 922.9
Other reserves 43.7 27.4
1,953.5 1,323.6

Annual Results for the year ended 31 December 2012
33
CONSOLIDATED STATEMENT OF CHANGES IN EQUITY
For the year ended 31 December 2012
Attributable to the equity holders of the parent
Other reserves
Share
capital
Share premium account
Retained earnings
Capital redemption
reserveTranslation
reserves Equity
reserve Total
$ million $ million $ million $ million $ million $ million $ million
At 1 January 2011 98.3 254.8 738.7 4.3 5.2 28.9 1,130.2
Issue of Ordinary Shares 0.5 19.7 (20.0) - - - 0.2
Net sale of ESOP Trust shares - - 2.6 - - - 2.6
Provision for share-based payments - - 34.6 - - - 34.6
Transfer between reserves* - - 7.6 - - (7.6) -
Total comprehensive income - - 159.4 - (3.4) - 156.0
At 31 December 2011 98.8 274.5 922.9 4.3 1.8 21.3 1,323.6
Issue of Ordinary Shares 11.7 374.7 - - - - 386.4
Net purchase of ESOP Trust shares - - (89.3) - - - (89.3)
Provision for share-based payments - - 30.5 - - - 30.5
Incremental equity component of new
convertible bonds - - - - - 8.6 8.6
Transfer between reserves* - - 7.6 - - (7.6) -
Total comprehensive income - - 278.4 - 15.3 - 293.7
At 31 December 2012 110.5 649.2 1,150.1 4.3 17.1 22.3 1,953.5
* The transfer between reserves relates to the non-cash interest on the convertible bonds, less the amortisation of the issue costs that were charged directly against equity.

Annual Results for the year ended 31 December 2012
34
CONSOLIDATED CASH FLOW STATEMENT
For the year ended 31 December 2012
2012 2011
$ million $ million
Net cash from operating activities 808.2 485.9
Investing activities:
Capital expenditure (771.6) (660.5)
Pre-licence exploration costs (29.2) (23.0)
Net cash inflow from acquisition of subsidiaries 4.6 -
Disposal of oil and gas properties 52.4 -
Acquisition of oil and gas properties (267.5) (89.9)
Net cash used in investing activities (1,011.3) (773.4)
Financing activities:
Proceeds from issuance of Ordinary Shares 0.4 0.2
Net (purchase)/sale of ESOP Trust shares (89.3) 2.6
Proceeds from drawdown of long-term bank loans 217.6 33.8
Proceeds from issuance of senior loan notes 235.2 350.7
Debt arrangement fees (5.0) (2.5)
Repayment of long-term bank loans (202.0) (35.1)
Convertible bonds partial repayment/arrangement fee for new bonds (7.9) -
Interest paid (65.6) (54.6)
Net cash from financing activities 83.4 295.1
Currency translation differences relating to cash and cash equivalents (2.0) 1.8
Net (decrease)/increase in cash and cash equivalents (121.7) 9.4
Cash and cash equivalents at the beginning of the year 309.1 299.7
Cash and cash equivalents at the end of the year 187.4 309.1

Annual Results for the year ended 31 December 2012
35
NOTES TO THE PRELIMINARY FINANCIAL STATEMENTS
For the year ended 31 December 2012 1 General information Premier Oil plc is a limited liability company incorporated in Scotland and listed on the London Stock Exchange. The address of the registered office is 4th Floor, Saltire Court, 20 Castle Terrace, Edinburgh, EH1 2EN, United Kingdom. This preliminary announcement was authorised for issue in accordance with a resolution of the Board of Directors on 20 March 2013. The financial information for the year ended 31 December 2012 set out in this announcement does not constitute statutory accounts within the meaning of section 434 of the Companies Act 2006. Statutory accounts for the year ended 31 December 2011 were approved by the Board of Directors on 21 March 2012 and delivered to the Registrar of Companies and those for 2012 will be delivered following the company’s Annual General Meeting (AGM). The auditor has reported on these accounts; the reports were unqualified, did not include a reference to any matters to which the auditor drew attention by way of emphasis of matter and did not contain statements under section 498(2) or 498(3) of the Companies Act 2006. Basis of preparation The financial information has been prepared in accordance with the recognition and measurement criteria of International Financial Reporting Standards (IFRS) adopted for use in the European Union. However, this announcement does not itself contain sufficient information to comply with IFRS. The company will publish full financial statements that comply with IFRS in April 2013. The financial information has been prepared under the historical cost convention except for the revaluation of financial instruments and certain oil and gas properties at the transition date to IFRS. These financial statements are presented in US dollars since that is the currency in which the majority of the group’s transactions are denominated. During the year, management changed the organisational structure of the group and three regional setups were restructured to form seven business units; namely the Falkland Islands, Indonesia, Norway, Pakistan (including Mauritania), the United Kingdom, Vietnam and the Rest of the World. The segmental information for the comparative year has been re-presented to reflect this change. Accounting policies The accounting policies applied in this announcement are consistent with those of the annual financial statements for the year ended 31 December 2011, as described in those annual financial statements. A number of amendments to existing standards and interpretations were applicable from 1 January 2012. The adoption of these amendments did not have a material impact on the group’s financial statements for the year ended 31 December 2012.

Annual Results for the year ended 31 December 2012
36
2 Operating segments
During the year, management changed the organisational structure of the group and the three
regional setups were restructured to form seven business units; namely the Falkland Islands,
Indonesia, Norway, Pakistan (including Mauritania), the United Kingdom, Vietnam and the Rest
of the World. The segmental information for 2011 has been re-presented to reflect this change.
Some of the business units currently do not generate revenue or have any material operating
income.
The group is only engaged in one business of up-stream oil and gas exploration and
production, therefore all information is being presented for geographical segments.
2012 2011
$ million $ million
Revenue:
Indonesia 305.1 300.1
Pakistan (including Mauritania) 175.2 151.6
Vietnam 509.4 121.3
United Kingdom 419.0 253.8
Total group sales revenue 1,408.7 826.8
Interest and other finance revenue 1.7 2.0
Total group revenue 1,410.4 828.8
Group operating profit/(loss):
Indonesia 134.6 142.8
Norway (7.7) (49.1)
Pakistan (including Mauritania) 103.0 102.7
Vietnam 261.7 58.3
United Kingdom 6.7 1.2
Rest of the world (1.9) (40.2)
Unallocated* (41.2) (40.1)
Group operating profit 455.2 175.6
Share of loss in associate (1.9) -
Interest revenue, finance and other gains 3.2 5.5
Finance costs and other finance expenses (110.8) (73.6)
Gain on derivative financial instruments 14.2 34.0
Profit before tax 359.9 141.5
Tax (107.9) 29.7
Profit after tax 252.0 171.2
Balance sheet
Segment assets:
Falkland Islands 242.6 -
Indonesia 692.2 696.2
Norway 253.5 206.8
Pakistan (including Mauritania) 140.7 138.2
Vietnam 705.2 742.9
United Kingdom 2,594.3 1,738.3
Rest of the world 18.0 8.8
Unallocated* 197.1 358.2
Total assets 4,843.6 3,889.4

Annual Results for the year ended 31 December 2012
37
2 Operating segments (continued)
2012 2011
$ million $ million
Liabilities:
Falkland Islands (3.3) -
Indonesia (326.0) (354.8)
Norway (111.9) (107.2)
Pakistan (including Mauritania) (103.3) (104.2)
Vietnam (196.9) (123.8)
United Kingdom (801.4) (668.4)
Rest of the world (19.4) (8.4)
Unallocated* (1,327.9) (1,199.0)
Total liabilities (2,890.1) (2,565.8)
Other information
Capital additions and acquisitions:
Falkland Islands 242.4 -
Indonesia 94.0 154.8
Norway 65.2 76.8
Pakistan (including Mauritania) 28.3 21.0
Vietnam 133.1 185.2
United Kingdom 720.3 439.3
Rest of the world 13.7 20.5
Total capital additions and acquisitions 1,297.0 897.6
Depreciation, depletion, amortisation and impairment:
Indonesia 72.2 43.8
Pakistan (including Mauritania) 27.3 16.2
Vietnam 149.7 26.7
United Kingdom 122.9 93.0
Rest of the world 0.7 0.4
Total depreciation, depletion, amortisation and impairment 372.8 180.1 *
Unallocated expenditure, assets and liabilities include amounts of a corporate nature and not specifically attributable to a geographical segment. These items include corporate general and administration costs, pre-licence exploration costs, cash and cash equivalents, mark-to-market valuations of commodity contracts and interest rate swaps, convertible bonds and other short-term and long-term debt.

Annual Results for the year ended 31 December 2012
38
3 Cost of sales
2012 2011
$ million $ million
Operating costs 342.4 235.2
Stock overlift/underlift movement (17.1) (22.8)
Royalties 44.3 22.4
Amortisation and depreciation of property, plant and equipment:
Oil and gas properties 345.4 203.2
Other fixed assets 6.7 2.8
Impairment charge/(reversal) on oil and gas properties 20.7 (25.9)
742.4 414.9

Annual Results for the year ended 31 December 2012
39
4 Tax
2012 2011
$ million $ million
Current tax:
UK corporation tax on profits - -
UK petroleum revenue tax 83.1 17.2
Overseas tax 137.0 60.1
Adjustments in respect of prior years* (11.9) 70.0
Total current tax 208.2 147.3
Deferred tax:
UK corporation tax (162.2) (222.6)
UK petroleum revenue tax (6.2) 11.0
Overseas tax 68.1 34.6
Total deferred tax (100.3) (177.0)
Tax on profit on ordinary activities 107.9 (29.7) * For 2012, the adjustments in respect of prior years consist principally of a UK tax refund relating to decommissioning
costs incurred and carried back to prior periods. 5 Deferred tax
2012 2011
$ million $ million
Deferred tax assets 568.9 500.8
Deferred tax liabilities (297.1) (219.1)
271.8 281.7
At 1 January
2012Exchange
movements
Acquisition of Encore
Oil plc
(Charged)/ credited
to income statement
At 31 December
2012
$ million $ million $ million $ million $ million
UK deferred corporation tax:
Fixed assets and allowances (221.2) - (132.1) (248.3) (601.6)
Decommissioning 268.3 - 1.3 (16.8) 252.8
Deferred petroleum revenue tax 2.4 - - (3.9) (1.5)
Tax losses and allowances 444.1 - 27.0 390.6 861.7
Small field allowance - - - 45.8 45.8
Deferred revenue 7.2 - - (5.2) 2.0
Total UK deferred corporation tax 500.8 - (103.8) 162.2 559.2
UK deferred petroleum revenue tax1 (3.9) - - 6.2 2.3
Overseas deferred tax2 (215.2) (6.4) - (68.1) (289.7)
Total 281.7 (6.4) (103.8) 100.3 271.8

Annual Results for the year ended 31 December 2012
40
5 Deferred tax (continued)
The group's unutilised tax losses and allowances at 31 December 2012 are recognised to the extent that taxable profits are expected to arise in the future against which the tax losses and allowances can be utilised. In accordance with paragraph 37 of IAS 12 - 'Income Taxes' the group re-assessed its unrecognised deferred tax assets at 31 December 2012 with respect to ring fence tax losses and allowances. The corporate model used to assess whether additional deferred tax assets should be recognised was re-run, using an oil price assumption of Dated Brent forward curve in 2013 and 2014, and US$85/bbl in ‘real’ terms. The results of the corporate model concluded that it was appropriate to recognise all of the group's UK ring fence deferred tax assets in respect of tax losses and allowances in full. In addition to the above, there are non-ring fence UK tax losses of approximately US$327.6 million (2011: US$181.2 million) and current year non-UK tax losses of approximately US$26.9 million (2011: US$69.4 million) for which a deferred tax asset has not been recognised. None of the UK tax losses (ring fence and non-ring fence) have a fixed expiry date for tax purposes. No deferred tax has been provided on unremitted earnings of overseas subsidiaries, following a change in UK tax legislation in 2009 which exempted foreign dividends from the scope of UK corporation tax, where certain conditions are satisfied. On 23 March 2011 it was announced that tax relief on decommissioning expenditure would be restricted to 50 per cent rather than 62 per cent. This restriction was substantively enacted in the 2012 Finance Bill and has resulted in a deferred tax charge to the income statement of US$27.2 million.
At 1
January2011
Exchange movements
(Charged)/ credited
to income statement
At 31 December
2011
$ million $ million $ million $ million
UK deferred corporation tax:
Fixed assets and allowances 14.8 - (236.0) (221.2)
Decommissioning 188.6 - 79.7 268.3
Deferred petroleum revenue tax (3.6) - 6.0 2.4
Tax losses and allowances 138.7 - 305.4 444.1
Unrecognised tax losses and allowances (70.2) - 70.2 -
Deferred revenue 9.9 - (2.7) 7.2
Total UK deferred corporation tax 278.2 - 222.6 500.8
UK deferred petroleum revenue tax1 7.1 - (11.0) (3.9)
Overseas deferred tax2 (183.7) 3.1 (34.6) (215.2)
Total 101.6 3.1 177.0 281.7
1 The UK deferred petroleum revenue tax relates mainly to temporary differences associated with decommissioning provisions.
2 The overseas deferred tax relates mainly to temporary differences associated with fixed asset balances.

Annual Results for the year ended 31 December 2012
41
6 Earnings per share The calculation of basic earnings per share is based on the profit after tax and on the weighted average number of Ordinary Shares in issue during the year. Basic and diluted earnings per share are calculated as follows:
Profit after tax Weighted average number of shares Earnings per share
2012 2011 2012 2011 2012 2011
$ million $ million million million cents cents
Basic 252.0 171.2 526.4 467.4 47.9 36.6
Contingently issuable shares 11.2 - 35.3 75.8 * *
Diluted 263.2 171.2 561.7 543.2 46.9 31.5
* The inclusion of the contingently issuable shares in the 2012 and 2011 calculations produces diluted earnings per share. At 31 December 2012 35,035,495 (2011: 37,349,360) potential Ordinary Shares in the company that are underlying the company’s new convertible bonds and that may dilute earnings per share in the future have been included in the calculation of diluted earnings per shares (2011: anti-dilutive). For 2011, the contingently issuable shares include expected additional share issues due to future share-based payments and for the acquisition of EnCore Oil plc.
7 Intangible exploration and evaluation (E&E) assets
Total
Oil and gas properties $ million
Cost:
At 1 January 2011 310.8
Exchange movements (0.3)
Additions during the year 273.0
Transfer to property, plant and equipment (80.5)
Exploration expense (187.5)
At 31 December 2011 315.5
Exchange movements 11.0
Acquisitions* 322.3
Additions during the year 213.5
Transfer to property, plant and equipment (46.6)
Exploration expense (157.7)
At 31 December 2012 658.0
* Acquisitions in the current year mainly comprises of US$74.6 million relating to the acquisition of EnCore Oil plc (note 10) and US$231.0 million relating to the purchase of a 60 per cent interest in the Falkland Islands Sea Lion development project.
The amounts for intangible E&E assets represent costs incurred on active exploration projects. These amounts are written off to the income statement as exploration expense unless commercial reserves are established or the determination process is not completed and there are no indications of impairment. The outcome of ongoing exploration, and therefore whether the carrying value of E&E assets will ultimately be recovered, is inherently uncertain.

Annual Results for the year ended 31 December 2012
42
8 Property, plant and equipment
Oil and gas properties
Other
fixed assets Total $ million $ million $ million
Cost:
At 1 January 2011 2,692.7 15.7 2,708.4
Exchange movements - (0.1) (0.1)
Acquisitions 124.0 - 124.0
Additions during the year* 493.7 6.9 500.6
Disposals - (0.1) (0.1)
Transfer from intangible E&E assets 80.5 - 80.5
At 31 December 2011 3,390.9 22.4 3,413.3
Exchange movements - 0.7 0.7
Acquisitions** 150.5 - 150.5
Additions during the year* 595.2 15.5 610.7
Disposals - (0.1) (0.1)
Transfer from intangible E&E assets 46.6 - 46.6
At 31 December 2012 4,183.2 38.5 4,221.7
Amortisation and depreciation:
At 1 January 2011 965.6 10.0 975.6
Exchange movements - (0.1) (0.1)
Charge for the year 203.2 2.8 206.0
Impairment (reversal)/charge (25.9) - (25.9)
Disposals - (0.1) (0.1)
At 31 December 2011 1,142.9 12.6 1,155.5
Exchange movements - 0.6 0.6
Charge for the year 345.4 6.7 352.1
Impairment charge 20.7 - 20.7
Disposals - (0.1) (0.1)
At 31 December 2012 1,509.0 19.8 1,528.8
Net book value:
At 31 December 2011 2,248.0 9.8 2,257.8
At 31 December 2012 2,674.2 18.7 2,692.9 * Finance costs that have been capitalised within oil and gas properties during the year total US$13.5 million (2011:
US$26.3 million), at a weighted average interest rate of 5.21 per cent (2011: 5.44 per cent). ** Acquisitions in the current year mainly relate to the acquisition of EnCore Oil plc (note 10).
Other fixed assets include items such as leasehold improvements, motor vehicles and office equipment. Amortisation and depreciation of oil and gas properties is calculated on a unit-of-production basis, using the ratio of oil and gas production in the period to the estimated quantities of proved and probable reserves on an entitlement basis at the end of the period plus production in the period, on a field-by-field basis. Proved and probable reserve estimates are based on a number of underlying assumptions including oil and gas prices, future costs, oil and gas in place and reservoir performance, which are inherently uncertain. Management uses established industry techniques to generate its estimates and regularly references its estimates against those of joint venture partners or external consultants. However, the amount of reserves that will ultimately be recovered from any field cannot be known with certainty until the end of the field's life.

Annual Results for the year ended 31 December 2012
43
8 Property, plant and equipment continued The 2012 impairment charge relates to assets on the Block A Aceh Production Sharing Contract in Indonesia due to application of a higher discount rate. The impairment charge was calculated by comparing the future discounted cash flows expected to be derived from production of commercial reserves (the value-in-use) against the carrying value of the asset. The future cash flows were estimated using an oil price assumption equal to the Dated Brent forward curve in 2013 and 2014, and US$85/bbl in 'real' terms thereafter and were discounted using a discount rate of 12.5 per cent (2011: 10 per cent). Assumptions involved in impairment measurement include estimates of commercial reserves and production volumes, future oil and gas prices and the level and timing of expenditures, all of which are inherently uncertain. 9 Notes to the cash flow statement
2012 2011
$ million $ million
Profit before tax for the year 359.9 141.5
Adjustments for:
Depreciation, depletion, amortisation and impairment 372.8 180.1
Exploration expense 157.7 187.5
Pre-licence exploration costs 29.2 23.0
Provision for share-based payments 10.1 8.5
Share of loss in associate 1.9 -
Interest revenue and finance gains (3.2) (5.5)
Finance costs and other finance expenses 110.8 73.6
Gain on derivative financial instruments (14.2) (34.0)
Operating cash flows before movements in working capital 1,025.0 574.7
Increase in inventories (6.8) (9.1)
Decrease /(increase) in receivables 36.3 (120.2)
(Decrease) /increase in payables (15.1) 82.5
Cash generated by operations 1,039.4 527.9
Income taxes paid (233.1) (44.0)
Interest income received 1.9 2.0
Net cash from operating activities 808.2 485.9
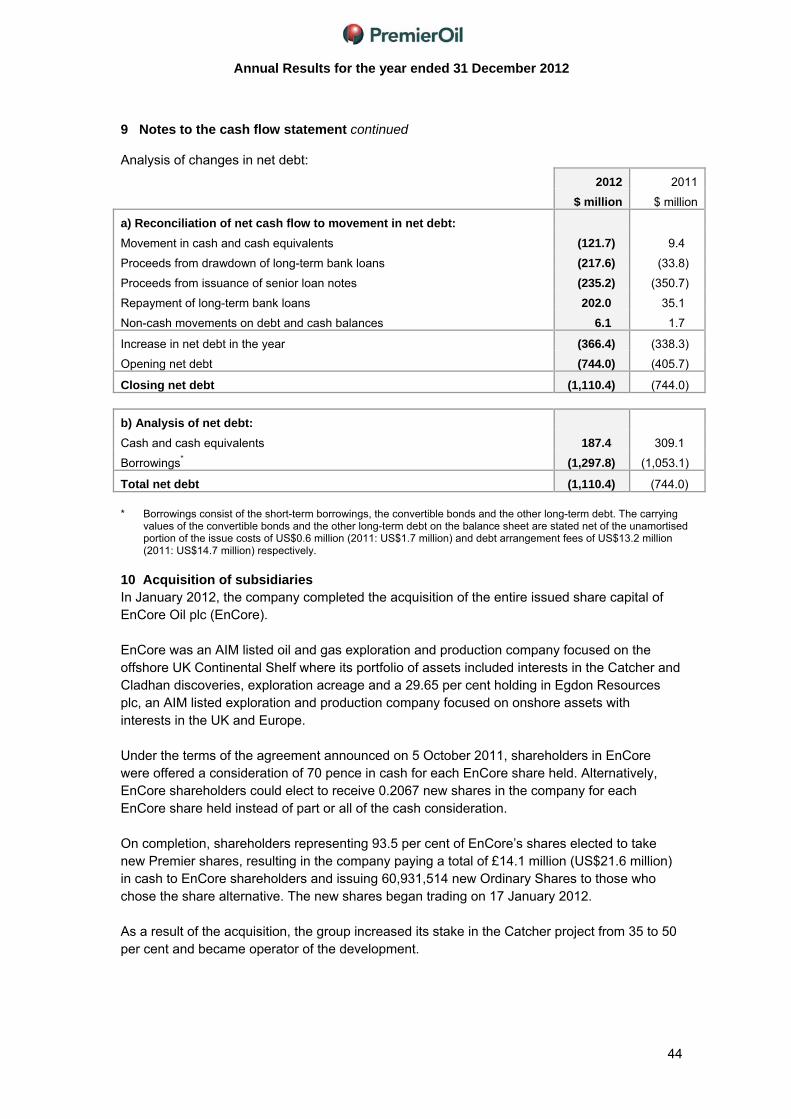
Annual Results for the year ended 31 December 2012
44
9 Notes to the cash flow statement continued Analysis of changes in net debt:
2012 2011
$ million $ million
a) Reconciliation of net cash flow to movement in net debt:
Movement in cash and cash equivalents (121.7) 9.4
Proceeds from drawdown of long-term bank loans (217.6) (33.8)
Proceeds from issuance of senior loan notes (235.2) (350.7)
Repayment of long-term bank loans 202.0 35.1
Non-cash movements on debt and cash balances 6.1 1.7
Increase in net debt in the year (366.4) (338.3)
Opening net debt (744.0) (405.7)
Closing net debt (1,110.4) (744.0)
b) Analysis of net debt:
Cash and cash equivalents 187.4 309.1
Borrowings* (1,297.8) (1,053.1)
Total net debt (1,110.4) (744.0) * Borrowings consist of the short-term borrowings, the convertible bonds and the other long-term debt. The carrying
values of the convertible bonds and the other long-term debt on the balance sheet are stated net of the unamortised portion of the issue costs of US$0.6 million (2011: US$1.7 million) and debt arrangement fees of US$13.2 million (2011: US$14.7 million) respectively.
10 Acquisition of subsidiaries In January 2012, the company completed the acquisition of the entire issued share capital of EnCore Oil plc (EnCore). EnCore was an AIM listed oil and gas exploration and production company focused on the offshore UK Continental Shelf where its portfolio of assets included interests in the Catcher and Cladhan discoveries, exploration acreage and a 29.65 per cent holding in Egdon Resources plc, an AIM listed exploration and production company focused on onshore assets with interests in the UK and Europe. Under the terms of the agreement announced on 5 October 2011, shareholders in EnCore were offered a consideration of 70 pence in cash for each EnCore share held. Alternatively, EnCore shareholders could elect to receive 0.2067 new shares in the company for each EnCore share held instead of part or all of the cash consideration. On completion, shareholders representing 93.5 per cent of EnCore’s shares elected to take new Premier shares, resulting in the company paying a total of £14.1 million (US$21.6 million) in cash to EnCore shareholders and issuing 60,931,514 new Ordinary Shares to those who chose the share alternative. The new shares began trading on 17 January 2012. As a result of the acquisition, the group increased its stake in the Catcher project from 35 to 50 per cent and became operator of the development.

Annual Results for the year ended 31 December 2012
45
10 Acquisition of subsidiaries continued Prior to completion of the EnCore transaction, the company reached an agreement to on-sell the 16.6 per cent interest in the Cladhan area which it indirectly acquired from the EnCore acquisition for an adjusted consideration of US$52.4 million. The buyer also agreed to farm-in to a 50 per cent interest in EnCore's wholly-owned Block 28/10a on a promoted basis whereby it paid 80 per cent of certain well costs and 50 per cent of back costs on the Coaster prospect, which was drilled as part of the company's 2012 drilling programme. The on-sale of these assets was completed in March 2012. The transaction has been accounted for by the purchase method of accounting with an effective date of 16 January 2012, being the date on which the group gained control of EnCore. Information in respect of assets acquired and the fair value allocation to the EnCore assets in accordance with the provisions of IFRS 3 - 'Business Combinations' is as follows:
Fair value
$ million
Net assets acquired:
Intangible exploration and evaluation assets 74.6
Property, plant and equipment 138.8
Investment in associates 7.5
Trade and other receivables 3.4
Restricted cash 7.2
Cash and cash equivalents 19.0
Assets held for sale 52.4
Trade and other payables (30.1)
Deferred tax liabilities (103.8)
Long-term provisions (2.2)
Total identifiable assets 166.8
Goodwill 240.8
Total consideration 407.6
$ million
Satisfied by:
Cash 21.6
Equity instruments (60,931,514 Ordinary Shares) 386.0
Total consideration transferred 407.6
$ million
Net cash inflow arising on acquisition:
Cash consideration 21.6
Less: cash and restricted cash balances acquired (26.2)
Net cash inflow (4.6) These fair values have been finalised based on a detailed review of the exploration portfolio and a reassessment of the Catcher area discoveries in December 2012.

Annual Results for the year ended 31 December 2012
46
10 Acquisition of subsidiaries continued Goodwill arises due to the difference between the fair value of assets and the consideration transferred and also due to the requirement to recognise deferred UK corporation tax liabilities in respect of the difference between assigned fair values and the tax bases of assets acquired and liabilities assumed in a business combination. None of the goodwill recognised is expected to be deductible for tax purposes. All acquisition-related expenses of US$6.9 million incurred by the group in 2011 and 2012 and were included within general and administration costs. 11 Dividends The Board is proposing a final dividend of five pence per share (2011: nil). The dividend is subject to shareholder approval at the Annual General Meeting to be held on 7 June 2013. If approved, the final dividend is expected to be paid on 14 June 2013 to shareholders on the register as of 17 May 2013. The following is the dividend timetable for shareholders’ information: 21 March 2013: 15 May 2013: 17 May 2013: 7 June 2013: 14 June 2013:
Declaration of final dividend Ex-dividend date Record date AGM Dividend payment date
12 External audit This preliminary announcement is consistent with the audited financial statements of the group for the year-ended 31 December 2012. 13 Publication of financial statements A full set of financial statements will be published on or before 30 April 2013. Copies will be available at the company’s head office, 23 Lower Belgrave Street, London SW1W 0NR, and on the company’s website (www.premier-oil.com) by this date. 14 Annual General Meeting The Annual General Meeting will be held at Institute of Directors, 116 Pall Mall, London SW1Y 5ED on Friday 7 June 2013 at 11.00am. 15 Events after the balance sheet date Additional financing In March 2013, the group has negotiated an additional £100 million (US$163.0 million) in the letter of credit facilities, increasing them to £316.0 million (US$515.1 million). This facility will expire in 2015.
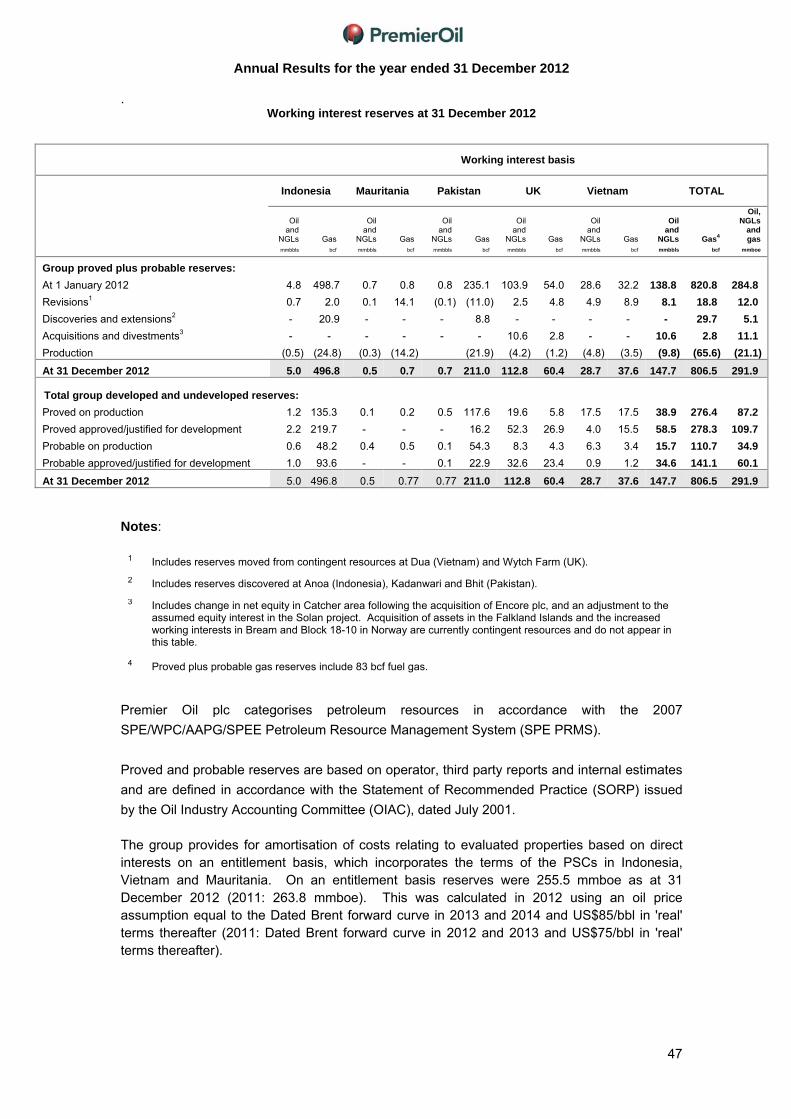
Annual Results for the year ended 31 December 2012
47
. Working interest reserves at 31 December 2012
Notes:
1 Includes reserves moved from contingent resources at Dua (Vietnam) and Wytch Farm (UK).
2 Includes reserves discovered at Anoa (Indonesia), Kadanwari and Bhit (Pakistan).
3 Includes change in net equity in Catcher area following the acquisition of Encore plc, and an adjustment to the assumed equity interest in the Solan project. Acquisition of assets in the Falkland Islands and the increased working interests in Bream and Block 18-10 in Norway are currently contingent resources and do not appear in this table.
4 Proved plus probable gas reserves include 83 bcf fuel gas.
Premier Oil plc categorises petroleum resources in accordance with the 2007
SPE/WPC/AAPG/SPEE Petroleum Resource Management System (SPE PRMS).
Proved and probable reserves are based on operator, third party reports and internal estimates
and are defined in accordance with the Statement of Recommended Practice (SORP) issued
by the Oil Industry Accounting Committee (OIAC), dated July 2001.
The group provides for amortisation of costs relating to evaluated properties based on direct interests on an entitlement basis, which incorporates the terms of the PSCs in Indonesia, Vietnam and Mauritania. On an entitlement basis reserves were 255.5 mmboe as at 31 December 2012 (2011: 263.8 mmboe). This was calculated in 2012 using an oil price assumption equal to the Dated Brent forward curve in 2013 and 2014 and US$85/bbl in 'real' terms thereafter (2011: Dated Brent forward curve in 2012 and 2013 and US$75/bbl in 'real' terms thereafter).
Working interest basis
Indonesia Mauritania Pakistan UK Vietnam TOTAL
Oil and
NGLs Gas
Oil and
NGLs Gas
Oil and
NGLs Gas
Oil and
NGLs Gas
Oil and
NGLs Gas
Oil and
NGLs Gas4
Oil, NGLs
and gas
mmbbls bcf mmbbls bcf mmbbls bcf mmbbls bcf mmbbls bcf mmbbls bcf mmboe
Group proved plus probable reserves:
At 1 January 2012 4.8 498.7 0.7 0.8 0.8 235.1 103.9 54.0 28.6 32.2 138.8 820.8 284.8
Revisions1 0.7 2.0 0.1 14.1 (0.1) (11.0) 2.5 4.8 4.9 8.9 8.1 18.8 12.0
Discoveries and extensions2 - 20.9 - - - 8.8 - - - - - 29.7 5.1
Acquisitions and divestments3 - - - - - - 10.6 2.8 - - 10.6 2.8 11.1
Production (0.5) (24.8) (0.3) (14.2) (21.9) (4.2) (1.2) (4.8) (3.5) (9.8) (65.6) (21.1)
At 31 December 2012 5.0 496.8 0.5 0.7 0.7 211.0 112.8 60.4 28.7 37.6 147.7 806.5 291.9
Total group developed and undeveloped reserves:
Proved on production 1.2 135.3 0.1 0.2 0.5 117.6 19.6 5.8 17.5 17.5 38.9 276.4 87.2
Proved approved/justified for development 2.2 219.7 - - - 16.2 52.3 26.9 4.0 15.5 58.5 278.3 109.7
Probable on production 0.6 48.2 0.4 0.5 0.1 54.3 8.3 4.3 6.3 3.4 15.7 110.7 34.9
Probable approved/justified for development 1.0 93.6 - - 0.1 22.9 32.6 23.4 0.9 1.2 34.6 141.1 60.1
At 31 December 2012 5.0 496.8 0.5 0.77 0.77 211.0 112.8 60.4 28.7 37.6 147.7 806.5 291.9