Embed Size (px)
Citation preview

Hong Kong Exchanges and Clearing Limited and The Stock Exchange of Hong Kong Limited take no responsibility for the contents of this document, make no representation as to its accuracy or completeness and expressly disclaim any liability whatsoever for any loss howsoever arising from or in reliance upon the whole or any part of the contents of this document.
(incorporated in Hong Kong with limited liability)
(Stock Code: 13)
AUDITED RESULTS FOR THE YEAR ENDED 31 DECEMBER 2013 HIGHLIGHTS 2013 2012 HK$
millionsHK$
millions (Restated1) ChangeTotal Revenue2 412,933 397,911 +4%
EBITDA2 95,647 87,336 +10% EBIT2 64,597 58,019 +11%
Profit attributable to ordinary shareholders, before property revaluation and profits on disposal of investments and others
31,028 26,587 +17%
Property revaluation after tax 32 1,113 -97%Profits on disposal of investments and others
after tax3 52 (1,803) +103%
Profit attributable to ordinary shareholders 31,112 25,897 +20%
Earnings per share HK$7.30 HK$6.07 +20%Recurring earnings per share4 HK$7.28 HK$6.23 +17%Final dividend per share HK$1.70 HK$1.53 +11.1%Full year dividend per share HK$2.30 HK$2.08 +10.6% Note 1: The comparatives have been restated to reflect the effect of adoption of new and revised accounting policies in 2013. See Note 1 to the
accounts. Total revenue in 2012 has been reduced by HK$480 million due to reclassification adjustment made by Husky Energy to its 2012 reported revenue and cost of sales.
Note 2: Total revenue, earnings before interest expenses and other finance costs, tax, depreciation and amortisation (“EBITDA”) and earnings before interest expenses and other finance costs and tax (“EBIT”) include the Group’s proportionate share of associated companies’ and joint ventures’ respective items. Total revenue, EBITDA and EBIT were adjusted to exclude the non-controlling interests' share of results of HPH Trust. See Note 5 to the accounts on the details of the adjustments.
Note 3: The profits on disposal of investments and others after tax in 2013 reflect the gain of HK$1,056 million arising from the Initial Public Offering of Westports in Malaysia, the one-time net gain of HK$958 million, arising from the completion of the Orange Austria transaction, which comprises the gain on disposal of Yesss! in Austria net of one-time provisions relating to the restructuring of 3 Austria’s business on the acquisition of Orange Austria, offset by the Group’s share of operating losses of Vodafone Hutchison Australia (“VHA”) for 2013 of HK$1,458 million and the Group’s share of Husky Energy’s impairment charge on certain natural gas assets in Western Canada of HK$504 million. 2012 comparative comprises of the Group's share of operating losses of VHA and its share of restructuring charges from July to December 2012.
Note 4: Recurring earnings per share is calculated based on profits attributable to ordinary shareholders before property revaluation after tax and profits on disposal of investments and others after tax.
HWL 2013 Annual Results Page 1 of 45

Total revenue grew 4% to HK$412,933 million.
EBITDA and EBIT, before property revaluation and profits on disposal of investments and others, grew 10% and 11% respectively.
Profit attributable to ordinary shareholders and earnings per share for the year were HK$31,112 million and HK$7.30 respectively, a 20% increase over last year, of which HK$31,028 million or HK$7.28 per share was recurring, a 17% increase over last year.
HWL 2013 Annual Results Page 2 of 45

Chairman’s Statement In 2013, the Group achieved solid earnings growth. Despite operating in some challenging markets around the world, overall our businesses in 52 countries continue to deliver solid performance. Results The Group’s recurring profit attributable to ordinary shareholders for the year, before property revaluation gains and profits on disposal of investments and others, was HK$31,028 million, a 17% increase from HK$26,587 million in 2012. Recurring earnings per share increased by 17% to HK$7.28 from HK$6.23 in 2012. The Group also reported profit on investment property revaluation after tax in 2013 of HK$32 million as compared to HK$1,113 million in 2012. Profits on disposal of investments and others after tax in 2013 of HK$52 million includes the gain arising from the Initial Public Offering of Westports in Malaysia of HK$1,056 million, the one-time net gain on the completion of the Orange Austria acquisition transaction of HK$958 million, partly offset by Hutchison Telecommunications (Australia) (“HTAL”)’s 50% share of Vodafone Hutchison Australia (“VHA”) operating losses of HK$1,458 million and the Group’s share of Husky Energy (“Husky”)’s impairment charge on certain natural gas assets in Western Canada. This compares to a charge of HK$1,803 million in 2012, comprising HTAL’s 50% share of VHA’s operating losses and restructuring charges in the second half of that year. Profit attributable to ordinary shareholders reported for the year was HK$31,112 million, a 20% increase compared to HK$25,897 million for 2012. Dividends The Board recommends the payment of a final dividend of HK$1.70 per share (2012 – HK$1.53 per share) payable on 3 June 2014 to those persons registered as shareholders of the Company on 22 May 2014, being the record date for determining the shareholders’ entitlement to the proposed final dividend. Combined with the interim dividend of HK$0.60 per share (2012 – HK$0.55 per share), the full year dividend amounts to HK$2.30 per share (2012 – HK$2.08 per share). Ports and Related Services The ports and related services division’s throughput grew 2% to 78.3 million twenty-foot equivalent units (“TEU”) in 2013. Total revenue of HK$34,119 million was 4% higher than last year reflecting throughput growth and higher average revenue per TEU. This increase was partly offset by higher operating costs and the division reported EBITDA of HK$11,447 million, which was 1% higher than last year. EBIT of HK$7,358 million was 4% lower than 2012 mainly due to higher depreciation charges of HK$427 million including accelerated depreciation of certain assets at London Thamesport as well as charges for new ports and expanded port facilities brought into operation during the year that, in the ordinary course, can be expected to grow volumes and contribution over the next two to three years. In March 2013, HPH Trust acquired 100% interest in Asia Container Terminals (“ACT HK”), located at Terminal 8 in Hong Kong’s Kwai Tsing Port. In October 2013, Westports Holdings Bhd. in Malaysia listed its shares on the Malaysia Stock Exchange. During the year, the division brought seven additional berths into service, of which two berths through acquisition of ACT HK by HPH Trust, two berths at Sydney Australia and one berth each at Westports in Malaysia, Lazaro Cardenas in Mexico and Huizhou in the Mainland, while five existing berths were returned to the Port Authorities at Barcelona in Spain and Busan in Korea.
HWL 2013 Annual Results Page 3 of 45

The division targets increasing the number of operating berths from 278 at the end of 2013 to 284 by the end of 2014 with a net addition of six berths at Westports Malaysia, Brisbane Australia, Dammam Saudi Arabia and Sohar Oman this year. Continuing economic recovery in the United States and Europe combined with the Mainland’s commitment to stability are providing a constructive outlook for the sector in 2014. Consequently, the division is expected to grow volumes during the year and will continue to focus on productivity gains, cost efficiency and selective acquisition and development opportunities to achieve earnings growth. Property and Hotels The property and hotels division reported total revenue of HK$24,264 million, a 22% increase compared to 2012. EBITDA and EBIT increased 29% and 30% to HK$13,995 million and HK$13,659 million respectively. The division’s 11.8 million square foot portfolio of rental properties in Hong Kong, together with our attributable share of 2.2 million square foot portfolio in the Mainland and overseas, reported higher occupancy and steady rental growth. Reported rental income improved 12% to HK$4,259 million from last year primarily due to higher rental renewal rates and occupancy. Our portfolio is of a high quality, is well located and is expected to continue performing well in 2014. The division’s hotel portfolio comprises 11 hotels with over 8,500 rooms, in which the Group has an average effective interest of approximately 63%, generated EBIT of HK$1,036 million which was flat compared to 2012. Our current property development activities are principally focused on the Mainland and Singapore. During the year, we completed the construction of an attributable share of gross floor area of approximately 9.0 million square feet of residential and commercial properties, and recognised sales on an attributable interest of approximately 7.8 million square feet of developed properties, primarily in the Mainland. The division’s current attributable interest in landbank is approximately 83 million developable square feet, largely held through joint ventures with Cheung Kong (Holdings) Ltd. Market conditions permitting, we expect to complete an attributable share of approximately 8.3 million square feet gross floor area of residential and commercial properties during 2014. Retail1 The retail division (excluding Marionnaud1), with over 10,500 stores in 25 markets, delivered another year of strong revenue, cash generation and earnings growth in 2013. Total revenue of HK$149,147 million, EBITDA of HK$14,158 million and EBIT of HK$11,771 million, were 8%, 11% and 14% higher respectively than last year. Excluding the impact attributable to the expiration of Nuance-Watson’s two core concession licences at Hong Kong International Airport in late 2012, total revenue, EBITDA and EBIT grew by 9%, 13% and 16% respectively. The division reported like-for-like sales growth of 2.2%, with 1.4% in Asia and 2.9% in Europe in 2013. Despite the difficult retail environment in several European economies, the division’s European operations overall were able to increase earnings contribution with EBITDA and EBIT growth of 15% and 22% respectively, primarily due to the strong performance of the Health and Beauty Western Europe subdivision. Health and beauty operations in the Mainland grew total revenue by 17% as new store openings continued to perform well, more than offsetting slowing comparable store sales growth. This business unit has the highest profit growth within the retail division as a whole, with EBITDA and EBIT growth at 18% and 16% respectively in 2013. Note 1: The Marionnaud business has been excluded from the retail division and included under “Others” pursuant to the strategic review of the
retail division which is still ongoing.
HWL 2013 Annual Results Page 4 of 45

Recovering consumption economies in Europe and an overall stable outlook for the Mainland and most countries in which we operate in Asia provide a positive outlook for the retail division’s businesses, which should continue to expand rapidly in 2014. Cheung Kong Infrastructure Cheung Kong Infrastructure Holdings Limited (“CKI”), our Hong Kong listed subsidiary, announced profit attributable to shareholders of HK$11,639 million, a growth of 23% over last year. CKI continued to invest in earnings accretive businesses during the year, acquiring Enviro Waste Services Limited, an integrated waste management business in New Zealand and, through a consortium led by CKI, AVR-Afvalverwerking B.V., the largest “energy-from-waste” business in the Netherlands. In January 2014, CKI’s 38.87%-owned associate, Power Assets Holdings Limited completed the separate listing of its Hong Kong electricity business on the Main Board of the Stock Exchange of Hong Kong Limited and currently holds 49.9% of the separate listed entity. Husky Energy Husky Energy, our associated company listed in Canada, announced profit from operations attributable to shareholders of C$1,829 million, including an after tax impairment charge of C$204 million on certain natural gas assets in Western Canada. Excluding this impairment charge, profit from operations attributable to shareholders increased 1% over last year. Average production in 2013 was 312,000 barrels of oil equivalent per day (“BOEs per day”) compared to 301,500 BOEs per day in 2012. Husky Energy has achieved several milestones in key development projects in 2013 and is progressing well on two very substantial capital projects, the Liwan deep-water natural gas development (“Liwan Project”) located in the South China Sea and the Sunrise Energy oil sands development (“Sunrise Project”) in Canada. The Liwan Project is expected to begin production in early 2014 and the first phase of the Sunrise Project is advancing towards first production in late 2014. 3 Group Europe The Group’s registered 3G customer base in Europe increased 13% during the year and totals over 26.6 million customers, of which over 83% are active. 3 Group Europe reported total revenue of HK$61,976 million, a 6% increase over last year. EBITDA and EBIT grew by 38% and 54% to HK$12,671 million and HK$4,856 million respectively. 3 Group Europe has achieved another important milestone and reported positive EBITDA less capex for the year. This encouraging performance reflects the Group’s strong market position in the smartphone and mobile data segments, the increased contribution from 3 Austria upon the completion of the acquisition of Orange Austria in January 2013, and a well-disciplined operating and capital expenditure profile. In June 2013, 3 Ireland entered into an agreement with Telefonica to acquire O2, Telefonica’s mobile business in Ireland, for €780 million with an additional deferred payment of €70 million payable dependent upon achievement of agreed financial targets. The completion of this transaction, which is subject to regulatory approval, is expected in the second quarter of 2014. 3 Group Europe also completed spectrum acquisitions required to support 4G (LTE) rollouts, which will continue in all of its major markets in 2014.
HWL 2013 Annual Results Page 5 of 45

The transition to a non-subsidised handset model in 3 Group Europe’s customer base was completed in 2013. European mobile termination regimes have also largely stabilised. Accordingly, with highly competitive network assets and service offerings as well as an industry leading cost structure, this division is expected to continue to increase its contribution to the Group in 2014. Hutchison Telecommunications Hong Kong Hutchison Telecommunications Hong Kong Holdings (“HTHKH”), our Hong Kong listed telecommunications subsidiary operating in Hong Kong and in Macau announced revenue of HK$12,777 million, a decrease of 18% over last year. EBITDA of HK$2,758 million and EBIT of HK$1,367 million, decreased 10% and 22% respectively over last year. The announced profit attributable to shareholders was HK$916 million and earnings per share was 19.01 HK cents, a decrease of 25% compared to last year. As of 31 December 2013, active mobile customers were maintained at approximately 3.8 million in Hong Kong and Macau. Hutchison Asia Telecommunications As of 31 December 2013, Hutchison Asia Telecommunications (“HAT”) had an active customer base of approximately 43.5 million and reported total revenue of HK$6,295 million, EBITDA of HK$819 million and LBIT of HK$409 million, an improvement of 41%, 94% and 52% respectively compared to last year. In 2014, HAT will continue to focus on growing its business in Indonesia, where major network rollout activities were completed in the third quarter of 2013. Finance & Investments and Others Contribution from this segment represents returns earned on the Group’s holdings of cash and liquid investments as well as results of other small operating units. During 2013, the Group raised HK$46,044 million from the debt and capital markets and repaid debts as they matured and repaid early certain long-term borrowings and notes of HK$61,822 million. As a result of refinancing at lower interest rates, the Group’s weighted average cost of debt reduced from 3.4% for 31 December 2012 to 3.1% for the year. At 31 December 2013, the Group’s consolidated cash and liquid investments totalled HK$102,787 million and consolidated debt amounted to HK$223,822 million, resulting in consolidated net debt of HK$121,035 million and net debt to net total capital ratio of 20.0%. The Group’s consolidated cash and liquid investments as at 31 December 2013 were sufficient to repay all outstanding consolidated Group debt maturing through 2015 and approximately 56% of the maturities in 2016. The Group will continue to closely monitor its liquidity and debt profile and expects its consolidated Group net debt to net total capital ratio to remain less than 25% for the foreseeable future.
HWL 2013 Annual Results Page 6 of 45

Outlook In 2013, economic uncertainty continued to affect several markets and geographies in which the Group operates. However, with the exception of certain emerging markets, trends in the second half of 2013 generally showed improvement, leading to a constructive outlook for the Group’s businesses overall in 2014. Adhering to the Group’s fundamental principle of always acting in the best long-term interest of our Shareholders and taking into consideration relevant economic and political factors, the Group will continue with the strategy of “Advancing with Stability” in the ongoing investment for growth in our core businesses. Achieving sustainable recurring earnings growth and maintaining a strong financial profile will continue to be the key objectives of the Group. Barring unforeseen material adverse external developments, I expect that the Group will continue to meet these objectives in 2014. I remain prudently optimistic about the Group’s prospects. I would like to thank the Board of Directors and all our dedicated employees around the world for their continued loyalty, diligence, professionalism and contributions to the Group. Li Ka-shing Chairman Hong Kong, 28 February 2014
HWL 2013 Annual Results Page 7 of 45

Hutchison Whampoa Limited
Consolidated Income Statementfor the year ended 31 December 2013
As restated
Note 1
2013 2012
Note HK$ millions HK$ millions
Revenue 2 256,234 243,089
Cost of inventories sold (102,496) (98,113)
Staff costs (33,151) (31,416)
Telecommunications customer acquisition costs (24,170) (25,514)
Depreciation and amortisation 2 (15,850) (14,149)
Other operating expenses (51,265) (50,364)
Change in fair value of investment properties 26 790
Profits on disposal of investments and others 3 230 (2,052)
Share of profits less losses after tax of:
Associated companies before profits on disposal of investments and others 10,433 10,558
Joint ventures 12,597 10,924
Associated companies’ share of profits on disposal of investments and others 3 (504) -
2 52,084 43,753
Interest expenses and other finance costs 4 (8,391) (9,243)
Profit before tax 43,693 34,510
Current tax 5 (4,231) (3,079)
Deferred tax 5 (569) 676
Profit after tax 38,893 32,107
Allocated as : Profit attributable to non-controlling interests and holders of
perpetual capital securities (7,781) (6,210)
Profit attributable to ordinary shareholders of the Company 31,112 25,897
Earnings per share for profit attributable to ordinary shareholders
of the Company 6 HK$ 7.30 HK$ 6.07
Details of distributions paid to the holders of perpetual capital securities and interim dividend paid and proposed final
dividend payable to the ordinary shareholders of the Company are set out in note 7.
HWL 2013 Annual Results Page 8 of 45

Hutchison Whampoa Limited
Consolidated Statement of Comprehensive Incomefor the year ended 31 December 2013
As restated
Note 1
2013 2012
HK$ millions HK$ millions
Profit after tax 38,893 32,107
Other comprehensive income (losses)
Items that will not be reclassified to profit or loss:
Remeasurement of defined benefit obligations recognised directly in reserves 694 (577)
Share of other comprehensive income of associated companies 563 247
Share of other comprehensive income (losses) of joint ventures (115) (129)
Tax relating to items that will not be reclassified to profit or loss 84 68
1,226 (391)
Items that have been reclassified or may be subsequently reclassified to profit or loss:
Available-for-sale investments
Valuation gains recognised directly in reserves 382 1,761
Valuation losses (gains) previously in reserves recognised in income statement 6 (210)
Gains (losses) on cash flow hedges arising from forward foreign currency contracts
and interest rate swap contracts recognised directly in reserves 346 (57)
Gains (losses) on translating overseas subsidiaries’ net assets recognised
directly in reserves (1,774) 1,833
Losses (gains) previously in exchange reserve related to subsidiaries and associated
companies disposed during the year recognised in income statement (152) 69
Share of other comprehensive income (losses) of associated companies (3,800) 1,525
Share of other comprehensive income of joint ventures 589 1,624
Tax relating to items that have been reclassified or may be subsequently
reclassified to profit or loss (76) (82)
(4,479) 6,463
Other comprehensive income (losses) after tax (3,253) 6,072
Total comprehensive income 35,640 38,179
Allocated as : Attributable to non-controlling interests and holders of
perpetual capital securities (7,878) (6,593)
Attributable to ordinary shareholders of the Company 27,762 31,586
HWL 2013 Annual Results Page 9 of 45

Hutchison Whampoa Limited
Consolidated Statement of Financial Positionat 31 December 2013
As restated As restated
Note 1 Note 1
31 December 31 December 1 January
2013 2012 2012
Note HK$ millions HK$ millions HK$ millions
ASSETS
Non-current assets
Fixed assets 177,324 167,588 155,502
Investment properties 42,454 43,652 42,610
Leasehold land 9,849 9,495 10,004
Telecommunications licences 86,576 78,655 75,503
Goodwill 38,028 26,492 26,338
Brand names and other rights 18,755 15,328 12,615
Associated companies 112,058 113,305 105,505
Interests in joint ventures 111,271 108,950 99,758
Deferred tax assets 18,548 18,059 16,985
Other non-current assets 7,934 9,579 10,184
Liquid funds and other listed investments 17,136 23,499 20,239
639,933 614,602 575,243
Current assets
Cash and cash equivalents 8 85,651 107,948 66,539
Trade and other receivables 9 69,083 61,788 60,345
Inventories 20,855 19,533 18,408
175,589 189,269 145,292
Current liabilities
Trade and other payables 10 86,812 78,471 78,093
Bank and other debts 18,159 39,596 28,835
Current tax liabilities 3,319 2,856 2,431
108,290 120,923 109,359
Net current assets 67,299 68,346 35,933
Total assets less current liabilities 707,232 682,948 611,176
Non-current liabilities
Bank and other debts 207,195 220,440 189,719
Interest bearing loans from non-controlling shareholders 5,445 6,307 6,502
Deferred tax liabilities 10,228 8,968 8,888
Pension obligations 3,095 3,616 3,041
Other non-current liabilities 5,037 5,076 4,296
231,000 244,407 212,446
Net assets 476,232 438,541 398,730
CAPITAL AND RESERVES
Share capital 1,066 1,066 1,066
Perpetual capital securities 39,587 23,400 15,600
Reserves 385,956 367,053 342,905
Total ordinary shareholders’ funds and perpetual capital securities 426,609 391,519 359,571
Non-controlling interests 49,623 47,022 39,159
Total equity 476,232 438,541 398,730
HWL 2013 Annual Results Page 10 of 45

Hutchison Whampoa Limited
Consolidated Statement of Changes in Equityfor the year ended 31 December 2013
Total ordinary
Share capital Holders of perpetual shareholders’ funds and Non-controlling
and premium (a)
Exchange reserve Other reserves (b)
Retained profit Sub-total capital securities perpetual capital securities interests Total equity
HK$ millions HK$ millions HK$ millions HK$ millions HK$ millions HK$ millions HK$ millions HK$ millions HK$ millions
At 1 January 2013, as previously reported 29,425 12,064 6,027 320,409 367,925 23,634 391,559 47,033 438,592
Prior year adjustments in respect of changes in accounting policies (see note 1) - - - (40) (40) - (40) (11) (51)
At 1 January 2013, as restated 29,425 12,064 6,027 320,369 367,885 23,634 391,519 47,022 438,541
Profit for the year - - - 31,112 31,112 1,774 32,886 6,007 38,893
Other comprehensive income (losses)
Available-for-sale investments
Valuation gains recognised directly in reserves - - 309 - 309 - 309 73 382
Valuation losses previously in reserves recognised in income statement - - 6 - 6 - 6 - 6
Remeasurement of defined benefit obligations recognised directly in reserves - - - 551 551 - 551 143 694
Gains on cash flow hedges arising from forward foreign currency contracts and interest
rate swap contracts recognised directly in reserves - - 318 - 318 - 318 28 346
Losses on translating overseas subsidiaries' net assets recognised directly in reserves - (1,696) - - (1,696) - (1,696) (78) (1,774)
Gains previously in exchange reserve related to subsidiaries and associated companies
disposed during the year recognised in income statement - (146) - - (146) - (146) (6) (152)
Share of other comprehensive income (losses) of associated companies - (4,044) 352 472 (3,220) - (3,220) (17) (3,237)
Share of other comprehensive income (losses) of joint ventures - 610 (43) (84) 483 - 483 (9) 474
Tax relating to components of other comprehensive income (losses) - - (59) 104 45 - 45 (37) 8
Other comprehensive income (losses) - (5,276) 883 1,043 (3,350) - (3,350) 97 (3,253)
Total comprehensive income (losses) - (5,276) 883 32,155 27,762 1,774 29,536 6,104 35,640
Dividends paid relating to 2012 - - - (6,523) (6,523) - (6,523) - (6,523)
Dividends paid relating to 2013 - - - (2,558) (2,558) - (2,558) - (2,558)
Dividends paid to non-controlling interests - - - - - - - (3,532) (3,532)
Distributions paid on perpetual capital securities - - - - - (1,351) (1,351) - (1,351)
Equity contribution from non-controlling interests - - - - - - - 108 108
Share option schemes of subsidiaries - - (11) - (11) - (11) 1 (10)
Share option lapsed - - (1) 1 - - - - -
Unclaimed dividends write back - - - 5 5 - 5 - 5
Issuance of perpetual capital securities (c)
- - - - - 17,879 17,879 - 17,879
Transaction costs in relation to issuance of perpetual capital securities - - - (158) (158) - (158) - (158)
Repurchase of perpetual capital securities (c)
- - - (110) (110) (1,692) (1,802) - (1,802)
Relating to acquisition of subsidiary companies - - - - - - - 2 2
Relating to purchase of non-controlling interests - - 21 - 21 - 21 (30) (9)
Relating to partial disposal of subsidiary companies - 1 52 (1) 52 - 52 (52) -
At 31 December 2013 29,425 6,789 6,971 343,180 386,365 40,244 426,609 49,623 476,232
Attributable to
Ordinary shareholders
HWL 2013 Annual Results Page 11 of 45

Hutchison Whampoa Limited
Consolidated Statement of Changes in Equityfor the year ended 31 December 2013
Total ordinary
Share capital Holders of perpetual shareholders’ funds and Non-controlling
and premium (a)
Exchange reserve Other reserves (b)
Retained profit Sub-total capital securities perpetual capital securities interests Total equity
HK$ millions HK$ millions HK$ millions HK$ millions HK$ millions HK$ millions HK$ millions HK$ millions HK$ millions
Attributable to
Ordinary shareholders
At 1 January 2012, as previously reported 29,425 6,968 3,632 303,823 343,848 15,764 359,612 39,171 398,783
Prior year adjustments in respect of changes in accounting policies (see note 1) - - - (41) (41) - (41) (12) (53)
At 1 January 2012, as restated 29,425 6,968 3,632 303,782 343,807 15,764 359,571 39,159 398,730
Profit for the year, as restated - - - 25,897 25,897 1,240 27,137 4,970 32,107
Other comprehensive income (losses), as restated
Available-for-sale investments
Valuation gains recognised directly in reserves - - 1,557 - 1,557 - 1,557 204 1,761
Valuation gains previously in reserves recognised in income statement - - (168) - (168) - (168) (42) (210)
Remeasurement of defined benefit obligations recognised directly in reserves - - - (525) (525) - (525) (52) (577)
Losses on cash flow hedges arising from forward foreign currency contracts and interest
rate swap contracts recognised directly in reserves - - (48) - (48) - (48) (9) (57)
Gains on translating overseas subsidiaries' net assets recognised directly in reserves - 1,862 - - 1,862 - 1,862 (29) 1,833
Losses previously in exchange reserve related to subsidiaries disposed during the year
recognised in income statement - 69 - - 69 - 69 - 69
Share of other comprehensive income (losses) of associated companies - 1,860 (427) 198 1,631 - 1,631 141 1,772
Share of other comprehensive income (losses) of joint ventures - 1,355 57 (102) 1,310 - 1,310 185 1,495
Tax relating to components of other comprehensive income (losses) - - (66) 67 1 - 1 (15) (14)
Other comprehensive income (losses), as restated - 5,146 905 (362) 5,689 - 5,689 383 6,072
Total comprehensive income, as restated - 5,146 905 25,535 31,586 1,240 32,826 5,353 38,179
Dividends paid relating to 2011 - - - (6,523) (6,523) - (6,523) - (6,523)
Dividends paid relating to 2012 - - - (2,345) (2,345) - (2,345) - (2,345)
Dividends paid to non-controlling interests - - - - - - - (2,693) (2,693)
Distributions paid on perpetual capital securities - - - - - (1,170) (1,170) - (1,170)
Equity contribution from non-controlling interests - - - - - - - 7,019 7,019
Transaction costs in relation to equity contribution from non-controlling interests - - - (39) (39) - (39) (10) (49)
Share option schemes of subsidiaries - - 6 - 6 - 6 2 8
Share option lapsed - - (2) 2 - - - - -
Unclaimed dividends write back - - - 11 11 - 11 - 11
Issuance of perpetual capital securities (c)
- - - - - 7,800 7,800 - 7,800
Transaction costs in relation to issuance of perpetual capital securities - - - (54) (54) - (54) - (54)
Relating to purchase of non-controlling interests - - (174) - (174) - (174) (198) (372)
Relating to partial disposal of subsidiary companies - (50) 1,660 - 1,610 - 1,610 (1,610) -
At 31 December 2012, as restated 29,425 12,064 6,027 320,369 367,885 23,634 391,519 47,022 438,541
(a) Share capital and premium comprise share capital of HK$1,066 million, share premium of HK$27,955 million and capital redemption reserve of HK$404 million in all reporting years.
(b) Other reserves comprise revaluation reserve, hedging reserve and other capital reserves. As at 31 December 2013, revaluation reserve surplus amounted to HK$3,883 million (1 January 2013 - HK$3,690 million and 1 January 2012 - HK$2,277 million), hedging reserve deficit amounted to HK$440 million
(1 January 2013 - HK$1,125 million and 1 January 2012 - HK$623 million) and other capital reserves surplus amounted to HK$3,528 million (1 January 2013 - HK$3,462 million and 1 January 2012 - HK$1,978 million). Revaluation surplus (deficit) arising from revaluation to market value of listed debt
securities and listed equity securities which are available for sale are included in the revaluation reserve. Fair value changes arising from the effective portion of hedging instruments designated as cash flow hedges are included in the hedging reserve.
(c) During the year ended 31 December 2013, the Group had repurchased US$217 million (approximately HK$1,692 million) nominal amount of subordinated guaranteed perpetual capital securities (the “perpetual capital securities”) that were originally issued in October 2010 at an aggregate nominal amount of
US$2,000 million (approximately HK$15,600 million).
In May 2013 and May 2012, wholly owned subsidiary companies of the Group issued perpetual capital securities with a nominal amount of €1,750 million (approximately HK$17,879 million) and US$1,000 million (approximately HK$7,800 million) for cash, which are classified as equity under Hong Kong
Financial Reporting Standards.
HWL 2013 Annual Results Page 12 of 45

Hutchison Whampoa Limited
Consolidated Statement of Cash Flows for the year ended 31 December 2013
As restated
Note 1
2013 2012
Note HK$ millions HK$ millions
Operating activities
Cash generated from operating activities before interest expenses and other
finance costs, tax paid and changes in working capital 11 (a) 60,898 46,942
Interest expenses and other finance costs paid (7,695) (8,509)
Tax paid (3,813) (2,334)
Funds from operations 49,390 36,099
Changes in working capital 11 (b) (4,338) (2,842)
Net cash from operating activities 45,052 33,257
Investing activities
Purchase of fixed assets and investment properties (23,028) (26,374)
Additions to leasehold land (532) (171)
Additions to telecommunications licences (6,828) (2,422)
Additions to brand names and other rights (105) (140)
Purchase of subsidiary companies 11 (c) (17,651) -
Additions to other unlisted investments and long term receivables (30) (45)
Repayments from associated companies and joint ventures 8,897 574
Purchase of and advances to (including deposits from) associated companies
and joint ventures (14,184) (4,484)
Proceeds on disposal of fixed assets, leasehold land and investment properties
and other assets 6,442 764
Proceeds on disposal of subsidiary companies 11 (d) 3,149 691
Proceeds on partial disposal / disposal of associated companies 1,895 -
Proceeds on disposal of joint ventures 111 14
Proceeds on disposal of other unlisted investments 17 317
Cash flows used in investing activities before additions to / disposal
of liquid funds and other listed investments (41,847) (31,276)
Disposal of liquid funds and other listed investments 6,245 99
Additions to liquid funds and other listed investments (147) (1,683)
Cash flows used in investing activities (35,749) (32,860)
Net cash inflow before financing activities 9,303 397
Financing activities
New borrowings 28,323 86,617
Repayment of borrowings (61,822) (47,022)
Issue of shares by subsidiary companies to non-controlling shareholders
and net loans from (to) non-controlling shareholders (69) 6,702
Payments to acquire additional interests in subsidiary companies (9) (172)
Proceeds on issue of perpetual capital securities, net of transaction costs 17,721 7,746
Repurchase of perpetual capital securities (1,802) -
Dividends paid to non-controlling interests (3,510) (2,821)
Distributions paid on perpetual capital securities (1,351) (1,170)
Dividends paid to ordinary shareholders (9,081) (8,868)
Cash flows from (used in) financing activities (31,600) 41,012
Increase (decrease) in cash and cash equivalents (22,297) 41,409
Cash and cash equivalents at 1 January 107,948 66,539
Cash and cash equivalents at 31 December 85,651 107,948
Analysis of cash, liquid funds and other listed investments
Cash and cash equivalents, as above 8 85,651 107,948
Liquid funds and other listed investments 17,136 23,499
Total cash, liquid funds and other listed investments 102,787 131,447
Total principal amount of bank and other debts 223,822 256,152
Interest bearing loans from non-controlling shareholders 5,445 6,307
Net debt 126,480 131,012
Interest bearing loans from non-controlling shareholders (5,445) (6,307)
Net debt (excluding interest bearing loans from non-controlling shareholders) 121,035 124,705
HWL 2013 Annual Results Page 13 of 45

Notes
1 Basis of preparation
The financial information is extracted from the Group’s audited accounts which have been prepared in accordance with Hong
Kong Financial Reporting Standards (“HKFRS”) issued by the Hong Kong Institute of Certified Public Accountants
(“HKICPA”). The accounts have been prepared under the historical cost convention except for certain properties and
financial instruments which are stated at fair values.
In the current year, the Group has adopted all of the new and revised standards, amendments and interpretations issued by the
HKICPA that are relevant to the Group’s operations and mandatory for annual periods beginning 1 January 2013.
Except as described below, the adoption of these new and revised standards, amendments and interpretations does not have a
material impact on the Group’s accounting policies.
(a) HKFRS 7 Disclosures - Offsetting Financial Assets and Financial Liabilities - Amendments to HKFRS 7
The amendments to HKFRS 7 require disclosure of the effect or potential effects of netting arrangements on an entity’s
financial position. The amendments require disclosure of recognised financial instruments that are subject to an
enforceable master netting arrangement or similar agreement.
The amendments to HKFRS 7 require retrospective application. New disclosures are provided in note 44(k) to the annual
accounts.
(b) HKFRS 10 Consolidated Financial Statements and HKAS 27 Separate Financial Statements
HKFRS 10 establishes a single control model that applies to all entities including special purpose entities. HKFRS 10
replaces the parts of previously existing HKAS 27 Consolidated and Separate Financial Statements that dealt with
consolidated financial statements and SIC-12 Consolidation – Special Purpose Entities. HKFRS 10 changes the definition
of control such that an investor controls an investee when it is exposed, or has rights, to variable returns from its
involvement with the investee and has the ability to affect those returns through its power over the investee. To meet the
definition of control in HKFRS 10, all three criteria must be met, including: (a) an investor has power over an investee;
(b) the investor has exposure, or rights, to variable returns from its involvement with the investee; and (c) the investor
has the ability to use its power over the investee to affect the amount of the investor’s returns. HKFRS 10 had no impact
on the consolidation of investments held by the Group.
(c) HKFRS 11 Joint Arrangements and HKAS 28 Investment in Associates and Joint Ventures
HKFRS 11 replaces HKAS 31 Interests in Joint Ventures and SIC-13 Jointly-controlled Entities — Non-monetary
Contributions by Venturers.
Under HKFRS 11 investments in joint arrangements are classified either as joint operations or joint ventures, depending
on the contractual rights and obligations each investor has rather than the legal structure of the joint arrangement. Unlike
HKAS 31, the use of “proportionate consolidation” to account for joint ventures is not permitted.
On adoption of HKFRS 11, the Group’s listed subsidiary, Cheung Kong Infrastructure (“CKI”) reviewed and re-assessed
the classification of its equity-accounted for investments, which were previously classified by CKI as interests in jointly
controlled entities and interests in associates. CKI concluded that investments previously classified as interests in jointly
controlled entities and certain investments previously classified as interests in associates are required to be classified as
interests in joint ventures in accordance with the requirements of HKFRS 11. Other than the change in classification
these investments continue to be accounted for using the equity method of accounting. As a result, CKI restated its
comparative information to reflect the retrospective application of this change in classification.
The effect of the adoption of HKFRS 11 to the Group’s financial statements is a reclassification of certain comparative
line items within the respective statement in the consolidated accounts, as explained in (h) below, and has no impact on
the Group’s results or total equity.
HWL 2013 Annual Results Page 14 of 45

1 Basis of preparation (continued)
(d) HKFRS 12 Disclosures of interests in other entities
HKFRS 12 brings together into a single standard all the disclosure requirements relevant to an entity’s interests in
subsidiaries, joint arrangements, associates and unconsolidated structured entities. New disclosures are provided in
note 19 to the annual accounts.
(e) HKFRS 13 Fair Value Measurement
HKFRS 13 establishes a single source of guidance under HKFRS for all fair value measurements. HKFRS 13 does not
change when an entity is required to use fair value, but rather provides guidance on how to measure fair value under
HKFRS when fair value is required or permitted. The application of HKFRS 13 has not materially impacted the fair value
measurements carried out by the Group.
HKFRS 13 also requires specific disclosures on fair values, some of which replace existing disclosure requirements in other
standards, including HKFRS 7 Financial Instruments: Disclosures. New disclosures are provided in notes 14, 44(i) and
44(j) to the annual accounts.
(f) HKAS 1 Presentation of Items of Other Comprehensive Income – Amendments to HKAS 1
The amendments to HKAS 1 introduce a grouping of items presented in other comprehensive income. Items that
could be reclassified to profit or loss at a future point in time now have to be presented separately from items that will
never be reclassified. The adoption of these amendments affected presentation only and had no impact on the Group’s
results or total equity.
(g) HKAS 19 Employee Benefits (Revised 2011) (“HKAS 19 (2011)”)
HKAS 19 (2011) includes a number of amendments to the accounting for defined benefit plans, including actuarial gains
and losses that are now recognised in other comprehensive income and permanently excluded from profit or loss;
expected returns on plan assets are no longer recognised in profit or loss and instead, interest on the net defined benefit
liability (asset) is in profit or loss, calculated using the discount rate used to measure the defined benefit obligation and;
unvested past service costs are now recognised in profit or loss in the period and not amortised over the vesting period.
Other amendments include new disclosures, such as, quantitative sensitivity disclosures.
HKAS 19 (2011) requires retrospective application. The adoption of HKAS 19 (2011) had an impact on the net defined
benefit plan obligations primarily due to the difference in accounting for interest on plan assets. The effect of the adoption
of HKAS 19 (2011) is explained below.
(h) As a result of the changes in accounting policies mentioned above, certain adjustments have been made to the comparative
information. The effect, where material, of these changes are summarised below:
HWL 2013 Annual Results Page 15 of 45

1 Basis of preparation (continued)
(i) Estimated effect on the consolidated income statement for the year ended 31 December 2013
Changes in accounting policies
HKAS 19
(2011) HKFRS 11 Total
HK$ millions HK$ millions HK$ millions
Revenue - - -
Cost of inventories sold - - -
Staff costs (334) - (334)
Telecommunications customer acquisition costs - - -
Depreciation and amortisation - - -
Other operating expenses - - -
Change in fair value of investment properties - - -
Profits on disposal of investments and others - - -
Share of profits less losses after tax of:
Associated companies before profits on disposal of investments and others (25) (6,481) (6,506)
Joint ventures (3) 6,481 6,478
Associated companies’ share of profits on disposal of investments and others - - -
(362) - (362)
Interest expenses and other finance costs - - -
Profit before tax (362) - (362)
Current tax 20 - 20
Deferred tax 7 - 7
Profit after tax (335) - (335)
Allocated as : Profit attributable to non-controlling interests and holders of perpetual
capital securities 36 - 36
Profit attributable to ordinary shareholders of the Company (299) - (299)
Earnings per share for profit attributable to ordinary shareholders of the Company (HK$0.07) - (HK$0.07)
(ii) Estimated effect on the consolidated statement of comprehensive income for the year ended 31 December 2013
Changes in accounting policies
HKAS 19
(2011) HKFRS 11 Total
HK$ millions HK$ millions HK$ millions
Profit after tax (335) - (335)
Other comprehensive income (losses)
Items that will not be reclassified to profit or loss:
Remeasurement of defined benefit obligations recognised directly in reserves 309 - 309
Share of other comprehensive income of associated companies 49 138 187
Share of other comprehensive income (losses) of joint ventures 3 (138) (135)
Tax relating to items that will not be reclassified to profit or loss (22) - (22)
339 - 339
Items that have been reclassified or may be subsequently reclassified to profit or loss:
Available-for-sale investments
Valuation gains recognised directly in reserves - - -
Valuation losses (gains) previously in reserves recognised in income statement - - -
Gains (losses) on cash flow hedges arising from forward foreign currency contracts and
interest rate swap contracts recognised directly in reserves - - -
Gains (losses) on translating overseas subsidiaries’ net assets recognised directly in reserves - - -
Losses (gains) previously in exchange reserve related to subsidiaries and associated companies
disposed during the year recognised in income statement - - -
Share of other comprehensive income (losses) of associated companies - (384) (384)
Share of other comprehensive income of joint ventures - 384 384
Tax relating to items that have been reclassified or may be subsequently reclassified to profit or loss - - -
- - -
Other comprehensive income (losses) after tax 339 - 339
Total comprehensive income 4 - 4
Allocated as : Attributable to non-controlling interests and holders of perpetual capital securities 2 - 2
Attributable to ordinary shareholders of the Company 6 - 6
HWL 2013 Annual Results Page 16 of 45

1 Basis of preparation (continued)
(iii) Estimated effect on the consolidated statement of financial position as at 31 December 2013Changes in accounting policies
HKAS 19
(2011) HKFRS 11 Total
HK$ millions HK$ millions HK$ millions
ASSETS
Non-current assets
Fixed assets - - -
Investment properties - - -
Leasehold land - - -
Telecommunications licences - - -
Goodwill - - -
Brand names and other rights - - -
Associated companies 24 (43,136) (43,112)
Interests in joint ventures (2) 43,136 43,134
Deferred tax assets (8) - (8)
Other non-current assets - - -
Liquid funds and other listed investments - - -
14 - 14
Current assets
Cash and cash equivalents - - -
Trade and other receivables - - -
Inventories - - -
- - -
Current liabilities
Trade and other payables - - -
Bank and other debts - - -
Current tax liabilities - - -
- - -
Net current assets - - -
Total assets less current liabilities 14 - 14
Non-current liabilities
Bank and other debts - - -
Interest bearing loans from non-controlling shareholders - - -
Deferred tax liabilities (10) - (10)
Pension obligations 71 - 71
Other non-current liabilities - - -
61 - 61
Net assets (47) - (47)
CAPITAL AND RESERVES
Share capital - - -
Perpetual capital securities - - -
Reserves (34) - (34)
Total ordinary shareholders’ funds and perpetual capital securities (34) - (34)
Non-controlling interests (13) - (13)
Total equity (47) - (47)
HWL 2013 Annual Results Page 17 of 45

1 Basis of preparation (continued)
(iv) Effect on the consolidated income statement for the year ended 31 December 2012
Changes in accounting policies
As previously
reported
HKAS 19
(2011) HKFRS 11 As restated
HK$ millions HK$ millions HK$ millions HK$ millions
Revenue 243,089 - - 243,089
Cost of inventories sold (98,113) - - (98,113)
Staff costs (31,171) (245) - (31,416)
Telecommunications customer acquisition costs (25,514) - - (25,514)
Depreciation and amortisation (14,149) - - (14,149)
Other operating expenses (50,364) - - (50,364)
Change in fair value of investment properties 790 - - 790
Profits on disposal of investments and others (2,052) - - (2,052)
Share of profits less losses after tax of:
Associated companies 14,978 (20) (4,400) 10,558
Joint ventures 6,530 (6) 4,400 10,924
44,024 (271) - 43,753
Interest expenses and other finance costs (9,243) - - (9,243)
Profit before tax 34,781 (271) - 34,510
Current tax (3,097) 18 - (3,079)
Deferred tax 676 - - 676
Profit after tax 32,360 (253) - 32,107
Allocated as : Profit attributable to non-controlling interests and holders of perpetual
capital securities (6,232) 22 - (6,210)
Profit attributable to ordinary shareholders of the Company 26,128 (231) - 25,897
Earnings per share for profit attributable to ordinary shareholders of the Company HK$ 6.13 (HK$ 0.06) - HK$ 6.07
(v) Effect on the consolidated statement of comprehensive income for the year ended 31 December 2012
Changes in accounting policies
As previously
reported
HKAS 19
(2011) HKFRS 11 As restated
HK$ millions HK$ millions HK$ millions HK$ millions
Profit after tax 32,360 (253) - 32,107
Other comprehensive income (losses)
Items that will not be reclassified to profit or loss:
Remeasurement of defined benefit obligations recognised directly in reserves (825) 248 - (577)
Share of other comprehensive income of associated companies 100 20 127 247
Share of other comprehensive income (losses) of joint ventures (8) 6 (127) (129)
Tax relating to items that will not be reclassified to profit or loss 87 (19) - 68
(646) 255 - (391)
Items that have been reclassified or may be subsequently reclassified to profit or loss:
Available-for-sale investments
Valuation gains recognised directly in reserves 1,761 - - 1,761
Valuation gains previously in reserves recognised in income statement (210) - - (210)
Losses on cash flow hedges arising from forward foreign currency contracts and
interest rate swap contracts recognised directly in reserves (57) - - (57)
Gains on translating overseas subsidiaries’ net assets recognised directly in reserves 1,833 - - 1,833
Losses previously in exchange reserve related to subsidiaries disposed during the
year recognised in income statement 69 - - 69
Share of other comprehensive income (losses) of associated companies 2,205 - (680) 1,525
Share of other comprehensive income of joint ventures 944 - 680 1,624
Tax relating to items that have been reclassified or may be subsequently reclassified
to profit or loss (82) - - (82)
6,463 - - 6,463
Other comprehensive income after tax 5,817 255 - 6,072
Total comprehensive income 38,177 2 - 38,179
Allocated as : Attributable to non-controlling interests and holders of perpetual
capital securities (6,592) (1) - (6,593)
Attributable to ordinary shareholders of the Company 31,585 1 - 31,586
HWL 2013 Annual Results Page 18 of 45

1 Basis of preparation (continued)
(vi) Effect on the consolidated statement of financial position as at 31 December 2012
Changes in accounting policies
As previously
reported
HKAS 19
(2011) HKFRS 11 As restated
HK$ millions HK$ millions HK$ millions HK$ millions
ASSETS
Non-current assets
Fixed assets 167,588 - - 167,588
Investment properties 43,652 - - 43,652
Leasehold land 9,495 - - 9,495
Telecommunications licences 78,655 - - 78,655
Goodwill 26,492 - - 26,492
Brand names and other rights 15,328 - - 15,328
Associated companies 151,860 - (38,555) 113,305
Interests in joint ventures 70,397 (2) 38,555 108,950
Deferred tax assets 18,067 (8) - 18,059
Other non-current assets 9,579 - - 9,579
Liquid funds and other listed investments 23,499 - - 23,499
614,612 (10) - 614,602
Current assets
Cash and cash equivalents 107,948 - - 107,948
Trade and other receivables 61,788 - - 61,788
Inventories 19,533 - - 19,533
189,269 - - 189,269
Current liabilities
Trade and other payables 78,471 - - 78,471
Bank and other debts 39,596 - - 39,596
Current tax liabilities 2,856 - - 2,856
120,923 - - 120,923
Net current assets 68,346 - - 68,346
Total assets less current liabilities 682,958 (10) - 682,948
Non-current liabilities
Bank and other debts 220,440 - - 220,440
Interest bearing loans from non-controlling shareholders 6,307 - - 6,307
Deferred tax liabilities 8,973 (5) - 8,968
Pension obligations 3,570 46 - 3,616
Other non-current liabilities 5,076 - - 5,076
244,366 41 - 244,407
Net assets 438,592 (51) - 438,541
CAPITAL AND RESERVES
Share capital 1,066 - - 1,066
Perpetual capital securities 23,400 - - 23,400
Reserves 367,093 (40) - 367,053
Total ordinary shareholders’ funds and perpetual capital securities 391,559 (40) - 391,519
Non-controlling interests 47,033 (11) - 47,022
Total equity 438,592 (51) - 438,541
HWL 2013 Annual Results Page 19 of 45

1 Basis of preparation (continued)
(vii) Effect on the consolidated income statement for the year ended 31 December 2011
Changes in accounting policies
As previously
reported
HKAS 19
(2011) HKFRS 11 As restatedHK$ millions HK$ millions HK$ millions HK$ millions
Revenue 233,700 - - 233,700
Cost of inventories sold (93,059) - - (93,059)
Staff costs (30,488) (222) - (30,710)
Telecommunications customer acquisition costs (22,497) - - (22,497)
Depreciation and amortisation (14,080) - - (14,080)
Other operating expenses (53,055) - - (53,055)
Change in fair value of investment properties - - - -
Profits on disposal of investments and others 43,147 - - 43,147
Share of profits less losses after tax of:
Associated companies 13,819 (16) (3,142) 10,661
Joint ventures 5,877 (5) 3,142 9,014
83,364 (243) - 83,121
Interest expenses and other finance costs (8,415) - - (8,415)
Profit before tax 74,949 (243) - 74,706
Current tax (3,237) 15 - (3,222)
Deferred tax 2,150 4 - 2,154
Profit after tax 73,862 (224) - 73,638
Allocated as : Profit attributable to non-controlling interests and holders of perpetual
capital securities (17,843) 29 - (17,814)
Profit attributable to ordinary shareholders of the Company 56,019 (195) - 55,824
Earnings per share for profit attributable to ordinary shareholders of the Company HK$ 13.14 (HK$ 0.05) - HK$ 13.09
(viii) Effect on the consolidated statement of comprehensive income for the year ended 31 December 2011
Changes in accounting policies
As previously
reported
HKAS 19
(2011) HKFRS 11 As restatedHK$ millions HK$ millions HK$ millions HK$ millions
Profit after tax 73,862 (224) - 73,638
Other comprehensive income (losses)Items that will not be reclassified to profit or loss:Remeasurement of defined benefit obligations recognised directly in reserves (1,607) 212 - (1,395) Revaluation gains recognised directly in reserves upon transfer from other properties
to investment properties 8 - - 8 Share of other comprehensive income (losses) of associated companies (1,862) 16 880 (966) Share of other comprehensive income (losses) of joint ventures (29) 5 (880) (904) Tax relating to items that will not be reclassified to profit or loss 170 (16) - 154
(3,320) 217 - (3,103)
Items that have been reclassified or may be subsequently reclassified to profit or loss:Available-for-sale investments
Valuation gains recognised directly in reserves 298 - - 298 Valuation gains previously in reserves recognised in income statement (280) - - (280)
Cash flow hedges arising from forward foreign currency contracts and interest rate swap contracts:Losses recognised directly in reserves (240) - - (240) Losses previously in reserves recognised in initial cost of non-financial items 7 - - 7
Gains on translating overseas subsidiaries’ net assets recognised directly in reserves 1,620 - - 1,620
Losses previously in exchange and other reserves related to subsidiaries disposed
during the year recognised in income statement 937 - - 937
Share of other comprehensive income (losses) of associated companies (1,668) - 270 (1,398)
Share of other comprehensive income (losses) of joint ventures 1,655 - (270) 1,385
Tax relating to items that have been reclassified or may be subsequently reclassified
to profit or loss (64) - - (64)
2,265 - - 2,265
Other comprehensive income (losses) after tax (1,055) 217 - (838)
Total comprehensive income (losses) 72,807 (7) - 72,800
Allocated as : Attributable to non-controlling interests and holders of perpetual
capital securities (17,150) 8 - (17,142)
Attributable to ordinary shareholders of the Company 55,657 1 - 55,658
HWL 2013 Annual Results Page 20 of 45

1 Basis of preparation (continued)
(ix) Effect on the consolidated statement of financial position as at 1 January 2012
Changes in accounting policies
As previously
reported
HKAS 19
(2011) HKFRS 11 As restated
HK$ millions HK$ millions HK$ millions HK$ millions
ASSETS
Non-current assets
Fixed assets 155,502 - - 155,502
Investment properties 42,610 - - 42,610
Leasehold land 10,004 - - 10,004
Telecommunications licences 75,503 - - 75,503
Goodwill 26,338 - - 26,338
Brand names and other rights 12,615 - - 12,615
Associated companies 137,703 - (32,198) 105,505
Interests in joint ventures 67,562 (2) 32,198 99,758
Deferred tax assets 16,992 (7) - 16,985
Other non-current assets 10,184 - - 10,184
Liquid funds and other listed investments 20,239 - - 20,239
575,252 (9) - 575,243
Current assets
Cash and cash equivalents 66,539 - - 66,539
Trade and other receivables 60,345 - - 60,345
Inventories 18,408 - - 18,408
145,292 - - 145,292
Current liabilities
Trade and other payables 78,093 - - 78,093
Bank and other debts 28,835 - - 28,835
Current tax liabilities 2,431 - - 2,431
109,359 - - 109,359
Net current assets 35,933 - - 35,933
Total assets less current liabilities 611,185 (9) - 611,176
Non-current liabilities
Bank and other debts 189,719 - - 189,719
Interest bearing loans from non-controlling shareholders 6,502 - - 6,502
Deferred tax liabilities 8,893 (5) - 8,888
Pension obligations 2,992 49 - 3,041
Other non-current liabilities 4,296 - - 4,296
212,402 44 - 212,446
Net assets 398,783 (53) - 398,730
CAPITAL AND RESERVES
Share capital 1,066 - - 1,066
Perpetual capital securities 15,600 - - 15,600
Reserves 342,946 (41) - 342,905
Total ordinary shareholders’ funds and perpetual capital securities 359,612 (41) - 359,571
Non-controlling interests 39,171 (12) - 39,159
Total equity 398,783 (53) - 398,730
HWL 2013 Annual Results Page 21 of 45

2 Operating segment information
Save as disclosed in the notes below, the column headed as Company and Subsidiaries refers to the Company and subsidiary
companies’ respective items and the column headed as Associates and JV refers to the Group’s share of associated companies and
joint ventures’ respective items, and segments are reported in a manner consistent with internal reporting provided to the board of
directors of the Company who is responsible for allocating resources and assessing performance of the operating segments.
The Group’s telecommunications division consists of a 65.01% interest in Hutchison Telecommunications Hong Kong Holdings,
which is listed on the Stock Exchange of Hong Kong, Hutchison Asia Telecommunications, an 87.87% interest in the Australian
Securities Exchange listed Hutchison Telecommunications (Australia) (“HTAL”), which has a 50% interest in a joint venture
company, Vodafone Hutchison Australia Pty Limited (“VHA”), and 3 Group Europe with businesses in 6 countries in Europe.
From the second half of 2012, VHA is undergoing a shareholder-sponsored restructuring under the leadership of the other
shareholder under the applicable terms of the shareholders’ agreement. In order to assist in providing a meaningful analysis of the
ongoing operating activities, HTAL’s share of VHA’s results for the year ended 31 December 2013 and the second half of 2012
(including VHA’s share of certain network closure costs and restructuring costs) are presented as separate items within the income
statement line item titled profits on disposal of investments and others (see note 3(c)) to separately identify them from the Group’s
recurring earnings profile during this phase. The share of VHA’s results for the first half of 2012 is presented in this segmental
analysis as the “Reconciliation item” to reconcile segment results to consolidated results of the Company.
The Group is continuing to assess its strategic options for maximising the value and future growth potential of the Retail division. This
strategic review process may include considering the possibility of public offerings (whilst retaining control) in all or some of the retail
businesses in appropriate markets. Whilst no decision has been made at this time to pursue any particular option, the Marionnaud
business will not be considered at this stage as a potential initial public offerings candidate. As a result, the Marionnaud business is
excluded from the Retail segment and is now included as part of the “Others” operation under Finance & Investments and Others.
Finance & Investments and Others is presented to reconcile to the totals included in the Group’s income statement and statement of
financial position. As additional information, “Others” is presented as a separate line item, within Finance & Investments and Others,
which covers the activities of other Group areas which are not presented separately and includes Hutchison Whampoa (China),
Hutchison E-Commerce and corporate head office operations, the Marionnaud business, listed subsidiary Hutchison China
MediTech Limited, listed subsidiary Hutchison Harbour Ring and listed associate Tom Group. “Finance & Investments” within
Finance & Investments and Others represents returns earned on the Group’s holdings of cash and liquid investments.
Prior year corresponding segment information that is presented for comparative purposes has been restated to conform to changes
adopted in the current year.
Revenue from external customers is after elimination of inter-segment revenue. The amount eliminated mainly attributable to
Property and hotels is HK$384 million (2012 – HK$353 million), Hutchison Telecommunications Hong Kong Holdings is
HK$134 million (2012 – HK$119 million) and Hutchison Asia Telecommunications is HK$10 million (2012 – HK$8 million).
HWL 2013 Annual Results Page 22 of 45

2 Operating segment information (continued)
(a) The following is an analysis of the Group’s revenue by operating segments:
Company and Associates 2013 Company and Associates 2012
Subsidiaries and JV Total Subsidiaries and JV Total
HK$ millions HK$ millions HK$ millions % HK$ millions HK$ millions HK$ millions %
Ports and related services 26,562 7,557 34,119 8% 25,647 7,294 32,941 8%
Hutchison Ports Group other than
HPH Trust 26,488 4,872 31,360 7% 25,627 4,581 30,208 7%
HPH Trust #
74 2,685 2,759 1% 20 2,713 2,733 1%
Property and hotels 6,807 17,457 24,264 6% 6,341 13,629 19,970 5%
Retail 119,637 29,510 149,147 36% 111,418 27,101 138,519 35%
Cheung Kong Infrastructure 5,087 37,373 42,460 10% 4,254 35,439 39,693 10%
Husky Energy * - 59,481 59,481 14% - 58,744 58,744 15%
3 Group Europe 61,968 8 61,976 15% 58,708 - 58,708 15%
Hutchison Telecommunications Hong
Kong Holdings 12,777 - 12,777 3% 15,536 - 15,536 4%
Hutchison Asia Telecommunications 6,295 - 6,295 2% 4,452 - 4,452 1%
Finance & Investments and Others 17,101 5,313 22,414 6% 16,733 4,967 21,700 5%
Finance & Investments 1,432 889 2,321 1% 1,619 769 2,388 -
Others 15,669 4,424 20,093 5% 15,114 4,198 19,312 5%
256,234 156,699 412,933 100% 243,089 147,174 390,263 98%
Reconciliation item @
- - - - - 7,648 7,648 2%
256,234 156,699 412,933 100% 243,089 154,822 397,911 100%
Non-controlling interests’ share of
HPH Trust’s revenue - 897 897 - 886 886
256,234 157,596 413,830 243,089 155,708 398,797
# represents the Group’s attributable share of HPH Trust’s revenue based on the effective shareholdings in HPH Trust during 2013.
Revenue reduced by HK$897 million and HK$886 million for 2013 and 2012 respectively, being adjustments to exclude
non-controlling interests’ share of revenue of HPH Trust.
* revenue reduced by HK$480 million for the year ended 31 December 2012 due to reclassification adjustments made by Husky Energy
to its 2012 reported revenue and cost of sales following a change in presentation of trading activities and a change in the classification
of certain trading transactions.
@ the reconciliation item represents revenue of HTAL and its share of VHA for the first half of 2012 of HK$7,648 million.
Revenue
HWL 2013 Annual Results Page 23 of 45

2 Operating segment information (continued)
(b) The Group uses two measures of segment results, EBITDA (see note 2(m)) and EBIT (see note 2(n)). The following is an
analysis of the Group’s results by operating segments by EBITDA:
Company and Associates 2013 Company and Associates 2012
Subsidiaries and JV Total Subsidiaries and JV Total
HK$ millions HK$ millions HK$ millions % HK$ millions HK$ millions HK$ millions %
Ports and related services 7,822 3,625 11,447 12% 7,350 3,993 11,343 13%
Hutchison Ports Group other than
HPH Trust 7,757 2,303 10,060 11% 7,342 2,551 9,893 11%
HPH Trust #
65 1,322 1,387 1% 8 1,442 1,450 2%
Property and hotels 7,340 6,655 13,995 15% 4,129 6,758 10,887 12%
Retail 11,684 2,474 14,158 15% 10,310 2,469 12,779 15%
Cheung Kong Infrastructure 1,657 21,184 22,841 24% 1,699 19,706 21,405 25%
Husky Energy - 14,779 14,779 15% - 14,889 14,889 17%
3 Group Europe 12,697 (26) 12,671 13% 9,227 (14) 9,213 11%
Hutchison Telecommunications Hong
Kong Holdings 2,694 64 2,758 3% 3,020 30 3,050 3%
Hutchison Asia Telecommunications (o)
819 - 819 1% 423 - 423 -
Finance & Investments and Others 439 1,740 2,179 2% 1,084 1,395 2,479 3%
Finance & Investments 1,919 889 2,808 3% 2,235 769 3,004 4%
Others (1,480) 851 (629) -1% (1,151) 626 (525) -1%
45,152 50,495 95,647 100% 37,242 49,226 86,468 99%
Reconciliation item @
- - - - (7) 875 868 1%
EBITDA before property revaluation
and profits on disposal of
investments and others 45,152 50,495 95,647 100% 37,235 50,101 87,336 100%
Profits on disposal of investments
(see note 3) 1,889 - 1,889 - - -
Non-controlling interests’ share of
HPH Trust’s EBITDA - 634 634 - 611 611
EBITDA 47,041 51,129 98,170 37,235 50,712 87,947
Depreciation and amortisation (15,850) (15,421) (31,271) (14,149) (15,834) (29,983)
One-time gains (p)
- - - 447 - 447
Change in fair value of investment
properties 26 2 28 790 377 1,167
Others (see note 3) - (2,163) (2,163) - (2,052) (2,052)
Group’s share of the following income
statement items of associated
companies and joint ventures:
Interest expenses and other finance costs - (5,768) (5,768) - (7,116) (7,116)
Current tax - (6,741) (6,741) - (5,564) (5,564)
Deferred tax - 192 192 - (731) (731)
Non-controlling interests - (363) (363) - (362) (362)
31,217 20,867 52,084 24,323 19,430 43,753
# represents the Group’s attributable share of HPH Trust’s EBITDA based on the effective shareholdings in HPH Trust during 2013.
EBITDA reduced by HK$634 million and HK$611 million for 2013 and 2012 respectively, being adjustments to exclude
non-controlling interests’ share of EBITDA of HPH Trust.
@ the reconciliation item represents EBITDA of HTAL and its share of VHA for the first half of 2012 of HK$868 million.
EBITDA (LBITDA) (m)
HWL 2013 Annual Results Page 24 of 45

2 Operating segment information (continued)
(c) The following is an analysis of the Group’s results by operating segments by EBIT:
Company and Associates 2013 Company and Associates 2012
Subsidiaries and JV Total Subsidiaries and JV Total
HK$ millions HK$ millions HK$ millions % HK$ millions HK$ millions HK$ millions %
Ports and related services 4,981 2,377 7,358 12% 4,894 2,787 7,681 13%
Hutchison Ports Group other than
HPH Trust 4,916 1,657 6,573 11% 4,886 1,920 6,806 12%
HPH Trust #
65 720 785 1% 8 867 875 1%
Property and hotels 7,122 6,537 13,659 21% 3,883 6,638 10,521 18%
Retail 9,864 1,907 11,771 18% 8,395 1,962 10,357 18%
Cheung Kong Infrastructure 1,424 16,104 17,528 27% 1,581 15,062 16,643 29%
Husky Energy - 7,208 7,208 11% - 7,427 7,427 13%
3 Group Europe (p)
EBITDA before the following
non-cash items (see note 11(e)): 12,697 (26) 12,671 9,227 (14) 9,213
Depreciation (6,941) - (6,941) (6,248) - (6,248)
Amortisation of licence fees and
other rights (874) - (874) (267) - (267)
One-time gains (p)
- - - 447 - 447
EBIT (LBIT) - 3 Group Europe (p)
4,882 (26) 4,856 8% 3,159 (14) 3,145 5%
Hutchison Telecommunications Hong
Kong Holdings 1,359 8 1,367 2% 1,738 6 1,744 3%
Hutchison Asia Telecommunications (o)
(409) - (409) -1% (846) - (846) -1%
Finance & Investments and Others 79 1,180 1,259 2% 736 1,178 1,914 3%
Finance & Investments 1,919 889 2,808 4% 2,235 769 3,004 5%
Others (1,840) 291 (1,549) -2% (1,499) 409 (1,090) -2%
29,302 35,295 64,597 100% 23,540 35,046 58,586 101%
Reconciliation item @
- - - - (7) (560) (567) -1%
EBIT before property revaluation
and profits on disposal of
investments and others 29,302 35,295 64,597 100% 23,533 34,486 58,019 100%
Change in fair value of investment
properties 26 2 28 790 377 1,167
EBIT 29,328 35,297 64,625 24,323 34,863 59,186
Profits on disposal of investments
and others (see note 3) 1,889 (2,163) (274) - (2,052) (2,052)
Non-controlling interests’ share of
HPH Trust’s EBIT - 413 413 - 392 392
Group’s share of the following income
statement items of associated
companies and joint ventures:
Interest expenses and other finance costs - (5,768) (5,768) - (7,116) (7,116)
Current tax - (6,741) (6,741) - (5,564) (5,564)
Deferred tax - 192 192 - (731) (731)
Non-controlling interests - (363) (363) - (362) (362)
31,217 20,867 52,084 24,323 19,430 43,753
# represents the Group’s attributable share of HPH Trust’s EBIT based on the effective shareholdings in HPH Trust during 2013.
EBIT reduced by HK$413 million and HK$392 million for 2013 and 2012 respectively, being adjustments to exclude
non-controlling interests’ share of EBIT of HPH Trust.
@ the reconciliation item represents LBIT of HTAL and its share of VHA for the first half of 2012 of HK$567 million.
EBIT (LBIT) (n)
HWL 2013 Annual Results Page 25 of 45

2 Operating segment information (continued)
(d) The following is an analysis of the Group’s depreciation and amortisation by operating segments:
Company and Associates 2013 Company and Associates 2012
Subsidiaries and JV Total Subsidiaries and JV Total
HK$ millions HK$ millions HK$ millions HK$ millions HK$ millions HK$ millions
Ports and related services 2,841 1,248 4,089 2,456 1,206 3,662
Hutchison Ports Group other than HPH Trust 2,841 646 3,487 2,456 631 3,087
HPH Trust #
- 602 602 - 575 575
Property and hotels 218 118 336 246 120 366
Retail 1,820 567 2,387 1,915 507 2,422
Cheung Kong Infrastructure 233 5,080 5,313 118 4,644 4,762
Husky Energy - 7,571 7,571 - 7,462 7,462
3 Group Europe 7,815 - 7,815 6,515 - 6,515
Hutchison Telecommunications Hong Kong Holdings 1,335 56 1,391 1,282 24 1,306
Hutchison Asia Telecommunications 1,228 - 1,228 1,269 - 1,269
Finance & Investments and Others 360 560 920 348 217 565
Finance & Investments - - - - - -
Others 360 560 920 348 217 565
15,850 15,200 31,050 14,149 14,180 28,329
Reconciliation item @
- - - - 1,435 1,435
15,850 15,200 31,050 14,149 15,615 29,764
Non-controlling interests’ share of HPH Trust’s
depreciation and amortisation - 221 221 - 219 219
15,850 15,421 31,271 14,149 15,834 29,983
# represents the Group’s attributable share of HPH Trust’s depreciation and amortisation based on the effective shareholdings in HPH Trust
during 2013. Depreciation and amortisation reduced by HK$221 million and HK$219 million for 2013 and 2012 respectively, being
adjustments to exclude non-controlling interests’ share of depreciation and amortisation of HPH Trust.
@ the reconciliation item represents depreciation and amortisation of HTAL and its share of VHA for the first half of 2012 of HK$1,435 million.
(e) The following is an analysis of the Group’s capital expenditure by operating segments:
Fixed assets, Fixed assets,
investment Telecom- Brand names investment Telecom- Brand names
properties and munications and 2013 properties and munications and 2012
leasehold land licences other rights Total leasehold land licences other rights Total
HK$ millions HK$ millions HK$ millions HK$ millions HK$ millions HK$ millions HK$ millions HK$ millions
Ports and related services 7,060 - 11 7,071 7,556 - - 7,556
Hutchison Ports Group other
than HPH Trust 7,060 - 11 7,071 7,556 - - 7,556
HPH Trust - - - - - - - -
Property and hotels 535 - - 535 271 - - 271
Retail 2,264 - - 2,264 2,717 - - 2,717
Cheung Kong Infrastructure 406 - 11 417 680 - - 680
Husky Energy - - - - - - - -
3 Group Europe (q)
10,116 6,824 60 17,000 11,323 2,253 23 13,599
Hutchison Telecommunications
Hong Kong Holdings 1,239 4 23 1,266 1,600 152 20 1,772
Hutchison Asia
Telecommunications 1,621 - - 1,621 2,017 17 97 2,131
Finance & Investments
and Others 319 - - 319 381 - - 381
Finance & Investments - - - - - - - -
Others 319 - - 319 381 - - 381
23,560 6,828 105 30,493 26,545 2,422 140 29,107
Depreciation and amortisation
Capital expenditure
HWL 2013 Annual Results Page 26 of 45

2 Operating segment information (continued)
(f) The following is an analysis of the Group’s total assets by operating segments:
Investments Investments
in associated in associated
Deferred companies and 2013 Deferred companies and 2012
Segment tax interests in Total Segment tax interests in Total
assets (r)
assets joint ventures assets assets (r)
assets joint ventures assets
HK$ millions HK$ millions HK$ millions HK$ millions HK$ millions HK$ millions HK$ millions HK$ millions
Ports and related services 71,164 169 27,548 98,881 66,021 165 27,936 94,122
Hutchison Ports Group other
than HPH Trust 71,164 169 13,483 84,816 66,021 165 13,332 79,518
HPH Trust - - 14,065 14,065 - - 14,604 14,604
Property and hotels 53,049 21 42,839 95,909 51,344 40 41,379 92,763
Retail 39,329 670 5,035 45,034 36,325 545 6,435 43,305
Cheung Kong Infrastructure 20,134 21 85,589 105,744 17,406 22 77,111 94,539
Husky Energy - - 51,833 51,833 - - 54,023 54,023
3 Group Europe (s)
235,401 17,265 18 252,684 208,310 16,850 9 225,169
Hutchison Telecommunications
Hong Kong Holdings 19,169 369 715 20,253 19,296 369 484 20,149
Hutchison Asia
Telecommunications 20,785 1 - 20,786 21,387 1 - 21,388
Finance & Investments
and Others 114,614 30 4,831 119,475 143,445 32 2,874 146,351
Finance & Investments 89,947 - - 89,947 118,506 - - 118,506
Others 24,667 30 4,831 29,528 24,939 32 2,874 27,845
573,645 18,546 218,408 810,599 563,534 18,024 210,251 791,809
Reconciliation item @
- 2 4,921 4,923 23 35 12,004 12,062
573,645 18,548 223,329 815,522 563,557 18,059 222,255 803,871
@ the reconciliation item comprises total assets of HTAL.
(g) The following is an analysis of the Group’s total liabilities by operating segments:
Current & Current &
non-current non-current
borrowings (u)
borrowings (u)
and other Current & 2013 and other Current & 2012
Segment non-current deferred tax Total Segment non-current deferred tax Total
liabilities (t)
liabilities liabilities liabilities liabilities (t)
liabilities liabilities liabilities
HK$ millions HK$ millions HK$ millions HK$ millions HK$ millions HK$ millions HK$ millions HK$ millions
Ports and related services 17,031 28,559 4,843 50,433 16,158 27,945 5,038 49,141
Hutchison Ports Group other
than HPH Trust 17,031 28,559 4,843 50,433 16,158 27,945 5,038 49,141
HPH Trust - - - - - - - -
Property and hotels 4,156 409 2,730 7,295 2,384 450 2,364 5,198
Retail 24,670 87 1,066 25,823 22,441 174 1,105 23,720
Cheung Kong Infrastructure 5,200 13,443 1,532 20,175 3,453 11,599 1,010 16,062
Husky Energy - - - - - - - -
3 Group Europe 23,630 101,565 930 126,125 20,979 128,645 213 149,837
Hutchison Telecommunications
Hong Kong Holdings 3,860 5,447 356 9,663 4,820 4,691 289 9,800
Hutchison Asia
Telecommunications 3,151 1,550 3 4,704 2,953 2,142 2 5,097
Finance & Investments
and Others 8,085 84,776 2,087 94,948 8,716 95,773 1,803 106,292
Finance & Investments - 78,011 - 78,011 - 89,342 - 89,342
Others 8,085 6,765 2,087 16,937 8,716 6,431 1,803 16,950
89,783 235,836 13,547 339,166 81,904 271,419 11,824 365,147
Reconciliation item @
124 - - 124 183 - - 183
89,907 235,836 13,547 339,290 82,087 271,419 11,824 365,330
@ the reconciliation item comprises total liabilities of HTAL.
Total liabilities
Total assets
Company and Company and
Subsidiaries Subsidiaries
HWL 2013 Annual Results Page 27 of 45

2 Operating segment information (continued)
Additional information in respect of geographical locations
(h) Additional disclosures of the Group’s revenue by geographical location are shown below:
Company and Associates 2013 Company and Associates 2012
Subsidiaries and JV Total Subsidiaries and JV Total
HK$ millions HK$ millions HK$ millions % HK$ millions HK$ millions HK$ millions %
Hong Kong 53,536 8,676 62,212 15% 53,705 10,294 63,999 16%
Mainland China 27,152 21,667 48,819 12% 24,110 18,602 42,712 11%
Europe 120,969 49,740 170,709 41% 114,980 43,863 158,843 40%
Canada (v)
96 59,551 59,647 14% 111 58,707 58,818 15%
Asia, Australia and others 37,380 11,752 49,132 12% 33,450 18,389 51,839 13%
Finance & Investments and Others 17,101 5,313 22,414 6% 16,733 4,967 21,700 5%
256,234 156,699 412,933 (1)
100% 243,089 154,822 397,911 (1)
100%
(1) see note 2(a) for reconciliation to total revenue included in the Group’s income statement.
(i) Additional disclosures of the Group’s EBITDA by geographical location are shown below:
Company and Associates 2013 Company and Associates 2012
Subsidiaries and JV Total Subsidiaries and JV Total
HK$ millions HK$ millions HK$ millions % HK$ millions HK$ millions HK$ millions %
Hong Kong 8,765 4,741 13,506 14% 6,892 5,232 12,124 14%
Mainland China 5,320 8,871 14,191 15% 4,074 8,460 12,534 14%
Europe 21,158 15,767 36,925 39% 16,771 13,809 30,580 35%
Canada (v)
83 14,550 14,633 15% 95 14,650 14,745 17%
Asia, Australia and others 9,387 4,826 14,213 15% 8,319 6,555 14,874 17%
Finance & Investments and Others 439 1,740 2,179 2% 1,084 1,395 2,479 3%
EBITDA before property
revaluation and profits on disposal
of investments and others 45,152 50,495 95,647 100% 37,235 50,101 87,336 100%
(2) see note 2(b) for reconciliation to total EBITDA included in the Group’s income statement.
(j) Additional disclosures of the Group’s EBIT by geographical location are shown below:
Company and Associates 2013 Company and Associates 2012
Subsidiaries and JV Total Subsidiaries and JV Total
HK$ millions HK$ millions HK$ millions % HK$ millions HK$ millions HK$ millions %
Hong Kong 6,861 3,253 10,114 16% 5,059 3,796 8,855 15%
Mainland China 4,693 7,879 12,572 19% 3,524 7,499 11,023 19%
Europe 11,391 12,607 23,998 37% 8,806 11,132 19,938 34%
Canada (v)
83 6,987 7,070 11% 96 7,175 7,271 13%
Asia, Australia and others 6,195 3,389 9,584 15% 5,312 3,706 9,018 16%
Finance & Investments and Others 79 1,180 1,259 2% 736 1,178 1,914 3%
EBIT before property
revaluation and profits on disposal of investments and others 29,302 35,295 64,597 100% 23,533 34,486 58,019 100%
Change in fair value of investment
properties 26 2 28 790 377 1,167
EBIT 29,328 35,297 64,625 (3)
24,323 34,863 59,186 (3)
(3) see note 2(c) for reconciliation to total EBIT included in the Group’s income statement.
(2)
Revenue
EBIT (n)
EBITDA (m)
(2)
HWL 2013 Annual Results Page 28 of 45

2 Operating segment information (continued)
(k) Additional disclosures of the Group’s capital expenditure by geographical location are shown below:
Fixed assets, Fixed assets,
investment Telecom- Brand names investment Telecom- Brand names
properties and munications and 2013 properties and munications and 2012
leasehold land licences other rights Total leasehold land licences other rights Total
HK$ millions HK$ millions HK$ millions HK$ millions HK$ millions HK$ millions HK$ millions HK$ millions
Hong Kong 2,008 4 25 2,037 2,412 152 17 2,581
Mainland China 1,654 - - 1,654 2,228 - - 2,228
Europe 12,460 6,824 60 19,344 14,674 2,253 23 16,950
Canada - - - - - - - -
Asia, Australia
and others 7,119 - 20 7,139 6,850 17 100 6,967
Finance & Investments
and Others 319 - - 319 381 - - 381
23,560 6,828 105 30,493 26,545 2,422 140 29,107
(l) Additional disclosures of the Group’s total assets by geographical location are shown below:
Investments Investments
in associated in associated
Deferred companies and 2013 Deferred companies and 2012
Segment tax interests in Total Segment tax interests in Total
assets (r)
assets joint ventures assets assets (r)
assets joint ventures assets
HK$ millions HK$ millions HK$ millions HK$ millions HK$ millions HK$ millions HK$ millions HK$ millions
Hong Kong 77,353 417 28,724 106,494 75,669 434 28,241 104,344
Mainland China 14,264 495 65,724 80,483 11,815 346 64,041 76,202
Europe 294,553 17,424 56,252 368,229 264,291 16,969 48,158 329,418
Canada (v)
329 - 47,701 48,030 410 - 50,325 50,735
Asia, Australia
and others 72,532 182 20,097 92,811 67,927 278 28,616 96,821
Finance & Investments
and Others 114,614 30 4,831 119,475 143,445 32 2,874 146,351
573,645 18,548 223,329 815,522 563,557 18,059 222,255 803,871
(m) EBITDA (LBITDA) represents the EBITDA (LBITDA) of the Company and subsidiary companies as well as the Group’s share
of the EBITDA (LBITDA) of associated companies and joint ventures except for HPH Trust which are included based on the
Group’s effective share of EBITDA for this operation. EBITDA (LBITDA) is defined as earnings (losses) before interest
expenses and other finance costs, tax, depreciation and amortisation, and includes profits on disposal of investments and
other earnings of a cash nature but excludes change in fair value of investment properties. Information concerning EBITDA
(LBITDA) has been included in the Group’s financial information and consolidated financial statements and is used by many
industries and investors as one measure of gross cash flow generation. The Group considers EBITDA (LBITDA) to be an
important performance measure which is used in the Group’s internal financial and management reporting to monitor business
performance. EBITDA (LBITDA) is therefore presented as a measure of segment results in accordance with HKFRS 8. EBITDA
(LBITDA) is not a measure of cash liquidity or financial performance under generally accepted accounting principles in Hong
Kong and the EBITDA (LBITDA) measures used by the Group may not be comparable to other similarly titled measures of
other companies. EBITDA (LBITDA) should not necessarily be construed as an alternative to cash flows or results from
operations as determined in accordance with generally accepted accounting principles in Hong Kong.
Capital expenditure
Company and
Subsidiaries
Total assets
Company and
Subsidiaries
HWL 2013 Annual Results Page 29 of 45

2 Operating segment information (continued)
(n) EBIT (LBIT) represents the EBIT (LBIT) of the Company and subsidiary companies as well as the Group’s share of the EBIT
(LBIT) of associated companies and joint ventures except for HPH Trust which are included based on the Group’s effective
share of EBIT for this operation. EBIT (LBIT) is defined as earnings (losses) before interest expenses and other finance
costs and tax. Information concerning EBIT (LBIT) has been included in the Group’s financial information and consolidated
financial statements and is used by many industries and investors as one measure of results from operations. The Group
considers EBIT (LBIT) to be an important performance measure which is used in the Group’s internal financial and management
reporting to monitor business performance. EBIT (LBIT) is therefore presented as a measure of segment results in accordance
with HKFRS 8. EBIT (LBIT) is not a measure of financial performance under generally accepted accounting principles in
Hong Kong and the EBIT (LBIT) measures used by the Group may not be comparable to other similarly titled measures of
other companies. EBIT (LBIT) should not necessarily be construed as an alternative to results from operations as determined
in accordance with generally accepted accounting principles in Hong Kong.
(o) Included in EBITDA and EBIT of Hutchison Asia Telecommunications in 2013 are compensation contributions amounting to
HK$717 million (2012 - HK$1,590 million).
(p) Included in comparable EBIT (LBIT) of 3 Group Europe in 2012 is a one-time net gain of HK$447 million from a network sharing
arrangement, which includes a benefit of HK$2,032 million from future cost savings arising from a right to share another Irish
operator’s mobile network, partially offset by a HK$1,585 million one-time provision mainly related to the restructuring of
3 Ireland’s network infrastructure.
(q) Included in capital expenditures of 3 Group Europe in 2013 is the effect of foreign exchange translation of overseas subsidiaries’
fixed assets balances at 31 December 2013 which has an effect of increasing total expenditures by HK$150 million (2012 -
HK$253 million).
(r) Segment assets comprise fixed assets, investment properties, leasehold land, telecommunications licences, goodwill, brand
names and other rights, other non-current assets, liquid funds and other listed investments, cash and cash equivalents and
other current assets. As additional information, non-current assets (excluding financial instruments, deferred tax assets,
post-employment benefits assets and assets from insurance contracts) for Hong Kong, Mainland China, Europe, Canada,
and Asia, Australia and others amounted to HK$96,779 million (2012 - HK$95,803 million), HK$76,967 million (2012 -
HK$73,676 million), HK$305,349 million (2012 - HK$270,566 million), HK$47,742 million (2012 - HK$50,366 million) and
HK$69,478 million (2012 - HK$73,054 million) respectively.
(s) Included in total assets of 3 Group Europe is an unrealised foreign currency exchange gain in 2013 of HK$3,129 million
(2012 - HK$3,055 million) from the translation of overseas subsidiaries accounts to Hong Kong dollars with an offsetting
amount recorded in exchange reserve.
(t) Segment liabilities comprise trade and other payables and pension obligations.
(u) Current and non-current borrowings comprise bank and other debts and interest bearing loans from non-controlling
shareholders.
(v) Include contribution from the United States of America for Husky Energy.
HWL 2013 Annual Results Page 30 of 45

3 Profits on disposal of investments and others
Attributable to
Ordinary Holders of
shareholders perpetual Non-controlling
of the Company capital securities interests Total
HK$ millions HK$ millions HK$ millions HK$ millions
Year ended 31 December 2013
Profits on disposal of investments
3 Austria - one-time net gain (a)
569 - - 569
Gain on disposal of partial interest in Westports
in Malaysia at IPO (b)
1,056 - 264 1,320
1,625 - 264 1,889
Others - HTAL - share of operating losses of
joint venture VHA (c)
(1,458) - (201) (1,659)
167 - 63 230
Others - Share of Husky Energy’s impairment charge
on certain natural gas assets in Western Canada (d)
(504) - - (504)
Year ended 31 December 2012
Profits on disposal of investments - - - -
Others - HTAL - share of operating losses of
joint venture VHA for the second half of 2012 (c)
(1,803) - (249) (2,052)
(a) In 2013, the Group recognised a one-time net gain of HK$569 million, arising from the disposal of certain non-core
telecommunications assets in Austria of HK$2,648 million, upon completion of the acquisition of Orange Austria, net with
one-time costs of HK$2,079 million mainly relating to the restructuring of 3 Austria’s business on the acquisition of Orange
Austria. The relating tax effect is a tax credit of HK$389 million.
(b) In 2013, the Group recognised a one-time gain of HK$1,056 million, arising on the Group's reduced interest in Westports
Holdings Bhd (“Westports”) following Westports’ successful initial public offering of its shares.
(c) From the second half of 2012, VHA is undergoing a shareholder-sponsored restructuring under the leadership of the other
shareholder under the applicable terms of the shareholders’ agreement. In order to assist in providing a meaningful analysis
of the ongoing operating activities, HTAL’s share of VHA’s results for the year ended 31 December 2013 and the second
half of 2012 (including share of certain network closure costs and restructuring costs) are presented as separate items above
to separately identify them from the recurring earnings profile during this phase.
(d) In 2013, the Group recognised a one-time impairment charge of HK$504 million in relation to the Group’s share of impairment
charge on certain natural gas assets of Husky Energy in Western Canada.
HWL 2013 Annual Results Page 31 of 45

4 Interest expenses and other finance costs
2013 2012
HK$ millions HK$ millions
Bank loans and overdrafts 1,306 1,424
Other loans repayable within 5 years 73 59
Other loans not wholly repayable within 5 years 28 21
Notes and bonds repayable within 5 years 3,374 4,181
Notes and bonds not wholly repayable within 5 years 2,652 2,441
7,433 8,126
Interest bearing loans from non-controlling shareholders repayable within 5 years 186 233
Interest bearing loans from non-controlling shareholders not wholly repayable within 5 years 5 6
7,624 8,365
Amortisation of loan facilities fees and premiums or discounts relating to borrowings 274 273
Notional non-cash interest accretion (a)
422 461
Other finance costs 244 249
8,564 9,348
Less: interest capitalised (b)
(173) (105)
8,391 9,243
(a) Notional non-cash interest accretion represents notional adjustments to accrete the carrying amount of certain obligations
recognised in the statement of financial position such as asset retirement obligation to the present value of the estimated
future cash flows expected to be required for their settlement in the future.
(b) Borrowing costs have been capitalised at various applicable rates ranging from 0.1% to 6.6% per annum (2012 - 0.1% to
6.5% per annum).
5 Tax
Current Deferred 2013 Current Deferred 2012
tax tax Total tax tax Total
HK$ millions HK$ millions HK$ millions HK$ millions HK$ millions HK$ millions
Hong Kong 601 378 979 326 281 607
Outside Hong Kong 3,630 191 3,821 2,753 (957) 1,796
4,231 569 4,800 3,079 (676) 2,403
Hong Kong profits tax has been provided for at the rate of 16.5% (2012 - 16.5%) on the estimated assessable profits less
estimated available tax losses. Tax outside Hong Kong has been provided for at the applicable rate on the estimated
assessable profits less estimated available tax losses.
6 Earnings per share for profit attributable to ordinary shareholders of the Company
The calculation of earnings per share is based on profit attributable to ordinary shareholders of the Company HK$31,112 million
(2012 - HK$25,897 million) and on 4,263,370,780 shares in issue during 2013 (2012 - 4,263,370,780 shares).
The Company has no share option scheme. Certain of the Company’s subsidiary and associated companies have employee
share options outstanding as at 31 December 2013. The employee share options of these subsidiary and associated companies
outstanding as at 31 December 2013 did not have a dilutive effect on earnings per share.
HWL 2013 Annual Results Page 32 of 45

7 Distributions and dividends
2013 2012
HK$ millions HK$ millions
Distributions paid on perpetual capital securities 1,351 1,170
Dividends
Interim dividend 2,558 2,345
Proposed final dividend 7,248 6,523
9,806 8,868
Dividends per share
Interim dividend HK$ 0.60 HK$ 0.55
Proposed final dividend HK$ 1.70 HK$ 1.53
HK$ 2.30 HK$ 2.08
8 Cash and cash equivalents
2013 2012
HK$ millions HK$ millions
Cash at bank and in hand 24,149 25,697
Short term bank deposits 61,502 82,251
85,651 107,948
The carrying amount of cash and cash equivalents approximates their fair value.
9 Trade and other receivables
2013 2012
HK$ millions HK$ millions
Trade receivables 24,991 23,953
Less: provision for estimated impairment losses for bad debts (4,296) (4,307)
Trade receivables - net 20,695 19,646
Other receivables and prepayments 48,231 41,979
Fair value hedges
Interest rate swaps - 116
Cross currency interest rate swaps 76 -
Cash flow hedges
Forward foreign exchange contracts 81 47
69,083 61,788
Trade and other receivables are stated at the expected recoverable amount, net of any estimated impairment losses for bad
debts where it is deemed that a receivable may not be fully recoverable. The carrying amount of these assets approximates
their fair value.
Trade receivables exposures are managed locally in the operating units where they arise and credit limits are set as deemed
appropriate for the customer. The Group has established credit policies for customers in each of its core businesses. The
average credit period granted for trade receivables ranges from 30 to 45 days. As stated above trade receivables which are
past due at the end of the reporting period are stated at the expected recoverable amount, net of provision for estimated
impairment losses for bad debts. Given the profile of our customers and the Group’s different types of businesses, the Group
generally does not hold collateral over these balances.
HWL 2013 Annual Results Page 33 of 45

9 Trade and other receivables (continued)
The Group’s five largest customers contributed less than 4% of the Group’s turnover for the year ended 31 December 2013
(2012 - less than 5%).
At 31 December, the ageing analysis of the trade receivables presented based on the invoice date, is as follows:
2013 2012
HK$ millions HK$ millions
Less than 31 days 13,571 13,089
Within 31 to 60 days 2,091 1,689
Within 61 to 90 days 870 795
Over 90 days 8,459 8,380
24,991 23,953
10 Trade and other payables
2013 2012
HK$ millions HK$ millions
Trade payables 22,309 20,742
Other payables and accruals 61,901 55,932
Provisions 928 1,120
Interest free loans from non-controlling shareholders 1,181 476
Cash flow hedges
Forward foreign exchange contracts 493 201
86,812 78,471
The Group’s five largest suppliers accounted for less than 29% of the Group’s cost of purchases for the year ended
31 December 2013 (2012 - less than 30%).
At 31 December, the ageing analysis of the trade payables is as follows:
2013 2012
HK$ millions HK$ millions
Less than 31 days 15,176 13,842
Within 31 to 60 days 3,221 3,196
Within 61 to 90 days 1,607 1,457
Over 90 days 2,305 2,247
22,309 20,742
HWL 2013 Annual Results Page 34 of 45

11 Notes to consolidated statement of cash flows
(a) Reconciliation of profit after tax to cash generated from operating activities before interest expenses and other finance
costs, tax paid and changes in working capital
2013 2012
HK$ millions HK$ millions
Profit after tax 38,893 32,107
Less: share of profits less losses after tax of
Associated companies (10,433) (10,558)
Joint ventures (12,597) (10,924)
15,863 10,625
Adjustments for:
Current tax charge 4,231 3,079
Deferred tax charge (credit) 569 (676)
Interest expenses and other finance costs 8,391 9,243
Change in fair value of investment properties (26) (790)
Depreciation and amortisation 15,850 14,149
Others (see note 3) 2,163 2,052
Non-cash items (see note 11(e)) - (447)
EBITDA of Company and subsidiaries (i)
47,041 37,235
Loss (profit) on disposal of other unlisted investments 82 (67)
Loss (profit) on disposal of fixed assets, leasehold land and investment properties
and other assets (4,109) 383
Dividends received from associated companies and joint ventures 14,906 8,740
Distribution from property joint ventures 4,928 1,812
Profit on disposal of subsidiary companies and joint ventures (1,783) (393)
Profit on partial disposal of an associated company (1,320) -
Other non-cash items 1,153 (768)
60,898 46,942
2013 2012
HK$ millions HK$ millions
(i) Reconciliation of EBITDA:
EBITDA of Company and subsidiaries 47,041 37,235
Share of EBITDA of associated companies and joint ventures
Share of profits less losses after tax:
Associated companies 10,433 10,558
Joint ventures 12,597 10,924
Adjustment for:
Depreciation and amortisation 15,421 15,834
Change in fair value of investment properties (2) (377)
Interest expenses and other finance costs 5,768 7,116
Current tax charge 6,741 5,564
Deferred tax charge (credit) (192) 731
Non-controlling interests 363 362
51,129 50,712
EBITDA (see notes 2(b) and 2(m)) 98,170 87,947
HWL 2013 Annual Results Page 35 of 45

11 Notes to consolidated statement of cash flows (continued)
(b) Changes in working capital
2013 2012
HK$ millions HK$ millions
Increase in inventories (1,100) (1,147)
Increase in debtors and prepayments (6,484) (661)
Increase (decrease) in creditors 4,726 (1,368)
Other non-cash items (1,480) 334
(4,338) (2,842)
(c) Purchase of subsidiary companies
As disclosed in the 2012 annual accounts, on 4 January 2013, 3 Austria, a wholly owned subsidiary of the Group announced
that it has completed its acquisition of 100% interest of Orange Austria, following the approval of all of the relevant Austrian
and European authorities. As a result of the acquisition, the Group has increased its market share of the Austrian mobile
telecommunications services. The Group expects synergies and other benefits from combining the infrastructure and
operations of Orange Austria with 3 Austria, and costs savings through economies of scale.
The following table summarises the consideration paid for Orange Austria and other acquisitions completed in the current
year, and the amounts of the assets acquired and liabilities assumed recognised at the respective acquisition date.
2013 2012
Orange Austria Others Total Total
HK$ millions HK$ millions HK$ millions HK$ millions
Fair Value
Fixed assets 1,028 662 1,690 -
Telecommunications licences 440 - 440 -
Brand names and other rights 2,512 1,996 4,508 -
Interests in joint ventures - 139 139 -
Deferred tax assets 285 - 285 -
Liquid funds and other listed investments - 6 6 -
Trade and other receivables 805 184 989 -
Inventories 975 5 980 -
Creditors and current tax liabilities (1,655) (189) (1,844) -
Bank and other debts (231) (76) (307) -
Deferred tax liabilities - (556) (556) -
Pension obligations (57) - (57) -
Non-controlling interests - (2) (2) -
4,102 2,169 6,271 -
Goodwill arising on acquisition 10,326 1,054 11,380 -
Discharged by cash payment 14,428 3,223 17,651 -
Net cash outflow (inflow) arising from acquisition:
Cash payment 15,942 3,227 19,169 -
Cash and cash equivalents acquired (1,514) (4) (1,518) -
Total net cash paid 14,428 3,223 17,651 -
The assets acquired and liabilities assumed are recognised at the acquisition date fair value and are recorded at the
consolidation level. No fair value adjustments arising from acquisitions are recognised at the underlying companies’ separate
financial statements. Goodwill arising on these acquisitions is recorded at the consolidation level and is not expected to be
deductible for tax purposes. As additional information, the amount deductible for tax purposes (i.e. tax base) of the identifiable
assets acquired and liabilities assumed relating to the acquisition of Orange Austria are different from and, in general, greater
than the amount shown above.
The contribution to the Group’s revenue and profit after tax from these subsidiaries acquired since the respective date of
acquisition is not material.
Acquisition related costs of approximately HK$200 million has been charged to income statement during the year and included
in the line item titled profits on disposal of investments and others.
HWL 2013 Annual Results Page 36 of 45

11 Notes to consolidated statement of cash flows (continued)
(d) Disposal of subsidiary companies
2013 2012
HK$ millions HK$ millions
Aggregate net assets disposed at date of disposal
(excluding cash and cash equivalents):
Fixed assets 1 100
Investment properties 573 -
Goodwill 161 -
Interests in joint ventures 854 -
Deferred tax assets - 11
Trade and other receivables 18 399
Inventories 26 -
Creditors and current tax liabilities (31) (266)
Deferred tax liabilities (1) -
Reserves (124) 69
1,477 313
Profit on disposal * 1,672 378
3,149 691
Less: Investments retained subsequent to disposal - -
3,149 691
Satisfied by:
Cash and cash equivalents received as consideration 3,161 857
Less: Cash and cash equivalents sold (12) (166)
Total net cash consideration 3,149 691
* The profit on disposal for the years ended 31 December 2013 and 2012 are recognised in the consolidated income statement
and are included in the line item titled other operating expenses.
The effect on the Group’s results from the subsidiaries disposed is not material for the years ended 31 December 2013 and 2012.
(e) Included in non-cash items in 2012 is a one-time net gain of HK$447 million from a network sharing arrangement, which
includes a benefit of HK$2,032 million from future cost savings arising from a right to share another Irish operator’s mobile
network, partially offset by a HK$1,585 million one-time provision mainly related to the restructuring of 3 Ireland’s network
infrastructure.
HWL 2013 Annual Results Page 37 of 45

Modified at: 2014-02-18 20:11
The Group’s treasury function sets financial risk management policies in accordance with policies and procedures that are approved by the Executive Directors, and which are also subject to periodic review by the Group’s internal audit function. The Group’s treasury policies are designed to mitigate the impact of fluctuations in interest rates and exchange rates on the Group’s overall financial position and to minimise the Group’s financial risks. The Group’s treasury function operates as a centralised service for managing financial risks, including interest rate and foreign exchange risks, and for providing cost-efficient funding to the Group and its companies. It manages the majority of the Group’s funding needs, interest rate, foreign currency and credit risk exposures. It is the Group’s policy not to have credit rating triggers that would accelerate the maturity dates of the Group’s borrowings. The Group uses interest rate and foreign currency swaps and forward currency contracts as appropriate for risk management purposes only, for hedging transactions and for managing the Group’s assets and liabilities. It is the Group’s policy not to enter into derivative transactions for speculative purposes. It is also the Group’s policy not to invest liquidity in financial products, including hedge funds or similar vehicles, with significant underlying leverage or derivative exposure.
The Group operates a central cash management system for all of its unlisted subsidiaries. Except for listed and certain overseas entities conducting businesses in non-HK or non-US dollar currencies, the Group generally obtains long-term financing at the Group level to on-lend or contribute as equity to its subsidiaries and associates to meet their funding requirements and provide more cost-efficient financing. These borrowings include a range of capital market issues and bank borrowings, which will change depending upon financial market conditions and projected interest rates. The Group regularly and closely monitors its overall debt position and reviews its funding costs and maturity profile to facilitate refinancing.
The Group manages its interest rate exposure with a focus on reducing the Group’s overall cost of debt and exposure to changes in interest rates. When considered appropriate, the Group uses derivatives such as interest rate swaps and forward rate agreements to manage its interest rate exposure. The Group’s main interest rate exposure relates to US dollar, British Pound, Euro and HK dollar borrowings.
At 31 December 2013, approximately 29% of the Group’s total principal amount of bank and other debts were at floating rates and the remaining 71% were at fixed rates. The Group has entered into various interest rate agreements with major financial institution counterparties to swap approximately HK$62,708 million principal amount of fixed interest rate borrowings to effectively become floating interest rate borrowings. In addition, HK$6,540 million principal amount of floating interest rate borrowings were swapped to fixed interest rate borrowings. After taking into consideration these interest rate swaps, approximately 54% of the Group’s total principal amount of bank and other debts were at floating rates and the remaining 46% were at fixed rates at 31 December 2013. All of the aforementioned interest rate derivatives are designated as hedges and these hedges are considered highly effective.
For overseas subsidiaries, associates and other investments, which consist of non-HK dollar or non-US dollar assets, the Group generally endeavours to establish a natural hedge for debt financing with an appropriate level of borrowings in those same currencies. For overseas businesses that are in the development phase, or where borrowings in local currency are not or are no longer attractive, the Group may not borrow in the local currency or may repay existing borrowings and monitor the development of the businesses’ cashflow and the relevant debt markets with a view to refinance these businesses with local currency borrowings in the future when conditions are more appropriate. Exposure to movements in exchange rates for individual transactions (such as major procurement contracts) directly related to the underlying businesses is minimised by using forward foreign exchange contracts and currency swaps where active markets for the relevant currencies exist. The Group generally does not enter into foreign currency hedges in respect of its long-term equity investments in overseas subsidiaries and associates. During the year, the currencies of certain countries where the Group has overseas operations, including Euro, British Pound, the Canadian and Australian dollars as well as Renminbi in the Mainland, fluctuated against the Hong Kong dollar. This gave rise to an unrealised loss of approximately HK$5,130 million (2012: gain of HK$5,077 million) on translation of these operations’ net assets to the Group’s Hong Kong dollar reporting currency, including the Group’s share of the translation gains and losses of associated companies and joint ventures. This unrealised loss is reflected as a movement in the Consolidated Statement of Changes in Equity under the heading of exchange reserve.
At 31 December 2013, the Group had currency swap arrangements with banks to swap US dollar principal amount of borrowings equivalent to HK$28,593 million to Hong Kong dollar principal amount of borrowings to match the currency exposures of the underlying businesses. The Group’s total principal amount of bank and other debts, after the above swaps, are denominated as follows: 33% in Euro, 31% in US dollars, 22% in HK dollars, 7% in British Pounds and 7% in other currencies.
DRAFT
HWL 2013 Annual Results Page 38 of 45

Modified at: 2014-02-18 20:11
The Group’s holdings of cash, managed funds and other liquid investments, and interest rate and foreign currency swaps and forward currency contracts with financial institutions expose the Group to credit risk of counterparties. The Group controls its credit risk to non-performance by its counterparties through monitoring their equity share price movements and credit ratings as well as setting approved counterparty credit limits that are regularly reviewed.
The Group is also exposed to counterparties credit risk from its operating activities, which is continuously monitored by the local operational management.
The Group aims to maintain a capital structure that is appropriate for long-term investment grade ratings of A3 on the Moody’s Investor Service scale, A- on the Standard & Poor’s Rating Services scale and A- on the Fitch Ratings scale. Actual credit ratings may depart from these levels from time to time due to economic circumstances. At 31 December 2013, our long-term credit ratings were A3 from Moody’s, A- from Standard & Poor’s and A- from Fitch, with all three agencies maintaining stable outlooks on the Group’s ratings.
The Group’s main market price risk exposures relate to listed/traded debt and equity securities described in “Liquid Assets” below and the interest rate swaps as described in “Interest Rate Exposure” above. The Group’s holding of listed/traded debt and equity securities represented approximately 16% (2012: approximately 18%) of the cash, liquid funds and other listed investments (“liquid assets”). The Group controls this risk through active monitoring of price movements and changes in market conditions that may have an impact on the value of these financial assets and instruments.
The Group continues to maintain a solid and healthy financial position. Liquid assets amounted to HK$102,787 million at 31 December 2013, a decrease of 22% from the balance of HK$131,447 million at 31 December 2012, mainly reflecting the utilisation of cash for the repayment and early repayment of certain borrowings, the repurchase of US$217 million (approximately HK$1,692 million) nominal amount of perpetual capital securities issued in 2010, dividend payments to ordinary and non-controlling shareholders as well as distributions to perpetual capital securities holders, acquisition of new investments, including the acquisition of Orange Austria and Enviro Waste in New Zealand, of HK$17,651 million, and acquisition of fixed assets and telecommunications licences totalling HK$30,493 million, net of the cash arising from positive funds from operations from the Group’s businesses, cash from new borrowings and proceeds from the issue of €1,750 million perpetual capital securities during the year. Liquid assets were denominated as to 21% in HK dollars, 33% in US dollars, 15% in Renminbi, 10% in Euro, 6% in British Pounds and 15% in other currencies.
Cash and cash equivalents represented 84% (2012: 82%) of the liquid assets, US Treasury notes and listed/traded debt securities 8% (2012: 11%) and listed equity securities 8% (2012: 7%).
The US Treasury notes and listed/traded debt securities, including those held under managed funds, consisted of US Treasury notes of 26%, government and government guaranteed notes of 32%, notes issued by the Group’s associated company, Husky Energy of 11%, notes issued by financial institutions of 3%, and others of 28%. Of these US Treasury notes and listed/traded debt securities, 55% are rated at Aaa/AAA or Aa1/AA+ with an average maturity of 3.1 years on the overall portfolio. The Group has no exposure in mortgage-backed securities, collateralised debt obligations or similar asset classes.
HWL 2013 Annual Results Page 39 of 45

Modified at: 2014-02-18 20:11
84%
8%
Total: HK$102,787 million
Liquid Assets by Type at 31 December 2013
Cash and cash equivalents
Listed equity securities
US Treasury notes and listed/traded debt securities
8%21%
33%15%
15%
6%
10%
Liquid Assets byCurrency Denominationat 31 December 2013
Total: HK$102,787 million
HKD USD
EUR
RMB
GBP Others
Consolidated EBITDA(1) amounted to HK$98,170 million, an increase of 12% compared to HK$87,947 million, as restated, for last year. Consolidated funds from operations (“FFO”) before cash profits from disposals, capital expenditures, investments and changes in working capital amounts to HK$49,390 million, a 37% increase compared to last year mainly due to higher EBITDA contributions by the Group’s subsidiaries, together with an increase in dividends and distributions received from associated companies and joint ventures.
The Group’s capital expenditures increased 5% to total HK$30,493 million during 2013 (2012: HK$29,107 million), primarily due to higher capital expenditures for the acquisition of telecommunications licences, mainly in Europe, which totalled HK$6,828 million (2012: HK$2,422 million), partially offset by lower capital expenditures for the acquisition of fixed assets, particularly for the telecommunications division. Capital expenditures on fixed assets for the ports and related services division amounted to HK$7,060 million (2012: HK$7,556 million); for the property and hotels division HK$535 million (2012: HK$271 million); for the retail division HK$2,264 million (2012: HK$2,717 million); for CKI HK$406 million (2012: HK$680 million); for 3 Group Europe HK$10,116 million (2012: HK$11,323 million); for HTHKH HK$1,239 million (2012: HK$1,600 million); for HAT HK$1,621 million (2012: HK$2,017 million); and for the finance and investments and others segment HK$319 million (2012: HK$381 million). Capital expenditures for licences, brand names and other rights were HK$11 million (2012: Nil) for the ports and related services division; for CKI HK$11 million (2012: Nil); for 3 Group Europe HK$6,884 million (2012: HK$2,276 million); for HTHKH HK$27 million (2012: HK$172 million); and for HAT nil (2012: HK$114 million).
In addition, during the year, the Group have spent HK$17,651 million on the acquisition of new investments which included the acquisition of Orange Austria as well as Enviro Waste in New Zealand.
Purchases of and advances to (net of deposits from) associated companies and joint ventures, net of repayments from associated companies and joint ventures, resulted in a net cash outflow of HK$5,287 million (2012: HK$3,910 million) mainly due to higher advances to property joint ventures in 2013, the acquisition of AVR-Afvalverwerking B.V. in the Netherlands by CKI, partly offset by higher repayments from associated companies and joint ventures in the year.
The capital expenditures and investments of the Group are primarily funded by cash generated from operations, cash on hand and to the extent appropriate, by external borrowings.
For further information of the Group’s capital expenditures by divisions and cashflow, please see Note 5(e) and the “Consolidated Statement of Cashflows” section of the annual report.
26%
32%
3%
11%
Total: HK$8,213 million
US Treasury notes Government and Government Guaranteed notes
Husky Energy Inc notes Financial Institutions notes
Others
28%
US Treasury Notes and Listed/ Traded Debt Securities by Typeat 31 December 2013
Note 1: EBITDA includes the non-controlling interests’ share of HPH Trust’s EBITDA.
HWL 2013 Annual Results Page 40 of 45
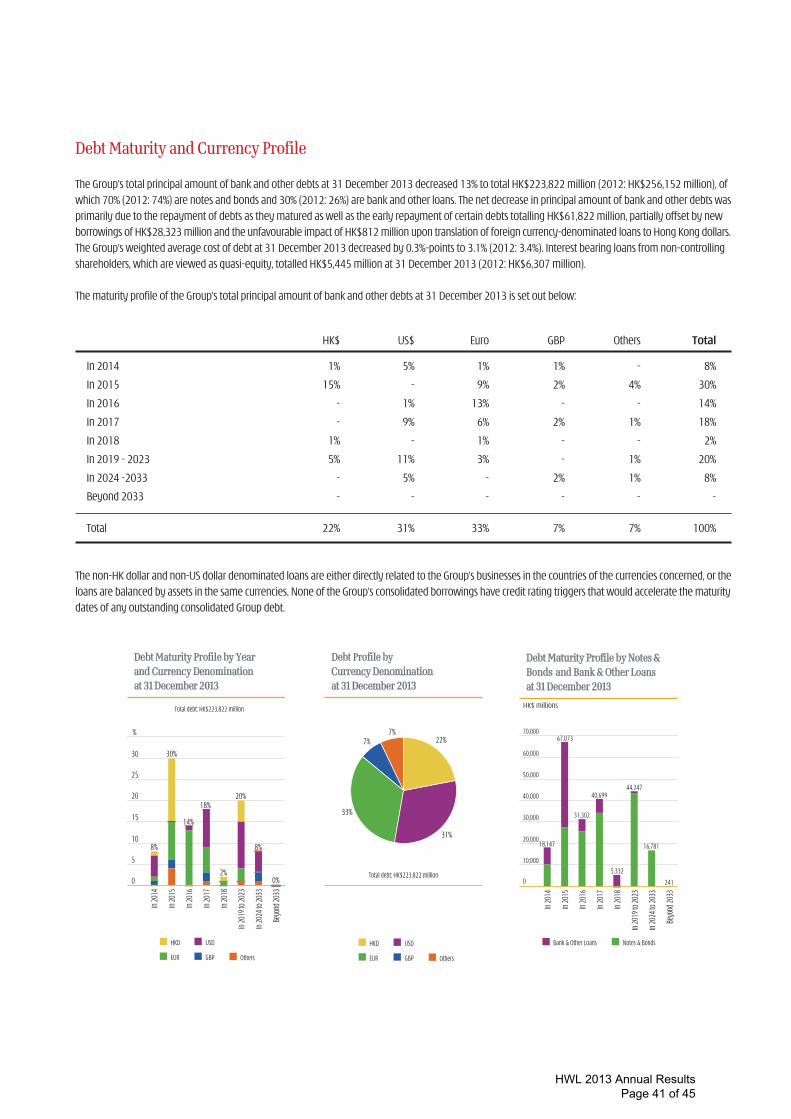
Modified at: 2014-02-18 20:11
The Group’s total principal amount of bank and other debts at 31 December 2013 decreased 13% to total HK$223,822 million (2012: HK$256,152 million), of which 70% (2012: 74%) are notes and bonds and 30% (2012: 26%) are bank and other loans. The net decrease in principal amount of bank and other debts was primarily due to the repayment of debts as they matured as well as the early repayment of certain debts totalling HK$61,822 million, partially offset by new borrowings of HK$28,323 million and the unfavourable impact of HK$812 million upon translation of foreign currency-denominated loans to Hong Kong dollars. The Group’s weighted average cost of debt at 31 December 2013 decreased by 0.3%-points to 3.1% (2012: 3.4%). Interest bearing loans from non-controlling shareholders, which are viewed as quasi-equity, totalled HK$5,445 million at 31 December 2013 (2012: HK$6,307 million).
The maturity profile of the Group’s total principal amount of bank and other debts at 31 December 2013 is set out below:
HK$ US$ Euro GBP Others Total
In 2014 1% 5% 1% 1% - 8%
In 2015 15% - 9% 2% 4% 30%
In 2016 - 1% 13% - - 14%
In 2017 - 9% 6% 2% 1% 18%
In 2018 1% - 1% - - 2%
In 2019 - 2023 5% 11% 3% - 1% 20%
In 2024 -2033 - 5% - 2% 1% 8%
Beyond 2033 - - - - - -
Total 22% 31% 33% 7% 7% 100%
The non-HK dollar and non-US dollar denominated loans are either directly related to the Group’s businesses in the countries of the currencies concerned, or the loans are balanced by assets in the same currencies. None of the Group’s consolidated borrowings have credit rating triggers that would accelerate the maturity dates of any outstanding consolidated Group debt.
Total debt: HK$223,822 million
31%
7%
33%
7%22%
HKD USD
EUR GBP Others
Debt Profile by Currency Denominationat 31 December 2013
Total debt: HK$223,822 million
In 20
14
In 20
15
In 20
16
In 20
17
In 20
18
In 20
19 to
2023
In 20
24 to
2033
Beyo
nd 20
33
HKD USD
EUR GBP Others
Debt Maturity Profile by Yearand Currency Denominationat 31 December 2013
0
5
10
15
20
25
30
%
8%
30%
14%
18%
2%
20%
8%
0%
In 20
14
In 20
15
In 20
16
In 20
17
In 20
18
In 20
19 to
2023
In 20
24 to
2033
Beyo
nd 20
33
Bank & Other Loans Notes & Bonds
HK$ millions
241
16,781
44,247
5,332
40,699
67,073
18,147
31,302
0
10,000
20,000
30,000
40,000
50,000
70,000
60,000
Debt Maturity Profile by Notes & Bonds and Bank & Other Loansat 31 December 2013
HWL 2013 Annual Results Page 41 of 45

Modified at: 2014-02-18 20:11
The significant financing activities in 2013 were as follows:
In anuary, obtained a short term floating rate loan facility of €1,450 million (approximately HK$15,037 million) and was subsequently repaid on maturity in May 2013;
In February, repaid on maturity US$3,110 million (approximately HK$24,257 million) principal amount of fixed rate notes;
In February, obtained a short term floating rate revolving loan facility of GBP550 million (approximately HK$6,523 million) which has already expired;
In March, obtained a five-year floating rate loan facility of HK$1,400 million;
In April, listed subsidiary CKI obtained a five-year loan facility of NZ$260 million (approximately HK$1,685 million), of which the project debt of NZ$150 million (approximately HK$972 million) was drawn in relation to the acquisition of Enviro Waste Services Limited;
In April, prepaid a floating rate loan facility of HK$1,400 million that matured in May 2013;
In April, prepaid a floating rate loan facility of HK$500 million that matured in October 2013;
In May, obtained a five-year floating rate loan facility of HK$2,000 million and repaid on maturity a floating rate loan facility of HK$1,500 million;
In uly, repaid €1,000 million (approximately HK$10,160 million) principal amount of fixed rate notes on maturity;
In uly, prepaid a floating rate loan facility of €300 million (approximately HK$3,048 million) maturing in une 2015;
In August, listed subsidiary CKI obtained a five-year floating rate term loan facility of €203 million (approximately HK$2,148 million), of which the project debt of €197 million (approximately HK$2,045 million) was drawn in relation to acquisition of AVR-Afvalverwerking B.V.; and
In December, repaid a floating rate revolving loan facility of HK$500 million maturing in April 2015.
Subsequent to year end:
In anuary 2014, repaid US$1,309 million (approximately HK$10,206 million) principal amount of fixed rate notes on maturity; and
In February 2014, prepaid HK$800 million of a floating rate term loan facility of HK$2,800 million maturing in November 2014.
HWL 2013 Annual Results Page 42 of 45

Modified at: 2014-02-18 20:11
The Group’s total ordinary shareholders’ funds and perpetual capital securities increased 9% to HK$426,609 million at 31 December 2013, compared to HK$391,519 million, as restated, at 31 December 2012, reflecting the profits for 2013 as well as the issuance of €1,750 million perpetual capital securities in May 2013, partly offset by net exchange losses on translation of the Group’s overseas operations’ net assets to the Group’s Hong Kong dollar reporting currency including the Group’s share of the translation gains and losses of associated companies and joint ventures, dividends and distributions paid and other items recognised directly in reserves. At 31 December 2013, the consolidated net debt of the Group, excluding interest bearing loans from non-controlling shareholders which are viewed as quasi-equity, unamortised loan facilities fees and premiums or discounts on issue and fair value changes of interest rate swap contracts, was HK$121,035 million (2012: HK$124,705 million), a reduction of 3% compared to the net debt at the beginning of the year. The Group’s net debt to net total capital ratio at 31 December 2013 reduced to 20.0% (2012: 21.9 %).
The following table shows the net debt to net total capital ratio calculated on the basis of including interest bearing loans from non-controlling shareholders and also with the Group’s investments in its listed subsidiaries and associated companies marked to market value at 31 December 2013. The net debt to net total capital ratio can be significantly affected by foreign currency translation effects on total ordinary shareholders’ funds and perpetual capital securities and on debt balances. The ratios as at 31 December 2013 before and after the effect of foreign currency transaction and other non-cash movements for the year are shown below:
Net debt/Net total capital ratios at 31 December 2013:
Before the effect of foreign
currency translation and
other non-cash movements
After the effect of
foreign currency translation and
other non-cash movements
A1: excluding interest bearing loans from non-controlling shareholders from debt
19.6% 20.0%
A2: as in A1 above and investments in listed subsidiaries and associated companies marked to market value
17.8% 18.2%
B1: including interest bearing loans from non-controlling shareholders as debt
20.5% 20.9%
B2: as in B1 above and investments in listed subsidiaries and associated companies marked to market value
18.6% 19.0%
The Group’s consolidated gross interest expense and other finance costs of subsidiaries, before capitalisation, decreased 8% in 2013 to total HK$8,564 million, compared to HK$9,348 million in 2012, mainly due to the weighted average cost of debt for the Group reducing from 3.4% in 2012 to 3.1% in 2013 and lower average borrowings during the year.
Consolidated EBITDA of HK$98,170 million and FFO of HK$49,390 million for the year covered consolidated net interest expense and other finance costs 17.9 times and 10.2 times respectively (31 December 2012, as restated: 14.7 times and 7.1 times).
At 31 December 2013, assets of the Group totalling HK$2,299 million (2012: HK$824 million) were pledged as security for bank and other debts.
Committed borrowing facilities available to Group companies but not drawn at 31 December 2013 amounted to the equivalent of HK$4,479 million (2012: HK$5,807 million).
At 31 December 2013, the Group provided guarantees in respect of bank and other borrowing facilities to its associated companies and joint ventures totalling HK$24,610 million (2012: HK$11,920 million), of which HK$22,839 million (2012: HK$10,485 million) has been drawn down as at 31 December 2013, and also provided performance and other guarantees of HK$4,131 million (2012: HK$4,411 million).
HWL 2013 Annual Results Page 43 of 45

PURCHASE, SALE OR REDEMPTION OF SHARES During the year ended 31 December 2013, neither the Company nor any of its subsidiaries has purchased or sold any of the Company’s ordinary shares. In addition, the Company has not redeemed any of its ordinary shares during the year.
COMPLIANCE WITH THE CORPORATE GOVERNANCE CODE The Company strives to attain and maintain high standards of corporate governance best suited to the needs and interests of the Group as it believes that effective corporate governance practices are fundamental to safeguarding interests of shareholders and other stakeholders and enhancing shareholder value. The Company has complied throughout the year ended 31 December 2013 with all the code provisions of the Corporate Governance Code contained in Appendix 14 of the Rules Governing the Listing of Securities on The Stock Exchange of Hong Kong Limited (the “Listing Rules”), other than those in respect of the nomination committee. The Company has considered the merits of establishing a nomination committee but is of the view that it is in the best interests of the Company that the Board collectively reviews, deliberates on and approves the structure, size and composition of the Board and the appointment of any new Director, as and when appropriate. The Board is tasked with ensuring that it has a balanced composition of skills and experience appropriate for the requirements of the businesses of the Group and that appropriate individuals with the relevant expertise and leadership qualities are appointed to the Board to complement the capabilities of the existing Directors. In addition, the Board as a whole is also responsible for reviewing the succession plan for the Directors, including the Chairman of the Board and the Group Managing Director.
COMPLIANCE WITH THE MODEL CODE FOR SECURITIES TRANSACTIONS BY DIRECTORS OF THE COMPANY The Board has adopted its own Model Code for Securities Transactions by Directors (the “Securities Code”) regulating Directors' dealings in securities (Group and otherwise), on terms no less exacting than the required standard of the Model Code for Securities Transactions by Directors of Listed Issuers set out in Appendix 10 of the Listing Rules. In response to specific enquiries made, all Directors of the Company have confirmed that they have complied with the Securities Code in their securities transactions throughout 2013.
REVIEW OF ACCOUNTS The consolidated accounts of the Company and its subsidiary companies for the year ended 31 December 2013 have been reviewed by the Audit Committee of the Company and audited by the Company’s auditor, PricewaterhouseCoopers. The unqualified auditor’s report will be included in the Annual Report to shareholders.
CLOSURE OF REGISTER OF MEMBERS The register of members of the Company will be closed from Tuesday, 13 May 2014 to Friday, 16 May 2014 (both days inclusive) for the purpose of determining shareholders’ entitlement to attend and vote at the 2014 Annual General Meeting.
In order to be eligible to attend and vote at the 2014 Annual General Meeting, all transfers, accompanied by the relevant share certificates, must be lodged with the Company’s Share Registrar (Computershare Hong Kong Investor Services Limited at Rooms 1712-1716, 17th Floor, Hopewell Centre, 183 Queen’s Road East, Wanchai, Hong Kong) for registration no later than 4:30 pm on Monday, 12 May 2014.
RECORD DATE FOR PROPOSED FINAL DIVIDEND The record date for the purpose of determining shareholders' entitlement to the proposed final dividend is Thursday, 22 May 2014.
In order to qualify for the proposed final dividend payable on Tuesday, 3 June 2014, all transfers, accompanied by the relevant share certificates, must be lodged with the Company’s Share Registrar (Computershare Hong Kong Investor Services Limited at Rooms 1712-1716, 17th Floor, Hopewell Centre, 183 Queen’s Road East, Wanchai, Hong Kong) for registration no later than 4:30 pm on Thursday, 22 May 2014.
HWL 2013 Annual Results Page 44 of 45

ANNUAL GENERAL MEETING The Annual General Meeting of the Company will be held on Friday, 16 May 2014. Notice of the Annual General Meeting will be published and issued to shareholders in due course.
ADOPTION OF NEW ARTICLES OF ASSOCIATION The new Companies Ordinance (Chapter 622, Laws of Hong Kong) (“NCO”) will come into effect on 3 March 2014. The Company proposes to put forward to shareholders for approval at the Annual General Meeting a special resolution to adopt new Articles of Association (the “New Articles”) in substitution for and to the exclusion of the existing Memorandum and Articles of Association of the Company. The proposed New Articles mainly reflect certain changes under the NCO, update market and governance practices and consolidate all previous amendments. A circular containing details of the proposed New Articles together with the 2013 Annual Report will be sent to the shareholders.
CORPORATE STRATEGY The primary objective of the Company is to enhance long-term total return for our shareholders. To achieve this objective, the Group’s strategy is to place equal emphasis on achieving sustainable recurring earnings growth and maintaining the Group’s strong financial profile. The Chairman’s Statement and the Operations Review contain discussions and analyses of the Group’s performance and the basis on which the Group generates or preserves value over the longer term and the basis on which the Group will execute its strategy for delivering the Group’s objective.
PAST PERFORMANCE AND FORWARD LOOKING STATEMENTS The performance and the results of operations of the Group contained within this Annual Report are historical in nature, and past performance is no guarantee of the future results of the Group. Any forward-looking statements and opinions contained within this Annual Report are based on current plans, estimates and projections, and therefore involve risks and uncertainties. Actual results may differ materially from expectations discussed in such forward-looking statements and opinions. The Group, the Directors, employees and agents of the Group assume (a) no obligation to correct or update the forward-looking statements or opinions contained in this Annual Report; and (b) no liability in the event that any of the forward-looking statements or opinions do not materialise or turn out to be incorrect. As at the date of this announcement, the Directors of the Company are: Executive Directors: Independent Non-executive Directors: Mr LI Ka-shing (Chairman) The Hon Sir Michael David KADOORIE Mr LI Tzar Kuoi, Victor (Deputy Chairman) Mr Holger KLUGE Mr FOK Kin Ning, Canning Ms LEE Wai Mun, Rose Mrs CHOW WOO Mo Fong, Susan Mr William Elkin MOCATTA Mr Frank John SIXT (Alternate to The Hon Sir Michael David Kadoorie) Mr LAI Kai Ming, Dominic Mr William SHURNIAK Mr KAM Hing Lam Mr WONG Chung Hin Non-executive Directors: Mr LEE Yeh Kwong, Charles Mr George Colin MAGNUS
HWL 2013 Annual Results Page 45 of 45

Analyses by Core Business Segments 2012 2013 Restated(1)
HK$millions % HK$millions % Change
TotalRevenue(2)
Portsandrelatedservices 34,119 8% 32,941 8% +4% Hutchison Ports Group other than HPH Trust 31,360 7% 30,208 7% +4% HPH Trust (2) 2,759 1% 2,733 1% +1%Propertyandhotels 24,264 6% 19,970 5% +22%Retail(4) 149,147 36% 138,519 35% +8%CheungKongInfrastructure 42,460 10% 39,693 10% +7%HuskyEnergy 59,481 14% 58,744 15% +1%3GroupEurope 61,976 15% 58,708 15% +6%HutchisonTelecommunicationsHongKongHoldings 12,777 3% 15,536 4% -18%HutchisonAsiaTelecommunications 6,295 2% 4,452 1% +41%Finance&InvestmentsandOthers(4) 22,414 6% 21,700 5% +3% Finance & Investments 2,321 1% 2,388 — -3% Others 20,093 5% 19,312 5% +4%
TotalComparableRevenue(3) 412,933 100% 390,263 98% +6%Reconciliationitem(3) — — 7,648 2% -100%
TotalReportedRevenue 412,933 100% 397,911 100% +4%
EBITDA(2)Portsandrelatedservices 11,447 12% 11,343 13% +1% Hutchison Ports Group other than HPH Trust 10,060 11% 9,893 11% +2% HPH Trust (2) 1,387 1% 1,450 2% -4%Propertyandhotels 13,995 15% 10,887 12% +29%Retail(4) 14,158 15% 12,779 15% +11%CheungKongInfrastructure 22,841 24% 21,405 25% +7%HuskyEnergy 14,779 15% 14,889 17% -1%3GroupEurope 12,671 13% 9,213 11% +38%HutchisonTelecommunicationsHongKongHoldings 2,758 3% 3,050 3% -10%HutchisonAsiaTelecommunications 819 1% 423 — +94%Finance&InvestmentsandOthers(4) 2,179 2% 2,479 3% -12% Finance & Investments 2,808 3% 3,004 4% -7% Others (629) -1% (525) -1% -20%
ComparableEBITDAbeforeprofitsondisposalof investments&othersandpropertyrevaluation(3) 95,647 100% 86,468 99% +11%Reconciliationitem(3) — — 868 1% -100%
ReportedEBITDAbeforeprofitsondisposalof investments&othersandpropertyrevaluation 95,647 100% 87,336 100% +10%
EBIT(2)Portsandrelatedservices 7,358 12% 7,681 13% -4% Hutchison Ports Group other than HPH Trust 6,573 11% 6,806 12% -3% HPH Trust (2) 785 1% 875 1% -10%Propertyandhotels 13,659 21% 10,521 18% +30%Retail(4) 11,771 18% 10,357 18% +14%CheungKongInfrastructure 17,528 27% 16,643 29% +5%HuskyEnergy 7,208 11% 7,427 13% -3%3GroupEurope 4,856 8% 3,145 5% +54%HutchisonTelecommunicationsHongKongHoldings 1,367 2% 1,744 3% -22%HutchisonAsiaTelecommunications (409) -1% (846) -1% +52%Finance&InvestmentsandOthers(4) 1,259 2% 1,914 3% -34% Finance & Investments 2,808 4% 3,004 5% -7% Others (1,549) -2% (1,090) -2% -42%
ComparableEBITbeforeprofitsondisposalof investments&othersandpropertyrevaluation(3) 64,597 100% 58,586 101% +10%Reconciliationitem(3) — — (567) -1% +100%
ReportedEBITbeforeprofitsondisposalofinvestments& othersandpropertyrevaluation 64,597 100% 58,019 100% +11%
Interestexpensesandotherfinancecosts(2) (14,159) (16,359) +13%Profitbeforetax 50,438 41,660 +21%Tax(2) Currenttax (10,972) (8,643) -27% Deferredtax (770) (1) -76,900%
Profitaftertax 38,696 33,016 +17%Non-controllinginterestsandperpetualcapitalsecurities holders’interests (7,668) (6,429) -19%
Profitattributabletoordinaryshareholdersbeforeprofitson disposalofinvestments&othersandpropertyrevaluation 31,028 26,587 +17%Propertyrevaluation,aftertax 32 1,113 -97%Profitsondisposalofinvestments&others,aftertax 52 (1,803) +103%
Profitattributabletoordinaryshareholders 31,112 25,897 +20%
Note1: Thecomparativeshavebeenrestatedtoreflecttheeffectofadoptionofnewandrevisedaccountingpoliciesin2013.SeeNote1totheaccounts.Totalrevenuein2012havebeenreducedbyHK$480millionduetoreclassificationadjustmentmadebyHuskyEnergytoits2012reportedrevenueandcostofsales.
Note2: Totalrevenue,earningsbeforeinterestexpensesandotherfinancecosts,tax,depreciationandamortisation(“EBITDA”)andearningsbeforeinterestexpensesandotherfinancecostsandtax(“EBIT”),interestexpensesandotherfinancecostsandtaxincludetheGroup’sproportionateshareofassociatedcompanies’andjointventures’respectiveitems.Totalrevenue,EBITDAandEBITwereadjustedtoexcludethenon-controllinginterests’shareofresultsofHPHTrust.SeeNote5totheaccountsonthedetailsoftheadjustments.
Note3: Toenableabettercomparisonofunderlyingperformance,thecomparablerevenue,EBITDAandEBITexcludesreconciliationitembelow: ThereconciliationitemrepresentstheresultsofHTALanditsshareofresultsofVHAforthefirsthalfof2012.VHA’soperatinglossesin2013andthesecondhalfof2012andrestructuring
chargesinthesecondhalfof2012areincludedasachargeunder“profitsondisposalofinvestments&others,aftertax”.Note4: Pursuanttothestrategicreviewoftheretaildivisionwhichisstillongoing,resultsoftheMarionnaudbusinessareincludedintheFinance&InvestmentsandOtherssegmentandthe2012
resultshavebeenreclassifiedforcomparativepurposes.
Hutchison Whampoa Limited5
* Represents contributions from Finance & Investments and Others# Includes Panama, Mexico and the Middle Eastr Includes contribution from the USA for Husky Energy
EuropeHK$23,998 million
7%
23%
20%
50%Canada HK$7,070 million
3%
97%
Hong KongHK$10,114 million
13%
12%
10%
65%
Mainland ChinaHK$12,572 million
11%4%
53%
3%
28%
Europe
37%(of which the UK 25%)
Canada
11%
Asia, Australia & Others #
15%
Mainland China
19%
2013 EBITHK$64,597 million
Hong Kong
16%
2013 EBITDAHK$95,647 million
EuropeHK$36,925 million
8%
19%
34%
39%
Canada HK$14,633 million
98%
Hong KongHK$13,506 million
14%
4%
12%
51%
19%
Mainland ChinaHK$14,191 million
3%1%14%
28%
7%
47%
Europe
39%(of which the UK 23%)
Canada
15%
Asia, Australia & Others #
15%
Hong Kong
14% Mainland China
15%
2%
Canada HK$59,647 million
2013 Total RevenueHK$412,933 million
EuropeHK$170,709 million
7%
43%
36%
14%
1%
99%
Hong KongHK$62,212 million
20% 4%10%
10%
56%
Europe
41%(of which the UK 17%)
Hong Kong
15%
Asia, Australia & Others #
12%
Mainland China
12%
Mainland ChinaHK$48,819 million
1% 7%
34%
1%
51%
6%
Canada
14%
Asia, Australia & Others #
HK$49,132 million
13%
34%
32%
2%
19%
Asia, Australia & Others #
HK$14,213 million
6% 43%
37%
11% 3%
Ports & Related Services
Retail
Property & Hotels
Energy
Infrastructure
Telecommunications
Asia, Australia & Others #
HK$9,584 million46%
40%
14%
-4%
4%
1%
6%*
2%*
2%*

Operations Analysis

DisclaimerPotential investors and shareholders of the Company (the “Potential Investors and Shareholders”) are reminded that informationcontained in this Presentation comprises extracts of operational data and financial information of the Group. The informationincluded is solely for the use in this Presentation and certain information has not been independently verified. No representations orwarranties, expressed or implied, are made as to, and no reliance should be placed on, the fairness, accuracy, completeness orcorrectness of the information or opinions presented or contained in this Presentation. Potential Investors and Shareholders shouldrefer to the 2013 Annual Report for the audited results of the Company which are published in accordance with the listing rules ofthe Stock Exchange of Hong Kong Limited.
The performance and the results of operations of the Group contained within this Presentation are historical in nature, and pastperformance is no guarantee of the future results of the Group. Any forward-looking statements and opinions contained within thisPresentation are based on current plans, estimates and projections, and therefore involve risks and uncertainties. Actual results maydiffer materially from expectations discussed in such forward-looking statements and opinions. The Group, the Directors, employeesand agents of the Group assume (a) no obligation to correct or update the forward-looking statements or opinions contained in thisPresentation; and (b) no liability in the event that any of the forward-looking statements or opinions do not materialise or turn outto be incorrect.
Potential Investors and Shareholders should exercise caution when investing in or dealing in the securities of the Company.

Performance in 2013Reported Revenue(1) HK$412.9bn
Comparable Revenue Growth(2)
Reported EBITDA(1) HK$95.6bn
Comparable EBITDA Growth(2)
Reported EBIT(1) HK$64.6bn
Comparable EBIT Growth(2)
Reported Earnings HK$31.1bn
Recurring Earnings(3) HK$31.0bn
Reported EPS HK$7.30
Recurring EPS(3) HK$7.28
Dividend per share HK$2.30
Note (1): Reported revenue, EBITDA and EBIT were adjusted to exclude non-controlling interests’ share of results of HPH Trust.
Note (2): For a like-for-like comparison, the comparable growth excluded Hutchison Telecommunications (Australia)’s share of Vodafone Hutchison Australia (“VHA”)’s results for 1H 2012. TheGroup’s growth % in local currency is the same as the growth in reported currency for reported revenue, EBITDA and EBIT.
Note (3): Recurring earnings and recurring EPS are calculated based on profits attributable to ordinary shareholders before property revaluation after tax and profits on disposal of investmentsand others after tax. Property revaluation gains after tax for 2013 totalled HK$32 million. The profits on disposal of investments and others after tax in 2013 was HK$52 million whichcomprises of the gain arising from the Initial Public Offering of Westports in Malaysia of HK$1,056 million, the one-time net gain of HK$958 million, arising from the completion of theOrange Austria transaction, which comprises the gain on disposal of Yesss! in Austria net of one-time provisions relating to the restructuring of 33 Austria’s business on the acquisition ofOrange Austria, offset by the Group’s share of operating losses of VHA for 2013 of HK$1,458 million and the Group’s share of Husky Energy’s impairment charge on certain natural gasassets in Western Canada of HK$504 million. Property revaluation gains after tax for 2012 totalled HK$1,113 million. The profits on disposal of investments and others after tax in 2012was a charge of HK$1,803 million which comprises of the Group's share of operating losses of VHA and its share of restructuring charges for 2H 2012.
+4%
+6%
+10%
+11%
+11%
+10%
+17%
+17%
+10.6%
+20%
+20%
3

Business & Geographical Diversification 2013 Reported Revenue : HK$412,933 millionGrowth of 4%
2013 Revenue Contribution by Geographical Location
2013 Revenue Contribution by Division
* Represents contribution from Finance & Investments and others
# Includes Panama, Mexico and the Middle East
∆ Includes contribution from the USA for Husky Energy
4
8%6%
36%10%
14%
20%6%*

Business & Geographical Diversification2013 Reported EBITDA : HK$95,647 millionGrowth of 10%
2013 EBITDA Contribution by Geographical Location
* Represents contributions from Finance & Investments and others
# Includes Panama, Mexico and the Middle East
∆ Includes contribution from the USA for Husky Energy
2013 EBITDA Contribution by Division
5
12%
15%
15%24%
15%
17% 2%*

Business & Geographical DiversificationEBITDA Growth of Major Business Units2013 Comparable EBITDA(1) Annual Growth (%)by major business units
2013 Comparable EBITDA(1) (HK$ millions)
6
Note (1): Comparable EBITDA exclude non-controlling interests’ share of results of HPH Trust and Hutchison Telecommunications Australia’s share of VHA’s results for 1H2012.
HAT 3 Group Europe Property &Hotels
Retail CKI Ports andrelated services
94%
38%29%
11%7% 1%
86,468
95,647
167
(63)
3,1081,379
1,436
(110) (292)
396
3,458
(196) (104)
ComparableEBITDA
2012
HPH Group HPH Trust Property &Hotels
Retail Infrastructure Energy HTHKH HAT 3 GroupEurope
F&I Others ComparableEBITDA
2013

Business & Geographical Diversification2013 Reported EBIT: HK$64,597 millionGrowth of 11%
2013 EBIT Contribution by Geographical Location
* Represents contributions from Finance & Investments and others
# Includes Panama, Mexico and the Middle East
∆ Includes contribution from the USA for Husky Energy
2013 EBIT Contribution by Division
7
12%
21%
18%27%
11%
9% 2%*

European ContributionRevenue, EBITDA & EBIT
2013 Total Revenue 2013 EBITDA 2013 EBITHK$ billion Growth (%)
Europe 170.7 +7%
Non-Europe 242.2 +1%
Total HWL 412.9 +4%
HK$ billion Growth (%)
Europe 36.9 +21%
Non-Europe 58.7 +3%
Total HWL 95.6 +10%
HK$ billion Growth (%)
Europe 24.0 +21%
Non-Europe 40.6 +6%
Total HWL 64.6 +11%
EBIT - European growth by division (%)
EBITDA - European growth by division (%)
Revenue - European growth by division (%)
8
# Includes Panama, Mexico and the Middle East
∆ Includes contribution from the USA for Husky Energy

Ports and Related Services8% of Group Revenue, 12% of Group EBITDA & 12% of Group EBIT
EBITDA was up 1% against last year, driven by revenue growth as a resultof higher contributions from ECT Rotterdam, ports in Shanghai, Thailandand Mexico as well as favourable exchange movements, partially offset byincreasing energy and labour costs and the effect of start-up expensesfrom newly opened terminals(3).
EBIT decreased by 4% in 2013, mainly due to higher depreciation chargesof HK$427 million including accelerated depreciation of certain assets atLondon Thamesport as well as charges for new terminals in Hong Kong,the Mainland and Spain and expanded port facilities in 3 containerterminals in Mexico and Panama brought into operation during the yearthat, in ordinary course, can be expected to grow volumes andcontribution over the next 2 to 3 years.
Start-up losses, including depreciation, from newly opened terminals inHuizhou in the Mainland and Lazaro Cardenas in Mexico as well asdeveloping ports in Sydney and Brisbane in Australia, increased byHK$126 million to HK$188 million this year.
Note (1): 2012 EBITDA and EBIT have been restated to reflect the effect of the adoption of amendments to HKAS19 in 2013.Note (2): Total revenue, EBITDA and EBIT were adjusted to exclude non-controlling interests’ share of results of HPH Trust.Note (3): Newly opened ports or facilities is defined as those in operation for less than 18 months.
2013HK$ millions
2012(1)
HK$ millionsChange
Change in local currency
Total revenue (2) 34,119 32,941 +4% +3%EBITDA (2) 11,447 11,343 +1% +0.4%EBIT (2) 7,358 7,681 -4% -5%Throughput 78.3 million TEUs 76.8 million TEUs +2% NA
9
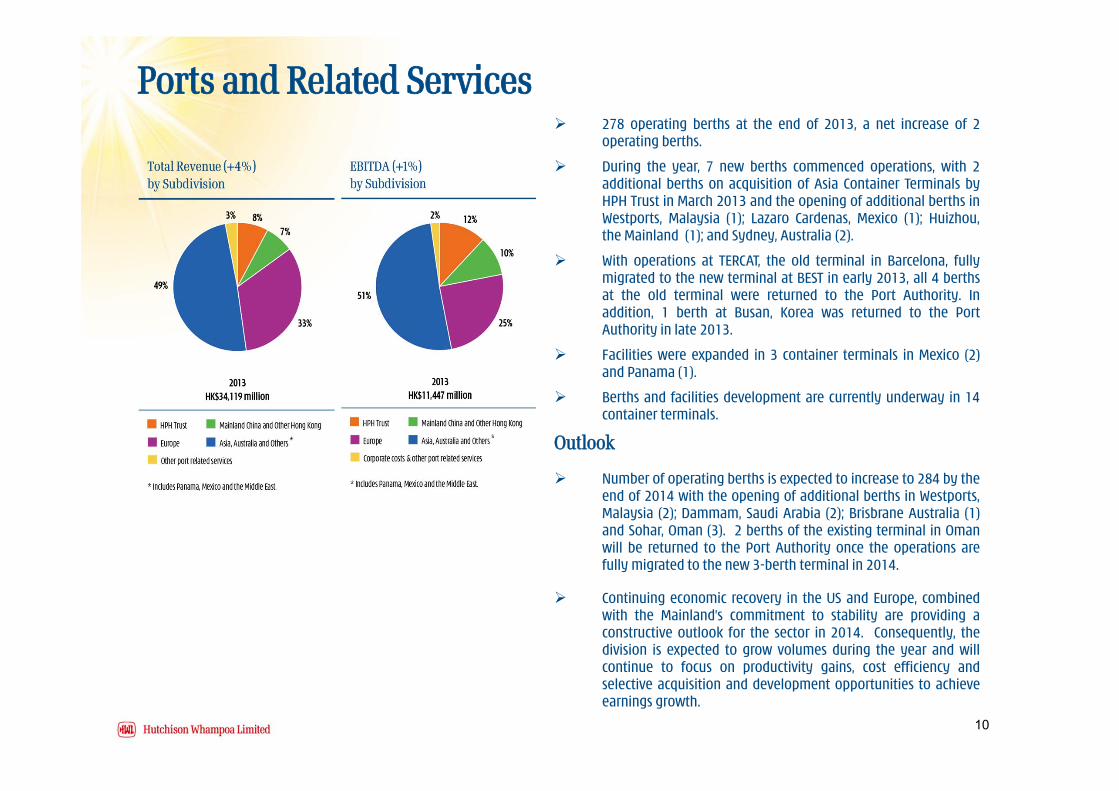
Ports and Related Services 278 operating berths at the end of 2013, a net increase of 2
operating berths.
During the year, 7 new berths commenced operations, with 2additional berths on acquisition of Asia Container Terminals byHPH Trust in March 2013 and the opening of additional berths inWestports, Malaysia (1); Lazaro Cardenas, Mexico (1); Huizhou,the Mainland (1); and Sydney, Australia (2).
With operations at TERCAT, the old terminal in Barcelona, fullymigrated to the new terminal at BEST in early 2013, all 4 berthsat the old terminal were returned to the Port Authority. Inaddition, 1 berth at Busan, Korea was returned to the PortAuthority in late 2013.
Facilities were expanded in 3 container terminals in Mexico (2)and Panama (1).
Berths and facilities development are currently underway in 14container terminals.
Outlook
Number of operating berths is expected to increase to 284 by theend of 2014 with the opening of additional berths in Westports,Malaysia (2); Dammam, Saudi Arabia (2); Brisbrane Australia (1)and Sohar, Oman (3). 2 berths of the existing terminal in Omanwill be returned to the Port Authority once the operations arefully migrated to the new 3-berth terminal in 2014.
Continuing economic recovery in the US and Europe, combinedwith the Mainland’s commitment to stability are providing aconstructive outlook for the sector in 2014. Consequently, thedivision is expected to grow volumes during the year and willcontinue to focus on productivity gains, cost efficiency andselective acquisition and development opportunities to achieveearnings growth.
10

Property and Hotels6% of Group Revenue, 15% of Group EBITDA & 21% of Group EBIT
2013HK$ millions
2012(1)
HK$ millionsChange
Change in local currency
Total revenue 24,264 19,970 +22% +19%EBITDA 13,995 10,887 +29% +25%EBIT 13,659 10,521 +30% +26%
Investment Properties
Overall gross rental income, including share of rental income fromthe commercial premises of our hotels, was 12% higher than 2012 atHK$4,259 million mostly due to the continuing trend of rising rentalrenewal rates and improvements in occupancy levels.
Attributable 11.8 million sq.ft. Gross Floor Area (“GFA”) portfolio ofrental properties in Hong Kong and attributable 2.2 million sq.ft. GFAportfolio in the Mainland and overseas.
The Group’s investment properties generated 8.7% yield on carryingvalue of approximately HK$48,400 million.
Investment properties average occupancy rate at 97%, up from 95%last year.
Hotels
Hotel portfolio comprises 11 hotels with 5.1 million sq.ft.(attributable share of GFA of approximately 2.9 million sq.ft., ofwhich 1.9 million sq.ft. in Hong Kong).
The Group has an average effective interest(2) of 63% in the 8,503total rooms of the 11 hotels.
Attributable hotel operating profit (“HOP”)(3) per sq.ft. for Hong Konghotels ranges from HK$12 per sq.ft. per month to HK$75 per sq.ft. permonth and averages HK$37 per sq.ft. per month.
Total average hotel rooms occupancy rate at 84%.
The Group’s attributable interest in the hotels in Hong Konggenerated 19.5% EBIT yield on its attributable carrying value of thesehotels of approximately HK$3,724 million.
Note (1): 2012 EBITDA and EBIT have been restated to reflect the effect of adoption of amendmentsto HKAS19 in 2013
Note (2): Based on room numbers
Note (3): HOP represents EBITDA after depreciation of furniture, fixtures and equipment
11

Property and HotelsDevelopment Activities Development Properties
Attributable landbank of approximately 83 million sq.ft.,comprising 43 projects in 22 cities. Average land cost ofattributable landbank in the Mainland is approximatelyRMB240 per sq.ft. or HK$307 per sq.ft..
Average land cost relating to the recognised sales ofresidential properties in 2013 in the Mainland isapproximately HK$227 per sq.ft.. Average construction costand average professional, marketing, funding and other costsare approximately HK$533 per sq.ft. and HK$311 per sq.ft.respectively for residential properties.
Completed an attributable share of GFA of approximately 9.0million sq.ft. in residential and commercial properties in theMainland, Singapore and Hong Kong in 2013.
Presold but had not yet recognised the sale of an attributableshare of GFA totalling 1.6 million sq.ft., all of which related toresidential properties with a total value of HK$3,028 million asat the end of 2013.
Outlook The Group expects to complete an attributable share of
approximately 8.3 million sq.ft. in GFA of residential andcommercial properties during 2014 primarily in 11 Mainlandcities and in Singapore.
The Group is targeting full year contracted sales of over10,700 residential units in 2014. A total attributable share ofapproximately 10.4 million sq.ft. of GFA (which includes anattributable share of 1.5 million sq.ft. commercial properties)is expected to be sold in 19 cities in the Mainland, as well as inSingapore and the UK.
12

Property and HotelsDevelopment Properties - Mainland China
2013 2012 % Change
Total Attributable Sales Value (HK$ millions)
Recognised Sales* 14,172 11,562 +23%- of which relates to residential property 10,830 10,038 +8%
ASP^ of residential property (HK$/sq.ft.) 1,636 1,722 -5%
Contracted Sales* 14,149 12,761 +11%- of which relates to residential property 11,122 11,120 +0%ASP^ of residential property (HK$/sq.ft.) 1,861 1,524 +22%
Total Attributable Sales in GFA (000's sq.ft.)
Presold Property b/f 2,321 764
Recognised Sales in GFA 7,748 6,749 +15%- of which relates to residential property 7,041 6,201 +14%Contracted Sales in GFA 6,985 8,306 -16%
- of which relates to residential property 6,354 7,761 -18%
Presold Property c/f # 1,558 2,321
# Presold property value of HK$3,028 million (net of business tax) at the end of 2013* Net of business tax^ Average selling price ("ASP") is stated inclusive of business tax
13
Residential Property SalesBy Geographical Location

2013HK$ millions
2012(1)
HK$ millionsChange
Change in local currency
Change excluding NWHK expiry
Total revenue 149,147 138,519 +8% +6% +9%
EBITDA 14,158 12,779 +11% +9% +13%
EBIT 11,771 10,357 +14% +12% +16% Total Store Numbers 10,581 9,742 +9% NA NA
Store NumbersComparable Store Sales Growth(3) (%)
2013Stores
2012Stores
Change 2013 2012
Health & Beauty China 1,693 1,438 +18% +0.6% +0.6%Health & Beauty Asia 1,864 1,684 +11% +4.9% +5.8%Health & Beauty Western Europe 4,710 4,569 +3% +2.8% +5.0%Health & Beauty Eastern Europe 1,781 1,563 +14% +3.2% +3.6%Health & Beauty Subtotal 10,048 9,254 +9% +2.9% +4.5%Other Retail (2) 533 488 +9% -0.3% +5.6%Total Retail 10,581 9,742 +9% +2.2% +4.8%
- Asia 4,090 3,610 +13% +1.4% +4.8%- Europe 6,491 6,132 +6% +2.9% +4.8%
Total Revenue
2013HK$ millions
2012(1)
HK$ millionsChange
Change in local
currencyHealth & Beauty China 17,962 15,368 +17% +14%Health & Beauty Asia 19,713 18,051 +9% +10%Health & Beauty Western Europe 60,469 56,196 +8% +6%Health & Beauty Eastern Europe 13,518 11,953 +13% +12%Health & Beauty Subtotal 111,662 101,568 +10% +8%Other Retail (2) 37,485 36,951 +1% +1%Total Retail 149,147 138,519 +8% +6%
- Asia 75,099 70,294 +7% +6%- Europe 74,048 68,225 +9% +7%
14
Retail36% of Group Revenue, 15% of Group EBITDA & 18% of Group EBIT
Note (1): 2012 results exclude Marionnaud results inthe comparatives as the business is nolonger reported under this division. 2012EBITDA and EBIT have been restated toreflect the effect of the adoption ofamendments to HKAS19 in 2013.
Note (2): Other Retail includes PARKnSHOP, Fortress,Watsons Wine, Nuance-Watson andmanufacturing operations for water andbeverage businesses.
Note (3): Comparable store sales growth represents the percentage change in revenue contributed by stores which, as at the first day of the relevant financial year (a) have been operating for over 12 months and (b) have not undergone major resizing within the previous 12 months.

RetailEBITDA by segment
EBITDA in reported currency
2013HK$ millions
EBITDAMargins %
2012(3)
HK$ millionsEBITDA
Margins %Change
Change in local
currencyHealth & Beauty China 3,567 20% 3,031 20% +18% +15%Health & Beauty Asia 1,779 9% 1,611 9% +10% +11%Health & Beauty Western Europe 5,168 9% 4,390 8% +18% +15%Health & Beauty Eastern Europe 1,703 13% 1,584 13% +8% +6%Health & Beauty Subtotal 12,217 11% 10,616 10% +15% +13%Other Retail (1) (2) 1,941 5% 2,163 6% -10% -10%Total Retail 14,158 9% 12,779 9% +11% +9%
- Asia 7,290 10% 6,807 10% +7% +6%- Europe 6,868 9% 5,972 9% +15% +13%
H&B overall delivered 10% and 15% growth on total revenue and EBITDA respectively, mainly driven by high quality new store openings with average newstore cash payback period of less than 10 months at an average capex per new store of HK$1 million.
Total sales growth for H&B China remained strong at 17%, more than offsetting comparable store sales growth which remained at 0.6%. Store numbers inH&B China increased 18% to 1,693.
Other Retail comparable store sales growth decreased from 5.6% in 2012 to -0.3% in 2013, mainly due to slower sales of PARKnSHOP and lower mobilephone sales in the Fortress stores during the year.
Excluding the impact attributable to the expiration of Nuance-Watson’s two core concession licences at Hong Kong International Airport in late 2012,EBITDA and EBIT of the Group’s retail businesses as a whole grew by 13% (11% in local currencies) and 16% (14% in local currencies) respectively in 2013.
The effective tax rate of the retail business (excluding associates and joint ventures) on profit before taxation is 23.6% in 2013 (2012: 23.4%).
Outlook
Looking into 2014 and beyond, the Group will continue to expand its portfolio of retail stores and expects to open more than 1,200 new stores in next year. The Group is continuing to assess its strategic options for maximising the value and future growth potential of this division. This strategic review process
may include considering the possibility of public offerings (whilst retaining control) in all or some of the retail businesses in appropriate markets. While nodecision has been made at this time to pursue any particular option, the Marionnaud business will not be considered at this stage as a potential initialpublic offering candidate. Accordingly, the performance of the Marionnaud business has been excluded from this division and included under the Finance &Investment and Others segment.
Note (1): Other Retail includes PARKnSHOP, Fortress, Watsons Wine, Nuance-Watson and manufacturing operations for water and beverage businesses.Note (2): Excluding the impact arising from the expiration of core concession licences in Nuance-Watson Hong Kong, EBITDA would increase by 1% against 2012.Note (3): 2012 results exclude Marionnaud results in the comparatives as the business is no longer reported under this division. 2012 EBITDA has been restated to
reflect the effect of the adoption of amendments to HKAS19 in 2013.
15

Retail7-Year Financial & Operational Summary
16
(CAGR: +7%) (CAGR: +16%) (CAGR: +22%)
(CAGR: +19%)

Infrastructure10% of Group Revenue, 24% of Group EBITDA & 27% of Group EBIT
Cheung Kong Infrastructure (“CKI”) increased its earnings by 23% to HK$11,639million, mainly attributable to the full-year contribution from Wales & WestUtilities, the accretive contributions from the newly acquired investments, as wellas the higher deferred tax credit in 2013 arising from the reduction in deferredtax liabilities following the lowering of enacted UK tax rate.
Earliest tariff reset date of various operations is in 2015.
In April 2013, CKI completed the acquisition of 100% interest in Enviro WasteServices Limited, a diversified, vertically integrated waste management businessthat has national coverage across New Zealand, for a consideration ofapproximately NZ$490 million.
In August 2013, a CKI-led consortium completed the acquisition of AVR-Afvalverwerking B.V., the largest “energy-from-waste” business in theNetherlands, for approximately €940 million.
Outlook CKI will continue to grow existing operations organically and look for
opportunities to expand its portfolio by acquiring businesses with strongrecurrent returns and to maintain its strong balance sheet with steady cashflowand low gearing.
In January 2014, CKI’s 38.87%-owned associate, Power Assets completed separatelisting of its Hong Kong electricity business, by way of the listing of Share StapledUnits jointly issued by HK Electric Investments and HK Electric Investments Limited(collectively as “HKEI”) on the Main Board of The Stock Exchange of Hong KongLimited. Power Assets currently holds 49.9% of HKEI.
2013HK$ millions
2012HK$ millions
Change
Total revenue 42,460 39,693 +7%EBITDA 22,841 21,405 +7%EBIT 17,528 16,643 +5%
17

Energy14% of Group Revenue, 15% of Group EBITDA & 11% of Group EBIT
Profit from operations attributable to shareholders was C$1,829million, including an after tax impairment charge of C$204 millionon certain natural gas assets in Western Canada. Excluding theimpairment charge, profit from operations attributable toshareholders increased 1% above last year to C$2,033 million,reflecting higher average realised prices for crude oil and naturalgas, combined with higher crude oil production in the AtlanticRegion and in Western Canada from heavy oil thermal projects,offset by decrease Downstream margins resulting from significantlylower market crack spreads and a major planned turnaround of theUpgrading facility in Q3 2013 as well as decreased Infrastructureand Marketing margins due to volatility in Western Canadian crudeoil price differentials which narrowed in Q2 and Q3 2013.
The Group’s share of EBITDA and EBIT, after translation into HongKong dollars and consolidation adjustments, but beforeimpairment charges mentioned above, decreased 1% and 3%respectively due to adverse foreign exchange movement.
Annual production increased by 3% to approximately 312.0mboe/day, primarily due to increased production in WesternCanada from heavy oil thermal projects, higher production in theAtlantic Region which was adversely impacted last year by themajor planned turnarounds of the SeaRose and Terra Nova FPSOvessels, partially offset by reduction in investments in dry naturalgas production.
2013HK$ millions
2012(1)
HK$ millionsChange
Change in local currency
Total revenue 59,481 58,744 +1% +5%EBITDA 14,779 14,889 -1% +3%EBIT 7,208 7,427 -3% +0.3%Production 312.0 mboe/day 301.5 mboe/day +3% NA
18
Note (1): Total revenue in 2012 reduced by HK$480 million due to reclassification adjustment made by Husky Energy to its 2012 reported revenue and cost of sales, following a change in presentation of tradingactivities and a change in the classification of certain trading transactions.
7.23 6.86
9.04
3.99
4.39 4.04
2.79
3.78 66.22
72.31
99.65
61.80 79.46
95.12 94.21 97.97
9.80 14.15
9.96 8.33 9.64
25.26 31.36
22.76
-
20.00
40.00
60.00
80.00
100.00
120.00
-
2.00
4.00
6.00
8.00
10.00
2006 2007 2008 2009 2010 2011 2012 2013
US$/bblUS$/mmbtu
Average benchmarks
NYMEX natural gas (U.S. $/mmbtu) WTI crude oil (U.S. $/bbl)US refining 3:2:1 crack spread (U.S. $/bbl)
Year ended 31 December

EnergyReserves Husky Energy continued to add more proved reserves compared to production in
2013 from crude oil and liquids-rich natural gas. The reserve replacement ratio for2013, excluding economic factors, was 166% (164% including economic factors).
At the end of 2013, Husky Energy had total proved reserves before royalties of1,265 mmboe and probable reserves of 1,862 mmboe.
Reserves growth has consistently outpaced production, with an average provedreserves replacement ratio (excluding economic factors) over the past three yearsof 172% (154% including economic factors).
Outlook Husky Energy will continue to maintain and enhance production in its Heavy Oil
and Western Canada foundation as it repositions these areas toward thermaldevelopments and resource plays, while advancing its three major growth pillarsin the Asia Pacific Region, Oil Sands and in the Atlantic Region.
There are two mega projects underway:
i. Liwan Gas Project (Husky Energy’s working interest is 49%) First production expected in early 2014.
ii. Sunrise Energy Project (Husky Energy’s working interest is 50%) Approximately 85% completed at the end of 2013 Expect first production in late 2014.
19
Note (2): Oil and gas reserves disclosures for 2010 to 2013have been prepared in accordance with CanadianSecurities Administrators’ National Instrument 51-101 “Standards of Disclosure for Oil and GasActivities” (“NI 51-101”) effective 31 December 2010(“Canadian method”). In prior years, Husky Energyapplied for and was granted an exemption fromcertain of the provisions of NI 51-101 whichpermitted Husky Energy to present oil and gasreserves disclosures in accordance with the rules ofthe United States Securities and ExchangeCommission guidelines and the United StatesFinancial Accounting Standards Board (“SECmethod”). The guidance was effective from 31December 2010. Accordingly, the 2010 to 2013figures are shown under the Canadian method,while 2009 are shown under the SEC method.

Telecommunications - 3 Group Europe15% of Group Revenue, 13% of Group EBITDA & 8% of Group EBIT
Achieved another important milestone and reported positive EBITDAless capex for 2013.
A one-off net gain of €95 million on the sale of Yesss! in Austriaupon completion of the acquisition transaction of Orange Austria,net of restructuring provision, was recognised in June 2013 andincluded under the Group’s reported profits on disposal ofinvestments and others.
Key Growth Drivers of 3 Group Europe Further capture market share in smartphone and mobile data
segments and improve service margin.
Continuous improvements in the active customer base.
Strict opex, CACs and capex spending disciplines.
Cumulative acquisition costs for 4G (LTE) spectrum totalsapproximately €1.1 billion.
Positive recurring earnings contribution from the acquisition ofOrange Austria.
Outlook Further improvements in underlying performances are expected
following completion of the transition to a non-subsidised handsetmodel in the customer base in 2013 and stabilisation of Europeanmobile termination regimes.
In June 2013, 3 Ireland entered into an agreement with Telefonica toacquire O2, Telefonica’s mobile business in Ireland, for €780 millionwith an additional deferred payment of €70 million payabledependent upon achievement of agreed financial targets. Thecompletion of this transaction, which is subject to regulatoryapproval, is expected in the Q2 2014.
20

Telecommunications - 3 Group EuropeResults by operations
21
Note (1): Net customer service margin represents net customer service revenue deducting direct variable costs (including interconnection charges and roaming cost). EBITDA represents the operational results excludingone-time items and is stated after all customer acquisition costs and retention costs. There are no one-time item included in EBIT in 2013 while one-time item of HK$447 million in 2012 represents the one-time net gain from a network sharing arrangement in Ireland.
Note (2): EBITDA margin % represents EBITDA as a % of total revenue (excluding handset revenue).
In millions
2013 2012 2013 2012 2013 2012 2013 2012 2013 2012 2013 2012 2013 2012
Total Revenue 2,044 1,948 1,746 1,965 5,717 5,981 1,998 2,098 745 361 180 174 61,976 58,708
% Improvement (Reduction) 5% -11% -4% -5% 106% 3% 6%
4%
- Net Customer Service Revenue 1,376 1,347 1,352 1,457 3,956 3,941 1,772 1,837 596 242 149 141 45,536 41,962 % Improvement (Reduction) 2% -7% 0.4% -4% 146% 6% 9%
- Handset Revenue 645 586 341 406 1,568 1,663 153 190 129 100 30 30 15,062 14,750
- Other Revenue 23 15 53 102 193 377 73 71 20 19 1 3 1,378 1,996
Net Customer Service Margin (1) 1,095 977 1,004 939 3,259 3,130 1,526 1,424 459 159 116 93 35,633 29,436
% Improvement 12% 7% 4% 7% 189% 25% 21%
19%
Net Customer Service Margin % 80% 73% 74% 64% 82% 79% 86% 78% 77% 66% 78% 66% 78% 70%
Other margin 15 11 49 112 78 287 44 50 18 13 - 1 1,015 1,851
TOTAL CACs (917) (884) (519) (678) (2,096) (2,207) (385) (412) (162) (114) (48) (51) (21,675) (22,427)
Less: Handset Revenue 645 586 341 406 1,568 1,663 153 190 129 100 30 30 15,062 14,750
Total CACs (net of handset revenue) (272) (298) (178) (272) (528) (544) (232) (222) (33) (14) (18) (21) (6,613) (7,677)
Operating Expenses (421) (409) (596) (515) (1,317) (1,225) (626) (589) (262) (108) (90) (92) (17,364) (14,397)
Opex as a % of net customer service margin 38% 42% 59% 55% 40% 39% 41% 41% 57% 68% 78% 99% 49% 49%
EBITDA (1) 417 281 279 264 1,492 1,648 712 663 182 50 8 (19) 12,671 9,213
% Improvement (Reduction) 48% 6% -9% 7% 264% 142% 38%
35%
EBITDA Margin % (2) 30% 21% 20% 17% 36% 38% 39% 35% 30% 19% 5% -13% 27% 21%
Depreciation & Amortisation (210) (180) (279) (263) (685) (583) (292) (265) (76) (34) (37) (26) (7,815) (6,515)
One-time item - - - - - - - - - - - 45 - 447
EBIT (LBIT) (1) 207 101 0.3 0.5 807 1,065 420 398 106 16 (29) - 4,856 3,145
% Improvement (Reduction) 105% -40% -24% 6% 563% NA 54%
52%
Capex (excluding licence) (271) (250) (344) (562) (856) (1,103) (252) (349) (117) (26) (47) (39) (10,176) (11,346)
EBITDA less Capex 146 31 (65) (298) 636 545 460 314 65 24 (39) (58) 2,495 (2,133)
Licence (238) - (21) (169) - - - - (331) - (25) (51) (6,824) (2,253)
UK Italy Sweden Denmark
Local currency change
Local currency change
Local currency change
Local currency change
3 Group
EuropeHK$GBP EURO SEK DKK EURO
Austria Ireland
EURO

Telecommunications - 3 Group EuropeKey Business Indicators
Key business indicators for the 3 Group Europe’s businesses are as follows:
Note (1): Includes 1.5 million of registered customers added upon the acquisition of Orange Austria in January 2013.Note (2): Includes 1.45 million of active customers added upon the acquisition of Orange Austria in January 2013.Note (3): An active customer is one that generated revenue from an outgoing call, incoming call or data/content service in the preceding 3 months.
22
3 Group
Europe
Postpaid 5,885 4,672 1,530 725 2,497 351 15,660% Variance (December 2013 vs December 2012) 12% 7% 11% 14% 116% -5% 19%
Prepaid 3,957 5,017 160 301 931 610 10,976% Variance (December 2013 vs December 2012) 4% -3% -5% 39% 68% 36% 6%
Total 9,842 9,689 1,690 1,026 3,428 961 26,636% Variance (December 2013 vs December 2012) 9% 2% 9% 20% 100% 17% 13%
UK Italy Sweden Denmark Austria(2) Ireland3 Group
Europe
Postpaid 5,718 4,525 1,530 725 2,476 311 15,285% Variance (December 2013 vs December 2012) 12% 9% 11% 14% 116% 2% 20%
Prepaid 2,218 3,672 92 280 358 237 6,857% Variance (December 2013 vs December 2012) -2% 27% 1% 35% 94% 39% 18%
Total 7,936 8,197 1,622 1,005 2,834 548 22,142% Variance (December 2013 vs December 2012) 8% 16% 10% 19% 113% 15% 19%
Ireland
Customer Base - Registered Customers at 31December 2013 ('000)
Customer Base - Active Customers(3) at 31 December 2013 ('000)
UK Italy Sweden Denmark Austria(1)

Telecommunications - 3 Group EuropeKey Business IndicatorsKey business indicators for the 3 Group Europe's businesses are as follows:
Note (1): ARPU equals total monthly revenue, including incoming mobile termination revenue and contributions for a handset/device in postpaid contract bundled plans, divided by the average number of activecustomers during the year.
Note (2): Net ARPU equals total monthly revenue, including incoming mobile termination revenue but excluding contributions for a handset/device in postpaid contract bundled plans, divided by the averagenumber of active customers during the year.
Note (3): Net AMPU equals total monthly revenue, including incoming mobile termination revenue but excluding contributions for a handset/device in postpaid contract bundled plans, less direct variable costs(including interconnection charges and roaming costs )(i.e. net customer service margin), divided by the average number of active customers during the year.
23
3 Group
Europe
Average
Postpaid ARPU(1) £26.73 €20.83 SEK306.92 DKK184.92 €22.79 €37.98 €27.07
Prepaid ARPU(1) £5.96 €6.69 SEK108.32 DKK138.08 €7.17 €15.30 €7.63
Blended Total ARPU(1) £20.74 €14.71 SEK295.43 DKK172.52 €20.60 €28.93 €21.13
% Variance compared to 31 December 2012 -2% -20% -1% -20% -9% -10% -12%
Postpaid Net ARPU(2) £18.84 €20.83 SEK218.63 DKK168.18 €19.24 €30.05 €21.77
Prepaid Net ARPU(2) £5.96 €6.69 SEK108.32 DKK138.08 €7.17 €15.30 €7.63
Blended Total Net ARPU(2) £15.13 €14.71 SEK212.24 DKK160.21 €17.55 €24.17 €17.45
% Variance compared to 31 December 2012 -8% -20% -10% -15% 3% -11% -14%
Postpaid Net AMPU(3) £14.84 €15.31 SEK180.75 DKK145.52 €14.75 €24.28 €16.95
Prepaid Net AMPU(3) £5.14 €5.19 SEK76.05 DKK116.84 €5.98 €10.77 €6.15
Blended Total Net AMPU(3) £12.05 €10.93 SEK174.69 DKK137.93 €13.52 €18.89 €13.65
% Variance compared to 31 December 2012 1% -8% -6% -6% 21% 5% -4%
12-month Trailing Net Average Margin per Active User ("Net AMPU")(3) to 31 December 2013
12-month Trailing Net Average Revenue per Active User ("Net ARPU")(2) to 31 December 2013
Ireland
12-month Trailing Average Revenue per Active User ("ARPU")(1) to 31 December 2013
UK Italy Sweden Denmark Austria
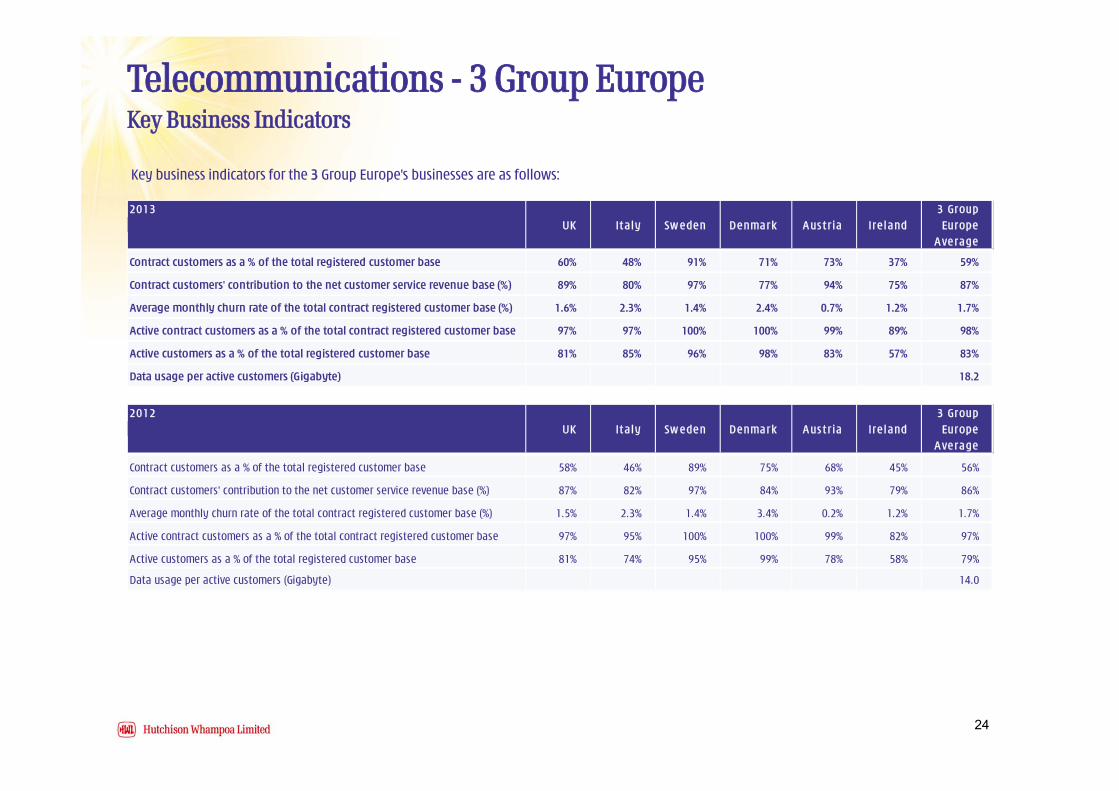
Telecommunications - 3 Group EuropeKey Business Indicators
Key business indicators for the 3 Group Europe's businesses are as follows:
24
2013 3 GroupUK It aly Sw eden Denmark A us t r ia Ire land Europe
A verage
Contract customers as a % of the total registered customer base 60% 48% 91% 71% 73% 37% 59%
Contract customers' contribution to the net customer service revenue base (%) 89% 80% 97% 77% 94% 75% 87%
Average monthly churn rate of the total contract registered customer base (%) 1.6% 2.3% 1.4% 2.4% 0.7% 1.2% 1.7%
Active contract customers as a % of the total contract registered customer base 97% 97% 100% 100% 99% 89% 98%
Active customers as a % of the total registered customer base 81% 85% 96% 98% 83% 57% 83%
Data usage per active customers (Gigabyte) 18.2
2012 3 GroupUK It aly Sw eden Denmark A us t r ia Ire land Europe
A verage
Contract customers as a % of the total registered customer base 58% 46% 89% 75% 68% 45% 56%
Contract customers' contribution to the net customer service revenue base (%) 87% 82% 97% 84% 93% 79% 86%
Average monthly churn rate of the total contract registered customer base (%) 1.5% 2.3% 1.4% 3.4% 0.2% 1.2% 1.7%
Active contract customers as a % of the total contract registered customer base 97% 95% 100% 100% 99% 82% 97%
Active customers as a % of the total registered customer base 81% 74% 95% 99% 78% 58% 79%
Data usage per active customers (Gigabyte) 14.0

Telecommunications - HTHKH & HAT
HTHKH had a combined active mobile customer base maintained at approximately 3.8 million in Hong Kong and Macau.
The shortfall in HTHKH’s EBITDA against last year was primarily due to the reduced mobile hardware and service revenue from lower demand for newhandset models and the transition to a non-subsidised handset model which was only completed in 1H2013.
Going forward, performance is expected to stabilise, with the transition to non-subsidised handset model completed, the removal of unlimited localdata offering and introduction of additional tier-pricing in late 2013.
2013HK$ millions
2012(1)
HK$ millionsChange
Total revenue 12,777 15,536 -18%EBITDA 2,758 3,050 -10%EBIT 1,367 1,744 -22%
HTHKH3% of Group Revenue, 3% of Group EBITDA & 2% of Group EBIT
HAT2% of Group Revenue, 1% of Group EBITDA & -1% of Group EBIT
2013HK$ millions
2012HK$ millions
Change
Total revenue 6,295 4,452 +41%EBITDA 819 423 +94%LBIT (409) (846) +52%
HAT had an active customer base of approximately 43.5 million with operations in Indonesia, Vietnam and Sri Lanka.
EBITDA increased by 94% compared to last year, driven by revenue growth in Indonesia and Vietnam.
Indonesia active customer base increased by 40% from last year to over 32.0 million customers with strong revenue growth of 50% compared to 2012.Monthly revenue has increased to approximately US$57 million in December 2013 representing a 25% increase in monthly revenue in local currency.The operation achieved positive EBITDA operationally since July 2013.
HAT will continue to grow its customer base and focus on expansion, particularly in Indonesia, where the 3G footprint is now extended to 150 citiescovering 86% of the population (2012: 93 cities with 70% population coverage).
Note (1): 2012 EBITDA and EBIT have been restated to reflect the effect of the adoption of HKAS19 in 2013.
25

HTAL owns 50% of VHA and announced a A$230 million loss in 2013, a 42% improvement as compared to last year.
VHA’s customer base declined by 19% to over 5.3 million (including MVNOs) as brand perception recovered more slowly than expected.However, the decline in customer numbers, excluding the Crazy John’s and 3 brands, stablised in Q3 2013 and showed a net gain in thefourth quarter.
In 2013, VHA’s network improved significantly in its voice and data performance, resiliency and coverage. It has significantly expandedregional coverage with 1,200 new sites and its average 3G data speed has doubled. It has also launched the 4G network in 5metropolitan capital cities with speeds comparable to or faster than other networks.
The strategic initiatives commenced in late 2012, which included the accelerated investment and upgrade of the network and certaincost rationalisation initiatives, have led to an improvement in VHA’s performance, both operationally and financially.
VHA’s operating losses continue to be included as a P&L charge under “Others” of the Group’s profits on disposal of investments andothers line as VHA continues with its shareholder sponsored restructuring under the leadership of Vodafone under the applicable termsof our shareholders’ agreement since 2H 2012.
Telecommunications - HTAL, Share of VHA2013
A$ millions2012
A$ millionsChange
Announced Total Revenue 1,776 2,049 -13%Announced Loss Attributable to Shareholders (230) (394) +42%
26

Financial profileNet Debt Ratio remaining below 25% with healthy liquidity
27

Financial profile2013 EBITDA, Dividends and Distributions from Associated Companies & JVs less Capex of Company and SubsidiariesBy division
28
45,152
50,495
19,834
23,665
6,828
95,647
64,986
HWL Total
45,152
7,822 7,822 7,340 7,340
11,684 11,684
1,657 1,657 2,694
819
12,697
439 439
3,625 2,420
6,655 7,425
2,474 870
21,184
5,771
64
(26)
1,740 256
7,071
535
2,264
4171,262
1,621
10,176
3194
6,824
11,447 10,242
13,995 14,765
14,158
12,554
22,841
7,428
14,779
3,092 2,758
12,671
2,179 695
Recurring EBITDA - Company & Subsidiaries Recurring EBITDA - Associated Companies & JVs Capex before Telecom Licences Capex - Telecom Licences
HK$ millions
Ports Property & Hotels
Retail Infrastructure Energy HTHKH HAT 3 Group Europe F&I and Others
Dividends & Distributions from Associated Companies & JVs

2013 Annual Results
Delivered 17% growth in recurring EPS. The Group has now reported strong doubledigit recurring EPS growth for 4 consecutive years.
Healthy cash generation with 10% reported EBITDA growth to HK$95.6 billion and a37% increase in funds from operations to HK$49.4 billion.
Increased European mobile’s EBITDA margin to 27%.
Gearing level at 11-year low.
Recurring EPS (HK$)Recurring EPS (HK$) Dividend per share (HK$)Dividend per share (HK$) Net Debt Ratio (%)Net Debt Ratio (%)
29
29.7%
26.0%23.8%
21.9%20.0%
2009 2010 2011 2012 2013
1.00
3.86
5.24
6.23
7.28
2009 2010 2011 2012 2013
1.731.92
2.08 2.08
2.30
2009 2010 2011 2012 2013

Operations Review
Hutchison Whampoa Limited1
Consolidated Operating Results
The Group’s operations comprise six core business divisions – ports and related services, property and hotels, retail, infrastructure, energy, and telecommunications.
Audited Results for the year ended 31 December 2013 Highlights
2012 2013 Restated (1)
HK$millions HK$ millions Change
Total Revenue (2) 412,933 397,911 +4%EBITDA (2) 95,647 87,336 +10%EBIT (2) 64,597 58,019 +11%
Profit attributable to ordinary shareholders, before property revaluation and profits on disposal of investments and others 31,028 26,587 +17%Property revaluation after tax 32 1,113 -97%Profits on disposal of investments and others after tax 52 (1,803) +103%
Profit attributable to ordinary shareholders 31,112 25,897 +20%
Earnings per share HK$7.30 HK$6.07 +20%Recurring earnings per share (3) HK$7.28 HK$6.23 +17%Final dividend per share HK$1.70 HK$1.53 +11.1%Full year dividend per share HK$2.30 HK$2.08 +10.6%
The Group reported total revenue, including the Group’s share of associated companies’ and joint ventures’ revenue, of HK$412,933 million, an increase of 4% compared to 2012. EBITDA and EBIT, before property revaluation and profits on disposal of investments and others, were HK$95,647 million and HK$64,597 million respectively, an increase of 10% and 11% compared to 2012.
Total recurring profit attributable to ordinary shareholders, before property revaluation and profits on disposal of investments and others, after tax for the year were HK$31,028 million, a 17% increase compared to last year’s profit of HK$26,587 million.
The Group also reported profit on investment properties revaluation after tax of HK$32 million (2012: HK$1,113 million). Profits on disposal of investments and others after tax in 2013 of HK$52 million includes the gain arising from the Initial Public Offering (“IPO”) of Westports in Malaysia of HK$1,056 million, the one-time net gain recognised on the completion of the Orange Austria acquisition transaction, net of certain restructuring provision, of HK$958 million, partly offset by Hutchison Telecommunications (Australia) (“HTAL”)’s 50% share of Vodafone Hutchison Australia (“VHA”) operating losses of HK$1,458 million and the Group’s share of Husky Energy (“Husky”)’s impairment charge of HK$504 million on certain natural gas assets in Western Canada. This compares to a charge of HK$1,803 million in 2012, comprising HTAL’s 50% share of VHA’s operating losses and restructuring charges in the second half of that year.
Profit attributable to ordinary shareholders reported for the year was HK$31,112 million as compared to HK$25,897 million in 2012.
Note 1: The comparatives have been restated to reflect the effect of adoption of new and revised accounting policies in 2013. See Note 1 to the accounts. Total revenue in 2012 has been reduced by HK$480 million due to reclassification adjustment made by Husky Energy to its 2012 reported revenue and cost of sales.
Note 2: Total revenue, earnings before interest expenses and other finance costs, tax, depreciation and amortisation (“EBITDA”) and earnings before interest expenses and other finance costs and tax (“EBIT”), interest expenses and other finance costs and tax include the Group’s proportionate share of associated companies’ and joint ventures’ respective items. Total revenue, EBITDA and EBIT were adjusted to exclude the non-controlling interests’ share of results of HPH Trust. See Note 5 to the accounts on the details of the adjustments.
Note 3: Recurring earnings per share is calculated based on profits attributable to ordinary shareholders before property revaluation after tax and profits on disposal of investments and others after tax.
Note 4: To enable a better comparison of underlying performance, the comparable revenue, EBITDA and EBIT excludes reconciliation item below:
The reconciliation item represents the results of HTAL and its share of results of VHA for the first half of 2012. VHA’s operating losses in 2013 and the second half of 2012 and restructuring charges in the second half of 2012 are included as a charge under “profits on disposal of investments & others, after tax”.
Note 5: Pursuant to the strategic review of the retail division which is still ongoing, results of the Marionnaud business are included in the Finance & Investments and Others segment and the 2012 results have been reclassified for comparative purposes.
HWL 2013 Annual Results Operations Review
Page 1 of 72

2013 Annual Report 2
Financial Performance Summary 2012 2013 Restated (1)
HK$millions % HK$ millions % Change
TotalRevenue(2)
Ports and related services 34,119 8% 32,941 8% +4% Hutchison Ports Group other than HPH Trust 31,360 7% 30,208 7% +4% HPH Trust (2) 2,759 1% 2,733 1% +1%Property and hotels 24,264 6% 19,970 5% +22%Retail (5) 149,147 36% 138,519 35% +8%Cheung Kong Infrastructure 42,460 10% 39,693 10% +7%Husky Energy 59,481 14% 58,744 15% +1%3 Group Europe 61,976 15% 58,708 15% +6%Hutchison Telecommunications Hong Kong Holdings 12,777 3% 15,536 4% -18%Hutchison Asia Telecommunications 6,295 2% 4,452 1% +41%Finance & Investments and Others (5) 22,414 6% 21,700 5% +3% Finance & Investments 2,321 1% 2,388 — -3% Others 20,093 5% 19,312 5% +4%
TotalComparableRevenue(4) 412,933 100% 390,263 98% +6%Reconciliation item (4) — — 7,648 2% -100%
TotalReportedRevenue 412,933 100% 397,911 100% +4%
EBITDA(2)Ports and related services 11,447 12% 11,343 13% +1% Hutchison Ports Group other than HPH Trust 10,060 11% 9,893 11% +2% HPH Trust (2) 1,387 1% 1,450 2% -4%Property and hotels 13,995 15% 10,887 12% +29%Retail (5) 14,158 15% 12,779 15% +11%Cheung Kong Infrastructure 22,841 24% 21,405 25% +7%Husky Energy 14,779 15% 14,889 17% -1%3Group Europe 12,671 13% 9,213 11% +38%Hutchison Telecommunications Hong Kong Holdings 2,758 3% 3,050 3% -10%Hutchison Asia Telecommunications 819 1% 423 — +94%Finance & Investments and Others (5) 2,179 2% 2,479 3% -12% Finance & Investments 2,808 3% 3,004 4% -7% Others (629) -1% (525) -1% -20%
ComparableEBITDAbeforeprofitsondisposalof investments&othersandpropertyrevaluation(4) 95,647 100% 86,468 99% +11%Reconciliation item (4) — — 868 1% -100%
ReportedEBITDAbeforeprofitsondisposalof investments&othersandpropertyrevaluation 95,647 100% 87,336 100% +10%
EBIT(2)Ports and related services 7,358 12% 7,681 13% -4% Hutchison Ports Group other than HPH Trust 6,573 11% 6,806 12% -3% HPH Trust (2) 785 1% 875 1% -10%Property and hotels 13,659 21% 10,521 18% +30%Retail (5) 11,771 18% 10,357 18% +14%Cheung Kong Infrastructure 17,528 27% 16,643 29% +5%Husky Energy 7,208 11% 7,427 13% -3%3Group Europe 4,856 8% 3,145 5% +54%Hutchison Telecommunications Hong Kong Holdings 1,367 2% 1,744 3% -22%Hutchison Asia Telecommunications (409) -1% (846) -1% +52%Finance & Investments and Others (5) 1,259 2% 1,914 3% -34% Finance & Investments 2,808 4% 3,004 5% -7% Others (1,549) -2% (1,090) -2% -42%
ComparableEBITbeforeprofitsondisposalof investments&othersandpropertyrevaluation(4) 64,597 100% 58,586 101% +10%Reconciliation item (4) — — (567) -1% +100%
ReportedEBITbeforeprofitsondisposalofinvestments& othersandpropertyrevaluation 64,597 100% 58,019 100% +11%
Interest expenses and other finance costs (2) (14,159) (16,359) +13%Profit before tax 50,438 41,660 +21%Tax (2) Current tax (10,972) (8,643) -27% Deferred tax (770) (1) -76,900%
Profit after tax 38,696 33,016 +17%Non-controlling interests and perpetual capital securities holders’ interests (7,668) (6,429) -19%
Profitattributabletoordinaryshareholdersbeforeprofitson disposalofinvestments&othersandpropertyrevaluation 31,028 26,587 +17%Property revaluation, after tax 32 1,113 -97%Profits on disposal of investments & others, after tax 52 (1,803) +103%
Profitattributabletoordinaryshareholders 31,112 25,897 +20%
HWL 2013 Annual Results Operations Review
Page 2 of 72

Portsand Related Services
Hutchison Whampoa Limited16
Operations Review
Shenzhen’s Yantian International Container Terminals breaks the world record by moving its 100 millionth TEU within only 18.5 years.
HWL 2013 Annual Results Operations Review
Page 3 of 72

Argentina
The Bahamas
Panama
Mexico
Mainland China
South Korea
Thailand
Germany
The Netherlands Sweden
Poland
United Arab Emirates
Indonesia
Vietnam
Malaysia
Pakistan
Oman
Saudi Arabia
Tanzania
Hong Kong Myanmar
Spain
Belgium
Egypt
United Kingdom
Australia
Italy
2013 Annual Report 17
• Totalrevenueincreased4%toHK$34,119million.
• EBITDAincreased1%toHK$11,447million.
• EBITdecreased4%toHK$7,358million.
• Annualthroughputincreased2%to78.3milliontwenty-footequivalentunits.
HWL 2013 Annual Results Operations Review
Page 4 of 72

Operations Review – Ports and Related Services
Hutchison Whampoa Limited18
1
1. The jacking frame (in red) heightens Quay Cranes at HIT by three metres.
2. Europe Container Terminals receives a “Lean and Green Star” for its environmental vigilance.
2
HWL 2013 Annual Results Operations Review
Page 5 of 72

2013 Annual Report 19
3
4 5
3. The Port of Cristobal in Panama.
4. The opening of the North Rail Terminal at UK’s Port of Felixstowe increases its handling capacity considerably.
5. Sydney International Container Terminals, the Group’s second port operation in Australia, commences operations.
HWL 2013 Annual Results Operations Review
Page 6 of 72

Operations Review – Ports and Related Services
Hutchison Whampoa Limited20
This division is one of the world’s leading port investors, developers and operators, and has interests in 52 ports comprising 278 operational berths in 26 countries.
Group Performance
The Group operates container terminals in five of the 10 busiest container ports in the world. The division comprises the Group’s 80% interest in the Hutchison Ports group of companies and its 27.62% interest in the HPH Trust, which together handled a total of 78.3 million twenty-foot equivalent units (“TEUs”) in 2013.
2013 2012 (1)
HK$millions HK$ millions Change
Total Revenue(2) 34,119 32,941 +4%
EBITDA(2) 11,447 11,343 +1%
EBIT(2) 7,358 7,681 -4%
Throughput (million TEUs) 78.3 76.8 +2%
Note 1: 2012 EBITDA and EBIT have been restated to reflect the effect of the adoption of amendments to HKAS19 in 2013.
Note 2: Total revenue, EBITDA and EBIT were adjusted to exclude non-controlling interests’ share of results of HPH Trust.
This division comprises of four segments: HPH Trust; Mainland China and other Hong Kong; Europe; and Asia, Australia and others.
In local currencies, total revenue and EBITDA of the division increased 3% and 0.4% respectively, but EBIT decreased 5% from last year. The lower EBIT reflected higher depreciation charges of HK$427 million including accelerated depreciation of certain assets at London Thamesport as well as charges for new ports and expanded facilities brought into operation during the year that, in ordinary course, can be expected to grow volumes and contribution over the next two to three years. This division contributed 8%, 12% and 12% respectively to the total revenue, EBITDA and EBIT of the Group’s businesses.
Overall throughput increased 2% to 78.3 million TEUs in 2013, reflecting a steady market growth in most geographical locations during the year, except HPH Trust where volumes at Kwai Tsing were adversely impacted by an industrial action in the second quarter and in parts of the Europe segment where economic recovery was slower. Recovery generally on the European segment improved in the second half of the year.
Total Container Throughput (+2%)by Subdivision
201378.3 million TEUs
201276.8 million TEUs
HPH Trust EuropeMainland China and Other Hong Kong Asia, Australia and Others *
20132010 2011 20122009
million TEUs
20
0
80
60
40
27.1
15.1
12.7
23.4
26.0
15.4
11.8
23.6
78.376.8
65.3
75.0 75.1
31%
15%20%
34% 30%
16%19%
35%
* Includes Panama, Mexico and the Middle East.
HWL 2013 Annual Results Operations Review
Page 7 of 72

2013 Annual Report 21
Total revenue increased 4% in 2013 primarily driven by higher contributions from Europe Container Terminals (“ECT”) in Rotterdam, ports in Shanghai, Thailand and Mexico, as well as favourable foreign exchange movement. In local currencies, total revenue increased 3%.
Note 3: Total revenue was adjusted to exclude non-controlling interests’ share of revenue of HPH Trust. For better comparison purposes in these charts and on a like-for-like basis, the Group’s attributable share of revenue for HPH Trust operations for 2009 to 2011 have been adjusted to reflect the Group’s attributable share of results based on the effective shareholding in HPH Trust during 2012.
As a result of increasing energy and labour costs and the effect of start-up expenses from newly opened terminals in Huizhou in the Mainland and Lazaro Cardenas in Mexico as well as developing ports in Sydney and Brisbane in Australia, EBITDA only improved by 1% in 2013, while the 4% decrease in EBIT was mainly due to higher depreciation charges of HK$427 million, mainly relating to accelerated depreciation of certain assets at London Thamesport and depreciaition charges for new terminals in Hong Kong, the Mainland and Spain and expanded facilities in three container terminals located in Mexico and Panama which, in ordinary course, can be expected to grow volumes and contribution over the next two to three years.
Note 4: EBITDA was adjusted to exclude non-controlling interests’ share of EBITDA of HPH Trust. For better comparison purposes in these charts and on a like-for-like basis, the Group’s attributable share of EBITDA for HPH Trust operations for 2009 to 2011 have been adjusted to reflect the Group’s attributable share of results based on the effective shareholding in HPH Trust during 2012.
Note 5: Comparatives have been restated to reflect the effect of the adoption of amendments to HKAS19 in 2013.
Total Revenue (3) (+4%)by Subdivision
HK$ millions
34,11932,941
31,829
25,195
28,573
10,000
0
20,000
30,000
2012HK$32,941 million
2013HK$34,119 million
1,015
2,759
16,638
11,440
2,267
1,163
2,733
16,034
10,941
2,070
20132010 2011 20122009
8%6%
4%
33%
49%
8%7%
3%
33%
49%
* Includes Panama, Mexico and the Middle East.
HPH Trust EuropeMainland China and Other Hong Kong Asia, Australia and Others * Other port related services
HK$ millions
0
1,000
3,000
7,000
5,000
9,000
EBITDA (4) (5) (+1%)by Subdivision
11,44711,34311,254
8,895
9,921
11,000
20132010 2011 20122009
-1,000
2012HK$11,343 million
2013HK$11,447 million
13%
12%
24%
1%
50%
12%
10%
25%
2%
51%
177
1,387
5,852
2,864
1,167
153
1,450
5,669
2,710
1,361
* Includes Panama, Mexico and the Middle East.
HPH Trust EuropeMainland China and Other Hong Kong Asia, Australia and Others * Corporate costs & Other port related services
HWL 2013 Annual Results Operations Review
Page 8 of 72

Operations Review – Ports and Related Services
Hutchison Whampoa Limited22
Segment Performance
HPH Trust
2013 2012 (6)
HK$millions HK$ millions Change
Total Revenue(7) 2,759 2,733 +1%
EBITDA(7) 1,387 1,450 -4%
EBIT(7) 785 875 -10%
Throughput (million TEUs) 23.4 23.6 -1%
Note 6: 2012 EBITDA and EBIT have been restated to reflect the effect of the adoption of amendments to HKAS19 in 2013.
Note 7: Total revenue, EBITDA and EBIT were adjusted to exclude non-controlling interests’ share of results of HPH Trust.
Throughput of ports operated by HPH Trust decreased by 1% in 2013 due to the impact of the industrial action at Kwai Tsing in the second quarter. However, higher average revenue per TEU at Yantian Ports resulted in an overall 1% increase in the Group’s share of revenue of HPH Trust. The Group’s share of EBITDA and EBIT decreased 4% and 10% respectively in 2013 mainly driven by the higher labour and other operating costs for Hongkong International Terminals (“HIT”) and COSCO-HIT Terminals reflecting the impact of the industrial action mentioned above.
In March 2013, HPH Trust acquired a 100% equity interest in Asia Container Terminals Holdings Limited, which owns and operates Asia Container Terminals Limited, also known as Container Terminal 8 West, located at Kwai Chung, Hong Kong, which is adjacent to HPH Trust’s existing container terminals. Acquisition of this asset is expected to enhance the HPH Trust’s strategic position in the port of Kwai Chung and actions are currently being considered to maximise the utilisation of the new facility for throughput growth, synergies realisation and to deliver profitablity improvements in 2014.
Mainland China and Other Hong Kong
2013 2012 HK$millions HK$ millions Change
Total Revenue 2,267 2,070 +10%
EBITDA 1,167 1,361 -14%
EBIT 823 1,040 -21%
Throughput (million TEUs) 12.7 11.8 +8%
The Mainland China and other Hong Kong segment has reported 8% and 10% increase in throughput and revenue respectively, mainly driven by the division’s Shanghai ports contribution as Waigaoqiao Port Zone Phase 6 container terminal commenced operations in August 2012, partially offset by lower volumes at ports in Ningbo and Xiamen.
Excluding an one-off asset disposal gain recognised last year, recurring EBITDA and EBIT of this segment improved by 4% and 3% respectively, mainly attributable to the strong performance of Shanghai ports partially offset by lower contributions from ports in Ningbo due to competition and Huizhou driven by the higher start-up losses for the two new container berths opened in the end of 2012 and in the second half of 2013.
HWL 2013 Annual Results Operations Review
Page 9 of 72

2013 Annual Report 23
Europe
2013 2012 (8)
HK$millions HK$ millions Change
Total Revenue 11,440 10,941 +5%
EBITDA 2,864 2,710 +6%
EBIT 1,642 1,741 -6%
Throughput (million TEUs) 15.1 15.4 -2%
In local currencies, revenue and EBITDA of the Europe segment increased 3% and 4% but EBIT decreased by 7%.
Throughput of the Europe segment decreased 2% in 2013 as weak economy in the first half resulted in lower volumes at ECT Rotterdam in the Netherlands. Despite lower volumes, however, revenue increased 5% in 2013 mainly driven by increases in other container handling revenue in ECT Rotterdam and higher tariffs of Barcelona Europe South Terminal (“BEST”). EBITDA of the Europe segment increased 6% over last year, mainly driven by the revenue growth of ECT Rotterdam and BEST Barcelona as well as favourable foreign exchange movement, partially offset by higher operating costs for majority of the European operations.
The 6% decrease in EBIT was driven by the higher depreciation charges of ECT Rotterdam, accelerated depreciation of certain assets at London Thamesport and depreciation charges for the new terminal at BEST Barcelona, which opened in the third quarter of 2012. With operations at Terminal Catalunya (“TERCAT”), the old terminal in Barcelona, fully migrated to the new terminal at BEST in early 2013, all four berths in the old terminal were returned to the Port Authority during the year.
Asia, Australia and Others
2013 2012 (8)
HK$millions HK$ millions Change
Total Revenue 16,638 16,034 +4%
EBITDA 5,852 5,669 +3%
EBIT 4,224 4,188 +1%
Throughput (million TEUs) 27.1 26.0 +4%
In local currencies, revenue, EBITDA and EBIT of the Asia, Australia and others segment increased 4%, 3% and 1% respectively.
Both throughput and revenue of the Asia, Australia and Others grew by 4% in 2013 as new services at Westports in Klang, Malaysia and the Laemchabang container terminals in Thailand brought in additional volumes during the year, partially offset by lower volumes from the ports in Mexico due to competition and in Panama due to local conditions. Revenue of the ports in Mexico grew 3% in local currency, mainly arising from the non-containerised revenue of Lazaro Cardenas Multipurpose Terminal which commenced operations during the year, offsetting lower container volumes from the Pacific side of Mexico.
EBITDA and EBIT of this segment increased 3% and 1% respectively, mainly attributable to higher contributions from ports in Jakarta, Indonesia; Dar es Salaam, Tanzania and Ajman, United Arab Emirates reflecting robust operating conditions as well as the effect of cost-saving measures, partially offset by the effect of start-up losses of the Australian ports as well as the lower contribution from Panama. The lower EBIT growth reflects the higher depreciation charge on facilities that were newly developed at Mexico and Panama and the newly opened ports in Brisbane and Sydney in Australia.
Westports Holdings Bhd (“Westports”), which operates one of Asia’s busiest shipping terminals at Port Klang on the west coast of peninsular Malaysia was listed on the Malaysia Stock Exchange in October 2013. Following Westports’ successful Initial Public Offering, the division’s interest in Westports decreased from 31.45% to 23.55%.
Note 8: 2012 EBITDA and EBIT have been restated to reflect the effect of the adoption of amendments to HKAS19 in 2013. HWL 2013 Annual Results Operations Review
Page 10 of 72

Property and Hotels
Hutchison Whampoa Limited26
Operations Review
Zhengcheng Noble Hills’ flourishing greenery and impressive environment are widely acclaimed.
HWL 2013 Annual Results Operations Review
Page 11 of 72

The Bahamas
Singapore
United Kingdom
Mainland China
Hong Kong
• Totalrevenueincreased22%toHK$24,264million.
• EBITDAincreased29%toHK$13,995million.
• EBITincreased30%toHK$13,659million.
• Thedivisioncontributed6%,15%and21%respectivelytothetotalrevenue,EBITDAandEBIToftheGroup'sbusinesses.
2013 Annual Report 27
HWL 2013 Annual Results Operations Review
Page 12 of 72

Hutchison Whampoa Limited28
Operations Review – Property and Hotels
1. Dongguan Laguna Verona Phase D – Laguna Summit - with magnificent architecture and impressive environment, is a masterpiece in Southern China
2. Redevelopment of luxury houses on Barker Road was completed during 2013.
1
2
HWL 2013 Annual Results Operations Review
Page 13 of 72

2013 Annual Report 29
4
5
3
3. & 4. Managed by Harbour Plaza Hotels and Resorts, Harbour Grand Hong Kong and Harbour Plaza North Point offer the finest hospitality to business and leisure travellers.
5. Strategically situated in Futian commercial district, Shenzhen, China, the three-in-one design of Century Place comprises a Grade A office tower, luxury apartments and a prime shopping arcade.
HWL 2013 Annual Results Operations Review
Page 14 of 72

Hutchison Whampoa Limited30
Operations Review – Property and Hotels
The Group’s property and hotels division includes an investment property portfolio of approximately 14.0 million square feet of office, commercial, industrial and residential premises, mainly residential property
development in the Mainland and overseas, and interests in 11 premium quality hotels.
Group Performance
The division’s attributable interest in the investment property portfolio consists of 11.8 million square feet of rental properties located in Hong Kong and 2.2 million square feet in the Mainland and overseas. The division also holds interests in joint ventures for the development of high quality, mainly residential projects with an attributable interest in a landbank of approximately 83 million developable square feet, primarily in the Mainland. In addition, the Group’s portfolio of 11 premium quality hotels has a total inventory of 8,503 rooms, in which the Group’s average effective interest is approximately 63% based on room numbers.
2013 2012 (1)
HK$ millions HK$ millions Change
Total Revenue 24,264 19,970 +22%
EBITDA 13,995 10,887 +29%
EBIT 13,659 10,521 +30%
Note 1: 2012 EBITDA and EBIT have been restated to reflect the effect of the adoption of amendments to HKAS19 in 2013.
In local currencies, the division reported growth in total revenue, EBITDA and EBIT, excluding property revaluation, of 19%, 25% and 26% respectively. This division contributed 6%, 15% and 21% respectively of the Group’s total revenue, EBITDA and EBIT.
Significant sales growth was reported with total revenue increased 22% compared with last year.
59%
19%
15%
7%
63%
17%12%
8%
Total Revenue (+22%)by Subdivision
2013HK$24,264 million
2012HK$19,970 million
Investment Properties HotelsDevelopment Properties Others
20132010 2011 20122009
HK$ millions
5,000
0
25,000
15,000
20,000
10,000
19,970
24,264
17,22616,159
13,912
1,861
3,020
15,233
4,150
1,415
3,021
11,805
3,729
HWL 2013 Annual Results Operations Review
Page 15 of 72

2013 Annual Report 31
57%
31%
12%
63%
27%
9% 1%
EBITDA (2) (+29%)by Subdivision
2013HK$13,995 million
2012HK$10,887 million
20132010 2011 20122009
HK$ millions
3,000
1,000
-1,000
0
11,000
13,000
9,000
7,000
5,000
10,887
13,995
9,8789,253
6,820
1461,285
8,774
3,790
-171,313
6,249
3,342
Investment Properties HotelsDevelopment Properties & Gains on Disposals Others
EBITDA and EBIT increased 29% and 30% respectively, primarily due to the completion and sale of various residential and commercial projects in the Mainland and Singapore, higher gains on disposal of properties in Hong Kong and the Mainland, as well as improved results from the hotel operations in the Bahamas during the year, partly offset by lower average occupancy and room rates in the hotel operations in the Mainland and certain hotels in Hong Kong.
Note 2: Comparatives have been restated to reflect the effect of the adoption of amendments to HKAS19 in 2013.
In addition to the EBITDA and EBIT above, the Group recorded an increase in fair value, after deferred tax expense and non-controlling interests, of HK$32 million in 2013 (2012: HK$1,113 million).
Segment Performance
Investment Properties
Gross rental income, including the share of rental income from the commercial premises in our hotels, increased
12% compared with last year, mainly due to higher rental renewal rates and improvements in occupancy levels. The
Group’s attributable interest in the rental properties portfolio of approximately 14.0 million square feet comprise
office (26%), commercial (29%), industrial (44%) and residential (1%) rental properties. The Group’s investment
properties overall generated an 8.7% yield on their carrying value of approximately HK$48,400 million.
2013HK$4,259 million
2012HK$3,805 million
Gross Rental Incomeby Property Type
2%
52%
14%
31%
1% 3%
52%
14%
31%
Office Commerical - Hotels ResidentialCommercial Industrial
Total Gross Rental Incomeby Geographical Location and Occupancy
0
1,000
2,000
3,000
4,000
HK$ millions
20132009 2010 2011 2012
3,805
4,259
3,8593,9493,787
42158
3,780
95% 97% 97% 97%97%
Hong Kong
Others
Mainland China
Occupancy
35155
3,399
HWL 2013 Annual Results Operations Review
Page 16 of 72

Hutchison Whampoa Limited32
Operations Review – Property and Hotels
Investment Properties (continued)
Hong Kong
The Group’s attributable interest in the rental properties in Hong Kong total approximately 11.8 milion square feet (2012: 12.0 million square feet) including properties held by associates and joint ventures. Gross rental income of HK$3,780 million (2012: HK$3,399 million) represents an 11% growth compared with last year and reflects higher lease renewal rates and occupancy levels. All of the Group’s Hong Kong rental properties are substantially let.
The Mainland and Overseas
The Group’s various joint ventures in the Mainland and overseas hold investment properties totalling 4.2 million square feet, of which the Group’s share is 2.2 million square feet (2012: 2.1 million square feet). The Group’s share of gross rental income from these properties was HK$479 million (2012: HK$406 million), 18% above last year, reflecting increased rental rates and occupancy levels in the Mainland as well as the leasing to third parties of certain properties in the Bahamas previously held for own-use.
Development Properties and Gains on Property Disposals
Development profits and gains on disposal of properties contributed HK$8,774 million to the Group’s EBITDA in 2013 (2012: HK$6,249 million). During the year, profits were recorded from the sale of units in joint venture residential development projects in the Mainland, Singapore and Hong Kong. The Group also recognised gains on the disposal of its interests in certain office and residential properties in Hong Kong and its interests in the Guangzhou Metropolitian Plaza in the Mainland during the year.
The division completed residential and commercial properties with an attributable gross floor area of approximately 9.0 million square feet and recognised sales from development properties on an attributable share of gross floor area amounting to 7.8 million square feet in 2013, representing increases of 5% and 15% respectively compared to 2012. The corresponding revenue from recognised sales, including the Group’s attributable share of revenue from associated companies and joint ventures, increased by 29% to HK$15,233 million in 2013, reflecting both increased sales volumes and completion activities.
The Group’s current attributable landbank (including interests held directly and its share of interests held by associated companies and joint ventures), is approximately 83 million square feet, of which 97% is in the Mainland (at an average land cost of RMB240 per sq ft or approximately HK$307 per sq ft) and 3% in the UK and Singapore. This landbank comprises 43 projects in 22 cities and is planned to be developed in a phased manner over several years.
Chongqing Shanghai
Others (Principally in London & Singapore)
Guangdong Province
Chengdu
Wuhan
Other areas in Mainland China
3%
22%
22%
15%
8%
9%
21%
Total: 83 million square feet
Gross Floor Area of Development Projectsby Geographical Location
Total: 83 million square feet
4%10%
86%
Residential Commercial Office & Others
Gross Floor Area of Development Projectsby Property Type
HWL 2013 Annual Results Operations Review
Page 17 of 72

2013 Annual Report 33
During 2014, the division targets completion of an attributable share of gross floor area of approximately 8.3 million square feet of residential and commercial properties, including in 11 cities in the Mainland and in Singapore.
The Group is targeting contracted sales of over 10,700 residential units in 2014. A total attributable share of approximately 10.4 million square feet of gross floor area (which includes an attributable share of 1.5 million square feet of commercial properties) is expected to be sold in 19 cities in the Mainland, as well as in Singapore and the UK.
The Mainland
Of the Group’s attributable share of approximately 9.0 million square feet of development completed in 2013, approximately 8.9 million square feet were completed in the Mainland, as detailed in the “Additional Information” section of the annual report.
The Group recognised sales on an attributable share of gross floor area amounting to 7.7 million square feet, an increase of 15% compared to last year, with 7.0 million square feet related to residential properties, an increase of 14%. The Group’s share of recognised revenue from development sales, net of business tax, increased 23% to HK$14,172 million, of which HK$10,830 million related to residential properties representing an average selling price of HK$1,636 per sq ft (2012: HK$1,722 per sq ft). The Group’s average land cost relating to the recognised sales of residential properties in the Mainland in 2013 was approximately HK$227 per sq ft (2012: HK$227 per sq ft). The Group’s average construction cost and average professional, marketing, funding and other costs amounted to approximately HK$533 per sq ft and HK$311 per sq ft respectively (2012: HK$504 per sq ft and HK$291 per sq ft respectively). Development profits from recognised sales of residential and commercial properties in the Mainland contributed HK$5,210 million to the Group’s EBITDA during the year, 14% higher than 2012.
In addition, the Group’s attributable share of gross floor area from contracted sales in 2013 amounted to 7.0 million square feet, of which 6.4 million square feet related to residential properties. The Group’s share of contracted sales revenue, net of business tax, in 2013 amounted to HK$14,149 million, of which HK$11,122 million related to residential properties. As at the end of 2013, the Group presold but had not yet recognised the sale of an attributable share of gross floor area totalling 1.6 million square feet, all of which related to residential properties with a total value of HK$3,028 million, net of business tax.
HWL 2013 Annual Results Operations Review
Page 18 of 72

Hutchison Whampoa Limited34
Operations Review – Property and Hotels
Development Properties and Gains on Property Disposals (continued)
2013 2012 Change
Total Attributable Sales Value (HK$ millions)
Recognised Sales* 14,172 11,562 +23%– of which relates to residential property 10,830 10,038 +8%
ASP^ of residential property (HK$/sq ft) 1,636 1,722 -5%
Contracted Sales* 14,149 12,761 +11%– of which relates to residential property 11,122 11,120 +0%
ASP^ of residential property (HK$/sq ft) 1,861 1,524 +22%
Total Attributable Sales in GFA (000’s sq ft)
Presold Property b/f 2,321 764
Recognised Sales in GFA 7,748 6,749 +15%– of which relates to residential property 7,041 6,201 +14%
Contracted Sales in GFA 6,985 8,306 -16%– of which relates to residential property 6,354 7,761 -18%
Presold Property c/f 1,558 2,321
* Net of business tax^ Average selling price (“ASP”) is stated inclusive of business tax
Residential Property SalesBy Geographical Location
2013: HK$10,830 million (+8%)
Recognised Sales
2%4%
5%4%
5%
21%
17%
42%
ChengduGuandong Province
Changchun
Shanghai
Xian Others
Chongqing Qingdao
2013: HK$ 11,122 million (+0%)
Contracted Sales
29%
4%
6%
4%3%
5%
35% 14%
ChengduGuandong Province
Changchun
Shanghai
Xian Others
Chongqing Qingdao
2013: 6.4 million square feet (-18%)
Contracted Sales GFA
23%
6%7%
9%
7%
3%
20%
25%
ChengduGuandong Province ChangchunShanghai Xian OthersChongqing Qingdao
2013: 6.4 million square feet (-18%)
Contracted Sales GFA
23%
6%7%
9%
7%
3%
20%
25%
ChengduGuandong Province ChangchunShanghai Xian OthersChongqing Qingdao
2013: 7.0 million square feet (+14%)
Recognised Sales GFA
32%
2%5%
6%
8%
6%
7%
34%
ChengduGuandong Province
Changchun
Shanghai
Xian Others
Chongqing Qingdao
HWL 2013 Annual Results Operations Review
Page 19 of 72

2013 Annual Report 35
Hotels
The Group has interests in 11 hotels in Hong Kong, the Mainland and the Bahamas, of which seven are managed through its 50% owned hotel management joint venture. In 2013, the hotel operations recorded total revenue of HK$3,020 million, which is flat against last year. EBITDA, including the results of hotel commercial properties, decreased slightly by 2% to HK$1,285 million and EBIT remained flat at HK$1,036 million when compared to 2012, mainly due to an improvement in the results from operations in the Bahamas, offset by lower average room and occupancy rates in the hotels in the Mainland as well as certain hotels in Hong Kong. The average occupancy rate of the hotel operations decreased slightly from 86% in 2012 to 84% in 2013.
The Group’s attributable share of gross floor area of 1.9 million square feet in the eight hotels in Hong Kong, generated an average attributable hotel operating profit (“HOP”)(1) of HK$37 per sq ft per month (ranging from HK$12 per sq ft per month to HK$75 per sq ft per month), and a 19.5% EBIT yield on its attributable carrying value of these hotels of approximately HK$3,724 million.
Note 1: HOP represents EBITDA after depreciation of furniture, fixtures and equipment.
Average Actual Room Inventory by Geographical Location and Occupancy Rate
3,000
0
6,000
9,000
Rooms
20132009 2010 2011 2012
Hong Kong
Others
Mainland China
Average Occupancy Rate
86% 84%
76%
84%
68%
8,504 8,5038,5049,365 9,366
1,216
6,016
1,271
1,216
6,017
1,271
HWL 2013 Annual Results Operations Review
Page 20 of 72

Retail
Hutchison Whampoa Limited36
Operations Review
Over 70% of all Dutch families in the Netherlands are customers at Kruidvat.
HWL 2013 Annual Results Operations Review
Page 21 of 72

Turkey
Luxembourg
Hungary
Ukraine
Ireland
Belgium
Germany
The Netherlands
Czech Republic
Poland
Lithuania
Latvia
United Kingdom
Indonesia
Singapore
The Philippines
Russia
Macau
Malaysia
Mainland China
Thailand
Taiwan
Hong Kong
South Korea
Albania
2013 Annual Report 37
• Totalrevenueincreased8%toHK$149,147million.
• EBITDAincreased11%toHK$14,158million.
• EBITincreased14%toHK$11,771million.
• Theretaildivisioncontributed36%,15%and18%respectivelytothetotalrevenue,EBITDAandEBIToftheGroup’sbusinesses.
2013 Annual Report 372013 Annual Report 37
HWL 2013 Annual Results Operations Review
Page 22 of 72

Operations Review – Retail
Hutchison Whampoa Limited38
1. A S Watson Group’s flagship retail brand Watsons opens its first baby concept store in Hong Kong.
2. Superdrug is one of the largest health and beauty retailer in the UK and operates over 800 stores in the region.
1
2
HWL 2013 Annual Results Operations Review
Page 23 of 72

2013 Annual Report 39
5
3
4
3. The Perfume Shop operates over 260 stores in the United Kingdom.
4. Watsons reaches 4,000 stores at the end of 2013, of which almost 1,700 stores are in Mainland China.
5. The GREAT store at Pacific Place in Hong Kong unveils its new look, reinforcing its brand image as an international concept food hall.
HWL 2013 Annual Results Operations Review
Page 24 of 72

Hutchison Whampoa Limited40
Operations Review – Retail
The retail division consists of the A S Watson group of companies, the world’s largest health and beauty retailer in terms of store numbers.
The Group is continuing to assess its strategic options for maximising the value and future growth potential of this division. This strategic review process may include considering the possibility of public offerings (whilst retaining control) in all or some of the retail businesses in appropriate markets. While no decision has been made at this time to pursue any particular option, the Marionnaud business will not be considered at this stage as a potential initial public offering candidate. Accordingly, the performance of the Marionnaud business has been excluded from this division and included under the Finance & Investment and Others segment. As part of this ongoing strategic review, the Group has appointed three financial advisors (1) to assist with the review and is engaging with regulators and potential investors. Although progress has been made in the strategic review since October 2013, no decision has been made at this time to pursue any particular option.
Group Performance
A S Watson currently operates 14 retail brands with over 10,500 stores in 25 markets worldwide, providing high quality personal care, health and beauty products; food and fine wines; as well as consumer electronics and electrical appliances. A S Watson also manufactures and distributes various bottled waters and other beverages in Hong Kong and the Mainland. As mentioned above, the Marionnaud business is now excluded from this division’s results and performance.
2013 2012 (2)
HK$ millions HK$ millions Change
Total Revenue 149,147 138,519 +8%
EBITDA 14,158 12,779 +11%
EBIT 11,771 10,357 +14%
Total Store Numbers 10,581 9,742 +9%
In local currencies, growth in total revenue, EBITDA and EBIT for the year were 6%, 9% and 12% respectively. The retail division contributed 36%, 15% and 18% respectively to the total revenue, EBITDA and EBIT of the Group’s businesses.
Excluding the impact attributable to the expiration of Nuance-Watson’s two core concession licences at Hong Kong International Airport in late 2012, total revenue, EBITDA and EBIT of the Group’s retail businesses grew by 9%, 13% and 16% respectively in 2013.
The Group’s retail businesses are managed under five principal operating subdivisions: Health and Beauty China; Health and Beauty Asia (excluding the Mainland); Health and Beauty Western Europe; Health and Beauty Eastern Europe and Other Retail.
Revenue growth was strong across all Health and Beauty subdivisions, which was supported by increased store numbers and year-on-year comparable store sales growth. The division reported 7% and 9% growth in total revenue in Asia and Europe respectively compared to last year. In local currencies, growth in total revenue in Asia and Europe were 6% and 7% respectively for the year.
Note 1: The Group has appointed Bank of America Merrill Lynch, Goldman Sachs and HSBC as advisors to assist with the strategic review of its retail businesses.
Note 2: 2012 results exclude Marionnaud results in the comparatives as the business is no longer reported under this division. 2012 EBITDA and EBIT have been restated to reflect the effect of the adoption of amendments to HKAS19 in 2013.
HWL 2013 Annual Results Operations Review
Page 25 of 72

2013 Annual Report 41
2013 2012 (3) Change in Total Revenue HK$ millions HK$ millions Change local currency
Health & Beauty China 17,962 15,368 +17% +14%
Health & Beauty Asia 19,713 18,051 +9% +10%
Health & Beauty Western Europe 60,469 56,196 +8% +6%
Health & Beauty Eastern Europe 13,518 11,953 +13% +12%
Health & Beauty Subtotal 111,662 101,568 +10% +8%
Other Retail (4) 37,485 36,951 +1% +1%
Total Retail 149,147 138,519 +8% +6%
- Asia 75,099 70,294 +7% +6%
- Europe 74,048 68,225 +9% +7%
Comparable Store Sales Growth (%) (5) – in local currency 2013 2012 (3)
Health & Beauty China +0.6% +0.6%
Health & Beauty Asia +4.9% +5.8%
Health & Beauty Western Europe +2.8% +5.0%
Health & Beauty Eastern Europe +3.2% +3.6%
Health & Beauty Subtotal +2.9% +4.5%
Other Retail (4) -0.3% +5.6%
Total Retail +2.2% +4.8%
– Asia +1.4% +4.8%
– Europe +2.9% +4.8%
Note 3: 2012 results exclude Marionnaud results in the comparatives as the business is no longer reported under this division.
Note 4: Other Retail includes PARKnSHOP, Fortress, Watson’s Wine, Nuance-Watson and manufacturing operations for water and beverage businesses.
Note 5: Comparable store sales growth represents the percentage change in revenue contributed by stores which, as at the first day of the relevant financial year (a) have been operating for over 12 months and (b) have not undergone major resizing within the previous 12 months.
40%
13%
27%
11%
Total Revenue (+8%) (3)
by Subdivision
2013HK$149,147 million
2012HK$138,519 million
HK$ millions
41%
13%
25%
12%
Health & Beauty China Health & Beauty Western Europe
Health & Beauty Eastern Europe
Health & Beauty Asia Other Retail
9%9%
20132011 2012200920082007 2010
30,000
90,000
150,000
120,000
60,000
132,223138,519
104,863106,34698,024
112,466
36,951
11,953
56,196
18,051
15,368
149,147
37,485
13,518
60,469
19,713
17,962
0
HWL 2013 Annual Results Operations Review
Page 26 of 72

Hutchison Whampoa Limited42
Operations Review – Retail
Store Numbers 2013 2012 (6) Change
Health & Beauty China 1,693 1,438 +18%
Health & Beauty Asia 1,864 1,684 +11%
Health & Beauty Western Europe 4,710 4,569 +3%
Health & Beauty Eastern Europe 1,781 1,563 +14%
Health & Beauty Subtotal 10,048 9,254 +9%
Other Retail (8) 533 488 +9%
Total Retail 10,581 9,742 +9%
– Asia 4,090 3,610 +13%
– Europe 6,491 6,132 +6%
Note 6: 2012 results exclude Marionnaud results in the comparatives as the business is no longer reported under this division.
Note 7: In 2012, Rossmann Germany acquired 90 stores as a result of the forced closure of a competitor.
Note 8: Other Retail includes PARKnSHOP, Fortress, Watson’s Wine, Nuance-Watson and manufacturing operations for water and beverage businesses.
Total Net Additions of Retail Stores (6) (7)
by Subdivision
2013Total Net Additions: 839
2012Total Net Additions: 898
Stores
600
800
200
400
0
-200
30%
22%
5%2%
42%
22%
17%
15
375
152
200
156
898
368
610
754
Health & Beauty China Health & Beauty Western Europe
Health & Beauty Eastern Europe
Health & Beauty Asia Other Retail Gross Additions of Stores
26%
1,145 1,115
786
958
536
1,000
17%
17%
20132011 2012200920082007 2010
45
255
180
141
218
839
397
190
457423
17%
47%
15%5%
Total Retail Store Numbers (+9%) (6)
by Subdivision
2013Total Stores: 10,581
2012Total Stores: 9,742
18%
44%
16%5%
Health & Beauty China Health & Beauty Western Europe
Health & Beauty Eastern Europe
Health & Beauty Asia Other Retail
17%16%
Stores
0
10,000
6,000
8,000
4,000
2,000
7,4808,090
8,844
12,000
10,581
1,693
1,781
1,864
4,710
9,742
1,438
1,563
1,684
4,569
20132011 2012200920082007 2010
6,7157,112
488 533
HWL 2013 Annual Results Operations Review
Page 27 of 72

2013 Annual Report 43
The Group recorded 11% and 14% increases in EBITDA and EBIT respectively, which were mainly supported by the aforementioned 8% growth in revenue as well as improvements in margins and operational efficiencies. EBITDA growth was solid across all health and beauty subdivisions. However, Other Retail was mainly impacted by the expiration of the two core concession licences of Nuance-Watson Hong Kong, as well as lower contributions from the PARKnSHOP operations.
2013 2012 (9) Change inEBITDA HK$ millions HK$ millions Change local currency
Health & Beauty China 3,567 3,031 +18% +15%
Health & Beauty Asia 1,779 1,611 +10% +11%
Health & Beauty Western Europe 5,168 4,390 +18% +15%
Health & Beauty Eastern Europe 1,703 1,584 +8% +6%
Health & Beauty Subtotal 12,217 10,616 +15% +13%
Other Retail (10) (11) 1,941 2,163 -10% -10%
Total Retail 14,158 12,779 +11% +9%
– Asia 7,290 6,807 +7% +6%
– Europe 6,868 5,972 +15% +13%
Note 9: 2012 results exclude Marionnaud results in the comparatives as the business is no longer reported under this division. Comparatives have been restated to reflect the effect of the adoption of amendments to HKAS19 in 2013.
Note 10: Other Retail includes PARKnSHOP, Fortress, Watson’s Wine, Nuance-Watson and manufacturing operations for water and beverage businesses.
Note 11: Excluding the impact arising from the expiration of core concession licences in Nuance-Watson Hong Kong, EBITDA would increase by 1% against 2012.
The Group’s retail businesses in Asia recorded 7% increases in both revenue and EBITDA. Excluding the impact arising from the expiration of the concession licences, revenue and EBITDA grew by 9% and 11% respectively in Asia. The Group’s retail businesses in Europe continued to demonstrate resilience and delivered strong revenue and EBITDA growth of 9% and 15% respectively. In local currencies, revenue and EBITDA improved by 7% and 13% respectively in Europe. The division’s overall growth in Asia and in Europe reflects competitive product offerings, improving margin management, operational efficiencies and the continuing focus on global own-brand and exclusive products.
The Group’s retail division has a customer relationship management (“CRM”) membership base of over 70 million at the end of 2013 with CRM sales participation reaching 53% in 2013. Moreover, digital sales from ecommerce grew by 14% to HK$1 billion in 2013 compared to 2012.
In particular, the overall health and beauty subdivisions continued to deliver strong performances in 2013 mainly driven by high quality new store openings with an average new store cash payback period of less than 10 months. The average capex per new store for the overall health and beauty subdivisions was HK$1 million in 2013.
EBITDA (+11%) (9)
by Subdivision
2013HK$14,158 million
2012HK$12,779 million
24%
13%
34%
12%
17% 25%
13%
36%
12%
14%
Health & Beauty China Health & Beauty Western Europe
Health & Beauty Eastern Europe
Health & Beauty Asia Other Retail
HK$ millions
2,000
0
12,000
14,000
10,000
6,000
8,000
5,832
4,000
1,941
1,703
5,168
1,779
14,158
3,56712,779
2,163
1,584
4,390
1,611
3,031
8,414
9,970
11,814
20132011 2012200920082007 2010
6,517
HWL 2013 Annual Results Operations Review
Page 28 of 72

Hutchison Whampoa Limited44
Operations Review – Retail
Segment Performance
Health and Beauty China
2013 2012 HK$ millions HK$ millions Change
Total Revenue 17,962 15,368 +17%
EBITDA 3,567 3,031 +18%
EBIT 3,212 2,767 +16%
Total Store Numbers 1,693 1,438 +18%
The Watsons business continues to be the leading health and beauty retail chain in Mainland China. With weaker than expected consumer sentiment in the Mainland, comparable store sales growth for 2013 remained at 0.6%. This was more than offset by total revenue growth, which continued to be robust at 17% driven by an 18% increase in the store numbers. EBITDA and EBIT growth also remained strong at 18% and 16% respectively.
Health and Beauty China increased its total number of stores by 255 during the year with an average new store cash payback period of less than 10 months, average capex per new store of HK$1.2 million and currently has more than 1,600 stores operating in 297 cities in the Mainland. The subdivision has over 35 million CRM members with a CRM sales participation of 73% in 2013.
Health and Beauty Asia
2013 2012 HK$ millions HK$ millions Change
Total Revenue 19,713 18,051 +9%
EBITDA 1,779 1,611 +10%
EBIT 1,470 1,298 +13%
Total Store Numbers 1,864 1,684 +11%
The Watsons business is the leading health and beauty retail chain in Asia with strong brand name recognition and extensive geographical coverage. Combined total revenue grew by 9% compared to last year reflecting the 11% increase in store numbers and comparable store sales growth of 4.9% (2012: 5.8%). EBITDA and EBIT growth were 10% and 13% respectively, mainly due to increased contributions from the Watsons businesses in Taiwan, Malaysia, Hong Kong, Thailand and the Philippines.
Health and Beauty Asia increased its total number of stores by 180 during the year with an average capex per new store of HK$0.7 million and achieving an average new store cash payback period of less than 9 months. The subdivision currently has more than 1,800 stores operating in 9 markets.
2013Total stores: 1,864
2012Total stores: 1,684
Health and Beauty Asia (+11%)Number of Retail Stores by Market
5%
26%
19%
15%
16%7%
12% 6%
25%
19%
16%
16%6%
12%
Hong Kong & Macau
SingaporeTaiwan Malaysia Thailand The Philippines Other Asian Countries
HWL 2013 Annual Results Operations Review
Page 29 of 72

2013 Annual Report 45
Health and Beauty Western Europe
2013 2012 HK$ millions HK$ millions Change
Total Revenue 60,469 56,196 +8%
EBITDA 5,168 4,390 +18%
EBIT 4,163 3,250 +28%
Total Store Numbers 4,710 4,569 +3%
Health and Beauty Western Europe consists of Kruidvat and Trekpleister in the Benelux countries; the Rossmann joint venture in Germany; Superdrug and The Perfume Shop in the UK and Ireland; Savers in the UK; and ICI Paris XL in the Netherlands, Belgium and Luxembourg.
Despite the difficult trading environment in Europe, the health and beauty businesses in Western Europe were able to grow their revenue, in local currencies, by 6% against last year. This growth was mainly due to better sales performances of the Rossmann joint venture in Germany and of Kruidvat in the Benelux countries, as well as increased contributions from Savers in the UK. Comparable store sales growth remained healthy at 2.8% (2012: 5.0%). In local currencies, EBITDA increased by 15% compared to last year mainly driven by better margins and tight cost controls, while EBIT grew by 25% as lower depreciation was incurred in 2013.
Health and Beauty Western Europe added 141 stores during 2013 and currently operates more than 4,700 stores. The average capex per new store was HK$1.4 million in 2013, and the average new store cash payback period of this subdivision was less than 13 months.
2013Total stores: 4,710
2012Total stores: 4,569
Health and Beauty Western Europe (+3%)Number of Retail Stores by Market
30%
31%
39%
29%
32%
39%
Germany United Kingdom and IrelandBenelux Countries
HWL 2013 Annual Results Operations Review
Page 30 of 72

Hutchison Whampoa Limited46
Operations Review – Retail
2013Total stores: 1,781
2012Total stores: 1,563
Health and Beauty Eastern Europe (+14%)Number of Retail Stores by Market
6%
18%
45%
17%
18%
48%
Poland Ukraine Turkey Other Eastern European CountriesHungary
12%
19%
10%
7%
Health and Beauty Eastern Europe
2013 2012 HK$ millions HK$ millions Change
Total Revenue 13,518 11,953 +13%
EBITDA 1,703 1,584 +8%
EBIT 1,425 1,330 +7%
Total Store Numbers 1,781 1,563 +14%
Health and Beauty Eastern Europe consists of Watsons in Turkey and Ukraine; the Rossmann joint ventures in Central European countries; Drogas in the Baltic States and Spektr in Russia.
In Eastern Europe, the health and beauty businesses reported strong revenue growth of 12% in local currencies, mainly due to the increased contributions from the Rossmann joint venture in Poland, as well as the Watsons businesses in Turkey and Ukraine. Comparable store sales growth remained healthy at 3.2% (2012: 3.6%). EBITDA and EBIT, in local currencies, increased by 6% and 5% respectively compared to last year mainly driven by the aforementioned revenue growth, partially offset by lower margins.
Health and Beauty Eastern Europe added 218 stores during 2013 and currently operates more than 1,700 stores in 8 markets. The average capex per new store was HK$0.5 million in 2013 and the average new store cash payback period in this subdivision was less than 9 months.
HWL 2013 Annual Results Operations Review
Page 31 of 72

2013 Annual Report 47
Other Retail
2013 2012 HK$ millions HK$ millions Change
Total Revenue 37,485 36,951 +1%
EBITDA 1,941 2,163 -10%
EBIT 1,501 1,712 -12%
Total Store Numbers 533 488 +9%
Other Retail consists of leading retail concepts in Hong Kong, being PARKnSHOP supermarkets and other related concept stores; Fortress consumer electronics and electrical appliances stores; and Watson’s Wine stores. The subdivision also includes PARKnSHOP and Watson’s Wine stores in the Mainland, Nuance-Watson in Hong Kong, Singapore and Mainland international airports, as well as manufacturing and distribution of well-known brands of bottled water, fruit juices and soft drinks in Hong Kong and the Mainland.
This subdivision reported total revenue growth of 1%, but EBITDA and EBIT declined by 10% and 12% respectively mainly due to the expiration of Nuance-Watson’s two core airport concession licences, as well as lower contributions from the PARKnSHOP operations. Excluding the impact arising from the aforementioned expiration of the airport licences, total revenue of this subdivision grew by 5%, while both EBITDA and EBIT increased by 1% against 2012. The subdivision recorded a comparable store sales decline of 0.3% in 2013 (2012: comparable store sales growth of 5.6%) mainly due to the slower comparable store sales of the PARKnSHOP operations, as well as lower mobile phone sales in the Fortress stores during the year. Other Retail currently operates over 530 retail stores in 4 markets.
2013Total stores: 533
2012Total stores: 488
Other Retail (+9%)Number of Retail Stores by Segment
5%9%
19%
67%
5%9%
18%
68%
Fast-moving Consumer Goods Airport Concessions Wine RetailingConsumer Electronics
HWL 2013 Annual Results Operations Review
Page 32 of 72

Infrastructure
Operations Review
Hutchison Whampoa Limited48
CKI further expands and enriches its global investment portfolio in 2013.
HWL 2013 Annual Results Operations Review
Page 33 of 72

Canada
Australia
New Zealand
United Kingdom Mainland China
Thailand
Hong Kong
The Netherlands
2013 Annual Report 49
• CKIannouncedprofitattributabletoshareholdersofHK$11,639million.
• Thedivisioncontributed10%,24%and27%respectivelytothetotalrevenue,EBITDAandEBIToftheGroup’sbusinesses.
HWL 2013 Annual Results Operations Review
Page 34 of 72

Hutchison Whampoa Limited50
Operations Review – Infrastructure
2
3
1
1. Enviro Waste is one of the leading waste management companies in New Zealand and is the operator of the country’s largest landfill.
2. A consortium led by CKI completes the acquisition of the Netherlands’ largest energy-from-waste company, AVR.
3. CKI’s new flagship cement production facility in Yunfu, Guangdong Province commences production.
HWL 2013 Annual Results Operations Review
Page 35 of 72

2013 Annual Report 51
The infrastructure division comprises the Group’s interest in Cheung Kong Infrastructure Holdings Limited (“CKI”), a leading investor in the infrastructure sectors in Hong Kong, the Mainland, the UK, the Netherlands, Australia, New
Zealand and Canada.
The Group holds 78.16% (1) of CKI, which contributed 10%, 24% and 27% respectively to the total revenue, EBITDA and
EBIT of the Group’s businesses.
2013 2012 HK$ millions HK$ millions Change
Total Revenue 42,460 39,693 +7%
EBITDA 22,841 21,405 +7%
EBIT 17,528 16,643 +5%
CKI is one of the largest publicly listed infrastructure companies on the SEHK, with diversified investments in energy infrastructure, transportation infrastructure, water infrastructure, waste management and infrastructure-related businesses.
CKI announced profit attributable to shareholders of HK$11,639 million, an increase of 23% from 2012, mainly reflecting a full year’s profit contribution from Wales & West Utilities acquired in October 2012, the accretive contributions from the newly acquired investments, as well as the higher deferred tax credits in 2013 arising from the reduction in deferred tax liabilities following the enactment of a lower UK tax rate.
CKI holds a 38.87% interest in Power Assets, a company listed on the SEHK. Power Assets has interests in power and utility-related businesses in the UK, the Mainland, Australia, New Zealand, Thailand, Canada and the Netherlands. Power Assets is also the sole provider of electricity to Hong Kong Island and Lamma Island through its wholly-owned subsidiary, The Hongkong Electric Company, Limited. Power Assets announced profit attributable to shareholders of HK$11,165 million, an increase of 15% compared to last year’s profit of HK$9,729 million. Earnings from Power Assets’ operations outside Hong Kong were HK$6,386 million, 25% higher than 2012, mainly attributable to approximately 40% growth in profit contribution from its UK investments.
In April 2013, CKI completed the acquisition of a 100% interest in Enviro Waste Services Limited, a diversified, vertically integrated waste management business that has national coverage across New Zealand, for a consideration of approximately NZ$490 million.
In August 2013, a CKI-led consortium completed the acquisition of AVR-Afvalverwerking B.V., the largest “energy-from-waste” business in the Netherlands, for approximately €940 million.
In January 2014, Power Assets completed the separate listing of its Hong Kong electricity business, by way of the listing of share stapled units jointly issued by HK Electric Investments and HK Electric Investments Limited (collectively as “HKEI”) on the Main Board of the SEHK. Power Assets currently holds 49.9% of HKEI.
Note 1: Represents the shareholding percentage as at 31 December 2013 and excludes the shares issued to and held by the fiduciary in connection with the issue of perpetual capital securities in February 2012. Including these shares, the Group’s interest reduces to 76.39%.
HWL 2013 Annual Results Operations Review
Page 36 of 72

Hutchison Whampoa Limited54
Energy
Operations Review
Husky Energy has a 40% working interest in the Wenchang oil field in the South China Sea.
HWL 2013 Annual Results Operations Review
Page 37 of 72

2013 Annual Report 55
Canada
Greenland
United States Indonesia
Mainland China
Taiwan
• HuskyEnergyannouncedrevenues,netofroyalties,increased5%toC$23,368million.
• Profitattributabletoshareholders,beforeimpairmentchargesofC$204million,increased1%toC$2,033million.
• HuskyEnergy’sproductionaveragedapproximately312,000barrelsofoilequivalentperday.
HWL 2013 Annual Results Operations Review
Page 38 of 72

Hutchison Whampoa Limited56
Operations Review – Energy
1
2
1. The SeaRose FPSO vessel is an important component of the White Rose development in the Atlantic Region.
2. The Gaolan Gas Terminal - part of the Liwan Gas Project in the South China Sea.
HWL 2013 Annual Results Operations Review
Page 39 of 72

2013 Annual Report 57
4
3
3. Steam generators are under construction at the Sunrise Energy Project in the northeast of Fort McMurray, Alberta.
4. Husky is one of Canada’s most recognised retail brands and operates several hundred outlets across Canada.
5. Located near Lloydminster, Alberta, the Sandall Heavy Oil Thermal Project is equipped to produce 3,500 barrels per day.
5
HWL 2013 Annual Results Operations Review
Page 40 of 72

Hutchison Whampoa Limited50
Operations Review – Energy
The energy division comprises of the Group’s 33.98% interest in Husky Energy, a Canadian based international integrated energy and energy-related company listed on the Toronto Stock Exchange.
2012 2013 Restated (1) HK$ millions HK$ millions Change
Total Revenue 59,481 58,744 +1%
EBITDA 14,779 14,889 -1%
EBIT 7,208 7,427 -3%
Production (mboe/day) 312.0 301.5 +3%
Note 1: Total revenue in 2012 reduced by HK$480 million due to reclassification adjustment made by Husky Energy to its 2012 reported revenue and cost of sales, following a change in presentation of trading activities and a change in the classification of certain trading transactions.
The energy division contributed 14%, 15% and 11% respectively to the total revenue, EBITDA and EBIT of the Group’s businesses.
Husky Energy announced revenues, net of royalties, increased 5% to C$23,368 million. Profit from operations attributable to shareholders was C$1,829 million, including a C$204 million impairment charge after tax on certain natural gas assets in Western Canada. Excluding the impairment, profit from operations attributable to shareholders increased 1% over last year to C$2,033 million, reflecting higher average realised prices for crude oil and natural gas, combined with higher crude oil production in the Atlantic Region and in Western Canada from heavy oil thermal projects, offset by decreased Downstream margins from significantly lower market crack spreads and a major planned turnaround of the Upgrading facility in the third quarter of 2013, as well as decreased Infrastructure and Marketing margins due to volatility in Western Canadian crude oil price differentials which narrowed in the second and third quarters of the year.
The Group’s share of EBITDA and EBIT, after translation into Hong Kong dollars and consolidation adjustments, but before the impairment charge mentioned above, decreased 1% and 3% respectively due to adverse foreign exchange movement.
In 2013, Husky Energy’s production averaged approximately 312,000 barrels of oil equivalent (“BOEs”) per day, a 3% increase when compared to approximately 301,500 BOEs per day in 2012, primarily due to increased production from heavy oil thermal projects in Western Canada, higher production in the Atlantic Region which was adversely impacted last year by the major planned turnarounds of the SeaRose and Terra Nova floating, production, storage and offloading vessels, partially offset by reduction in investments in dry natural gas production.
Aggregated dividends on common shares of C$1,180 million relating to the fourth quarter of 2012 and the first three quarters of 2013 were declared during the year, of which C$1,170 million and C$10 million were paid in cash and common shares respectively. Cash received and receivable by the Group from Husky Energy’s dividend amounted to C$401 million or HK$3,055 million in 2013. The Group’s interest in Husky Energy decreased from 34.02% at the end of 2012 to the current interest of 33.98%.
HWL 2013 Annual Results Operations Review
Page 41 of 72

2013 Annual Report 51
Note 2: Oil and gas reserves disclosures for 2010 to 2013 have been prepared in accordance with Canadian Securities Administrators’ National Instrument 51-101 “Standards of Disclosure for Oil and Gas Activities” (“NI 51-101”) effective 31 December 2010 (“Canadian method”). In prior years, Husky Energy applied for and was granted an exemption from certain of the provisions of NI 51-101, which permitted Husky Energy to present oil and gas reserves disclosures in accordance with the rules of the United States Securities and Exchange Commission guidelines and the United States Financial Accounting Standards Board (“SEC method”). The guidance was effective from 31 December 2010. Accordingly, the 2010 to 2013 figures are shown under the Canadian method, while 2009 is shown under the SEC method.
During 2013, Husky Energy focused on exploration and development projects on its extensive oil and liquids rich natural gas resource play portfolio in Western Canada and continued development of heavy oil thermal projects as well as major growth projects in the Asia Pacific, Oil Sands, and the Atlantic Region. At the Liwan Project in the South China Sea, where Husky Energy’s has 49% working interest, testing and commissioning is underway with first production planned in the first quarter of 2014. The Sunrise Energy Project is on track at approximately 85% complete at the end of 2013 with first production scheduled for late 2014. Key milestones were met for the White Rose Extension Program including approval of the benefits agreement, release of the environmental impact assessment for further regulatory approval and the submission of the Development Plan Amendment. The Sandall heavy oil thermal development project commenced production in the first quarter of 2014, while commissioning of the Rush Lake thermal development project is expected in mid-2015. During the third quarter of 2013, Husky Energy and its partner confirmed significant oil discoveries at the Bay du Nord, Harpoon and Mizzen in the Atlantic Region, of which Husky Energy holds a 35% working interest in all three discoveries.
Husky Energy will continue to maintain and enhance production in its Heavy Oil and Western Canada foundation as it repositions these areas toward thermal developments and resource plays, while advancing its three major growth pillars in the Asia Pacific Region, Oil Sands and in the Atlantic Region. Husky Energy’s Downstream assets will continue to provide specialised support to the Upstream operations to enhance efficiency and extract additional value from production.
Proved and Probable Reserves & Production
(mmboe) (2)
500
0
1,000
2,000
1,500
2,500
3,000
3,500
Proved Reserves (mmboe) Probable Reserves (mmboe)
2,9153,127301.5
312.0312.5
2,307 2,399
306.5
2,851287.1
50
0
100
200
150
250
300
350
(mboe/day)
20132009 2010 2011 2012
Production (mboe/day)
1,862
1,265
1,723
1,192
HWL 2013 Annual Results Operations Review
Page 42 of 72

Hutchison Whampoa Limited60
Operations Review
Telecommunications
3 UK has the country’s fastest growing network and covers 97% of the UK population.
HWL 2013 Annual Results Operations Review
Page 43 of 72

2013 Annual Report 61
Australia
IndonesiaSri Lanka
MacauVietnam
Italy
Ireland
Denmark
SwedenUnited Kingdom
Austria
Hong Kong
• 3GroupEurope'stotalrevenue,EBITDAandEBITincreased6%,38%and54%respectively.
• 3GroupEurope'sactivecustomerbasetotalsover22.1millionasat31December2013.
• HTHKHannouncedprofitattributabletoshareholdersofHK$916million,a25%decreaseoverlastyear.
• HAT’sEBITDAincreasedby94%andLBITimprovedby52%.
HWL 2013 Annual Results Operations Review
Page 44 of 72

Hutchison Whampoa Limited62
Operations Review – Telecommunications
1. Customers can purchase the newest mobile devices and experience an array of mobile telecommunications services at 3 Shops throughout Hong Kong.
2. HGC’s data centres are accredited with ISO 27001 information security management certification, offering a one-stop network solution and world-class data centre service.
1
2
HWL 2013 Annual Results Operations Review
Page 45 of 72

2013 Annual Report 63
4
3 3. 3 Italia continues to grow its customer base.
4. 3 Austria completes its acquisition of Orange Austria in January.
HWL 2013 Annual Results Operations Review
Page 46 of 72

Hutchison Whampoa Limited64
Operations Review – Telecommunications
The Group’s telecommunications division consists of the 3 Group businesses in Europe (“3 Group Europe”), a 65.01% interest in Hutchison Telecommunications Hong Kong Holdings (“HTHKH”), which is listed on the SEHK,
Hutchison Asia Telecommunications (“HAT”), and an 87.87% interest in the Australian Securities Exchange listed HTAL. 3 Group Europe is a pioneer of high-speed mobile telecommunications and mobile broadband technologies with businesses in six countries across Europe. HTHKH holds the Group’s interests in mobile operations in Hong Kong and Macau, as well as fixed-line operations in Hong Kong. HAT holds the Group’s interests in the mobile operations in Indonesia, Vietnam and Sri Lanka. HTAL owns a 50% share in VHA.
Group Performance
3 Group Europe
2013 2012 HK$ millions HK$ millions Change
Total Revenue 61,976 58,708 +6%- Net customer service revenue 45,536 41,962 +9%- Handset revenue 15,062 14,750 +2%- Other revenue 1,378 1,996 -31%
Net Customer Service Margin (1) 35,633 29,436 +21%Net customer service margin % 78% 70%
Other Margin 1,015 1,851 -45%
Total CACs (21,675) (22,427) +3%Less: Handset revenue 15,062 14,750 +2%
Total CACs (net of handset revenue) (6,613) (7,677) +14%
Operating Expenses (17,364) (14,397) -21%Opex as a % of net customer service margin 49% 49%
EBITDA (1) 12,671 9,213 +38%EBITDA Margin % (2) 27% 21%
Depreciation & Amortisation (7,815) (6,515) -20%
One-time Item (1) - 447 -100%
EBIT (1) 4,856 3,145 +54%
Capex (excluding licence) (10,176) (11,346) +10%
EBITDA less Capex 2,495 (2,133) +217%
Licence (6,824) (2,253) -203%
Note 1: Net customer service margin represents net customer service revenue deducting direct variable costs (including interconnection charges and roaming costs). EBITDA represents the operational results excluding one-time items and is stated after all customer acquisition costs and retention costs. There are no one-time items included in EBIT in 2013 while a one-time item of HK$447 million in 2012 represents the net gain from a network sharing arrangement in Ireland.
Note 2: EBITDA margin % represents EBITDA as a percentage of total revenue (excluding handset revenue).
In local currencies, growth in total revenue, net customer service margin, EBITDA and EBIT for the year were 4%, 19%, 35% and 52% respectively. 3 Group Europe contributed 15%, 13% and 8% respectively to the total revenue, EBITDA and EBIT of the Group’s businesses.
3 Group Europe’s registered customer base grew 13% during the year to total over 26.6 million at 31 December 2013, while the active base grew 19% to total over 22.1 million and represented an 83% activity level. The proportion of active contract customers in the 3 Group Europe contract customer base was 98% compared to 97% in 2012. The revenue generated by contract customers accounted for approximately 87% of overall net customer service revenue, 1%-point higher than last year. The proportion of contract customers as a percentage of the registered customer base has increased from 56% last year to 59% at the end of 2013. Management continues to focus on managing churn and the average monthly customer churn rate of the contract customer remained stable at 1.7%.
HWL 2013 Annual Results Operations Review
Page 47 of 72

2013 Annual Report 65
3 Group Europe’s net ARPU, which excludes the monthly contribution for a handset / device in postpaid contract bundled plans, on a 12-month trailing average active customer basis, decreased by 14% to €17.45 compared to 2012, primarily due to further regulated interconnection rate reductions in various countries that 3 Group Europe operates in. Net AMPU decreased by 4% to €13.65 as the lower interconnection revenue was partly offset by corresponding lower interconnection charges on outgoing calls. Despite the decrease in net ARPU and net AMPU, net customer service revenue and net customer service margin increased by 9% and 21% respectively mainly due to the increase in active customers.
3 Group Europe continued to capture market share in the smartphone and mobile data segments. The majority of the 3 Group Europe operations continued to hold a leading position in their respective country’s smartphone and mobile broadband access segments during the year. Following the licence auctions in the UK, Austria and Ireland during 2013, 3 Group Europe has completed spectrum acquisitions to support 4G (LTE) rollouts, which will continue in all of its major markets in 2014, to provide good customer usage experiences and competitively priced services. Cumulative total expenditure across 3 Group Europe on 4G(LTE) spectrum licences totals approximately €1.1 billion. Public recognition for network excellence continued in 2013 with 3 UK winning awards from uSwitch for Mobile Broadband, Roaming and Customer Support categories and also winning the best value awards (for Pay Month and SIM only categories), as well as leading consistently on YouGov’s iPhone, Dongle and Tablet Trackers and 3 Austria winning best network in German speaking countries for the smartphone category.
At 31 December 2013, approximately 6.6 million customers, representing 25% of the total 3 Group Europe customer base, are mobile broadband access customers, an increase of 8% from last year. Contract smartphone customers acquired in 2013 represented around 51% of the total contract customers acquired during the year. Total data usage exceeded 384 petabytes in 2013, an increase of 56% compared to last year. Data usage per active customer was approximately 18.2 gigabytes in 2013 compared to 14.0 gigabytes in 2012.
Total CACs, net of handset revenue in postpaid contract bundled plans, totalled HK$6,613 million in 2013, 14% lower than in 2012. Operating expenses increased 21% to HK$17,364 million, in line with the growth in net customer service margin.
EBITDA and EBIT growth reflected the increased net customer service margin driven by the enlarged customer base and lower CACs, partly offset by higher operating expenses and higher depreciation and amortisation from an increased asset base.
3 Group Europe achieved an important milestone of an overall positive EBITDA less capex in the year. This achievement reflects the successful strategy of 3 Group Europe to focus on improving service margins in market segments that demonstrate high growth potential, the success in transiting the operations to a non-subsidised handset model, which was completed in 2013, and the establishment of an industry leading cost structure.
HK$ millions
3 Group Europe - EBITDA & EBIT
EBITDA (LBITDA) EBIT (LBIT)
20132009 2010 2011 2012
5,438
1,815
(788)
(8,304)
9,213
3,145
8,031
1,567
12,671
4,856
-5,000
-10,000
0
10,000
5,000
15,000
Customers (’000)
20,000
15,000
10,000
5,000
0
20132009 2010 2011 2012
3 Group Europe’s Active Customers (at 31 December)
3 Group Europe Customer Data Usage
25,000
Petabytes (per year)
400
300
200
100
0
500
3 Group Europe’s ActiveCustomers and Data Usage
14,73613,539
18,542
16,358
247.31
22,142
384.70
52.48
94.94
154.85
HWL 2013 Annual Results Operations Review
Page 48 of 72

Hutchison Whampoa Limited66
Operations Review – Telecommunications
Key Business Indicators
Registered Customer Base
Registered Customer Growth (%) Registered Customers at from 31 December 2012 to 31 December 2013 (‘000) 31 December 2013
Prepaid Postpaid Total Prepaid Postpaid Total
United Kingdom 3,957 5,885 9,842 +4% +12% +9%
Italy 5,017 4,672 9,689 -3% +7% +2%
Sweden 160 1,530 1,690 -5% +11% +9%
Denmark 301 725 1,026 +39% +14% +20%
Austria (3) 931 2,497 3,428 +68% +116% +100%
Ireland 610 351 961 +36% -5% +17%
3 Group Europe Total 10,976 15,660 26,636 +6% +19% +13%
Active (4) Customer Base
Active Customer Growth (%) Active Customers at from 31 December 2012 to 31 December 2013 (’000) 31 December 2013
Prepaid Postpaid Total Prepaid Postpaid Total
United Kingdom 2,218 5,718 7,936 -2% +12% +8%
Italy 3,672 4,525 8,197 +27% +9% +16%
Sweden 92 1,530 1,622 +1% +11% +10%
Denmark 280 725 1,005 +35% +14% +19%
Austria (5) 358 2,476 2,834 +94% +116% +113%
Ireland 237 311 548 +39% +2% +15%
3 Group Europe Total 6,857 15,285 22,142 +18% +20% +19%
2013 2012
Contract customers as a % of the total registered customer base 59% 56%
Contract customers’ contribution to the net customer service revenue base (%) 87% 86%
Average monthly churn rate of the total contract registered customer base (%) 1.7% 1.7%
Active contract customers as a % of the total contract registered customer base 98% 97%
Active customers as a % of the total registered customer base 83% 79%
Note 3: Includes 1.5 million of registered customers added upon the acquisition of Orange Austria in January 2013.
Note 4: An active customer is one that generated revenue from an outgoing call, incoming call or data/content service in the preceding three months.
Note 5: Includes 1.45 million of active customers added upon the acquisition of Orange Austria in January 2013.
HWL 2013 Annual Results Operations Review
Page 49 of 72

2013 Annual Report 67
12-month Trailing Average Revenue per Active User (“ARPU”) (6)
to 31 December 2013
% Variance Blended compared to Prepaid Postpaid Total 31 December 2012
United Kingdom £5.96 £26.73 £20.74 -2%
Italy €6.69 €20.83 €14.71 -20%
Sweden SEK108.32 SEK306.92 SEK295.43 -1%
Denmark DKK138.08 DKK184.92 DKK172.52 -20%
Austria €7.17 €22.79 €20.60 -9%
Ireland €15.30 €37.98 €28.93 -10%
3 Group Europe Average €7.63 €27.07 €21.13 -12%
12-month Trailing Net Average Revenue per Active User (“Net ARPU”) (7)
to 31 December 2013
% Variance Blended compared to Prepaid Postpaid Total 31 December 2012
United Kingdom £5.96 £18.84 £15.13 -8%
Italy €6.69 €20.83 €14.71 -20%
Sweden SEK108.32 SEK218.63 SEK212.24 -10%
Denmark DKK138.08 DKK168.18 DKK160.21 -15%
Austria €7.17 €19.24 €17.55 +3%
Ireland €15.30 €30.05 €24.17 -11%
3 Group Europe Average €7.63 €21.77 €17.45 -14%
12-month Trailing Net Average Margin per Active User (“Net AMPU”) (8)
to 31 December 2013
% Variance Blended compared to Prepaid Postpaid Total 31 December 2012
United Kingdom £5.14 £14.84 £12.05 +1%
Italy €5.19 €15.31 €10.93 -8%
Sweden SEK76.05 SEK180.75 SEK174.69 -6%
Denmark DKK116.84 DKK145.52 DKK137.93 -6%
Austria €5.98 €14.75 €13.52 +21%
Ireland €10.77 €24.28 €18.89 +5%
3 Group Europe Average €6.15 €16.95 €13.65 -4%
Note 6: ARPU equals total monthly revenue, including incoming mobile termination revenue and contributions for a handset/device in postpaid contract bundled plans, divided by the average number of active customers during the year.
Note 7: Net ARPU equals total monthly revenue, including incoming mobile termination revenue but excluding contributions for a handset/device in postpaid contract bundled plans, divided by the average number of active customers during the year.
Note 8: Net AMPU equals total monthly revenue, including incoming mobile termination revenue but excluding contributions for a handset/device in postpaid contract bundled plans, less direct variable costs (including interconnection charges and roaming costs) (i.e. net customer service margin), divided by the average number of active customers during the year.
HWL 2013 Annual Results Operations Review
Page 50 of 72

Hutchison Whampoa Limited68
Operations Review – Telecommunications
United Kingdom
2013 2012 GBP millions GBP millions Change
Total Revenue 2,044 1,948 +5%- Net customer service revenue 1,376 1,347 +2%- Handset revenue 645 586 +10%- Other revenue 23 15 +53%
Net Customer Service Margin 1,095 977 +12%Net customer service margin % 80% 73%
Other Margin 15 11 +36%
Total CACs (917) (884) -4%Less: Handset revenue 645 586 +10%
Total CACs (net of handset revenue) (272) (298) +9%
Operating Expenses (421) (409) -3%Opex as a % of net customer service margin 38% 42%
EBITDA 417 281 +48%EBITDA Margin % 30% 21%
Depreciation & Amortisation (210) (180) -17%
EBIT 207 101 +105%
Capex (excluding licence) (271) (250) -8%
EBITDA less Capex 146 31 +371%
Licence (238) – NA
2013 2012
Total registered customer base (millions) 9.8 9.1
Total active customer base (millions) 7.9 7.4
Contract customers as a % of the total registered customer base 60% 58%
Contract customers’ contribution to the net customer service revenue base (%) 89% 87%
Average monthly churn rate of the total contract registered customer base (%) 1.6% 1.5%
Active contract customers as a % of the total contract registered customer base 97% 97%
Active customers as a % of the total registered customer base 81% 81%
EBITDA of £417 million was 48% higher than 2012 mainly driven by improved net customer service margin, due to net AMPU being 1% higher than 2012 and an enlarged customer base, and lower total CACs (net of handset revenue). These improvements were partly offset by higher depreciation and amortisation due to an increased number of sites, resulting in an EBIT of £207 million, an increase of 105% over last year.
3 UK successfully acquired one block of 5 MHz of 800 MHz paired spectrum in the auction held in the UK in early 2013 at a cost of £225 million to build an LTE network. Additional incidental spectrum licence costs of £13 million were incurred in the year. 3 UK launched its 4G (LTE) services in December 2013.
HWL 2013 Annual Results Operations Review
Page 51 of 72

2013 Annual Report 69
Italy
2013 2012 EUR millions EUR millions Change
Total Revenue 1,746 1,965 -11%- Net customer service revenue 1,352 1,457 -7%- Handset revenue 341 406 -16%- Other revenue 53 102 -48%
Net Customer Service Margin 1,004 939 +7%Net customer service margin % 74% 64%
Other Margin 49 112 -56%Total CACs (519) (678) +23%Less: Handset revenue 341 406 -16%
Total CACs (net of handset revenue) (178) (272) +35%
Operating Expenses (596) (515) -16%Opex as a % of net customer service margin 59% 55%
EBITDA 279 264 +6%EBITDA Margin % 20% 17%
Depreciation & Amortisation (279) (263) -6%
EBIT 0.3 0.5 -40%
Capex (excluding licence) (344) (562) +39%
EBITDA less Capex (65) (298) +78%
Licence (21) (169) +88%
2013 2012
Total registered customer base (millions) 9.7 9.5
Total active customer base (millions) 8.2 7.0
Contract customers as a % of the total registered customer base 48% 46%
Contract customers’ contribution to the net customer service revenue base (%) 80% 82%
Average monthly churn rate of the total contract registered customer base (%) 2.3% 2.3%
Active contract customers as a % of the total contract registered customer base 97% 95%
Active customers as a % of the total registered customer base 85% 74%
EBITDA of €279 million increased 6% from 2012 despite the very competitive environment in the Italian market in 2013. The higher EBITDA was driven by a 7% increase in net customer service margin mainly due to the increase in active customer base of 16% partly offset by reduction in net AMPU of 8%, as well as total CACs (net of handset revenue) being lower due to lower commissions and the lower proportion of contract customers acquired. These favourable variances are partly offset by an increase in operating expenses due to higher network cost resulted from the rollout of additional sites. EBIT of €0.3 million was in line with 2012 as a result of higher depreciation and amortisation offsetting the EBITDA growth.
HWL 2013 Annual Results Operations Review
Page 52 of 72

Hutchison Whampoa Limited70
Operations Review – Telecommunications
Sweden
2013 2012 SEK millions SEK millions Change
Total Revenue 5,717 5,981 -4%- Net customer service revenue 3,956 3,941 +0%- Handset revenue 1,568 1,663 -6%- Other revenue 193 377 -49%
Net Customer Service Margin 3,259 3,130 +4%Net customer service margin % 82% 79%
Other Margin 78 287 -73%Total CACs (2,096) (2,207) +5%Less: Handset revenue 1,568 1,663 -6%
Total CACs (net of handset revenue) (528) (544) +3%
Operating Expenses (1,317) (1,225) -8%Opex as a % of net customer service margin 40% 39%
EBITDA 1,492 1,648 -9%EBITDA Margin % 36% 38%
Depreciation & Amortisation (685) (583) -17%
EBIT 807 1,065 -24%
Capex (856) (1,103) +22%
EBITDA less Capex 636 545 +17%
2013 2012
Total registered customer base (millions) 1.7 1.6
Total active customer base (millions) 1.6 1.5
Contract customers as a % of the total registered customer base 91% 89%
Contract customers’ contribution to the net customer service revenue base (%) 97% 97%
Average monthly churn rate of the total contract registered customer base (%) 1.4% 1.4%
Active contract customers as a % of the total contract registered customer base 100% 100%
Active customers as a % of the total registered customer base 96% 95%
In Sweden, where the Group has a 60% interest, EBITDA and EBIT of SEK1,492 million and SEK807 million decreased 9% and 24% respectively from 2012, due to lower other margin and higher operating expenses. This was partly offset by an improved net customer service margin, driven by a 10% enlarged active customer base, partly offset by a 6% lower net AMPU as the transition of its customer base to a non-subsidised handset model was only completed at the end of 2013. This is not expected to impact further in 2014 due to the completion of the transition. Excluding the impact of the transition, net customer service margin increased by 12% in 2013. The lower EBIT also reflected higher depreciation and amortisation due to the full year impact of the 4G (LTE) network rollout.
HWL 2013 Annual Results Operations Review
Page 53 of 72

2013 Annual Report 71
Denmark
2013 2012 DKK millions DKK millions Change
Total Revenue 1,998 2,098 -5%- Net customer service revenue 1,772 1,837 -4%- Handset revenue 153 190 -19%- Other revenue 73 71 +3%
Net Customer Service Margin 1,526 1,424 +7%Net customer service margin % 86% 78%
Other Margin 44 50 -12%Total CACs (385) (412) +7%Less: Handset revenue 153 190 -19%
Total CACs (net of handset revenue) (232) (222) -5%
Operating Expenses (626) (589) -6%Opex as a % of net customer service margin 41% 41%
EBITDA 712 663 +7%EBITDA Margin % 39% 35%
Depreciation & Amortisation (292) (265) -10%
EBIT 420 398 +6%
Capex (252) (349) +28%
EBITDA less Capex 460 314 +46%
2013 2012
Total registered customer base (millions) 1.0 0.9
Total active customer base (millions) 1.0 0.8
Contract customers as a % of the total registered customer base 71% 75%
Contract customers’ contribution to the net customer service revenue base (%) 77% 84%
Average monthly churn rate of the total contract registered customer base (%) 2.4% 3.4%
Active contract customers as a % of the total contract registered customer base 100% 100%
Active customers as a % of the total registered customer base 98% 99%
In Denmark, where the Group has a 60% interest, EBITDA of DKK712 million was an increase of 7% over 2012, mainly due to a 7% improvement on net customer service margin. This was due to a 19% increase in the active customer base, partly offset by a 6% lower net AMPU due to keen market competition and reduction in the interconnection rates. This improvement was partly offset by higher depreciation and amortisation due to an increased number of sites, resulting in an EBIT of DKK420 million, a 6% increase over last year.
HWL 2013 Annual Results Operations Review
Page 54 of 72

Hutchison Whampoa Limited72
Operations Review – Telecommunications
Austria
2013 2012 EUR millions EUR millions Change
Total Revenue 745 361 +106%- Net customer service revenue 596 242 +146%- Handset revenue 129 100 +29%- Other revenue 20 19 +5%
Net Customer Service Margin 459 159 +189%Net customer service margin % 77% 66%
Other Margin 18 13 +38%Total CACs (162) (114) -42%Less: Handset revenue 129 100 +29%
Total CACs (net of handset revenue) (33) (14) -136%
Operating Expenses (262) (108) -143%Opex as a % of net customer service margin 57% 68%
EBITDA 182 50 +264%EBITDA Margin % 30% 19%
Depreciation & Amortisation (76) (34) -124%
EBIT 106 16 +563%
Capex (excluding licence) (117) (26) -350%
EBITDA less Capex 65 24 +171%
Licence (331) – NA
2013 2012
Total registered customer base (millions) 3.4 1.7
Total active customer base (millions) 2.8 1.3
Contract customers as a % of the total registered customer base 73% 68%
Contract customers’ contribution to the net customer service revenue base (%) 94% 93%
Average monthly churn rate of the total contract registered customer base (%) 0.7% 0.2%
Active contract customers as a % of the total contract registered customer base 99% 99%
Active customers as a % of the total registered customer base 83% 78%
EBITDA and EBIT of €182 million and €106 million increased 264% and 563% respectively from 2012 mainly due to the incremental revenue following the completion of Orange Austria acquisition in January 2013, partly offset by a corresponding increase in the cost base. The realisation of operational synergies and efficiencies from the acquisition is progressing well and within expectations.
3 Austria successfully acquired one block of 5 MHz of 900 MHz paired spectrum and four blocks of 5 MHz of 1800 MHz paired spectrum in the auction held in Austria in 2013 at a cost of €331 million to enhance its 3G and 4G (LTE) network.
HWL 2013 Annual Results Operations Review
Page 55 of 72

2013 Annual Report 73
Ireland
2013 2012 EUR millions EUR millions Change
Total Revenue 180 174 +3%- Net customer service revenue 149 141 +6%- Handset revenue 30 30 -- Other revenue 1 3 -67%
Net Customer Service Margin 116 93 +25%Net customer service margin % 78% 66%
Other Margin - 1 -100%Total CACs (48) (51) +6%Less: Handset revenue 30 30 -
Total CACs (net of handset revenue) (18) (21) +14%Operating Expenses (90) (92) +2%
Opex as a % of net customer service margin 78% 99%
EBITDA (LBITDA) 8 (19) +142%EBITDA (LBITDA) Margin % 5% -13%
Depreciation & Amortisation (37) (26) -42%
One-time Item - 45 -100%
LBIT (29) – NA
Capex (excluding licence) (47) (39) -21%
EBITDA (LBITDA) less Capex (39) (58) +33%
Licence (25) (51) +51%
2013 2012
Total registered customer base 961,000 819,000
Total active customer base 548,000 477,000
Contract customers as a % of the total registered customer base 37% 45%
Contract customers’ contribution to the net customer service revenue base (%) 75% 79%
Average monthly churn rate of the total contract registered customer base (%) 1.2% 1.2%
Active contract customers as a % of the total contract registered customer base 89% 82%
Active customers as a % of the total registered customer base 57% 58%
EBITDA of €8 million represents a turnaround of 142% from the LBITDA of €19 million in 2012, mainly due to the improved net customer service margin arising from a 15% increase in its active customer base, 5% higher net AMPU and lower total CACs (net of handset revenue). However, LBIT of €29 million was adverse to the breakeven EBIT position in 2012, mainly due to a one-time net gain of €45 million from a network sharing arrangement recognised last year, together with higher depreciation and amortisation in 2013 as the network rollout continued during the year.
HWL 2013 Annual Results Operations Review
Page 56 of 72

Hutchison Whampoa Limited74
Operations Review – Telecommunications
Hutchison Telecommunications Hong Kong Holdings
2013 2012 (1) HK$ millions HK$ millions Change
Total Revenue 12,777 15,536 -18%
EBITDA 2,758 3,050 -10%
EBIT 1,367 1,744 -22%
Total active customer base (‘000) 3,771 3,776 -0%
Note 1: 2012 EBITDA and EBIT have been restated to reflect the effect of the adoption of amendments to HKAS19 in 2013.
HTHKH announced its 2013 turnover of HK$12,777 million and profit attributable to shareholders of HK$916 million, an 18% and a 25% decrease respectively over last year. EBITDA of HK$2,758 million and EBIT of HK$1,367 million decreased 10% and 22% respectively against 2012. HTHKH contributed 3% to both total revenue and EBITDA, and 2% to the EBIT of the Group’s businesses.
The mobile operations in Hong Kong and Macau reported a 24% decrease in combined turnover to HK$9,359 million in 2013, while EBITDA and EBIT decreased by 24% and 33% respectively. The adverse performances in 2013 were attributed to the intensified market competition, lower demand for new handset models and the impact of the transition to a non-subsidised handset model which was only completed in the first half of 2013. The combined mobile customer base, on an active basis, was approximately 3.8 million as at 31 December 2013, similar to last year.
The fixed-line telecommunications business in Hong Kong continues to achieve steady growth with increasing data traffic across all market segments in Hong Kong, reporting a 7% increase in turnover to HK$3,880 million in 2013 compared to HK$3,640 million in 2012, while EBITDA and EBIT improved by 19% and 32% respectively mainly due to additional demand for data transmission in the corporate and business markets.
Hutchison Asia Telecommunications
2013 2012 HK$ millions HK$ millions Change
Total Revenue 6,295 4,452 +41%
EBITDA 819 423 +94%
LBIT (409) (846) +52%
Total active customer base (‘000) 43,497 35,391 +23%
HAT consists of the Group’s mobile operations in Indonesia, Vietnam and Sri Lanka. HAT contributed 2%, 1% and negative 1% respectively to the total revenue, EBITDA and EBIT of the Group’s businesses. Total revenue increased 41% over last year mainly due to the expanded networks and enhanced service offerings across its operations, particularly in Indonesia. EBITDA and LBIT in 2013 include HK$717 million of compensation contributions (2012: HK$1,590 million). At 31 December 2013, HAT had an active mobile customer base of approximately 43.5 million.
In Indonesia, the business continues to grow following the completion of the network rollout in the third quarter of 2013. At 31 December 2013, the expanded network in Indonesia extends 3G coverage to 150 cities, covering 86% of the population (2012: 93 cities with 70% population coverage). The active customer base at the end of 2013 increased 40% from last year to over 32.0 million customers. Underlying LBITDA and LBIT improved by 79% and 47% respectively, reflecting a higher contribution from the increased customer base, partly offset by adverse foreign exchange impact as the Indonesian Rupiah depreciated significantly against the Hong Kong Dollar in 2013. The operation achieved positive EBITDA operationally since July 2013.
HWL 2013 Annual Results Operations Review
Page 57 of 72

2013 Annual Report 75
In Vietnam, the active customer base decreased by 12% over last year due to regulatory changes in the acquisition of customers. Despite this, underlying EBITDA increased 247% from 2012 and achieved positive EBIT in the year with a 354% turnaround from a corresponding LBIT last year as a result of the successful retention of higher quality customers and disciplined cost control. The division’s strategy is to manage the business to return and reduce investment cost and to convert from a business co-operation venture to a joint stock company when conditions are conducive.
In Sri Lanka, the active customer base increased by 22% compared to last year and the underlying LBITDA and LBIT improved by 8% and 4% respectively.
HTAL, share of VHA
2013 2012 AUD millions AUD millions Change
Announced Total Revenue 1,776 2,049 -13%
Announced Loss Attributable to Shareholders (230) (394) +42%
HTAL announced total revenue from its share of 50% owned associated company, VHA, of A$1,776 million, a 13% decrease over last year, and a loss attributable to shareholders of A$230 million, an improvement of 42%. VHA’s active customer base declined 19% from 31 December 2012 to total over 5.3 million (including MVNOs) at 31 December 2013 as brand perception recovered more slowly than expected. However, the decline in customer numbers, excluding the Crazy John’s and 3 brands, stabilised in the third quarter of 2013 and showed a net gain in the fourth quarter.
In 2013, VHA’s network improved significantly in its voice and data performance, resiliency and coverage. It has significantly expanded regional coverage with 1,200 new sites and its average 3G data speed has doubled. It has also launched the 4G network in five metropolitan capital cities with speeds comparable to or faster than other networks.
The strategic initiatives that commenced in late 2012 and which included the accelerated investment and upgrade of the network and certain cost rationalisation initiatives, have led to an improvement in VHA’s performance, both operationally and financially.
HWL 2013 Annual Results Operations Review
Page 58 of 72

Hutchison Whampoa Limited78
Finance &Investmentsand Others
Operations Review
GAMECO announces the inauguration of the new Phase II Hangar.
HWL 2013 Annual Results Operations Review
Page 59 of 72

2013 Annual Report 79
Taiwan
Luxembourg
United Kingdom
Czech Republic
Poland
Mainland China
Singapore
Hong Kong
Japan
South Korea
Israel
Spain
Austria Slovakia
Portugal
Morocco
France
Switzerland Italy
Hungary
Romania
• LiquidassetsamountedtoHK$102,787millionasat31December2013.
• Netdebttonettotalcapitalratioreducedto20.0%.
HWL 2013 Annual Results Operations Review
Page 60 of 72

Hutchison Whampoa Limited80
Operations Review – Finance & Investments and Others
The finance & investments and others segment includes returns earned on the Group’s holdings of cash and liquid investments, Hutchison Whampoa (China) Limited (“HWCL”), listed subsidiary Hutchison Harbour Ring
Limited (“HHR”), listed associate TOM Group (“TOM”), Hutchison Water, and the Marionnaud business.
2013 2012 (1)
HK$ millions HK$ millions Change
Total Revenue 22,414 21,700 +3%- Finance & Investments 2,321 2,388 -3%- Others 20,093 19,312 +4%
EBITDA 2,179 2,479 -12%- Finance & Investments 2,808 3,004 -7%- Others (629) (525) -20%
EBIT 1,259 1,914 -34%- Finance & Investments 2,808 3,004 -7%- Others (1,549) (1,090) -42%
Note 1: 2012 results included Marionnaud results in the comparatives as the business is now reported under this segment. 2012 EBITDA and EBIT have been restated to reflect the effect of the adoption of amendments to HKAS19 in 2013.
This segment contributed 6%, 2% and 2% respectively to the total revenue, EBITDA and EBIT of the Group’s businesses.
Finance and Investments
Finance and investments mainly represents returns earned on the Group’s holdings of cash and liquid investments, which totalled HK$102,787 million at 31 December 2013 compared to HK$131,447 million at the end of last year. Further information on the Group’s treasury function can be found in the “Group Capital Resources and Liquidity” section of the annual report.
HWL 2013 Annual Results Operations Review
Page 61 of 72

2013 Annual Report 81
Other Operations
The Group’s share of the results of HWCL, listed subsidiary HHR, listed associate TOM, Hutchison Water and the Marionnaud business are reported under this segment.
Hutchison Whampoa (China) Limited
HWCL operates various manufacturing, service and distribution joint ventures in the Mainland and Hong Kong, and also has an investment in Hutchison China MediTech Limited (“Chi-Med”), currently a 70.4% owned subsidiary listed on the Alternative Investment Market of the London Stock Exchange in the UK. Chi-Med focuses on researching, developing, manufacturing and selling pharmaceuticals and health oriented consumer products.
Hutchison Harbour Ring Limited
HHR, a 71.4% owned subsidiary, is listed on SEHK and holds certain investment properties in the Mainland. HHR announced revenue of HK$88 million, a 1% increase compared to last year. Profit attributable to shareholders of HHR decreased 4% to HK$175 million.
TOM Group
TOM, a 24.5% associate, is listed on SEHK and its businesses include mobile Internet, e-commerce, publishing, outdoor media as well as television and entertainment. TOM announced revenue of HK$1,928 million, a 13% decrease from last year. Loss attributable to shareholders increased from HK$337 million in 2012 to HK$550 million in 2013, which included an impairment charge of HK$1,590 million relating primarily to its wireless value-added services businesses in the Mainland, as well as a gain of HK$1,369 million arising from the loss of control in subsidiaries engaging in e-commerce business in the Mainland.
Hutchison Water
The Group has a 49% interest in a water desalination project in Israel which was granted a 26.5-year concession by the Israeli government to build and operate a water desalination plant in Sorek, Israel. The plant has commenced commercial operation in 2014 following the completion of the construction at the end of 2013 and is one of the largest in the world in terms of capacity.
Marionnaud
Marionnaud currently operates over 1,000 stores in 12 European markets, providing luxury perfumery and cosmetic products. The Marionnaud business continued to be affected by the difficult economic situation, intense competition as well as weak consumer spending on luxury products in several European countries, particulary in France, Spain and certain Central European countries where revenue and margins continued to be depressed.
Interest Expense, Finance Costs and Tax
The Group’s interest expense and finance costs for the year, including its share of associated companies’ and joint ventures’ interest expense, amortisation of finance costs and after deducting interest capitalised on assets under development, amounted to HK$14,159 million, a decrease of 13% when compared to 2012. Further information on these expenses can be found in the “Group Capital Resources and Liquidity” section of the annual report.
The Group recorded current and deferred tax charges totalling HK$11,742 million for the year, an increase of 36%, mainly due to higher current tax charges from profit generating operations and the impact on the lower recognition of deferred tax assets in the telecommunications operations during 2013.
HWL 2013 Annual Results Operations Review
Page 62 of 72

Hutchison Whampoa Limited82
Operations Review – Finance & Investments and Others
Summary
Economic conditions remained uncertain in 2013 and continue to affect certain markets in which the Group operates. Despite facing various challenges, the Group achieved a solid growth in recurring earnings in 2013, in line with expectations, while maintaining a healthy and conservative level of liquidity and further strengthening an already strong balance sheet.
The Group remains committed to its dual objectives of maintaining a healthy rate of growth in recurring earnings and a strong financial profile. This will be achieved through cautious and selective expansion, stringent capital expenditure and cost controls across all businesses, and maintaining a prudent financial profile, including a Group consolidated net debt to net total capital ratio not higher than 25% and strong liquidity. Barring adverse external developments in the sectors and geographies in which we operate, I have full confidence these objectives will be achieved in 2014.
Fok Kin Ning, CanningGroup Managing Director
Hong Kong, 28 February 2014
HWL 2013 Annual Results Operations Review
Page 63 of 72

Hutchison Whampoa Limited1
Additional Information
Ports and Related Services
The following tables summarise the major port operations for the four segments of the division.
HPH Trust
2013 PortsDivision’s ThroughputName Location effectiveInterest (100%basis)
(million TEUs)
Hongkong International Terminals/ 27.62%/ COSCO-HIT Terminals/ Hong Kong 13.81%/ 12.0 Asia Container Terminals 27.62%
Yantian International Container Terminals - Phase I and II/ 15.58%/ Phase III/ Mainland China 14.26%/ 10.8 West Port 14.26%/
Ancillary Services - Asia Port Services/ Hong Kong 27.62%/ 0.6 Hutchison Logistics (HK)/ and Mainland China 27.62%/ Shenzhen Hutchison Inland Container Depots 21.45%
Mainland China and Other Hong Kong
2013 PortsDivision’s ThroughputName Location Interest (100%basis)
(million TEUs)
Shanghai Container Terminals (“SCT”) (1)/ 40%/ Shanghai Mingdong Container Terminals/ Mainland China 50%/ 7.2 Shanghai Pudong International Container Terminals 30%
Ningbo Beilun International Container Terminals Mainland China 49% 1.8
River Trade Terminal Hong Kong 50% 1.5
Ports in Southern China - Zhuhai Internatinal Container Terminals (Jiuzhou) (2)/ 50%/ Nanhai International Container Terminals (2)/ 50%/ Jiangmen International Container Terminals (2)/ 50%/ Shantou International Container Terminals/ 70%/ Zhuhai International Container Terminals (Gaolan)/ Mainland China 50%/ 2.2 Huizhou Port Industrial Corporation/ 33.59%/ Huizhou International Container Terminals/ 80%/ Xiamen International Container Terminals/ 49%/ Xiamen Haicang International Container Terminals 49%
Note 1: SCT ceased its container handling business from January 2011 onwards.
Note 2: Although HPH Trust holds the economic interest in the three River Ports in Jiuzhou, Nanhai and Jiangmen in Southern China, the legal interests in these operations are retained by this division.
HWL 2013 Annual Results Operations Review
Page 64 of 72

2013 Annual Report 2
Europe 2013 PortsDivision’s ThroughputName Location Interest (100%basis)
(million TEUs)
Europe Container Terminals/ 93.5%/ Amsterdam Container Terminals The Netherlands 70.08% 9.7
Hutchison Ports (UK) – Port of Felixstowe/ 100%/ Harwich International Port/ United Kingdom 100%/ 4.0 London Thamesport 80%
Barcelona Europe South Terminal Spain 100% 0.9
Gdynia Container Terminal Poland 99.15% 0.3
Taranto Container Terminal Italy 50% 0.2
Container Terminal Frihamnen Sweden 100% -
Asia, Australia and Others 2013 PortsDivision’s ThroughputName Location Interest (100%basis)
(million TEUs)
Westports Malaysia Malaysia 23.55% 7.5
Panama Ports Company Panama 90% 3.8
Jakarta International Container Terminal / Terminal Petikemas Koja Indonesia 51% / 45.09% 3.3
Internacional de Contenedores Asociados de Veracruz/ Lazaro Cardenas Terminal Portuaria de Contenedores/ Lazaro Cardenas Multipurpose Terminal/ Mexico 100% 2.4 Ensenada International Terminal/ Terminal Internacional de Manzanillo
Hutchison Korea Terminals / Korea International Terminals South Korea 100% / 88.9% 2.3
Hutchison Laemchabang Terminal / Thai Laemchabang Terminal Thailand 80% / 87.5% 1.9
International Ports Services Saudi Arabia 51% 1.7
Freeport Container Port The Bahamas 51% 1.5
Karachi International Container Terminal / South Asia Pakistan Terminals Pakistan 100% / 90% 0.9
Alexandria International Container Terminals Egypt 50% 0.7
Tanzania International Container Terminal Services Tanzania 70% 0.4
Buenos Aires Container Terminal Argentina 100% 0.3
Oman International Container Terminal Oman 65% 0.2
Hutchison Ajman International Terminals United Arab Emirates 100% 0.1
Brisbane Container Terminals Australia 100% 0.1
Myanmar International Terminals Thilawa Myanmar 100% -
Sydney International Container Terminals Australia 100% -
Saigon International Terminals Vietnam Vietnam 70% -
HWL 2013 Annual Results Operations Review
Page 65 of 72

Hutchison Whampoa Limited3
Additional Information
Properties
Investment Properties
Hong Kong
MajorrentalpropertiesinHongKong
Economic TotalGrossName PropertyType NetInterest FloorAreaforRent Leased
(thousand sq ft)
Cheung Kong Center Office 100% 1,263 97%
Harbourfront Office Towers I and II Office 100% 863 99%
Hutchison House Office 100% 504 82%
China Building Office 100% 259 99%
Whampoa Garden Commercial 100% 1,714 96%
Aberdeen Centre Commercial 100% 345 99%
Hutchison Logistics Centre Industrial 100% 4,705 99%
The Mainland and Overseas
MajorrentalpropertiesintheMainland
Economic AttributableGrossName Location PropertyType NetInterest FloorAreaforRent Leased
(thousand sq ft)
Metropolitan Plaza Chongqing Office & Commercial 50% 756 96%
Westgate Mall & Tower Shanghai Office & Commercial 30% 330 96%
HWL 2013 Annual Results Operations Review
Page 66 of 72

2013 Annual Report 4
Development Properties
Hong Kong
Developmentcompletedduring2013
Economic AttributableGrossName Location PropertyType NetInterest FloorArea
(thousand sq ft)
28 Barker Road The Peak Residential 100% 29
The Mainland
Developmentscompletedduring2013
Economic AttributableGrossName Location PropertyType NetInterest FloorArea
(thousand sq ft)
Le Parc Phases 4A, 4B & 6B Chengdu High-Tech Zone, Residential 50% 2,386 Chengdu Commercial 152
The Metropolitan Tianjin Phases 1& 2 Yingkoudao, Heping District, Tianjin Commercial 40% 804
Noble Hills – Baoan District, Shenzhen Residential 50% 755 Commercial 34
Le Sommet Phases 4B & 4C Longgang District, Shenzhen Residential 50% 572 Commercial 70
Noble Hills Phase 3 Wangcheng County, Changsha Residential 50% 585
Regency Oasis Phase 1B Wenjiang District, Chengdu Residential 50% 534
Laguna Verona Phases D1b2, D1c Hwang Gang Lake, Residential 49.9% 490 & G1a Dongguan Commercial 24
Cape Coral Phase 3B Panyu District, Guangzhou Residential 50% 452
Cape Coral Phase 2B Nanan District, Chongqing Residential 47.5% 398
Regency Garden Phases 2A & 3 Pudong New District, Shanghai Residential 42.5% 394
The Harbourfront Land No. 2 Shibei District, Qingdao Residential 45% 272 Commercial 20
Regency Park Phase 3 Jingyue Economic Development Residential 50% 279 Zone, Changchun
Guangzhou Guoji Wanjucheng Phase 2A Huang Pu District, Guangzhou Commercial 30% 204
Yuhu Mingdi Phase 1 Luogang District, Guangzhou Residential 40% 165 Commercial 24
Noble Hills Phases 1A &1B Zengcheng, Guangzhou Residential 50% 134
Regency Park Phase 3A Tianning District, Changzhou Residential 50% 89
Regency Residence Phase 2B Nanguan District, Residential 50% 13 Changchun Commercial 27
HWL 2013 Annual Results Operations Review
Page 67 of 72

Hutchison Whampoa Limited5
Additional Information
The Mainland (continued)
DevelopmentsintheMainlandtobecompletedin2014
Economic AttributableGrossName Location PropertyType NetInterest FloorArea
(thousand sq ft)
Le Parc Phases 5A & 5B Chengdu High-Tech Zone, Chengdu Residential 50% 1,628
Regency Park Phase 3B Tianning District, Changzhou Residential 50% 919
The Harbourfront Land No. 3, Shibei District, Qingdao Residential 45% 497 4 and 8 Commercial 168
Regency Garden Phases 2B, 4 & 5A Pudong New District, Shanghai Residential 42.5% 624
Regency Cove Phase 1 Caidian District, Wuhan Residential 50% 481
Oriental Financial Center – Pudong New District, Shanghai Commercial 50% 431
Zhaomushan Land No. G19 Liangjiang New Area, Residential 50% 397 Chongqing
Yingtiandajie Phases 1B, 1C, 2A & 2B Jianye District, Nanjing Residential 50% 288 Commercial 105
Upper West Phases 1A & 1B Putuo District, Shanghai Commercial 30% 377
Laguna Verona Phases E1 & E2 Hwang Gang Lake, Dongguan Residential 49.9% 353
Hupan Mingdi Land No. 911 North Jiading District, Shanghai Residential 50% 325 Area 2, 4 and 5 Commercial 6
Guangzhou Guoji Wanjucheng Phases 2B & 2C (1) Huang Pu District, Commercial 30% 321 Guangzhou
Noble Hills Phase 2C Douxi, Chongqing Residential 50% 195
Zhao Xiang Town Land No. 16 Phase 1A Qing Pu District, Shanghai Residential 50% 189
Century Link – Pudong New District, Shanghai Commercial 25% 174
Zhao Xiang Town Land No. 17 Phase 1 Qing Pu District, Shanghai Residential 50% 170
Millennium Waterfront Phase 1A Jianghan District, Wuhan Commercial 50% 133
Noble Hills Phases 1A & 1B Zengcheng, Guangzhou Residential 50% 117 Commercial 8
Nanzhuang Town Phase 1A Changcheng District, Foshan Residential 50% 118
Regency Oasis Phase 1B Wenjiang District, Chengdu Residential 50% 83
Regency Residence Phase 1 Nanguan District, Changchun Commercial 50% 16
Overseas
Developmentcompletedduring2013
Economic AttributableGrossName Location PropertyType NetInterest FloorArea
(thousand sq ft)
Marina Bay Suites Phase 2 Singapore Residential 17% 78
Developmenttobecompletedin2014
Economic AttributableGrossName Location PropertyType NetInterest FloorArea
(thousand sq ft)
The Vision West Coast Crescent, Singapore Residential 50% 181HWL 2013 Annual Results
Operations Review Page 68 of 72

2013 Annual Report 6
Retail
Brand list by Market
Market Brand
Albania Rossmann
Belgium ICI PARIS XL, Kruidvat
Czech Republic Rossmann
Germany Rossmann
Hong Kong Watsons, Nuance-Watson, PARKnSHOP, Fortress, Watson’s Wine, Watsons Water, Mr Juicy
Hungary Rossmann
Indonesia Watsons
Ireland The Perfume Shop, Superdrug
Korea Watsons
Latvia Drogas
Lithuania Drogas
Luxembourg ICI PARIS XL
Macau Watsons, PARKnSHOP, Fortress
Mainland China Watsons, PARKnSHOP, Watson’s Wine, Watsons Water, Mr Juicy
Malaysia Watsons
Netherlands ICI PARIS XL, Kruidvat, Trekpleister
Philippines Watsons
Poland Rossmann
Russia Spektr
Singapore Watsons, Nuance-Watson
Taiwan Watsons
Thailand Watsons
Turkey Watsons, Rossmann
United Kingdom The Perfume Shop, Superdrug, Savers
Ukraine Watsons
HWL 2013 Annual Results Operations Review
Page 69 of 72

Hutchison Whampoa Limited7
Additional Information
Infrastructure
CKI Project Profile by Geographical Location ShareholdinginterestGeographicalLocation Company/Project TypeofBusiness withinHWLGroup
Australia SA Power Networks Electricity Distribution CKI: 23.07%; Power Assets: 27.93% Powercor Australia Limited Electricity Distribution CKI: 23.07%; Power Assets: 27.93% CitiPower I Pty Ltd. Electricity Distribution CKI: 23.07%; Power Assets: 27.93% Spark Infrastructure Group Infrastructure Investment CKI: 8.53% Envestra Limited Gas Distribution CKI: 17.46% Transmission Operations (Australia) Pty Ltd Electricity Transmission CKI: 50%; Power Assets: 50% AquaTower Pty Ltd (1) Water Services CKI: 49%
Canada Canadian Power Holdings Inc. Electricity Generation CKI: 50%; Power Assets: 50% (formerly known as Stanley Power Inc.)
Hong Kong Power Assets Holdings Limited (“Power Assets”) Electricity Generation, CKI: 38.87% Transmission and Distribution of electricity in HK Power and Utility-related businesses overseas Alliance Construction Materials Limited Infrastructure Materials CKI: 50% Green Island Cement Company, Limited Infrastructure Materials CKI: 100% Anderson Asphalt Limited Infrastructure Materials CKI: 100%
China Green Island Cement (Yunfu) Company Limited Infrastructure Materials CKI: 100% Guangdong Gitic Green Island Cement Co. Ltd. Infrastructure Materials CKI: 67% Shen-Shan Highway (Eastern Section) Toll Roads CKI: 33.5% Shantou Bay Bridge Toll Roads CKI: 30% Tangshan Tangle Road Toll Roads CKI: 51% Changsha Wujialing and Wuyilu Bridges Toll Roads CKI: 44.2% National Highway 107 (Zhumadian Sections) (2) Toll Roads CKI: 66% Jiangmen Chaolian Bridge Toll Roads CKI: 50% Jiangmen Jiangsha Highway Toll Roads CKI: 50% Panyu Beidou Bridge Toll Roads CKI: 40%
The Netherlands AVR-Afvalverwerking B.V. Waste Management CKI: 35%; Power Assets: 20%
New Zealand Wellington Electricity Lines Limited Electricity Distribution CKI: 50%; Power Assets: 50% Enviro Waste Services Limited Waste Management CKI: 100%
Philippines Siquijor Limestone Quarry Infrastructure Materials CKI: 40%
United Kingdom UK Power Networks Holdings Limited Electricity Distribution CKI: 40%; Power Assets: 40% Northumbrian Water Group Limited Water Supply, Sewerage and CKI: 40% Waste Water businesses Northern Gas Networks Limited Gas Distribution CKI: 47.06%; Power Assets: 41.29% Wales & West Utilities Limited Gas Distribution CKI: 30%; Power Assets: 30% Seabank Power Limited Electricity Generation CKI: 25%; Power Assets: 25% Southern Water Services Limited Water and Wastewater Services CKI: 4.75%
Note 1: CKI entered into a sale and purchase agreement in December 2013 to dispose of the project.
Note 2: CKI completed the sale of the project in December 2013.
HWL 2013 Annual Results Operations Review
Page 70 of 72

2013 Annual Report 8
Energy
Husky Energy’s conventional oil and natural gas assets, heavy oil production and upgrading and transportation infrastructure in Western Canada
provides a firm foundation to support three growth pillars: the Asia Pacific Region, the Oil Sands and the Atlantic Region. The table below summarised
the major projects and activities of the division.
Status/Production HuskyEnergy’sOperations Project timeline WorkingInterest
WESTERNCANADA - Oil Resource Plays Oungre Bakken, S.E. Saskatchewan In production 100% Lower Shaunavon, S.W. Saskatchewan In production Varies Viking, Alberta and S.W. Saskatchewan In production Varies N. Cardium, Wapiti, Alberta In production Varies Muskwa, Rainbow, Northern Alberta Under evaluation Varies Slater River Canol Shale, Northwest Territories Under evaluation Varies - Liquids-Rich Gas Resource Plays Ansell Multi-zone, Alberta In production Varies Duvernay, Kaybob, Alberta In production Varies - Heavy Oil Pikes Peak In production 100% Bolney/Celtic In production 100% Rush Lake Pilot In production 100% Paradise Hill In production 100% Pikes Peak South In production 100% Sandall heavy oil thermal project First half of 2014 100% Rush Lake thermal development Second half 2015 100% Vawn 2016 100% Edam East 2016 100%
GROWTHPILLARS - Atlantic Region Terra Nova In production 13% North Amethyst In production 68.875% South White Rose Extension Late 2014 68.875% West White Rose Under evaluation 68.875% Flemish Pass Basin Under evaluation 35% - Oil Sands Tucker, Alberta In production 100% McMullen, Northern Alberta 2014 100% Sunrise (Phase 1), Alberta Later 2014 50% Saleski, Alberta Under evaluation 100% Caribou, Alberta Under evaluation 100% - Asia Pacific Wenchang, South China Sea In production 40% Liwan 3-1, Block 29/26, South China Sea Early 2014 49% Liuhua 34-2, Block 29/26, South China Sea Late 2014 49% Liuhua 29-1, Block 29/26, South China Sea 2017 49% Madura Strait, BD, MDA & MBH, Indonesia 2016 40% Madura Strait, MAC, MAX, MBJ & MOK, Indonesia Under evaluation 40% Madura Strait, MBF, Indonesia Under evaluation 50% Offshore Taiwan Production Sharing Contract signed in 2012 75%
DOWNSTREAM Lima Refinery, Ohio, USA In production 100% Toledo Refinery, Ohio, USA In production 50% Lloydminster Upgrader, Saskatchewan In production 100% Lloydminster Asphalt Refinery, Saskatchewan In production 100% Prince George Refinery, British Columbia In production 100% Lloydminster Ethanol Plant, Saskatchewan In production 100% Minnedosa Ethanol Plant, Manitoba In production 100% Cold Lake Pipeline System, Alberta In operation 100% Mainline Pipeline System, Alberta In operation 100% Hardisty Terminal In operation 100% Rainbow Lake Gas Processing Plant In operation 50%
HWL 2013 Annual Results Operations Review
Page 71 of 72

Hutchison Whampoa Limited9
Additional Information
Telecommunications
Summary of licence investments
Operation Licence SpectrumLot Blocks Paired/Unpaired AvailableSpectrum
UK 800 MHz 5 MHz 1 Paired 10 MHz 1800 MHz 5 MHz 2 Paired 20 MHz 1800 MHz (from 2015) 5 MHz 1 Paired 10 MHz 2100 MHz 5 MHz 3 Paired 30 MHz 2100 MHz 5 MHz 1 Unpaired 5 MHz
Italy 900 MHz 5 MHz 1 Paired 10 MHz 1800 MHz 5 MHz 3 Paired 30 MHz 2100 MHz 5 MHz 3 Paired 30 MHz 2100 MHz 5 MHz 1 Unpaired 5 MHz 2600 MHz 5 MHz 2 Paired 20 MHz 2600T MHz 15 MHz 2 Unpaired 30 MHz
Austria 900 MHz (to 2015) 0.8 MHz 1 Paired 1.6 MHz 900 MHz (from 2016) 5 MHz 1 Paired 10 MHz 1800 MHz (to 2017) 200 KHz 145 Paired 58 MHz 1800 MHz (from 2014 to 2017) 3.5 MHz 1 Paired 7 MHz 1800 MHz (from 2016 to 2017) 3 MHz 1 Paired 6 MHz 1800 MHz (from 2018) 5 MHz 4 Paired 40 MHz 2100 MHz 5 MHz 5 Paired 50 MHz 2100T MHz 5 MHz 1 Unpaired 5 MHz 2600 MHz 5 MHz 5 Paired 50 MHz 2600T MHz 25 MHz 1 Unpaired 25 MHz
Sweden 800 MHz 10 MHz 1 Paired 20 MHz 900 MHz 5 MHz 1 Paired 10 MHz 2100 MHz 20 MHz 1 Paired 40 MHz 2100 MHz 5 MHz 1 Unpaired 5 MHz 2600 MHz 10 MHz 1 Paired 20 MHz 2600 MHz 50 MHz 1 Unpaired 50 MHz
Denmark 900 MHz 5 MHz 1 Paired 10 MHz 1800 MHz 10 MHz 1 Paired 20 MHz 2100 MHz 15 MHz 1 Paired 30 MHz 2100 MHz 5 MHz 1 Unpaired 5 MHz 2600 MHz 10 MHz 1 Paired 20 MHz 2600 MHz 5MHz 5 Unpaired 25 MHz
Ireland 900 MHz 5 MHz 1 Paired 10 MHz 1800 MHz (to 2015) 5 MHz 2 Paired 20 MHz 1800 MHz (from 2015) 5 MHz 4 Paired 40 MHz 2100 MHz 5 MHz 3 Paired 30 MHz
HTHKH(1) 900 MHz 5 MHz 1 Paired 10 MHz 900 MHz 8.3 MHz 1 Paired 16.6 MHz 1800 MHz 11.6 MHz 1 Paired 23.2 MHz 2100 MHz 14.8 MHz 1 Paired 29.6 MHz 2100 MHz 5 MHz 1 Unpaired 5 MHz 2300 MHz 30 MHz 1 Unpaired 30 MHz 2600 MHz (2) 5MHz 1 Paired 10 MHz 2600 MHz (2) 15MHz 1 Paired 30 MHz
HAT–Indonesia 1800 MHz 10 MHz 1 Paired 20 MHz 2100 MHz 5 MHz 2 Paired 20 MHz
HAT–SriLanka 900 MHz 7.5 MHz 1 Paired 15 MHz 1800 MHz 7.5 MHz 1 Paired 15 MHz 2100 MHz 5 MHz 2 Paired 20 MHz
HAT–Vietnam 900 MHz 10 MHz 1 Paired 20 MHz 2100 MHz (3) 15 MHz 1 Paired 30 MHz
Australia(4) 850 MHz 5 MHz 2 Paired 20 MHz 900 MHz 8.2 MHz 1 Paired 16.4 MHz 1800 MHz 5 MHz 6 Paired 60 MHz 2100 MHz 5 MHz 5 Paired 50 MHz
Note 1: Reflects spectrum licence in Hong Kong only.
Note 2: Spectrum held by 50/50 joint venture with PCCW.
Note 3: Spectrum shared with Viettel Mobile.
Note 4: VHA’s spectrum holdings vary across different locations, hence the above reflects spectrum allocated in Sydney and Melbourne only. HWL 2013 Annual Results Operations Review
Page 72 of 72