Embed Size (px)
Citation preview
Annual Results for FY2014 Be the Best, Be the One 2017
May 7th, 2015 Sumitomo Corporation
2. New Medium-Term Management Plan, “Be the Best, Be the One 2017”
1. Annual Results for FY2014
Topics
Cautionary Statement Concerning Forward-looking Statements This report includes forward-looking statements relating to our future plans, forecasts, objectives, expectations and intentions. The forward-looking statements reflect management's current assumptions and expectations of future events, and accordingly, they are inherently susceptible to uncertainties and changes in circumstances and are not guarantees of future performance. Actual results may differ materially, for a wide range of possible reasons, including general industry and market conditions and general international economic conditions. In light of the many risks and uncertainties, you are advised not to put undue reliance on these statements. The management forecasts included in this report are not projections, and do not represent management's current estimates of future performance. Rather, they represent forecasts that management strives to achieve through the successful implementation of the Company's business strategies. The Company may be unsuccessful in implementing its business strategies, and management may fail to achieve its forecasts. The Company is under no obligation -- and expressly disclaims any such obligation -- to update or alter its forward-looking statements.
Annual Results for FY2014
FY2013 FY2014forecast
as of Mar.25
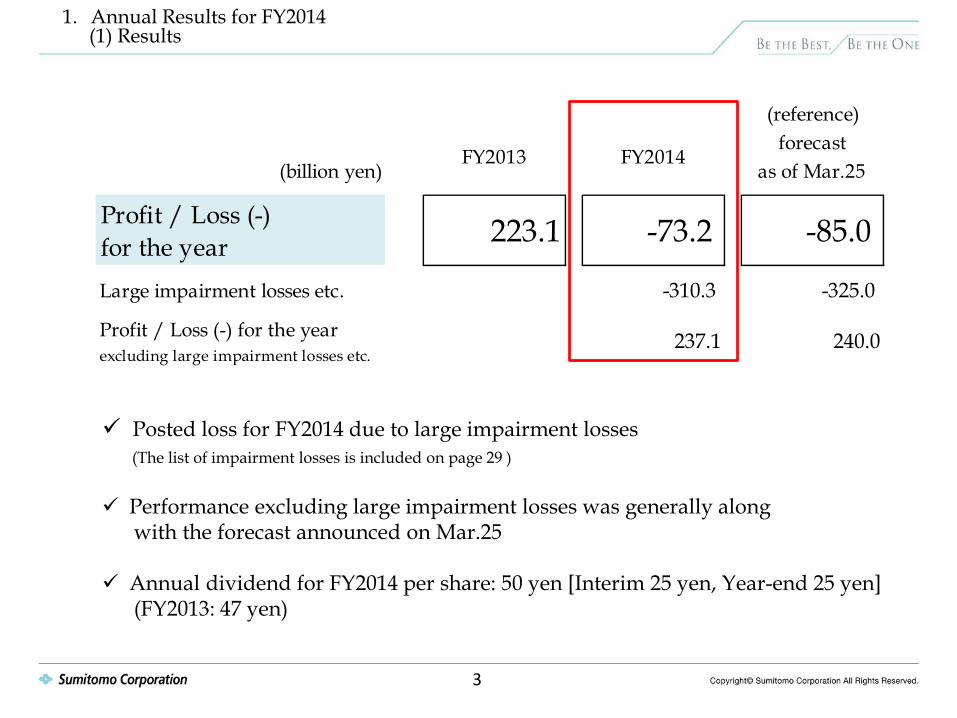
Profit / Loss (-)for the year 223.1 -73.2 -85.0
Large impairment losses etc. -310.3 -325.0
Profit / Loss (-) for the yearexcluding large impairment losses etc.
237.1 240.0
(billion yen)
(reference)
2019 2019
1. Annual Results for FY2014 (1) Results
3
Posted loss for FY2014 due to large impairment losses (The list of impairment losses is included on page 29 ) Performance excluding large impairment losses was generally along with the forecast announced on Mar.25 Annual dividend for FY2014 per share: 50 yen [Interim 25 yen, Year-end 25 yen] (FY2013: 47 yen)
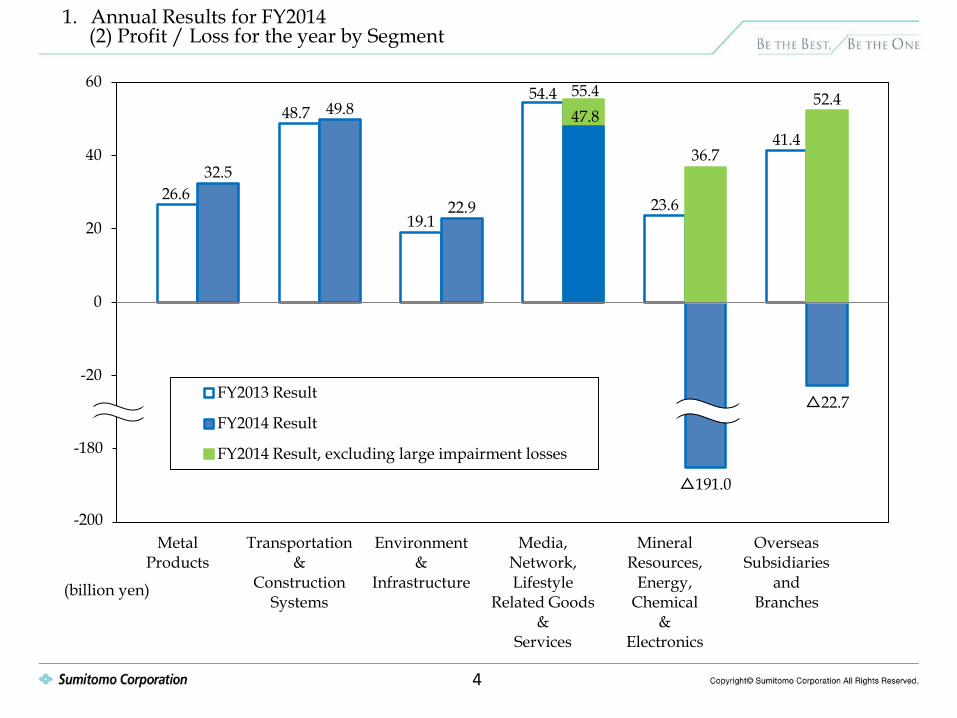
26.6
48.7
19.1
54.4
23.6
41.4
32.5
49.8
22.9
55.4
△191.0
△22.7
47.8
36.7
52.4
-60
-40
-20
0
20
40
60
Metal Products
Transportation &
Construction Systems
Environment &
Infrastructure
Media, Network, Lifestyle
Related Goods &
Services
Mineral Resources,
Energy, Chemical
& Electronics
Overseas Subsidiaries
and Branches
FY2013 Result
FY2014 Result
FY2014 Result, excluding large impairment losses
(billion yen)
-180
-200
2019
1. Annual Results for FY2014 (2) Profit / Loss for the year by Segment
4
2019
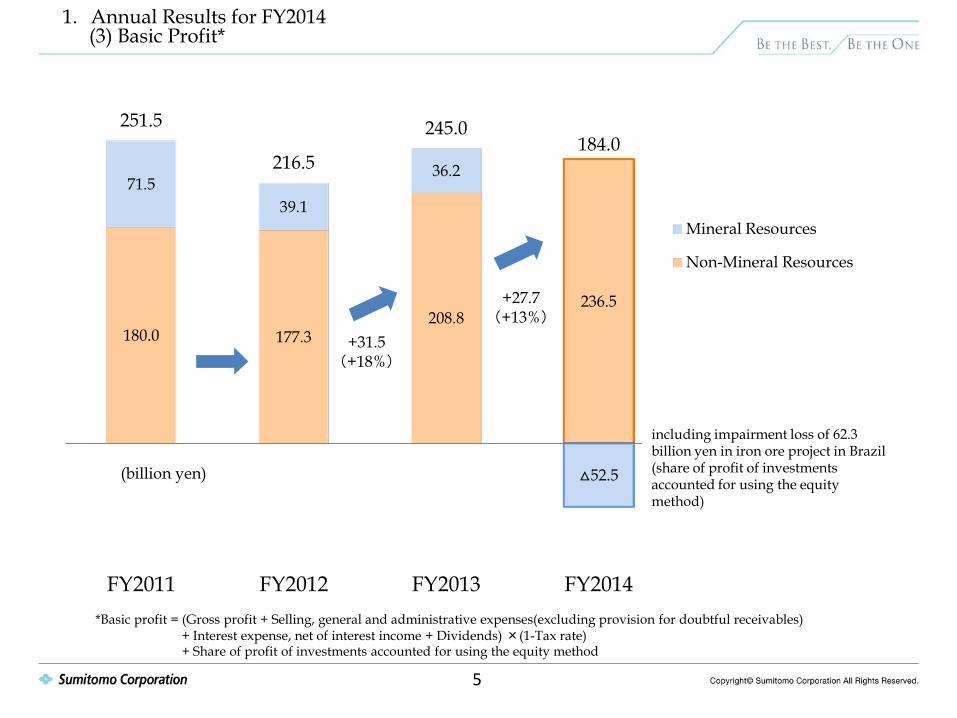
1. Annual Results for FY2014 (3) Basic Profit*
5
*Basic profit = (Gross profit + Selling, general and administrative expenses(excluding provision for doubtful receivables) + Interest expense, net of interest income + Dividends) ×(1-Tax rate) + Share of profit of investments accounted for using the equity method
180.0 177.3 208.8
236.5
71.5 39.1
36.2
△52.5
251.5
216.5
245.0 184.0
FY2011 FY2012 FY2013 FY2014
Mineral Resources
Non-Mineral Resources
(billion yen)
including impairment loss of 62.3 billion yen in iron ore project in Brazil (share of profit of investments accounted for using the equity method)
+31.5 (+18%)
+27.7 (+13%)
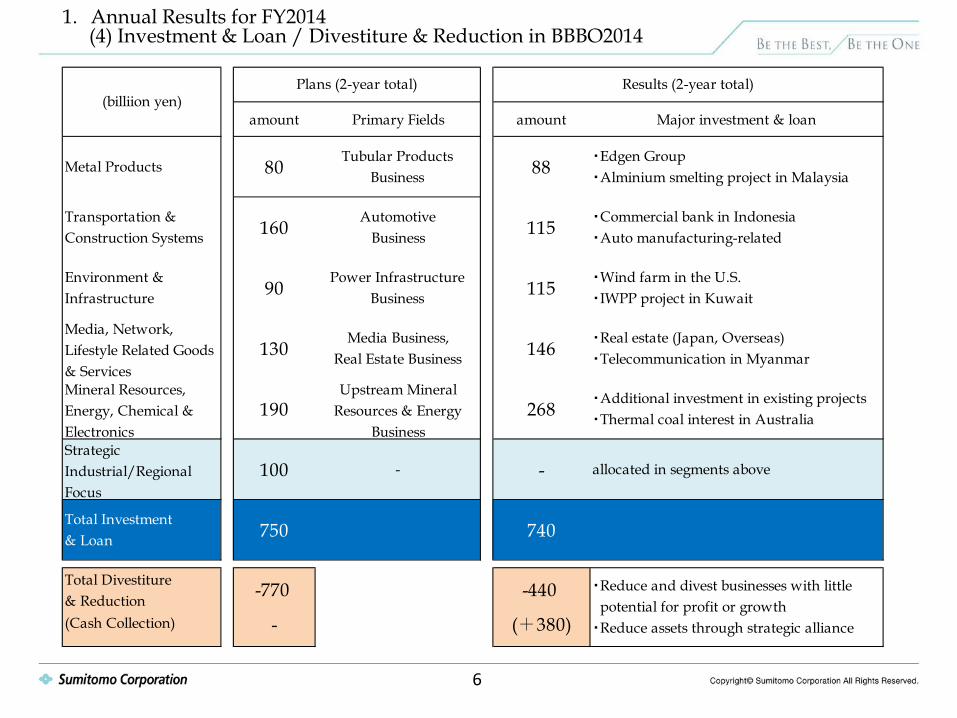
1. Annual Results for FY2014 (4) Investment & Loan / Divestiture & Reduction in BBBO2014
6
amount Primary Fields amount Major investment & loan
Metal Products 80Tubular Products
Business 88・Edgen Group・Alminium smelting project in Malaysia
Transportation &Construction Systems 160
AutomotiveBusiness 115
・Commercial bank in Indonesia・Auto manufacturing-related
Environment &Infrastructure 90
Power InfrastructureBusiness 115
・Wind farm in the U.S.・IWPP project in Kuwait
Media, Network,Lifestyle Related Goods& Services
130Media Business,
Real Estate Business 146・Real estate (Japan, Overseas)・Telecommunication in Myanmar
Mineral Resources,Energy, Chemical &Electronics
190Upstream Mineral
Resources & EnergyBusiness
268・Additional investment in existing projects・Thermal coal interest in Australia
StrategicIndustrial/RegionalFocus
100 - - allocated in segments above
Total Investment& Loan 750 740
Total Divestiture& Reduction -770 -440
(Cash Collection) - (+380)
(billiion yen)Plans (2-year total) Results (2-year total)
・Reduce and divest businesses with little potential for profit or growth・Reduce assets through strategic alliance
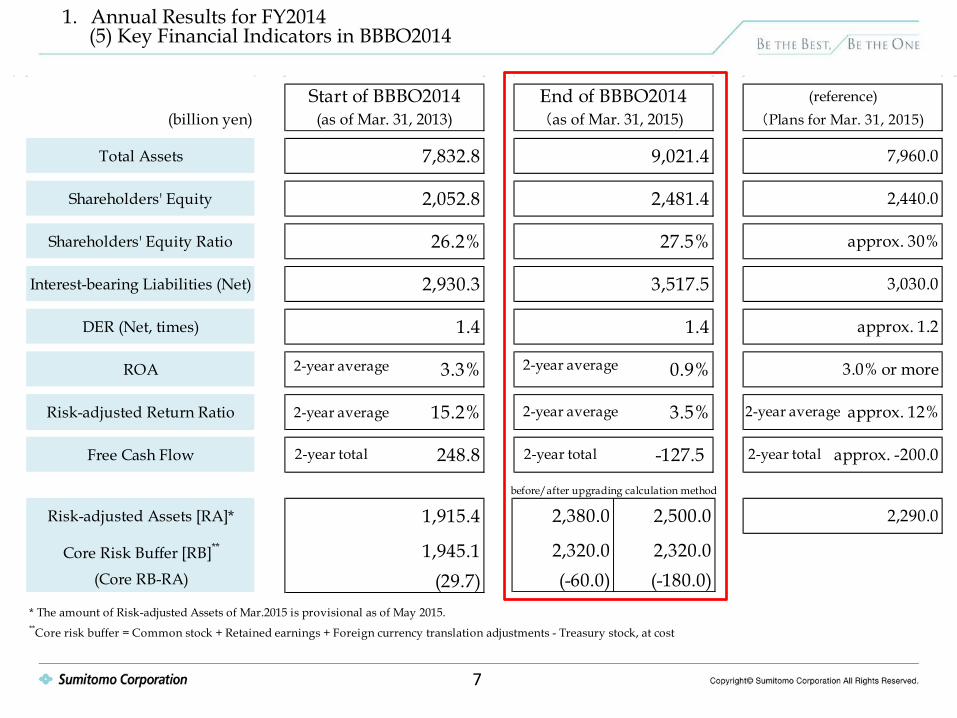
Start of BBBO2014 End of BBBO2014 (reference)(billion yen) (as of Mar. 31, 2013) (as of Mar. 31, 2015) (Plans for Mar. 31, 2015)
Total Assets 7,832.8 9,021.4 7,960.0
Shareholders' Equity 2,052.8 2,481.4 2,440.0
Shareholders' Equity Ratio 26.2% 27.5% approx. 30%
Interest-bearing Liabilities (Net) 2,930.3 3,517.5 3,030.0
DER (Net, times) 1.4 1.4 approx. 1.2
ROA 3.3% 0.9% 3.0% or more
Risk-adjusted Return Ratio 15.2% 3.5% approx. 12%
Free Cash Flow 248.8 -127.5 approx. -200.0
before/after upgrading calculation method
Risk-adjusted Assets [RA]* 1,915.4 2,290.0
Core Risk Buffer [RB]** 1,945.1(Core RB-RA) (29.7)
* The amount of Risk-adjusted Assets of Mar.2015 is provisional as of May 2015.**Core risk buffer = Common stock + Retained earnings + Foreign currency translation adjustments - Treasury stock, at cost
2-year total 2-year total 2-year total
2-year average2-year average2-year average
2-year average2-year average
2,380.0 2,500.0
2,320.0 2,320.0(-60.0) (-180.0)
1. Annual Results for FY2014 (5) Key Financial Indicators in BBBO2014
7
New Medium-Term Management Plan Be the Best, Be the One 2017
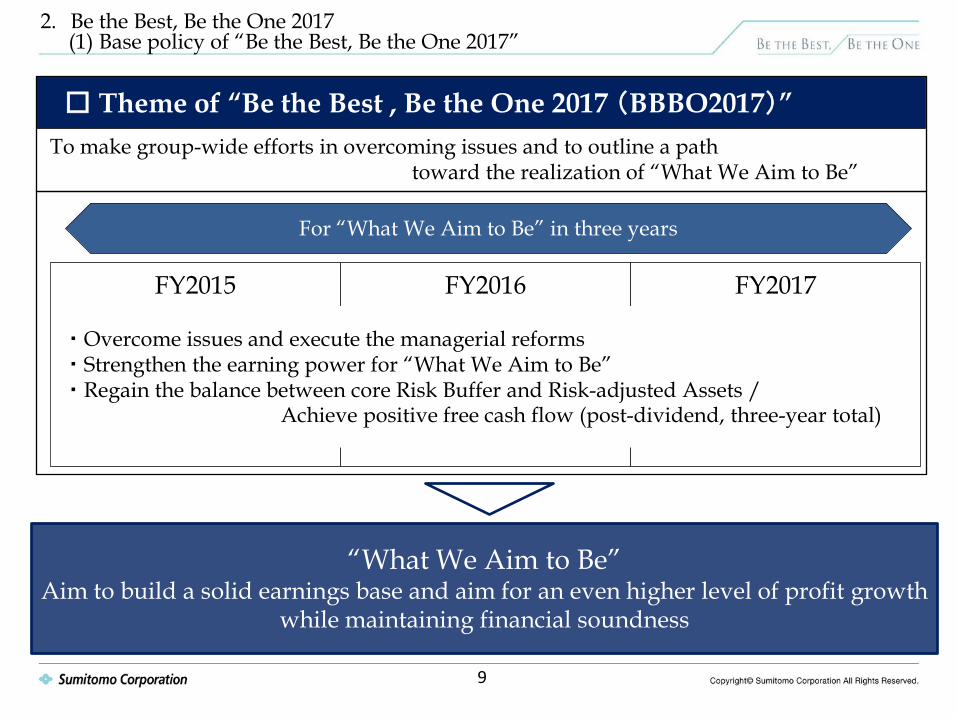
FY2015
FY2016
FY2017
9
“What We Aim to Be” Aim to build a solid earnings base and aim for an even higher level of profit growth
while maintaining financial soundness
To make group-wide efforts in overcoming issues and to outline a path toward the realization of “What We Aim to Be”
□ Theme of “Be the Best , Be the One 2017 (BBBO2017)”
・ Overcome issues and execute the managerial reforms ・ Strengthen the earning power for “What We Aim to Be” ・ Regain the balance between core Risk Buffer and Risk-adjusted Assets / Achieve positive free cash flow (post-dividend, three-year total)
For “What We Aim to Be” in three years
2. Be the Best, Be the One 2017 (1) Base policy of “Be the Best, Be the One 2017”
2. Be the Best, Be the One 2017 (2) Overall Picture of BBBO2017
10
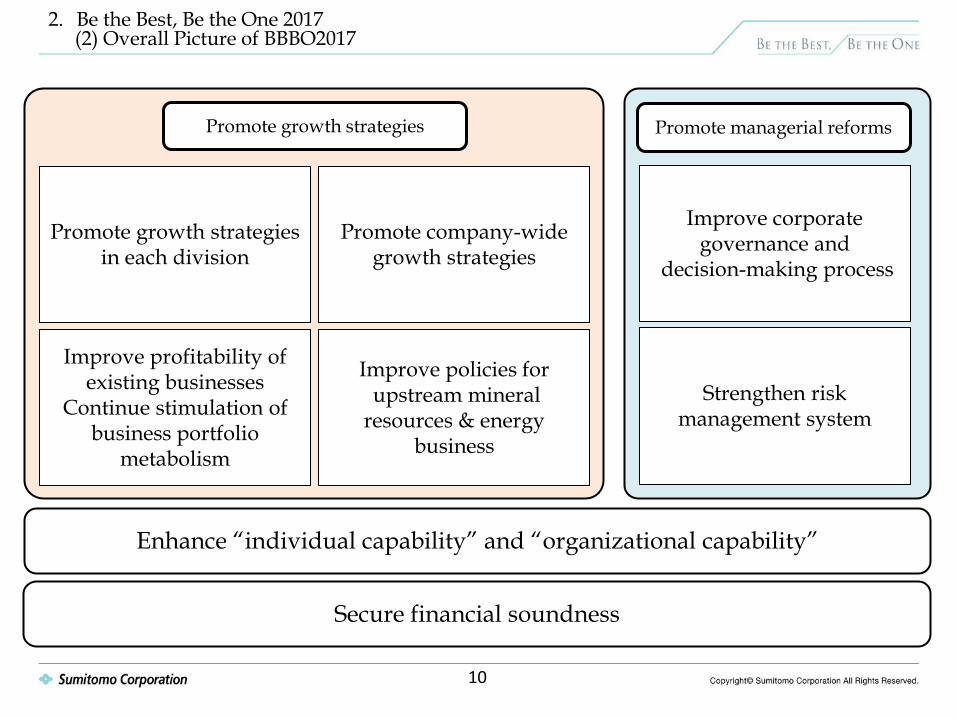
Promote growth strategies in each division
Promote company-wide growth strategies
Improve profitability of existing businesses
Continue stimulation of business portfolio
metabolism
Improve policies for upstream mineral resources & energy
business
Improve corporate governance and
decision-making process
Strengthen risk management system
Promote growth strategies Promote managerial reforms
Secure financial soundness
Enhance “individual capability” and “organizational capability”
11
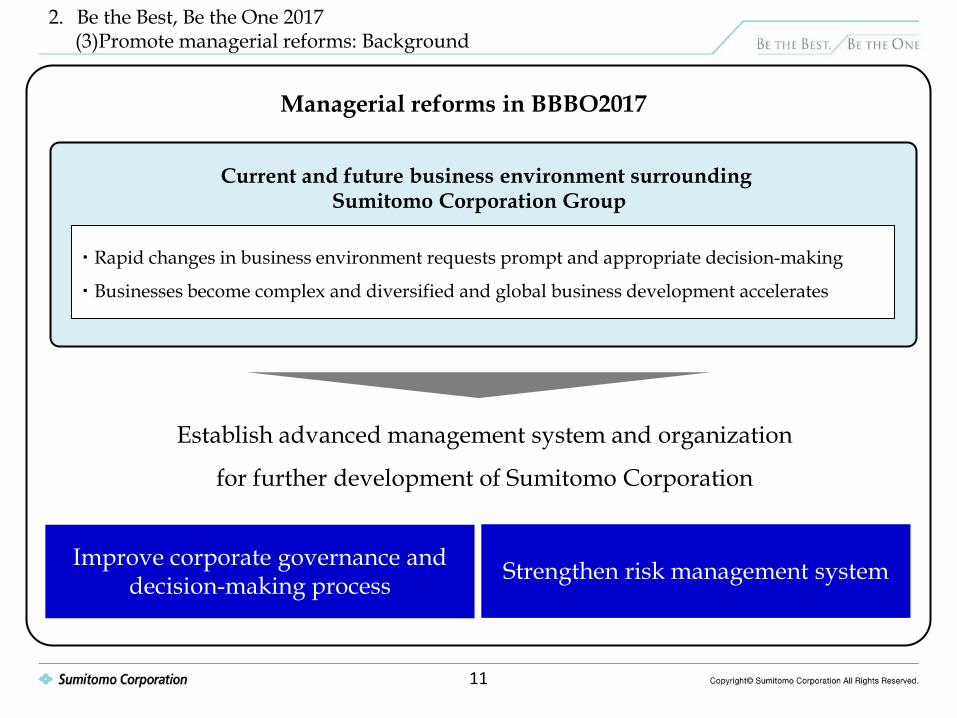
2. Be the Best, Be the One 2017 (3)Promote managerial reforms: Background
Managerial reforms in BBBO2017
Current and future business environment surrounding Sumitomo Corporation Group
Establish advanced management system and organization
for further development of Sumitomo Corporation
Improve corporate governance and decision-making process Strengthen risk management system
・ Rapid changes in business environment requests prompt and appropriate decision-making
・ Businesses become complex and diversified and global business development accelerates
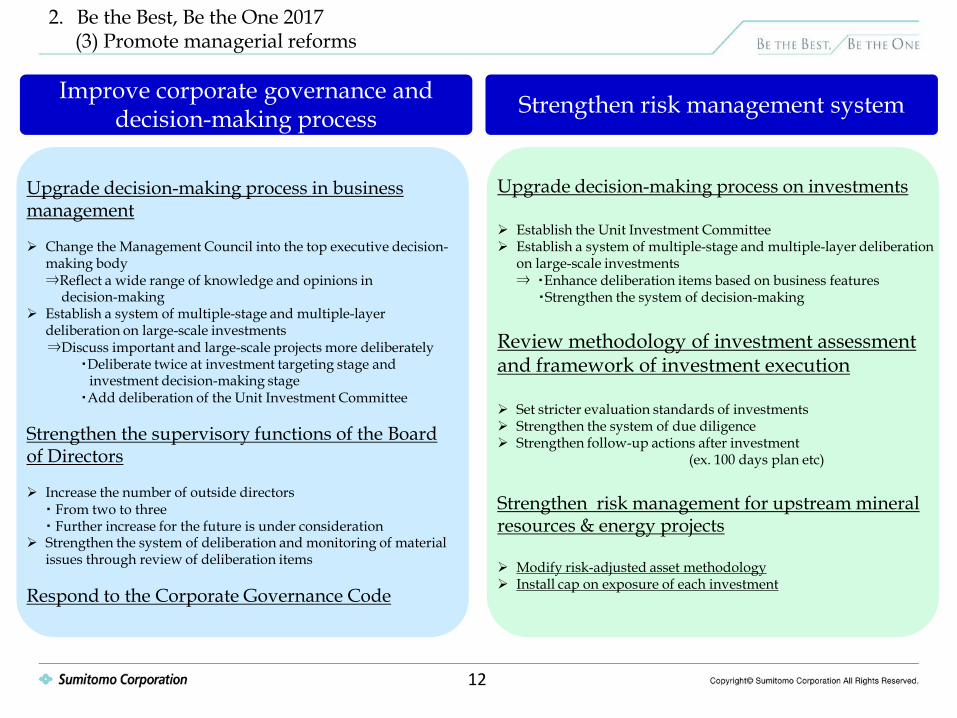
2. Be the Best, Be the One 2017 (3) Promote managerial reforms
Improve corporate governance and decision-making process Strengthen risk management system
12
Upgrade decision-making process in business management Change the Management Council into the top executive decision-
making body ⇒Reflect a wide range of knowledge and opinions in decision-making Establish a system of multiple-stage and multiple-layer
deliberation on large-scale investments ⇒Discuss important and large-scale projects more deliberately ・Deliberate twice at investment targeting stage and investment decision-making stage
・Add deliberation of the Unit Investment Committee Strengthen the supervisory functions of the Board of Directors Increase the number of outside directors ・ From two to three ・ Further increase for the future is under consideration Strengthen the system of deliberation and monitoring of material
issues through review of deliberation items Respond to the Corporate Governance Code
Upgrade decision-making process on investments Establish the Unit Investment Committee Establish a system of multiple-stage and multiple-layer deliberation
on large-scale investments ⇒ ・Enhance deliberation items based on business features ・Strengthen the system of decision-making Review methodology of investment assessment and framework of investment execution Set stricter evaluation standards of investments Strengthen the system of due diligence Strengthen follow-up actions after investment (ex. 100 days plan etc) Strengthen risk management for upstream mineral resources & energy projects Modify risk-adjusted asset methodology Install cap on exposure of each investment
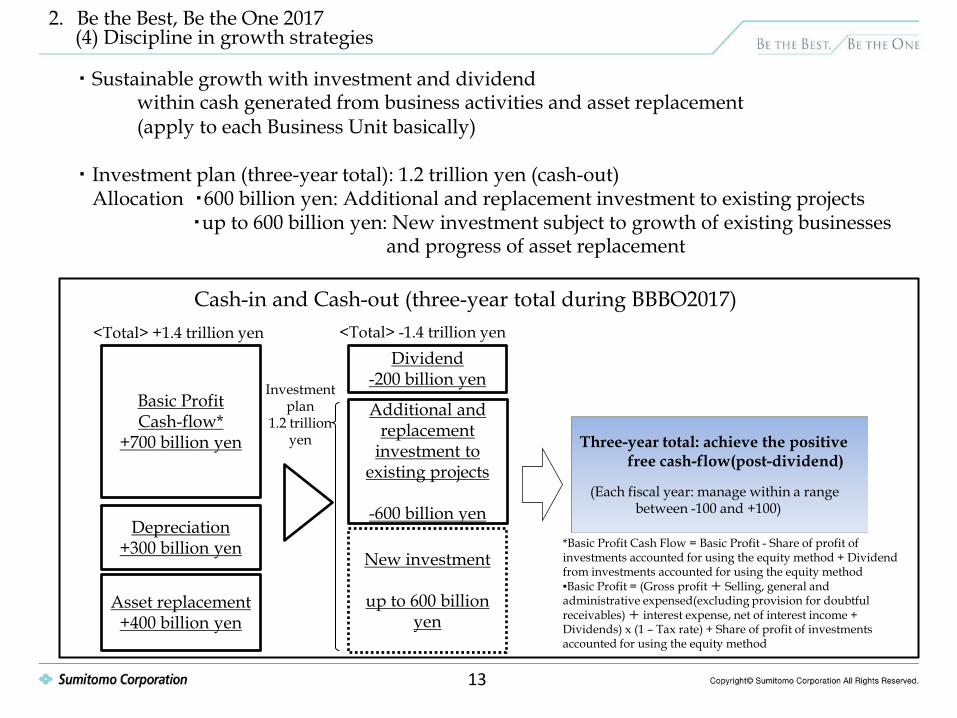
2. Be the Best, Be the One 2017 (4) Discipline in growth strategies
・ Sustainable growth with investment and dividend within cash generated from business activities and asset replacement (apply to each Business Unit basically) ・ Investment plan (three-year total): 1.2 trillion yen (cash-out) Allocation ・600 billion yen: Additional and replacement investment to existing projects ・up to 600 billion yen: New investment subject to growth of existing businesses and progress of asset replacement
Three-year total: achieve the positive free cash-flow(post-dividend) (Each fiscal year: manage within a range between -100 and +100)
Cash-in and Cash-out (three-year total during BBBO2017)
Basic Profit Cash-flow*
+700 billion yen
Asset replacement +400 billion yen
Dividend -200 billion yen
New investment
up to 600 billion yen
Depreciation +300 billion yen
<Total> +1.4 trillion yen <Total> -1.4 trillion yen
*Basic Profit Cash Flow = Basic Profit - Share of profit of investments accounted for using the equity method + Dividend from investments accounted for using the equity method •Basic Profit = (Gross profit + Selling, general and administrative expensed(excluding provision for doubtful receivables) + interest expense, net of interest income + Dividends) x (1 – Tax rate) + Share of profit of investments accounted for using the equity method
Additional and replacement
investment to existing projects
-600 billion yen
Investment plan
1.2 trillion yen
13
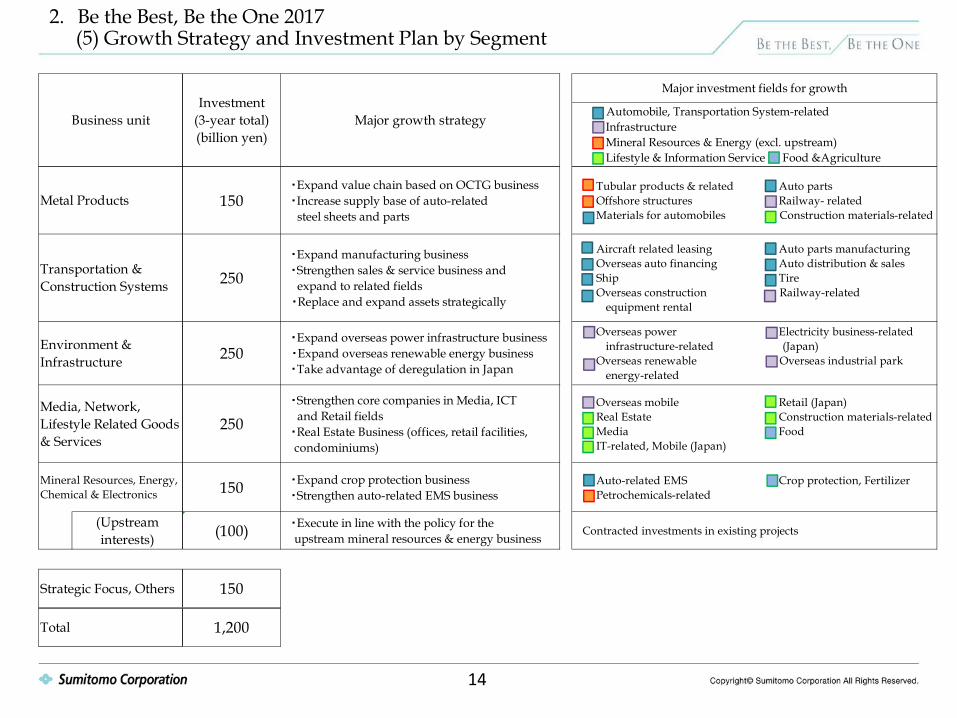
2. Be the Best, Be the One 2017 (5) Growth Strategy and Investment Plan by Segment
14
150 ・Expand value chain based on OCTG business ・Increase supply base of auto-related steel sheets and parts
Tubular products & related Offshore structures Materials for automobiles
Auto parts Railway- related Construction materials-related
250 ・Expand manufacturing business ・Strengthen sales & service business and expand to related fields ・Replace and expand assets strategically
Aircraft related leasing Overseas auto financing Ship Overseas construction equipment rental
Auto parts manufacturing Auto distribution & sales Tire Railway-related
250 ・Expand overseas power infrastructure business ・Expand overseas renewable energy business ・Take advantage of deregulation in Japan
Overseas power infrastructure-related Overseas renewable energy-related
Electricity business-related (Japan) Overseas industrial park
250 ・Strengthen core companies in Media, ICT and Retail fields ・Real Estate Business (offices, retail facilities, condominiums)
Overseas mobile Real Estate Media IT-related, Mobile (Japan)
Retail (Japan) Construction materials-related Food
150 ・Expand crop protection business ・Strengthen auto-related EMS business
Auto-related EMS Petrochemicals-related
Crop protection, Fertilizer
(Upstreaminterests) (100) ・Execute in line with the policy for the
upstream mineral resources & energy business
150
1,200
Business unitInvestment
(3-year total)(billion yen)
Major growth strategy
Major investment fields for growth
Automobile, Transportation System-related Infrastructure Mineral Resources & Energy (excl. upstream) Lifestyle & Information Service Food &Agriculture
Strategic Focus, Others
Total
Metal Products
Transportation &Construction Systems
Environment &Infrastructure
Media, Network,Lifestyle Related Goods& Services
Mineral Resources, Energy,Chemical & Electronics
Contracted investments in existing projects
2. Be the Best, Be the One 2017 (6) Growth Strategy, Macro environment outlook
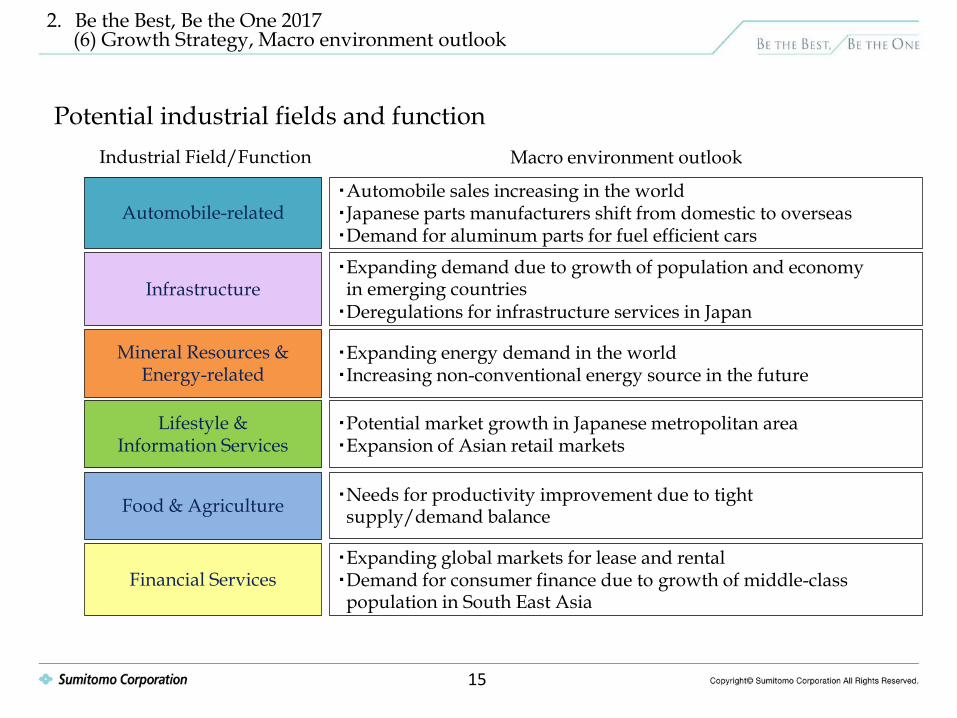
Potential industrial fields and function
Industrial Field/Function
Automobile-related
Infrastructure
Financial Services
Mineral Resources & Energy-related
Lifestyle & Information Services
Food & Agriculture
・Automobile sales increasing in the world ・Japanese parts manufacturers shift from domestic to overseas ・Demand for aluminum parts for fuel efficient cars
Macro environment outlook
・Expanding demand due to growth of population and economy in emerging countries ・Deregulations for infrastructure services in Japan
・Expanding global markets for lease and rental ・Demand for consumer finance due to growth of middle-class population in South East Asia
・Potential market growth in Japanese metropolitan area ・Expansion of Asian retail markets
・Expanding energy demand in the world ・Increasing non-conventional energy source in the future
・Needs for productivity improvement due to tight supply/demand balance
15
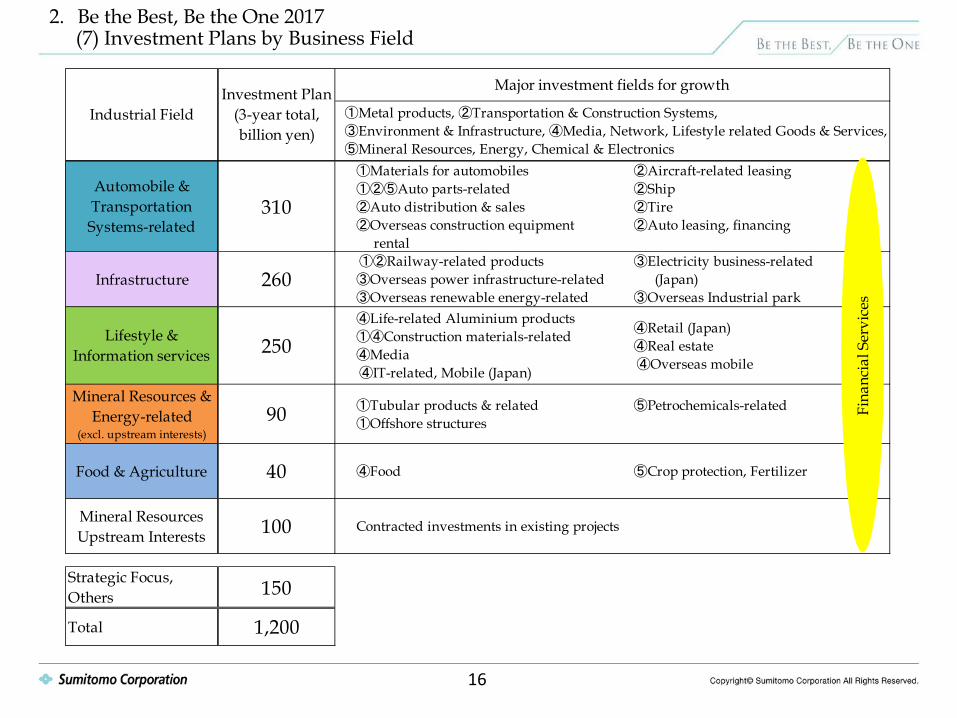
2. Be the Best, Be the One 2017 (7) Investment Plans by Business Field
項目名はP.13に合わせる
16
Automobile &TransportationSystems-related
310
①Materials for automobiles ①②⑤Auto parts-related ②Auto distribution & sales ②Overseas construction equipment rental
②Aircraft-related leasing ②Ship ②Tire ②Auto leasing, financing
Infrastructure 260 ①②Railway-related products ③Overseas power infrastructure-related ③Overseas renewable energy-related
③Electricity business-related (Japan) ③Overseas Industrial park
Lifestyle &Information services 250
④Life-related Aluminium products ①④Construction materials-related ④Media ④IT-related, Mobile (Japan)
④Retail (Japan) ④Real estate ④Overseas mobile
Mineral Resources &Energy-related
(excl. upstream interests)90 ①Tubular products & related
①Offshore structures ⑤Petrochemicals-related
Food & Agriculture 40 ④Food ⑤Crop protection, Fertilizer
Mineral ResourcesUpstream Interests 100
Strategic Focus,Others 150
Total 1,200
①Metal products, ②Transportation & Construction Systems, ③Environment & Infrastructure, ④Media, Network, Lifestyle related Goods & Services, ⑤Mineral Resources, Energy, Chemical & Electronics
Contracted investments in existing projects
Industrial FieldInvestment Plan
(3-year total,billion yen)
Major investment fields for growth
Fina
ncia
l Ser
vice
s
2019
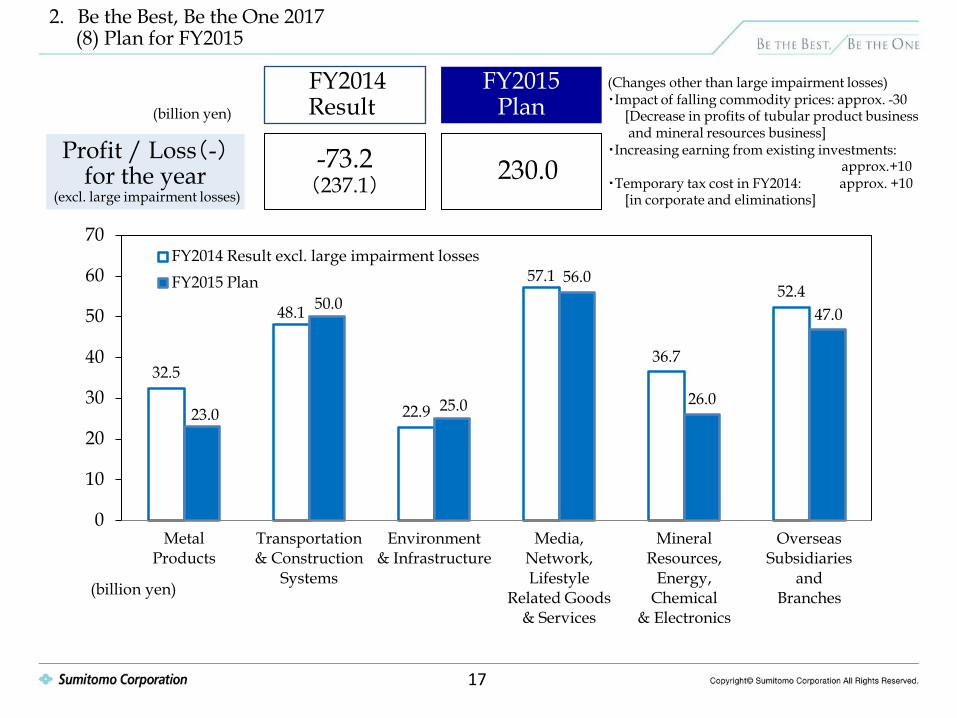
-73.2 (237.1)
FY2014 Result
Profit / Loss(-) for the year
(excl. large impairment losses)
FY2015 Plan
230.0
(billion yen)
2. Be the Best, Be the One 2017 (8) Plan for FY2015
(Changes other than large impairment losses) ・Impact of falling commodity prices: approx. -30 [Decrease in profits of tubular product business and mineral resources business] ・Increasing earning from existing investments: approx.+10 ・Temporary tax cost in FY2014: approx. +10 [in corporate and eliminations]
32.5
48.1
22.9
57.1
36.7
52.4
23.0
50.0
25.0
56.0
26.0
47.0
0
10
20
30
40
50
60
70
Metal Products
Transportation & Construction
Systems
Environment & Infrastructure
Media, Network, Lifestyle
Related Goods & Services
Mineral Resources,
Energy, Chemical
& Electronics
Overseas Subsidiaries
and Branches
FY2014 Result excl. large impairment losses FY2015 Plan
(billion yen)
17

2. Be the Best, Be the One 2017 (9) Plan for FY2017 (Basic Profit)
18
0
100
200
300
400
FY2014 FY2015 FY2017
Non-Mineral Resources
Mineral Resources
* excluding impairment loss of 62.3 billion yen in iron ore project in Brazil (share of profit of investments accounted for using the equity method)
(billion yen)
300 or more
246.3* 230.0
approx. 225.0
236.5
9.9* approx. 5.0
- Growth of existing businesses - Contribution from recent investments Auto manufacturing/financing, Overseas power infrastructure business, Telecommunications project in Myanmar etc.
- Recovery in tubular product business +10 - +20
- Recovery in restructuring projects - Contribution from projects in start-up Tire business in the U.S., Nickel project in Madagascar etc
- Commodity prices: based on a certain level of stress scenario
+50
+10 - +20
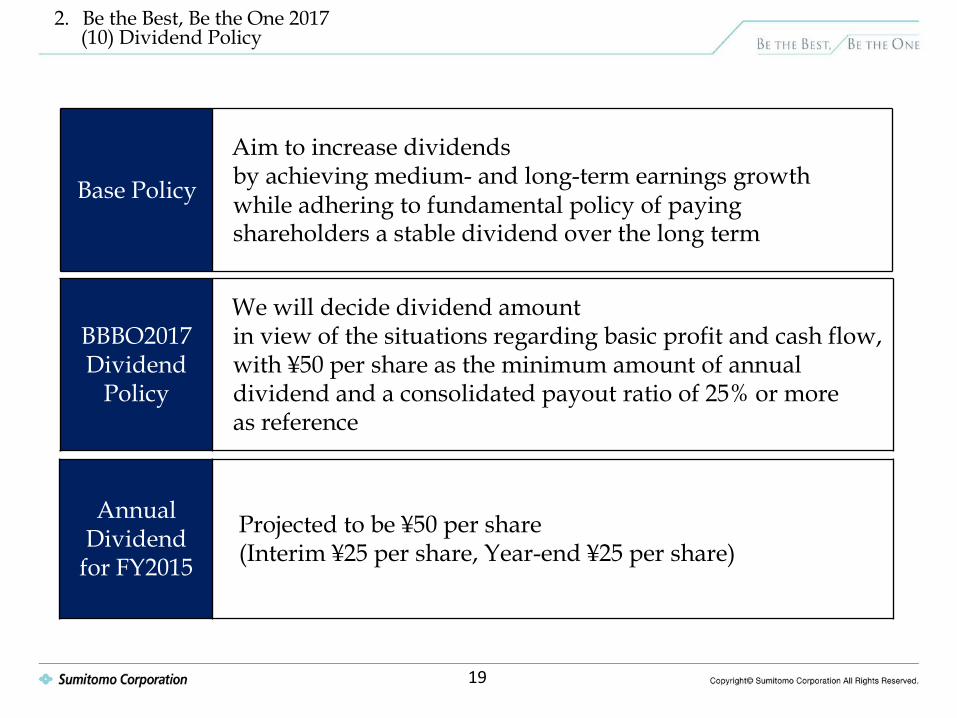
2. Be the Best, Be the One 2017 (10) Dividend Policy
19
Base Policy
Aim to increase dividends by achieving medium- and long-term earnings growth while adhering to fundamental policy of paying shareholders a stable dividend over the long term
BBBO2017 Dividend
Policy
We will decide dividend amount in view of the situations regarding basic profit and cash flow, with ¥50 per share as the minimum amount of annual dividend and a consolidated payout ratio of 25% or more as reference
Annual Dividend
for FY2015
Projected to be ¥50 per share (Interim ¥25 per share, Year-end ¥25 per share)
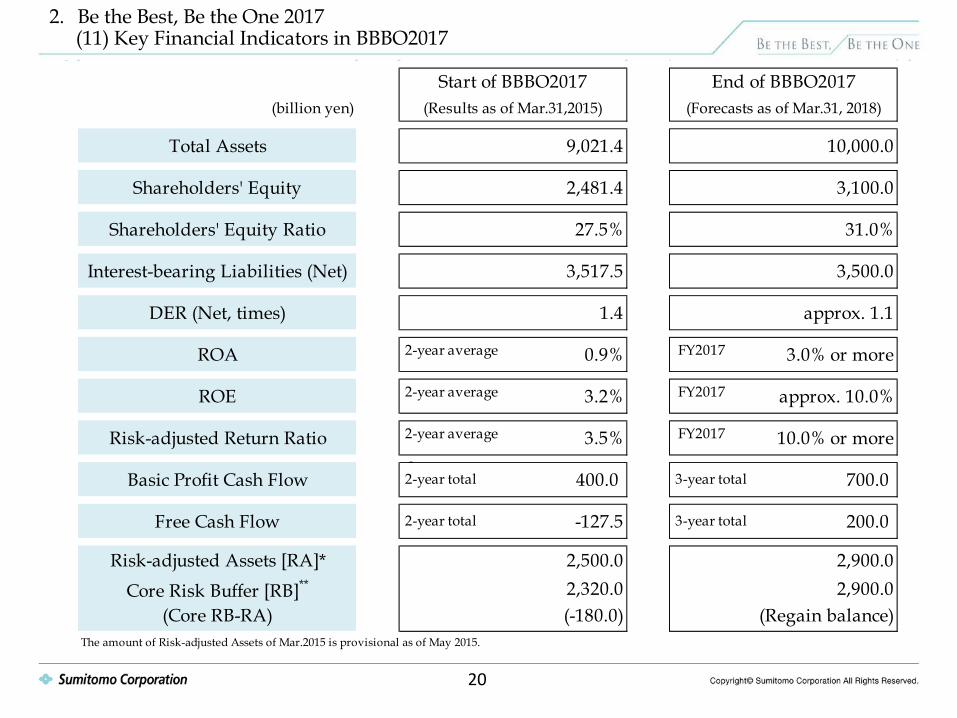
2. Be the Best, Be the One 2017 (11) Key Financial Indicators in BBBO2017
20
Start of BBBO2017 End of BBBO2017(billion yen) (Results as of Mar.31,2015) (Forecasts as of Mar.31, 2018)
Total Assets 9,021.4 10,000.0
Shareholders' Equity 2,481.4 3,100.0
Shareholders' Equity Ratio 27.5% 31.0%
Interest-bearing Liabilities (Net) 3,517.5 3,500.0
DER (Net, times) 1.4 approx. 1.1
ROA 0.9% 3.0% or more
ROE 3.2% approx. 10.0%
Risk-adjusted Return Ratio 3.5% 10.0% or more
Basic Profit Cash Flow 400.0 700.0
Free Cash Flow -127.5 200.0
Risk-adjusted Assets [RA]* 2,500.0 2,900.0
Core Risk Buffer [RB]** 2,320.0 2,900.0(Core RB-RA) (-180.0) (Regain balance)
The amount of Risk-adjusted Assets of Mar.2015 is provisional as of May 2015.
2-year total 3-year total
2-year average
2-year average
2
2-year average
2-year total 3-year total
FY2017
FY2017
FY2017
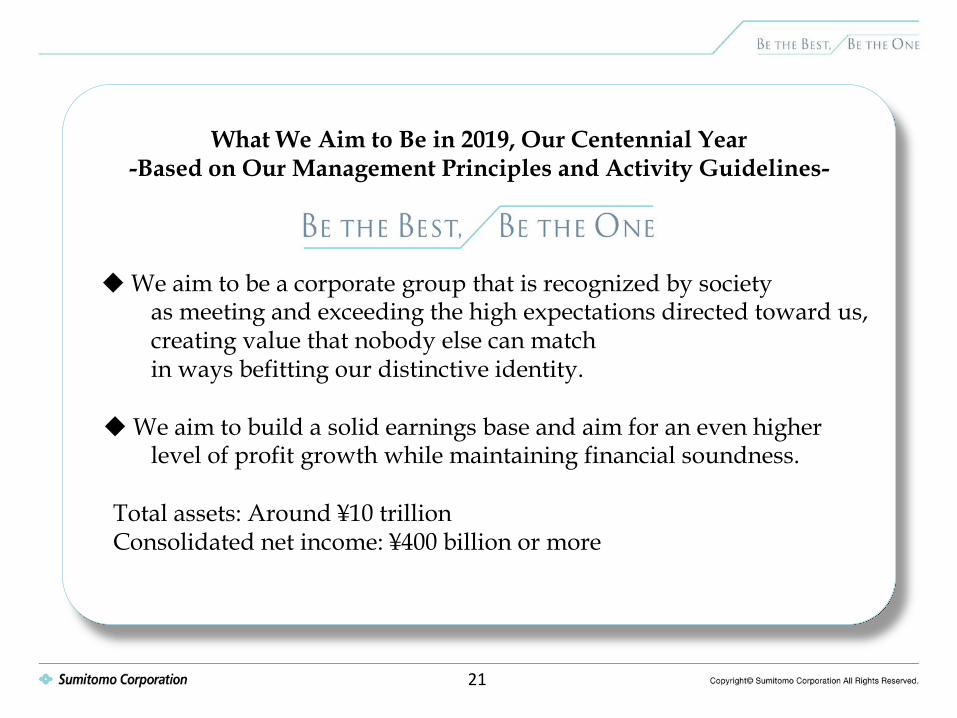
What We Aim to Be in 2019, Our Centennial Year -Based on Our Management Principles and Activity Guidelines-
◆ We aim to be a corporate group that is recognized by society as meeting and exceeding the high expectations directed toward us, creating value that nobody else can match in ways befitting our distinctive identity. ◆ We aim to build a solid earnings base and aim for an even higher level of profit growth while maintaining financial soundness. Total assets: Around ¥10 trillion Consolidated net income: ¥400 billion or more
21
Appendix
◆ Strengthen risk management system 1. Change of Investment Decision Making Process 2. Activities Newly Introduced for Good Investment Decision Making ◆ Policy for the upstream mineral resources & energy business ◆ Promote Growth Strategies - Cross-organizational collaborations
23
24
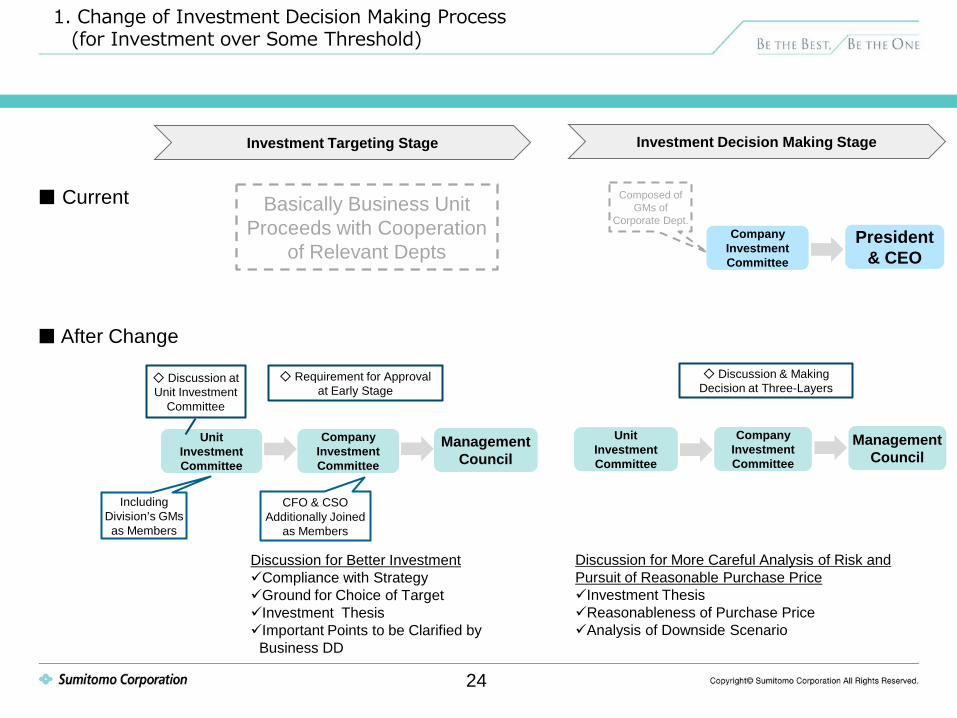
1. Change of Investment Decision Making Process (for Investment over Some Threshold)
■ Current
Investment Targeting Stage Investment Decision Making Stage
Company Investment Committee
■ After Change
President & CEO
Unit Investment Committee
Company Investment Committee
Management Council
Unit Investment Committee
Company Investment Committee
Management Council
Discussion for Better Investment Compliance with Strategy Ground for Choice of Target Investment Thesis Important Points to be Clarified by
Business DD
Discussion for More Careful Analysis of Risk and Pursuit of Reasonable Purchase Price Investment Thesis Reasonableness of Purchase Price Analysis of Downside Scenario
Composed of GMs of
Corporate Dept.
CFO & CSO Additionally Joined
as Members
Including Division’s GMs as Members
Basically Business Unit Proceeds with Cooperation
of Relevant Depts
◇ Discussion at Unit Investment
Committee
◇ Requirement for Approval at Early Stage
◇ Discussion & Making Decision at Three-Layers
24
25
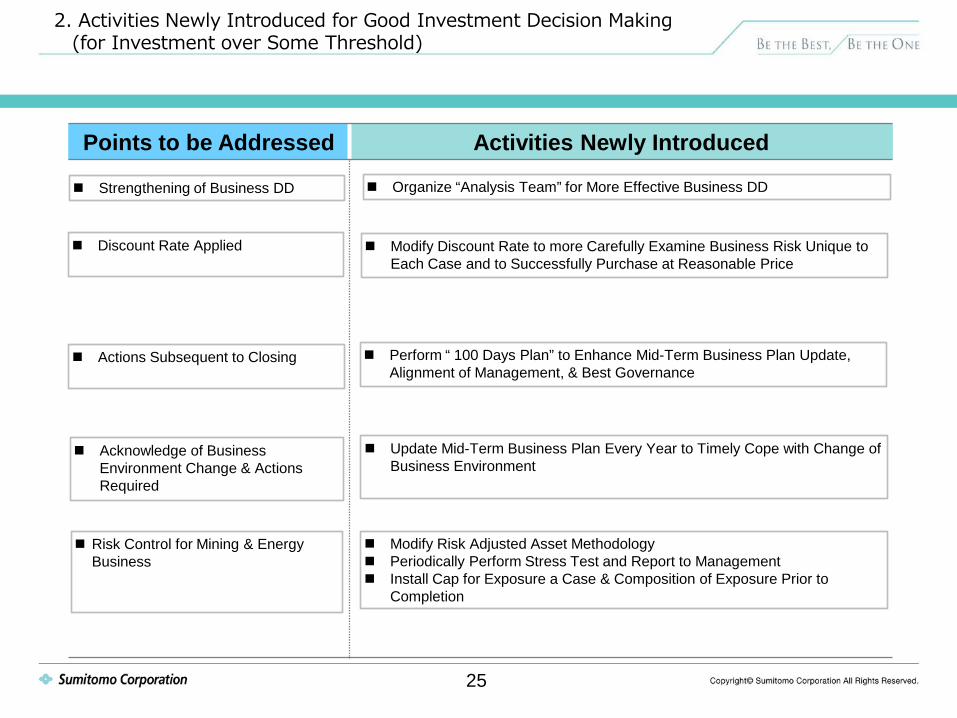
Points to be Addressed Activities Newly Introduced
2. Activities Newly Introduced for Good Investment Decision Making (for Investment over Some Threshold)
Strengthening of Business DD
Actions Subsequent to Closing
Acknowledge of Business Environment Change & Actions Required
Risk Control for Mining & Energy Business
Organize “Analysis Team” for More Effective Business DD
Modify Discount Rate to more Carefully Examine Business Risk Unique to Each Case and to Successfully Purchase at Reasonable Price
Perform “ 100 Days Plan” to Enhance Mid-Term Business Plan Update, Alignment of Management, & Best Governance
Update Mid-Term Business Plan Every Year to Timely Cope with Change of Business Environment
Modify Risk Adjusted Asset Methodology Periodically Perform Stress Test and Report to Management Install Cap for Exposure a Case & Composition of Exposure Prior to
Completion
Discount Rate Applied
25
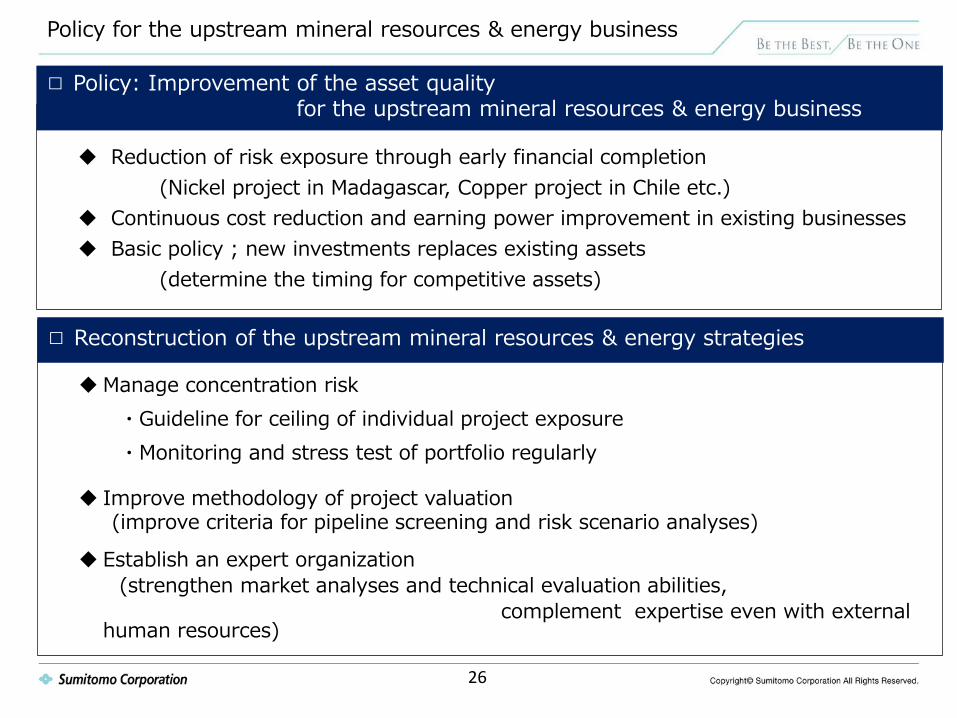
Reduction of risk exposure through early financial completion (Nickel project in Madagascar, Copper project in Chile etc.) Continuous cost reduction and earning power improvement in existing businesses Basic policy ; new investments replaces existing assets (determine the timing for competitive assets)
Policy for the upstream mineral resources & energy business
26
□ Policy: Improvement of the asset quality for the upstream mineral resources & energy business
Manage concentration risk ・Guideline for ceiling of individual project exposure ・Monitoring and stress test of portfolio regularly
Improve methodology of project valuation (improve criteria for pipeline screening and risk scenario analyses)
Establish an expert organization (strengthen market analyses and technical evaluation abilities, complement expertise even with external
human resources)
□ Reconstruction of the upstream mineral resources & energy strategies
27
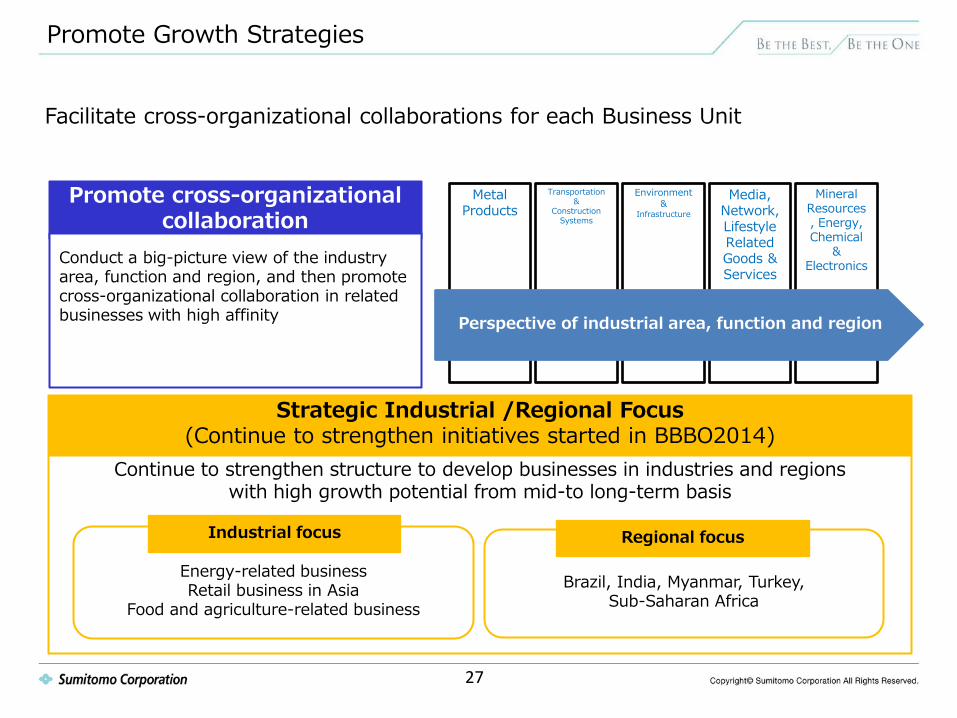
Facilitate cross-organizational collaborations for each Business Unit
Promote cross-organizational collaboration
Conduct a big-picture view of the industry area, function and region, and then promote cross-organizational collaboration in related businesses with high affinity
Strategic Industrial /Regional Focus (Continue to strengthen initiatives started in BBBO2014)
Continue to strengthen structure to develop businesses in industries and regions with high growth potential from mid-to long-term basis
Metal Products
Transportation &
Construction Systems
Environment &
Infrastructure
Media, Network, Lifestyle Related Goods & Services
Mineral Resources, Energy, Chemical
& Electronics
Perspective of industrial area, function and region
Energy-related business Retail business in Asia
Food and agriculture-related business
Industrial focus
Brazil, India, Myanmar, Turkey,
Sub-Saharan Africa
Regional focus
Promote Growth Strategies
Breakdown of Impairment Losses in Large Projects (P.29) Assumptions (P.30) Supplemental materials by segment (P.32) (Performance overview, Medium-to long-term strategies and Forecasts)
Historical Data (P.54)
Medium-term Management Plans (P.56)
Shareholders’ composition (P.57)
(Reference)
28
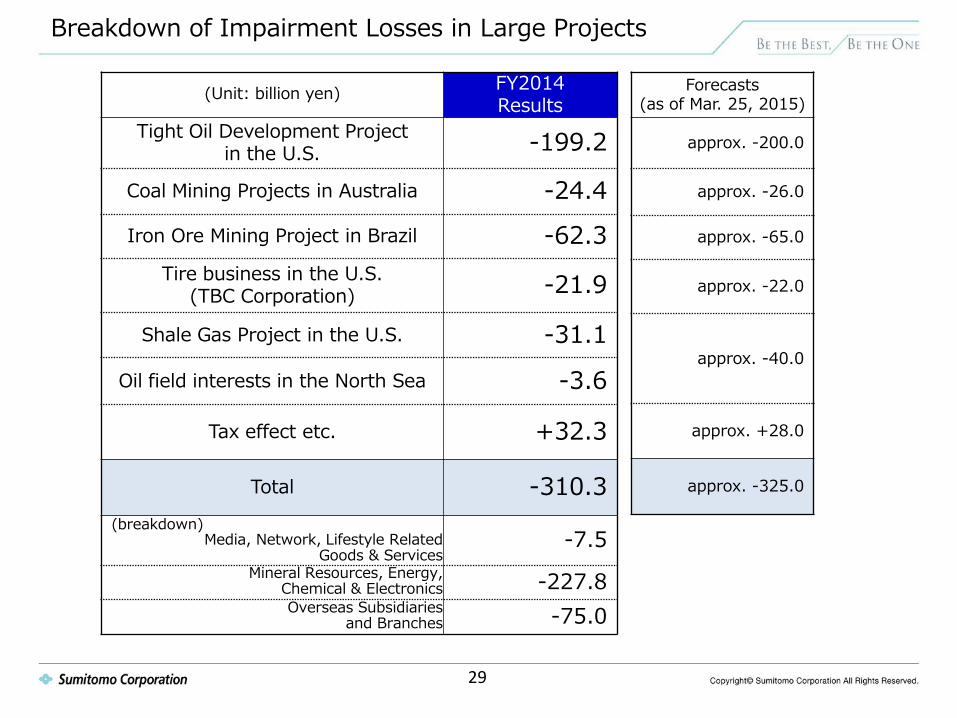
Breakdown of Impairment Losses in Large Projects
(Unit: billion yen) FY2014 Results
Tight Oil Development Project in the U.S. -199.2
Coal Mining Projects in Australia -24.4 Iron Ore Mining Project in Brazil -62.3
Tire business in the U.S. (TBC Corporation) -21.9
Shale Gas Project in the U.S. -31.1
Oil field interests in the North Sea -3.6
Tax effect etc. +32.3
Total -310.3 (breakdown)
Media, Network, Lifestyle Related Goods & Services
-7.5 Mineral Resources, Energy,
Chemical & Electronics -227.8 Overseas Subsidiaries
and Branches -75.0
Forecasts (as of Mar. 25, 2015)
approx. -200.0
approx. -26.0
approx. -65.0
approx. -22.0
approx. -40.0
approx. +28.0
approx. -325.0
29

Assumptions
*1 Foreign Exchange: including hedge, Others: excluding hedge *2 Iron ore and Coking coal prices are general market price. All the figures are the average of the period written in the chart.
0.65%
60
5,732
2,167
6.77
Assumptions
Crude oil<North Sea Brent> (US$/bbl) [Jan.-Dec.] around 60 million yen(1US$/bbl)
99
around 1.1 billion yen(1JPY/US$)
Interestrate
115.00
0.20%
109.76
0.16%
0.34%
around 250 million yen(1US$/t)
120
around 1.0 billion yen(100US$/t)
-
2,175
7.65
119
around 3.7 billion yen(1US$/lb)
97 68 around 400 million yen(1US$/t)
Coking coal (US$/t) [Apr.-Mar.]*2
Nickel (US$/lb) [Jan.-Dec.]
Zinc (US$/t) [Apr.-Mar.]
Copper (US$/t) [Jan.-Dec.]
Foreign Exchange (YEN/US$) [Apr.-Mar.]
LIBOR 6M (YEN) [Apr.-Mar.]
LIBOR 6M (US$) [Apr.-Mar.]
Iron ore (US$/t) [Jan.-Dec.]*2
FY15 Outlook(Apr, 2015-Mar, 2016)
FY14 Results(Apr, 2014-Mar,
2015)
around 490 million yen(100US$/t)
-
6,860
Sensitivity to profit*1
(as of May, 2015)
30

<MEMO>
Performance Overview
※On April 1, 2014 the Kansai Regional Business Unit and Chubu Regional Business Unit were abolished. These two regional business units were incorporated into organizations under business units and divisions. Also, on October 1, 2014 Commodity Business Department was transferred from Corporate and Eliminations to Mineral Resources, Energy, Chemical & Electronics Business Unit. The prior year results are also shown on a new organization basis accordingly.
32

(unit: billions of yen)
2013
Results
Gross profit 97.2
Operating profit 34.6
Share of profit of
Investments accounted for
using the equity method5.6
1Q 2Q 3Q 4Q7.9 8.3 8.1 8.2
Basic profit 26.0
2014
Results
103.5
9.1
Profit/loss(-) for the year
attributable to owners of the
parent26.6
37.4
32.5
Total assets 877.6884.4
33.7
【Results of major subsidiaries and associated companies】 Company Equity in earnings of the segment (shares in equity owned by the segment / (unit: billions of yen) owned by whole company) 2013 2014 Results Results ・SC Pipe Services : 2.8 3.2 ・ERYNGIUM(30/100)*1 : 1.4 1.9 ・Sumisho Metalex: 1.4 1.2 ・Aluminium smelting business in Malaysia(14/20) : -0.1 0.6 ・Edgen Group(29/100) : 0.1 0.1
Metal Products
【Profit for the Year (Apr. 2014-Mar. 2015):32.5 billion yen】 (5.9 billion yen increase from Apr. 2013-Mar. 2014) ・Steel sheets Steel service center: stable ・Tubular products North America: stable
【Investment & Replacement in BBBO2014】
・ Acquired global distributor of metal and tubular products for energy industry (Nov.2013) ・ Participated in aluminum smelting project in Malaysia Second phase (Apr. 2014) Third phase (Feb. 2015)
*1 As the consolidated period was changed, the results show equity in earnings of Jan.-Dec. 2013 for FY2013 and Apr. 2014-Mar. 2015 for FY2014.
33

Transportation & Construction Systems
【Results of major subsidiaries and associated companies】 Company Equity in earnings of the segment (shares in equity owned by the segment / (unit: billions of yen) owned by whole company) 2013 2014 Results Results ・Sumitomo Mitsui Finance and Leasing (35/40): 14.9 16.0 ・Sumitomo Mitsui Auto Service: 4.0 4.4 ・SOF(90/100) : 2.7 2.6 ・Oto Multiartha(90/100) : 3.8 2.1 ・Sumisho Machinery Trade Corporation(60/100) *1: 0.6 1.1
【Profit for the Year (Apr. 2014-Mar. 2015):49.8 billion yen】 (1.1 billion yen increase from Apr. 2013-Mar. 2014) ・Ships, aerospace and railway car Shipping market: sluggish Leasing business: stable ・Automobile Auto finance businesses in Indonesia: decreased Automobile assembly business in Mexico: stable ・Construction equipment Distribution business in Russia and China : slowdown Rental business in the U.S. : stable
【Investment & Replacement in BBBO2014】
・Started aircraft engine leasing business jointly with aircraft engine manufacturer and maintenance services provider in Germany (Sep.2013) ・Invested in an Iraqi automotive service and sales company (Oct.2013) ・Invested in a construction equipment sales/service company in Saudi Arabia (July 2014) ・Invested in a commercial bank in Indonesia (Feb.2015)
*1 Shares in equity of the segment were changed from 44.5% to 60% on 1 Apr., 2014.
(unit: billions of yen)
2013
Results
Gross profit 124.2
Operating profit 34.3
Share of profit of
Investments accounted for
using the equity method27.7
1Q 2Q 3Q 4Q12.4 13.0 12.1 12.3
Basic profit 48.3
2014
Results
133.9
31.5
Profit/loss(-) for the year
attributable to owners of the
parent48.7
29.3
49.8
Total assets 1,615.41,440.6
52.8
34
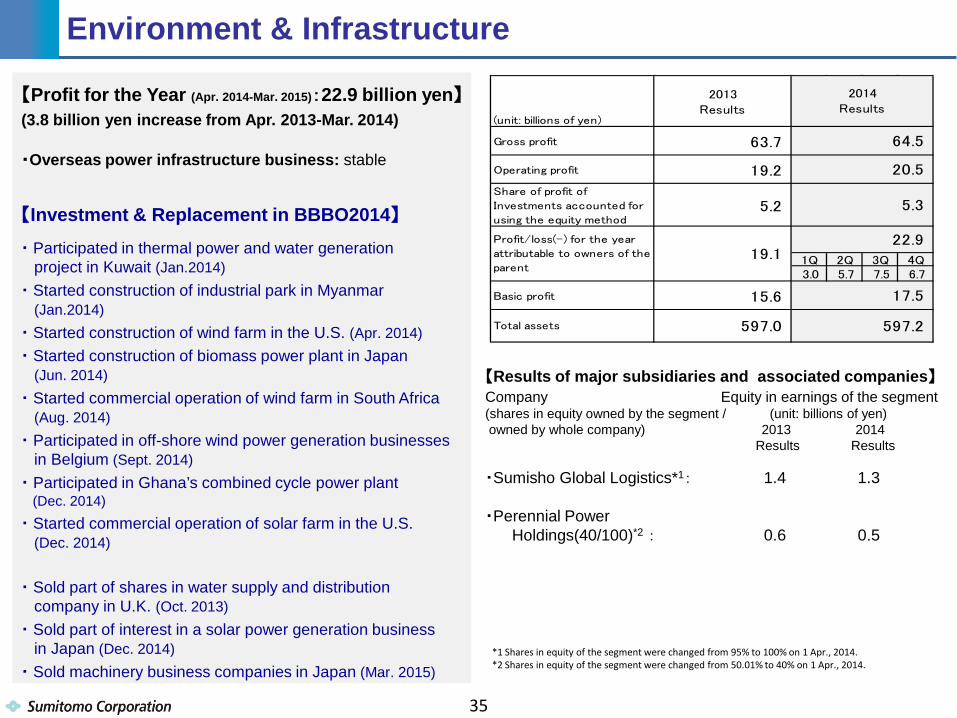
Environment & Infrastructure
【Results of major subsidiaries and associated companies】 Company Equity in earnings of the segment (shares in equity owned by the segment / (unit: billions of yen) owned by whole company) 2013 2014 Results Results ・Sumisho Global Logistics*1: 1.4 1.3 ・Perennial Power Holdings(40/100)*2 : 0.6 0.5
【Profit for the Year (Apr. 2014-Mar. 2015):22.9 billion yen】 (3.8 billion yen increase from Apr. 2013-Mar. 2014)
・Overseas power infrastructure business: stable 【Investment & Replacement in BBBO2014】
・ Participated in thermal power and water generation project in Kuwait (Jan.2014) ・ Started construction of industrial park in Myanmar (Jan.2014) ・ Started construction of wind farm in the U.S. (Apr. 2014) ・ Started construction of biomass power plant in Japan (Jun. 2014) ・ Started commercial operation of wind farm in South Africa (Aug. 2014) ・ Participated in off-shore wind power generation businesses in Belgium (Sept. 2014) ・ Participated in Ghana’s combined cycle power plant (Dec. 2014) ・ Started commercial operation of solar farm in the U.S. (Dec. 2014) ・ Sold part of shares in water supply and distribution company in U.K. (Oct. 2013) ・ Sold part of interest in a solar power generation business in Japan (Dec. 2014) ・ Sold machinery business companies in Japan (Mar. 2015)
*1 Shares in equity of the segment were changed from 95% to 100% on 1 Apr., 2014. *2 Shares in equity of the segment were changed from 50.01% to 40% on 1 Apr., 2014.
(unit: billions of yen)
2013
Results
Gross profit 63.7
Operating profit 19.2
Share of profit of
Investments accounted for
using the equity method5.2
1Q 2Q 3Q 4Q3.0 5.7 7.5 6.7
Basic profit 15.6
2014
Results
64.5
5.3
Profit/loss(-) for the year
attributable to owners of the
parent19.1
20.5
22.9
Total assets 597.2597.0
17.5
35
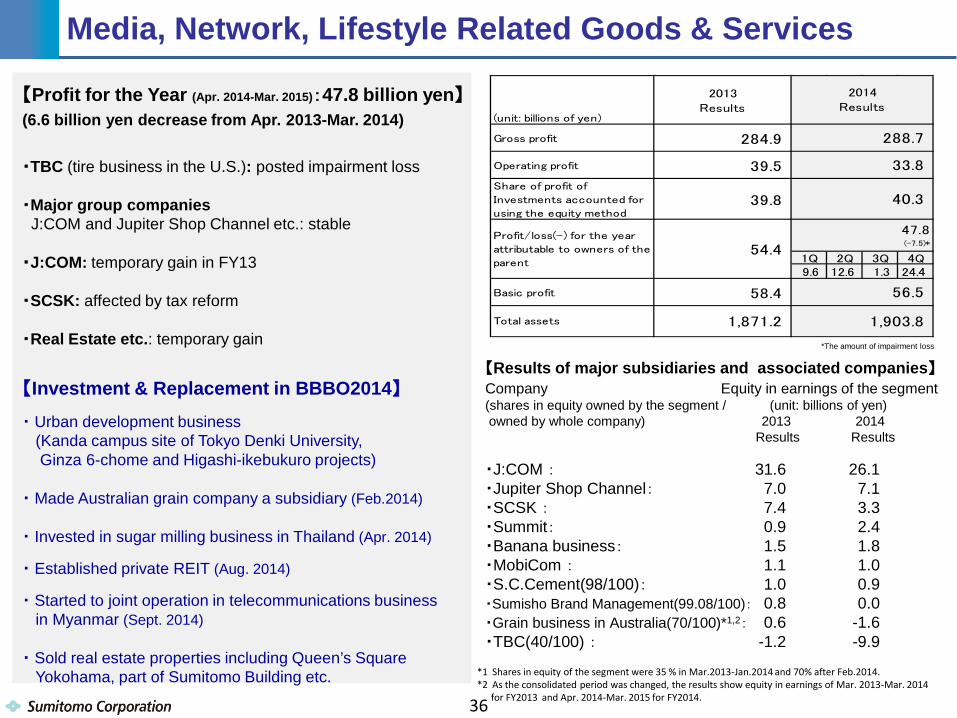
Media, Network, Lifestyle Related Goods & Services
【Results of major subsidiaries and associated companies】 Company Equity in earnings of the segment (shares in equity owned by the segment / (unit: billions of yen) owned by whole company) 2013 2014 Results Results ・J:COM : 31.6 26.1 ・Jupiter Shop Channel: 7.0 7.1 ・SCSK : 7.4 3.3 ・Summit: 0.9 2.4 ・Banana business: 1.5 1.8 ・MobiCom : 1.1 1.0 ・S.C.Cement(98/100): 1.0 0.9 ・Sumisho Brand Management(99.08/100): 0.8 0.0 ・Grain business in Australia(70/100)*1,2: 0.6 -1.6 ・TBC(40/100) : -1.2 -9.9
【Profit for the Year (Apr. 2014-Mar. 2015):47.8 billion yen】 (6.6 billion yen decrease from Apr. 2013-Mar. 2014)
・TBC (tire business in the U.S.): posted impairment loss ・Major group companies J:COM and Jupiter Shop Channel etc.: stable ・J:COM: temporary gain in FY13 ・SCSK: affected by tax reform ・Real Estate etc.: temporary gain 【Investment & Replacement in BBBO2014】
・ Urban development business (Kanda campus site of Tokyo Denki University, Ginza 6-chome and Higashi-ikebukuro projects) ・ Made Australian grain company a subsidiary (Feb.2014) ・ Invested in sugar milling business in Thailand (Apr. 2014)
・ Established private REIT (Aug. 2014)
・ Started to joint operation in telecommunications business in Myanmar (Sept. 2014) ・ Sold real estate properties including Queen’s Square Yokohama, part of Sumitomo Building etc.
(unit: billions of yen)
2013
Results
Gross profit 284.9
Operating profit 39.5
Share of profit of
Investments accounted for
using the equity method39.8
1Q 2Q 3Q 4Q9.6 12.6 1.3 24.4
Basic profit 58.4
Total assets 1,903.81,871.2
56.5
2014
Results
288.7
40.3
Profit/loss(-) for the year
attributable to owners of the
parent54.4
33.8
47.8(-7.5)*
*1 Shares in equity of the segment were 35 % in Mar.2013-Jan.2014 and 70% after Feb.2014. *2 As the consolidated period was changed, the results show equity in earnings of Mar. 2013-Mar. 2014 for FY2013 and Apr. 2014-Mar. 2015 for FY2014.
*The amount of impairment loss
36
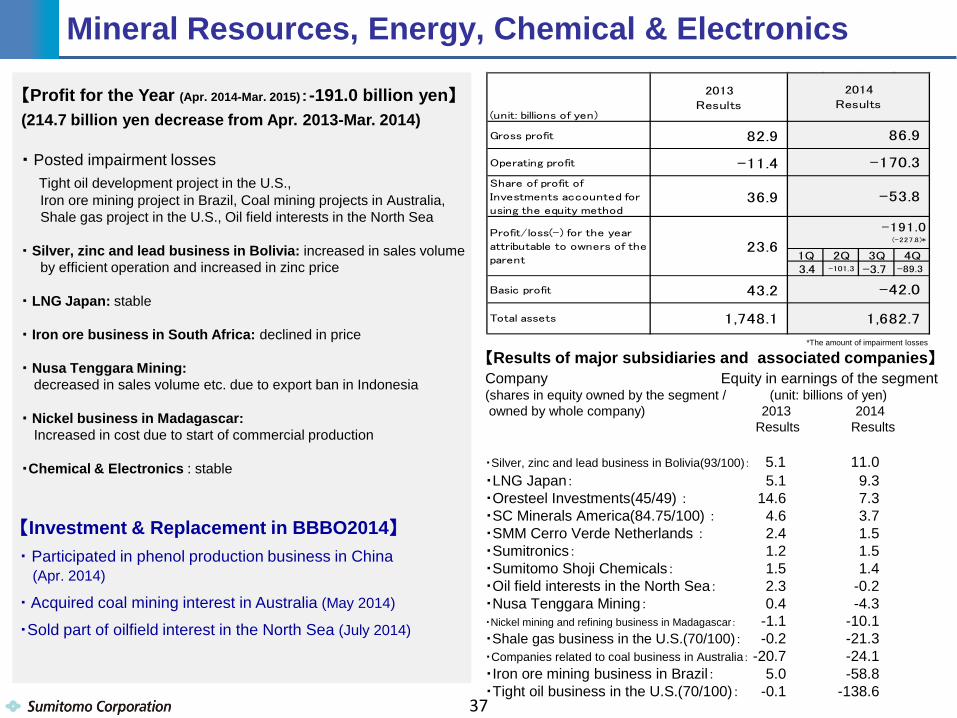
Mineral Resources, Energy, Chemical & Electronics
【Results of major subsidiaries and associated companies】 Company Equity in earnings of the segment (shares in equity owned by the segment / (unit: billions of yen) owned by whole company) 2013 2014 Results Results
・Silver, zinc and lead business in Bolivia(93/100): 5.1 11.0 ・LNG Japan: 5.1 9.3 ・Oresteel Investments(45/49) : 14.6 7.3 ・SC Minerals America(84.75/100) : 4.6 3.7 ・SMM Cerro Verde Netherlands : 2.4 1.5 ・Sumitronics: 1.2 1.5 ・Sumitomo Shoji Chemicals: 1.5 1.4 ・Oil field interests in the North Sea: 2.3 -0.2 ・Nusa Tenggara Mining: 0.4 -4.3 ・Nickel mining and refining business in Madagascar: -1.1 -10.1 ・Shale gas business in the U.S.(70/100): -0.2 -21.3 ・Companies related to coal business in Australia: -20.7 -24.1 ・Iron ore mining business in Brazil: 5.0 -58.8 ・Tight oil business in the U.S.(70/100): -0.1 -138.6
【Profit for the Year (Apr. 2014-Mar. 2015):-191.0 billion yen】 (214.7 billion yen decrease from Apr. 2013-Mar. 2014)
・ Posted impairment losses Tight oil development project in the U.S., Iron ore mining project in Brazil, Coal mining projects in Australia, Shale gas project in the U.S., Oil field interests in the North Sea ・ Silver, zinc and lead business in Bolivia: increased in sales volume by efficient operation and increased in zinc price ・ LNG Japan: stable ・ Iron ore business in South Africa: declined in price ・ Nusa Tenggara Mining: decreased in sales volume etc. due to export ban in Indonesia ・ Nickel business in Madagascar: Increased in cost due to start of commercial production ・Chemical & Electronics : stable
【Investment & Replacement in BBBO2014】
・ Participated in phenol production business in China (Apr. 2014)
・ Acquired coal mining interest in Australia (May 2014)
・Sold part of oilfield interest in the North Sea (July 2014)
(unit: billions of yen)
2013
Results
Gross profit 82.9
Operating profit -11.4
Share of profit of
Investments accounted for
using the equity method36.9
1Q 2Q 3Q 4Q3.4 -101.3 -3.7 -89.3
Basic profit 43.2
Total assets 1,682.71,748.1
-42.0
2014
Results
86.9
-53.8
Profit/loss(-) for the year
attributable to owners of the
parent23.6
-170.3
-191.0(-227.8)*
*The amount of impairment losses
37
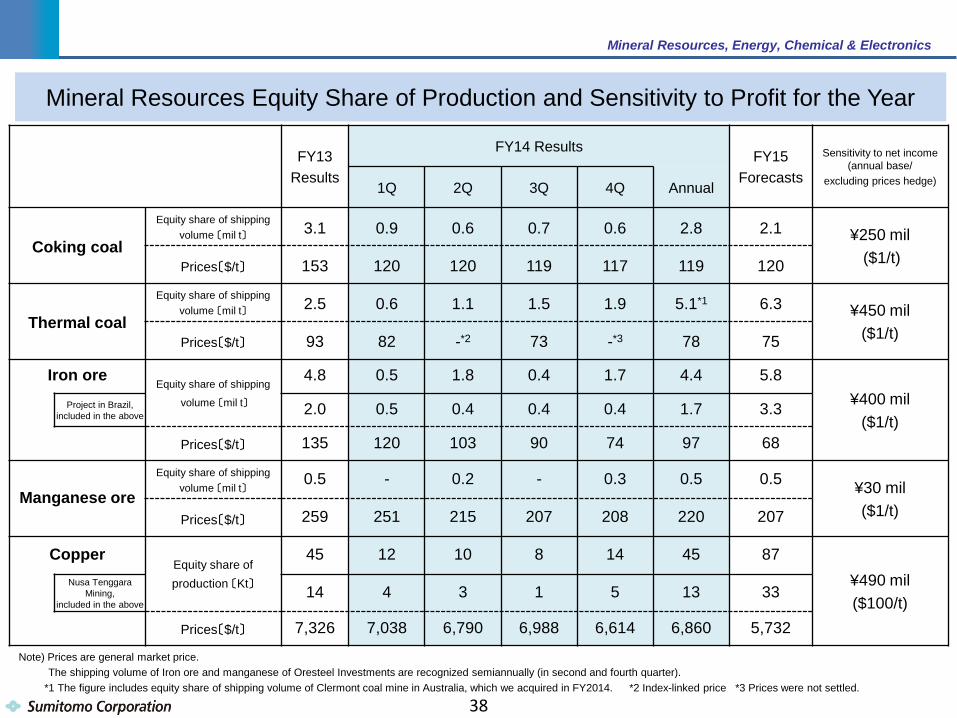
FY13 Results
FY14 Results FY15
Forecasts
Sensitivity to net income (annual base/
excluding prices hedge) 1Q 2Q 3Q 4Q Annual
Coking coal
Equity share of shipping volume 〔mil t〕 3.1 0.9 0.6 0.7 0.6 2.8 2.1 ¥250 mil
($1/t) Prices〔$/t〕 153 120 120 119 117 119 120
Thermal coal
Equity share of shipping volume 〔mil t〕 2.5 0.6 1.1 1.5 1.9 5.1*1 6.3 ¥450 mil
($1/t) Prices〔$/t〕 93 82 -*2 73 -*3 78 75
Iron ore Equity share of shipping
volume 〔mil t〕
4.8 0.5 1.8 0.4 1.7 4.4 5.8 ¥400 mil
($1/t) Project in Brazil,
included in the above 2.0 0.5 0.4 0.4 0.4 1.7 3.3
Prices〔$/t〕 135 120 103 90 74 97 68
Manganese ore Equity share of shipping
volume 〔mil t〕 0.5 - 0.2 - 0.3 0.5 0.5 ¥30 mil
($1/t) Prices〔$/t〕 259 251 215 207 208 220 207
Copper Equity share of production 〔Kt〕
45 12 10 8 14 45 87 ¥490 mil ($100/t)
Nusa Tenggara Mining,
included in the above 14 4 3 1 5 13 33
Prices〔$/t〕 7,326 7,038 6,790 6,988 6,614 6,860 5,732
Note) Prices are general market price. The shipping volume of Iron ore and manganese of Oresteel Investments are recognized semiannually (in second and fourth quarter). *1 The figure includes equity share of shipping volume of Clermont coal mine in Australia, which we acquired in FY2014. *2 Index-linked price *3 Prices were not settled.
Mineral Resources Equity Share of Production and Sensitivity to Profit for the Year
Mineral Resources, Energy, Chemical & Electronics
38
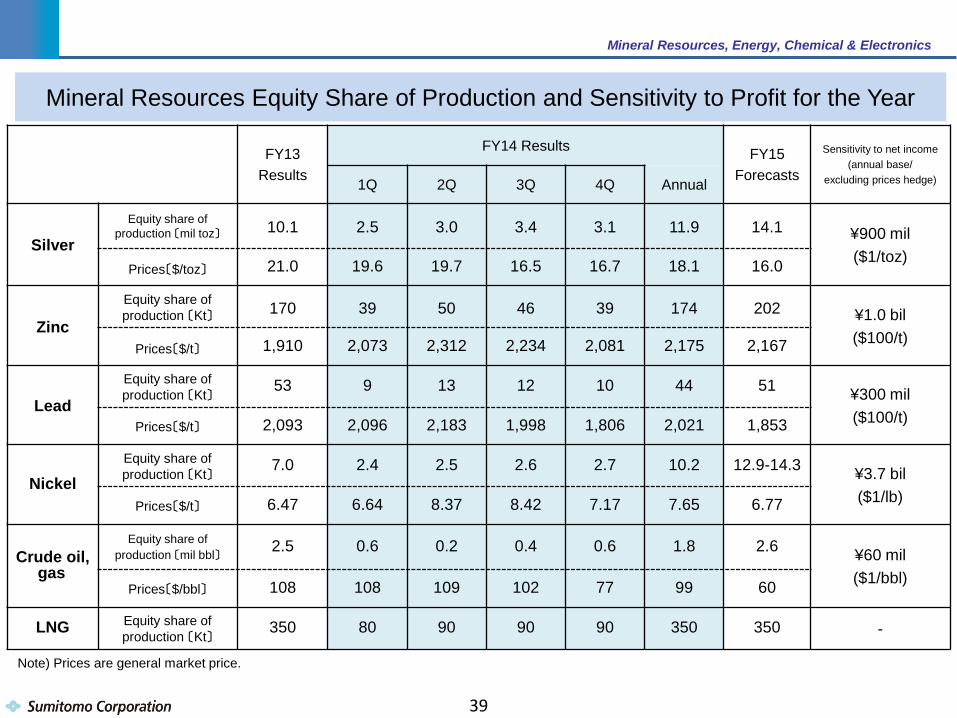
FY13 Results
FY14 Results FY15 Forecasts
Sensitivity to net income (annual base/
excluding prices hedge) 1Q 2Q 3Q 4Q Annual
Silver Equity share of
production 〔mil toz〕 10.1 2.5 3.0 3.4 3.1 11.9 14.1 ¥900 mil ($1/toz)
Prices〔$/toz〕 21.0 19.6 19.7 16.5 16.7 18.1 16.0
Zinc
Equity share of production 〔Kt〕 170 39 50 46 39 174 202 ¥1.0 bil
($100/t) Prices〔$/t〕 1,910 2,073 2,312 2,234 2,081 2,175 2,167
Lead Equity share of production 〔Kt〕 53 9 13 12 10 44 51 ¥300 mil
($100/t) Prices〔$/t〕 2,093 2,096 2,183 1,998 1,806 2,021 1,853
Nickel Equity share of production 〔Kt〕 7.0 2.4 2.5 2.6 2.7 10.2 12.9-14.3 ¥3.7 bil
($1/lb) Prices〔$/t〕 6.47 6.64 8.37 8.42 7.17 7.65 6.77
Crude oil, gas
Equity share of production 〔mil bbl〕 2.5 0.6 0.2 0.4 0.6 1.8 2.6 ¥60 mil
($1/bbl) Prices〔$/bbl〕 108 108 109 102 77 99 60
LNG Equity share of production 〔Kt〕 350 80 90 90 90 350 350 -
Note) Prices are general market price.
Mineral Resources Equity Share of Production and Sensitivity to Profit for the Year
Mineral Resources, Energy, Chemical & Electronics
39
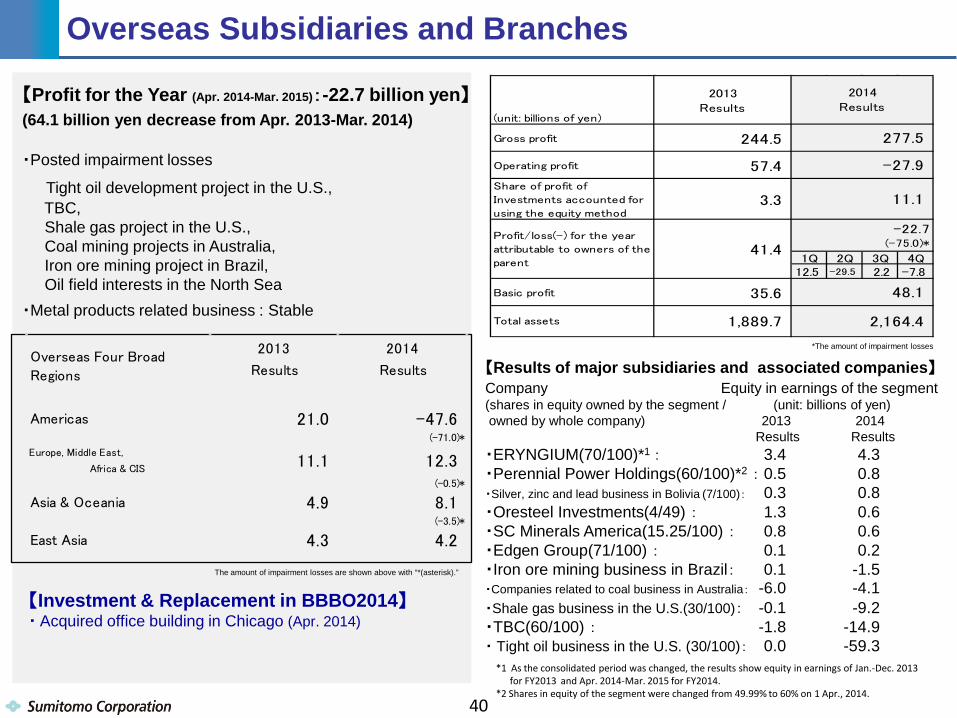
Overseas Subsidiaries and Branches
【Results of major subsidiaries and associated companies】 Company Equity in earnings of the segment (shares in equity owned by the segment / (unit: billions of yen) owned by whole company) 2013 2014 Results Results ・ERYNGIUM(70/100)*1 : 3.4 4.3 ・Perennial Power Holdings(60/100)*2 : 0.5 0.8 ・Silver, zinc and lead business in Bolivia (7/100): 0.3 0.8 ・Oresteel Investments(4/49) : 1.3 0.6
・SC Minerals America(15.25/100) : 0.8 0.6 ・Edgen Group(71/100) : 0.1 0.2 ・Iron ore mining business in Brazil: 0.1 -1.5 ・Companies related to coal business in Australia: -6.0 -4.1 ・Shale gas business in the U.S.(30/100): -0.1 -9.2 ・TBC(60/100) : -1.8 -14.9 ・ Tight oil business in the U.S. (30/100): 0.0 -59.3
2013 2014
Results Results
Americas 21.0 -47.6(-71.0)*
Europe, Middle East,
Africa & CIS11.1 12.3
(-0.5)*
Asia & Oceania 4.9 8.1(-3.5)*
East Asia 4.3 4.2
Overseas Four Broad
Regions
【Investment & Replacement in BBBO2014】 ・ Acquired office building in Chicago (Apr. 2014)
【Profit for the Year (Apr. 2014-Mar. 2015):-22.7 billion yen】 (64.1 billion yen decrease from Apr. 2013-Mar. 2014)
・Posted impairment losses
Tight oil development project in the U.S., TBC, Shale gas project in the U.S., Coal mining projects in Australia, Iron ore mining project in Brazil, Oil field interests in the North Sea ・Metal products related business : Stable
(unit: billions of yen)
2013
Results
Gross profit 244.5
Operating profit 57.4
Share of profit of
Investments accounted for
using the equity method3.3
1Q 2Q 3Q 4Q12.5 -29.5 2.2 -7.8
Basic profit 35.6
Total assets 2,164.41,889.7
48.1
2014
Results
277.5
11.1
Profit/loss(-) for the year
attributable to owners of the
parent41.4
-27.9
-22.7(-75.0)*
*1 As the consolidated period was changed, the results show equity in earnings of Jan.-Dec. 2013 for FY2013 and Apr. 2014-Mar. 2015 for FY2014. *2 Shares in equity of the segment were changed from 49.99% to 60% on 1 Apr., 2014.
*The amount of impairment losses
The amount of impairment losses are shown above with “*(asterisk).”
40
Medium-to long-term Strategy and Forecast
※On April 1, 2015 Tire Department was transferred from Media, Network, Lifestyle Related Goods & Services Business Unit to Transportation & Construction Systems Business Unit. The prior year results are also shown on a new organization basis accordingly.
41
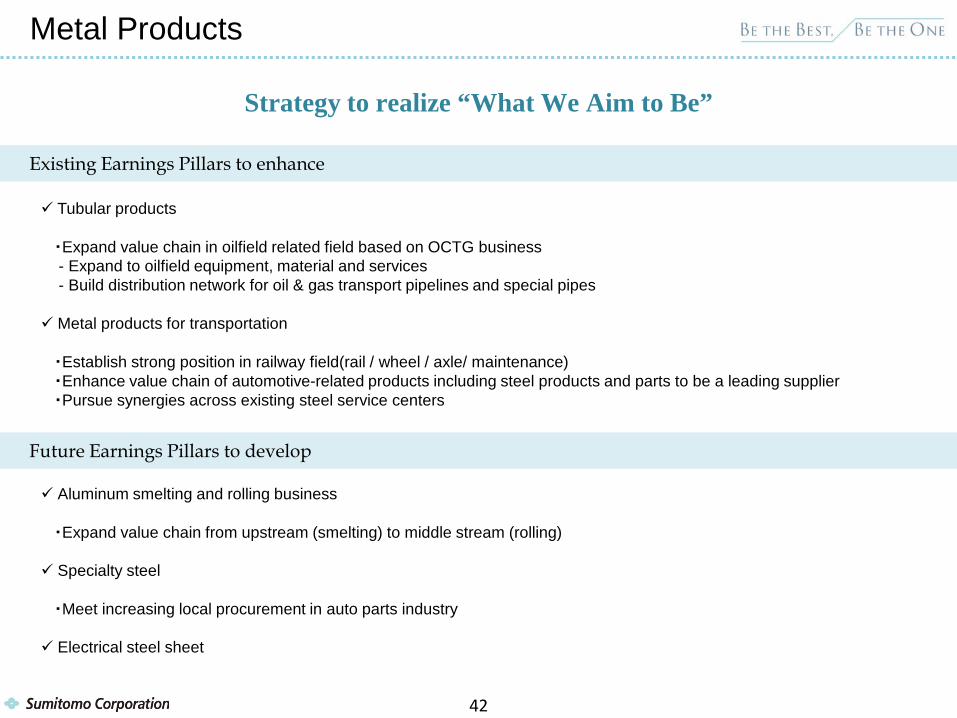
Metal Products
Tubular products ・Expand value chain in oilfield related field based on OCTG business - Expand to oilfield equipment, material and services - Build distribution network for oil & gas transport pipelines and special pipes Metal products for transportation ・Establish strong position in railway field(rail / wheel / axle/ maintenance) ・Enhance value chain of automotive-related products including steel products and parts to be a leading supplier ・Pursue synergies across existing steel service centers
Existing Earnings Pillars to enhance
Future Earnings Pillars to develop
Aluminum smelting and rolling business ・Expand value chain from upstream (smelting) to middle stream (rolling) Specialty steel
・Meet increasing local procurement in auto parts industry Electrical steel sheet
Strategy to realize “What We Aim to Be”
42
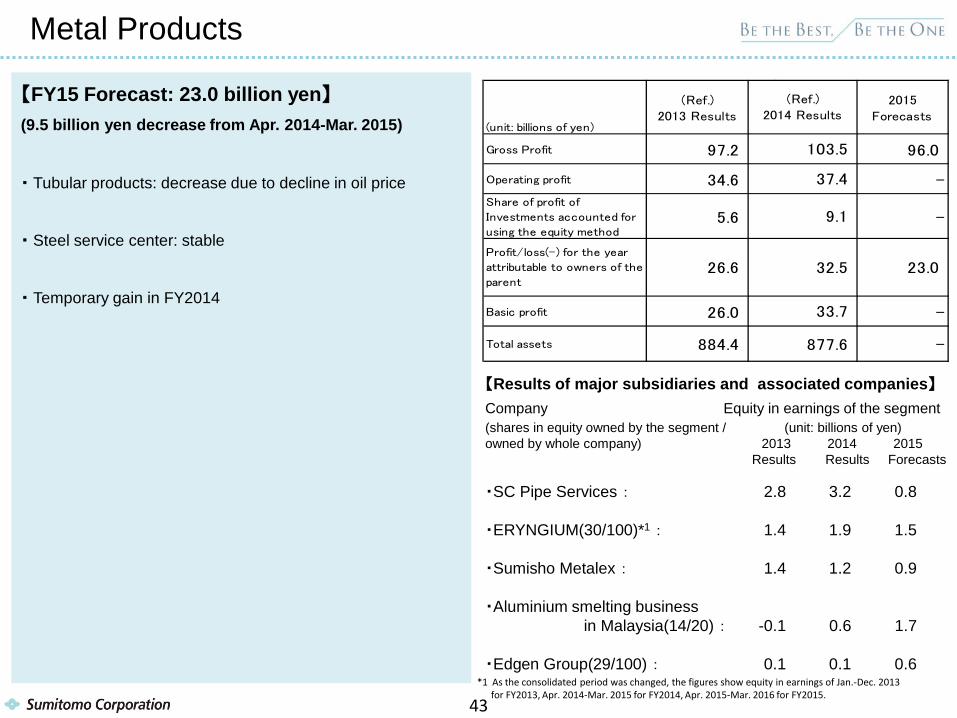
(unit: billions of yen)
(Ref.)
2013 Results
2015
Forecasts
Gross Profit 97.2 96.0
Operating profit 34.6 -
Share of profit of
Investments accounted for
using the equity method5.6 -
Basic profit 26.0 -
23.0
Total assets -877.6
33.7
32.5
884.4
(Ref.)
2014 Results
103.5
9.1
Profit/loss(-) for the year
attributable to owners of the
parent26.6
37.4
【Results of major subsidiaries and associated companies】 Company Equity in earnings of the segment (shares in equity owned by the segment / (unit: billions of yen) owned by whole company) 2013 2014 2015 Results Results Forecasts ・SC Pipe Services : 2.8 3.2 0.8 ・ERYNGIUM(30/100)*1 : 1.4 1.9 1.5 ・Sumisho Metalex : 1.4 1.2 0.9 ・Aluminium smelting business in Malaysia(14/20) : -0.1 0.6 1.7 ・Edgen Group(29/100) : 0.1 0.1 0.6
【FY15 Forecast: 23.0 billion yen】 (9.5 billion yen decrease from Apr. 2014-Mar. 2015)
・ Tubular products: decrease due to decline in oil price
・ Steel service center: stable
・ Temporary gain in FY2014
Metal Products
*1 As the consolidated period was changed, the figures show equity in earnings of Jan.-Dec. 2013 for FY2013, Apr. 2014-Mar. 2015 for FY2014, Apr. 2015-Mar. 2016 for FY2015.
43
Transportation & Construction Systems
Strategy to realize “What We Aim to Be”
Existing Earnings Pillars to enhance
Future Earnings Pillars to develop
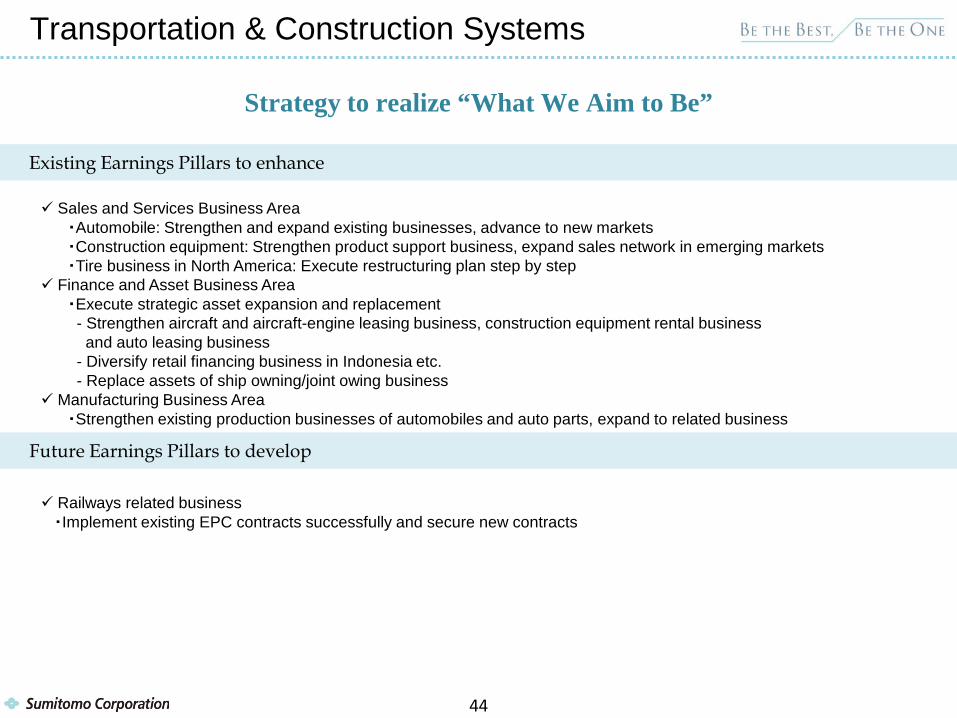
Railways related business ・Implement existing EPC contracts successfully and secure new contracts
Sales and Services Business Area ・Automobile: Strengthen and expand existing businesses, advance to new markets ・Construction equipment: Strengthen product support business, expand sales network in emerging markets ・Tire business in North America: Execute restructuring plan step by step Finance and Asset Business Area ・Execute strategic asset expansion and replacement - Strengthen aircraft and aircraft-engine leasing business, construction equipment rental business and auto leasing business - Diversify retail financing business in Indonesia etc. - Replace assets of ship owning/joint owing business Manufacturing Business Area ・Strengthen existing production businesses of automobiles and auto parts, expand to related business
44
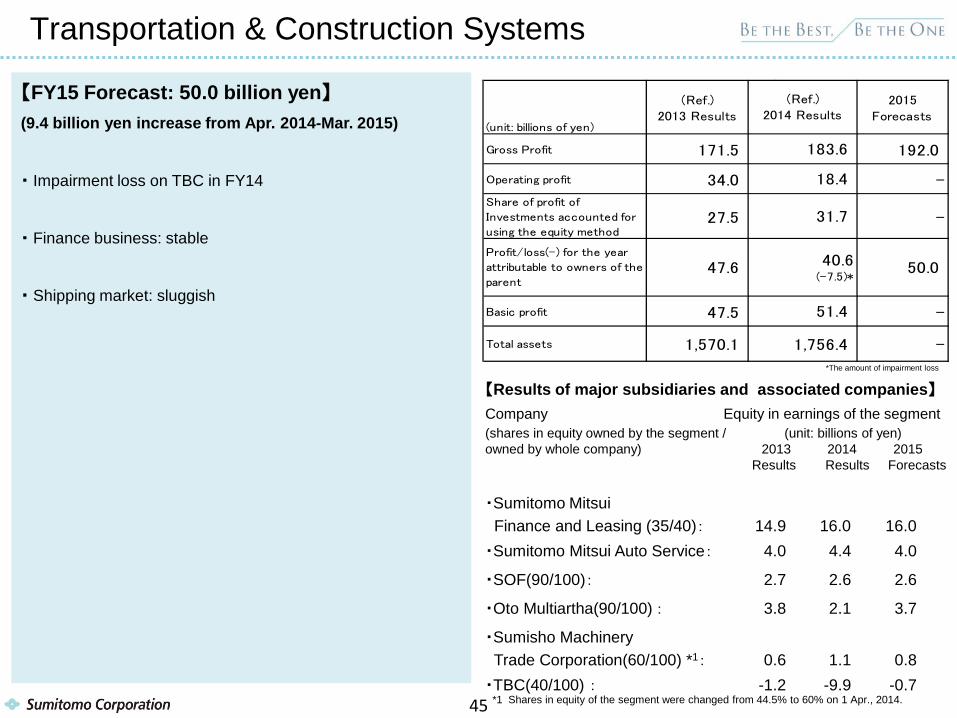
【FY15 Forecast: 50.0 billion yen】 (9.4 billion yen increase from Apr. 2014-Mar. 2015)
・ Impairment loss on TBC in FY14
・ Finance business: stable
・ Shipping market: sluggish
【Results of major subsidiaries and associated companies】 Company Equity in earnings of the segment (shares in equity owned by the segment / (unit: billions of yen) owned by whole company) 2013 2014 2015 Results Results Forecasts
・Sumitomo Mitsui Finance and Leasing (35/40): 14.9 16.0 16.0 ・Sumitomo Mitsui Auto Service: 4.0 4.4 4.0
・SOF(90/100): 2.7 2.6 2.6
・Oto Multiartha(90/100) : 3.8 2.1 3.7
・Sumisho Machinery Trade Corporation(60/100) *1: 0.6 1.1 0.8 ・TBC(40/100) : -1.2 -9.9 -0.7
Transportation & Construction Systems
*1 Shares in equity of the segment were changed from 44.5% to 60% on 1 Apr., 2014.
(unit: billions of yen)
(Ref.)
2013 Results
2015
Forecasts
Gross Profit 171.5 192.0
Operating profit 34.0 -
Share of profit of
Investments accounted for
using the equity method27.5 -
Basic profit 47.5 -
50.0
Total assets -1,756.4
51.4
40.6(-7.5)*
1,570.1
(Ref.)
2014 Results
183.6
31.7
Profit/loss(-) for the year
attributable to owners of the
parent47.6
18.4
*The amount of impairment loss
45
Environment & Infrastructure
Strategy to realize “What We Aim to Be”
Existing Earnings Pillars to enhance
Future Earnings Pillars to develop
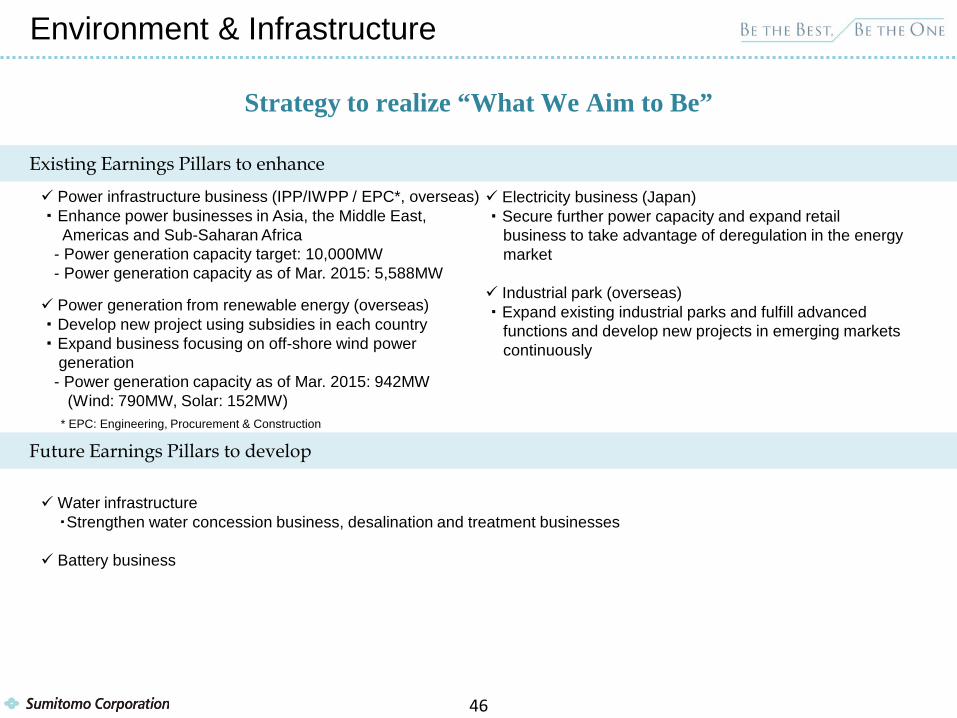
Water infrastructure ・Strengthen water concession business, desalination and treatment businesses
Battery business
Power infrastructure business (IPP/IWPP / EPC*, overseas) ・ Enhance power businesses in Asia, the Middle East, Americas and Sub-Saharan Africa - Power generation capacity target: 10,000MW - Power generation capacity as of Mar. 2015: 5,588MW
Power generation from renewable energy (overseas) ・ Develop new project using subsidies in each country ・ Expand business focusing on off-shore wind power generation - Power generation capacity as of Mar. 2015: 942MW (Wind: 790MW, Solar: 152MW)
* EPC: Engineering, Procurement & Construction
Electricity business (Japan) ・ Secure further power capacity and expand retail business to take advantage of deregulation in the energy market Industrial park (overseas) ・ Expand existing industrial parks and fulfill advanced functions and develop new projects in emerging markets continuously
46
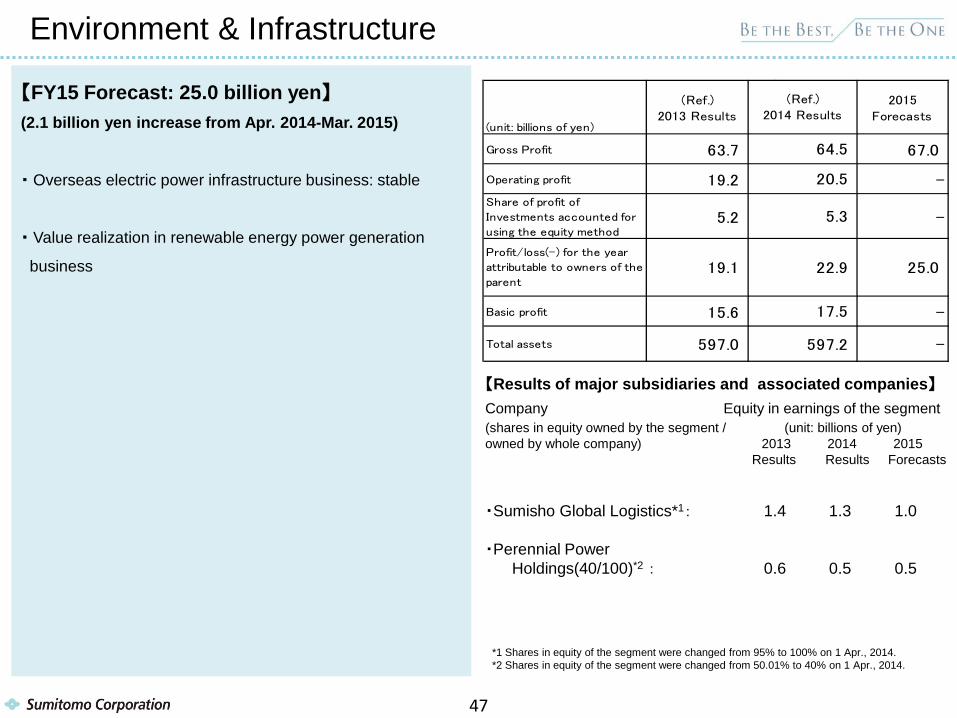
【FY15 Forecast: 25.0 billion yen】 (2.1 billion yen increase from Apr. 2014-Mar. 2015)
・ Overseas electric power infrastructure business: stable
・ Value realization in renewable energy power generation
business
【Results of major subsidiaries and associated companies】 Company Equity in earnings of the segment (shares in equity owned by the segment / (unit: billions of yen) owned by whole company) 2013 2014 2015 Results Results Forecasts ・Sumisho Global Logistics*1: 1.4 1.3 1.0 ・Perennial Power Holdings(40/100)*2 : 0.6 0.5 0.5
Environment & Infrastructure
*1 Shares in equity of the segment were changed from 95% to 100% on 1 Apr., 2014. *2 Shares in equity of the segment were changed from 50.01% to 40% on 1 Apr., 2014.
(unit: billions of yen)
(Ref.)
2013 Results
2015
Forecasts
Gross Profit 63.7 67.0
Operating profit 19.2 -
Share of profit of
Investments accounted for
using the equity method5.2 -
Basic profit 15.6 -
25.0
Total assets -597.2
17.5
22.9
597.0
(Ref.)
2014 Results
64.5
5.3
Profit/loss(-) for the year
attributable to owners of the
parent19.1
20.5
47
Media, Network, Lifestyle Related Goods & Services
Strategy to realize “What We Aim to Be”
Existing Earnings Pillars to enhance
Future Earnings Pillars to develop
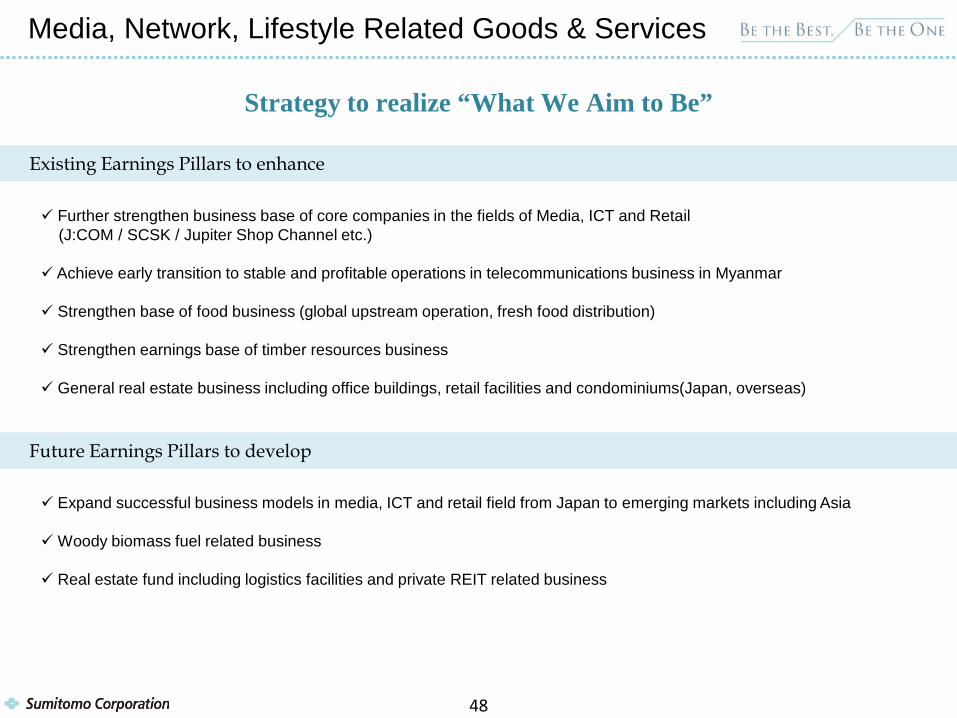
Expand successful business models in media, ICT and retail field from Japan to emerging markets including Asia
Woody biomass fuel related business Real estate fund including logistics facilities and private REIT related business
Further strengthen business base of core companies in the fields of Media, ICT and Retail (J:COM / SCSK / Jupiter Shop Channel etc.)
Achieve early transition to stable and profitable operations in telecommunications business in Myanmar
Strengthen base of food business (global upstream operation, fresh food distribution)
Strengthen earnings base of timber resources business
General real estate business including office buildings, retail facilities and condominiums(Japan, overseas)
48
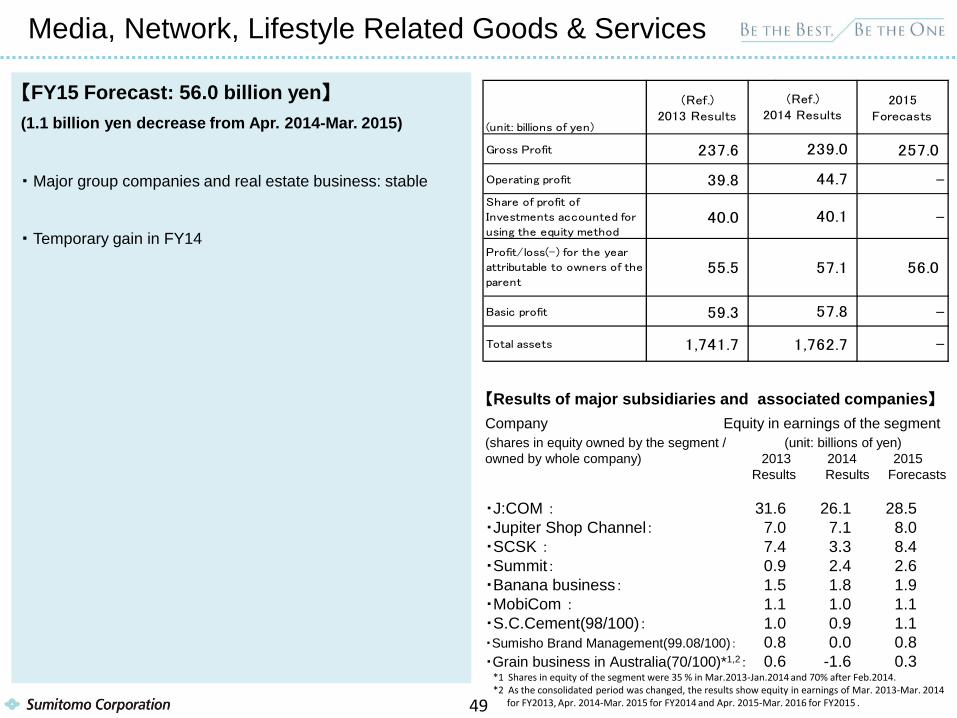
【FY15 Forecast: 56.0 billion yen】 (1.1 billion yen decrease from Apr. 2014-Mar. 2015)
・ Major group companies and real estate business: stable
・ Temporary gain in FY14
【Results of major subsidiaries and associated companies】 Company Equity in earnings of the segment (shares in equity owned by the segment / (unit: billions of yen) owned by whole company) 2013 2014 2015 Results Results Forecasts ・J:COM : 31.6 26.1 28.5 ・Jupiter Shop Channel: 7.0 7.1 8.0 ・SCSK : 7.4 3.3 8.4 ・Summit: 0.9 2.4 2.6 ・Banana business: 1.5 1.8 1.9 ・MobiCom : 1.1 1.0 1.1 ・S.C.Cement(98/100): 1.0 0.9 1.1 ・Sumisho Brand Management(99.08/100): 0.8 0.0 0.8 ・Grain business in Australia(70/100)*1,2: 0.6 -1.6 0.3
Media, Network, Lifestyle Related Goods & Services
(unit: billions of yen)
(Ref.)
2013 Results
2015
Forecasts
Gross Profit 237.6 257.0
Operating profit 39.8 -
Share of profit of
Investments accounted for
using the equity method40.0 -
Basic profit 59.3 -
56.0
Total assets -1,762.7
57.8
57.1
1,741.7
(Ref.)
2014 Results
239.0
40.1
Profit/loss(-) for the year
attributable to owners of the
parent55.5
44.7
*1 Shares in equity of the segment were 35 % in Mar.2013-Jan.2014 and 70% after Feb.2014. *2 As the consolidated period was changed, the results show equity in earnings of Mar. 2013-Mar. 2014 for FY2013, Apr. 2014-Mar. 2015 for FY2014 and Apr. 2015-Mar. 2016 for FY2015 . 49
Future Earnings Pillars to develop
Existing Earnings Pillars to enhance
Mineral Resources, Energy, Chemical & Electronics
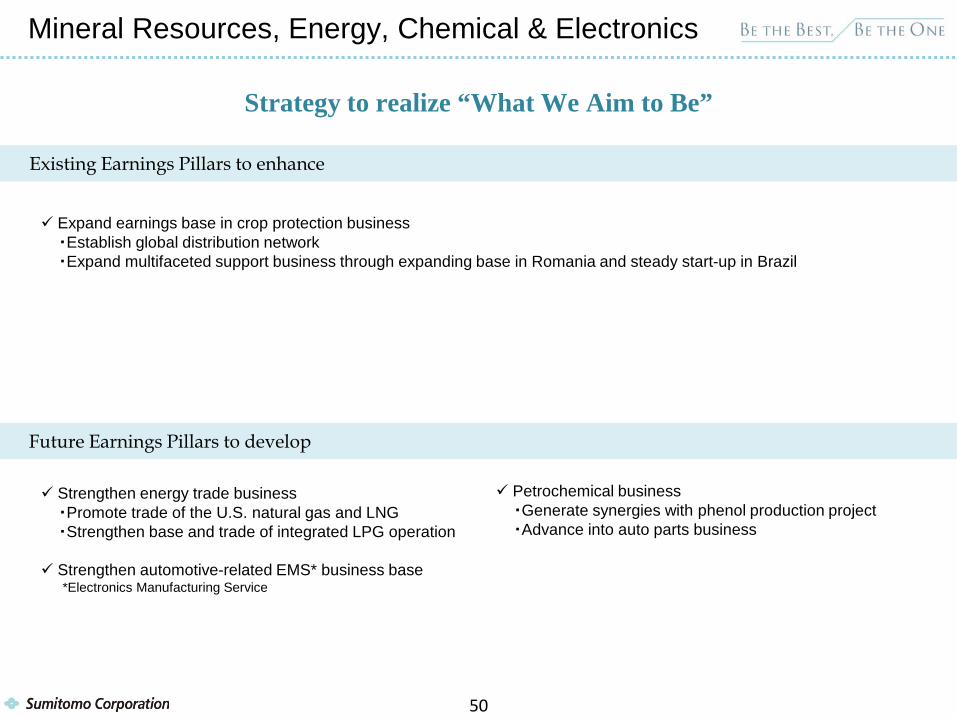
Strategy to realize “What We Aim to Be”
Expand earnings base in crop protection business ・Establish global distribution network ・Expand multifaceted support business through expanding base in Romania and steady start-up in Brazil
Strengthen energy trade business ・Promote trade of the U.S. natural gas and LNG ・Strengthen base and trade of integrated LPG operation
Strengthen automotive-related EMS* business base *Electronics Manufacturing Service
Petrochemical business ・Generate synergies with phenol production project ・Advance into auto parts business
50
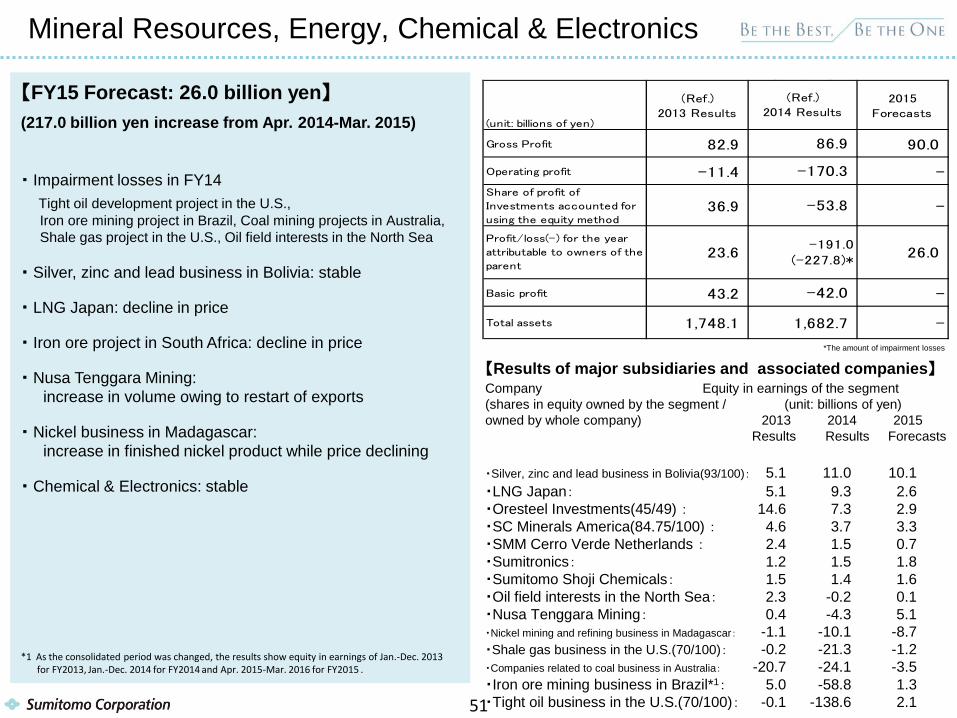
【FY15 Forecast: 26.0 billion yen】 (217.0 billion yen increase from Apr. 2014-Mar. 2015)
・ Impairment losses in FY14 Tight oil development project in the U.S., Iron ore mining project in Brazil, Coal mining projects in Australia, Shale gas project in the U.S., Oil field interests in the North Sea ・ Silver, zinc and lead business in Bolivia: stable
・ LNG Japan: decline in price
・ Iron ore project in South Africa: decline in price
・ Nusa Tenggara Mining: increase in volume owing to restart of exports
・ Nickel business in Madagascar: increase in finished nickel product while price declining
・ Chemical & Electronics: stable
【Results of major subsidiaries and associated companies】 Company Equity in earnings of the segment (shares in equity owned by the segment / (unit: billions of yen) owned by whole company) 2013 2014 2015 Results Results Forecasts ・Silver, zinc and lead business in Bolivia(93/100): 5.1 11.0 10.1 ・LNG Japan: 5.1 9.3 2.6 ・Oresteel Investments(45/49) : 14.6 7.3 2.9 ・SC Minerals America(84.75/100) : 4.6 3.7 3.3 ・SMM Cerro Verde Netherlands : 2.4 1.5 0.7 ・Sumitronics: 1.2 1.5 1.8 ・Sumitomo Shoji Chemicals: 1.5 1.4 1.6 ・Oil field interests in the North Sea: 2.3 -0.2 0.1 ・Nusa Tenggara Mining: 0.4 -4.3 5.1 ・Nickel mining and refining business in Madagascar: -1.1 -10.1 -8.7 ・Shale gas business in the U.S.(70/100): -0.2 -21.3 -1.2 ・Companies related to coal business in Australia: -20.7 -24.1 -3.5 ・Iron ore mining business in Brazil*1: 5.0 -58.8 1.3 ・Tight oil business in the U.S.(70/100): -0.1 -138.6 2.1
Mineral Resources, Energy, Chemical & Electronics
*The amount of impairment losses
(unit: billions of yen)
(Ref.)
2013 Results
2015
Forecasts
Gross Profit 82.9 90.0
Operating profit -11.4 -
Share of profit of
Investments accounted for
using the equity method36.9 -
Basic profit 43.2 -
26.0
Total assets -1,682.7
-42.0
-191.0(-227.8)*
1,748.1
(Ref.)
2014 Results
86.9
-53.8
Profit/loss(-) for the year
attributable to owners of the
parent23.6
-170.3
*1 As the consolidated period was changed, the results show equity in earnings of Jan.-Dec. 2013 for FY2013, Jan.-Dec. 2014 for FY2014 and Apr. 2015-Mar. 2016 for FY2015 .
51
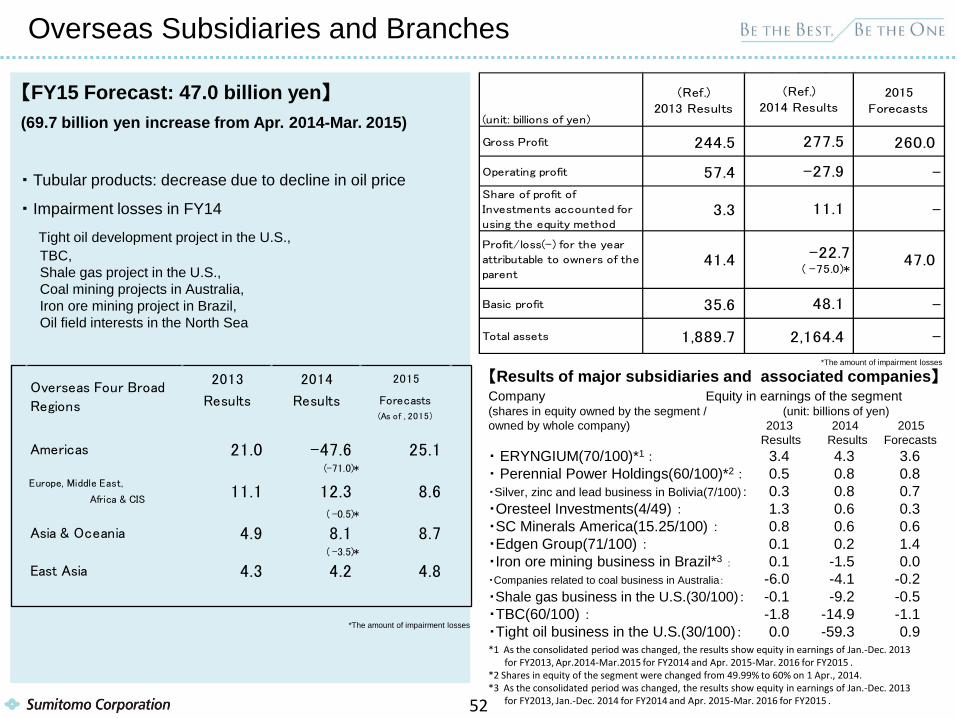
【FY15 Forecast: 47.0 billion yen】 (69.7 billion yen increase from Apr. 2014-Mar. 2015)
・ Tubular products: decrease due to decline in oil price
・ Impairment losses in FY14
Tight oil development project in the U.S., TBC, Shale gas project in the U.S., Coal mining projects in Australia, Iron ore mining project in Brazil, Oil field interests in the North Sea
Overseas Subsidiaries and Branches
2013 2014 2015
Results Results Forecasts(As of , 2015)
Americas 21.0 -47.6 25.1(-71.0)*
Europe, Middle East,
Africa & CIS11.1 12.3 8.6
( -0.5)*
Asia & Oceania 4.9 8.1 8.7( -3.5)*
East Asia 4.3 4.2 4.8
Overseas Four Broad
Regions
(unit: billions of yen)
(Ref.)
2013 Results
2015
Forecasts
Gross Profit 244.5 260.0
Operating profit 57.4 -
Share of profit of
Investments accounted for
using the equity method3.3 -
Basic profit 35.6 -
47.0
Total assets -2,164.4
48.1
-22.7( -75.0)*
1,889.7
(Ref.)
2014 Results
277.5
11.1
Profit/loss(-) for the year
attributable to owners of the
parent41.4
-27.9
【Results of major subsidiaries and associated companies】 Company Equity in earnings of the segment (shares in equity owned by the segment / (unit: billions of yen) owned by whole company) 2013 2014 2015 Results Results Forecasts ・ ERYNGIUM(70/100)*1 : 3.4 4.3 3.6 ・ Perennial Power Holdings(60/100)*2 : 0.5 0.8 0.8 ・Silver, zinc and lead business in Bolivia(7/100): 0.3 0.8 0.7 ・Oresteel Investments(4/49) : 1.3 0.6 0.3 ・SC Minerals America(15.25/100) : 0.8 0.6 0.6 ・Edgen Group(71/100) : 0.1 0.2 1.4 ・Iron ore mining business in Brazil*3 : 0.1 -1.5 0.0 ・Companies related to coal business in Australia: -6.0 -4.1 -0.2 ・Shale gas business in the U.S.(30/100): -0.1 -9.2 -0.5 ・TBC(60/100) : -1.8 -14.9 -1.1 ・Tight oil business in the U.S.(30/100): 0.0 -59.3 0.9
*The amount of impairment losses
*1 As the consolidated period was changed, the results show equity in earnings of Jan.-Dec. 2013 for FY2013, Apr.2014-Mar.2015 for FY2014 and Apr. 2015-Mar. 2016 for FY2015 . *2 Shares in equity of the segment were changed from 49.99% to 60% on 1 Apr., 2014. *3 As the consolidated period was changed, the results show equity in earnings of Jan.-Dec. 2013 for FY2013, Jan.-Dec. 2014 for FY2014 and Apr. 2015-Mar. 2016 for FY2015 .
*The amount of impairment losses
52

<MEMO>
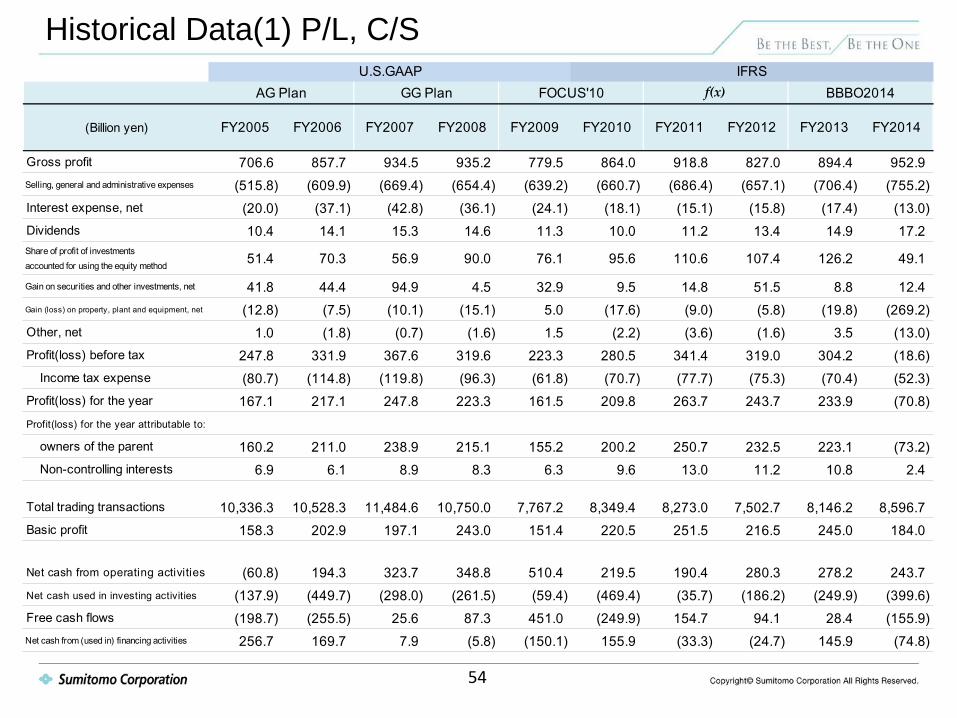
Historical Data(1) P/L, C/S
(Billion yen) FY2005 FY2006 FY2007 FY2008 FY2009 FY2010 FY2011 FY2012 FY2013 FY2014
Gross profit 706.6 857.7 934.5 935.2 779.5 864.0 918.8 827.0 894.4 952.9Selling, general and administrative expenses (515.8) (609.9) (669.4) (654.4) (639.2) (660.7) (686.4) (657.1) (706.4) (755.2)Interest expense, net (20.0) (37.1) (42.8) (36.1) (24.1) (18.1) (15.1) (15.8) (17.4) (13.0)Dividends 10.4 14.1 15.3 14.6 11.3 10.0 11.2 13.4 14.9 17.2Share of profit of investmentsaccounted for using the equity method 51.4 70.3 56.9 90.0 76.1 95.6 110.6 107.4 126.2 49.1
Gain on securities and other investments, net 41.8 44.4 94.9 4.5 32.9 9.5 14.8 51.5 8.8 12.4Gain (loss) on property, plant and equipment, net (12.8) (7.5) (10.1) (15.1) 5.0 (17.6) (9.0) (5.8) (19.8) (269.2)Other, net 1.0 (1.8) (0.7) (1.6) 1.5 (2.2) (3.6) (1.6) 3.5 (13.0)Profit(loss) before tax 247.8 331.9 367.6 319.6 223.3 280.5 341.4 319.0 304.2 (18.6) Income tax expense (80.7) (114.8) (119.8) (96.3) (61.8) (70.7) (77.7) (75.3) (70.4) (52.3)Profit(loss) for the year 167.1 217.1 247.8 223.3 161.5 209.8 263.7 243.7 233.9 (70.8)Profit(loss) for the year attributable to:
owners of the parent 160.2 211.0 238.9 215.1 155.2 200.2 250.7 232.5 223.1 (73.2) Non-controlling interests 6.9 6.1 8.9 8.3 6.3 9.6 13.0 11.2 10.8 2.4
Total trading transactions 10,336.3 10,528.3 11,484.6 10,750.0 7,767.2 8,349.4 8,273.0 7,502.7 8,146.2 8,596.7Basic profit 158.3 202.9 197.1 243.0 151.4 220.5 251.5 216.5 245.0 184.0
Net cash from operating activities (60.8) 194.3 323.7 348.8 510.4 219.5 190.4 280.3 278.2 243.7Net cash used in investing activities (137.9) (449.7) (298.0) (261.5) (59.4) (469.4) (35.7) (186.2) (249.9) (399.6)Free cash flows (198.7) (255.5) 25.6 87.3 451.0 (249.9) 154.7 94.1 28.4 (155.9)Net cash from (used in) financing activities 256.7 169.7 7.9 (5.8) (150.1) 155.9 (33.3) (24.7) 145.9 (74.8)
U.S.GAAP IFRSGG Plan FOCUS'10 f(x) BBBO2014AG Plan
54
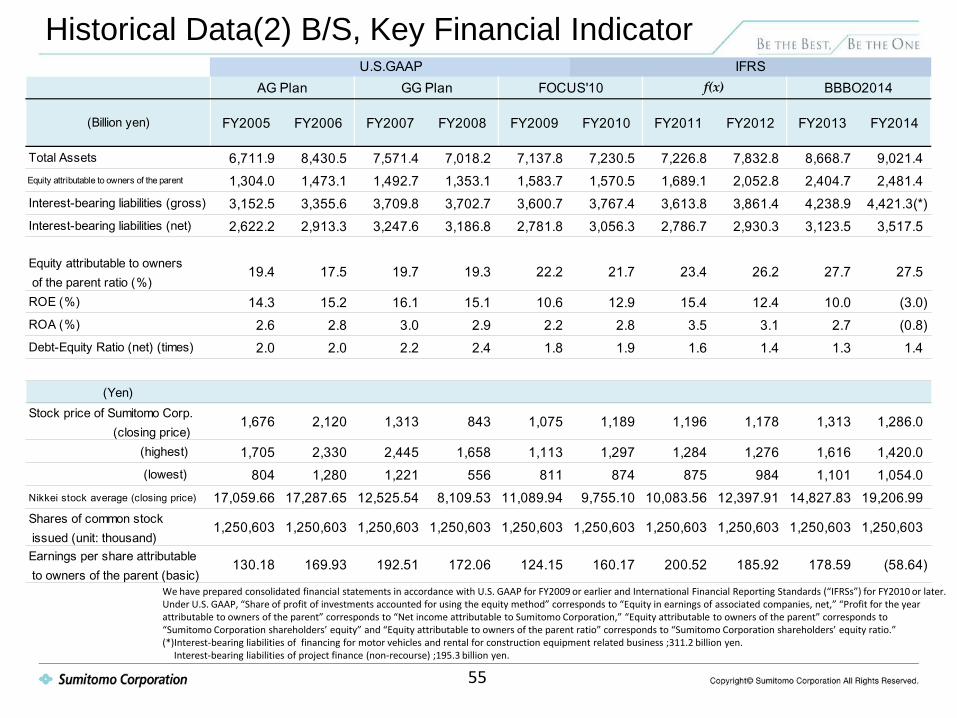
Historical Data(2) B/S, Key Financial Indicator
(Billion yen) FY2005 FY2006 FY2007 FY2008 FY2009 FY2010 FY2011 FY2012 FY2013 FY2014
Total Assets 6,711.9 8,430.5 7,571.4 7,018.2 7,137.8 7,230.5 7,226.8 7,832.8 8,668.7 9,021.4Equity attributable to owners of the parent 1,304.0 1,473.1 1,492.7 1,353.1 1,583.7 1,570.5 1,689.1 2,052.8 2,404.7 2,481.4Interest-bearing liabilities (gross) 3,152.5 3,355.6 3,709.8 3,702.7 3,600.7 3,767.4 3,613.8 3,861.4 4,238.9 4,421.3(*)Interest-bearing liabilities (net) 2,622.2 2,913.3 3,247.6 3,186.8 2,781.8 3,056.3 2,786.7 2,930.3 3,123.5 3,517.5
Equity attributable to owners of the parent ratio (%)
19.4 17.5 19.7 19.3 22.2 21.7 23.4 26.2 27.7 27.5
ROE (%) 14.3 15.2 16.1 15.1 10.6 12.9 15.4 12.4 10.0 (3.0)ROA (%) 2.6 2.8 3.0 2.9 2.2 2.8 3.5 3.1 2.7 (0.8)Debt-Equity Ratio (net) (times) 2.0 2.0 2.2 2.4 1.8 1.9 1.6 1.4 1.3 1.4
(Yen)Stock price of Sumitomo Corp. (closing price)
1,676 2,120 1,313 843 1,075 1,189 1,196 1,178 1,313 1,286.0
(highest) 1,705 2,330 2,445 1,658 1,113 1,297 1,284 1,276 1,616 1,420.0 (lowest) 804 1,280 1,221 556 811 874 875 984 1,101 1,054.0Nikkei stock average (closing price) 17,059.66 17,287.65 12,525.54 8,109.53 11,089.94 9,755.10 10,083.56 12,397.91 14,827.83 19,206.99Shares of common stock issued (unit: thousand)
1,250,603 1,250,603 1,250,603 1,250,603 1,250,603 1,250,603 1,250,603 1,250,603 1,250,603 1,250,603
Earnings per share attributable to owners of the parent (basic)
130.18 169.93 192.51 172.06 124.15 160.17 200.52 185.92 178.59 (58.64)
U.S.GAAP IFRSBBBO2014GG Plan FOCUS'10 f(x)AG Plan
We have prepared consolidated financial statements in accordance with U.S. GAAP for FY2009 or earlier and International Financial Reporting Standards (“IFRSs”) for FY2010 or later. Under U.S. GAAP, “Share of profit of investments accounted for using the equity method” corresponds to “Equity in earnings of associated companies, net,” “Profit for the year attributable to owners of the parent” corresponds to “Net income attributable to Sumitomo Corporation,” “Equity attributable to owners of the parent” corresponds to “Sumitomo Corporation shareholders’ equity” and “Equity attributable to owners of the parent ratio” corresponds to “Sumitomo Corporation shareholders’ equity ratio.” (*)Interest-bearing liabilities of financing for motor vehicles and rental for construction equipment related business ;311.2 billion yen. Interest-bearing liabilities of project finance (non-recourse) ;195.3 billion yen.
55
-4
-2
0
2
4
6
8
10
12
14
16
-100
-50
0
50
100
150
200
250
300
350
400
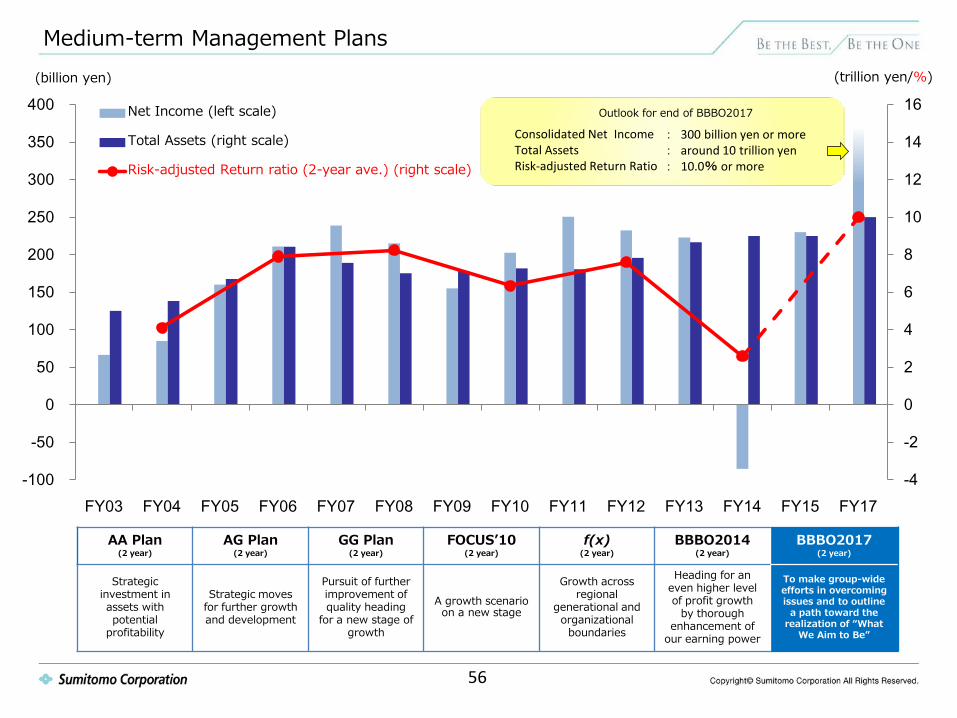
FY03 FY04 FY05 FY06 FY07 FY08 FY09 FY10 FY11 FY12 FY13 FY14 FY15 FY17
Net Income (left scale)
Total Assets (right scale)
Risk-adjusted Return ratio (2-year ave.) (right scale)
Outlook for end of BBBO2017
Consolidated Net Income Total Assets Risk-adjusted Return Ratio
Medium-term Management Plans
AA Plan (2 year)
AG Plan (2 year)
GG Plan (2 year)
FOCUS’10 (2 year)
f(x) (2 year)
BBBO2014 (2 year)
BBBO2017 (2 year)
Strategic investment in assets with potential
profitability
Strategic moves for further growth and development
Pursuit of further improvement of quality heading
for a new stage of growth
A growth scenario on a new stage
Growth across regional
generational and organizational
boundaries
Heading for an even higher level of profit growth
by thorough enhancement of
our earning power
To make group-wide efforts in overcoming issues and to outline
a path toward the realization of “What
We Aim to Be”
: 300 billion yen or more : around 10 trillion yen : 10.0% or more
(billion yen) (trillion yen/%)
56
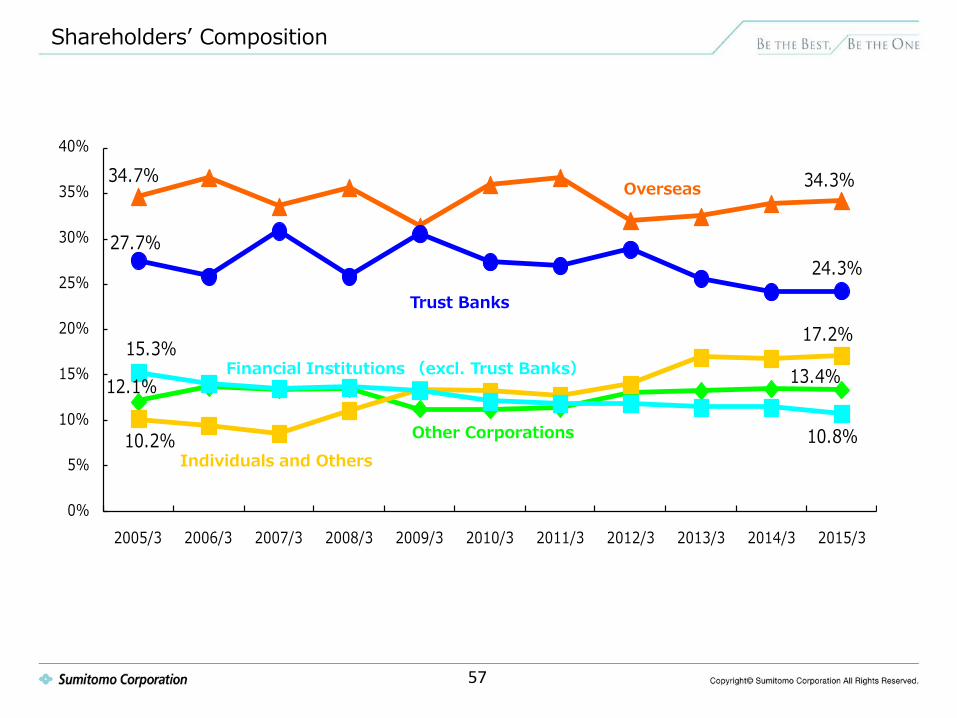
Shareholders’ Composition
12.1% 13.4%
10.2%
17.2%
34.7% 34.3%
15.3%
10.8%
27.7%24.3%
0%
5%
10%
15%
20%
25%
30%
35%
40%
2005/3 2006/3 2007/3 2008/3 2009/3 2010/3 2011/3 2012/3 2013/3 2014/3 2015/3
Financial Institutions (excl. Trust Banks)
Other Corporations
Trust Banks
Overseas
Individuals and Others
57