Embed Size (px)
Citation preview

Annual Results 2012 12th September 2012

Agenda
▲ EOH Update Jane Thomson
▲ Financial Results Highlights John King
▲ Enterprise Applications Ebrahim Laher
▲ Infrastructure Technologies Rob Godlonton
▲ Business Process Outsourcing Johan Van Jaarsveld
▲ Intelligent Infrastructure Zunaid Mayet
▲ Strategy and Way Forward Asher Bohbot

EOH Update Jane Thomson

Purpose
To provide technology, knowledge, skills and
organisational ability, critical to Africa’s development
and growth
To be an ethical, relevant force for good and to play
a positive role in our society, beyond normal
business

Vision
To be Africa’s best technology and knowledge
services provider
To work for
Partner with, and
Invest in

▲Best people
To attract, develop and retain the best people
▲Partner for life
To develop lifelong mutually beneficial partnerships with our
customers and technology partners
▲Right 1st time
To ensure excellent professional planning and execution.
Have pride in all we do
▲Sustainable transformation
To transform and manage diversity
▲Profitable growth
To grow top and bottom line similarly whilst remaining
entrepreneurial
EOH philosophy

Operating model

Portfolio
• Knowledge services
• Business operations
improvement
• IT strategy
• IT architecture
• Project management
• Change management
• Enterprise applications
• Information management
• IT security
• IT management & optimisation
• Software development &
integration
• Enterprise content
management
• Transformational outsourcing
• Cloud computing
• Converged communications
• IT infrastructure
• Rightshoring
• Intelligent infrastructure
• Business process outsourcing
• Human capital development
Design Build Operate
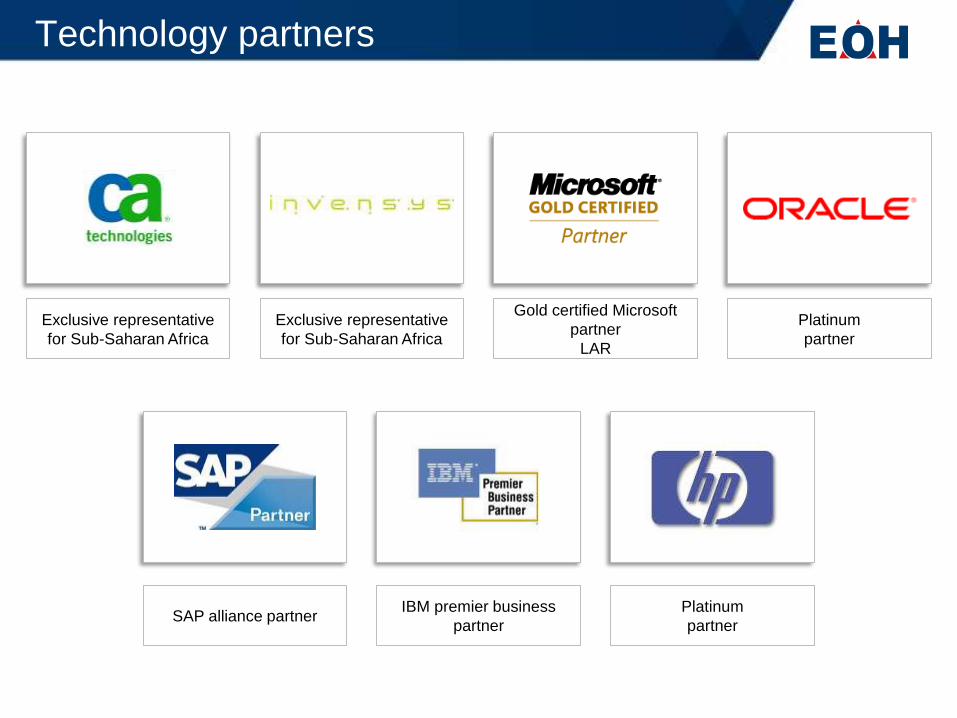
Technology partners
SAP alliance partner IBM premier business
partner
Platinum
partner
Exclusive representative
for Sub-Saharan Africa
Exclusive representative
for Sub-Saharan Africa
Gold certified Microsoft
partner
LAR
Platinum
partner

Technology partners
INFOR distributor and
implementation partner Value added reseller
Exclusive Southern African
distributor
Mimecast partner Gold partner Largest SYSPRO distributor
in Africa
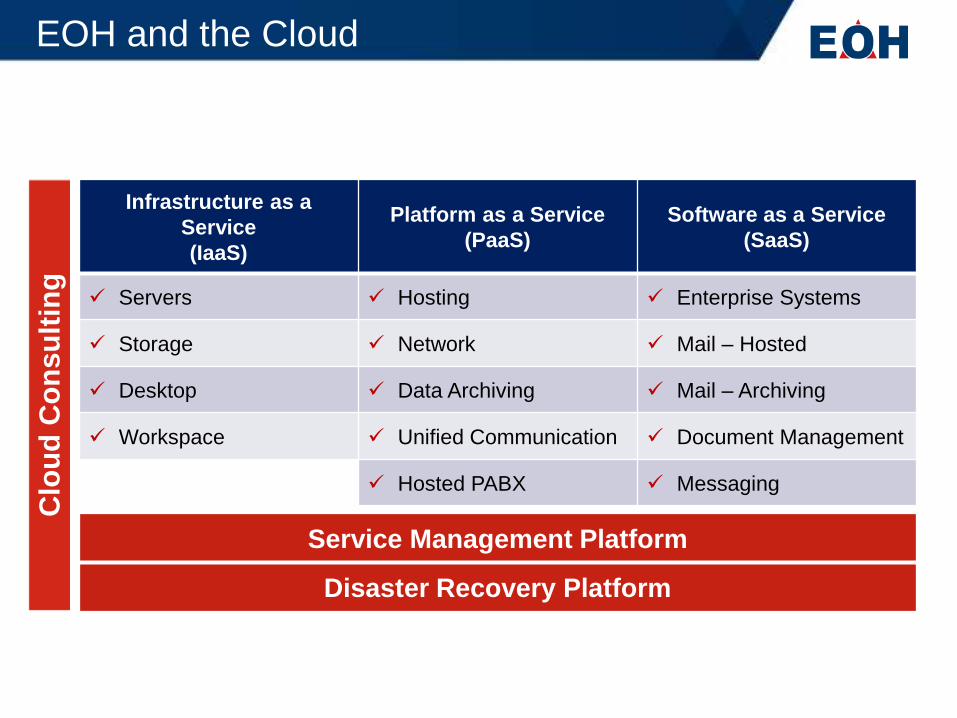
EOH and the Cloud
Infrastructure as a
Service
(IaaS)
Platform as a Service
(PaaS)
Software as a Service
(SaaS)
Servers Hosting Enterprise Systems
Storage Network Mail – Hosted
Desktop Data Archiving Mail – Archiving
Workspace Unified Communication Document Management
Hosted PABX Messaging
Service Management Platform
Disaster Recovery Platform
Clo
ud
Co
ns
ult
ing

Points of presence

Industries served
▲ We provide solutions in the following industries
• Financial Services
• Telecommunications
• Mining
• Manufacturing
• Public Sector
• Health
• Retail

Telecommunications Retail
Abridged client list (Cont.)
State owned entity's
Financial Services

Financial Results Highlights John King

Condensed Consolidated Statement of Comprehensive
Income for the year ended 31 July 2012
July
2012
July
2011
(R'000) (R'000) Change
Revenue 3 642 915 2 428 973 50.0%
Cost of sales (2 086 082) (1 528 392)
Gross margin 1 556 833 900 581
Operating Profit 356 622 233 011
Investment income 12 676 9 157
Finance costs (27 429) (7 646)
Share of losses from associate companies (43) -
Net impairment of assets (1 907) (132)
Profit before taxation 339 919 234 390 45.0%
Taxation (116 831) (85 986)
Profit for the period 223 088 148 404 50.3%
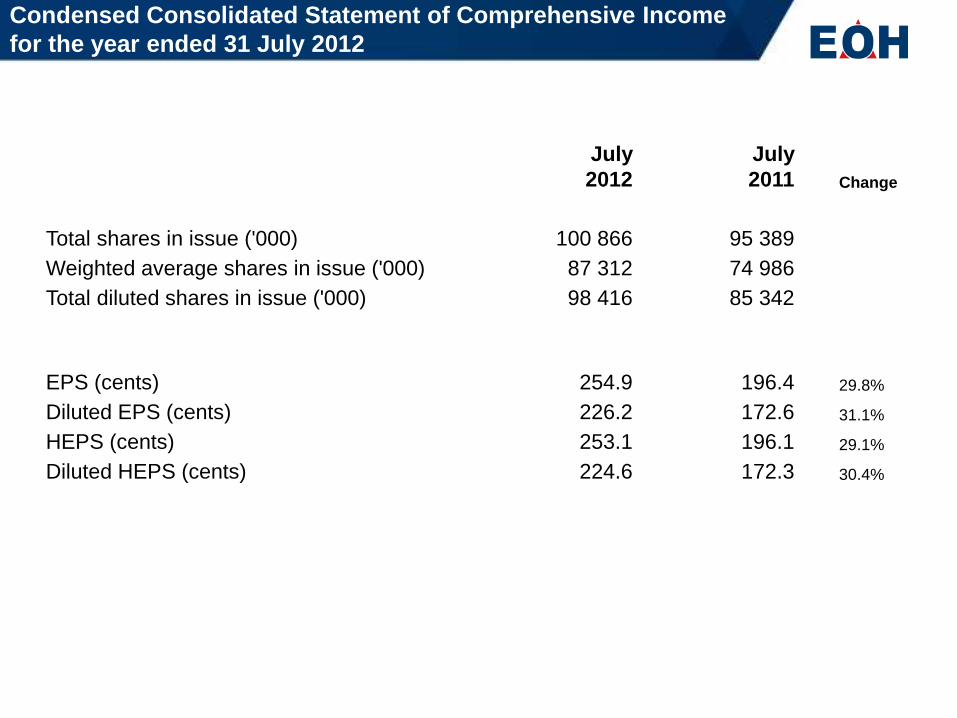
Condensed Consolidated Statement of Comprehensive Income
for the year ended 31 July 2012
July
2012
July
2011
Change
Total shares in issue ('000) 100 866 95 389
Weighted average shares in issue ('000) 87 312 74 986
Total diluted shares in issue ('000) 98 416 85 342
EPS (cents) 254.9 196.4 29.8%
Diluted EPS (cents) 226.2 172.6 31.1%
HEPS (cents) 253.1 196.1 29.1%
Diluted HEPS (cents) 224.6 172.3 30.4%

Condensed Consolidated Statement of
Financial Position as at 31 July 2012
July July
2012 2011
ASSETS (R'000) (R'000)
Non-current assets
Property, plant and equipment 183 856 80 325
Investment property 2 872 -
Goodwill and intangible assets 801 497 550 355
Finance lease receivables 36 447 -
Other financial assets 16 203 23 436
Deferred taxation assets 90 008 38 427
Current assets
Inventories 39 401 30 662
Finance lease obligations 26 360 -
Other financial assets 15 625 5 671
Taxation receivable 37 493 17 846
Trade and other receivables 809 429 569 817
Trade receivables 783 470 545 629
Other receivables 25 959 24 188
Cash and cash equivalents 451 867 321 507
Total Assets 2 511 058 1 638 046

Condensed Consolidated Statement of Financial Position
for the year ended 31 July 2012
July July
2012 2011
EQUITY AND LIABILITIES (R'000) (R'000)
Equity attributable to owners of the parent 1 128 435 709 926
Non-controlling interest 1 400 1 131
Total equity 1 129 835 711 057
Non-current liabilities
Finance lease obligations 2 748 3 714
Other financial liabilities 271 768 145 988
Deferred taxation liabilities 50 786 618
Current liabilities
Trade and other liabilities 906 753 677 245
Deferred revenue 107 565 68 261
Current taxation payable 41 603 31 163
Total liabilities 1 381 223 926 989
Total equity and liabilities 2 511 058 1 638 046
Net asset value per share (cents) 1118.7 744.2
Net tangible asset value per share (cents) 324.1 167.3

Condensed Consolidated Statement of
Cash Flows for the year to 31 July 2012
July 2012 July 2011
(R'000) (R'000)
Net income before tax and separately
disclosed items 339 919 234 390
Non-cash items 118 329 80 965
Working capital changes (15 710) (165 572)
Cash generated by operating activities 442 538 149 783
Investment income 12 676 9 157
Finance costs (27 429) (7 646)
Taxation paid (141 477) (129 609)
Net cash inflow from operating activities 286 308 21 685
Net cash (outflow) from investing activities (163 808) (52 436)
Net cash inflow from financing activities 7 860 85 587
Net cash movement for period 130 360 54 836
Cash at beginning of period 321 507 266 671
Cash at end of period 451 867 321 507

Revenue
R3 643m
PBT
R339.9m
EPS
254.9 cents
HEPS
253.1 cents
Up
45.0%
Up
29.8%
Up
29.1%
Up
50.0%
Financial highlights

Revenue (R millions)
Revenue growth
299,5
3 642,9
2 428,9
1 692,4
1 235,6
950,9
703,7 503,3 420,2

Headline EPS (cents)
Earnings growth
42,8
253.1
196,1
146,1 108,0
96,8
78,8
63,4 52,7

Services 64%
Business profile

Enterprise Applications
Ebrahim Laher

The business need
ERP
Company-wide,
real-time
capturing and
reporting
On-demand,
on-device
reporting
Centralised business data
Improved quality
and efficiency

Our business
EOH is the largest implementer of enterprise systems
and custom applications in SA
Over 900 ERP professionals
We have the largest footprint in Southern Africa for:
• SAP
• Microsoft
• Oracle
• Infor

Client example
EOH ERP Implementation Project
Key Project Highlights
A large South African
construction company

Scope – key figures
Item Value
Users 200 (growing to 400 in 2013)
Employees 4500
Countries South Africa, Mozambique, Namibia
Yellow Metal Machines >700
Project Sites 14
Branches 15
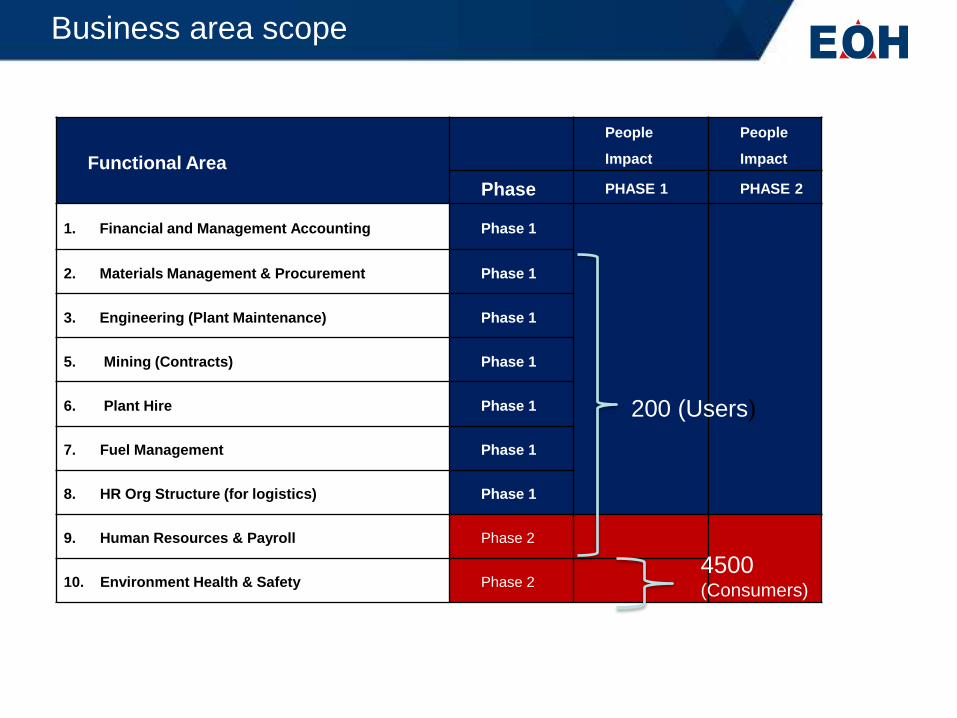
Project Scope (End User
Numbers) Functional Area
People
Impact
People
Impact
Phase PHASE 1 PHASE 2
1. Financial and Management Accounting Phase 1
2. Materials Management & Procurement Phase 1
3. Engineering (Plant Maintenance) Phase 1
5. Mining (Contracts) Phase 1
6. Plant Hire Phase 1
7. Fuel Management Phase 1
8. HR Org Structure (for logistics) Phase 1
9. Human Resources & Payroll Phase 2
10. Environment Health & Safety Phase 2
200 (Users)
4500 (Consumers)
Business area scope
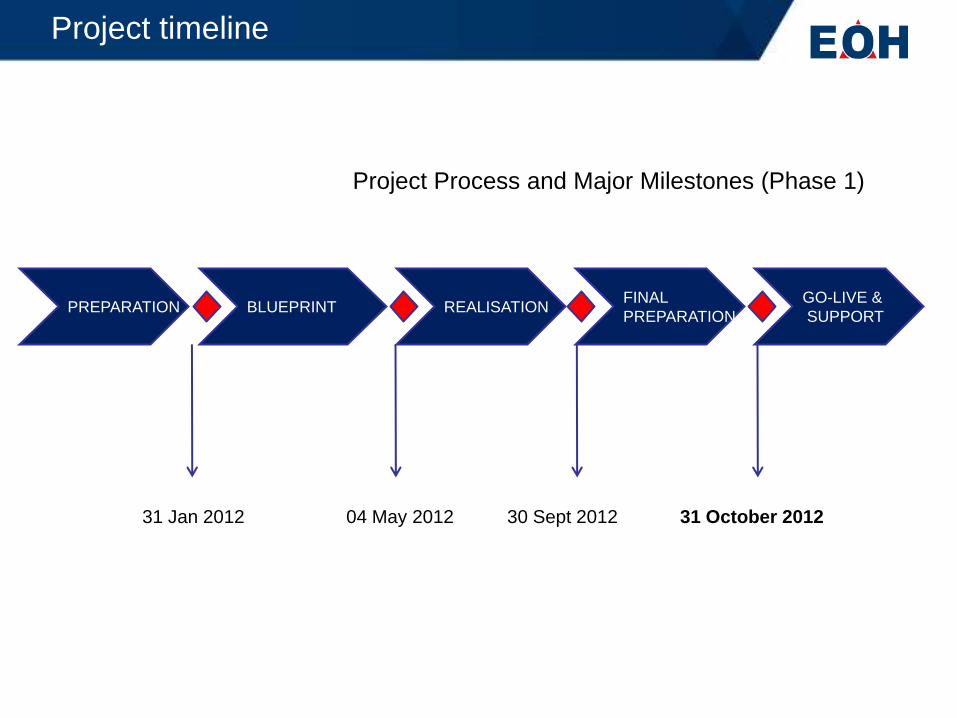
Project timeline
PREPARATION
31 Jan 2012 04 May 2012 30 Sept 2012
BLUEPRINT REALISATION FINAL
PREPARATION
GO-LIVE &
SUPPORT
31 October 2012
Project Process and Major Milestones (Phase 1)

EOH implementation roadmap
(Methodology)
Implementation methodology

The bnefits of EOH Enterprise Applications

The future of ERP at EOH
Outsourcing
New Models for IT Management
Managed services
infrastructure
Applications
Convergence
Infrastructure Technologies Rob Godlonton

The business requirements
▲ Upgrade of Infrastructure Technologies (Design, Build, Optimise and
Manage) • New architecture adoption (Cloud and Virtualisation)
• Desktops, laptops and servers
• Active Directory and Exchange (email)
• Archiving and retrieval of email
• Upgrade LAN’s
• Cost effective WAN solutions
• Increase service levels and efficiencies
▲ Development of bespoke business systems to meet change in business
needs • Business and mobility solutions
▲ Optimisation of applications over networks
▲ Utilise new technologies
• Virtualisation & Cloud Services
▲ Pay as you are – as a Service

Overview of our business
▲ Infrastructure technologies • Design, Build, Optimise and Manage
▲ Cloud services • Private and Public & Highly Scalable
▲ Microsoft development and deployment
• Licensing of all Microsoft products (Large Account Reseller LAR)
• Design, build and manage
• 15 Gold certifications and over 300 Microsoft consultants
▲ Managed services • Manage and Operate end to end IT systems
• Over 1,200 people in over 100 locations in Southern Africa
▲ Network solutions • Corporate MPLS
• Internet Breakout
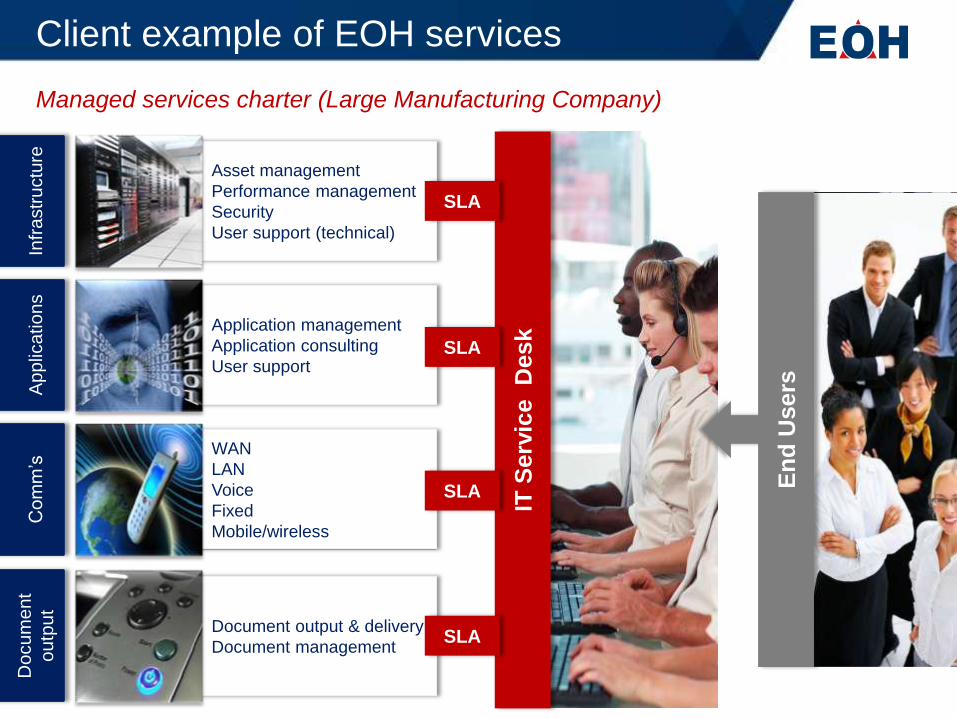
Managed services charter (Large Manufacturing Company)
Client example of EOH services
Asset management
Performance management
Security
User support (technical)
Application management
Application consulting
User support
WAN
LAN
Voice
Fixed
Mobile/wireless
Document output & delivery
Document management
Infr
astr
uctu
re
Ap
plic
atio
ns
Co
mm
’s
Do
cu
me
nt
ou
tpu
t
IT S
erv
ice
Desk
SLA
SLA
SLA
SLA
En
d U
sers

Benefits of EOH solutions
▲ Right 1st Time – design, build and operate
▲ Optimisation and management of current solutions
▲ Develop business solutions to meet business requirements
▲ Utilisation of new technologies to drive out cost efficiencies
▲ Pay as you grow as a Service
▲ Improved end-user management
▲ Implementation flexibility and scalability
▲ Manageability / Agility of the environments
▲ Refreshed infrastructure & end points
▲ Improved governance and control
▲ Control over monthly expenditure & cash flow control
▲ Consolidation of services with leading ICT provider

The future
▲ Infrastructure Technologies as a Service
• Convergence of Cloud Models with one EOH management interface and
operating model
• Supporting Bring Your Own (BYO) device
• Optimisation of applications on networks
▲ Adoption of more Cloud based solutions
▲ Increase of Managed Services and Outsourcing to ICT specialists like EOH
• Convergence of Cloud and Managed Services
• Mobile Device Management (MDM)
▲ Development of Cloud based business solutions
• Faster time to market of bespoke business solutions
• Mobility solution deployment

Existing Datacenters Public Cloud Services
Existing Apps New Enterprise Apps SaaS Apps
Summary of the future
Evolve the Infrastructure Technologies and Management
Modernise Application Deployment
Re-think End-User Computing

Business Process Outsourcing
Johan Van Jaarsveld

What is KPO
▲ Knowledge process outsourcing (KPO) is a term that has emerged to
distinguish a specific type of BPO that involves highly skilled professional
services focused on business processes that provide competitive
advantage.
▲ Requires specialised knowledge or expertise for analytical, industry domain
expertise.
▲ Offerings often include knowledge works, specific assets in the form of
intellectual property, and methodologies, tools, process accelerators and
business process approaches designed to drive differentiated business
value.
▲ Outsourcing of knowledge and information-based crucial processes has
several advantages. Experienced and equipped KPO companies cannot
only reduce risks but also save costs for clients.

Our business
▲ Human Capital, Health Solutions, CSO and LSO
▲ >1 000 people focused on our clients business
Client benefits
▲ Cost Effectiveness – Outsourcing a process provides economic
advantages without compromising the work quality.
▲ Work Perfection – We have domain experts. Be it, finance, IT, healthcare
or any other segment, organisations can find best resources to handle their
KPO projects efficiently and effectively.
▲ Skilled Manpower – We have the ability to perform and the competence in
various knowledge and information based processes.
▲ Time Management – Knowledge processes can be handled effectively in
less time by outsourcing. To accomplish large processes on time,
organisations can leverage more experienced professionals and processes
in delivery.
▲ Extended Organisational Capability – Outsourcing KPO jobs to other
expert organisations provides extended organisational capability to parent
organisations.

The future
▲ Develop and grow: • Human Capital business
• Healthcare business
• Aggressively grow our CSO and LSO business

Intelligent Infrastructure
Zunaid Mayet

The need for Intelligent Infrastructure
• “Green” environmentally relevant designs are gaining importance
• Green issues dominate the global Data Centre market with the focus on reducing carbon footprints and environmental damage
• Smart-buildings coming to the fore with the convergence of intelligent and green buildings
• Hosting and collocation growing markets increasing demands on data centres
• Rising electricity costs changing the dynamics of the DC market
• Energy efficient & environmentally friendly industrial plants
Source: Frost & Sullivan, 2010
• Increased role of the Network infrastructure as the converged ITS (Information Transport System)*
• Explosion of mobile devices for connecting to the LAN/WAN (Smartphones, Tablets, CCTV)
• Proliferation of devices on the LAN e.g. security devices, lighting & energy control, A/V applications
• Demand for bandwidth continues to increase at exponential rates
• Cloud Computing and Video as the “killer app” in both the professional and personal/social realms. Expected to drive bandwidth demand
Legacy Disparate Building Networks
Today Open Standards Building Network
Convergence Green Infrastructures
Green Bright Green Intelligent

The business of Intelligent Infrastructure
Intelligent Infrastructure combines state-of-the-art technology and
best practice to create facilities that are smart, safe, healthy and secure
by:
• Creating optimum working and living conditions
• Ensuring sustained protection of people and assets
• Enhancing comfort, efficiency, availability and security
• Lowering energy consumption and CO2 emissions
• Integrated data, voice &
video networks
• Corporate campus data
networks
• Structured cabling, fibre
optics and networking
• Metropolitan broadband
networks
• Wireless networks
• Full turn-key design, build,
maintain
• HV A/C systems
• Backup power solutions
• Off-grid DC solutions
• Mobile containerised DC
solutions
• Monitoring and
surveillance
• Access control
• Biometric identity
management
• Time and attendance
• Smart card solutions
• Fire safety: prevention,
detection & suppression
• Asset management &
tracking
• Automation and control
systems
• Building automation
• Building management
systems
• Integrated security
• Electrical infrastructure
• Energy management
• Audio-visual solutions
• Intelligent green
infrastructures
• Backup power
Datacentres Safety & security
solutions Converged
connectivity Automation and
control

Client example
• A fully automated turn key solution from 11kV right down to the runway inset lights
• Installed a total of 585 lights, 105 km of primary 5000 V cable, 26,5 km of earth cable and trenched 28 km
• Back-up by power generators in case of an outage • Controlled by air traffic controllers from touch screens in the tower
• Remotely controlled from with-in the aircraft in the case of an emergency
The Need
• 24/7 Availability of airfield • Fully automated control system • Latest technology of ADB aviation products • Remotely controlled system • A complete turn key solution
• Key deployment & training facility for large Air Force base
• Required 24/7 availability for flights • Upgrade of the runway and taxiway technology
The Solution
The Benefits
o Automation and control

Client example
• Instrumentation and software to monitor & control the manufacturing/production plant
• Integrated Generation Control Centre because “Every Megawatt Counts”
• Monitor 17 power stations at a central facility
The Need
• Optimal use of generation capacity • NOW time decisions to ramp up/down power • Limits use of expensive Gas Turbines • Able to warn of impending power shortage • Control and manage emissions
• Monitor status and availability of all generation facilities at large local power utility
• Optimise power distribution • Monitor/control emissions • Need to understand & control production costs in the NOW time – not at month-end
The Solution
The Benefits
o Power generation and distribution control

Client example
• Electrical infrastructure, control and instrumentation solutions to a local water utility
• Supply power and back-up power • Analyze water quality (green drop vs. blue drop) • Plant operational control systems (SCADA, PLCs and instrumentation)
The Need
• Recycled water safe for human consumption or agricultural usage
• Decrease the risk of fast spreading disease • Alleviating water pollution
• South Africa and Africa has enormous challenges to provide safe drinking water for human consumption
• Untreated waste water is the carrier of many life threatening diseases
• Recycle water for human consumption
The Solution
The Benefits
o Automation and control

The future
Focused market sector development in
o Public Sector & SoE’s
o Mining
o Manufacturing
o Financial services
o Construction
Regional expansion for specific offerings
(WC, KZN, EC)
Portfolio diversification (Smart Metering, Smart Grid, HVAC Systems,
“Green” Solutions …)
Africa

Strategy and Way Forward
Asher Bohbot

Our industry
In an ok shape
Re-alignment of roles
Strong drive for outsourcing (Cloud & Managed Services)
Strong services demand
Customers seek larger players to do business with
More maintenance and support - less projects
Still growth at 7% p.a.
BPO still evolving in SA
Government will have to spend more on technology
150BN combined addressable market

EOH today
4 700 people
3.6bn market cap
4.5bn – 5.0bn revenue going forward
Strong services organisation
Winning much larger deals
Often automatically invited to bid
Healthy, stable and positive work environment
Gaining market share
Stronger brand
Ability to retain and attract best people
40% + compounded annual growth over 14 years
+ 40% owned by employees and management
We are very busy…

EOH operating model
Category Lines of Business Public
Sector Health
Financial
Services Manufact. Mining Telco’s Retail
Consulting – core industry
Technology Consulting
Enterprise Applications
Information Management
IT Security
IT Management & Optimisation
Enterprise Content Management
Software Development & Integration
Transformational Outsourcing
Cloud Services
Managed Services
IT Infrastructure
Converged Communications
Intelligent Infrastructure
Technology Rightshoring
Finance and Accounting
Corporate Legal Services
Customer Services
Recruitment
Remuneration
Legal
Organisational Design
Employee Benefits
Training
Technolo
gy
BP
O
HC
S

Services
64%
Reporting segments

Transformation update
▲Equity
37.4% black ownership
▲Board Representation
60% black
▲Employment Equity
57% black
▲Preferential Procurement
138%
▲Skills Development
Variety of programmes
620 trainees
▲Enterprise Development
5% of NPAT
▲Corporate Social Investments
Maths & Science centre
The Child and Youth Dev. Programme
Various other initiatives

Growth drivers
Everything as a service
Managed services
Cloud services
BPO
Intelligent infrastructure
Public sector
Industry verticals introduction
Enterprise applications
Information management
Larger deals
Market share gain
Africa (cautiously)
Strategic acquisitions
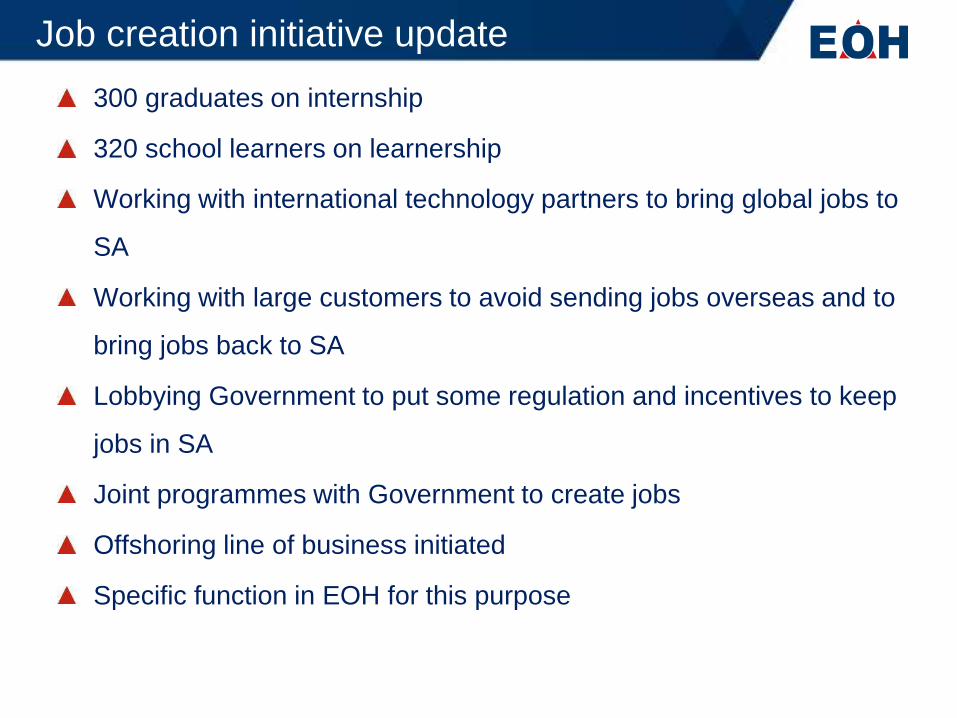
Job creation initiative update
300 graduates on internship
320 school learners on learnership
Working with international technology partners to bring global jobs to
SA
Working with large customers to avoid sending jobs overseas and to
bring jobs back to SA
Lobbying Government to put some regulation and incentives to keep
jobs in SA
Joint programmes with Government to create jobs
Offshoring line of business initiated
Specific function in EOH for this purpose

Thank You


![[Survey Results] Do You Know the Financial Situation of Your Shipping Partner?](https://img.pdfslide.us/doc/110x75/5870bff71a28ab0b4a8b6dd7/survey-results-do-you-know-the-financial-situation-of-your-shipping-partner.jpg)
