Embed Size (px)
Citation preview

ANNUAL REPORTS 2013 EXTERNAL TRADE STATISTICS
Ministerio das Finanças
��������Title��������������EXTERNAL�TRADE�STATISTICS,�2013�Editor�� 1.�Eduardo�M.�Ximenes�� 2.�Nani�Rolanda����4.�Maria�Cardozo�Xavier������3.�Silvino�Lopes���Direcção�Geral�de�Esta�s�ca�Rua�de�Caicoli,�PO�Box�10�Dili,�Timor�Leste��Director�General�of�Sta�s�cs�������������������������Antonio�Freitas,�SE.MM��Designed�&�Composed�by�� 1.�Silvino�Lopes�����2.�Helder�Henriques�Mendes�� � �Impressão��������Prin�ng�by�Gra�ca�Patris�Dili,�Timor�Leste�� ������������
���
Sr. Paulina R.C. Viegas Directora Nacional Economia Esta�s�ca e Sociais No. Telp: + 670 77305918 Direcção Geral de Esta�s�ca Rua de Caicoli, Dili, PO Box 10 Telefone: +670 3311348 email: [email protected]
www.sta�s�cs.gov.tl
i EXTERNAL TRADE STATISTICS, 2013
Preface The General Directorate of Statistics (GDS) is pleased to present External Trade Statistics 2013, the ninth official publication of annual Trade Statistics for Timor-Leste. The statistics contained in this report show the patterns of international trade relating to Timor-Leste during the 2013 calendar year. Ad-ditionally, the report provides comparative annual data for 2009 to 2013. This publication provides the trade statistics required for government, the do-nor community, NGOs, universities, research organizations and the private sector. This report is produced annually, along with the regular monthly Trade data releases that began in January 2004. In addition to this publication the DGE has now established a comprehensive Trade Statistics database. On request, this database can provide more detailed statistical data than is presented in this annual publication. External Trade statistics are compiled from declarations made to the Timor-Leste Customs Service by importers and exporters, or their agents. We would therefore like to express our thanks for the cooperation of the Customs Service in providing the base data used to compile this publication. This publication is the result of the work of a small team at DGE Trade Statis-tics Section, composed of Mr. Eduardo Martinho Ximenes, Ms. Nani Rolanda and Ms. Maria Cardozo Xavier under the National Directorate of Statistics Economic and Social at Direcção Geral de Estatìstica. The GDS kindly advise users to read the concepts and definitions in the initial section of this report to fully understand the statistical data presented. The GDS would welcome any comments from users of this publication for improving the future Trade Statistics releases.
Antonio Freitas, SE.M.M General Director of Statistics

ii
Table of Contents
Preface………..…………………………………………….………….Page i Table of Contents………………………………………….………….Page ii Introduction ……………………………………………..………….Page 1 Concepts, Definitions and Explanations of Data……………....……Page 2 Key Statistics ………………………………………………..….…....Page 4 Imports of Major Commodities (2013) Top 10 ………...…….…….Page 5 Imports – Major Trading Partners (2013) ……………...…….…….Page 6 Imports Tables ………………………………….…………….........…Page 7.
Table 1: Trade Statistics Summary by Month – 2013 Table 2: Merchandise Imports by Chapter Heading 2009—2013 (HS2). Table 3: Merchandise Imports by Major Countries of Origin (2013). Table 4: Merchandise Imports of Major Commodities by Country of Origin (2013).
Exports Tables …………………………….…...……………….......Page 26
Table 5: Exports by Major Trading Partners (2013). Table 6: Re Exports by Country of Destination (2013). Table 7: Coffee Exports by country of Destination (2013). Table 8: Coffee Exports by Month, Quantity and Value (2013) Table 9: Coffee Exports and Others Commodities Exports by Years 2009-2013 Table 10: Others Commodities Exports by Years 2009-2013
Charts…………………………………..………...………………..…Page 32 .
Chart 1: Merchandise Imports by Year 2009- 2013 Chart 2: Exports by Year 2009 - 2013 Chart 3: Imports and Exports by Year 2009 - 2013 Chart 4: Coffee exports by Year 2009 – 2013 Chart5 : Coffee exports and Others Commodities exports by Year 2009 - 2013 Chart6 : Others Commodities Exports by Year 2009 - 2013
EXTERNAL TRADE STATISTICS, 2013

1
Introduction
Timor-Leste in Figures, 2013
With the publication of this annual Trade Statistics report the DI-RECÇÃO GERAL DE ESTATÌSTICA provides the latest available data on imports and exports for Timor-Leste during the 2013 calendar year. As a “stand alone” indicator Trade statistics form a valuable source of information on the economic health of a country, as well as being used by a wide variety of planning and business organisations. Statistics on imports and exports form a valuable component of a country’s state-ment of economic transactions in the National Accounts and Balance of Payments. Accordingly, internationally comparable Trade Statistics that are accurate, detailed and timely have always been a statistical priority. Such information is vitally important for the planning and future development of Timor-Leste.
The information contained in this report aggregates the regular month-ly releases of Trade Statistics issued by the Directorate during 2011. Additionally there are tables that aim to provide a more comprehen-sive picture of trading patterns than is possible from viewing a single month’s data. As the Trade Statistics database grows it is now possible to present comparative annual data. The statistical methods and concepts used to compile data for this re-port closely follow the recommendations of UN publication “International Merchandise Trade Statistics: Concepts and Defini-tions (IMTS, Rev.2)” wherever possible. The objective of External Trade Statistics, 2013 is to provide an aggregated view of import and export statistics for the 2012 calendar year, accepting the fact that more detailed analysis of specific commodities is available by contact-ing the DIRECÇÃO GERAL DE ESTATÌSTICA.

2 EXTERNAL TRADE STATISTICS, 2013
The following section aims to provide additional information on the methods used to collect and analyse the Trade Statistics contained in this report. As already men-tioned, these Trade Statistics are compiled using the UN “International Merchan-dise Trade Statistics: Concepts and Definitions (IMTS, Rev.2)” as a guide and quo-tations from that publication are included here.
Concepts, Definitions and Explanations of Data
Source of Data Time of Recording System of Recording Merchandise Trade
Data is obtained from import and export documents lodged with the Customs Service of Timor-Leste. This data is then processed by the National Statistics Directorate to produce External Trade Statistics that conform to United Nations statistical concepts. The ASYCUDA (Automated System for Customs Data) system became operational in the Timor-Leste Customs Service in Octo-ber 2003. This system provides the basic data from which External Trade Statistics are prepared. Currently this system provides cov-erage of all imports and exports from the main airport and seaports plus parcel post. Some documentation from “small” ports is also processed at the Dili Customs Office, however it should be noted that approximately 4% of entries (those not lodged electronically via ASYCUDA), may not be included in the Trade Statistics. Import and Export Statistics are compiled by Date of Assessment. This is the date on which the duty to be paid (if any) is assessed by the Customs Service, in effect “clearing” the goods for import/export. External Trade statistics are compiled in close accordance with the United Nations International Merchandise Trade Statistics Con-cepts and Definitions. The system is known as the "general "system of recording trade statistics as defined in UN statistical papers M52. Under this system imports includes all goods entering the economic territory of a compiling country and exports includes all goods leaving the economic territory of a compiling country. The “economic territory” includes bonded warehouses. Merchandise Trade is the import or export of goods that alter the nation’s stock of material resources as a result of their movement in or out of the country.

3 EXTERNAL TRADE STATISTICS, 2013
Non Merchandise Trade Country Statistics Commodity Classification Limitations of data F.O.B. (Free on Board) C.I.F. (Cost, Insurance and Freight) Re Exports
Goods which do not permanently add to the materi-al resources of a country are identified as “Non Mer-chandise” trade. Some common examples would be temporary imports, returnable containers, goods in transit and goods consigned to foreign embassies within a host country. Import statistics are available by “Country of Origin” - the country of manufacture of the goods. Export statistics are available by “Country of Desti-nation” – the country of final destination as shown on the export declaration. Goods are classified by Customs using the Customs Tariff that is based on the international “Harmonized Commodity Description and Coding System”, or “HS” as it is sometimes called. External Trade statistics are compiled from docu-ments provided by exporters and importers to the Timor-Leste Customs Service. Considerable reli-ance is placed on the exporters/importers and their agents submitting correct codes and information. Before the data is released for statistical purposes it is validated and detected errors corrected however no warranty can be given that this information con-tains no errors. It should also be noted that goods crossing interna-tional borders without appropriate Customs docu-mentation would not be included in Trade Statistics. Method of valuation for Exports. This valuation includes the cost of the goods plus their delivery on board ship ready for departure. Method of valuation for Imports. This valuation includes the cost of the goods, cost of insuring the goods during transportation and cost of freight.
Re Exports are goods leaving the country that were previously imported into Timor-Leste and comprise less than 50 percent Timor-Leste value by content at time of export.
4
Key
Sta
tistic
s
EX
TE
RN
AL
TR
AD
E S
TA
TIS
TIC
S, 2
013
U
S$'0
00
20
09
2010
20
11
2012
20
13
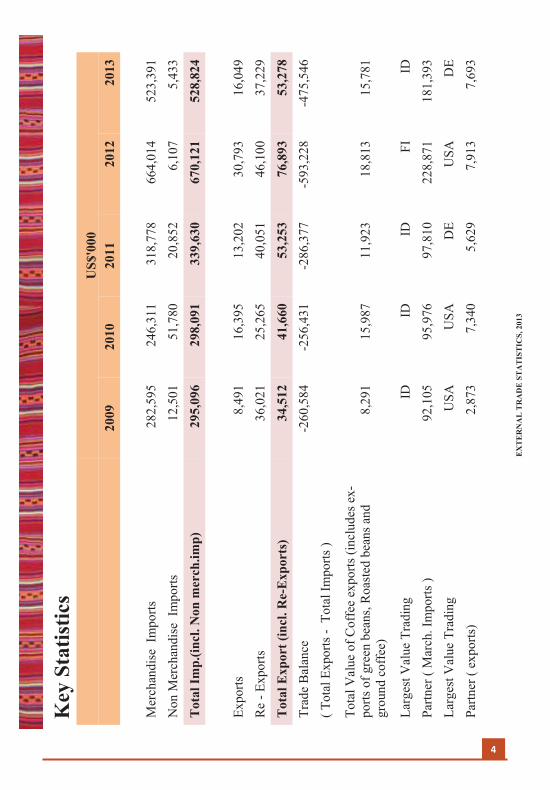
Mer
chan
dise
Im
ports
28
2,59
5 24
6,31
1 31
8,77
8 66
4,01
4 52
3,39
1 N
on M
erch
andi
se I
mpo
rts
12,5
01
51,7
80
20,8
52
6,10
7 5,
433
Tot
al Im
p.(in
cl. N
on m
erch
.imp)
29
5,09
6 29
8,09
1 33
9,63
0 67
0,12
1 52
8,82
4
Expo
rts
8,49
1 16
,395
13
,202
30
,793
16
,049
R
e - E
xpor
ts
36,0
21
25,2
65
40,0
51
46,1
00
37,2
29
Tot
al E
xpor
t (in
cl. R
e-E
xpor
ts)
34,5
12
41,6
60
53,2
53
76,8
93
53,2
78
Trad
e B
alan
ce
-260
,584
-2
56,4
31
-286
,377
-5
93,2
28
-475
,546
( T
otal
Exp
orts
- T
otal
Impo
rts )
Tota
l Val
ue o
f Cof
fee
expo
rts (i
nclu
des e
x-po
rts o
f gre
en b
eans
, Roa
sted
bea
ns a
nd
grou
nd c
offe
e)
8,29
1 15
,987
11
,923
18
,813
15
,781
Larg
est V
alue
Tra
ding
ID
ID
ID
FI
ID
Pa
rtner
( M
arch
. Im
ports
) 92
,105
95
,976
97
,810
22
8,87
1 18
1,39
3 La
rges
t Val
ue T
radi
ng
USA
U
SA
DE
USA
D
E Pa
rtner
( ex
ports
) 2,
873
7,34
0 5,
629
7,91
3 7,
693

5
EX
TE
RN
AL
TR
AD
E S
TA
TIS
TIC
S, 2
013
IMPO
RT
S O
F M
AJO
R C
OM
MO
DIT
IES
(201
3) -
TO
P 10
HS
Cha
pter
D
escr
iptio
n V
alue
($
'000
)
27
Min
eral
fuel
s, m
iner
al o
ils a
nd p
rodu
cts o
f the
ir di
still
atio
n; b
itum
inou
s sub
stan
ces;
min
eral
wax
-es
14
5,19
2
87
Veh
icle
s, ot
hers
than
railw
ay o
r tra
mw
ay ro
lling
stoc
k an
d p
arts
and
acc
esso
ries t
here
of
63,7
63
85
Elec
trica
l mac
hine
ry a
nd e
quip
men
t and
par
ts th
ereo
f, so
und
reco
rder
s and
repr
oduc
ers;
tele
visi
on
etc
43,8
45
84
Nuc
lear
reac
tors
, boi
lers
, mac
hine
ry a
nd m
echa
nica
l ap
plia
nces
par
ts th
ereo
f 39
,317
63
Te
xtile
s, m
ade
up a
rticl
es; s
ets;
wor
n cl
othi
ng a
nd w
orn
text
ile a
rticl
es; r
ags
32,8
28
10
Cer
eals
22
,525
22
B
ever
age,
spiri
ts a
nd v
ineg
ar
22,2
10
73
Iron
or s
teel
arti
cles
21
,196
25
Sa
lt;ea
rth,st
one;
plas
terin
g m
ater
ial,
lime
and
cem
ent
17,6
70
94
Furin
iture
,bed
ding
, mat
tress
es,m
attre
sses
supp
ort;c
ushi
ons a
nd si
mila
r stu
ffed
furn
ishi
ng, l
amps
an
d lig
htin
g 8,
868
Tot
al V
alue
for
top
10
417,
414
A
ll O
ther
Com
mod
ities
42
6,48
6
T
otal
Mer
chan
dise
Impo
rts
843,
900
6 EXTERNAL TRADE STATISTICS, 2013
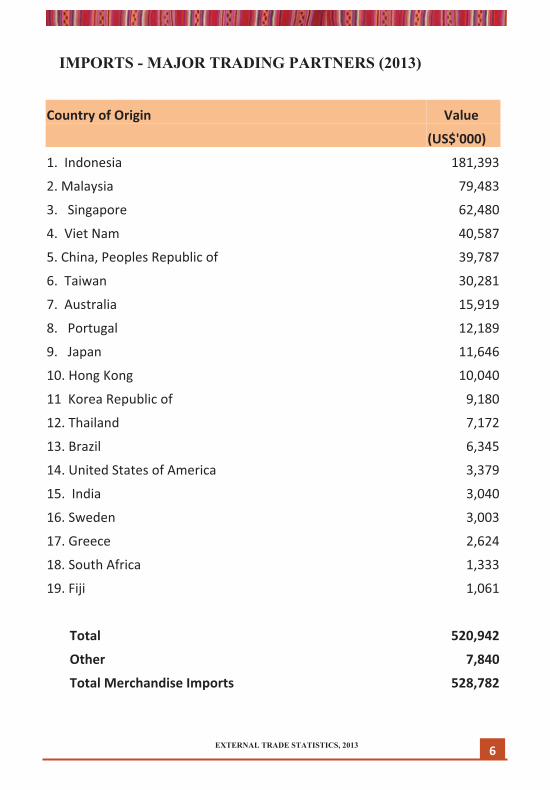
IMPORTS - MAJOR TRADING PARTNERS (2013)
Country of Origin Value
(US$'000)
1. Indonesia 181,393
2. Malaysia 79,483
3. Singapore 62,480
4. Viet Nam 40,587
5. China, Peoples Republic of 39,787
6. Taiwan 30,281
7. Australia 15,919
8. Portugal 12,189
9. Japan 11,646
10. Hong Kong 10,040
11 Korea Republic of 9,180
12. Thailand 7,172
13. Brazil 6,345
14. United States of America 3,379
15. India 3,040
16. Sweden 3,003
17. Greece 2,624
18. South Africa 1,333
19. Fiji 1,061
Total 520,942
Other 7,840
Total Merchandise Imports 528,782

Imports Tables
EXTERNAL TRADE STATISTICS, 2013 7
TIMOR-LESTE TRADE STATISTICS SUMMARY
Notes : Merchandise Trade Imports exclude values of goods imported for use by for-
eign Embassies and High Commissions-there goods are deemed to be “Non
Merchandise “ Trade Imports.
Exports are goods comprising at least 50 percent Timor-Leste content by val-
ue.
Re- Exports are goods for export that were previously imported into Timor-
Leste and comprise less Than 50 percent Timor-Leste content by value, the
Table 1 : Trade Statistics Summary by Month - 2013 (US$’000)
Monthly
2013 Imports Exports
Merchandise Imports
Non Merch. Imports
Total Imports Exports Re-
Exports Total Ex-
ports
January 55,130 1,132 56,262 1,011 2,954 3,964 February 35,403 697 36,100 882 5,718 6,001 March 34,813 527 35,340 6 1,303 1,310 Total Quartel 1 125,346 2,356 127,702 1,899 9,975 11,275 April 49,662 88 49,750 473 10,263 10,736 May 39,854 250 40,104 2 2,568 2,569 June 38,804 320 39,123 466 3,672 4,138 Total Quartel 2 128,320 658 128,977 641 16,503 17,443 July 40,090 97 40,187 175 684 859 August 39,080 471 39,551 2,066 1,337 3,403 September 42,558 322 42,880 2,031 2,474 4,505 Total Quartel 3 121,728 890 122,618 4,272 4,495 8,767 October 52,458 551 53,009 3,487 2,560 6,047 November 42,732 332 43,065 2,174 1,120 3,294 December 52,807 644 53,452 3,277 2,576 5,852 Total Quartel 4 147,997 1,527 149,526 8,938 6,256 15,193
2013 Total 523,391 5,431 528,823 15,750 37,229 52,678

Table 2: Merchandise Imports by Chapter Heading 2009– 2013 (HS2)
8 EXTERNAL TRADE STATISTICS, 2013
HS HS Description Value ($'000) 2009 2010 2011 2012 2013
1 Animals;live 18 52 25 16 0 2 Meat and edible meat of offal 3,919 5,116 2,042 2,600 0
3 Fish and Crustaceans,molluscs and
other aquatic invertebrastes 443 662 153 402 0
4
Dairy produce;birds' eggs; natural
honey;edible products of animal
origin,not elsewhere apeci�ied or
included
2,662 3,320 853 1,192 0
5 Animal originated products;not
elsewhere speci�ied or included 10 24 5 7 0
6
Trees and other
plants,live;bulbs,roots and the
like;cut �lowers and ornamental
foliage
29 9 1 3 0
7 Vegetables and certain roots and
tubers; eable 806 1,284 591 336 0
8 Fruit and nuts,edible;peel of citrus
fruit or melons 587 811 299 418 0
9 Coffee,tean mate and spices 594 873 431 598 0
10 Cereals 35,169 14,123 9,182 31,066 22,525
11
Products of the milling indus-
try;malt starches,insulin wheat
gluten
1,320 1,870 1,368 2,455 3,224
12
Oils seeds and oleaginous
fruits;miscellaneous gains ,seeds
and fruit, indusrial or medicinal
plants; straw etc.
738 637 173 492
257
13 Lac; gums,resins and other vegeta-
ble saps and extracts 7 18 6 11
35
14
Vegetable plaiting mate-
riasls;vegetable products not else-
where speci�ied or included
34 5 8 30
34
15
Animal or vegetable fats and oils
and their cleavage products; pre-
pared animal fats; animal or vege-
table waxes
1,170 2,000 1,743 2,515 4,012
9 EXTERNAL TRADE STATISTICS, 2013
Continue….
HS HS Description Value ($'000)
2009 2010 2011 2012 2013
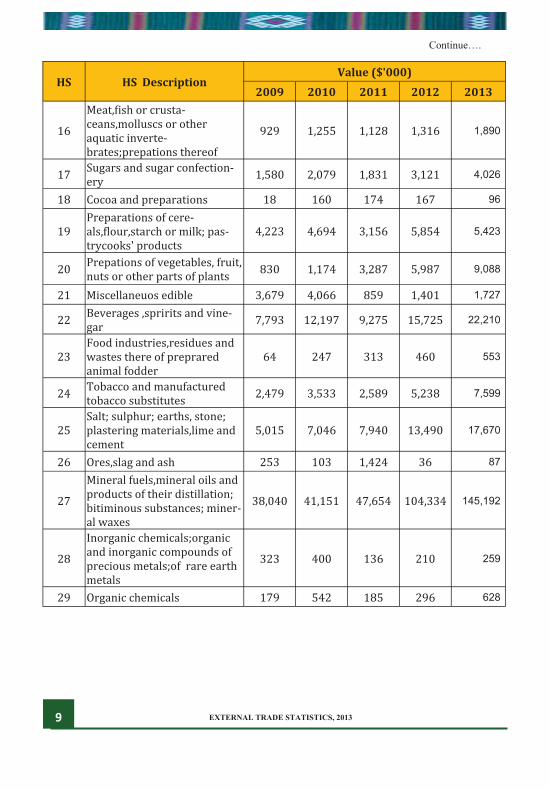
16
Meat,�ish or crusta-
ceans,molluscs or other
aquatic inverte-
brates;prepations thereof
929 1,255 1,128 1,316 1,890
17 Sugars and sugar confection-
ery 1,580 2,079 1,831 3,121 4,026
18 Cocoa and preparations 18 160 174 167 96
19
Preparations of cere-
als,�lour,starch or milk; pas-
trycooks' products
4,223 4,694 3,156 5,854 5,423
20 Prepations of vegetables, fruit,
nuts or other parts of plants 830 1,174 3,287 5,987 9,088
21 Miscellaneuos edible 3,679 4,066 859 1,401 1,727
22 Beverages ,spririts and vine-
gar 7,793 12,197 9,275 15,725 22,210
23
Food industries,residues and
wastes there of preprared
animal fodder
64 247 313 460 553
24 Tobacco and manufactured
tobacco substitutes2,479 3,533 2,589 5,238 7,599
25
Salt; sulphur; earths, stone;
plastering materials,lime and
cement
5,015 7,046 7,940 13,490 17,670
26 Ores,slag and ash 253 103 1,424 36 87
27
Mineral fuels,mineral oils and
products of their distillation;
bitiminous substances; miner-
al waxes
38,040 41,151 47,654 104,334 145,192
28
Inorganic chemicals;organic
and inorganic compounds of
precious metals;of rare earth
metals
323 400 136 210 259
29 Organic chemicals 179 542 185 296 628
EXTERNAL TRADE STATISTICS, 2013 10
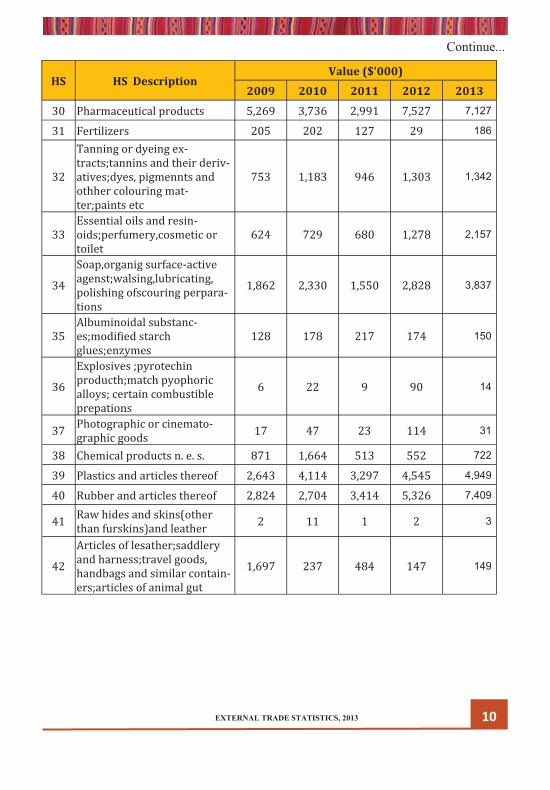
Continue...
HS HS Description Value ($'000)
2009 2010 2011 2012 2013 30 Pharmaceutical products 5,269 3,736 2,991 7,527 7,127
31 Fertilizers 205 202 127 29 186
32
Tanning or dyeing ex-
tracts;tannins and their deriv-
atives;dyes, pigmennts and
othher colouring mat-
ter;paints etc
753 1,183 946 1,303 1,342
33
Essential oils and resin-
oids;perfumery,cosmetic or
toilet
624 729 680 1,278 2,157
34
Soap,organig surface-active
agenst;walsing,lubricating,
polishing ofscouring perpara-
tions
1,862 2,330 1,550 2,828 3,837
35
Albuminoidal substanc-
es;modi�ied starch
glues;enzymes
128 178 217 174 150
36
Explosives ;pyrotechin
producth;match pyophoric
alloys; certain combustible
prepations
6 22 9 90 14
37 Photographic or cinemato-
graphic goods 17 47 23 114 31
38 Chemical products n. e. s. 871 1,664 513 552 722
39 Plastics and articles thereof 2,643 4,114 3,297 4,545 4,949
40 Rubber and articles thereof 2,824 2,704 3,414 5,326 7,409
41 Raw hides and skins(other
than furskins)and leather 2 11 1 2 3
42
Articles of lesather;saddlery
and harness;travel goods,
handbags and similar contain-
ers;articles of animal gut
1,697 237 484 147 149

EXTERNAL TRADE STATISTICS, 2013 11
Continue...
HS HS Description Value ($'000)
2009 2010 2011 2012 2013
43 Furskins and articial
fur;manufactures therof 4 107 5 16 6
44 Wood and articles of
wood;charcoal 2,406 2,612 2,192 3,418 1,798
45 Cork and articles of cork 19 39 29 88 90
46
Manufactures ofs straw,esparto
or other plaijing materials;
baskettware and wickerwork
9 10 4 25 43
47
Pulp of wood or other frbrous
cellulosic material;recovered
(waste and scrap)paper or paper-
board)
4 10 8 15 32
48
Paper and paperboard;articles of
paper pulp,of paper or paper-
board
4,115 2,647 2,333 2,955 2,264
49
printed
books,newspapers,pictures and
other products of the printing
industry;manuscripts etc
384 1,606 373 7,059 2,668
50 Silk 3 14 14 18 16
51 Wool,�ine or coarse animal hair;
horsehair yam and woven fabric 21 18 3 6 22
52 Cotton 15 41 5 90 45
53
Vegetable textile �ibres; paper
yarn and woven fabrics of paper
yarn
8 3 1 0 1
54 Man-made �ilaments 0 7 6 26 11
55 Man-made staple �ibres 16 8 22 21 32
56
Waddiing,felt and
nonwovens,special yarns;
twine,cordage ropes and cables
and articles thereof
355 1,647 465 1,544 1,923
57 Carpets and other textile �loor
coverings 33 69 79 185 84
58
Fabrics; special woven fabrics,
tufted texile fabrics, lace trim-
mings, taxtile arti-
cles,trimmigs,embroidery
31 225 59 149 149

EXTERNAL TRADE STATISTICS, 2013 12
Continue...
HS HS Description Value ($'000)
2009 2010 2011 2012 2013
59
Textile fabrics; implreganat-
ed,coated,coverred or laminat-
ed; taxile artile articeles of a
kind suitabel for industria use
51 225 109 161 113
60 Fabrics; knitted or crocheted 30 20 550 19 71
61 Apparel and clothing accesso-
ries knitted or crocheted 500 461 610 587 657
62 Apparel and clothing accesso-
ries not knitted or crocheted 545 2,847 595 591 523
63
Textiles,made up articles; sets;
worn clothing and worn textile
articles; rags
1,655 1,970 2,112 12,445 32,828
64 Footwear; gaiters and the like;
parts of such articles 573 855 754 1,492 2,083
65 Headgear and parts thereof 188 50 240 75 75
66
Umbrellas,sun umbrel-
las,walking-sticks seat
sticks,whips riding cprps;and
parts thereof
32 41 47 127 148
67
Feathers and down, prepared;
and articles made of feather or
of down; arti�icial frlowers;
articles of human hair
29 33 37 49 71
68
Stone, plaster, cement, asbes-
to,mica or similar materials;
articles thereof
1,053 832 2,694 1,740 1,723
69 Ceramic products 1,153 2,086 1,245 2,678 3,085
70 Glass and glassware 553 570 1,001 1,120 1,945
71
Natural,cultured pearls; pre-
cious, semi-precious stones;
precious metals,clad with pre-
cious metal etc
21 451 428 496 889
72 Iron and steel 3,922 4,679 4,676 8,240 6,196
73 Iron or steel articles 5,149 11,121 23,493 35,164 21,196
74 Copper and articles thereof 334 305 682 304 583
EXTERNAL TRADE STATISTICS, 2013 13
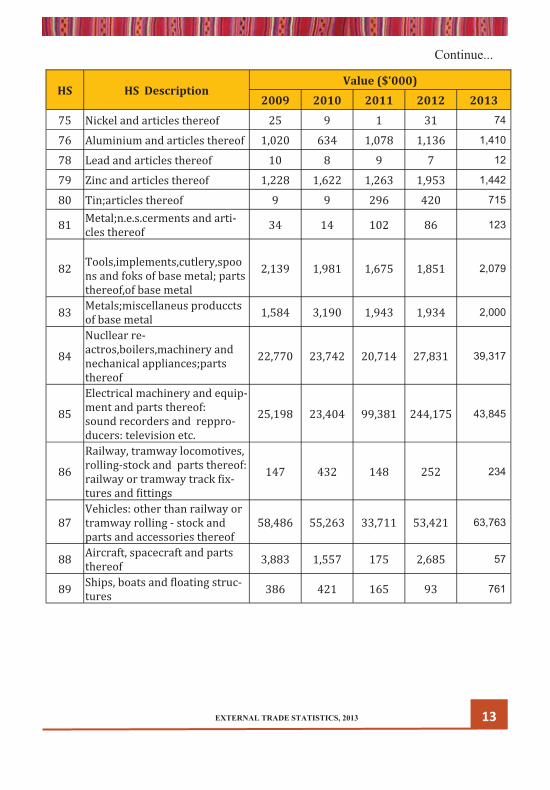
Continue...
HS HS Description Value ($'000)
2009 2010 2011 2012 2013 75 Nickel and articles thereof 25 9 1 31 74
76 Aluminium and articles thereof 1,020 634 1,078 1,136 1,410
78 Lead and articles thereof 10 8 9 7 12
79 Zinc and articles thereof 1,228 1,622 1,263 1,953 1,442
80 Tin;articles thereof 9 9 296 420 715
81 Metal;n.e.s.cerments and arti-
cles thereof 34 14 102 86 123
82
Tools,implements,cutlery,spoo
ns and foks of base metal; parts
thereof,of base metal
2,139 1,981 1,675 1,851 2,079
83 Metals;miscellaneus produccts
of base metal 1,584 3,190 1,943 1,934 2,000
84
Nucllear re-
actros,boilers,machinery and
nechanical appliances;parts
thereof
22,770 23,742 20,714 27,831 39,317
85
Electrical machinery and equip-
ment and parts thereof:
sound recorders and reppro-
ducers: television etc.
25,198 23,404 99,381 244,175 43,845
86
Railway, tramway locomotives,
rolling-stock and parts thereof:
railway or tramway track �ix-
tures and �ittings
147 432 148 252 234
87
Vehicles: other than railway or
tramway rolling - stock and
parts and accessories thereof
58,486 55,263 33,711 53,421 63,763
88 Aircraft, spacecraft and parts
thereof 3,883 1,557 175 2,685 57
89 Ships, boats and �loating struc-
tures 386 421 165 93 761
EXTERNAL TRADE STATISTICS, 2013 14
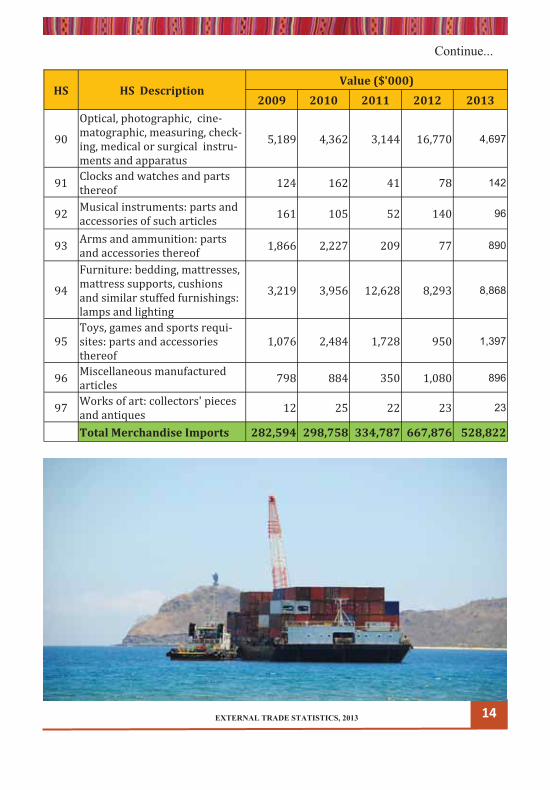
Continue...
HS HS Description Value ($'000)
2009 2010 2011 2012 2013
90
Optical, photographic, cine-
matographic, measuring, check-
ing, medical or surgical instru-
ments and apparatus
5,189 4,362 3,144 16,770 4,697
91 Clocks and watches and parts
thereof 124 162 41 78 142
92 Musical instruments: parts and
accessories of such articles 161 105 52 140 96
93 Arms and ammunition: parts
and accessories thereof 1,866 2,227 209 77 890
94
Furniture: bedding, mattresses,
mattress supports, cushions
and similar stuffed furnishings:
lamps and lighting
3,219 3,956 12,628 8,293 8,868
95
Toys, games and sports requi-
sites: parts and accessories
thereof
1,076 2,484 1,728 950 1,397
96 Miscellaneous manufactured
articles 798 884 350 1,080 896
97 Works of art: collectors' pieces
and antiques 12 25 22 23 23
Total Merchandise Imports 282,594 298,758 334,787 667,876 528,822

EXTERNAL TRADE STATISTICS, 2013 15
Table 3 : Merchandise Import by Major Countries of Origin (2013)
Country of Origin Value (US$'000)
1. Indonesia 181,393
2. Malaysia 79,483
3. Singapore 62,480
4. Viet Nam 40,587
5. China, Peoples Republic of 39,787
6. Taiwan 30,281
7. Australia 15,919
8. Portugal 12,189
9. Japan 11,646
10. Hong Kong 10,040
11 Korea Republic of 9,180
12. Thailand 7,172
13. Brazil 6,345
14. United States of America 3,379
15. India 3,040
16. Sweden 3,003
17. Greece 2,624
18. South Africa 1,333
19. Fiji 1,061
EXTERNAL TRADE STATISTICS, 2013 16
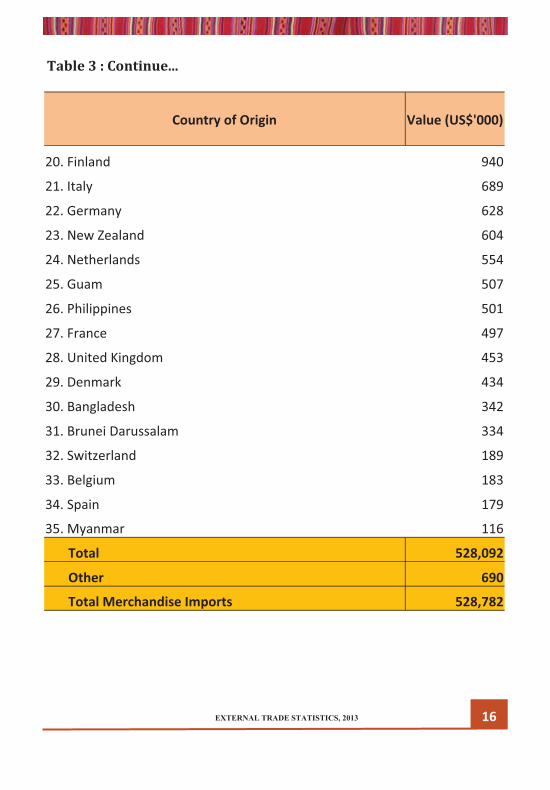
Table 3 : Continue...
Country of Origin Value (US$'000)
20. Finland 940
21. Italy 689
22. Germany 628
23. New Zealand 604
24. Netherlands 554
25. Guam 507
26. Philippines 501
27. France 497
28. United Kingdom 453
29. Denmark 434
30. Bangladesh 342
31. Brunei Darussalam 334
32. Switzerland 189
33. Belgium 183
34. Spain 179
35. Myanmar 116
Total 528,092
Other 690
Total Merchandise Imports 528,782
17 EXTERNAL TRADE STATISTICS, 2013
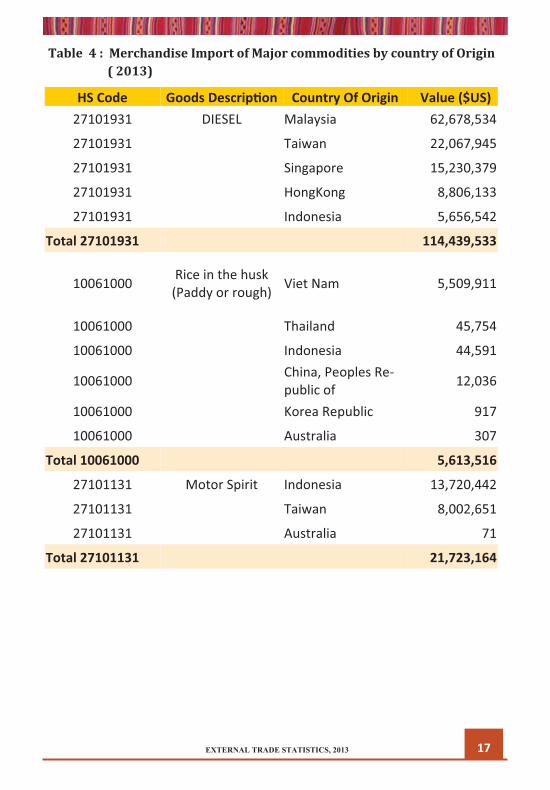
Table 4 : Merchandise Import of Major commodities by country of Origin ( 2013)
HS Code Goods Descrip�on Country Of Origin Value ($US) 27101931 DIESEL Malaysia 62,678,534
27101931 Taiwan 22,067,945
27101931 Singapore 15,230,379
27101931 HongKong 8,806,133
27101931 Indonesia 5,656,542
Total 27101931 114,439,533
10061000 Rice in the husk (Paddy or rough) Viet Nam 5,509,911
10061000 Thailand 45,754
10061000 Indonesia 44,591
10061000 China, Peoples Re-public of 12,036
10061000 Korea Republic 917
10061000 Australia 307
Total 10061000 5,613,516
27101131 Motor Spirit Indonesia 13,720,442
27101131 Taiwan 8,002,651
27101131 Australia 71
Total 27101131 21,723,164

18 EXTERNAL TRADE STATISTICS, 2013
Table 4 : Continue...
HS Code Goods Descrip�on Country Of Origin Value ($US)
87032300
Vehicles with spark-igni�on engine of cylinder capacity
1500-3000 cc
Japan 5,063,897
87032300 Indonesia 3,849,405 87032300 Australia 2,784,610 87032300 Singapore 2,371,271 87032300 Thailand 1,395,640
87032300 Korea Republic of 381,177
87032300 China, Peoples Re-public of 118,490
87032300 Malaysia 69,794 87032300 Gibraltar 63,492 87032300 India 60,020 87032300 Denmark 56,640 87032300 Belgium 51,577 87032300 Switzerland 42,695
87032300 United states of America 31,617
87032300 Ghana 27,032
87032300 United Arab Emir-ates 21,390
87032300 United Kingdom 20,894 87032300 South Africa 20,000 87032300 Solomon Islands 14,834 87032300 Cyprus 11,000
Total 87032300 16,457,475
19 EXTERNAL TRADE STATISTICS, 2013
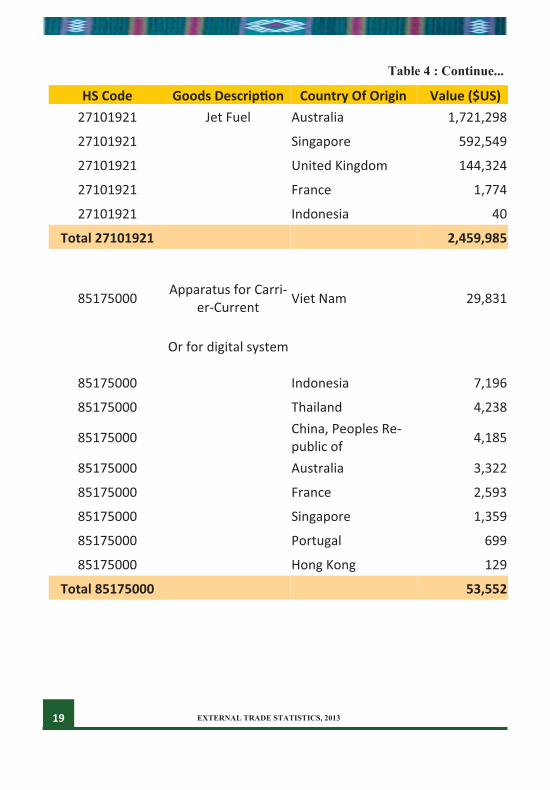
Table 4 : Continue...
HS Code Goods Descrip�on Country Of Origin Value ($US) 27101921 Jet Fuel Australia 1,721,298
27101921 Singapore 592,549
27101921 United Kingdom 144,324
27101921 France 1,774
27101921 Indonesia 40
Total 27101921 2,459,985
85175000 Apparatus for Carri-er-Current Viet Nam 29,831
Or for digital system
85175000 Indonesia 7,196
85175000 Thailand 4,238
85175000 China, Peoples Re-public of 4,185
85175000 Australia 3,322
85175000 France 2,593
85175000 Singapore 1,359
85175000 Portugal 699
85175000 Hong Kong 129
Total 85175000 53,552
20 EXTERNAL TRADE STATISTICS, 2013
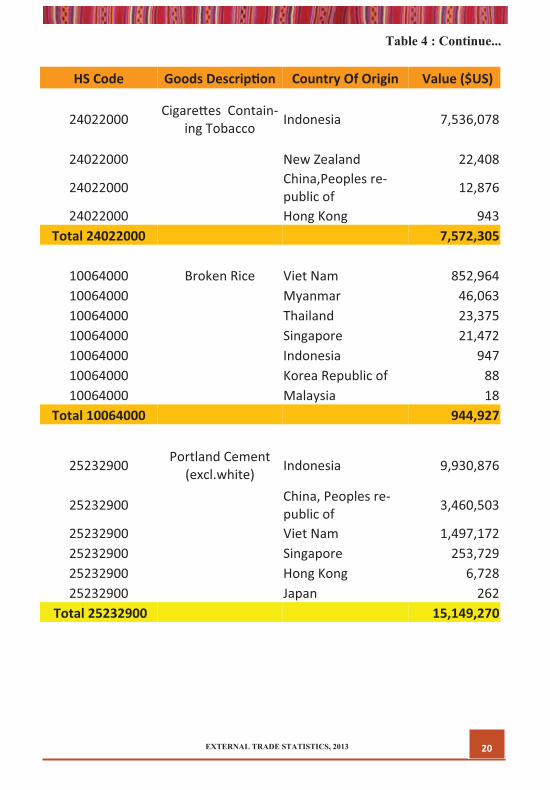
Table 4 : Continue...
HS Code Goods Descrip�on Country Of Origin Value ($US)
24022000 Cigare�es Contain-ing Tobacco Indonesia 7,536,078
24022000 New Zealand 22,408
24022000 China,Peoples re-public of 12,876
24022000 Hong Kong 943 Total 24022000 7,572,305
10064000 Broken Rice Viet Nam 852,964 10064000 Myanmar 46,063 10064000 Thailand 23,375 10064000 Singapore 21,472 10064000 Indonesia 947 10064000 Korea Republic of 88 10064000 Malaysia 18
Total 10064000 944,927
25232900 Portland Cement (excl.white) Indonesia 9,930,876
25232900 China, Peoples re-public of 3,460,503
25232900 Viet Nam 1,497,172 25232900 Singapore 253,729 25232900 Hong Kong 6,728 25232900 Japan 262
Total 25232900 15,149,270

21 EXTERNAL TRADE STATISTICS, 2013
Table 4 : Continue...
HS Code Goods Descrip�on Country Of Origin Value ($US)
87089900 Parts and Accessories, forVehicles of 87.01 to
87.05 Indonesia
815,182
87089900 Australia 511356 87089900 singapore 367991 87089900 Japan 213221 87089900 Malaysia 206742
87089900 China, Peoples Re-public of 168238
87089900 Thailand 149583 87089900 Portugal 32218 87089900 Taiwan 22287
87089900 Korea Democra�c Peoples Republic 9717
87089900 Korea Republic of 8665 87089900 United Kingdom 8519 87089900 Italy 3736 87089900 Hong Kong 2615
87089900 United States of America 2056
87089900 Saudi Arabia 1938 87089900 Netherlands 1008 87089900 Philippines 608 87089900 India 461 87089900 Germany 426 87089900 France 411 87089900 Denmark 355 87089900 South Africa 16 87089900 Hai� 12
Total 87089900 2,527,361

22 EXTERNAL TRADE STATISTICS, 2013
Table 4 : Continue...
HS Code Goods Descrip�on Country Of Origin Value ($US)
30032000 Medicaments of
Other an�bio�c not for retail Sale
France 102,433
30032000 Indonesia 4,048 30032000 Australia 1,977
30032000 Inited States of America 702
Total 30032000 109,160
85291000 Aerials and aerial reflectors of all
kinds parts thereof Viet Nam 6,413,069
85291000 Sweden 1,546,981 85291000 Indonesia 887,336 85291000 Portugal 99,230 85291000 Singapore 43,054
85291000 China, Peoples re-public of 41,721
85291000 Netherlands 40,176 85291000 New Zealand 21,749 85291000 Australia 7,331 85291000 Finland 6,136 85291000 Israel 4,506
85291000 United States of America 1,816
85291000 Malaysia 856 85291000 Norway 772 85291000 Philippines 688 85291000 United Kingdom 405
Japan 31 Total 85291000 9,115,857
23 EXTERNAL TRADE STATISTICS, 2013
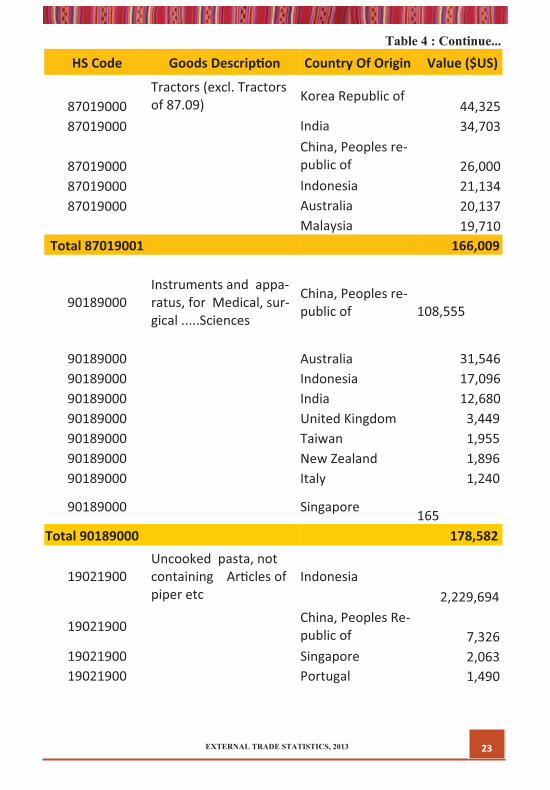
Table 4 : Continue...
HS Code Goods Descrip�on Country Of Origin Value ($US)
87019000 Tractors (excl. Tractors of 87.09) Korea Republic of
44,325 87019000 India 34,703
87019000 China, Peoples re-
public of 26,000 87019000 Indonesia 21,134 87019000 Australia 20,137
Malaysia 19,710 Total 87019001 166,009
90189000 Instruments and appa-ratus, for Medical, sur-gical .....Sciences
China, Peoples re-public of
108,555
90189000 Australia 31,546 90189000 Indonesia 17,096 90189000 India 12,680 90189000 United Kingdom 3,449 90189000 Taiwan 1,955 90189000 New Zealand 1,896 90189000 Italy 1,240
90189000 Singapore 165
Total 90189000 178,582
19021900 Uncooked pasta, not containing Ar�cles of piper etc
Indonesia 2,229,694
19021900 China, Peoples Re-public of 7,326
19021900 Singapore 2,063 19021900 Portugal 1,490

24 EXTERNAL TRADE STATISTICS, 2013
Table 4 : Continue... HS Code Goods Descrip�on Country Of Origin Value ($US)
19021900 Philippines 1,361 19021900 Australia 1,018 19021900 Malaysia 44 19021900 Korea Republic of 36
Total 19021900 2,243,032
48189000 Household, Sanitary or hospital Australia 16,938
Ar�cles of piper etc 48189000 Indonesia 6,662
48189000 Singapore 992
48189000 China, Peoples Repub-lic of 58
Total 48189000 24,650
83024100 Moun�ngs, fi�ngs, etc, for buildings Indonesia
269,312 Of base metal
83024100 Portugal 151,989
83024100 China, Peoples Repub-lic of 38936
83024100 Guam 23,406 83024100 Australia 13,003 83024100 Singapore 2,691 83024100 Malaysia 1,174 83024100 Turkey 13
Total 83024100 500,524
15111000 Crude Palm Oil Indonesia 963,190
15111000 Malaysia 26 Total 15111000 963,216
25 EXTERNAL TRADE STATISTICS, 2013
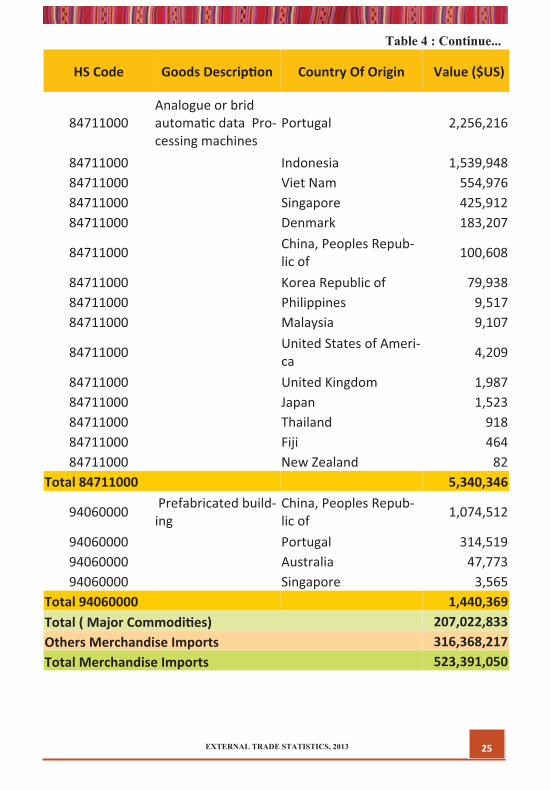
Table 4 : Continue...
HS Code Goods Descrip�on Country Of Origin Value ($US)
84711000 Analogue or brid automa�c data Pro-cessing machines
Portugal 2,256,216
84711000 Indonesia 1,539,948 84711000 Viet Nam 554,976 84711000 Singapore 425,912 84711000 Denmark 183,207
84711000 China, Peoples Repub-lic of 100,608
84711000 Korea Republic of 79,938 84711000 Philippines 9,517 84711000 Malaysia 9,107
84711000 United States of Ameri-ca 4,209
84711000 United Kingdom 1,987 84711000 Japan 1,523 84711000 Thailand 918 84711000 Fiji 464 84711000 New Zealand 82
Total 84711000 5,340,346
94060000 Prefabricated build-ing
China, Peoples Repub-lic of 1,074,512
94060000 Portugal 314,519 94060000 Australia 47,773 94060000 Singapore 3,565
Total 94060000 1,440,369 Total ( Major Commodi�es) 207,022,833 Others Merchandise Imports 316,368,217 Total Merchandise Imports 523,391,050

26 EXTERNAL TRADE STATISTICS, 2013
Exports Table Table 5 : Exports by Major Trading Partners (2013)
Country of Destination Value ($’000)
Germany 7,708 United States of America 5,830 Japan 1,025 Australia 539 Singapore 273 Korea Republic of 149 New Zealand 128 Taiwan 101 Netherlands 86 Belgium 48 Hong Kong 44 Spain 38 Portugal 25 China, Peoples Republic of 22 Denmark 17 Malaysia 10 Indonesia 8
Total Export 16,051

Table 6 : Re-Exports by Country of Destination (2012)
EXTERNAL TRADE STATISTICS, 2013 27
Country of Des�na�on Value ($'000) Singapore 11,097 Indonesia 8,719 Australia 4,783 Sudan 2,219 Liberia 1,818 Cyprus 1,695 United States of America 1,514 Libyan Arab Republic 998 Lebanon 784 United Kingdom 737 Italy 539 Pakistan 444 Malaysia 374 Uganda 299 China, Peoples Republic of 287 Kenya 195 New Zealand 77 Portugal 65 Fiji 58 Belgium 56 Russia 51 Philippines 50 Armenia 46 Mali 44 Hong Kong 42 Papua New Guinea 25
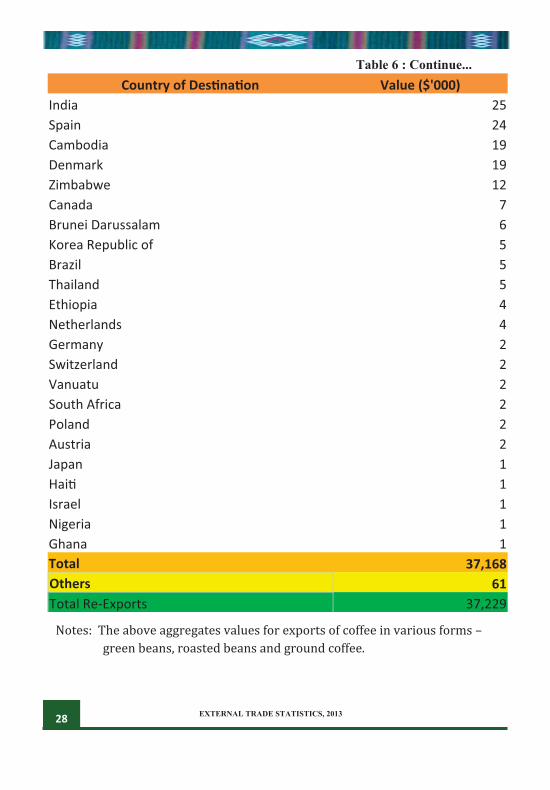
EXTERNAL TRADE STATISTICS, 2013 28
Table 6 : Continue... Country of Des�na�on Value ($'000)
India 25 Spain 24 Cambodia 19 Denmark 19 Zimbabwe 12 Canada 7 Brunei Darussalam 6 Korea Republic of 5 Brazil 5 Thailand 5 Ethiopia 4 Netherlands 4 Germany 2 Switzerland 2 Vanuatu 2 South Africa 2 Poland 2 Austria 2 Japan 1 Hai� 1 Israel 1 Nigeria 1 Ghana 1 Total 37,168 Others 61 Total Re-Exports 37,229
Notes: The above aggregates values for exports of coffee in various forms –
green beans, roasted beans and ground coffee.
29
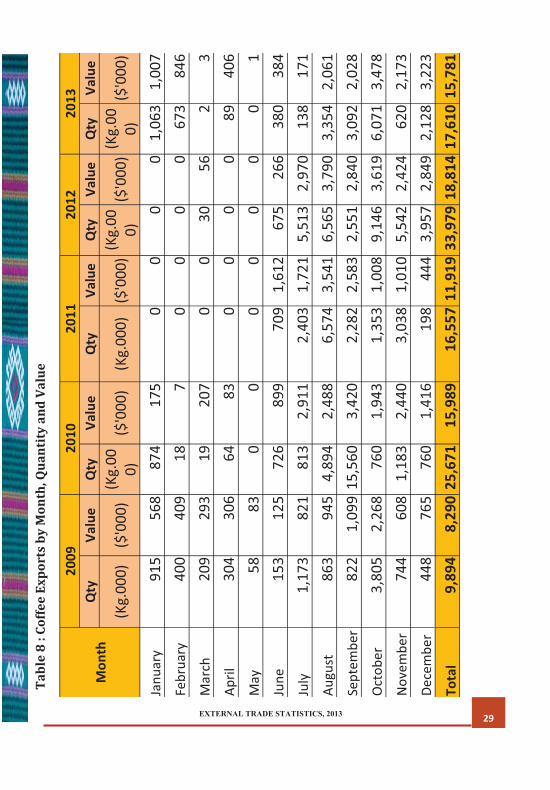
Tabl
e 8
: Cof
fee
Expo
rts
by M
onth
, Qua
ntit
y an
d Va
lue
EXTERNAL TRADE STATISTICS, 2013
Mon
th
2009
20
10
2011
20
12
2013
Q
ty
Valu
e Q
ty
Valu
e Q
ty
Valu
e Q
ty
Valu
e Q
ty
Valu
e
(Kg.
000)
($
'000
) (K
g.00
0)
($'0
00)
(Kg.
000)
($
'000
) (K
g.00
0)
($'0
00)
(Kg.
000)
($
'000
)
Janu
ary
915
568
874
175
0 0
0 0
1,06
3 1,
007
Febr
uary
40
0 40
9 18
7
0 0
0 0
673
846
Mar
ch
209
293
1920
70
030
562
3Ap
ril
304
306
64
83
0 0
0 0
89
406
May
58
83
0
0 0
0 0
0 0
1 Ju
ne
153
125
726
899
709
1,61
2 67
5 26
6 38
0 38
4 Ju
ly
1,17
3 82
1 81
3 2,
911
2,40
3 1,
721
5,51
3 2,
970
138
171
Augu
st
863
945
4,89
4 2,
488
6,57
4 3,
541
6,56
5 3,
790
3,35
4 2,
061
Sept
embe
r 82
21,
099
15,5
603,
420
2,28
22,
583
2,55
12,
840
3,09
22,
028
Oct
ober
3,
805
2,26
8 76
0 1,
943
1,35
3 1,
008
9,14
6 3,
619
6,07
1 3,
478
Nov
embe
r 74
4 60
8 1,
183
2,44
0 3,
038
1,01
0 5,
542
2,42
4 62
0 2,
173
Dece
mbe
r 44
8 76
5 76
0 1,
416
198
444
3,95
7 2,
849
2,12
8 3,
223
Tota
l 9,
894
8,29
0 25
,671
15
,989
16
,557
11,
919
33,9
79 1
8,81
4 17
,610
15,
781
30
EX
TE
RN
AL
TR
AD
E S
TA
TIS
TIC
S, 2
013
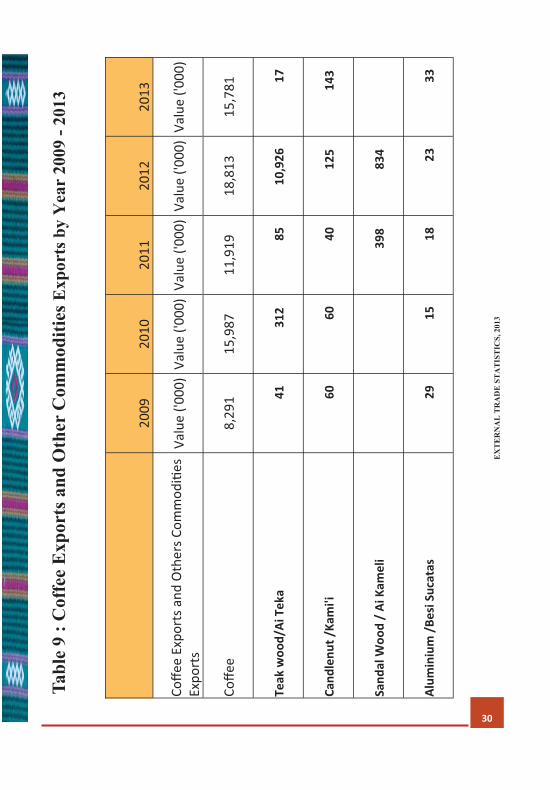
Tabl
e 9
: Cof
fee
Exp
orts
and
Oth
er C
omm
oditi
es E
xpor
ts b
y Y
ear
2009
- 20
13
20
09
2010
20
11
2012
20
13
Coffe
e Ex
port
s and
Oth
ers C
omm
odi�
es
Expo
rts
Valu
e ('0
00)
Valu
e ('0
00)
Valu
e ('0
00)
Valu
e ('0
00)
Valu
e ('0
00)
Coffe
e 8,
291
15,9
87
11,9
19
18,8
13
15,7
81
Teak
woo
d/Ai
Tek
a
4
1
3
12
85
10
,926
1
7
Cand
lenu
t /Ka
mi'i
6
0
60
4
0
1
25
1
43
Sand
al W
ood
/ Ai
Kam
eli
3
98
8
34
Alum
iniu
m /
Besi
Suc
atas
2
9
15
1
8
23
3
3

31 EXTERNAL TRADE STATISTICS, 2013 T
able
10
: Oth
ers C
omm
oditi
es E
xpor
ts b
y Y
ears
200
9 - 2
013
Com
mod
ities
20
09
2010
20
11
2012
20
13
Teak
woo
d/Ai
Tek
a
4
1
3
12
85
10
,926
1
7
Cand
lenu
t /KA
MI'I
6
0
60
4
0
1
25
1
43
Sand
al W
ood
/ Ai
Kam
eli
3
98
8
34
Alum
iniu
m /
Besi
Suc
atas
2
9
15
1
8
23
3
3

32
Charts
Charts 1 : Merchandise Imports by Year 2009 – 2013
EXTERNAL TRADE STATISTICS, 2013
282,595 246,311 318,778
664,014
523,391
-
100,000
200,000
300,000
400,000
500,000
600,000
700,000
2009 2010 2011 2012 2013

33 EXTERNAL TRADE STATISTICS, 2013
Chart 2 : Exports by year 2009 -2013
Chart 3 : Imports and Exports by year 2009 -2013
8,491
16,395 13,202
30,793
16,049
-
5,000
10,000
15,000
20,000
25,000
30,000
35,000
2009 2010 2011 2012 2013
282,595 246,311
318,778
664,014
523,391
8,491 16,395 13,202 30,793 16,049 -
100,000
200,000
300,000
400,000
500,000
600,000
700,000
2009 2010 2011 2012 2013
Imports Exports
34
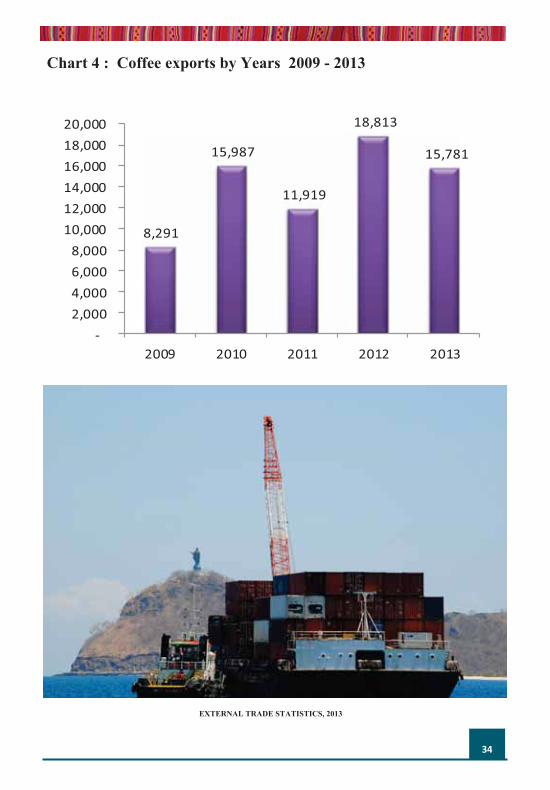
Chart 4 : Coffee exports by Years 2009 - 2013
EXTERNAL TRADE STATISTICS, 2013
8,291
15,987
11,919
18,813
15,781
- 2,000 4,000 6,000 8,000
10,000 12,000 14,000 16,000 18,000 20,000
2009 2010 2011 2012 2013

35
Chart 5 : Coffee Exports and Other Commodities Exports by Year 2009 - 2013
EXTERNAL TRADE STATISTICS, 2013
Chart 6 : Other Commodities Exports by Year 2009 - 2013

Direcção Geral de EstatÍstica Rua de Caicoli, Po Box 10 Dili, Timor-Leste www.statistics.gov.tl