Embed Size (px)
Citation preview

Annual Report: Tara Social and economic changes in Queensland's gasfield communities in 2020
Published: June 2021

Research Project:
Cumulative social and economic impacts of CSG development in the Western Downs
DATA REPORT
INDICATORS OF CHANGE
IN
TARA AND DISTRICT COMMUNITY
Statistical data updated in June 2021
Contact: The University of Queensland, Dr Katherine Witt | Research Fellow
Centre for Natural Gas
The University of Queensland | Brisbane, QLD, 4072 AUSTRALIA
M: +61 (0) 418 619 341 | E: [email protected]
W: www.cng.uq.edu.au

UQ Research Project: Cumulative social and economic impacts of CSG development in Western Downs
2
Tara statistical area 2 (SA2) boundary
Source: http://www.qgso.qld.gov.au/products/maps/qld-sa2-asgs-2016/
Tara Township

UQ Research Project: Cumulative social and economic impacts of CSG development in Western Downs
3
Tara urban centre and locality (UCL) boundary
Source:
http://www.censusdata.abs.gov.au/census_services/getproduct/census/2011/
quickstat/UCL321104?opendocument&navpos=220
Tara postcode boundary 4421
Source: https://www.google.com.au/maps/place/Tara+QLD+4421/@-
27.2279563,150.3680239,10z/data=!4m5!3m4!1s0x6bbc4b4089346037:0x1c00eef4d30914f
0!8m2!3d-27.0745513!4d150.5175918

UQ Research Project: Cumulative social and economic impacts of CSG development in Western Downs
4
Data notes
• UCL non-resident workers population estimate from QGSO 'Surat Basin Population Report' (ASGC 2016); 2020 version available here:
https://www.qgso.qld.gov.au/statistics/theme/population/non-resident-population-queensland-resource-regions/surat-basin
• UCL resident population estimate from the QGSO table ‘Estimated resident population (a) by urban centre and locality (b), Queensland, 2006 to 2016pr’ (ASGS 2016),
http://www.qgso.qld.gov.au/products/tables/erp-ucl-qld/index.php
• SA2 population estimate from the QGSO table ‘Estimated resident population by statistical area level 2 (SA2), Queensland, 2006 to 2016pr’ (ASGS 2016),
http://www.qgso.qld.gov.au/subjects/demography/population-estimates/tables/erp-sa2-qld/index.php
• Population projection (2019 edition) from QGSO table 'Projected population (medium series), by statistical area level 2 (SA2), SA3 and SA4, Queensland, 2011 to 2041' (ASGC 2001),
http://www.qgso.qld.gov.au/subjects/demography/population-projections/tables/proj-pop-medium-series-sa2-sa3-sa4-qld/index.php
Residents (UCL)
Non-resident workers (UCL)
Residents projection (SA2)
Residents (SA2)
-
500
1,000
1,500
2,000
2,500
3,000
3,500
4,000
4,500
5,000P
op
ula
tio
n (
no
. of
per
son
s)Population and Projections

UQ Research Project: Cumulative social and economic impacts of CSG development in Western Downs
5
Data notes
• Population and non-resident worker population estimates for UCL and Western Downs LGA from the QGSO 'Surat Basin Population Report' (ASGC 2016); 2020 version available here: https://www.qgso.qld.gov.au/statistics/theme/population/non-resident-population-queensland-resource-regions/surat-basin
• Data missing for 2008/09 non-resident worker population
-
200
400
600
800
1,000N
o. o
f p
erso
ns
Resident vs. non-resident population
Residents (UCL) Non-resident workers (UCL)
- 5,000
10,000 15,000 20,000 25,000 30,000 35,000 40,000 45,000
No
. of
per
son
s
Population (resident vs. non-residents) - Western Downs LGA
Residents (LGA) Non-residents (LGA)

UQ Research Project: Cumulative social and economic impacts of CSG development in Western Downs
6
Data notes
• Non-resident population, Queensland resource regions: Surat Basin: https://www.qgso.qld.gov.au/statistics/theme/population/non-resident-population-queensland-resource-regions/surat-basin
• Non-resident workers projections (2018) by LGA from QGSO report 'Surat Basin non–resident population projections: 2019 to 2025', https://www.qgso.qld.gov.au/statistics/theme/population/non-resident-population-queensland-resource-regions/surat-basin
• Series A projection is based on the number of non–resident workers on-shift who were engaged in existing resource operations and associated infrastructure activities in the area at June 2019. The projection takes into account future changes to those operational workforces as advised by resource company sources, as well as the estimated construction and operational workforces of Category A projects (i.e. those that are approved and have reached a financial close).
• Series B projection includes the Series A projection plus projected growth in the non-resident population arising from Category B projects (those that are approved but have yet to reach a financial close).
• Series A projection is based on the number of non–resident workers on-shift who were engaged in existing resource operations and associated infrastructure activities in the area at June 2014. The projection takes into account future changes to those operational workforces as advised by resource company sources, as well as the estimated construction and operational workforces of Category A projects (i.e. those that are approved and have reached a financial close).
• Series B projection includes the Series A projection plus projected growth in the non-resident population arising from Category B projects (those that are approved but have yet to reach a financial close).
Non-residents (LGA)
NRW projection A (2019)
NRW projection B (2019)
0
1000
2000
3000
4000
5000
6000
7000
8000
9000
10000
2007/08 2008/09 2009/10 2010/11 2011/12 2012/13 2013/14 2014/15 2015/16 2016/17 2017/18 2018/19 2019/20 2020/21 2021/22 2022/23 2023/24 2024/25
No
. of
per
son
sNon-resident population projections - Western Downs LGA

UQ Research Project: Cumulative social and economic impacts of CSG development in Western Downs
7
Data notes
• 2004-2008 based on SLA statistical boundary; Source: QGSO Regional Database Archived dataset 'Labour Force - Small Area (Qtr Ended 31 Dec 2002 to Qtr Ended 31 Dec 2008) [DEEWR, Small Area Labour Markets Australia] (ASGC 2001)', http://www.qgso.qld.gov.au/products/tables/qld-regional-database/index.php
• 2009-2010 data from DEEWR file 'Unemployment salm_data_files_2008-2013'
• 2010-2020 based on SA2 statistical boundary; Source: QGSO Regional Database dataset 'Labour Force - Small Area (Qtr Ended 31 Dec 2010 to Qtr Ended 31 Dec 2020) [Department
of Jobs and Small Business] (ASGS 2016)', http://www.qgso.qld.gov.au/products/tables/qld-regional-database/index.php
Tara
Queensland (benchmark)
0
2
4
6
8
10
12
2003/04 2004/05 2005/06 2006/07 2007/08 2008/09 2009/10 2011 2012 2013 2014 2015 2016 2017 2018 2019 2020
Un
emp
loym
ent
rate
(%
)Unemployment rate
UQ Research Project: Cumulative social and economic impacts of CSG development in Western Downs
8
Data notes
• Source: Australian Taxation Office (ATO), Research and Statistics, https://www.ato.gov.au/
• Average taxable incomes reported by ATO until 2009 excluded losses. Averages from 2010 include all taxable incomes including incomes of zero and losses.
• Data relates to Tara postcode 4421
• Original data – no discounting applied
• Due to ATO data publishing cycles, 2019/20 data will be included in the 2021 Tara booklet
Tara
Queensland (benchmark)
$-
$10,000
$20,000
$30,000
$40,000
$50,000
$60,000
$70,000
$80,000A
nn
ual
inco
me
($A
U)
Average taxable income (taxable individuals only)

UQ Research Project: Cumulative social and economic impacts of CSG development in Western Downs
9
Data notes
• Source: Australian Taxation Office (ATO), Research and Statistics, https://www.ato.gov.au/
• Data relates to Tara postcode 4421
• Original data – no discounting applied
• Due to ATO data publishing cycles, 2019/20 data will be included in the 2021 Tara booklet
0
100
200
300
400
500
600
700
800
900
$-
$5
$10
$15
$20
$25
$30
$35
$40
No
. of
earn
ers
Earn
ings
($
AU
per
yea
r)M
illio
ns
Total wage and salary earnings
No. wage and salary earners Total wage and salary earnings

UQ Research Project: Cumulative social and economic impacts of CSG development in Western Downs
10
Data notes
• Source: Australian Bureau of Statistics, Cat. 8165, https://www.abs.gov.au/
• Data based on SA2 (Tara) statistical boundary
0
50
100
150
200
250
2008/09 2009/10 2010/11 2011/12 2012/13 2013/14 2014/15 2015/16 2016/17 2017/18 2018/19 2019/20
Co
un
t o
f b
usi
nes
s (n
o.)
Count of Businesses by Turnover (NPP)
0k-100k 100k-499k 500k-2m 2m+

UQ Research Project: Cumulative social and economic impacts of CSG development in Western Downs
11
Data notes
• Source: Australian Bureau of Statistics, Cat. 8165, https://www.abs.gov.au/
• Data based on SA2 (Tara) statistical boundary
0
50
100
150
200
250
300
350
400
450
2008/09 2009/10 2010/11 2011/12 2012/13 2013/14 2014/15 2015/16 2016/17 2017/18 2018/19 2019/20
Co
un
t o
f b
usi
nes
s (n
o.)
Count of Businesses by Turnover (PP)
0k-100k 100k-499k 500k-2m 2m+

UQ Research Project: Cumulative social and economic impacts of CSG development in Western Downs
12
Data notes
• Source: QGSO Regional Database dataset 'Residential land and dwelling sales (Year Ended 30 Sep 2000 to Year Ended 31 Dec 2020) [DNRM] (ASGS 2016)',
http://www.qgso.qld.gov.au/products/tables/qld-regional-database/index.php
• Median house sale price and house sales based on SA2 statistical boundary
0
50
100
150
200
250
300
350
400
450
500
$-
$100
$200
$300
$400
$500
$600
$700
$800
2000 2001 2002 2003 2004 2005 2006 2007 2008 2009 2010 2011 2012 2013 2014 2015 2016 2017 2018 2019 2020
No
. of
ho
use
sal
es
Pri
ce (
$A
U)
Tho
usa
nd
s
Median house sale price
No. of house sales - Tara Tara (SA2) Brisbane (benchmark)

UQ Research Project: Cumulative social and economic impacts of CSG development in Western Downs
13
Data notes
• Source: QGSO Regional Database dataset 'Median rent (Year Ended 30 Sep 1990 to Year Ended 31 Dec 2020) [RTA] (ASGS 2016)', http://www.qgso.qld.gov.au/products/tables/qld-
regional-database/index.php
• Rent value data based on SA2 statistical boundary
$8
4
$8
5
$8
6
$9
0 $1
10
$1
09
$1
18
$1
38
$1
50
$1
51
$1
71
$1
93
$2
20
$2
32
$2
30
$2
28
$2
03
$2
00
$2
00
$2
05
$1
25
Queensland (benchmark)
$-
$50
$100
$150
$200
$250
$300
$350
$400
2000 2001 2002 2003 2004 2005 2006 2007 2008 2009 2010 2011 2012 2013 2014 2015 2016 2017 2018 2019 2020
Wee
kly
ren
t ($
AU
)Median weekly rent (3-bedroom house)
Median weekly rent Queensland (benchmark)

UQ Research Project: Cumulative social and economic impacts of CSG development in Western Downs
14
Data notes
• Source: QGSO Regional Database dataset 'Building Approvals (Jul 2001 to Dec 2020) [ABS 8731.0] (ASGS 2016)', http://www.qgso.qld.gov.au/products/tables/qld-regional-
database/index.php
• Data based on SA2 statistical boundary
• Approvals shown for private buildings only; public developments are excluded
• Private non-residential building approvals remained at zero between 2002 and 2020
0
2
4
6
8
10
12
2001 2002 2003 2004 2005 2006 2007 2008 2009 2010 2011 2012 2013 2014 2015 2016 2017 2018 2019 2020
No
. of
app
rova
lsNew building approvals
Residential building approvals Non-residential building approvals
UQ Research Project: Cumulative social and economic impacts of CSG development in Western Downs
15
Data notes
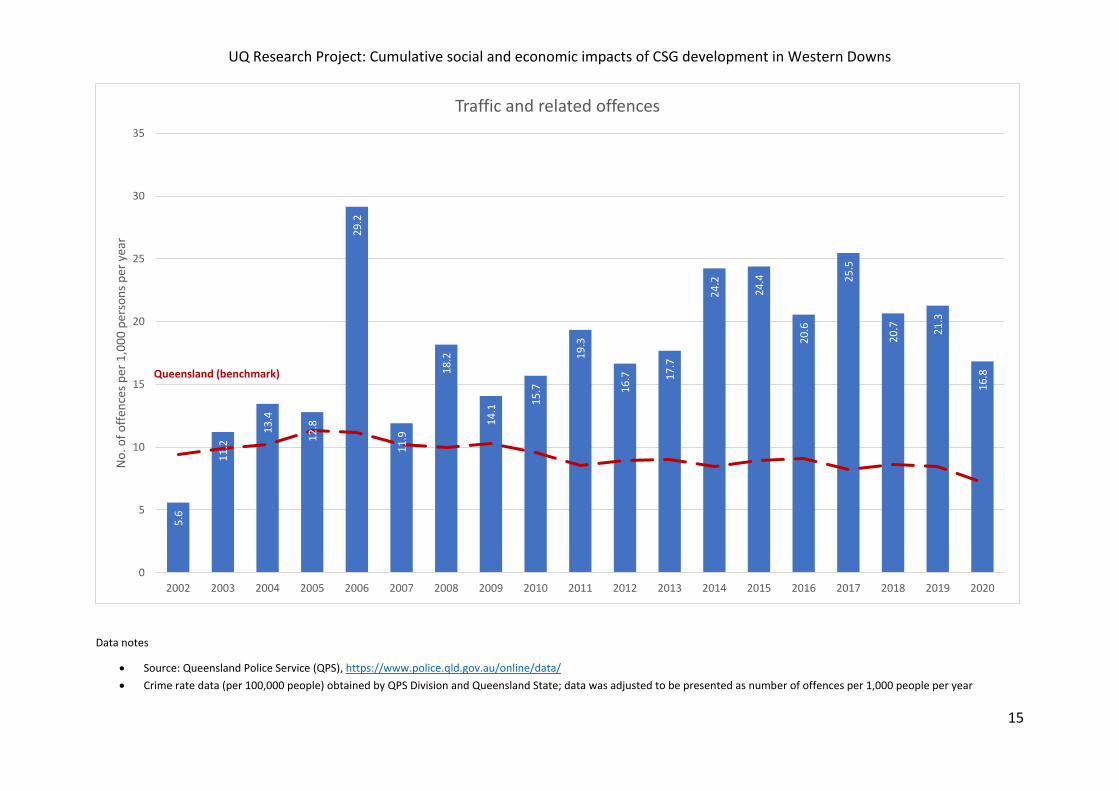
• Source: Queensland Police Service (QPS), https://www.police.qld.gov.au/online/data/
• Crime rate data (per 100,000 people) obtained by QPS Division and Queensland State; data was adjusted to be presented as number of offences per 1,000 people per year
5.6
11
.2
13
.4
12
.8
29
.2
11
.9
18
.2
14
.1
15
.7
19
.3
16
.7 17
.7
24
.2
24
.4
20
.6
25
.5
20
.7 21
.3
16
.8Queensland (benchmark)
0
5
10
15
20
25
30
35
2002 2003 2004 2005 2006 2007 2008 2009 2010 2011 2012 2013 2014 2015 2016 2017 2018 2019 2020
No
. of
off
ence
s p
er 1
,00
0 p
erso
ns
per
yea
rTraffic and related offences

UQ Research Project: Cumulative social and economic impacts of CSG development in Western Downs
16
Data notes
• Source: Queensland Police Service (QPS), https://www.police.qld.gov.au/online/data/
• Crime rate data (per 100,000 people) obtained by QPS Division and Queensland State; data was adjusted to be presented as number of offences per 1,000 people per year
Drug Offences
Good Order Offences
Other Theft (excl. Unlawful Entry)0
10
20
30
40
50
60
70
80
90N
o. o
f o
ffen
ces
per
1,0
00
per
son
s p
er y
ear
Other relevant offences
Drug Offences
Good Order Offences
Other Theft (excl. Unlawful Entry)
0.0
5.0
10.0
15.0
20.0
25.0
30.0
35.0
2002 2003 2004 2005 2006 2007 2008 2009 2010 2011 2012 2013 2014 2015 2016 2017 2018 2019 2020
No
. of
off
ence
s p
er 1
,00
per
son
s p
er
year
Other relevant offences - Queensland

UQ Research Project: Cumulative social and economic impacts of CSG development in Western Downs
17
Data notes
• Source: Queensland Police Service (QPS), https://www.police.qld.gov.au/online/data/
• Crime rate data (per 100,000 people) obtained by QPS Division and Queensland State; data was adjusted to be presented as number of offences per 1,000 people per year
Queensland total crime rate
0
50
100
150
200
250
2001 2002 2003 2004 2005 2006 2007 2008 2009 2010 2011 2012 2013 2014 2015 2016 2017 2018 2019 2020
No
. of
off
ence
s p
er 1
,00
0 p
erso
ns
per
yea
rTotal offences
Offences Against the Person Offences Against Property Other Offences

UQ Research Project: Cumulative social and economic impacts of CSG development in Western Downs
18
Data notes
• Source: Bureau of Meteorology Climate Data online, http://www.bom.gov.au/climate/data/
• Rainfall observations are reported for Woodlea Weather Station
• Where missing data is indicated, gaps exist in daily rainfall observations
Historic Average
0
100
200
300
400
500
600
700
800
900
2001 2002 2003 2004 2005 2006 2007 2008 2009 2010 2011 2012 2013 2014 2015 2016 2017 2018 2019 2020
Rai
nfa
ll (m
m)
Rainfall
Summer (Jan-Mar, Oct-Dec) Winter (Apr-Sept)
*
* *
*
*
*
*
**
*
*
* *