Embed Size (px)
Citation preview

ANNUAL REPORT15 April - 31 December 2017

Strategic report
Overview
Business model 4
Our mission 6
Strategic summary 8
Chief Executive's Review 10
Health and Safety
Safety record 18
Approach 21
Strategy in action
UK and Ireland Fuels 32
International Fuels 42
Global Biofuels 50
Infrastructure 56
Market review
Global markets 24
UK and Irish markets 25
Biofuel markets 26
Brazilian market 28
Canadian market 29
Middle Eastern market 30
1
3
4
5
2
2 ANNUAL REPORT APRIL – DECEMBER 2017
STRATEGIC REPORT » CONTENTS
Following a change in our financial year, this report relates to the 37 week period from 15 April – 31 December 2017.
Key performance indicators
Financial KPIs 63
Operational KPIs 65
Enviromental KPIs 66
Service quality KPIs 67
Managing our risks
Risk overview 73
Risk register 74
People and environment
Executive Directors 84
Employment 86
Biofuel sustainability 88
Carbon emissions 90
Directors' reports
Strategic report 92
Directors’ report 94
Chief Financial Officer's Review 68
8
10 11
97
6
3
Financials
Independent auditors’ report 98
Consolidated income statement 100
Consolidated statement 101 of comprehensive income
Consolidated and 102 Company balance sheets
Consolidated statement 104 of changes in equity
Company statement 105 of changes in equity
Consolidated and Company 106 statements of cash flows
Notes to the financial 107statements
Officers and 147professional advisors
Registered offices 148
Business modelOur unique supply chain enables us to source fuel products from the lowest-cost global producers and move that fuel in the most efficient way to our customers’ forecourts.
Global originationWe source from around the world in order to find the lowest cost petrol, diesel and biofuel products. By maintaining flexibility and optionality in our purchasing, we are able to respond quickly to market requirements to source fuel products at minimum cost.
Infrastructure We continue to invest in fuel infrastructure in order to access global diesel and gasoline markets and provide supply resilience for customers.
From supplier
To customer
Manufacturing from wastesBy owning and operating two of Europe’s largest waste-to-biodiesel manufacturing facilities, we also have a low-cost and sustainable supply of biofuel with which to meet rising UK biofuel supply obligations.
Customer salesWe supply fuel to customers in the UK, Ireland, Canada and Brazil. Our customers come from all key segments, including oil companies, supermarkets, independently owned forecourts and commercial users. In all markets our commitment to low-cost and resilient fuel supply chains earns long-term customer loyalty.
LogisticsWe manage the fuel supply chain for many of our customers, taking care of stock management and delivery as well as fuel supply. In the UK our in-house haulage operation provides flexibility to deliver from the lowest-cost supply location and control over the quality of service we provide to customers.
To customer
From supplier
From supplier
54 ANNUAL REPORT APRIL – DECEMBER 2017
OVERVIEW » BUSINESS MODEL

Our missionTo deliver long-term customer partnerships by being the fuel provider with the:
» Lowest-cost» Highest reliability» Best systems and control» Easiest people to deal with» Most transparency
Navigator Terminals | Thames, UK
76 ANNUAL REPORT APRIL – DECEMBER 2017
OVERVIEW » OUR MISSION

Strategic summary
International Fuels
UK and Ireland Fuels p32
UK and Ireland Fuels
Our aim
Develop low-cost and resilient fuel supply chains to earn the long-term loyalty of our customers in the UK and Ireland
Highlights:
» Acquisition of Inver Energy, giving us a business in Ireland for the first time and access to the Inver retail brand
» Opening of Thames Oilport for diesel supply, creating capacity and resilience in the busy South East Region
» Further growth in sales to independent forecourt operators, including under our Branded Wholesaler agreement with Esso in the UK, and to other delivered-in customers.
Our aim
Expand by replicating our UK success in other markets
Highlights:
» In Canada, acquisition of the CAN-OP fuel business in Northern Ontario, expanding our existing supply footprint into a new region
» Also in Canada, continued expansion of our supply chain capability to enable sourcing from North America by rail and Europe by sea, giving us supply chain optionality and the ability to ensure year-round product availability for customers
» Further growth in our diesel imports into Brazil
» Successful first period of commercial operations by our petrol blending joint venture in Bahrain.
Global Biofuels Infrastructure
Our aim
Create value from biofuel manufacturing and supply
Highlights:
» Continued growth in our biodiesel manufacturing output as a result of investments in incremental process improvements
» Further extension of our raw material supply chains, particularly outside Europe, to allow for sourcing of waste oils with particular quality characteristics or in smaller containers
» Growth in sales of biofuel and UK Renewable Transport Fuel Certificates to other oil companies.
Our aim
Acquire, regenerate and operate assets that support our supply chain objectives
Highlights:
» Successful start to diesel throughput and supply at Thames Oilport in the UK
» Also in the UK, completion of a diesel pipeline linking our various Teesside facilities and expansion of a jetty pipeline on the Thames, creating cost and operational efficiencies
» Purchase of a 50% share of the AFSC terminal at Foynes, a deep-water multi-product terminal on the west coast of Ireland, as part of our acquisition of Inver Energy
» In Canada, acquisition of the CAN-OP rail-fed facility at Thunder Bay and completion of works to double the size of our first rail-to-road supply location in Toronto.
International Fuels p42
Global Biofuels p50
Infrastructure p56
98 ANNUAL REPORT APRIL – DECEMBER 2017 9
OVERVIEW » STRATEGIC SUMMARY

The increase in biofuel supply obligations in the UK represents a significant development for the business. Our investments in biodiesel manufacturing facilities and raw material supply chains position us well to meet the rapidly growing requirement for waste-based biofuel.
"The business continued to perform to expectation in this 37 week period. We expanded our international businesses both organically and through acquisition and grew delivered-in sales in the UK. Our biodiesel manufacturing operation made a particularly strong contribution following investment in incremental process improvements. "Andrew OwensChief Executive
Chief Executive's Review
Safety, Health, Environment and Quality
Our approach to safety is underpinned by open and honest reporting and sharing of event learnings across the business. With this awareness, we are best placed to take effective action to prevent future events.
A particular priority this period was to address the rate of RIDDOR1 reportable injuries resulting from manual-handling or slips by drivers, which had increased in FY17. We introduced more targeted training, including our own video, which resulted in a significant reduction in this type of injury this period.
As we expand internationally, we are introducing our safety culture to employees who are new to the business and providing training and auditing for our international businesses.
Markets
The most significant market change this period was the introduction of new legislation in the UK to increase biofuel supply obligations, which we expect will support the continued strong performance of our biofuels business. Effective April 2018, the percentage of biofuel that UK fuel suppliers are required to blend into their petrol and diesel increased from 4.75% to 7.25%, with further rises legislated for in subsequent years. With new caps on supply of crop-based biofuel, these higher obligations will be met primarily from waste-based biofuel of the kind we manufacture in the UK. This will create important new supply and margin opportunities.
Global demand for diesel continued to rise as a result of world economic growth. With OPEC maintaining its production restrictions, diesel stocks started to deplete this period, exacerbated by hurricanes in the latter half of 2017.
As a result, diesel markets tightened and returned to backwardated market conditions. Therefore, we sold out the diesel we were holding in long-term storage at Thames Oilport and on Teesside.
In the UK, road fuel demand remained flat and surprisingly dieselisation continued, with diesel demand rising 1.0% in the 2017 calendar year and gasoline demand falling by 1.9%. We expect this trend to reverse as a result of Government plans to improve air quality by curbing the use of diesel vehicles, which in calendar year 2017 resulted in a fall in new diesel car registrations.
Health and Safety p17
Market review p23
Boardroom | London, UK
EBITDA2
£67.2m
KPI
(excluding exceptionals for 37 week period)
1 www.hse.gov.uk/riddor2 Earnings before interest, taxation, depreciation and amortisation
1110 ANNUAL REPORT APRIL – DECEMBER 2017
CHIEF EXECUTIVE'S REVIEW

Chief exec reviewKPI: EBITDA
(excluding exceptionals)
20130
80
60
2014 2015
100
£ (
mill
ion
)
20
40
2016 2017
67.2
30.9
20.5
47.6
17.6 89.2
23.3
15 A
pr
- 31
Dec
1 Ja
n -
14 A
pr
Chief exec reviewKPI: Global sales volume
pg 12
20130
20
15
10
2014 2015
5
2016 2017
14.4
5.3
17.6 19.1
Bill
ion
litr
es
15 A
pr
- 31
Dec
1 Ja
n -
14 A
pr
15.1 15.5
Results
Our results were affected by the change in year-end from 15 April to 31 December resulting in a shorter 37 week trading period.
EBITDA1 amounted to £67.2 million for the 37 week period from 15 April 2017 to 31 December 2017 (equivalent period in 2016: £70.6m). Profit before tax and before exceptionals totalled £48.0m (equivalent period in 2016: £56.4m). The most significant impact on performance was from:
» Volume growth in our biodiesel production, combined with stronger manufacturing margins achieved by supply chain diversification and efficiency and reliability improvements
» Strong but transient margins for imports into Brazil
» Lower UK diesel margins in tighter market conditions following hurricanes in the latter half of 2017.
Chief Financial Officer’s Review p68
Financial KPIs p63
Thames Oilport | UK
KPI: EBITDA (excluding exceptionals)
KPI: Global sales volume
1 Earnings before interest, taxation, depreciation and amortisation
1312 ANNUAL REPORT APRIL – DECEMBER 2017
CHIEF EXECUTIVE'S REVIEW » RESULTS

Chief exec reviewFuel sales by region
15 April -31 December
UK and Ireland
Brazil
Canada
84% 12%4%
Fuel sales by region 15 April 2017 – 31 December 2017
International FuelsWe continue to use our UK experience and capabilities to expand in new markets.
In Canada, we are developing flexible supply chains and investing in infrastructure in order to provide low-cost fuel to our customers, using sea and rail access to deliver supply resilience throughout the year. Our acquisition of CAN-OP, a fuel marketer and terminal operator in Northern Ontario, gives us an additional rail-fed distribution location in the growing Ontario fuels market. We also completed the development of the Breakaway retail brand offer and commenced roll-out of the concept to Canadian dealers. With developments both in our supply chain and our customer offer, we are well positioned for further growth in Canada.
The Brazilian market increased its reliance on fuel imports, creating ongoing, but transient, supply opportunities for us in Brazil. We expanded our diesel supply into Brazil and towards the end of the period made our first gasoline imports, building on our reputation as a trusted trading counterparty.
In the Middle East, we are part of Bahrain Gasoline Blending (BGB), a strategic joint venture between nogaholding, Bapco (the national oil company of Bahrain) and Greenergy. This period, BGB successfully blended gasoline to meet domestic Bahraini demand and made its first export cargo. The joint venture is evaluating engineering works to expand and enhance the gasoline blending facilities in Bahrain to give greater trading capability and flexibility.
International Fuels p42
This period we made three acquisitions, taking over Inver Energy in the UK and Ireland, CAN-OP in Canada and concluding a waste oil origination joint venture in Australia. Each of these transactions was originated through our industry relationships.
Strategy
UK and Ireland FuelsIn the UK, strong refining margins resulted in highly competitive market conditions. However, we continued to grow, delivered-in sales to commercial and retail customers, including as part of our branded wholesaler agreement with Esso. The number of independent forecourt sites we were contracted to supply increased organically to 521 at the end of the period, up 32% from April 2017. As we earn trust and respect in the sector as a flexible and high service fuel supplier, we won new business from all competing brands.
In line with the growth of our delivered-in business, we expanded our in-house haulage capability within Greenergy Flexigrid, recruiting additional drivers and extending our fleet to minimise our reliance on sub-contractors.
We were pleased to acquire Inver Energy’s fuel infrastructure and supply businesses, giving us a supply footprint in Ireland for the first time. Inver’s business model is very similar to Greenergy’s, based on importing lowest-cost products and staying close to customers. Inver has its own retail brand in Ireland and we intend to offer the brand to retail dealers in other markets.
Our UK margins were affected by a tightening of the global diesel market and a return to backwardated market conditions. One-off costs were also created as a result of third-party damage to one of our busiest jetties on the Thames, which severely restricted downwards the size of ships that could use the jetty. As smaller ships cost more to operate, this resulted in higher product and shipping-related costs for the business, but our ability to maintain continuous supply through this period is evidence of the supply resilience we offer to customers.
Partially offsetting the Thames jetty issue, we commissioned two new product pipelines. The first links the deep-water jetty at our North Tees facility with our other terminals on Teesside, allowing large and lower cost diesel ships to supply all terminals. The other, on the Thames, allows gasoline ships to discharge at much higher rates, cutting jetty time and demurrage bills.
UK and Ireland Fuels p32
Chief Executive's Review (continued)
1514 ANNUAL REPORT APRIL – DECEMBER 2017
CHIEF EXECUTIVE'S REVIEW

Health and Safety3
Global BiofuelsDemand for waste-based biofuel increased significantly in the UK from April 2018 as a result of the introduction of higher blending obligations. In anticipation of these higher mandates we have been working to increase our production of biodiesel from waste through a variety of incremental expansion investments at our manufacturing facilities. Our biodiesel output was 26% higher this period compared with the same period in 2016.
We also invested further in upstream raw material supply chains, including through a new joint venture in Australia, in order to access growing volumes of feedstock with quality characteristics best suited to our manufacturing facilities. We have been particularly successful in moving used cooking oil from Asia to the UK and we plan more investments in this area.
InfrastructureWe continue to make strategic infrastructure investments to support our fuel supply objectives.
In the UK, we opened Thames Oilport for diesel supply by truck having regenerated former refinery infrastructure for use as an import terminal. This gives us a second supply location on the Thames and deep-water import capability. Through the acquisition of Inver Energy we also now own a share of the Foynes terminal in Ireland and 100% of the Cardiff terminal in the UK.
We also made strong progress towards realising the value of the substantial surplus land associated with Thames Enterprise Park, which uses land not required for Thames Oilport. Our first land disposals were ahead of expectation and the permitting process for land development gained strong momentum.
In Canada, we completed works to double the size of our first rail-to-road supply location in Toronto, creating additional capacity at a location that is convenient for customers. Following our acquisition of the CAN-OP business in Northern Ontario, we plan to refurbish and expand the Thunder Bay fuel terminal in order to benefit from its position at a key petroleum supply/trading intersection.
OwnershipFollowing the investment by Brookfield Business Partners which completed in May 2017, Greenergy Fuels Holdings is now a Brookfield subsidiary. The Executive Directors of Greenergy Fuels Holdings are unchanged and continue to run the business. The investment by Brookfield Business Partners increases our access to capital and allows us to participate in larger-scale strategic project and acquisition activities.
Outlook
Looking forward we expect to grow our supply to the UK independent forecourt sector and expand our Irish operations. We also see further opportunities within our global biofuels business, in our fuel supply operations in Canada and Brazil and in BGB, our joint venture in Bahrain, and we expect these areas to be the main recipients of our project capital expenditure going forward. We also remain active in seeking further bolt-on acquisition opportunities in both the petroleum and biofuel markets across the world.
Global Biofuels p50
Infrastructure p56
As we expand our biodiesel manufacturing operations in the UK, we are also investing upstream to source waste oils globally. This period we concluded a new joint venture partnership in Australia and expanded our joint venture operations in China.
Andrew OwensChief Executive
1716 ANNUAL REPORT APRIL – DECEMBER 2017
CHIEF EXECUTIVE'S REVIEW

Incident rate per 100,000 hours worked
FY17 (April 2016 to April 2017)
-
0.0 0.7
1.0
3.1
14.8
263.9
Fatalities
RIDDOR dangerous occurrences or injuries
Lost time injuries
Minor injuries
Near misses
Hazard observations
Safety record
Where we have gained important learning from events, that information is communicated across the business as part of our policy of prevention and continual improvement.
In the previous financial year we witnessed a rise in the rate of RIDDOR reportable injuries, primarily as a result of drivers sustaining injuries through manual-handling or slips.
This period, all injury rates have reduced. A contributing factor has been improved sharing of event learnings when significant injuries and events occur, to increase awareness and help prevent further events of the same kind.
There were three separate RIDDOR reportable injuries across the business this period:
» Two slip/trip/fall injuries to drivers
» One other injury to a driver.
There were no RIDDOR dangerous occurrences.
DEFINITIONS RIDDOR dangerous occurrence: an incident with a high potential to cause death or serious injury (as defined by the RIDDOR regulations).
RIDDOR injury: a specified major injury such as a fracture or serious burns, or an injury resulting in an absence from or restricted work for more than seven days.
Lost time injury: an injury resulting in an absence from work beyond the shift in which the injury was sustained.
Minor injury: an injury which is not RIDDOR reportable and does not require time off work or restricted work duties.
Near miss: an unplanned event that did not result in injury, illness, damage or non-compliance but which had the potential to do so.
Hazard observation: an ‘act’ or a ‘condition’ that has the potential to cause injury, loss or damage.
"We focus on continuous improvement in safety across the business, with our key message of Certainty, Curiosity and STOP reiterating personal accountability for safety. "Kolade AfuwapeHead of Process Integrity
Per 100,000 hours worked
15 April 2017 to 31 December 2017
-
- 0.3
0.8
2.5
7.2
243.8
RIDDOR events/injuries
Lost time injury
Minor injuries
Near misses
Hazard observations
Fatalities
1918 ANNUAL REPORT APRIL – DECEMBER 2017
HEALTH AND SAFETY » SAFETY RECORD

Case study
Learning from events
A large proportion of lost-time and RIDDOR reportable injuries in FY17 were related to manual handling issues amongst our drivers. We therefore created a bespoke training programme and video focused specifically on correct manual handling techniques for routine driver tasks such as draining and handling fuel delivery hoses. This has contributed to a marked reduction in lost-time injuries related to manual handling and has been positively received by drivers.
Customer forecourt | Bristol, UK
Approach
This period we made a number of international acquisitions. Our immediate focus has been the integration of our health and safety standards into these businesses.
Open and honest reporting
We maintain a strong reporting culture across all parts of the business, from high hazard operating sites and haulage operations to offices. We encourage observation and reporting of hazards, near misses and unwanted events, however small, without fear of blame.
By capturing information about hazards and incidents that might easily remain unnoticed, we aim to reduce risks and improve safe working practices. We have worked to ensure that new staff, contractors and businesses are rapidly introduced to the Greenergy culture of open and honest reporting.
Investigation and learning
A comprehensive central reporting system supports the detailed reporting and systematic investigation of each reported observation and unwanted event, so we can identify lessons to be learned from individual events and broader trends. We then act to correct issues that have potential to lead to injuries, asset damage, environmental impacts or significant business impact.
Where key lessons have been identified, a ‘Lesson Learned’ brief is produced and shared across the business via noticeboards, the intranet and toolbox talks. A monthly Flexigrid safety bulletin has also been introduced to share key learnings and performance with haulage staff and drivers.
International safety awareness
We recognise the importance of extending our strong SHEQ (Safety, Health, Environment and Quality) culture to all parts of our growing global business. We have developed and started to implement a long- term plan to extend SHEQ support, training and auditing to our international businesses. Gap assessments and audits have been introduced to gain a broad understanding of the existing SHEQ culture in new business areas. Based on this we have started a programme of training on safety awareness, hazard observations and Greenergy expectations for safety walks, event reporting and investigation in our international businesses.
Personal safety
2120 ANNUAL REPORT APRIL – DECEMBER 2017
HEALTH AND SAFETY » CASE STUDY

Safe operating standards
We continue to review, extend and improve our Safe Operating Standards to provide a structured and consistent approach to safety across all our operations.
Continual improvement of the standards is driven by the Process Integrity team. The team shares knowledge and experience from all parts of the business, including joint venture businesses and contract operators working on behalf of Greenergy, formally and informally through team and cross-site meetings, publications, intranet and management leadership.
Auditing
Group Process Integrity audits continued across all our operations, at all our own facilities and also at joint venture facilities. To ensure compliance with Greenergy performance requirements, we also capture third-party terminals and contract haulage operations within our audit programme.
This period, the full auditing plan was extended to include existing international operations and new acquisitions.
Where we have identified opportunities for improvement of facilities or processes, follow up audits take place to ensure recommendations have been implemented.
Emergency planning and exercise
Whilst our SHEQ management systems focus strongly on the prevention of unwanted events, we do recognise the potential for such events to occur and the need to be prepared for such eventualities.
We ensure that all of our facilities and business operations have effective emergency management plans in place and we review and test these plans on a regular basis. At a strategic level, the Group Crisis Management Plan is reviewed regularly. Following a recent review we have provided awareness information to refresh the whole Greenergy workforce on when and how to activate this plan.
Process safety Market review4
2322 ANNUAL REPORT APRIL – DECEMBER 2017
HEALTH AND SAFETY » APPROACH

1000
1500
2000
3000
3500
4000
2500mt
Dec 17Jan 17Jan 16Jan 15Jan 14Jan 13
Bill
ion
to
nn
es
2.25
2.05
1.45
1.25
1.85
1.65
2013 2014 20152011 2012 2016 2017
Diesel
Petrol
Mill
ion
to
nn
es
15
10
5
(5)
(10)
(15)
0
2005 2007 2009 2011 2013 2015 2017
Net imports
Net exports
Global markets
Global diesel demand growth was not offset by increased refinery production, and product stocks fell from their previous levels. Market structures changed as a result and we sold out our contango stocks.
The announcement of UK Government plans to curb the use of diesel vehicles did not immediately affect demand for UK diesel fuel.
Fuel products have been in plentiful supply over recent years, with diesel stocks reaching a peak in Europe at the end of 2015 and declining slowing subsequently. This resulted in contango market conditions from 2015 into early 2017, meaning that prompt prices were lower than forward prices.
In these prior years, when the level of the contango exceeded tankage and working capital costs, we put diesel into storage at Thames Oilport and Navigator North Tees in the UK, where we had available capacity. This represented a new source of margin for the business.
This period, however, the market moved from a contango to a backwardated price structure. Even though refinery margins were strong and refinery utilisation rates high, global diesel demand outstripped production and diesel stocks declined. The market tightness was exacerbated by hurricanes in the latter half of 2017, which temporarily affected refinery production in the US. With these changing market conditions, we released our diesel from contango storage.
UK and Irish markets
Fuel imports into the UK
Net imports of petroleum products were lower than in 2016 due to:
» Continuing strong refiningmargins and high utilisationrates for UK refineries
» The ending of contango marketconditions, which had resultedin stock building and recordlevels of imports in 2016.
As a result, the level of net imports into the UK was 10.1m tonnes, down from 10.5m tonnes in 20162.
Source: Reuters 1 SMMT 2 UK Department for Business, Energy and Industrial Strategy
of Irish fuel demand is met through imports
70%
Ireland relies on fuel imports to meet its growing fuel requirements
Road fuel demand in Ireland continues to rise as a result of population growth. Dieselisation continued this period, with diesel demand rising 3.4% in the calendar year 2017 and gasoline demand falling 1%.
Ireland has one refinery located in the rural south and no pipeline-fed inland terminals, so 70% of Irish fuel demand is met through imports. Our acquisition of 50% of the Foynes import terminal as part of the Inver Energy transaction gives us a strategically important supply location to meet demand in the west of the country.
UK and Ireland Fuels p32
Global markets ARA diesel stocks
Continued growth in UK diesel demand
Road fuel demand in the UK remained flat in the 2017 calendar year (2016: up 2.2%). Once again, there was growth in diesel demand, up 1.0% (2016: up 4.2%), while gasoline demand fell by 1.9% (2016: down 1.3%).
The continued rise in diesel consumption occurred despite the announcement of Government plans to reduce diesel engine emissions, including higher taxes on new diesel vehicles from 2018. This impacted sales of new diesel cars (down 17% in the 2017 calendar year1) but at year- end had not yet affected demand for diesel fuel, which is also used by buses, light and heavy goods vehicles.
Road fuel demand
2.65
2.45
Net fuel import
2524 ANNUAL REPORT APRIL – DECEMBER 2017
MARKET REVIEW » GLOBAL MARKETS / UK AND IRISH MARKETS
UK and Ireland Fuels p32

4
10
12
8
6
Pec
enta
ge
%
Apr2014
Apr2018
Apr2017
Jan2020
Jan2019
Jan2022
Jan2021
Apr2016
Apr2015
Apr2013
4.75%
10.4%10.1%
7.25%
8.50%
9.75%
Post year-end, the UK Government adopted legislation to amend the UK’s Renewable Transport Fuel Obligation.
The new legislation:
» Significantly increases the amount of waste-based biofuel that must be blended into fuel in the UK
» Introduces maximum levels for competing biofuels made from crops.
These changes take effect from April 2018 and create new supply opportunities for us as Europe’s largest producer and supplier of biofuel from waste.
UK biofuel supply obligations
Biodiesel manufacturing facility | Teesside, UK
Percentage biofuel inclusion rates required under the Renewable Transport Fuel Obligation
Global Biofuels p50
Case study
Rising biofuel supply obligations
2726 ANNUAL REPORT APRIL – DECEMBER 2017
MARKET REVIEW » BIOFUEL MARKETS

Market reviewBrazil marketDiesel imports into Brazil
0
8
14
12
10
6
cbm
(m
illio
n)
4
2
2013 20162015 201720142012
Diesel imports into Brazil
Brazilian market
The Brazilian road fuels market continued its rapid transition from a regulated market supplied by the ‘national’ oil company to a growing import market.
Severe hurricanes in autumn 2017 resulted in lost refinery output in the USA Midwest, increasing our products costs into Canada.
Canadian market
We source lowest-cost product from across the world for our Canadian fuel supply business, and the USA Mid-West and Europe are both key sources of product to us. Hurricanes resulted in a sudden fall in refinery output in both the USA Mid-West and mid-continent, and any available product from the Mid-West headed south and east to replace lost production in Texas.
With our unique marine and rail-fed logistics capability and our supply chain flexibility, we were able to switch our sourcing to other markets to ensure continued supply resilience for customers. However, we incurred higher product costs and lower margins in Canada until normal refinery production resumed.
Canada p44
Growing requirement for fuel imports
The Brazilian road fuels market has historically been supplied almost exclusively by the state-regulated ‘national’ oil company but is currently undergoing significant change.
This period, the ‘national’ oil company:
» Reduced its supply into the domestic market, resulting in growing demand for fuel imports by new suppliers such as Greenergy
» Began divesting of infrastructure assets, reducing future domestic supply capacity.
Together, these trends are increasing the country’s requirement for fuel imports. Diesel imports were equivalent to 24% of domestic diesel demand in 2017, up from 15% the previous year. Gasoline imports accounted for 15% of the domestic gasoline market in 2017, up 1.5m cbm on 2016.
The ‘national’ oil company also introduced daily pricing from July 2017, replacing the periodic price reviews which characterised the market in the previous year. The move to a pricing structure more closely aligned to world markets reduced our exposure to counterparty risk.
Brazil p48
Risk register p74
Source: ANP (Brazil national Agency of Petroleum, Natural Gas and Biofuels)
2928 ANNUAL REPORT APRIL – DECEMBER 2017
MARKET REVIEW » BRAZIL MARKET

Strategy in action5capacity by 2022
1.3mb/d
Middle Eastern market
Our gasoline blending joint venture aims to supply its Bahraini home market and meet growing gasoline demand in other GCC countries and in Asia.
The Middle East continues to see a significant expansion in refinery production, with 1.3 million barrels/day of capacity due to come on stream by 2022 and a further 1.1 mb/d by 20254. With these new refineries geared towards diesel exports, there are significant regional imbalances in gasoline components, creating import, blending and supply opportunities for our gasoline joint venture in Bahrain.
Middle East p49
4 Source: OPEC
MARKET REVIEW » MIDDLE EASTERN MARKET
3130 ANNUAL REPORT APRIL – DECEMBER 2017

UK and Ireland Fuels
Customer forecourt | London, UK
"Access to import infrastructure continues to be strategically important, allowing us to minimise product costs and ensure supply resilience for our customers. By acquiring Inver Energy this period, we have extended our infrastructure footprint and fuel supply into the Irish market for the first time."
Caroline LumbardUK Trading Director
Aim: Develop low-cost and resilient fuel supply chains to earn the long-term loyalty of our customers in the UK and Ireland
Supply locations
Areas of population density
3332 ANNUAL REPORT APRIL – DECEMBER 2017
STRATEGY IN ACTION » UK AND IRELAND FUELS

UK and ireland fuelsKPI: average ship size (cbm)
25
20
15
10
Ave
rgae
sh
ip s
ize
(cb
m t
ho
usa
nd
)
2011 2012 20162015 20172013 2014
12,929
21,217
19,676
Creating economies of scale by using larger vessels
KPI
UK and Ireland Fuels
Competition in the UK road fuels market remained intense following a period of strong refining margins. We used our import infrastructure to buy globally and minimise product costs.
(continued)
Strategic capability 1 Source diesel from the lowest-cost global producers
In 2015 and 2016 diesel was in plentiful supply, with high global diesel stocks giving us strong purchase margins. This year saw a decline in global diesel stocks and, following hurricanes in the USA in the second half of 2017, a return to backwardated market conditions. Margins for prompt purchases were therefore lower than in prior years.
We expect the UK road fuels market to continue to be highly competitive in 2018 following a period of strong margins for UK refiners. Our capacity rights at the UK’s only east-coast deep-water road fuel jetties, at Navigator North Tees and Thames Oilport, and our investment in pipeline connections between our Teesside facilities, are all important in this context, giving us the flexibility to source a variety of cargo sizes and specifications at the lowest cost.
Strategic capability 3 Create cost and operational efficiencies
We continue to work to create operational and supply chain efficiencies and reduce unit costs across the business. This period, we:
» Brought into use a diesel pipeline linking Navigator North Tees (a former refinery), Navigator Seal Sands and Inter-Terminals Seal Sands. We are now able to receive diesel on larger ships via the deep-water jetty at Navigator North Tees and move it by pipeline to our neighbouring supply locations, creating cost and operational efficiencies. This period, we received our first LR2 vessel (capacity 110kt) into Navigator North Tees
» Increased the capacity of the pipeline from the jetties at Navigator Thames. By debottlenecking this busy terminal, we have reduced ship discharge times and associated shipping-related costs
» Continued to optimise our haulage operations to lift from the lowest-cost location.
Our aim is to use bigger ships wherever economic to achieve economies of scale and debottleneck busy terminals.
However, this period, the average size of ships used in the UK fell as a result of:
» Jetty damage on the Thames, which severely restricted the size of ships we were able to receive
» The drawing-down of our contango stock at Thames Oilport and Navigator North Tees.
We expect average vessel size to increase in 2018 following jetty repairs at Navigator Thames and completion of the Teesside diesel pipeline.
Strategic capability 2 Blend gasoline from component products
We operate sophisticated gasoline blending systems at three UK locations, Navigator Thames, Navigator Seal Sands and Inter-Terminals Seal Sands. These three facilities in combination continue to offer significant operational flexibility.
Gasoline blend margins remained stable overall. Strong demand from the petrochemical sector increased the price of naphtha, a typical petrol blend component, but this was partially offset by other components in our blending pool. The scale of our petrol blending operations allows us to accommodate a range of minority components we would otherwise be unable to use.
Global markets p24
Global markets p24
Thames case study p36
KPI: average ship size (cbm)
3534 ANNUAL REPORT APRIL – DECEMBER 2017
STRATEGY IN ACTION » UK AND IRELAND FUELS

Case study
Jetty damage on the Thames
Third-party damage to the jetty infrastructure at Navigator Thames, our busiest import terminal, restricted the size of ships we were able to receive at the facility from mid November 2017.
We used our significant supply chain capability and our additional supply location at Thames Oilport to ensure uninterrupted supply for customers following the incident, but incurred increased product and shipping costs as a result.
Navigator Terminals | Thames, UK
3736 ANNUAL REPORT APRIL – DECEMBER 2017
STRATEGY IN ACTION » UK AND IRELAND FUELS

Dec2015
250Dec2016
Dec2017
Apr2017
350
300
277
344
319
301
0
600
500
400
300
200
100
Apr2013
Apr2015
Apr2016
Apr2017
Apr2014
Dec2017
521
396
Nu
mb
er o
f si
tes
sup
plie
d
KPI: Independent forecourts
Our Greenergy Flexigrid logistics operation provides greater control over the quality of service we provide to customers and allows us to adapt continually to deliver from the lowest-cost supply location.
We have established Thames Oilport as a new diesel supply location, providing increased resilience in the busy South East region.
Strategic capability 4 Make safe, reliable and cost-efficient fuel deliveries to customers
We expanded our in-house haulage capability within Greenergy Flexigrid to meet our growing supply requirements in the UK.
We recruited more drivers into Greenergy Flexigrid in order to meet a greater proportion of our deliveries from our own fleet, reducing reliance on subcontractors and improving overall resilience and quality. We also increased the size of our fleet, ordering an additional 26 tankers and 34 trailers to be delivered after the end of the period.
Strategic capability 5 Grow in target markets
Independent forecourts
We significantly expanded sales to the independently owned forecourt sector in the UK, and by the end of 2017 were contracted to supply some 521 independently-owned sites (Esso: 387; other: 134). Some of these contracts are for supply commencing in 2018.
Our ability to offer fuel supply under a choice of brands (Esso, convenience brands or operators’ own brands) continues to be attractive, allowing us to meet the needs of the larger forecourt groups as well as those of single-site dealers.
Thames Oilport
We commenced diesel and gasoil supply from Thames Oilport this period, giving us a second significant import and supply location in the South East of England, an area of population and demand growth. This has provided improved supply security for customers and reduced peak-time queuing at the nearby Navigator Thames terminal.
With expanding sales from Thames Oilport, we extended facilities for drivers, brought into use additional road loading facilities and completed new additive systems, allowing us to meet customer-specific specifications.
Our investment in newer vehicles improved fuel efficiency. Average MPG from our in-house fleet improved to 8.99 miles per gallon, a 5% improvement on the same period in 2016 (industry average: 7.9 miles per gallon1).
Work continued on a new scheduling system designed to improve fleet utilisation and real-time reporting of ETAs. This is part of a major systems upgrade to bring operational efficiencies and add capability and scalability, to support the continued growth of our in-house haulage function.
In FY17 we took over the management of our vehicle maintenance operations from a previously outsourced function. With better resource planning this period, we improved vehicle up-time to 94% (FY17: 92%) and increased fleet utilisation.
Infrastructure p58
UK and Ireland Fuels (continued)
Number of Greenergy Flexigrid drivers
Includes Inver dealers referenced on p40
"Our independent fuel retail offer goes from strength to strength. We continue to work to earn the loyalty of each and every customer by delivering unparalleled supply reliability and customer responsiveness. "Debbie GhigiRetail Territory Manager
1 Department for Transport, updated November 2017
3938 ANNUAL REPORT APRIL – DECEMBER 2017
STRATEGY IN ACTION » UK AND IRELAND FUELS

Our plans in the UK and Ireland
» Maintain sales growth to the independent forecourt sector in the UK and Ireland
» Progress the regeneration in Thames Oilport to add petrol handling capability
» Expand our UK in-house haulage operation to meet growth in our delivered-in fuel supply
» Integrate Inver’s import and storage operations into our global purchasing strategies, to create supply chain efficiencies and economies of scale
» Explore opportunities to expand our supply footprint in Ireland.
We acquired Inver Energy’s fuel infrastructure and supply operations in Ireland and the UK. After a period of familiarisation, we are preparing to integrate our businesses to create supply chain efficiencies and economies of scale.
Strategic capability 6 Grow Inver sales in Ireland
As part of the acquisition of Inver Energy we acquired Inver’s storage facilities and supply operations in Ireland and the UK.
Inver currently imports diesel, gasoline, gasoil, kerosene, marine fuel and jet fuel into Ireland. We will look at opportunities to integrate Inver’s supply chains into our global purchasing and supply strategies, to achieve supply chain efficiencies and economies of scale.
Inver also supplies fuel to independent forecourt operators under its own brand. The Inver brand combines a clean, modern image with support for local community initiatives and offers independent retailers competitive and flexible pricing together with service quality and security of supply. The development of own-branded retail sales has enabled Inver to diversify its sales portfolio and establish longer-term relationships with customers. We will work to expand this part of Inver’s Irish business and consider opportunities to use the Inver brand in other markets.
With Inver’s storage and supply facilities on the west coast of Ireland, we are now ideally placed to supply customers in the south and west of the country. Going forward, we will explore opportunities to commence supply in the more densely populated east coast region.
Infrastructure p60
"We have developed a highly successful retail brand in the Irish market. We are now exploring opportunities to develop the brand outside of Ireland."Chris O’CallaghanHead of Branded Supply at Greenergy and Managing Director of Inver Energy
UK and Ireland Fuels (continued)
Customer forecourt | Limerick, Ireland
4140 ANNUAL REPORT APRIL – DECEMBER 2017
STRATEGY IN ACTION » UK AND IRELAND FUELS

Strategy in actionInternational fuelsNon-UK sales pg 42
15 A
pr
- 31
Dec
1 Ja
n -
14 A
pr
Lit
res
(bill
ion
)
2013 20152014 20172016
2.5
2.0
1.0
0.5
1.5
3.0
0
KPI: Non-UK sales
International Fuels
We further expanded our international fuel businesses, increasing our fuel imports into Brazil and acquiring the CAN-OP fuel terminal in Canada to give us a new supply location in northern Ontario. In Bahrain our petrol blending joint venture is now supplying gasoline to the local Bahraini market.
Aim: Expand internationally by replicating our UK experience in other markets
Rail-to-road facility | Toronto, Canada
4342 ANNUAL REPORT APRIL – DECEMBER 2017
STRATEGY IN ACTION » INTERNATIONAL FUELS

Marketing terminal
Supply terminal
CANADA
USA
Concord
NEW YORK
ONTARIO
QUEBEC
Quebec City
Chicago
Hamilton
Toledo
Detroit
Concord
Thunder Bay
Toronto
CANADA
USA
Concord
NEW YORK
ONTARIO
QUEBEC
Quebec City
Chicago
Hamilton
Toledo
Detroit
Concord
Thunder Bay
Toronto
Dec2015
Dec2016
Apr2017
Dec2017
0
50
100
150
200
250
109
155
231
177
We extended our supply chains in order to source fuel products from a range of markets, using sea and rail access to deliver supply resilience throughout the year.
Strategic capability 1 Develop low-cost, multi-modal and reliable supply chains
We operate multi-modal supply chains comprising domestic and international rail, international shipping or a break-bulk combination of both. This unique flexibility allows us to source from the prevailing lowest-cost market around the world.
During the period we purchased product from Western Canada, USA Mid-West, Europe and local Canadian refiners.
Our supply chain flexibility was evident during the latter half of the period where the hurricanes in the USA caused significant refinery outages and tightness in product availability. At this time we maintained continuous supply for our customers by shifting our sourcing more towards Canada and Europe.
We intend to expand our supply sourcing options as our supply footprint grows, creating further long-term relationships with domestic and foreign refiners in order to maintain supply resilience for customers.
Canada
Canadian market p29
Case study
Creating resilient fuel supply chains
Historically, growth in fuel demand in Canada has not been matched by investment in fuel supply infrastructure, resulting in supply disruption and product outages in the market.
We are developing flexible supply chains and investing in critical supply assets in order to create year-round product availability for customers.
Number of railcars leased in Canada
4544 ANNUAL REPORT APRIL – DECEMBER 2017
STRATEGY IN ACTION » INTERNATIONAL FUELS
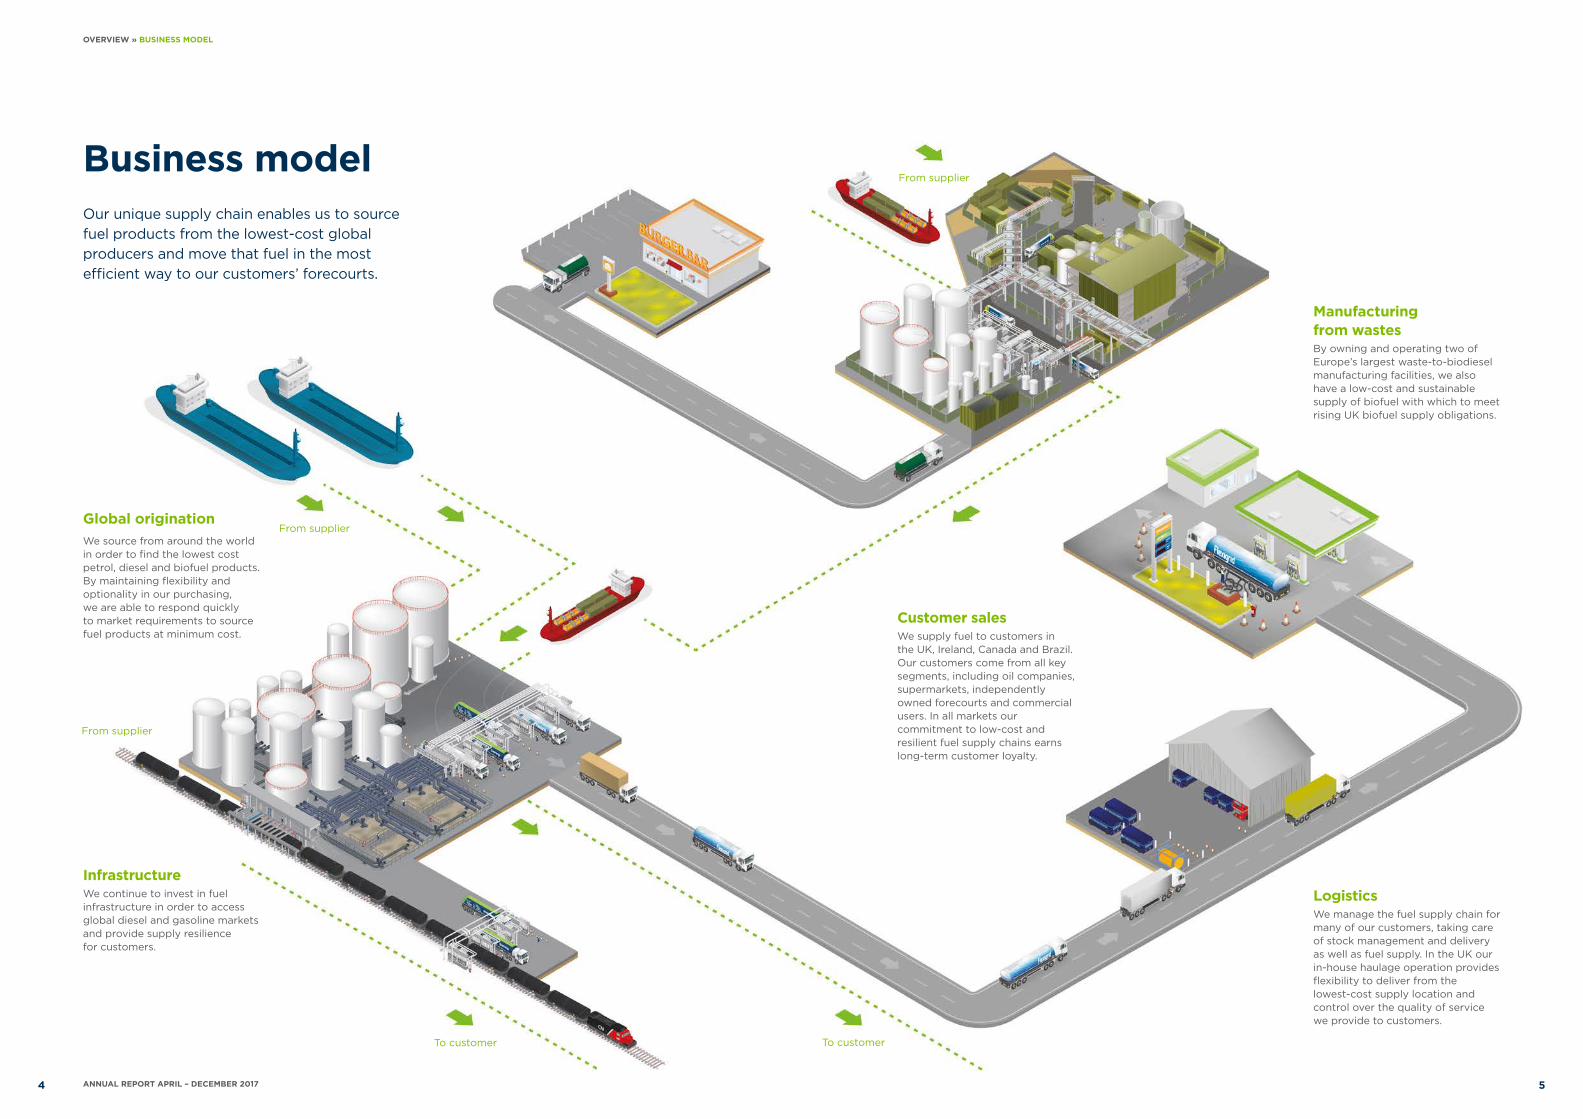
We expanded further in Canada, acquiring a fuel supply business and terminal in northern Ontario and expanding sales from our rail-to-road facility in Toronto.
Strategic capability 2 Invest in infrastructure to expand supply and improve supply resilience
Expanding existing rail-to-road facilities in Toronto
We completed the expansion of our first rail-to-road supply location at Concord, north of Toronto. The facility has added capacity in a convenient location and continues to be extremely popular with customers. We intend to replicate this model in other regions across the country in the years ahead.
Strategic capability 3 Commence branded sales to independent fuel retailers
Breakaway: A new retail proposition
We are developing a unique retail brand that draws on Canadians’ love of ice hockey. After extensive market research, we have selected Breakaway as the brand name for our retail offer. Accompanying our fuel offer, we have partnered with Gateway Newstands who will be able to provide customers with an industry-leading C-store offering.
The Breakaway brand offers an alternative to major oil company brands which are currently concentrated in the market and allows us to target sales to independently owned forecourt groups in Canada.
We expect to have our first Breakaway branded site operational by summer 2018, with a rollout to other sites following shortly thereafter.
A new sourcing and supply terminal in Northern Ontario
During the year we acquired 100% of the shares of Canadian Operators Petroleum (CAN-OP), a fuel marketer and terminal operator in Thunder Bay. CAN-OP’s operations include a gasoline and diesel wholesale business and a wholly owned petroleum storage and supply facility, Wascan Terminals Inc.
Located in Northern Ontario, Thunder Bay expands our supply footprint into a new developing region. The terminal facility is rail-fed, allowing for efficient integration into our existing supply chains.
Over the next twelve months, we plan to upgrade and expand the facility to make fuel supply more reliable and competitive in Thunder Bay and the surrounding region. This significant investment will be positive for the local community.
The acquisition also included a retail site and cardlock/truck stop, which we also plan to upgrade.
"We continue to make significant investments into oil supply chain infrastructure in Canada. We aim to bring low-cost fuel and higher levels of supply reliability to customers in regions that have historically been poorly served. "Adam TraegerDirector of Investments
Canada
Infrastructure p56
Our plans in Canada
» Expand our network of suppliers across Canada, USA and Europe for enhanced supply chain flexibility
» Commence sales under the Breakaway brand, providing a new, flexible branded offer to the independent market
» Expand and modernise our new facility in Thunder Bay, to provide this important region with an industry leading offering
» Develop and invest in additional supply infrastructure, including additional rail-to-road facilities, to create new supply capability.
(continued)
4746 ANNUAL REPORT APRIL – DECEMBER 2017
STRATEGY IN ACTION » INTERNATIONAL FUELS

BRAZIL
Santos
Paranaguá
The Brazilian market is increasingly reliant on fuel imports to meet domestic demand. We increased our diesel imports into Brazil and made our first gasoline sales.
Bahrain Gasoline Blending (BGB), our joint venture in Bahrain, is now blending gasoline for the domestic Bahraini market and for export.
Strategic capability 4 Increase domestic sales into Brazil
Fuel product imports into the Brazilian market continued to increase this period because supply from the ‘national’ oil company was insufficient to meet domestic demand.
As customers looked for alternative sources of supply, we expanded our imports of diesel, supplying from facilities at Santos in the centre south and Paranaguá in the south, both areas of population density.
Strategic capability 5 Develop lasting relationships in the Middle East
We are now blending gasoline within Bahrain Gasoline Blending (BGB), a joint venture between nogaholding, Bapco (the national oil company of the Kingdom of Bahrain) and Greenergy. The joint venture commenced operations in February 2017.
This period, BGB:
» Met its objectives by adding value to Bahrain’s gasoline pool in terms of better blend margins, trading and risk management
» Blended more than 5 million barrels of gasoline
» Supplied gasoline to meet demand within the local market
» Exported the first finished gasoline cargo out of Bahrain for more than five years
» Developed trading relationships with most of the major refineries and traders in the region.
The joint venture is also evaluating engineering works to expand and enhance the gasoline blending facilities in Bahrain. These additional facilities would give greater trading capability and flexibility, allowing BGB to source and trade a wider variety of gasoline products and further improve its blend economics.
Diesel demand in Brazil is significantly linked to agricultural and industrial production and therefore varies by season. When diesel demand dropped at the end of the harvest season and start of the holiday period in November and December, we used available tankage to make our first imports of gasoline into Brazil.
Across all our relationships we continue to work to gain the trust and loyalty of new and existing customers, cementing our reputation as a reliable supplier.
"Across all our relationships we are working to earn the trust and long-term loyalty of new and existing customers, building on our reputation as a trusted trading counterparty in the Brazilian market. "Nelson OstanelloChief Executive, Greenergy Brazil
Brazil Middle East
Market review p23
Market review p30
Our plans in Brazil and the Middle East
» Continue to expand fuel imports into Brazil to meet growing demand
» Increase our storage capacity in Brazil in order to supply other regions
» As a shareholder within BGB, pursue opportunities to become a major gasoline player in the Middle East.
Supplying Brazil
4948 ANNUAL REPORT APRIL – DECEMBER 2017
STRATEGY IN ACTION » INTERNATIONAL FUELS

Strategy in actionGlobal biofuelsbiodiesel manufacturing output
Pro
du
ctio
n (
cbm
)
2013* 2014* 2015 2016 2017
*Flood 15 Apr - 31 Dec
15 A
pr
- 31
Dec
1 Ja
n -
14 A
pr
Global Biofuels
Aim: Create value from biofuel manufacturing and supply
"We have achieved further significant growth in our biodiesel manufacturing output, benefitting from previous investments and ongoing process and technical improvements. We are ideally placed to meet growing demand for biofuel resulting from rising UK Government mandates effective April 2018."
Paul BatesonChief Operating Officer
Biodiesel manufacturing output
Market review p23
Biodiesel manufacturing facility | Immingham, UK
5150 ANNUAL REPORT APRIL – DECEMBER 2017
STRATEGY IN ACTION » GLOBAL BIOFUELS

USAUK
China
Middle East
Australia
Our global biofuel supply chain
Global sourcing We purchase waste oils as feedstock for our biodiesel manufacturing activities. By diversifying our supply chains globally we are able to source increasing quantities of the most appropriate feedstock, to meet our growing production requirements.
Biodiesel productionWith two manufacturing facilities on the east coast of England, we are Europe’s largest producer of waste-based biodiesel. We continue to expand our production to meet rising demand resulting from additional UK Government incentives.
Location: Immingham and Teesside, UK
Storage and supplyWe blend biodiesel and bioethanol into the petrol and diesel we supply in the UK, Ireland and Canada to meet regulatory requirements.
We also supply biodiesel and bioethanol to other oil companies in the UK, Ireland and in Canada, meeting customer-specific sustainability requirements.
Our storage facilities in the UK, Canada and Rotterdam give us the capacity to meet biofuel demand in different markets.
Imports: Australia, China, Middle East, USA
Supply: UK, Canada and mainland Europe
We continue to scale up our sourcing operations in line with growth in our manufacturing operation, making upstream investments.
Strategic capability 1 Source biofuels and biofuel raw materials globally
Expansion of our biodiesel manufacturing output required a significant increase in the volume of waste oils we source. By diversifying our supply chains beyond the UK and Europe to countries where there are no comparable biofuel supply obligations or incentives, we:
» Reduced raw material costs
» Sourced growing volumes of feedstock with quality characteristics that are best suited to our manufacturing operations.
This period, we expanded our sourcing from Asia, Australia and the Middle East, concluding a new joint venture partnership in Australia and expanding our joint venture operations in China. We also increased the volume of product sourced in smaller containers, including ISO containers, reducing product costs and making new supply chains available to us.
Global Biofuels (continued)
5352 ANNUAL REPORT APRIL – DECEMBER 2017
STRATEGY IN ACTION » GLOBAL BIOFUELS
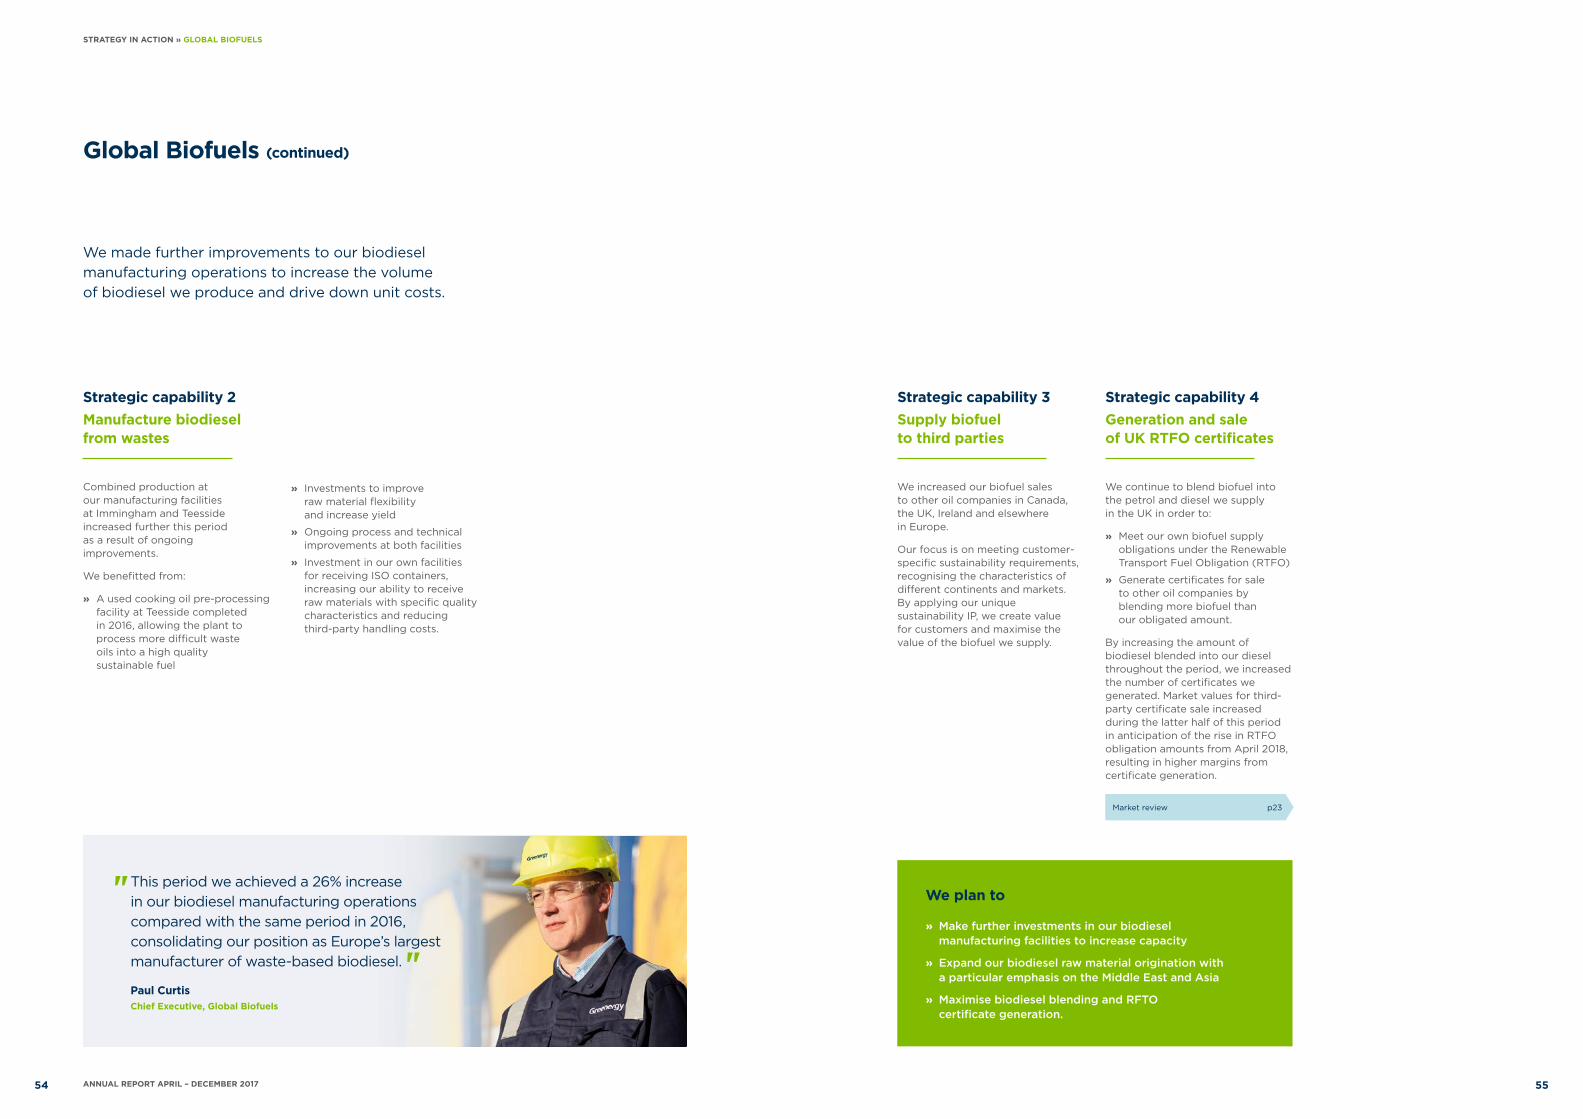
"This period we achieved a 26% increase in our biodiesel manufacturing operations compared with the same period in 2016, consolidating our position as Europe’s largest manufacturer of waste-based biodiesel. "Paul CurtisChief Executive, Global Biofuels
» Investments to improve raw material flexibility and increase yield
» Ongoing process and technical improvements at both facilities
» Investment in our own facilities for receiving ISO containers, increasing our ability to receive raw materials with specific quality characteristics and reducing third-party handling costs.
Strategic capability 2 Manufacture biodiesel from wastes
Combined production at our manufacturing facilities at Immingham and Teesside increased further this period as a result of ongoing improvements.
We benefitted from:
» A used cooking oil pre-processing facility at Teesside completed in 2016, allowing the plant to process more difficult waste oils into a high quality sustainable fuel
Strategic capability 3 Supply biofuel to third parties
We increased our biofuel sales to other oil companies in Canada, the UK, Ireland and elsewhere in Europe.
Our focus is on meeting customer-specific sustainability requirements, recognising the characteristics of different continents and markets. By applying our unique sustainability IP, we create value for customers and maximise the value of the biofuel we supply.
Strategic capability 4 Generation and sale of UK RTFO certificates
We continue to blend biofuel into the petrol and diesel we supply in the UK in order to:
» Meet our own biofuel supply obligations under the Renewable Transport Fuel Obligation (RTFO)
» Generate certificates for sale to other oil companies by blending more biofuel than our obligated amount.
By increasing the amount of biodiesel blended into our diesel throughout the period, we increased the number of certificates we generated. Market values for third- party certificate sale increased during the latter half of this period in anticipation of the rise in RTFO obligation amounts from April 2018, resulting in higher margins from certificate generation.
We plan to
» Make further investments in our biodiesel manufacturing facilities to increase capacity
» Expand our biodiesel raw material origination with a particular emphasis on the Middle East and Asia
» Maximise biodiesel blending and RFTO certificate generation.
Market review p23
Global Biofuels (continued)
We made further improvements to our biodiesel manufacturing operations to increase the volume of biodiesel we produce and drive down unit costs.
5554 ANNUAL REPORT APRIL – DECEMBER 2017
STRATEGY IN ACTION » GLOBAL BIOFUELS

Infrastructure
Aim: Acquire, regenerate and integrate assets to support our supply chain objectives
"We are using our understanding of fuel markets and our experience as an infrastructure user to develop strategically important assets that support our long-term supply objectives.
This period, we opened Thames Oilport for diesel supply by truck and acquired 100% of the Cardiff terminal, where we already store and supply fuel, as part of the Inver Energy transaction. We also extended our infrastructure footprint internationally, acquiring a 50% share in the Foynes terminal in Ireland and 100% of the rail-fed terminal at Thunder Bay in Northern Ontario. "Chris BrookhouseInfrastructure Director
Thames Oilport | UK
5756 ANNUAL REPORT APRIL – DECEMBER 2017
STRATEGY IN ACTION » INFRASTRUCTURE

Foynes
Navigator Seal Sands
Thunder Bay
Toronto
Navigator North Tees
Thames OilportThames Enterprise Park
Navigator Thames
Cardi�
Plymouth
Foynes
Navigator Seal Sands
Thunder Bay
Toronto
Navigator North Tees
Thames OilportThames Enterprise Park
Navigator Thames
Cardi�
Plymouth
Wholly owned
Part owned
We are regenerating fuel infrastructure in the UK and Canada to add functionality, flexibility and value.
Strategic capability 1 Regenerate legacy infrastructure to increase value
Thames Oilport, UK
We continue to progress the phased development of Thames Oilport with our joint venture partner:
» We commenced road-loading of diesel and heating oil, giving us a new and strategically important supply location in the South East of England. This follows extensive refurbishment works in prior years to tankage, pipes, jetty infrastructure, road-loading facilities and the terminal control system
» The connection to the UK Oil Pipeline (UKOP) was commissioned. This is strategically important for the facility, enabling diesel to be supplied by pipeline to customers in other parts of the UK
» We brought into use additional road loading facilities to meet sales growth
» We began design works for gasoline storage and supply, to be developed as the next phase of regeneration.
Thunder Bay, Canada
Our acquisition of Canadian Operators Petroleum (CAN-OP) included the purchase of 100% of the shares in Wascan Terminals Inc, a storage and supply facility located in Thunder Bay in northern Ontario. We commenced engineering works to upgrade and expand the terminal to:
» Enhance the approach to health and safety for our employees, customers and suppliers
» Expand rail supply and storage infrastructure at the facility to replicate our successful rail-to-road concept already in operation at Toronto
» Modernise and expand road-loading facilities.
Infrastructure Our infrastructure investments
UK and Ireland
UK and Ireland Fuels p39
Toronto, Canada
We completed the expansion of our first rail-to-road supply location at Concord, north of Toronto. The works have doubled the size of the facility, providing increased supply security to the Greater Toronto region, and added full biofuel blending and dye capability to our customer offering.
Teesside, UK
We completed work on a diesel pipeline linking Navigator North Tees (a former refinery), Navigator Seal Sands and Inter-Terminals Seal Sands. By connecting the deep-water jetty at Navigator North Tees with our other supply locations nearby, we aim to create economies of scale, reducing shipping-related costs and improving purchase margins.
International Fuels p46
UK and Ireland Fuels p35
(continued)
Canada
International Fuels p46
Part owned
Wholly owned
Thunder Bay » Acquired this period
» Strategic location at a key petroleum supply/trading intersection
Toronto
Foynes » 50% share acquired this period
» Deep-water multi-product import terminal
» Realising the value of former refinery land not required as fuel infrastructure
Thames Oilport » Opened this period for diesel
supply by truck
Thames Enterprise Park
Cardiff
Teesside
» 100% share acquired this period
» Continues as a Greenergy stock-managed terminal
» New diesel pipeline connections completed this period
» Our first rail-road facility
» Unique concept suitable for other locations
5958 ANNUAL REPORT APRIL – DECEMBER 2017
STRATEGY IN ACTION » INFRASTRUCTURE

Thames Enterprise Park | UK
Strategic capability 2 Operate fuel infrastructure to meet regional demand
Purchase of Inver terminals at Foynes and Cardiff
Our acquisition of Inver Energy included Inver’s 50% share in the AFSC facilities at Foynes and its wholly-owned facility in Cardiff.
The AFSC terminal at Foynes is a multi-product, deep-water facility at a strategic location on the west coast of Ireland, allowing us to import, store and supply a range of fuel products.
We have operated from Inver’s Cardiff terminal since 2012, moving gasoline blended at our Teesside facilities by rail to Cardiff and importing diesel by ship. We will be carrying out a strategic review to ensure we make best use of the facility now that it is under Greenergy ownership.
Navigator Terminals
In 2016 we formed Navigator Terminals with various institutional investors to own and operate fuel storage and blend facilities in the UK. Our participation in Navigator provides:
» Continued access to strategically important fuel storage and blending facilities on the Thames and Teesside
» More integrated supply chain management across Navigator facilities
» Shareholder income.
Plymouth
We continue to operate our Plymouth facility as a key part of our national supply chain. Over our ten years of ownership we have upgraded the facility to comply fully with post-Buncefield safety and environmental requirements.
Infrastructure
UK and Ireland fuels p40
(continued)
We have invested in strategically important infrastructure assets that supply our ongoing fuel supply commitments.
We plan to
» Continue the regeneration of Thames Oilport
» Upgrade and expand the Thunder Bay facility
» Progress the development of Thames Enterprise Park with a view to maximising land value at sale.
Case study
Creating value from former refinery land at Thames Enterprise Park
We are working to realise the value of the substantial area of land at Thames Enterprise Park, using land not required for the Thames Oilport import terminal.
This period, we completed the first phase of demolition of refinery infrastructure and obtained planning permission for land remediation on part of the site. With masterplan planning approval already granted, we expect to submit an outline planning application for the entire land redevelopment in 2018.
6160 ANNUAL REPORT APRIL – DECEMBER 2017
STRATEGY IN ACTION » INFRASTRUCTURE

20150
80
60
2016 2017
100
£ (
mill
ion
)
20
40
Key performance indicatorsEBITDA excluding exceptionals
47.6
89.267.2
30.9
15 A
pr
- 31
Dec
1 Ja
n -
14 A
pr
20150
80
60
2016 2017
100
£ (
mill
ion
)
20
40
22.1
64.348.0
23.2
15 A
pr
- 31
Dec
1 Ja
n -
14 A
pr
EBITDA excluding exceptionals
£67.2m
Profit before tax and before exceptionals
£48.0m
Key performance indicators6
EBITDA/Profit before taxEBITDA for the 37 week period to 31 December was £67.1m before exceptional items, compared to £70.6m during the equivalent period in the prior year. Results from the established UK business were affected by lower diesel margins but our UK performance was bolstered by profits in Brazil plus stronger returns from biodiesel production.
Financial KPIs
Chief Executive's Review p10
Chief Financial Officer’s Review p68
EBITDA excluding exceptionals
Profit before tax and before exceptionals
6362 ANNUAL REPORT APRIL – DECEMBER 2017

Operational KPisGroup sales volume
20150
15
2016 2017
20
Lit
res
(bill
ion
)
5
10
17.619.1 14.4
5.3
15 A
pr
- 31
Dec
1 Ja
n -
14 A
pr
Operational KPisBiodiesel manufacturing
2015 2016 2017
cbm
15 A
pr
- 31
Dec
1 Ja
n -
14 A
pr
Operational KPisInternational sales growth
2015
1.5
2016 20170
2.5
2.0
Lit
res
(bill
ion
)
0.5
1.0
3.0
0.60.6
1.4
2.4
15 A
pr
- 31
Dec
1 Ja
n -
14
Ap
r
Operational KPisShip sizes
10
20
14
18
16
12
22
2013 2015 20162014 2017
Ave
rag
e sh
ip s
ize
cb
m (
00
0)
16,744
19,676
21,217
Operational KPisIndependent forecourts
0
600
500
400
300
200
100
Apr2013
Apr2015
Apr2016
Apr2017
Apr2014
Dec2017
521
Group sales volumeGroup sales volume grew as a result of international expansion.
Biodiesel manufacturing outputProduction volume increased strongly as a result of previous investments to expand manufacturing capacity and create operational efficiencies.
International sales growthOur non-UK sales grew strongly as we expanded our fuel supply operations in Brazil and Canada and acquired the Inver business in Ireland.
Ship sizesOur ability to receive product on larger ships was impacted by third-party damage to one of the jetties at our main supply facility on the Thames.
Sales to UK independent forecourtsSales to the independently owned forecourt sector in the UK continued to expand rapidly as we won business from all competing brands.
Operational KPIs
Chief Executive's Review p10
Global Biofuels p50
Number of independently-owned forecourts contracted to supply
Combined output from Immingham and Teesside facilties (cbm)
Size of ships importing Greenergy fuel into the UK (cbm)
UK and Ireland Fuels p35
UK and Ireland Fuels p39International Fuels p42
UK and Ireland Fuels p40
Customer forecourt | Exeter, UK
6564 ANNUAL REPORT APRIL – DECEMBER 2017
KEY PERFORMANCE INDICATORS
Service quality KPisOn-time deliveries
Per
cen
t
Apr2017
Dec2017
100
90
70
80
60
Environmental KPisbiodiesel from waste
Jan-Apr2017
Apr-Dec2017
20150
2016
100
80
60
40
20
Per
cen
tag
e %
99.95 100 100 100
Environmental KPisfuel e�ciency
in our in-house �eet
20150
8
2016 Jan-Apr2017
Apr-Dec2017
10
MP
G
4
6
2
8.26 8.43 8.71 8.99
Environmental KPisbioethanol from waste
Jan-Apr2017
Apr-Dec2017
2015 2016
Per
cen
tag
e %
0
100
80
60
40
20
39
66
4740
Apr2017
Dec2017
100
90
70
80
60
Per
cen
t
Service quality KPisTruck lwaiting times
0
35
30
20
25
15
10
5
Jan2015
Dec2017
10.10%
31.80%
Per
cen
t
Bioethanol from waste
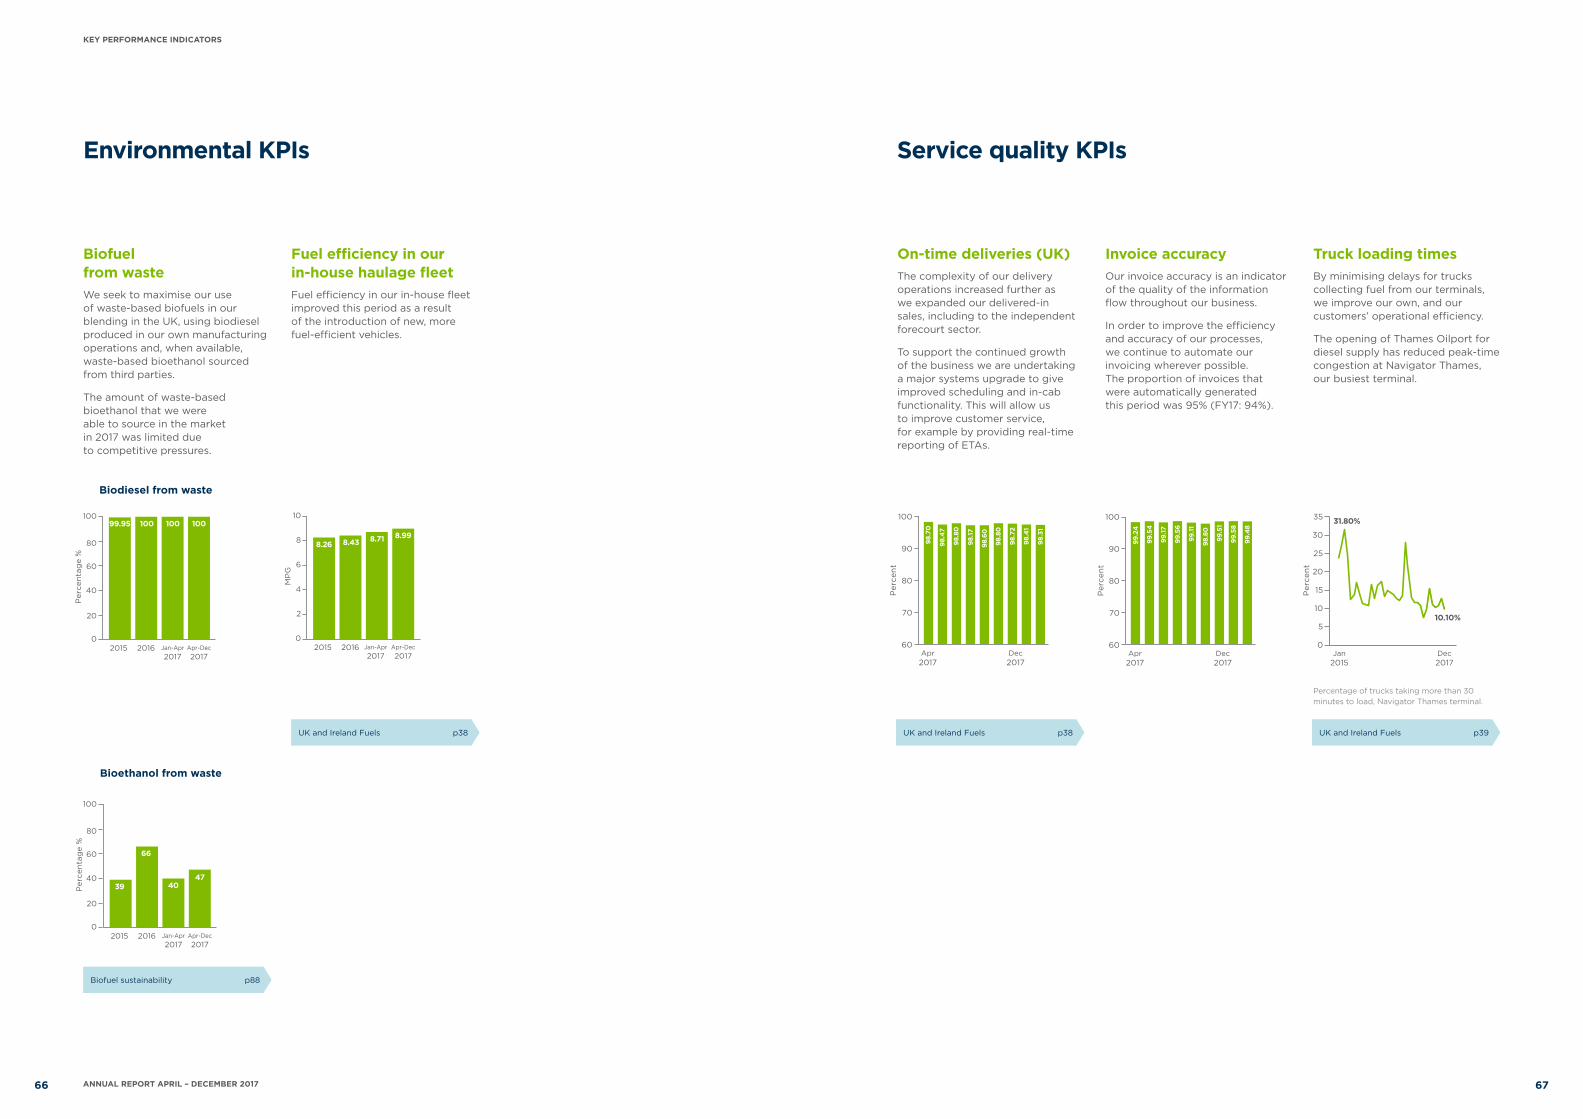
On-time deliveries (UK) The complexity of our delivery operations increased further as we expanded our delivered-in sales, including to the independent forecourt sector.
To support the continued growth of the business we are undertaking a major systems upgrade to give improved scheduling and in-cab functionality. This will allow us to improve customer service, for example by providing real-time reporting of ETAs.
Biofuel from wasteWe seek to maximise our use of waste-based biofuels in our blending in the UK, using biodiesel produced in our own manufacturing operations and, when available, waste-based bioethanol sourced from third parties.
The amount of waste-based bioethanol that we were able to source in the market in 2017 was limited due to competitive pressures.
Fuel efficiency in our in-house haulage fleet Fuel efficiency in our in-house fleet improved this period as a result of the introduction of new, more fuel-efficient vehicles.
Invoice accuracyOur invoice accuracy is an indicator of the quality of the information flow throughout our business.
In order to improve the efficiency and accuracy of our processes, we continue to automate our invoicing wherever possible. The proportion of invoices that were automatically generated this period was 95% (FY17: 94%).
Truck loading times By minimising delays for trucks collecting fuel from our terminals, we improve our own, and our customers’ operational efficiency.
The opening of Thames Oilport for diesel supply has reduced peak-time congestion at Navigator Thames, our busiest terminal.
Environmental KPIs Service quality KPIs
UK and Ireland Fuels p38
Biofuel sustainability p88
UK and Ireland Fuels p38 UK and Ireland Fuels p39
Percentage of trucks taking more than 30 minutes to load, Navigator Thames terminal.
Biodiesel from waste
6766 ANNUAL REPORT APRIL – DECEMBER 2017
KEY PERFORMANCE INDICATORS

Boardroom | London, UKCHIEF FINANCIAL OFFICER’S REVIEW
EBITDA for the 37 week period to 31 December was £67.2m before exceptional items, compared to £70.6m during the equivalent period in the prior year. Profit before tax and before exceptional items was £48.0m compared to £56.4m during the equivalent period in the prior year.
"During a shortened reporting period, results were 5% below the equivalent period last year. Our UK and Canadian businesses performed well in testing market conditions. The Group’s results were boosted by a strong contribution from our Brazilian operation as well as improved output from our biodiesel production facilities following a capital expansion programme. Further capital investment and expansion of supply origination will continue in the current year. Our strategic investment programme saw the acquisition of Inver Energy, marking our entry into the Irish fuels market. "Stephen McCaffreyChief Financial Officer
Chief Financial Officer’s Review
Change in reporting period
During this period we moved our financial year-end to the calendar year-end of 31 December; as such, the current period under review represents 37 weeks of trading.
The change in reporting date also drives a change in the allocation of our year-end balance sheet compared to what has been presented in previous years as at 14 April. This is due to the fluctuating nature and relative scale of balances associated with our indirect tax collection and repayment cycle, which runs from 15th to 14th of the month. However the net asset position remains unaffected.
International growth
We continue to achieve stronger margins in Brazil during the period resulting in a higher contribution than forecast. Towards the final quarter of the period and subsequently, the Brazilian market began to show signs of oversupply; as such we do not anticipate as strong a performance in 2018 as the structure of the market continues to change.
We believe there is a long-term future for Greenergy in Brazil as a net importer of fuels, and we continue to assess potential infrastructure opportunities in the region to expand our footprint.
Despite a slow start to the period, the Canadian business recovered in the later months and contributed positively overall. During the period, we acquired an existing business, trading as CAN-OP, which extends our existing customer base and also provides access to additional infrastructure in the form of an operational terminal. We plan to invest in the terminal during 2018 to modernise the facility and expand the customer base.
As part of a wider investment strategy we acquired Inver Energy, an established fuel supply business based in Ireland. This investment will provide access to new markets as well as local infrastructure and has made a positive contribution to Group results since the acquisition was completed in October 2017. This is an initial step in aiming for an Ireland-wide supply operation.
Canada p44
Brazil p48
6968 ANNUAL REPORT APRIL – DECEMBER 2017

The strategic investments made during the period are already making good contributions and this is expected to continue into the next financial year.
UK market
Increasing competition and shifting market structures affected the UK market during the period and resulted in lower than forecast contribution from this area of the business in the second half of the reporting period. Regional volume losses in a small number of customers have been offset by gains in sales to delivered-in customers that will commence during 2018.
For the second year running, returns in our key UK market were boosted by income earned from the long-term storage of diesel in multiple locations to take advantage of the contango market conditions. These positions were closed out during the period so we do not anticipate any further gains in 2018.
Global biofuels
The combined contribution from our biodiesel manufacturing facilities was stronger than expected and also higher than the equivalent period in the prior year. This was due to increased output and record uptime at both plants, which has been achieved on the back of significant investment made during recent years to increase production levels and improve efficiency.
Exceptional items
Exceptional items in the period of £8.3m relate to impairments recognised against the carrying value of investments.
Financing our business
Last year we completed a renewal of our borrowing base facility to accommodate our future working capital needs. The borrowing base is a trade finance facility and as such is at all times secured by specific working capital assets such as inventory and accounts receivable.
The facility has continued to operate well and our banks continue to be supportive of the business’ growth. There are two years remaining on the existing facility with an option to extend for a further two years.
Post year-end we exercised our option to increase the size of the facility in order to accommodate increased oil prices, growth of our operations and to absorb the financing needs of the Inver Energy business. In increasing the facility by $150m to $950m, we also introduced a new bank to our syndicate.
Taxation
The Group’s corporation tax charge for the period was £12.3m representing an effective rate of 31% (FY17: 24%).
Although the majority of the taxable profits earned in the Group are subject to corporation tax in the UK, the increasing proportion of profits earned in both Brazil and Canada have increased the effective tax rate at a consolidated level as the rates of tax in both of these jurisdictions are higher than that of the UK.
We continue to be a significant contributor to UK Government Treasury receipts, making fuel duty payments of £4.3 billion and VAT payments of £1.0bn during the period.
Forward performance
Looking ahead, we are confident that our recent investments will facilitate growth in new geographical markets and strengthen upstream supply chain management for the existing businesses. At the same time we remain aware of other potential investment opportunities in both the UK and overseas.
Chief Financial Officer’s Review (continued)
Stephen McCaffreyChief Financial Officer
7170 ANNUAL REPORT APRIL – DECEMBER 2017
CHIEF FINANCIAL OFFICER’S REVIEW

Loss of key sta�M
agni
tud
e o
f im
pac
t
Likelihood of occurence after mitigation
Oil price volatility
HIGH
HIG
H
LOW
HIG
HLO
W
Health, safety and
environmental incidents
Biofuelmargin
volatility
Supplier/customer
counterpartyriskIT failure
/connectivity loss
Regulatoryrisk/
Brexit
Currencyrisk
Bribery and corruption
Product quality issue
Biofuel compliance
risk
Interruption of fuel supply to customers
Extreme weather
Industrial relations
Maliciouscyber attack
Managing our risks8
Risk overview
The risks we face in our business, and the action we take to mitigate those risks, are formalised in a risk register which is reviewed regularly by the Board.
7372 ANNUAL REPORT APRIL – DECEMBER 2017

Risk register
RiskMagnitude of impact
Mitigating action ResponsibilityLikelihood
of occurrence after mitigation
Group risks
Health, safety and environmental incidents
Our operations involve the storage and processing of fuel products and the movement of fuel products by ship, train and truck, including deliveries to customer sites. These activities bring us into contact with members of the public and with the environment. We focus on preventing major pollution, injury and/or loss of life due to systems or equipment failure.
High Personal and process management systems are based on best industry practice and implemented at both corporate and country level. As we expand internationally we apply our auditing across all businesses. Our approach is to ensure all activities are accessed, people trained and all incidents are reported. Investigations are in an atmosphere of ownership and responsibility. Our increased focus on Process Integrity is resulting in additional controls and improved reporting.
Executive Directors
Medium
Malicious cyber-attack
The profile and therefore the risk of cyber-attack is increasing for businesses globally. Threats present themselves in many forms, including viruses or targeted emails which create data integrity issues or loss of data, leading to inaccurate reporting or financial loss.
Medium We work with leading external security specialists to improve our technology, staff awareness and evolve multiple layers of security to protect the business. Participation in specialist Government/ industry committees provides additional notification and ensures we remain aligned with industry best practice. Our information security strategy is reviewed at Board level.
Executive Directors
Medium
IT failure or loss of connectivity
An extended loss of connectivity, breach or major IT system failure would cause significant disruption to our business operations, with potential for reputational damage and loss of sales.
Medium Our IT continuity plan includes site connectivity, data backup, hardware failure and remote access. All critical systems have multiple layers of protection and are hosted by third-party data centres appropriate to the scale of our businesses and accredited to relevant standards. Our disaster recovery plan is practiced yearly.
Executive Directors
Low
Extreme weather conditions
Adverse weather conditions have the potential to impact the movement of fuel into our storage and our deliveries to customer sites. Our owned terminal infrastructure and our biodiesel manufacturing facilities are all located in ports, where tidal flooding can occur. As we expand internationally the probability of adverse weather conditions are more likely.
High Customer supply resilience is achieved in the UK through a national network of supply locations. In Canada, supply chain diversification has reduced the likelihood supply disruption caused by a long period of extremely cold weather. Flood protection systems have also been reviewed and enhanced where appropriate following flooding of our Immingham biodiesel manufacturing facility in 2013 and infrastructure is adequately insured.
Executive Directors
Medium
Loss of key staff Loss of key staff would mean loss of knowledge and skills to the Group. As we expand the need for the strength and depth of the senior management increases.
Medium Staff retention and succession planning is carried out with a focus on both culture and financial reward, including an established performance-related-pay scheme. There is good management connection and team building between different offices and a long-serving senior management team.
Chief Executive Low
Bribery and corruption, codes of conduct, ethics and good governance
The business sources product globally from a wide variety of suppliers, counterparties, agents and intermediaries. As we expand internationally we sell to customers on increasingly complex terms with the number of counterparties connected to transactions increasing. There is a need to ensure compliance with domestic and international rules around full disclosure of business dealings, codes of conduct and controls on facilitation and equivalent payments (such as those stipulated in the UK under the Bribery Act 2010).
Low The Group has in place clear and company-wide policies to inform and set limitations and prohibitions, including a gift register and a record of supplier/customer entertainment. We identify any roles which may be considered to be high risk and ensure those staff members particularly are aware of the requirements placed on them. The Group has established an 'ethics hotline' to allow staff to report concerns.
Executive Directors
Low
Heath and Safety p17
Employment p86
(FY17: Medium) (FY17: Low)
7574 ANNUAL REPORT APRIL – DECEMBER 2017
MANAGING OUR RISKS » RISK REGISTER

Risk register (continued)
RiskMagnitude of impact
Mitigating action ResponsibilityLikelihood
of occurrence after mitigation
UK and International Fuels
Oil price volatility Fluctuations in fuel product prices can result in a difference between purchase and sales prices. Unless managed, these fluctuations could very significantly impact purchase and sales margins.
High Comprehensive control processes and hedging mechanisms are in place to limit exposure to oil and product price fluctuations. The objective of these mechanisms is to match our priced physical positions (generated from spot and term contracts entered into with suppliers and customers) with equal and opposite derivative positions.
In response to global supply and demand risk, we maintain an active forward purchasing and sales activity hedged with appropriate market instruments. Sales contracts also include floating elements which are linked to market prices which reduces exposure to fuel product price rises.
Chief Financial Officer
Low
Interruption of fuel supply to customers
An event which significantly interrupts the supply of fuel to our customers has potential to cause reputational, commercial and financial damage. Supply disruption could be market-wide or site-specific:
» A political or physical event in a major oil producing nation or a significant supply location could disrupt supplies into Europe
» Weather-related shipping delays, industrial action, a fuel quality issue or an IT failure could cause product unavailability at a specific supply location.
Medium Supply resilience is central to our mission. By maintaining optionality across our supply chain, we minimise reliance on any single supplier, supply location or haulage provider.
» With our flexible global supply chains and our deep-water infrastructure, we can quickly switch our purchasing to other locations in the event that oil flow is disrupted
» We continue to strengthen our supply locations with new investments in the North East and South East
» In the UK, our global product sourcing, network of storage and supply locations, in-house and third-party haulage arrangements all give operational flexibility and the ability to switch to other sites in the event of an outage or closure at one location
» In Canada, supply resilience is achieved by combining rail and import infrastructure, giving us the ability to source from local suppliers and also from the USA and Europe.
Executive Directors / Chief Operating Officer
Low
Product quality issue The supply of fuel failing to meet quality standards could lead to significant reputational damage and remediation costs.
Medium The risk of a field quality issue is minimised through extensive operational controls embedded within the quality management system certified to ISO 9001. This includes independent product quality tests on receipt of product, in tank and prior to releasing product for customer deliveries.
Deputy Chief Executive / Chief Operating Officer
Low
Continued
7776 ANNUAL REPORT APRIL – DECEMBER 2017
MANAGING OUR RISKS » RISK REGISTER
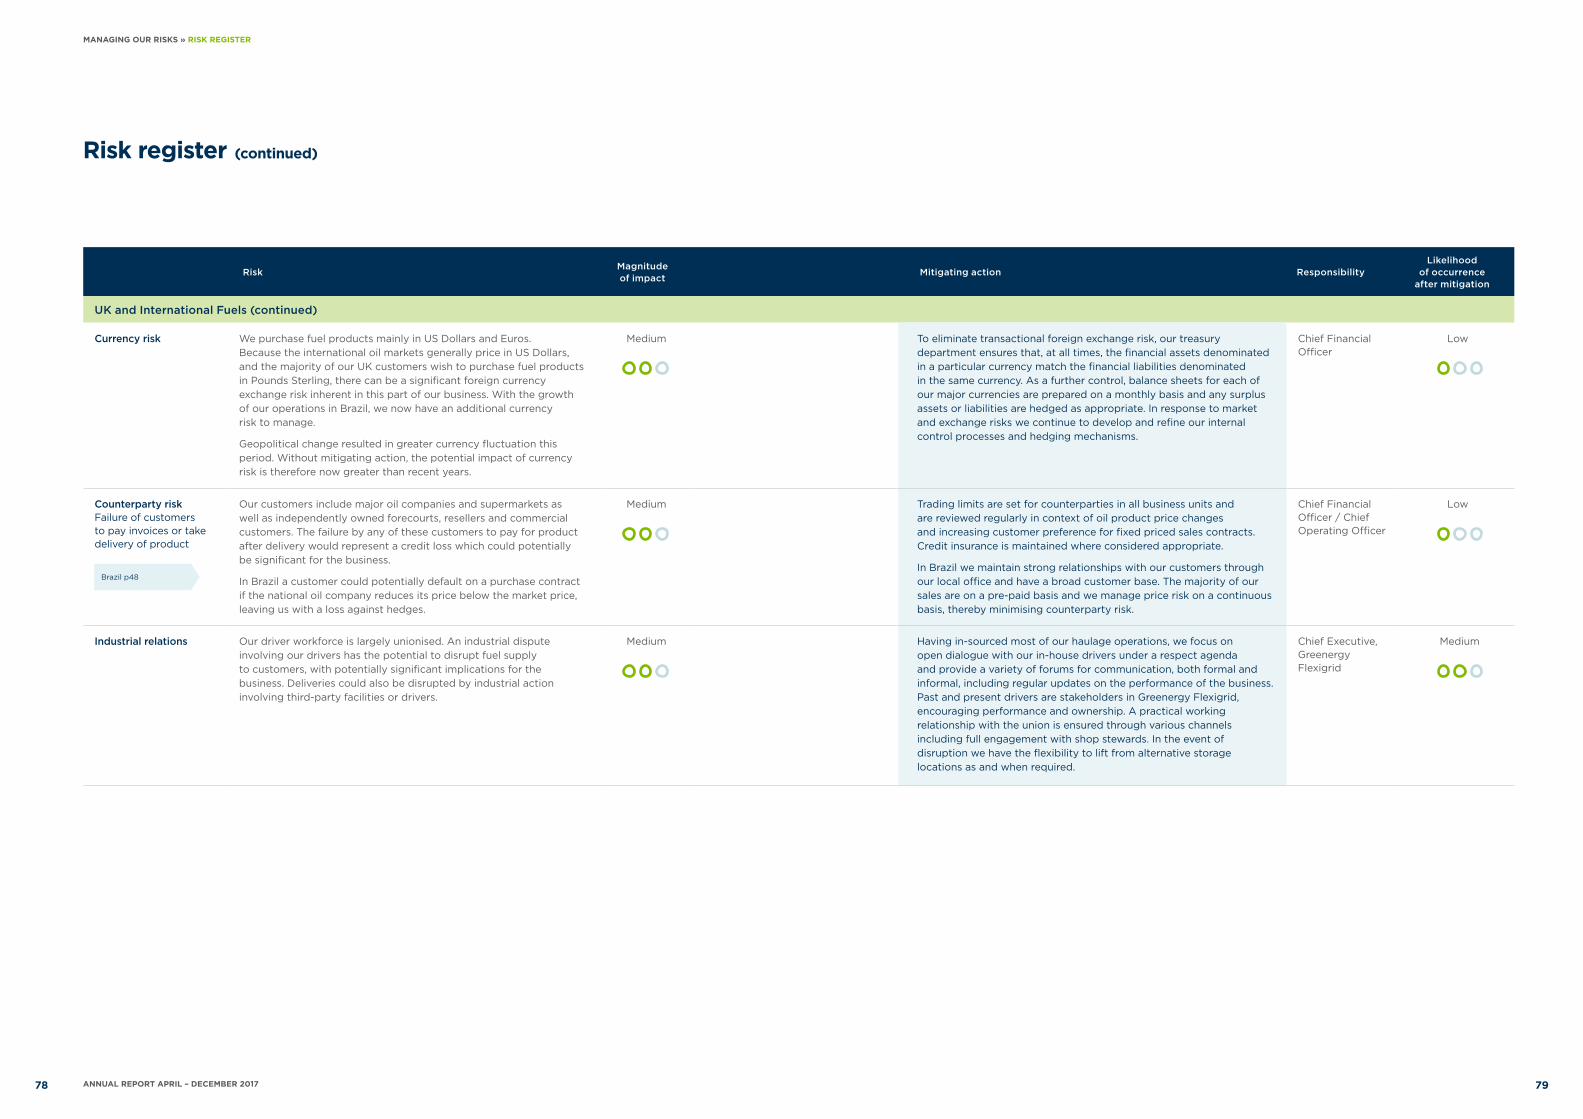
Risk register (continued)
RiskMagnitude of impact
Mitigating action ResponsibilityLikelihood
of occurrence after mitigation
UK and International Fuels (continued)
Currency risk We purchase fuel products mainly in US Dollars and Euros. Because the international oil markets generally price in US Dollars, and the majority of our UK customers wish to purchase fuel products in Pounds Sterling, there can be a significant foreign currency exchange risk inherent in this part of our business. With the growth of our operations in Brazil, we now have an additional currency risk to manage.
Geopolitical change resulted in greater currency fluctuation this period. Without mitigating action, the potential impact of currency risk is therefore now greater than recent years.
Medium To eliminate transactional foreign exchange risk, our treasury department ensures that, at all times, the financial assets denominated in a particular currency match the financial liabilities denominated in the same currency. As a further control, balance sheets for each of our major currencies are prepared on a monthly basis and any surplus assets or liabilities are hedged as appropriate. In response to market and exchange risks we continue to develop and refine our internal control processes and hedging mechanisms.
Chief Financial Officer
Low
Counterparty risk Failure of customers to pay invoices or take delivery of product
Our customers include major oil companies and supermarkets as well as independently owned forecourts, resellers and commercial customers. The failure by any of these customers to pay for product after delivery would represent a credit loss which could potentially be significant for the business.
In Brazil a customer could potentially default on a purchase contract if the national oil company reduces its price below the market price, leaving us with a loss against hedges.
Medium Trading limits are set for counterparties in all business units and are reviewed regularly in context of oil product price changes and increasing customer preference for fixed priced sales contracts. Credit insurance is maintained where considered appropriate.
In Brazil we maintain strong relationships with our customers through our local office and have a broad customer base. The majority of our sales are on a pre-paid basis and we manage price risk on a continuous basis, thereby minimising counterparty risk.
Chief Financial Officer / Chief Operating Officer
Low
Industrial relations Our driver workforce is largely unionised. An industrial dispute involving our drivers has the potential to disrupt fuel supply to customers, with potentially significant implications for the business. Deliveries could also be disrupted by industrial action involving third-party facilities or drivers.
Medium Having in-sourced most of our haulage operations, we focus on open dialogue with our in-house drivers under a respect agenda and provide a variety of forums for communication, both formal and informal, including regular updates on the performance of the business. Past and present drivers are stakeholders in Greenergy Flexigrid, encouraging performance and ownership. A practical working relationship with the union is ensured through various channels including full engagement with shop stewards. In the event of disruption we have the flexibility to lift from alternative storage locations as and when required.
Chief Executive, Greenergy Flexigrid
Medium
Brazil p48
7978 ANNUAL REPORT APRIL – DECEMBER 2017
MANAGING OUR RISKS » RISK REGISTER
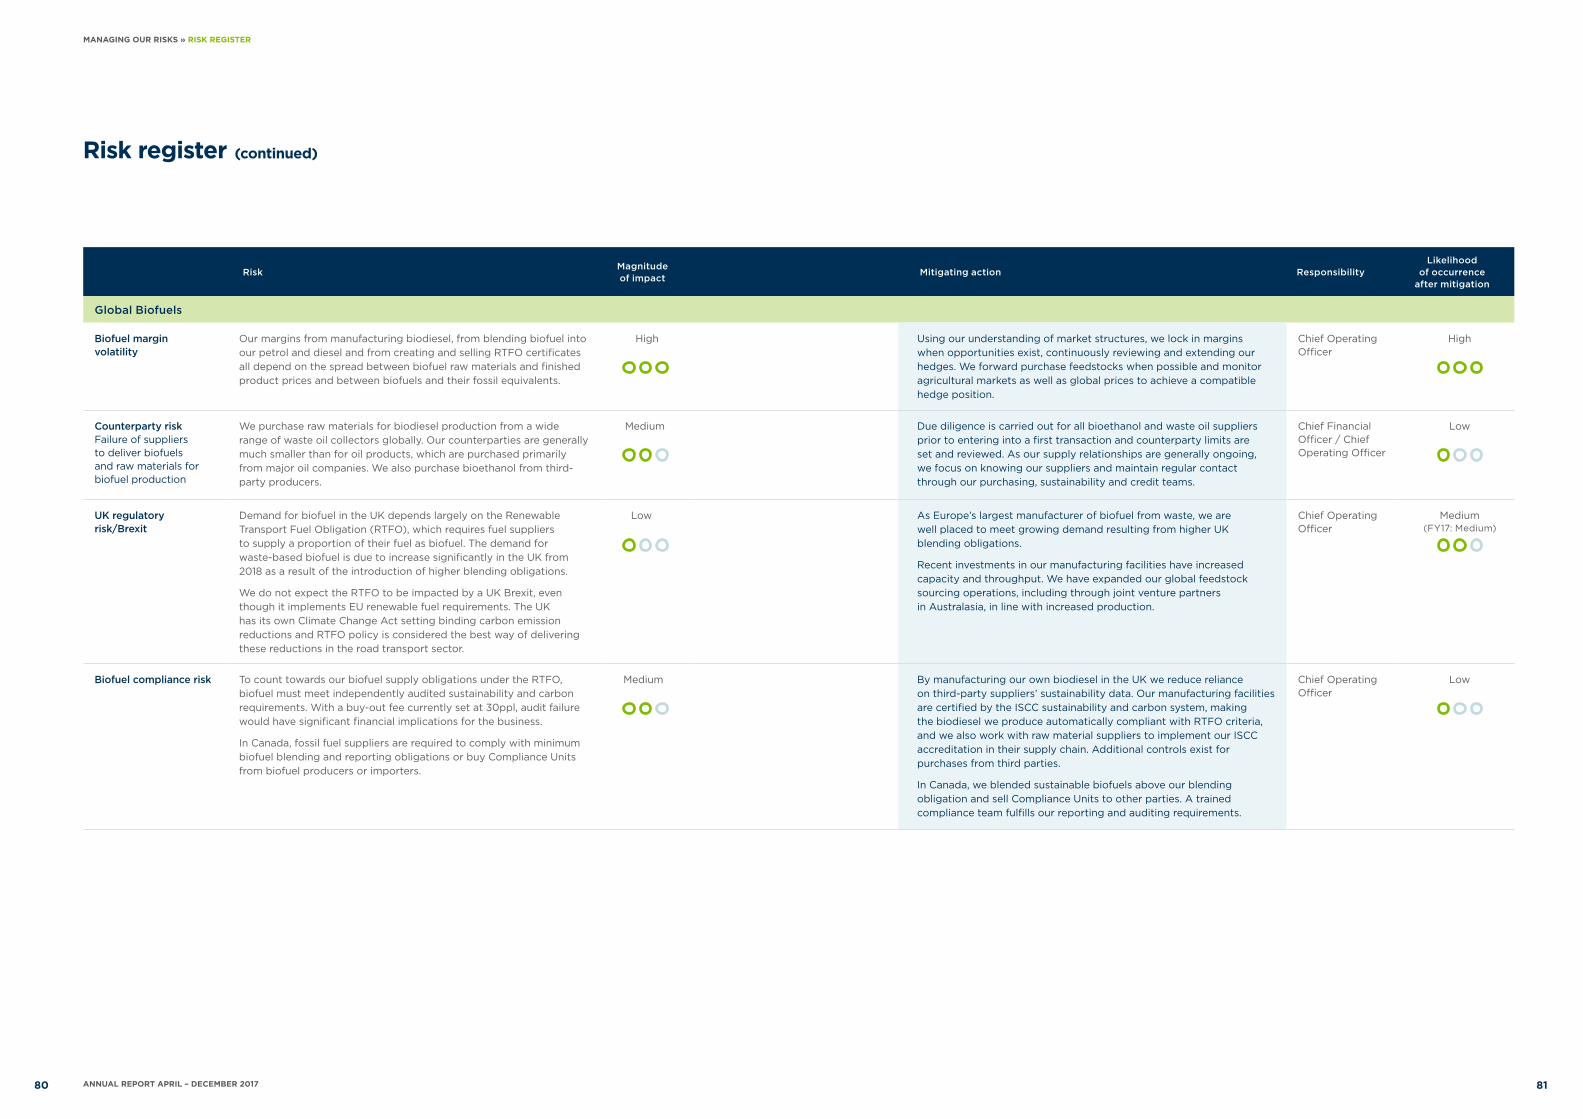
Risk register (continued)
RiskMagnitude of impact
Mitigating action ResponsibilityLikelihood
of occurrence after mitigation
Global Biofuels
Biofuel margin volatility
Our margins from manufacturing biodiesel, from blending biofuel into our petrol and diesel and from creating and selling RTFO certificates all depend on the spread between biofuel raw materials and finished product prices and between biofuels and their fossil equivalents.
High Using our understanding of market structures, we lock in margins when opportunities exist, continuously reviewing and extending our hedges. We forward purchase feedstocks when possible and monitor agricultural markets as well as global prices to achieve a compatible hedge position.
Chief Operating Officer
High
Counterparty risk Failure of suppliers to deliver biofuels and raw materials for biofuel production
We purchase raw materials for biodiesel production from a wide range of waste oil collectors globally. Our counterparties are generally much smaller than for oil products, which are purchased primarily from major oil companies. We also purchase bioethanol from third-party producers.
Medium Due diligence is carried out for all bioethanol and waste oil suppliers prior to entering into a first transaction and counterparty limits are set and reviewed. As our supply relationships are generally ongoing, we focus on knowing our suppliers and maintain regular contact through our purchasing, sustainability and credit teams.
Chief Financial Officer / Chief Operating Officer
Low
UK regulatory risk/Brexit
Demand for biofuel in the UK depends largely on the Renewable Transport Fuel Obligation (RTFO), which requires fuel suppliers to supply a proportion of their fuel as biofuel. The demand for waste-based biofuel is due to increase significantly in the UK from 2018 as a result of the introduction of higher blending obligations.
We do not expect the RTFO to be impacted by a UK Brexit, even though it implements EU renewable fuel requirements. The UK has its own Climate Change Act setting binding carbon emission reductions and RTFO policy is considered the best way of delivering these reductions in the road transport sector.
Low As Europe’s largest manufacturer of biofuel from waste, we are well placed to meet growing demand resulting from higher UK blending obligations.
Recent investments in our manufacturing facilities have increased capacity and throughput. We have expanded our global feedstock sourcing operations, including through joint venture partners in Australasia, in line with increased production.
Chief Operating Officer
Medium
Biofuel compliance risk To count towards our biofuel supply obligations under the RTFO, biofuel must meet independently audited sustainability and carbon requirements. With a buy-out fee currently set at 30ppl, audit failure would have significant financial implications for the business.
In Canada, fossil fuel suppliers are required to comply with minimum biofuel blending and reporting obligations or buy Compliance Units from biofuel producers or importers.
Medium By manufacturing our own biodiesel in the UK we reduce reliance on third-party suppliers’ sustainability data. Our manufacturing facilities are certified by the ISCC sustainability and carbon system, making the biodiesel we produce automatically compliant with RTFO criteria, and we also work with raw material suppliers to implement our ISCC accreditation in their supply chain. Additional controls exist for purchases from third parties.
In Canada, we blended sustainable biofuels above our blending obligation and sell Compliance Units to other parties. A trained compliance team fulfills our reporting and auditing requirements.
Chief Operating Officer
Low
(FY17: Medium)
8180 ANNUAL REPORT APRIL – DECEMBER 2017
MANAGING OUR RISKS » RISK REGISTER
AFSC Terminal | Foynes, Ireland
People and environment9
8382 ANNUAL REPORT APRIL – DECEMBER 2017

Executive Directors
Andrew Owens MBEChief Executive
Andrew is a co-founder of Greenergy and has more than 30 years’ experience working in the oil industry. Andrew has a Chemical Engineering degree from Imperial College and retains links with the college as Adjunct Professor at Imperial College Business School and a mentor in its alumni entrepreneurial network.
Caroline LumbardUK Trading Director
Since joining Greenergy 19 years ago, Caroline has helped champion our rapid sales and customer growth. As UK Trading Director, Caroline is responsible for the Group’s UK sales, purchasing and operations strategies and leads complex supply chain activities with major oil companies in the UK.
Chris BrookhouseInfrastructure Director
Chris joined in 2015 as Infrastructure Director to maximise the value potential of our assets. He brings significant project and capital development expertise from the downstream oil and energy sectors. Chris is also Chief Executive for joint venture activities at Thames Oilport and Thames Enterprise Park.
Tamara EarleyDeputy Chief Executive
Tamara has over 25 years’ experience in the oil industry, including more than 20 years with Greenergy. Before Greenergy, Tamara worked with Safeway and BP in various roles. Tamara oversees all elements of the day-to-day running of the business.
Stephen McCaffreyChief Financial Officer
Stephen joined Greenergy in 2005 as the Chief Financial Officer of Greenergy Biofuels and has subsequently fulfilled numerous roles including Managing Director of Greenergy Terminals. Stephen is a chartered accountant and has over 20 years’ experience in the oil and gas industry including roles with Amerada Hess and The BOC Group plc.
Chris O’CallaghanHead of Branded Supply at Greenergy and Managing Director of Inver Energy
Chris joins us following our acquisition of Inver Energy this period. After 18 years at Chevron, Chris acquired Inver in 2004, successfully grew the business and launched the Inver retail brand in 2013. Chris continues to manage Inver’s operations in Ireland and has also taken over responsibility for our branded retail sales in the UK.
Adam TraegerDirector of Investments
A chartered accountant, Adam joined Greenergy nine years ago having previously worked with Deloitte. Adam is responsible for the Group’s global mergers and acquisitions and manages all of the company’s investments, including capital expenditure, joint ventures and infrastructure.
Paul BatesonChief Operating Officer
Paul joined Greenergy in 2007 and brings 34 years’ experience in the downstream oil sector, including at Exxon, Conoco Phillips, and Louis Dreyfus Refining and Marketing. He manages the Company’s trading, biodiesel manufacturing and international businesses.
8584 ANNUAL REPORT APRIL – DECEMBER 2017
PEOPLE AND ENVIRONMENT » EXECUTIVE DIRECTORS

Employmentgender diversity
All employees
Non-driver workforce
Senior management
Executive Directors
126 667
126 307
2 5
3 18
Women Men
Employment
Our average headcount increased from 711 in FY17 to 793 this period following acquisitions in Ireland and Canada and the continuing expansion of our in-house haulage operation.
Culture and values
The Respect Agenda is the core value that everything else within Greenergy depends on. Everyone within the Company is undertaking an important and worthwhile job, and therefore everyone needs to be respected and supported. The often used mantra of 'Treat people how you would like to be treated' is crucial to how we interact with colleagues, customers and suppliers, in particular as we welcomed colleagues from our newly acquired businesses, CAN-OP and Inver Energy. We also introduced Brookfield’s ABC policies and ethics hotline across the business.
Within our Greenergy Flexigrid haulage operation, we have spent considerable time creating a culture that makes us a more attractive employer than competitors within the same sector, and allowing drivers to have rewarding careers. The quantity and quality of applications this period has been proof that we are now an employer of choice. Our ability to employ the best people is vital in delivering the highest service levels for customers.
Training
Structured training programmes have been developed for drivers and infrastructure staff over a number of years, resulting in a safe and knowledgeable workforce. Every driver must have annual training towards their Petroleum Driver Passport (PDP) and Driver Certificate of Professional Competence (DCPC), and we combine these modules with load and discharge assessments using our dedicated group of in-house trainers. Operators at our terminals and biodiesel plants have ongoing training to ensure they are both competent in their roles, and abreast of any legislation changes.
Our values are to:
» Take care to do no harm to people or place
» Respect each other
» Act in a fair, responsible and honest manner.
"At Greenergy, people work hard to ensure that all employees, including drivers, feel connected to the aims of the business and valued for the work they do. "Dave Le MaitreDriver, Greenergy Flexigrid
Gender diversity
Charitable giving
Each year, the Board sets a charity budget through which it can help fund socially orientated and development causes both nationally and internationally.
This period, £220,000 was distributed, primarily by our 22 charity teams and up from £216,000 for the previous 12 months. The teams are made up of permanent employees, each of whom can nominate a charity for consideration by the wider team. The way by which funds are disbursed allows for employees to share ideas and make decisions as a team.
No political donations were made and no political expenditure was incurred during the year.
Navigator Terminals | Thames, UK
8786 ANNUAL REPORT APRIL – DECEMBER 2017
PEOPLE AND ENVIRONMENT » EMPLOYMENT

93% 5%2%
People and environmentWhat is our biofuel made of?
Bioethanol blended into petrolsupplied in the UK
23%
16%
47% 13%1%
Global Biofuels p50
average carbon saving for biodiesel
92%biodiesel from waste
100%
Biofuel sustainability
We blend biofuel into our petrol and diesel in order to meet our biofuel supply obligations and reduce the environmental impact of the fuel we supply. Our focus is on using biofuels which deliver greatest carbon benefit and have minimal land use impacts.
Action 1
Maximise biofuel from waste
We further increased our use of biofuels derived from waste.
The biodiesel we blended into diesel in the UK was derived entirely from wastes and was supplied almost exclusively from our own production (this period: 99%; FY17: 95%).
We continue to source waste-based ethanol from third-party manufacturers for blending into petrol, although in 2017 availability was limited due to competitive pressures. Of the ethanol in the petrol we supplied in the UK this period, 47% was derived from waste (FY17: 56%).
Action 2
Choose biofuels with the greatest carbon benefit
The average carbon saving from the biofuel blended into our petrol and diesel in the UK remained high at 81% (FY17: 82%). Our average carbon saving was 92% for biodiesel (FY17: 93%) and 67% for ethanol (FY17: 72%), reflecting limited availability and lower blending of waste-based ethanol.
We continue to work to maximise the carbon savings from the biofuel we blend:
» Using biofuel from wastes including from our own production, with higher carbon savings
» Capturing detailed information at each stage of our supply chain.
Action 3
Diversifying sustainable supply chains
Sourcing raw materials with the best sustainability and quality characteristics is an ongoing priority, particularly as we increase our biodiesel production.
Our focus is on developing lasting relationships with businesses in all continents of the world, and particularly in countries where comparable biofuel incentives do not exist. This requires pioneering work with suppliers to demonstrate traceability back to the restaurant. Our ability to receive waste oils in small containers also enables us to source raw materials from a wider variety of collectors globally.
Where we do use biofuels derived from crops, we ensure they are produced in accordance with EU-approved biofuel sustainability standards. Of the crop-based biofuel we supplied in the UK, 100% was verified as compliant with one of these standards (FY17: 100%).
Global Biofuels p50
Waste materialsUsed cooking oil
WheatOther wastes
CornFood waste
Sugar beet
Sugar cane
What is our biofuel made from?
Biodiesel All of the biodiesel we blended in the UK was derived from wastes. 99% was produced at our manufacturing facilities on the east coast of England using waste oils sourced from around the world.
BioethanolAlthough we are not ourselves an ethanol producer, we work with innovative third-party manufacturers to maximise our use of waste-derived ethanol as a petrol blend component.
Biodiesel blended into diesel supplied in the UK
Bioethanol blended into diesel supplied in the UK
8988 ANNUAL REPORT APRIL – DECEMBER 2017
PEOPLE AND ENVIRONMENT » BIOFUEL SUSTAINABILITY

5% 1%
60%
34%
People and environmentGroup carbon emissions
Group carbon emissions
Carbon emissions
Group carbon emission increased this year as a result of growth across the business, including increased biofuel production, the opening of Thames Oilport for diesel supply and expansion of our in-house haulage operations.
UK and Ireland Fuels
This period, our calculation for UK and Ireland Fuels includes emissions from our in-house and third-party haulage operations, which were previously broken out as a separate business unit.
Haulage represented the main source of emissions in our UK and Irish businesses. Compared with the same period in 2016, we drove further to deliver more fuel to customers but this additional mileage was offset by improved fuel efficiency of our UK in-house fleet, reflecting continued investment in newer vehicles as well as ongoing training in fuel efficient driving.
Fuel consumption by our in-house fleet averaged to nine miles per gallon this period (industry average: 7.9 MPG).
Emissions from the remainder of our UK and Irish businesses (primarily import, storage and distribution of fuels) increased 3% this period compared with the same period in 2016. Emissions associated with Inver Energy’s fuel business in Ireland relate primarily to the operation of the Foynes terminal, which is included under Infrastructure.
International Fuels
Emissions from our operations to source, store and supply fuel internationally increased due to growth of our businesses in Canada and Brazil. In particular, we imported fuel into Canada from further afield and took on more tankage in Brazil.
Infrastructure
Emissions from our infrastructure business increased significantly (up 91%), mainly as a result of the opening of Thames Oilport as a supply rather than storage location. Emissions also increased following the acquisition of Inver Energy’s fuel terminals at Foynes and Cardiff and the CAN-OP fuel terminal at Thunder Bay in Canada.
Global Biofuels
Emissions from our biofuel raw material sourcing and manufacturing operations were 18% higher than the same period last year as we expanded our biofuel sourcing and manufacturing operations. However, emissions per tonne of biodiesel produced reduced by 5% compared with the same period last year as a result of production efficiencies.
UK and Ireland Fuels p32
International Fuels p42
Infrastructure p56
Global Biofuels p50
Methodology All CO2e conversions from Greenergy operational data have been calculated in accordance with the Defra’s 2015 conversion factors for Company Reporting (2015, Version 1.1. Expiry – 31 May 2016), except for office workers where an industry standard carbon factor was used as government data was unavailable.
We have included all emissions classified in Scope 1 & 2 of the World Business Council on Sustainable Development Scope GHG Protocol (www.ghgprotocol.org/about-ghgp). Certain aspects of Scope 3 have also been included on a voluntary basis.
Emissions associated with office and travel have been allocated to the relevant business unit.
Global biofuels
Infrastructure
UK and Ireland Fuels
International Fuels
9190 ANNUAL REPORT APRIL – DECEMBER 2017
PEOPLE AND ENVIRONMENT » CARBON EMISSIONS

Directors'reports10
Strategic report
Strategic report for the 37 weeks ended 31 December 2017
The Directors present their strategic report for the Group for the period from 15 April 2017 to 31 December 2017 on pages 4-91.
Review of the business
The review of the business can be found on pages 10-16.
By order of the Board
Andrew OwensChief Executive
30 April 2018
9392 ANNUAL REPORT APRIL – DECEMBER 2017
PEOPLE AND ENVIRONMENT

Directors’ report
The Directors present their annual report on the Group, together with the financial statements and auditor’s report for the 37 week period from 15 April 2017 to 31 December 2017.
Directors’ report for the period 15 April 2017 to 31 December 2017.
In accordance with section 414C(ii) of the Companies Act 2016 information relating to future developments, Key Performance Indicators and financial risk management have been included within the strategic report.
Future developments
An indication of the likely future developments in the business can be found on pages 31-61.
Results and dividends
The Group’s profit before tax for this 37 week period was £48.0m before exceptional items (equivalent period in 2016: £56.4m).
The Directors propose a final dividend of £nil (FY17: £nil). The Directors declared interim dividends of £39.7m (FY17: £nil) in respect of the current year.
Political and charitable contributions
The Group allocated £220,000 for charitable donations during the period (FY17: £216,000), distributed primarily by the Company’s 22 employee charity teams referenced on page 86.
Statement of Directors’ responsibilities
The Directors are responsible for preparing the Directors’ Report and the financial statements in accordance with applicable law and regulations.
Company law requires the Directors to prepare financial statements for each financial year. Under that law the Directors have prepared the Group and parent Company financial statements in accordance with International Financial Reporting Standards (IFRSs) as adopted by the European Union. Under Company law the Directors must not approve the financial statements unless they are satisfied that they give a true and fair view of the state of affairs of the Group and the Company and of the profit or loss of the Group for that period
In preparing these financial statements, the Directors are required to:
» Select suitable accounting policies and then apply them consistently
» Make judgements and estimates that are reasonable and prudent
» State whether applicable IFRSs as adopted by the European Union have been followed, subject to any material departures disclosed and explained in the financial statements
» Prepare the financial statements on the going concern basis unless it is inappropriate to presume that the Company will continue in business.
The Directors are responsible for keeping adequate accounting records that are sufficient to show and explain the Company’s transactions and disclose with reasonable accuracy at any time the financial position of the Company and the Group and enable them to ensure that the financial statements comply with the Companies Act 2006.
They are also responsible for safeguarding the assets of the Company and the Group and hence for taking reasonable steps for the prevention and detection of fraud and other irregularities.
The Directors are responsible for the maintenance and integrity of the Company’s website. Legislation in the United Kingdom governing the preparation and dissemination of financial statements may differ from legislation in other jurisdictions.
Auditor
Deloitte LLP was appointed as statutory auditor during the period. Pursuant to section 487 of the Companies Act 2016, the auditor will be deemed to be reappointed and Deloitte LLP will therefore continue in office.
Disclosure of information to auditor
Each of the Directors who held office at the date of approval of this Directors’ report confirm that:
» So far as they are each aware, there is no relevant audit information of which the Company’s auditor is unaware
» Each Director has taken all the steps that he/she ought to have taken as a Director to make himself/herself aware of any relevant audit information and to establish that the Group and parent Company’s auditor are aware of that information.
This confirmation is given and should be interpreted in accordance with the provisions of section 418 of the Companies Act 2006.
By order of the Board.
Suppliers
Terms and conditions for business transaction are agreed individually with suppliers. Payment is then made on these terms, subject to the terms and conditions being met by the suppliers including the timely submission of satisfactory invoices and the due verification of the bank account to which payment is made. For this period the average trade payables period for the Company was one day, compared to two days in the prior financial year.
Financial risk management
The risk management programme of the Company, including financial risk management, is detailed on pages 72-81.
Directors
The Directors of the Company who served during the period and up to the date of signing the financial statements are:
Andrew Owens
Tamara Earley
Stephen McCaffrey
Paul Bateson
Caroline Lumbard
Chris Brookhouse
Chris O’Callaghan
Adam Traeger
Chris O’Callaghan and Adam Traeger joined the Board after the end of the period.
Employees
Communications are established and maintained with all employees through the Company intranet and twice yearly presentations.
Consultation with employees or their representatives has continued at all levels with the aim of ensuring that their views are taken into account when decisions are made that are likely to affect their interests and that all employees are aware of the financial and economic performance of their business units and of the Company as a whole.
Employment p86
Executive Directors p84
Applications for employment by disabled persons are always fully considered, bearing in mind the respective aptitudes and abilities of the applicant concerned. It is the policy of the Company that the training, career development and promotion of a disabled person should, as far as possible, be identical to that of a person who does not suffer from a disability.
R W CliftonCompany Secretary
30 April 2018
9594 ANNUAL REPORT APRIL – DECEMBER 2017
DIRECTORS' REPORT
Financials11
Navigator Terminals | Seal Sands, UK
9796 ANNUAL REPORT APRIL – DECEMBER 2017
Independent auditors’ report to the members of Greenergy Fuels Holdings Limited
Report on the audit of the financial statements
Our opinion
In our opinion:
» the financial statements give a true and fair view of the state of the Group’s and of the Parent Company’s affairs as at 31 December 2017 and of the Group’s profit for the period then ended;
» the Group financial statements have been properly prepared in accordance with International Financial Reporting Standards (IFRSs) as adopted by the European Union;
» the Parent Company financial statements have been properly prepared in accordance with IFRSs as adopted by the European Union and as applied in accordance with the provisions of the Companies Act 2006; and
» the financial statements have been prepared in accordance with the requirements of the Companies Act 2006.
Responsibilities of directorsAs explained more fully in the Directors’ responsibilities statement, the Directors are responsible for the preparation of the financial statements and for being satisfied that they give a true and fair view, and for such internal control as the directors determine is necessary to enable the preparation of financial statements that are free from material misstatement, whether due to fraud or error.
In preparing the financial statements, the Directors are responsible for assessing the Group’s and the Parent Company’s ability to continue as a going concern, disclosing, as applicable, matters related to going concern and using the going concern basis of accounting unless the Directors either intend to liquidate the Group or the Parent Company or to cease operations, or have no realistic alternative but to do so.
Auditor’s responsibilities for the audit of the financial statementsOur objectives are to obtain reasonable assurance about whether the financial statements as a whole are free from material misstatement, whether due to fraud or error, and to issue an auditor’s report that includes our opinion. Reasonable assurance is a high level of assurance, but is not a guarantee that an audit conducted in accordance with ISAs (UK) will always detect a material misstatement when it exists. Misstatements can arise from fraud or error and are considered material if, individually or in the aggregate, they could reasonably be expected to influence the economic decisions of users taken on the basis of these financial statements.
A further description of our responsibilities for the audit of the financial statements is located on the Financial Reporting Council’s website at: www.frc.org.uk/ auditorsresponsibilities. This description forms part of our auditor’s report.
We have audited the financial statements of Greenergy Fuels Holdings Limited (the ‘Parent Company’) and its subsidiaries (the ‘Group’) which comprise:
» the consolidated income statement
» the consolidated statement of comprehensive income
» the consolidated and Parent Company balance sheets
» the consolidated and Parent Company statements of changes in equity
» the consolidated and Parent Company cash flow statements; and
» the related notes 1 to 34.
The financial reporting framework that has been applied in their preparation is applicable law and International Financial Reporting Standards (IFRSs) as adopted by the European Union and, as regards the Parent Company financial statements, as applied in accordance with the provisions of the Companies Act 2006.
Basis for opinionWe conducted our audit in accordance with International Standards on Auditing (UK) (ISAs (UK)) and applicable law.
Our responsibilities under those standards are further described in the auditor’s responsibilities for the audit of the financial statements section of our report.
We are independent of the Group and the Parent Company in accordance with the ethical requirements that are relevant to our audit of the financial statements in the UK, including the FRC’s Ethical Standard, and we have fulfilled our other ethical responsibilities in accordance with these requirements. We believe that the audit evidence we have obtained is sufficient and appropriate to provide a basis for our opinion.
Use of our reportThis report is made solely to the Company’s members, as a body, in accordance with Chapter 3 of Part 16 of the Companies Act 2006. Our audit work has been undertaken so that we might state to the Company’s members those matters we are required to state to them in an auditor’s report and for no other purpose. To the fullest extent permitted by law, we do not accept or assume responsibility to anyone other than the Company and the Company’s members as a body, for our audit work, for this report, or for the opinions we have formed.
Report on other legal and regulatory requirements
Opinions on other matters prescribed by the Companies Act 2006
In our opinion, based on the work undertaken in the course of the audit:
» the information given in the strategic report and the Directors’ report for the financial year for which the financial statements are prepared is consistent with the financial statements, and
» the strategic report and the Directors’ report have been prepared in accordance with applicable legal requirements
» the financial statements have been prepared in accordance with the requirements of the Companies Act 2006.
In the light of the knowledge and understanding of the Group and of the Parent Company and their environment obtained in the course of the audit, we have not identified any material misstatements in the strategic report or the Directors’ report.
Matters on which we are required to report by exception
Under the Companies Act 2006 we are required to report in respect of the following matters if, in our opinion:
» adequate accounting records have not been kept by the Parent Company, or returns adequate for our audit have not been received from branches not visited by us; or
» the Parent Company financial statements are not in agreement with the accounting records and returns; or
» certain disclosures of Directors’ remuneration specified by law are not made; or
» we have not received all the information and explanations we require for our audit.
We have nothing to report in respect of these matters.
David Paterson ACA Senior Statutory Auditor
for and on behalf of Deloitte LLP Statutory Auditor
London 30 April 2018
Conclusions relating to going concernWe are required by ISAs (UK) to report in respect of the following matters where:
» the Directors’ use of the going concern basis of accounting in preparation of the financial statements is not appropriate; or
» the Directors have not disclosed in the financial statements any identified material uncertainties that may cast significant doubt about the Group’s or the Parent Company’s ability to continue to adopt the going concern basis of accounting for a period of at least twelve months from the date when the financial statements are authorised for issue.
We have nothing to report in respect of these matters.
Other informationIn connection with our audit of the financial statements, our responsibility is to read the other information and, in doing so, consider whether the other information is materially inconsistent with the financial statements or our knowledge obtained in the audit or otherwise appears to be materially misstated. If we identify such material inconsistencies or apparent material misstatements, we are required to determine whether there is a material misstatement in the financial statements or a material misstatement of the other information. If, based on the work we have performed, we conclude that there is a material misstatement of this other information, we are required to report that fact.
We have nothing to report in respect of these matters.
FINANCIALS
9998 ANNUAL REPORT APRIL – DECEMBER 2017

Consolidated statement of comprehensive income
Group Note
37 week period ended 31 December 2017
£’000
Year ended 14 April 2017
£’000
Profit for the financial period/year 27,647 58,800
Other comprehensive (expense)/income:
Items that may be reclassified subsequently to profit or loss
Available-for-sale financial assets 15 10 11,638
Exchange difference on translation of net assets of subsidiaries (1,657) 612
Cash flow hedges - 272
Total items that may be reclassified subsequently to profit or loss (1,647) 12,552
Other comprehensive (expense)/income for the period, net of tax (1,647) 12,552
Total comprehensive income for the year, net of tax 26,000 71,322
Attributable to:
Owners of the Parent 25,916 71,028
Non-controlling interest 84 294
Total comprehensive income for the year, net of tax 26,000 71,322
The items in the statement above are disclosed net of tax. There are no other taxation charges or credits associated with the elements of other comprehensive income reported above (14 April 2017: none).
The notes on pages 107-146 are an integral part of these consolidated financial statements.
For the 37 week period ended 31 December 2017
Consolidated income statement
Note
37 week period ended 31 December 2017
£’000
Year ended 14 April 2017
£’000
Revenue 5 11,158,397 14,868,124
Cost of sales (11,006,475) (14,645,618)
Gross profit 151,922 222,506
Distribution costs (55,714) (78,184)
Administrative expenses (43,465) (62,077)
Other operating income - 1,021
Exceptional items: Impairment charges 25 (8,348) -
Share of results of joint ventures and associates 14 112 868
Operating profit 6 44,507 84,134
Investment income 19 2,953 3,126
Finance income 8 20 98
Finance costs 9 (7,859) (9,786)
Profit before taxation 39,621 77,572
Income tax expense 10 (11,974) (18,772)
Profit for the financial period / year 27,647 58,800
Profit attributable to:
Owners of the Parent 27,563 58,506
Non-controlling interest 84 294
Profit for the financial period / year 27,647 58,800
The results stated above are all derived from continuing operations.
The notes on pages 107-146 are an integral part of these consolidated financial statements.
For the 37 week period ended 31 December 2017
FINANCIALS
101100 ANNUAL REPORT APRIL – DECEMBER 2017

Consolidated and Companybalance sheets
Group Company
Note31 December 2017
£’00014 April 2017
£’00031 December 2017
£’00014 April 2017
£’000
Equity
Share capital 26 177 158 177 158
Share premium account 85 85 85 85
Merger reserve 24,904 24,904 - -
Capital redemption reserve (689) (689) - -
Revaluation reserve 12,093 12,083 - -
Retained earnings 185,402 204,233 24,000 -
Equity attributable to owners of the Parent 221,972 240,774 24,262 243
Non-controlling interests (233) (317) - -
Total equity 221,739 240,457 24,262 243
The Company has elected to take the exemption under section 408 of the Companies Act 2006 not to present the Parent Company income statement.
The profit of the Parent Company for the period was £63,748,000 (14 April 2017: £nil).
The notes on pages 107-146 are an integral part of these consolidated financial statements.
The financial statements on pages 100-146 were approved by the Board of Directors on 30 April 2018 and were signed on its behalf by:
Company number: 07318726
Consolidated and Company balance sheets (continued)
Group Company
Note31 December 2017
£’00014 April 2017
£’00031 December 2017
£’00014 April 2017
£’000
Assets
Non-current assets
Property, plant and equipment 12 117,546 107,983 - -
Intangible assets 13 61,163 35,733 - -
Investment in Group undertakings 14 - - 24,243 243
Investments in associates 14 244 164 - -
Investments in joint ventures 14 93,879 92,273 - -
Available-for-sale financial assets 15 25,267 25,256 - -
Other receivables 17 25,413 56,831 - -
Deferred income tax assets 22 293 438 - -
323,805 318,678 24,243 243
Current assets
Inventories 16 601,149 556,595 - -
Trade and other receivables 17 925,125 870,254 5,118 -
Cash and cash equivalents 18 19,711 60,499 - -
1,545,985 1,487,348 5,118 -
Total assets 1,869,790 1,806,026 29,361 243
Liabilities
Non-current liabilities
Borrowings 20 - (8,895) - -
Provisions for other liabilities and charges 21 (1,700) (4,699) - -
Other payables 23 (27,370) (1,461) - -
Deferred income tax liabilities 22 (12,826) (3,637) - -
(41,896) (18,692) - -
Current liabilities
Trade and other payables 23 (1,173,991) (1,284,041) (5,099) -
Borrowings 20 (429,481) (253,184) - -
Corporation tax liabilities (2,683) (9,652) - -
(1,606,155) (1,546,877) (5,099) -
Total liabilities (1,648,051) (1,565,569) (5,099) -
Net assets 221,739 240,457 24,262 243
SE McCaffreyDirector
As at 31 December 2017As at 31 December 2017
FINANCIALS
103102 ANNUAL REPORT APRIL – DECEMBER 2017

Consolidated statement of changes in equity
Company statementof changes in equity
As at 31 December 2017
Attributable to owners of the Parent
Group Note
Share capital £’000
Share premium account
£’000
Merger reserve
£’000
Retained earnings
£’000
Capital redemption
reserve £’000
Hedging reserve
£’000
Revaluation reserve
£’000Total
£’000
Non- controlling
interest £’000
Total equity £’000
Balance at 15 April 2016 158 85 24,904 140,457 (689) (272) 446 165,089 (612) 164,477
Comprehensive income
Profit for the year - - - 58,506 - - - 58,506 294 58,800
Other comprehensive income
Available-for-sale financial assets
15 - - - - - - 11,638 11,638 - 11,638
Exchange difference on translation of net assets of subsidiaries
- - - 612 - - - 612 - 612
Cash flow hedge: Fair value gains in year
- - - - - 272 - 272 - 272
Total comprehensive income - - - 59,118 - 272 11,638 71,027 294 71,322
Share-based payments 27 - - - 107 - - - 107 - 107
Deferred tax on share options 11 - - - 4,552 - - - 4,552 - 4,552
Total transactions with owners - - - 4,659 - - - 4,659 - 4,659
Balance at 15 April 2017 158 85 24,904 204,233 (689) - 12,083 240,775 (317) 240,458
Comprehensive income
Profit for the period - - - 27,563 - - - 27,563 84 27,647
Other comprehensive income
Available-for-sale financial assets
15 - - - - - - 10 10 - 10
Exchange difference on translation of net assets of subsidiaries
- - - (1,657) - - - (1,657) - (1,657)
Total comprehensive income - - - 25,906 - - 10 25,916 84 26,000
Share-based payments 27 - - - 9 - - - 9 - 9
Issue of share capital 19 - - - - - - 19 - 19
Dividends 11 - - - (39,748) - - - (39,748) - (39,748)
Deferred tax on share options - - - (4,999) - - - (4,999) - (4,999)
Total transactions with owners 19 - - (44,738) - - - (44,719) - (44,719)
Balance at 31 December 2017 177 85 24,904 185,402 (689) - 12,093 221,972 (233) 221,739
The notes on pages 107-146 are an integral part of these consolidated financial statement
The merger reserve arose on the restructuring of the Group and acquisition of subsidiaries in prior periods.
The capital redemption reserve arose on the purchase of the Company’s own shares in prior periods.
The revaluation reserve arose on the revaluation of available-for-sale financial assets.
The hedging reserve represents the gains and losses on certain derivative instruments.
Retained earnings represents the cumulative balance of earnings not distributed.
Attributable to owners of the Parent
Company Note
Share capital £’000
Share premium account
£’000Retained earnings
£’000
TotalEquity £’000
Balance at 15 April 2016 158 85 - 243
Comprehensive income
Result for the financial year - - - -
Total comprehensive income - - - -
Dividends 11 - - - -
Total transactions with owners - - - -
Balance at 15 April 2017 158 85 - 243
Comprehensive income
Profit for the financial period - - 63,748 63,748
Total comprehensive income - - 63,748 63,748
Issue of share capital 19 - - 19
Dividends 11 - - (39,748) (39,748)
Total transactions with owners 19 - (39,748) (39,729)
Balance at 31 December 2017 177 85 24,000 24,262
The notes on pages 107-146 are an integral part of these consolidated financial statements.
Retained earnings represents the cumulative balance of earnings not distributed.
As at 31 December 2017
FINANCIALS
105104 ANNUAL REPORT APRIL – DECEMBER 2017

Consolidated and Company statements of cash flows
Group Company
Note
37 week period ended
31 December 2017 £’000
Year ended 14 April 2017
£’000
37 week period ended
31 December 2017£’000
Year ended 14 April 2017
£’000
Net cash used in operating activities 28 (102,298) (129,048) (19) -
Investing activities
Acquisition of subsidiaries net of cash acquired 34 (49,148) (354) (24,000) -
Purchases of property, plant and equipment (6,644) (7,473) - -
Purchases of intangible assets (1,664) (3,917) - -
Proceeds from sale of property, plant and equipment - 221 - -
Dividends received 1,369 - 63,748 -
Acquisition of shareholding in joint arrangement (3,027) - - -
Redesignation of joint arrangement - (3,316) - -
Net cash generated from/(used in) investing activities
(59,114) (14,839) 39,748 -
Financing activities
Repayments of borrowings (11,895) (8,594) - -
Proceeds of issuing share capital 19 - 19 -
Finance income 20 98 - -
Finance costs (7,069) (8,858) - -
Dividends paid 11 (39,748) - (39,748) -
Net cash used in financing activities (58,673) (17,354) (39,729) -
Decrease in cash and cash equivalents (220,085) (161,241) - -
Cash and cash equivalents and bank overdrafts at the beginning of the period/year
(189,685) (28,444) - -
Cash and cash equivalents and bank overdrafts at the end of the period/year
18 (409,770) (189,685) - -
The notes on pages 107-146 are an integral part of these consolidated financial statements.
Notes to the financial statements
1. Summary of business and significant accounting policies
General business descriptionGreenergy Fuels Holdings Limited (the ‘Company’) is a company domiciled and incorporated in the UK. The address of the registered office is given on page 148.
The Company and its subsidiaries (together, ‘the Group’) is one of the major petrol and diesel oil suppliers in the UK, being the UK’s largest independent oil group. The Group is also a major supplier, manufacturer and trader of biofuels and has supporting supply and trading operations outside the UK.
Basis of preparationThe consolidated financial statements have been prepared in accordance with International Financial Reporting Standards as adopted by the European Union (IFRS) and International Financial Reporting Interpretations Committee (IFRIC) interpretations and the Companies Act 2006 applicable to companies reporting under IFRS.
The consolidated financial statements have been prepared on the going concern basis and under the historical cost convention, as modified by the revaluation of inventories, available-for-sale financial assets and financial assets and financial liabilities (including derivative instruments) at fair value through profit or loss. The accounting policies that follow have been consistently applied to all years presented. The consolidated financial statements are presented in Pounds Sterling and all values are rounded to the nearest thousand Pounds Sterling (£ thousand), except where otherwise indicated.
In preparing the financial statements on the going concern basis the Directors have considered the reliance the Group has on the $950 million working capital facility provided by a syndicate of banks which is due to expire in April 2020, and involving elements of both committed and uncommitted facilities. Given the long-standing nature of these banking relationships, the bankers’ willingness to renew and extend credit lines in the recent past, and verbal assurances received from the bankers, the Directors are satisfied that both the uncommitted and committed facilities will continue to be available to the Group for the foreseeable future.
Consolidation
The consolidated financial statements include the financial statements of the Company and the entities it controls (its subsidiary undertakings) made up to the year-end date. Control is achieved where the Company has the power to govern the financial and operating policies of an entity, generally accompanying a shareholding of greater than half of the voting rights, so as to obtain benefits from its activities.
The financial performance and position of subsidiaries are consolidated for the same reporting year as the Parent Company, using consistent accounting policies.
The results of subsidiaries acquired or disposed of during the year are fully consolidated from the effective date of acquisition or up to the effective date of disposal.
All intragroup balances, transactions, income and expenses are eliminated in full.
Foreign currency
a. Functional and presentational currency
Items included in the financial statements of each of the Group’s entities are measured using the currency of the primary economic environment in which the entity operates (‘the functional currency’). The consolidated financial statements are presented in Pounds Sterling, which is the Company’s functional and the Group’s presentational currency.
b. Transactions and balances
Transactions in foreign currencies are initially recorded using monthly rates of exchange. Monetary assets and liabilities denominated in foreign currencies are translated using the rate of exchange ruling at the balance sheet date and the gains or losses on translation are included in the income statement within cost of sales.
Non-monetary assets and liabilities that are measured at historical cost and denominated in a foreign currency are translated into the functional currency using the rates of exchange as at the dates of the initial transactions. Non-monetary assets and liabilities measured at fair value in a foreign currency are translated into the functional currency using the rate of exchange at the date the fair value was determined. These gains or losses on translation are included in the income statement within administrative expenses.
Group companiesThe results and financial position of all the Group entities (none of which has the currency of a hyper-inflationary economy) that have a functional currency different from the presentational currency are translated into the presentational currency as follows:
i. Assets and liabilities for each balance sheet presented are translated at the closing rate at the date of the balance sheet
ii. Income and expenses for each income statement are translated at average exchange rates, and
iii. All resulting exchange differences are recognised in other comprehensive income.
For the 37 week period ended 31 December 2017
FINANCIALS
107106 ANNUAL REPORT APRIL – DECEMBER 2017
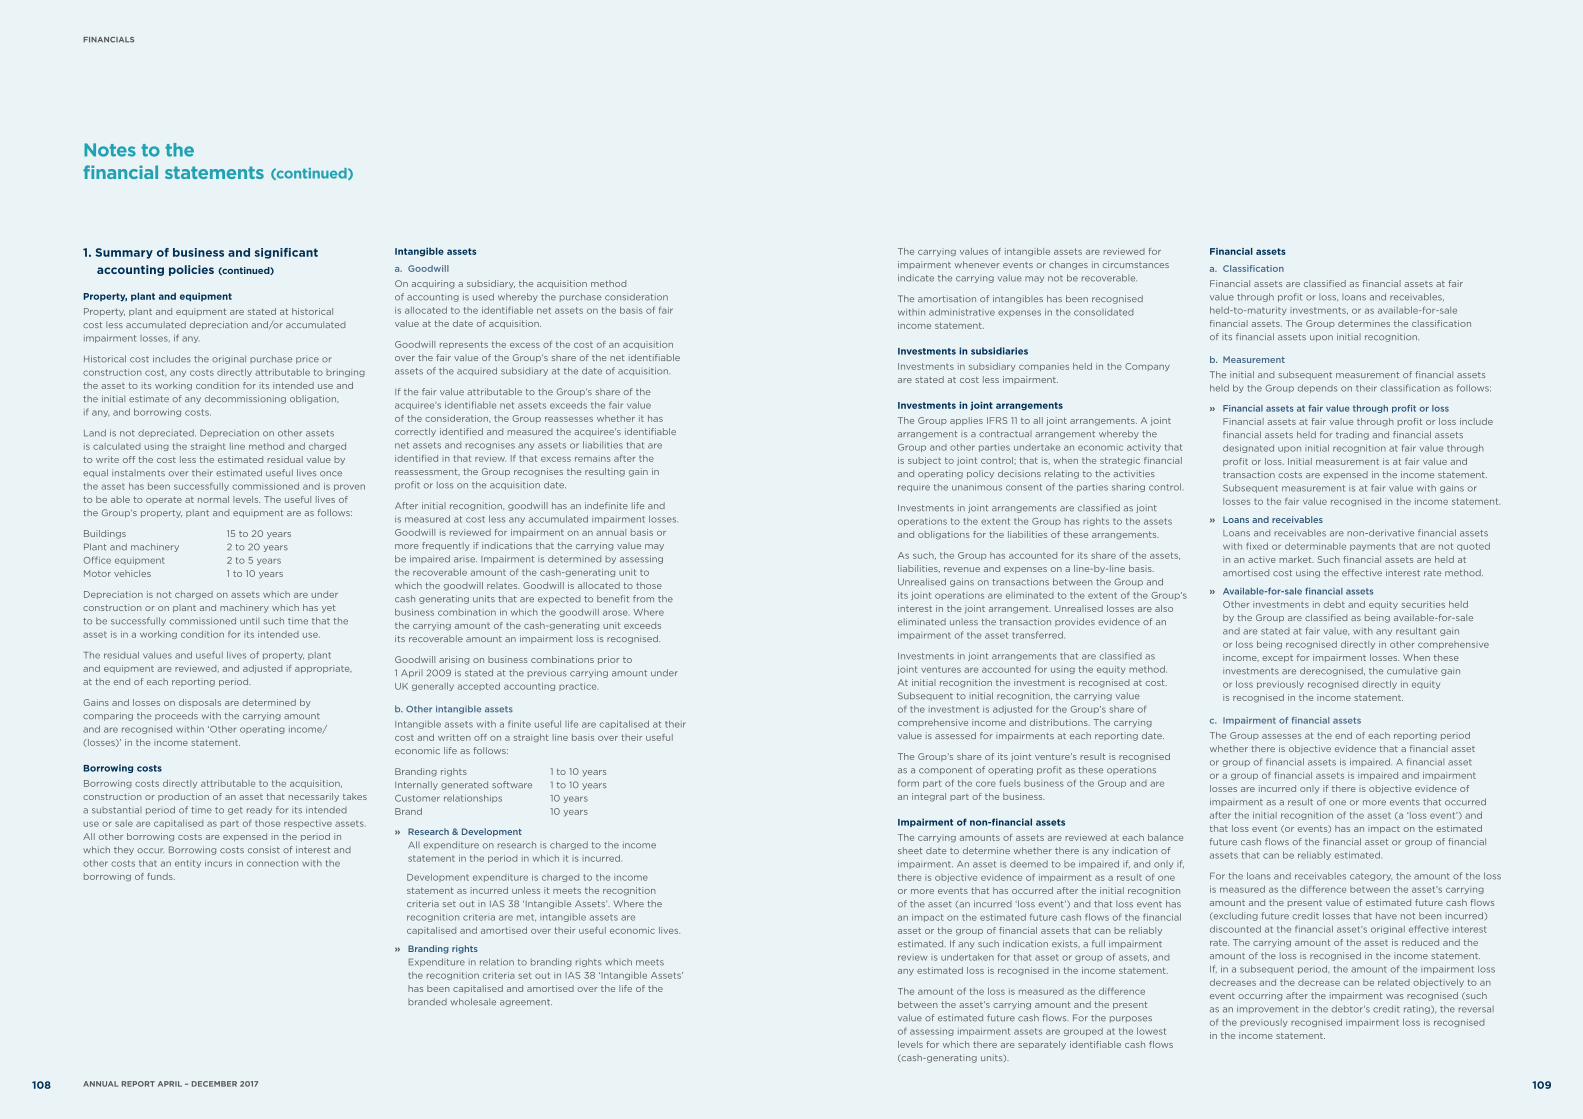
1. Summary of business and significant accounting policies (continued)
Property, plant and equipmentProperty, plant and equipment are stated at historical cost less accumulated depreciation and/or accumulated impairment losses, if any.
Historical cost includes the original purchase price or construction cost, any costs directly attributable to bringing the asset to its working condition for its intended use and the initial estimate of any decommissioning obligation, if any, and borrowing costs.
Land is not depreciated. Depreciation on other assets is calculated using the straight line method and charged to write off the cost less the estimated residual value by equal instalments over their estimated useful lives once the asset has been successfully commissioned and is proven to be able to operate at normal levels. The useful lives of the Group’s property, plant and equipment are as follows:
Buildings 15 to 20 years Plant and machinery 2 to 20 years Office equipment 2 to 5 years Motor vehicles 1 to 10 years
Depreciation is not charged on assets which are under construction or on plant and machinery which has yet to be successfully commissioned until such time that the asset is in a working condition for its intended use.
The residual values and useful lives of property, plant and equipment are reviewed, and adjusted if appropriate, at the end of each reporting period.
Gains and losses on disposals are determined by comparing the proceeds with the carrying amount and are recognised within ‘Other operating income/ (losses)’ in the income statement.
Borrowing costsBorrowing costs directly attributable to the acquisition, construction or production of an asset that necessarily takes a substantial period of time to get ready for its intended use or sale are capitalised as part of those respective assets. All other borrowing costs are expensed in the period in which they occur. Borrowing costs consist of interest and other costs that an entity incurs in connection with the borrowing of funds.
Intangible assets
a. Goodwill
On acquiring a subsidiary, the acquisition method of accounting is used whereby the purchase consideration is allocated to the identifiable net assets on the basis of fair value at the date of acquisition.
Goodwill represents the excess of the cost of an acquisition over the fair value of the Group’s share of the net identifiable assets of the acquired subsidiary at the date of acquisition.
If the fair value attributable to the Group’s share of the acquiree’s identifiable net assets exceeds the fair value of the consideration, the Group reassesses whether it has correctly identified and measured the acquiree’s identifiable net assets and recognises any assets or liabilities that are identified in that review. If that excess remains after the reassessment, the Group recognises the resulting gain in profit or loss on the acquisition date.
After initial recognition, goodwill has an indefinite life and is measured at cost less any accumulated impairment losses. Goodwill is reviewed for impairment on an annual basis or more frequently if indications that the carrying value may be impaired arise. Impairment is determined by assessing the recoverable amount of the cash-generating unit to which the goodwill relates. Goodwill is allocated to those cash generating units that are expected to benefit from the business combination in which the goodwill arose. Where the carrying amount of the cash-generating unit exceeds its recoverable amount an impairment loss is recognised.
Goodwill arising on business combinations prior to 1 April 2009 is stated at the previous carrying amount under UK generally accepted accounting practice.
b. Other intangible assets
Intangible assets with a finite useful life are capitalised at their cost and written off on a straight line basis over their useful economic life as follows:
Branding rights 1 to 10 years Internally generated software 1 to 10 years Customer relationships 10 years Brand 10 years
» Research & Development All expenditure on research is charged to the income statement in the period in which it is incurred.
Development expenditure is charged to the income statement as incurred unless it meets the recognition criteria set out in IAS 38 ‘Intangible Assets’. Where the recognition criteria are met, intangible assets are capitalised and amortised over their useful economic lives.
» Branding rights Expenditure in relation to branding rights which meets the recognition criteria set out in IAS 38 ‘Intangible Assets’ has been capitalised and amortised over the life of the branded wholesale agreement.
The carrying values of intangible assets are reviewed for impairment whenever events or changes in circumstances indicate the carrying value may not be recoverable.
The amortisation of intangibles has been recognised within administrative expenses in the consolidated income statement.
Investments in subsidiariesInvestments in subsidiary companies held in the Company are stated at cost less impairment.
Investments in joint arrangementsThe Group applies IFRS 11 to all joint arrangements. A joint arrangement is a contractual arrangement whereby the Group and other parties undertake an economic activity that is subject to joint control; that is, when the strategic financial and operating policy decisions relating to the activities require the unanimous consent of the parties sharing control.
Investments in joint arrangements are classified as joint operations to the extent the Group has rights to the assets and obligations for the liabilities of these arrangements.
As such, the Group has accounted for its share of the assets, liabilities, revenue and expenses on a line-by-line basis. Unrealised gains on transactions between the Group and its joint operations are eliminated to the extent of the Group’s interest in the joint arrangement. Unrealised losses are also eliminated unless the transaction provides evidence of an impairment of the asset transferred.
Investments in joint arrangements that are classified as joint ventures are accounted for using the equity method. At initial recognition the investment is recognised at cost. Subsequent to initial recognition, the carrying value of the investment is adjusted for the Group’s share of comprehensive income and distributions. The carrying value is assessed for impairments at each reporting date.
The Group’s share of its joint venture’s result is recognised as a component of operating profit as these operations form part of the core fuels business of the Group and are an integral part of the business.
Impairment of non-financial assetsThe carrying amounts of assets are reviewed at each balance sheet date to determine whether there is any indication of impairment. An asset is deemed to be impaired if, and only if, there is objective evidence of impairment as a result of one or more events that has occurred after the initial recognition of the asset (an incurred ‘loss event’) and that loss event has an impact on the estimated future cash flows of the financial asset or the group of financial assets that can be reliably estimated. If any such indication exists, a full impairment review is undertaken for that asset or group of assets, and any estimated loss is recognised in the income statement.
The amount of the loss is measured as the difference between the asset’s carrying amount and the present value of estimated future cash flows. For the purposes of assessing impairment assets are grouped at the lowest levels for which there are separately identifiable cash flows (cash-generating units).
Financial assets
a. Classification
Financial assets are classified as financial assets at fair value through profit or loss, loans and receivables, held-to-maturity investments, or as available-for-sale financial assets. The Group determines the classification of its financial assets upon initial recognition.
b. Measurement
The initial and subsequent measurement of financial assets held by the Group depends on their classification as follows:
» Financial assets at fair value through profit or loss Financial assets at fair value through profit or loss include financial assets held for trading and financial assets designated upon initial recognition at fair value through profit or loss. Initial measurement is at fair value and transaction costs are expensed in the income statement. Subsequent measurement is at fair value with gains or losses to the fair value recognised in the income statement.
» Loans and receivables Loans and receivables are non-derivative financial assets with fixed or determinable payments that are not quoted in an active market. Such financial assets are held at amortised cost using the effective interest rate method.
» Available-for-sale financial assets Other investments in debt and equity securities held by the Group are classified as being available-for-sale and are stated at fair value, with any resultant gain or loss being recognised directly in other comprehensive income, except for impairment losses. When these investments are derecognised, the cumulative gain or loss previously recognised directly in equity is recognised in the income statement.
c. Impairment of financial assets
The Group assesses at the end of each reporting period whether there is objective evidence that a financial asset or group of financial assets is impaired. A financial asset or a group of financial assets is impaired and impairment losses are incurred only if there is objective evidence of impairment as a result of one or more events that occurred after the initial recognition of the asset (a ‘loss event’) and that loss event (or events) has an impact on the estimated future cash flows of the financial asset or group of financial assets that can be reliably estimated.
For the loans and receivables category, the amount of the loss is measured as the difference between the asset’s carrying amount and the present value of estimated future cash flows (excluding future credit losses that have not been incurred) discounted at the financial asset’s original effective interest rate. The carrying amount of the asset is reduced and the amount of the loss is recognised in the income statement. If, in a subsequent period, the amount of the impairment loss decreases and the decrease can be related objectively to an event occurring after the impairment was recognised (such as an improvement in the debtor’s credit rating), the reversal of the previously recognised impairment loss is recognised in the income statement.
Notes to the financial statements (continued)
FINANCIALS
109108 ANNUAL REPORT APRIL – DECEMBER 2017

1. Summary of business and significant accounting policies (continued) For available-for-sale financial assets, a significant or prolonged decline in the fair value of the security below its cost is also evidence that the assets are impaired.
If any such evidence exists for available-for-sale financial assets, the cumulative loss – measured as the difference between the acquisition cost and the current fair value, less any impairment loss on that financial asset previously recognised in profit or loss – is removed from equity and recognised in the income statement. Impairment losses recognised on equity instruments are not reversed through the income statement.
Financial liabilitiesWhen a financial liability is recognised initially, the Group measures it at its fair value less, in the case of a financial liability not at fair value through profit or loss, transaction costs that are directly attributable to the issue of the financial liability. Financial liabilities include trade payables, other payables, borrowings and derivative financial instruments. Subsequent measurement depends on its classification as follows:
Financial liabilities at fair value through profit or loss
Financial liabilities classified as held for trading and derivative liabilities that are not designated as effective hedging instruments are classified as financial liabilities at fair value through profit or loss. Such liabilities are carried on the balance sheet at fair value with gains or losses being recognised in the income statement
Other
All other financial liabilities not classified as fair value through profit or loss are measured at amortised cost using the effective interest method.
Derivative financial instruments and hedging activitiesDerivatives are initially recognised at fair value on the date a derivative contract is entered into and are subsequently re-measured at their fair value. The method of recognising the resulting gain or loss depends on whether the derivative is designated as a hedging instrument, and if so, the nature of the item being hedged. The Group designates certain derivatives as either:
» Hedges of the fair value of recognised assets or liabilities or a firm commitment (fair-value hedge); or
» Hedges of a particular risk associated with a recognised asset or liability or a highly probable forecast transaction (cash flow hedge); or
» Hedges of a net investment in a foreign operation (net investment hedge).
The Group documents at the inception of the transaction
the relationship between hedging instruments and hedged items, as well as its risk management objectives and strategy for undertaking various hedging transactions. The Group also documents its assessment, both at hedge inception and on an ongoing basis, of whether the derivatives that are used in hedging transactions are highly effective in offsetting the changes in fair values or cash flows of hedged items.
The fair values of various derivative instruments used for hedging purposes are disclosed in note 24. The full fair value of a hedging derivative is classified as a non-current asset or liability when the remaining hedged item is more than 12 months; and as a current asset or liability when the remaining maturity of the hedged item is less than 12 months. Trading derivatives are classified as a current asset or liability.
Cash flow hedgeThe effective portion of changes in the fair value of derivatives that are designated and qualify as cash flow hedges is recognised in other comprehensive income. The gain or loss relating to the ineffective portion is recognised immediately in the income statement within Cost of sales.
Amounts accumulated in equity are reclassified to profit or loss in the periods when the hedged item affects profit or loss (for example, when the forecast sale that is hedged takes place).
When a hedging instrument expires or is sold, or when a hedge no longer meets the criteria for hedge accounting, any cumulative gain or loss existing in equity at that time remains in equity and is recognised when the forecast transaction is ultimately recognised in the income statement. When a forecast transaction is no longer expected to occur, the cumulative gain or loss that was reported in equity is immediately transferred to the income statement within Cost of sales.
LeasesLeases in which a significant portion of the risks and rewards of ownership are retained by the lessor are classified as operating leases. Payments made under operating leases (net of any incentives received from the lessor) are charged to the income statement on a straight-line basis over the period of the lease.
Finance leases, which transfer to the Group substantially all the risks and benefits incidental to ownership of the leased item, are capitalised at the commencement of the lease at the fair value of the leased property or, if lower, at the present value of the minimum lease payments. Lease payments are apportioned between finance charges and reduction of the lease liability so as to achieve a constant rate of interest on the remaining balance of the liability. Finance charges are recognised in the income statement.
Leased assets are depreciated over the useful life of the asset. However, if there is no reasonable certainty that the Group will obtain ownership by the end of the lease term, the asset is depreciated over the shorter of the estimated useful life of the asset and the lease term.
InventoriesFuel products are traded in active markets and are purchased with a view to resale in the near future, generating a profit from fluctuations in prices or margins. As a result, stocks of fuel products are carried at market value by reference to quoted market prices at year-end, in accordance with the broker/trader exemption granted by IAS 2. Changes in fair value are recognised in the income statement through cost of sales. Used cooking oil and other products and chemicals used in the production of biofuels are valued at the lower of cost and net realisable value. Duty paid on stock is valued at cost.
Renewable Transport Fuel Obligation (RTFO) Since 1 April 2008 the Group has been part of the Renewable Transport Fuel Obligation (RTFO) scheme under which it is required to meet annual targets for the supply of biofuels. The obligations which arise are either settled by cash or through the delivery of certificates which are generated by the Group through the blending of biofuels.
To the extent that the Group generates certificates in excess of its current year obligation, these can either be carried forward to offset up to 25% of the next year’s obligation of the Group or sold to other parties.
The liability associated with the Group’s obligations under the scheme are recognised in the year in which the obligation arises and is valued by reference to either the cost of generating the certificates which will be surrendered to meet the obligation or the expected future cash outflow where cash settled. This is disclosed as the fuel compliance obligation.
Certificates generated or purchased during the year which will be used to settle the current obligation are recognised at the lower of cost and net realisable value.
Where certificates are generated, cost is deemed to be the average cost of blending biofuels during the year in which the certificates are generated.
Certificates held for sale to third parties are recognised at fair value by reference to year-end market prices. Changes in market prices of the certificates and the quantity of tickets considered to be realisable through external sales are recognised immediately in the income statement.
Certificates for which no active market is deemed to exist are not recognised.
Trade receivablesTrade receivables are amounts due from customers for fuel products sold or services performed in the ordinary course of business. If collection is expected in one year or less they are classified as current assets, otherwise they are presented as non-current assets.
Trade receivables are recognised initially at fair value and subsequently at amortised cost, less provision for impairment.
Cash and cash equivalentsCash and cash equivalents include cash in hand, deposits held at call with banks, and other short-term highly liquid investments with original maturities of three months or less.
Share capitalOrdinary shares are classified as equity. Incremental costs directly attributable to the issue of new shares are shown in equity as a deduction, net of tax, from the proceeds.
Trade payablesTrade payables are obligations to pay for goods or services that have been acquired in the ordinary course of business from suppliers. Accounts payable are classified as current liabilities if payment is due within one year or less; otherwise they are presented as non-current liabilities.
Trade payables are recognised initially at fair value and subsequently measured at amortised cost.
BorrowingsBorrowings are recognised initially at fair value, net of transaction costs incurred. Borrowings are subsequently carried at amortised cost; any difference between the proceeds (net of transaction costs) and the redemption value is recognised in the income statement over the period of the borrowings using the effective interest method.
Fees paid on the establishment of loan facilities are recognised as transaction costs of the loan to the extent that it is probable that some or all of the facility will be drawn down. In this case, the fee is deferred until the draw-down occurs. To the extent there is no evidence that it is probable that some or all of the facility will be drawn down, the fee is capitalised as a pre-payment for liquidity services and amortised over the period of the facility to which it relates.
Bank overdrafts are included within the current borrowings on the balance sheet.
Current and deferred income taxesThe tax expense for the year comprises current and deferred tax. Tax is recognised in the income statement, except to the extent that it relates to items recognised in other comprehensive income or directly in equity. In this case, the tax is also recognised in other comprehensive income or directly in equity, respectively.
a. Current taxes
The current income tax charge is calculated on the basis of the tax laws enacted or substantively enacted at the balance sheet date in the countries where the Company’s subsidiaries operate and generate taxable income.
Notes to the financial statements (continued)
FINANCIALS
111110 ANNUAL REPORT APRIL – DECEMBER 2017

1. Summary of business and significant accounting policies (continued)
b. Deferred taxes
Deferred income tax is recognised, using the liability method, on temporary differences arising between the tax bases of assets and liabilities and their carrying amounts in the consolidated financial statements. However, deferred tax liabilities are not recognised if they arise from the initial recognition of goodwill; deferred income tax is not accounted for if it arises from initial recognition of an asset or liability in a transaction other than a business combination that at the time of the transaction affects neither accounting nor taxable profit or loss. Deferred income tax is determined using tax rates (and laws) that have been enacted or substantially enacted by the balance sheet date and are expected to apply when the related deferred income tax asset is realised or the deferred income tax liability is settled.
Deferred income tax assets are recognised only to the extent that it is probable that future taxable profit will be available against which the temporary differences can be utilised.
Deferred income tax is provided on temporary differences arising on investments in subsidiaries and associates, except for deferred income tax liability where the timing of the reversal of the temporary difference is controlled by the Group and it is probable that the temporary difference will not reverse in the foreseeable future.
Deferred income tax assets and liabilities are offset when there is a legally enforceable right to offset current tax assets against current tax liabilities and when the deferred income taxes assets and liabilities relate to income taxes levied by the same taxation authority on either the same taxable entity or different taxable entities where there is an intention to settle the balances on a net basis.
Share-based paymentsThe Group operates a number of equity-settled, share-based compensation plans. The cost of equity-settled transactions with employees is measured by reference to the fair value at the date at which they are granted and is recognised as an expense over the vesting period, which ends on the date on which the relevant employees become fully entitled to the award. The total amount to be expensed over the vesting period is determined by reference to the fair value of the options granted, excluding the impact of any non-market vesting conditions (for example, profitability and sales growth targets). Non-market vesting conditions are included in assumptions about the number of options that are expected to vest. At each balance sheet date, the entity revises its estimates of the number of options that are expected to vest. It recognises the impact of the revision to original estimates, if any, in income statement, with a corresponding adjustment to equity.
The financial effect of awards by the Group of options over its equity shares to the employees of subsidiary undertakings are recognised by the subsidiary undertakings in their separate financial statements.
The proceeds received net of any directly attributable transaction costs are credited to share capital (nominal value) and share premium when the options are exercised.
Pension costsContributions are made to the personal plans of all applicable employees. The expenditure is charged to the income statement in the period to which it relates.
Provisions and contingenciesProvisions are recognised when the Group has a present obligation (legal or constructive) as a result of a past event, it is probable that an outflow of resources will be required to settle the obligation and a reliable estimate can be made of the amount.
A contingent liability is disclosed where the existence of an obligation will only be confirmed by future events or where the amount of the obligation cannot be measured reliably. Contingent assets are not recognised, but are disclosed where an inflow of economic benefits is probable.
Where the Company enters into financial guarantee contracts to guarantee the indebtedness of other companies within its Group, the Company considers these to be insurance arrangements, and accounts for them accordingly. In this respect, the Company treats the guarantee contract as a contingent liability until such time as it becomes probable that the Company will be required to make a payment under the guarantee.
Revenue recognitionRevenue comprises the fair value of the consideration received or receivable for the sale of goods and services in the ordinary course of the Group’s activities.
Revenue is recognised when the significant risks and rewards of ownership have passed to the buyer and the value can be reliably measured. Revenue is measured at the fair value of the consideration received or receivable for goods provided in the normal course of business, net of discounts, rebates, VAT and after eliminating sales within the Group.
The following criteria must also be met before revenue is recognised:
a. Sale of goods
Revenue from the sale of goods represents net invoiced sales of fuel products and RTFO certificates, excluding value added tax and including excise duty. Revenue is recognised at the point that title passes to the customer.
b. Managed services and storage services
Managed services and storage services income is recognised evenly over the contract period. Revenue related to one-off services is recognised on the date of the service provision.
c. Haulage services
The Group provides haulage services to third-party customers on a delivered-in basis. The revenue related to haulage services is recognised at the point the goods are received by the customer.
Dividend distributionDividend distribution to the Company’s shareholders is recognised as a liability in the Group and the Company’s financial statements in the year in which the dividends are approved by the Company’s shareholders.
Investment incomeInvestment income is recognised when the right to receive payment is established.
Recent accounting developments
a. Amendments to IFRSs that are mandatorily effective for the current year
In the current year, the Group has applied a number of amendments to IFRSs issued by the International Accounting Standards Board (IASB) that are mandatorily effective for an accounting period that begins on or after 1 January 2017. Their adoption has not had any material impact on the disclosures or on the amounts reported in these financial statements.
Amendments to IAS 7 Disclosure InitiativeThe Group has adopted the amendments to IAS 7 for the first time in the current year. The amendments require an entity to provide disclosures that enable users of financial statements to evaluate changes in liabilities arising from financing activities, including both cash and non-cash changes. The Group’s liabilities arising from financing activities consist of borrowings (note 20) and certain derivatives (note 24). The application of these amendments has had no impact on the Group’s consolidated financial statements.
Amendments to IAS 12 Recognition of Deferred Tax Assets for Unrealised LossesThe Group has adopted the amendments to IAS 12 for the first time in the current year. The amendments clarify how an entity should evaluate whether there will be sufficient future taxable profits against which it can utilise a deductible temporary difference. The application of these amendments has had no impact on the Group’s consolidated financial statements as the Group already assesses the sufficiency of future taxable profits in a way that is consistent with these amendments.
Annual Improvements to IFRSs 2014-2016 Cycle The Group has adopted the amendments to IFRS 12 included in the Annual Improvements to IFRSs 2014-2016 Cycle for the first time in the current year. The other amendments included in this package are not yet mandatorily effective and they have not been adopted early by the Group. IFRS 12 states that an entity need not provide summarised financial information for interests in subsidiaries, associates or joint ventures that are classified (or included in a disposal group that is classified) as held for sale. The amendments clarify that this is the only concession from the disclosure requirements of IFRS 12 for such interests.
b. New and revised IFRSs in issue but not yet effective
At the date of authorisation of these financial statements, The Group has not applied the following new and revised IFRSs that have been issued but are not yet effective and in some cases had not yet been adopted by the EU:
IFRS 9 – Financial instrumentsThe Group will apply IFRS 9 from 1 January 2018. The Group has elected not to restate comparatives on initial application of IFRS 9.
Classification and measurement With respect to the classification and measurement of financial assets, the number of categories of financial assets under IFRS 9 has been reduced compared to IAS 39. Under IFRS 9 the classification of financial assets is based both on the business model within which the asset is held and the contractual cash flow characteristics of the asset. There are three principal classification categories for financial assets that are debt instruments: (i) amortised cost, (ii) fair value through other comprehensive income (FVTOCI) and (iii) fair value through profit or loss (FVTPL). Equity investments in scope of IFRS 9 are measured at fair value with gains and losses recognised in profit or loss unless an irrevocable election is made to recognise gains or losses in other comprehensive income. Under IFRS 9, derivatives embedded in financial assets are not bifurcated but instead the whole hybrid contract is assessed for classification.
Under IFRS 9, financial assets can be designated as at FVTPL to mitigate an accounting mismatch. In respect to classification and measurement of financial liabilities changes in the fair value of a financial liability designated as at FVTPL due to credit risk are presented in other comprehensive income unless such presentation would create or enlarge an accounting mismatch in profit or loss.
No material changes are expected as a result of the implementation of IFRS 9.
IFRS 15 – Revenue from contracts with customers IFRS 15 establishes a single comprehensive model for entities to use in accounting for revenue arising from contracts with customers. IFRS 15 will supersede the current revenue recognition guidance including IAS 18 Revenue, IAS 11 Construction Contracts and the related interpretations when it becomes effective for accounting periods beginning on or after 1 January 2018. The Group is required to adopt IFRS 15 for the period ending 31 December 2018 and will adopt the modified retrospective approach without restatement of comparatives.
Notes to the financial statements (continued)
FINANCIALS
113112 ANNUAL REPORT APRIL – DECEMBER 2017
1. Summary of business and significant accounting policies (continued)
The core principle of IFRS 15 is that an entity should recognise revenue to depict the transfer of promised goods or services to customers in an amount that reflects the consideration to which the entity expects to be entitled in exchange for those goods or services. Specifically, the Standard introduces a five-step approach to revenue recognition:
Step 1: Identify the contract(s) with a customer
Step 2: Identify the performance obligations in the contract
Step 3: Determine the transaction price
Step 4: Allocate the transaction price to the performance obligations in the contract
Step 5: Recognise revenue when (or as) the entity satisfies a performance obligation.
Under IFRS 15, an entity recognises revenue when (or as) a performance obligation is satisfied, i.e. when ‘control’ of the goods or services underlying the particular performance obligation is transferred to the customer.
The primary revenue source is the supply of diesel and gasoline to external customers. No material changes are expected as a result of the implementation of IFRS 15.
IFRS 16 - LeasesIFRS 16, which has not yet been endorsed by the EU, introduces a comprehensive model for the identification of lease arrangements and accounting treatments for both lessors and lessees. IFRS 16 will supersede the current lease guidance including IAS 17 Leases and the related interpretations when it becomes effective for accounting periods beginning on or after 1 January 2019. The Group currently expects to adopt IFRS 16 for the year ending 31 December 2019. No decision has been made about whether to use any of the transitional options in IFRS 16.
IFRS 16 distinguishes leases and service contracts on the basis of whether an identified asset is controlled by a customer. Distinctions of operating leases (off balance sheet) and finance leases (on balance sheet) are removed for lessee accounting, and is replaced by a model where a right-of-use asset and a corresponding liability have to be recognised for all leases by lessees (i.e. all on balance sheet) except for short-term leases and leases of low value assets.
The right-of-use asset is initially measured at cost and subsequently measured at cost (subject to certain exceptions) less accumulated depreciation and impairment losses, adjusted for any remeasurement of the lease liability. The lease liability is initially measured at the present value of the lease payments that are not paid at that date. Subsequently, the lease liability is adjusted for interest and lease payments, as well as the impact of lease modifications, amongst others.
Furthermore, the classification of cash flows will also be affected because operating lease payments under IAS 17 are presented as operating cash flows; whereas under the IFRS 16 model, the lease payments will be split into a principal and an interest portion which will be presented as financing and operating cash flows respectively.
In contrast to lessee accounting, IFRS 16 substantially carries forward the lessor accounting requirements in IAS 17, and continues to require a lessor to classify a lease either as an operating lease or a finance lease. Furthermore, extensive disclosures are required by IFRS 16.
The Group has not yet completed its preliminary analysis of the impact of applying IFRS 16 but expect there to be a material impact.
Other
IFRS 2 (amendments) - Classification and Measurement of Share-based Payment Transactions
IFRS 10 and IAS 28 (amendments) - Sale or Contribution of Assets between an Investor and its Associate or Joint Venture
Annual Improvements to IFRSs 2014-2016 Cycle - Amendments to IFRS 1 First-time Adoption of International Financial Reporting Standards and IFRS 28 Investments in Associates and Joint Ventures
IFRIC 22 - Foreign Currency Transactions and Advanced Consideration
IFRIC 23 - Uncertainty over Income Tax Treatments
The Directors do not expect that the adoption of the Standards listed above will have a material impact on the financial statements of the Group in future periods, except as noted.
2. Critical accounting estimates and judgements
Estimates and judgements applied within the business are continually evaluated and are based on historical experience, current issues and events, and expectations of future events.
Judgements
Valuation of inventoryThe Group’s inventories which include fuel products and RTFO certificates are subject to fluctuations in value as a result of changes in their market price. As set out in Note 1 above, both fuel products and RTFO certificates held for sale to third parties are recognised at market value in the financial statements. Where there is no quoted marker for certain fuel products or vintages of RTFO certificates, a year-end market value is assigned based on relevant comparative market data and recent realised prices. Inventories used in production are valued at cost.
Business combinationsThe consideration transferred for the acquisition of a subsidiary is the fair value of the assets transferred, the liabilities incurred and the equity interest issued by the Group. The consideration transferred includes the fair value of any asset or liability resulting from a contingent consideration arrangement. Acquisition-related costs are expensed as incurred in the income statement. Identifiable assets acquired and identifiable liabilities and contingent liabilities assumed in a business combination are measured initially at their fair values at the acquisition date. The determination of fair values often requires significant judgements and the use of estimates, and, for material acquisitions, the fair value of the acquired intangible assets is determined taking into consideration the findings of an independent valuer. The excess of the consideration transferred over the fair value of the identifiable net assets acquired is recorded as goodwill.
Further detail of business combinations during the year is provided in Note 34.
3. Nature and extent of risks arising from financial instruments
The Directors have identified the following types of risk which may arise from the use of financial instruments.
Credit riskThe Group is exposed to credit risk from its operating activities (primarily trade receivables and derivative instruments) and from its financing activities, including deposits with banks and financial institutions, foreign exchange transactions and other financial instruments.
In respect of trade receivables, the Group operates a strict policy of applying credit limits to all new customers prior to entering into a transaction. These limits are then subject to regular review throughout the term of the contractual relationship. The Group uses third-party credit referencing agencies as an input into this process and monitors all trade debtor balances on a daily basis. Exposure to debt default is managed by the use of credit insurance where the costof acquiring cover is considered commensurate with the risk incurred.
The counterparties involved in the Group’s other financial instruments such as swaps, futures and fixed price sales and purchase contracts within the scope of IAS 39 are subjected to the same credit review process. In addition, contractual terms for all such instruments are reviewed in detail to ensure that credit risk is minimised.
Credit risk from balances with banks and financial institutions is managed by the treasury team. Investments of surplus funds are only made with approved counterparties who are highly rated investment grade.
The maximum exposure to credit risk at the reporting date is the carrying value of each class of financial assets (refer to Note 24). The value of trade and other receivables pledged as security against borrowings is disclosed in Note 17.
Liquidity riskThe Group’s treasury department constantly monitors the Group’s cash position by maintaining up-to-date cash flow projections so that appropriate action may be taken to ensure financial liabilities are met as they become due. The Directors therefore consider that the exposure to liquidity risk is low.
In managing its working capital requirements, the Group currently relies on a combination of uncommitted revolving facilities, which could be withdrawn at any time, and a committed credit line. The facility is a $950 million (£703 million) asset backed facility which was amended and extended at the end of the 2016/17 financial year to support the Group’s trade financing and working capital requirements. This includes a $150 million extension after the Balance Sheet date. The working capital facility has been secured with a syndicate of high-quality UK and European banks which are highly rated investment grade. The facility is a three year facility with extension options and comprises $425 million of committed and $525 million of uncommitted funding.
Given the long-standing nature of these banking relationships, the bankers’ willingness to renew and extend credit linesin the recent past, and verbal assurances received from the bankers, the Directors are satisfied that both the uncommitted and committed facilities will continue to be available to the Group for the foreseeable future.
Notes to the financial statements (continued)
FINANCIALS
115114 ANNUAL REPORT APRIL – DECEMBER 2017

The table below shows the banking facilities of the Group, divided between the total available and the amounts utilised at the period-end.
31 December 2017 14 April 2017
Credit facility £’000
Utilised £’000
Credit facility £’000
Utilised £’000
Counterparty
On 13th April 2017 the facility was renewed with the following limits:
Syndicated facility — committed ($0.4bn) 295,694 177,567 319,540 189,024
Syndicated facility — uncommitted ($0.4bn) 295,694 188,500 319,540 -
On 26th August 2016 a trade finance facility was taken out with the following limits:
Trade facility – uncommitted ($0.1bn) 73,923 7,466 79,885 56,718
Other overdrafts and unsecured borrowings totalled £55.9m at 31 December 2017.
The table below shows the financial liabilities of the Group outstanding at the period-end, on the basis of contractual undiscounted cash flows for liabilities:
Less than 1 year£’000
Between 1 and 2 years
£’000
Between 2and 5 years
£’000
At 31 December 2017
Borrowings including future interest payments 429,481 - -
Trading and net settled derivative financial instruments 30,364 - -
Trade and other payables 463,335 1,748 25,623
923,180 1,748 25,623
At 14 April 2017
Borrowings including future interest payments 253,579 3,207 6,153
Trading and net settled derivative financial instruments 32,535 84 -
Trade and other payables 309,304 1,019 2,151
595,418 4,310 8,304
Notes to the financial statements (continued)
Market riskThis area can be further subdivided into fuel product price risk, foreign exchange risk and interest rate risk which are addressed separately below.
a. Fuel product price risk
Fuel product prices are subject to international supply and demand, which are themselves particularly dependent on political climates throughout the world. The resulting risk of product price fluctuations impacting the Group’s future cash flows is therefore high.
The Group has developed comprehensive internal control processes and hedging mechanisms to minimise this inherent risk. The objective of these mechanisms is to match the Group’s priced physical positions (generated from spot and term contracts entered into with suppliers and customers) with equal and opposite derivative positions.
In order to achieve this, the Group’s risk management department analyses the priced position for each product type throughout each day. Traders use this information to identify the most appropriate derivative for hedging purposes.
b. Foreign currency exchange risk
The Group purchases fuel products mainly in US Dollars and Euros. Because the international oil markets generally price in US Dollars, and the majority of the Group’s UK customers wish to purchase fuel products in Pounds Sterling, there can be a significant foreign currency exchange risk inherent in this aspect of the Group’s business. In order to minimise the financial effect of this risk, the Group looks to ensure that at all times, the financial assets denominated in a particular currency match the financial liabilities denominated in the same currency.
The following table illustrates only the Group’s sensitivity to the fluctuation of the major currencies on its income statement and financial assets and liabilities:
Where the Group’s stock is denominated in US Dollars and a sale is priced in Pounds Sterling, a net US Dollar financial liability is generated, resulting in a potential foreign exchange exposure. Where purchases and sales are priced in different currencies, the Group’s treasury department buys or sells currency to balance the assets and liabilities by currency, thus eliminating this transactional foreign exchange risk.
As a further control, balance sheets for each of the Group’s major currencies are prepared on a monthly basis and any surplus assets or liabilities are hedged as appropriate.
There are also highly probable forecast sales denominated in foreign currencies. The risk of changes in the relevant spot exchange rate associated with these highly probable forecast foreign currency transactions is hedged as appropriate using forward contracts.
c. Interest rate risk
Interest on the Group’s deposits/overdrafts is credited/ charged on a daily basis based on LIBOR plus a commercial margin.
The Directors consider that there is no material interest rate risk on the Group's financial assets at the balance sheet date.
The main types of hedge transaction which the Group enters into are as follows:
i. Exchange-traded commodity derivatives
Typically in the form of futures and options traded on a recognised exchange such as the International Petroleum Exchange or the New York Mercantile Exchange. The fair value of these derivatives changes with movements in the underlying commodity price. The Group is generally obliged to make margin calls to the exchange where the fair value of the instrument is in favour of the exchange. The Group generally closes out any futures contracts prior to crystallisation.
At 31 December 2017, if the closing price for each of the Group’s exchange-traded commodity derivatives had been 1 US Dollar per metric tonne lower with all other variables held constant, consolidated pre-tax profit for the year would have been £268,000 lower (14 April 2017: £341,000 lower).
ii. Over-the-counter (‘OTC’) contracts
Typically in the form of commodity swaps, OTC contracts are negotiated between two parties and are not traded on an exchange. Swaps are entered into in respect of specified indices and time periods. The amount payable under such instruments varies directly with the quote of those indices over the specified period. The Group is generally obliged to make margin calls to the counterparty where the fair value of the instrument is in favour of the counterparty.
At 31 December 2017, if the closing price for each of the open OTC contracts had been 1 US Dollar per metric tonne lower with all other variables held constant, consolidated pre-tax profit for the year would have been £34,000 lower (14 April 2017: £33,000 higher).
iii. Sales and purchase contract embedded hedges
Typically in the form of fixed price spot and term physical contracts. The fair values of the hedges embedded in fixed price sales and purchase contracts for the delivery of specified quantities of a commodity at a determined future date are calculated by reference to the difference between the market index price of the relevant commodity at the balance sheet date and at the contract pricing date(s).
At 31 December 2017, if the market price indices of the relevant commodities for the total priced physical position had been 1 US Dollar per metric tonne lower with all other variables held constant, consolidated pre-tax profit for the year would have been £302,000 higher (14 April 2017: £316,000 higher).
31 December 2017
£’000
Equity £’000
Sterling/US dollar +/- 10% change 39,150 43--
Income statement
3. Nature and extent of risks arising from financial instruments (continued)
FINANCIALS
117116 ANNUAL REPORT APRIL – DECEMBER 2017
37 week period ended 31 December 2017
£’000
Year ended 14 April 2017
£’000
United Kingdom 10,292,517 14,217,647
Rest of Europe 73,894 -
Rest of the world 791,986 650,477
11,158,397 14,868,124
Notes to the financial statements (continued)
4. Capital management
Management regard the capital of the business to be equity and net debt (constituting borrowings less cash and cash equivalents).
The Group’s objective for managing capital is to maintain a solid capital base in order to preserve the confidence of the Group’s investors and creditors and to sustain future development of its businesses.
Group members are subject to various banking covenants on their financing facilities. These generally take the form of a requirement to meet a variety of financial ratio targets. Such targets are monitored as part of the regular reporting processes for the entities concerned.
The primary segments for management and reporting are geographies as outlined below. For more detail on the services and products included in each business segment refer to the strategic report.
Revenue by geographical area is as follows:
Intangible assets, property, plant and equipment, joint ventures, associates and AFS financial assets by geographical area are as follows:
5. Segmental information
Revenue37 week period ended
31 December 2017 £’000
Year ended 14 April 2017
£’000
Sales of fuel products 11,158,397 14,868,124
11,158,397 14,868,124
37 week period ended 31 December 2017
£’000
Year ended 14 April 2017
£’000
United Kingdom 246,446 256,960
Rest of Europe 30,671 -
Rest of the world 20,982 4,449
298,099 261,409
One of the covenants places a restriction on the level of dividend which Greenergy Fuels Holdings Limited’s subsidiary Greenergy Fuels Limited may distribute.
A variety of financial modelling techniques are employed in the appraisal of potential capital expenditure projects and Board approval is required before such projects are entered into.
A Group Capital Committee was formed during the prior year, and meetings are held regularly to discuss both ongoing and prospective capital projects.
Value for shareholders is measured by internal business KPIs.
6. Results from operating activities
Note
37 week period ended 31 December 2017
£’000
Year ended 14 April 2017
£’000
6a. Group profit on ordinary activities before taxation is stated after charging/(crediting):
Operating lease rentals:
Land and buildings 1,637 830
Other 37,768 46,479
Depreciation, amortisation 12, 13 11,348 15,578
Exceptional items: Impairment charges 25 8,348 -
Loss/(Profit) on disposal of property, plant and equipment 186 267
Employee benefit expense 7 35,418 44,417
Defined contribution pension cost 7 1,381 1,589
Foreign exchange (gain)/loss (2,252) 6,078
6b. Auditors’ remuneration:
Fees payable to the Company’s auditor for the audit of the consolidated financial statements
60 150
Fees payable to the Company’s auditor and its associates for other services:
Audit of financial statements of subsidiaries pursuant to legislation 265 278
All other audit-related assurance services - 43
265 321
Taxation compliance services 7 150
All other taxation advisory services - 50
All other non-audit services - 155
7 355
Total 332 826
FINANCIALS
119118 ANNUAL REPORT APRIL – DECEMBER 2017
37 week period ended 31 December 2017
Year ended 14 April 2017
The average monthly number of persons employed by the Group (including Directors) during the year, analysed by category, was as follows:
Drivers – Flexigrid 360 313
Infrastructure staff 102 108
Office staff 331 256
793 677
Note
37 week period ended 31 December 2017
£’000
Year ended 14 April 2017
£’000
The aggregate payroll costs of these persons were as follows:
Wages and salaries 31,371 39,600
Social security costs 4,038 4,709
Other pension costs 1,381 1,589
Equity-settled share-based payments 27 9 107
36,799 46,005
The Company had no direct employees during the period/year.
7. Employee numbers and benefit expense
8. Finance income
37 week period ended 31 December 2017
£’000
Year ended 14 April 2017
£’000
Interest receivable on bank balances 20 98
20 98
9. Finance costs
37 week period ended 31 December 2017
£’000
Year ended 14 April 2017
£’000
Interest payable in servicing of:
Term loans 228 257
Fair value loss on financial instruments: cash flow hedges - 10
Working capital facilities (bank overdrafts) 7,631 9,519
7,859 9,786
Notes to the financial statements (continued)
10. Income tax expense
Note
37 week period ended 31 December 2017
£’000
Year ended 14 April 2017
£’000
Analysis of charge in period/year:
UK corporation tax
Current tax on income for the period/year 5,465 14,482
Adjustments in respect of previous years (387) 804
5,078 15,286
Overseas tax
Current tax on income for the period/year 7,387 4,684
Adjustments in respect of previous years (553) -
6,834 4,684
Total current tax charge 11,912 19,970
Deferred tax 22
Origination and reversal of timing differences (47) (340)
Effects of change in tax rates 126 (470)
Adjustments in respect of previous years (17) (388)
Total deferred tax charge/(credit) 62 (1,198)
Tax on profit on ordinary activities 11,974 18,772
The total tax charge for the period/year is higher (2017: higher) than the standard rate of corporation tax in the UK of 19.00% (April 2017: 19.96%). The differences are explained below:
37 week period ended 31 December 2017
£’000
Year ended 14 April 2017
£’000
Profit before tax 39,621 77,572
At tax rate of 19.00% (14 April 2017: 19.96%) 7,528 15,485
Effects of:
Expenses not deductible for tax 408 241
Income not taxable (318) (167)
Effect of overseas tax rates 3,697 2,858
Tax on joint arrangement 1,616 1,074
Movement on unrecognised deferred tax - (768)
Share options - (367)
Adjustments in respect of previous years (957) 416
Total tax charge 11,974 18,772
Factors that may affect future tax charges:
» Changes to the UK corporation tax rates were enacted in September 2016 to reduce the main rate to 17% from 1 April 2020.Changes to reduce the UK corporation tax rate to 19% from 1 April 2017 and to 18% from 1 April 2020 had already been substantively enacted in October 2015.
» There are no current or deferred tax items relating to other comprehensive income in these financial statements.
FINANCIALS
121120 ANNUAL REPORT APRIL – DECEMBER 2017

Group
Assets under construction
£’000
Land and buildings
£’000
Plant and machinery
£’000
Office equipment
£’000
Motor vehicles
£’000Total
£’000
Cost
At 15 April 2016 44,007 1,862 201,118 9,020 3,319 259,326
Additions 3,591 26 2,750 393 713 7,473
Disposals (231) - (34) - (354) (619)
Foreign exchange 5 - 214 22 - 241
Reclassifications (43,636) - (47,804) (27) 27 (91,440)
At 14 April 2017 3,736 1,888 156,244 9,408 3,705 174,981
Additions 3,508 - 2,175 437 522 6,642
Disposals (227) - (1,855) - (83) (2,165)
Foreign exchange adjustments (34) 54 (146) (4) - (130)
Acquisition of subsidiary 34 - 5,532 7,401 47 7 12,987
Reclassifications (3,931) - 3,320 391 - (220)
At 31 December 2017 3,052 7,474 167,139 10,279 4,151 192,095
Accumulated depreciation and impairment
At 15 April 2016 - (118) (49,988) (6,059) (1,000) (57,165)
Charge for the year - (27) (9,041) (1,350) (388) (10,806)
Impairment - - 802 - - 802
Disposals - - - - 195 195
Foreign exchange - - (11) (13) - (24)
At 14 April 2017 - (145) (58,238) (7,422) (1,193) (66,998)
Charge for the period - (42) (6,186) (864) (298) (7,390)
Impairment (19) (227) (839) - - (1,085)
Disposals - - 850 - 65 915
Foreign exchange - - (17) 15 11 9
At 31 December 2017 (19) (414) (64,430) (8,271) (1,415) (74,549)
Net book value at 31 December 2017 3,033 7,060 102,709 2,008 2,736 117,546
Net book value at 14 April 2017 3,736 1,743 98,006 1,986 2,512 107,983
Net book value at 15 April 2016 44,007 1,744 151,130 2,961 2,319 202,161
Interim dividends paid in the year were £39,748,000 or £224.04 per share (14 April 2017: £Nil or £Nil per share). The Directors do not propose a final dividend (14 April 2017: £Nil).
11. Dividends
12. Property, plant and equipment
GroupPurchased
goodwill £’000
Branding rights £’000
Software £’000
Customer relationships
£’000Brand £’000
Total £’000
Cost
At 15 April 2016 16,477 8,975 20,576 - - 46,028
Additions - 3,295 622 - - 3,917
Disposals - - (172) - - (172)
Foreign exchange 4 - - 4
Reclassifications - 2 - - - 2
At 14 April 2017 16,477 12,272 21,030 - - 49,779
Additions - 1,350 314 - - 1,664
Acquisition of subsidiaries 7,548 - 61 20,178 260 28,047
Disposals - - - - - -
Foreign exchange (433) 7 - - - (426)
Reclassifications - 351 (131) - - 220
At 31 December 2017 23,592 13,980 21,274 20,178 260 79,284
Accumulated amortisation and impairment
At 15 April 2016 - (5,107) (4,167) - - (9,274)
Charge for the year - (2,758) (2,014) - - (4,772)
At 14 April 2017 - (7,865) (6,181) - - (14,046)
Charge for the period - (2,066) (1,495) (393) (4) (3,958)
Disposals - (63) (54) - (117)
At 31 December 2017 - (9,994) (7,730) (393) (4) (18,121)
Net book value at 31 December 2017 23,592 3,986 13,544 19,785 256 61,163
Net book value at 14 April 2017 16,477 4,407 14,849 - - 35,733
Net book value at 14 April 2016 16,477 3,868 16,409 - - 36,754
Amortisation of £3,958,600 (14 April 2017: £4,772,000) has been charged to administration expenses.
Branding rights relate to the costs associated with the Group becoming a branded wholesaler within the UK market.
Goodwill has arisen on the UK Fuels business, on acquisition of Greenergy Biofuels Teesside Limited during 2015 financial year, and the acquisition of Inver and Canop in the current year.
The brand relates to the Inver brand on acquisition.
As detailed in the accounting policies goodwill is assessed for impairment annually.
Impairment reviews are performed for all other tangible and intangible assets where there has been an indicator of impairment during the year. These impairment reviews are based on value-in-use calculations for the relevant Cash Generating Units (CGU). These calculations use post-tax cash flow projections based on financial budgets approved by management covering a five-year period. Cash flows beyond the five-year period are extrapolated using estimated growth rates.
13. Intangible assets
Notes to the financial statements (continued)
Depreciation expenses of £2,728,000 (14 April 2017: £3,747,000) has been charged to cost of sales, £3,476,000 (14 April 2017: £5,744,000) in distribution costs and £1,186,000 (14 April 2017: £1,315,000) in administration expenses.
During the period, it was deemed that the North Cave plant had no forward business plan demonstrating a future use for the facility. The amount shown within impairment is the carrying value of the property, plant and equipment at the end of the previous financial year. During the prior year £11,345,000 of fixed assets were reclassified to investments in Morzine Limited due to the change in nature from a joint operation to a joint venture. Refer to Note 14 for further details.
Note
FINANCIALS
123122 ANNUAL REPORT APRIL – DECEMBER 2017

Name of undertaking Country of registration Principal activity Direct/indirect
Greenergy Biofuels Teesside Limited
England and Wales Construction and operation of biofuel production plants and distribution of resultant products
Indirect
Greenergy Brasil Trading SA Brazil Support entity working to procure sustainable bioethanol
Indirect
Greenergy Deutschland GmbH Germany Dormant company Indirect
Greenergy Flexigrid Limited (75%)
England and Wales Provision of haulage and logistics services
Direct
Greenergy Fuels Australia Pty Ltd
Australia Holding company Indirect
Greenergy Fuels Canada Inc (80%)
Canada Blending, supply and marketing of branded low emission fuels
Indirect
Greenergy Fuels Holdings North America Inc
Canada Holding company Indirect
Greenergy Fuels Limited England and Wales Blending, supply and marketing of branded low emission fuels
Indirect
Greenergy Fuels North America Inc (80%)
Canada Holding company Indirect
Greenergy Fuels Private Limited India Provision of IT services Indirect
Greenergy Infrastructure Holdings Inc.
Canada Holding company Indirect
Greenergy International Limited England and Wales Holding company Direct
Greenergy Morzine Holding Limited
England and Wales Holding company Indirect
Greenergy Oil UK Limited England and Wales Holding company Indirect
Greenergy Services Limited England and Wales Dormant company Indirect
Greenergy Terminals Limited England and Wales Construction and operation of fuel terminals
Indirect
Greenergy USA Inc United States of America
Procurement and brokerage on behalf of UK and Canada feedstock
Indirect
Inver Energy Limited Ireland Blending, supply and marketing of transportation fuels.
Indirect
Inver Energy (UK) Limited England and Wales Blending, supply and marketing of transportation fuels.
Indirect
Northland Biodiesel Marketing Inc
Canada Inactive Indirect
Wascan Terminals Inc Canada Operation of fuel storage terminal Indirect
The registered addresses of all related undertakings are included on page 148.
Company
£’000
14a. Investment in Group undertakings
At 15 April 2017 243
Additions 24,000
At 31 December 2017 24,243
Interests in subsidiary undertakings are as follows. All interests are 100% unless otherwise stated. All shareholdings are ordinary share capital unless otherwise stated.
All of the companies on the following page operate principally in their country of incorporation or registration. The Directors believe that the carrying value of the investments is supported by their underlying net assets.
Name of undertaking Country of registration Principal activity Direct/indirect
1796640 Ontario Limited Canada Supply and marketing of transportation fuels
Indirect
Central Canada Fuels and Lubricants Inc
Canada Inactive Indirect
Greenergy Asia DMCC United Arab Emirates Sourcing of raw materials in the Far East
Indirect
Greenergy Bioethanol SA Switzerland Procurement of sustainable bioethanol Indirect
Greenergy Biofuels Limited England and Wales Construction and operation of biofuel production plants and distribution of resultant products
Indirect
Notes to the financial statements (continued)
13. Intangible assets (continued)
Key assumptions for impairment reviews conducted in the period/year were as follows:
» Post-tax discount rate of 9.1% (14 April 2017: 7.5%)
» Nominal growth rate of cash flows after 5 years kept steady to reflect the overall state of the market (14 April 2017: 5 years).
As part of the review process a sensitivity analysis is applied, flexing key assumptions such as growth rates and discount rates. The impairment reviews conducted, including the sensitivity analysis, indicated that there were no impairments of goodwill in the year. Goodwill acquired in a business combination is allocated, at acquisition, to the cash generating units that are expected to benefit from that business combination.
The Directors consider there to be one cash generating unit being Greenergy fuel supply.
14. Investments
FINANCIALS
125124 ANNUAL REPORT APRIL – DECEMBER 2017

The investments in associates relates to a 23% investment in Scarab Distributed Energy Limited, a private company set up to investigate alternative methods of biofuel production from food waste. The company is currently in a start-up phase and as such there are no material profits or losses to recognise. Investments also relate to a 49% investment in Anglo China Chemical Company Limited, which is deemed an associate of Greenergy International Limited.
Name Country of registration Principal activity Percentage shareholdings
Anglo China Chemical Company Limited
Hong Kong Procurement of used cooking oil 49
Scarab Distributed Energy Limited
England and Wales Investigating alternative methods of biofuel production from food waste
23
14c. Investments in joint arrangements
At 31 December 2017, the Group had the following interests in joint arrangements carrying on businesses, which affect consolidated profits and losses. Unless otherwise stated the Group’s principal joint arrangements all have share capital consisting solely of ordinary shares, which are indirectly held, and the country of incorporation or registration is also their principal place of operation.
Name Country of registration Principal activity Percentage shareholdings 1
Greenergy North Cave Limited England and Wales Construction and operation of waste processing plant and distribution of resultant products
50.0
Greenlife Oil Holding Pty Ltd 2 Australia Procurement of used cooking oil 50.0
Atlantic Fuel Supply Company Limited
Ireland Operation of fuel storage terminal 50.0
Morzine Limited t/a Thames Oilport 3
England and Wales Retail-mix fuel terminal with blending facilities
66.7
1 Rounded to nearest tenth of one per cent. 2 Greenlife Oil Holding Pty Ltd was acquired on the 10 July 2017. 3 Morzine Limited t/a Thames Oilport’s most recent financial period related to the year ended 30 November 2017.
14. Investments (continued)
Notes to the financial statements (continued)
Group
£’000
14b. Investments in associates
Cost
At 15 April 2017 288
Share of profit 80
At 31 December 2017 368
Impairment
At 14 April 2017 and 31 December 2017 (124)
Net fair value at 31 December 2017 244
Net fair value at 14 April 2017 164
Group31 December 2017
£'000
14 April 2017
£’000
14d. Investment in joint ventures
At beginning of period 92,273 -
Additions 8,838 -
Change in nature of investment - 91,405
Foreign exchange (1)
Share of (loss)/profit (7,231) 868
At 14 April 2017 93,879 92,273
The share of loss in the period includes £7,263,000 of exceptional impairment costs (Note 25). During the prior year the nature of the Group’s investment in Morzine Limited changed from a joint operation to a joint venture.
The summarised financial information of the material joint venture as at the last financial year-end (unaudited) is detailed below:
Morzine Limited
30 November 2017£’000
Assets
Current assets 74,707
Non-current assets 94,588
Liabilities
Current liabilities (3,992)
Non-current liabilities (65,722)
Net assets 99,581
Revenue 5,179
Post tax loss from continuing operations and total comprehensive loss
(2,810)
Group
31 December 2017£'000
Ownership percentage applied to net assets 66,387
Accounting policy alignments 18,623
Share of post joint venture balance sheet results (163)
Total 84,847
An impairment assessment has been carried out over the recoverability of the Group’s share of the assets of its joint venture in Morzine Limited. Management consider that the value is recoverable through either the sale of surplus land or its development for commercial property usage and the economic benefit that will be generated in the Greenergy Group for operating at Thames Oilport.
Reconciliation of equity investment in joint venture to joint venture result
FINANCIALS
127126 ANNUAL REPORT APRIL – DECEMBER 2017

Notes to the financial statements (continued)
15. Available-for-sale financial assets
Group31 December 2017
£'00014 April 2017
£’000
Equity investments classified as available-for-sale:
Fair value on acquisition 18,751 18,395
Additions - 356
Impairment provision for permanent diminution in value (5,578) (5,578)
AFS reserve 12,094 12,083
Net fair value 25,267 25,256
The investments classified as available for sale relate to a 4.45% investment in RedT Energy Plc, a 19.72% investment in Navigator Topco and a 10% investment in Bahrain Gasoline Blending W.L.L.
RedT Energy is a company quoted on the London Stock Exchange’s Alternative Investment Market.
The fair value of the investment in RedT Energy is determined by reference to published price quotations in an active market. Navigator Topco is the holding company for Navigator Terminal assets. Bahrain Gasoline Blending W.L.L is a strategic partnership between Nogaholding, Bahrain Petroleum Company (BAPCO) and Greenergy International Limited.
16. Inventories
Group
31 December 2017£'000
14 April 2017 £’000
Fuel products 458,903 425,357
Compliance certificates – own use 97,826 109,220
Compliance certificates – held for trading 44,420 22,018
601,149 556,595
During the period year £9,378,538,000 of inventory was expensed through cost of sales (14 April 2017: £12,813,407,000).
Inventories with a carrying amount of £173,458,000 were pledged as security for certain of the Group’s borrowings (14 April 2017: £350,030,000).
Compliance certificates include fuel sustainability compliance obligations in the UK and Canada. The UK compliance is managed through the RTFO scheme. The Canadian scheme is managed through the cap and trade, and greener diesel programs.
There is currently no externally quoted market for the valuation of RTFO certificates. In order to value these contracts, management have adopted a pricing methodology, combining both observable inputs based on market data and assumptions developed internally based on observable market activity.
The anticipated market premia above the calculated cost of creation of RTFO certificates are the most significant input. Assuming other inputs remain unchanged, if the premia was decreased by 1ppl, pre-tax profit would decrease by £1,880,000 (14 April 2017: decrease by £1,147,000).
17. Trade and other receivables
Group31 December 2017
£'000
14 April 2017
£’000
Trade receivables 723,402 696,984
Less: Provision for impairment of receivables (2,461) (1,732)
720,941 695,252
Other receivables 81,073 86,721
Amounts owed by Group undertakings 446 -
Prepayments 21,426 14,576
Accrued income 92,694 105,471
Derivative financial instruments 33,958 25,065
950,538 927,085
Less non-current portion:
Other receivables (105) (105)
Loan receivable from joint ventures - (31,350)
Loan receivable from affiliates (25,308) (25,308)
Derivative financial instruments - (68)
Current portion 925,125 870,254
Trade and other receivables with a carrying amount of £685,902,000 were pledged as security for certain of the Group’s borrowings (14 April 2017: £763,183,000).
Trade and other receivables are predominantly non-interest bearing.
Intercompany balances have no formal repayment plan and as such are classified as current. In the instances where interest is charged on intercompany balances, it is charged at a rate of LIBOR plus 2%.
Loans to affiliates bear interest at a rate of 7% and are due for repayment in greater than five years.
As of 31 December 2017, trade debtors of the Group with a carrying value of £2,461,000 (14 April 2017: £1,732,000) were provided for. The amount of the provision was £2,461,000 (14 April 2017: £1,732,000).
The aging of these debtors is as follows:
Group31 December 2017
£'000
14 April 2017
£’000
120+ Days 2,461 1,732
2,461 1,732
During the year, receivables of the Group written off as uncollectible amounted to £Nil (14 April 2017: £Nil).
The maximum exposure to credit risk at the reporting date is the fair value of each class of receivable mentioned above. Neither the Group nor the Company hold any collateral as security.
Company31 December 2017
£'000
14 April 2017
£’000
Amounts owed by Group undertakings 5,118 1,732
5,118 1,732
FINANCIALS
129128 ANNUAL REPORT APRIL – DECEMBER 2017
Notes to the financial statements (continued)
Group31 December 2017
£'000
14 April 2017
£’000
Cash at bank and on hand 19,711 60,499
Cash and cash equivalents 19,711 60,499
Cash and cash equivalents include the following for the purposes of the statement of cash flows:
Group Note31 December 2017
£’000
14 April 2017
£’000
Cash and cash equivalents 19,711 60,499
Borrowings 20 (429,481) (250,184)
Cash and cash equivalents and bank overdrafts (409,770) (189,685)
18. Cash and cash equivalents
19. Investment income19. Investment income
Group31 December 2017
£'000
14 April 2017
£’000
Borrowings – non-current
Bank loans - 8,855
- 8,855
The loan was taken out by Greenergy Terminals Limited on 18 January 2016 and is repayable in quarterly instalments of £750,000. On 8 May 2017 this loan was repaid in full.
Group31 December 2017
£'000
14 April 2017
£’000
Maturity of debt
Within one year - 3,040
In more than one year, but not more than two years - 2,947
In more than two years, but not more than five years - 5,908
- 11,895
Group31 December 2017
£,000
14 April 2017
£’000
Dividend income from investments 1,369 -
Income from investments 1,584 3,127
2,953 3,127
Group37 week period ended
31 December 2017£'000
Year ended 14 April 2017
£’000
Dividend income from investments 1,369 -
Income from investments 1,584 3,126
2,953 3,126
20. Borrowings
Interest on the bank overdrafts is charged at a commercial margin above LIBOR (United Kingdom) and FED (Non-United Kingdom). The blended effective interest rate on the bank loans undertaken by Greenergy Terminals Limited is nil% after the effect of the interest rate swaps discussed in Note 3c (14 April 2017: 3.49%).
Group Maturity31 December 2017
£'000
14 April 2017
£’000
Borrowings – current
Bank overdrafts:
United Kingdom On demand 418,919 245,744
Non-United Kingdom On demand 10,562 4,440
429,481 250,184
Bank loans: United Kingdom See opposite - 3,040
429,481 253,224
Group
Provision for
plant dismantlement £’000
Provision for legal claims
£’000
Provision for onerous lease
£’000
Total
£’000
At 15 April 2017 500 1,200 2,999 4,699
Utilised - - (2,000) (2,000)
Release upon settlement - - (999) (999)
At 31 December 2017 500 1,200 - 1,700
The dismantlement provision represents management’s estimate of the costs involved in dismantling the Immingham biofuels plant at the end of its useful life and returning the site to the same state in which it was originally acquired. Management review the provision on an annual basis to ensure that the expected outflow of economic benefits is correctly provided for.
The lease relates to a long-term agreement entered into with a third party. Management have undertaken an assessment of this agreement and deemed it unlikely to yield a notable business return. The onerous lease was settled in the period.
The legal provision relates to a claim in relation to continuing operations incurred in a previous financial period. The timing for the resolution of the claim is uncertain.
21. Provisions for other liabilities and charges
FINANCIALS
131130 ANNUAL REPORT APRIL – DECEMBER 2017

Notes to the financial statements (continued)
22. Deferred income tax
The accounting policies for financial instruments in Note 1 have been applied to the line items below:
Group Loans and receivables
£’000
Financial assets at fair value through
profit and loss £’000
Available-for-sale financial assets
£’000Total
£’000
Assets at 31 December 2017
Available-for-sale investments (Level 1) - - 719 719
Available-for-sale investments (Level 3) - - 24,548 24,548
Derivative financial instruments (Level 1) - 11,013 - 11,013
Derivative financial instruments (Level 2) - 22,945 - 22,945
Receivables 895,154 - - 895,154
Cash and cash equivalents 19,711 - - 19,711
914,865 33,958 25,267 974,090
Assets at 14 April 2017
Available-for-sale investments (Level 1) - - 708 708
Available-for-sale investments (Level 3) - - 24,548 24,548
Derivative financial instruments (Level 2) - 961 - 961
Derivative financial instruments (Level 3) - 24,104 - 24,104
Receivables 887,444 - - 887,444
Cash and cash equivalents 60,499 - - 60,499
947,943 25,065 25,256 998,264
24. Financial instruments
Note31 December 2017
£'000
14 April 2017
£’000
The movement on deferred taxation is as follows:
At the beginning of the year (3,198) (8,949)
Income statement (charge)/credit (79) 810
Equity (charge)/credit (4,999) 4,552
Adjustments in respect of prior years 17 388
Movement arising from the acquisition of subsidiary 34 (4,274) -
At the end of the period/year (12,533) (3,199)
The Group has unused losses of £34,000 (14 April 2017: £34,000) for which no deferred tax asset has been recognised.
Group31 December 2017
£’000
14 April 2017
£’000
Trade payables 56,947 66,787
Fuel compliance obligations 97,904 109,220
Amounts owed to group undertakings 4,573 -
Other taxes and social security 578,333 828,614
Other payables 20,390 8,128
Accrued expenses 408,796 237,559
Deferred income 4,055 2,575
Derivative financial instruments 30,363 32,619
1,201,361 1,285,502
23. Trade and other payables
The carrying amounts of trade payables and other payables approximate to their fair values. Trade and other payables are predominantly non-interest bearing.
Other payables include the fair value of contingent consideration arising on the acquisition of subsidiary companies in the period, which totalled £10,042,000 in Other payables due in more than one year of the Balance Sheet date.
Intercompany balances have no formal repayment plan and as such are classified as current. In the instances where interest is charged on intercompany balances, it is charged at a rate of LIBOR plus 2%.
Company
31 December 2017 £’000
14 April 2017
£’000
Amounts owed to Group undertakings 4,573 -
Other payables 526 -
5,099 -
Group31 December 2017
£'000
14 April 2017
£’000
The elements of the deferred taxation is as follows:
Accelerated capital allowances (10,354) (8,480)
Intangible assets 1,045 (1,403)
Other short-term timing differences 989 910
Losses and other differences (1,135) 309
Share options - 5,465
Intangibles (3,078) -
Net deferred tax liability (12,533) (3,199)
Deferred tax asset 293 438
Deferred tax liability (12,826) (3,637)
Net deferred tax liability (12,533) (3,199)
Less non-current portion:
Other payables (12,558) (1,377)
Fuel compliance obligations (14,812) -
Derivative financial instruments - (84)
Current portion 1,173,991 1,284,041
FINANCIALS
133132 ANNUAL REPORT APRIL – DECEMBER 2017

Notes to the financial statements (continued)
24. Financial instruments (continued)
Group
Financial liabilities
at fair value through profit and loss
£’000
Financial liabilities measured at
amortised cost £’000
Total £’000
Liabilities at 31 December 2017
Payables - 480,664 480,664
Bank loans and overdrafts - 429,481 429,481
Derivative financial instruments (Level 1) 15,659 - 15,659
Derivative financial instruments (Level 2) 14,704 - 14,704
Contingent consideration payable on acquisition of subsidiary undertakings (Level 3)
10,042 - 10,042
40,405 910,145 950,550
Liabilities at 14 April 2017
Payables - 421,694 421,694
Bank loans and overdrafts - 262,079 262,079
Derivative financial instruments (Level 1) 14,542 - 14,542
Derivative financial instruments (Level 2) 18,078 - 18,078
32,620 683,773 716,393
Company
Financial liabilities
at fair value through profit and loss
£’000
Financial liabilities as measured at amortised cost
£’000Total
£’000
Liabilities at 31 December 2017
Payables - 5,099 5,099
- 5,099 5,099
Liabilities at 14 April 2017
Payables - - -
- - -
31 December 2017
£’000
14 April 2017
£’000
Opening balance 24,548 12,692
AFS financial assets acquired - 356
Profits recognised during the year relating to fair value movements - 11,500
Closing balance 24,548 24,548
The following table reconciles the movements in the Group’s net financial instruments classified in Level 3 of the fair values hierarchy:
Group
31 December 2017 £’000
14 April 2017
£’000
Pounds 825,766 864,849
US Dollars 64,102 97,296
Euros 40,719 7,752
Swiss Francs 240 269
Canadian Dollars 34,215 21,017
UAE Dirhams 40 87
Brazilian Real 9,008 6,994
974,090 998,264
The carrying amounts of financial assets are denominated in the following currencies:
The fair value of financial instruments traded in active markets is based on quoted market prices at the balance sheet date. A market is regarded as active if quoted prices are readily and regularly available from an exchange, dealer, broker, industry group, pricing service, or regulatory agency, and those prices represent actual and regularly occurring market transactions on an arm’s length basis. The quoted market price used for financial instruments held by the Group is the current mid-price. These instruments are included in Level 1. Instruments included in Level 1 comprise AIM equity investments classified as available for sale and exchange-traded commodity derivative financial instruments.
The fair value of financial instruments that are not traded in an active market (for example, over-the-counter derivatives) is determined by using valuation techniques. These valuation techniques maximise the use of observable market data where it is available and rely as little as possible on entity specific estimates. For derivative contracts where publicly available information is not available, fair value estimations are generally determined using models and other valuation methods, the key inputs for which include future prices, volatility, price correlations, counterparty credit risk and market liquidity, as appropriate; for other assets and liabilities, fair value estimations are generally based on the net present value of expected future cash flows. If all significant inputs required to fair value an instrument are observable, the instrument is included in Level 2.
Company Loans and receivables
£’000
Financial assets at fair value through
profit and loss £’000
Available-for-sale financial assets
£’000Total
£’000
Assets at 31 December 2017
Receivables 5,118 - - 5,118
5,118 - - 5,118
Assets at 14 April 2017
Receivables - - - -
- - - -
Contingent consideration is held at fair value, measured using scenario based modelling. The modelling adopted utilises a number of unobservable inputs, including scenarios of future forecast earnings and the probabilities applied to each earnings scenario. Therefore the valuation of contingent consideration has been deemed to be Level 3 within the hierarchy above.
Available for sale investments are held at fair value, measured using appropriate valuation techniques. During the prior year certain financial instruments were valued using observable market inputs that required significant adjustment based on unobservable inputs. We have deemed these instruments to be Level 3 within the hierarchy above.
The carrying value of the financial instruments where measured at amortised cost is deemed to be the same as fair value due to them being predominantly short-term in nature.
FINANCIALS
135134 ANNUAL REPORT APRIL – DECEMBER 2017

Notes to the financial statements (continued)
Company
31 December 2017 £’000
14 April 2017
£’000
Pounds 526 -
US Dollars 4,573 -
5,099 -
Group
31 December 2017 £’000
14 April 2017
£’000
Pounds 600,895 442,143
US Dollars 289,239 241,084
Euros 34,823 8,834
Swiss Francs 8 41
Canadian Dollars 10,911 671
UAE Dirhams 433 160
Brazilian Real 14,241 23,457
Hong Kong Dollar - 3
950,550 716,393
The carrying amounts of financial liabilities are denominated in the following currencies:
24. Financial instruments (continued)
Gross amounts of recognised
financial liabilities £’000
Amounts being offset in the
balance sheet £’000
Net amounts of financial liabilities
presented in the balance sheet
£’000
Balances subject to a contractual
right of offset £’000
Cash collateral pledged
£’000Net amounts
£’000
As at 31 December 2017
Derivative financial liabilities 77,397 (54,751) 22,646 (5,050) (4,257) 13,339
Total 77,397 (54,751) 22,646 (5,050) (4,257) 13,339
As at 14 April 2017
Derivative financial liabilities 18,086 (2,800) 15,286 (3,847) (10,935) 504
Total 18,086 (2,800) 15,286 (3,847) (10,935) 504
Offsetting financial assets and financial liabilitiesThe following table sets out the Group’s financial assets and financial liabilities that are subject to counterparty offsetting or a master netting agreement. The master netting agreements regulate settlement amounts in the event either party defaults on their obligations:
Gross amounts of recognised
financial assets £’000
Amounts being offset in the
balance sheet £’000
Net amounts of financial assets
presented in the balance sheet
£’000
Balances subject to a contractual
right of offset £’000
Cash collateral pledged
£’000Net amounts
£’000
As at 31 December 2017
Derivative financial assets 70,403 (53,154) 17,249 (5,050) - 12,199
Total 70,403 (53,154) 17,249 (5,050) - 12,199
As at 14 April 2017
Derivative financial assets 7,479 (2,800) 4,679 (3,847) - 832
Total 7,479 (2,800) 4,679 (3,847) - 832
Group
31 December 2017 Charge/(credit)
to hedging reserve
£’000
31 December 2017 Charge/(credit) to profit & loss
account £’000
31 December 2017 Fair value
asset/ (liability)
£’000
14 April 2017 Charge/(credit)
to hedging reserve
£’000
14 April 2017 Charge/(credit) to profit & loss
account £’000
14 April 2017 Fair value
asset/ (liability)
£’000
Derivative financial instruments - (5,977) (5,424) (272) 6,980 (11,401)
Sales and purchase commodity contracts
- 2,017 1,830 - 719 3,847
- (3,960) (3,594) (272) 7,699 (7,554)
Included in trade and other receivables
- 33,958 - - 25,065
Included in trade and other payables - (30,363) - - (32,619)
- - 3,594 - - (7,554)
Derivative financial instruments shown above generally relate to exchange traded commodity derivatives and over-the-counter contracts. Sales and purchase commodity contracts relate to open contracts that the Group has entered into.
Company
31 December 2017 £’000
14 April 2017
£’000
Pounds 525 -
US Dollars 4,593 -
5,118 -
FINANCIALS
137136 ANNUAL REPORT APRIL – DECEMBER 2017

Notes to the financial statements (continued)
25. Exceptional items: impairment charges
25b. Impairment of Morzine joint venture
During the period, Morzine identified two areas where the carrying value of the assets it holds was impaired. The useful economic life of a number of assets was reviewed resulting in a reduction in life and resulting impairment. In addition, there were a number of costs incurred in the development of the TEP land that were written off based on the revised fair value of the land.
37 week period ended
31 December 2017 £’000
Year ended 14 April 2017
£’000
Reduction in useful economic life of assets (4,263) -
Impairment of TEP land (3,000) -
(7,263) -
27. Share-based payments
During the year ending 14 April 2013, the Group introduced a hurdle scheme for its employees with effect from 8 May 2012, in addition to the share option plan which was already in existence. The details of both plans are outlined in the following tables.
Share option planThe Group’s equity-settled share-based payments are made under a share option plan dated 5 July 2000, as amended on 21 March 2006 (the ‘Plan’). From time to time, the Company awards share options to employees of the Company itself and employees of other Group companies.
Options awarded under the Plan have a life of 10 years and normally vest equally on the first, second, third and fourth anniversary of grant. Subject to certain conditions, vested options may be exercised on or after the earlier of flotation or takeover of the Company; and 50% of those options granted on or after 21 March 2006, may be exercised on the fifth anniversary of grant.
Details of outstanding share options awarded to Group employees including Directors are set out below.
Date of grant Date of expiry Strike
price £Opening balance
Vested at opening
Exercised in the year
Balance of options remaining
Vested at closing
15 Apr 2002 14 Apr 2018 £6.00 275 100% 275 - 100%
21 Mar 2006 20 Mar 2018 £6.00 231 100% 231 - 100%
21 Mar 2006 20 Mar 2018 £100.00 2,269 100% 2,269 - 100%
21 Mar 2006 20 Mar 2018 £100.00 147 100% 147 - 100%
21 Mar 2006 20 Mar 2018 £200.00 1,056 100% 1,056 - 100%
28 Feb 2008 27 Feb 2018 £750.00 2,000 100% 2,000 - 100%
28 Feb 2008 27 Feb 2018 £750.00 2,389 100% 2,389 - 100%
37 week period ended
31 December 2017 £’000
Year ended 14 April 2017
£’000
Operating items:
Impairment of North Cave plant (1,085) -
Impairment of Morzine joint venture (7,263) -
Exceptional income (8,348) -
25a. Impairment of North Cave plant
During the period, it was deemed that the North Cave plant had no forward business plan demonstrating a future use for the facility. The amount shown is the carrying value of the property, plant and equipment at the end of the previous financial year:
37 week period ended
31 December 2017 £’000
Year ended 14 April 2017
£’000
Impairment of plant (1,085) -
(1,085) -
26. Share capital
Group and Company31 December 2017
£’000
14 April 2017
£’000
Allotted, called up and fully paid
121,886 (14 April 2017: 102,549) ordinary shares of £1 each 122 103
55,525 (14 April 2017: 55,525) non-voting ordinary shares of £1 each 55 55
177 158
Other than the ability to vote at general meetings, the rights of ordinary and non-voting ordinary shareholders are identical.
31 December 2017 No.
31 December 2017 WAEP
14 April 2017No.
14 April 2017 WAEP
Opening balance outstanding 8,367 447.90 8,517 443.53
Exercised during the year (8,367) 447.90 - -
Repurchased during the year - - - -
Forfeited during the year - - (150) 4.37
Closing balance outstanding - - 8,367 447.90
Closing balance exercisable - - 8,367 447.90
The following tables illustrate the number and weighted average exercise price (WAEP) of, and movements in, share options during the year.
FINANCIALS
139138 ANNUAL REPORT APRIL – DECEMBER 2017
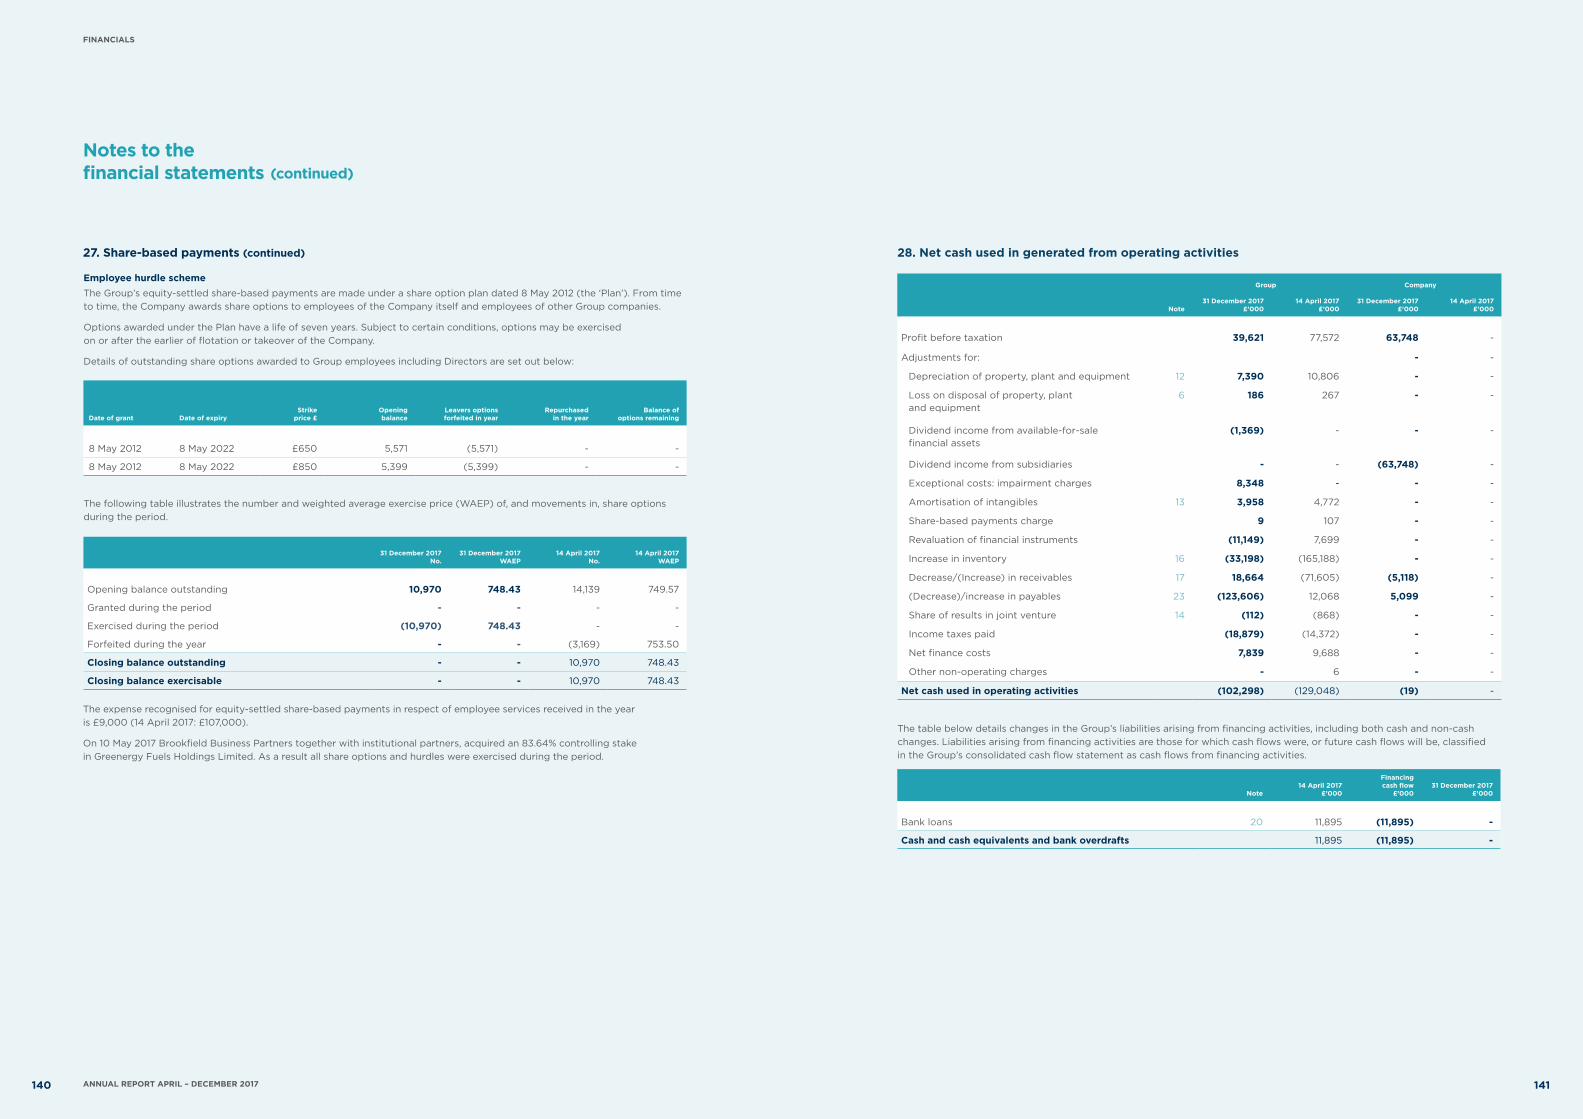
Notes to the financial statements (continued)
27. Share-based payments (continued)
Date of grant Date of expiryStrike
price £Opening balance
Leavers options forfeited in year
Repurchased in the year
Balance of options remaining
8 May 2012 8 May 2022 £650 5,571 (5,571) - -
8 May 2012 8 May 2022 £850 5,399 (5,399) - -
The following table illustrates the number and weighted average exercise price (WAEP) of, and movements in, share options during the period.
31 December 2017No.
31 December 2017 WAEP
14 April 2017No.
14 April 2017WAEP
Opening balance outstanding 10,970 748.43 14,139 749.57
Granted during the period - - - -
Exercised during the period (10,970) 748.43 - -
Forfeited during the year - - (3,169) 753.50
Closing balance outstanding - - 10,970 748.43
Closing balance exercisable - - 10,970 748.43
Employee hurdle scheme The Group’s equity-settled share-based payments are made under a share option plan dated 8 May 2012 (the ‘Plan’). From time to time, the Company awards share options to employees of the Company itself and employees of other Group companies.
Options awarded under the Plan have a life of seven years. Subject to certain conditions, options may be exercised on or after the earlier of flotation or takeover of the Company.
Details of outstanding share options awarded to Group employees including Directors are set out below:
28. Net cash used in generated from operating activities
Group Company
Note31 December 2017
£’00014 April 2017
£’00031 December 2017
£’00014 April 2017
£’000
Profit before taxation 39,621 77,572 63,748 -
Adjustments for: - -
Depreciation of property, plant and equipment 12 7,390 10,806 - -
Loss on disposal of property, plant and equipment
6 186 267 - -
Dividend income from available-for-sale financial assets
(1,369) - - -
Dividend income from subsidiaries - - (63,748) -
Exceptional costs: impairment charges 8,348 - - -
Amortisation of intangibles 13 3,958 4,772 - -
Share-based payments charge 9 107 - -
Revaluation of financial instruments (11,149) 7,699 - -
Increase in inventory 16 (33,198) (165,188) - -
Decrease/(Increase) in receivables 17 18,664 (71,605) (5,118) -
(Decrease)/increase in payables 23 (123,606) 12,068 5,099 -
Share of results in joint venture 14 (112) (868) - -
Income taxes paid (18,879) (14,372) - -
Net finance costs 7,839 9,688 - -
Other non-operating charges - 6 - -
Net cash used in operating activities (102,298) (129,048) (19) -
The table below details changes in the Group’s liabilities arising from financing activities, including both cash and non-cash changes. Liabilities arising from financing activities are those for which cash flows were, or future cash flows will be, classified in the Group’s consolidated cash flow statement as cash flows from financing activities.
Note
14 April 2017
£’000
Financingcash flow
£’00031 December 2017
£’000
Bank loans 20 11,895 (11,895) -
Cash and cash equivalents and bank overdrafts 11,895 (11,895) -
The expense recognised for equity-settled share-based payments in respect of employee services received in the year is £9,000 (14 April 2017: £107,000).
On 10 May 2017 Brookfield Business Partners together with institutional partners, acquired an 83.64% controlling stake in Greenergy Fuels Holdings Limited. As a result all share options and hurdles were exercised during the period.
FINANCIALS
141140 ANNUAL REPORT APRIL – DECEMBER 2017
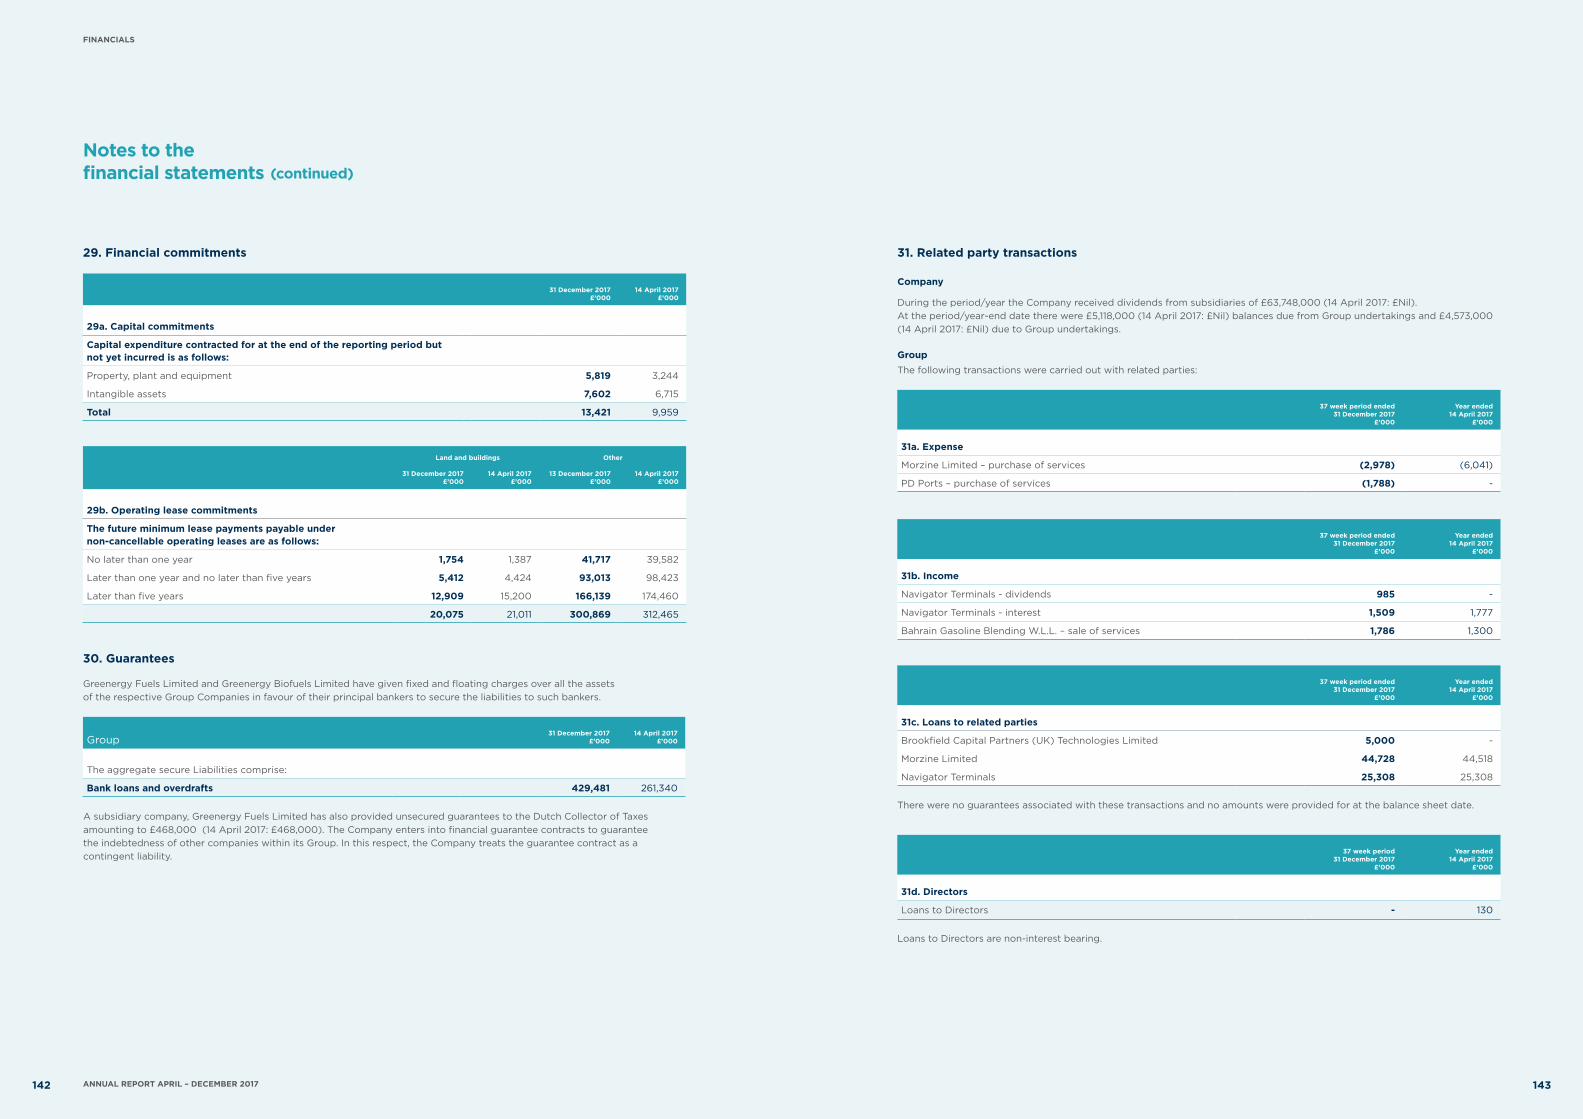
Notes to the financial statements (continued)
30. Guarantees
Greenergy Fuels Limited and Greenergy Biofuels Limited have given fixed and floating charges over all the assets of the respective Group Companies in favour of their principal bankers to secure the liabilities to such bankers.
Group31 December 2017
£’000
14 April 2017
£’000
The aggregate secure Liabilities comprise:
Bank loans and overdrafts 429,481 261,340
31 December 2017
£’000 14 April 2017
£’000
29a. Capital commitments
Capital expenditure contracted for at the end of the reporting period but not yet incurred is as follows:
Property, plant and equipment 5,819 3,244
Intangible assets 7,602 6,715
Total 13,421 9,959
Land and buildings Other
31 December 2017 £’000
14 April 2017 £’000
13 December 2017 £’000
14 April 2017 £’000
29b. Operating lease commitments
The future minimum lease payments payable under non-cancellable operating leases are as follows:
No later than one year 1,754 1,387 41,717 39,582
Later than one year and no later than five years 5,412 4,424 93,013 98,423
Later than five years 12,909 15,200 166,139 174,460
20,075 21,011 300,869 312,465
29. Financial commitments
A subsidiary company, Greenergy Fuels Limited has also provided unsecured guarantees to the Dutch Collector of Taxes amounting to £468,000 (14 April 2017: £468,000). The Company enters into financial guarantee contracts to guarantee the indebtedness of other companies within its Group. In this respect, the Company treats the guarantee contract as a contingent liability.
31. Related party transactions
Company
During the period/year the Company received dividends from subsidiaries of £63,748,000 (14 April 2017: £Nil). At the period/year-end date there were £5,118,000 (14 April 2017: £Nil) balances due from Group undertakings and £4,573,000 (14 April 2017: £Nil) due to Group undertakings.
GroupThe following transactions were carried out with related parties:
37 week period ended31 December 2017
£’000
Year ended 14 April 2017
£’000
31a. Expense
Morzine Limited – purchase of services (2,978) (6,041)
PD Ports – purchase of services (1,788) -
37 week period ended31 December 2017
£’000
Year ended 14 April 2017
£’000
31b. Income
Navigator Terminals - dividends 985 -
Navigator Terminals - interest 1,509 1,777
Bahrain Gasoline Blending W.L.L. – sale of services 1,786 1,300
37 week period ended31 December 2017
£’000
Year ended 14 April 2017
£’000
31c. Loans to related parties
Brookfield Capital Partners (UK) Technologies Limited 5,000 -
Morzine Limited 44,728 44,518
Navigator Terminals 25,308 25,308
Loans to Directors are non-interest bearing.
There were no guarantees associated with these transactions and no amounts were provided for at the balance sheet date.
37 week period31 December 2017
£’000
Year ended 14 April 2017
£’000
31d. Directors
Loans to Directors - 130
FINANCIALS
143142 ANNUAL REPORT APRIL – DECEMBER 2017

Notes to the financial statements (continued)
Key management is composed of the Directors. The compensation paid or payable to key management of the Group for employee services is shown below:
37 week period ended 31 December 2017
£’000
Year ended 14 April 2017
£’000
Salaries and other short-term benefits 3,991 5,071
Post employment benefits 41 48
Compensation for loss of office 10 -
Share-based payments - 35
4,042 5,154
Highest paid Director
Aggregate emoluments 1,635 2,086
Company pension contributions to money purchase schemes 8 30
1,643 2,116
32. Key management personnel compensation
33. Ultimate parent undertaking and controlling party
The immediate parent undertaking is BCP IV Fuel Holdings V Limited, a company incorporated in the UK. The ultimate parent undertaking and controlling party is Brookfield Asset Management Inc, a company incorporated in Canada.
Brookfield Asset Management Inc., is the parent undertaking of the largest group of undertakings to consolidate these financial statements at 31 December 2017. The consolidated financial statements of Brookfield Asset Management Inc. can be obtained from Suite 300, Brookfield Place, 181 Bay Street, Toronto, Ontario, M5J 2T3.
Book value
of assets and liabilities acquired
£’000Adjustments
£’000
Fair value of assets and
liabilities acquired£’000
Recognised amounts of assets and liabilities acquired
Investments 3,839 1,942 5,781
Property, plant and equipment 12,232 (2,864) 9,368
Cash (7,541) - (7,541)
Operating working capital 31,925 (13,170) 18,755
Deferred tax liability (581) (2,751) (3,332)
Software 61 - 61
Customer relationships - 16,814 16,814
Brand - 260 260
Goodwill 89 2,019 2,108
40,024 2,250 42,274
CAN-OPOn 31 October, the Group acquired 100% of the share capital of the CAN-OP group in order to expand the operations of the Group in Canada. The principal activity is that of an independent fuel distributor and terminal owner in Ontario, Canada. The acquisition was treated as a business combination.
The following table summarises the consideration paid across the assets acquired and liabilities assumed.
£’000
Consideration at 31 October 2017
Cash 9,500
Contingent consideration -
Total 9,500
Inver On 31 October, the Group acquired 100% of the share capital of the Inver group in order to expand the operations of the Group in Ireland. The principal activity is that of an independent fuel supplier based in Ireland and Cardiff, Wales. The acquisition was treated as a business combination.
The following table summarises the consideration paid across the assets acquired and liabilities assumed.
£’000
Consideration at 31 October 2017
Cash 32,304
Contingent consideration 9,970
Total 42,274
34. Business combinations
Goodwill relates to access to a new market and future value added as a result of the business combination.
Contingent consideration is measured using scenario based modelling. A third party valuer was used to assist in determining the value of the contingent consideration on acquisition.
The contingent consideration arrangements requires the Group to pay the former owners of Inver up to a maximum of £21 million (€24 million). This is based on the financial performance of the Inver group between 2017 and 2020. There are a number of performance obligations to be met.
It is not considered practicable to disclose the results of the Inver group as if the acquisition had been in place since the start of the financial period.
The following amounts have contributed to the Group result from the Inver group since the acquisition date:
£’000
Revenue 81,325
Profit before taxation 46
FINANCIALS
145144 ANNUAL REPORT APRIL – DECEMBER 2017

34. Business combinations (continued)
Notes to the financial statements (continued)
DirectorsP T Bateson C J Brookhouse T G Earley C S Lumbard C O’Callaghan S E McCaffrey A J Traeger A W Owens
Company secretaryR W Clifton
Independent auditorDeloitte LLP Statutory Auditors 2 New Street Square London EC4A 3BZ
SolicitorsMacfarlanes LLP 20 Cursitor Street London EC4A 1LT
BankersLloyds Bank plc 25 Gresham Street London EC2V 7HN
ING Bank N.V. Bijlmerplein 888 1102 MG Amsterdam Netherlands
Officers and professional advisors
Goodwill relates to future value added as a result of the business combination.
It is not considered practicable to disclose the results of the CAN-OP group as if the acquisition had been in place since the start of the financial period.
The following amounts have contributed to the Group result from the CAN-OP group since the acquisition date:
£’000
Revenue 7,406
Profit before taxation 60
Book value
of assets and liabilities acquired
£’000Adjustments
£’000
Fair value of assets and
liabilities acquired£’000
Recognised amounts of assets and liabilities acquired
Property, plant and equipment 3,157 462 3,619
Cash 191 - 191
Operating working capital (2,082) (90) (2,172)
Deferred tax liability - (942) (942)
Customer relationships - 3,364 3,364
Goodwill 808 4,632 5,440
2,074 7,426 9,500
ANNUAL REPORT APRIL – DECEMBER 2017 147146
FINANCIALS

Designed by Mr B & Friends
Registered offices
Greenergy Fuels Holdings Limited198 High Holborn, London, WC1V 7BD
Registration number 07318726 England and Wales
Greenergy International Limited198 High Holborn London WC1V 7BD
1796640 Ontario Limited 1130 Commerce Street, Thunder Bay, Ontario, Canada, P7E 6E8
Central Canada Fuels and Lubricants Inc 910 Commerce Street, Thunder Bay, Ontario, Canada, P7E 6E9
Greenergy Asia DMCC #R 01-01, Suite 101, Floor No1, Serviced Offices JLT, Reef Tower, Jumeirah Lake Towers, Dubai UAE
Greenergy Bioethanol SA Hinterbergstrasse 24, 6312 Steinhausen, Zug, Switzerland
Greenergy Biofuels Limited 198 High Holborn, London, WC1V 7BD
Greenergy Biofuels Teesside Limited 198 High Holborn, London, WC1V 7BD
Greenergy Brasil Trading SA Rua Gomes de Carvalho, 1069, cj 181 and 182, Advance Tower, Vila Olimpia, São Paulo – SP, Brazil 04547-004
Greenergy Deutschland GmbH Austraße 6, 73230 Kirchheim unter Teck, Germany
Greenergy Flexigrid Limited 198 High Holborn, London, WC1V 7BD
Greenergy Fuels Australia Pty Ltd HD & Co 118 Atkinson Street, Oakleigh, Victoria, Australia 3166
Greenergy Fuels Canada Inc107 Germain Street, Suite 300, Saint John, NB, E2L 2E9, Canada
Greenergy Fuels Limited198 High Holborn, London, WC1V 7BD
Greenergy Fuels Holdings North America Inc1 Germain Street Suite 1500, Saint John, E2L 4V1, Canada
Greenergy Fuels North America Inc107 Germain Street, Suite 300, Saint John, NB, E2L 2E9, Canada
Greenergy Fuels Private Limited165/XXI, Kaniyamparambil, Thondankulangara Ward, Avalookunnu (P.O), Alappuzha, Kerala, India, 686006
Greenergy Morzine Holding Limited198 High Holborn, London, WC1V 7BD
Greenergy Oil U.K. Limited198 High Holborn, London, WC1V 7BD
Greenergy Services Limited198 High Holborn, London, WC1V 7BD
Greenergy Terminals Limited198 High Holborn, London, WC1V 7BD
Greenergy USA Inc9 Greenway Plaza, Suite 1260 Houston, Texas, 77046, USA
Inver Energy Limited River House, Blackpool Park, Blackpool, Cork, T23R5TF, Ireland
Inver Energy (UK) Limited Queen Alexandra House, Cargo Road, Cardiff, CF10 4LY
Northland Biodiesel Marketing Inc. 910 Commerce Street, Thunder Bay, Ontario, Canada, P7E 6E9
Wascan Terminals Inc 920 Commerce Street, Thunder Bay, Ontario, Canada, P7E 6E9
Associates and Joint ventures
Anglo China Chemical Co. LimitedRM18L, 27/F, Ho King Comm CTR, 2-16 Fayuen ST, Mongkok Kowloon, Hong Kong
Atlantic Fuel Supply Company LimitedRiver House, Blackpool Business Park, Blackpool, Cork, Ireland
Greenlife Oil Holdings Pty Limited First Floor, 118 Atkinson Street, Oakleigh, Victoria, 3166, Australia
Greenergy North Cave Limited198 High Holborn, London, WC1V 7BD
Morzine LimitedOgier House, The Esplanade, St Helier, Jersey
Scarab Distributed Energy Limited 198 High Holborn, London, WC1V 7BD
FINANCIALS
148 ANNUAL REPORT APRIL – DECEMBER 2017148

Printed on FSC certified paper, acid free with 100% virgin ECF fibre using waterless printing and vegetable-based inks.
Greenergy Fuels Holdings Ltd
198 High Holborn, London WC1V 7BDwww.greenergy.com