Embed Size (px)
Citation preview
Welltec® AnnuAl RepoRt 2011 1
AnnuAl RepoRt
Welltec International ApS
Central Business Registration No: 30 69 50 03

Welltec® AnnuAl RepoRt 2011 2
focused on estAblishing A succesful tRend
Welltec® AnnuAl RepoRt 2011 3
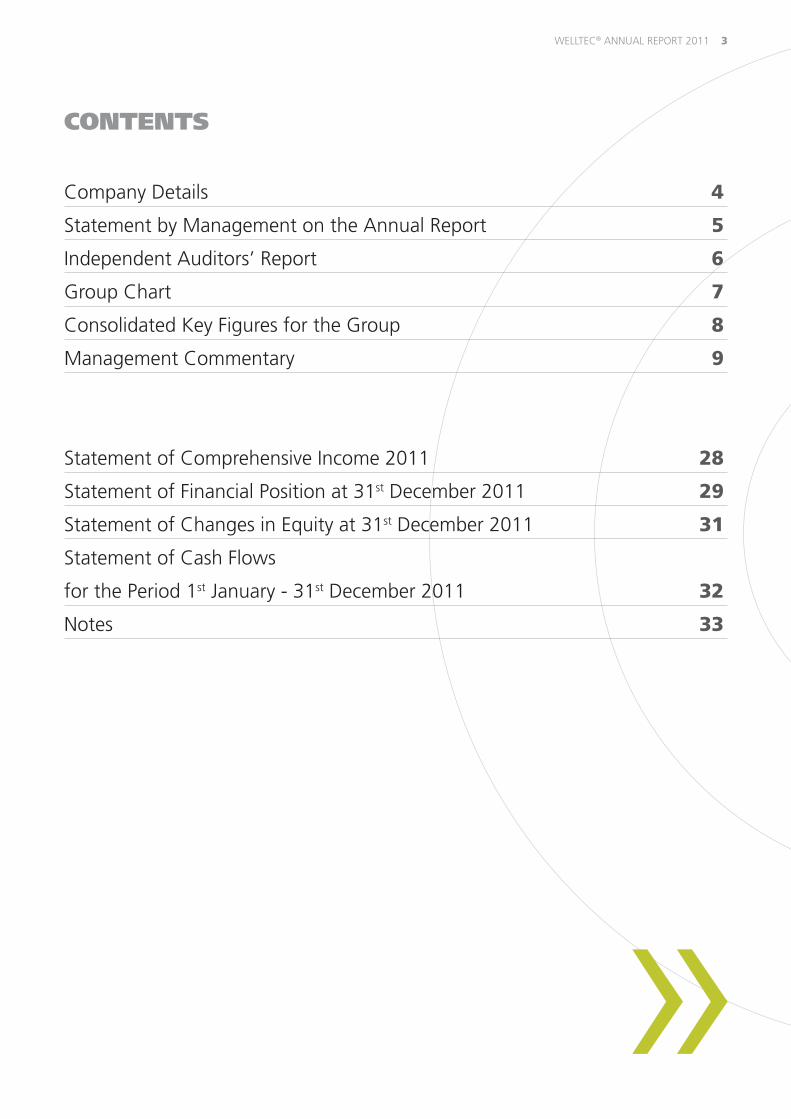
Contents
company details 4
statement by Management on the Annual Report 5
independent Auditors’ Report 6
group chart 7
consolidated Key figures for the group 8
Management commentary 9
statement of comprehensive income 2011 28
statement of financial position at 31st december 2011 29
statement of changes in equity at 31st december 2011 31
statement of cash flows
for the period 1st January - 31st december 2011 32
notes 33
Welltec® AnnuAl RepoRt 2011 4
CoMpAnY DetAIls
Company Welltec international Aps
gydevang 25
3450 Allerød
denmark
phone: 48 14 35 14
fax: 48 14 35 18
internet: www.welltec.com
e-mail: [email protected]
central business Registration no: 30 69 50 03
Registered in: Allerød
Accounting year: 1/1 - 31/12 2011
Board of Directors søren Jørgensen
Jørgen hallundbæk
han sikkens
scott c. collins
Executive Board Jørgen hallundbæk
Company auditors deloitte statsautoriseret Revisionspartnerselskab
the Annual general Meeting adopted the annual report on March 27, 2012.
Chairman of the General Meeting
Welltec® AnnuAl RepoRt 2011 5
stAteMent BY MAnAGeMent on tHe AnnuAl RepoRt
We have today considered and approved the annual report of
Welltec international Aps for the financial year January 1, 2011
to december 31, 2011.
the consolidated financial statements and parent financial
statements are prepared in accordance with international
financial Reporting standards as adopted by the eu and addi-
tional danish disclosure requirements for annual reports.
in our opinion, the consolidated financial statements and the
parent financial statements give a true and fair view of the
group’s and the parent’s financial position at december 31,
2011 as well as of their financial performance and their cash
flows for the financial year January 1, 2011–december 31,
2011.
We also believe that the management commentary contains a
fair review of the development of the group’s and the parent’s
activities and financial position, together with a description of
the principal risks and uncertainties that the group and the par-
ent face.
We recommend the annual report for adoption at the Annual
general Meeting.
Allerød, March 2, 2012
Executive Board:
Jørgen hallundbæk
chief executive officer
Board of Directors:
søren Jørgensen scott c. collins
chairman
Jørgen hallundbæk Johannes K. J. sikkens
Welltec® AnnuAl RepoRt 2011 6
copenhagen, March 2, 2012
Deloitte
statsautoriseret Revisionspartnerselskab
Anders dons Martin faarborg state Authorised state Authorised public Accountant public Accountant
InDepenDent AuDItoRs’ RepoRt
To the shareholders of Welltec International ApS
Report on the consolidated financial statements and parent
financial statements
We have audited the consolidated financial statements and parent
financial statements of Welltec international Aps for the financial year
January 1 - december 31, 2011, which comprise the statement of
comprehensive income, statement of financial position, statement of
changes in equity, cash flow statement and notes, including the ac-
counting policies, for the group as well as the parent. the consolidated
financial statements and parent financial statements have been pre-
pared in accordance with international financial Reporting standards as
adopted by the eu and disclosure requirements of the danish financial
statements Act.
Management’s responsibility for the consolidated financial
statements and parent financial statements
Management is responsible for the preparation of consolidated finan-
cial statements and parent financial statements that give a true and fair
view in accordance with international financial Reporting standards as
adopted by the eu and disclosure requirements of the danish financial
statements Act and for such internal control as Management deter-
mines is necessary to enable the preparation of consolidated financial
statements and parent financial statements that are free from material
misstatement, whether due to fraud or error.
Auditor’s responsibility
our responsibility is to express an opinion on the consolidated financial
statements and parent financial statements based on our audit. We
conducted our audit in accordance with international standards on
Auditing and additional requirements under danish audit regulation.
this requires that we comply with ethical requirements and plan and
perform the audit to obtain reasonable assurance about whether the
consolidated financial statements and parent financial statements are
free from material misstatement.
An audit involves performing procedures to obtain audit evidence
about the amounts and disclosures in the consolidated financial
statements and parent financial statements. the procedures selected
depend on the auditor’s judgement, including the assessment of the
risks of material misstatements of the consolidated financial state-
ments and parent financial statements, whether due to fraud or error.
in making those risk assessments, the auditor considers internal control
relevant to the entity’s preparation of consolidated financial statements
and parent financial statements that give a true and fair view in order
to design audit procedures that are appropriate in the circumstances,
but not for the purpose of expressing an opinion on the effectiveness
of the entity’s internal control. An audit also includes evaluating the
appropriateness of accounting policies used and the reasonableness
of accounting estimates made by Management, as well as the overall
presentation of the consolidated financial statements and parent finan-
cial statements.
We believe that the audit evidence we have obtained is sufficient and
appropriate to provide a basis for our audit opinion.
our audit has not resulted in any qualification.
Opinion
in our opinion, the consolidated financial statements and parent finan-
cial statements give a true and fair view of the group’s and the parent’s
financial position at december 31, 2011, and of the results of their op-
erations and cash flows for the financial year January 1 - december 31,
2011 in accordance with international financial Reporting standards as
adopted by the eu and disclosure requirements of the danish financial
statements Act.
Statement on the management commentary
pursuant to the danish financial statements Act, we have read the
management commentary. We have not performed any further proce-
dures in addition to the audit of the consolidated financial statements
and parent financial statements.
on this basis, it is our opinion that the information provided in the
management commentary is consistent with the consolidated financial
statements and parent financial statements.
Welltec® AnnuAl RepoRt 2011 7
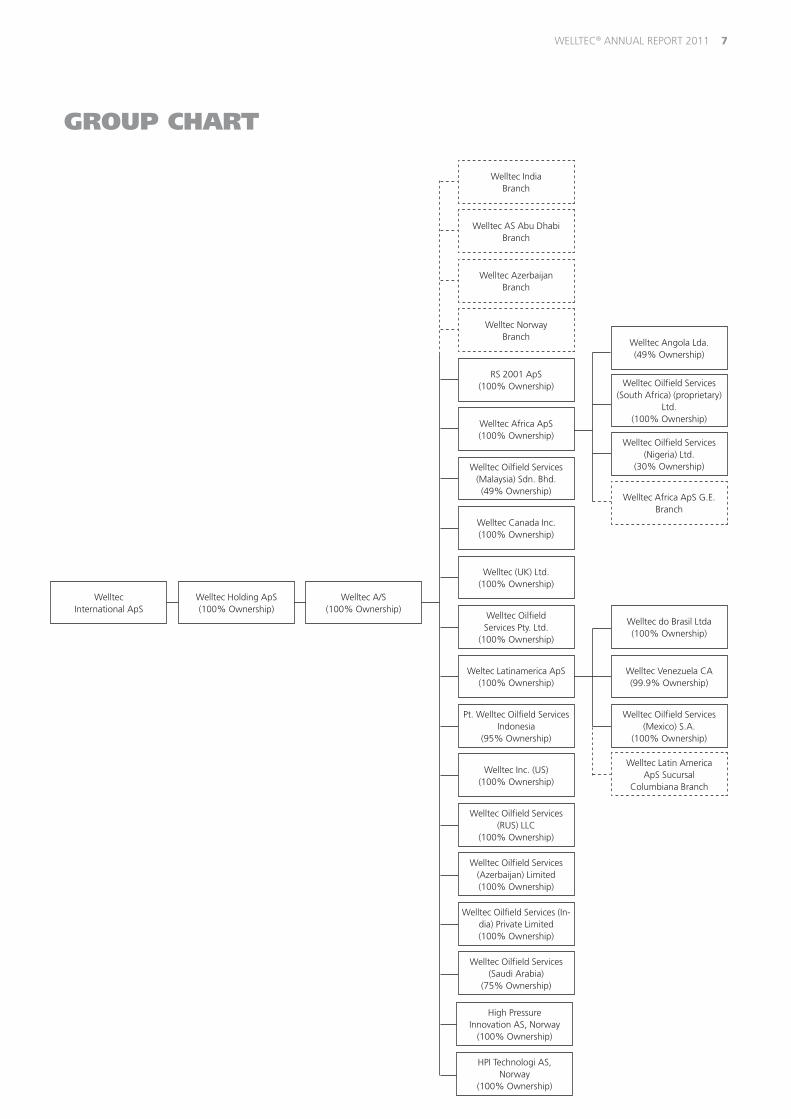
GRoup CHARt
Welltec indiabranch
Welltec As Abu dhabibranch
Welltec Azerbaijanbranch
Welltec norwaybranch
Rs 2001 Aps(100% ownership)
Welltec Africa Aps(100% ownership)
Welltec oilfield services (Malaysia) sdn. bhd.(49% ownership)
Welltec canada inc.(100% ownership)
Welltec (uK) ltd.(100% ownership)
Welltec oilfield services pty. ltd.
(100% ownership)
Weltec latinamerica Aps(100% ownership)
pt. Welltec oilfield services indonesia
(95% ownership)
Welltec inc. (us)(100% ownership)
Welltec oilfield services (Rus) llc
(100% ownership)
Welltec oilfield services (Azerbaijan) limited(100% ownership)
Welltec oilfield services (in-dia) private limited(100% ownership)
Welltec oilfield services (saudi Arabia)
(75% ownership)
Welltec Angola lda.(49% ownership)
Welltec oilfield services (nigeria) ltd.
(30% ownership)
Welltec do brasil ltda(100% ownership)
Welltec Venezuela cA(99.9% ownership)
Welltec oilfield services (Mexico) s.A.
(100% ownership)
Welltec latin America Aps sucursal
columbiana branch
Welltec Africa Aps g.e. branch
Welltecinternational Aps
Welltec holding Aps(100% ownership)
Welltec A/s(100% ownership)
high pressure innovation As, norway
(100% ownership)
hpi technologi As, norway
(100% ownership)
Welltec oilfield services(south Africa) (proprietary)
ltd.(100% ownership)
Welltec® AnnuAl RepoRt 2011 8
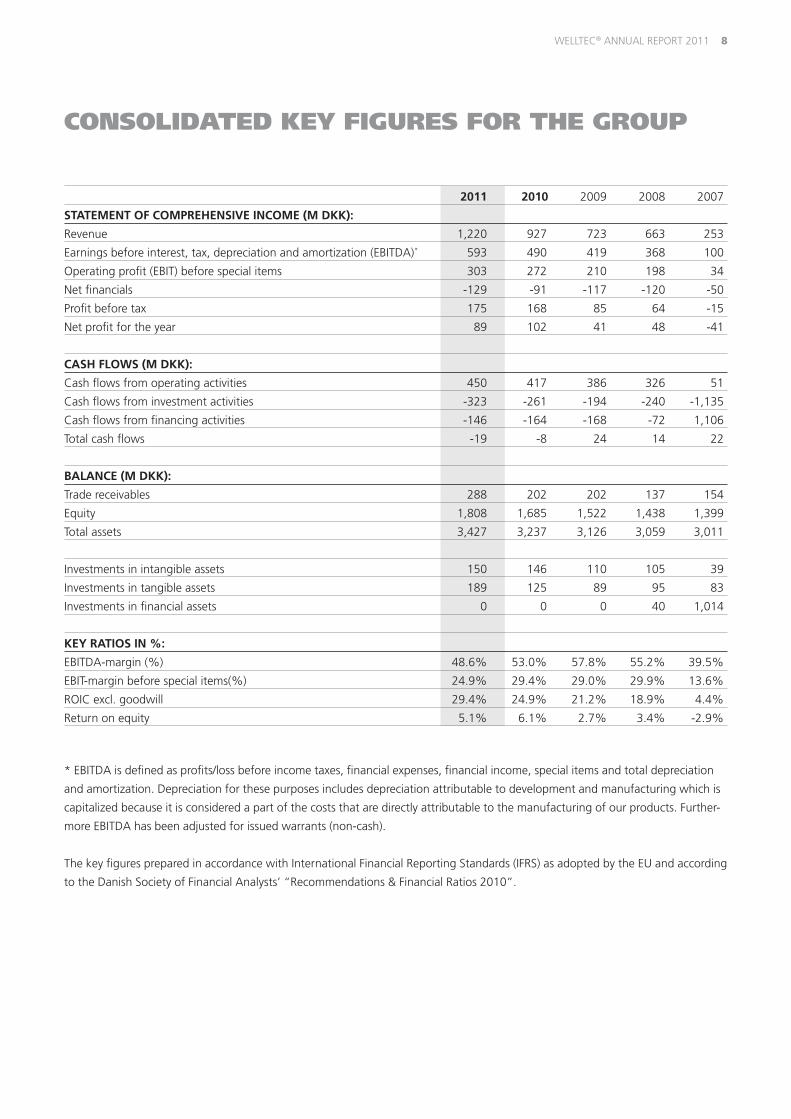
ConsolIDAteD KeY FIGuRes FoR tHe GRoup
2011 2010 2009 2008 2007
STATEMEnT Of COMpREhEnSIvE InCOME (M DKK):
Revenue 1,220 927 723 663 253
earnings before interest, tax, depreciation and amortization (ebitdA)* 593 490 419 368 100
operating profit (ebit) before special items 303 272 210 198 34
net financials -129 -91 -117 -120 -50
profit before tax 175 168 85 64 -15
net profit for the year 89 102 41 48 -41
CASh flOWS (M DKK):
cash flows from operating activities 450 417 386 326 51
cash flows from investment activities -323 -261 -194 -240 -1,135
cash flows from financing activities -146 -164 -168 -72 1,106
total cash flows -19 -8 24 14 22
BAlAnCE (M DKK):
trade receivables 288 202 202 137 154
equity 1,808 1,685 1,522 1,438 1,399
total assets 3,427 3,237 3,126 3,059 3,011
investments in intangible assets 150 146 110 105 39
investments in tangible assets 189 125 89 95 83
investments in financial assets 0 0 0 40 1,014
KEy RATIOS In %:
ebitdA-margin (%) 48.6% 53.0% 57.8% 55.2% 39.5%
ebit-margin before special items(%) 24.9% 29.4% 29.0% 29.9% 13.6%
Roic excl. goodwill 29.4% 24.9% 21.2% 18.9% 4.4%
Return on equity 5.1% 6.1% 2.7% 3.4% -2.9%
* ebitdA is defined as profits/loss before income taxes, financial expenses, financial income, special items and total depreciation
and amortization. depreciation for these purposes includes depreciation attributable to development and manufacturing which is
capitalized because it is considered a part of the costs that are directly attributable to the manufacturing of our products. further-
more ebitdA has been adjusted for issued warrants (non-cash).
the key figures prepared in accordance with international financial Reporting standards (ifRs) as adopted by the eu and according
to the danish society of financial Analysts’ “Recommendations & financial Ratios 2010”.
Welltec® AnnuAl RepoRt 2011 9
MAnAGeMent CoMMentARY
RESulTS AnD OuTlOOK
Development in activities and finances
Welltec® achieved another successful year in 2011, secur-
ing record revenues of dKK 1,220 million in the period ended
december 31, 2011. this represents a growth of 31.7% year
on year in comparison to 2010 and is in line with the outlook
presented in the 2010 Annual Report.
the growth can be attributed to three main areas; an increase
of activity within our existing client base, commercialization of
new products and expansion within some geographical areas
brought about by an increase in tool fleet and client mix.
gross profit margin for the Year ending december 31, 2011
was 57.7% with the costs of service provision increasing rela-
tively to revenue as a result of required investments made in
the operational organization to perpetuate the growth plan.
Adjusted for issuance of non-cash warrants of dKK 33.3 mil-
lion, the administrative costs increased proportional to revenue.
profit from operations before special items (ebit) was dKK
303 million, a 11.5% increase on 2010. the ebit margin was
24.9% against 29.4% in 2010, reflecting the lower gross
profit margin compared to 2010.
profit for the year was dKK 89 million, a 12.2% decrease on
2010, reflecting the issuance of warrants (non-cash) to employ-
ees and increased taxes primarily related to tax provisions.
Welltec® once again recorded a positive cash flow from op-
erations, which in addition to investments in equipment and
development activities were used for installments and interest
payments.
Outlook
the outlook for the future remains positive. As the oil and gas
industry is risk averse due to the substantial economic costs
and business implications of failure or mishaps, many new
technologies fail to gain customer acceptance and therefore
do not succeed commercially. conversely, once a technology is
proven to be reliable, it secures a position of acceptance and
becomes a planned part of the work program. the group’s per-
formance is evidence of broad client acceptance by multiple oil
and gas companies around the world in many different operat-
ing environments.
Welltec® has created a unique position in the robotic well in-
tervention market through technology leadership and has the
highest market share of available robot tractors. growth will
continue in our tractor and intervention capabilities as well as
with new innovations. this is supported in 2012 by the intro-
duction of new products and services such as the Well cutter
tool.
furthermore Welltec® is in the process of increasing the organi-
zational capacity in order to support the future growth. this
process will continue into 2012.
Management expects growth for the group both in revenue as
well as ebitdA in 2012. Revenue is expected to be in the range
of dKK 1,350m to 1,500m and ebitdA margin is expected to
be at or around historic levels.
Events after the balance sheet date
february 1, 2012 we announced the completion of an us$
325 million aggregate principal amount 8 % senior secured
notes due 2019 offering. the 144A/Regs offering drew de-
mand from institutional investors in both europe and the us.
pRofit fRoM opeRAtions befoRe speciAl iteMs (ebit) WAs
dKK 303 Million, A 11.5% incReAse on 2010
MAnAgeMent coMMentARY /
Welltec® AnnuAl RepoRt 2011 10
the notes have been assigned a b1 rating by Moody’s (stable
outlook) and a bb- rating by standard & poor’s (stable outlook)
with equivalent corporate ratings. the notes have been listed
on the official list and admitted to trading on the euro Mtf
Market of the luxembourg stock exchange.
the net proceeds of the offering of the notes will be used to
refinance existing credit facilities, pay a special shareholder dis-
tribution and for general corporate purposes. part of the share-
holder distribution will be done through payout of extraordi-
nary divided from Welltec international Aps.
to complete the refinancing of existing facilities, the follow-
ing extraordinary dividends have been distributed in february,
2012. from Welltec Africa Aps dKK 31.4 million was distrib-
uted to Welltec A/s. from Welltec A/s dKK 728.6 million was
distributed to Welltec holding Aps. from Welltec holding Aps
dKK 787.3 million was distributed to Welltec international Aps.
in february 2012 Welltec® announced that the company,
through its wholly owned subsidiary Welltec canada inc. grew
its operations with the acquisition of endeavor e-line services,
the wireline portion of essential energy services, ltd. in calgary,
Alberta. the total cost of the business combination was agreed
to dKK 41.4 million. the transaction is financed through exist-
ing cash resources.
As the final acquisition date is february 2, 2012, it is not pos-
sible to provide details about the pre-acquistion balance sheet
and the total transaction costs.
no further significant events regarding the group’s activities
have occurred since december 31, 2011.
pROfIlE Of WEllTEC®
Who we are
As a leading provider of well intervention services to the oil
and gas industry, our robotic technology enables operators to
conduct interventions safer, faster and with higher accuracy,
thereby enabling the oil and gas industry to optimize the pro-
ductivity from wells draining a reservoir. Welltec® also provides
well completion products that help build flexible wells which
can be intervened through-out the life of the well, allowing
for a continuous adaptation of the well to the conditions in
the reservoir. by providing our services and solutions, we help
secure the most optimal use of the oil and gas resources , and
thereby enable a better supply of energy for people and allow
for improved production of reserves that otherwise couldn’t be
produced optimally.
historically, our founder began drawing up the plans for the
first Well tractor in 1987 and we were formally established
in 1989, changing our name to Welltec® in 1994. We initially
operated primarily in the north sea oil and gas market but have
since grown through new service development and geographi-
cal expansion to provide a wide range of services to our cus-
tomers all over the world.
today Welltec® is headquartered in Allerød, denmark, and
operates in all major hydrocarbon producing areas of the
world, employing more than 790 employees with offices in 22
countries.
MAnAgeMent coMMentARY /
Welltec® AnnuAl RepoRt 2011 11
What we do
We provide our services and solutions in any environment
where hydrocarbons are produced – onshore or offshore,
in oil or gas wells, in mature oilfields and in fields under
development.
Most of our activities are related to the production phase of oil
and gas wells, but as we grow our business, our services and
solutions portfolio addresses the entire life cycle of a well, from
drilling and evaluation to completion, production and plug and
abandonment.
our well intervention services, from which we currently de-
rive most of our revenue, provides our customers with well
management solutions through a wide range of services, from
conveyance of well logging and surveillance measurements to
complex clean-out and maintenance operations.
in addition, we have in 2011 started the full-scale commerciali-
zation of our well completion products and solutions aimed at
enabling wells to come on stream faster with increased safety,
reduced cost and higher productivity.
We develop, test, manufacture and use proprietary technology
and equipment to provide our services and solutions. our pro-
prietary high-technology equipment is developed, tested and
manufactured in-house for our exclusive use.
our tractor based, light footprint technology (Well tractor®) has
represented a breakthrough in deploying and operating oil and
gas well intervention tools. compared to coiled tubing or simi-
lar heavy-duty equipment, our technology has several benefits,
including an ability to operate at high pressure and tempera-
tures, in large depths, over long distances and at high devia-
tions. our technology is also deployable in a faster and more
flexible manner compared to our competitors (including being
transportable by helicopter or truck) and provides for riserless
well intervention and fast rig up / rig down time.
At Welltec®, we believe that bringing technology to a higher
level will yield benefits for the industry. therefore we con-
stantly work at pushing the boundaries for what we can do to
sweep reservoirs better though using improved technology. our
development and engineering (d&e) department continues to
develop new technology that allows us to both enhance our
existing solutions and provide new ones. We invest heavily in
the development of new technology, and during 2011 we in-
vested more than 11.1% of our total revenues in d&e.
Where we work
We can work in virtually any environments where oil or gas is
being extracted regardless of whether it is a conventional or
unconventional reserve that is being drained and regardless of
whether it is onshore or offshore. Also in more complicated or
hostile environments, such as deepwater, subsea, arctic, or re-
mote areas, or in wells sweeping challenging reserves, such as
heavy oil, sAgd, tight oil, geothermal and unconventional gas,
our technology is delivering tangible benefits for the operator.
our operations are focused in three geographic marketing
areas: (1) europe & Russia, (2) Americas and (3) Middle east,
Africa (MeA) & Asia pacific (ApAc). our customers include key
national and a wide range of the world’s most renown major
stRAtegicAllY, We focus on dRiVing the coMpAnY’s deVelopMent
thRough focus on thRee stRAtegic theMes foR the coMing YeARs: gRoWth, stRength And position.
GRowtH
MAnAgeMent coMMentARY /
Welltec® plAns to stRengthen ouR business And opeRAtionAl Model to pRoVide betteR seRVices
foR ouR custoMeRs in A WAY Which endoRses long teRM RelAtionships.
stRenGtH
Welltec® AnnuAl RepoRt 2011 12
and independent oil companies (such as statoil, saudi Aramco,
petrobras, petronas, sonangol, peMeX, conocophillips, total,
exxonMobil, shell, bp, chevron and canadian natural Resourc-
es limited (cnRl)), from which we derive the majority of our
revenue, as well as other oilfield services providers.
WEllTEC’S STRATEGy
strategically we are focused on driving the company’s devel-
opment through focus on three strategic themes; growth,
strength and position.
We believe that challenging conventional solutions will contin-
ue to allow us to deliver disruptive technology that adds value
for our clients. coupled with improved service delivery and a
responsiveness to our client’s needs, we will deliver growth in
several key regions:
• north America: We aim to leverage our existing operations
in the united states and canada, where we believe our cur-
rent footprint in the conveyance market for unconventional
oil and gas plays will serve as a solid basis for the diversifi-
cation of our offerings to include high-technology services
such as conveyance, milling and cleaning that today are
served primarily by conventional technologies.
• brazil: Recent offshore discoveries and our existing business
with petrobras constitute a potential for significant growth
in activities.
• Russia/cis: in the Russian market, we have been providing
mostly wireline conveyance services to many of our custom-
ers but we believe that there is potential for selling a broad-
er range of services, including more complex and high-value
services and solutions to our large gas producing customers.
• Middle east: We believe that there are also opportunities in
the Middle east, where the national oil companies represent
a large growth potential, in particular in saudi Arabia, uAe,
Qatar and Kuwait.
• southeast Asia: the large offshore activities in Malaysia, bru-
nei, Vietnam and indonesia represent growth opportunities,
where our current track record can help us get even further
work.
Build a stronger and more resilient company
We plan to continue to strengthen our business and opera-
tional models to provide better services in a way that endorses
long term relationships with our customers. Working more
closely with our customers over longer periods of time ensures
not only a more stable revenue stream but also allows Welltec®
to develop faster and more accurately solutions to meet our
customers’ challenges; thereby perpetuating the value cycle.
We have begun several projects which support this initiative,
including:
• expansion of our service offerings and product ranges to
broaden our portfolio and reduce dependency upon a single
offering.
• establishing more direct, contractual ties with our customers
as well as longer duration agreements which secures more
planned, dedicated work.
• streamlining our organizational structure to reflect our value
chain, and thereby matching a global, company-wide inte-
gration of services where roles, responsibilities and interac-
tions between different parts of the organization are being
clarified to improve performance;
• Recruiting and keeping new engineering and management
talent; and
MAnAgeMent coMMentARY /
Welltec® AnnuAl RepoRt 2011 13
• introducing scalable structures and procedures across our
organization that support our growth, primarily through lev-
eraging our already established it-driven infrastructure and
ensuring that knowledge is built into the structure of the
organization rather than depending on specific individuals.
Maximize the value we provide to our customers
Welltec® is focused on providing services where we can be
unique and avoiding those markets where services are effec-
tively commoditized. We intend to attract and satisfy more ref-
erence customers like statoil through a focus on global account
management, by maintaining our focus on direct customer re-
lationships and by accelerating the rate of technology replace-
ment to our offerings across all geographies.
We pursue strategic partnerships with other service providers,
such as selected wireline providers, vessel providers and tech-
nology companies, where our combined offerings can be pre-
sented to customers as a complete solution. Welltec® can posi-
tion ourselves as the lead contractor when required, thereby
gaining direct customer access in both tender and transactional
engagements.
furthermore we actively engage in developing new solution
concepts that addresses our customer’s largest challenges, such
as riserless well intervention services for subsea wells, plug and
abandonment of wells and open-hole intervention services in
horizontals that require integrated, specialized solutions and
equipment. in due time, these solutions will provide significant
value to our customers as they will enable them to redefine the
manner in which they operate today. We believe the value crea-
tion this delivers for our customers will be rewarded through
an increase in our own business. overall, Welltec’s goal is to
ensure that we maintain our status quo as a top provider of our
current offerings while simultaneously providing unique, new
solutions in other segments. our pipeline of new service and
product initiatives are aimed at developing a diversified and
growing business in terms of revenues and margins in 2012
and beyond.
WEllTEC®’S COMpETITIvE STREnGThS
position ourselves within important industry growth
areas
over the last decade, operational and capital expenditure by
oil and gas companies has increased. We expect this trend to
continue given the ongoing efforts to improve production from
existing fields and search for new reserves. forecast spend for
the major oil and gas companies is up and we believe this trend
will favor companies such as Welltec® that have advanced and
differentiated technological offerings covering all phases of the
well lifecycle. Moreover, we expect demand for well interven-
tion services to increase relatively unaffected by oil price fluc-
tuations due to capex budgets versus opex budgets, which are
historically less dependent on oil prices.
from a global perspective, oil fields are maturing and new dis-
coveries are not keeping pace with declines or demand consid-
eration. this combination of increasingly mature fields, reduced
quantity and size of new discoveries and increasing global
demand represents a huge challenge for all. Welltec’s expecta-
tions are that our value proposition of developing methods for
increased reservoir optimization will resonate with our custom-
er’s around the world as they seek to increase the life span of
existing fields.
new discoveries are increasingly being made in areas present-
ing significant operational complexity for exploration and
development. Almost half of all newly discovered oil reserves
since 2000 have been made in offshore deepwater or ultra
deepwater. An increasing portion of new supply is also coming
from unconventional reserves (such as shale gas or shale oil)
adding further complexity in the form of more horizontal well
designs. the shift in discoveries and resource types have also
increased the technical risk of projects and the requirements of
the equipment and services necessary to handle these extreme
operating conditions, which have also driven the need to use
ouR goAl is to ensuRe thAt We MAintAin ouR stAtus Quo As A top pRoVideR of ouR
cuRRent offeRings While siMultAneouslY deVeloping otheR uniQue offeRings.
posItIon
MAnAgeMent coMMentARY /
Welltec® AnnuAl RepoRt 2011 14
advanced technologies in well intervention. it is our experience
that oil and gas companies are becoming more likely to work
with suppliers of high-quality services as they deliver a higher
long-term value. With the increased complexity and costs of
new discoveries, we believe that well interventions have be-
come an attractive economic proposition compared to explor-
ing for new reserves. Welltec’s technology, which has a proven
record of successful operations in these environments, will
continue to be in demand.
Superior technology offering
the increased focus on enhancing oil and gas recovery rates
and improving well profitability has led to an increasing indus-
try acceptance of the robotic technology we offer.
Well intervention services increases well profitability through
increased recovery rates and cash flow from production. given
the challenges of sustaining oil and gas production to meet de-
mand we expect the well intervention market will grow signifi-
cant in the coming years. due to its superior performance, we
expect robotic technology to grow even faster than the market
for conventional intervention technologies, and gradually even
replacing older methods. Robotic intervention technology is
superior to these conventional methods because:
• it can be safer given its smaller footprint and lower num-
ber of personnel involved, leading to significant health and
safety advantages for our customers;
• it is less intrusive because it requires a smaller set up space
and a more limited amount of equipment to be inserted into
the well, typically resulting in less damage to the well;
• it can be an order of magnitude faster than conventional
methods due to deployment and rig up times; and
• it is more cost efficient, both in terms of lower direct in-
tervention costs and lower future costs for subsequent
interventions
Sustainable, protected market leadership
We were pioneers in the well intervention services market with
our robotic technology and continue to have a leadership posi-
tion. We believe we have one of the largest inventories of op-
erational tractors globally, and in 2011 we believe that we per-
formed more than half of all well interventions using tractors.
our technological leadership has been recognized by both cus-
tomers and industry associations, and we have been awarded
several industry leading recognitions, such as the 2010 spot-
light technology Award. We have also accumulated many
“firsts” for well-intervention tools within our industry, including
what we believe are records with our Well tractor for deepest
well intervention and highest deviation well intervention, as
well as deepest water depth intervention using riserless light
well intervention.
to maintain our leading position and further grow our business
we continue to focus on technological innovation. We often
work in conjunction with our customers on developing new
applications and tools in order to solve specific needs of our
customers. this enables us to develop a deep understanding
of our customers’ business requirements and the challenges
they face while strengthening our relationships with them. We
continue to devote considerable time and resources to develop-
ment and engineering, and are working on several projects to
deliver the next generation of tools and solutions.
MAnAgeMent coMMentARY /
Welltec® AnnuAl RepoRt 2011 15
hand-in-hand with our dedicated efforts on technology innova-
tions, we vigorously protect our technology and intellectual
property. We have implemented a rigorous intellectual property
rights strategy, including the registration of over 110 patent
families with more than 2.000 individual patents and patent
applications at various stages of registration or application.
We have measures in place to avoid unintended dissemina-
tion of our trade secrets and know-how. this includes in-house
manufacturing of key components, operating our tractors and
tools by our own personnel and restricting access to key manu-
facturing data such as blue-prints.
We believe that our leading position will be maintained and
our business will grow as a consequence of our commitment
to quality in execution and customer service. in the market for
well intervention services, technical reliability and overall service
quality are significant factors (along with price) in our custom-
ers’ purchasing decisions. through continuous evolution and
improvement of our work processes, we believe we offer supe-
rior service quality.
RISKS RElATED TO OuR BuSInESS
Business and industry related risks
our business is affected by the level of expenditures of compa-
nies engaged in the production, exploration and development
of oil and gas.
traditionally, the oil and gas industry is highly cyclical and ex-
penditures can be cancelled or reduced on short notice. While
demand for our services is primarily dependent on operating
expenditures by the oil and gas industry (primarily optimizing
recovery rates for existing wells), demand for our services also
depends on the capital expenditures of this industry (primarily
drilling new wells). A decrease in operating expenditures by the
oil and gas industry may have adverse effects on our revenue
and profits in the shorter term, while a decrease in the capital
expenditures of this industry may have adverse effects on our
revenue and profits in the longer term.
the total level of expenditures by the oil and gas industry for
production, exploration and development of oil and natural
gas reserves is sensitive to a number of factors, primarily oil
and gas prices and the industry’s view of future oil and gas
prices, which historically have been volatile. long-term oil and
gas prices are affected by numerous factors, including (i) the
demand for energy, which is affected by worldwide popula-
tion growth and general economic and business conditions; (ii)
the ability of the organization of petroleum exporting coun-
tries (opec) to set and maintain production levels; (iii) oil and
gas production by non-opec countries; (iv) the cost of explor-
ing for, producing and delivering oil and gas; (v) political and
economic uncertainty and socio-political unrest; (vi) the level of
worldwide oil exploration and production activity; (vii) tech-
nological advances affecting energy consumption; and (viii)
weather conditions.
if oil and gas prices were to increase significantly, companies
engaged in the production, exploration and development of
onshore and offshore oil and gas are more likely to focus on
exploration and development of new reserves rather than
seeking to increase production and recovery rates through well
intervention. further, if oil and gas prices were to decrease sig-
nificantly, well intervention may not be cost-effective for these
companies, although expenditures on well intervention would
likely be reduced less than capital expenditures. since we cur-
rently derive a majority of our revenues from well intervention
services, a significant increase or decrease of oil and gas prices
may have an adverse effect on our revenue and profits.
Skilled technical personnel
highly-skilled personnel are required to develop, manufacture
and operate Welltec®’s sophisticated equipment and support
our business. Management believes it has put in place an entre-
preneurial, international and flexible organization that is attrac-
tive to future and current employees. to date, the group has
successfully recruited, absorbed, trained and retained excellent
people, and expects to continue doing so.
We belieVe thAt ouR leAding position Will be MAintAined And ouR business Will gRoW As A conseQuence of ouR coMMitMent to QuAlitY in eXecution And custoMeR seRVice.
MAnAgeMent coMMentARY /
Welltec® AnnuAl RepoRt 2011 16
Intellectual property
the group’s business relies upon the proprietary knowledge
and innovation know-how. We have put in place an extensive
series of legal, human, process, physical and it security meas-
ures and controls to protect our intellectual property. Among
others, these measures include legal protection via patents and
patent applications pending on our sophisticated equipment
and contractual agreements.
Environmental performance
Welltec® considers quality, health, safety and respect for the
environment to be an integral part of our business. We build
quality, health, safety and respect for the environment into our
processes starting at the design phase and track performance.
Keeping high environmental standards is critical to ensure both
future and present contracts. there are no environmental inci-
dents to report. We believe our sophisticated clean technology
is part of the solution that helps our clients meet the world’s
need for energy security while at the same time reducing
greenhouse gas emissions and promoting sustainable economic
growth.
financial risks
Financial exposure
due to the group’s foreign activities and credit facilities in
foreign currencies, its profit/loss, cash flows and equity are
affected by changes in exchange rates and interest rates for a
number of currencies, primarily us dollars.
Foreign exchange fluctuations
the reporting currency of the group is the danish Kroner and
the functional currency of each of the groups’ subsidiaries
is that of the country in which the subsidiary is domiciled. A
significant proportion of the group’s revenues, expenses and
other liabilities are denominated in currencies other than the
danish Kroner, in particular us dollars. fluctuations in the value
of other currencies as compared with the danish Kroner could
result in translation losses or gains. the company has to a
significant extent hedged its net position in us dollars through
certain foreign exchange contracts.
Interest rate risk
since our primary financing is senior secured bonds at a
fixed interest rate, the interest rate risk has been substantially
reduced.
Credit risk
the group’s services are provided to a variety of contractual
counterparties and are therefore subject to the risk of non-
payment for services or non-reimbursement of costs. counter-
party credit risk is believed to be low because all of the group’s
customers are large corporations in the oil industry deemed
creditworthy. therefore, Management assesses that there are
no significant risks involved.
Liquidity risk
our ability to make payments on and to refinance our indebt-
edness, and to fund planned capital expenditures and other
strategic investments will depend on our ability to generate
cash in the future. this, to a certain extent, is subject to gen-
eral economic, financial, competitive, legislative, regulatory
and other factors that are beyond our control. We anticipate
that we will continue to make capital investments to develop
and purchase additional equipment to expand our services,
increase our capacity and replace existing equipment. our
MAnAgeMent coMMentARY /
Welltec® AnnuAl RepoRt 2011 17
capital investments require cash that we could otherwise ap-
ply to other business needs. however, if we do not incur these
expenditures while our competitors make substantial invest-
ments, our market share may decline and our business may be
adversely affected.
it is the group’s policy that capital raising and distribution of
cash are managed centrally by the group’s finance department
to the extent it is deemed appropriate. the group has the op-
tion of adjusting centrally the cash outflow in investments in in-
tangible assets and property, plant and equipment in denmark.
based on our current level of operations and anticipated cost
management and operating improvements, we believe our
expected cash flow from operations, available cash, proceeds
from bond issuance and other sources of available financing
will be adequate to meet our future liquidity.
uncertainty relating to recognition and measurement
the preparation of financial statements and related disclosures
in conformity with international financial Reporting standards
as adopted by the eu requires the group to make estimates
and assumptions that affect the reported amounts of assets
and liabilities, the disclosure of contingent assets and liabilities
and the reported amounts of revenue and expenses. the ac-
counting policies involved “critical accounting judgments and
key sources of estimation uncertainty” (see note 2), because
they are particularly dependent on estimates and assumptions
made by the group about matters that are inherently uncertain.
A summary of all the group’s significant accounting policies is
included in note 1 to the annual report.
the group bases its estimates on historical experience and on
various other assumptions that are believed to be reasonable
under the circumstances, the results of which form the basis for
making judgments about the carrying values of assets and lia-
bilities that are not readily apparent from other sources. Actual
results may be different from these estimates under different
assumptions or conditions.
unusual circumstances
there were no unusual circumstances in 2011 that affected the
annual report.
CORpORATE SOCIAl RESpOnSIBIlITy
the following statement of corporate social Responsibility
(csR) pursuant to the danish financial statements Act section
99a is part of the Management’s Review in the 2011 Annual
Report.
Corporate Social Responsibility policy
At Welltec®, we believe that we share a responsibility which
not only includes the interests of our stakeholders but also, due
to the nature of the business, extends beyond this in a greater
context.
this responsibility is defined in the various polices which have
been developed and implemented to comply with the objec-
tives of csR. the principles encompassed in the policies have
been developed and continue to be reviewed against and up-
dated by reference to relevant codes of corporate governance
and international standards including the united nations (un)
universal declaration of human Rights, the international labor
organization (ilo) declaration on fundamental principles and
Rights at Work, the guidelines for Multinational enterprises
established by the organization for economic cooperation and
We AnticipAte thAt We Will continue to MAKe cApitAl inVestMents to deVelop And puRchAse AdditionAl eQuipMent to eXpAnd ouR seRVices, incReAse ouR cApAcitY And ReplAce eXisting eQuipMent.
MAnAgeMent coMMentARY /
Welltec® AnnuAl RepoRt 2011 18
development (oecd), the Rio declaration on environment and
development, the un convention against corruption and ap-
plicable legislation governing the interest of our stakeholders.
the areas currently covered by our csR policies are:
• business ethics
• Anti-corruption
• health, safety and environment
• employment
• customers
the policies are approved by the board of directors; they have
been communicated to all employees and are posted on the
corporate intranet portal accessible to all employees. it is the
responsibility of each and every manager to ensure compliance
with the policies.
the chief executive officer has delegated the responsibility of
monitoring compliance to the following Vice presidents and
chiefs for their respective areas:
• legal
• human Resource
• Qhse (Quality, health, safety, environment)
• commercial
Key indicators and reports are monitored and appropriate au-
dits performed and followed up.
Business Ethics
Policy
Welltec® generally encourages, operates and enforces the fol-
lowing management principle: “At Welltec®, we say what we
do and we do what we say”. this general management princi-
ple facilitates certainty to all our stakeholders that predictability
and reliability are the norm when dealing with a Welltec® repre-
sentative. We consider this predictability and reliability as key
drivers in our approach to business ethics.
Implementation
our code of business ethics is embedded as an integral part of
our overall csR procedures, and is an underlying driver in all we
do.
procedurally, it is an integral part of our top management pro-
cedures on mission, vision and values, as well as the Welltec®
corporate social Responsibility policy – all of which is available
to all employees on the corporate intranet. below the primary
policies are presented
our employees and officers should conduct their business af-
fairs in such a manner that our reputation will not be damaged
if the details of their dealings should become a matter of public
discussion.
our conviction to uphold ethical standards in all our corporate
activities is a common mindset of all our employees. We strive
to do business with customers and suppliers of sound business
character and reputation and we do not knowingly support any
public or private organization, which supports discriminatory
policies or practices.
MAnAgeMent coMMentARY /
Welltec® AnnuAl RepoRt 2011 19
We expect all our employees to perform their work with hon-
esty, truthfulness and integrity, hereunder to respect and abide
by the guidelines expressed in this policy.
it is our policy to comply with all governmental laws, rules and
regulations applicable to our business.
All employees are responsible for the immediate and accurate
reporting to higher management of work-related information
of importance to this policy.
Key Results in 2011 and Future Plans
Maintaining high business ethical standards is part of the duty
for all employees in the company.
in 2011, there have been no major events caused solemnly by
an employee’s non-compliance with our business ethical code.
going forward in 2012, we will be continuously working on
keeping our high business ethical principles. As we see it busi-
ness of high principle
• generates greater drive and effectiveness because people
know that they can do the right thing decisively and with
confidence
• Attracts high-caliber people more easily, thereby gaining a
basic competitive and thereby profit edge.
• develops better and more profitable relations with cus-
tomers and suppliers, as well as with the general environ-
ment, such as the general society, competitors and other
stakeholders.
Anti-Corruption
Policy
Welltec® maintains a general screening program applicable for
agents, representatives and joint venture partners in territories
where transparency and corruption are imminent issues. this
screening program comprises of a questionnaire combined with
a review process under which a potential agent, representa-
tive and joint venture partner is screened for undue relation-
ships and channels of influence. further during such process,
a search up against applicable european and us lists of special
designated nationals will be done.
further, Welltec® operates a zero-tolerance policy towards cor-
ruptive behavior of employees and representatives. Any indica-
tion implying corruption will immediately trigger an internal
investigation led by the legal department and supplemented
by the hR department.
Implementation
in 2011 the new uK Anti-bribery Act became effective and this
required an examination of existing policies and compliance
with the new legislation in relation with Welltec®’s operations
in the uK.
in addition, Welltec® did in 2011 expand its partner screening
process, by the adaption and application of the methods from
common export control end user processes. to this extent,
Welltec®’s partner screening process now entails screening up
against the current lists of special designated nationals utilized
in export control end user screening.
Key Results in 2011 and Future Plans
As a result of this policy one ‘whistle-blowing’ incident was
recorded and duly acted upon. one incident was discovered
during internal control and acted upon.
two screenings took place. no agents were turned down. the
screening process has resulted in transparency with regard to
relationships as well as interests and hence an increased likeli-
hood of mitigating the risk of corruption.
RespeCtWe eXpect All ouR eMploYees to peRfoRM theiR WoRK With honestY, tRuthfulness And
integRitY, heReundeR to Respect And Abide bY the guidelines eXpRessed in this policY.
MAnAgeMent coMMentARY /
Welltec® AnnuAl RepoRt 2011 20
Welltec® will continue the improvement of the screening pro-
cedures, review processes and further incorporate additional
fcpA (foreign corrupt practices Act) based initiatives. further,
Welltec will continue to monitor initiatives and guidelines is-
sued by oecd and transparency international to identify poli-
cies and procedures that in the future will improve measures
against corruption.
in 2012 Welltec® will further develop and strengthen its efforts
within the consolidated compliance functions, which covers not
only csR related functions, but also trade and export control
compliance.
health, Safety and Environment
Policy
Welltec® generally promotes actions, attitudes and decisions
that facilitate maximum awareness towards potential health
and safety hazards thereby facilitating maximum alertness with
the objective to reduce and minimize the number of incidents.
Welltec® imposes certain duties upon employees and subcon-
tractors which require them to conform to any local statu-
tory or legal safety regulations in the location where we are
operating.
it is the intention of Welltec®, so far as is reasonably practica-
ble, to ensure that:
• the provision, commissioning and maintenance of plant and
systems of work are safe and without risks to health.
• Arrangements for use, handling, storage and transport of
articles and substances for use at work are safe and without
risks to health.
• Adequate information is available with respect to articles
and substances used at work detailing the conditions and
precautions necessary to ensure that when properly used
they will be safe and without risk to health.
• employees are provided with such information, instruction,
training and supervision as is necessary to secure their health
and safety.
• the maintenance of all plant, machinery and equipment
is safe not only to employees, and subcontractors and but
to any person who may be affected with regards to any by
premises or operations under our control.
• the working environment of all employees is safe and with-
out risks to health and adequate provisions are made with
regard to the facilities and arrangements for their welfare at
work.
• the risk of driving, which is assessed to be a potential safety
risk faced by our employees, is minimized.
it shall be the duty of all employees at work:
• to take reasonable steps for the health and safety of them-
selves and of other persons who may be affected by their
acts or omissions at work.
• to co-operate with the organization in regards to any duty
or requirement imposed on the employer or any other per-
son by or under any of the relevant statutory duties.
based on our mission, vision and values, Welltec® aspires to be
the leading global provider of well services to the oil- and gas
industry with focus on protection of the environment and the
surrounding society.
MAnAgeMent coMMentARY /
Welltec® AnnuAl RepoRt 2011 21
environmental preservation is regarded as being of paramount
importance. We integrate environmental aspects in all decisions
and actions, and we seek to plan and execute all activities in a
manner that lowers resource consumption and possible envi-
ronmental hazards.
Implementation
hse WAll - central board has been created with the most im-
port information in regards to hse.
hse intRoduction - All new hires attend an hse introduction
program where all hse policies, procedures and practices are a
part of the agenda. upon completion of the hse introduction,
employees read and sign an acknowledgement statement en-
suring that they have read and understand all Welltec govern-
ing procedures.
hse tRAining - health and safety training is an integral part of
all Welltec internal courses.
Qhse Meetings - At the bases – worldwide - health and safety
meetings as well as briefings are held monthly where all base
employees shall attend.
MAnAgeMent Meetings - As a result of the general ap-
proach, the weekly corporate management meetings are
opened with a review on any health and safety issues which
have occurred in the preceding week.
hse sYsteMs And pRogRAMs – for monitoring progress we
use incident Reporting system 3 (iRs3), safety card observa-
tion program (scop), health and safety statistics and Annual
internal Audits.
hse coMMittee - aims to influence Welltec business in a way
that best serves and inspires the working individual to achieve
the highest degree of safety and health practices through con-
tinuous improvement
hse officeRs / hse MAnAgeRs - All Welltec bases / locations
have a hse officer or an hse Manager employed. his/hers
main tasks is to lead the hse work at the base; ensuring that
all Welltec policies and procedures plus the local legislation is
implemented and followed
Key Results and Future plans
HSE Statistics
Welltec® is monitoring the hse performance by tracking the
Medical treatments (Mto), lost time incidents (lti), Restricted
Work cases (RWc), Vehicle accidents and fatalities (ftl). Also
the lost time incidents frequency, the total Recordable case
frequency and the Vehicle Accident frequency is also measured
and monitored. it is the hse officer / hse Manager´s responsi-
bility to ensure that the hse statistics are updated monthly. the
statistics are posted on the hse Wall and are also used during
the regional performance meetings.
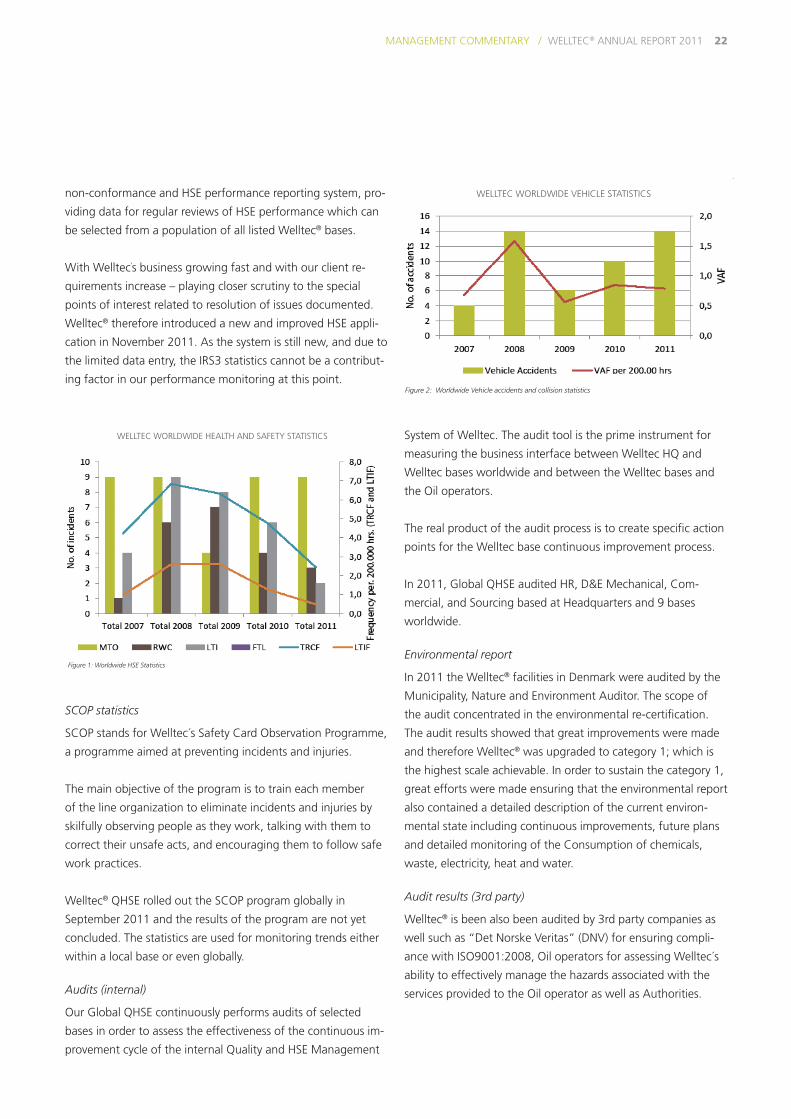
We can observe from the graphs below that the total of Mto,
lti, RWc has decreased in 2011 even though the amount of
working hours has increased from 1,010,798 to 1,123,393
hours. the Vehicle accidents / collisions have increased however
the amount of kilometers driven has increased dramatically
(from 2,371,756 to 3,067,145). note that none of the vehicle
accidents / collisions has resulted in personal injury.
With more than 5 years of experience, incident Report-
ing has been developed as a comprehensive and extensive
MAnAgeMent coMMentARY /
Welltec® AnnuAl RepoRt 2011 22
non-conformance and hse performance reporting system, pro-
viding data for regular reviews of hse performance which can
be selected from a population of all listed Welltec® bases.
With Welltec’s business growing fast and with our client re-
quirements increase – playing closer scrutiny to the special
points of interest related to resolution of issues documented.
Welltec® therefore introduced a new and improved hse appli-
cation in november 2011. As the system is still new, and due to
the limited data entry, the iRs3 statistics cannot be a contribut-
ing factor in our performance monitoring at this point.
SCOP statistics
scop stands for Welltec´s safety card observation programme,
a programme aimed at preventing incidents and injuries.
the main objective of the program is to train each member
of the line organization to eliminate incidents and injuries by
skilfully observing people as they work, talking with them to
correct their unsafe acts, and encouraging them to follow safe
work practices.
Welltec® Qhse rolled out the scop program globally in
september 2011 and the results of the program are not yet
concluded. the statistics are used for monitoring trends either
within a local base or even globally.
Audits (internal)
our global Qhse continuously performs audits of selected
bases in order to assess the effectiveness of the continuous im-
provement cycle of the internal Quality and hse Management
system of Welltec. the audit tool is the prime instrument for
measuring the business interface between Welltec hQ and
Welltec bases worldwide and between the Welltec bases and
the oil operators.
the real product of the audit process is to create specific action
points for the Welltec base continuous improvement process.
in 2011, global Qhse audited hR, d&e Mechanical, com-
mercial, and sourcing based at headquarters and 9 bases
worldwide.
Environmental report
in 2011 the Welltec® facilities in denmark were audited by the
Municipality, nature and environment Auditor. the scope of
the audit concentrated in the environmental re-certification.
the audit results showed that great improvements were made
and therefore Welltec® was upgraded to category 1; which is
the highest scale achievable. in order to sustain the category 1,
great efforts were made ensuring that the environmental report
also contained a detailed description of the current environ-
mental state including continuous improvements, future plans
and detailed monitoring of the consumption of chemicals,
waste, electricity, heat and water.
Audit results (3rd party)
Welltec® is been also been audited by 3rd party companies as
well such as “det norske Veritas” (dnV) for ensuring compli-
ance with iso9001:2008, oil operators for assessing Welltec´s
ability to effectively manage the hazards associated with the
services provided to the oil operator as well as Authorities.
Welltec WoRldWide heAlth And sAfetY stAtistics
Figure 1: Worldwide HSE Statistics
Welltec WoRldWide Vehicle stAtistics
Figure 2: Worldwide Vehicle accidents and collision statistics
MAnAgeMent coMMentARY /
Welltec® AnnuAl RepoRt 2011 23
As Welltec® holds an iso 9001:2008 certificate, surveillance
audits are performed by dnV on a yearly basis as well as re-
certification audits every 3 years.
in 2011; Welltec dK has been audited by dnV, Welltec Angola
has been audited by totAl, Welltec colombia by Ruc, Welltec
brazil by petrobras, Welltec canada by certification of Recong-
nition and Welltec Mexico by peMeX. All audits results showed
increasing improvement.
Safety culture survey
in June 2011, Welltec´s first safety culture survey was born
and launched in denmark, norway, us and canada. the pur-
pose of the audit was to identify trends within the same geog-
raphy (denmark and norway as well as us and canada) and
to get an idea of how the employees perceived safety within
Welltec®.
the results were very positive, for example 70% of the partici-
pants said that the hse incidents/investigations are handled
appropriately in Welltec®, 100% of the participants they have
no problem of stopping an unsafe job/task.
Employment
Policy
the employment policy at Welltec is based on the fundamen-
tal belief that the employee as an individual and as part of a
group constitutes the key asset. hence, and with due consider-
ation to the working field and conditions, measures which go
beyond the norm are practiced to safeguard and maximize the
health and safety aspects of the employees when performing
their duties.
Welltec® recognizes a shared responsibility on behalf of all em-
ployees to exercise the principles of mutual respect and dignity
in all working relationships and consequently enforces a policy
of zero tolerance with regard to harassment or discrimination.
Welltec practices the principle of equal employment opportuni-
ty without regard to race, religion, national origin, gender, age,
physical disability or political affiliation.
Implementation
We apply a principle of duality in recruitment processes and
also use objective profiling tools to assess candidates.
We regularly measure physical and psychological work climate
and we closely follow up on undesired results from the work
place surveys.
for long-term ill employees, we work closely and actively with
local authorities and community centers in order to define indi-
vidual solutions, including definition of flex jobs (permanently
reduced work time), temporarily reduced work time, redefini-
tion of work area, etc.
employees are covered by a collective health insurance as ap-
propriate in country of employment. Where applicable, insur-
ances include psychologist assistance in connection with stress
and accidents/traumas.
Key Results in 2011 and Future Plans
Key results for 2011 include in addition to the above men-
tioned areas:
• At least half a dozen long term ill employees have benefit-
ted from the individual solutions approach to their work
assignment.
MAnAgeMent coMMentARY /
Welltec® AnnuAl RepoRt 2011 24
• More than 100 employees have followed internal training
in the areas of field engineer courses, special equipment
courses, project Management courses, etc.
• compliance reviews in a number of the countries in which
we operate – this has led to improved compliance.
• Results of the 2011 Work place survey in denmark indicate
no big issues, and subsequent sector action plans primarily
address physical workplace improvements.
• Welltec will continue work to improve employee condi-
tions, and expect during 2012 to launch additional initia-
tives such as a new hR it system to support information
capture, update and reporting thus enabling better focusing
of resources and improved decision making and worldwide
processes for global performance appraisal, employee on-
boarding, etc.
Customers
Policy
Welltec perceives customers as business partners and pursues
an open and transparent partnership characterized by frequent
and relevant dialogue with focus on serving their interests.
it is the policy of Welltec to provide services and products that
excel in quality and at all times conform to best practices as ex-
ercised by industry, herein adherence to responsible standards
of performance with particular consideration to protect the
environment and the health and safety of all people involved.
in situations, where a customer or regulatory body wishes to
investigate a non-successful operation or an issue of regulatory
non-compliance a failure investigation is initiated to ensure:
• that investigations requested by the clients are performed.
• that conformed and controlled methods are followed when
handling misruns; covering from job planning, equipment,
procedures, communication to human factors.
• lessons learned are properly communicated throughout the
organization in order to minimize the risk of re-occurrence.
• A failure report is prepared on a timely manner for the cli-
ent, prior to officially closing the investigation.
All non-optimal or non-compliant findings from the internal
Welltec investigation are openly disclosed to the customer or
regulatory body in order to achieve maximum transparency and
optimal lessons learned, enabling hindrance of repetition of
any such issues.
Implementation
to ensure continuously improvement of service quality on jobs
performed a training program “job editor champions” were
launched, to ensure the data quality remains high during the
high growth we are currently facing.
Key Results in 2011 and Future Plans
As a result of the constant focus on service quality throughout
the organization and the new training program “job editor
champions” Welltec has had an increase in service quality from
2010 to 2011.
the focus to drive dialogue with customers has led to an
increased focus on meeting with our customers regularly. in
2011, we have registered more than 8300 meetings in our
cRM system, versus the 2890 meetings registered in 2010.
it is the policY of Welltec® to pRoVide seRVices And pRoducts thAt eXcel in QuAlitY
MAnAgeMent coMMentARY /
Welltec® AnnuAl RepoRt 2011 25
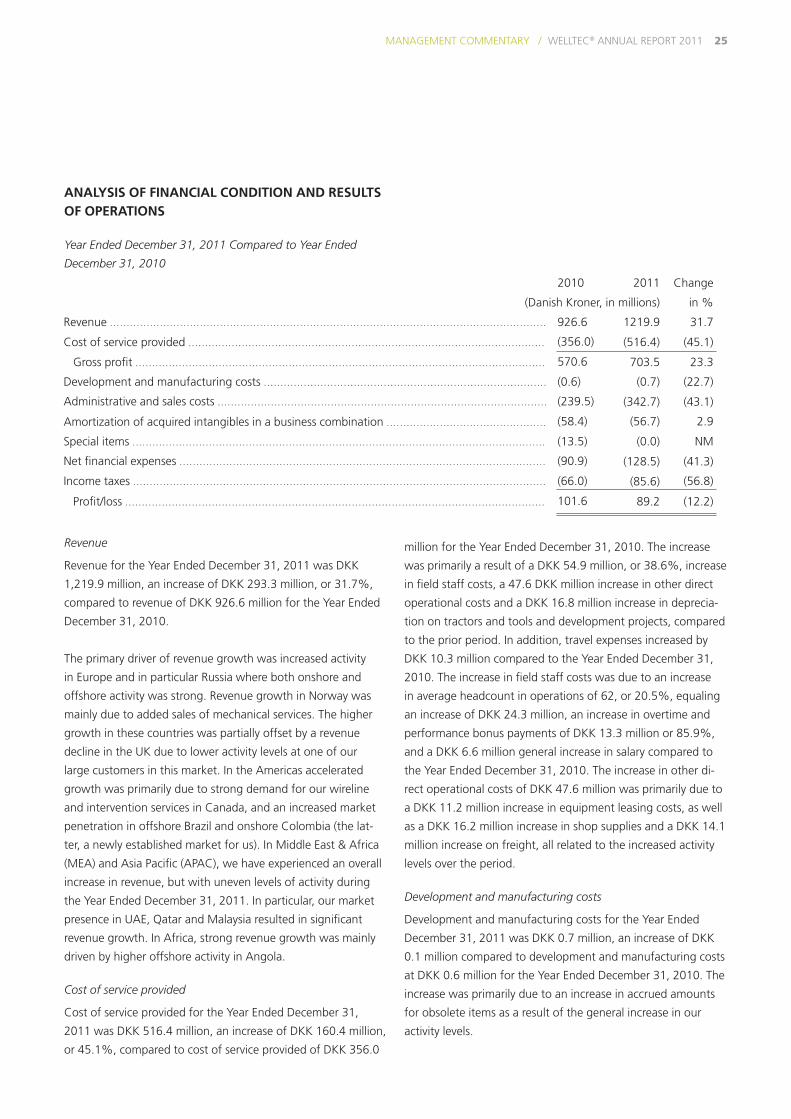
2010 2011 change
(danish Kroner, in millions) in %
Revenue ................................................................................................................................... 926.6 1219.9 31.7
cost of service provided ........................................................................................................... (356.0) (516.4) (45.1)
gross profit ........................................................................................................................... 570.6 703.5 23.3
development and manufacturing costs ..................................................................................... (0.6) (0.7) (22.7)
Administrative and sales costs ................................................................................................... (239.5) (342.7) (43.1)
Amortization of acquired intangibles in a business combination ................................................ (58.4) (56.7) 2.9
special items ............................................................................................................................ (13.5) (0.0) nM
net financial expenses .............................................................................................................. (90.9) (128.5) (41.3)
income taxes ............................................................................................................................ (66.0) (85.6) (56.8)
profit/loss .............................................................................................................................. 101.6 89.2 (12.2)
AnAlySIS Of fInAnCIAl COnDITIOn AnD RESulTS Of OpERATIOnS
Year Ended December 31, 2011 Compared to Year Ended
December 31, 2010
Revenue
Revenue for the Year ended december 31, 2011 was dKK
1,219.9 million, an increase of dKK 293.3 million, or 31.7%,
compared to revenue of dKK 926.6 million for the Year ended
december 31, 2010.
the primary driver of revenue growth was increased activity
in europe and in particular Russia where both onshore and
offshore activity was strong. Revenue growth in norway was
mainly due to added sales of mechanical services. the higher
growth in these countries was partially offset by a revenue
decline in the uK due to lower activity levels at one of our
large customers in this market. in the Americas accelerated
growth was primarily due to strong demand for our wireline
and intervention services in canada, and an increased market
penetration in offshore brazil and onshore colombia (the lat-
ter, a newly established market for us). in Middle east & Africa
(MeA) and Asia pacific (ApAc), we have experienced an overall
increase in revenue, but with uneven levels of activity during
the Year ended december 31, 2011. in particular, our market
presence in uAe, Qatar and Malaysia resulted in significant
revenue growth. in Africa, strong revenue growth was mainly
driven by higher offshore activity in Angola.
Cost of service provided
cost of service provided for the Year ended december 31,
2011 was dKK 516.4 million, an increase of dKK 160.4 million,
or 45.1%, compared to cost of service provided of dKK 356.0
million for the Year ended december 31, 2010. the increase
was primarily a result of a dKK 54.9 million, or 38.6%, increase
in field staff costs, a 47.6 dKK million increase in other direct
operational costs and a dKK 16.8 million increase in deprecia-
tion on tractors and tools and development projects, compared
to the prior period. in addition, travel expenses increased by
dKK 10.3 million compared to the Year ended december 31,
2010. the increase in field staff costs was due to an increase
in average headcount in operations of 62, or 20.5%, equaling
an increase of dKK 24.3 million, an increase in overtime and
performance bonus payments of dKK 13.3 million or 85.9%,
and a dKK 6.6 million general increase in salary compared to
the Year ended december 31, 2010. the increase in other di-
rect operational costs of dKK 47.6 million was primarily due to
a dKK 11.2 million increase in equipment leasing costs, as well
as a dKK 16.2 million increase in shop supplies and a dKK 14.1
million increase on freight, all related to the increased activity
levels over the period.
Development and manufacturing costs
development and manufacturing costs for the Year ended
december 31, 2011 was dKK 0.7 million, an increase of dKK
0.1 million compared to development and manufacturing costs
at dKK 0.6 million for the Year ended december 31, 2010. the
increase was primarily due to an increase in accrued amounts
for obsolete items as a result of the general increase in our
activity levels.
MAnAgeMent coMMentARY /
Welltec® AnnuAl RepoRt 2011 26
Administrative and sales costs
Administrative and sales costs for the Year ended december
31, 2011 were dKK 342.7 million, an increase of dKK 104.2
million, or 43.1%, compared to administrative and sales cost
of dKK 239.5 million for the Year ended december 31, 2010.
the increase in 2011 was primarily a result of an increase in
staff costs of dKK 70.4 million, or 58.7%, compared to the
prior period. the staff costs include issuance of warrants (non-
cash) to employees at a value of dKK 33.3 million. Adjusted
for issuance of warrants staff cost increased by dKK 37.3 mil-
lion or 31.1%. Average headcount in sales and administration
increased by 61, or 40.1%, in 2011 compared to Year ended
december 31, 2010. other administrative and sales costs in-
creased by dKK 33.8 million, or 38.1%, compared to the prior
period. the increase was primarily due to an increase in lease
costs for premises of dKK 10.4 million, in particular related to
our new facility in norway. travel costs increased by dKK 4.1
million, or 45.8%, primarily due to the overall increased activ-
ity. insurance costs increased by dKK 6.4 million primarily re-
lated to increased activities in Russia. other administrative and
sales costs for the Year ended december 31, 2011 increased by
dKK 12.9 million primarily due to increased activity levels.
Amortization of acquired intangibles in a business combination
there was no change in the amortization of acquired intangi-
bles in a business combination for the Year ended december
31, 2011 compared to the Year ended december 31, 2010.
Special items
special items for the Year ended december 31, 2011 were dKK
0.0 million, a decrease of dKK 13.5 million compared to dKK
13.5 million for the Year ended december 31, 2010. special
items in the year ended december 31, 2010 primarily related to
costs for third party advisors (such as auditors and lawyers) in
connection with a proposed capital markets transaction.
Net financial expenses
net financial expenses for the Year ended december 31, 2011
were dKK 126.8 million, an increase of dKK 35.9 million com-
pared to dKK 90.0 million for the Year ended december 31,
2010. interest expenses were dKK 66.7 million, an increase by
dKK 13.1 million over the prior period. other financial ex-
penses were dKK 21.5 million for the Year ended december
31, 2011, compared to dKK 5.7 million in the same period in
2010. the increase was primarily related to expensed redemp-
tion fees of dKK 13.6 million regarding refinancing of earlier
credit facilities.
Income taxes
income taxes for the Year ended december 31, 2011 were dKK
85.6 million, an increase of dKK 19.6 million, or 29.8%, com-
pared to income taxes of dKK 66.0 million for the Year ended
december 31, 2010. the increase was primarily due to a dKK
18.6 million tax provision.
MAnAgeMent coMMentARY /

Welltec® AnnuAl RepoRt 2011 27
finAnciAl stAteMent
FINANCIAL STATEMENT / WELLTEC® ANNUAL REPORT 2011 28
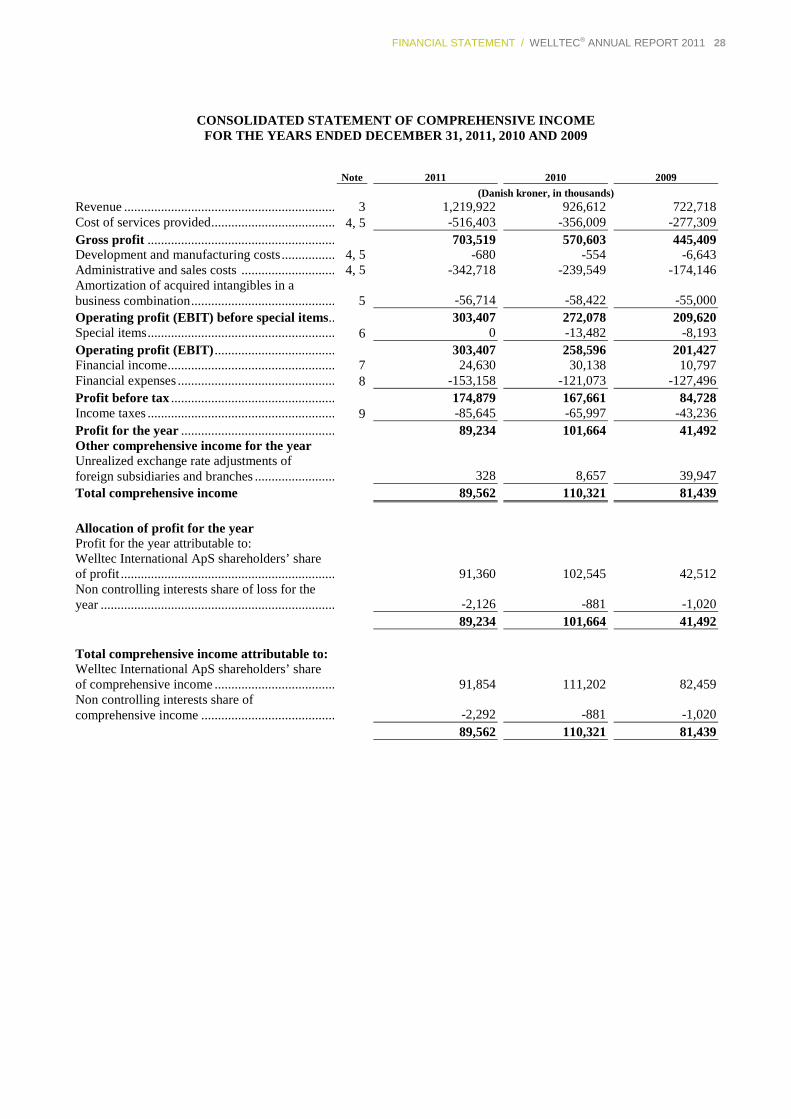
CONSOLIDATED STATEMENT OF COMPREHENSIVE INCOME FOR THE YEARS ENDED DECEMBER 31, 2011, 2010 AND 2009
Note
2011
2010
2009
(Danish kroner, in thousands) Revenue ............................................................... 3 1,219,922 926,612 722,718 Cost of services provided ..................................... 4, 5 -516,403 -356,009 -277,309 Gross profit ........................................................ 703,519 570,603 445,409 Development and manufacturing costs ................ 4, 5 -680 -554 -6,643 Administrative and sales costs ............................4, 5 -342,718 -239,549 -174,146 Amortization of acquired intangibles in a business combination ........................................... 5 -56,714 -58,422 -55,000 Operating profit (EBIT) before special items.. 303,407 272,078 209,620 Special items ........................................................ 6 0 -13,482 -8,193 Operating profit (EBIT) .................................... 303,407 258,596 201,427 Financial income .................................................. 7 24,630 30,138 10,797 Financial expenses ............................................... 8 -153,158 -121,073 -127,496 Profit before tax ................................................. 174,879 167,661 84,728 Income taxes ........................................................ 9 -85,645 -65,997 -43,236 Profit for the year .............................................. 89,234 101,664 41,492 Other comprehensive income for the year Unrealized exchange rate adjustments of foreign subsidiaries and branches ........................ 328 8,657 39,947 Total comprehensive income 89,562 110,321 81,439
Allocation of profit for the year Profit for the year attributable to: Welltec International ApS shareholders’ share of profit ................................................................ 91,360 102,545 42,512 Non controlling interests share of loss for the year ...................................................................... -2,126 -881 -1,020 89,234 101,664 41,492 Total comprehensive income attributable to: Welltec International ApS shareholders’ share of comprehensive income .................................... 91,854 111,202 82,459 Non controlling interests share of comprehensive income ........................................ -2,292 -881 -1,020 89,562 110,321 81,439
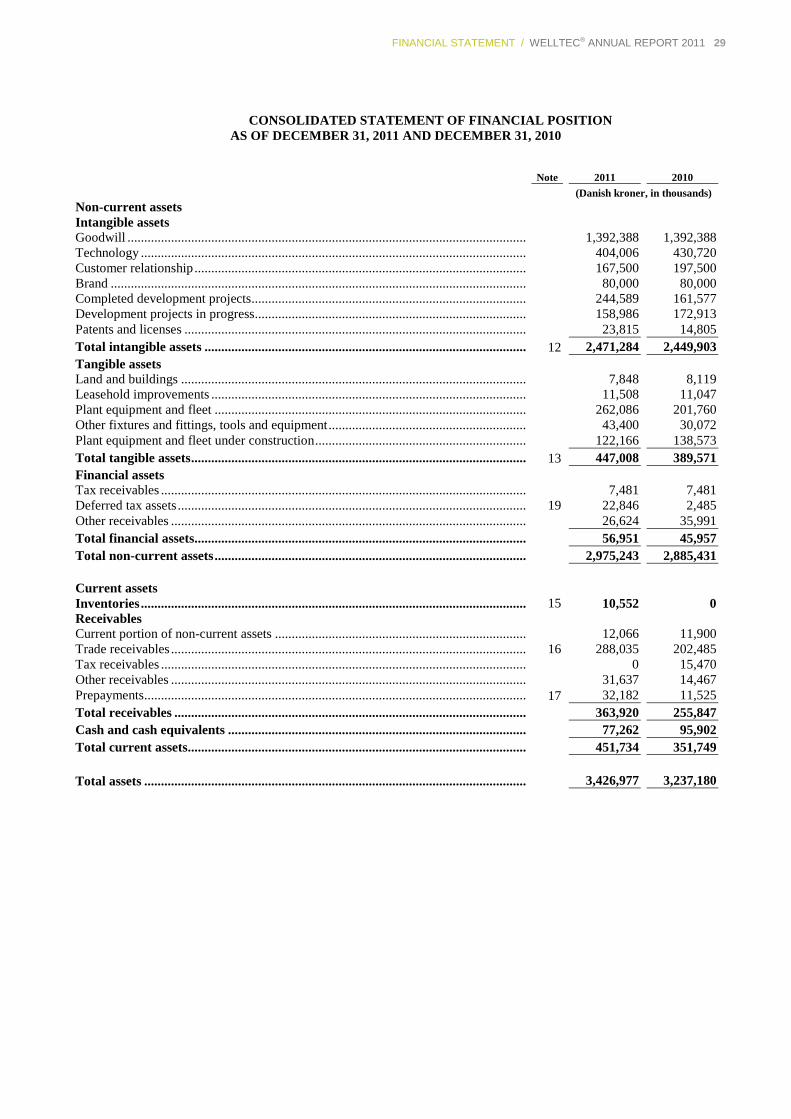
FINANCIAL STATEMENT / WELLTEC® ANNUAL REPORT 2011 29
CONSOLIDATED STATEMENT OF FINANCIAL POSITION AS OF DECEMBER 31, 2011 AND DECEMBER 31, 2010
Note
2011
2010
(Danish kroner, in thousands) Non-current assets Intangible assets Goodwill ....................................................................................................................... 1,392,388 1,392,388 Technology ................................................................................................................... 404,006 430,720 Customer relationship ................................................................................................... 167,500 197,500 Brand ............................................................................................................................ 80,000 80,000 Completed development projects .................................................................................. 244,589 161,577 Development projects in progress ................................................................................. 158,986 172,913 Patents and licenses ...................................................................................................... 23,815 14,805 Total intangible assets ................................................................................................ 12 2,471,284 2,449,903 Tangible assets Land and buildings ....................................................................................................... 7,848 8,119 Leasehold improvements .............................................................................................. 11,508 11,047 Plant equipment and fleet ............................................................................................. 262,086 201,760 Other fixtures and fittings, tools and equipment ........................................................... 43,400 30,072 Plant equipment and fleet under construction ............................................................... 122,166 138,573 Total tangible assets .................................................................................................... 13 447,008 389,571 Financial assets Tax receivables ............................................................................................................. 7,481 7,481 Deferred tax assets ........................................................................................................ 19 22,846 2,485 Other receivables .......................................................................................................... 26,624 35,991 Total financial assets ................................................................................................... 56,951 45,957 Total non-current assets ............................................................................................. 2,975,243 2,885,431 Current assets Inventories ................................................................................................................... 15 10,552 0 Receivables Current portion of non-current assets ........................................................................... 12,066 11,900 Trade receivables .......................................................................................................... 16 288,035 202,485 Tax receivables ............................................................................................................. 0 15,470 Other receivables .......................................................................................................... 31,637 14,467 Prepayments .................................................................................................................. 17 32,182 11,525 Total receivables ......................................................................................................... 363,920 255,847 Cash and cash equivalents ......................................................................................... 77,262 95,902 Total current assets..................................................................................................... 451,734 351,749 Total assets .................................................................................................................. 3,426,977 3,237,180
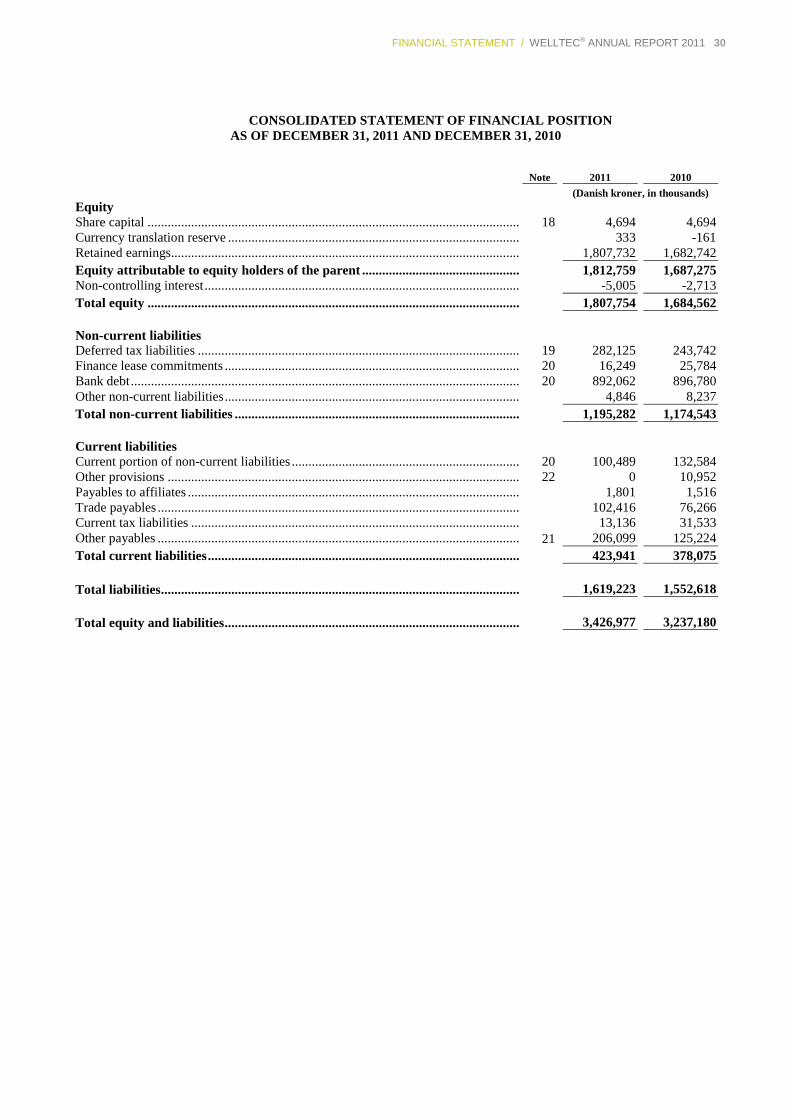
FINANCIAL STATEMENT / WELLTEC® ANNUAL REPORT 2011 30
CONSOLIDATED STATEMENT OF FINANCIAL POSITION AS OF DECEMBER 31, 2011 AND DECEMBER 31, 2010
Note
2011
2010
(Danish kroner, in thousands) Equity Share capital ............................................................................................................... 18 4,694 4,694 Currency translation reserve ....................................................................................... 333 -161 Retained earnings........................................................................................................ 1,807,732 1,682,742 Equity attributable to equity holders of the parent ............................................... 1,812,759 1,687,275 Non-controlling interest .............................................................................................. -5,005 -2,713 Total equity ............................................................................................................... 1,807,754 1,684,562 Non-current liabilities Deferred tax liabilities ................................................................................................ 19 282,125 243,742 Finance lease commitments ........................................................................................ 20 16,249 25,784 Bank debt .................................................................................................................... 20 892,062 896,780 Other non-current liabilities ........................................................................................ 4,846 8,237 Total non-current liabilities ..................................................................................... 1,195,282 1,174,543 Current liabilities Current portion of non-current liabilities .................................................................... 20 100,489 132,584 Other provisions ......................................................................................................... 22 0 10,952 Payables to affiliates ................................................................................................... 1,801 1,516 Trade payables ............................................................................................................ 102,416 76,266 Current tax liabilities .................................................................................................. 13,136 31,533 Other payables ............................................................................................................ 21 206,099 125,224 Total current liabilities ............................................................................................. 423,941 378,075 Total liabilities ........................................................................................................... 1,619,223 1,552,618 Total equity and liabilities ........................................................................................ 3,426,977 3,237,180
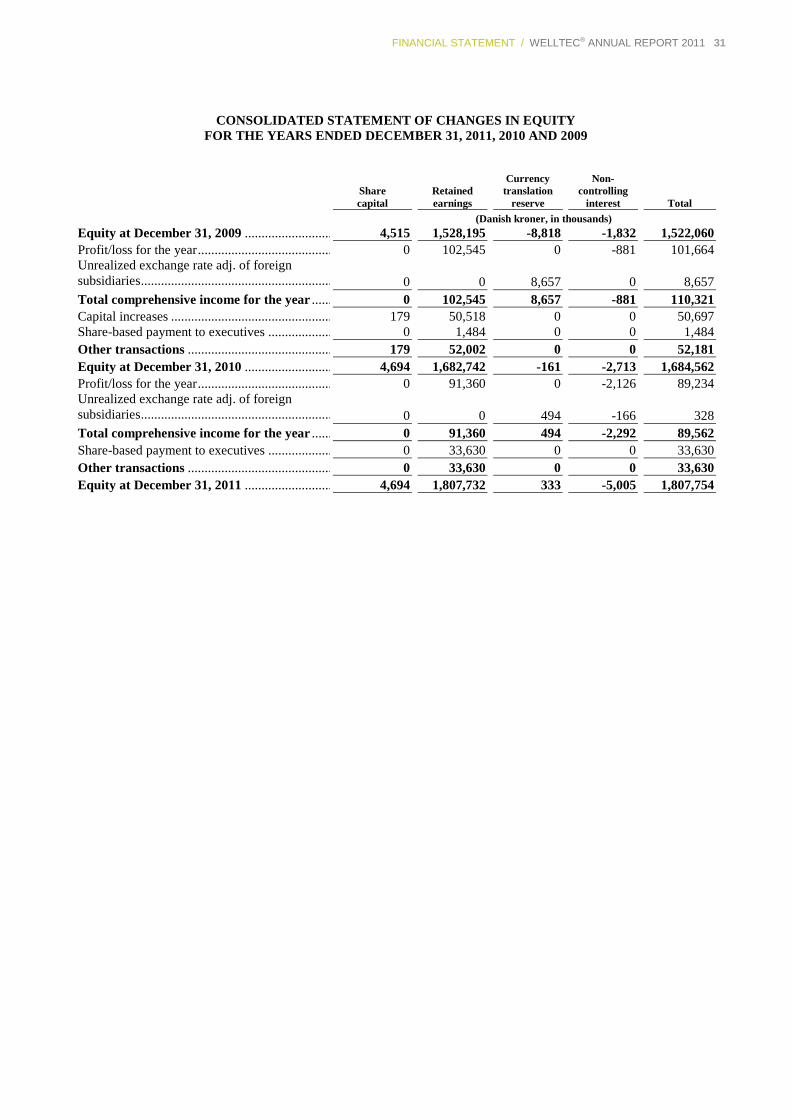
FINANCIAL STATEMENT / WELLTEC® ANNUAL REPORT 2011 31
CONSOLIDATED STATEMENT OF CHANGES IN EQUITY FOR THE YEARS ENDED DECEMBER 31, 2011, 2010 AND 2009
Share capital
Retained earnings
Currency
translation reserve
Non-
controlling interest
Total
(Danish kroner, in thousands) Equity at December 31, 2009 ................................ 4,515 1,528,195 -8,818 -1,832 1,522,060 Profit/loss for the year ........................................................ 0 102,545 0 -881 101,664 Unrealized exchange rate adj. of foreign subsidiaries ................................................................ 0 0
8,657 0 8,657
Total comprehensive income for the year ...................... 0 102,545 8,657 -881 110,321 Capital increases ................................................................179 50,518 0 0 50,697 Share-based payment to executives ................................ 0 1,484 0 0 1,484 Other transactions ...........................................................179 52,002 0 0 52,181 Equity at December 31, 2010 ................................ 4,694 1,682,742 -161 -2,713 1,684,562 Profit/loss for the year ........................................................ 0 91,360 0 -2,126 89,234 Unrealized exchange rate adj. of foreign subsidiaries ................................................................ 0 0
494 -166 328
Total comprehensive income for the year ...................... 0 91,360 494 -2,292 89,562 Share-based payment to executives ................................ 0 33,630 0 0 33,630 Other transactions ........................................................... 0 33,630 0 0 33,630 Equity at December 31, 2011 ................................ 4,694 1,807,732 333 -5,005 1,807,754
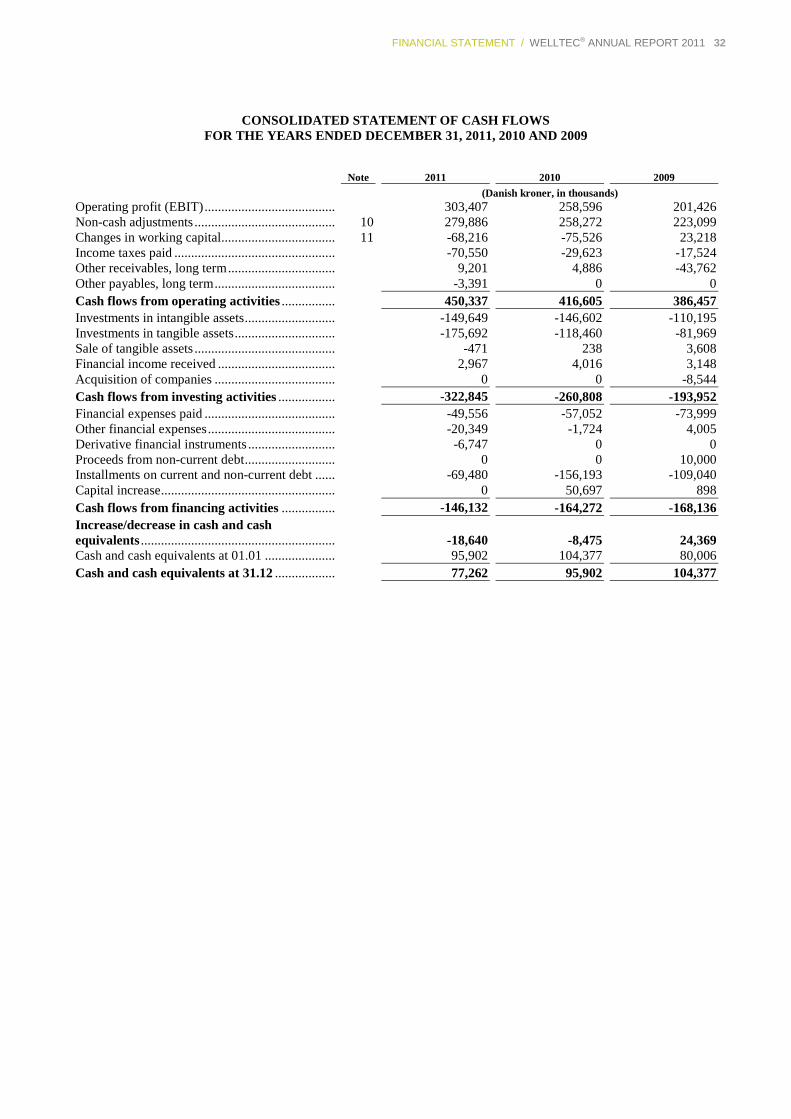
FINANCIAL STATEMENT / WELLTEC® ANNUAL REPORT 2011 32
CONSOLIDATED STATEMENT OF CASH FLOWS FOR THE YEARS ENDED DECEMBER 31, 2011, 2010 AND 2009
Note
2011
2010
2009
(Danish kroner, in thousands) Operating profit (EBIT) ....................................... 303,407 258,596 201,426 Non-cash adjustments .......................................... 10 279,886 258,272 223,099 Changes in working capital.................................. 11 -68,216 -75,526 23,218 Income taxes paid ................................................ -70,550 -29,623 -17,524 Other receivables, long term ................................ 9,201 4,886 -43,762 Other payables, long term .................................... -3,391 0 0 Cash flows from operating activities ................ 450,337 416,605 386,457 Investments in intangible assets ........................... -149,649 -146,602 -110,195 Investments in tangible assets .............................. -175,692 -118,460 -81,969 Sale of tangible assets .......................................... -471 238 3,608 Financial income received ................................... 2,967 4,016 3,148 Acquisition of companies .................................... 0 0 -8,544 Cash flows from investing activities ................. -322,845 -260,808 -193,952 Financial expenses paid ....................................... -49,556 -57,052 -73,999 Other financial expenses ...................................... -20,349 -1,724 4,005 Derivative financial instruments .......................... -6,747 0 0 Proceeds from non-current debt ........................... 0 0 10,000 Installments on current and non-current debt ...... -69,480 -156,193 -109,040 Capital increase .................................................... 0 50,697 898 Cash flows from financing activities ................ -146,132 -164,272 -168,136 Increase/decrease in cash and cash equivalents .......................................................... -18,640 -8,475 24,369 Cash and cash equivalents at 01.01 ..................... 95,902 104,377 80,006 Cash and cash equivalents at 31.12 .................. 77,262 95,902 104,377
NOTES / WELLTEC® ANNUAL REPORT 2011 33
TABLE OF CONTENTS NOTES
1. Accounting policies .......................................................................................................................................... 34 2. Critical accounting judgments and key sources of estimation uncertainty ....................................................... 42
Statement of comprehensive income 3. Revenue ............................................................................................................................................................ 43 4. Staff costs ......................................................................................................................................................... 44 5. Depreciation, amortization and impairment losses ........................................................................................... 47 6. Special items .................................................................................................................................................... 47 7. Financial income .............................................................................................................................................. 47 8. Financial expenses ............................................................................................................................................ 48 9. Income taxes ..................................................................................................................................................... 49
Statement of cash flows 10. Non-cash adjustments ....................................................................................................................................... 50 11. Changes in working capital .............................................................................................................................. 50 12. Intangible assets ............................................................................................................................................... 51 13. Tangible assets ................................................................................................................................................. 53 14. Investments in subsidiaries ............................................................................................................................... 54 15. Inventories ........................................................................................................................................................ 54 16. Trade receivables .............................................................................................................................................. 55 17. Prepayments ..................................................................................................................................................... 55 18. Share capital ..................................................................................................................................................... 56 19. Deferred tax assets and liabilities ..................................................................................................................... 56 20. Current and non-current financial liabilities ..................................................................................................... 57 21. Other payables .................................................................................................................................................. 59 22. Other provisions ............................................................................................................................................... 59 Other 23. Fees to auditor appointed at the Annual General Meeting ............................................................................... 59 24. Assets charged and contingent liabilities .......................................................................................................... 59 25. Operating lease commitments .......................................................................................................................... 60 26. Financial instruments ....................................................................................................................................... 60 27. Related parties .................................................................................................................................................. 63 28. Events after the balance sheet date ................................................................................................................... 64
NOTES / WELLTEC® ANNUAL REPORT 2011 34
NOTES TO CONSOLIDATED ANNUAL FINANCIAL STATEMENTS
1. Accounting policies
Basis of accounting
The consolidated financial statements for 2011 are presented in accordance with International Financial Reporting Standards (“IFRS”) as adopted by the EU and additional Danish disclosure requirements for annual reports of reporting class C (large) enterprises. Please see the Danish Executive Order on IFRS adoption issued in accordance with the Danish Financial Statements Act.
The consolidated financial statements are presented in thousands of Danish kroner (DKK), which is regarded as the primary currency in relation to the Group’s activities and the functional currency of the parent company.
The consolidated financial statements have been prepared on the historical cost basis, except for certain derivative financial instruments which are measured at fair value. The principal accounting policies adopted are set out below.
The consolidated financial statements are presented in accordance with the new and revised standards (IFRS/IAS) and Interpretations (IFRIC) which apply for the financial year. This has not resulted in any changes in accounting policies that have affected recognition and measurement in the current or previous years.
Implementation of new and amended standards and interpretations
Welltec has implemented the amendments to IAS 24 Related Party Disclosures.
Future IFRS changes
At the date of the publication of these consolidated financial statements, a number of new and amended standards and interpretations have not yet entered into force or have not yet been adopted by the EU. Therefore, they are not incorporated in the consolidated financial statements.
None of the new standards or amendments of existing standards are expected to have a material impact on future consolidated financial statements.
Change in presentation
The Group has changed the presentation of the comparative figures of 2009 in the statement of comprehensive income. DKK 4,000k is moved from administrative costs to special items. As this change only consists of split of items which does not otherwise affect the statement of comprehensive income, it is not assessed to be a reclassification adjustment under IAS1.
The presentation in the consolidated statement of cash flows has changed compared to earlier years. Addition to tangible finance lease assets is no longer included in the cash flows from investing activities and addition to finance lease debt is no longer presented in cash flows from financing activities. This changed presentation has the following affect on comparative figures:
Cash flows from investing activities has been reduced by DKK 6,614k in 2010 and DKK 6,475k in 2009. Equally cash flows from financing activites have been increased.
NOTES / WELLTEC® ANNUAL REPORT 2011 35
Recognition and measurement
Assets are recognized in the statement of financial position if it is probable that future financial benefits will flow to the Group and the value of the asset can be measured reliably.
Liabilities are recognized in the statement of financial position if they are probable and can be measured reliably. On initial recognition assets and liabilities are measured at cost or fair value. Subsequently assets and liabilities are measured as described for each item bellow.
Income is recognized in the statement of comprehensive income as earned and includes value adjustments of financial assets and liabilities measured at fair value or amortized cost.
Consolidated financial statements
The consolidated financial statements comprise the parent company and the group enterprises (subsidiaries) that are controlled by the parent company, see Group chart. Control is achieved where the parent company, either directly or indirectly, holds more than 50% of the voting rights or in any other way possibly or actually exercises controlling influence over a subsidiary. If the parent company holds less than 50% of the share capital, control exists when the parent company under agreement has more than 50% of the voting rights, has the power to govern financial and operating policies of the subsidiary, to appoint members of the Board of Directors or to cast the majority of votes at meetings of the Board of Directors of the subsidiary.
Basis of consolidation
The consolidated financial statements are prepared on the basis of the financial statements of the parent company and its subsidiaries, which are all prepared in accordance with the Group’s accounting policies. Upon consolidation, intra-group income and expenses, balances, investments and dividends as well as profits and losses on transactions between the consolidated enterprises are eliminated.
Subsidiaries’ financial statement items are recognized in full in the consolidated financial statements. Non controlling interests’ pro rata share of profit/loss and equity is shown as separate line items in the statement of comprehensive income and in the Group’s equity, respectively.
Business combinations
Newly acquired or newly established enterprises are recognized in the consolidated financial statements from the date of acquisition. The date of acquisition is when the parent company obtains control of the company. Divested or wound-up enterprises are recognized in profit or loss up to the time of their divestment or winding-up.
The purchase method is applied to the acquisition of new enterprises. According to this method, identifiable assets, including separable intangible assets, liabilities and contingent liabilities of acquired enterprises are measured at fair value at the acquisition date. Non-current assets acquired for the purpose of resale, however, are measured at fair value less anticipated selling costs. Restructuring costs are only recognized in the pre-acquisition statement of financial position if they constitute a liability for the acquired enterprise. If there is a tax effect, a corresponding asset or liability is booked. If the final determination of the consideration is conditional upon one or several future events, the value thereof will be recognized at fair value at the date of acquisition. Changes to contingent considerations are recognized in the profit or loss. Costs directly attributable to the business combination are recognized in the profit or loss.
Positive differences (goodwill) between cost of the enterprise acquired and the fair value of the assets, liabilities and contingent liabilities acquired are recognized as an asset under intangible assets and are tested for impairment at least once a year. If the carrying amount of goodwill is higher than its recoverable amount, it is written down to this lower recoverable amount.
Foreign currency translation
On initial recognition, transactions denominated in foreign currencies are translated at the transaction date exchange rate. Receivables, payables and other monetary items denominated in foreign currencies that have not been settled at the
NOTES / WELLTEC® ANNUAL REPORT 2011 36
end of the reporting period are translated using the exchange rate at the end of the reporting period. Exchange differences that arise between the rate at the transaction date and the exchange rate effective at the payment date or the exchange rate at the end of the reporting period are recognized in statement of comprehensive income as financial income or financial expenses. Property, plant equipment fleet, intangible assets, inventories and other non-monetary assets purchased in foreign currencies and measured on the basis of historical cost are translated at the transaction date exchange rate. If non-monetary items are restated at fair value, they are translated using the exchange rate at the date of restatement.
When foreign subsidiaries that use a functional currency different from DKK are recognized in the consolidated financial statements, the statement of comprehensive income is translated at average exchange rates on a monthly basis unless such rates vary significantly from the actual exchange rates at the transaction dates. In the latter case, the actual exchange rates are used. Statement of financial position items is translated using the exchange rates at the end of the reporting period. Goodwill is considered to belong to the relevant entity acquired and is translated using the exchange rate at the end of the reporting period.
Exchange differences resulting from the translation of foreign entities’ equity at the beginning of the year using the end of the reporting period exchange rates and by translating statements of comprehensive income from average exchange rates to the exchange rates at the end of the reporting period are recognized in other comprehensive income. Similarly, exchange differences resulting from changes made in a foreign entity’s other comprehensive income are also taken to other comprehensive income.
Exchange adjustments on receivables from, or payables to, subsidiaries that are considered part of the parent company’s total investment in the subsidiary in question, are also recognized in other comprehensive income.
When foreign subsidiaries that use DKK as their functional currency but present their financial statements in another currency are recognized in the consolidated financial statements, monetary assets and liabilities are translated using the end of the reporting period exchange rate. Non-monetary assets and liabilities measured on the basis of historical cost are translated using the transaction date exchange rate. Non-monetary items measured at fair value are translated at the exchange rate at the time of the last fair value adjustment.
The items in profit or loss are translated at average exchange rates on a monthly basis, with the exception of items deriving from non-monetary assets and liabilities, which are translated using the historical rates applicable to the relevant non-monetary assets and liabilities.
Derivative financial instruments
On initial recognition, derivative financial instruments are measured at fair value. Directly attributable expenses related to the purchase or issue of a derivative financial instrument are expensed.
Subsequent to initial recognition, derivative financial instruments are measured at fair value at the end of the reporting period.
For derivative financial instruments that do not qualify as hedging instruments, changes in fair value are recognized currently in profit or loss as financial income or financial expenses.
The Group does not apply hedge accounting to its derivatives financial instruments.
Share-based payment
Share-based incentive arrangements under which employees can only opt to receive new shares in Welltec International ApS (equity arrangements) are measured at the equity instruments’ fair value at the grant date and are recognized in profit or loss under staff costs over the vesting period. The related set-off entry is recognized in equity.
Income taxes
Tax for the year consists of current tax for the year and changes in deferred tax. The portion of tax that is attributable to profit is recognized in the income statement, and the portion of tax that is attributable to entries directly in other
NOTES / WELLTEC® ANNUAL REPORT 2011 37
comprehensive income is recognized in other comprehensive income. The portion of tax that is attributable to equity transactions is recognized in equity.
Exchange adjustments on deferred tax are recognized as part of the year’s adjustment in deferred tax.
The current tax payable or receivable is recognized in the statement of financial position, stated as tax calculated on this year’s taxable income, adjusted for prepaid tax.
When calculating the current tax for the year, the tax rates and rules in effect at the end of the reporting period are applied.
Deferred tax is recognized on all temporary differences between carrying values and tax-based values of assets and liabilities, apart from deferred tax on all temporary differences occurring on initial recognition of goodwill or on initial recognition of a transaction that is not a business combination, and for which the temporary difference found at the time of initial recognition neither affects profit nor loss for the year nor taxable income.
Deferred tax is recognized on all temporary differences related to investments in subsidiaries, unless the parent company is able to control when the deferred tax is realized, and it is probable that the deferred tax will not crystallize as current tax in the foreseeable future.
Deferred tax is calculated based on the expected use of each asset and the settlement of each liability, respectively.
Deferred tax is measured by using the tax rates and tax rules in the relevant countries which are based on acts in force or acts in force in reality at the end of the reporting period, which are expected to apply when the deferred tax is expected to crystallize as current tax. Changes in deferred tax resulting from changed tax rates or tax rules are recognized in profit or loss, unless the deferred tax is attributable to items previously recognized in other comprehensive income or in equity. If so, such changes are also recognized in other comprehensive income or in equity.
Deferred tax assets, including the tax base of tax loss carryforwards, are recognized in the statement of financial position at their estimated realizable value, either as a set-off against deferred tax liabilities or as net tax assets for set-off against future positive taxable income. At the end of each reporting period, it is reassessed whether sufficient taxable income is probable to arise in the future for the deferred tax asset to be used.
The parent company is jointly taxed with all Danish subsidiaries. The current Danish income tax is allocated among the jointly taxed Danish companies proportionally to their taxable income.
Statement of comprehensive income
Revenue
The Group provides multiple services to oil and gas companies around the world at their onshore and offshore locations using proprietary remote-control precision robotic equipment that Welltec® designs and manufactures.
Provision of services is recognized in revenue when the work is performed or when the agreed service is provided.
Revenue is measured at fair value of the consideration received or receivable. If an interest-free credit has been arranged for payment of the consideration receivable that is longer than the usual credit period, the fair value of the consideration is determined by discounting future payments receivable. The difference between fair value and nominal amount of the consideration is recognized as financial income in profit or loss by applying the effective interest method.
Revenue is calculated net of VAT, duties, etc. collected on behalf of a third party.
In addition, income from the sale of development projects is considered part of the Group’s activities and therefore is recognized as revenue.
NOTES / WELLTEC® ANNUAL REPORT 2011 38
Cost of services provided
Cost of services provided comprises direct and indirect expenses incurred to realize revenue including salaries, depreciation and amortization.
Development and manufacturing costs
Development and manufacturing costs comprise all development and engineering costs that are not capitalized.
Administrative and sales costs
Administrative and sales costs comprise costs required to sustain the business including finance, IT, legal, HR and other overhead.
Special items
Special items consist of costs of a special nature in relation to the activities of the Group, including costs of extensive structural changes and other significant amounts of a one-off nature. These items are shown separately to facilitate the comparability of the profit or loss and provide a better picture of the operational results.
Financial income and expenses
These items comprise interest income and expenses, the interest portion of finance lease payments, realized and unrealized capital gains and losses on securities, payables and transactions in foreign currencies, amortization premium/allowance on mortgage debt, etc. as well as tax interest.
Statement of financial position
Intangible assets
Goodwill
Upon initial recognition, goodwill is recognized in the statement of financial position and measured as the difference between cost of the enterprise acquired and the fair value of the assets, liabilities and contingent liabilities acquired.
When goodwill is recognized, the goodwill amount is distributed on those of the Group’s activities generating separate payments (cash-generating units). Determination of cash-generating units follows the management structure and internal finance management and reporting of the Group.
Subsequently, goodwill is measured at cost less accumulated write-downs. There is no amortization of goodwill but the carrying value of goodwill is tested for impairment at least once a year together with the other long-term assets in the cash-generating unit to which the goodwill is allocated. It is written down to recoverable amount in profit or loss if the accounting value exceeds the recoverable amount, this representing the higher of the fair value of the asset less expected disposal costs and the value in use. The recoverable amount is generally determined as the present value of the expected future net cash flows from the cash-generating unit to which the goodwill is allocated. Impairment losses of goodwill are stated in profit or loss under amortization and impairment losses of intangible assets.
Development projects and other intangible assets
Development projects on clearly defined and identifiable service equipment and processes are recognized as intangible assets if it is probable that the service equipment or process will generate future financial benefits for the Group, and the development costs of each asset can be measured reliably. Other development costs are recognized as costs in the profit or loss as incurred.
On initial recognition, development costs are measured at cost. The cost of development projects comprises costs such as salaries, amortization/depreciation and other indirect costs that are directly attributable to the development projects
NOTES / WELLTEC® ANNUAL REPORT 2011 39
(e.g. field tests) and are needed to complete the project, calculated from the time at which the development project first meets the specific criteria for being recognized as an asset.
Completed development projects are amortized on a straight-line basis using the estimated useful lives of the assets. The amortization period is usually 5 years, but in certain cases it may be up to 20 years if the longer amortization period is considered to better reflect the Group’s benefit from the developed product, etc. For development projects protected by intellectual property rights, the maximum amortization period is the remaining duration of the relevant rights, however, no more than 20 years.
Development projects and other intangible assets are written down to any lower recoverable amount. Development projects in progress are tested at least once a year for impairment. Borrowing costs to finance the investments in development projects are recognized in cost of these assets if such expenses relate to qualifying assets for which their development period last longer than 12 months. Other borrowing costs are taken to finance expenses in the statement of comprehensive income.
Other intangible assets
Acquired intellectual property rights in the form of patents and licenses are measured at cost less accumulated amortization and impairment losses. Patents are amortized over their remaining duration, usually 5 years, and licenses are amortized over the term of the agreement. If the actual useful life is shorter than the remaining duration and the term of the agreement, respectively, amortization is made over such shorter useful life.
Separable intangible assets acquired through business combinations are brand, customer relationship and technology. Brand is not amortized as the useful life is considered indefinite. Customer relationship is amortized on a straight-line basis over its estimated useful life of 10 years. Technology is amortized on a straight-line basis over its estimated useful life of 10 to 20 years.
Tangible assets
Land and buildings, plant and machinery as well as other fixtures and fittings, tools and equipment are measured at cost less accumulated depreciation and impairment losses. Land is not depreciated.
Cost comprises the acquisition price, costs directly attributable to the acquisition and preparation costs of the asset until the time when it is ready to be put into operation. For assets manufactured and owned by the Group, cost comprises expenses directly attributable to the manufacture of the asset, including materials, components, sub-suppliers and labor costs. In the year when the tool is completed and ready to generate income for the company, it is recognized under “Plant equipment and fleet.” During construction, the asset is recognized under “Plant equipment and fleet under construction.”
Interest expenses on loans to finance the investments in tangible assets are recognized in cost of these assets if such expenses relate to qualifying assets for which their production period lasts longer than 12 months. Other borrowing costs are taken to finance expenses in the statement of comprehensive income.
For assets held under finance leases, cost is measured as the lower of the asset’s fair value or present value of future lease payments.
The basis of depreciation is cost less estimated residual value after the end of useful life. The residual value is the estimated amount that would be earned if selling the asset today net of selling costs if the asset is of an age and a condition that is expected after the end of useful life Straight-line depreciation is made on the basis of the following estimated useful lives of the assets:
Buildings: 50 years Leasehold improvements: 3-10 years Plant equipment and fleet: 3-10 years Other fixtures and fittings, tools and equipment: 3-5 years
Depreciation methods, useful lives and residual amounts are reassessed annually.
NOTES / WELLTEC® ANNUAL REPORT 2011 40
Property, plant equipment and fleet are written down to the lower of recoverable amount and carrying amount.
Impairment of property, plant equipment and fleet and intangible assets
The carrying amounts of property, plant equipment and fleet and intangible assets with definite useful lives are tested at the end of the reporting period for any indication of impairment. If impaired, the recoverable amount of the asset is estimated to determine the need for any write-down and the extent thereof.
The recoverable amount of intangible assets with indefinite useful lives, development projects in progress, brand and goodwill is estimated annually irrespective of any recorded indications of impairment.
If the asset does not generate cash flows separately from other assets, an estimate is made of the recoverable amount of the smallest cash-generating unit of which the asset forms part.
The recoverable amount is calculated as the higher of the asset’s and the cash-generating unit’s fair value less selling costs and net present value. When the net present value is determined, estimated future cash flows are discounted at present value using a discount rate that reflects current market estimates of the value of money in terms of time, as well as the particular risks related to the asset and the cash-generating unit, respectively, and for which no adjustment is made in the estimated future cash flows.
If the recoverable amount of the asset or the cash-generating unit is estimated to be lower than the carrying amount, the carrying amount is written down to this lower recoverable amount. For cash-generating units, write-down is distributed in such a way that goodwill amounts are written down first and then any remaining need for write-down is distributed on the other assets of the unit, however, the individual asset is not written down to an amount that is lower than its fair value net of estimated selling costs.
Impairment losses are recognized in the profit or loss. In case of any subsequent reversals of impairment losses resulting from change in assumptions of the estimated recoverable value, the carrying values of the asset and the cash-generating unit, respectively, are increased to the adjusted estimate of the recoverable value, however, no more than the carrying value which the asset or the cash-generating unit would have had if the write-down had not been performed. Impairment losses of goodwill are not reversed.
Profits or losses from the sale of property, plant equipment and fleet are calculated as the difference between selling price less selling costs and carrying value at the time of sale. Profits or losses are recognized in the statement of comprehensive income if the selling price differs from the carrying amount.
Financial assets
Other receivables
Other receivables with a fixed maturity are measured at amortized cost, less any impairment.
Current assets
Trade receivables
On initial recognition, trade receivables are measured at fair value and subsequently at amortized cost, which usually equals nominal amount less bad debt provisions.
Prepayments
Prepayments comprise incurred costs relating to subsequent financial years. Prepayments are measured at cost.
Other financial assets and liabilities
Financial assets measured at fair value are classified as belonging to levels 1-3 depending on the pricing method applied. The value of financial assets belonging to level 1 is determined on the basis of quoted prices in an active
NOTES / WELLTEC® ANNUAL REPORT 2011 41
market. For level 2, the value is determined on the basis of other observable inputs from the market, and for level 3 on the basis of an assessment of the asset value less a liquidity premium.
Liabilities
Other provisions
Other provisions are recognized when the Group has a legal or constructive obligation as a result of past events in the financial year or prior years, and it is probable that settlement of such obligation will lead to an outflow of the company’s financial resources.
Lease commitments
Lease commitments relating to assets held under finance leases are recognized in the statement of financial position as liabilities other than provisions, and, at the time of inception of the lease, measured at the lower of the lease asset’s fair value and the present value of future lease payments. Subsequent to initial recognition, lease commitments are measured at amortized cost. The difference between the present value and nominal amount of the lease payments is recognized in profit or loss as a financial expense over the term of the leases.
Lease payments on operating leases are recognized on a straight-line basis in profit or loss over the term of the lease.
Other financial liabilities
On initial recognition, other liabilities, including bank loans and trade payables, are measured at fair value. Subsequently, these liabilities are measured at amortized cost applying the effective interest method to the effect that the difference between proceeds and nominal amount is recognized in profit or loss as a financial expense over the term of the loan.
Pension obligations
The Group has entered into pension agreements with certain groups of employees, which are classified as defined contribution pension plans.
Periodical payments to defined contribution pension plans are recognized in profit or loss at the due date, and any contributions payable are recognized in the statement of financial position under liabilities.
Statement of cash flows
The Group’s statement of cash flows is presented using the indirect method and shows cash flows from operating, investing and financing activities as well as the Group’s cash and cash equivalents at the beginning and end of the financial year.
Cash flows from operating activities are calculated as EBIT adjusted for non-cash operating items, working capital changes and income taxes paid.
Cash flows from investing activities comprise payments in connection with the acquisition and divestment of enterprises, tangible fixed asset investments, and purchase, development, improvement and sale, etc. of intangible assets, and property, plant equipment and fleet.
If any, cash flows from acquired and divested enterprises are shown as separate line items within cash flows from investing activities. Cash flows related to acquired enterprises are recognized in the statement of cash flow from their date of acquisition, and cash flows from divested enterprises are recognized up to the date of sale.
Cash flows from financing activities comprise financial expenses paid and changes in the size or composition of the parent company’s share capital and related costs, the raising of loans, installments on interest-bearing debt, purchase of treasury shares, and payment of dividends.
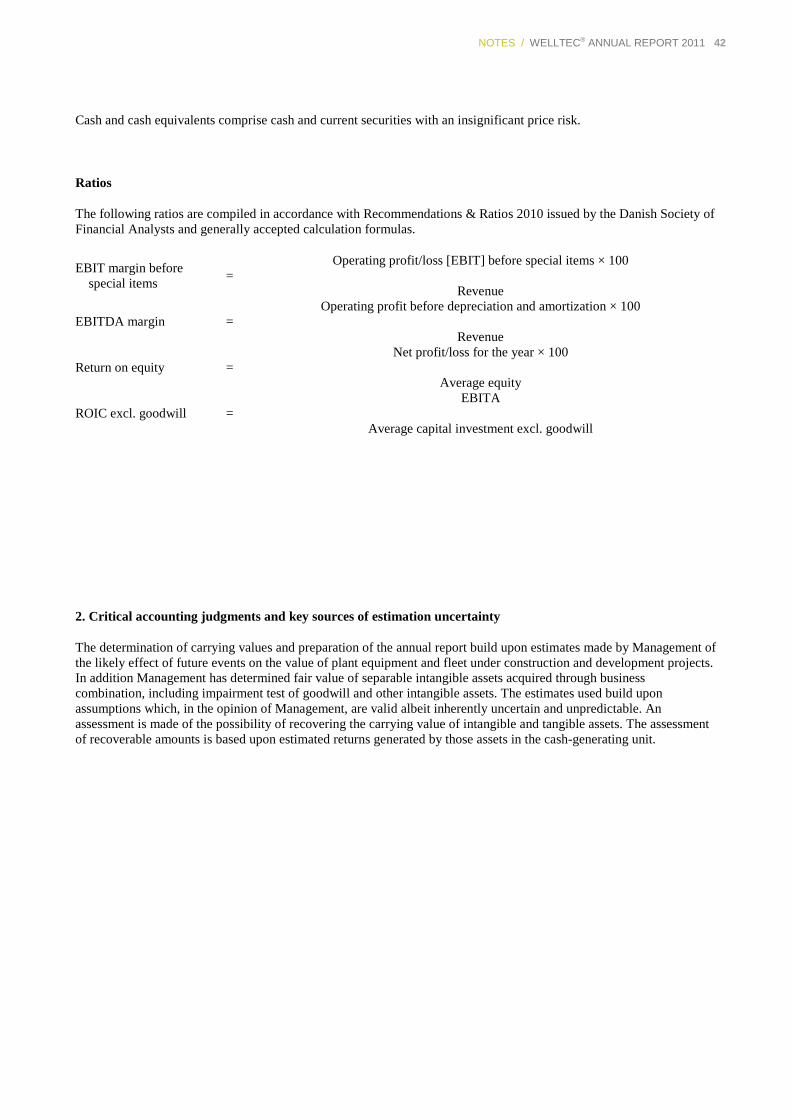
NOTES / WELLTEC® ANNUAL REPORT 2011 42
Cash and cash equivalents comprise cash and current securities with an insignificant price risk.
Ratios
The following ratios are compiled in accordance with Recommendations & Ratios 2010 issued by the Danish Society of Financial Analysts and generally accepted calculation formulas.
EBIT margin before special items
= Operating profit/loss [EBIT] before special items × 100
Revenue
EBITDA margin = Operating profit before depreciation and amortization × 100
Revenue
Return on equity = Net profit/loss for the year × 100
Average equity
ROIC excl. goodwill = EBITA
Average capital investment excl. goodwill
2. Critical accounting judgments and key sources of estimation uncertainty
The determination of carrying values and preparation of the annual report build upon estimates made by Management of the likely effect of future events on the value of plant equipment and fleet under construction and development projects. In addition Management has determined fair value of separable intangible assets acquired through business combination, including impairment test of goodwill and other intangible assets. The estimates used build upon assumptions which, in the opinion of Management, are valid albeit inherently uncertain and unpredictable. An assessment is made of the possibility of recovering the carrying value of intangible and tangible assets. The assessment of recoverable amounts is based upon estimated returns generated by those assets in the cash-generating unit.
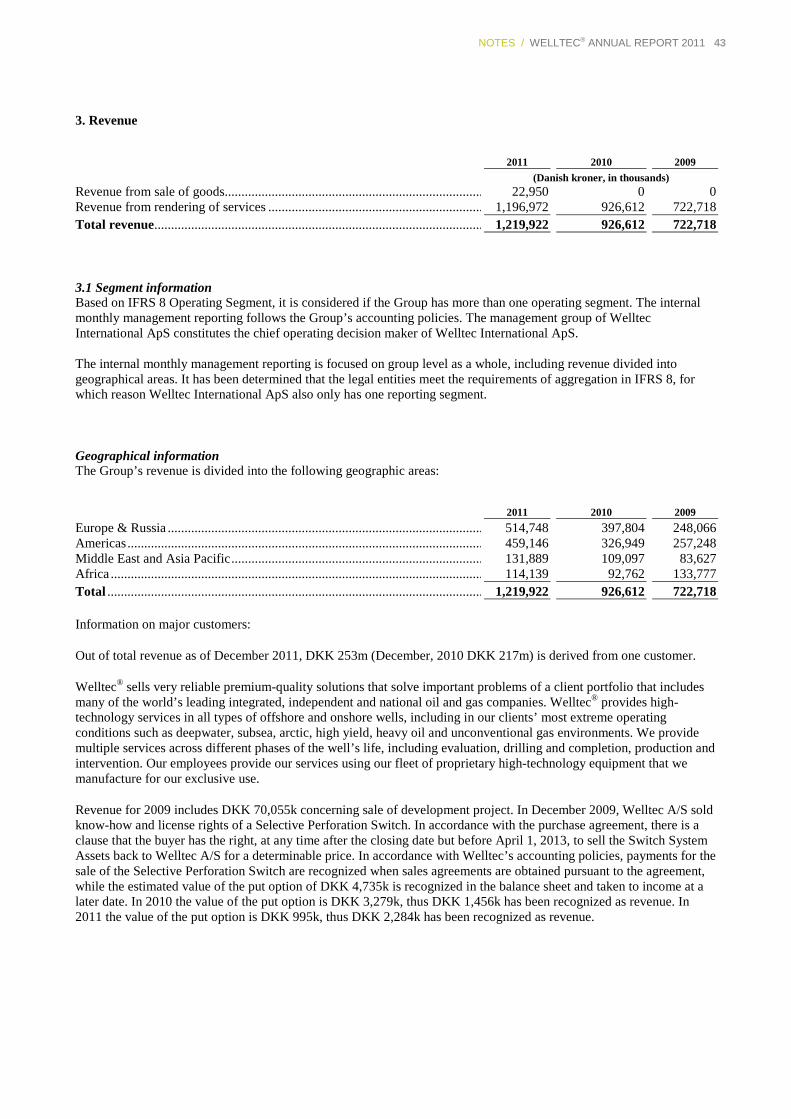
NOTES / WELLTEC® ANNUAL REPORT 2011 43
3. Revenue
2011
2010
2009
(Danish kroner, in thousands) Revenue from sale of goods.............................................................................. 22,950 0 0 Revenue from rendering of services ................................................................1,196,972 926,612 722,718 Total revenue ................................................................................................... 1,219,922 926,612 722,718 3.1 Segment information Based on IFRS 8 Operating Segment, it is considered if the Group has more than one operating segment. The internal monthly management reporting follows the Group’s accounting policies. The management group of Welltec International ApS constitutes the chief operating decision maker of Welltec International ApS. The internal monthly management reporting is focused on group level as a whole, including revenue divided into geographical areas. It has been determined that the legal entities meet the requirements of aggregation in IFRS 8, for which reason Welltec International ApS also only has one reporting segment. Geographical information The Group’s revenue is divided into the following geographic areas:
2011
2010
2009
Europe & Russia ............................................................................................... 514,748 397,804 248,066 Americas ........................................................................................................... 459,146 326,949 257,248 Middle East and Asia Pacific ............................................................................ 131,889 109,097 83,627 Africa ................................................................................................................ 114,139 92,762 133,777 Total ................................................................................................................. 1,219,922 926,612 722,718
Information on major customers:
Out of total revenue as of December 2011, DKK 253m (December, 2010 DKK 217m) is derived from one customer.
Welltec® sells very reliable premium-quality solutions that solve important problems of a client portfolio that includes many of the world’s leading integrated, independent and national oil and gas companies. Welltec® provides high-technology services in all types of offshore and onshore wells, including in our clients’ most extreme operating conditions such as deepwater, subsea, arctic, high yield, heavy oil and unconventional gas environments. We provide multiple services across different phases of the well’s life, including evaluation, drilling and completion, production and intervention. Our employees provide our services using our fleet of proprietary high-technology equipment that we manufacture for our exclusive use.
Revenue for 2009 includes DKK 70,055k concerning sale of development project. In December 2009, Welltec A/S sold know-how and license rights of a Selective Perforation Switch. In accordance with the purchase agreement, there is a clause that the buyer has the right, at any time after the closing date but before April 1, 2013, to sell the Switch System Assets back to Welltec A/S for a determinable price. In accordance with Welltec’s accounting policies, payments for the sale of the Selective Perforation Switch are recognized when sales agreements are obtained pursuant to the agreement, while the estimated value of the put option of DKK 4,735k is recognized in the balance sheet and taken to income at a later date. In 2010 the value of the put option is DKK 3,279k, thus DKK 1,456k has been recognized as revenue. In 2011 the value of the put option is DKK 995k, thus DKK 2,284k has been recognized as revenue.
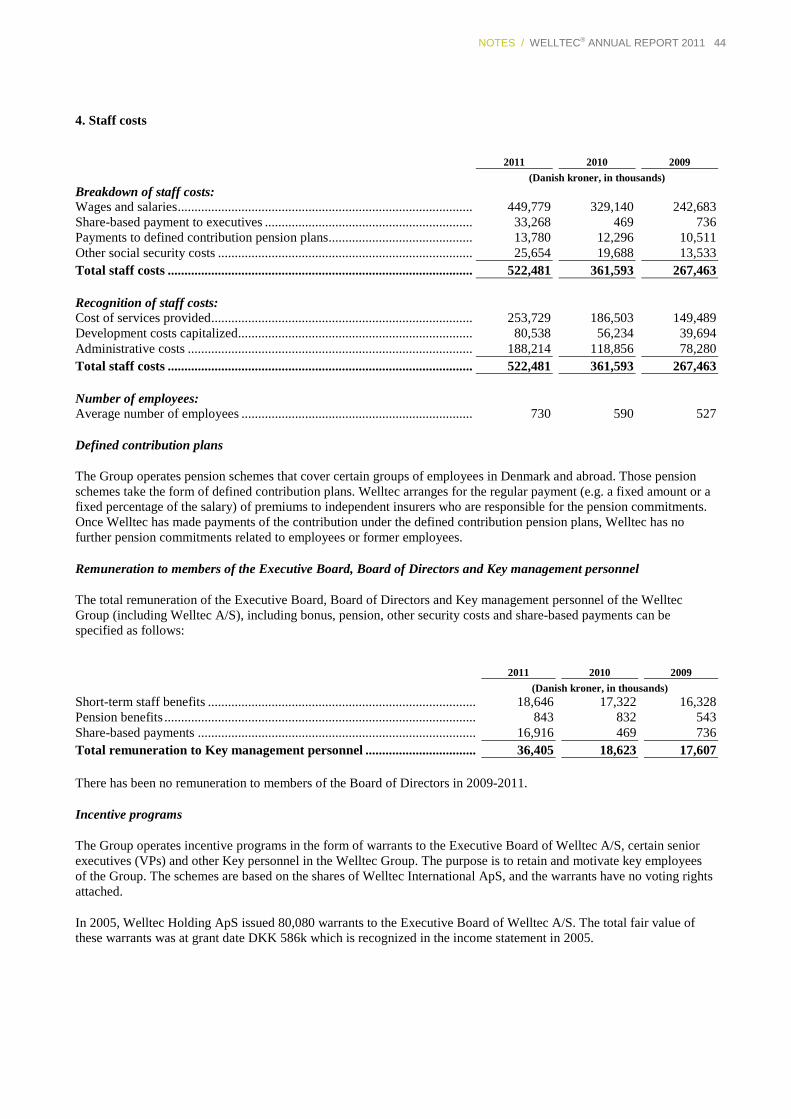
NOTES / WELLTEC® ANNUAL REPORT 2011 44
4. Staff costs
2011
2010
2009
(Danish kroner, in thousands) Breakdown of staff costs: Wages and salaries ......................................................................................... 449,779 329,140 242,683 Share-based payment to executives ............................................................... 33,268 469 736 Payments to defined contribution pension plans ............................................ 13,780 12,296 10,511 Other social security costs ............................................................................. 25,654 19,688 13,533 Total staff costs ............................................................................................ 522,481 361,593 267,463 Recognition of staff costs: Cost of services provided ............................................................................... 253,729 186,503 149,489 Development costs capitalized ....................................................................... 80,538 56,234 39,694 Administrative costs ...................................................................................... 188,214 118,856 78,280 Total staff costs ............................................................................................ 522,481 361,593 267,463 Number of employees: Average number of employees ...................................................................... 730 590 527
Defined contribution plans
The Group operates pension schemes that cover certain groups of employees in Denmark and abroad. Those pension schemes take the form of defined contribution plans. Welltec arranges for the regular payment (e.g. a fixed amount or a fixed percentage of the salary) of premiums to independent insurers who are responsible for the pension commitments. Once Welltec has made payments of the contribution under the defined contribution pension plans, Welltec has no further pension commitments related to employees or former employees.
Remuneration to members of the Executive Board, Board of Directors and Key management personnel
The total remuneration of the Executive Board, Board of Directors and Key management personnel of the Welltec Group (including Welltec A/S), including bonus, pension, other security costs and share-based payments can be specified as follows:
2011
2010
2009
(Danish kroner, in thousands) Short-term staff benefits ................................................................................ 18,646 17,322 16,328 Pension benefits ............................................................................................. 843 832 543 Share-based payments ................................................................................... 16,916 469 736 Total remuneration to Key management personnel ................................. 36,405 18,623 17,607
There has been no remuneration to members of the Board of Directors in 2009-2011.
Incentive programs
The Group operates incentive programs in the form of warrants to the Executive Board of Welltec A/S, certain senior executives (VPs) and other Key personnel in the Welltec Group. The purpose is to retain and motivate key employees of the Group. The schemes are based on the shares of Welltec International ApS, and the warrants have no voting rights attached.
In 2005, Welltec Holding ApS issued 80,080 warrants to the Executive Board of Welltec A/S. The total fair value of these warrants was at grant date DKK 586k which is recognized in the income statement in 2005.
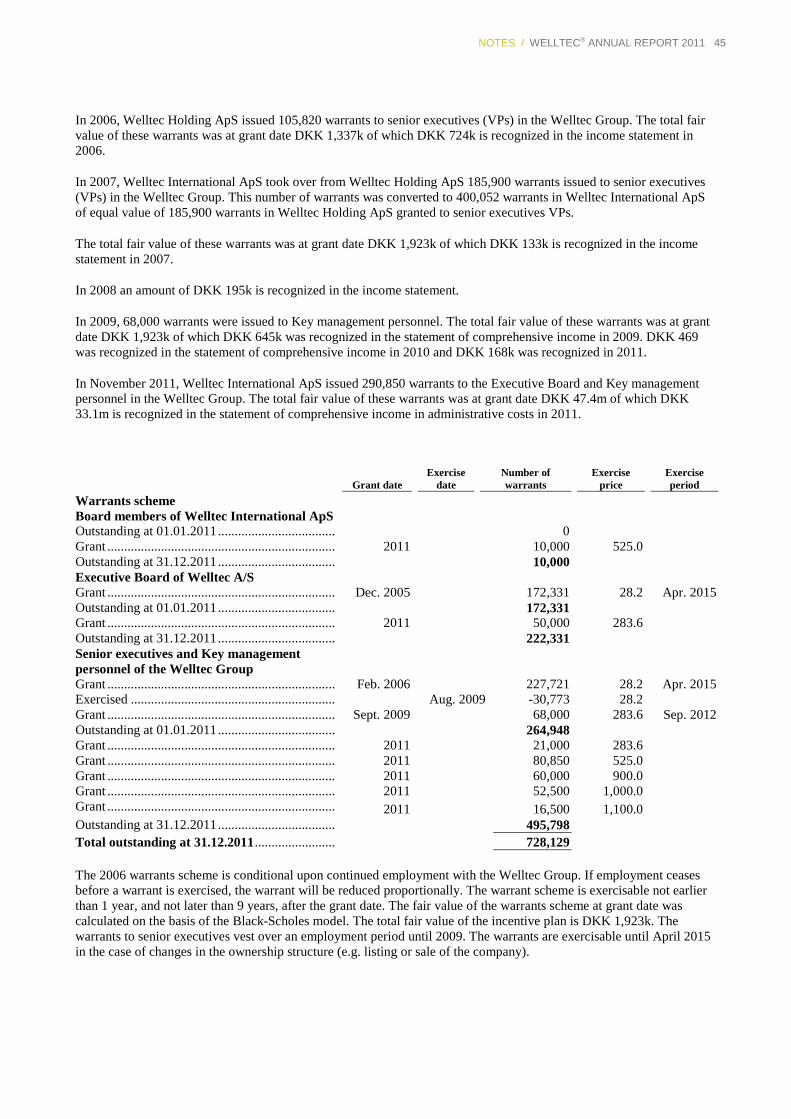
NOTES / WELLTEC® ANNUAL REPORT 2011 45
In 2006, Welltec Holding ApS issued 105,820 warrants to senior executives (VPs) in the Welltec Group. The total fair value of these warrants was at grant date DKK 1,337k of which DKK 724k is recognized in the income statement in 2006.
In 2007, Welltec International ApS took over from Welltec Holding ApS 185,900 warrants issued to senior executives (VPs) in the Welltec Group. This number of warrants was converted to 400,052 warrants in Welltec International ApS of equal value of 185,900 warrants in Welltec Holding ApS granted to senior executives VPs.
The total fair value of these warrants was at grant date DKK 1,923k of which DKK 133k is recognized in the income statement in 2007.
In 2008 an amount of DKK 195k is recognized in the income statement.
In 2009, 68,000 warrants were issued to Key management personnel. The total fair value of these warrants was at grant date DKK 1,923k of which DKK 645k was recognized in the statement of comprehensive income in 2009. DKK 469 was recognized in the statement of comprehensive income in 2010 and DKK 168k was recognized in 2011.
In November 2011, Welltec International ApS issued 290,850 warrants to the Executive Board and Key management personnel in the Welltec Group. The total fair value of these warrants was at grant date DKK 47.4m of which DKK 33.1m is recognized in the statement of comprehensive income in administrative costs in 2011.
Grant date
Exercise
date Number of warrants
Exercise price
Exercise period
Warrants scheme Board members of Welltec International ApS Outstanding at 01.01.2011 ................................... 0 Grant .................................................................... 2011 10,000 525.0 Outstanding at 31.12.2011 ................................... 10,000 Executive Board of Welltec A/S Grant .................................................................... Dec. 2005 172,331 28.2 Apr. 2015 Outstanding at 01.01.2011 ................................... 172,331 Grant .................................................................... 2011 50,000 283.6 Outstanding at 31.12.2011 ................................... 222,331 Senior executives and Key management personnel of the Welltec Group
Grant .................................................................... Feb. 2006 227,721 28.2 Apr. 2015 Exercised ............................................................. Aug. 2009 -30,773 28.2 Grant .................................................................... Sept. 2009 68,000 283.6 Sep. 2012 Outstanding at 01.01.2011 ................................... 264,948 Grant .................................................................... 2011 21,000 283.6 Grant .................................................................... 2011 80,850 525.0 Grant .................................................................... 2011 60,000 900.0 Grant .................................................................... 2011 52,500 1,000.0 Grant .................................................................... 2011 16,500 1,100.0 Outstanding at 31.12.2011 ................................... 495,798 Total outstanding at 31.12.2011 ........................ 728,129
The 2006 warrants scheme is conditional upon continued employment with the Welltec Group. If employment ceases before a warrant is exercised, the warrant will be reduced proportionally. The warrant scheme is exercisable not earlier than 1 year, and not later than 9 years, after the grant date. The fair value of the warrants scheme at grant date was calculated on the basis of the Black-Scholes model. The total fair value of the incentive plan is DKK 1,923k. The warrants to senior executives vest over an employment period until 2009. The warrants are exercisable until April 2015 in the case of changes in the ownership structure (e.g. listing or sale of the company).
NOTES / WELLTEC® ANNUAL REPORT 2011 46
The calculation for both 2005 and 2006 schemes are based on an expected volatility of 28.4% and a risk-free interest rate computed at 2.4-3.4% depending on the expected life of the warrants of 1-4 years. The expected volatility has been determined using a historical volatility for a one-year period for comparable listed companies adjusted for a small-cap factor.
In 2009 30,773 of the warrants were exercised. The exercise price amount was DKK 867k.
In 2009 a new warrants scheme to Key management personnel was granted. The warrant scheme is exercisable not earlier than 3 years and not later than 6 years after the grant date. The fair value of the warrants scheme at grant date was calculated on the basis of the Black-Scholes model. The total fair value of the granted warrants in 2009 is DKK 1,281k. The calculation for 2009 schemes is based on an expected volatility of 38% and a risk-free interest rate at 2.07%. The expected volatility has been determined using a historical volatility for a five-year period for comparable listed companies adjusted for a small-cap factor.
In November 2011, new warrants schemes to the Board of Directors, Executive Board of Welltec Group and Key management personnel were granted. The warrant schemes are vested in the period from January 1, 2011 to January 1, 2015. The warrant schemes are only exercisable if certain events occur. The fair value of the warrants scheme at grant date was calculated on the basis of the Black-Scholes model. The total fair value of the granted warrants in 2011 is DKK 47.4m. The calculation for 2011 schemes is based on an expected volatility of 33% and a risk-free interest rate at 0.85%. The expected volatility has been determined using a historical volatility for a five-year period for comparable listed companies adjusted for a small-cap factor.
Summary:
The total expense recognized in the statement of comprehensive income for all warrants schemes amounted to DKK 33,268k for 2011. (DKK 168k from warrants schemes granted in 2009 and DKK 33,100k from warrants schemes granted in 2011.) The total expense recognized in the statement of comprehensive income for all warrants schemes amounted to DKK 469k in 2010 and DKK 645k in 2009.
No warrants have been exercised in 2011 or 2010.
The number of warrants which can be exercised as at December 31, 2011 is 369,279 (2010: 369,279) and the fair value of these warrants as at December 31, 2011 is DKK 336m.
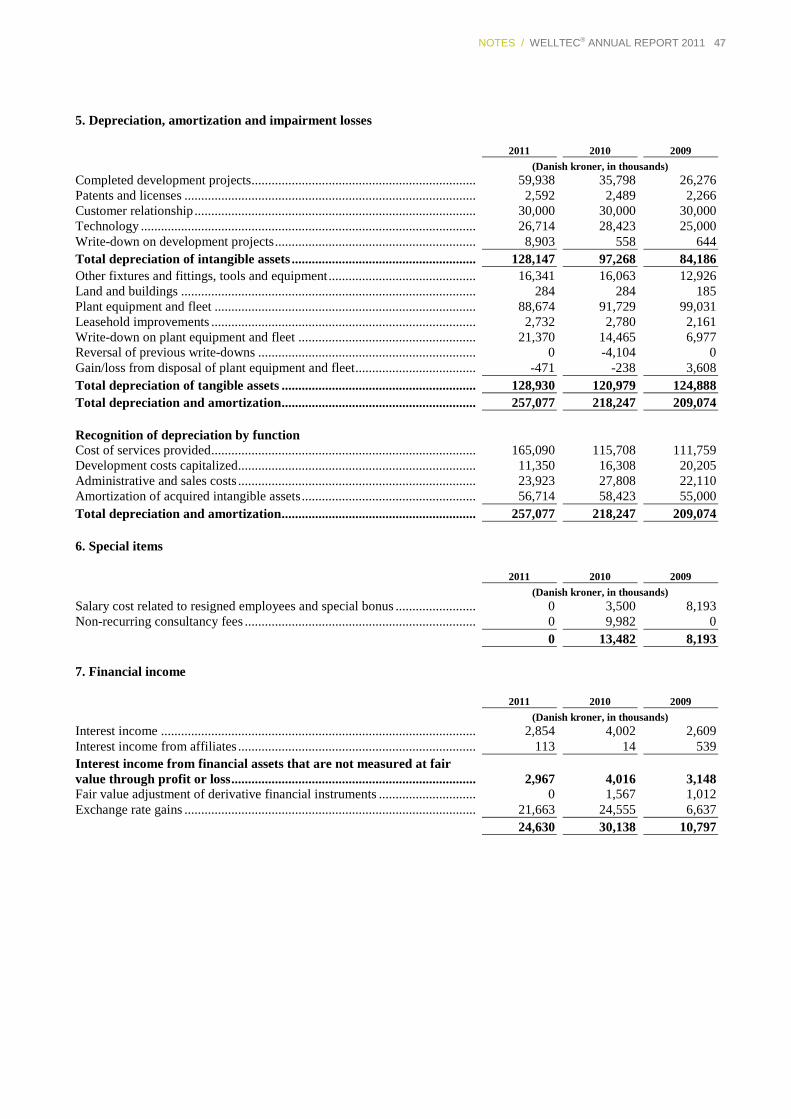
NOTES / WELLTEC® ANNUAL REPORT 2011 47
5. Depreciation, amortization and impairment losses
2011 2010 2009 (Danish kroner, in thousands)
Completed development projects ................................................................... 59,938 35,798 26,276 Patents and licenses ....................................................................................... 2,592 2,489 2,266 Customer relationship .................................................................................... 30,000 30,000 30,000 Technology .................................................................................................... 26,714 28,423 25,000 Write-down on development projects ............................................................ 8,903 558 644 Total depreciation of intangible assets ....................................................... 128,147 97,268 84,186 Other fixtures and fittings, tools and equipment ............................................ 16,341 16,063 12,926 Land and buildings ........................................................................................ 284 284 185 Plant equipment and fleet .............................................................................. 88,674 91,729 99,031 Leasehold improvements ............................................................................... 2,732 2,780 2,161 Write-down on plant equipment and fleet ..................................................... 21,370 14,465 6,977 Reversal of previous write-downs ................................................................. 0 -4,104 0 Gain/loss from disposal of plant equipment and fleet .................................... -471 -238 3,608 Total depreciation of tangible assets .......................................................... 128,930 120,979 124,888 Total depreciation and amortization .......................................................... 257,077 218,247 209,074 Recognition of depreciation by function Cost of services provided ............................................................................... 165,090 115,708 111,759 Development costs capitalized ....................................................................... 11,350 16,308 20,205 Administrative and sales costs ....................................................................... 23,923 27,808 22,110 Amortization of acquired intangible assets .................................................... 56,714 58,423 55,000 Total depreciation and amortization .......................................................... 257,077 218,247 209,074 6. Special items
2011 2010 2009 (Danish kroner, in thousands)
Salary cost related to resigned employees and special bonus ........................ 0 3,500 8,193 Non-recurring consultancy fees ..................................................................... 0 9,982 0 0 13,482 8,193 7. Financial income
2011 2010 2009 (Danish kroner, in thousands)
Interest income .............................................................................................. 2,854 4,002 2,609 Interest income from affiliates ....................................................................... 113 14 539 Interest income from financial assets that are not measured at fair value through profit or loss ......................................................................... 2,967 4,016 3,148 Fair value adjustment of derivative financial instruments ............................. 0 1,567 1,012 Exchange rate gains ....................................................................................... 21,663 24,555 6,637 24,630 30,138 10,797
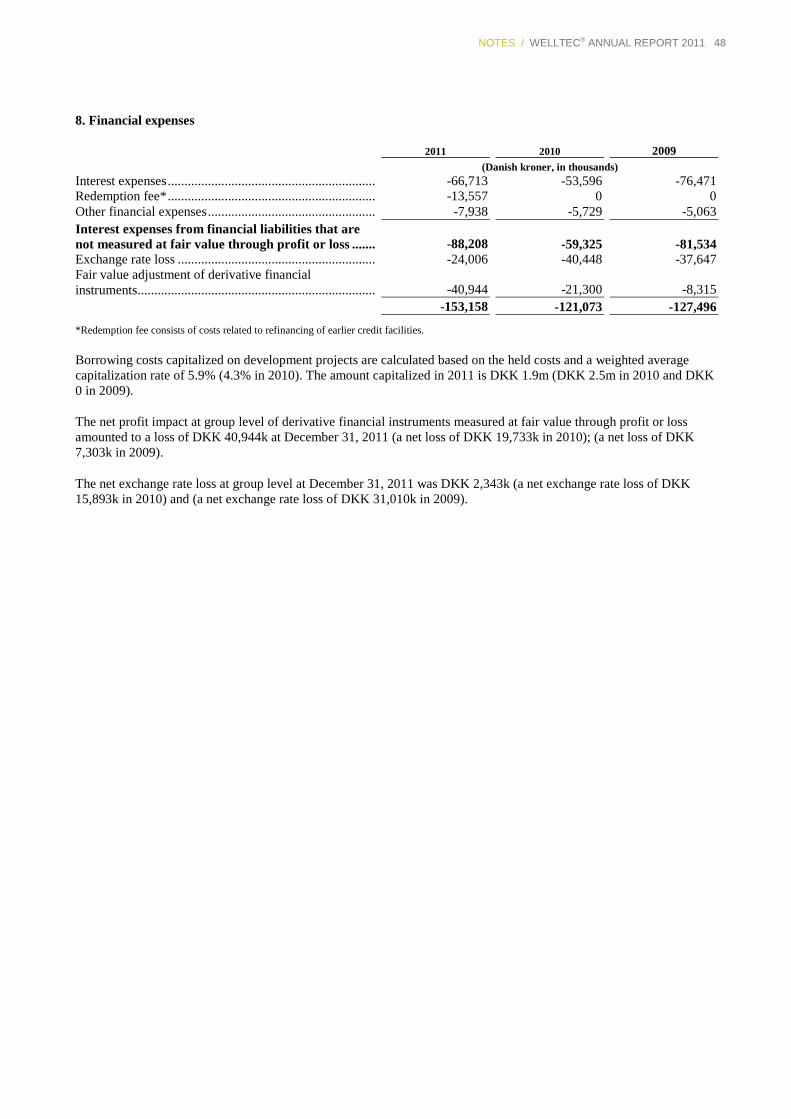
NOTES / WELLTEC® ANNUAL REPORT 2011 48
8. Financial expenses
2011 2010 2009 (Danish kroner, in thousands)
Interest expenses .............................................................. -66,713 -53,596 -76,471 Redemption fee* .............................................................. -13,557 0 0 Other financial expenses .................................................. -7,938 -5,729 -5,063 Interest expenses from financial liabilities that are not measured at fair value through profit or loss ....... -88,208 -59,325 -81,534 Exchange rate loss ........................................................... -24,006 -40,448 -37,647 Fair value adjustment of derivative financial instruments....................................................................... -40,944 -21,300 -8,315 -153,158 -121,073 -127,496
*Redemption fee consists of costs related to refinancing of earlier credit facilities.
Borrowing costs capitalized on development projects are calculated based on the held costs and a weighted average capitalization rate of 5.9% (4.3% in 2010). The amount capitalized in 2011 is DKK 1.9m (DKK 2.5m in 2010 and DKK 0 in 2009).
The net profit impact at group level of derivative financial instruments measured at fair value through profit or loss amounted to a loss of DKK 40,944k at December 31, 2011 (a net loss of DKK 19,733k in 2010); (a net loss of DKK 7,303k in 2009).
The net exchange rate loss at group level at December 31, 2011 was DKK 2,343k (a net exchange rate loss of DKK 15,893k in 2010) and (a net exchange rate loss of DKK 31,010k in 2009).
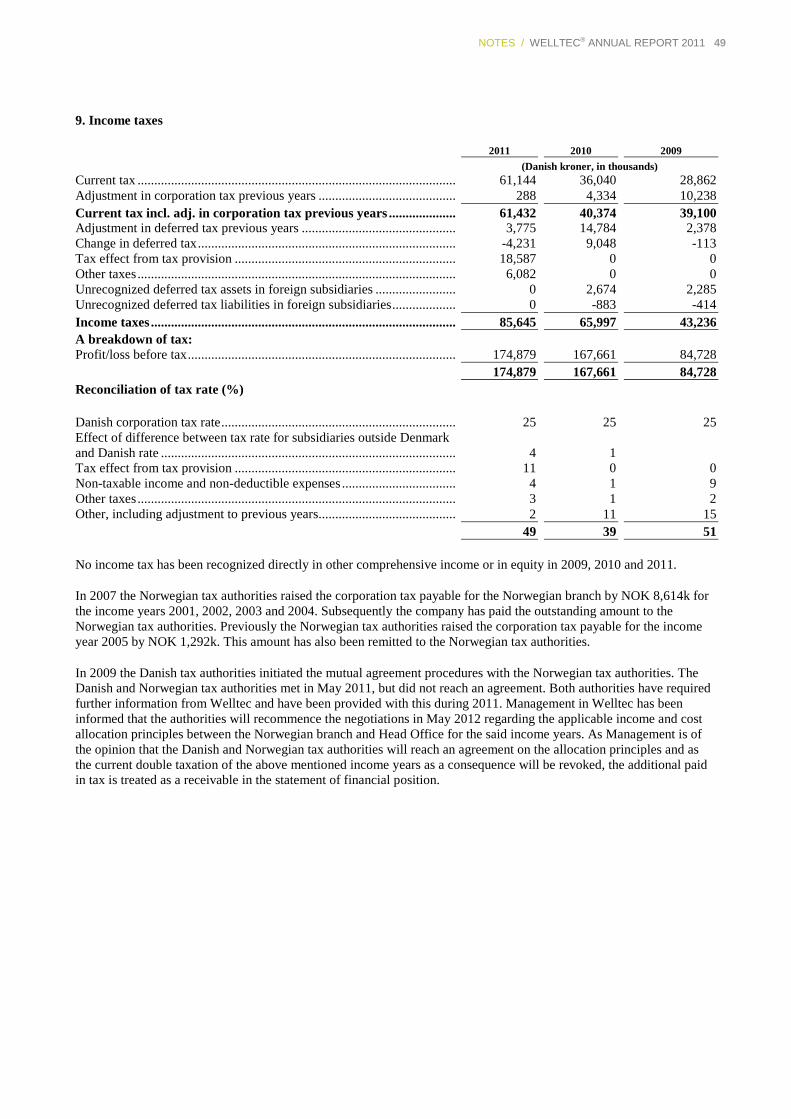
NOTES / WELLTEC® ANNUAL REPORT 2011 49
9. Income taxes
2011 2010 2009 (Danish kroner, in thousands)
Current tax ............................................................................................... 61,144 36,040 28,862 Adjustment in corporation tax previous years ......................................... 288 4,334 10,238 Current tax incl. adj. in corporation tax previous years .................... 61,432 40,374 39,100 Adjustment in deferred tax previous years .............................................. 3,775 14,784 2,378 Change in deferred tax ............................................................................. -4,231 9,048 -113 Tax effect from tax provision .................................................................. 18,587 0 0 Other taxes ............................................................................................... 6,082 0 0 Unrecognized deferred tax assets in foreign subsidiaries ........................ 0 2,674 2,285 Unrecognized deferred tax liabilities in foreign subsidiaries ................... 0 -883 -414 Income taxes ........................................................................................... 85,645 65,997 43,236 A breakdown of tax: Profit/loss before tax ................................................................................ 174,879 167,661 84,728 174,879 167,661 84,728 Reconciliation of tax rate (%) Danish corporation tax rate ...................................................................... 25 25 25 Effect of difference between tax rate for subsidiaries outside Denmark and Danish rate ........................................................................................ 4 1 Tax effect from tax provision .................................................................. 11 0 0 Non-taxable income and non-deductible expenses .................................. 4 1 9 Other taxes ............................................................................................... 3 1 2 Other, including adjustment to previous years......................................... 2 11 15 49 39 51
No income tax has been recognized directly in other comprehensive income or in equity in 2009, 2010 and 2011.
In 2007 the Norwegian tax authorities raised the corporation tax payable for the Norwegian branch by NOK 8,614k for the income years 2001, 2002, 2003 and 2004. Subsequently the company has paid the outstanding amount to the Norwegian tax authorities. Previously the Norwegian tax authorities raised the corporation tax payable for the income year 2005 by NOK 1,292k. This amount has also been remitted to the Norwegian tax authorities.
In 2009 the Danish tax authorities initiated the mutual agreement procedures with the Norwegian tax authorities. The Danish and Norwegian tax authorities met in May 2011, but did not reach an agreement. Both authorities have required further information from Welltec and have been provided with this during 2011. Management in Welltec has been informed that the authorities will recommence the negotiations in May 2012 regarding the applicable income and cost allocation principles between the Norwegian branch and Head Office for the said income years. As Management is of the opinion that the Danish and Norwegian tax authorities will reach an agreement on the allocation principles and as the current double taxation of the above mentioned income years as a consequence will be revoked, the additional paid in tax is treated as a receivable in the statement of financial position.
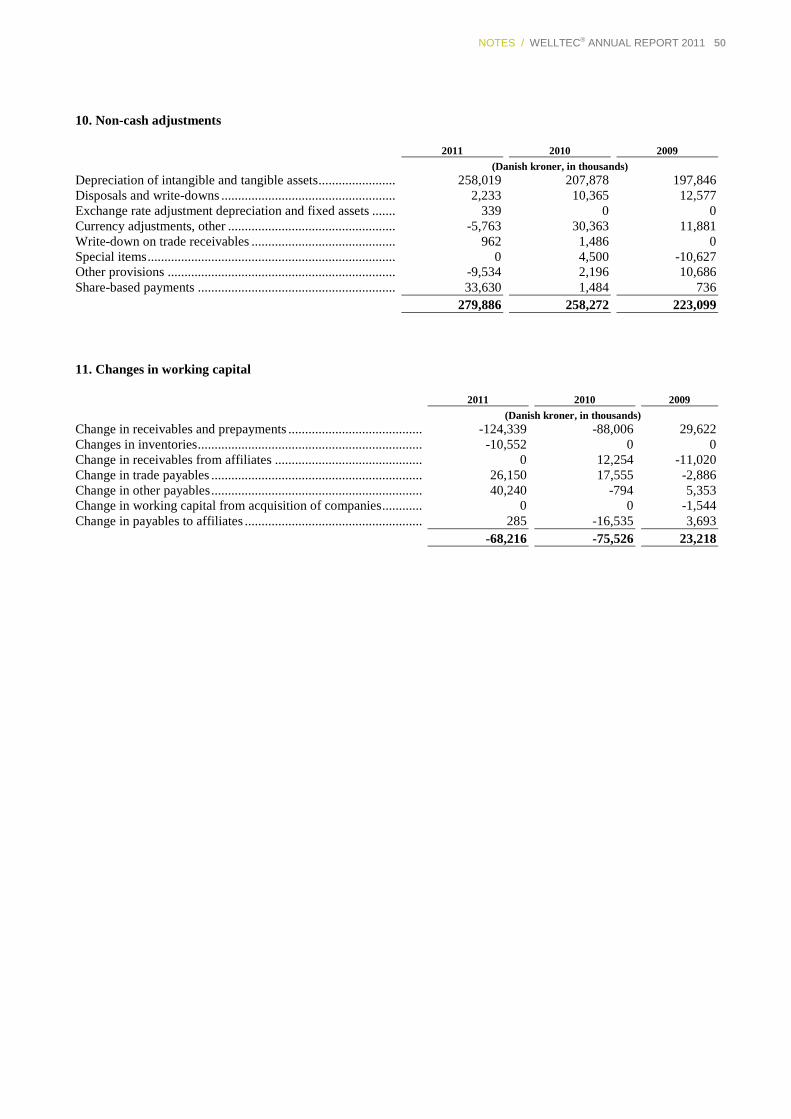
NOTES / WELLTEC® ANNUAL REPORT 2011 50
10. Non-cash adjustments
2011 2010 2009 (Danish kroner, in thousands)
Depreciation of intangible and tangible assets ....................... 258,019 207,878 197,846 Disposals and write-downs .................................................... 2,233 10,365 12,577 Exchange rate adjustment depreciation and fixed assets ....... 339 0 0 Currency adjustments, other .................................................. -5,763 30,363 11,881 Write-down on trade receivables ........................................... 962 1,486 0 Special items .......................................................................... 0 4,500 -10,627 Other provisions .................................................................... -9,534 2,196 10,686 Share-based payments ........................................................... 33,630 1,484 736 279,886 258,272 223,099
11. Changes in working capital
2011 2010 2009 (Danish kroner, in thousands)
Change in receivables and prepayments ........................................ -124,339 -88,006 29,622 Changes in inventories ................................................................... -10,552 0 0 Change in receivables from affiliates ............................................ 0 12,254 -11,020 Change in trade payables ............................................................... 26,150 17,555 -2,886 Change in other payables ............................................................... 40,240 -794 5,353 Change in working capital from acquisition of companies ............ 0 0 -1,544 Change in payables to affiliates ..................................................... 285 -16,535 3,693 -68,216 -75,526 23,218
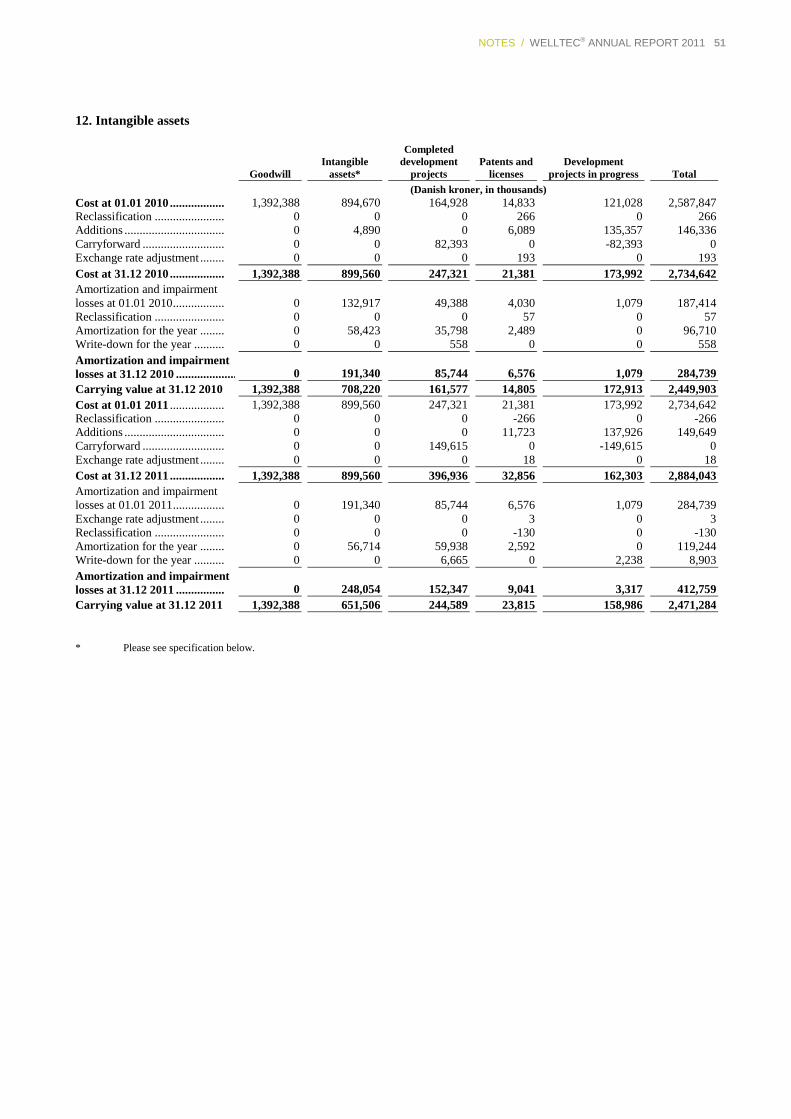
NOTES / WELLTEC® ANNUAL REPORT 2011 51
12. Intangible assets
Goodwill Intangible
assets*
Completed development
projects Patents and
licenses Development
projects in progress Total (Danish kroner, in thousands)
Cost at 01.01 2010 .................. 1,392,388 894,670 164,928 14,833 121,028 2,587,847 Reclassification ....................... 0 0 0 266 0 266 Additions ................................. 0 4,890 0 6,089 135,357 146,336 Carryforward ........................... 0 0 82,393 0 -82,393 0 Exchange rate adjustment ........ 0 0 0 193 0 193 Cost at 31.12 2010 .................. 1,392,388 899,560 247,321 21,381 173,992 2,734,642 Amortization and impairment losses at 01.01 2010 ................. 0 132,917 49,388 4,030 1,079 187,414 Reclassification ....................... 0 0 0 57 0 57 Amortization for the year ........ 0 58,423 35,798 2,489 0 96,710 Write-down for the year .......... 0 0 558 0 0 558 Amortization and impairment losses at 31.12 2010 ..................... 0 191,340 85,744 6,576 1,079 284,739 Carrying value at 31.12 2010 1,392,388 708,220 161,577 14,805 172,913 2,449,903 Cost at 01.01 2011 .................. 1,392,388 899,560 247,321 21,381 173,992 2,734,642 Reclassification ....................... 0 0 0 -266 0 -266 Additions ................................. 0 0 0 11,723 137,926 149,649 Carryforward ........................... 0 0 149,615 0 -149,615 0 Exchange rate adjustment ........ 0 0 0 18 0 18 Cost at 31.12 2011 .................. 1,392,388 899,560 396,936 32,856 162,303 2,884,043 Amortization and impairment losses at 01.01 2011 ................. 0 191,340 85,744 6,576 1,079 284,739 Exchange rate adjustment ........ 0 0 0 3 0 3 Reclassification ....................... 0 0 0 -130 0 -130 Amortization for the year ........ 0 56,714 59,938 2,592 0 119,244 Write-down for the year .......... 0 0 6,665 0 2,238 8,903 Amortization and impairment losses at 31.12 2011 ................ 0 248,054 152,347 9,041 3,317 412,759 Carrying value at 31.12 2011 1,392,388 651,506 244,589 23,815 158,986 2,471,284
* Please see specification below.
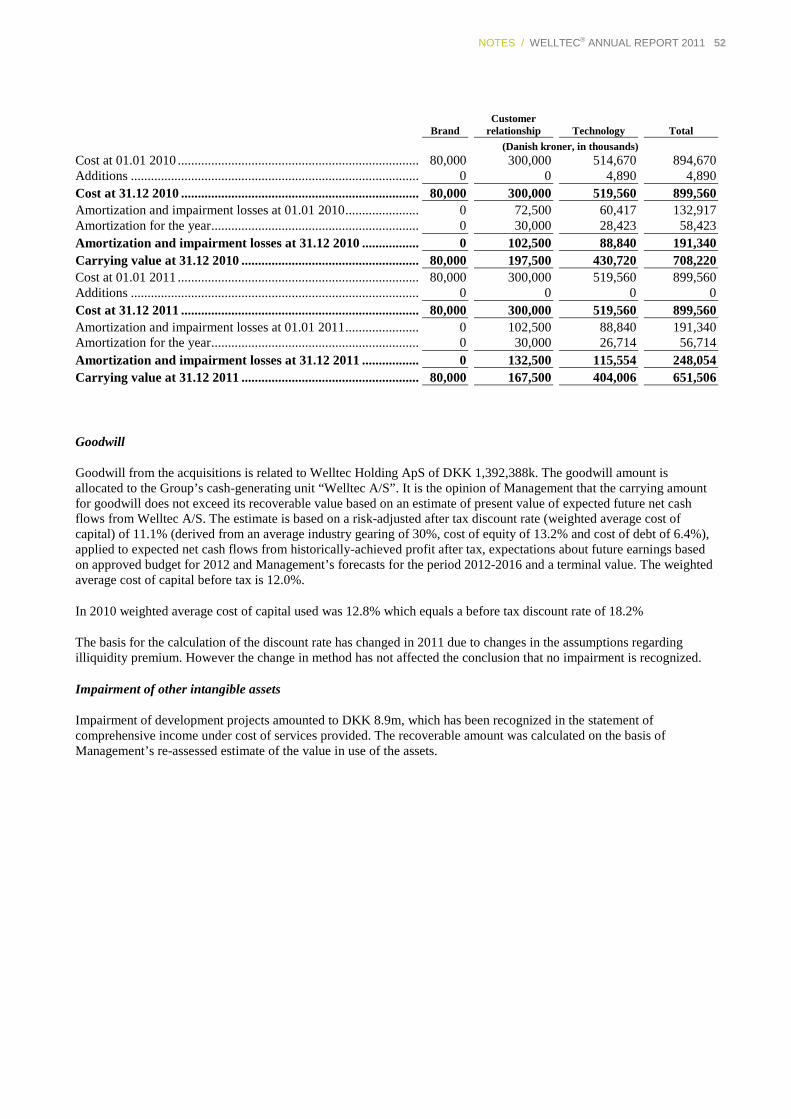
NOTES / WELLTEC® ANNUAL REPORT 2011 52
Brand Customer
relationship Technology Total (Danish kroner, in thousands)
Cost at 01.01 2010 ...........................................................................80,000 300,000 514,670 894,670 Additions ......................................................................................... 0 0 4,890 4,890 Cost at 31.12 2010 ..........................................................................80,000 300,000 519,560 899,560 Amortization and impairment losses at 01.01 2010 ......................... 0 72,500 60,417 132,917 Amortization for the year ................................................................ 0 30,000 28,423 58,423 Amortization and impairment losses at 31.12 2010 .................... 0 102,500 88,840 191,340 Carrying value at 31.12 2010 ........................................................80,000 197,500 430,720 708,220 Cost at 01.01 2011 ...........................................................................80,000 300,000 519,560 899,560 Additions ......................................................................................... 0 0 0 0 Cost at 31.12 2011 ..........................................................................80,000 300,000 519,560 899,560 Amortization and impairment losses at 01.01 2011 ......................... 0 102,500 88,840 191,340 Amortization for the year ................................................................ 0 30,000 26,714 56,714 Amortization and impairment losses at 31.12 2011 .................... 0 132,500 115,554 248,054 Carrying value at 31.12 2011 ........................................................80,000 167,500 404,006 651,506
Goodwill
Goodwill from the acquisitions is related to Welltec Holding ApS of DKK 1,392,388k. The goodwill amount is allocated to the Group’s cash-generating unit “Welltec A/S”. It is the opinion of Management that the carrying amount for goodwill does not exceed its recoverable value based on an estimate of present value of expected future net cash flows from Welltec A/S. The estimate is based on a risk-adjusted after tax discount rate (weighted average cost of capital) of 11.1% (derived from an average industry gearing of 30%, cost of equity of 13.2% and cost of debt of 6.4%), applied to expected net cash flows from historically-achieved profit after tax, expectations about future earnings based on approved budget for 2012 and Management’s forecasts for the period 2012-2016 and a terminal value. The weighted average cost of capital before tax is 12.0%.
In 2010 weighted average cost of capital used was 12.8% which equals a before tax discount rate of 18.2%
The basis for the calculation of the discount rate has changed in 2011 due to changes in the assumptions regarding illiquidity premium. However the change in method has not affected the conclusion that no impairment is recognized.
Impairment of other intangible assets
Impairment of development projects amounted to DKK 8.9m, which has been recognized in the statement of comprehensive income under cost of services provided. The recoverable amount was calculated on the basis of Management’s re-assessed estimate of the value in use of the assets.
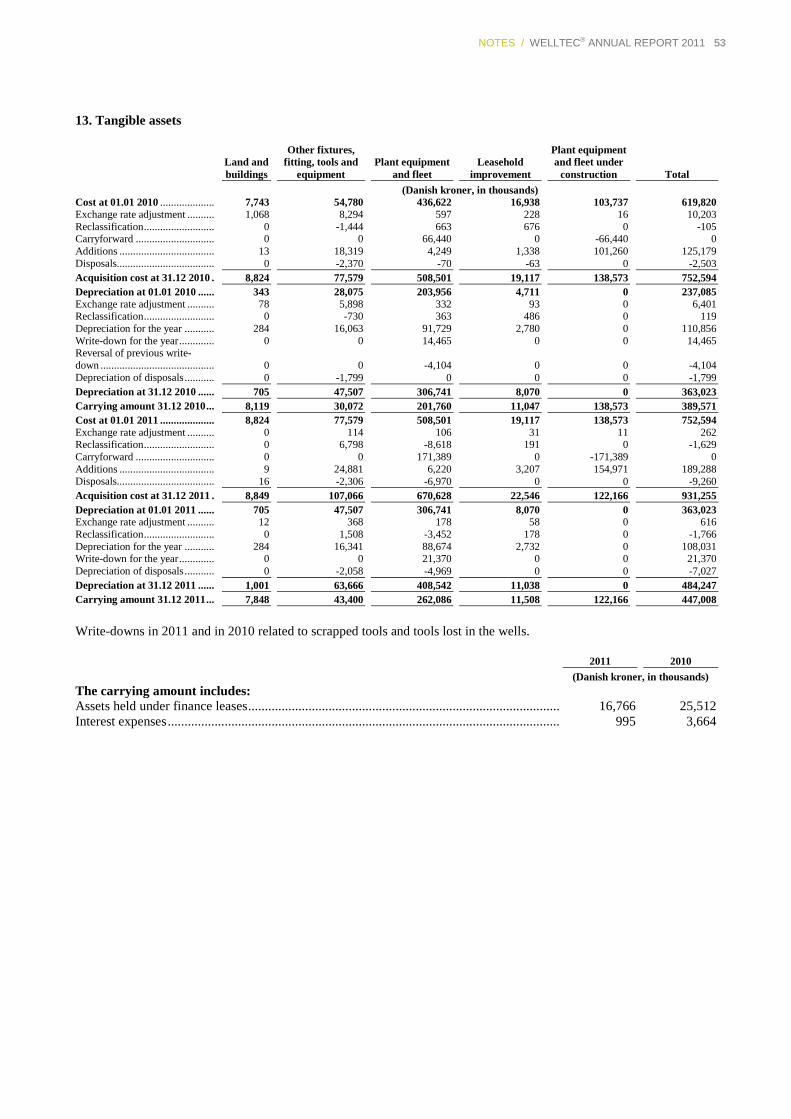
NOTES / WELLTEC® ANNUAL REPORT 2011 53
13. Tangible assets
Land and buildings
Other fixtures, fitting, tools and
equipment Plant equipment
and fleet Leasehold
improvement
Plant equipment and fleet under
construction Total (Danish kroner, in thousands)
Cost at 01.01 2010 .................... 7,743 54,780 436,622 16,938 103,737 619,820 Exchange rate adjustment .......... 1,068 8,294 597 228 16 10,203 Reclassification .......................... 0 -1,444 663 676 0 -105 Carryforward ............................. 0 0 66,440 0 -66,440 0 Additions ................................... 13 18,319 4,249 1,338 101,260 125,179 Disposals.................................... 0 -2,370 -70 -63 0 -2,503 Acquisition cost at 31.12 2010 . 8,824 77,579 508,501 19,117 138,573 752,594 Depreciation at 01.01 2010 ...... 343 28,075 203,956 4,711 0 237,085 Exchange rate adjustment .......... 78 5,898 332 93 0 6,401 Reclassification .......................... 0 -730 363 486 0 119 Depreciation for the year ........... 284 16,063 91,729 2,780 0 110,856 Write-down for the year ............. 0 0 14,465 0 0 14,465 Reversal of previous write-down .......................................... 0 0 -4,104 0 0 -4,104 Depreciation of disposals ........... 0 -1,799 0 0 0 -1,799 Depreciation at 31.12 2010 ...... 705 47,507 306,741 8,070 0 363,023 Carrying amount 31.12 2010 ... 8,119 30,072 201,760 11,047 138,573 389,571 Cost at 01.01 2011 .................... 8,824 77,579 508,501 19,117 138,573 752,594 Exchange rate adjustment .......... 0 114 106 31 11 262 Reclassification .......................... 0 6,798 -8,618 191 0 -1,629 Carryforward ............................. 0 0 171,389 0 -171,389 0 Additions ................................... 9 24,881 6,220 3,207 154,971 189,288 Disposals.................................... 16 -2,306 -6,970 0 0 -9,260 Acquisition cost at 31.12 2011 . 8,849 107,066 670,628 22,546 122,166 931,255 Depreciation at 01.01 2011 ...... 705 47,507 306,741 8,070 0 363,023 Exchange rate adjustment .......... 12 368 178 58 0 616 Reclassification .......................... 0 1,508 -3,452 178 0 -1,766 Depreciation for the year ........... 284 16,341 88,674 2,732 0 108,031 Write-down for the year ............. 0 0 21,370 0 0 21,370 Depreciation of disposals ........... 0 -2,058 -4,969 0 0 -7,027 Depreciation at 31.12 2011 ...... 1,001 63,666 408,542 11,038 0 484,247 Carrying amount 31.12 2011 ... 7,848 43,400 262,086 11,508 122,166 447,008
Write-downs in 2011 and in 2010 related to scrapped tools and tools lost in the wells.
2011 2010 (Danish kroner, in thousands)
The carrying amount includes: Assets held under finance leases ............................................................................................. 16,766 25,512 Interest expenses ..................................................................................................................... 995 3,664
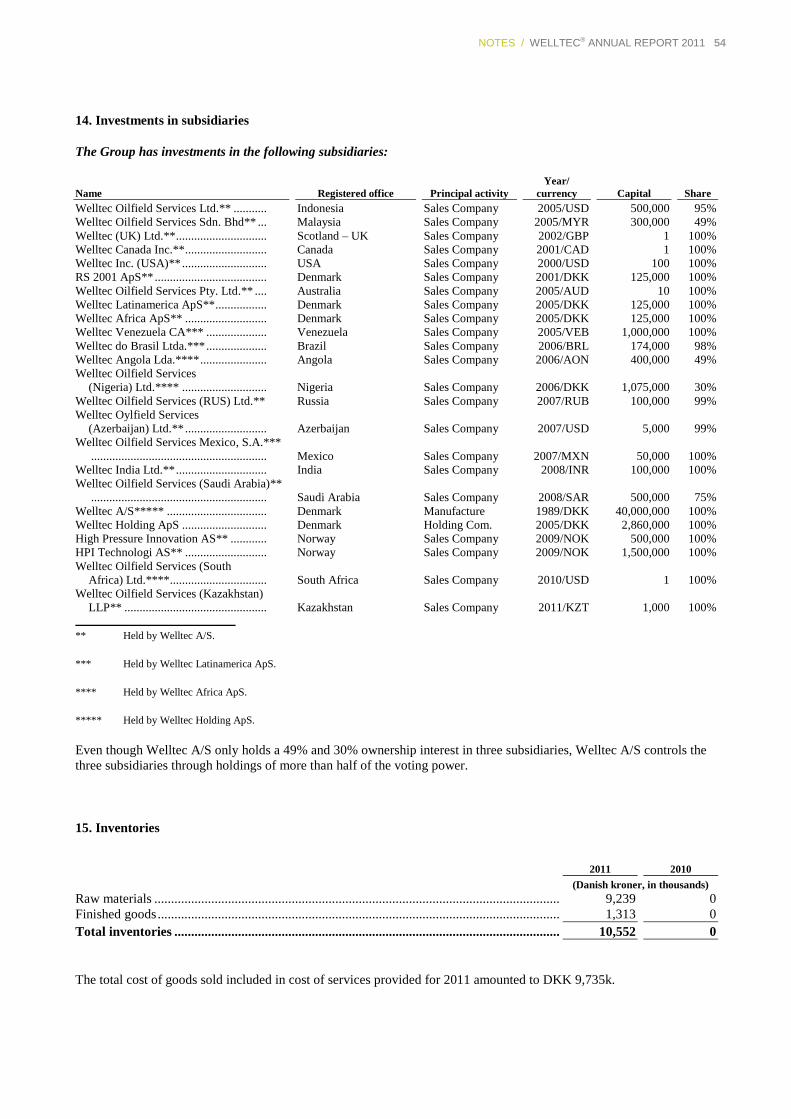
NOTES / WELLTEC® ANNUAL REPORT 2011 54
14. Investments in subsidiaries
The Group has investments in the following subsidiaries:
Name Registered office Principal activity Year/
currency Capital Share Welltec Oilfield Services Ltd.** ........... Indonesia Sales Company 2005/USD 500,000 95% Welltec Oilfield Services Sdn. Bhd** ... Malaysia Sales Company 2005/MYR 300,000 49% Welltec (UK) Ltd.** .............................. Scotland – UK Sales Company 2002/GBP 1 100% Welltec Canada Inc.** ........................... Canada Sales Company 2001/CAD 1 100% Welltec Inc. (USA)** ............................ USA Sales Company 2000/USD 100 100% RS 2001 ApS** ..................................... Denmark Sales Company 2001/DKK 125,000 100% Welltec Oilfield Services Pty. Ltd.** .... Australia Sales Company 2005/AUD 10 100% Welltec Latinamerica ApS** ................. Denmark Sales Company 2005/DKK 125,000 100% Welltec Africa ApS** ........................... Denmark Sales Company 2005/DKK 125,000 100% Welltec Venezuela CA*** .................... Venezuela Sales Company 2005/VEB 1,000,000 100% Welltec do Brasil Ltda.*** .................... Brazil Sales Company 2006/BRL 174,000 98% Welltec Angola Lda.**** ...................... Angola Sales Company 2006/AON 400,000 49% Welltec Oilfield Services
(Nigeria) Ltd.**** ............................ Nigeria Sales Company 2006/DKK 1,075,000 30% Welltec Oilfield Services (RUS) Ltd.** Russia Sales Company 2007/RUB 100,000 99% Welltec Oylfield Services
(Azerbaijan) Ltd.** ........................... Azerbaijan Sales Company 2007/USD 5,000 99% Welltec Oilfield Services Mexico, S.A.***
.......................................................... Mexico Sales Company 2007/MXN 50,000 100% Welltec India Ltd.** .............................. India Sales Company 2008/INR 100,000 100% Welltec Oilfield Services (Saudi Arabia)**
.......................................................... Saudi Arabia Sales Company 2008/SAR 500,000 75% Welltec A/S***** ................................. Denmark Manufacture 1989/DKK 40,000,000 100% Welltec Holding ApS ............................ Denmark Holding Com. 2005/DKK 2,860,000 100% High Pressure Innovation AS** ............ Norway Sales Company 2009/NOK 500,000 100% HPI Technologi AS** ........................... Norway Sales Company 2009/NOK 1,500,000 100% Welltec Oilfield Services (South
Africa) Ltd.**** ................................ South Africa Sales Company 2010/USD 1 100% Welltec Oilfield Services (Kazakhstan)
LLP** ............................................... Kazakhstan Sales Company 2011/KZT 1,000 100%
** Held by Welltec A/S.
*** Held by Welltec Latinamerica ApS.
**** Held by Welltec Africa ApS.
***** Held by Welltec Holding ApS.
Even though Welltec A/S only holds a 49% and 30% ownership interest in three subsidiaries, Welltec A/S controls the three subsidiaries through holdings of more than half of the voting power.
15. Inventories
2011
2010
(Danish kroner, in thousands) Raw materials ......................................................................................................................... 9,239 0 Finished goods ........................................................................................................................ 1,313 0 Total inventories ................................................................................................................... 10,552 0
The total cost of goods sold included in cost of services provided for 2011 amounted to DKK 9,735k.
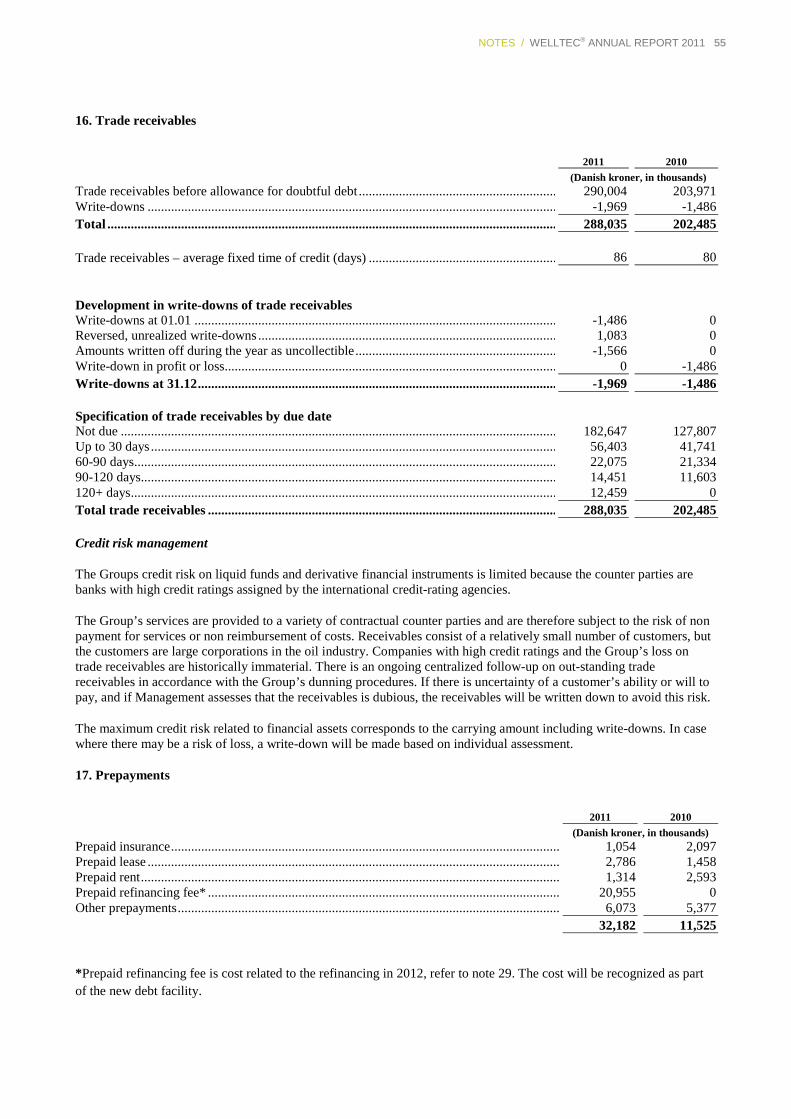
NOTES / WELLTEC® ANNUAL REPORT 2011 55
16. Trade receivables
2011
2010
(Danish kroner, in thousands) Trade receivables before allowance for doubtful debt ............................................................ 290,004 203,971 Write-downs ........................................................................................................................... -1,969 -1,486 Total ....................................................................................................................................... 288,035 202,485 Trade receivables – average fixed time of credit (days) ......................................................... 86 80 Development in write-downs of trade receivables Write-downs at 01.01 ............................................................................................................. -1,486 0 Reversed, unrealized write-downs .......................................................................................... 1,083 0 Amounts written off during the year as uncollectible ............................................................. -1,566 0 Write-down in profit or loss.................................................................................................... 0 -1,486 Write-downs at 31.12 ............................................................................................................ -1,969 -1,486 Specification of trade receivables by due date Not due ................................................................................................................................... 182,647 127,807 Up to 30 days .......................................................................................................................... 56,403 41,741 60-90 days............................................................................................................................... 22,075 21,334 90-120 days............................................................................................................................. 14,451 11,603 120+ days ................................................................................................................................ 12,459 0 Total trade receivables ......................................................................................................... 288,035 202,485
Credit risk management
The Groups credit risk on liquid funds and derivative financial instruments is limited because the counter parties are banks with high credit ratings assigned by the international credit-rating agencies.
The Group’s services are provided to a variety of contractual counter parties and are therefore subject to the risk of non payment for services or non reimbursement of costs. Receivables consist of a relatively small number of customers, but the customers are large corporations in the oil industry. Companies with high credit ratings and the Group’s loss on trade receivables are historically immaterial. There is an ongoing centralized follow-up on out-standing trade receivables in accordance with the Group’s dunning procedures. If there is uncertainty of a customer’s ability or will to pay, and if Management assesses that the receivables is dubious, the receivables will be written down to avoid this risk.
The maximum credit risk related to financial assets corresponds to the carrying amount including write-downs. In case where there may be a risk of loss, a write-down will be made based on individual assessment.
17. Prepayments
2011
2010
(Danish kroner, in thousands) Prepaid insurance .................................................................................................................... 1,054 2,097 Prepaid lease ........................................................................................................................... 2,786 1,458 Prepaid rent ............................................................................................................................. 1,314 2,593 Prepaid refinancing fee* ......................................................................................................... 20,955 0 Other prepayments .................................................................................................................. 6,073 5,377 32,182 11,525
*Prepaid refinancing fee is cost related to the refinancing in 2012, refer to note 29. The cost will be recognized as part of the new debt facility.
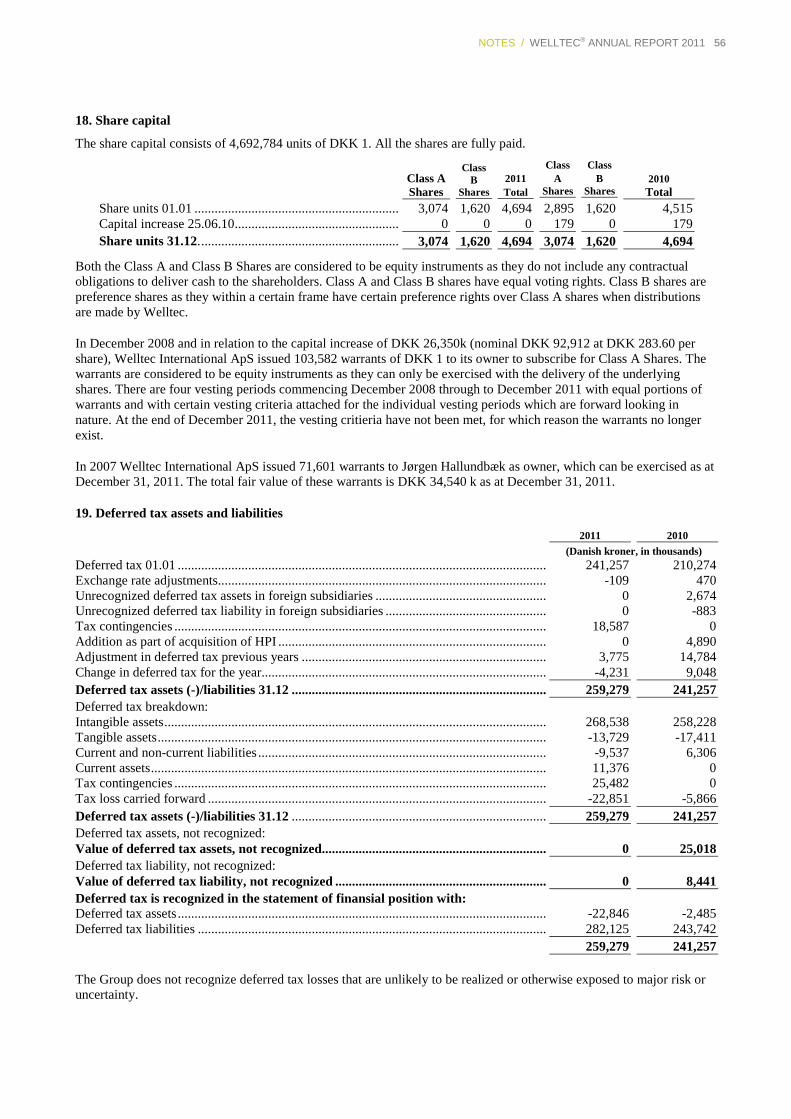
NOTES / WELLTEC® ANNUAL REPORT 2011 56
18. Share capital
The share capital consists of 4,692,784 units of DKK 1. All the shares are fully paid.
Class A Shares
Class B
Shares
2011 Total
Class A
Shares
Class B
Shares 2010 Total
Share units 01.01 ................................................................3,074 1,620 4,694 2,895 1,620 4,515 Capital increase 25.06.10 ................................................................0 0 0 179 0 179 Share units 31.12. ................................................................3,074 1,620 4,694 3,074 1,620 4,694
Both the Class A and Class B Shares are considered to be equity instruments as they do not include any contractual obligations to deliver cash to the shareholders. Class A and Class B shares have equal voting rights. Class B shares are preference shares as they within a certain frame have certain preference rights over Class A shares when distributions are made by Welltec.
In December 2008 and in relation to the capital increase of DKK 26,350k (nominal DKK 92,912 at DKK 283.60 per share), Welltec International ApS issued 103,582 warrants of DKK 1 to its owner to subscribe for Class A Shares. The warrants are considered to be equity instruments as they can only be exercised with the delivery of the underlying shares. There are four vesting periods commencing December 2008 through to December 2011 with equal portions of warrants and with certain vesting criteria attached for the individual vesting periods which are forward looking in nature. At the end of December 2011, the vesting critieria have not been met, for which reason the warrants no longer exist.
In 2007 Welltec International ApS issued 71,601 warrants to Jørgen Hallundbæk as owner, which can be exercised as at December 31, 2011. The total fair value of these warrants is DKK 34,540 k as at December 31, 2011.
19. Deferred tax assets and liabilities
2011 2010
(Danish kroner, in thousands) Deferred tax 01.01 .............................................................................................................. 241,257 210,274 Exchange rate adjustments.................................................................................................. -109 470 Unrecognized deferred tax assets in foreign subsidiaries ................................................... 0 2,674 Unrecognized deferred tax liability in foreign subsidiaries ................................................ 0 -883 Tax contingencies ............................................................................................................... 18,587 0 Addition as part of acquisition of HPI ................................................................................ 0 4,890 Adjustment in deferred tax previous years ......................................................................... 3,775 14,784 Change in deferred tax for the year..................................................................................... -4,231 9,048 Deferred tax assets (-)/liabilities 31.12 ............................................................................ 259,279 241,257 Deferred tax breakdown: Intangible assets .................................................................................................................. 268,538 258,228 Tangible assets .................................................................................................................... -13,729 -17,411 Current and non-current liabilities ...................................................................................... -9,537 6,306 Current assets ...................................................................................................................... 11,376 0 Tax contingencies ............................................................................................................... 25,482 0 Tax loss carried forward ..................................................................................................... -22,851 -5,866 Deferred tax assets (-)/liabilities 31.12 ............................................................................ 259,279 241,257 Deferred tax assets, not recognized: Value of deferred tax assets, not recognized................................................................... 0 25,018 Deferred tax liability, not recognized: Value of deferred tax liability, not recognized ............................................................... 0 8,441 Deferred tax is recognized in the statement of finansial position with: Deferred tax assets .............................................................................................................. -22,846 -2,485 Deferred tax liabilities ........................................................................................................ 282,125 243,742 259,279 241,257
The Group does not recognize deferred tax losses that are unlikely to be realized or otherwise exposed to major risk or uncertainty.
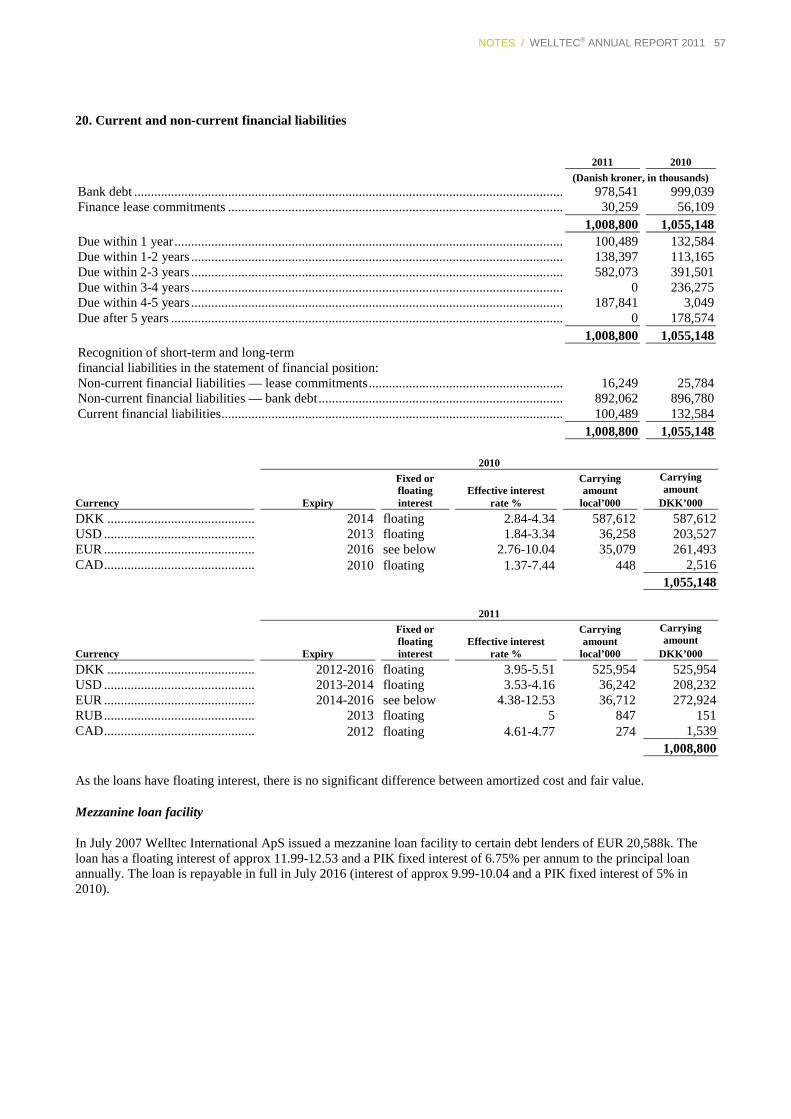
NOTES / WELLTEC® ANNUAL REPORT 2011 57
20. Current and non-current financial liabilities
2011
2010
(Danish kroner, in thousands) Bank debt ................................................................................................................................ 978,541 999,039 Finance lease commitments .................................................................................................... 30,259 56,109 1,008,800 1,055,148 Due within 1 year .................................................................................................................... 100,489 132,584 Due within 1-2 years ............................................................................................................... 138,397 113,165 Due within 2-3 years ............................................................................................................... 582,073 391,501 Due within 3-4 years ............................................................................................................... 0 236,275 Due within 4-5 years ............................................................................................................... 187,841 3,049 Due after 5 years ..................................................................................................................... 0 178,574 1,008,800 1,055,148 Recognition of short-term and long-term financial liabilities in the statement of financial position: Non-current financial liabilities — lease commitments .......................................................... 16,249 25,784 Non-current financial liabilities — bank debt ......................................................................... 892,062 896,780 Current financial liabilities ...................................................................................................... 100,489 132,584 1,008,800 1,055,148
2010
Currency Expiry
Fixed or floating interest
Effective interest rate %
Carrying amount
local’000
Carrying amount
DKK’000 DKK ............................................ 2014 floating 2.84-4.34 587,612 587,612 USD ............................................. 2013 floating 1.84-3.34 36,258 203,527 EUR ............................................. 2016 see below 2.76-10.04 35,079 261,493 CAD ............................................. 2010 floating 1.37-7.44 448 2,516 1,055,148
2011
Currency Expiry
Fixed or floating interest
Effective interest rate %
Carrying amount
local’000
Carrying amount
DKK’000 DKK ............................................ 2012-2016 floating 3.95-5.51 525,954 525,954 USD ............................................. 2013-2014 floating 3.53-4.16 36,242 208,232 EUR ............................................. 2014-2016 see below 4.38-12.53 36,712 272,924 RUB ............................................. 2013 floating 5 847 151 CAD ............................................. 2012 floating 4.61-4.77 274 1,539 1,008,800 As the loans have floating interest, there is no significant difference between amortized cost and fair value.
Mezzanine loan facility
In July 2007 Welltec International ApS issued a mezzanine loan facility to certain debt lenders of EUR 20,588k. The loan has a floating interest of approx 11.99-12.53 and a PIK fixed interest of 6.75% per annum to the principal loan annually. The loan is repayable in full in July 2016 (interest of approx 9.99-10.04 and a PIK fixed interest of 5% in 2010).
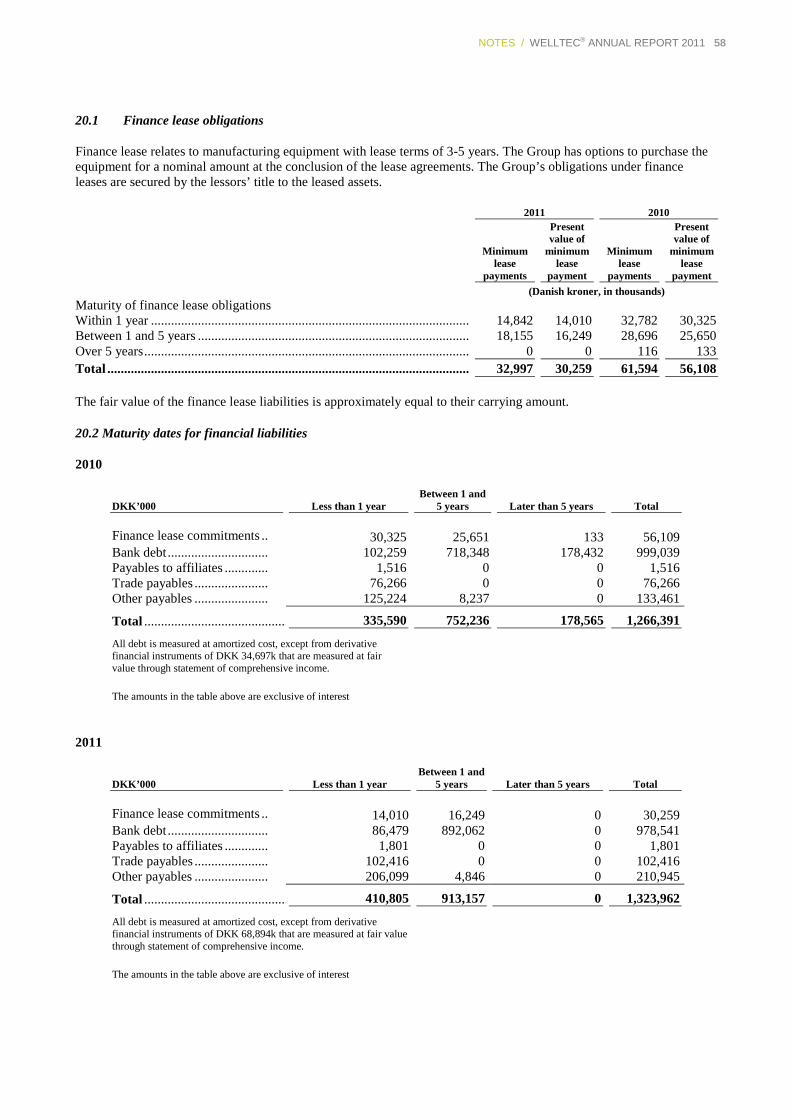
NOTES / WELLTEC® ANNUAL REPORT 2011 58
20.1 Finance lease obligations
Finance lease relates to manufacturing equipment with lease terms of 3-5 years. The Group has options to purchase the equipment for a nominal amount at the conclusion of the lease agreements. The Group’s obligations under finance leases are secured by the lessors’ title to the leased assets.
2011 2010
Minimum lease
payments
Present value of
minimum lease
payment
Minimum lease
payments
Present value of
minimum lease
payment (Danish kroner, in thousands)
Maturity of finance lease obligations Within 1 year ............................................................................................... 14,842 14,010 32,782 30,325 Between 1 and 5 years ................................................................................. 18,155 16,249 28,696 25,650 Over 5 years ................................................................................................. 0 0 116 133 Total ............................................................................................................ 32,997 30,259 61,594 56,108
The fair value of the finance lease liabilities is approximately equal to their carrying amount.
20.2 Maturity dates for financial liabilities
2010
DKK’000 Less than 1 year Between 1 and
5 years Later than 5 years Total
Finance lease commitments .. 30,325 25,651 133 56,109 Bank debt .............................. 102,259 718,348 178,432 999,039 Payables to affiliates ............. 1,516 0 0 1,516 Trade payables ...................... 76,266 0 0 76,266 Other payables ...................... 125,224 8,237 0 133,461
Total ................................................. 335,590 752,236 178,565 1,266,391
All debt is measured at amortized cost, except from derivative financial instruments of DKK 34,697k that are measured at fair value through statement of comprehensive income.
The amounts in the table above are exclusive of interest
2011
DKK’000 Less than 1 year Between 1 and
5 years Later than 5 years Total
Finance lease commitments .. 14,010 16,249 0 30,259 Bank debt .............................. 86,479 892,062 0 978,541 Payables to affiliates ............. 1,801 0 0 1,801 Trade payables ...................... 102,416 0 0 102,416 Other payables ...................... 206,099 4,846 0 210,945
Total ................................................. 410,805 913,157 0 1,323,962
All debt is measured at amortized cost, except from derivative financial instruments of DKK 68,894k that are measured at fair value through statement of comprehensive income.
The amounts in the table above are exclusive of interest
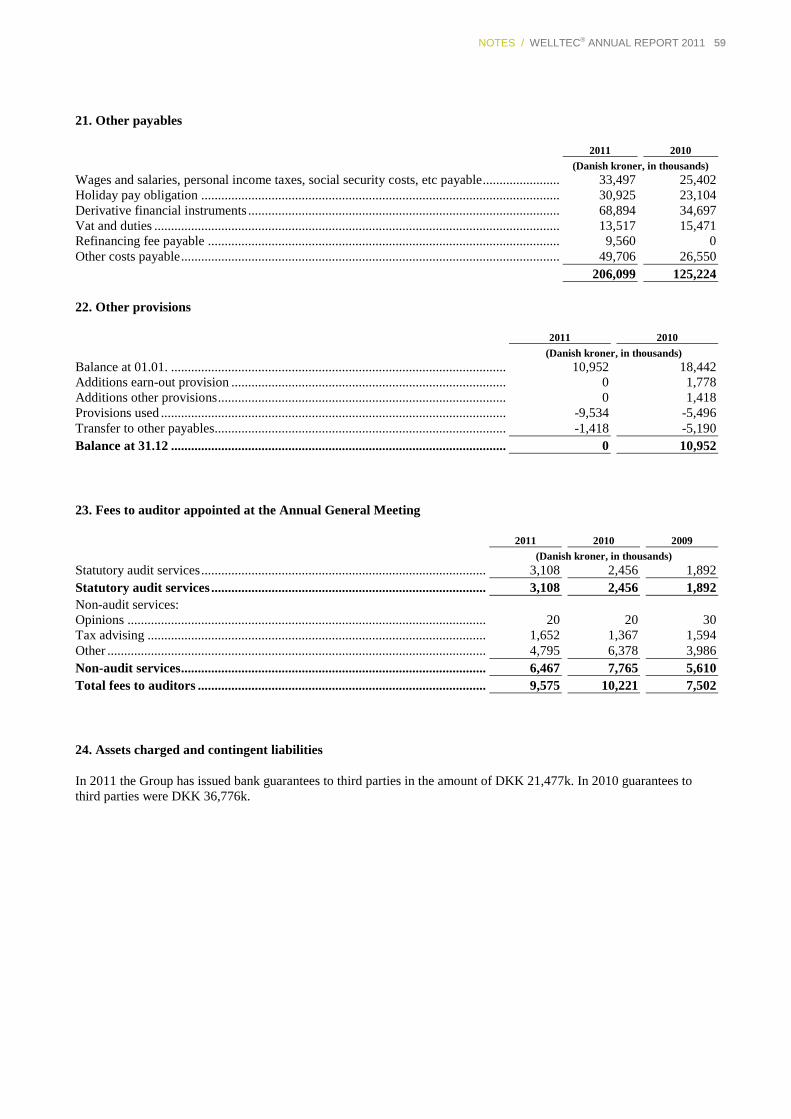
NOTES / WELLTEC® ANNUAL REPORT 2011 59
21. Other payables
2011 2010 (Danish kroner, in thousands)
Wages and salaries, personal income taxes, social security costs, etc payable ....................... 33,497 25,402 Holiday pay obligation ........................................................................................................... 30,925 23,104 Derivative financial instruments ............................................................................................. 68,894 34,697 Vat and duties ......................................................................................................................... 13,517 15,471 Refinancing fee payable ......................................................................................................... 9,560 0 Other costs payable ................................................................................................................. 49,706 26,550 206,099 125,224
22. Other provisions
2011 2010 (Danish kroner, in thousands)
Balance at 01.01. .................................................................................................... 10,952 18,442 Additions earn-out provision .................................................................................. 0 1,778 Additions other provisions ...................................................................................... 0 1,418 Provisions used ....................................................................................................... -9,534 -5,496 Transfer to other payables....................................................................................... -1,418 -5,190 Balance at 31.12 .................................................................................................... 0 10,952
23. Fees to auditor appointed at the Annual General Meeting
2011 2010 2009 (Danish kroner, in thousands)
Statutory audit services ..................................................................................... 3,108 2,456 1,892 Statutory audit services .................................................................................. 3,108 2,456 1,892 Non-audit services: Opinions ........................................................................................................... 20 20 30 Tax advising ..................................................................................................... 1,652 1,367 1,594 Other ................................................................................................................. 4,795 6,378 3,986 Non-audit services ........................................................................................... 6,467 7,765 5,610 Total fees to auditors ...................................................................................... 9,575 10,221 7,502
24. Assets charged and contingent liabilities
In 2011 the Group has issued bank guarantees to third parties in the amount of DKK 21,477k. In 2010 guarantees to third parties were DKK 36,776k.
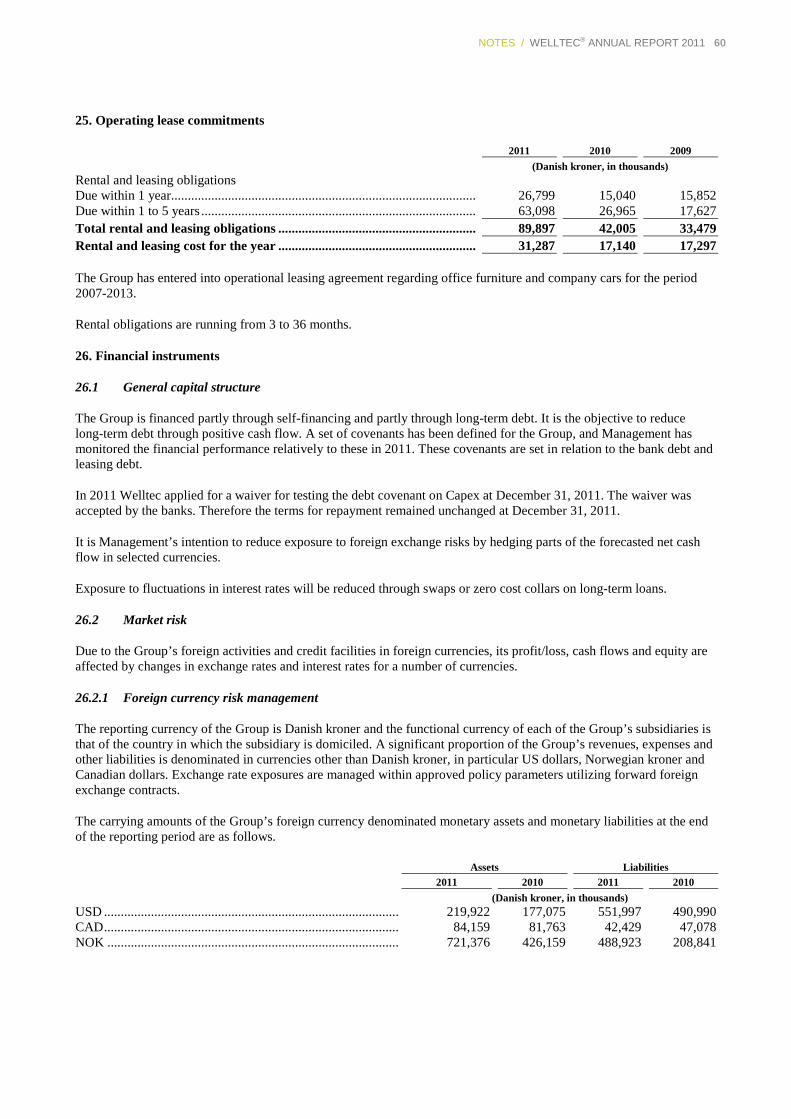
NOTES / WELLTEC® ANNUAL REPORT 2011 60
25. Operating lease commitments
2011 2010 2009 (Danish kroner, in thousands)
Rental and leasing obligations Due within 1 year........................................................................................... 26,799 15,040 15,852 Due within 1 to 5 years .................................................................................. 63,098 26,965 17,627 Total rental and leasing obligations ........................................................... 89,897 42,005 33,479 Rental and leasing cost for the year ........................................................... 31,287 17,140 17,297 The Group has entered into operational leasing agreement regarding office furniture and company cars for the period 2007-2013.
Rental obligations are running from 3 to 36 months.
26. Financial instruments
26.1 General capital structure
The Group is financed partly through self-financing and partly through long-term debt. It is the objective to reduce long-term debt through positive cash flow. A set of covenants has been defined for the Group, and Management has monitored the financial performance relatively to these in 2011. These covenants are set in relation to the bank debt and leasing debt.
In 2011 Welltec applied for a waiver for testing the debt covenant on Capex at December 31, 2011. The waiver was accepted by the banks. Therefore the terms for repayment remained unchanged at December 31, 2011.
It is Management’s intention to reduce exposure to foreign exchange risks by hedging parts of the forecasted net cash flow in selected currencies.
Exposure to fluctuations in interest rates will be reduced through swaps or zero cost collars on long-term loans.
26.2 Market risk
Due to the Group’s foreign activities and credit facilities in foreign currencies, its profit/loss, cash flows and equity are affected by changes in exchange rates and interest rates for a number of currencies.
26.2.1 Foreign currency risk management
The reporting currency of the Group is Danish kroner and the functional currency of each of the Group’s subsidiaries is that of the country in which the subsidiary is domiciled. A significant proportion of the Group’s revenues, expenses and other liabilities is denominated in currencies other than Danish kroner, in particular US dollars, Norwegian kroner and Canadian dollars. Exchange rate exposures are managed within approved policy parameters utilizing forward foreign exchange contracts.
The carrying amounts of the Group’s foreign currency denominated monetary assets and monetary liabilities at the end of the reporting period are as follows.
Assets Liabilities 2011 2010 2011 2010 (Danish kroner, in thousands)
USD ........................................................................................ 219,922 177,075 551,997 490,990 CAD ........................................................................................ 84,159 81,763 42,429 47,078 NOK ....................................................................................... 721,376 426,159 488,923 208,841
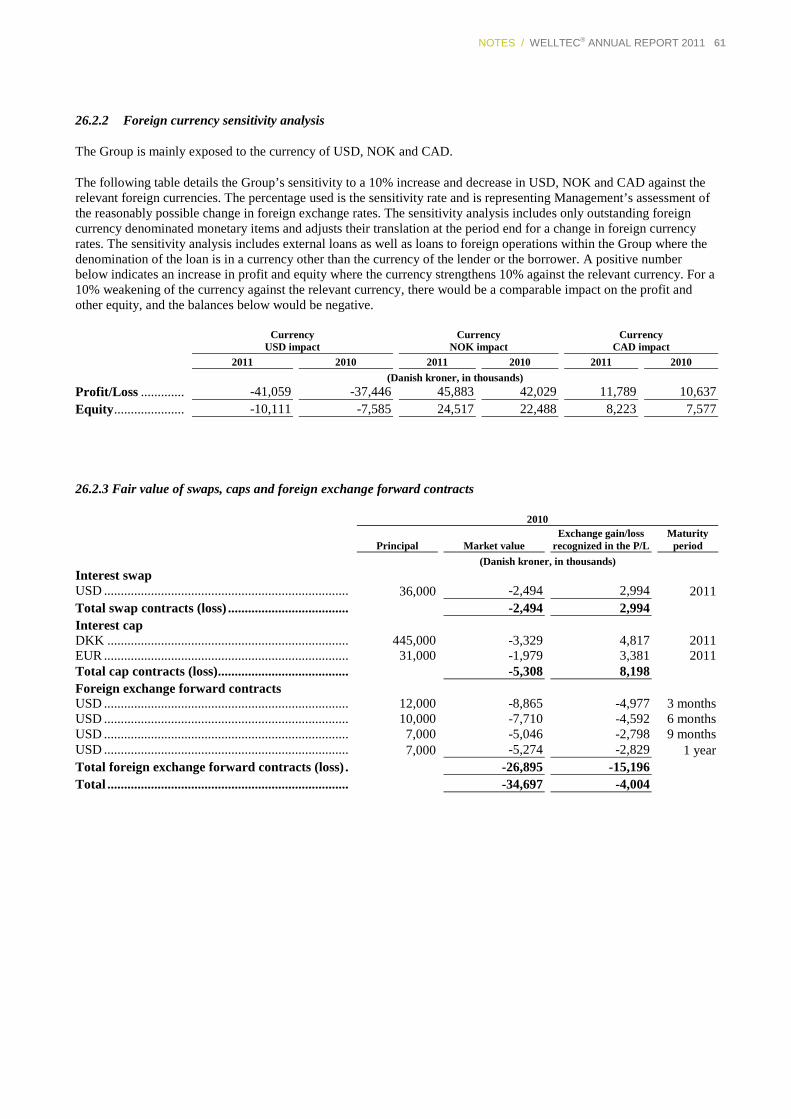
NOTES / WELLTEC® ANNUAL REPORT 2011 61
26.2.2 Foreign currency sensitivity analysis
The Group is mainly exposed to the currency of USD, NOK and CAD.
The following table details the Group’s sensitivity to a 10% increase and decrease in USD, NOK and CAD against the relevant foreign currencies. The percentage used is the sensitivity rate and is representing Management’s assessment of the reasonably possible change in foreign exchange rates. The sensitivity analysis includes only outstanding foreign currency denominated monetary items and adjusts their translation at the period end for a change in foreign currency rates. The sensitivity analysis includes external loans as well as loans to foreign operations within the Group where the denomination of the loan is in a currency other than the currency of the lender or the borrower. A positive number below indicates an increase in profit and equity where the currency strengthens 10% against the relevant currency. For a 10% weakening of the currency against the relevant currency, there would be a comparable impact on the profit and other equity, and the balances below would be negative.
Currency
USD impact Currency
NOK impact Currency
CAD impact 2011 2010 2011 2010 2011 2010 (Danish kroner, in thousands)
Profit/Loss ............. -41,059 -37,446 45,883 42,029 11,789 10,637 Equity ..................... -10,111 -7,585 24,517 22,488 8,223 7,577
26.2.3 Fair value of swaps, caps and foreign exchange forward contracts
2010
Principal Market value Exchange gain/loss
recognized in the P/L Maturity
period (Danish kroner, in thousands)
Interest swap USD ......................................................................... 36,000 -2,494 2,994 2011 Total swap contracts (loss) .................................... -2,494 2,994 Interest cap DKK ........................................................................ 445,000 -3,329 4,817 2011 EUR ......................................................................... 31,000 -1,979 3,381 2011 Total cap contracts (loss) ....................................... -5,308 8,198 Foreign exchange forward contracts USD ......................................................................... 12,000 -8,865 -4,977 3 months USD ......................................................................... 10,000 -7,710 -4,592 6 months USD ......................................................................... 7,000 -5,046 -2,798 9 months USD ......................................................................... 7,000 -5,274 -2,829 1 year Total foreign exchange forward contracts (loss) . -26,895 -15,196 Total ........................................................................ -34,697 -4,004
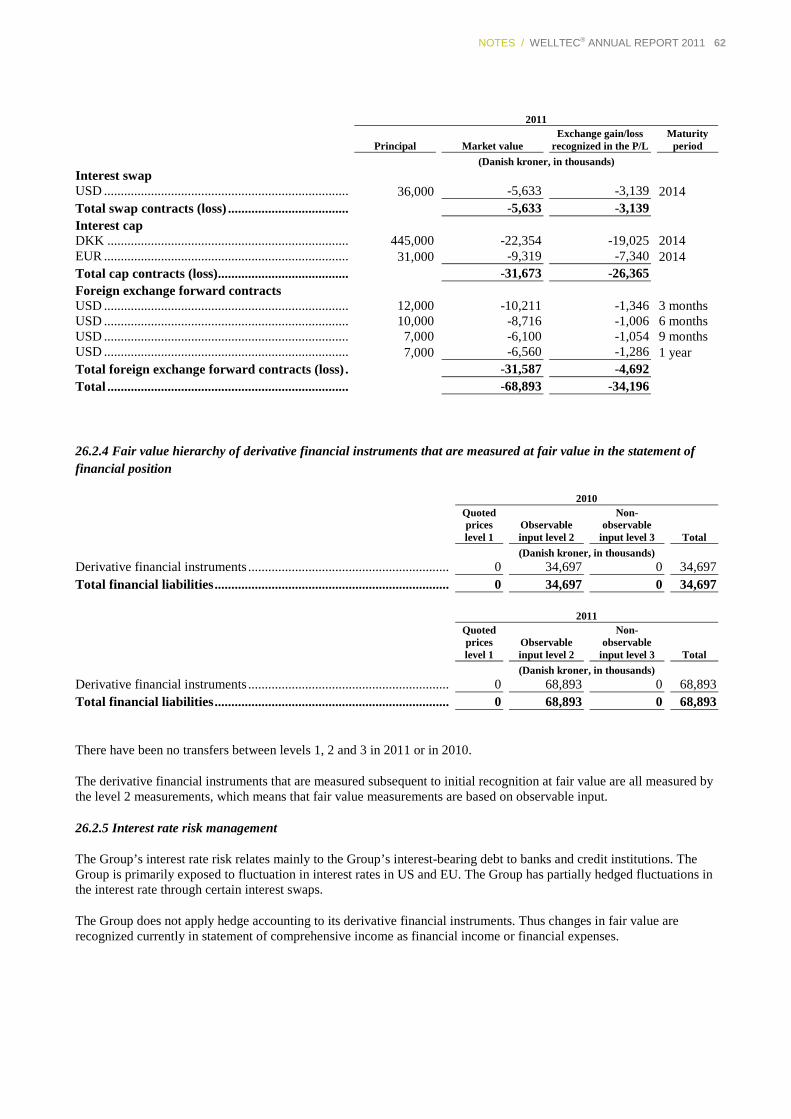
NOTES / WELLTEC® ANNUAL REPORT 2011 62
2011
Principal Market value Exchange gain/loss
recognized in the P/L Maturity
period (Danish kroner, in thousands)
Interest swap USD ......................................................................... 36,000 -5,633 -3,139 2014 Total swap contracts (loss) .................................... -5,633 -3,139 Interest cap DKK ........................................................................ 445,000 -22,354 -19,025 2014 EUR ......................................................................... 31,000 -9,319 -7,340 2014 Total cap contracts (loss) ....................................... -31,673 -26,365 Foreign exchange forward contracts USD ......................................................................... 12,000 -10,211 -1,346 3 months USD ......................................................................... 10,000 -8,716 -1,006 6 months USD ......................................................................... 7,000 -6,100 -1,054 9 months USD ......................................................................... 7,000 -6,560 -1,286 1 year Total foreign exchange forward contracts (loss) . -31,587 -4,692 Total ........................................................................ -68,893 -34,196
26.2.4 Fair value hierarchy of derivative financial instruments that are measured at fair value in the statement of financial position
2010
Quoted prices level 1
Observable input level 2
Non-observable
input level 3 Total (Danish kroner, in thousands)
Derivative financial instruments ............................................................ 0 34,697 0 34,697 Total financial liabilities ...................................................................... 0 34,697 0 34,697
2011
Quoted prices level 1
Observable input level 2
Non-observable
input level 3 Total (Danish kroner, in thousands)
Derivative financial instruments ............................................................ 0 68,893 0 68,893 Total financial liabilities ...................................................................... 0 68,893 0 68,893
There have been no transfers between levels 1, 2 and 3 in 2011 or in 2010.
The derivative financial instruments that are measured subsequent to initial recognition at fair value are all measured by the level 2 measurements, which means that fair value measurements are based on observable input.
26.2.5 Interest rate risk management
The Group’s interest rate risk relates mainly to the Group’s interest-bearing debt to banks and credit institutions. The Group is primarily exposed to fluctuation in interest rates in US and EU. The Group has partially hedged fluctuations in the interest rate through certain interest swaps.
The Group does not apply hedge accounting to its derivative financial instruments. Thus changes in fair value are recognized currently in statement of comprehensive income as financial income or financial expenses.
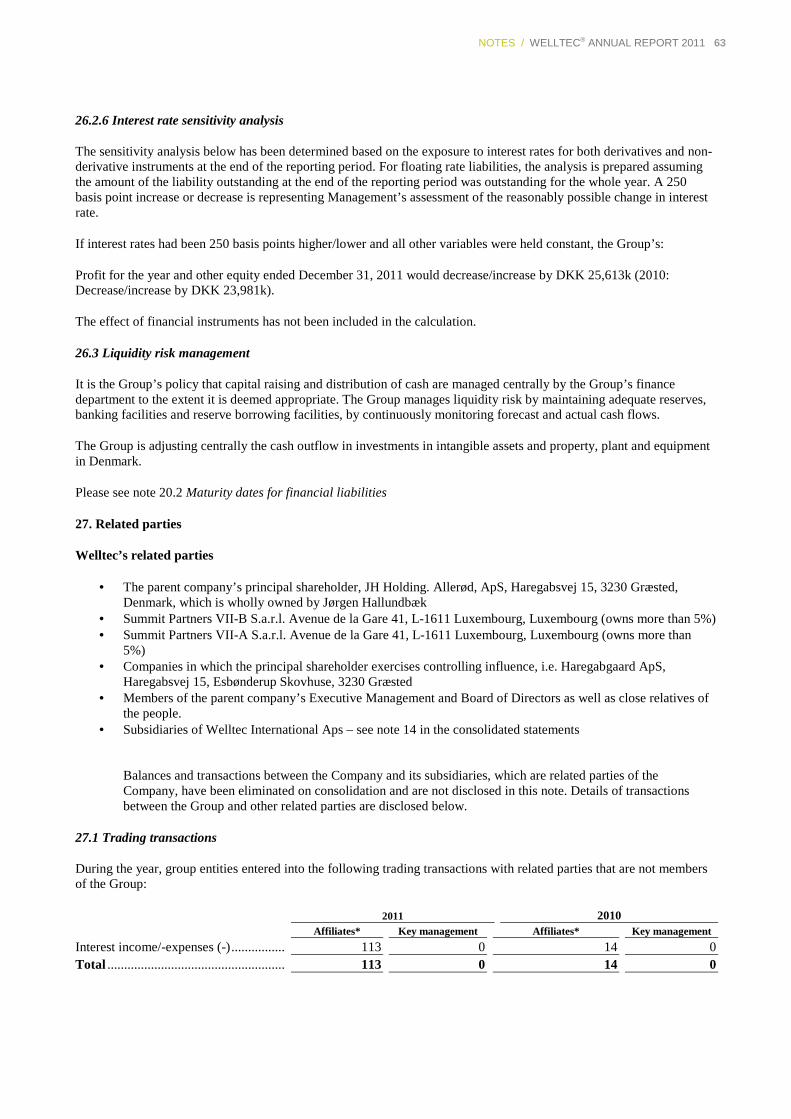
NOTES / WELLTEC® ANNUAL REPORT 2011 63
26.2.6 Interest rate sensitivity analysis
The sensitivity analysis below has been determined based on the exposure to interest rates for both derivatives and non-derivative instruments at the end of the reporting period. For floating rate liabilities, the analysis is prepared assuming the amount of the liability outstanding at the end of the reporting period was outstanding for the whole year. A 250 basis point increase or decrease is representing Management’s assessment of the reasonably possible change in interest rate.
If interest rates had been 250 basis points higher/lower and all other variables were held constant, the Group’s:
Profit for the year and other equity ended December 31, 2011 would decrease/increase by DKK 25,613k (2010: Decrease/increase by DKK 23,981k).
The effect of financial instruments has not been included in the calculation.
26.3 Liquidity risk management
It is the Group’s policy that capital raising and distribution of cash are managed centrally by the Group’s finance department to the extent it is deemed appropriate. The Group manages liquidity risk by maintaining adequate reserves, banking facilities and reserve borrowing facilities, by continuously monitoring forecast and actual cash flows.
The Group is adjusting centrally the cash outflow in investments in intangible assets and property, plant and equipment in Denmark.
Please see note 20.2 Maturity dates for financial liabilities
27. Related parties
Welltec’s related parties
• The parent company’s principal shareholder, JH Holding. Allerød, ApS, Haregabsvej 15, 3230 Græsted, Denmark, which is wholly owned by Jørgen Hallundbæk
• Summit Partners VII-B S.a.r.l. Avenue de la Gare 41, L-1611 Luxembourg, Luxembourg (owns more than 5%) • Summit Partners VII-A S.a.r.l. Avenue de la Gare 41, L-1611 Luxembourg, Luxembourg (owns more than
5%) • Companies in which the principal shareholder exercises controlling influence, i.e. Haregabgaard ApS,
Haregabsvej 15, Esbønderup Skovhuse, 3230 Græsted • Members of the parent company’s Executive Management and Board of Directors as well as close relatives of
the people. • Subsidiaries of Welltec International Aps – see note 14 in the consolidated statements
Balances and transactions between the Company and its subsidiaries, which are related parties of the Company, have been eliminated on consolidation and are not disclosed in this note. Details of transactions between the Group and other related parties are disclosed below.
27.1 Trading transactions
During the year, group entities entered into the following trading transactions with related parties that are not members of the Group:
2011 2010 Affiliates* Key management Affiliates* Key management
Interest income/-expenses (-) ................ 113 0 14 0 Total ..................................................... 113 0 14 0
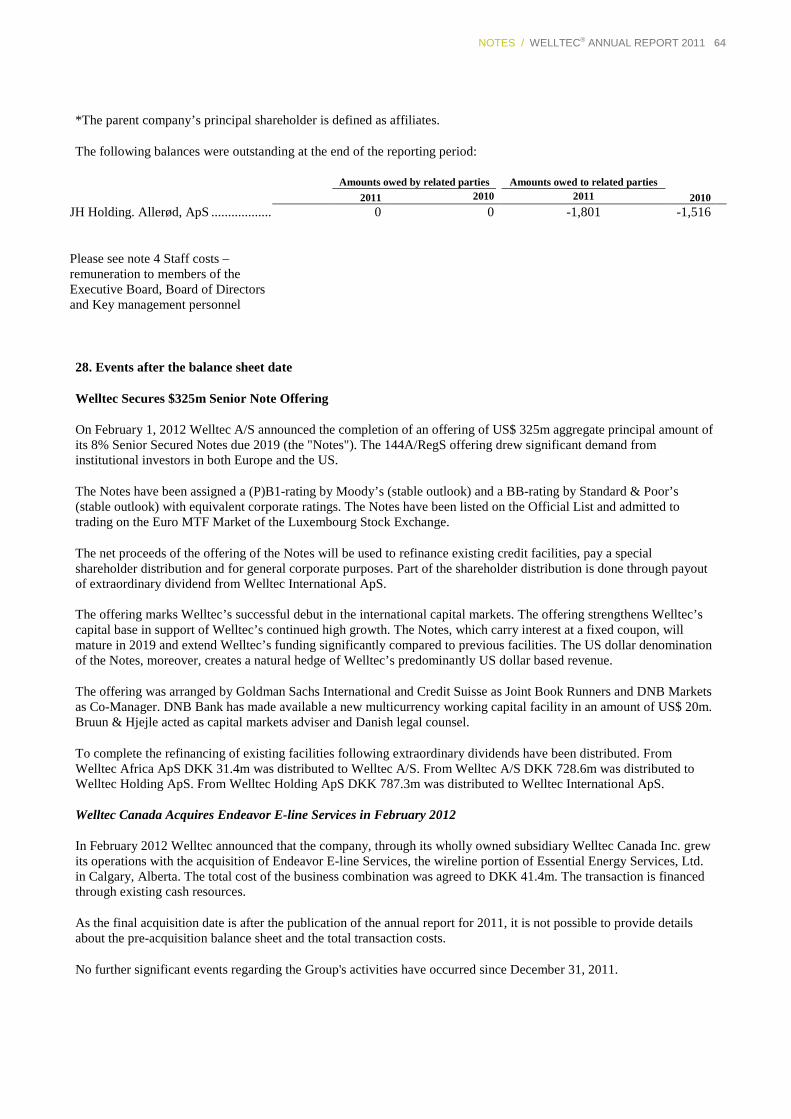
NOTES / WELLTEC® ANNUAL REPORT 2011 64
*The parent company’s principal shareholder is defined as affiliates.
The following balances were outstanding at the end of the reporting period:
Amounts owed by related parties Amounts owed to related parties
2011 2010 2011 2010
JH Holding. Allerød, ApS ................................ 0 0 -1,801 -1,516
Please see note 4 Staff costs – remuneration to members of the Executive Board, Board of Directors and Key management personnel
28. Events after the balance sheet date
Welltec Secures $325m Senior Note Offering
On February 1, 2012 Welltec A/S announced the completion of an offering of US$ 325m aggregate principal amount of its 8% Senior Secured Notes due 2019 (the "Notes"). The 144A/RegS offering drew significant demand from institutional investors in both Europe and the US.
The Notes have been assigned a (P)B1-rating by Moody’s (stable outlook) and a BB-rating by Standard & Poor’s (stable outlook) with equivalent corporate ratings. The Notes have been listed on the Official List and admitted to trading on the Euro MTF Market of the Luxembourg Stock Exchange.
The net proceeds of the offering of the Notes will be used to refinance existing credit facilities, pay a special shareholder distribution and for general corporate purposes. Part of the shareholder distribution is done through payout of extraordinary dividend from Welltec International ApS. The offering marks Welltec’s successful debut in the international capital markets. The offering strengthens Welltec’s capital base in support of Welltec’s continued high growth. The Notes, which carry interest at a fixed coupon, will mature in 2019 and extend Welltec’s funding significantly compared to previous facilities. The US dollar denomination of the Notes, moreover, creates a natural hedge of Welltec’s predominantly US dollar based revenue.
The offering was arranged by Goldman Sachs International and Credit Suisse as Joint Book Runners and DNB Markets as Co-Manager. DNB Bank has made available a new multicurrency working capital facility in an amount of US$ 20m. Bruun & Hjejle acted as capital markets adviser and Danish legal counsel.
To complete the refinancing of existing facilities following extraordinary dividends have been distributed. From Welltec Africa ApS DKK 31.4m was distributed to Welltec A/S. From Welltec A/S DKK 728.6m was distributed to Welltec Holding ApS. From Welltec Holding ApS DKK 787.3m was distributed to Welltec International ApS. Welltec Canada Acquires Endeavor E-line Services in February 2012
In February 2012 Welltec announced that the company, through its wholly owned subsidiary Welltec Canada Inc. grew its operations with the acquisition of Endeavor E-line Services, the wireline portion of Essential Energy Services, Ltd. in Calgary, Alberta. The total cost of the business combination was agreed to DKK 41.4m. The transaction is financed through existing cash resources.
As the final acquisition date is after the publication of the annual report for 2011, it is not possible to provide details about the pre-acquisition balance sheet and the total transaction costs.
No further significant events regarding the Group's activities have occurred since December 31, 2011.

NOTES / WELLTEC® ANNUAL REPORT 2011 65
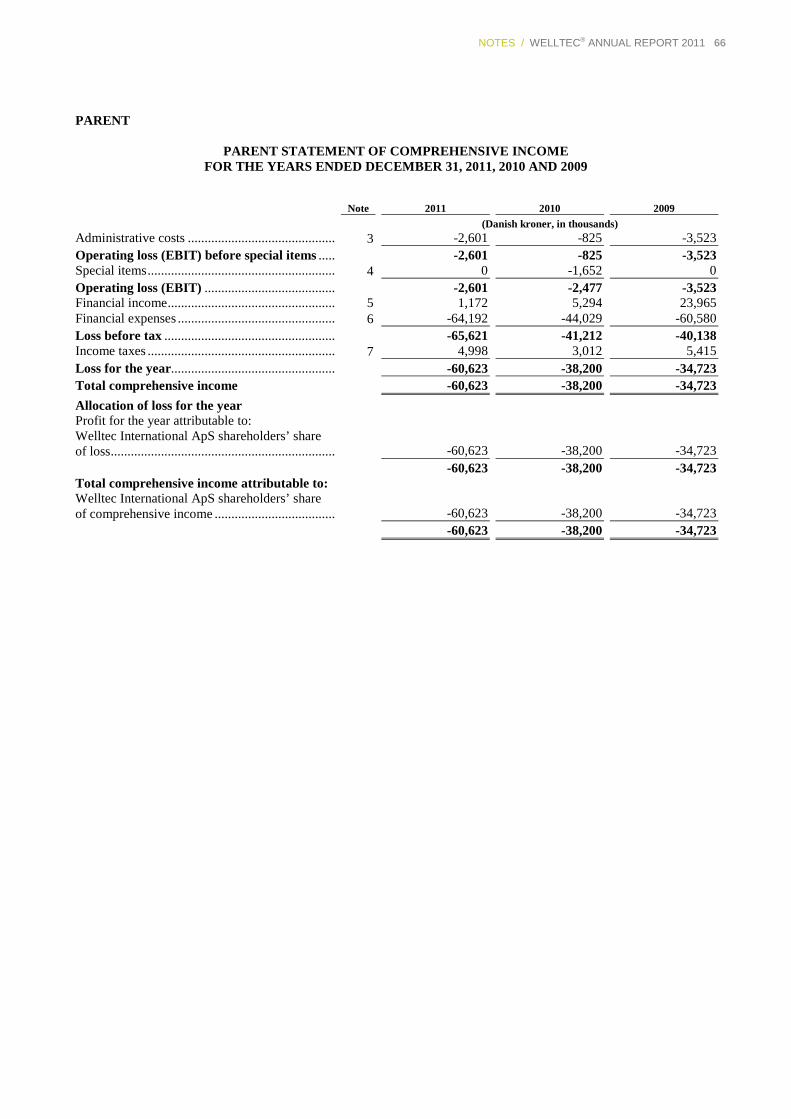
NOTES / WELLTEC® ANNUAL REPORT 2011 66
PARENT
PARENT STATEMENT OF COMPREHENSIVE INCOME FOR THE YEARS ENDED DECEMBER 31, 2011, 2010 AND 2009
Note
2011
2010
2009
(Danish kroner, in thousands) Administrative costs ............................................ 3 -2,601 -825 -3,523 Operating loss (EBIT) before special items ..... -2,601 -825 -3,523 Special items ........................................................ 4 0 -1,652 0 Operating loss (EBIT) ....................................... -2,601 -2,477 -3,523 Financial income .................................................. 5 1,172 5,294 23,965 Financial expenses ............................................... 6 -64,192 -44,029 -60,580 Loss before tax ................................................... -65,621 -41,212 -40,138 Income taxes ........................................................ 7 4,998 3,012 5,415 Loss for the year................................................. -60,623 -38,200 -34,723 Total comprehensive income -60,623 -38,200 -34,723
Allocation of loss for the year Profit for the year attributable to: Welltec International ApS shareholders’ share of loss ................................................................... -60,623 -38,200 -34,723 -60,623 -38,200 -34,723 Total comprehensive income attributable to: Welltec International ApS shareholders’ share of comprehensive income .................................... -60,623 -38,200 -34,723 -60,623 -38,200 -34,723
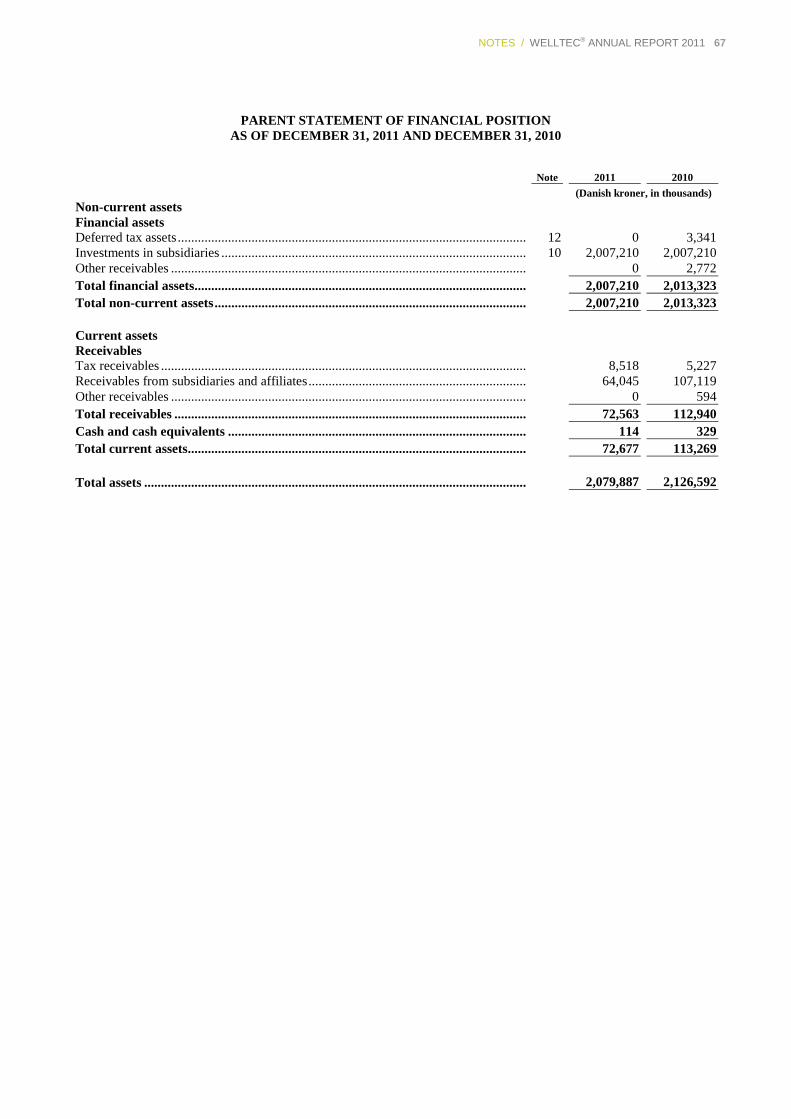
NOTES / WELLTEC® ANNUAL REPORT 2011 67
PARENT STATEMENT OF FINANCIAL POSITION AS OF DECEMBER 31, 2011 AND DECEMBER 31, 2010
Note
2011
2010
(Danish kroner, in thousands) Non-current assets Financial assets Deferred tax assets ........................................................................................................ 12 0 3,341 Investments in subsidiaries ........................................................................................... 10 2,007,210 2,007,210 Other receivables .......................................................................................................... 0 2,772 Total financial assets ................................................................................................... 2,007,210 2,013,323 Total non-current assets ............................................................................................. 2,007,210 2,013,323 Current assets Receivables Tax receivables ............................................................................................................. 8,518 5,227 Receivables from subsidiaries and affiliates ................................................................. 64,045 107,119 Other receivables .......................................................................................................... 0 594 Total receivables ......................................................................................................... 72,563 112,940 Cash and cash equivalents ......................................................................................... 114 329 Total current assets..................................................................................................... 72,677 113,269 Total assets .................................................................................................................. 2,079,887 2,126,592
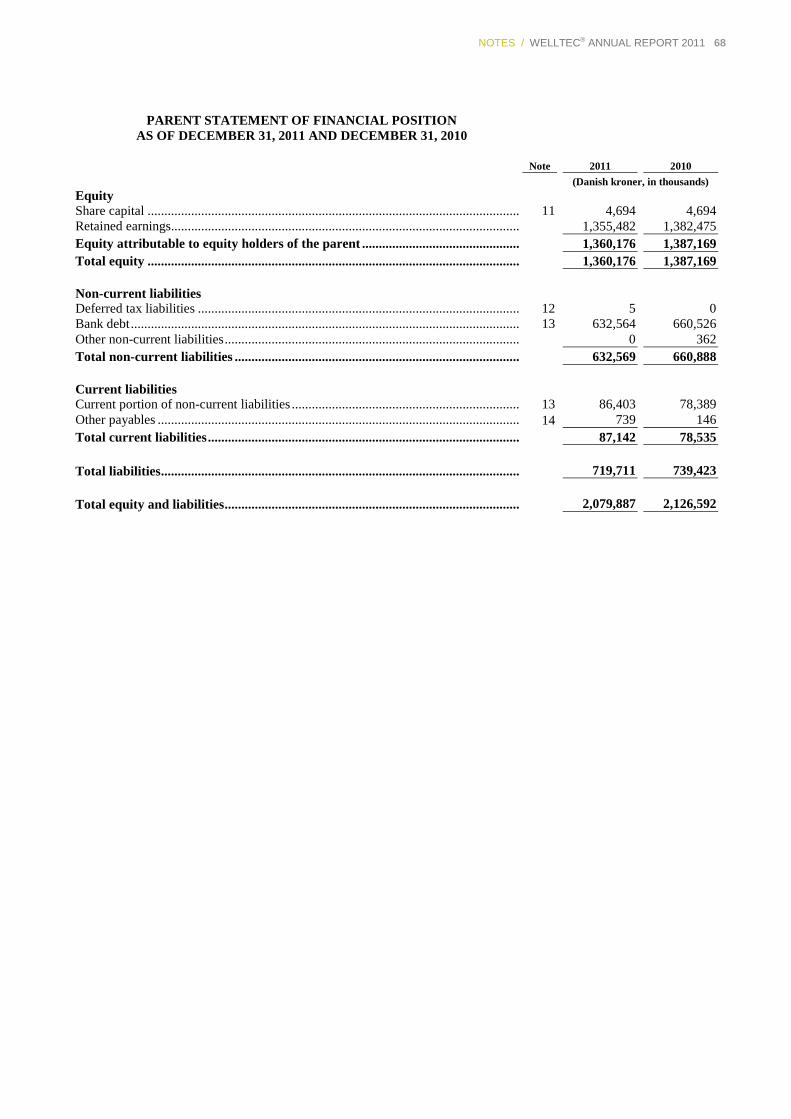
NOTES / WELLTEC® ANNUAL REPORT 2011 68
PARENT STATEMENT OF FINANCIAL POSITION AS OF DECEMBER 31, 2011 AND DECEMBER 31, 2010
Note 2011 2010 (Danish kroner, in thousands)
Equity Share capital ............................................................................................................... 11 4,694 4,694 Retained earnings........................................................................................................ 1,355,482 1,382,475 Equity attributable to equity holders of the parent ............................................... 1,360,176 1,387,169 Total equity ............................................................................................................... 1,360,176 1,387,169 Non-current liabilities Deferred tax liabilities ................................................................................................ 12 5 0 Bank debt .................................................................................................................... 13 632,564 660,526 Other non-current liabilities ........................................................................................ 0 362 Total non-current liabilities ..................................................................................... 632,569 660,888 Current liabilities Current portion of non-current liabilities .................................................................... 13 86,403 78,389 Other payables ............................................................................................................ 14 739 146 Total current liabilities ............................................................................................. 87,142 78,535 Total liabilities ........................................................................................................... 719,711 739,423 Total equity and liabilities ........................................................................................ 2,079,887 2,126,592
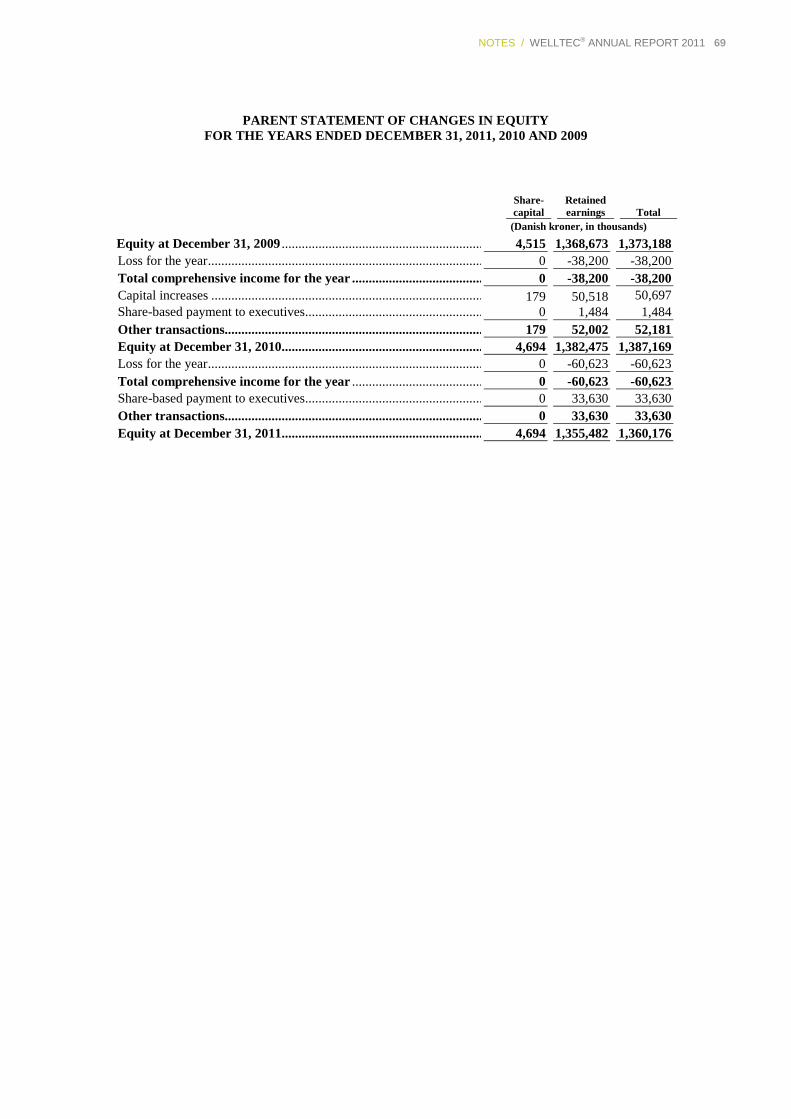
NOTES / WELLTEC® ANNUAL REPORT 2011 69
PARENT STATEMENT OF CHANGES IN EQUITY FOR THE YEARS ENDED DECEMBER 31, 2011, 2010 AND 2009
Share- capital
Retained earnings Total
(Danish kroner, in thousands) Equity at December 31, 2009 ................................................................ 4,515 1,368,673 1,373,188 Loss for the year ................................................................................................0 -38,200 -38,200 Total comprehensive income for the year ..............................................................0 -38,200 -38,200 Capital increases ................................................................................................179 50,518 50,697 Share-based payment to executives................................................................ 0 1,484 1,484 Other transactions................................................................................................179 52,002 52,181 Equity at December 31, 2010................................................................ 4,694 1,382,475 1,387,169 Loss for the year ................................................................................................0 -60,623 -60,623 Total comprehensive income for the year ..............................................................0 -60,623 -60,623 Share-based payment to executives................................................................ 0 33,630 33,630 Other transactions................................................................................................0 33,630 33,630 Equity at December 31, 2011................................................................ 4,694 1,355,482 1,360,176
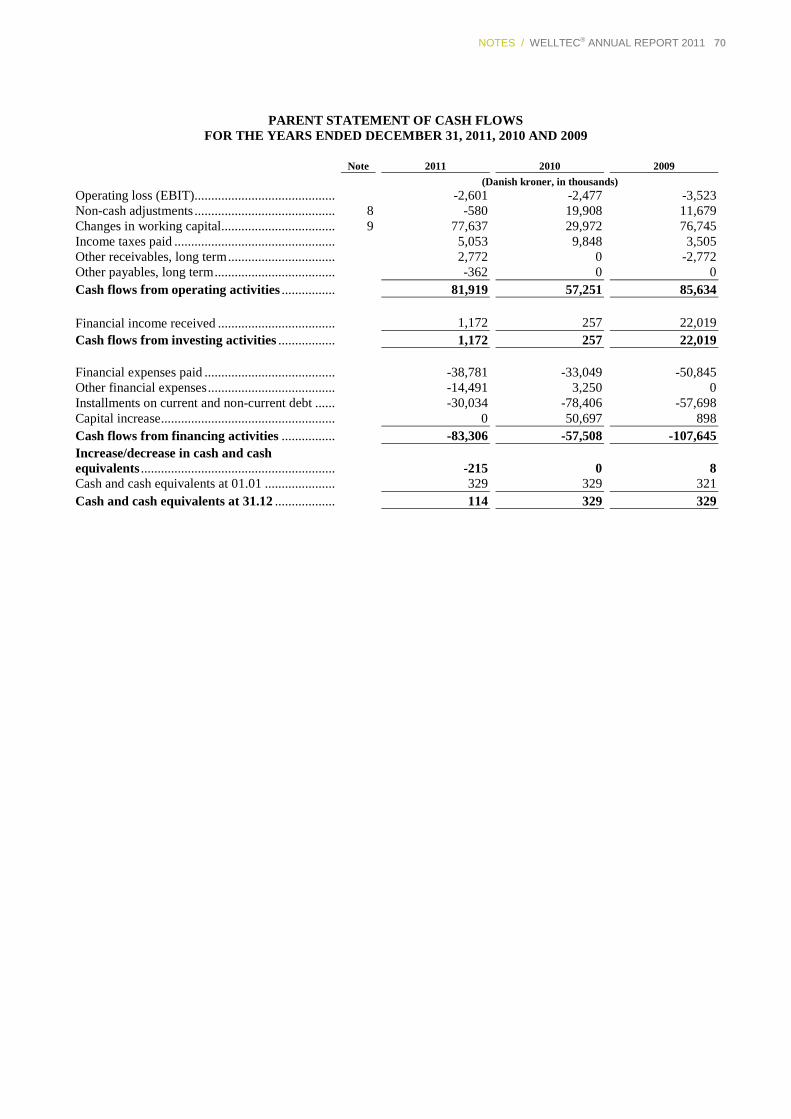
NOTES / WELLTEC® ANNUAL REPORT 2011 70
PARENT STATEMENT OF CASH FLOWS FOR THE YEARS ENDED DECEMBER 31, 2011, 2010 AND 2009
Note 2011 2010 2009 (Danish kroner, in thousands)
Operating loss (EBIT) .......................................... -2,601 -2,477 -3,523 Non-cash adjustments .......................................... 8 -580 19,908 11,679 Changes in working capital.................................. 9 77,637 29,972 76,745 Income taxes paid ................................................ 5,053 9,848 3,505 Other receivables, long term ................................ 2,772 0 -2,772 Other payables, long term .................................... -362 0 0 Cash flows from operating activities ................ 81,919 57,251 85,634 Financial income received ................................... 1,172 257 22,019 Cash flows from investing activities ................. 1,172 257 22,019 Financial expenses paid ....................................... -38,781 -33,049 -50,845 Other financial expenses ...................................... -14,491 3,250 0 Installments on current and non-current debt ...... -30,034 -78,406 -57,698 Capital increase .................................................... 0 50,697 898 Cash flows from financing activities ................ -83,306 -57,508 -107,645 Increase/decrease in cash and cash equivalents .......................................................... -215 0 8 Cash and cash equivalents at 01.01 ..................... 329 329 321 Cash and cash equivalents at 31.12 .................. 114 329 329
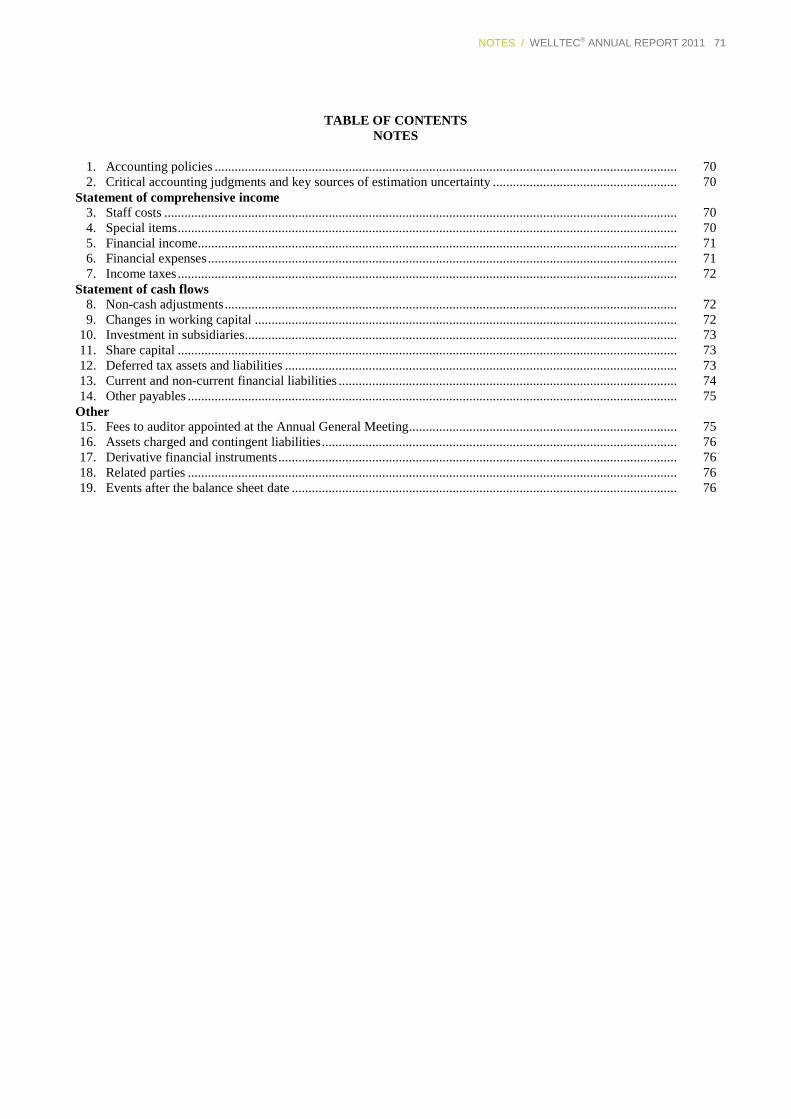
NOTES / WELLTEC® ANNUAL REPORT 2011 71
TABLE OF CONTENTS NOTES
1. Accounting policies .......................................................................................................................................... 70 2. Critical accounting judgments and key sources of estimation uncertainty ....................................................... 70
Statement of comprehensive income 3. Staff costs ......................................................................................................................................................... 70 4. Special items ..................................................................................................................................................... 70 5. Financial income............................................................................................................................................... 71 6. Financial expenses ............................................................................................................................................ 71 7. Income taxes ..................................................................................................................................................... 72
Statement of cash flows 8. Non-cash adjustments ....................................................................................................................................... 72 9. Changes in working capital .............................................................................................................................. 72
10. Investment in subsidiaries................................................................................................................................. 73 11. Share capital ..................................................................................................................................................... 73 12. Deferred tax assets and liabilities ..................................................................................................................... 73 13. Current and non-current financial liabilities ..................................................................................................... 74 14. Other payables .................................................................................................................................................. 75
Other 15. Fees to auditor appointed at the Annual General Meeting ................................................................................ 75 16. Assets charged and contingent liabilities .......................................................................................................... 76 17. Derivative financial instruments ....................................................................................................................... 76 18. Related parties .................................................................................................................................................. 76 19. Events after the balance sheet date ................................................................................................................... 76
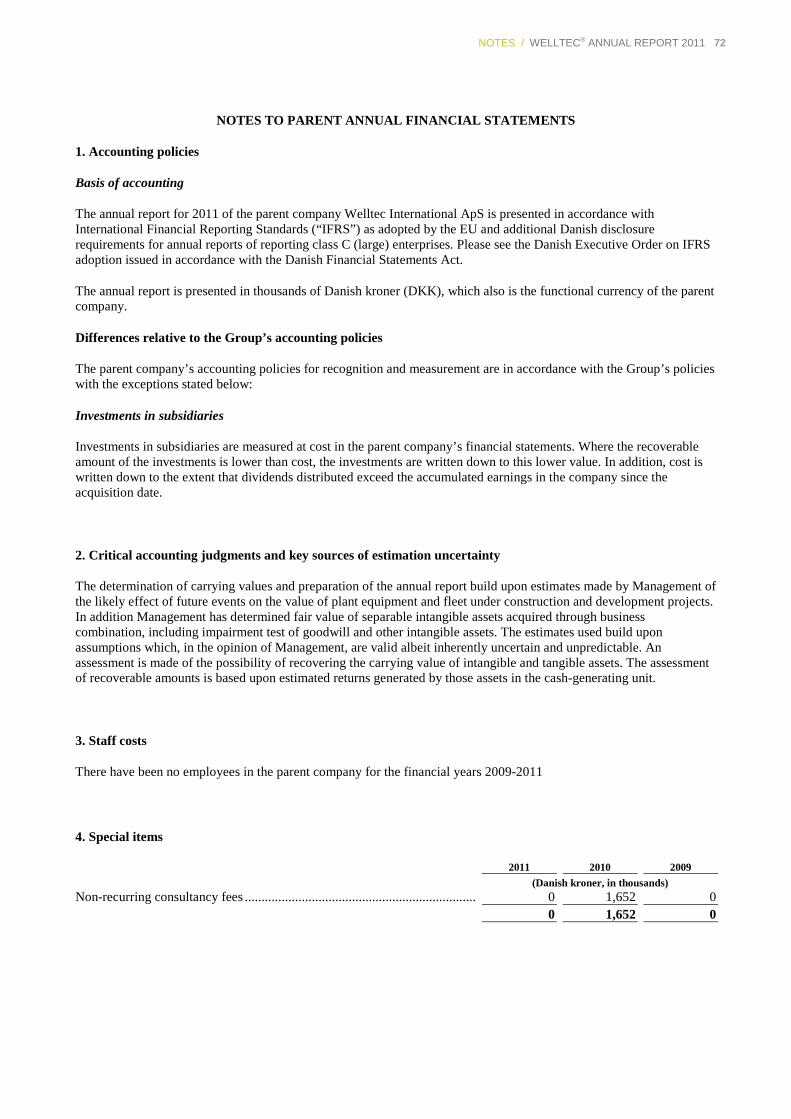
NOTES / WELLTEC® ANNUAL REPORT 2011 72
NOTES TO PARENT ANNUAL FINANCIAL STATEMENTS
1. Accounting policies
Basis of accounting
The annual report for 2011 of the parent company Welltec International ApS is presented in accordance with International Financial Reporting Standards (“IFRS”) as adopted by the EU and additional Danish disclosure requirements for annual reports of reporting class C (large) enterprises. Please see the Danish Executive Order on IFRS adoption issued in accordance with the Danish Financial Statements Act.
The annual report is presented in thousands of Danish kroner (DKK), which also is the functional currency of the parent company.
Differences relative to the Group’s accounting policies
The parent company’s accounting policies for recognition and measurement are in accordance with the Group’s policies with the exceptions stated below:
Investments in subsidiaries
Investments in subsidiaries are measured at cost in the parent company’s financial statements. Where the recoverable amount of the investments is lower than cost, the investments are written down to this lower value. In addition, cost is written down to the extent that dividends distributed exceed the accumulated earnings in the company since the acquisition date.
2. Critical accounting judgments and key sources of estimation uncertainty
The determination of carrying values and preparation of the annual report build upon estimates made by Management of the likely effect of future events on the value of plant equipment and fleet under construction and development projects. In addition Management has determined fair value of separable intangible assets acquired through business combination, including impairment test of goodwill and other intangible assets. The estimates used build upon assumptions which, in the opinion of Management, are valid albeit inherently uncertain and unpredictable. An assessment is made of the possibility of recovering the carrying value of intangible and tangible assets. The assessment of recoverable amounts is based upon estimated returns generated by those assets in the cash-generating unit.
3. Staff costs
There have been no employees in the parent company for the financial years 2009-2011
4. Special items
2011 2010 2009 (Danish kroner, in thousands)
Non-recurring consultancy fees ..................................................................... 0 1,652 0 0 1,652 0
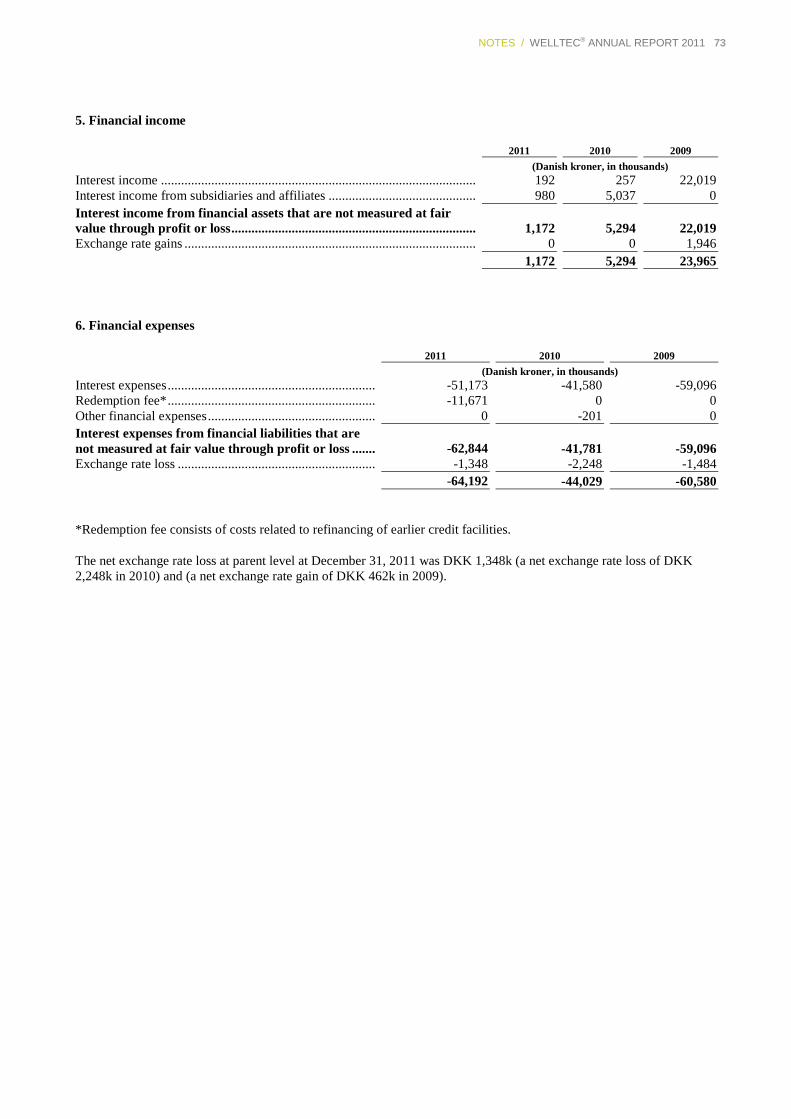
NOTES / WELLTEC® ANNUAL REPORT 2011 73
5. Financial income
2011 2010 2009 (Danish kroner, in thousands)
Interest income .............................................................................................. 192 257 22,019 Interest income from subsidiaries and affiliates ............................................ 980 5,037 0 Interest income from financial assets that are not measured at fair value through profit or loss ......................................................................... 1,172 5,294 22,019 Exchange rate gains ....................................................................................... 0 0 1,946 1,172 5,294 23,965
6. Financial expenses
2011 2010 2009 (Danish kroner, in thousands)
Interest expenses .............................................................. -51,173 -41,580 -59,096 Redemption fee* .............................................................. -11,671 0 0 Other financial expenses .................................................. 0 -201 0 Interest expenses from financial liabilities that are not measured at fair value through profit or loss ....... -62,844 -41,781 -59,096 Exchange rate loss ........................................................... -1,348 -2,248 -1,484 -64,192 -44,029 -60,580
*Redemption fee consists of costs related to refinancing of earlier credit facilities.
The net exchange rate loss at parent level at December 31, 2011 was DKK 1,348k (a net exchange rate loss of DKK 2,248k in 2010) and (a net exchange rate gain of DKK 462k in 2009).
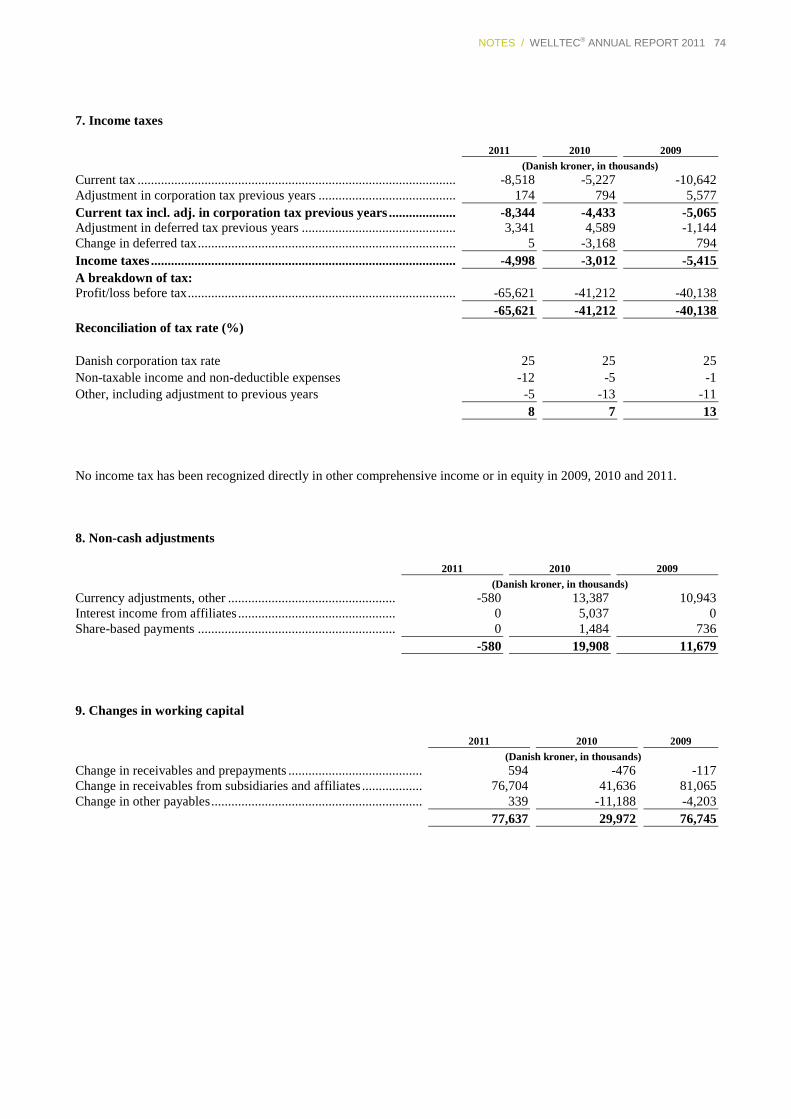
NOTES / WELLTEC® ANNUAL REPORT 2011 74
7. Income taxes
2011 2010 2009 (Danish kroner, in thousands)
Current tax ............................................................................................... -8,518 -5,227 -10,642 Adjustment in corporation tax previous years ......................................... 174 794 5,577 Current tax incl. adj. in corporation tax previous years .................... -8,344 -4,433 -5,065 Adjustment in deferred tax previous years .............................................. 3,341 4,589 -1,144 Change in deferred tax ............................................................................. 5 -3,168 794 Income taxes ........................................................................................... -4,998 -3,012 -5,415 A breakdown of tax: Profit/loss before tax ................................................................................ -65,621 -41,212 -40,138 -65,621 -41,212 -40,138 Reconciliation of tax rate (%) Danish corporation tax rate 25 25 25 Non-taxable income and non-deductible expenses -12 -5 -1 Other, including adjustment to previous years -5 -13 -11 8 7 13
No income tax has been recognized directly in other comprehensive income or in equity in 2009, 2010 and 2011.
8. Non-cash adjustments
2011 2010 2009 (Danish kroner, in thousands)
Currency adjustments, other .................................................. -580 13,387 10,943 Interest income from affiliates ............................................... 0 5,037 0 Share-based payments ........................................................... 0 1,484 736 -580 19,908 11,679
9. Changes in working capital
2011 2010 2009 (Danish kroner, in thousands)
Change in receivables and prepayments ........................................ 594 -476 -117 Change in receivables from subsidiaries and affiliates .................. 76,704 41,636 81,065 Change in other payables ............................................................... 339 -11,188 -4,203 77,637 29,972 76,745
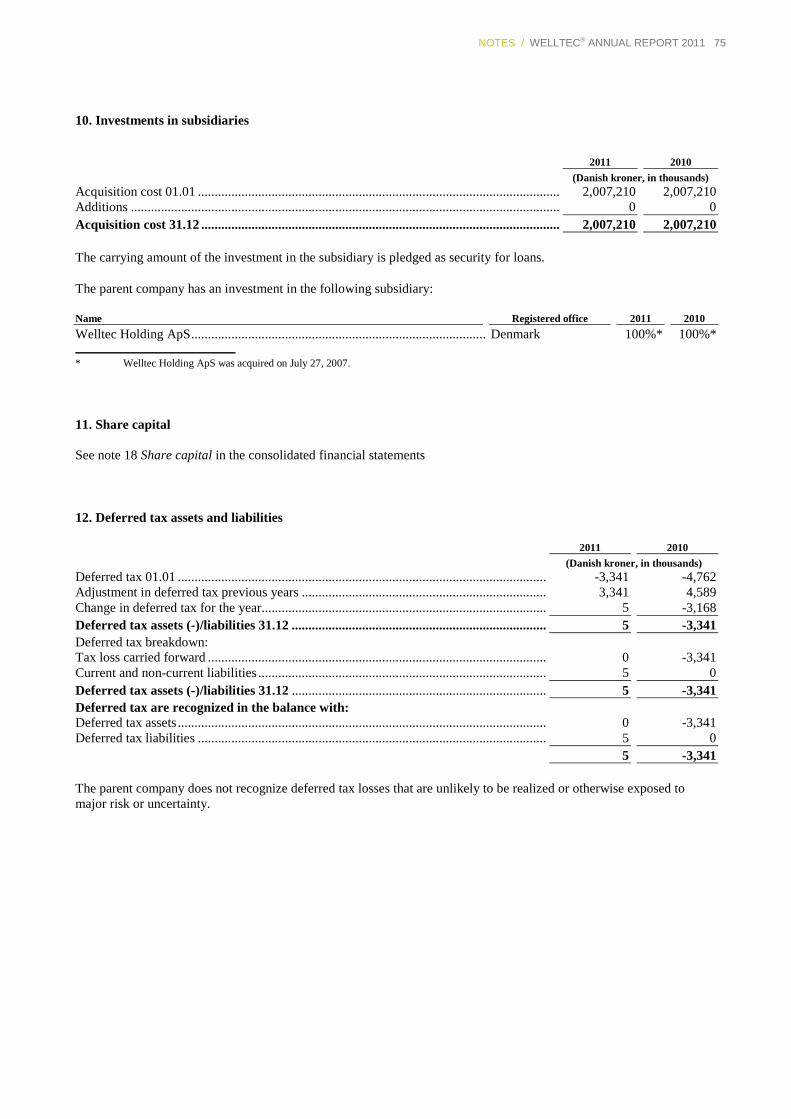
NOTES / WELLTEC® ANNUAL REPORT 2011 75
10. Investments in subsidiaries
2011
2010
(Danish kroner, in thousands) Acquisition cost 01.01 ............................................................................................................ 2,007,210 2,007,210 Additions ................................................................................................................................ 0 0 Acquisition cost 31.12 ........................................................................................................... 2,007,210 2,007,210
The carrying amount of the investment in the subsidiary is pledged as security for loans.
The parent company has an investment in the following subsidiary:
Name Registered office 2011 2010 Welltec Holding ApS ........................................................................................ Denmark 100%* 100%*
* Welltec Holding ApS was acquired on July 27, 2007.
11. Share capital
See note 18 Share capital in the consolidated financial statements
12. Deferred tax assets and liabilities
2011 2010 (Danish kroner, in thousands)
Deferred tax 01.01 .............................................................................................................. -3,341 -4,762 Adjustment in deferred tax previous years ......................................................................... 3,341 4,589 Change in deferred tax for the year..................................................................................... 5 -3,168 Deferred tax assets (-)/liabilities 31.12 ............................................................................ 5 -3,341 Deferred tax breakdown: Tax loss carried forward ..................................................................................................... 0 -3,341 Current and non-current liabilities ...................................................................................... 5 0 Deferred tax assets (-)/liabilities 31.12 ............................................................................ 5 -3,341 Deferred tax are recognized in the balance with: Deferred tax assets .............................................................................................................. 0 -3,341 Deferred tax liabilities ........................................................................................................ 5 0 5 -3,341
The parent company does not recognize deferred tax losses that are unlikely to be realized or otherwise exposed to major risk or uncertainty.
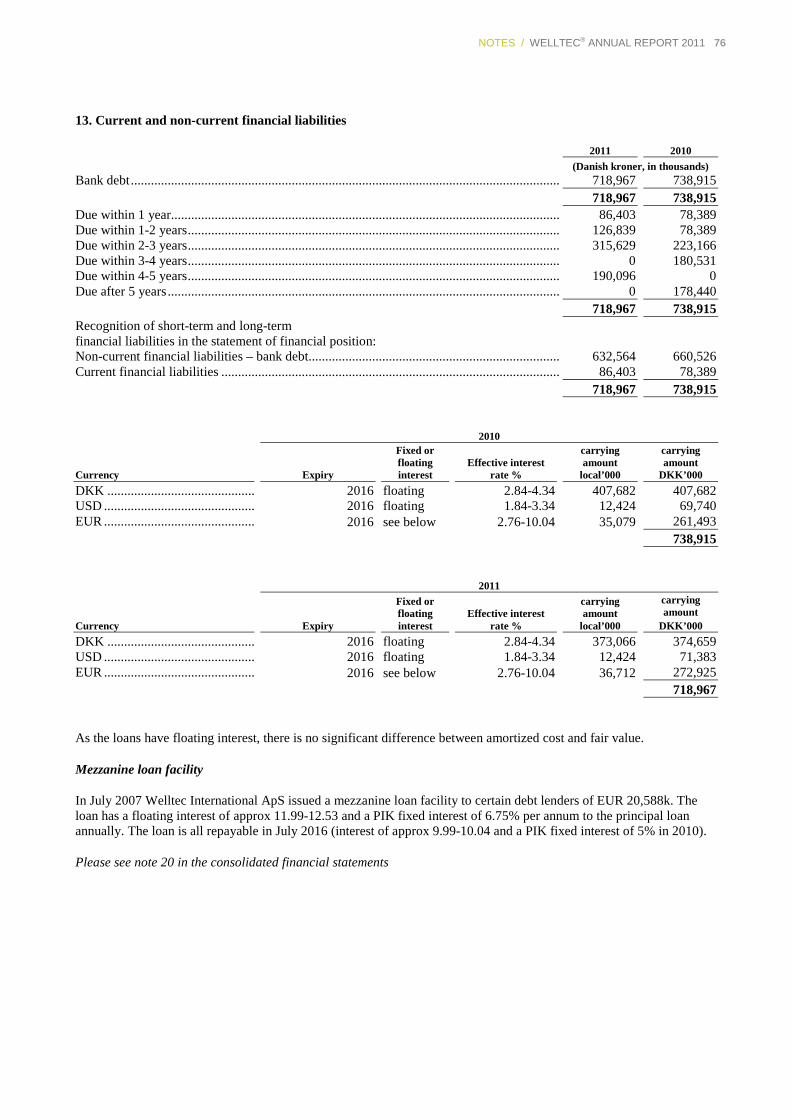
NOTES / WELLTEC® ANNUAL REPORT 2011 76
13. Current and non-current financial liabilities
2011 2010 (Danish kroner, in thousands)
Bank debt ................................................................................................................................ 718,967 738,915 718,967 738,915 Due within 1 year.................................................................................................................... 86,403 78,389 Due within 1-2 years ............................................................................................................... 126,839 78,389 Due within 2-3 years ............................................................................................................... 315,629 223,166 Due within 3-4 years ............................................................................................................... 0 180,531 Due within 4-5 years ............................................................................................................... 190,096 0 Due after 5 years ..................................................................................................................... 0 178,440 718,967 738,915 Recognition of short-term and long-term financial liabilities in the statement of financial position: Non-current financial liabilities – bank debt........................................................................... 632,564 660,526 Current financial liabilities ..................................................................................................... 86,403 78,389 718,967 738,915
2010
Currency Expiry
Fixed or floating interest
Effective interest rate %
carrying amount
local’000
carrying amount
DKK’000 DKK ............................................ 2016 floating 2.84-4.34 407,682 407,682 USD ............................................. 2016 floating 1.84-3.34 12,424 69,740 EUR ............................................. 2016 see below 2.76-10.04 35,079 261,493 738,915
2011
Currency Expiry
Fixed or floating interest
Effective interest rate %
carrying amount
local’000
carrying amount
DKK’000 DKK ............................................ 2016 floating 2.84-4.34 373,066 374,659 USD ............................................. 2016 floating 1.84-3.34 12,424 71,383 EUR ............................................. 2016 see below 2.76-10.04 36,712 272,925 718,967
As the loans have floating interest, there is no significant difference between amortized cost and fair value.
Mezzanine loan facility
In July 2007 Welltec International ApS issued a mezzanine loan facility to certain debt lenders of EUR 20,588k. The loan has a floating interest of approx 11.99-12.53 and a PIK fixed interest of 6.75% per annum to the principal loan annually. The loan is all repayable in July 2016 (interest of approx 9.99-10.04 and a PIK fixed interest of 5% in 2010).
Please see note 20 in the consolidated financial statements
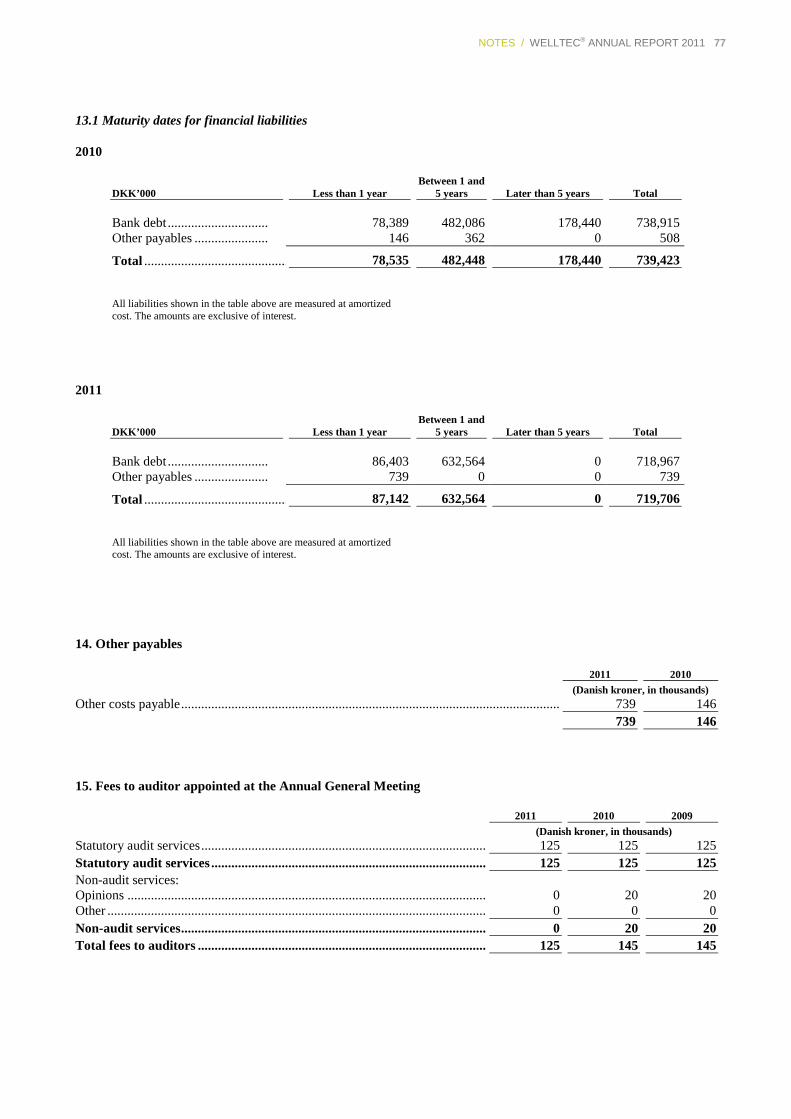
NOTES / WELLTEC® ANNUAL REPORT 2011 77
13.1 Maturity dates for financial liabilities
2010
DKK’000 Less than 1 year Between 1 and
5 years Later than 5 years Total
Bank debt .............................. 78,389 482,086 178,440 738,915 Other payables ...................... 146 362 0 508
Total ................................................. 78,535 482,448 178,440 739,423
All liabilities shown in the table above are measured at amortized cost. The amounts are exclusive of interest.
2011
DKK’000 Less than 1 year Between 1 and
5 years Later than 5 years Total
Bank debt .............................. 86,403 632,564 0 718,967 Other payables ...................... 739 0 0 739
Total ................................................. 87,142 632,564 0 719,706
All liabilities shown in the table above are measured at amortized cost. The amounts are exclusive of interest.
14. Other payables
2011 2010 (Danish kroner, in thousands)
Other costs payable ................................................................................................................. 739 146 739 146
15. Fees to auditor appointed at the Annual General Meeting
2011 2010 2009 (Danish kroner, in thousands)
Statutory audit services ..................................................................................... 125 125 125 Statutory audit services .................................................................................. 125 125 125 Non-audit services: Opinions ........................................................................................................... 0 20 20 Other ................................................................................................................. 0 0 0 Non-audit services ........................................................................................... 0 20 20 Total fees to auditors ...................................................................................... 125 145 145
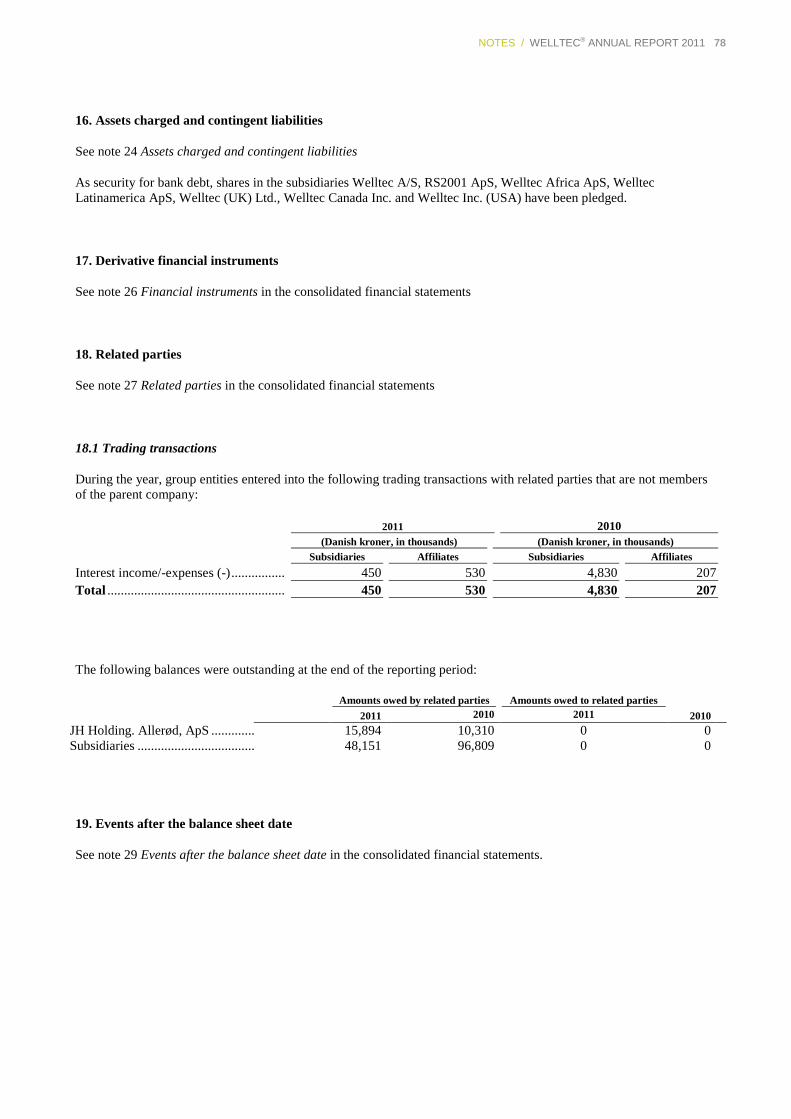
NOTES / WELLTEC® ANNUAL REPORT 2011 78
16. Assets charged and contingent liabilities
See note 24 Assets charged and contingent liabilities
As security for bank debt, shares in the subsidiaries Welltec A/S, RS2001 ApS, Welltec Africa ApS, Welltec Latinamerica ApS, Welltec (UK) Ltd., Welltec Canada Inc. and Welltec Inc. (USA) have been pledged.
17. Derivative financial instruments
See note 26 Financial instruments in the consolidated financial statements
18. Related parties
See note 27 Related parties in the consolidated financial statements
18.1 Trading transactions
During the year, group entities entered into the following trading transactions with related parties that are not members of the parent company:
2011 2010 (Danish kroner, in thousands) (Danish kroner, in thousands)
Subsidiaries Affiliates Subsidiaries Affiliates Interest income/-expenses (-) ................ 450 530 4,830 207 Total ..................................................... 450 530 4,830 207
The following balances were outstanding at the end of the reporting period:
Amounts owed by related parties Amounts owed to related parties
2011 2010 2011 2010
JH Holding. Allerød, ApS ................................ 15,894 10,310 0 0 Subsidiaries ................................................................ 48,151 96,809 0 0
19. Events after the balance sheet date
See note 29 Events after the balance sheet date in the consolidated financial statements.