Embed Size (px)
Citation preview

A N N U A L R E P O R T2 0 1 4 - 2 0 1 5

this highly-connectedworld, technology is
touching lives in our daily
activities.
In
With every challenge that life poses, technological
advances are being made that have far-reaching
implications. From staying in touch with a loved one to
hearing an unborn child’s heartbeat or contributing to
sustained living by conserving energy, technology extends
its presence deep into our lives and enables a richer life.
At Sasken, we have helped some of our global customers
enable technology that has not only touched the lives of
over a billion people across the globe, but has also brought
them together for a better future. As you turn the pages of
this report, you will be taken on a journey of how we have
contributed to adopting technology to celebrate life,
connectivity, and communication thus enhancing
togetherness and sustainability.
Board of Directors ..................................................................................... 04
Letter to Shareholders ............................................................................... 05
Technology and Markets ........................................................................... 08
Sasken People ....................................................................... .................. 16
Board’s Report ......................................................................................... 21
Annexure to the Board’s Report ................................................................. 27
Sasken Quality, Information Security and Environment Policy ....................... 56
Financial Statements
The Year at a Glance - Consolidated (Non GAAP) ............................................. 57
Financial Performance - A Seven Year Snapshot ................................................ 58
Auditors’ Report on Standalone Financial Statements ........................................ 60
Annexure to the Auditors’ Report ....................................................................... 61
Auditors’ Report on Abridged Financial Statements ........................................... 63
Abridged Balance Sheet .................................................................................... 64
Abridged Statement of Profit and Loss .............................................................. 65
Abridged Cash Flow Statement ......................................................................... 66
Notes to Abridged Financial Statements ............................................................ 67
Consolidated Auditors’ Report ........................................................................... 75
Consolidated Balance Sheet ............................................................................. 76
Consolidated Statement of Profit and Loss ........................................................ 77
Consolidated Cash Flow Statement ................................................................... 78
Notes to Consolidated Financial Statements ...................................................... 80
Statement pursuant to Section 129(3) of the Companies Act, 2013 .................. 112
Management Discussion and Analysis Report ...................................................114
Other InformationRoute Map to Sasken Registered Office ..................................................... 124
Table of Contents

Working with leading
healthcare equipment
manufacturers, Sasken’s
expertise in multimedia
imaging software
has helped engineer
advanced prenatal
solutions that
celebrate life.

Mr. Rajiv C. Mody Chairman, Managing Director and CEO
Dr. Ashok Jhunjhunwala Director
Mr. Bansi S. Mehta Director
Mr. Bharat V. Patel Director
Mr. Jyotindra B. Mody Director
Mr. Kiran S. Karnik Director
Mr. Pranabh D. Mody Director
Prof. J. Ramachandran Director
Mr. Sanjay M. Shah Director
Dr. G. Venkatesh Director
Mr. Krishna J. Jhaveri Whole Time Director
Ms. Neeta S. Revankar Whole Time Director & Chief Financial Officer
Committees of the Board
Audit Committee
Corporate Social Responsibility Committee
Nomination and Remuneration Committee
Risk Management Committee
Stakeholders Relationship Committee
Strategy, Business and Marketing Review Committee
Bankers
Citibank NA
Deutsche Bank AG
Union Bank of India
Registered and Corporate Office
No. 139/25, Ring Road, Domlur,
Bengaluru 560 071, India
CIN: L72100KA1989PL C014226
Board of Directors
Company Secretary
Mr. S. Prasad
Statutory Auditors
S.R. Batliboi & Co. LLP
Chartered Accountants
SASKEN ANNUAL REPORT 2014-20154

Dear Shareholder,One of the highlights of the year gone by has been the resolution of our dispute with a non - Indian licensee. The arbitration ruling in our favor stands as testimony to the deep-rooted talent base of your Company, our ability to deliver world-class products and zealously defend what is rightfully due to us. During the course of this year, we collected around ` 276 crores pursuant to the award. Recognizing our employees as key stakeholders we shared the remuneration gained from the arbitration award. Payments made were commensurate with tenure thereby recognizing employees’ long-standing commitment to the Company.
Having navigated turbulent changes in the technology landscape, we pride ourselves in being a resilient organization. In the current year, I have taken on the additional role of the Chief Executive Officer (CEO). Your Company will continue to pursue its intended strategy to work on the cusp of opportunities created by the intersection of embedded and IT domains.
As a pioneer in providing engineering research and development (ERnD) services, we have built a reputation of being a strategic partner to several marquee customers. We have worked extensively on the Android ecosystem supporting leading smart device OEMs in areas such as operating system upgrades, commercialization, application development, and testing. Upstream engagement with semiconductor vendors places us in a unique position to help OEMs accelerate product development. Our prowess in connectivity and multimedia helps customers build products that are state-of-the-art. Our capabilities in the area of network engineering complement our semiconductor and smart device expertise. We partnered with leading network equipment manufacturer (NEMs) to develop wireless communication systems for railway networks. Additionally, we have helped customers build next-generation access and packet core networks.
Hyper-connectivity of devices and pervasive wireless infrastructure has resulted in a data deluge. This has enabled platform players to disrupt conventional businesses. The Internet of Things (IoT) is integrating discreet services to fundamentally enhance the quality of life. IoT promises myriad possibilities with evolving monetization opportunities. Your Company has won pilot engagements from enterprises seeking to profit from these disruptive forces.
We are working on embedded technologies such as RFID and NFC. Additionally, we are helping retail and insurance customers deploy innovative technological solutions. Thus, your Company is associated in a process - we like to call stack2app – where enterprises can benefit from our expertise in embedded engineering to deliver new-to-market IT services.
Analysis by industry experts reveals that the verticals your Company serves are the most prolific outsourcers of ERnD services and allied IT services. Over two decades, we have served the automotive, semiconductor, consumer electronics, industrial and rugged devices, satellite, independent software vendors (ISV), insurance and retail verticals. We are now servicing the IT needs of our customers leading to greater entrenchment. Our geocentric organization provides proximity to key customers enabling sharper focus and better market access. We have augmented our forte in ERnD and Testing by building expertise in IT Infrastructure and Analytics and Data Services. The combined portfolio that Sasken has built distinctly positions us in the industry today to respond with agility to the needs of the digital enterprise.
Keeping in mind our tradition of rewarding our stakeholders, I am happy to bring to your attention the payment of a Special Dividend of 200% (` 20 per equity share) during October 2014. We have also paid interim dividend of 25% (` 2.50 per equity share) in January 2015. The Board has recommended a final dividend of 45% (` 4.50 per equity share) subject to approval of shareholders at the AGM, thus making the total regular dividend ` 7 per equity share for the year. You would recall that your Company has a good track record of paying dividends since its listing in 2005.
I believe that quality drives everything we do – from technology to processes to human resource practices. We have reinitiated the CMMI journey and have currently attained CMMI Dev V1.3, Maturity Level 3. According to TL 9000 standards, your Company has an average of 98 percent on-time delivery. This corroborates our focus towards delivery excellence. Additionally, Sasken uses a variety of software development and lifecycle management methodologies including DevOps and Agile methods. We have consistently achieved 4+ customer satisfaction score leading to a significant percentage of our projects being repeat business.
On behalf of my management team, I assure you that we will do our best to ensure the continued success of your Company. We are grateful for your support and trust that you will continue to repose your confidence in us.
Thanking you,
Rajiv C. ModyChairman, Managing Director and CEO
Letter to Shareholders
5

Sasken’s capabilities
in providing product
engineering services
has helped in putting
technology to use for
a cleaner and greener
environment by
enabling end-users to
smartly manage their
energy expenditure.

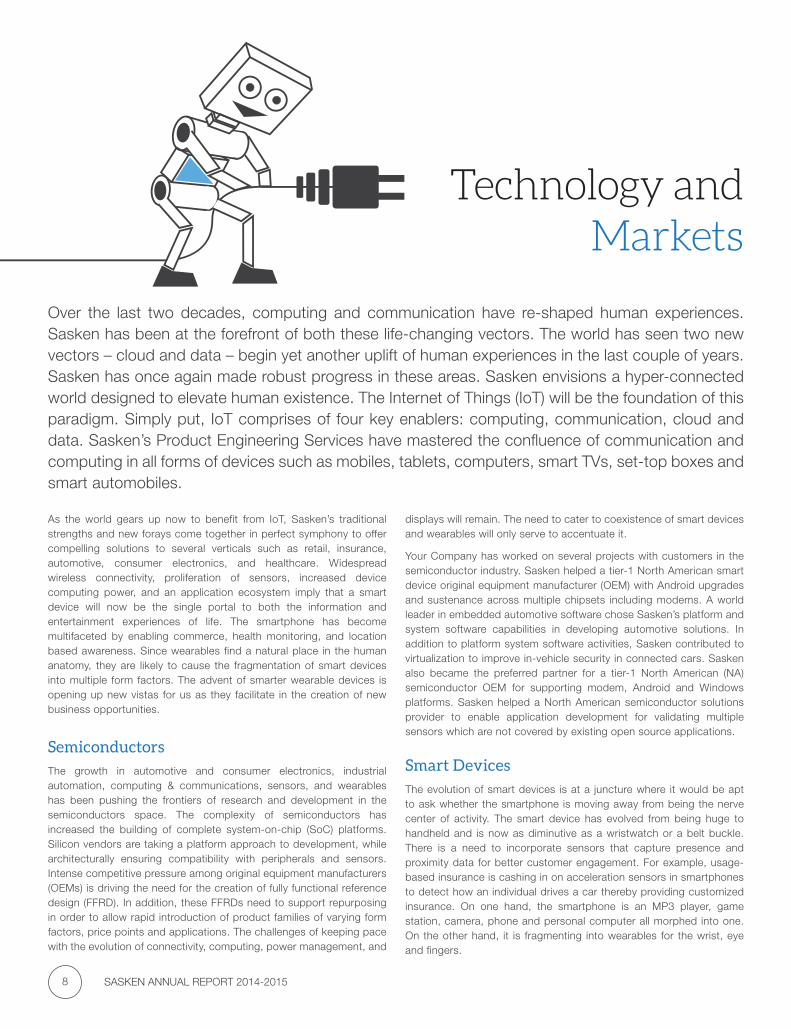
Over the last two decades, computing and communication have re-shaped human experiences. Sasken has been at the forefront of both these life-changing vectors. The world has seen two new vectors – cloud and data – begin yet another uplift of human experiences in the last couple of years. Sasken has once again made robust progress in these areas. Sasken envisions a hyper-connected world designed to elevate human existence. The Internet of Things (IoT) will be the foundation of this paradigm. Simply put, IoT comprises of four key enablers: computing, communication, cloud and data. Sasken’s Product Engineering Services have mastered the confluence of communication and computing in all forms of devices such as mobiles, tablets, computers, smart TVs, set-top boxes and smart automobiles.
Technology and
Markets
As the world gears up now to benefit from IoT, Sasken’s traditional strengths and new forays come together in perfect symphony to offer compelling solutions to several verticals such as retail, insurance, automotive, consumer electronics, and healthcare. Widespread wireless connectivity, proliferation of sensors, increased device computing power, and an application ecosystem imply that a smart device will now be the single portal to both the information and entertainment experiences of life. The smartphone has become multifaceted by enabling commerce, health monitoring, and location based awareness. Since wearables find a natural place in the human anatomy, they are likely to cause the fragmentation of smart devices into multiple form factors. The advent of smarter wearable devices is opening up new vistas for us as they facilitate in the creation of new business opportunities.
Semiconductors
The growth in automotive and consumer electronics, industrial automation, computing & communications, sensors, and wearables has been pushing the frontiers of research and development in the semiconductors space. The complexity of semiconductors has increased the building of complete system-on-chip (SoC) platforms. Silicon vendors are taking a platform approach to development, while architecturally ensuring compatibility with peripherals and sensors. Intense competitive pressure among original equipment manufacturers (OEMs) is driving the need for the creation of fully functional reference design (FFRD). In addition, these FFRDs need to support repurposing in order to allow rapid introduction of product families of varying form factors, price points and applications. The challenges of keeping pace with the evolution of connectivity, computing, power management, and
displays will remain. The need to cater to coexistence of smart devices and wearables will only serve to accentuate it.
Your Company has worked on several projects with customers in the semiconductor industry. Sasken helped a tier-1 North American smart device original equipment manufacturer (OEM) with Android upgrades and sustenance across multiple chipsets including modems. A world leader in embedded automotive software chose Sasken’s platform and system software capabilities in developing automotive solutions. In addition to platform system software activities, Sasken contributed to virtualization to improve in-vehicle security in connected cars. Sasken also became the preferred partner for a tier-1 North American (NA) semiconductor OEM for supporting modem, Android and Windows platforms. Sasken helped a North American semiconductor solutions provider to enable application development for validating multiple sensors which are not covered by existing open source applications.
Smart Devices
The evolution of smart devices is at a juncture where it would be apt to ask whether the smartphone is moving away from being the nerve center of activity. The smart device has evolved from being huge to handheld and is now as diminutive as a wristwatch or a belt buckle. There is a need to incorporate sensors that capture presence and proximity data for better customer engagement. For example, usage-based insurance is cashing in on acceleration sensors in smartphones to detect how an individual drives a car thereby providing customized insurance. On one hand, the smartphone is an MP3 player, game station, camera, phone and personal computer all morphed into one. On the other hand, it is fragmenting into wearables for the wrist, eye and fingers.
SASKEN ANNUAL REPORT 2014-20158

WearablesWearables are power packed with several sensors such as location, acceleration, bearing, body temperature, point of interest, etc. pooled in for convenience. Locating a lost pet or a good diner in a new area has never been easier with attempts to make technology that can be wrapped around the human body and not as an appendage. The display is getting bigger and simultaneously smaller. While the processor is becoming bigger in terms of capacity, processing power and memory, users are demanding frugal devices. So the question arises: how much can you pack in a wrist? The answer, though surprising, is pretty much. Consumers are growing to demand prudent power management display, high performance batteries, multiple wireless sensors, gaming graphics processing, and audio video enhancements.
Sasken has built a mobile application that is designed to coach and guide budding and professional players alike on their bowling skills in cricket. The app can be paired to an Android watch on which sensors can detect all the parameters that a cricket coach would advise for bowling. The data is then presented in a concise and informative form on the phone. A state-of-the-art animation shows the exact movement of the bowling action and a performance chart is provided as well.
Consumer ElectronicsConsumer electronic products have found a way to be there in every moment of our lives and the evolution of technologies such as connectivity, mobility, computing, human-machine interfaces and the cloud is upping the ante for convergence. Today, not only can the television support an operating system but the set top box also runs on the same OS that the TV sports. The TV’s connectivity is also becoming varied as it is doubling up as a broadband hub that can also connect to Wi-Fi apart from satellite. Seamless connections are possible between smartphones, media players, cameras, etc. Consumer electronic devices with seamless connectivity and data interchange enable the consumption of information sans any time or spatial limitations.
User experience is now trying to capitalize on primeval human behavior in their quest to become second nature to us. With more devices crossing over for borderless connectivity within the household, consumers expect multi-functionality in a product. Competencies that were once valued are now commoditized while newer ones are of prime importance. Consumer electronic OEMs are under relentless pressure to be the first-to-market and sustain that momentum through constant innovation. The ability to manage an ecosystem of complementary partners is an important requirement to succeed in the market.
Sasken partnered with a tier-1 Japanese handset major for Android upgrades, operator testing, and voice over long-term evolution (VoLTE) among others. A world leader in consumer electronics collaborated with Sasken in order to upgrade their smart TV platform to Android Lollipop. It was also the first Android TV platform that was upgraded to Lollipop. Sasken co-worked with a leading North American OEM for the overall upgrade of their latest phone and subsequently took over the delivery ownership from critical triaging phase onwards. Sasken’s expertise in the core domains of Android helped the phone become one of the three Android L compliant smartphones in the world. These forays reaffirm our position as a leading provider of services on the Android software platform.
Industrial AutomationThe need for instant gratification is driving industries to fuel up their logistics processes and deliver faster and better. No sooner has the
user selected and paid for a product online, than he wants it delivered to his doorstep. Enabling this means cultivating long-term customer loyalty and word-of-mouth publicity but it takes a detailed logistics process to make this happen. While automatic data identification using bar code, QR code, RFID, NFC, etc. is one way to go, it also involves real-time inventory keeping and data transfer. Away from the warehouse, the product’s shipment and dispatch has to be managed in a precise manner. Automation is enabling stock keeping of millions of units with the ability to locate them precisely. The wireless rugged devices today automatically identify products, capture data without manual intervention and provide accurate spatial coordinates using tags. Integration with traditional IT systems and mobility has resulted in a field force that is ably supported by real-time information and decision-making capability.
Rugged devices are today almost indistinguishable from smartphones save the compliance to standards such as IP67 that ensure ingress protection for use in extreme working conditions. Building engineering rugged devices requires the ability to manage complex systems including industrial grade hardware, sensors, hardened operating systems, and simultaneously provide a user interface that is comparable to smart devices.
Another array of devices that have undergone a phenomenal change is terminals that are used in civil defense. A plethora of standards are in vogue including TETRA, P25, and DMR that are now poised to selectively adapt civilian broadband wireless standards such as LTE due to the insatiable need for rich media. The evolution of these terminals would entail suitable adaptation of commercial technologies to suit the demands of working in a failsafe mode, security and complying to command and control mode of communication. Given that, these communication systems work via a control-room and field personnel support for dispatch of applications and location based services (LBS) are of fundamental importance.
In the past year, Sasken has been able to use its expertise in rugged devices in order to help a global leader in technology and solutions upgrade their Android devices to the latest version of Android Jelly Bean along with keypad mapping while ensuring CTS (certified technology specialist) certification within stringent timelines for Jelly Bean version. Sasken has also worked with a leading provider of field workforce automation software to help enable NFC, Bluetooth, Wi-Fi and application customization for their rugged devices.
SatelliteThe need for high-speed data regardless of one’s location is driving satellite operators to introduce next generation technologies such as Long Term Evolution (LTE). The nature of satellite communication necessitates the stringent management of complex phenomena such as latency and low signal to noise ratios (SNR). This calls for customization of terrestrial standards to suit the satellite environment. Satellite operators and terminal manufacturers who forge useful partnerships to develop advanced broadband satellite communication systems would establish a competitive edge in the market. The additional challenge faced by this industry is the need to design terminals of varied form factors such as handheld, vehicular, maritime, aeronautical devices, etc. Therefore, the best response to this challenge is to seek design support for a core module that can be customized to rapidly assist in the development of any one of these devices. Sasken with its extensive product engineering service capability brings to satellite operators its knowledge of terrestrial wireless standards such as GSM and its evolution, Universal Mobile Telecommunication
9
Combining our
knowledge in Telecom &
IT, Sasken’s predictive
analytics-based model
has helped migrant
communities remain
connected to their loved
ones without having to
worry about lengthy
phone bills.

System (UMTS) and LTE. This, combined with system engineering skills honed by a two-decade legacy in product development, puts us in a position of advantage to reuse and reengineer solutions from the terrestrial to the satellite environment. Sasken also helps players in satellite industry to offer much needed backward compatibility in the face of constant changes in technology and standards. The global delivery model Sasken offers, in addition to a cost optimized mix of development locations, the multi-faceted competency to engineer complex systems. This leads to industry players achieving faster time-to-market and deriving greater value from their product development budgets.
Sasken’s years of expertise in the field of satellite communications is evidenced by our extensive collaboration with one of the world leaders in mobile satellite communications. In the year that has been, Sasken executed an end-to-end productization including hardware and software design of one of their primary satellite phones. This also included antenna design, system and modem optimizations. Sasken also worked for the development of revised core module for their satellite phone user terminal that encompassed evaluation and integration of new chipsets, product line continuance beyond current chipset end-of-life among others.
AutomotiveThe connected car has been the fulcrum on which the automotive industry has spawned off several innovative services and solutions. Automotive electronic systems continue to be upgraded and enhanced with tremendous velocity. The key drivers for the explosion of connectivity – within and without – are to enhance safety, comfort, and infotainment of the occupants. However, auto manufacturers and independent software vendors are locking horns to gain the mindshare of both drivers and passengers. This is leading to auto OEMs upping the ante in viewing the car as a service and not a product.
Auto OEMs are actively wooing the customer and changing their evanescent loyalties by continuously raising the bar. The new norm, therefore, is to feature the automobile as a service and cater to variegated needs including prognosis & diagnosis, under the hood engine management, car-to-car & car-to-place connectivity, and safety. As is wont, auto OEMs have an obsessive concern to increase the safety continually. Toward this end, they are building systems that enable Automated Driver Assistance and Safety (ADAS) by incorporating lane departure warning, blind spot detection, infrared sensing, camera-based navigation, collision warning, and collision detection.
Automotive industry is cautiously, yet actively, adopting a multi-pronged approach to service the entire spectrum of market needs ranging from the elitist to the mass markets. This dynamic tension is managed by the adoption of either open source or proprietary platforms, both of which have their pros and cons. Insurance is an area that is being seen as an early battleground between auto OEMs, insurance providers and third-party software providers. In their quest to gain on the customer’s wallet and mindshare, the industry is rapidly creating innovative product and service bundles.
Sasken’s extensive experience in multimedia has been leveraged by a global auto OEM to productize streaming sub-systems of in-vehicle infotainment (IVI) solution thus providing an enhanced user experience while garnering a time-to-market advantage. Sasken has also helped a leading North American OEM enable IVI solution with next-generation streaming technologies such as Internet radio, video-on-demand among others. On the connectivity front, Sasken enabled a
North American tier-1 customer consolidate their Bluetooth solutions, optimize costs and improve their response time to customers.
Networks
In the eye of data explosion, rich communication is taking precedence over traditional ways of communicating. With emphasis on improving technology for a richer communication experience by introducing high fidelity audio and high definition visuals, the strength lies in enabling rich media over multiple platforms. The entire communication value chain has progressed from being homogenous to being heterogeneous. The customer, demanding devices that support multi-generation networks, has pushed the networks industry to sustain older technologies while investing in new ones. For network equipment manufacturers (NEMs) the challenge is in reducing cost and time-to-market. While managing multi-generation networks, high computing time increases the complexity of the problem. Thus, it can be rightly said that the evolution of technology is disrupting the market because of a constant need to upgrade.
Being able to cover a vast space of urban area is also posing as a problem of its own. This gives rise to the need to build networks that function over a wide range of spatial separation. For service providers this is driving investment costs skyward as opposed to revenue. While traditional sources of revenue are drying up, new sources are being explored. There is a constant need to manage the tradeoff between performance and cost while continuing to enhance the overall quality of experience. Further, traditional service providers are being marginalized by over-the-top (OTT) services that ride on the telecommunications infrastructure and appropriate disproportionate value without the risk of capital investments. Revenue is not skyrocketing while there is a daunting increase in margin.
Sasken’s deep domain competencies across protocols, standards, technologies and platforms have helped global leaders in network equipment commercialize a wide array of network elements. This year your Company worked with a leading Korean smartphone manufacturer in its Android VoLTE commercialization and certification. Sasken also played a vital role in developing products and solutions for one of the world leaders in the integration of IT and network technologies. Your Company helped the customer upgrade the line cards of high-speed access network (HSAN) from 1GHz to 10GHz chipset. This year also saw a strategic partnership strengthened with a global end-to-end telecomm solutions provider and equipment manufacturer that delivers solutions in diverse markets. The customer turned to Sasken for end-to-end development of latest generation of highly scalable and robust BaseStation and Packet unit solutions for running mission and business-critical systems for railways across the world.
Testing
Testing has come to occupy the pivotal position in the product development lifecycle (PDLC). Testing has moved to being co-terminus with every stage in the development cycle as opposed to being at the logical end of it. The simultaneous demand for cost effective and comprehensive testing requires the judicious use of automation. Product manufacturers are expecting their service providers to become independent testing hubs. This has led to the emergence of Testing Centers of Excellence (TCoE) which provides subject matter expertise, automation strategies, tool selection, and complete infrastructure to offer the entire gamut of testing services. In order to optimize costs and provide deep domain expertise on demand, we have established a
SASKEN ANNUAL REPORT 2014-201512
shared services model that takes advantage of right mix of centralization and de-centralization while providing testing services to global leaders in product development.
On the communications and devices space there is an increased need for a plethora of test services for both existing – 3G and 4G – and future technologies such as 5G. There will be an uptake in demand for testing services spanning areas such as multi-screen content delivery, IoT, enterprise mobility, cloud and virtualization. Sasken has established a TCoE and forged a partnership with HP among others to add value by accelerating the cycle time and help customers launch proven products. Our domain knowledge spanning semiconductors, smart devices, automotive and networks coupled with our systems proficiency enables us to deliver turnkey testing services. In consonance with our foray into IT services, we have an expanded folio of validation and quality assurance services targeted toward ecommerce, social, mobile, analytics and cloud (SMAC), and the digital enterprises.
Sasken worked with a Finnish multinational communication and information technology company to execute operator test cases, error verification and application testing. Sasken has added value to its customers spanning across various industries such as semiconductors, device OEMs, automotive and networks by proactively developing test automation frame works. This has helped in bringing down the cost and time for quality in global field testing. In the Testing practice, Sasken has transitioned to Agile-based testing and continues to enhance skills of our engineers based on market changes and customer needs.
Applications & Data Services
Today enterprises are at point of reflection and faced with the challenge of collision of two forces namely – the amalgamation of mobile, internet, cloud and social elements and the other being the convergence of smart devices and applications. Enterprises, therefore, are externally able to engage better with customers and internally enhance process efficiencies.
To ride this wave of opportunity, enterprises – especially the Chief Information Officer (CIO) organizations – must embrace the best tenets of development including Agile, Scrum and DevOps. Sasken, with its productized approach to development, brings to the CIO organizations a fresh perspective for accelerating the transition toward becoming a digital enterprise.
Sasken’s legacy in mobility and associated technologies coupled with expertise across multiple generations of technologies, platforms, operating systems and standards makes it possible to bring to the table an ‘inside out’ perspective that places mobility at the core. This will help CIOs design and deliver solutions that fully leverage the power of ‘computing and connectivity’ for enterprise-grade applications.
We continue to hone our expertise in providing Data Discovery and Analytics services to enterprises. Hyper-competition among enterprises along with the need for instant gratification has necessitated gleaming insights from data assets in a visual and agile fashion. Our business intelligence (BI) solutions are geared to help companies derive actionable insights from data via the use of predictive analytics techniques. Our heritage in communication and devices uniquely positions us to work with machine-generated data, use the appropriate analytics techniques for several business scenarios.
Your Company is helping organizations tide through the digitization process using an exploratory approach that helps CIOs move from ideation to prototyping and eventual deployment of solutions. This approach empowers CIOs to deliver tailor-made applications drawing on a repertoire of evolutionary solutions.
IT Infrastructure
IT Infrastructure as we know has undergone a sea change. IT assets have morphed considerably in the face of the changes brought about by the adoption of SMAC in the enterprise. Infrastructure is no longer seen as a passive asset that is confined to being viewed as a system of servers and software. It has rather evolved to become the nerve center of global enterprises. CIOs need to manage with dexterity the dichotomous tension - managing legacy and continuous upgrade of the assets.
Migration to the cloud has resulted in a hybrid environment comprising private and public cloud infrastructure necessitating the management of multi-cloud environments. The ubiquity of smart devices and the incorporation of automatic identification and data capture (AIDC) capability have pushed the envelope for adoption of mobility within an enterprise. Smart CIOs are investing to take advantage of this trend to increase the productivity and efficiency of the enterprise workforce on one hand and on the other hand manage the potential threat to enterprise vulnerability by hardening security systems.
The pressure to deliver more from static to shrinking budgets is propelling CIOs to look at novel ways to manage their IT infrastructure. Automation is largely seen as a key driver to achieving significant cost advantage without compromising on the level of service provided to power users.
CIOs have a tremendous opportunity to provide almost ready-to-use solutions to their functional counterparts. For the large part, they achieve this by transforming information into actionable data points. CIOs judiciously manage a slew of tools to support and enable business, which may be owned or procured as a service in order to derive cost savings and protect against obsolescence.
Sasken’s Infrastructure Services Practice has risen to many challenges with offerings across data center services, cloud, network & security, telecom infrastructure, end-user computing, service desk and cross-functional services. With an eye to deliver optimized IT services, Sasken has forged a partnership with HP to establish a Center of Excellence (CoE). Sasken Infrastructure practice has built capabilities around various enterprise IT management tools through this CoE. Sasken’s automation solution helps customers reduce cost of delivery, improve availability, increase agility and create customer delight.
13

Sasken’s expertise
in developing
new-generation
handheld satellite phones
has helped users stay
connected to their world
in spite of being in remote
places with challenging
environmental and
climatic conditions.

Sasken PeopleSasken has been a firm believer in the three pillars: people, process and performance. Pride for us is a result of relentless pursuit of our passion to deliver the best value for customers. From the inception, we have designed policies that have put people first and provided the necessary impetus for all Sasians to hone their competence and deliver their best with utmost conviction. We pride ourselves in having progressive policies that spur our young and diverse talent pool to perform at the peak of their potential while striking the right work life balance. The tenets that continue to anchor and galvanize Sasken as one family are:
SASKEN ANNUAL REPORT 2014-201516
Engage and Enjoy
Empowerment and Accountability
Trust and Verify
Respect and Differentiate
17

Sasken’s prowess
in connectivity and
communication has
enabled state-of-the-art
infotainment in cars
that transport
influential world
leaders.

It is in the fitness of things that we mention a few Sasians who have
continuously risen above and beyond their call of duty. We have
Amrith Ravindranathan who is based in Somaliland, North-East
Africa. Amrith has been working as the Implementation Engineer
(Onsite) in Somaliland and facilitating project delivery for the nationwide
deployment of operations and business support system for the country’s
leading telecommunications service provider. Despite the challenging
environment Amrith is based in, he has upheld Sasken values of service
and quality.
Then we have Bilal Wani who has been working in Srinagar, Jammu and
Kashmir, on a tele-healthcare project. Bilal’s efforts have helped spread
better awareness about primary medical care by connecting patients to
the right doctors. So far, the project has touched close to 300 patients
and 100 doctors. In spite of his home and office getting inundated
during the Kashmir floods in September, Bilal has been persistent in his
endeavors to equip locals with better medical information, free of cost.
Another Sasian worth celebrating is Sushmita Danabalan who has
been with us for 10 years now as our Library Assistant. Though she is
differently abled, Sushmita never loses an opportunity to smile in the
face of day-to-day challenges. Sushmita was awarded the Karnataka
State Women’s Achievement Award in 2009 and donates part of her
salary to help in the education of differently abled children.
As a company with a technology DNA, we have many exemplary
employees who have excelled in crafting and delivering innovative
solutions for our customers. Krishna Kishore is one such representative,
among many, who has relentlessly conceived solutions to help OEMs
build smart devices. Your Company believes in creating and nurturing
intellectual property. Pankaj Bansal, with close to two decades
of association with Sasken, has filed for patents, mentored young
engineers and architected best-in-class solutions for global leaders.
An amalgamation of humility, pragmatism and creativity is seen as a
mark of a true leader. Subhash Peruvaje, is a serial innovator who
believes in the realm of possibilities. He has championed the creation of
simple yet usable solutions using a collaborative and frugal approach to
technology development.
Our people policies have always endeavored to help people perform
consistently at a high level. A number of Sasians are high performers
who constantly push their own limits and strive to improve their
performance continuously. Surya Pocham stands tall as one such
Sasian who has been a stellar performer for six consecutive appraisal
cycles. It is in Sasken’s spirit to learn from and emulate Surya.
Adaptability is a mantra that is adopted by the fittest in the face of ever
changing paradigms. Sujamol Mohiyudheen who joined us fresh from
college, 20 years ago, has metamorphosed into becoming a mentor
for several young engineers. By the sheer dent of her perseverance,
Sujamol has worked on myriad technologies, standards and products.
Persistence is a quality that defines achievers and it is fitting to say
Manoj Damodar is an achiever. Manoj has been leading the sales
operations in Europe for many years. His never-give-up attitude has
helped Sasken win deals that matter. While he has managed tough
situations and negotiations with extreme deftness he pays a lot of
attention to nurturing a customer relationship. His tenacity continues to
inspire other sales personnel in the region.
Sasken has always been a believer in customer centricity which
also forms one of the tenets of our IRISE values that recognizes
Sasians who stand by these values in the toughest of situations.
Parekh Mital Sanatkumar is one such Sasian who has been outstanding
on the customer centricity front. He has managed significant customer
engagements for Sasken including some key accounts. His high degree
of attention to detail coupled with technical expertise and people
management skills, has earned him a lot of respect from his peers and
team.
Another vanguard of our value of being a customer centric organization
is Nishikant Kulkarni. He has been instrumental in winning customer’s
confidence across geographies. Under his able leadership, Sasken has
achieved full marks in customer satisfaction ratings on various projects.
Recently he was awarded a 5/5 for a project from a leading Japanese
Automotive OEM.
While customer centricity is an important asset that we look for in our
employees, we also value people who go out of the way to help those
in need. Anjan Coimbatore is one such change leader who has been
associated with Vathsalya Charitable Trust for over six years. Anjan
helps the NGO that focuses on children, education, nutrition and family
preservation. He is also associated with the Sanman foundation – an
NGO that is focused on spreading awareness on palliative care.
We would also take this opportunity to recognize Neeta Revankar
and Sudha Munireddy for steadfastly pursuing our conviction in
the arbitration case. Not for once did they lose sight of the goal on
this journey that took over two years. This win would not have been
possible without their single-minded focus in rightfully pursuing the
amounts due to us when our customer took a unilateral decision to
stop payment of royalty amounts due to us. Their commitment and
hard work strengthened our case and resulted in an award in our favor.
The qualities of the people mentioned here, that set them apart, are
common indeed to most Sasians. Additionally, we are proud to highlight
external recognition awarded to Sasians.
For the second time in a row Neel Nahata, AVP, Finance bagged
the CFONEXT100 2014. In 2015, Rajesh Maniar, VP, Finance was
recognized for his exceptional caliber and contribution to the world
of finance by the same organization. The CFO Institute organizes the
CFONEXT100 award every year to recognize trend-setting CFOs who
have made a difference in the world of business and finance.
Sasian Anil Kumar, who is the Senior Manager – Facilities, FMS &
Travel and Admin Management, has recently won the Best Facility
Manager award at the Facility Manager’s Contest organized by Facility
Management Zone, India. He has also written and presented a technical
paper at the Steel, Space and Composite Structures conference held
in May at Prague, Czech Republic. His paper was also published in the
Journal of Civil Engineering and Architecture, USA.
SASKEN ANNUAL REPORT 2014-201520
21
Board’s Report
To the Members,
Your Directors have pleasure in presenting the Report on the business and operations of the Company along with the Abridged Standalone and Unabridged Consolidated Audited Accounts for the financial year ended March 31, 2015.
1. FINANCIAL PERFORMANCE
A summary of the Company’s financial performance in 2015:(` in lakhs)
ParticularsConsolidated for the year
ended March 31Standalone for the year
ended March 31
2015 2014 2015 2014
Revenue 42,800.99 45,802.93 34,676.38 35,393.20
Profit Before Interest and Depreciation 5,418.34 8,491.72 4,705.87 9,583.67
Finance Charges 13.87 20.25 - -
Gross Profit 5,404.47 8,471.47 4,705.87 9,583.67
Provision for Depreciation 1,119.76 1,254.22 1,039.23 953.32
Exceptional Items Income / (Expenses) 17,333.30 - 21,716.10 (1,197.39)
Net Profit Before Tax 21,618.01 7,217.25 25,382.74 7,432.96
Provision for Tax 9,661.57 2,070.08 9,503.70 1,639.83
Net Profit After Tax 11,956.44 5,147.17 15,879.04 5,793.13
Balance of Profit brought forward 25,970.49 28,977.32 22,573.20 24,794.52
Balance available for appropriation 37,926.93 34,124.49 38,452.24 30,587.65
Retained Earnings Adjustment 36.46 - 35.89 -
Proposed Dividend on Equity Shares 960.52 - 960.52 -
Interim dividend (including Special dividend) 4,797.42 6,807.81 4,797.42 6,807.81
Dividend Tax 940.69 732.81 804.09 627.33
Transfer to General Reserve 1,587.90 613.38 1,587.90 579.31
Surplus carried to Balance Sheet 29,603.94 25,970.49 30,266.42 22,573.20
(Previous year’s figures have been regrouped wherever necessary to conform to the current year’s presentation)
On a consolidated basis, your Company’s revenues from operation for the financial year 2014-15 have decreased by 6.55% in rupee terms, from `45,802.93 lakhs in 2013-14 to `42,800.99 lakhs in 2014-15. In the current year, Software Services, including Network Engineering Services contributed 96.71% to the revenues, while the Software Products revenues contributed 2.77%. The net profits increased from `5,147.17 lakhs in FY14 to `11,956.44 lakhs during the year, an increase of 232.29%. This has translated to a Basic Earnings Per Share of `56.11 in 2014-15 vs `24.36 in 2013-14.
There was no change in the nature of business of the Company, its subsidiaries and JV’s.
2. MATERIAL CHANGES AND COMMITMENTS AFFECTING THE FINANCIAL POSITION OF THE COMPANY
There have been no material changes and commitments, if any, affecting the financial position of the Company which have occurred between the end of the financial year of the Company to which the financial statements relate and the date of the report.
3. DIVIDEND
Your Directors are pleased to recommend a final dividend of `4.50 per equity share of face value of `10 each for the year under review. During the year, your Company paid an interim dividend of `2.50 per equity share and special dividend of `20 per equity share. The total dividend for the year ended March 31, 2015 would be `27 per equity share.
4. BUY - BACK OF SHARES
In terms of decision of the Board of Directors (Board) dated April 23, 2015 and in accordance with the provisions of Companies Act, 2013 and the Securities and Exchange Board of India (Buy - back) Regulations, 1988 and with the approval of shareholders by Postal Ballot on June 25, 2015, the Company has offered to buy - back 41,57,000 fully paid up equity shares of `10 each, at a price of `260 per share for an aggregate amount of up to `10,808.20 lakhs from the existing shareholders of the Company under Tender Offer mechanism. The offer size represents 19.48% of the aggregate paid up capital and free reserves of the Company as at March 31, 2015.
5. BUSINESS OUTLOOK, ECONOMIC & REGULATORY SCENARIO AND OPPORTUNITIES
The transformation of business operations across all industry - standard verticals has been buoyed by the platformization of businesses. This has meant traditional businesses coming under attack by new entrants. Enterprises that have embraced platforms have seen their valuation skyrocket irrespective of the vertical they operate in or the consumer segments they serve. This has been made possible by the evolution of information technology (IT) from being a passive infrastructure to becoming a strategic asset.
In order to better service the immense market opportunities that we see, we have revectored our go - to - market approach that judiciously combines a geo - focus in conjunction with customer engagement models. Our thrust areas include pursuing opportunities arising from Global In - House Centers (GICs) in India, proximity development centers of global OEMs, and delivering the work entrusted to us through a prudent choice of our global development centers.
SASKEN ANNUAL REPORT 2014-201522
Board’s Report (Contd.)
At Sasken, we are continuing to build on our intended strategy of leveraging our deep expertise in product engineering and embedded systems to help transform the enterprise landscape. We have started making headway in this journey and have successfully engaged both entrenched companies and challengers in diverse areas such as retail, insurance, consumer and automotive electronics. Additionally with strong heritage in designing semiconductors, which form the substratum of products and networks, your Company is able to engage in the early phase of the product development lifecycle. Our ability to provide comprehensive services from stack2app (stack to application) combined with our semiconductor expertise, places us among forerunners who can help businesses profit from this wave of platformization.
The Internet of Things (IoT) has captured the imagination of industry leaders worldwide and has become the focal point of future development initiatives. Consensus industry estimates places the IoT to emerge from its current nascent state to become a multi - trillion dollar industry by 2020. Sasken has embarked upon several initiatives to develop distinct proof - of - concepts to demonstrate its ability to put together solutions that center around the IoT space.
For example, Sasken has designed an IoT - based energy management solution that aims to provide a simple and intelligent system. It combines sensing, communication, control, cloud and analytics to realize a reliable, efficient and cost effective solution to corporates and households. The board design, system integration, analytics, device communication protocol have been developed in - house by ConnectM (a Sasken and IDG Ventures company). In similar vein, we have built solutions that use a combination of wearable technology and IoT to address sports and retail industries. While the role of IoT in transforming our pursuits in the professional and personal space seems promising, the monetization opportunities will evolve over time.
In the cusp of embedded and IT, we have worked toward enabling independent software vendors (ISVs), who are using communication technologies, to transform the way logistic management can improve both efficient management of inventory and customer service. In our traditional embedded business, we have further strengthened our position of being a pioneer in providing product - engineering services by helping our customers launch a slew of products that are truly innovative. These include, among others, the services we have rendered to help smart devices leverage near - field communications (NFC) for micro payments; railway communication systems exploit the power of newer architectures for Base Transceiver Systems. In the coming years, we will endeavor to retain the momentum and enhance customer traction across both the embedded and IT markets.
For a more detailed discussion of our areas of business, please refer to the Technology and Markets section.
Litigation
Sasken received arbitration award in its favour on June 27, 2014. The award recognizes that the agreement between the parties is in full force and as a result, the Non - Indian Licensee was directed to pay Sasken royalties and interest on unpaid royalties as per the contract. Further, the Arbitrator had directed the said party to continue to provide royalty reports and pay the contracted royalties on an ongoing basis. During the financial year, Sasken collected around `276 crores against the contract pursuant to the award.
6. SHARE CAPITAL
The paid up equity share as on March 31, 2015 was `21,34,48,730. During the year, your Company issued and allotted 67,300 equity shares to eligible employees on exercise of options granted under Employee Stock Option Plan – 2006. Consequently, the issued, subscribed and paid–up capital of the Company increased from 2,12,77,573 equity shares to 2,13,44,873 equity shares of `10 each.
6.1. Employees Stock Option Plan (ESOP) - 2006
The Company’s ESOP continues with the philosophy of encouraging the employees to be partners in the growth of the organization.
As on March 31, 2015, there were 54,000 options outstanding with the employees. There are 16,58,700 unissued options as on March 31, 2015.
The details required under SEBI (Employee Stock Option Scheme & Employee Stock Purchase Scheme), Guidelines 1999, as on March 31, 2015, is annexed herewith as “Annexure A”.
6.2. Warrants issued to Lahiri Family Trust
Based on the Special Resolution passed by the Company on November 8, 2013, your Company allotted on preferential basis 12,00,000 convertible warrants on November 18, 2013, to Ms. Ira Bhaduri in her capacity as Trustee of Lahiri Family Trust, of which Mr. Anjan Lahiri, former Whole Time Director and CEO of the Company, is the Managing Trustee. The allottee was entitled to one equity share of `10 each of the Company for each such warrant at a price of `120.25 each and 25% of the price amounting to `360.75 lakhs has been received as application money. The allottee exercised 10,40,000 options and paid `937.95 lakhs towards the balance 75% of the application money and as the proposed allotment / conversion was not to be proceeded with, this amount of `937.95 lakhs has been refunded and the stock exchanges have been informed about the non - conversion / allotment.
The Company has sought informal guidance from Securities and Exchange Board of India (“SEBI”) on whether the 25% should be forfeited or can be refunded and if so, the procedural formalities in connection with that. SEBI vide its letter dated February 23, 2015 expressed its inability to issue any guidance in the matter as in its opinion, the matter for which guidance sought was not in compliance of para 8 of the Scheme. The Company was advised that since SEBI has not expressed any opinion despite having placed all the relevant facts and materials, the Company could proceed to effect the refund in its entirety. Accordingly the Board at its meeting held on April 13, 2015 approved refund of the application amount and the interest accrued and the same was paid on April 14, 2015.
23
Board’s Report (Contd.)
7. DEPOSITS
Your Company has neither accepted nor renewed any deposit during the year. As such, no amount of principal and / or interest is outstanding as on the Balance Sheet date.
8. PARTICULARS OF LOANS, GUARANTEES OR INVESTMENTS
Details of Loans, Guarantees and Investments covered under the provisions of Section 186 of the Companies Act, 2013 (the “Act”) are given in the notes to the Financial Statements.
9. ENERGY CONSERVATION, TECHNOLOGY ABSORPTION AND FOREIGN EXCHANGE EARNINGS AND OUTGO
The information on conservation of energy, technology absorption and foreign exchange earnings and outgo stipulated under Section 134(3)(m) of the Act read with Rule 8 of the Companies (Accounts) Rules, 2014, is annexed herewith as “Annexure B”.
10. RISK MANAGEMENT POLICY, INTERNAL CONTROL SYSTEMS AND THEIR ADEQUACY
Pursuant to the requirement of the Section 134 of the Act and Clause 49 of the Listing Agreement, your Company has constituted a Risk Management Committee. The details of the Committee and its terms of reference are set out in the Corporate Governance Report forming part of this Report.
The Company has in place a mechanism to identify, assess, monitor and mitigate various risks to key business objectives. Major risks identified by the businesses and functions are systematically addressed through mitigating actions on a continuing basis. These are also discussed at the meetings of the Audit Committee and the Board of the Company.
The Company’s internal control systems are commensurate with the nature of its business and the size and complexity of its operations. These are routinely tested by Statutory as well as Internal Auditors. Significant audit observations and follow up actions thereon are reported to the Audit Committee.
The key business risks identified by the Company and its mitigation plans are detailed in the Management’s Discussion and Analysis Report.
11. CORPORATE SOCIAL RESPONSIBILITY
Your Company has constituted a Corporate Social Responsibility (CSR) Committee in accordance with Section 135 of the Act. The details of the CSR Policy and the annual report on CSR activities as prescribed under the Act and Companies (Corporate Social Responsibility Policy) Rules, 2014, is annexed herewith as “Annexure C”.
Self Employed Women’s Association (SEWA) is an organization in Ahmedabad that supports self - employed women workers to obtain work security, income security, food security and social security. For self - employed rural women engaged in the unorganized sector, various District Associations in the State of Gujarat, owned and managed by SEWA members, provide suitable financial services for socio - economic empowerment and self - development.
SEWA requested your Company for the development of an application and support system that would facilitate SEWA members in automating their savings and credit management activity. Based on the requirement of SEWA members to automate its existing manual processes in the savings and credit management activity, your Company using its software development expertise decided to support SEWA by independently developing the solution to make a difference to the rural women groups in Gujarat who are members of SEWA, thus fulfilling its Corporate Social Responsibility as well. Accordingly, your Company has started developing a solution known as KenSEWA that would include an Android smartphone application and associated server application (“Solution”) and financing the Project.
In July 2014, the pilot phase of the Project was started for 21 groups in Anand District of Gujarat. All manual processes related to the Project would be ceased and the Solution alone would be used by end of July, 2016. The financial support both in cash or in kind shall be provided by your Company till December 2015 under its CSR activities.
Your Company had allocated `91.81 lakhs towards CSR for the year 2014-15 and spent `69.86 lakhs as above, thus utilized 76% of the amount. Your Company is in the process of identifying suitable projects and will carry out the CSR activities once this is firmed up. During the year, your Company had participated in other charitable events, contributed to a Research Project as well as to the local welfare association. As these expenditures were not part of the items detailed in the CSR Policy, your Company has not recognized the same in its reporting.
12. VIGIL MECHANISM / WHISTLE BLOWER POLICY
The Company has established a vigil mechanism for Directors and employees to report their genuine concerns, details of which have been given in the Corporate Governance Report annexed to this Report.
13. DIRECTORS
All Independent Directors have given declarations that they meet the criteria of independence as laid down under Section 149(6) of the Act and Clause 49 of the Listing Agreement.
Mr. Anjan Lahiri, Whole Time Director & CEO, resigned from the Board of your Company on September 23, 2014 and Mr. Deepak Harlalka, Independent Director, resigned from the Board on January 12, 2015.
Dr. G. Venkatesh, ceased to be a Whole Time Director with effect from January 19, 2015 and continues on the Board as a Non - Executive Director.
In accordance with the provisions of the Act and in terms of the Memorandum and Articles of Association of the Company, Mr. J.B. Mody and Dr. G. Venkatesh retire by rotation and are eligible for re - appointment.
SASKEN ANNUAL REPORT 2014-201524
Board’s Report (Contd.)
13.1 Board Evaluation
The board of directors has carried out an annual evaluation of its own performance, Board committees and individual directors pursuant to the provisions of the Act and the corporate governance requirements as prescribed by Securities and Exchange Board of India under Clause 49 of the Listing Agreement.
A comprehensive questionnaire was sent to all the Directors seeking inputs from them on various aspects and the performance of the Board was evaluated by the Board accordingly.
The performance of the committees was evaluated by the Board after seeking inputs from the committee members on the basis of the criteria such as the composition of committees, effectiveness of committee meetings, etc.
The Board and the Nomination and Remuneration Committee reviewed the performance of the individual directors on the basis of the criteria such as the contribution of the individual director to the Board and committee meetings like preparedness on the issues to be discussed, meaningful and constructive contribution and inputs in meetings, etc. In addition, the Chairman was also evaluated on the key aspects of his role.
In a separate meeting of independent Directors, performance of non - independent directors, performance of the board as a whole and performance of the Chairman was evaluated, taking into account the views of executive directors and Non - Executive directors. The same was discussed in the board meeting that followed the meeting of the independent Directors, at which the performance of the Board, its committees and individual directors was also discussed.
13.2 Board independence
Our definition of ‘Independence’ of Directors is derived from Clause 49 of the Listing Agreement with Stock Exchanges and Section 149(6) of the Act. Based on the confirmation / disclosures received from the Directors and on evaluation of the relationships disclosed, the following Directors are Independent in terms of Clause 49 of the Listing Agreement and Section 149(6) of the Act : -
1. Dr. Ashok Jhunjhunwala2. Mr. Bansi S. Mehta3. Mr. Bharat V. Patel4. Mr. Kiran S. Karnik5. Prof. J. Ramachandran6. Mr. Sanjay M. Shah
Details of the familiarization programme of the Independent Directors is available on the website of the Company (www.sasken.com/investors/corporate-governance).
13.3 Nomination & Remuneration Policy
The Board has, on the recommendation of the Nomination & Remuneration Committee framed a policy for selection and appointment of Directors, Senior Management and their remuneration, including criteria for determining qualifications, positive attributes, independence of a Director and other matters provided under Section 178(3) of the Act. The Remuneration Policy and the composition of the Nomination and Remuneration Committee have been stated in the Corporate Governance Report.
13.4 Meetings of the Board and its Committees
The details of the meeting of the Board and its Committees are detailed in the Corporate Governance Report.
13.5 Committees of the Board
During the year, in accordance with the Act, the Board re - constituted some of its Committees and also formed a Corporate Social Responsibility Committee and Risk Management Committee. The composition and terms of reference of all the Committees are detailed in the Corporate Governance Report.
13.6 Code of conduct
The Board has approved a Code of Business Conduct which is applicable to the Members of the Board and all employees. The Code has been posted on the Company’s website (www.sasken.com/investors/corporate-governance). The Code lays down the standard of conduct which is expected to be followed by the Directors and the employees in their business dealings and in particular on matters relating to integrity in the work place, in business practices and in dealing with stakeholders.
All the Board Members and the Senior Management personnel have confirmed compliance with the Code.
Details of the Committees along with their charters, composition and meetings held during the year, are provided in the Corporate Governance Report.
14. DIRECTORS’ RESPONSIBILITY STATEMENT
To the best of our knowledge and belief and according to the information and explanations obtained by us, your Directors make the following statements in terms of Section 134(3)(c) of the Act that:
a) in the preparation of the annual accounts, the applicable accounting standards have been followed along with proper explanation relating to material departures;
b) accounting policies have been selected and applied consistently and, judgments and estimates have been made that are reasonable and prudent so as to give a true and fair view of the state of affairs of the Company as at March 31, 2015 and of the profit of the Company for the year ended March 31, 2015;
c) proper and sufficient care has been taken for the maintenance of adequate accounting records in accordance with the provisions of the Act for safeguarding the assets of the Company and for preventing and detecting fraud and other irregularities;
d) the annual accounts have been prepared on a going concern basis;

25
Board’s Report (Contd.)
e) proper internal financial controls to be followed by the company were in place and that such internal financial controls were adequate and were operating effectively with no material defects; and
f) systems to ensure compliance with the provisions of all applicable laws were in place and were adequate and operating effectively.
15. SUBSIDIARY COMPANIES & JOINT VENTURES
The Company has one wholly owned subsidiary in India and four wholly owned subsidiaries overseas and one Joint Venture viz. ConnectM Technology Solutions Pvt. Ltd. During the year, Sasken Network Solutions Inc., the wholly owned subsidiary of Sasken Network Engineering Ltd. was liquidated on April 17, 2014.
There has been no change in the nature of business of the subsidiaries or the joint venture, during the year under review. In accordance with Section 129(3) of the Act, the Company has prepared a consolidated financial statement of the Company and all its subsidiary companies and joint venture, which is forming part of the Annual Report. A statement containing salient features of the financial statements of the subsidiary companies and joint venture is also included in the Annual Report.
In accordance with third proviso of Section 136(1) of the Act, the Annual Report of the Company, containing therein its standalone and the consolidated financial statements has been placed on the website of the Company (www.sasken.com/investors). Further, as per fourth proviso of the said section, audited annual accounts of each of the subsidiary companies and joint venture have also been placed on the website of the Company (www.sasken.com/investors). Shareholders interested in obtaining a copy of the audited annual accounts of the subsidiary companies may write to the Company Secretary at the Company’s registered office.
The Audit Committee of the Board reviews the consolidated financial statements of the Company and the investments made by its unlisted subsidiary companies. The minutes of the board meetings along with a report on significant developments of the unlisted subsidiary companies are periodically placed before the Board of the Company.
The Company does not have any material non - listed Indian subsidiary companies. The Company has a policy for determining ‘material subsidiaries’ which is disclosed on its website.
16. AUDITORS
16.1. Statutory Auditors
The Company’s Auditors, M/s. S.R. Batliboi & Co., LLP, were appointed for a period of three years at the last Annual General Meeting held on September 22, 2014. However, vide letter dated July 20, 2015 they have expressed their inability to continue as auditors of your Company, in view of the internal restructuring by them. The Board has appointed M/s. S.R. Batliboi & Associates, LLP as auditors of your Company. They have confirmed their eligibility under Section 141 of the Act and the Rules framed thereunder for appointment as Statutory Auditors of the Company. Both M/s. S.R. Batliboi & Co. LLP and M/s. S.R. Batliboi & Associates LLP are members of the same network of firms of S.R. Batliboi & Affiiliates. As required under Section 139 of the Act, a resolution is being placed before the shareholders at this Annual General Meeting for their appointment.
16.2. Secretarial Auditors
Pursuant to the provisions of Section 204 of the Act and the Companies (Appointment and Remuneration of Managerial Personnel) Rules, 2014, the Company has appointed M/s. J. Sundharesan & Associates, Practicing Company Secretaries to undertake the Secretarial Audit of the Company. The Practicing Company Secretaries have submitted their report of the Secretarial Audit conducted by them which is annexed herewith as “Annexure D”.
17. COMMENTS ON AUDITORS’ REPORT
There are no qualifications, reservations or adverse remarks or disclaimers made by M/s. S.R. Batliboi & Co. LLP, Statutory Auditors, in their report and by M/s. J. Sundharesan & Associates, Practicing Company Secretaries, in their secretarial audit report.
18. CORPORATE GOVERNANCE AND SHAREHOLDERS INFORMATION
The Company is committed to maintaining the highest standards of Corporate Governance and adhering to the Corporate Governance requirements as set out by Securities and Exchange Board of India. The Report on Corporate Governance as stipulated under Clause 49 of the Listing Agreement with the Stock Exchanges, shareholders information together with Corporate Governance Compliance Certificate, forms an integral part of this Report which is annexed herewith as “Annexure E”.
19. MANAGEMENT’S DISCUSSION AND ANALYSIS REPORT
The Management’s Discussion and Analysis Report for the year under review, as stipulated under Clause 49 of the Listing Agreement with the Stock Exchanges, is given separately, forming part of this Annual Report.
20. RELATED PARTY TRANSACTIONS
All related party transactions that were entered into during the financial year were on an arm’s length basis and were in the ordinary course of business.
The Company has developed a Related Party Transactions Policy for the purpose of identification and monitoring of such transactions. This policy has been approved by the Board and is available on the website of the Company (www.sasken.com/investors/corporate-governance).
None of the Directors has any pecuniary relationships or transactions with the Company.
The particulars of contracts or arrangements with related parties referred to in Section 188(1), as prescribed in Form AOC - 2, of the rules prescribed under Chapter IX relating to Accounts of Companies under the Act, is annexed herewith as “Annexure F”.
SASKEN ANNUAL REPORT 2014-201526
Board’s Report (Contd.)
21. SIGNIFICANT AND MATERIAL ORDERS PASSED BY THE REGULATORS OR COURTS
There are certain on - going litigations / disputes in the normal course of business. However, there are no significant and / or material orders passed by the courts against your Company. No orders were passed by the Regulators against your Company during the year under review.
22. AWARDS
In terms of global rankings, Zinnov – a leading independent consultant – in its Global Service Provider Rating – 2014, has placed Sasken in the Established zone. Sasken stands amongst the leading providers in automotive and consumer electronics with headway in industrial automation, outsourced software product development in consumer software. According to the rankings, Sasken is a market leader in semiconductors and telecommunications verticals.
As forerunners in bringing innovative solutions to the market, Sasken’s latest patent uses a combination of pattern and unique code, which provide a method to identify and authenticate shipment of goods. While this will go a long way in making transactions more transparent and easy to execute, it will also help Sasken and others in creating relevant solutions for retail, manufacturing and shipping industries.
Sasken has been awarded by Tektronix Communications for Service Excellence. This award recognizes Sasken’s outstanding performance throughout the engagement with Tektronix and their view of Sasken as a trusted partner.
23. PATENTS
US IndiaApplied# 58 29Granted 35 11Abandoned 10 8Pending 9 13Sold 4 - Granted since last report 1 1
# includes divisional patents
24. QUALITY CERTIFICATIONS
ISO 14001:2004
Sasken is certified for ISO 14001:2004 [Environment Management System Standard]. Sasken is committed to contribute towards environment management, being a responsible corporate member of the communities in which it operates. This reaffirms our Company as a responsible corporate citizen.
ISO/IEC 27001:2005
Sasken is certified for ISO/IEC 27001:2005 [Information Security Management System Standard]. This is important for assuring our stakeholders (like Customers, Partners, Vendors, Investors and Employees) of our commitment in protecting their information assets and Intellectual Properties (IPs), as well as sensitizing all employees about importance of confidentiality, integrity and availability of information assets of our stakeholders.
TL 9000 R5.5/R5.0 (including ISO 9001:2008)
Sasken is certified for Quality Management System Standards - TL9000 R5.5/R5.0 which by definition includes the ISO 9001:2008 (QMS - Quality Management System) requirements and in addition telecom domain specific measurement and documentation requirements which helps to maintain consistent quality of deliverables within agreed timelines and budget to its valued customers.
CMMI - Dev - V1.3 - ML3
Sasken’s quality management system is formally assessed at CMMI - Dev - V1.3 - ML3 in May - 2014. This provides the infrastructure and stability necessary to deal with an ever - changing world and to maximize the productivity of people and the use of technology to be competitive.
25. CONSOLIDATED FINANCIAL STATEMENTS
The Consolidated Financial Statements of the Company prepared in accordance with relevant Accounting Standards (AS) issued by the Institute of Chartered Accountants of India form part of this Annual Report.
26. EXTRACT OF ANNUAL RETURN
The details forming part of the extract of the Annual Return in Form MGT - 9 is annexed herewith as “Annexure G”.
27. PARTICULARS OF EMPLOYEES
The information required pursuant to Section 197(12) of the Act read with Rule 5(1) of the Companies (Appointment and Remuneration of Managerial Personnel) Rules, 2014 is annexed herewith as “Annexure H1”.
A statement containing names of employees employed throughout the financial year and in receipt of remuneration of `60 lakhs or more, employees employed for part of the year and in receipt of `5 lakhs or more per month, pursuant to Rule 5(2) of the Companies (Appointment and Remuneration of Managerial Personnel) Rules, 2014 is annexed herewith as “Annexure H2”.
27
28. ACKNOWLEDGEMENTS
Your Directors thank the various Central and State Government Departments, Organizations and Agencies for the continued help and co - operation extended by them. The Directors also gratefully acknowledge all stakeholders of the Company viz. customers, members, dealers, vendors, banks and other business partners for the excellent support received from them during the year. The Directors place on record their sincere appreciation to all employees of the Company for their unstinted commitment and continued contribution to the Company.
For and on behalf of the Board of Directors
Place : Bengaluru Rajiv C. ModyDate : July 20, 2015 Chairman & Managing Director
Annexure A
Disclosures under SEBI (Employee Stock Option Scheme & Employee Stock Purchase Scheme), Guidelines 1999
Sl.No. Description Apr 14 to Mar 15 1. Total no. of options outstanding as on April 1 1,88,800 2. Total no. of options granted during the year - 3. Total no. of options vested (but not exercised) cumulative till March 31 27,000 4. Total no. of options exercised during the year 67,300 5. Total no. of shares arising as a result of exercise of options 67,300 6. Total no. of options lapsed (due to resignation, etc.) during the year ended March 31 67,500 7. Total no. of options outstanding as on March 31 54,000 8. Money realized by the exercise of options (`) 98,91,700 9. Total no. of options in force 54,000
10. Variation of terms of Options – Nil
11. Pricing formula for the grant:
Pricing of the Option will be at market price, as may be determined by the Nomination & Remuneration Committee of the Company. The first lot of Options will vest after one year from the date of grant of Option and the subsequent lots will vest thereafter. The Option - holder will have 2 years from the date of vesting to exercise the Options. On the expiry of the exercise period, Options that have not been exercised will lapse and cease to be valid. However, the exercise period can be extended for exceptional cases based on approval by the Nomination & Remuneration Committee.
Following is a snapshot of Vesting Schedule applied at different grants:
Options granted during Vesting Schedule Price Range (`)2004 - 05 July 2005 - July 2008 160 – 2562005 - 06 July 2006 - July 2009 225 – 3212006 - 07 July 2007 - July 2009
Oct 2007 - Oct 2010Jan 2008 - Jan 2011
234 – 321298 – 394367 – 559
2007 - 08 Apr 2008 - Apr 2011July 2008 - July 2011Oct 2008 - Oct 2011
475 – 667554 – 746410 – 602
2008 - 09 Apr 2009 - July 2009 1202009 - 10 April 2010 - Oct 2012 52 – 1552010 - 11 May 2011 - Oct 2013 190 – 2072011 - 12 Oct 2012 - July 2014 1382012 - 13 July 2013 - April 2015 1232013-14 Nov 2014 - July 2015 119
12. Details of Options granted to some of the senior managerial personnel during the year under review Nil
13. Employee - wise details of Options granted to:
Other Employees who were in receipt of grants amounting to 5% or more of total Options granted during the year NilEmployees who were granted Options, during any one year, equal to or exceeding 1% of the issued capital (excluding outstanding warrants and conversions) of the Company at the time of grant
Nil
14. Consolidated Diluted Earnings Per Share (EPS) calculated in accordance with the Indian Accounting Standard 20 is `15.03 per share (Before exceptional items) and `56.05 per share (After exceptional items).
Board’s Report (Contd.) & Annexure to the Board’s Report
SASKEN ANNUAL REPORT 2014-201528
Annexure to the Board’s Report (Contd.)
15. Description of method and significant assumptions used during the year to estimate fair value of Options:
The method applied was the Black – Scholes – Merton formula with the following assumptions:
Particulars 2014-15 2013-14Average risk free interest rate (%) - 8.49%
Weighted average expected life of options granted (in years) - 2.63Expected dividend yield (%) - 5.37%Volatility (annualized) *(%) - 49.87%
Weighted average market price (`) - 130.30
Exercise Price (`) - 119.00
Weighted average fair value of the options (`) - 41.98
* Based on historical market price of the Company’s shares for the period since listing.
Annexure B
Conservation of energy, technology absorption and foreign exchange earnings and outgo
A) Conservation of Energy – Environmental Management System (EMS)
We strive to continue saving energy for the next generations.
Sasken, with its focus on concentrating towards managing the environmental system, has made this its DNA by being environmentally responsible in its workplace. Our employees being important stakeholders have been acting as major ‘Change Agents’ in supporting initiatives such as:
100% compliance to all applicable legislation Creating awareness on the consumption of environment’s resources through various campaignsRecycling and re - using resources in Business operations Promoting environment friendly products Using Water recycling plantContinuously monitored Metrics on Power and water consumption Regular energy Audits to find the gaps, if any and take improvisation steps
FY - 15 saw the reduction in electricity consumption and it is 1.6 Kwh / sq ft against the benchmark or 1.9 Kwh / sq ft for the year FY 15, there is constant awareness and proactive approach toward energy usage.
Further to the ‘Save Paper’ initiative which runs in the organization, Sasken took an initiative to reduce number of output devices, thereby reducing paper consumption by 1,45,000 sheets per year and associated power consumption for the printers.
During Q3 of FY 2014-15, Sasken implemented “enABEL” an online power monitoring solution for Air - condition chiller plants in the corporate office, which provides;
Online energy monitoringAlertsPeriodic ReportsGraphsEnergy Data Profiling
This real - time monitoring and control device ensures that, with proper monitoring of the overall energy consumed by the chiller plants sends periodic alerts, which is useful information to fine tune the chillers / AHU. The device also eliminates the error which may happen in the manual recording. There is a guaranteed reduction of 10% of energy consumed by Chiller plants. This savings have started reflecting from as early as February 2015.
At Sasken, our commitment to continuous improvement on environmental performance is integrated into our programs. This is driven by individual commitment of various team members and strong support from the management.
Our philosophy is ‘Every drop counts, every tree is precious and every watt is valuable. We continue to pledge to take the initiative and make a difference.’
B) Research & Development and Technology Absorption
The Company continues its focus in Multimedia, Wireless Broadband and Mobile Value Added Services. Your Company has made further inroads into the automotive segment with another Japanese automotive customer for its rear seat entertainment solution. Apart from making the solution compliant to industry standards, your Company has focused on compliance to popular proprietary technologies: Dolby certification is completed for this solution and DivX certification is in process.
Android has made the switch from being a promising emerging technology to being a mainstream Operating System (OS) for handheld devices. Your Company has the reputation of being a leader in the porting of Android and Windows Phone 7/8 OS and middleware onto new hardware platforms. The business opportunity also includes upgrading from one version of Android to a newer version, on existing hardware platforms. Your Company has continued to keep pace with the time - to - market demands of the customers, by investing in developing assets and processes to accelerate this task. We are the preferred partners for this domain for all the top 5 application processor companies, 4 of the top 5 handset OEMs and niche product categories like ruggedized devices.
29
Annexure to the Board’s Report (Contd.)
With Microsoft’s focus, Windows Phone - 7/8 is also emerging as a credible alternative to Android. Your Company has strengthened its position in Windows 8 activities in ruggedized devices segment and in addition is working closely with its semiconductor partners on Windows 8 device driver aspects.
Capability building with in Testing practice is continuous activities, the focus is mainly on automation skills development considering the demands around automation Testing, includes the scripting expertise building on Perl, Python, Robot Frame work, etc., the capability development Engine provides us the ability to upskill our Engineers based on the customer demands, which had helped to deliver the customer expectation and to stay competitive in the technology and Test automation area.
C) Foreign Exchange Earnings and outgoAmount in ` lakhs
As atMarch 31, 2015
As atMarch 31, 2014
Foreign exchange earnings 55,322.59 32,202.50Foreign exchange expenditure 12,962.85 12,838.23
Annexure C
Report on Corporate Social Responsibility (CSR) activities
1. A brief outline of the Company’s CSR policy, including overview of projects or programmes proposed to be undertaken and a reference to the web - link to the CSR policy and projects or programmes.
Kindly refer the Company’s website (www.sasken.com/investors/corporate - governance).
2. The Composition of the CSR Committee
Mr. Rajiv C. Mody, ChairmanMs. Neeta S. Revankar, MemberMr. Sanjay M. Shah, Member
3. Average net profit of the company for last three financial years
`4,590.66 lakhs
4. Prescribed CSR Expenditure (two per cent of the amount as in item 3 above)
`91.81 lakhs
5. Details of CSR spent during the financial year:
a. Total amount to be spent for the financial year - `91.81 lakhsb. Amount unspent, if any - `21.95 lakhsc. Manner in which the amount spent during the financial year is detailed below;
Sl.No.
CSR project or activity identified
Sector in which the Project is covered
Projects or programs1. Local area or other2. Specify the State
and district where projects or programs was undertaken
Amount outlay (budget) project or programs wise
Amount spent on the projects or ProgramsSub heads: (1) Direct expenditure
on projects or programs
(2) Overheads:
Cumul ative expenditure upto the reporting period
Amount spent: Direct or through implementing agency
1 Self Employed Women’s Association (SEWA)
Women Empowerment 1. Other2. State : GujaratDistricts: Anand and others
`69,86,337 1. `68,83,2172. ̀ 1,03,120
`69,86,337 Directly
TOTAL `69,86,337 `69,86,337
Details of implementation agency: None
6. In case the company has failed to spend the two per cent of the average net profit of the last three financial years or any part thereof, the company shall provide the reasons for not spending the amount in its Board’s report.
Your Company had allocated `91.81 lakhs towards CSR for the year 2014-15 and spent `69.86 lakhs as above, thus utilized 76% of the amount. Your Company is in the process of identifying suitable projects and will carry out the CSR activities once this is firmed up.
7. The CSR Committee of the Company hereby confirms that the implementation and monitoring of CSR Policy, is in compliance with CSR objectives and Policy of the Company.
For and on behalf of CSR Committee
Place : Bengaluru Rajiv C. ModyDate : April 23, 2015 Chairman
SASKEN ANNUAL REPORT 2014-201530
Annexure D
SECRETARIAL AUDIT REPORT
For the Financial Year ended March 31, 2015
[Pursuant to Section 204(1) of the Companies Act, 2013 and Rule No. 9 of the Companies(Appointment and Remuneration of Managerial Personnel) Rules, 2014]
To,
The Members,Sasken Communication Technologies Limited,139/25 Ring Road, Domlur,Bengaluru – 560 071.
I have conducted the Secretarial Audit of the compliance of applicable statutory provisions and the adherence to good corporate practices by Sasken Communication Technologies Limited (hereinafter called the “Company”). Secretarial Audit was conducted in a manner that provided me a reasonable basis for evaluating the corporate statutory compliances and expressing my opinion thereon.
Based on my verification of the Company’s books, papers, minute books, forms and returns filed and other records maintained by the Company and also the information provided by the Company, its officers, agents and authorised representatives during the conduct of Secretarial Audit, I hereby report that in my opinion, the Company has, during the audit period covering the financial year ended on March 31, 2015 complied with the statutory provisions listed hereunder and also that the Company has proper Board-processes and compliance-mechanism in place to the extent, in the manner and subject to the reporting made hereinafter:
I have examined the books, papers, minute books, forms and returns filed and other records maintained by the Company for the Financial Year ended on March 31, 2015 according to the provisions of:
(i) The Companies Act, 2013 and 1956 (the Act) and the rules made thereunder;(ii) The Securities Contracts (Regulation) Act, 1956 (SCRA) and the rules made thereunder;(iii) The Depositories Act, 1996 and the Regulations and Bye - laws framed thereunder;(iv) Foreign Exchange Management Act, 1999 and the rules and regulations made thereunder to the extent of Foreign Direct Investment,
Overseas Direct Investment and External Commercial Borrowings;(v) The following Regulations and Guidelines prescribed under the Securities and Exchange Board of India Act, 1992 (SEBI Act):-
(a) The Securities and Exchange Board of India (Substantial Acquisition of Shares and Takeovers) Regulations, 2011;(b) The Securities and Exchange Board of India (Prohibition of Insider Trading) Regulations, 1992;(c) The Securities and Exchange Board of India (Issue of Capital and Disclosure Requirements) Regulations, 2009 (Not Applicable to
the Company during the Audit Period);(d) The Securities and Exchange Board of India (Employee Stock Option Scheme and Employee Stock Purchase Scheme) Guidelines,
1999;(e) The Securities and Exchange Board of India (Issue and Listing of Debt Securities) Regulations, 2008 (Not Applicable to the
Company during the Audit Period);(f) The Securities and Exchange Board of India (Registrar to an Issue and Share Transfer Agents) Regulations, 1993 regarding the
Companies Act and dealing with client;(g) The Securities and Exchange Board of India (Delisting of Equity Shares) Regulations, 2009 (Not Applicable to the Company during
the Audit Period); and (h) The Securities and Exchange Board of India (Buyback of Securities) Regulations, 1998 (Not Applicable to the Company during
the Audit Period);
(vi) The other Applicable laws :
I. Environmental Health and Safety
(a) The Air (Prevention & Control of Pollution) Act,1981;(b) The Water (Prevention & Control of Pollution) Cess Rules, 1978, Amendment 2003;(c) The Environment (Protection) Rules, 1986, Amendment 2004, 2005;(d) The Hazardous Wastes (Management and Handling) Rules, 2003;(e) The Batteries Handling and Management Rules, 2001, 2010;(f) The Noise Pollution (Regulation and Control) (Amendment) Rules, 2010;(g) The Bio - Medical Waste (Management and Handling) Rules, 1998, Amendment 2003;(h) E-waste (Management and Handling) Rules, 2011.
II. Intellectual Property Laws
(a) The Indian Copyright Act, 1957;(b) The Trade Marks Act, 1999;(c) The Patents Act. 1970.
III. Industry Specific laws
(a) Policy relating to Software Technology Parks of India and its regulations;(b) The Information Technology Act, 2000 and the Rules made thereunder;(c) The Special Economic Zone Act, 2005 and the Rules made thereunder.
Annexure to the Board’s Report (Contd.)

31
IV. Local Laws
(a) The Karnataka Lifts Act,1974;(b) The Bangalore Water Supply and Sewerage Act, 1964;(c) Shop & Commercial Establishment Act of local authorities.
V. Tax Laws
(a) The Finance Act, 1994 (Service Tax Law) and the rules made thereunder;(b) The Income Tax Act, 1961 and the rules made thereunder;(c) The Customs Act, 1962 and the rules made thereunder;(d) Central Excise Act, 1944 and the rules made thereunder.
VI. Labour Laws and other incidental laws related to labour and employees appointed by Company either on payroll or on contractual basis as related to wages, gratuity, provident fund and other compensation.
VII. The Sexual harassment of Women at workplace (Prevention, Prohibition and Redressal) Rules, 2013
I have also examined compliance with the applicable clauses of the following:
(i) Secretarial Standards issued by The Institute of Company Secretaries of India (not notified hence not applicable to the Company during the audit period).
(ii) The Listing Agreements entered into by the Company with the Stock Exchanges;
During the period under review the Company has complied with the provisions of the Act, Rules, Regulations, Guidelines, Standard, etc. mentioned above.
I further report that
The Board of Directors of the Company is duly constituted with proper balance of Executive Directors, Non-Executive Directors and Independent Directors. The changes in the Composition of the Board of Directors that took place during the period under review were carried out in compliance with the provisions of the Act.
Adequate notice is given to all the directors to schedule the Board Meetings, agenda and detailed notes on agenda were sent at least seven days in advance and a system exists for seeking and obtaining further information and clarifications on the agenda items before the meeting and for meaningful participation at the meeting. However certain Board Meetings were held at a shorter notice in which some of the Independent Directors were present.
I further report that there are adequate systems and processes in the Company commensurate with the size and operations of the Company to monitor and ensure compliance with applicable laws, rules, regulations and guidelines.
This Report is to be read with my letter of even date, which is annexed as Annexure A and forms an integral part of this report.
Bengaluru J Sundharesan (PCS)April 14, 2015 (M. No – 5229 CP. No – 5164)
Annexure A
The Members,
Sasken Communication Technologies Limited
My report of even date is to be read along with this letter.
1. Maintenance of Statutory records is the responsibility of the management of the Company. My responsibility is to express an opinion on these records based on my audit.
2. I have followed the audit practices and process as were appropriate to obtain reasonable assurance about the correctness of the contents of the records. The verification was done on test basis to ensure that correct facts are reflected in records.
3. I have not verified the correctness and appropriateness of financial records and Books of Account of the Company.
4. Wherever required, I have obtained the management representation about the Compliance of laws, rules and regulations and happening of events, etc.
5. The Compliance of the provisions of Corporate and other applicable laws, rules, regulations, standards is the responsibility of management. My examination was limited to the verification of procedure on test basis.
6. The Secretarial Audit report is neither an assurance as to the future viability of the Company nor of the efficacy or effectiveness with which the management has conducted the affairs of the Company.
Bengaluru J Sundharesan (PCS)April 14, 2015 (M. No – 5229 CP. No – 5164)
Annexure to the Board’s Report (Contd.)
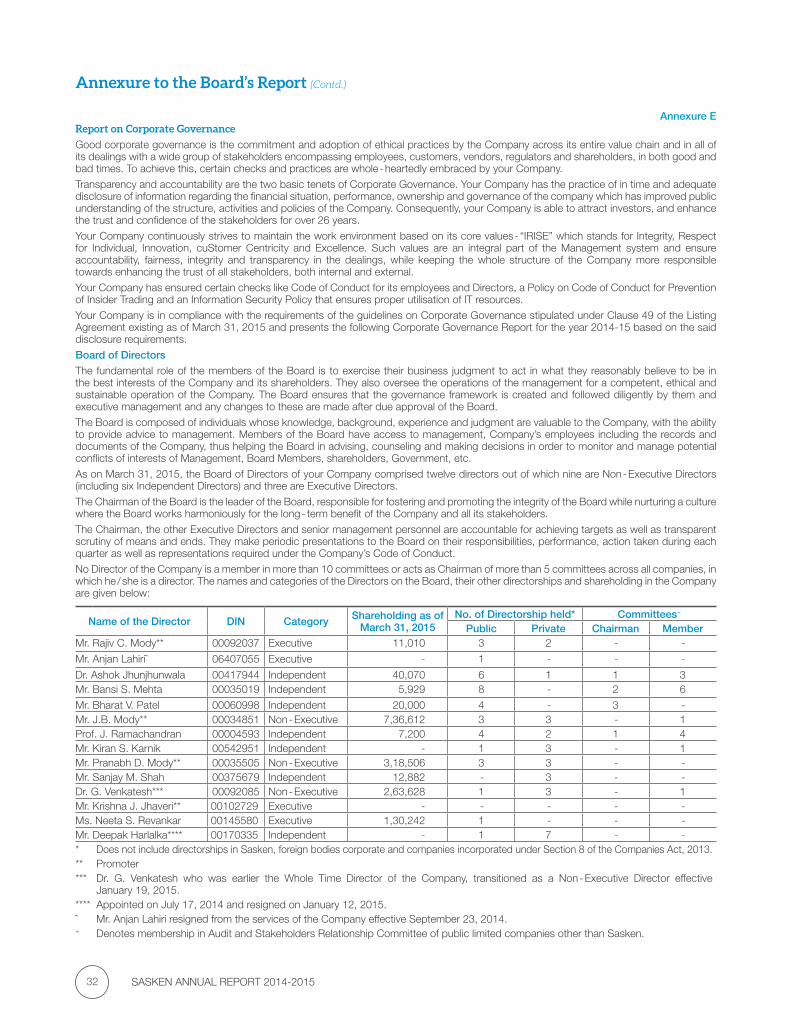
SASKEN ANNUAL REPORT 2014-201532
Annexure EReport on Corporate Governance
Good corporate governance is the commitment and adoption of ethical practices by the Company across its entire value chain and in all of its dealings with a wide group of stakeholders encompassing employees, customers, vendors, regulators and shareholders, in both good and bad times. To achieve this, certain checks and practices are whole - heartedly embraced by your Company.
Transparency and accountability are the two basic tenets of Corporate Governance. Your Company has the practice of in time and adequate disclosure of information regarding the financial situation, performance, ownership and governance of the company which has improved public understanding of the structure, activities and policies of the Company. Consequently, your Company is able to attract investors, and enhance the trust and confidence of the stakeholders for over 26 years.
Your Company continuously strives to maintain the work environment based on its core values - “IRISE” which stands for Integrity, Respect for Individual, Innovation, cuStomer Centricity and Excellence. Such values are an integral part of the Management system and ensure accountability, fairness, integrity and transparency in the dealings, while keeping the whole structure of the Company more responsible towards enhancing the trust of all stakeholders, both internal and external.
Your Company has ensured certain checks like Code of Conduct for its employees and Directors, a Policy on Code of Conduct for Prevention of Insider Trading and an Information Security Policy that ensures proper utilisation of IT resources.
Your Company is in compliance with the requirements of the guidelines on Corporate Governance stipulated under Clause 49 of the Listing Agreement existing as of March 31, 2015 and presents the following Corporate Governance Report for the year 2014-15 based on the said disclosure requirements.
Board of Directors
The fundamental role of the members of the Board is to exercise their business judgment to act in what they reasonably believe to be in the best interests of the Company and its shareholders. They also oversee the operations of the management for a competent, ethical and sustainable operation of the Company. The Board ensures that the governance framework is created and followed diligently by them and executive management and any changes to these are made after due approval of the Board.
The Board is composed of individuals whose knowledge, background, experience and judgment are valuable to the Company, with the ability to provide advice to management. Members of the Board have access to management, Company’s employees including the records and documents of the Company, thus helping the Board in advising, counseling and making decisions in order to monitor and manage potential conflicts of interests of Management, Board Members, shareholders, Government, etc.
As on March 31, 2015, the Board of Directors of your Company comprised twelve directors out of which nine are Non - Executive Directors (including six Independent Directors) and three are Executive Directors.
The Chairman of the Board is the leader of the Board, responsible for fostering and promoting the integrity of the Board while nurturing a culture where the Board works harmoniously for the long - term benefit of the Company and all its stakeholders.
The Chairman, the other Executive Directors and senior management personnel are accountable for achieving targets as well as transparent scrutiny of means and ends. They make periodic presentations to the Board on their responsibilities, performance, action taken during each quarter as well as representations required under the Company’s Code of Conduct.
No Director of the Company is a member in more than 10 committees or acts as Chairman of more than 5 committees across all companies, in which he / she is a director. The names and categories of the Directors on the Board, their other directorships and shareholding in the Company are given below:
Name of the Director DIN Category Shareholding as of March 31, 2015
No. of Directorship held* Committees~
Public Private Chairman MemberMr. Rajiv C. Mody** 00092037 Executive 11,010 3 2 - -
Mr. Anjan Lahiriˆ 06407055 Executive - 1 - - -
Dr. Ashok Jhunjhunwala 00417944 Independent 40,070 6 1 1 3Mr. Bansi S. Mehta 00035019 Independent 5,929 8 - 2 6
Mr. Bharat V. Patel 00060998 Independent 20,000 4 - 3 - Mr. J.B. Mody** 00034851 Non - Executive 7,36,612 3 3 - 1Prof. J. Ramachandran 00004593 Independent 7,200 4 2 1 4Mr. Kiran S. Karnik 00542951 Independent - 1 3 - 1Mr. Pranabh D. Mody** 00035505 Non - Executive 3,18,506 3 3 - - Mr. Sanjay M. Shah 00375679 Independent 12,882 - 3 - - Dr. G. Venkatesh*** 00092085 Non - Executive 2,63,628 1 3 - 1Mr. Krishna J. Jhaveri** 00102729 Executive - - - - - Ms. Neeta S. Revankar 00145580 Executive 1,30,242 1 - - - Mr. Deepak Harlalka**** 00170335 Independent - 1 7 - - * Does not include directorships in Sasken, foreign bodies corporate and companies incorporated under Section 8 of the Companies Act, 2013.** Promoter*** Dr. G. Venkatesh who was earlier the Whole Time Director of the Company, transitioned as a Non - Executive Director effective
January 19, 2015.**** Appointed on July 17, 2014 and resigned on January 12, 2015.ˆ Mr. Anjan Lahiri resigned from the services of the Company effective September 23, 2014.~ Denotes membership in Audit and Stakeholders Relationship Committee of public limited companies other than Sasken.
Annexure to the Board’s Report (Contd.)
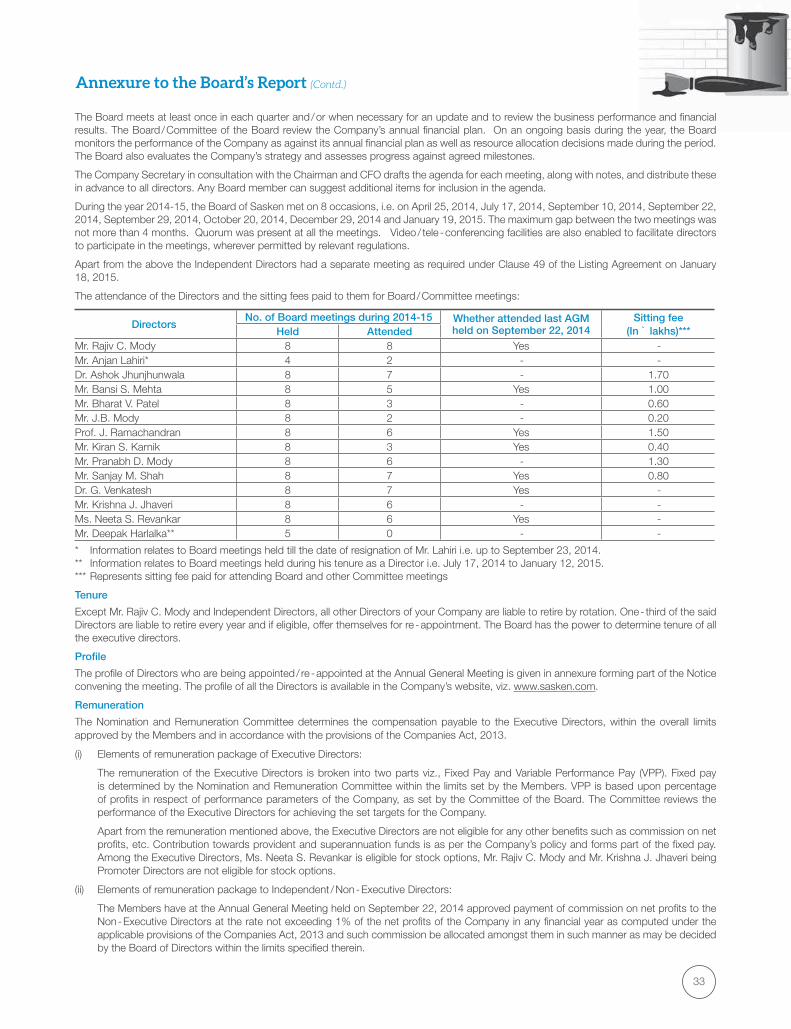
33
The Board meets at least once in each quarter and / or when necessary for an update and to review the business performance and financial results. The Board / Committee of the Board review the Company’s annual financial plan. On an ongoing basis during the year, the Board monitors the performance of the Company as against its annual financial plan as well as resource allocation decisions made during the period. The Board also evaluates the Company’s strategy and assesses progress against agreed milestones.
The Company Secretary in consultation with the Chairman and CFO drafts the agenda for each meeting, along with notes, and distribute these in advance to all directors. Any Board member can suggest additional items for inclusion in the agenda.
During the year 2014-15, the Board of Sasken met on 8 occasions, i.e. on April 25, 2014, July 17, 2014, September 10, 2014, September 22, 2014, September 29, 2014, October 20, 2014, December 29, 2014 and January 19, 2015. The maximum gap between the two meetings was not more than 4 months. Quorum was present at all the meetings. Video / tele - conferencing facilities are also enabled to facilitate directors to participate in the meetings, wherever permitted by relevant regulations.
Apart from the above the Independent Directors had a separate meeting as required under Clause 49 of the Listing Agreement on January 18, 2015.
The attendance of the Directors and the sitting fees paid to them for Board / Committee meetings:
DirectorsNo. of Board meetings during 2014-15 Whether attended last AGM
held on September 22, 2014Sitting fee
(In ` lakhs)***Held AttendedMr. Rajiv C. Mody 8 8 Yes - Mr. Anjan Lahiri* 4 2 - - Dr. Ashok Jhunjhunwala 8 7 - 1.70Mr. Bansi S. Mehta 8 5 Yes 1.00Mr. Bharat V. Patel 8 3 - 0.60Mr. J.B. Mody 8 2 - 0.20Prof. J. Ramachandran 8 6 Yes 1.50Mr. Kiran S. Karnik 8 3 Yes 0.40Mr. Pranabh D. Mody 8 6 - 1.30Mr. Sanjay M. Shah 8 7 Yes 0.80Dr. G. Venkatesh 8 7 Yes - Mr. Krishna J. Jhaveri 8 6 - - Ms. Neeta S. Revankar 8 6 Yes - Mr. Deepak Harlalka** 5 0 - -
* Information relates to Board meetings held till the date of resignation of Mr. Lahiri i.e. up to September 23, 2014.** Information relates to Board meetings held during his tenure as a Director i.e. July 17, 2014 to January 12, 2015.*** Represents sitting fee paid for attending Board and other Committee meetings
Tenure
Except Mr. Rajiv C. Mody and Independent Directors, all other Directors of your Company are liable to retire by rotation. One - third of the said Directors are liable to retire every year and if eligible, offer themselves for re - appointment. The Board has the power to determine tenure of all the executive directors.
Profile
The profile of Directors who are being appointed / re - appointed at the Annual General Meeting is given in annexure forming part of the Notice convening the meeting. The profile of all the Directors is available in the Company’s website, viz. www.sasken.com.
Remuneration
The Nomination and Remuneration Committee determines the compensation payable to the Executive Directors, within the overall limits approved by the Members and in accordance with the provisions of the Companies Act, 2013.
(i) Elements of remuneration package of Executive Directors:
The remuneration of the Executive Directors is broken into two parts viz., Fixed Pay and Variable Performance Pay (VPP). Fixed pay is determined by the Nomination and Remuneration Committee within the limits set by the Members. VPP is based upon percentage of profits in respect of performance parameters of the Company, as set by the Committee of the Board. The Committee reviews the performance of the Executive Directors for achieving the set targets for the Company.
Apart from the remuneration mentioned above, the Executive Directors are not eligible for any other benefits such as commission on net profits, etc. Contribution towards provident and superannuation funds is as per the Company’s policy and forms part of the fixed pay. Among the Executive Directors, Ms. Neeta S. Revankar is eligible for stock options, Mr. Rajiv C. Mody and Mr. Krishna J. Jhaveri being Promoter Directors are not eligible for stock options.
(ii) Elements of remuneration package to Independent / Non - Executive Directors:
The Members have at the Annual General Meeting held on September 22, 2014 approved payment of commission on net profits to the Non - Executive Directors at the rate not exceeding 1% of the net profits of the Company in any financial year as computed under the applicable provisions of the Companies Act, 2013 and such commission be allocated amongst them in such manner as may be decided by the Board of Directors within the limits specified therein.
Annexure to the Board’s Report (Contd.)

SASKEN ANNUAL REPORT 2014-201534
Towards this end, the Board took into consideration the attendance and contribution made by Non - Executive Directors at Board and certain Committee Meetings as well as the time spent by them on operational matters other than at meetings while arriving at the commission payable to them for the year ended March 31, 2015. No Stock Options were granted to Directors during the year. The following table shows the remuneration paid / payable to the Directors for the year 2014 -15:
(` in lakhs)
Directors Fixed Remuneration Variable Performance Pay CommissionMr. Rajiv C. Mody 80.00 243.25 - Mr. Anjan Lahiri 50.46 - - Dr. Ashok Jhunjhunwala - - 25.00Mr. Bansi S. Mehta - - 22.00Mr. Bharat V. Patel - - 12.00Prof. J. Ramachandran - - 25.00Mr. Kiran S. Karnik - - 10.00Mr. Sanjay M. Shah - - 8.00Dr. G. Venkatesh 27.80 32.75 - Mr. Krishna J. Jhaveri 25.79 2.89 - Ms. Neeta S. Revankar 57.05 122.50 -
The proposed maximum remuneration payable per annum to the Executive Directors for a period of five years is given in the notice convening the Annual General Meeting, forming part of this Annual Report.
Board Committees
In order to have a more focussed attention on the affairs of the Company, the Board has formed various committees. These Committees prepare the groundwork for decision making and report at the subsequent Board Meeting. As of March 31, 2015, your Company has the following committees of the Board of Directors:
(a) Audit Committee(b) Corporate Social Responsibility Committee(c) Nomination and Remuneration Committee(d) Risk Management Committee(e) Stakeholders Relationship Committee(f) Strategy, Business and Marketing Review Committee
Audit Committee
This Committee provides oversight of the Company’s accounting and financial reporting processes and the audit of the Company’s financial statements and assists the Board in oversight of (1) the integrity of the Company’s financial statements, (2) the Company’s compliance with legal and regulatory requirements, (3) the independent auditor’s qualifications, independence and performance, and (4) the Company’s internal accounting and financial controls and (5) Enterprise Risk Management Policy and adherence to approved policy.
Mr. Bansi S. Mehta is the Chairman of the Audit Committee. The other members of the Committee are Prof J. Ramachandran, Dr. Ashok Jhunjhunwala and Mr. Pranabh D. Mody.
The terms of reference are as follows:
1. To oversee the company’s financial reporting process and the disclosure of its financial information to ensure that the financial statement is correct, sufficient and credible;
2. To recommend the appointment, remuneration and terms of appointment of auditors of the company;
3. To approve the payment to statutory auditors for any other services rendered by the statutory auditors;
4. To review, with the management, the annual financial statements and auditor’s report thereon before submission to the board for approval, with particular reference to:
(a) Matters required to be included in the Director’s Responsibility Statement to be included in the Board’s report in terms of clause (c) of sub - section 3 of section 134 of the Companies Act, 2013;
(b) Changes, if any, in accounting policies and practices and reasons for the same;(c) Major accounting entries involving estimates based on the exercise of judgment by management;(d) Significant adjustments made in the financial statements arising out of audit findings;(e) Compliance with listing and other legal requirements relating to financial statements;(f) Disclosure of any related party transactions; and(g) Qualifications in the draft audit report.
5. To review, with the management, the quarterly financial statements before submission to the board for approval;
6. To review, with the management, the statement of uses / application of funds raised through an issue (public issue, rights issue, preferential issue, etc.), the statement of funds utilized for purposes other than those stated in the offer document / prospectus / notice and the report submitted by the agency monitoring the utilisation of proceeds of a public or rights issue, and making appropriate recommendations to the Board to take up steps in this matter;
Annexure to the Board’s Report (Contd.)
35
7. To review and monitor the auditor’s independence and performance, and effectiveness of audit process;
8. To approve or any subsequent modification of transactions of the company with related parties;
9. To scrutinize inter - corporate loans and investments;
10. To valuate undertakings or assets of the company, wherever it is necessary;
11. To evaluate internal financial controls and risk management systems;
12. To review, with the management, performance of statutory and internal auditors, adequacy of the internal control systems;
13. To review the adequacy of internal audit function, if any, including the structure of the internal audit department, staffing and seniority of the official heading the department, reporting structure coverage and frequency of internal audit;
14. To discuss with internal auditors for any significant findings and follow up there on;
15. To review the findings of any internal investigations by the internal auditors into matters where there is suspected fraud or irregularity or a failure of internal control systems of a material nature and reporting the matter to the board;
16. To discuss with statutory auditors before the audit commences, about the nature and scope of audit as well as post - audit discussion to ascertain any area of concern;
17. To look into the reasons for substantial defaults in the payment to the depositors, debenture holders, shareholders (in case of non - payment of declared dividends) and creditors;
18. To review the functioning of the Whistle Blower mechanism;
19. To approve the appointment of CFO (i.e., the Whole Time Finance Director or any other person heading the finance function or discharging that function) after assessing the qualifications, experience and background, etc. of the candidate.
The Audit Committee met four times during the year, i.e. on April 25, 2014, July 17, 2014, October 20, 2014 and January 19, 2015. The minutes of the meetings are placed before the Board at the succeeding Board Meeting for information. Quorum was present at all the meetings. Whenever needed, decisions were also taken by the Committee by circulation process.
Details of attendance at the Committee meetings are given below:
DirectorNo. of Meetings
Held AttendedMr. Bansi S. Mehta 4 4Prof J. Ramachandran 4 3Dr. Ashok Jhunjhunwala 4 4Mr. Pranabh D. Mody 4 3
Mr. Rajiv C. Mody, Chairman & Managing Director, Ms. Neeta S. Revankar, Whole Time Director & CFO, Dr. G. Venkatesh, Non - Executive Director and both the Internal as well as Statutory Auditors of the Company are permanent invitees to the Audit Committee meetings.
Mr. S. Prasad, Company Secretary acts as Secretary to the Committee.
Corporate Social Responsibility Committee
As per section 135 of the Companies Act, 2013 the Company had constituted a Corporate Social Responsibility Committee of the Board consisting of Mr. Rajiv C. Mody as Chairman, Mr. Sanjay M. Shah and Ms. Neeta S. Revankar as members.
The objective of the SASKEN CSR Policy is to:
1. Ensure an increased commitment at all levels in the organization, to operate its business in an economically, socially & environmentally sustainable manner, while recognizing the interests of all its stakeholders.
2. To directly or indirectly take up programs that benefit the communities in & around its work centers and results, over a period of time, in enhancing the quality of life & economic well - being of the local populace.
3. To generate, through its CSR initiatives, a community goodwill for SASKEN and help reinforce a positive & socially responsible image of SASKEN as a corporate entity.
The said Policy is made available in the website of the Company.
Nomination and Remuneration Committee
Prof. J. Ramachandran chairs the Nomination and Remuneration Committee. Dr. Ashok Jhunjhunwala and Mr. Pranabh D. Mody are the members of the Committee.
The objective and purpose of the policy of the Committee, including its terms of reference are as follows:
1. Formulate the criteria for determining qualifications, positive attributes and independence of a director.2. Oversee the identification of persons who are qualified to become a Director and who may be appointed in accordance with the criteria
laid down in the Nomination and Remuneration policy of the Company.3. Recommend to the Board, appointment and removal of Director.4. To device a Policy on Board Diversity.
Annexure to the Board’s Report (Contd.)
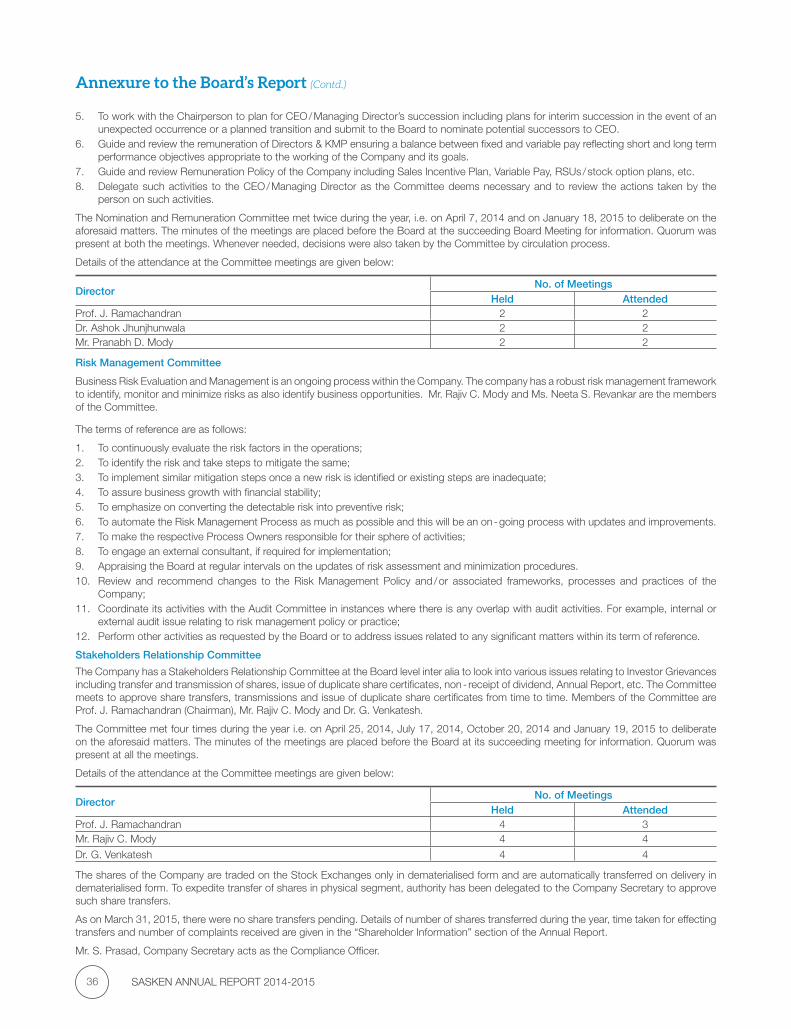
SASKEN ANNUAL REPORT 2014-201536
5. To work with the Chairperson to plan for CEO / Managing Director’s succession including plans for interim succession in the event of an unexpected occurrence or a planned transition and submit to the Board to nominate potential successors to CEO.
6. Guide and review the remuneration of Directors & KMP ensuring a balance between fixed and variable pay reflecting short and long term performance objectives appropriate to the working of the Company and its goals.
7. Guide and review Remuneration Policy of the Company including Sales Incentive Plan, Variable Pay, RSUs / stock option plans, etc.8. Delegate such activities to the CEO / Managing Director as the Committee deems necessary and to review the actions taken by the
person on such activities.
The Nomination and Remuneration Committee met twice during the year, i.e. on April 7, 2014 and on January 18, 2015 to deliberate on the aforesaid matters. The minutes of the meetings are placed before the Board at the succeeding Board Meeting for information. Quorum was present at both the meetings. Whenever needed, decisions were also taken by the Committee by circulation process.
Details of the attendance at the Committee meetings are given below:
DirectorNo. of Meetings
Held AttendedProf. J. Ramachandran 2 2Dr. Ashok Jhunjhunwala 2 2Mr. Pranabh D. Mody 2 2
Risk Management Committee
Business Risk Evaluation and Management is an ongoing process within the Company. The company has a robust risk management framework to identify, monitor and minimize risks as also identify business opportunities. Mr. Rajiv C. Mody and Ms. Neeta S. Revankar are the members of the Committee.
The terms of reference are as follows:
1. To continuously evaluate the risk factors in the operations;2. To identify the risk and take steps to mitigate the same;3. To implement similar mitigation steps once a new risk is identified or existing steps are inadequate;4. To assure business growth with financial stability;5. To emphasize on converting the detectable risk into preventive risk;6. To automate the Risk Management Process as much as possible and this will be an on - going process with updates and improvements.7. To make the respective Process Owners responsible for their sphere of activities;8. To engage an external consultant, if required for implementation;9. Appraising the Board at regular intervals on the updates of risk assessment and minimization procedures. 10. Review and recommend changes to the Risk Management Policy and / or associated frameworks, processes and practices of the
Company;11. Coordinate its activities with the Audit Committee in instances where there is any overlap with audit activities. For example, internal or
external audit issue relating to risk management policy or practice;12. Perform other activities as requested by the Board or to address issues related to any significant matters within its term of reference.
Stakeholders Relationship Committee
The Company has a Stakeholders Relationship Committee at the Board level inter alia to look into various issues relating to Investor Grievances including transfer and transmission of shares, issue of duplicate share certificates, non - receipt of dividend, Annual Report, etc. The Committee meets to approve share transfers, transmissions and issue of duplicate share certificates from time to time. Members of the Committee are Prof. J. Ramachandran (Chairman), Mr. Rajiv C. Mody and Dr. G. Venkatesh.
The Committee met four times during the year i.e. on April 25, 2014, July 17, 2014, October 20, 2014 and January 19, 2015 to deliberate on the aforesaid matters. The minutes of the meetings are placed before the Board at its succeeding meeting for information. Quorum was present at all the meetings.
Details of the attendance at the Committee meetings are given below:
DirectorNo. of Meetings
Held AttendedProf. J. Ramachandran 4 3Mr. Rajiv C. Mody 4 4
Dr. G. Venkatesh 4 4
The shares of the Company are traded on the Stock Exchanges only in dematerialised form and are automatically transferred on delivery in dematerialised form. To expedite transfer of shares in physical segment, authority has been delegated to the Company Secretary to approve such share transfers.
As on March 31, 2015, there were no share transfers pending. Details of number of shares transferred during the year, time taken for effecting transfers and number of complaints received are given in the “Shareholder Information” section of the Annual Report.
Mr. S. Prasad, Company Secretary acts as the Compliance Officer.
Annexure to the Board’s Report (Contd.)
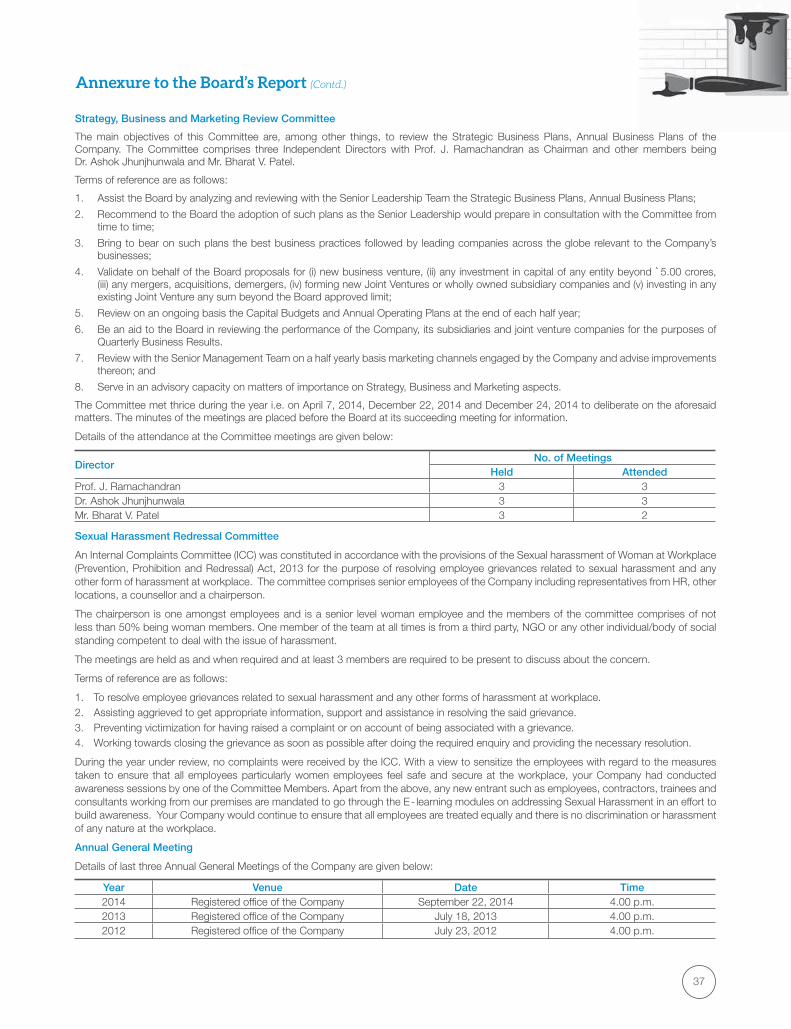
37
Strategy, Business and Marketing Review Committee
The main objectives of this Committee are, among other things, to review the Strategic Business Plans, Annual Business Plans of the Company. The Committee comprises three Independent Directors with Prof. J. Ramachandran as Chairman and other members being Dr. Ashok Jhunjhunwala and Mr. Bharat V. Patel.
Terms of reference are as follows:
1. Assist the Board by analyzing and reviewing with the Senior Leadership Team the Strategic Business Plans, Annual Business Plans;
2. Recommend to the Board the adoption of such plans as the Senior Leadership would prepare in consultation with the Committee from time to time;
3. Bring to bear on such plans the best business practices followed by leading companies across the globe relevant to the Company’s businesses;
4. Validate on behalf of the Board proposals for (i) new business venture, (ii) any investment in capital of any entity beyond `5.00 crores, (iii) any mergers, acquisitions, demergers, (iv) forming new Joint Ventures or wholly owned subsidiary companies and (v) investing in any existing Joint Venture any sum beyond the Board approved limit;
5. Review on an ongoing basis the Capital Budgets and Annual Operating Plans at the end of each half year;
6. Be an aid to the Board in reviewing the performance of the Company, its subsidiaries and joint venture companies for the purposes of Quarterly Business Results.
7. Review with the Senior Management Team on a half yearly basis marketing channels engaged by the Company and advise improvements thereon; and
8. Serve in an advisory capacity on matters of importance on Strategy, Business and Marketing aspects.
The Committee met thrice during the year i.e. on April 7, 2014, December 22, 2014 and December 24, 2014 to deliberate on the aforesaid matters. The minutes of the meetings are placed before the Board at its succeeding meeting for information.
Details of the attendance at the Committee meetings are given below:
DirectorNo. of Meetings
Held AttendedProf. J. Ramachandran 3 3Dr. Ashok Jhunjhunwala 3 3Mr. Bharat V. Patel 3 2
Sexual Harassment Redressal Committee
An Internal Complaints Committee (ICC) was constituted in accordance with the provisions of the Sexual harassment of Woman at Workplace (Prevention, Prohibition and Redressal) Act, 2013 for the purpose of resolving employee grievances related to sexual harassment and any other form of harassment at workplace. The committee comprises senior employees of the Company including representatives from HR, other locations, a counsellor and a chairperson.
The chairperson is one amongst employees and is a senior level woman employee and the members of the committee comprises of not less than 50% being woman members. One member of the team at all times is from a third party, NGO or any other individual/body of social standing competent to deal with the issue of harassment.
The meetings are held as and when required and at least 3 members are required to be present to discuss about the concern.
Terms of reference are as follows:
1. To resolve employee grievances related to sexual harassment and any other forms of harassment at workplace.2. Assisting aggrieved to get appropriate information, support and assistance in resolving the said grievance.3. Preventing victimization for having raised a complaint or on account of being associated with a grievance.4. Working towards closing the grievance as soon as possible after doing the required enquiry and providing the necessary resolution.
During the year under review, no complaints were received by the ICC. With a view to sensitize the employees with regard to the measures taken to ensure that all employees particularly women employees feel safe and secure at the workplace, your Company had conducted awareness sessions by one of the Committee Members. Apart from the above, any new entrant such as employees, contractors, trainees and consultants working from our premises are mandated to go through the E - learning modules on addressing Sexual Harassment in an effort to build awareness. Your Company would continue to ensure that all employees are treated equally and there is no discrimination or harassment of any nature at the workplace.
Annual General Meeting
Details of last three Annual General Meetings of the Company are given below:
Year Venue Date Time2014 Registered office of the Company September 22, 2014 4.00 p.m.2013 Registered office of the Company July 18, 2013 4.00 p.m.2012 Registered office of the Company July 23, 2012 4.00 p.m.
Annexure to the Board’s Report (Contd.)
SASKEN ANNUAL REPORT 2014-201538
At each of the above AGMs, special resolutions were passed approving the appointment of independent directors, payment of remuneration to Executive Directors, payment of commission to Non - Executive Directors and Amendment to Articles of Association.
Extraordinary General Meeting
No Extraordinary General Meeting of the members was held during the year 2014-15.
Postal Ballot
There were no resolutions passed by postal Ballot during the year 2014-15.
Your Company also proposes to conduct Postal Ballot and / or E - voting to pass special resolution of the members as appropriate.
Other Disclosures
1. Reconciliation of share capital audit:
A qualified practicing Company Secretary carried out a share capital audit to reconcile the total admitted equity share capital with the National Securities Depository Limited (NSDL) and the Central Depository Services (India) Limited (CDSL) and the total issued and listed equity share capital. The audit report confirms that the total issued / paid - up capital is in agreement with the total number of shares in physical form and the total number of dematerialised shares held with NSDL and CDSL.
2. Related Party Transactions:
All related party transactions that were entered into during the financial year were on an arm’s length basis and in the ordinary course of business. There are no materially significant related party transactions made by the Company with Promoters, Directors, Key Managerial Personnel or other designated persons which may have a potential conflict with the interest of the Company at large.
Details of the related party transactions are given in Annexure F to the Board’s Report.
3. There are no non - compliances by the Company, penalties and strictures imposed on the Company by Stock Exchanges or SEBI or any other statutory authority, on any matter related to capital markets, during the last three years.
4. The Company has complied with the requirements of the Stock Exchanges and SEBI on matters relating to Capital Markets, as applicable from time to time.
5. Your Company has been having a Whistle Blower Policy in place since June, 2004 and have been amended from time to time incorporating the changes. The said Policy is also available on the website of the Company. We confirm that no employee of the Company has been denied access to the Audit Committee in respect of any incident covered by the Whistle Blower Policy.
6. The terms and conditions of appointment of independent directors are disclosed on the website of the Company.
Means of communication:
Following information is displayed at Company’s website www.sasken.com from time to time:
1. Financial results at the end of each quarter of the year2. Relevant Press Releases3. Company Presentations4. Shareholding Pattern5. Annual Report
The quarterly audited financial results are published in Financial Express (National daily) and in Kannada Prabha (a Kannada daily). The last four quarterly results were published in the above dailies on April 26, 2014, July 18, 2014, October 21, 2014 and January 20, 2015.
All material information about the Company is promptly uploaded in the Portals and also sent through e - mail / facsimile to the Stock Exchanges where the Company’s shares are listed and released to wire services and the Press for information of the public at large. Besides, the Company disseminates information through Press Release, and its website.
Compliance with disclosure requirements under Clause 49 of the Listing Agreement with Stock Exchanges
Annexure X to said Clause 49
Information as required to be placed before the Board has been complied with.
Annexure XIII to said Clause 49
Your Company has engaged a firm of Chartered Accountants as Internal Auditors and they report to the Audit Committee of the Board.
Your Company always strive towards having unqualified financial statements.
Code of Conduct
All the Members of the Board and Senior Management personnel have affirmed compliance with the Company’s Code of Conduct in respect of the last financial year.
Bengaluru Rajiv C. ModyApril 23, 2015 Chairman & Managing Director
Annexure to the Board’s Report (Contd.)
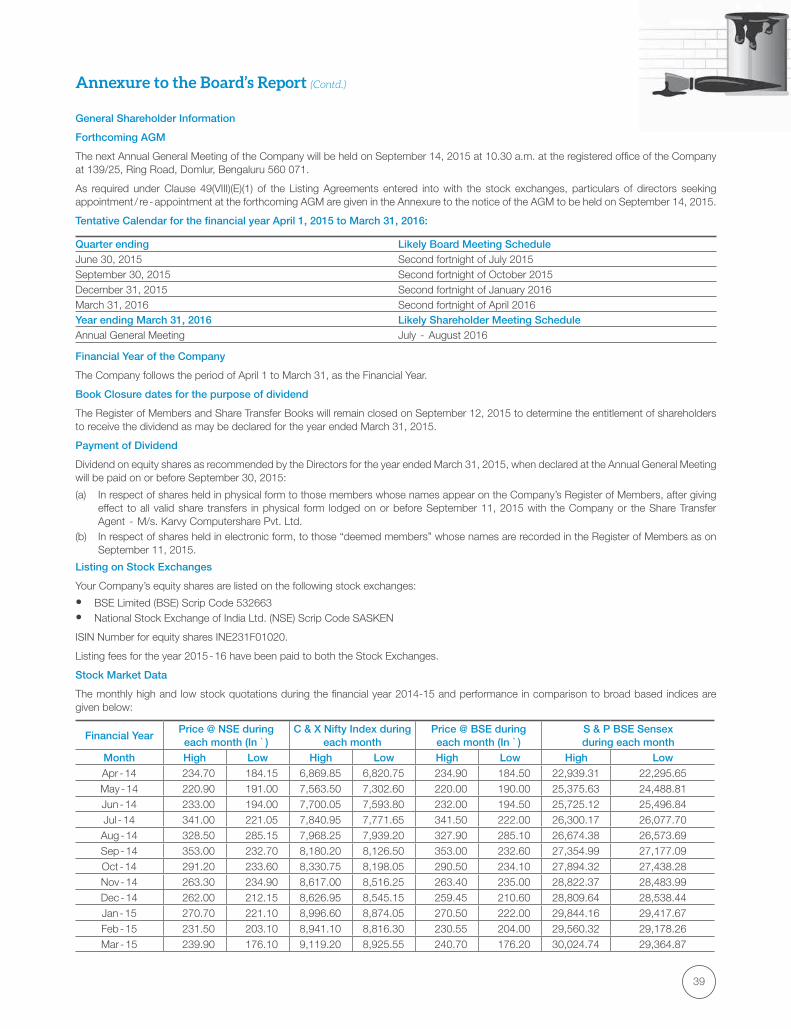
39
General Shareholder Information
Forthcoming AGM
The next Annual General Meeting of the Company will be held on September 14, 2015 at 10.30 a.m. at the registered office of the Company at 139/25, Ring Road, Domlur, Bengaluru 560 071.
As required under Clause 49(VIII)(E)(1) of the Listing Agreements entered into with the stock exchanges, particulars of directors seeking appointment / re - appointment at the forthcoming AGM are given in the Annexure to the notice of the AGM to be held on September 14, 2015.
Tentative Calendar for the financial year April 1, 2015 to March 31, 2016:
Quarter ending Likely Board Meeting ScheduleJune 30, 2015 Second fortnight of July 2015September 30, 2015 Second fortnight of October 2015December 31, 2015 Second fortnight of January 2016March 31, 2016 Second fortnight of April 2016Year ending March 31, 2016 Likely Shareholder Meeting ScheduleAnnual General Meeting July - August 2016
Financial Year of the Company
The Company follows the period of April 1 to March 31, as the Financial Year.
Book Closure dates for the purpose of dividend
The Register of Members and Share Transfer Books will remain closed on September 12, 2015 to determine the entitlement of shareholders to receive the dividend as may be declared for the year ended March 31, 2015.
Payment of Dividend
Dividend on equity shares as recommended by the Directors for the year ended March 31, 2015, when declared at the Annual General Meeting will be paid on or before September 30, 2015:
(a) In respect of shares held in physical form to those members whose names appear on the Company’s Register of Members, after giving effect to all valid share transfers in physical form lodged on or before September 11, 2015 with the Company or the Share Transfer Agent - M/s. Karvy Computershare Pvt. Ltd.
(b) In respect of shares held in electronic form, to those “deemed members” whose names are recorded in the Register of Members as on September 11, 2015.
Listing on Stock Exchanges
Your Company’s equity shares are listed on the following stock exchanges:
BSE Limited (BSE) Scrip Code 532663National Stock Exchange of India Ltd. (NSE) Scrip Code SASKEN
ISIN Number for equity shares INE231F01020.
Listing fees for the year 2015 - 16 have been paid to both the Stock Exchanges.
Stock Market Data
The monthly high and low stock quotations during the financial year 2014-15 and performance in comparison to broad based indices are given below:
Financial YearPrice @ NSE during each month (In `)
C & X Nifty Index during each month
Price @ BSE during each month (In `)
S & P BSE Sensexduring each month
Month High Low High Low High Low High LowApr - 14 234.70 184.15 6,869.85 6,820.75 234.90 184.50 22,939.31 22,295.65May - 14 220.90 191.00 7,563.50 7,302.60 220.00 190.00 25,375.63 24,488.81Jun - 14 233.00 194.00 7,700.05 7,593.80 232.00 194.50 25,725.12 25,496.84Jul - 14 341.00 221.05 7,840.95 7,771.65 341.50 222.00 26,300.17 26,077.70Aug - 14 328.50 285.15 7,968.25 7,939.20 327.90 285.10 26,674.38 26,573.69Sep - 14 353.00 232.70 8,180.20 8,126.50 353.00 232.60 27,354.99 27,177.09Oct - 14 291.20 233.60 8,330.75 8,198.05 290.50 234.10 27,894.32 27,438.28Nov - 14 263.30 234.90 8,617.00 8,516.25 263.40 235.00 28,822.37 28,483.99Dec - 14 262.00 212.15 8,626.95 8,545.15 259.45 210.60 28,809.64 28,538.44Jan - 15 270.70 221.10 8,996.60 8,874.05 270.50 222.00 29,844.16 29,417.67Feb - 15 231.50 203.10 8,941.10 8,816.30 230.55 204.00 29,560.32 29,178.26Mar - 15 239.90 176.10 9,119.20 8,925.55 240.70 176.20 30,024.74 29,364.87
Annexure to the Board’s Report (Contd.)
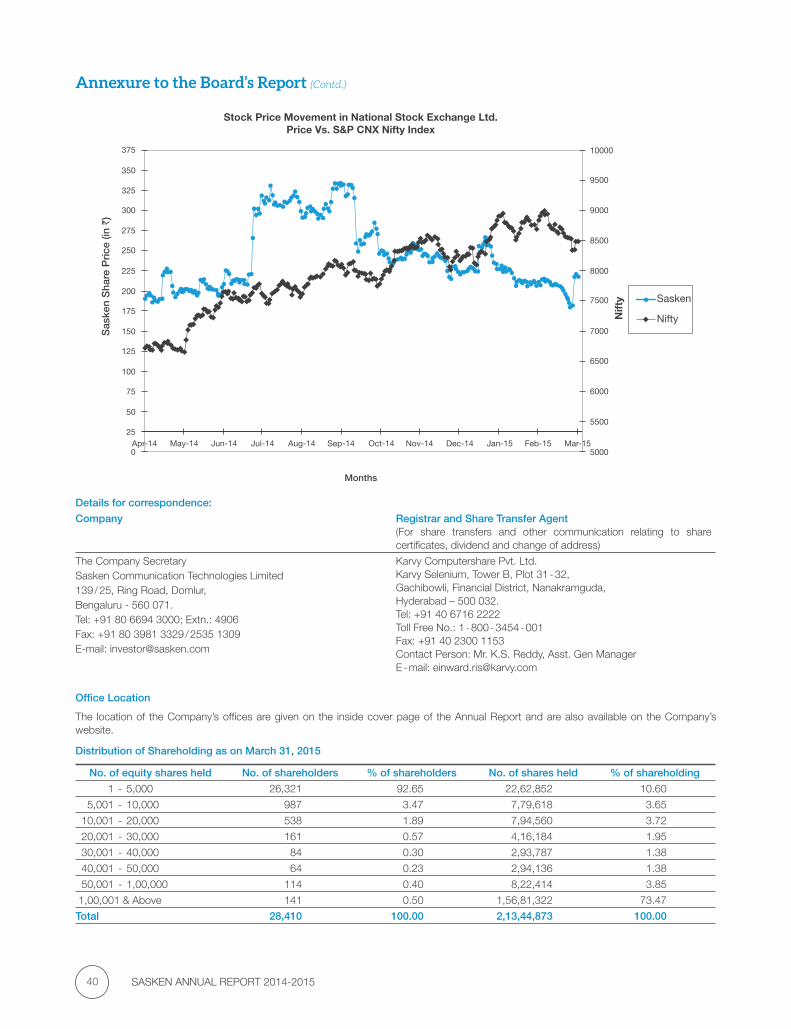
SASKEN ANNUAL REPORT 2014-201540
Annexure to the Board’s Report (Contd.)
Details for correspondence:
Company Registrar and Share Transfer Agent(For share transfers and other communication relating to share certificates, dividend and change of address)
The Company SecretarySasken Communication Technologies Limited139 / 25, Ring Road, Domlur,Bengaluru - 560 071.Tel: +91 80 6694 3000; Extn.: 4906Fax: +91 80 3981 3329 / 2535 1309E-mail: [email protected]
Karvy Computershare Pvt. Ltd.Karvy Selenium, Tower B, Plot 31 - 32,Gachibowli, Financial District, Nanakramguda, Hyderabad – 500 032.Tel: +91 40 6716 2222Toll Free No.: 1 - 800 - 3454 - 001Fax: +91 40 2300 1153Contact Person: Mr. K.S. Reddy, Asst. Gen ManagerE - mail: [email protected]
Office Location
The location of the Company’s offices are given on the inside cover page of the Annual Report and are also available on the Company’s website.
Distribution of Shareholding as on March 31, 2015
No. of equity shares held No. of shareholders % of shareholders No. of shares held % of shareholding
1 - 5,000 26,321 92.65 22,62,852 10.60
5,001 - 10,000 987 3.47 7,79,618 3.65
10,001 - 20,000 538 1.89 7,94,560 3.72
20,001 - 30,000 161 0.57 4,16,184 1.95
30,001 - 40,000 84 0.30 2,93,787 1.38
40,001 - 50,000 64 0.23 2,94,136 1.38
50,001 - 1,00,000 114 0.40 8,22,414 3.85
1,00,001 & Above 141 0.50 1,56,81,322 73.47
Total 28,410 100.00 2,13,44,873 100.00
Apr-14 May-14 Jun-14 Jul-14 Aug-14 Sep-14 Oct-14 Nov-14 Dec-14 Jan-15 Feb-15 Mar-15
Months
Stock Price Movement in National Stock Exchange Ltd.Price Vs. S&P CNX Nifty Index
Sas
ken
Sha
re P
rice
(in `)
Nift
y Sasken
Nifty
0 5000
5500
6000
6500
7000
7500
8000
8500
9000
9500
10000
25
50
75
100
125
150
175
200
225
250
275
300
325
350
375
41
Shareholding Pattern as at March 31, 2015
Category No. of shares %
Promoters & Promoter Group 78,63,770 36.84
Public Shareholdings: - -
Mutual Funds 22,11,355 10.36
Financial Institutions / Banks 7,750 0.04
Foreign Institutional Investors 8,75,792 4.10
Foreign Portfolio Investors 1,56,902 0.74
Bodies Corporate 17,50,337 8.20
Trust 10,000 0.05
Non Resident Indians / Foreign Nationals 11,90,128 5.58
Directors & Relatives (other than Promoter / Directors) 10,05,704 4.71
Indian Public & Others 62,73,135 29.39
Total 2,13,44,873 100.00
Details of complaints:
Description Received Cleared
Non receipt of Dividend / Annual Report 59 59
There are no valid requests pending for share transfers as at March 31, 2015.
Details of Shares held in Suspense Account
Your Company went in for IPO during August 2005 and the shares were allotted to the applicants on August 31, 2005. When the IPO concluded, there were 838 cases involving 32,962 shares, which could not be transferred to investors due to reasons such as incomplete / wrong / invalid Demat Account details, etc. With persistent follow up and reminders, we were able to identify and transfer most of the shares. As at March 31, 2015 the number reduced to 27 cases involving 675 shares that remained unclaimed. The unclaimed shares are kept in a separate Suspense Account and will be transferred to the rightful holders as and when they approach the Company. Our efforts to locate the rightful owners will continue. The voting rights on these shares shall remain frozen till the rightful owner of such shares claims the shares.
The current status:
Description No. of Holders No. of Shares in Suspense Account
At the beginning of the year 27 675
No. of shareholders that approached for transfer of shares from Suspense Account and to whom shares were transferred during the year
Nil Nil
Status as of March 31, 2015 27 675
Other information useful for Shareholders
During the year, the Company approved 1 request for transfer of 326 shares in physical segment. Share transfer requests are acted upon within 7 - 10 days from the date of their receipt at the Registered Office / Registrar. In case no response is received within 15 days of lodgment of transfer request, the lodger may write to the Company with full details so that necessary action could be taken to safeguard interests of the concerned against any possible loss / interception during postal transit. As mandated by the Listing Agreement, the Company has designated [email protected] as the exclusive e - mail ID for redressal of investor complaints. Investors are urged to make use of this facility.
Members may note that as per the requirement of Clause 47(c) of the Listing Agreement with the Stock Exchanges, the Company has obtained half - yearly certificates from Practicing Company Secretary for due compliance of share transfer formalities and filed the same with the Stock Exchanges.
Dematerialization requests duly completed in all respects are normally processed within 7 days from the date of their receipt.
National Electronic Clearing Service / Mandates / Bank Details
Shareholders may note that Bank Account details given by them to their Depository Participants would be used for payment of dividend under National Electronic Clearing Service facility. Shareholders desirous of modifying these instructions may write to the Registrar & Share Transfer Agent, Karvy Computershare Pvt. Ltd., Hyderabad (for shares held in physical form) or to their respective Depository Participants (for shares held in electronic form), as early as possible and in any case before the date of next Annual General Meeting.
Unclaimed Dividends
Under the provisions of the Companies Act, 2013, any dividend amount that remains unclaimed in the Unpaid Dividend Account of the Company for a period of seven years from the date of its transfer to the said account, has to be transferred to the Investor Education and Protection Fund (IEPF) administered by the Central Government. As regards the dividend declared at the Annual General Meeting held on June 23, 2007 remaining unclaimed was transferred to IEPF within the due date.
Annexure to the Board’s Report (Contd.)

SASKEN ANNUAL REPORT 2014-201542
Once the transfer to IEPF is complete, no claims shall lie against the IEPF or the Company for the amount of dividend nor shall any payment be made in respect of such claims. Members who have not encashed the dividend warrants issued on any date after September 19, 2009 may write to the Company and follow the procedure for claiming the amount.
Dematerialization of Shares
Equity Shares of the Company can be traded on the Stock Exchanges only in dematerialized form and at present about 99% of the shares of the Company are held in demat form. Considering the advantages of scrip less trading including enhanced marketability of the shares, shareholders holding shares in physical form are requested to consider dematerializing their shareholding so as to avoid inconvenience in future.
Outstanding GDRs / ADRs / Warrants / Convertible Instruments
The Company has not issued GDRs or ADRs. There are no outstanding warrants or any convertible instruments.
General
(a) Shareholders holding shares in physical form are requested to notify the Company / Registrar in writing, any change in their address and Bank Account details under the signature of sole / first joint holder. Beneficial owners of shares in demat form are requested to send their instructions regarding change of name, change of address, bank details, nomination, power of attorney, etc. directly to their Depository Participants (DP) as the same are maintained by the DP.
(b) Members who hold shares in physical form are advised that SEBI has made it mandatory that a copy of the PAN card of the transferee/s, members, surviving joint holders / legal heirs be furnished to the Company while obtaining the services of transfer, transposition, transmission and issue of duplicate share certificates.
(c) Non - resident shareholders are requested to notify at the earliest: change in their residential status on return to India for permanent settlement; particulars of their NRE Bank Account with a bank in India, if not furnished earlier; E - mail address, if any, to the Company / Registrar.
(d) In case of loss / misplacement of share certificates, investors should immediately lodge a FIR / Complaint with the police and inform the Company / Registrar along with copy of FIR / acknowledged copy of complaint.
(e) For expeditious transfer of shares, shareholders should fill in complete and correct particulars in the transfer deed. Wherever applicable, registration number of Power of Attorney should also be quoted in the transfer deed at the appropriate place.
(f) Shareholders are requested to maintain record of their specimen signature before lodgement of shares with the Company to obviate possibility of difference in signature at a later date.
(g) Shareholder(s) of the Company who have multiple accounts in identical name(s) or holding more than one Share Certificate in the same name under different Ledger Folio(s) are requested to write to the Company for consolidation of such Folio(s) with the relevant share certificates.
(h) Nomination in respect of shares – Section 72 of the Companies Act, 2013 provides facility for making nominations by shareholders in respect of their holding of all securities. Such nomination greatly facilitates transmission of shares from the deceased shareholder to his / her nominee without having to go through the process of obtaining Succession Certificate / Probate of the Will, etc. It would therefore be in the best interests of the shareholders holding shares in physical form registered as a sole holder to make such nominations. Please write to the Company Secretary for a nomination form.
(i) Shareholders holding shares in demat form are advised to contact their DP for making nominations.
(j) Some of the shareholders have not yet exchanged their old share certificates for the new ones, necessitated on the consolidation of the capital effected by the Company in July 2004 (i.e. consolidation of two old shares of `5 each into one new share of `10). Such holders are advised to send the old share certificates immediately. If the share certificates are brought in - person for exchange, the new share certificates will be provided on the spot. If the share certificates are sent by post, the new share certificates will be sent under Registered Post within 2 days from the date of receipt of the old share certificates. It is needless to mention that the old share certificate(s) cannot be submitted for dematerialization.
(k) Shareholders are requested to quote and register their E - mail IDs, Telephone / Fax numbers for receiving prompt communication and notification from the Company.
(l) Shareholders are informed that by the operation of the Companies Act 2013, a notice may be sent through e - mail as a text or as an attachment to e - mail or as a notification providing electronic link or Uniform Resource Locator for accessing such notice. Shareholders are advised to update their e - mail ID’s with their DP. All future communication of the Company to shareholders who have registered their e - mail ID with their DP or Company will be sent only by way of e - mail. Shareholders are requested to check their e - mails at regular intervals. Such communication will also be made available in the Company’s website www.sasken.com.
(m) Shareholders are also informed that under the Companies Act, 2013 the company’s obligation shall be satisfied when it transmits the e - mail and the company shall not be held responsible for a failure in transmission beyond its control. If a member entitled to receive notice fails to provide or update relevant e - mail address to the Company or to the Depository Participant as the case may be, the Company shall not be in default for not delivering notice via e - mail.
(n) Green Initiative
It is our endeavor to save the precious natural resources and achieve 100% environment friendly initiative to save trees and preserve environment. Many of the shareholders have supported us in this initiative and we look forward to the continued support and co - operation of all the shareholders in dematerializing their holding as well as updating their e - mail address with the respective depositories if the shares are held in demat or send a mail to [email protected] if shares are held in physical form.
(o) We solicit suggestions for improving the investor services.
Annexure to the Board’s Report (Contd.)
43
Annexure to the Board’s Report (Contd.)
CORPORATE GOVERNANCE COMPLIANCE CERTIFICATE
To
The Members,Sasken Communication Technologies Limited,
We have examined all the relevant records of Sasken Communication Technologies Limited, for the purpose of certifying compliance of the conditions of Corporate Governance, for the year ended on March 31, 2015, as stipulated in Clause 49 of the Listing Agreement of the said Company with stock exchanges. We have obtained all information and explanation which to the best of our knowledge and belief were necessary for the purposes of the certification.
The compliance of the conditions of Corporate Governance is the responsibility of the Management. Our examination was limited to review of the procedures and implementation thereof adopted by the Company for ensuring compliance with the conditions of the Corporate Governance as stipulated in the said Clause.
In our opinion and to the best of our information and according to the explanations given to us and based on the representations made by the Management, we certify that the Company has complied with the conditions of Corporate Governance as stipulated in Clause 49 of the above mentioned Listing Agreement.
We state that such compliance is neither an assurance as to future viability of the Company nor of the efficiency or effectiveness with which the management has conducted the affairs of the Company.
For J Sundharesan & AssociatesCompany Secretaries
J SUNDHARESAN
Bengaluru April 14, 2015
Practising Company SecretaryM. No - 5229
CP. No - 5164
SASKEN ANNUAL REPORT 2014-201544
Ann
exur
e F
FO
RM
NO
. AO
C –
2[P
ursu
ant t
o cl
ause
(h) o
f sub
- se
ctio
n (3
) of S
ectio
n 13
4 of
the
Com
pani
es A
ct, 2
013
and
Rul
e 8(
2) o
f the
Com
pani
es (A
ccou
nts)
Rul
es, 2
014]
Form
for
disc
losu
re o
f par
ticul
ars
of c
ontr
acts
/ arr
ange
men
ts e
nter
ed in
to b
y th
e C
ompa
ny w
ith th
e re
late
d pa
rtie
s re
ferr
ed to
in s
ub -
sect
ion
(1) o
f Sec
tion
188
of th
eC
ompa
nies
Act
, 201
3 in
clud
ing
cert
ain
arm
s - l
engt
h tr
ansa
ctio
ns u
nder
third
pro
viso
ther
eto.
A. D
etai
ls o
f con
trac
ts o
r ar
rang
emen
ts o
r tr
ansa
ctio
ns n
ot a
t arm
’s le
ngth
bas
is:
(a)
(b)
(c)
(d)
(e)
(f)(g
)(h
)(i)
Sl.
No.
Nam
e of
the
rela
ted
part
y an
d na
ture
of
rela
tions
hip
Nat
ure
of c
ontr
acts
/ar
rang
emen
ts/
tran
sact
ions
Dur
atio
n of
cont
ract
s/ar
rang
emen
ts/
tran
sact
ions
Salie
nt fe
atur
es o
fco
ntra
cts /
arr
ange
men
ts/
tran
sact
ions
, inc
ludi
ng v
alue
, if a
ny
Just
ifica
tion
for
ente
ring
into
such
con
trac
ts/
arra
ngem
ents
/tr
ansa
ctio
ns
Dat
e(s)
of
appr
oval
by
the
Boa
rd/
Aud
it C
omm
ittee
Am
ount
pai
d as
adv
ance
s,if
any
Dat
e on
w
hich
spe
cial
re
solu
tion
was
pas
sed
in
gene
ral m
eetin
g u/
s 18
8(1)
Nil
B. D
etai
ls o
f mat
eria
l con
trac
ts o
r ar
rang
emen
t or
tran
sact
ions
at a
rm’s
leng
th b
asis
:1.
Ms.
Sak
hee
R. M
ody
(Dau
ghte
r of M
r. R
ajiv
C. M
ody,
Cha
irman
&
Man
agin
g D
irect
or)
Appo
intm
ent o
f Ms.
Sa
khee
R. M
ody
as a
G
raph
ics
Des
igne
r in
the
Com
pany
Subj
ect t
o th
e te
rms
of
empl
oym
ent
Ms.
Sak
hee
R. M
ody
was
app
oint
ed a
s a
Gra
phic
s D
esig
ner,
with
effe
ct fr
om
Sept
embe
r 1, 2
014
on a
Sal
ary
of
`10,
00,0
00 p
er a
nnum
. Sh
e is
als
o
entit
led
to o
ther
ben
efits
, if a
ny a
nd
subj
ect t
o ot
her t
erm
s an
d co
nditi
ons
of e
mpl
oym
ent a
s ap
plic
able
to o
ther
em
ploy
ees
of th
e C
ompa
ny.
Ms.
Sak
hee
R. M
ody
has
com
plet
ed h
er B
A in
Gra
phic
des
igni
ng
from
Lon
don
and
MFA
Vi
sual
Com
mun
icat
ion
from
USA
. She
has
prio
r w
ork
expe
rienc
e in
the
rele
vant
fiel
d.
Augu
st 2
8, 2
014
Nil
Not
Appl
icab
le
2.Sa
sken
Net
wor
k En
gine
erin
g Lt
d.(W
holly
ow
ned
subs
idia
ry o
f th
e C
ompa
ny)
Ren
ting
the
7th fl
oor
of th
e pr
emis
es o
f the
C
ompa
ny
11 m
onth
s, v
iz.N
ovem
ber 1
6,
2014
to O
ctob
er
15, 2
015
Ren
ting
the
7th fl
oor o
f the
pre
mis
es
of th
e C
ompa
ny, s
ituat
ed a
t No.
139
/25,
Rin
g R
oad,
Dom
lur,
Ben
galu
ru-5
60 0
71.
Are
a -
Supe
r bui
lt up
are
a of
13,
356.
17
sq. f
t.R
ent
- `6
6.25
per
sq.
ft pl
us S
ervic
e Ta
x as
app
licab
le.
Not
ice
Per
iod
for t
erm
inat
ion
- 30
da
ys’ w
ritte
n no
tice
by e
ither
of t
he
parti
esSe
curit
y D
epos
it -
`80,
00,0
00
Opt
imum
spa
ce
utiliz
atio
n an
d fo
r bet
ter
co - o
rdin
atio
n be
twee
n co
mpa
nies
.
Nov
embe
r 10,
20
14N
ilN
otAp
plic
able
3.Sa
sken
Inc.
, USA
(Who
lly o
wne
d su
bsid
iary
of t
he
Com
pany
)
Ren
ewal
of l
oan
agre
emen
t dat
ed
Mar
ch 1
7, 2
010*
One
yea
r fro
m
Oct
ober
1, 2
014
Ren
ewal
of l
oan
agre
emen
t dat
ed
Mar
ch 1
7, 2
010
Loan
Am
ount
- U
p to
USD
9 m
illion
Inte
rest
Rat
e - S
hall b
e as
per
the
appl
icab
le A
cts /
Reg
ulat
ions
Rep
aym
ent -
Eith
er a
s on
e - tim
e pa
ymen
t at t
he e
nd o
f the
term
or i
n an
y ot
her m
anne
r as
may
be
mut
ually
ag
reed
bet
wee
n th
e pa
rties
.
Fina
ncia
l ass
ista
nce
Dec
embe
r 25,
20
14N
ilN
otAp
plic
able
4.Sa
sken
Inc.
, USA
(Who
lly o
wne
d su
bsid
iary
of t
he
Com
pany
)
Gra
nt o
f add
ition
al
loan
up
to U
SD 2
2 m
illion
*&**
One
yea
r fro
m
Dec
embe
r 30,
20
14
Gra
nt o
f an
addi
tiona
l loan
of u
p to
USD
22
milli
onLo
an A
mou
nt -
Up
to U
SD 2
2 m
illion
Inte
rest
Rat
e -
Shal
l be
as p
er th
e ap
plic
able
Act
s / R
egul
atio
ns.
Rep
aym
ent
- Ei
ther
as
one -
time
paym
ent a
t the
end
of t
he te
rm o
r in
any
othe
r man
ner a
s m
ay b
e m
utua
lly
agre
ed b
etw
een
the
parti
es.
Dur
atio
n of
the
loan
- N
ot e
xcee
ding
on
e ye
ar fr
om th
e da
te o
f dis
burs
emen
t.
Fina
ncia
l ass
ista
nce
Dec
embe
r 25,
20
14N
ilN
otAp
plic
able
Annexure to the Board’s Report (Contd.)
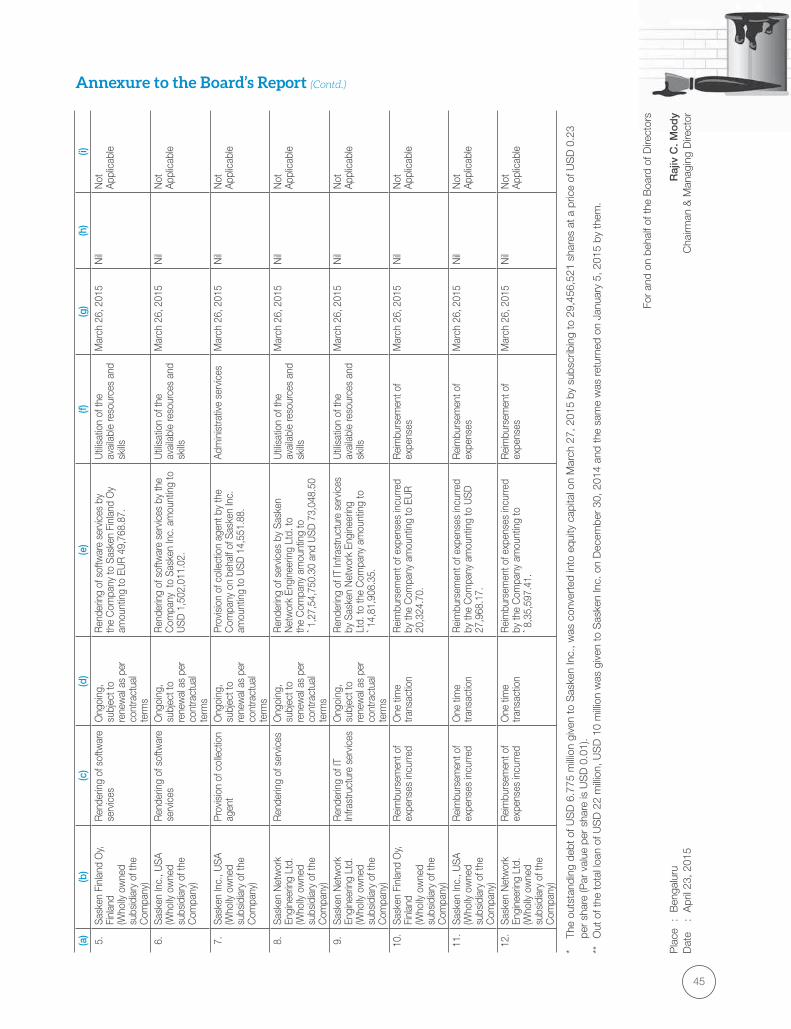
45
(a)
(b)
(c)
(d)
(e)
(f)(g
)(h
)(i)
5.Sa
sken
Fin
land
Oy,
Finl
and
(Who
lly o
wne
d su
bsid
iary
of t
he
Com
pany
)
Ren
derin
g of
sof
twar
e se
rvic
esO
ngoi
ng,
subj
ect t
ore
new
al a
s pe
rco
ntra
ctua
lte
rms
Ren
derin
g of
sof
twar
e se
rvic
es b
y th
e C
ompa
ny to
Sas
ken
Finl
and
Oy
amou
ntin
g to
EU
R 4
9,76
8.87
.
Util
isat
ion
of th
e av
aila
ble
reso
urce
s an
d sk
ills
Mar
ch 2
6, 2
015
Nil
Not
Appl
icab
le
6.Sa
sken
Inc.
, USA
(Who
lly o
wne
d su
bsid
iary
of t
he
Com
pany
)
Ren
derin
g of
sof
twar
e se
rvic
esO
ngoi
ng,
subj
ect t
ore
new
al a
s pe
rco
ntra
ctua
lte
rms
Ren
derin
g of
sof
twar
e se
rvic
es b
y th
e C
ompa
ny t
o Sa
sken
Inc.
am
ount
ing
to
USD
1,5
02,0
11.0
2.
Util
isat
ion
of th
e av
aila
ble
reso
urce
s an
d sk
ills
Mar
ch 2
6, 2
015
Nil
Not
Appl
icab
le
7.Sa
sken
Inc.
, USA
(Who
lly o
wne
d su
bsid
iary
of t
he
Com
pany
)
Prov
isio
n of
col
lect
ion
agen
tO
ngoi
ng,
subj
ect t
ore
new
al a
s pe
rco
ntra
ctua
lte
rms
Prov
isio
n of
col
lect
ion
agen
t by
the
Com
pany
on
beha
lf of
Sas
ken
Inc.
am
ount
ing
to U
SD 1
4,55
1.88
.
Adm
inis
trativ
e se
rvic
esM
arch
26,
201
5N
ilN
otAp
plic
able
8.Sa
sken
Net
wor
k En
gine
erin
g Lt
d.(W
holly
ow
ned
subs
idia
ry o
f the
C
ompa
ny)
Ren
derin
g of
ser
vices
Ong
oing
,su
bjec
t to
rene
wal
as
per
cont
ract
ual
term
s
Ren
derin
g of
ser
vices
by
Sask
en
Net
wor
k En
gine
erin
g Lt
d. to
th
e C
ompa
ny a
mou
ntin
g to
`1
,27,
54,7
50.3
0 an
d U
SD 7
3,04
8.50
Util
isat
ion
of th
e av
aila
ble
reso
urce
s an
d sk
ills
Mar
ch 2
6, 2
015
Nil
Not
Appl
icab
le
9.Sa
sken
Net
wor
k En
gine
erin
g Lt
d.(W
holly
ow
ned
subs
idia
ry o
f the
C
ompa
ny)
Ren
derin
g of
IT
Infra
stru
ctur
e se
rvic
esO
ngoi
ng,
subj
ect t
ore
new
al a
s pe
rco
ntra
ctua
lte
rms
Ren
derin
g of
IT In
frast
ruct
ure
serv
ices
by
Sas
ken
Net
wor
k En
gine
erin
g Lt
d. to
the
Com
pany
am
ount
ing
to
`14,
81,9
08.3
5.
Util
isat
ion
of th
e av
aila
ble
reso
urce
s an
d sk
ills
Mar
ch 2
6, 2
015
Nil
Not
Appl
icab
le
10.
Sask
en F
inla
nd O
y, Fi
nlan
d(W
holly
ow
ned
subs
idia
ry o
f the
C
ompa
ny)
Rei
mbu
rsem
ent o
f ex
pens
es in
curre
dO
ne ti
me
trans
actio
nR
eim
burs
emen
t of e
xpen
ses
incu
rred
by th
e C
ompa
ny a
mou
ntin
g to
EU
R
20,3
24.7
0.
Rei
mbu
rsem
ent o
f ex
pens
esM
arch
26,
201
5N
ilN
otAp
plic
able
11.
Sask
en In
c., U
SA(W
holly
ow
ned
subs
idia
ry o
f the
C
ompa
ny)
Rei
mbu
rsem
ent o
f ex
pens
es in
curre
dO
ne ti
me
trans
actio
nR
eim
burs
emen
t of e
xpen
ses
incu
rred
by th
e C
ompa
ny a
mou
ntin
g to
USD
27
,968
.17.
Rei
mbu
rsem
ent o
f ex
pens
esM
arch
26,
201
5N
ilN
otAp
plic
able
12.
Sask
en N
etw
ork
Engi
neer
ing
Ltd.
(W
holly
ow
ned
subs
idia
ry o
f the
C
ompa
ny)
Rei
mbu
rsem
ent o
f ex
pens
es in
curre
dO
ne ti
me
trans
actio
nR
eim
burs
emen
t of e
xpen
ses
incu
rred
by th
e C
ompa
ny a
mou
ntin
g to
`8
,35,
597.
41.
Rei
mbu
rsem
ent o
f ex
pens
esM
arch
26,
201
5N
ilN
otAp
plic
able
Annexure to the Board’s Report (Contd.)
*
The
outs
tand
ing
debt
of U
SD
6.7
75 m
illion
giv
en to
Sas
ken
Inc.
, was
con
vert
ed in
to e
quity
cap
ital o
n M
arch
27,
201
5 by
sub
scrib
ing
to 2
9,45
6,52
1 sh
ares
at a
pric
e of
US
D 0
.23
per
shar
e (P
ar v
alue
per
sha
re is
US
D 0
.01)
.**
O
ut o
f the
tota
l loa
n of
US
D 2
2 m
illion
, US
D 1
0 m
illion
was
giv
en to
Sas
ken
Inc.
on
Dec
embe
r 30
, 201
4 an
d th
e sa
me
was
retu
rned
on
Janu
ary
5, 2
015
by th
em.
For
and
on b
ehal
f of t
he B
oard
of D
irect
ors
Pla
ce
: B
enga
luru
R
ajiv
C. M
od
yD
ate
: A
pril
23, 2
015
Cha
irman
& M
anag
ing
Dire
ctor

SASKEN ANNUAL REPORT 2014-201546
Annexure G
Form No. MGT - 9
EXTRACT OF ANNUAL RETURN
as on the financial year ended on March 31, 2015
I. REGISTRATION AND OTHER DETAILS:
CIN L72100KA1989PLC014226
Registration Date February 13, 1989
Name of the Company Sasken Communication Technologies Limited
Category / Sub - Category of the Company Information Technology / IT Enabled Services
Address of the Registered office and contact details 139/25, Ring Road, Domlur, Bengaluru – 560 071, India Ph: +91 80 6694 3000; Fax: +91 80 2535 1309
Whether listed company Yes
Name, Address and Contact details of Registrar and Transfer Agent, if any
Karvy Computershare Pvt. Ltd.Karvy Selenium, Tower B, Plot 31 - 32,Gachibowli, Financial District, Nanakramguda, Hyderabad – 500 032.Tel: +91 40 6716 2222Toll Free No.: 1 - 800 - 3454 - 001Fax: +91 40 2300 1153Contact Person: Mr. K.S. Reddy, Asst. Gen ManagerE - mail: [email protected]
II. PRINCIPAL BUSINESS ACTIVITIES OF THE COMPANY:
All the business activities contributing 10% or more of the total turnover of the company shall be stated –
Sl.No.
Name and Description of main products / servicesNIC Code of theProduct / service
% to total turnover of thecompany
1. Software Development 620 95.3%
III. PARTICULARS OF HOLDING, SUBSIDIARY AND ASSOCIATE COMPANIES:
Sl.No. Name and address of the Company CIN/GLN
Holding/subsidiary/Associate
% of shares held
Applicable Section under Co. Act, 2013
1. Sasken Network Engineering Ltd.7th Floor, 139/25, Ring Road, Domlur,Bengaluru - 560 071, India
U64202KA2004PLC034773 Subsidiary 100% 2(87)
2. Sasken Communication Technologies(Shanghai) Co. Ltd.6F, Tower B, Haoli Building, No. 18,Longqing Street, BDA, Beijing, China 100 176
Not Applicable Subsidiary 100% 2(87)
3. Sasken Finland Oy.Vissavedentie 1, P.O. Box 29, Fl - 69601Kaustinen, Finland
- do - Subsidiary 100% 2(87)
4. Sasken Communication TechnologiesMexico S.A. de C.VRio Mississippi 303 Ote N2-3 Col. del ValleSan Pedro Garza Garcia,Nuevo Leon - 66220, Mexico
- do - Subsidiary 100% 2(87)
5. Sasken Inc.3601, Algonquin Road, Suite # 815, Rolling Meadows, Illinois 60008, USA
- do - Subsidiary 100% 2(87)
6. ConnectM Technology Solutions Pvt. Ltd.# 562/640, Block A, Ground Floor,Janardhana Towers, Bilekahalli,Bannerghatta Road, Bengaluru - 560 076, India
U64202KA2007PTC043080 Associate 46.29% 2(6)
Annexure to the Board’s Report (Contd.)
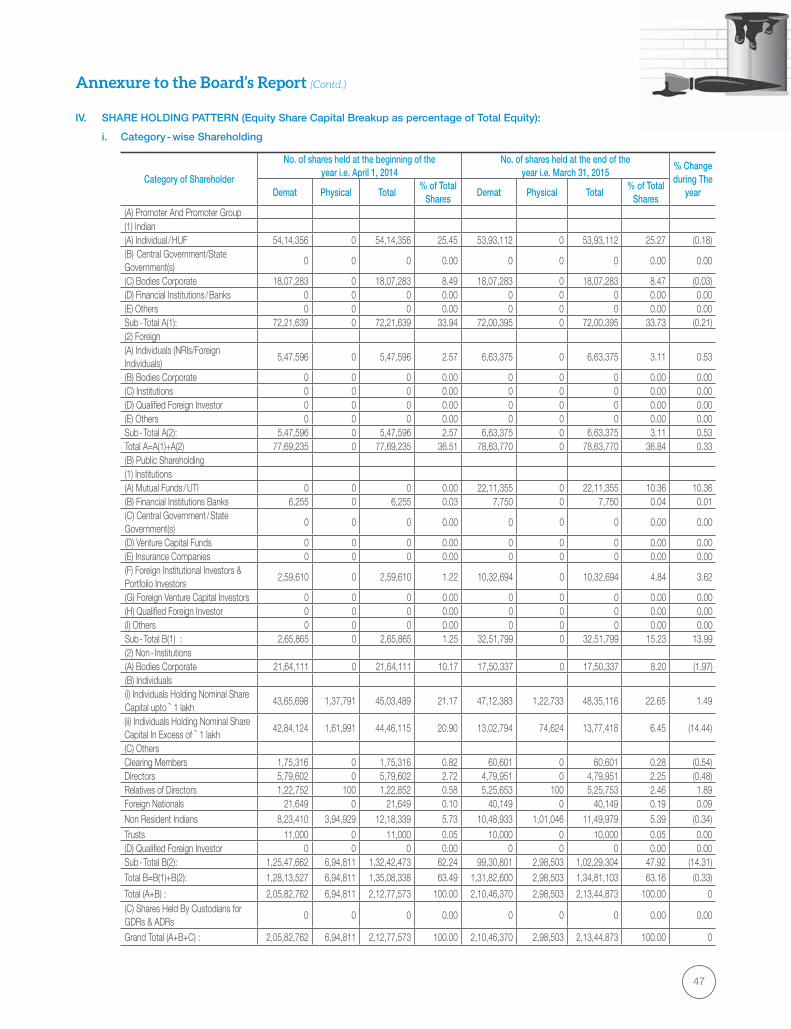
47
IV. SHARE HOLDING PATTERN (Equity Share Capital Breakup as percentage of Total Equity):
i. Category - wise Shareholding
Category of Shareholder
No. of shares held at the beginning of theyear i.e. April 1, 2014
No. of shares held at the end of theyear i.e. March 31, 2015
% Change during The
yearDemat Physical Total% of Total
SharesDemat Physical Total
% of Total Shares
(A) Promoter And Promoter Group (1) Indian (A) Individual / HUF 54,14,356 0 54,14,356 25.45 53,93,112 0 53,93,112 25.27 (0.18)(B) Central Government/State Government(s)
0 0 0 0.00 0 0 0 0.00 0.00
(C) Bodies Corporate 18,07,283 0 18,07,283 8.49 18,07,283 0 18,07,283 8.47 (0.03)(D) Financial Institutions / Banks 0 0 0 0.00 0 0 0 0.00 0.00(E) Others 0 0 0 0.00 0 0 0 0.00 0.00Sub - Total A(1): 72,21,639 0 72,21,639 33.94 72,00,395 0 72,00,395 33.73 (0.21)(2) Foreign (A) Individuals (NRIs/Foreign Individuals)
5,47,596 0 5,47,596 2.57 6,63,375 0 6,63,375 3.11 0.53
(B) Bodies Corporate 0 0 0 0.00 0 0 0 0.00 0.00(C) Institutions 0 0 0 0.00 0 0 0 0.00 0.00(D) Qualified Foreign Investor 0 0 0 0.00 0 0 0 0.00 0.00(E) Others 0 0 0 0.00 0 0 0 0.00 0.00Sub - Total A(2): 5,47,596 0 5,47,596 2.57 6,63,375 0 6,63,375 3.11 0.53Total A=A(1)+A(2) 77,69,235 0 77,69,235 36.51 78,63,770 0 78,63,770 36.84 0.33(B) Public Shareholding (1) Institutions (A) Mutual Funds / UTI 0 0 0 0.00 22,11,355 0 22,11,355 10.36 10.36(B) Financial Institutions Banks 6,255 0 6,255 0.03 7,750 0 7,750 0.04 0.01(C) Central Government / State Government(s)
0 0 0 0.00 0 0 0 0.00 0.00
(D) Venture Capital Funds 0 0 0 0.00 0 0 0 0.00 0.00(E) Insurance Companies 0 0 0 0.00 0 0 0 0.00 0.00(F) Foreign Institutional Investors & Portfolio Investors
2,59,610 0 2,59,610 1.22 10,32,694 0 10,32,694 4.84 3.62
(G) Foreign Venture Capital Investors 0 0 0 0.00 0 0 0 0.00 0.00(H) Qualified Foreign Investor 0 0 0 0.00 0 0 0 0.00 0.00(I) Others 0 0 0 0.00 0 0 0 0.00 0.00Sub - Total B(1) : 2,65,865 0 2,65,865 1.25 32,51,799 0 32,51,799 15.23 13.99(2) Non - Institutions (A) Bodies Corporate 21,64,111 0 21,64,111 10.17 17,50,337 0 17,50,337 8.20 (1.97)(B) Individuals (i) Individuals Holding Nominal Share Capital upto ̀ 1 lakh
43,65,698 1,37,791 45,03,489 21.17 47,12,383 1,22,733 48,35,116 22.65 1.49
(ii) Individuals Holding Nominal Share Capital In Excess of `1 lakh
42,84,124 1,61,991 44,46,115 20.90 13,02,794 74,624 13,77,418 6.45 (14.44)
(C) Others Clearing Members 1,75,316 0 1,75,316 0.82 60,601 0 60,601 0.28 (0.54)Directors 5,79,602 0 5,79,602 2.72 4,79,951 0 4,79,951 2.25 (0.48)Relatives of Directors 1,22,752 100 1,22,852 0.58 5,25,653 100 5,25,753 2.46 1.89Foreign Nationals 21,649 0 21,649 0.10 40,149 0 40,149 0.19 0.09Non Resident Indians 8,23,410 3,94,929 12,18,339 5.73 10,48,933 1,01,046 11,49,979 5.39 (0.34)Trusts 11,000 0 11,000 0.05 10,000 0 10,000 0.05 0.00(D) Qualified Foreign Investor 0 0 0 0.00 0 0 0 0.00 0.00Sub - Total B(2): 1,25,47,662 6,94,811 1,32,42,473 62.24 99,30,801 2,98,503 1,02,29,304 47.92 (14.31)Total B=B(1)+B(2): 1,28,13,527 6,94,811 1,35,08,338 63.49 1,31,82,600 2,98,503 1,34,81,103 63.16 (0.33)
Total (A+B) : 2,05,82,762 6,94,811 2,12,77,573 100.00 2,10,46,370 2,98,503 2,13,44,873 100.00 0(C) Shares Held By Custodians for GDRs & ADRs
0 0 0 0.00 0 0 0 0.00 0.00
Grand Total (A+B+C) : 2,05,82,762 6,94,811 2,12,77,573 100.00 2,10,46,370 2,98,503 2,13,44,873 100.00 0
Annexure to the Board’s Report (Contd.)
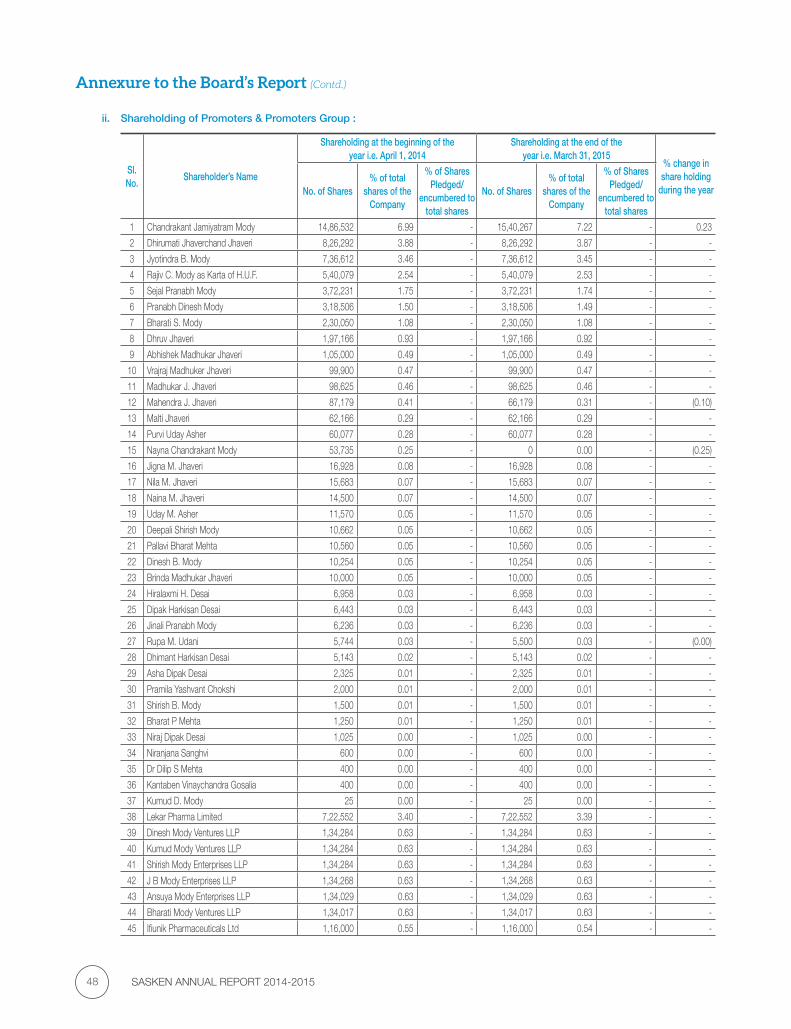
SASKEN ANNUAL REPORT 2014-201548
ii. Shareholding of Promoters & Promoters Group :
Sl.No.
Shareholder’s Name
Shareholding at the beginning of theyear i.e. April 1, 2014
Shareholding at the end of theyear i.e. March 31, 2015
% change in share holding
during the yearNo. of Shares% of total
shares of the Company
% of Shares Pledged/
encumbered to total shares
No. of Shares% of total
shares of the Company
% of Shares Pledged/
encumbered to total shares
1 Chandrakant Jamiyatram Mody 14,86,532 6.99 - 15,40,267 7.22 - 0.23
2 Dhirumati Jhaverchand Jhaveri 8,26,292 3.88 - 8,26,292 3.87 - -
3 Jyotindra B. Mody 7,36,612 3.46 - 7,36,612 3.45 - -
4 Rajiv C. Mody as Karta of H.U.F. 5,40,079 2.54 - 5,40,079 2.53 - -
5 Sejal Pranabh Mody 3,72,231 1.75 - 3,72,231 1.74 - -
6 Pranabh Dinesh Mody 3,18,506 1.50 - 3,18,506 1.49 - -
7 Bharati S. Mody 2,30,050 1.08 - 2,30,050 1.08 - -
8 Dhruv Jhaveri 1,97,166 0.93 - 1,97,166 0.92 - -
9 Abhishek Madhukar Jhaveri 1,05,000 0.49 - 1,05,000 0.49 - -
10 Vrajraj Madhuker Jhaveri 99,900 0.47 - 99,900 0.47 - -
11 Madhukar J. Jhaveri 98,625 0.46 - 98,625 0.46 - -
12 Mahendra J. Jhaveri 87,179 0.41 - 66,179 0.31 - (0.10)
13 Malti Jhaveri 62,166 0.29 - 62,166 0.29 - -
14 Purvi Uday Asher 60,077 0.28 - 60,077 0.28 - -
15 Nayna Chandrakant Mody 53,735 0.25 - 0 0.00 - (0.25)
16 Jigna M. Jhaveri 16,928 0.08 - 16,928 0.08 - -
17 Nila M. Jhaveri 15,683 0.07 - 15,683 0.07 - -
18 Naina M. Jhaveri 14,500 0.07 - 14,500 0.07 - -
19 Uday M. Asher 11,570 0.05 - 11,570 0.05 - -
20 Deepali Shirish Mody 10,662 0.05 - 10,662 0.05 - -
21 Pallavi Bharat Mehta 10,560 0.05 - 10,560 0.05 - -
22 Dinesh B. Mody 10,254 0.05 - 10,254 0.05 - -
23 Brinda Madhukar Jhaveri 10,000 0.05 - 10,000 0.05 - -
24 Hiralaxmi H. Desai 6,958 0.03 - 6,958 0.03 - -
25 Dipak Harkisan Desai 6,443 0.03 - 6,443 0.03 - -
26 Jinali Pranabh Mody 6,236 0.03 - 6,236 0.03 - -
27 Rupa M. Udani 5,744 0.03 - 5,500 0.03 - (0.00)
28 Dhimant Harkisan Desai 5,143 0.02 - 5,143 0.02 - -
29 Asha Dipak Desai 2,325 0.01 - 2,325 0.01 - -
30 Pramila Yashvant Chokshi 2,000 0.01 - 2,000 0.01 - -
31 Shirish B. Mody 1,500 0.01 - 1,500 0.01 - -
32 Bharat P Mehta 1,250 0.01 - 1,250 0.01 - -
33 Niraj Dipak Desai 1,025 0.00 - 1,025 0.00 - -
34 Niranjana Sanghvi 600 0.00 - 600 0.00 - -
35 Dr Dilip S Mehta 400 0.00 - 400 0.00 - -
36 Kantaben Vinaychandra Gosalia 400 0.00 - 400 0.00 - -
37 Kumud D. Mody 25 0.00 - 25 0.00 - -
38 Lekar Pharma Limited 7,22,552 3.40 - 7,22,552 3.39 - -
39 Dinesh Mody Ventures LLP 1,34,284 0.63 - 1,34,284 0.63 - -
40 Kumud Mody Ventures LLP 1,34,284 0.63 - 1,34,284 0.63 - -
41 Shirish Mody Enterprises LLP 1,34,284 0.63 - 1,34,284 0.63 - -
42 J B Mody Enterprises LLP 1,34,268 0.63 - 1,34,268 0.63 - -
43 Ansuya Mody Enterprises LLP 1,34,029 0.63 - 1,34,029 0.63 - -
44 Bharati Mody Ventures LLP 1,34,017 0.63 - 1,34,017 0.63 - -
45 Ifiunik Pharmaceuticals Ltd 1,16,000 0.55 - 1,16,000 0.54 - -
Annexure to the Board’s Report (Contd.)
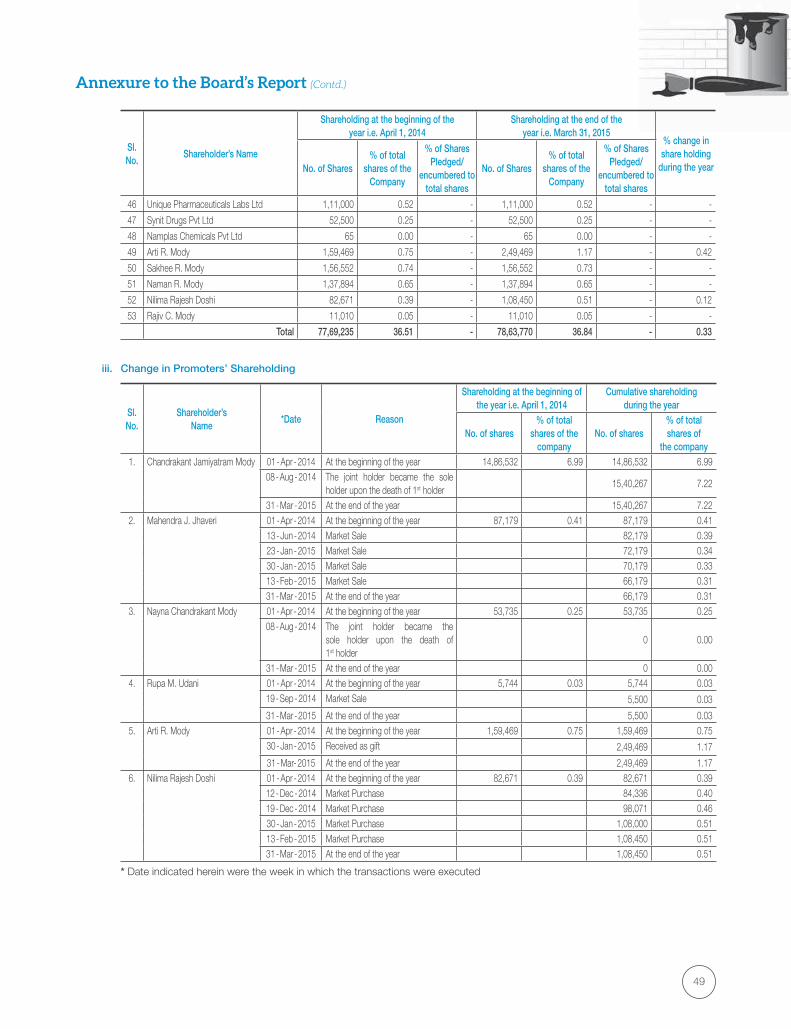
49
Sl.No.
Shareholder’s Name
Shareholding at the beginning of theyear i.e. April 1, 2014
Shareholding at the end of theyear i.e. March 31, 2015
% change in share holding
during the yearNo. of Shares% of total
shares of the Company
% of Shares Pledged/
encumbered to total shares
No. of Shares% of total
shares of the Company
% of Shares Pledged/
encumbered to total shares
46 Unique Pharmaceuticals Labs Ltd 1,11,000 0.52 - 1,11,000 0.52 - -
47 Synit Drugs Pvt Ltd 52,500 0.25 - 52,500 0.25 - -
48 Namplas Chemicals Pvt Ltd 65 0.00 - 65 0.00 - -
49 Arti R. Mody 1,59,469 0.75 - 2,49,469 1.17 - 0.42
50 Sakhee R. Mody 1,56,552 0.74 - 1,56,552 0.73 - -
51 Naman R. Mody 1,37,894 0.65 - 1,37,894 0.65 - -
52 Nilima Rajesh Doshi 82,671 0.39 - 1,08,450 0.51 - 0.12
53 Rajiv C. Mody 11,010 0.05 - 11,010 0.05 - -
Total 77,69,235 36.51 - 78,63,770 36.84 - 0.33
iii. Change in Promoters’ Shareholding
Sl.No.
Shareholder’sName
*Date Reason
Shareholding at the beginning of the year i.e. April 1, 2014
Cumulative shareholdingduring the year
No. of shares% of total
shares of the company
No. of shares% of total shares of
the company1. Chandrakant Jamiyatram Mody 01 - Apr - 2014 At the beginning of the year 14,86,532 6.99 14,86,532 6.99
08 - Aug - 2014 The joint holder became the sole holder upon the death of 1st holder
15,40,267 7.22
31 - Mar - 2015 At the end of the year 15,40,267 7.222. Mahendra J. Jhaveri 01 - Apr - 2014 At the beginning of the year 87,179 0.41 87,179 0.41
13 - Jun - 2014 Market Sale 82,179 0.3923 - Jan - 2015 Market Sale 72,179 0.3430 - Jan - 2015 Market Sale 70,179 0.3313 - Feb - 2015 Market Sale 66,179 0.3131 - Mar - 2015 At the end of the year 66,179 0.31
3. Nayna Chandrakant Mody 01 - Apr - 2014 At the beginning of the year 53,735 0.25 53,735 0.2508 - Aug - 2014 The joint holder became the
sole holder upon the death of 1st holder
0 0.00
31 - Mar - 2015 At the end of the year 0 0.004. Rupa M. Udani 01 - Apr - 2014 At the beginning of the year 5,744 0.03 5,744 0.03
19 - Sep - 2014 Market Sale 5,500 0.03
31 - Mar - 2015 At the end of the year 5,500 0.035. Arti R. Mody 01 - Apr - 2014 At the beginning of the year 1,59,469 0.75 1,59,469 0.75
30 - Jan - 2015 Received as gift 2,49,469 1.17
31 - Mar- 2015 At the end of the year 2,49,469 1.176. Nilima Rajesh Doshi 01 - Apr - 2014 At the beginning of the year 82,671 0.39 82,671 0.39
12 - Dec - 2014 Market Purchase 84,336 0.4019 - Dec - 2014 Market Purchase 98,071 0.4630 - Jan - 2015 Market Purchase 1,08,000 0.5113 - Feb - 2015 Market Purchase 1,08,450 0.5131 - Mar - 2015 At the end of the year 1,08,450 0.51
* Date indicated herein were the week in which the transactions were executed
Annexure to the Board’s Report (Contd.)
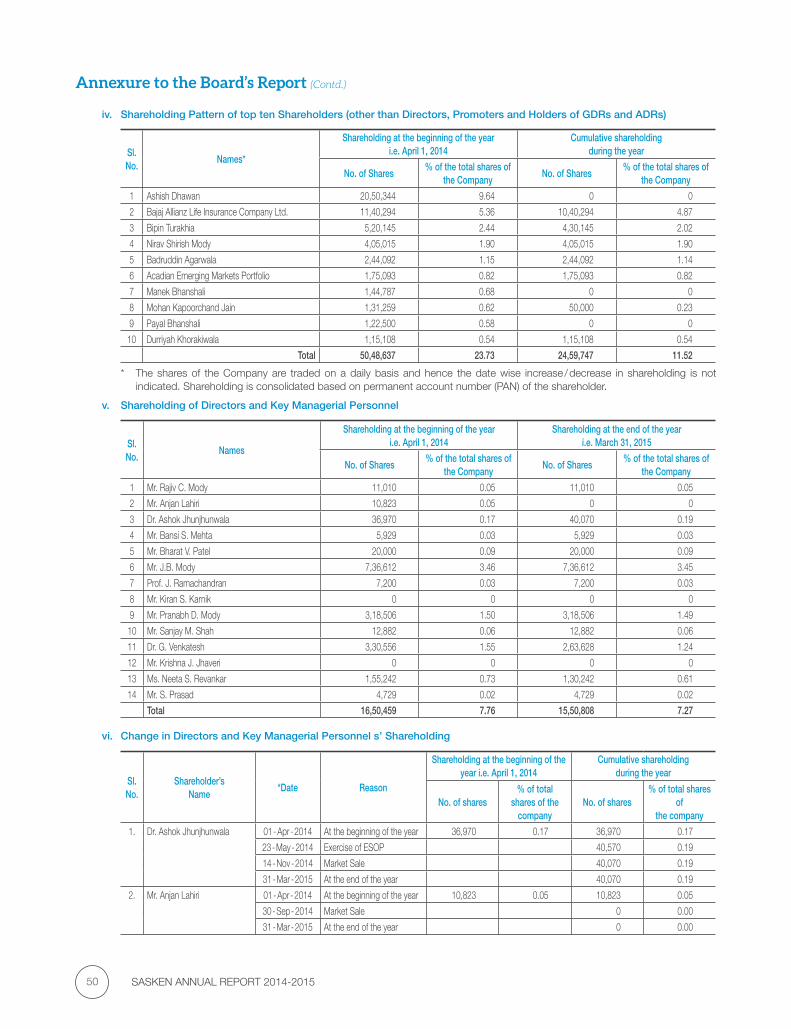
SASKEN ANNUAL REPORT 2014-201550
iv. Shareholding Pattern of top ten Shareholders (other than Directors, Promoters and Holders of GDRs and ADRs)
Sl. No.
Names*
Shareholding at the beginning of the yeari.e. April 1, 2014
Cumulative shareholdingduring the year
No. of Shares% of the total shares of
the CompanyNo. of Shares
% of the total shares of the Company
1 Ashish Dhawan 20,50,344 9.64 0 0
2 Bajaj Allianz Life Insurance Company Ltd. 11,40,294 5.36 10,40,294 4.87
3 Bipin Turakhia 5,20,145 2.44 4,30,145 2.02
4 Nirav Shirish Mody 4,05,015 1.90 4,05,015 1.90
5 Badruddin Agarwala 2,44,092 1.15 2,44,092 1.14
6 Acadian Emerging Markets Portfolio 1,75,093 0.82 1,75,093 0.82
7 Manek Bhanshali 1,44,787 0.68 0 0
8 Mohan Kapoorchand Jain 1,31,259 0.62 50,000 0.23
9 Payal Bhanshali 1,22,500 0.58 0 0
10 Durriyah Khorakiwala 1,15,108 0.54 1,15,108 0.54
Total 50,48,637 23.73 24,59,747 11.52
* The shares of the Company are traded on a daily basis and hence the date wise increase / decrease in shareholding is not indicated. Shareholding is consolidated based on permanent account number (PAN) of the shareholder.
v. Shareholding of Directors and Key Managerial Personnel
Sl.No.
Names
Shareholding at the beginning of the yeari.e. April 1, 2014
Shareholding at the end of the yeari.e. March 31, 2015
No. of Shares% of the total shares of
the CompanyNo. of Shares
% of the total shares of the Company
1 Mr. Rajiv C. Mody 11,010 0.05 11,010 0.05
2 Mr. Anjan Lahiri 10,823 0.05 0 0
3 Dr. Ashok Jhunjhunwala 36,970 0.17 40,070 0.19
4 Mr. Bansi S. Mehta 5,929 0.03 5,929 0.03
5 Mr. Bharat V. Patel 20,000 0.09 20,000 0.09
6 Mr. J.B. Mody 7,36,612 3.46 7,36,612 3.45
7 Prof. J. Ramachandran 7,200 0.03 7,200 0.03
8 Mr. Kiran S. Karnik 0 0 0 0
9 Mr. Pranabh D. Mody 3,18,506 1.50 3,18,506 1.49
10 Mr. Sanjay M. Shah 12,882 0.06 12,882 0.06
11 Dr. G. Venkatesh 3,30,556 1.55 2,63,628 1.24
12 Mr. Krishna J. Jhaveri 0 0 0 0
13 Ms. Neeta S. Revankar 1,55,242 0.73 1,30,242 0.61
14 Mr. S. Prasad 4,729 0.02 4,729 0.02
Total 16,50,459 7.76 15,50,808 7.27
vi. Change in Directors and Key Managerial Personnel s’ Shareholding
Sl.No.
Shareholder’sName
*Date Reason
Shareholding at the beginning of the year i.e. April 1, 2014
Cumulative shareholdingduring the year
No. of shares% of total
shares of the company
No. of shares% of total shares
ofthe company
1. Dr. Ashok Jhunjhunwala 01 - Apr - 2014 At the beginning of the year 36,970 0.17 36,970 0.17
23 - May - 2014 Exercise of ESOP 40,570 0.19
14 - Nov - 2014 Market Sale 40,070 0.19
31 - Mar - 2015 At the end of the year 40,070 0.19
2. Mr. Anjan Lahiri 01 - Apr - 2014 At the beginning of the year 10,823 0.05 10,823 0.05
30 - Sep - 2014 Market Sale 0 0.00
31 - Mar - 2015 At the end of the year 0 0.00
Annexure to the Board’s Report (Contd.)

51
Sl.No.
Shareholder’sName
*Date Reason
Shareholding at the beginning of the year i.e. April 1, 2014
Cumulative shareholdingduring the year
No. of shares% of total
shares of the company
No. of shares% of total shares
ofthe company
3. Dr. G. Venkatesh 01 - Apr - 2014 At the beginning of the year 3,30,556 1.55 3,30,556 1.5501 - Aug - 2014 Market Sale 3,00,845 1.4105 - Sep - 2014 Market Sale 2,72,797 1.2812 - Sep - 2014 Market Sale 2,63,628 1.2431 - Mar - 2015 At the end of the year 2,63,628 1.24
4. Ms. Neeta S. Revankar 01 - Apr - 2014 At the beginning of the year 1,55,242 0.73 1,55,242 0.7305 - Sep - 2014 Market Sale 1,35,242 0.6312 - Sep - 2014 Market Sale 1,30,242 0.6131 - Mar - 2015 At the end of the year 1,30,242 0.61
* Date indicated here were the week in which the transactions were executed
vii. INDEBTEDNESS:
Indebtedness of the Company including interest outstanding / accrued but not due for payment:
Secured Loansexcluding deposits
UnsecuredLoans
Deposits TotalIndebtedness
Indebtedness at the beginning of the financial year i) Principal Amount ii) Interest due but not paidiii) Interest accrued but not due
None
Total (i+ii+iii)Change in Indebtedness during the financial year
None
Net ChangeIndebtedness at the end of the financial year i) Principal Amount ii) Interest due but not paidiii) Interest accrued but not due
None
Total (i+ii+iii)
viii. REMUNERATION OF DIRECTORS AND KEY MANAGERIAL PERSONNEL
A. Remuneration to Managing Director, Whole Time Directors and/or Manager:(` In lakhs)
Sl.No.
Particulars of RemunerationName of MD/WTD/Manager
Rajiv C. Mody Anjan Lahiri* Neeta S. Revankar
G. Venkatesh** Krishna J. Jhaveri
TotalAmount
1. Gross salary(a) Salary as per provisions contained in section
17(1) of the Income - tax Act, 196178.41 45.75 55.81 28.49 25.80 234.26
(b) Value of perquisites u/s 17(2) of the Income - tax Act, 1961
- - - - - -
(c) Profits in lieu of salary under section 17(3) of the Income - tax Act, 1961
- - - - - -
2. Stock Option - - - - - - 3. Sweat Equity - - - - - - 4. Commission
- as % of profit - others
- - - - - -
5. Others - - - - - - Total (A) 78.41 45.75 55.81 28.49 25.80 234.26Ceiling as per the Act (@10% of profits calculated under Section 198 of the Act)
2,945.69
* for the period April 1, 2014 to September 23, 2014** for the period April 1, 2014 to January 19, 2015
Annexure to the Board’s Report (Contd.)
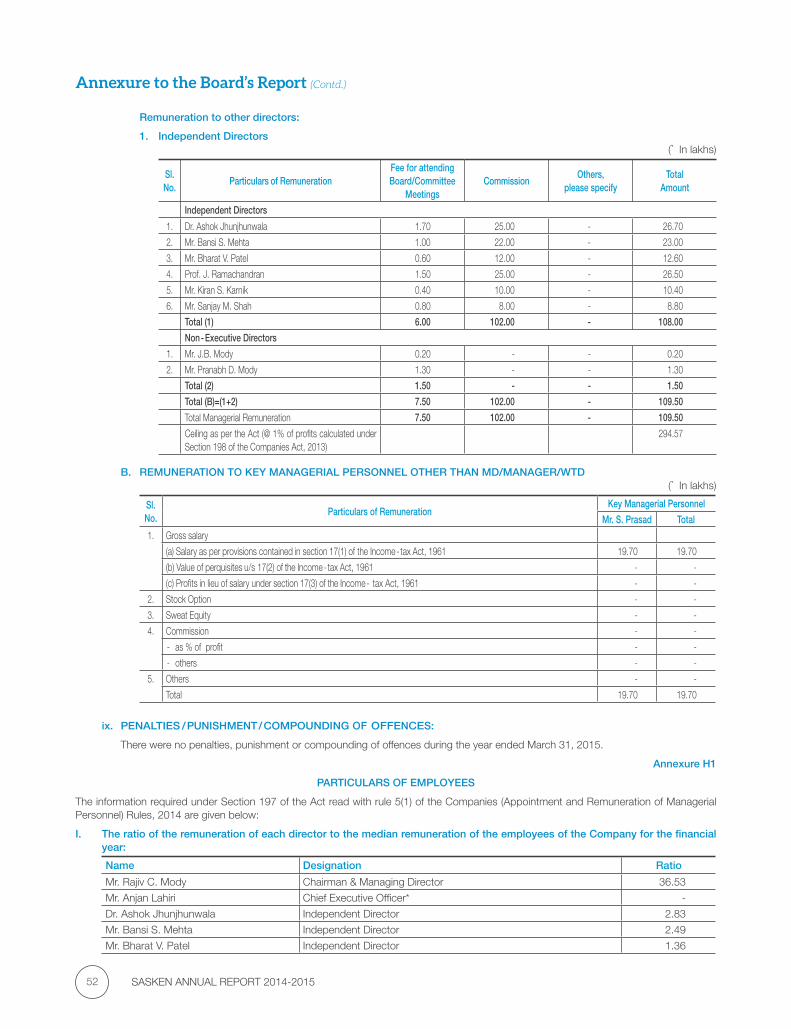
SASKEN ANNUAL REPORT 2014-201552
Remuneration to other directors:
1. Independent Directors(` In lakhs)
Sl.No.
Particulars of RemunerationFee for attending Board/Committee
MeetingsCommission
Others,please specify
TotalAmount
Independent Directors
1. Dr. Ashok Jhunjhunwala 1.70 25.00 - 26.70
2. Mr. Bansi S. Mehta 1.00 22.00 - 23.00
3. Mr. Bharat V. Patel 0.60 12.00 - 12.60
4. Prof. J. Ramachandran 1.50 25.00 - 26.50
5. Mr. Kiran S. Karnik 0.40 10.00 - 10.40
6. Mr. Sanjay M. Shah 0.80 8.00 - 8.80
Total (1) 6.00 102.00 - 108.00
Non - Executive Directors
1. Mr. J.B. Mody 0.20 - - 0.20
2. Mr. Pranabh D. Mody 1.30 - - 1.30
Total (2) 1.50 - - 1.50
Total (B)=(1+2) 7.50 102.00 - 109.50
Total Managerial Remuneration 7.50 102.00 - 109.50
Ceiling as per the Act (@ 1% of profits calculated under Section 198 of the Companies Act, 2013)
294.57
B. REMUNERATION TO KEY MANAGERIAL PERSONNEL OTHER THAN MD/MANAGER/WTD(` In lakhs)
Sl.No.
Particulars of RemunerationKey Managerial Personnel
Mr. S. Prasad Total
1. Gross salary
(a) Salary as per provisions contained in section 17(1) of the Income - tax Act, 1961 19.70 19.70
(b) Value of perquisites u/s 17(2) of the Income - tax Act, 1961 - -
(c) Profits in lieu of salary under section 17(3) of the Income - tax Act, 1961 - -
2. Stock Option - -
3. Sweat Equity - -
4. Commission - -
- as % of profit - -
- others - -
5. Others - -
Total 19.70 19.70
ix. PENALTIES / PUNISHMENT / COMPOUNDING OF OFFENCES:
There were no penalties, punishment or compounding of offences during the year ended March 31, 2015.
Annexure H1
PARTICULARS OF EMPLOYEES
The information required under Section 197 of the Act read with rule 5(1) of the Companies (Appointment and Remuneration of Managerial Personnel) Rules, 2014 are given below:
I. The ratio of the remuneration of each director to the median remuneration of the employees of the Company for the financial year:
Name Designation Ratio
Mr. Rajiv C. Mody Chairman & Managing Director 36.53
Mr. Anjan Lahiri Chief Executive Officer* -
Dr. Ashok Jhunjhunwala Independent Director 2.83
Mr. Bansi S. Mehta Independent Director 2.49
Mr. Bharat V. Patel Independent Director 1.36
Annexure to the Board’s Report (Contd.)

53
Name Designation Ratio
Mr. J.B. Mody Non - Executive Director -
Mr. Kiran S. Karnik Independent Director 1.13
Mr. Krishna J. Jhaveri Whole Time Director 3.24
Ms. Neeta S. Revankar Whole Time Director & CFO 20.29
Mr. Pranabh D. Mody Non - Executive Director -
Prof. J. Ramachandran Independent Director 2.83
Mr. Sanjay M. Shah Independent Director 0.90
Dr. G. Venkatesh Non - Executive Director** 6.84
Mr. S. Prasad Associate Vice President & Company Secretary 2.46
* Mr. Anjan Lahiri ceased to be director effective September 23, 2014** Dr. G. Venkatesh ceased to be an executive director effective January 19, 2015
II. The percentage increase in remuneration of each director, Chief Executive Officer, Chief Financial Officer, Company Secretary in the financial year:
Name Designation % Increment
Mr. Rajiv C. Mody Chairman & Managing Director 154.3%
Mr. Anjan Lahiri Chief Executive Officer* -
Dr. Ashok Jhunjhunwala Independent Director 92.3%
Mr. Bansi S. Mehta Independent Director 69.2%
Mr. Bharat V. Patel Independent Director 71.4%
Mr. J.B. Mody Non - Executive Director -
Mr. Kiran S. Karnik Independent Director 66.7%
Mr. Krishna J. Jhaveri Whole Time Director (28.9)%
Ms. Neeta S. Revankar Whole Time Director & CFO 102.7%
Mr. Pranabh D. Mody Non - Executive Director -
Prof. J. Ramachandran Independent Director 56.3%
Mr. Sanjay M. Shah Independent Director 166.7%
Dr. G. Venkatesh Non - Executive Director 36.6%
Mr. S. Prasad Associate Vice President & Company Secretary 6.7%
* Mr. Anjan Lahiri was a director for the part of the year and hence not able to determine the increment.
III. The percentage increase in the median remuneration of employees in the financial year:
The median remuneration of the employees in the financial year was increased by 4.1%. The calculation of % Increase in Median Remuneration is done based on comparable employees.
IV. The number of permanent employees on the rolls of the Company:
There were 1,776 permanent employees on rolls as on March 31, 2015.
V. The explanation on the relationship between average increase in remuneration and company performance:
Factors considered while recommending salary increase:
1. External Equity: Sasken benchmarks its median salary for different bands and job family’s vis - à - vis our comparator. Each Job family, within each band has a pay range accordingly. The proposed increases for each band are based on how far the company is from the median. The compensation strategy is to peg our median to market median.
2. Internal Parity: Pay ranges are mapped to defined bands and job families. Compensation grid accounting for performance and compensation fit. Restricting new employee offers to on or below median as far as possible.
3. Differentiation: Compensation is connected to Performance ratings. Higher the performance and one would see higher increments.
4. Affordability: This pillar ties all the other pillars based on business reality, visibility and ensures compensation programs are aligned to business expectations.
VI. Comparison of the remuneration of the Key Managerial Personnel against the performance of the company:
Ratio of total remuneration of all key managerial personnel on the annual profit of FY ‘15 was 4.18%.
Annexure to the Board’s Report (Contd.)
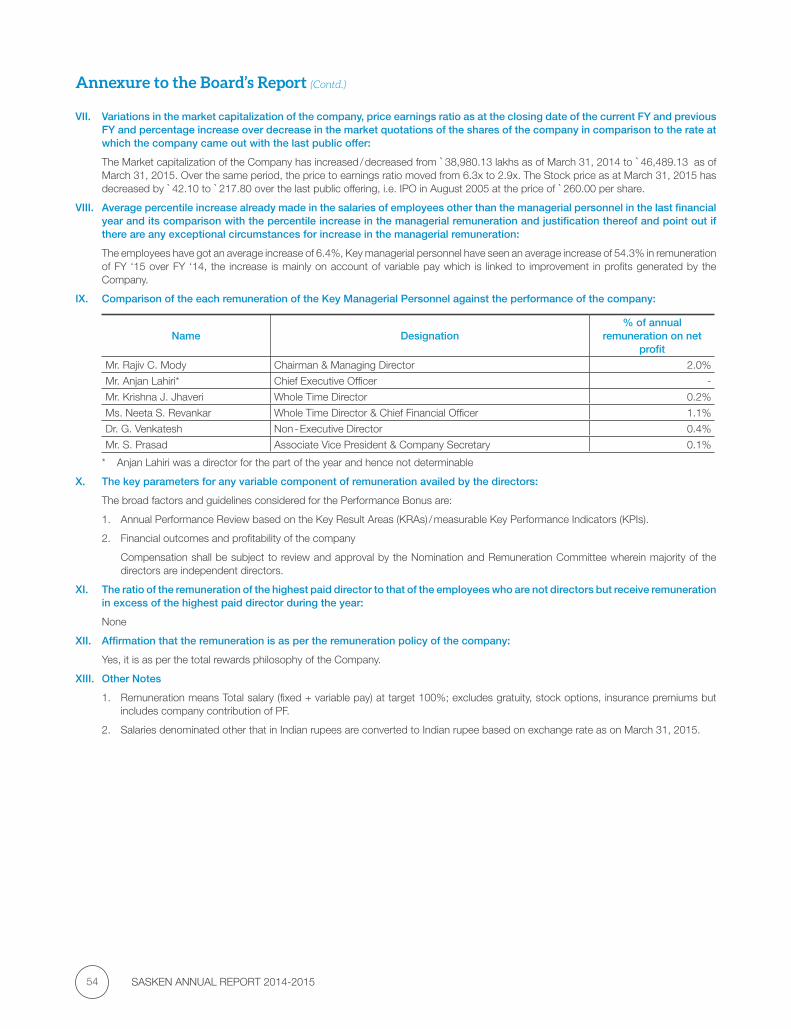
SASKEN ANNUAL REPORT 2014-201554
VII. Variations in the market capitalization of the company, price earnings ratio as at the closing date of the current FY and previous FY and percentage increase over decrease in the market quotations of the shares of the company in comparison to the rate at which the company came out with the last public offer:
The Market capitalization of the Company has increased / decreased from `38,980.13 lakhs as of March 31, 2014 to `46,489.13 as of March 31, 2015. Over the same period, the price to earnings ratio moved from 6.3x to 2.9x. The Stock price as at March 31, 2015 has decreased by `42.10 to `217.80 over the last public offering, i.e. IPO in August 2005 at the price of `260.00 per share.
VIII. Average percentile increase already made in the salaries of employees other than the managerial personnel in the last financial year and its comparison with the percentile increase in the managerial remuneration and justification thereof and point out if there are any exceptional circumstances for increase in the managerial remuneration:
The employees have got an average increase of 6.4%, Key managerial personnel have seen an average increase of 54.3% in remuneration of FY ‘15 over FY ‘14, the increase is mainly on account of variable pay which is linked to improvement in profits generated by the Company.
IX. Comparison of the each remuneration of the Key Managerial Personnel against the performance of the company:
Name Designation% of annual
remuneration on net profit
Mr. Rajiv C. Mody Chairman & Managing Director 2.0%
Mr. Anjan Lahiri* Chief Executive Officer -
Mr. Krishna J. Jhaveri Whole Time Director 0.2%
Ms. Neeta S. Revankar Whole Time Director & Chief Financial Officer 1.1%
Dr. G. Venkatesh Non - Executive Director 0.4%
Mr. S. Prasad Associate Vice President & Company Secretary 0.1%
* Anjan Lahiri was a director for the part of the year and hence not determinable
X. The key parameters for any variable component of remuneration availed by the directors:
The broad factors and guidelines considered for the Performance Bonus are:
1. Annual Performance Review based on the Key Result Areas (KRAs) / measurable Key Performance Indicators (KPIs).
2. Financial outcomes and profitability of the company
Compensation shall be subject to review and approval by the Nomination and Remuneration Committee wherein majority of the directors are independent directors.
XI. The ratio of the remuneration of the highest paid director to that of the employees who are not directors but receive remuneration in excess of the highest paid director during the year:
None
XII. Affirmation that the remuneration is as per the remuneration policy of the company:
Yes, it is as per the total rewards philosophy of the Company.
XIII. Other Notes
1. Remuneration means Total salary (fixed + variable pay) at target 100%; excludes gratuity, stock options, insurance premiums but includes company contribution of PF.
2. Salaries denominated other that in Indian rupees are converted to Indian rupee based on exchange rate as on March 31, 2015.
Annexure to the Board’s Report (Contd.)
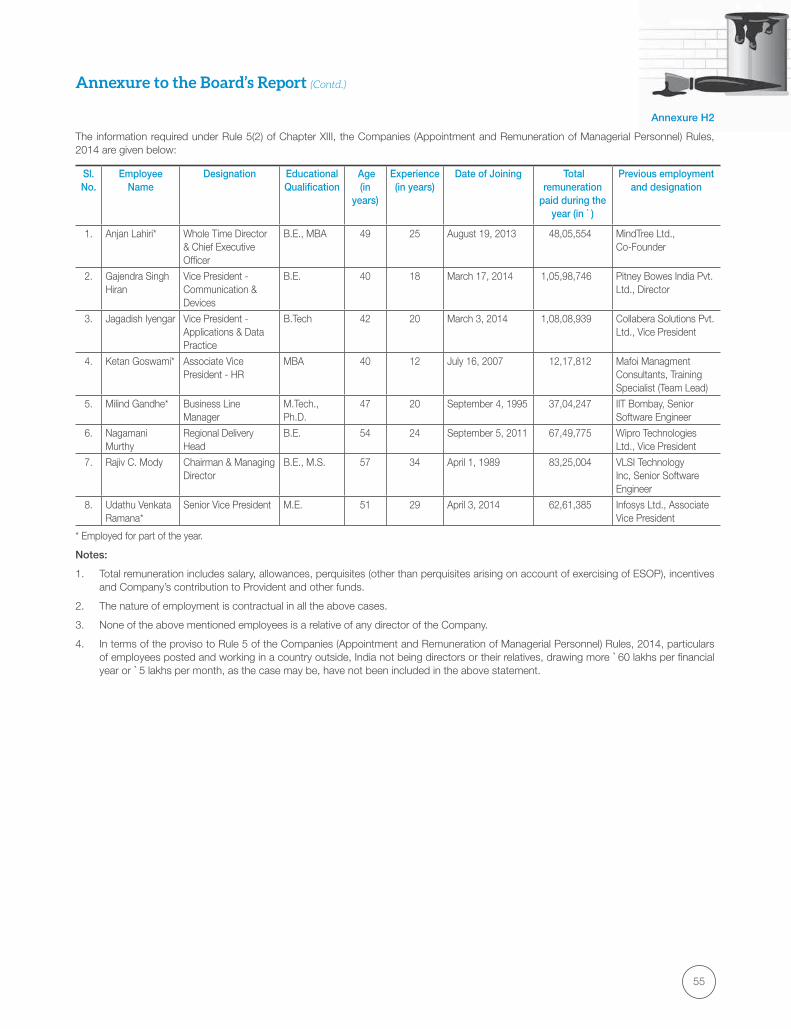
55
Annexure to the Board’s Report (Contd.)
Annexure H2
The information required under Rule 5(2) of Chapter XIII, the Companies (Appointment and Remuneration of Managerial Personnel) Rules, 2014 are given below:
Sl. No.
Employee Name
Designation Educational Qualification
Age (in
years)
Experience (in years)
Date of Joining Total remuneration
paid during the year (in `)
Previous employment and designation
1. Anjan Lahiri* Whole Time Director & Chief Executive Officer
B.E., MBA 49 25 August 19, 2013 48,05,554 MindTree Ltd., Co-Founder
2. Gajendra Singh Hiran
Vice President - Communication & Devices
B.E. 40 18 March 17, 2014 1,05,98,746 Pitney Bowes India Pvt. Ltd., Director
3. Jagadish Iyengar Vice President - Applications & Data Practice
B.Tech 42 20 March 3, 2014 1,08,08,939 Collabera Solutions Pvt. Ltd., Vice President
4. Ketan Goswami* Associate Vice President - HR
MBA 40 12 July 16, 2007 12,17,812 Mafoi Managment Consultants, Training Specialist (Team Lead)
5. Milind Gandhe* Business Line Manager
M.Tech., Ph.D.
47 20 September 4, 1995 37,04,247 IIT Bombay, Senior Software Engineer
6. Nagamani Murthy
Regional Delivery Head
B.E. 54 24 September 5, 2011 67,49,775 Wipro Technologies Ltd., Vice President
7. Rajiv C. Mody Chairman & Managing Director
B.E., M.S. 57 34 April 1, 1989 83,25,004 VLSI Technology Inc, Senior Software Engineer
8. Udathu Venkata Ramana*
Senior Vice President M.E. 51 29 April 3, 2014 62,61,385 Infosys Ltd., Associate Vice President
* Employed for part of the year.
Notes:
1. Total remuneration includes salary, allowances, perquisites (other than perquisites arising on account of exercising of ESOP), incentives and Company’s contribution to Provident and other funds.
2. The nature of employment is contractual in all the above cases.
3. None of the above mentioned employees is a relative of any director of the Company.
4. In terms of the proviso to Rule 5 of the Companies (Appointment and Remuneration of Managerial Personnel) Rules, 2014, particulars of employees posted and working in a country outside, India not being directors or their relatives, drawing more `60 lakhs per financial year or `5 lakhs per month, as the case may be, have not been included in the above statement.
SASKEN ANNUAL REPORT 2014-201556
Sasken Management along with all Sasians is committed to define, implement and continuously improve quality, information security and environment management systems spanning products and services.
Quality
Sasken’s Quality philosophy stems from its Vision:
“To be a global leader in R&D services by being the partner of choice for customers through superior offerings and operational excellence while being the employer of choice”.
To uphold the highest levels of Customer Centricity and ensure that customers stay competitive at all times, Sasken has established the following tenets:
Information Security
assets belonging to Company, its customers, partners and suppliers as per the Sasken Risk Assessment Framework.
Environment
Rajiv C. ModyChairman & Managing Director
Sasken Quality, Information Security and Environment Policy
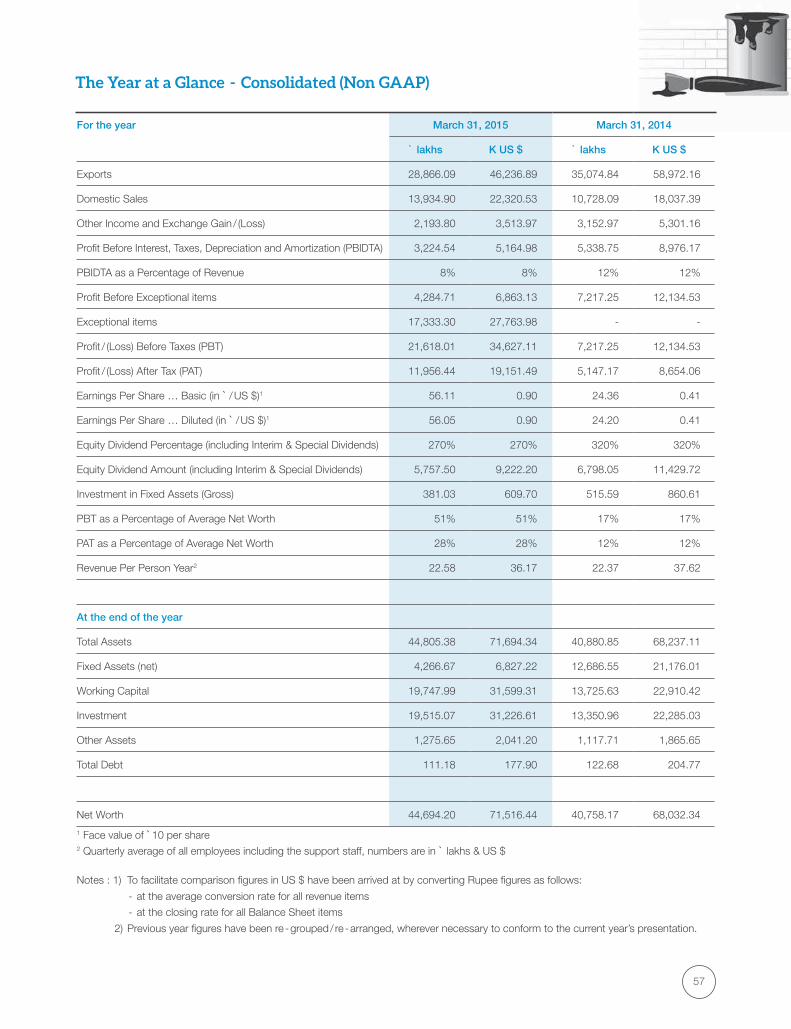
57
The Year at a Glance - Consolidated (Non GAAP)
For the year March 31, 2015 March 31, 2014
` lakhs K US $ ` lakhs K US $
Exports 28,866.09 46,236.89 35,074.84 58,972.16
Domestic Sales 13,934.90 22,320.53 10,728.09 18,037.39
Other Income and Exchange Gain / (Loss) 2,193.80 3,513.97 3,152.97 5,301.16
Profit Before Interest, Taxes, Depreciation and Amortization (PBIDTA) 3,224.54 5,164.98 5,338.75 8,976.17
PBIDTA as a Percentage of Revenue 8% 8% 12% 12%
Profit Before Exceptional items 4,284.71 6,863.13 7,217.25 12,134.53
Exceptional items 17,333.30 27,763.98 - -
Profit / (Loss) Before Taxes (PBT) 21,618.01 34,627.11 7,217.25 12,134.53
Profit / (Loss) After Tax (PAT) 11,956.44 19,151.49 5,147.17 8,654.06
Earnings Per Share … Basic (in ` / US $)1 56.11 0.90 24.36 0.41
Earnings Per Share … Diluted (in ` / US $)1 56.05 0.90 24.20 0.41
Equity Dividend Percentage (including Interim & Special Dividends) 270% 270% 320% 320%
Equity Dividend Amount (including Interim & Special Dividends) 5,757.50 9,222.20 6,798.05 11,429.72
Investment in Fixed Assets (Gross) 381.03 609.70 515.59 860.61
PBT as a Percentage of Average Net Worth 51% 51% 17% 17%
PAT as a Percentage of Average Net Worth 28% 28% 12% 12%
Revenue Per Person Year2 22.58 36.17 22.37 37.62
At the end of the year
Total Assets 44,805.38 71,694.34 40,880.85 68,237.11
Fixed Assets (net) 4,266.67 6,827.22 12,686.55 21,176.01
Working Capital 19,747.99 31,599.31 13,725.63 22,910.42
Investment 19,515.07 31,226.61 13,350.96 22,285.03
Other Assets 1,275.65 2,041.20 1,117.71 1,865.65
Total Debt 111.18 177.90 122.68 204.77
Net Worth 44,694.20 71,516.44 40,758.17 68,032.34
1 Face value of `10 per share2 Quarterly average of all employees including the support staff, numbers are in ` lakhs & US $
Notes : 1) To facilitate comparison figures in US $ have been arrived at by converting Rupee figures as follows:
- at the average conversion rate for all revenue items
- at the closing rate for all Balance Sheet items
2) Previous year figures have been re - grouped / re - arranged, wherever necessary to conform to the current year’s presentation.
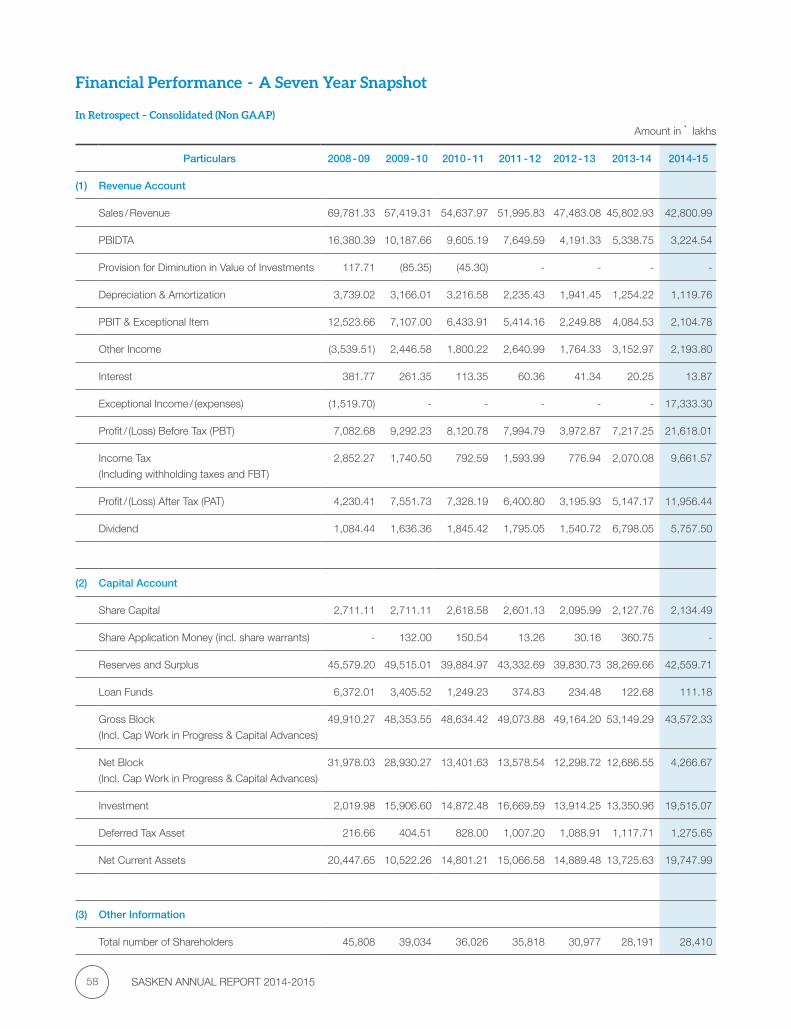
SASKEN ANNUAL REPORT 2014-201558
Financial Performance - A Seven Year Snapshot
In Retrospect – Consolidated (Non GAAP)
Amount in ` lakhs
Particulars 2008 - 09 2009 - 10 2010 - 11 2011 - 12 2012 - 13 2013-14 2014-15
(1) Revenue Account
Sales / Revenue 69,781.33 57,419.31 54,637.97 51,995.83 47,483.08 45,802.93 42,800.99
PBIDTA 16,380.39 10,187.66 9,605.19 7,649.59 4,191.33 5,338.75 3,224.54
Provision for Diminution in Value of Investments 117.71 (85.35) (45.30) - - - -
Depreciation & Amortization 3,739.02 3,166.01 3,216.58 2,235.43 1,941.45 1,254.22 1,119.76
PBIT & Exceptional Item 12,523.66 7,107.00 6,433.91 5,414.16 2,249.88 4,084.53 2,104.78
Other Income (3,539.51) 2,446.58 1,800.22 2,640.99 1,764.33 3,152.97 2,193.80
Interest 381.77 261.35 113.35 60.36 41.34 20.25 13.87
Exceptional Income / (expenses) (1,519.70) - - - - - 17,333.30
Profit / (Loss) Before Tax (PBT) 7,082.68 9,292.23 8,120.78 7,994.79 3,972.87 7,217.25 21,618.01
Income Tax
(Including withholding taxes and FBT)
2,852.27 1,740.50 792.59 1,593.99 776.94 2,070.08 9,661.57
Profit / (Loss) After Tax (PAT) 4,230.41 7,551.73 7,328.19 6,400.80 3,195.93 5,147.17 11,956.44
Dividend 1,084.44 1,636.36 1,845.42 1,795.05 1,540.72 6,798.05 5,757.50
(2) Capital Account
Share Capital 2,711.11 2,711.11 2,618.58 2,601.13 2,095.99 2,127.76 2,134.49
Share Application Money (incl. share warrants) - 132.00 150.54 13.26 30.16 360.75 -
Reserves and Surplus 45,579.20 49,515.01 39,884.97 43,332.69 39,830.73 38,269.66 42,559.71
Loan Funds 6,372.01 3,405.52 1,249.23 374.83 234.48 122.68 111.18
Gross Block
(Incl. Cap Work in Progress & Capital Advances)
49,910.27 48,353.55 48,634.42 49,073.88 49,164.20 53,149.29 43,572.33
Net Block
(Incl. Cap Work in Progress & Capital Advances)
31,978.03 28,930.27 13,401.63 13,578.54 12,298.72 12,686.55 4,266.67
Investment 2,019.98 15,906.60 14,872.48 16,669.59 13,914.25 13,350.96 19,515.07
Deferred Tax Asset 216.66 404.51 828.00 1,007.20 1,088.91 1,117.71 1,275.65
Net Current Assets 20,447.65 10,522.26 14,801.21 15,066.58 14,889.48 13,725.63 19,747.99
(3) Other Information
Total number of Shareholders 45,808 39,034 36,026 35,818 30,977 28,191 28,410
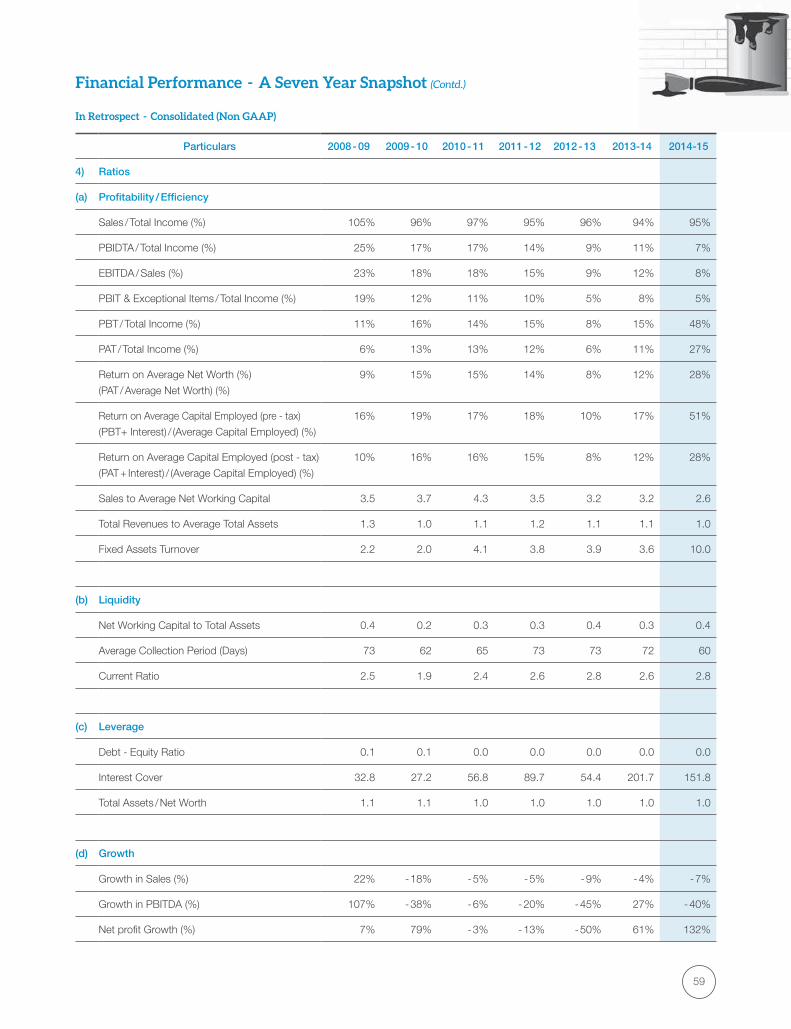
59
Financial Performance - A Seven Year Snapshot (Contd.)
In Retrospect - Consolidated (Non GAAP)
Particulars 2008 - 09 2009 - 10 2010 - 11 2011 - 12 2012 - 13 2013-14 2014-15
4) Ratios
(a) Profitability / Efficiency
Sales / Total Income (%) 105% 96% 97% 95% 96% 94% 95%
PBIDTA / Total Income (%) 25% 17% 17% 14% 9% 11% 7%
EBITDA / Sales (%) 23% 18% 18% 15% 9% 12% 8%
PBIT & Exceptional Items / Total Income (%) 19% 12% 11% 10% 5% 8% 5%
PBT / Total Income (%) 11% 16% 14% 15% 8% 15% 48%
PAT / Total Income (%) 6% 13% 13% 12% 6% 11% 27%
Return on Average Net Worth (%)
(PAT / Average Net Worth) (%)
9% 15% 15% 14% 8% 12% 28%
Return on Average Capital Employed (pre - tax)
(PBT+ Interest) / (Average Capital Employed) (%)
16% 19% 17% 18% 10% 17% 51%
Return on Average Capital Employed (post - tax)
(PAT + Interest) / (Average Capital Employed) (%)
10% 16% 16% 15% 8% 12% 28%
Sales to Average Net Working Capital 3.5 3.7 4.3 3.5 3.2 3.2 2.6
Total Revenues to Average Total Assets 1.3 1.0 1.1 1.2 1.1 1.1 1.0
Fixed Assets Turnover 2.2 2.0 4.1 3.8 3.9 3.6 10.0
(b) Liquidity
Net Working Capital to Total Assets 0.4 0.2 0.3 0.3 0.4 0.3 0.4
Average Collection Period (Days) 73 62 65 73 73 72 60
Current Ratio 2.5 1.9 2.4 2.6 2.8 2.6 2.8
(c) Leverage
Debt - Equity Ratio 0.1 0.1 0.0 0.0 0.0 0.0 0.0
Interest Cover 32.8 27.2 56.8 89.7 54.4 201.7 151.8
Total Assets / Net Worth 1.1 1.1 1.0 1.0 1.0 1.0 1.0
(d) Growth
Growth in Sales (%) 22% - 18% - 5% - 5% - 9% - 4% - 7%
Growth in PBITDA (%) 107% - 38% - 6% - 20% - 45% 27% - 40%
Net profit Growth (%) 7% 79% - 3% - 13% - 50% 61% 132%
SASKEN ANNUAL REPORT 2014-201560
Independent Auditors’ Report
To the Members of Sasken Communication Technologies Limited
Report on the Standalone Financial Statements
We have audited the accompanying standalone financial statements of Sasken Communication Technologies Limited (“the Company”), which comprise the Balance Sheet as at March 31, 2015, the Statement of Profit and Loss and Cash Flow Statement for the year then ended, and a summary of significant accounting policies and other explanatory information.
Management’s Responsibility for the Standalone Financial Statements
The Company’s Board of Directors is responsible for the matters stated in Section 134(5) of the Companies Act, 2013 (“the Act”) with respect to the preparation of these standalone financial statements that give a true and fair view of the financial position, financial performance and cash flows of the Company in accordance with accounting principles generally accepted in India, including the Accounting Standards specified under Section 133 of the Act, read with Rule 7 of the Companies (Accounts) Rules, 2014. This responsibility also includes maintenance of adequate accounting records in accordance with the provisions of the Act for safeguarding of the assets of the Company and for preventing and detecting frauds and other irregularities; selection and application of appropriate accounting policies; making judgments and estimates that are reasonable and prudent; and the design, implementation and maintenance of adequate internal financial control that were operating effectively for ensuring the accuracy and completeness of the accounting records, relevant to the preparation and presentation of the financial statements that give a true and fair view and are free from material misstatement, whether due to fraud or error.
Auditor’s Responsibility
Our responsibility is to express an opinion on these standalone financial statements based on our audit. We have taken into account the provisions of the Act, the accounting and auditing standards and matters which are required to be included in the audit report under the provisions of the Act and the Rules made thereunder. We conducted our audit in accordance with the Standards on Auditing, issued by the Institute of Chartered Accountants of India, as specified under Section 143(10) of the Act. Those Standards require that we comply with ethical requirements and plan and perform the audit to obtain reasonable assurance about whether the financial statements are free from material misstatement.
An audit involves performing procedures to obtain audit evidence about the amounts and disclosures in the financial statements. The procedures selected depend on the auditor’s judgment, including the assessment of the risks of material misstatement of the financial statements, whether due to fraud or error. In making those risk assessments, the auditor considers internal financial control relevant to the Company’s preparation of the financial statements that give a true and fair view in order to design audit procedures that are appropriate in the circumstances but not for the purpose of expressing an opinion on whether the Company has in place an adequate internal financial controls system over financial reporting and the effectiveness of such controls. An audit also includes evaluating the appropriateness of accounting policies used and the reasonableness of the accounting estimates made by the Company’s Directors, as well as evaluating the overall presentation of the financial statements. We believe that the audit evidence we have obtained is sufficient and appropriate to provide a basis for our audit opinion on the standalone financial statements.
Opinion
In our opinion and to the best of our information and according to the explanations given to us, the standalone financial statements give the information required by the Act in the manner so required and give a true and fair view in conformity with the accounting principles generally accepted in India of the state of affairs of the Company as at March 31, 2015, its profit and its cash flows for the year ended on that date.
Report on Other Legal and Regulatory Requirements
1. As required by the Companies (Auditor’s Report) Order, 2015 (“the Order”) issued by the Central Government of India in terms of sub - section (11) of Section 143 of the Act, we give in the Annexure 1 a statement on the matters specified in paragraphs 3 and 4 of the Order.
2. As required by Section 143(3) of the Act, we report that:(a) We have sought and obtained all the information and explanations which to the best of our knowledge and belief were necessary for
the purpose of our audit;(b) In our opinion, proper books of account as required by law have been kept by the Company so far as it appears from our examination
of those books;(c) The Balance Sheet, Statement of Profit and Loss, and Cash Flow Statement dealt with by this Report are in agreement with the books
of account;(d) In our opinion, the aforesaid standalone financial statements comply with the Accounting Standards specified under Section 133 of the
Act, read with Rule 7 of the Companies (Accounts) Rules, 2014;(e) On the basis of the written representations received from the directors as on March 31, 2015 taken on record by the Board of Directors,
none of the directors is disqualified as on March 31, 2015 from being appointed as a director in terms of Section 164 (2) of the Act; and(f) With respect to the other matters to be included in the Auditor’s Report in accordance with Rule 11 of the Companies (Audit and
Auditors) Rules, 2014, in our opinion and to the best of our information and according to the explanations given to us:i. The Company has disclosed the impact of pending litigations on its financial position in its financial statements - Refer Note 27 to
the financial statements.ii. The Company did not have any long - term contracts including derivative contracts for which there were any material foreseeable
losses.iii. There has been no delay in transferring amounts to the Investor Education and Protection Fund by the Company.
For S.R. Batliboi & Co. LLP Chartered AccountantsICAI Firm Registration Number: 301003E
per Navin AgrawalPartnerMembership No.: 56102
Place : BengaluruDate : April 23, 2015
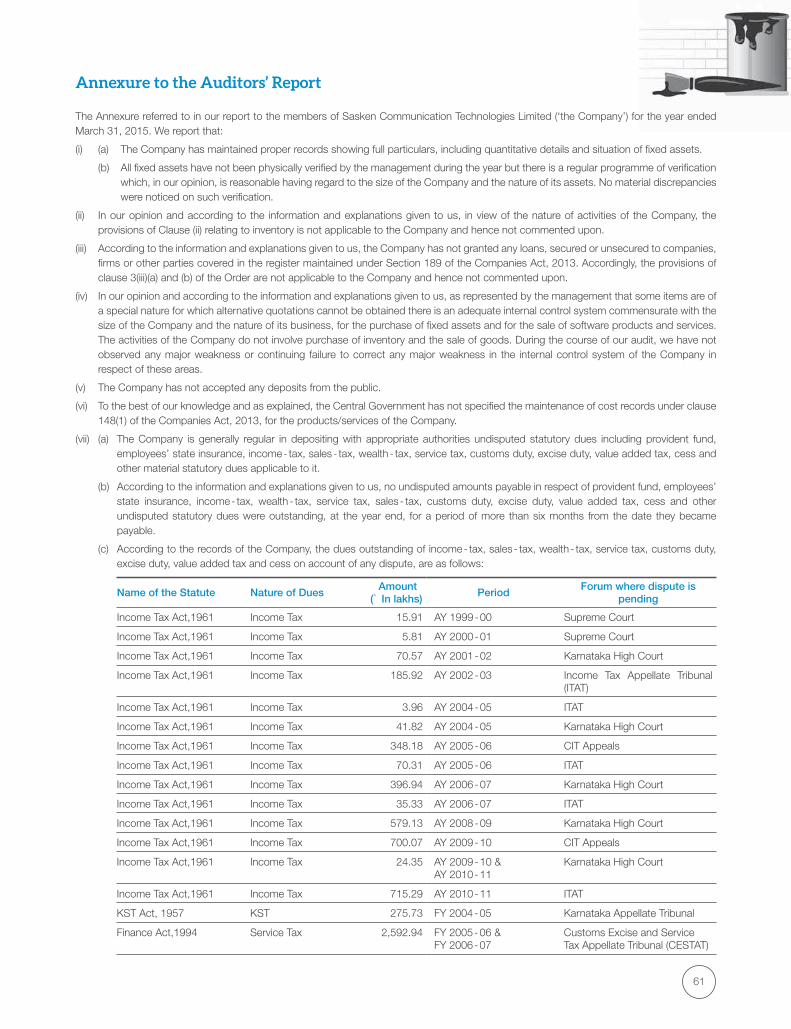
61
Annexure to the Auditors’ Report
The Annexure referred to in our report to the members of Sasken Communication Technologies Limited (‘the Company’) for the year ended March 31, 2015. We report that:
(i) (a) The Company has maintained proper records showing full particulars, including quantitative details and situation of fixed assets.
(b) All fixed assets have not been physically verified by the management during the year but there is a regular programme of verification which, in our opinion, is reasonable having regard to the size of the Company and the nature of its assets. No material discrepancies were noticed on such verification.
(ii) In our opinion and according to the information and explanations given to us, in view of the nature of activities of the Company, the provisions of Clause (ii) relating to inventory is not applicable to the Company and hence not commented upon.
(iii) According to the information and explanations given to us, the Company has not granted any loans, secured or unsecured to companies, firms or other parties covered in the register maintained under Section 189 of the Companies Act, 2013. Accordingly, the provisions of clause 3(iii)(a) and (b) of the Order are not applicable to the Company and hence not commented upon.
(iv) In our opinion and according to the information and explanations given to us, as represented by the management that some items are of a special nature for which alternative quotations cannot be obtained there is an adequate internal control system commensurate with the size of the Company and the nature of its business, for the purchase of fixed assets and for the sale of software products and services. The activities of the Company do not involve purchase of inventory and the sale of goods. During the course of our audit, we have not observed any major weakness or continuing failure to correct any major weakness in the internal control system of the Company in respect of these areas.
(v) The Company has not accepted any deposits from the public.
(vi) To the best of our knowledge and as explained, the Central Government has not specified the maintenance of cost records under clause 148(1) of the Companies Act, 2013, for the products/services of the Company.
(vii) (a) The Company is generally regular in depositing with appropriate authorities undisputed statutory dues including provident fund, employees’ state insurance, income - tax, sales - tax, wealth - tax, service tax, customs duty, excise duty, value added tax, cess and other material statutory dues applicable to it.
(b) According to the information and explanations given to us, no undisputed amounts payable in respect of provident fund, employees’ state insurance, income - tax, wealth - tax, service tax, sales - tax, customs duty, excise duty, value added tax, cess and other undisputed statutory dues were outstanding, at the year end, for a period of more than six months from the date they became payable.
(c) According to the records of the Company, the dues outstanding of income - tax, sales - tax, wealth - tax, service tax, customs duty, excise duty, value added tax and cess on account of any dispute, are as follows:
Name of the Statute Nature of Dues Amount
(` In lakhs) Period
Forum where dispute is pending
Income Tax Act,1961 Income Tax 15.91 AY 1999 - 00 Supreme Court
Income Tax Act,1961 Income Tax 5.81 AY 2000 - 01 Supreme Court
Income Tax Act,1961 Income Tax 70.57 AY 2001 - 02 Karnataka High Court
Income Tax Act,1961 Income Tax 185.92 AY 2002 - 03 Income Tax Appellate Tribunal (ITAT)
Income Tax Act,1961 Income Tax 3.96 AY 2004 - 05 ITAT
Income Tax Act,1961 Income Tax 41.82 AY 2004 - 05 Karnataka High Court
Income Tax Act,1961 Income Tax 348.18 AY 2005 - 06 CIT Appeals
Income Tax Act,1961 Income Tax 70.31 AY 2005 - 06 ITAT
Income Tax Act,1961 Income Tax 396.94 AY 2006 - 07 Karnataka High Court
Income Tax Act,1961 Income Tax 35.33 AY 2006 - 07 ITAT
Income Tax Act,1961 Income Tax 579.13 AY 2008 - 09 Karnataka High Court
Income Tax Act,1961 Income Tax 700.07 AY 2009 - 10 CIT Appeals
Income Tax Act,1961 Income Tax 24.35 AY 2009 - 10 &AY 2010 - 11
Karnataka High Court
Income Tax Act,1961 Income Tax 715.29 AY 2010 - 11 ITAT
KST Act, 1957 KST 275.73 FY 2004 - 05 Karnataka Appellate Tribunal
Finance Act,1994 Service Tax 2,592.94 FY 2005 - 06 &FY 2006 - 07
Customs Excise and Service Tax Appellate Tribunal (CESTAT)
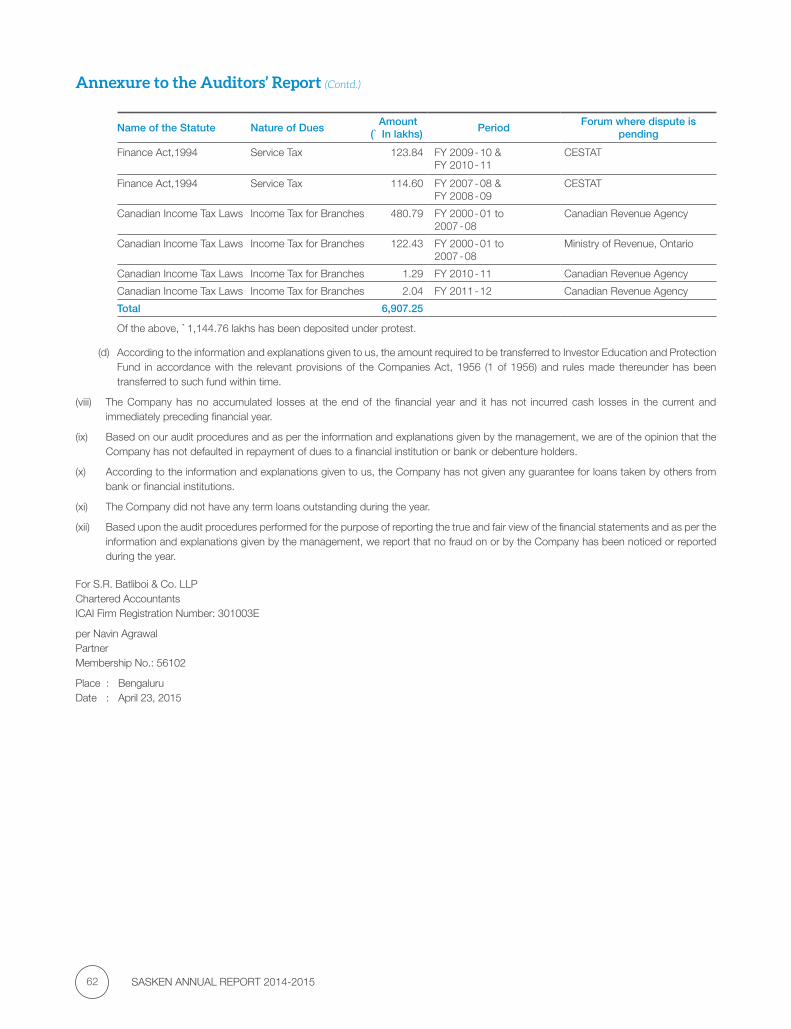
SASKEN ANNUAL REPORT 2014-201562
Annexure to the Auditors’ Report (Contd.)
Name of the Statute Nature of Dues Amount
(` In lakhs) Period
Forum where dispute is pending
Finance Act,1994 Service Tax 123.84 FY 2009 - 10 &FY 2010 - 11
CESTAT
Finance Act,1994 Service Tax 114.60 FY 2007 - 08 &FY 2008 - 09
CESTAT
Canadian Income Tax Laws Income Tax for Branches 480.79 FY 2000 - 01 to2007 - 08
Canadian Revenue Agency
Canadian Income Tax Laws Income Tax for Branches 122.43 FY 2000 - 01 to 2007 - 08
Ministry of Revenue, Ontario
Canadian Income Tax Laws Income Tax for Branches 1.29 FY 2010 - 11 Canadian Revenue Agency
Canadian Income Tax Laws Income Tax for Branches 2.04 FY 2011 - 12 Canadian Revenue Agency
Total 6,907.25
Of the above, `1,144.76 lakhs has been deposited under protest.
(d) According to the information and explanations given to us, the amount required to be transferred to Investor Education and Protection Fund in accordance with the relevant provisions of the Companies Act, 1956 (1 of 1956) and rules made thereunder has been transferred to such fund within time.
(viii) The Company has no accumulated losses at the end of the financial year and it has not incurred cash losses in the current and immediately preceding financial year.
(ix) Based on our audit procedures and as per the information and explanations given by the management, we are of the opinion that the Company has not defaulted in repayment of dues to a financial institution or bank or debenture holders.
(x) According to the information and explanations given to us, the Company has not given any guarantee for loans taken by others from bank or financial institutions.
(xi) The Company did not have any term loans outstanding during the year.
(xii) Based upon the audit procedures performed for the purpose of reporting the true and fair view of the financial statements and as per the information and explanations given by the management, we report that no fraud on or by the Company has been noticed or reported during the year.
For S.R. Batliboi & Co. LLP Chartered AccountantsICAI Firm Registration Number: 301003E
per Navin AgrawalPartnerMembership No.: 56102
Place : BengaluruDate : April 23, 2015

63
To the Members of Sasken Communication Technologies Limited
The accompanying abridged financial statements, which comprise the abridged Balance Sheet as at March 31, 2015, the abridged Statement of Profit and Loss and abridged Cash Flow Statement for the year then ended, and related notes, are derived from the audited standalone financial statements of Sasken Communication Technologies Limited (‘the Company’) as at and for the year ended March 31, 2015. We expressed an unmodified audit opinion on those financial statements in our report dated April 23, 2015.
The abridged financial statements do not contain all the disclosures required by the accounting principles generally accepted in India, including the Accounting Standards specified under Section 133 of the Companies Act, 2013 (“the Act”) read with Rule 7 of the Companies (Accounts) Rules, 2014. Reading the abridged financial statements, therefore, is not a substitute for reading the audited standalone financial statements of the Company.
Management’s Responsibility for the Financial Statements
The Company’s Board of Directors is responsible for the preparation of a summary of the audited financial statements in accordance with the Accounting Standards specified under Section 133 of the Act, read with Rule 7 of the Companies (Accounts) Rules, 2014 and accounting principles generally accepted in India.
Auditor’s Responsibility
Our responsibility is to express an opinion on the abridged financial statements based on our procedures, which were conducted in accordance with Standard on Auditing (SA) 810, “Engagements to Report on Summary Financial Statements” issued by the Institute of Chartered Accountants of India.
Opinion
In our opinion, the abridged financial statements derived from the audited standalone financial statements of the Company as at and for the year ended March 31, 2015 are a fair summary of those financial statements, in accordance with the Accounting Standards specified under Section 133 of the Act, read with Rule 7 of the Companies (Accounts) Rules, 2014 and accounting principles generally accepted in India.
For S.R. Batliboi & Co. LLP Chartered AccountantsICAI Firm Registration Number: 301003E
per Navin AgrawalPartnerMembership No.: 56102
Place : BengaluruDate : April 23, 2015
Report of the Independent Auditor on the Abridged Financial Statements
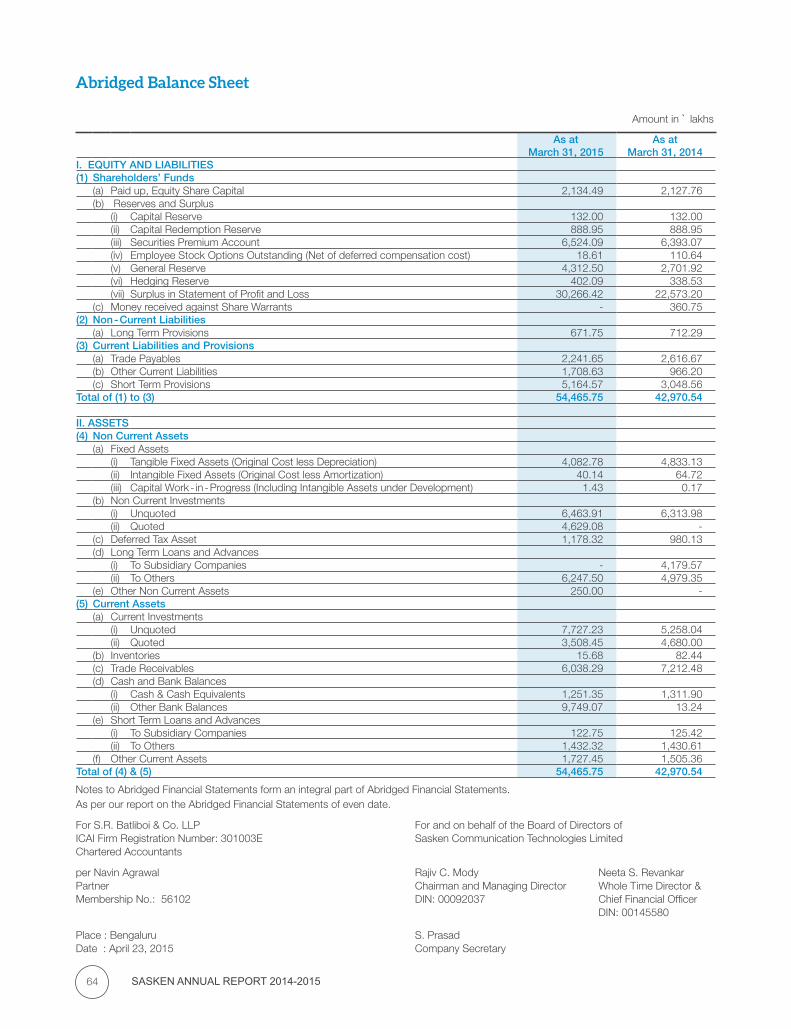
SASKEN ANNUAL REPORT 2014-201564
Abridged Balance Sheet
Notes to Abridged Financial Statements form an integral part of Abridged Financial Statements.
Amount in ` lakhs
As at March 31, 2015
As at March 31, 2014
I. EQUITY AND LIABILITIES(1) Shareholders’ Funds
(a) Paid up, Equity Share Capital 2,134.49 2,127.76 (b) Reserves and Surplus
(i) Capital Reserve 132.00 132.00 (ii) Capital Redemption Reserve 888.95 888.95 (iii) Securities Premium Account 6,524.09 6,393.07 (iv) Employee Stock Options Outstanding (Net of deferred compensation cost) 18.61 110.64 (v) General Reserve 4,312.50 2,701.92 (vi) Hedging Reserve 402.09 338.53 (vii) Surplus in Statement of Profit and Loss 30,266.42 22,573.20
(c) Money received against Share Warrants - 360.75 (2) Non - Current Liabilities
(a) Long Term Provisions 671.75 712.29 (3) Current Liabilities and Provisions
(a) Trade Payables 2,241.65 2,616.67 (b) Other Current Liabilities 1,708.63 966.20 (c) Short Term Provisions 5,164.57 3,048.56
Total of (1) to (3) 54,465.75 42,970.54
II. ASSETS(4) Non Current Assets
(a) Fixed Assets(i) Tangible Fixed Assets (Original Cost less Depreciation) 4,082.78 4,833.13 (ii) Intangible Fixed Assets (Original Cost less Amortization) 40.14 64.72 (iii) Capital Work - in - Progress (Including Intangible Assets under Development) 1.43 0.17
(b) Non Current Investments(i) Unquoted 6,463.91 6,313.98 (ii) Quoted 4,629.08 -
(c) Deferred Tax Asset 1,178.32 980.13 (d) Long Term Loans and Advances
(i) To Subsidiary Companies - 4,179.57 (ii) To Others 6,247.50 4,979.35
(e) Other Non Current Assets 250.00 - (5) Current Assets
(a) Current Investments(i) Unquoted 7,727.23 5,258.04 (ii) Quoted 3,508.45 4,680.00
(b) Inventories 15.68 82.44 (c) Trade Receivables 6,038.29 7,212.48 (d) Cash and Bank Balances
(i) Cash & Cash Equivalents 1,251.35 1,311.90 (ii) Other Bank Balances 9,749.07 13.24
(e) Short Term Loans and Advances(i) To Subsidiary Companies 122.75 125.42 (ii) To Others 1,432.32 1,430.61
(f) Other Current Assets 1,727.45 1,505.36 Total of (4) & (5) 54,465.75 42,970.54
As per our report on the Abridged Financial Statements of even date.
For S.R. Batliboi & Co. LLP For and on behalf of the Board of Directors of ICAI Firm Registration Number: 301003E Sasken Communication Technologies Limited Chartered Accountants
per Navin Agrawal Rajiv C. Mody Neeta S. Revankar Partner Chairman and Managing Director Whole Time Director &Membership No.: 56102 DIN: 00092037 Chief Financial Officer DIN: 00145580
Place : Bengaluru S. Prasad Date : April 23, 2015 Company Secretary

65
Notes to Abridged Financial Statements form an integral part of Abridged Financial Statements.
Abridged Statement of Profit and Loss
Amount in ` lakhs
For the Year EndedMarch 31, 2015
For the Year EndedMarch 31, 2014
I. Income
Revenue from Operations:
(a) Software Products 332.83 309.71
(b) Software Services 34,343.55 35,083.49
Net revenue from Operations 34,676.38 35,393.20
II. Other Income 2,443.32 6,067.34
III. Total Income (I + II) 37,119.70 41,460.54
IV. Expenditure
(a) (Increase) / Decrease of Work - in - Progress 66.76 84.70
(b) Employee Benefits Expense 25,860.27 23,928.77
(c) Depreciation and Amortization Expense 1,039.23 953.32
(d) Other Expenses 6,486.80 7,863.40
Total Expenditure (a to d) 33,453.06 32,830.19
V. Profit Before Exceptional Item and Tax (III - IV) 3,666.64 8,630.35
VI. Exceptional Item
(a) Revenue and interest from litigated items 26,752.99 -
(b) Employee related payments (1,500.00) -
(c) Diminution of investment in subsidiaries (3,536.89) (1,197.39)
Total (a to c) 21,716.10 (1,197.39)
VII. Profit Before Tax (V - VI) 25,382.74 7,432.96
VIII. Provision for Taxation
(a) Current Tax 9,683.41 1,754.09
(b) Deferred Tax (credit) (179.71) (63.31)
(c) Minimum Alternate Tax Credit entitlement - (50.95)
Total (a to c) 9,503.70 1,639.83
IX. Profit After Tax (VII - VIII) 15,879.04 5,793.13
X. Earning Per Share
Earnings Per Equity Share (EPS) in Rupees (Equity Share par value `10 each)
Before Exceptional Items
(a) Basic 12.89 33.09
(b) Diluted 12.88 32.87
After Exceptional Items
(a) Basic 74.52 27.42
(b) Diluted 74.44 27.24
Weighted Average Number of Equity Shares used in computation of
(a) Basic EPS 2,13,08,543 2,11,25,993
(b) Diluted EPS 2,13,31,249 2,12,67,657
As per our report on the Abridged Financial Statements of even date.
For S.R. Batliboi & Co. LLP For and on behalf of the Board of Directors of ICAI Firm Registration Number: 301003E Sasken Communication Technologies Limited Chartered Accountants
per Navin Agrawal Rajiv C. Mody Neeta S. Revankar Partner Chairman and Managing Director Whole Time Director &Membership No.: 56102 DIN: 00092037 Chief Financial Officer DIN: 00145580
Place : Bengaluru S. Prasad Date : April 23, 2015 Company Secretary
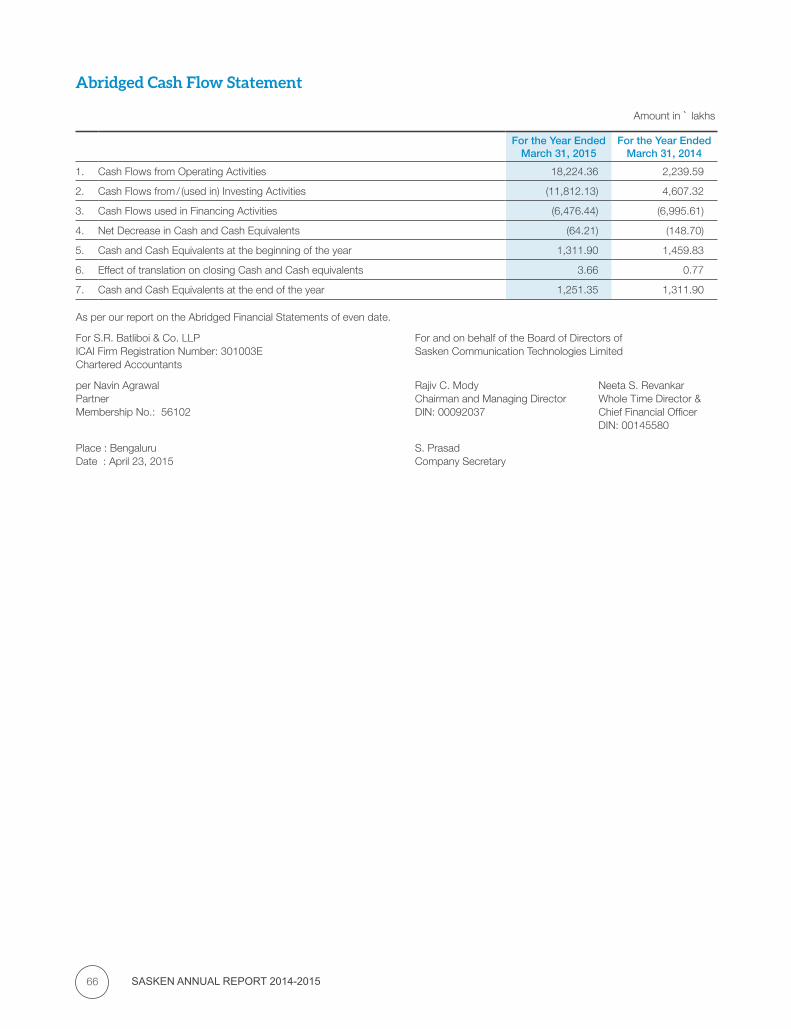
SASKEN ANNUAL REPORT 2014-201566
Abridged Cash Flow Statement
Amount in ` lakhs
For the Year EndedMarch 31, 2015
For the Year EndedMarch 31, 2014
1. Cash Flows from Operating Activities 18,224.36 2,239.59
2. Cash Flows from / (used in) Investing Activities (11,812.13) 4,607.32
3. Cash Flows used in Financing Activities (6,476.44) (6,995.61)
4. Net Decrease in Cash and Cash Equivalents (64.21) (148.70)
5. Cash and Cash Equivalents at the beginning of the year 1,311.90 1,459.83
6. Effect of translation on closing Cash and Cash equivalents 3.66 0.77
7. Cash and Cash Equivalents at the end of the year 1,251.35 1,311.90
As per our report on the Abridged Financial Statements of even date.
For S.R. Batliboi & Co. LLP For and on behalf of the Board of Directors of ICAI Firm Registration Number: 301003E Sasken Communication Technologies Limited Chartered Accountants
per Navin Agrawal Rajiv C. Mody Neeta S. Revankar Partner Chairman and Managing Director Whole Time Director &Membership No.: 56102 DIN: 00092037 Chief Financial Officer DIN: 00145580
Place : Bengaluru S. Prasad Date : April 23, 2015 Company Secretary
67
Notes to Abridged Financial Statements
1. Description of Business
Sasken Communication Technologies Limited (“Sasken” or “the Company”) is a leader in providing Engineering R&D and Productized IT services to global Tier - 1 customers in the Communications & Devices, Retail, Insurance and Independent Software space. Sasken’s deep domain knowledge and comprehensive suite of services have helped global leaders in verticals such as Semiconductors, Consumer Electronics, Smart Devices, Automotive Electronics, Enterprises and Network Equipment maintain market leadership. In the Retail, Insurance and Independent Software Vendor verticals, Sasken enables customers to rapidly re - architect their suite of IT Application and Infrastructure.
Established in 1989, Sasken has its headquarter in Bengaluru and employs over 2,000 people, operating from state - of - the - art centers in Bengaluru, Pune, Chennai & Hyderabad (India), Kaustinen and Tampere (Finland), Beijing (China), Tokyo (Japan), Greater London (UK), California, Massachusetts, New Jersey and Texas (USA), Bochum (Germany) and Seoul (South Korea). The equity shares of Sasken have been listed on the National Stock Exchange of India Ltd., and BSE Ltd., since its initial public offering in 2005.
2. Basis for Preparation
The abridged financial statements have been prepared in accordance with the requirements of sub - Section (1) of Section 136 of the Companies Act, 2013 and Rule 10 of Companies (Accounts) Rules, 2014. These abridged financial statements have been prepared on the basis of the complete set of financial statements for the year ended March 31, 2015. The notes number in the brackets “[ ]” are as they appear in the complete set of financial statements.
The complete set of financial statements have been prepared to comply in all material respects with the Accounting Standards notified under Section 133 of the Companies Act, 2013, read with Rule 7 of the Companies (Accounts) Rules, 2014). The financial statements have been prepared under the historical cost convention on an accrual basis, except in case of certain financial instruments which are measured at fair values and in case of assets for which impairment is made and revaluation is carried out. The accounting policies have been consistently applied by the Company and are consistent with those used during the previous year, other than those disclosed.
Note: - Complete Balance Sheet, Statement of Profit and Loss, other statements and notes thereto prepared as per the requirements of Schedule III to the Companies Act, 2013 are available at the Company’s website www.sasken.com.
3. Investments in Subsidiaries and Joint Ventures
(a) Sasken has a 46.29% (March 31, 2014, 46.29%) interest in a joint venture company called ConnectM Technology Solutions Pvt. Ltd. (“ConnectM”), incorporated in India, which focuses on end - to - end cycle development & sustenance to the Transportation, Industrial, Utilities and Enterprise markets enabled by Machine - to - Machine (M2M) communications. As at March 31, 2015, the Company has invested `1,796.24 lakhs ( March 31, 2014 `1,796.24 lakhs) in ConnectM. ConnectM has incurred losses since the date of incorporation. The Company has evaluated its investment in the Joint Venture for the purpose of determination of potential diminution in value, and based on such evaluation and determination, the Company has recognised a provision for diminution in the value of investment in ConnectM as at March 31, 2015 amounting to `1,796.24 lakhs (March 31, 2014 `1,796.24 lakhs). [Note 25 (a) of main financial statements].
(b) Sasken has a 50% interest in a joint venture company called TACO Sasken Automotive Electronics Limited (formerly known as TACO Sasken Automotive Electronics Private Limited) (“TSAE”) in Pune. The shareholders of TSAE have resolved that the company be wound up voluntarily. Requisite documents have been filed with the Registrar of Companies. Considering the closure of operations of TSAE, the Company has made full provision for diminution in the value of investments in TSAE amounting to `767.84 lakhs as on March 31, 2015 (March 31, 2014 `767.84 lakhs). [Note 25 (b) of main financial statements].
(c) The Company has evaluated its investment in Sasken Finland Oy and Sasken Communication Technologies Mexico S. A. de C. V. for the purpose of determination of potential diminution in value of investment and based on such evaluation and determination, the Company has recognized a further provision for diminution in the value of investment for the year ended March 31, 2015 amounting to ̀ 3,360.14 lakhs (March 31, 2014 Nil) and ̀ 176.75 lakhs (March 31, 2014 Nil) respectively. [Note 25 (c) of main financial statements].
(d) The Company has subscribed to 2,94,56,521 shares of Common Stock, USD 0.01 par value of Sasken Inc. at a price of USD 0.23 per share and paid the aggregate amount of USD 67,74,999.83 by the conversion of the existing debt owed by Sasken Inc. [Note 25(d) of main financial statements].
4. Capital and other commitments [Note 26 of main financial statements]
(a) Estimated amount of contracts remaining to be executed on capital account (net of advances) amounted to `28.21 lakhs (As at March 31, 2014 `15.83 lakhs).
(b) The Company enters into foreign exchange forward contracts and option contracts to hedge its net foreign currency receivables position including its future receivables. As per the current policy of the Company, the Company takes foreign exchange forward contracts for currencies primarily denominated in the US Dollar and Euro. The Company currently does not have a foreign currency hedge in respect of its investment in subsidiaries outside India.
SASKEN ANNUAL REPORT 2014-201568
Notes to Abridged Financial Statements (Contd.)
The details of outstanding foreign exchange forward contracts entered by the Company and outstanding as on the Balance Sheet date are as under:
Foreign Currency Hedged
Type of Contract
As at March 31, 2015 As at March 31, 2014
Amount (In Foreign
Currency lakhs)
Avg. Forward ExchangeRate (`)
Amount (In Foreign
Currency lakhs)
Avg. Forward ExchangeRate (`)
US Dollar (USD) Sell 149.49 65.59 125.98 63.91
Euro (EUR) Sell 24.14 80.08 21.01 88.83
The Company has also taken European style option contracts where by it has option to sell USD Nil (As at March 31, 2014 USD 13.68 lakhs) and EUR 2.00 lakhs at an average strike price ranging between `71.00 and `81.00, with maturity dates upto Dec 2015 (As at March 31,2014 EUR Nil ).
(c) The Company has operating leases for office premises that are (a) renewable on a periodic basis and are cancellable by giving a notice period ranging from 1 month to 6 months and (b) renewable on a periodic basis and are non - cancellable for specified periods under arrangements. Rent escalation clauses vary from contract to contract, ranging from 0% to 15%. There are no restrictions imposed by the lease arrangements. There are no sub leases. [Note 42 of main financial statements]
Amount in ` lakhs
ParticularsYear Ended
March 31, 2015Year Ended
March 31, 2014
Rent expenses included in Statement of Profit and Loss towards operating leases 587.58 669.38
Future minimum lease obligation under non - cancellable lease contracts amounts to: Amount in ` lakhs
ParticularsAs at
March 31, 2015As at
March 31, 2014
Due within one year 54.36 245.78
Due between one to five years 20.00 31.90
Due more than five years - -
(d) Contingent Liabilities [Note 27 of main financial statements] Amount in ` lakhs
ParticularsAs at
March 31, 2015As at
March 31, 2014
Bank Guarantees 8.96 10.56
Income taxes* (matters pertaining to disputes on tax holiday benefits, transfer pricing and disallowance of certain expenses claimed by the Company)
3,534.60 6,381.29
Indirect taxes* (includes matters pertaining to disputes on VAT / sales tax and service tax)
5,048.23 5,048.23
* The Company is contesting the demands and based on expert advice, the management believes that its position will likely be upheld in the various appellate authorities /courts. The management believes that the ultimate outcome of this proceeding will not be adverse and such demands have been disclosed as contingent liabilities.
There are certain claims made against the Company by an investee company, which are a subject matter of arbitration proceedings. In the view of the management, such claims are frivolous and are not tenable. No provision has been made for such claims pending completion of legal proceedings as the amount of claims are currently not ascertainable.
5. Details of Cash and Bank balances [Note 17 of main financial statements] Amount in ` lakhs
Particulars As at
March 31, 2015As at
March 31, 2014
Cash on hand 0.81 0.60
Balances with banks - Current accounts 1,169.66 1,240.02
Balances with banks - Unpaid dividend accounts 80.88 71.28
1,251.35 1,311.90
Other bank balances - bank deposits 9,749.07 13.24
Total 11,000.42 1,325.14
69
Notes to Abridged Financial Statements (Contd.)
6. The Ministry of Micro, Small and Medium Enterprises has issued an office memorandum dated August 26, 2008 which recommends that the Micro and Small Enterprises should mention in their correspondence with its customers the Entrepreneurs Memorandum Number as allocated after filing of the Memorandum in accordance with the ‘Micro, Small and Medium Enterprises Development Act, 2006 (‘the Act’). Accordingly, the disclosure in respect of the amounts payable to such enterprises has been made in the financial statements based on information received and available with the Company. [Note 6 of main financial statements].
7. Related Party Disclosures [Note 37 of main financial statements]
(a) Following is the list of subsidiary / joint venture companies where control exists:
Particulars% of holding as at
March 31, 2015 March 31, 2014
Subsidiaries
Sasken Network Engineering Limited (‘SNEL’) 100.00% 100.00%
Sasken Network Solutions Inc., USA (‘SNSI’)1 - 100.00%
Sasken Communication Technologies Mexico, S.A.de C.V (‘Sasken Mexico’) 100.00% 100.00%
Sasken Communication Technologies (Shanghai) Co. Ltd. (‘Sasken China’) 100.00% 100.00%
Sasken Finland Oy (‘Sasken Finland’)2 100.00% 100.00%
Sasken Inc., USA (‘Sasken Inc’) 100.00% 100.00%
Joint Ventures
TACO Sasken Automotive Electronics Limited (‘TSAE’) 50.00% 50.00%
ConnectM Technology Solutions Pvt. Ltd (‘ConnectM’) 46.29% 46.29%1 100% subsidiary of Sasken Network Engineering Limited which ceases to exist on liquidation during the year ended March 31,
2015.2 During the financial year 2012 - 13, an application was made to Finland Trade Registry for merger of Sasken Communication
Technologies Oy (wholly owned subsidiary of the Company) with Sasken Finland Oy (wholly owned subsidiary of Sasken Communication Technologies Oy). The Finland Trade Registry has approved the merger effective April 01, 2013. Pursuant to the merger, 20,197 shares of 1 eur each fully paid up in Sasken Finland Oy have been allotted to the Company in lieu of its holding in Sasken Communication Technologies Oy, Finland.
(b) Following is the list of Key Managerial Personnel
Name of the related party Relationship
Rajiv C. Mody Chairman, Managing Director and Chief Executive Officer
Krishna J. Jhaveri Whole Time Director
G. Venkatesh Non Executive Director*
Neeta S. Revankar Whole Time Director and Chief Financial Officer
Anjan Lahiri (upto September 23, 2014) Whole Time Director and Chief Executive Officer
* Dr. G. Venkatesh, ceased to be a Whole Time Director as on January 19, 2015 and continues in the Board as a Non - Executive Director.
(c) Remuneration paid to Key Managerial PersonnelAmount in ` lakhs
Name of the related partyYear Ended
March 31, 2015Year Ended
March 31, 2014
Rajiv C. Mody 323.25 127.10
Krishna Jhaveri 28.68 40.35
G. Venkatesh 60.55 44.31
Neeta S. Revankar 179.55 88.58
Anjan Lahiri 50.46 61.83
Total 642.49 362.17
The remuneration to the key managerial personnel does not include the provisions made for gratuity and leave benefits, as they are determined on an actuarial basis for the company as a whole.
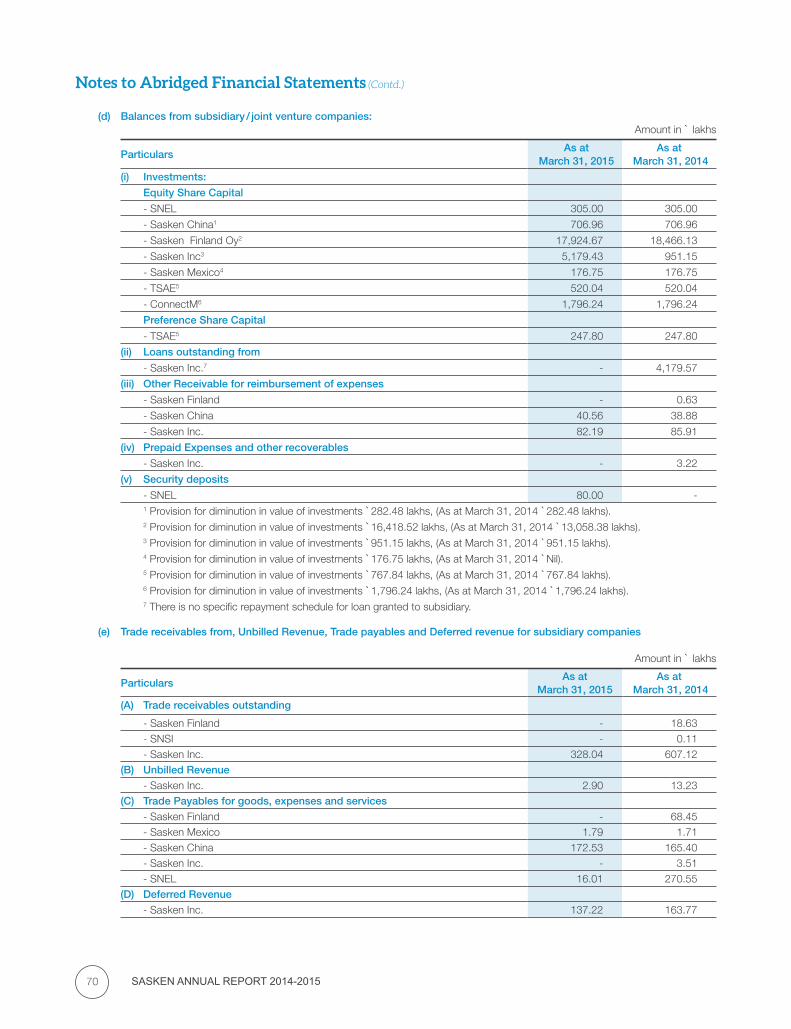
SASKEN ANNUAL REPORT 2014-201570
Notes to Abridged Financial Statements (Contd.)
(d) Balances from subsidiary / joint venture companies:Amount in ` lakhs
Particulars As at
March 31, 2015As at
March 31, 2014
(i) Investments:
Equity Share Capital
- SNEL 305.00 305.00
- Sasken China1 706.96 706.96
- Sasken Finland Oy2 17,924.67 18,466.13
- Sasken Inc3 5,179.43 951.15
- Sasken Mexico4 176.75 176.75
- TSAE5 520.04 520.04
- ConnectM6 1,796.24 1,796.24
Preference Share Capital
- TSAE5 247.80 247.80
(ii) Loans outstanding from
- Sasken Inc.7 - 4,179.57
(iii) Other Receivable for reimbursement of expenses
- Sasken Finland - 0.63
- Sasken China 40.56 38.88
- Sasken Inc. 82.19 85.91
(iv) Prepaid Expenses and other recoverables
- Sasken Inc. - 3.22
(v) Security deposits
- SNEL 80.00 - 1 Provision for diminution in value of investments `282.48 lakhs, (As at March 31, 2014 `282.48 lakhs).2 Provision for diminution in value of investments `16,418.52 lakhs, (As at March 31, 2014 `13,058.38 lakhs).3 Provision for diminution in value of investments `951.15 lakhs, (As at March 31, 2014 `951.15 lakhs).4 Provision for diminution in value of investments `176.75 lakhs, (As at March 31, 2014 `Nil).5 Provision for diminution in value of investments `767.84 lakhs, (As at March 31, 2014 `767.84 lakhs).6 Provision for diminution in value of investments `1,796.24 lakhs, (As at March 31, 2014 `1,796.24 lakhs).7 There is no specific repayment schedule for loan granted to subsidiary.
(e) Trade receivables from, Unbilled Revenue, Trade payables and Deferred revenue for subsidiary companies
Amount in ` lakhs
ParticularsAs at
March 31, 2015As at
March 31, 2014(A) Trade receivables outstanding
- Sasken Finland - 18.63 - SNSI - 0.11 - Sasken Inc. 328.04 607.12
(B) Unbilled Revenue
- Sasken Inc. 2.90 13.23 (C) Trade Payables for goods, expenses and services
- Sasken Finland - 68.45 - Sasken Mexico 1.79 1.71 - Sasken China 172.53 165.40 - Sasken Inc. - 3.51 - SNEL 16.01 270.55
(D) Deferred Revenue
- Sasken Inc. 137.22 163.77

71
Notes to Abridged Financial Statements (Contd.)
(f) The following table summarizes the transactions of the Company with subsidiary companies / joint ventures:
Amount in ` lakhs
ParticularsYear Ended
March 31, 2015Year Ended
March 31, 2014
(A) Cross charges for common administrative services, net
- SNEL 147.60 56.92
- Sasken Finland 16.05 8.68
- Sasken Inc. 15.45 21.74
- SNSI - (7.95)
(B) Software Development Services rendered to
- Sasken Finland 40.01 235.56
- Sasken Inc. 770.04 1,587.04
(C) Selling, Marketing & Administrative expenses recovery
- Sasken Inc. - 4.31
(D) Network Support Services (IT Enabled) procured from
- SNEL 186.62 570.20
(E) Software Development Services procured from
- Sasken Finland - 78.14
- Sasken China - (35.08)
(F) Interest on Loan charged to
- Sasken Inc. 148.08 141.71
(G) Dividend Received from
- Sasken Mexico - 815.82
- Sasken Finland 1,184.89 2,571.72
- SNEL - 620.68
(H) Loans given during the year
- Sasken Inc. 6,307.79 1,117.76
(I) Loans repaid during the year
- Sasken Inc. 6,462.07 -
(J) Investments in Subsidiaries during the year
- Sasken Inc* 4,228.28 -
(K) Assets / Advances acquired
- SNSI - 27.68
- Sasken Japan** - 131.15
* Loan given in prior years was converted into equity during the year.** Sasken Japan KK, a wholly owned subsidiary in Japan was liquidated on November 18, 2013.
8. Segment Reporting [Note 38 of main financial statements]
The business segmental information is given based on Software Services and Software Products offerings.
(a) Business Segment Information
Segmental Balance Sheet Amount in ` lakhs
ParticularsAs at
March 31, 2015As at
March 31, 2014
Segment Assets
Software Services 8,142.18 8,872.51
Software Products 30.89 1,022.74
Corporate and Others (Unallocated) 46,292.68 33,075.29
Total 54,465.75 42,970.54
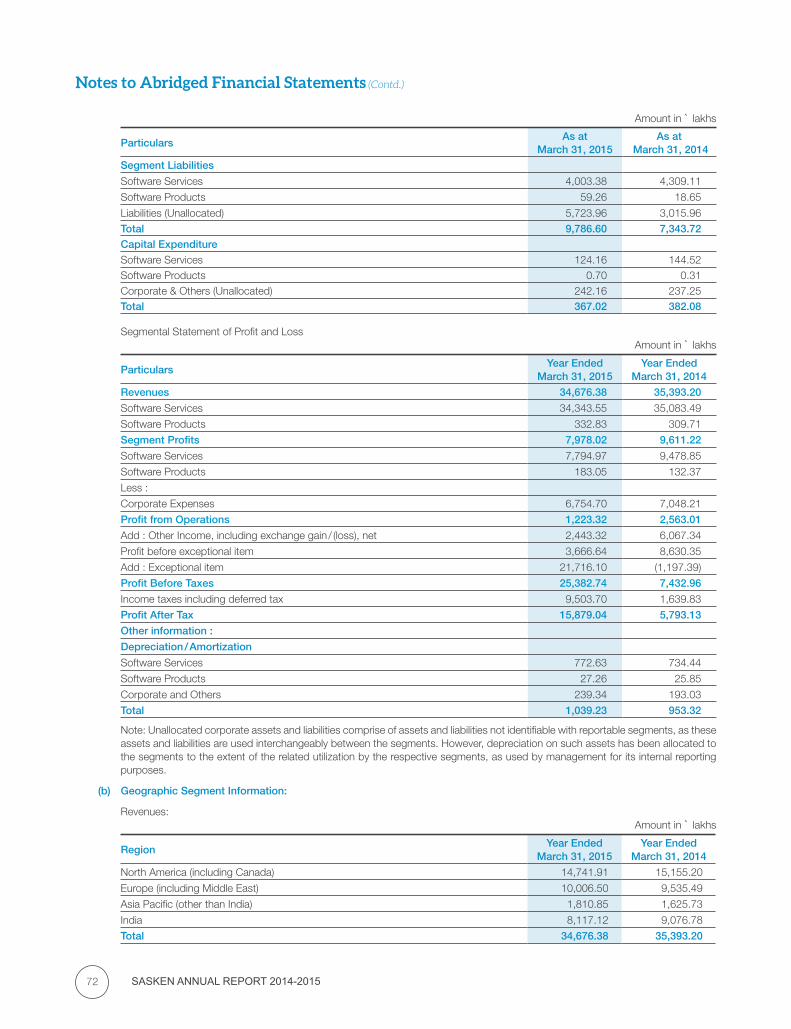
SASKEN ANNUAL REPORT 2014-201572
Notes to Abridged Financial Statements (Contd.)
Amount in ` lakhs
ParticularsAs at
March 31, 2015As at
March 31, 2014
Segment Liabilities
Software Services 4,003.38 4,309.11
Software Products 59.26 18.65
Liabilities (Unallocated) 5,723.96 3,015.96 Total 9,786.60 7,343.72 Capital Expenditure
Software Services 124.16 144.52 Software Products 0.70 0.31 Corporate & Others (Unallocated) 242.16 237.25 Total 367.02 382.08
Segmental Statement of Profit and LossAmount in ` lakhs
ParticularsYear Ended
March 31, 2015Year Ended
March 31, 2014
Revenues 34,676.38 35,393.20
Software Services 34,343.55 35,083.49
Software Products 332.83 309.71
Segment Profits 7,978.02 9,611.22
Software Services 7,794.97 9,478.85
Software Products 183.05 132.37
Less :
Corporate Expenses 6,754.70 7,048.21
Profit from Operations 1,223.32 2,563.01
Add : Other Income, including exchange gain / (loss), net 2,443.32 6,067.34
Profit before exceptional item 3,666.64 8,630.35
Add : Exceptional item 21,716.10 (1,197.39)
Profit Before Taxes 25,382.74 7,432.96
Income taxes including deferred tax 9,503.70 1,639.83
Profit After Tax 15,879.04 5,793.13
Other information :
Depreciation / Amortization
Software Services 772.63 734.44
Software Products 27.26 25.85
Corporate and Others 239.34 193.03
Total 1,039.23 953.32
Note: Unallocated corporate assets and liabilities comprise of assets and liabilities not identifiable with reportable segments, as these assets and liabilities are used interchangeably between the segments. However, depreciation on such assets has been allocated to the segments to the extent of the related utilization by the respective segments, as used by management for its internal reporting purposes.
(b) Geographic Segment Information:
Revenues:Amount in ` lakhs
RegionYear Ended
March 31, 2015Year Ended
March 31, 2014
North America (including Canada) 14,741.91 15,155.20
Europe (including Middle East) 10,006.50 9,535.49
Asia Pacific (other than India) 1,810.85 1,625.73
India 8,117.12 9,076.78
Total 34,676.38 35,393.20

73
Notes to Abridged Financial Statements (Contd.)
Assets:
Trade receivables & Unbilled RevenueAmount in ` lakhs
RegionAs at
March 31, 2015As at
March 31, 2014North America (including Canada) 2,493.07 3,745.28Europe (including Middle East) 2,610.75 2,261.08Asia Pacific (other than India) 612.60 1,270.10India 1,811.65 1,441.38Total 7,528.07 8,717.84
Note: Other than above, rest of the assets are primarily located in India.
9. Earnings Per Share (EPS) [Note 39 of main financial statements]
Reconciliation of the net income and number of shares considered in the computation of basic and diluted EPS is given below:
Amount in ` lakhs (except share data)
ParticularsYear Ended
March 31, 2015Year Ended
March 31, 2014Profit for computation of basic and diluted EPS 15,879.04 5,793.13 Weighted average number of shares considered for basic EPS 2,13,08,543 2,11,25,993 Add: Effect of stock options / warrants 22,706 1,41,664 Weighted average number of shares considered for diluted EPS 2,13,31,249 2,12,67,657
10. Based on the Special Resolution passed by the Company on November 8, 2013, the Company allotted on preferential basis 12,00,000 convertible warrants, on November 18, 2013, to Ms. Ira Bhaduri in her capacity as Trustee of Lahiri Family Trust, of which Mr.Anjan Lahiri, former Whole Time Director and CEO of the Company, is the Managing Trustee. The allottee was entitled to one equity share of `10 each of the Company for each such warrant at a price of `120.25 each and 25% of the price amounting to `360.75 lakhs was received as application money. The allottee exercised 10,40,000 options and paid `937.95 lakhs towards the balance 75% of the application money and as the proposed allotment /conversion was not to be proceeded with, this amount of `937.95 lakhs has been refunded and the stock exchanges have been informed about the non - conversion /allotment.
The Company had sought informal guidance from Securities and Exchange Board of India (“SEBI”) on whether the 25% should be forfeited or can be refunded and if so, the procedural formalities in connection with that. SEBI vide its letter dated February 23, 2015 expressed its inability to issue any guidance in the matter. The Company was advised that since SEBI has not expressed any opinion despite having placed all the relevant facts and materials, the Company could proceed to effect the refund in its entirety. Accordingly the Board at its meeting held on April 13, 2015 approved refund of the application amount and the interest accrued and the whole amount was paid on April 14, 2015. [Note 33 of main financial statements].
11. During the earlier years, the Company had recognized royalty income of USD 1.67 million (`880.52 lakhs) in respect of Software Product License granted to a non - Indian licensee, who had purportedly claimed non - usage of the licensed IPR after initial acceptance, which was being contested by the Company. On June 27, 2014, an award was passed in the Company’s favour, as per which the non - India licensee was directed to pay USD 31.70 million within 30 days, towards royalties and interest on unpaid royalties and the non - India licensee was also directed to continue to provide royalty reports and pay the contracted royalties on an ongoing basis.
During the year, the Company received a sum of USD 45.31 million towards royalties upto December 2014 and interest on royalties. Of the above, USD 1.67 million was adjusted towards outstanding trade receivables and the balance amount of USD 43.64 million (equivalent to `26,752.99 lakhs) was recognized as exceptional revenue. Further, in relation to the above, a provision towards employee payments amounting to ̀ 1,500.00 lakhs was recorded as an exceptional item. During the year ended March 31, 2015, another arbitration proceeding has been initiated between the Party and the Company and both the parties have preferred certain claims, the amount of which is unascertainable, at present. [Note 41 of main financial statements].
12. During the year, the Company has reassessed the useful life of computers. Accordingly, the written down value of computers as at April 01, 2014, is depreciated on a prospective basis over the remaining estimated useful life. This change in accounting estimate has resulted in increase in depreciation expense for the year ended March 31, 2015 by `68.29 lakhs. Further, in case of computers whose useful life on such reassessment had expired as of April 01, 2014, net book value of assets of `35.89 lakhs (net of deferred tax of `18.48 lakhs) is adjusted against the surplus in the Statement of Profit and Loss as of April 01, 2014. [Note 40 of main financial statements].
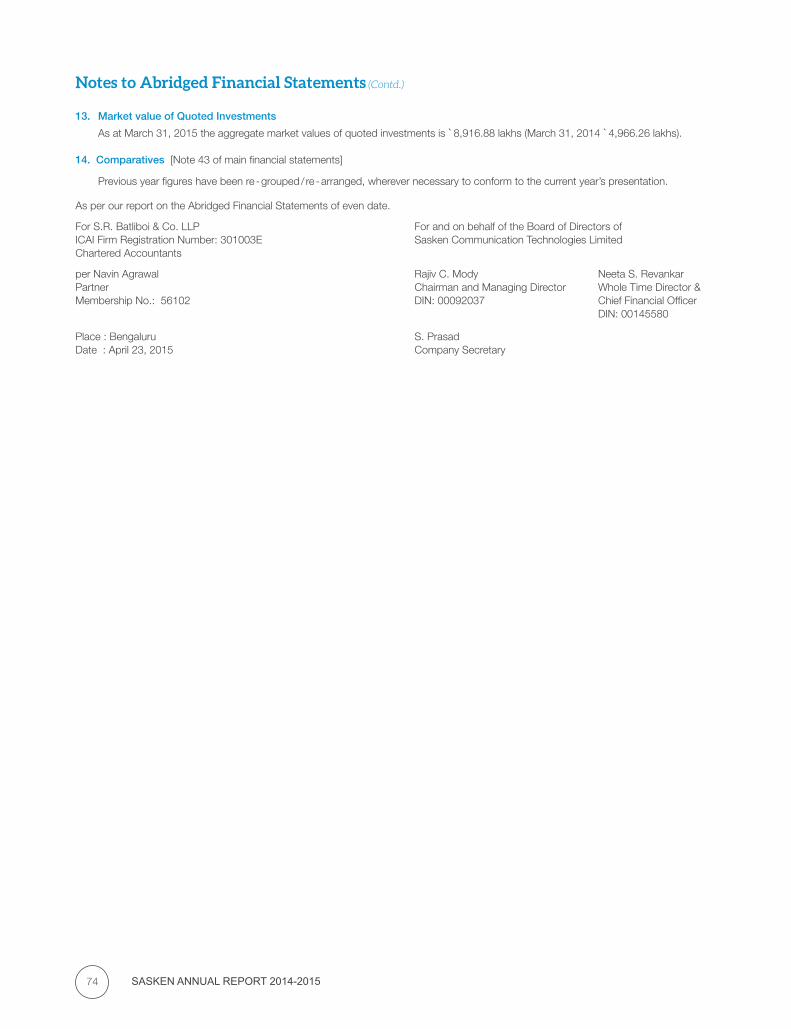
SASKEN ANNUAL REPORT 2014-201574
Notes to Abridged Financial Statements (Contd.)
13. Market value of Quoted Investments
As at March 31, 2015 the aggregate market values of quoted investments is `8,916.88 lakhs (March 31, 2014 `4,966.26 lakhs). 14. Comparatives [Note 43 of main financial statements]
Previous year figures have been re - grouped / re - arranged, wherever necessary to conform to the current year’s presentation.
As per our report on the Abridged Financial Statements of even date.
For S.R. Batliboi & Co. LLP For and on behalf of the Board of Directors of ICAI Firm Registration Number: 301003E Sasken Communication Technologies Limited Chartered Accountants
per Navin Agrawal Rajiv C. Mody Neeta S. Revankar Partner Chairman and Managing Director Whole Time Director &Membership No.: 56102 DIN: 00092037 Chief Financial Officer DIN: 00145580
Place : Bengaluru S. Prasad Date : April 23, 2015 Company Secretary
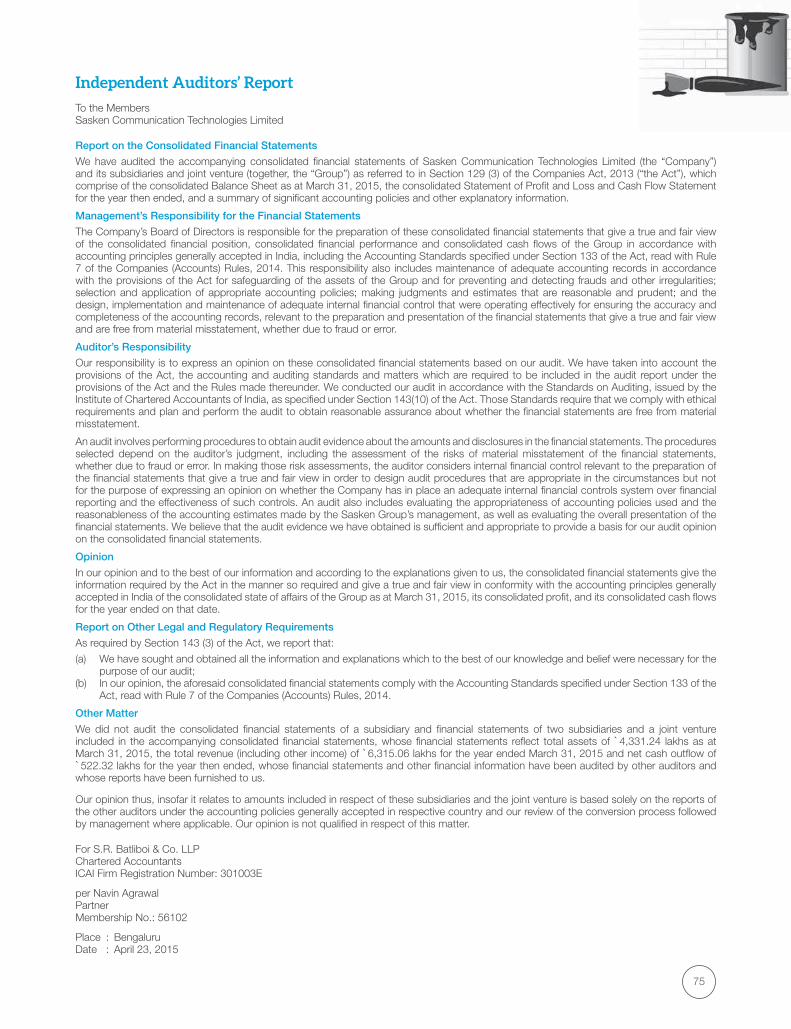
75
Independent Auditors’ Report
To the MembersSasken Communication Technologies Limited
Report on the Consolidated Financial Statements
We have audited the accompanying consolidated financial statements of Sasken Communication Technologies Limited (the “Company”) and its subsidiaries and joint venture (together, the “Group”) as referred to in Section 129 (3) of the Companies Act, 2013 (“the Act”), which comprise of the consolidated Balance Sheet as at March 31, 2015, the consolidated Statement of Profit and Loss and Cash Flow Statement for the year then ended, and a summary of significant accounting policies and other explanatory information.
Management’s Responsibility for the Financial Statements
The Company’s Board of Directors is responsible for the preparation of these consolidated financial statements that give a true and fair view of the consolidated financial position, consolidated financial performance and consolidated cash flows of the Group in accordance with accounting principles generally accepted in India, including the Accounting Standards specified under Section 133 of the Act, read with Rule 7 of the Companies (Accounts) Rules, 2014. This responsibility also includes maintenance of adequate accounting records in accordance with the provisions of the Act for safeguarding of the assets of the Group and for preventing and detecting frauds and other irregularities; selection and application of appropriate accounting policies; making judgments and estimates that are reasonable and prudent; and the design, implementation and maintenance of adequate internal financial control that were operating effectively for ensuring the accuracy and completeness of the accounting records, relevant to the preparation and presentation of the financial statements that give a true and fair view and are free from material misstatement, whether due to fraud or error.
Auditor’s Responsibility
Our responsibility is to express an opinion on these consolidated financial statements based on our audit. We have taken into account the provisions of the Act, the accounting and auditing standards and matters which are required to be included in the audit report under the provisions of the Act and the Rules made thereunder. We conducted our audit in accordance with the Standards on Auditing, issued by the Institute of Chartered Accountants of India, as specified under Section 143(10) of the Act. Those Standards require that we comply with ethical requirements and plan and perform the audit to obtain reasonable assurance about whether the financial statements are free from material misstatement.
An audit involves performing procedures to obtain audit evidence about the amounts and disclosures in the financial statements. The procedures selected depend on the auditor’s judgment, including the assessment of the risks of material misstatement of the financial statements, whether due to fraud or error. In making those risk assessments, the auditor considers internal financial control relevant to the preparation of the financial statements that give a true and fair view in order to design audit procedures that are appropriate in the circumstances but not for the purpose of expressing an opinion on whether the Company has in place an adequate internal financial controls system over financial reporting and the effectiveness of such controls. An audit also includes evaluating the appropriateness of accounting policies used and the reasonableness of the accounting estimates made by the Sasken Group’s management, as well as evaluating the overall presentation of the financial statements. We believe that the audit evidence we have obtained is sufficient and appropriate to provide a basis for our audit opinion on the consolidated financial statements.
Opinion
In our opinion and to the best of our information and according to the explanations given to us, the consolidated financial statements give the information required by the Act in the manner so required and give a true and fair view in conformity with the accounting principles generally accepted in India of the consolidated state of affairs of the Group as at March 31, 2015, its consolidated profit, and its consolidated cash flows for the year ended on that date.
Report on Other Legal and Regulatory Requirements
As required by Section 143 (3) of the Act, we report that:
(a) We have sought and obtained all the information and explanations which to the best of our knowledge and belief were necessary for the purpose of our audit;
(b) In our opinion, the aforesaid consolidated financial statements comply with the Accounting Standards specified under Section 133 of the Act, read with Rule 7 of the Companies (Accounts) Rules, 2014.
Other Matter
We did not audit the consolidated financial statements of a subsidiary and financial statements of two subsidiaries and a joint venture included in the accompanying consolidated financial statements, whose financial statements reflect total assets of `4,331.24 lakhs as at March 31, 2015, the total revenue (including other income) of `6,315.06 lakhs for the year ended March 31, 2015 and net cash outflow of `522.32 lakhs for the year then ended, whose financial statements and other financial information have been audited by other auditors and whose reports have been furnished to us.
Our opinion thus, insofar it relates to amounts included in respect of these subsidiaries and the joint venture is based solely on the reports of the other auditors under the accounting policies generally accepted in respective country and our review of the conversion process followed by management where applicable. Our opinion is not qualified in respect of this matter.
For S.R. Batliboi & Co. LLP Chartered AccountantsICAI Firm Registration Number: 301003E
per Navin AgrawalPartnerMembership No.: 56102
Place : Bengaluru Date : April 23, 2015

SASKEN ANNUAL REPORT 2014-201576
Consolidated Balance Sheet
NotesAs at
March 31, 2015As at
March 31, 2014EQUITY AND LIABILITIES 1. Shareholders’ Funds
(a) Share Capital 3 2,134.49 2,127.76 (b) Reserves and Surplus 4 42,559.71 38,269.66
(c) Money received against Share Warrants - 360.75 44,694.20 40,758.17
2. Non Current Liabilities (a) Long Term Provisions 5 690.91 770.97
3. Current Liabilities (a) Trade Payables 6 2,470.86 2,632.58
(b) Other Current Liabilities 7 2,099.40 1,695.39
(c) Short Term Provisions 8 5,939.51 3,925.16 10,509.77 8,253.13
Total 55,894.88 49,782.27
ASSETS 1. Non Current Assets
(a) Fixed Assets (net) 9
(i) Tangible Fixed Assets 9a 4,193.82 5,019.40
(ii) Intangible Assets 9b 50.98 7,666.53
(iii) Capital Work - in - Progress 1.43 0.17 4,246.23 12,686.10
(b) Non Current Investments 10 7,231.32 2,995.50
(c) Deferred Tax Assets 11 1,275.65 1,117.71
(d) Long Term Loans and Advances 12 6,771.42 5,707.26
(e) Other Non Current Assets 13 259.39 93.46 19,784.01 22,600.03
2. Current Assets
(a) Current Investments 14 12,283.75 10,355.46
(b) Inventories 15 44.95 209.39
(c) Trade Receivables 16 6,992.91 9,276.07
(d) Cash and Bank Balances 17 12,589.69 3,406.30
(e) Short Term Loans and Advances 18 1,650.02 1,795.44
(f) Other Current Assets 19 2,549.55 2,139.58
36,110.87 27,182.24 Total 55,894.88 49,782.27
Significant Accounting policies and Notes attached herein form an integral part of the Consolidated financial statements.
As per our report of even date.
For S.R. Batliboi & Co. LLP For and on behalf of the Board of Directors of ICAI Firm Registration Number: 301003E Sasken Communication Technologies Limited Chartered Accountants
per Navin Agrawal Rajiv C. Mody Neeta S. Revankar Partner Chairman and Managing Director Whole Time Director &Membership No.: 56102 DIN: 00092037 Chief Financial Officer DIN: 00145580
Place : Bengaluru S. Prasad Date : April 23, 2015 Company Secretary
Amount in ` lakhs
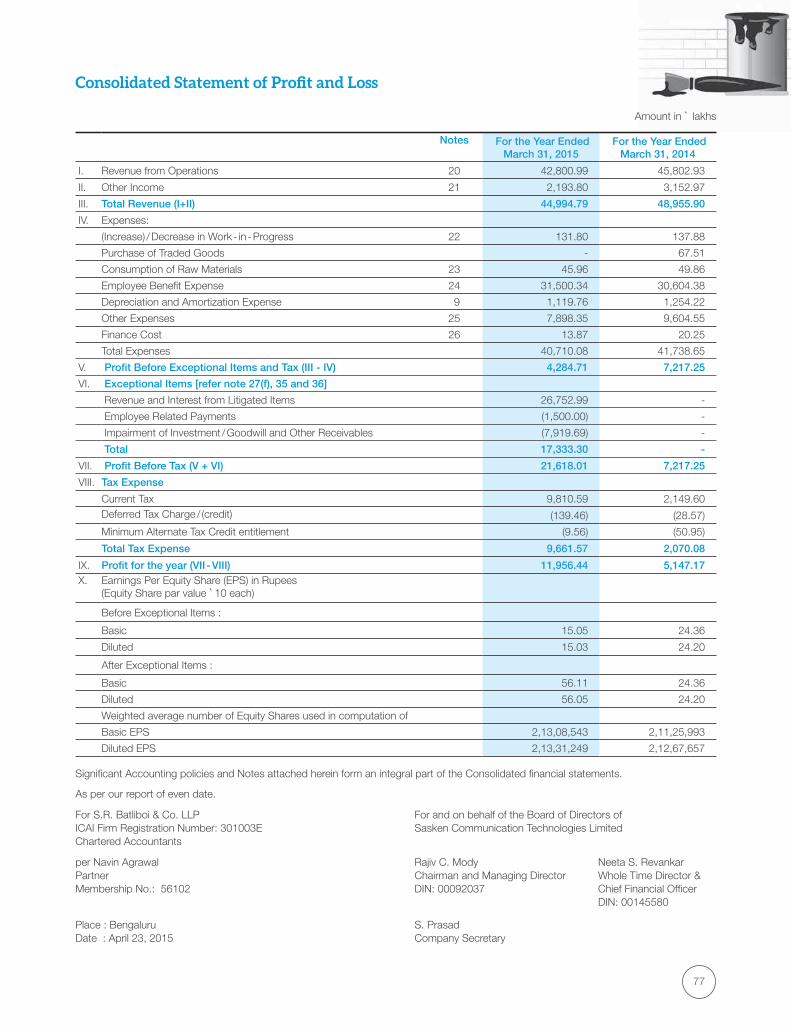
77
Consolidated Statement of Profit and Loss
Amount in ` lakhs
Notes For the Year Ended March 31, 2015
For the Year Ended March 31, 2014
I. Revenue from Operations 20 42,800.99 45,802.93
II. Other Income 21 2,193.80 3,152.97
III. Total Revenue (I+II) 44,994.79 48,955.90
IV. Expenses:
(Increase) / Decrease in Work - in - Progress 22 131.80 137.88
Purchase of Traded Goods - 67.51
Consumption of Raw Materials 23 45.96 49.86
Employee Benefit Expense 24 31,500.34 30,604.38
Depreciation and Amortization Expense 9 1,119.76 1,254.22
Other Expenses 25 7,898.35 9,604.55
Finance Cost 26 13.87 20.25
Total Expenses 40,710.08 41,738.65
V. Profit Before Exceptional Items and Tax (III - IV) 4,284.71 7,217.25
VI. Exceptional Items [refer note 27(f), 35 and 36]
Revenue and Interest from Litigated Items 26,752.99 -
Employee Related Payments (1,500.00) -
Impairment of Investment / Goodwill and Other Receivables (7,919.69) -
Total 17,333.30 -
VII. Profit Before Tax (V + VI) 21,618.01 7,217.25
VIII. Tax Expense
Current Tax 9,810.59 2,149.60 Deferred Tax Charge / (credit) (139.46) (28.57)
Minimum Alternate Tax Credit entitlement (9.56) (50.95)
Total Tax Expense 9,661.57 2,070.08
IX. Profit for the year (VII - VIII) 11,956.44 5,147.17 X. Earnings Per Equity Share (EPS) in Rupees
(Equity Share par value `10 each)
Before Exceptional Items :
Basic 15.05 24.36
Diluted 15.03 24.20
After Exceptional Items :
Basic 56.11 24.36
Diluted 56.05 24.20
Weighted average number of Equity Shares used in computation of
Basic EPS 2,13,08,543 2,11,25,993
Diluted EPS 2,13,31,249 2,12,67,657
Significant Accounting policies and Notes attached herein form an integral part of the Consolidated financial statements.
As per our report of even date.
For S.R. Batliboi & Co. LLP For and on behalf of the Board of Directors of ICAI Firm Registration Number: 301003E Sasken Communication Technologies Limited Chartered Accountants
per Navin Agrawal Rajiv C. Mody Neeta S. Revankar Partner Chairman and Managing Director Whole Time Director &Membership No.: 56102 DIN: 00092037 Chief Financial Officer DIN: 00145580
Place : Bengaluru S. Prasad Date : April 23, 2015 Company Secretary
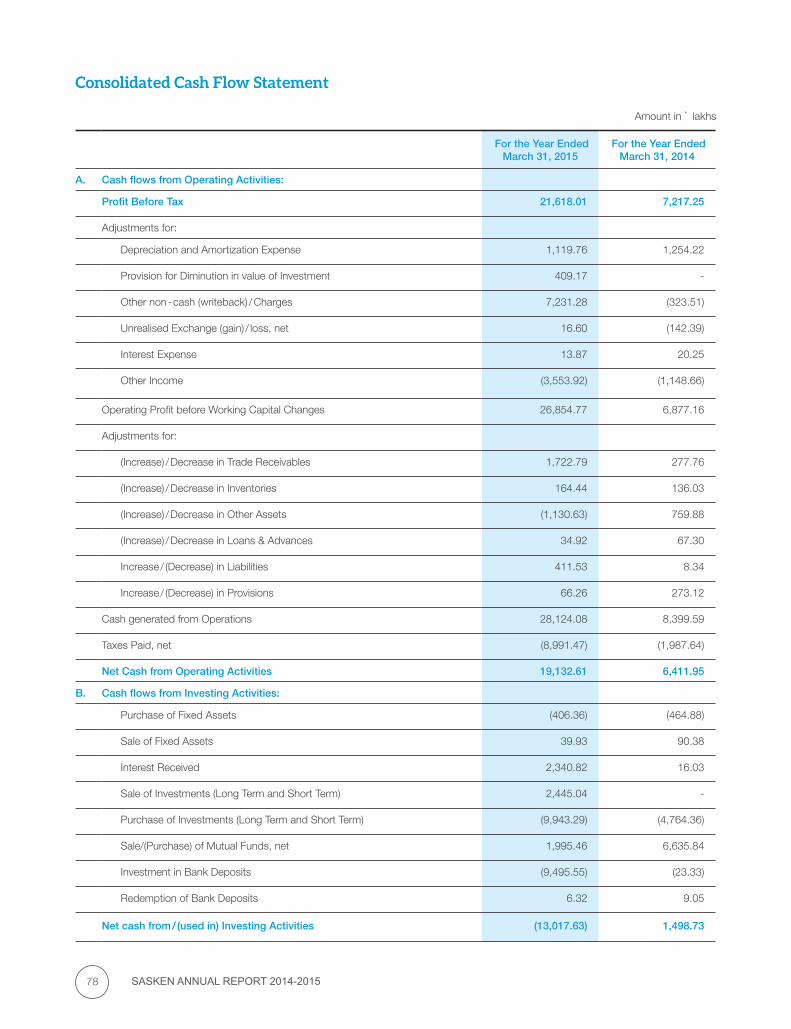
SASKEN ANNUAL REPORT 2014-201578
Consolidated Cash Flow Statement
For the Year Ended March 31, 2015
For the Year Ended March 31, 2014
A. Cash flows from Operating Activities:
Profit Before Tax 21,618.01 7,217.25
Adjustments for:
Depreciation and Amortization Expense 1,119.76 1,254.22
Provision for Diminution in value of Investment 409.17 -
Other non - cash (writeback) / Charges 7,231.28 (323.51)
Unrealised Exchange (gain) / loss, net 16.60 (142.39)
Interest Expense 13.87 20.25
Other Income (3,553.92) (1,148.66)
Operating Profit before Working Capital Changes 26,854.77 6,877.16
Adjustments for:
(Increase) / Decrease in Trade Receivables 1,722.79 277.76
(Increase) / Decrease in Inventories 164.44 136.03
(Increase) / Decrease in Other Assets (1,130.63) 759.88
(Increase) / Decrease in Loans & Advances 34.92 67.30
Increase / (Decrease) in Liabilities 411.53 8.34
Increase / (Decrease) in Provisions 66.26 273.12
Cash generated from Operations 28,124.08 8,399.59
Taxes Paid, net (8,991.47) (1,987.64)
Net Cash from Operating Activities 19,132.61 6,411.95
B. Cash flows from Investing Activities:
Purchase of Fixed Assets (406.36) (464.88)
Sale of Fixed Assets 39.93 90.38
Interest Received 2,340.82 16.03
Sale of Investments (Long Term and Short Term) 2,445.04 -
Purchase of Investments (Long Term and Short Term) (9,943.29) (4,764.36)
Sale/(Purchase) of Mutual Funds, net 1,995.46 6,635.84
Investment in Bank Deposits (9,495.55) (23.33)
Redemption of Bank Deposits 6.32 9.05
Net cash from / (used in) Investing Activities (13,017.63) 1,498.73
Amount in ` lakhs
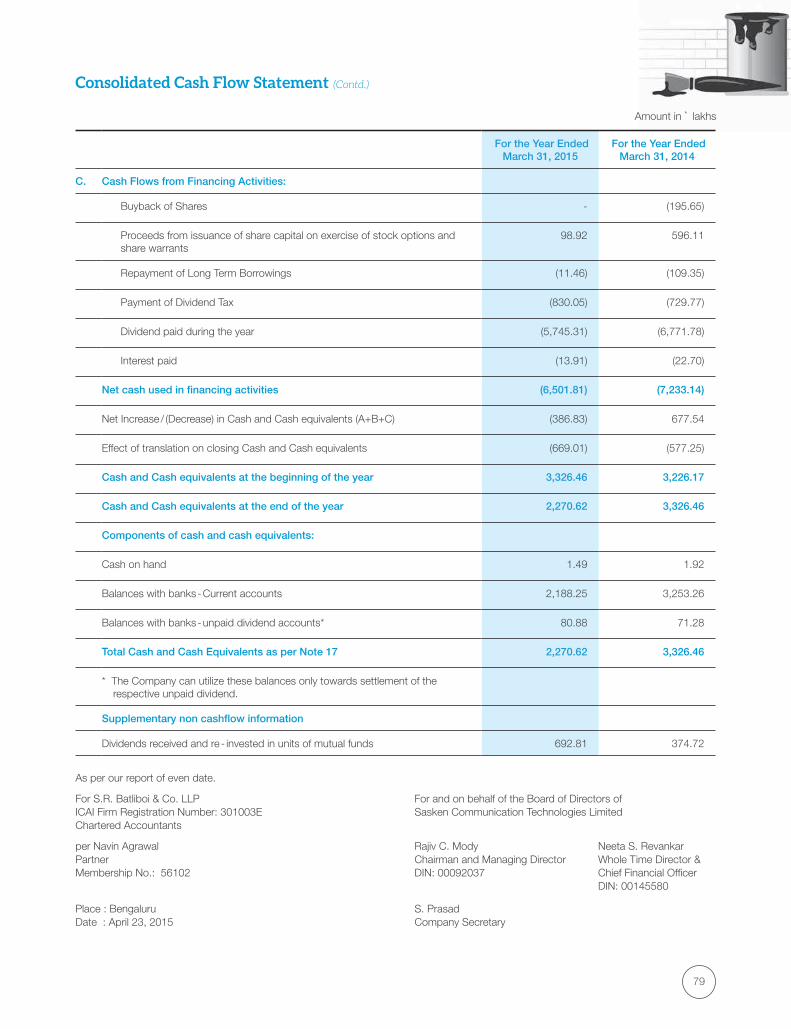
79
Consolidated Cash Flow Statement (Contd.)
Amount in ` lakhs
For the Year Ended March 31, 2015
For the Year Ended March 31, 2014
C. Cash Flows from Financing Activities:
Buyback of Shares - (195.65)
Proceeds from issuance of share capital on exercise of stock options and share warrants
98.92 596.11
Repayment of Long Term Borrowings (11.46) (109.35)
Payment of Dividend Tax (830.05) (729.77)
Dividend paid during the year (5,745.31) (6,771.78)
Interest paid (13.91) (22.70)
Net cash used in financing activities (6,501.81) (7,233.14)
Net Increase / (Decrease) in Cash and Cash equivalents (A+B+C) (386.83) 677.54
Effect of translation on closing Cash and Cash equivalents (669.01) (577.25)
Cash and Cash equivalents at the beginning of the year 3,326.46 3,226.17
Cash and Cash equivalents at the end of the year 2,270.62 3,326.46
Components of cash and cash equivalents:
Cash on hand 1.49 1.92
Balances with banks - Current accounts 2,188.25 3,253.26
Balances with banks - unpaid dividend accounts* 80.88 71.28
Total Cash and Cash Equivalents as per Note 17 2,270.62 3,326.46
* The Company can utilize these balances only towards settlement of the respective unpaid dividend.
Supplementary non cashflow information
Dividends received and re - invested in units of mutual funds 692.81 374.72
As per our report of even date.
For S.R. Batliboi & Co. LLP For and on behalf of the Board of Directors of ICAI Firm Registration Number: 301003E Sasken Communication Technologies Limited Chartered Accountants
per Navin Agrawal Rajiv C. Mody Neeta S. Revankar Partner Chairman and Managing Director Whole Time Director &Membership No.: 56102 DIN: 00092037 Chief Financial Officer DIN: 00145580
Place : Bengaluru S. Prasad Date : April 23, 2015 Company Secretary
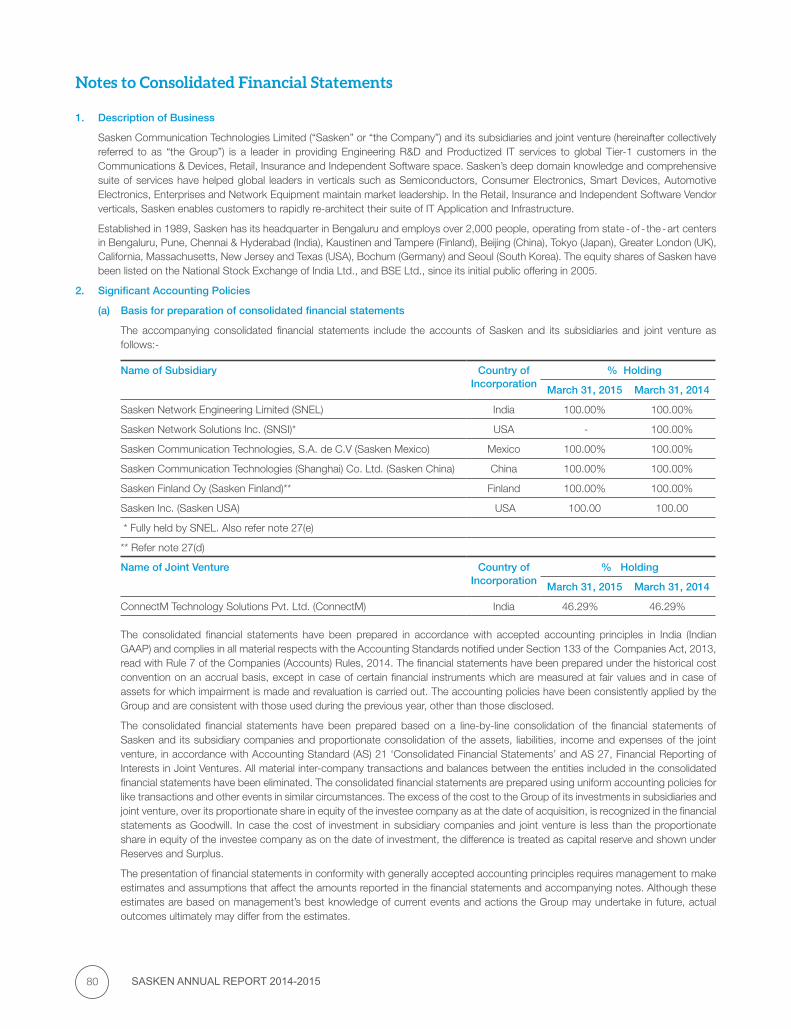
SASKEN ANNUAL REPORT 2014-201580
Notes to Consolidated Financial Statements
1. Description of Business
Sasken Communication Technologies Limited (“Sasken” or “the Company”) and its subsidiaries and joint venture (hereinafter collectively referred to as “the Group”) is a leader in providing Engineering R&D and Productized IT services to global Tier-1 customers in the Communications & Devices, Retail, Insurance and Independent Software space. Sasken’s deep domain knowledge and comprehensive suite of services have helped global leaders in verticals such as Semiconductors, Consumer Electronics, Smart Devices, Automotive Electronics, Enterprises and Network Equipment maintain market leadership. In the Retail, Insurance and Independent Software Vendor verticals, Sasken enables customers to rapidly re-architect their suite of IT Application and Infrastructure.
Established in 1989, Sasken has its headquarter in Bengaluru and employs over 2,000 people, operating from state - of - the - art centers in Bengaluru, Pune, Chennai & Hyderabad (India), Kaustinen and Tampere (Finland), Beijing (China), Tokyo (Japan), Greater London (UK), California, Massachusetts, New Jersey and Texas (USA), Bochum (Germany) and Seoul (South Korea). The equity shares of Sasken have been listed on the National Stock Exchange of India Ltd., and BSE Ltd., since its initial public offering in 2005.
2. Significant Accounting Policies
(a) Basis for preparation of consolidated financial statements
The accompanying consolidated financial statements include the accounts of Sasken and its subsidiaries and joint venture as follows:-
Name of Subsidiary Country of Incorporation
% Holding
March 31, 2015 March 31, 2014
Sasken Network Engineering Limited (SNEL) India 100.00% 100.00%
Sasken Network Solutions Inc. (SNSI)* USA - 100.00%
Sasken Communication Technologies, S.A. de C.V (Sasken Mexico) Mexico 100.00% 100.00%
Sasken Communication Technologies (Shanghai) Co. Ltd. (Sasken China) China 100.00% 100.00%
Sasken Finland Oy (Sasken Finland)** Finland 100.00% 100.00%
Sasken Inc. (Sasken USA) USA 100.00 100.00
* Fully held by SNEL. Also refer note 27(e)
** Refer note 27(d)
Name of Joint Venture Country of Incorporation
% Holding
March 31, 2015 March 31, 2014
ConnectM Technology Solutions Pvt. Ltd. (ConnectM) India 46.29% 46.29%
The consolidated financial statements have been prepared in accordance with accepted accounting principles in India (Indian GAAP) and complies in all material respects with the Accounting Standards notified under Section 133 of the Companies Act, 2013, read with Rule 7 of the Companies (Accounts) Rules, 2014. The financial statements have been prepared under the historical cost convention on an accrual basis, except in case of certain financial instruments which are measured at fair values and in case of assets for which impairment is made and revaluation is carried out. The accounting policies have been consistently applied by the Group and are consistent with those used during the previous year, other than those disclosed.
The consolidated financial statements have been prepared based on a line-by-line consolidation of the financial statements of Sasken and its subsidiary companies and proportionate consolidation of the assets, liabilities, income and expenses of the joint venture, in accordance with Accounting Standard (AS) 21 ‘Consolidated Financial Statements’ and AS 27, Financial Reporting of Interests in Joint Ventures. All material inter-company transactions and balances between the entities included in the consolidated financial statements have been eliminated. The consolidated financial statements are prepared using uniform accounting policies for like transactions and other events in similar circumstances. The excess of the cost to the Group of its investments in subsidiaries and joint venture, over its proportionate share in equity of the investee company as at the date of acquisition, is recognized in the financial statements as Goodwill. In case the cost of investment in subsidiary companies and joint venture is less than the proportionate share in equity of the investee company as on the date of investment, the difference is treated as capital reserve and shown under Reserves and Surplus.
The presentation of financial statements in conformity with generally accepted accounting principles requires management to make estimates and assumptions that affect the amounts reported in the financial statements and accompanying notes. Although these estimates are based on management’s best knowledge of current events and actions the Group may undertake in future, actual outcomes ultimately may differ from the estimates.
81
Notes to Consolidated Financial Statements (Contd.)
(b) Change in accounting policy
Employee Stock Option Plan
In view of the amendment to SEBI (Share Based Employee Benefits) Regulations, 2014, effective from October 1, 2014, the compensation expense in respect of options lapsed / forfeited is now credited to General Reserve. Such compensation expense was earlier credited to the Statement of Profit and Loss as per the erstwhile SEBI (Employee Stock Option Scheme and Employee Stock Purchase Scheme) Guidelines, 1999. Had the Company continued to follow the earlier accounting policy of crediting to the Statement of Profit and Loss, then the profit and loss after tax for the current year would have been higher by `22.68 lakhs and general reserve would have been lower by the same amount.
(c) Fixed Assets (including intangible assets)
Fixed assets including intangible assets are stated at cost, less accumulated depreciation / amortization less impairment, if any. Cost comprises the purchase price and any attributable cost of bringing the asset to its working condition for its intended use. Borrowing costs relating to acquisition of fixed assets, which necessarily take substantial period of time to get ready for intended use, are also included to the extent they relate to the period till such assets are ready to be put to use. Cost of fixed assets not ready for their intended use before balance sheet date are disclosed under capital work in progress.
(d) Depreciation / Amortization
Based on an independent assessment, the management has estimated the useful lives of the following classes of assets, which are lower than or equal to those indicated in Schedule II. Depreciation is provided on Straight Line Method (SLM), over the estimated useful life of the asset, as follows:
In years
Type of asset Estimated life (SLM) Schedule II Estimated life (SLM)
Building 20 60
Computers 3 3
Electrical Fittings 5 10
Furniture & Fixtures 10 10
Plant & Equipment 5 15
Office Equipment 5 5
Vehicles 5 5
Leasehold improvements at leased premises are depreciated on SLM, over the estimated useful life (not exceeding 10 years) or the lease period, whichever is lower.
Assets with unit value of `5,000 or less are depreciated entirely in the period of acquisition, except in case of Sasken Finland and its subsidiaries where the assets with unit value of Euro 5,000 or less are depreciated entirely in the period of acquisition.
Intangible assets comprise of the following and except otherwise mentioned, are amortized over the estimated useful life, on a straight line basis, as given below:
1. Goodwill arising on consolidation is not amortized but is tested for impairment in accordance with Accounting Standard 21 on Consolidated Financial Statements.
2. Goodwill on acquisition represents the excess of the purchase price over the value of the net assets of the acquired business, and is not amortized but is tested for impairment on a periodic basis.
3. Computer Software -
(a) Computer Software used for development of software / rendering software services - over the life of the project / product - 1 year to 5 years.
(b) Generic Computer Software - over 1 year.
(c) Product Software for administration purposes - 3 years.
4. Contract Rights - over a period of 1 year.
5. Technical know - how - over a period of 3 years.
(e) Research and Development
Research costs are expensed as incurred. Development expenditure incurred on an individual project is carried forward when its future recoverability can reasonably be regarded as assured. Equipment or facilities that are acquired or constructed for research and development activities, which have alternative future uses are capitalized as tangible assets. Depreciation on such assets, during research phase is charged to expense as research and development costs.
SASKEN ANNUAL REPORT 2014-201582
Notes to Consolidated Financial Statements (Contd.)
(f) Capitalization and Amortization of Software Products
Costs incurred during the research phase are expensed off as period costs. Costs incurred towards development of computer software products meant for sale, lease or otherwise marketed, are capitalized subsequent to establishing the technological feasibility provided future economic benefit is probable and the Company has an intention and ability to complete and use or sell software and costs can be measured reliably. The costs are expensed as period costs, if the technological feasibility is not established. Capitalization ceases when the product is ready for general release to customers. Capitalized software product costs are amortized on a straight line method over the remaining estimated economic life of the product. The unamortized cost of capitalized software products is carried at cost, less accumulated amortization less impairment, if any.
(g) Operating Leases
Leases where the lessor effectively retains substantially all the risks and benefits of ownership of the leased term are classified as operating lease. Operating leases payments are recognized as expense in the Statement of Profit and Loss on a straight-line basis over the lease term.
(h) Impairment of assets
(i) The carrying amounts of assets are reviewed at each balance sheet date to assess if there is any indication of impairment based on internal / external factors. An impairment loss is recognized wherever the carrying amount of an asset exceeds its recoverable amount. The recoverable amount is the greater of the asset’s net selling price and value in use. In assessing value in use, the estimated future cash flows are discounted to their present value using a pre-tax discount rate that reflects current market assessments of the time value of money and risks specific to the asset.
(ii) After impairment, depreciation is provided on the revised carrying amount of the assets over its remaining useful life.
(iii) A previously recognized impairment loss is increased or reversed depending on changes in circumstances. However the carrying value after reversal is not increased beyond the carrying value that would have prevailed by charging usual depreciation if there was no impairment.
(i) Investments
Investments that are readily realisable and intended to be held for not more than a year are classified as current investments. All other investments are classified as long-term investments. Current investments are carried at lower of cost and net realizable value determined on an individual investment basis. Long-term investments are carried at cost. However, provision for diminution in value is made to recognize a decline other than temporary in the value of the investments. On disposal of an investment, the difference between its carrying amount and net disposal proceeds is charged or credited to the Statement of Profit and Loss.
(j) Inventories
(i) Work - in - Progress
Costs related to milestones that have not been completed until the balance sheet date are reported as work - in - progress. Work - in - progress is carried at cost or net realizable value whichever is lower. Cost includes all expenses directly identifiable to a project and other costs directly attributable to the project. Net Realizable value is the estimated revenue expected in the ordinary course of business on completion of the milestone less expected costs and margin on completion of milestone.
(ii) Raw materials and Components
Raw materials and Components are valued at lower of cost or net realizable value. Cost is determined on FIFO basis. Cost includes the purchase price and other associated costs directly incurred in bringing the inventory to its present location.
(k) Revenue Recognition
The Group derives its revenues from product and technology licensing, software services and installation and commissioning services.
Revenue is recognized to the extent that it is probable that the economic benefits will flow to the Company, the revenue can be reliably measured and the collection is probable. In all cases revenue is recognized only when no further vendor obligations remain, up to the stage of revenue recognized and collection is probable. The following specific recognition criteria must also be met before revenue is recognized.
Licensing revenue is recognized when the product or technology is delivered and accepted.
Revenue from time and material service contracts is recognized as the services are provided. Revenue from fixed price service contracts and customized products or technology developments is recognized based on the proportionate completion method, determined based on the achievement and acceptance of the milestone, provided collection is probable. Revenue from maintenance contracts is recognized rateably over the term of the maintenance arrangement.
Revenue from royalty is recognized on an accrual basis based on customer confirmation of shipment volumes, provided collection is probable.
83
Notes to Consolidated Financial Statements (Contd.)
Revenue related to post contract customer support is recognized ratably over the support period.
Dividend income is recognized when the right to receive dividend is established as at the reporting date.
Interest income is recognized on a time proportion basis taking into account the amount outstanding and the rate applicable.
Sales are recognized, net of returns and trade discounts, on transfer of significant risks and rewards of ownership to the buyer, which generally coincides with the delivery of goods to customers.
The Company recognizes legal award revenue when the litigation reaches finality, and the Company has assurance of collecting those awards or the Company has collected litigation awards from the other litigating party or parties.
The Group collects service tax, business tax and value added taxes (VAT) on behalf of the government and, therefore, it is not an economic benefit flowing to the Group. Hence, it is excluded from revenue.
(l) Foreign Currency Translations
Initial Recognition
Foreign currency transactions are recorded in the reporting currency, by applying to the foreign currency amount the exchange rate between the reporting currency and the foreign currency approximately at the date of the transaction.
Conversion
Foreign currency monetary items are reported using the exchange rate prevailing at the Balance Sheet date. Non-monetary items, which are carried in terms of historical cost denominated in a foreign currency, are reported using the exchange rate at the date of the transaction.
Exchange Differences
Exchange differences arising on the settlement of monetary items or on reporting such monetary items of Group at rates different from those at which they were initially recorded during the year, or reported in previous financial statements, are recognized as income or as expenses in the year in which they arise.
Forward exchange contracts not intended for trading or speculation purposes covered by notified AS 11.
The premium or discount arising at the inception of forward exchange contracts is amortized as expense or income over the life of the contract. Exchange differences on such contracts are recognized in the Statement of Profit and Loss in the year in which the exchange rates change. Any profit or loss arising on cancellation or renewal of forward exchange contract is recognized as income or as expense for the year.
Options and Forward exchange contracts not intended for trading or speculation purposes, classified as derivative instruments (Cash flow hedge).
The Group has adopted the principles of Accounting Standard (‘AS’) 30, Financial Instruments: Recognition and Measurement to the extent that the adoption does not conflict with notified accounting standards and other applicable pronouncements. Accordingly, such derivative instruments, which qualify for hedge accounting are fair valued at Balance Sheet date and the effective portion of the resultant loss / (gain) is debited / credited to the hedging reserve and the ineffective portion is recognized in the Statement of Profit and Loss.
Changes in the fair value of derivative instruments that do not qualify for hedge accounting are recognized in the Statement of Profit and Loss as they arise.
Hedge Accounting is discontinued when the hedging instrument expires or is sold, or terminated, or exercised, or no longer qualifies for hedge accounting. Any cumulative gain or loss on the hedging instrument recognized in hedging reserve is transferred to the Statement of Profit and Loss when the forecasted transaction occurs or when a hedged transaction is no longer expected to occur.
Translation of Integral and Non-integral foreign operation :
The financial statements of an integral foreign operation are translated as if the transactions of the foreign operation have been those of the Group itself.
In translating the financial statements of a non-integral foreign operation for incorporation in financial statements, the assets and liabilities, both monetary and non-monetary, of the non - integral foreign operation are translated at the rate prevailing at the Balance Sheet date; income and expense items of the non-integral foreign operation are translated at exchange rates at the dates of the transactions; and all resulting exchange differences are accumulated in a foreign currency translation reserve until the disposal of the net investment.
Where there is a change in the classification of a foreign operation the translation procedures applicable to the revised classification are applied from the date of change in the classification.
SASKEN ANNUAL REPORT 2014-201584
Notes to Consolidated Financial Statements (Contd.)
On disposal of a non-integral foreign operation, the cumulative amount of the exchange difference which have been deferred and which relate to that operation are recognized as income or expense in the same period in which the gain or loss on disposal is recognized. Where there is a change in the classification of a foreign operation, the translation procedure applicable to the revised classification are applied from the date of the change in the classification.
(m) Retirement and other Employee Benefits
(i) Gratuity
The Group provides for gratuity, a defined benefit plan covering all eligible employees. The plan provides a lump sum payment to eligible employees at retirement or on termination of employment based on the salary of the respective employee and the years of employment with the Company.
The Group contributes to a gratuity fund maintained by an insurance company. The amount of contribution is determined based upon actuarial valuations as at the period end. Such contributions are charged off to the Statement of Profit and Loss. Provision is made for the shortfall between the actuarial valuation carried out as at Balance Sheet date as per Projected Unit Credit Method and the funded balance with the insurance company.
(ii) Provident Fund
Employees other than the employees at foreign branches and subsidiaries are eligible to receive Provident Fund benefits through a defined benefit plan in which both employee and employer make monthly contributions to the plan. The Company has established a Provident Fund Trust to which contributions towards provident fund are made each month. The Provident Fund Trust guarantees a specified rate of return on such contributions on a periodical basis. The Company will meet the shortfall in the return, if any, which is provided for based on actuarial valuation carried out, as at the date of Balance Sheet. Contributions towards Provident Fund are charged to the Statement of Profit & Loss on an accrual basis.
(iii) Pension
In case of Germany branch, pension contributions are made as per the local laws and regulations.The Company provides for pension benefits, a defined benefit plan, covering all eligible employees. The plan provides for various pension benefits to eligible employees at retirement or on termination of employment based on earnings of the respective employee and the year of employment with the Company. The Company contributes to a reinsured support fund maintained by an external agency. The contributions made by the employer are charged to the Statement of Profit and Loss on accrual basis. Provision is made for the shortfall between the actuarial valuation as per the Projected Unit Credit Method and funded balance as at the Balance Sheet date.
For other overseas branches and foreign subsidiary companies, social security contributions are made as per the respective country laws and regulations. The same is charged to the Statement of Profit and Loss on an accrual basis. There are no obligations beyond the respective entity’s contributions.
(iv) Compensated absences
Short-term compensated absences are provided based on estimates. Long-term compensated absences are provided for based on actuarial valuation, done as per Projected Unit Credit Method, as at Balance Sheet date. The Group presents the compensated absences as a current liability in the Balance Sheet wherever it does not have an unconditional right to defer its settlement beyond 12 months after the reporting date.
(v) Other employee benefits
The Group operates other long term benefit plan covering all eligible employees. The plan provide for lump sum payments at the end of agreed tenure. The cost of providing benefit under this plan is determined by the actuarial valuation, done as per Projected Unit Credit Method as at each Balance Sheet date.
(vi) Superannuation
The Company contributes to a superannuation scheme, a defined contribution plan maintained by an insurance company. Such contributions are charged to the Statement of Profit and Loss on an accrual basis. The Company has no other obligations beyond its monthly contributions.
(vii) Actuarial gains / losses
The actuarial gains / losses on the employee benefits are immediately recognized in the Statement of Profit and Loss and are not deferred.
(n) Income Taxes
Tax expense comprises of current and deferred tax. Current income tax is measured at the amount expected to be paid to the tax authorities in accordance with tax laws applicable to the respective jurisdictions. Deferred income taxes reflect the impact of current year timing differences between taxable income and accounting income for the year and reversal of timing differences of earlier years.
85
Notes to Consolidated Financial Statements (Contd.)
Deferred tax is measured based on the tax rates and the tax laws enacted or substantively enacted at the balance sheet date. Deferred tax assets and deferred tax liabilities across various countries of operation are not set off against each other as the Group does not have a legal right to do so. Deferred tax liabilities are recognized for all taxable timing differences. In the situations where the company is entitled to a tax holiday under the Income-tax Act, 1961 enacted in India or tax laws prevailing in the respective tax jurisdictions where it operates, no deferred tax (asset or liability) is recognized in respect of timing differences which reverse during the tax holiday period, to the extent the company’s gross total income is subject to the deduction during the tax holiday period. Deferred tax in respect of timing differences which reverse after the tax holiday period is recognized in the year in which the timing differences originate. Deferred tax assets are recognized only to the extent that there is reasonable certainty that sufficient future taxable income will be available against which such deferred tax assets can be realized. If the Group has carry forward of unabsorbed depreciation and tax losses, all deferred tax assets are recognized only if there is virtual certainty supported by convincing evidence that they can be realized against future taxable profits.
The carrying amount of deferred tax assets are reviewed at each Balance Sheet date. The Group writes-down the carrying amount of a deferred tax asset to the extent that it is no longer reasonably certain or virtually certain, as the case may be, that sufficient future taxable income will be available against which deferred tax asset can be realized. Any such write - down is reversed to the extent that it becomes reasonably certain or virtually certain, as the case may be, that sufficient future taxable income will be available.
Unrecognized deferred tax assets of earlier years are re-assessed and recognized to the extent that it has become reasonably certain or virtually certain, as the case may be that future taxable income will be available against which such deferred tax assets can be realized.
Minimum Alternative Tax (MAT) credit is recognized as an asset only when and to the extent there is convincing evidence that the company will pay normal income tax during the specified period. In the year in which the Minimum Alternative tax (MAT) credit becomes eligible to be recognized as an asset in accordance with the recommendations contained in Guidance Note issued by the Institute of Chartered Accountants of India on Accounting for Credit Available in respect of MAT under the Income-tax Act, 1961, the said asset is created by way of a credit to the Statement of Profit and Loss and shown as MAT Credit Entitlement. The Group reviews the same at each Balance Sheet date and writes down the carrying amount of MAT Credit Entitlement to the extent there is no longer convincing evidence to the effect that Group will pay normal Income Tax during the specified period.
(o) Stock Compensation Expense
Measurement and disclosure of the employee share-based payment plans is done in accordance with SEBI (Share Based Employee Benefits) Regulations, 2014 and the Guidance Note on Accounting for Employee Share-based Payments, issued by the Institute of Chartered Accountants of India. The Group accounts for stock compensation expense based on the fair value of the options granted, determined on the date of grant. Compensation expense is amortized over the vesting period of the option on a straight-line basis. The accounting value of the options outstanding net of the Deferred Compensation Expense is reflected as Employee Stock Options Outstanding.
(p) Segment Reporting
The Group prepares its segment information in conformity with the accounting policies adopted for preparing and presenting the financial statements of the Group as a whole.
Identification of segments:
The Group is focused in the embedded communication space. The risks and returns of the Group are predominantly determined by the nature of the solutions offered to its customers, which may be in the form of products or services. The primary reporting segments are Software Services, Software Products, Network Engineering Services and Automotive, Utilities & Industrial.
The geographical segment information is disclosed based on the location of the customers.
Allocation of common costs:
Common allocable costs are allocated to each segment according to the relative contribution of each segment to the total common costs.
Unallocated items:
The unallocated items includes general corporate income and expense items, which are not allocated to any business segment.
(q) Earnings per share
Basic earnings per share is calculated by dividing the net profit or loss for the year attributable to equity shareholders by the weighted average number of equity shares outstanding during the year. The weighted average number of equity shares outstanding during the year are adjusted for events of bonus issue; bonus element in a rights issue to existing shareholders; share split; and reverse share split (consolidation of shares).
For the purpose of calculating diluted earnings per share, the net profit or loss for the year attributable to equity shareholders and the weighted average number of shares outstanding during the year are adjusted for the effects of all dilutive potential equity shares.
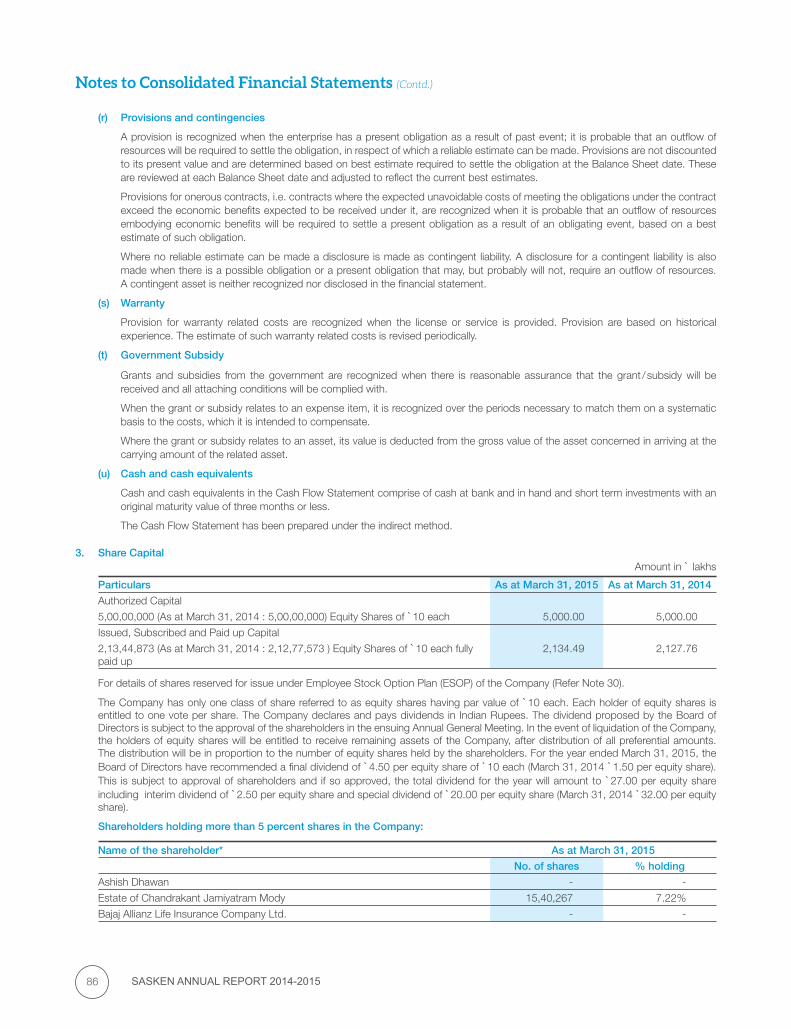
SASKEN ANNUAL REPORT 2014-201586
Notes to Consolidated Financial Statements (Contd.)
(r) Provisions and contingencies
A provision is recognized when the enterprise has a present obligation as a result of past event; it is probable that an outflow of resources will be required to settle the obligation, in respect of which a reliable estimate can be made. Provisions are not discounted to its present value and are determined based on best estimate required to settle the obligation at the Balance Sheet date. These are reviewed at each Balance Sheet date and adjusted to reflect the current best estimates.
Provisions for onerous contracts, i.e. contracts where the expected unavoidable costs of meeting the obligations under the contract exceed the economic benefits expected to be received under it, are recognized when it is probable that an outflow of resources embodying economic benefits will be required to settle a present obligation as a result of an obligating event, based on a best estimate of such obligation.
Where no reliable estimate can be made a disclosure is made as contingent liability. A disclosure for a contingent liability is also made when there is a possible obligation or a present obligation that may, but probably will not, require an outflow of resources. A contingent asset is neither recognized nor disclosed in the financial statement.
(s) Warranty
Provision for warranty related costs are recognized when the license or service is provided. Provision are based on historical experience. The estimate of such warranty related costs is revised periodically.
(t) Government Subsidy
Grants and subsidies from the government are recognized when there is reasonable assurance that the grant / subsidy will be received and all attaching conditions will be complied with.
When the grant or subsidy relates to an expense item, it is recognized over the periods necessary to match them on a systematic basis to the costs, which it is intended to compensate.
Where the grant or subsidy relates to an asset, its value is deducted from the gross value of the asset concerned in arriving at the carrying amount of the related asset.
(u) Cash and cash equivalents
Cash and cash equivalents in the Cash Flow Statement comprise of cash at bank and in hand and short term investments with an original maturity value of three months or less.
The Cash Flow Statement has been prepared under the indirect method.
3. Share CapitalAmount in ` lakhs
Particulars As at March 31, 2015 As at March 31, 2014
Authorized Capital
5,00,00,000 (As at March 31, 2014 : 5,00,00,000) Equity Shares of `10 each 5,000.00 5,000.00
Issued, Subscribed and Paid up Capital
2,13,44,873 (As at March 31, 2014 : 2,12,77,573 ) Equity Shares of `10 each fully paid up
2,134.49 2,127.76
For details of shares reserved for issue under Employee Stock Option Plan (ESOP) of the Company (Refer Note 30).
The Company has only one class of share referred to as equity shares having par value of `10 each. Each holder of equity shares is entitled to one vote per share. The Company declares and pays dividends in Indian Rupees. The dividend proposed by the Board of Directors is subject to the approval of the shareholders in the ensuing Annual General Meeting. In the event of liquidation of the Company, the holders of equity shares will be entitled to receive remaining assets of the Company, after distribution of all preferential amounts. The distribution will be in proportion to the number of equity shares held by the shareholders. For the year ended March 31, 2015, the Board of Directors have recommended a final dividend of `4.50 per equity share of `10 each (March 31, 2014 `1.50 per equity share). This is subject to approval of shareholders and if so approved, the total dividend for the year will amount to `27.00 per equity share including interim dividend of `2.50 per equity share and special dividend of `20.00 per equity share (March 31, 2014 `32.00 per equity share).
Shareholders holding more than 5 percent shares in the Company:
Name of the shareholder* As at March 31, 2015
No. of shares % holding
Ashish Dhawan - -
Estate of Chandrakant Jamiyatram Mody 15,40,267 7.22%
Bajaj Allianz Life Insurance Company Ltd. - -
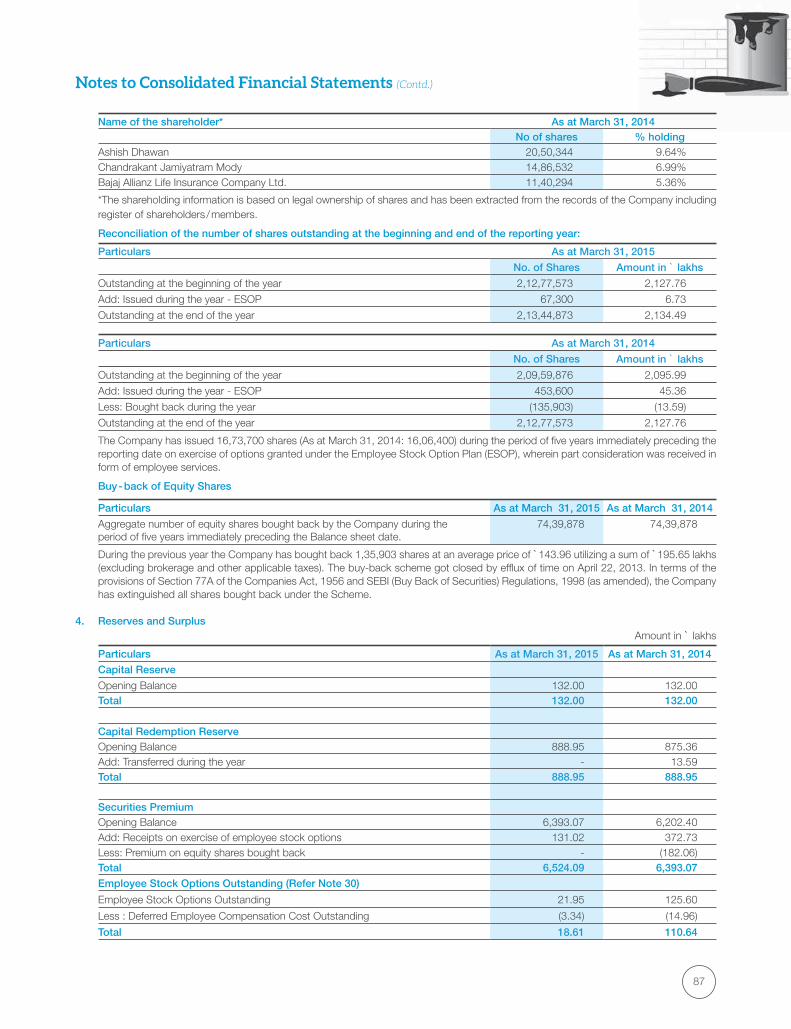
87
Notes to Consolidated Financial Statements (Contd.)
Name of the shareholder* As at March 31, 2014No of shares % holding
Ashish Dhawan 20,50,344 9.64%Chandrakant Jamiyatram Mody 14,86,532 6.99%Bajaj Allianz Life Insurance Company Ltd. 11,40,294 5.36%
*The shareholding information is based on legal ownership of shares and has been extracted from the records of the Company including register of shareholders / members.
Reconciliation of the number of shares outstanding at the beginning and end of the reporting year:
Particulars As at March 31, 2015
No. of Shares Amount in ` lakhs
Outstanding at the beginning of the year 2,12,77,573 2,127.76
Add: Issued during the year - ESOP 67,300 6.73
Outstanding at the end of the year 2,13,44,873 2,134.49
Particulars As at March 31, 2014
No. of Shares Amount in ` lakhs
Outstanding at the beginning of the year 2,09,59,876 2,095.99
Add: Issued during the year - ESOP 453,600 45.36
Less: Bought back during the year (135,903) (13.59)
Outstanding at the end of the year 2,12,77,573 2,127.76
The Company has issued 16,73,700 shares (As at March 31, 2014: 16,06,400) during the period of five years immediately preceding the reporting date on exercise of options granted under the Employee Stock Option Plan (ESOP), wherein part consideration was received in form of employee services.
Buy - back of Equity Shares
Particulars As at March 31, 2015 As at March 31, 2014
Aggregate number of equity shares bought back by the Company during the period of five years immediately preceding the Balance sheet date.
74,39,878 74,39,878
During the previous year the Company has bought back 1,35,903 shares at an average price of `143.96 utilizing a sum of `195.65 lakhs (excluding brokerage and other applicable taxes). The buy-back scheme got closed by efflux of time on April 22, 2013. In terms of the provisions of Section 77A of the Companies Act, 1956 and SEBI (Buy Back of Securities) Regulations, 1998 (as amended), the Company has extinguished all shares bought back under the Scheme.
4. Reserves and SurplusAmount in ` lakhs
Particulars As at March 31, 2015 As at March 31, 2014
Capital Reserve
Opening Balance 132.00 132.00 Total 132.00 132.00
Capital Redemption Reserve Opening Balance 888.95 875.36 Add: Transferred during the year - 13.59 Total 888.95 888.95
Securities Premium Opening Balance 6,393.07 6,202.40 Add: Receipts on exercise of employee stock options 131.02 372.73 Less: Premium on equity shares bought back - (182.06)Total 6,524.09 6,393.07
Employee Stock Options Outstanding (Refer Note 30)
Employee Stock Options Outstanding 21.95 125.60
Less : Deferred Employee Compensation Cost Outstanding (3.34) (14.96)
Total 18.61 110.64
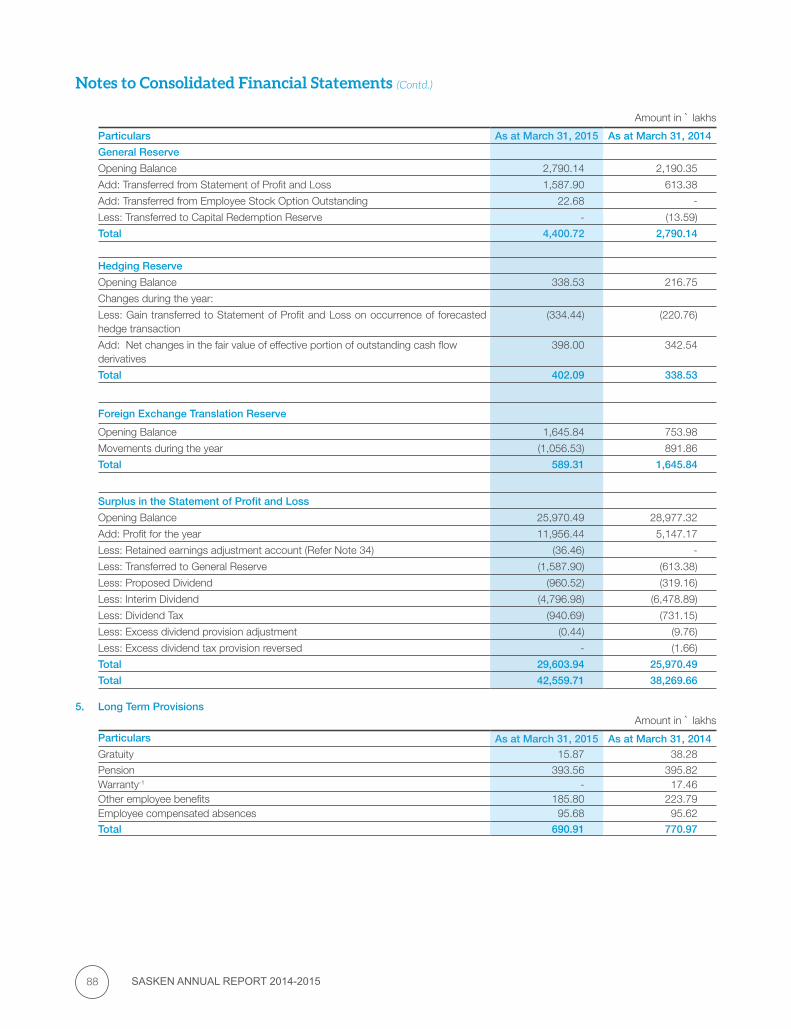
SASKEN ANNUAL REPORT 2014-201588
Notes to Consolidated Financial Statements (Contd.)
Particulars As at March 31, 2015 As at March 31, 2014
General Reserve
Opening Balance 2,790.14 2,190.35
Add: Transferred from Statement of Profit and Loss 1,587.90 613.38
Add: Transferred from Employee Stock Option Outstanding 22.68 -
Less: Transferred to Capital Redemption Reserve - (13.59)
Total 4,400.72 2,790.14
Hedging Reserve
Opening Balance 338.53 216.75
Changes during the year:
Less: Gain transferred to Statement of Profit and Loss on occurrence of forecasted hedge transaction
(334.44) (220.76)
Add: Net changes in the fair value of effective portion of outstanding cash flow derivatives
398.00 342.54
Total 402.09 338.53
Foreign Exchange Translation Reserve
Opening Balance 1,645.84 753.98
Movements during the year (1,056.53) 891.86
Total 589.31 1,645.84
Surplus in the Statement of Profit and Loss
Opening Balance 25,970.49 28,977.32
Add: Profit for the year 11,956.44 5,147.17
Less: Retained earnings adjustment account (Refer Note 34) (36.46) -
Less: Transferred to General Reserve (1,587.90) (613.38)
Less: Proposed Dividend (960.52) (319.16)
Less: Interim Dividend (4,796.98) (6,478.89)
Less: Dividend Tax (940.69) (731.15)
Less: Excess dividend provision adjustment (0.44) (9.76)
Less: Excess dividend tax provision reversed - (1.66)
Total 29,603.94 25,970.49
Total 42,559.71 38,269.66
5. Long Term ProvisionsAmount in ` lakhs
Particulars As at March 31, 2015 As at March 31, 2014Gratuity 15.87 38.28
Pension 393.56 395.82 Warranty-1 - 17.46 Other employee benefits 185.80 223.79 Employee compensated absences 95.68 95.62
Total 690.91 770.97
Amount in ` lakhs
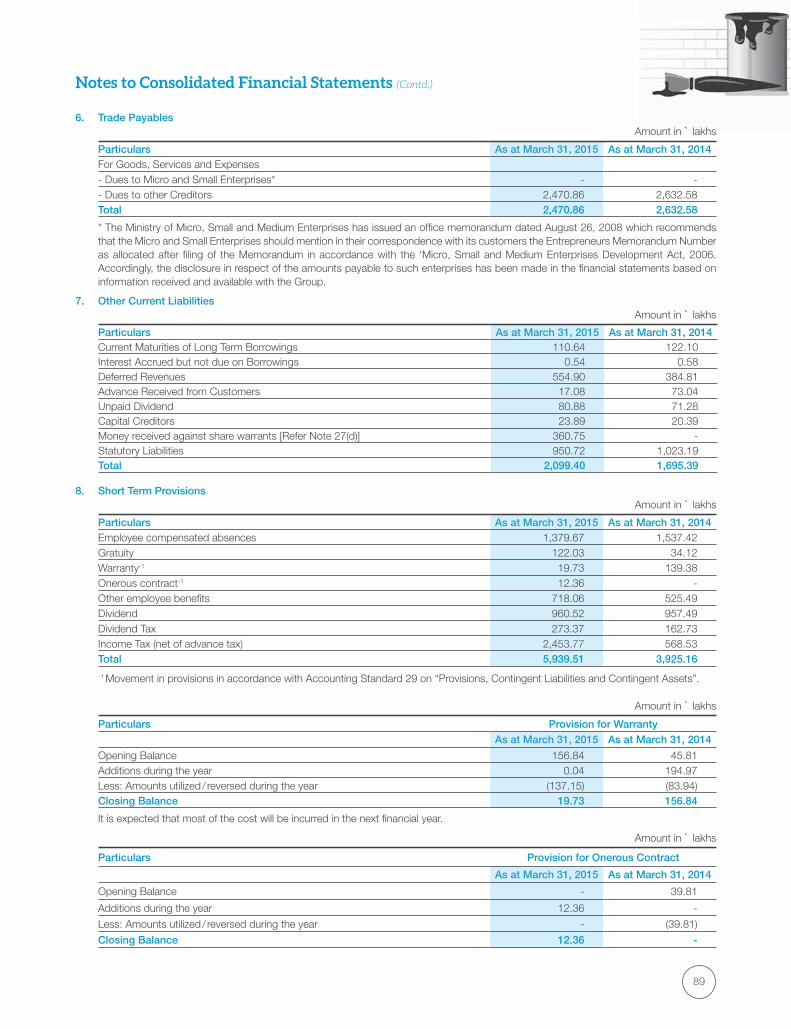
89
Notes to Consolidated Financial Statements (Contd.)
6. Trade Payables Amount in ` lakhs
Particulars As at March 31, 2015 As at March 31, 2014For Goods, Services and Expenses - Dues to Micro and Small Enterprises* - - - Dues to other Creditors 2,470.86 2,632.58 Total 2,470.86 2,632.58
* The Ministry of Micro, Small and Medium Enterprises has issued an office memorandum dated August 26, 2008 which recommends that the Micro and Small Enterprises should mention in their correspondence with its customers the Entrepreneurs Memorandum Number as allocated after filing of the Memorandum in accordance with the ‘Micro, Small and Medium Enterprises Development Act, 2006. Accordingly, the disclosure in respect of the amounts payable to such enterprises has been made in the financial statements based on information received and available with the Group.
7. Other Current LiabilitiesAmount in ` lakhs
Particulars As at March 31, 2015 As at March 31, 2014Current Maturities of Long Term Borrowings 110.64 122.10 Interest Accrued but not due on Borrowings 0.54 0.58 Deferred Revenues 554.90 384.81 Advance Received from Customers 17.08 73.04 Unpaid Dividend 80.88 71.28 Capital Creditors 23.89 20.39 Money received against share warrants [Refer Note 27(d)] 360.75 - Statutory Liabilities 950.72 1,023.19 Total 2,099.40 1,695.39
8. Short Term ProvisionsAmount in ` lakhs
Particulars As at March 31, 2015 As at March 31, 2014Employee compensated absences 1,379.67 1,537.42 Gratuity 122.03 34.12 Warranty-1 19.73 139.38 Onerous contract-1 12.36 - Other employee benefits 718.06 525.49 Dividend 960.52 957.49 Dividend Tax 273.37 162.73 Income Tax (net of advance tax) 2,453.77 568.53 Total 5,939.51 3,925.16
-1 Movement in provisions in accordance with Accounting Standard 29 on “Provisions, Contingent Liabilities and Contingent Assets”.
Amount in ` lakhs
Particulars Provision for WarrantyAs at March 31, 2015 As at March 31, 2014
Opening Balance 156.84 45.81 Additions during the year 0.04 194.97 Less: Amounts utilized / reversed during the year (137.15) (83.94)Closing Balance 19.73 156.84
It is expected that most of the cost will be incurred in the next financial year.
Amount in ` lakhs
Particulars Provision for Onerous Contract
As at March 31, 2015 As at March 31, 2014
Opening Balance - 39.81
Additions during the year 12.36 -
Less: Amounts utilized / reversed during the year - (39.81)
Closing Balance 12.36 -
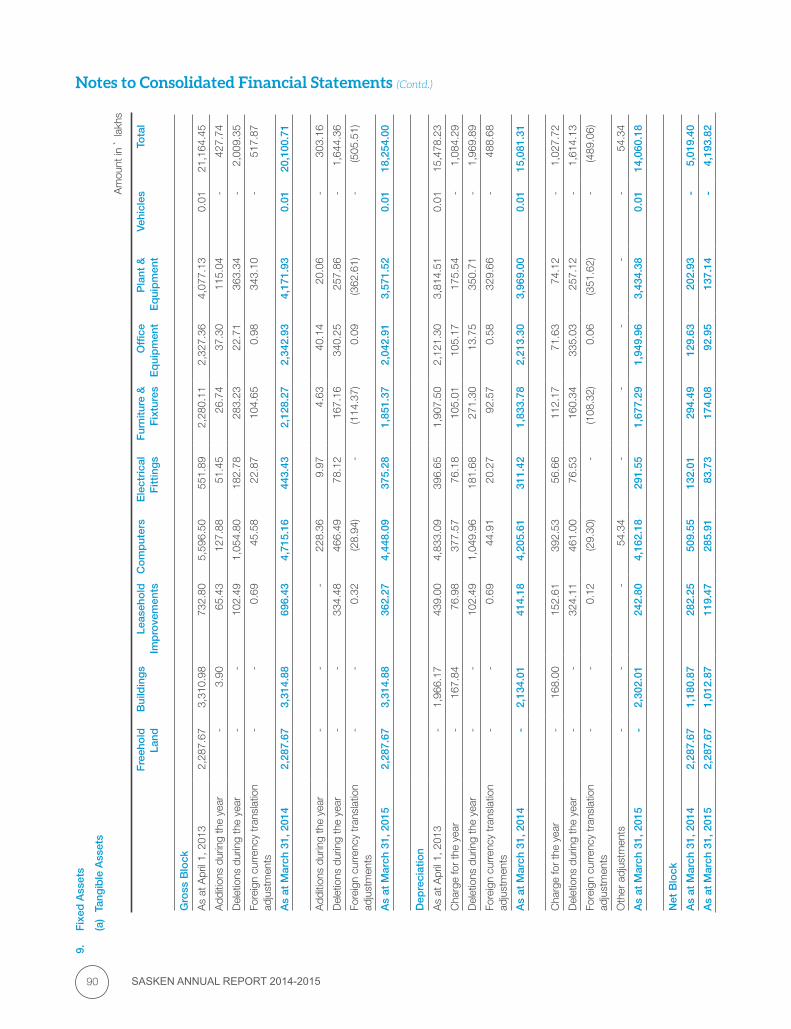
SASKEN ANNUAL REPORT 2014-201590
Notes to Consolidated Financial Statements (Contd.)9.
F
ixed
Ass
ets
(a)
Tang
ible
Ass
ets
Am
ount
in `
lakh
s
Fre
eho
ld
Land
Bui
ldin
gs
Leas
eho
ld
Imp
rove
men
tsC
om
put
ers
Ele
ctri
cal
Fitt
ing
sF
urni
ture
&
Fix
ture
sO
ffice
E
qui
pm
ent
Pla
nt &
E
qui
pm
ent
Vehi
cles
Tota
l
Gro
ss B
lock
As
at A
pril
1, 2
013
2,2
87.6
7 3
,310
.98
732
.80
5,5
96.5
0 5
51.8
9 2
,280
.11
2,3
27.3
6 4
,077
.13
0.0
1 2
1,16
4.45
Add
ition
s du
ring
the
year
-
3.9
0 6
5.43
1
27.8
8 5
1.45
2
6.74
3
7.30
1
15.0
4 -
4
27.7
4
Del
etio
ns d
urin
g th
e ye
ar -
-
1
02.4
9 1
,054
.80
182
.78
283
.23
22.
71
363
.34
-
2,0
09.3
5
Fore
ign
curr
ency
tran
slat
ion
adju
stm
ents
-
-
0.6
9 4
5.58
2
2.87
1
04.6
5 0
.98
343
.10
-
517
.87
As
at M
arch
31,
201
4 2
,287
.67
3,3
14.8
8 6
96.4
3 4
,715
.16
443
.43
2,1
28.2
7 2
,342
.93
4,1
71.9
3 0
.01
20,
100.
71
Add
ition
s du
ring
the
year
-
-
-
228
.36
9.9
7 4
.63
40.
14
20.
06
-
303
.16
Del
etio
ns d
urin
g th
e ye
ar -
-
3
34.4
8 4
66.4
9 7
8.12
1
67.1
6 3
40.2
5 2
57.8
6 -
1
,644
.36
Fore
ign
curr
ency
tran
slat
ion
adju
stm
ents
-
-
0.3
2 (2
8.94
) -
(1
14.3
7) 0
.09
(362
.61)
-
(505
.51)
As
at M
arch
31,
201
5 2
,287
.67
3,3
14.8
8 3
62.2
7 4
,448
.09
375
.28
1,8
51.3
7 2
,042
.91
3,5
71.5
2 0
.01
18,
254.
00
Dep
reci
atio
n
As
at A
pril
1, 2
013
-
1,9
66.1
7 4
39.0
0 4
,833
.09
396
.65
1,9
07.5
0 2
,121
.30
3,8
14.5
1 0
.01
15,
478.
23
Cha
rge
for
the
year
-
167
.84
76.
98
377
.57
76.
18
105
.01
105
.17
175
.54
-
1,0
84.2
9
Del
etio
ns d
urin
g th
e ye
ar -
-
1
02.4
9 1
,049
.96
181
.68
271
.30
13.
75
350
.71
-
1,9
69.8
9
Fore
ign
curr
ency
tran
slat
ion
adju
stm
ents
-
-
0.6
9 4
4.91
2
0.27
9
2.57
0
.58
329
.66
-
488
.68
As
at M
arch
31,
201
4 -
2
,134
.01
414
.18
4,2
05.6
1 3
11.4
2 1
,833
.78
2,2
13.3
0 3
,969
.00
0.0
1 1
5,08
1.31
Cha
rge
for
the
year
-
168
.00
152
.61
392
.53
56.
66
112
.17
71.
63
74.
12
-
1,0
27.7
2
Del
etio
ns d
urin
g th
e ye
ar -
-
3
24.1
1 4
61.0
0 7
6.53
1
60.3
4 3
35.0
3 2
57.1
2 -
1
,614
.13
Fore
ign
curr
ency
tran
slat
ion
adju
stm
ents
-
-
0.1
2 (2
9.30
) -
(1
08.3
2) 0
.06
(351
.62)
-
(489
.06)
Oth
er a
djus
tmen
ts -
-
-
5
4.34
-
-
-
-
-
5
4.34
As
at M
arch
31,
201
5 -
2
,302
.01
242
.80
4,1
62.1
8 2
91.5
5 1
,677
.29
1,9
49.9
6 3
,434
.38
0.0
1 1
4,06
0.18
Net
Blo
ck
As
at M
arch
31,
201
4 2
,287
.67
1,1
80.8
7 2
82.2
5 5
09.5
5 1
32.0
1 2
94.4
9 1
29.6
3 2
02.9
3 -
5
,019
.40
As
at M
arch
31,
201
5 2
,287
.67
1,0
12.8
7 1
19.4
7 2
85.9
1 8
3.73
1
74.0
8 9
2.95
1
37.1
4 -
4
,193
.82
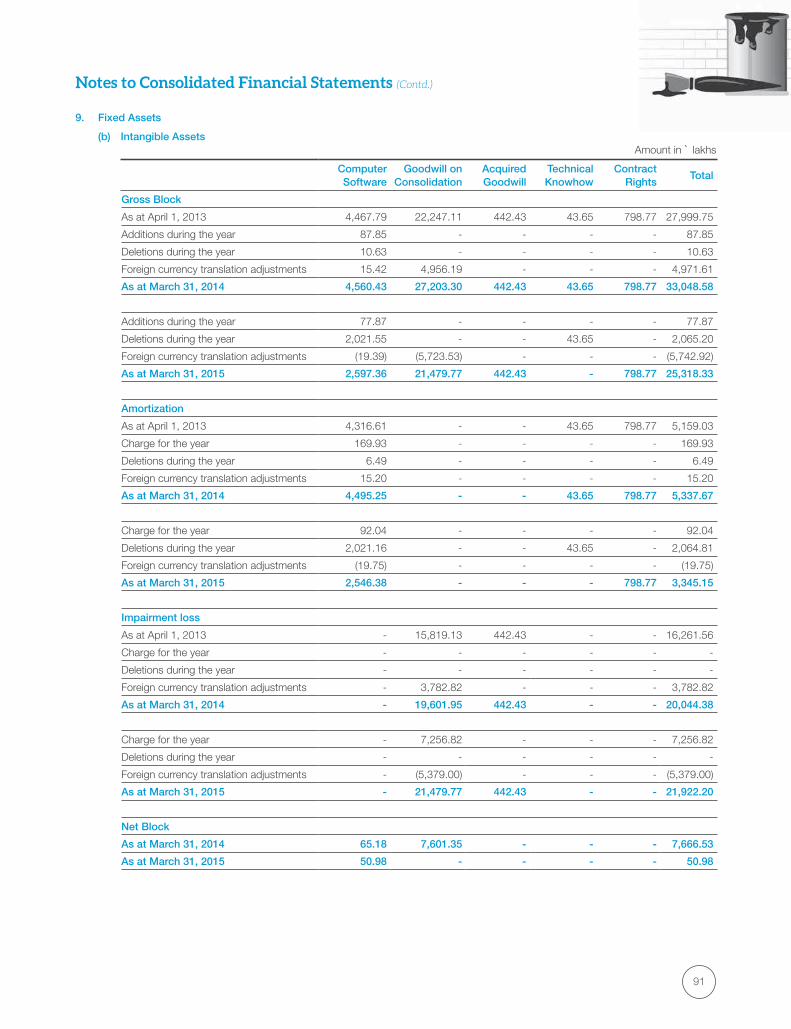
91
Notes to Consolidated Financial Statements (Contd.)
9. Fixed Assets
(b) Intangible AssetsAmount in ` lakhs
Computer Software
Goodwill on Consolidation
Acquired Goodwill
Technical Knowhow
Contract Rights
Total
Gross Block
As at April 1, 2013 4,467.79 22,247.11 442.43 43.65 798.77 27,999.75
Additions during the year 87.85 - - - - 87.85
Deletions during the year 10.63 - - - - 10.63
Foreign currency translation adjustments 15.42 4,956.19 - - - 4,971.61
As at March 31, 2014 4,560.43 27,203.30 442.43 43.65 798.77 33,048.58
Additions during the year 77.87 - - - - 77.87
Deletions during the year 2,021.55 - - 43.65 - 2,065.20
Foreign currency translation adjustments (19.39) (5,723.53) - - - (5,742.92)
As at March 31, 2015 2,597.36 21,479.77 442.43 - 798.77 25,318.33
Amortization
As at April 1, 2013 4,316.61 - - 43.65 798.77 5,159.03
Charge for the year 169.93 - - - - 169.93
Deletions during the year 6.49 - - - - 6.49
Foreign currency translation adjustments 15.20 - - - - 15.20
As at March 31, 2014 4,495.25 - - 43.65 798.77 5,337.67
Charge for the year 92.04 - - - - 92.04
Deletions during the year 2,021.16 - - 43.65 - 2,064.81
Foreign currency translation adjustments (19.75) - - - - (19.75)
As at March 31, 2015 2,546.38 - - - 798.77 3,345.15
Impairment loss
As at April 1, 2013 - 15,819.13 442.43 - - 16,261.56
Charge for the year - - - - - -
Deletions during the year - - - - - -
Foreign currency translation adjustments - 3,782.82 - - - 3,782.82
As at March 31, 2014 - 19,601.95 442.43 - - 20,044.38
Charge for the year - 7,256.82 - - - 7,256.82
Deletions during the year - - - - - -
Foreign currency translation adjustments - (5,379.00) - - - (5,379.00)
As at March 31, 2015 - 21,479.77 442.43 - - 21,922.20
Net Block
As at March 31, 2014 65.18 7,601.35 - - - 7,666.53
As at March 31, 2015 50.98 - - - - 50.98
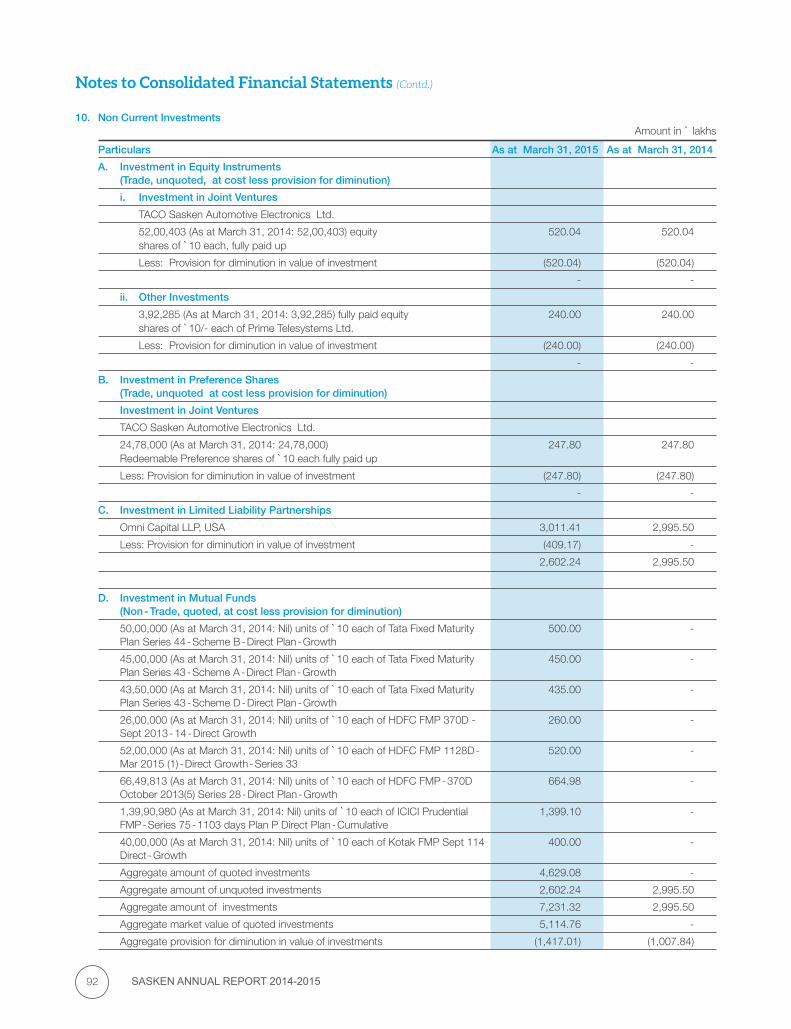
SASKEN ANNUAL REPORT 2014-201592
Notes to Consolidated Financial Statements (Contd.)
10. Non Current Investments Amount in ` lakhs
Particulars As at March 31, 2015 As at March 31, 2014
A. Investment in Equity Instruments(Trade, unquoted, at cost less provision for diminution)
i. Investment in Joint Ventures
TACO Sasken Automotive Electronics Ltd.
52,00,403 (As at March 31, 2014: 52,00,403) equity shares of `10 each, fully paid up
520.04 520.04
Less: Provision for diminution in value of investment (520.04) (520.04)
- -
ii. Other Investments
3,92,285 (As at March 31, 2014: 3,92,285) fully paid equity shares of `10/- each of Prime Telesystems Ltd.
240.00 240.00
Less: Provision for diminution in value of investment (240.00) (240.00)
- -
B. Investment in Preference Shares(Trade, unquoted at cost less provision for diminution)
Investment in Joint Ventures
TACO Sasken Automotive Electronics Ltd.
24,78,000 (As at March 31, 2014: 24,78,000) Redeemable Preference shares of `10 each fully paid up
247.80 247.80
Less: Provision for diminution in value of investment (247.80) (247.80)
- -
C. Investment in Limited Liability Partnerships
Omni Capital LLP, USA 3,011.41 2,995.50
Less: Provision for diminution in value of investment (409.17) -
2,602.24 2,995.50
D. Investment in Mutual Funds(Non - Trade, quoted, at cost less provision for diminution)
50,00,000 (As at March 31, 2014: Nil) units of `10 each of Tata Fixed Maturity Plan Series 44 - Scheme B - Direct Plan - Growth
500.00 -
45,00,000 (As at March 31, 2014: Nil) units of `10 each of Tata Fixed Maturity Plan Series 43 - Scheme A - Direct Plan - Growth
450.00 -
43,50,000 (As at March 31, 2014: Nil) units of `10 each of Tata Fixed Maturity Plan Series 43 - Scheme D - Direct Plan - Growth
435.00 -
26,00,000 (As at March 31, 2014: Nil) units of `10 each of HDFC FMP 370D - Sept 2013 - 14 - Direct Growth
260.00 -
52,00,000 (As at March 31, 2014: Nil) units of `10 each of HDFC FMP 1128D - Mar 2015 (1) - Direct Growth - Series 33
520.00 -
66,49,813 (As at March 31, 2014: Nil) units of `10 each of HDFC FMP - 370D October 2013(5) Series 28 - Direct Plan - Growth
664.98 -
1,39,90,980 (As at March 31, 2014: Nil) units of `10 each of ICICI Prudential FMP - Series 75 - 1103 days Plan P Direct Plan - Cumulative
1,399.10 -
40,00,000 (As at March 31, 2014: Nil) units of `10 each of Kotak FMP Sept 114 Direct - Growth
400.00 -
Aggregate amount of quoted investments 4,629.08 -
Aggregate amount of unquoted investments 2,602.24 2,995.50
Aggregate amount of investments 7,231.32 2,995.50
Aggregate market value of quoted investments 5,114.76 -
Aggregate provision for diminution in value of investments (1,417.01) (1,007.84)
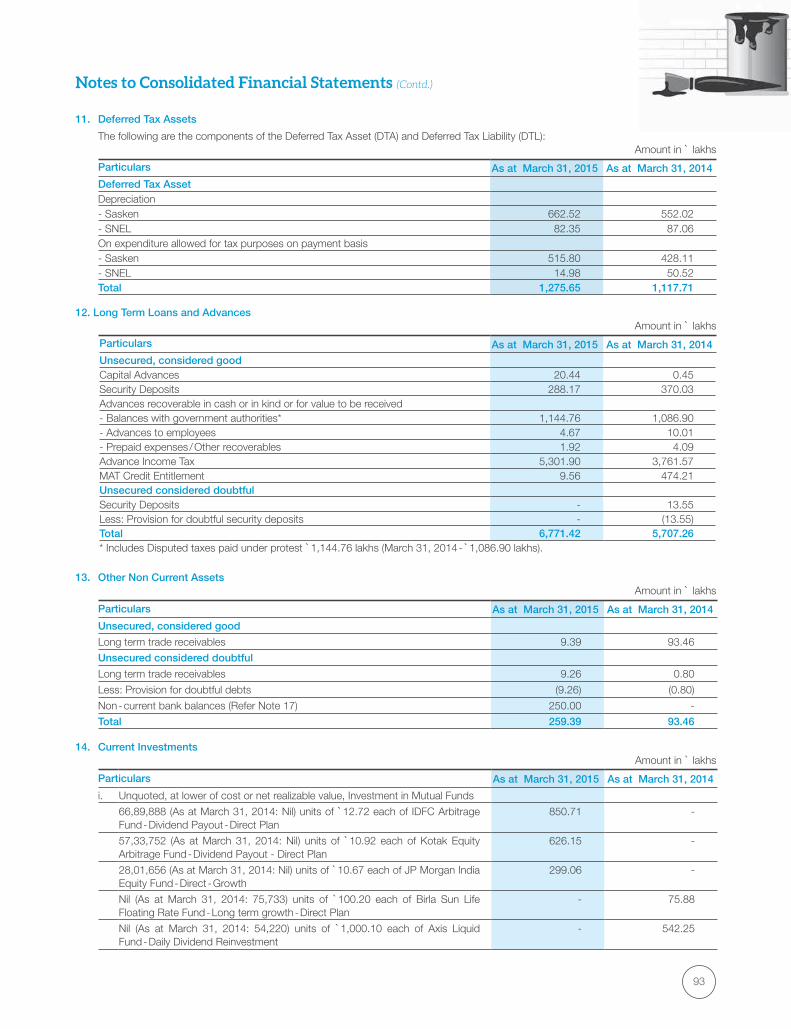
93
Notes to Consolidated Financial Statements (Contd.)
11. Deferred Tax Assets
The following are the components of the Deferred Tax Asset (DTA) and Deferred Tax Liability (DTL):Amount in ` lakhs
Particulars As at March 31, 2015 As at March 31, 2014
Deferred Tax Asset Depreciation- Sasken 662.52 552.02 - SNEL 82.35 87.06 On expenditure allowed for tax purposes on payment basis- Sasken 515.80 428.11 - SNEL 14.98 50.52Total 1,275.65 1,117.71
12. Long Term Loans and AdvancesAmount in ` lakhs
Particulars As at March 31, 2015 As at March 31, 2014
Unsecured, considered goodCapital Advances 20.44 0.45 Security Deposits 288.17 370.03 Advances recoverable in cash or in kind or for value to be received- Balances with government authorities* 1,144.76 1,086.90 - Advances to employees 4.67 10.01 - Prepaid expenses / Other recoverables 1.92 4.09 Advance Income Tax 5,301.90 3,761.57 MAT Credit Entitlement 9.56 474.21 Unsecured considered doubtfulSecurity Deposits - 13.55 Less: Provision for doubtful security deposits - (13.55)Total 6,771.42 5,707.26 * Includes Disputed taxes paid under protest `1,144.76 lakhs (March 31, 2014 - ̀ 1,086.90 lakhs).
13. Other Non Current Assets Amount in ` lakhs
Particulars As at March 31, 2015 As at March 31, 2014
Unsecured, considered good
Long term trade receivables 9.39 93.46
Unsecured considered doubtful
Long term trade receivables 9.26 0.80
Less: Provision for doubtful debts (9.26) (0.80)
Non - current bank balances (Refer Note 17) 250.00 -
Total 259.39 93.46 14. Current Investments
Amount in ` lakhs
Particulars As at March 31, 2015 As at March 31, 2014
i. Unquoted, at lower of cost or net realizable value, Investment in Mutual Funds
66,89,888 (As at March 31, 2014: Nil) units of `12.72 each of IDFC Arbitrage Fund - Dividend Payout - Direct Plan
850.71 -
57,33,752 (As at March 31, 2014: Nil) units of `10.92 each of Kotak Equity Arbitrage Fund - Dividend Payout - Direct Plan
626.15 -
28,01,656 (As at March 31, 2014: Nil) units of `10.67 each of JP Morgan India Equity Fund - Direct - Growth
299.06 -
Nil (As at March 31, 2014: 75,733) units of `100.20 each of Birla Sun Life Floating Rate Fund - Long term growth - Direct Plan
- 75.88
Nil (As at March 31, 2014: 54,220) units of `1,000.10 each of Axis Liquid Fund - Daily Dividend Reinvestment
- 542.25
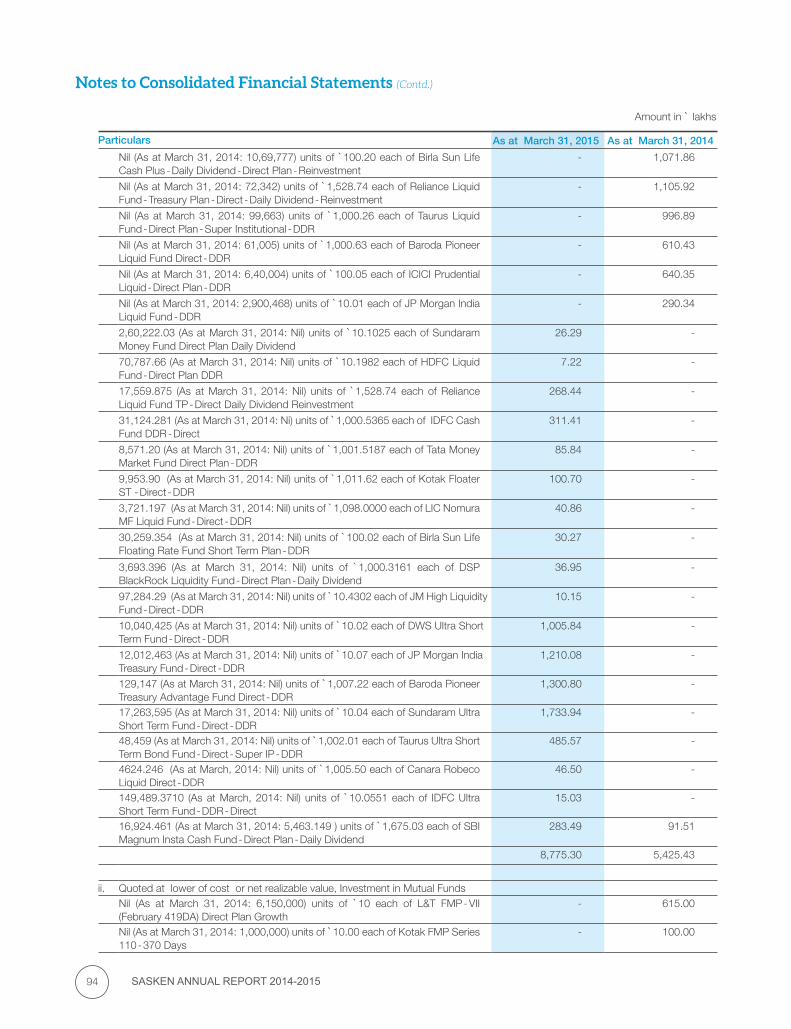
SASKEN ANNUAL REPORT 2014-201594
Notes to Consolidated Financial Statements (Contd.)
Amount in ` lakhs
Particulars As at March 31, 2015 As at March 31, 2014
Nil (As at March 31, 2014: 10,69,777) units of `100.20 each of Birla Sun Life Cash Plus - Daily Dividend - Direct Plan - Reinvestment
- 1,071.86
Nil (As at March 31, 2014: 72,342) units of `1,528.74 each of Reliance Liquid Fund - Treasury Plan - Direct - Daily Dividend - Reinvestment
- 1,105.92
Nil (As at March 31, 2014: 99,663) units of `1,000.26 each of Taurus Liquid Fund - Direct Plan - Super Institutional - DDR
- 996.89
Nil (As at March 31, 2014: 61,005) units of `1,000.63 each of Baroda Pioneer Liquid Fund Direct - DDR
- 610.43
Nil (As at March 31, 2014: 6,40,004) units of `100.05 each of ICICI Prudential Liquid - Direct Plan - DDR
- 640.35
Nil (As at March 31, 2014: 2,900,468) units of `10.01 each of JP Morgan India Liquid Fund - DDR
- 290.34
2,60,222.03 (As at March 31, 2014: Nil) units of `10.1025 each of Sundaram Money Fund Direct Plan Daily Dividend
26.29 -
70,787.66 (As at March 31, 2014: Nil) units of `10.1982 each of HDFC Liquid Fund - Direct Plan DDR
7.22 -
17,559.875 (As at March 31, 2014: Nil) units of `1,528.74 each of Reliance Liquid Fund TP - Direct Daily Dividend Reinvestment
268.44 -
31,124.281 (As at March 31, 2014: Ni) units of `1,000.5365 each of IDFC Cash Fund DDR - Direct
311.41 -
8,571.20 (As at March 31, 2014: Nil) units of `1,001.5187 each of Tata Money Market Fund Direct Plan - DDR
85.84 -
9,953.90 (As at March 31, 2014: Nil) units of `1,011.62 each of Kotak Floater ST - Direct - DDR
100.70 -
3,721.197 (As at March 31, 2014: Nil) units of ̀ 1,098.0000 each of LIC Nomura MF Liquid Fund - Direct - DDR
40.86 -
30,259.354 (As at March 31, 2014: Nil) units of `100.02 each of Birla Sun Life Floating Rate Fund Short Term Plan - DDR
30.27 -
3,693.396 (As at March 31, 2014: Nil) units of `1,000.3161 each of DSP BlackRock Liquidity Fund - Direct Plan - Daily Dividend
36.95 -
97,284.29 (As at March 31, 2014: Nil) units of ̀ 10.4302 each of JM High Liquidity Fund - Direct - DDR
10.15 -
10,040,425 (As at March 31, 2014: Nil) units of `10.02 each of DWS Ultra Short Term Fund - Direct - DDR
1,005.84 -
12,012,463 (As at March 31, 2014: Nil) units of `10.07 each of JP Morgan India Treasury Fund - Direct - DDR
1,210.08 -
129,147 (As at March 31, 2014: Nil) units of `1,007.22 each of Baroda Pioneer Treasury Advantage Fund Direct - DDR
1,300.80 -
17,263,595 (As at March 31, 2014: Nil) units of `10.04 each of Sundaram Ultra Short Term Fund - Direct - DDR
1,733.94 -
48,459 (As at March 31, 2014: Nil) units of `1,002.01 each of Taurus Ultra Short Term Bond Fund - Direct - Super IP - DDR
485.57 -
4624.246 (As at March, 2014: Nil) units of `1,005.50 each of Canara Robeco Liquid Direct - DDR
46.50 -
149,489.3710 (As at March, 2014: Nil) units of `10.0551 each of IDFC Ultra Short Term Fund - DDR - Direct
15.03 -
16,924.461 (As at March 31, 2014: 5,463.149 ) units of `1,675.03 each of SBI Magnum Insta Cash Fund - Direct Plan - Daily Dividend
283.49 91.51
8,775.30 5,425.43
ii. Quoted at lower of cost or net realizable value, Investment in Mutual FundsNil (As at March 31, 2014: 6,150,000) units of `10 each of L&T FMP - VII (February 419DA) Direct Plan Growth
- 615.00
Nil (As at March 31, 2014: 1,000,000) units of `10.00 each of Kotak FMP Series 110 - 370 Days
- 100.00

95
Notes to Consolidated Financial Statements (Contd.)
Amount in ` lakhs
Particulars As at March 31, 2015 As at March 31, 2014
Nil (As at March 31, 2014: 5,000,000) units of `10 each of Tata Fixed Maturity Plan Series 44 - Scheme B - Direct Plan - Growth
- 500.00
Nil (As at March 31, 2014: 4,500,000) units of `10 each of Tata Fixed Maturity Plan Series 43 - Scheme A - Direct Plan - Growth
- 450.00
Nil (As at March 31, 2014: 4,350,000) units of `10 each of Tata Fixed Maturity Plan Series 43 - Scheme D - Direct Plan - Growth
- 435.00
Nil (As at March 31, 2014: 2,600,000) units of `10 each of HDFC FMP 370D - Sept 2013 - 14 - Direct Growth
- 260.00
Nil (As at March 31, 2014: 4,000,000) units of `10 each of Kotak FMP Sept 114 Direct - Growth
- 400.00
Nil (As at March 31, 2014: 7,000,000) units of `10 each of Baroda Pioneer FMP Series G Plan B (Direct) (369 days) - Growth
- 700.00
Nil (As at March 31, 2014: 2,000,000) units of `10 each of IDBI FMP - Series III - 370 days (Aug 2013) - I Plan B Direct Plan - Growth
- 200.00
Nil (As at March 31, 2014: 2,500,000) units of `10 each of ICICI FMP - Series 68 - 369 Days Plan K Direct Plan Cumulative
- 250.00
Nil (As at March 31, 2014: 7,50,000) units of `10 each of Tata Fixed Maturity Plan Series 43 Scheme D (370 days maturity)
- 75.00
Nil (As at March 31, 2014: 7,200,000) units of `10 each of HDFC FMP - 370D October 2013(5) Series 28 - Direct Plan - Growth
- 720.00
Nil (As at March 31, 2014: 1,500,000) units of `10 each of Reliance Fixed Horizon Fund - XXIV - Series 23 - Direct Plan - Growth
- 150.00
6,250,000 (As at March 31, 2014: Nil) units of `10 each of Kotak FMP Series 156 370 Days - Direct - Growth
625.00 -
3,100,000 (As at March 31, 2014: Nil) units of `10 each of IDFC FTPS - 91 370 - Direct - Growth
310.00 -
6,810,000 (As at March 31, 2014: Nil) units of `10 each of LIC Nomura MF FMP - 81 - Direct - Growth
681.00 -
7,920,000 (As at March 31, 2014: Nil) units of `10 each of L&T FMP Series XI - Plan A - Direct - Growth
792.00 -
4,860,000 (As at March 31, 2014: Nil) units of `10 each of LIC Nomura FMP Series 82 - Direct - Growth
486.00 -
3,603,163 (As at March 31, 2014: Nil) units of `10 each of ICICI Prudential FMP - Series 74 - 370 days (Aug 2013) - I Plan V Direct Plan - Cumulative
360.32 -
2,541,337 (As at March 31, 2014: Nil) units of `10 each of SBI Debt Fund Series - A 32 - 367 Days - Direct - Growth
254.13 -
Nil (As at March 31, 2014: 750,279) units of `10 each of UTI Fixed Term Income Fund Series
- 75.03
3,508.45 4,930.03
Aggregate amount of Current investments 12,283.75 10,355.46
Aggregate market value of quoted investments 3,802.12 5,230.33 15. Inventories (at lower of cost or net realizable value)
Amount in ` lakhs
Particulars As at March 31, 2015 As at March 31, 2014
Raw materials and components 29.27 61.91
Work - in - Progress (Also Refer Note 22) 15.68 147.48
Total 44.95 209.39
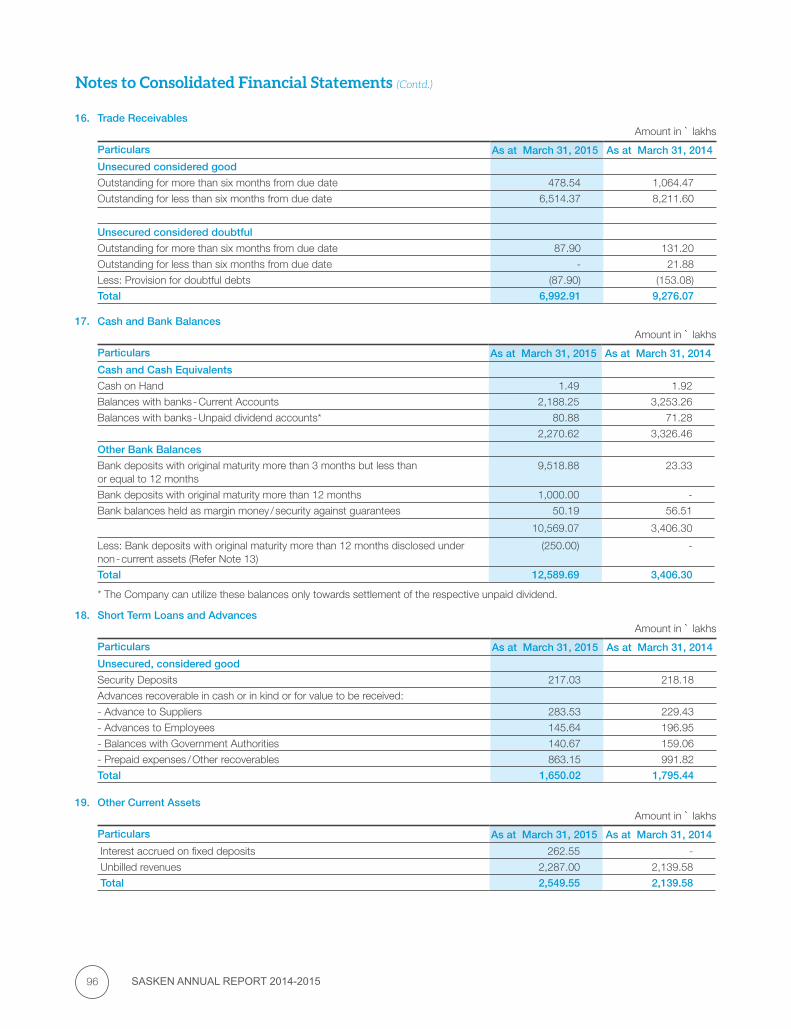
SASKEN ANNUAL REPORT 2014-201596
Notes to Consolidated Financial Statements (Contd.)
16. Trade Receivables Amount in ` lakhs
Particulars As at March 31, 2015 As at March 31, 2014
Unsecured considered good
Outstanding for more than six months from due date 478.54 1,064.47
Outstanding for less than six months from due date 6,514.37 8,211.60
Unsecured considered doubtful
Outstanding for more than six months from due date 87.90 131.20
Outstanding for less than six months from due date - 21.88
Less: Provision for doubtful debts (87.90) (153.08)
Total 6,992.91 9,276.07
17. Cash and Bank Balances Amount in ` lakhs
Particulars As at March 31, 2015 As at March 31, 2014
Cash and Cash Equivalents
Cash on Hand 1.49 1.92
Balances with banks - Current Accounts 2,188.25 3,253.26
Balances with banks - Unpaid dividend accounts* 80.88 71.28
2,270.62 3,326.46
Other Bank Balances
Bank deposits with original maturity more than 3 months but less than or equal to 12 months
9,518.88 23.33
Bank deposits with original maturity more than 12 months 1,000.00 -
Bank balances held as margin money / security against guarantees 50.19 56.51
10,569.07 3,406.30
Less: Bank deposits with original maturity more than 12 months disclosed under non - current assets (Refer Note 13)
(250.00) -
Total 12,589.69 3,406.30
* The Company can utilize these balances only towards settlement of the respective unpaid dividend.
18. Short Term Loans and Advances Amount in ` lakhs
Particulars As at March 31, 2015 As at March 31, 2014
Unsecured, considered good
Security Deposits 217.03 218.18
Advances recoverable in cash or in kind or for value to be received:
- Advance to Suppliers 283.53 229.43
- Advances to Employees 145.64 196.95
- Balances with Government Authorities 140.67 159.06
- Prepaid expenses / Other recoverables 863.15 991.82
Total 1,650.02 1,795.44
19. Other Current Assets Amount in ` lakhs
Particulars As at March 31, 2015 As at March 31, 2014
Interest accrued on fixed deposits 262.55 -
Unbilled revenues 2,287.00 2,139.58
Total 2,549.55 2,139.58

97
Notes to Consolidated Financial Statements (Contd.)
20. Revenue from Operations Amount in ` lakhs
Particulars For the Year Ended March 31, 2015
For the Year Ended March 31, 2014
Revenue from Software Products 1,172.52 1,922.91 Revenue from Software Services 40,318.69 41,207.62 Revenue from Network Engineering Services 1,090.42 2,380.07 Revenue from Automotive, Utilities and Industrial Services 219.36 215.10 Revenue from sale of Traded Goods - 77.23 Total 42,800.99 45,802.93
21. Other Income Amount in ` lakhs
Particulars For the Year Ended March 31, 2015
For the Year Ended March 31, 2014
Dividend on current investments 718.56 374.72
Net gain on sale of current investments 222.68 695.05
Interest Income:
- on Bank Deposits 312.91 16.03
- on Income Tax refund - 14.82
- on Others 8.85 9.52
Write back of unclaimed balances / provisions 131.27 97.72
Profit on Sale of Fixed Assets 9.31 62.86
Write back of Provision for doubtful debts, deposits and other loans and advances - 76.10
Exchange gain (net) 744.75 1,733.23
Miscellaneous Income 45.47 72.92
Total 2,193.80 3,152.97
22. (Increase) / Decrease in Work - in - Progress Amount in ` lakhs
Particulars For the Year Ended March 31, 2015
For the Year Ended March 31, 2014
Opening balance of Work - in - Progress 147.48 285.36
Closing balance of Work - in - Progress 15.68 147.48
Total 131.80 137.88
Amount in ` lakhs
Details of Work - in - Progress For the Year Ended March 31, 2015
For the Year Ended March 31, 2014
Software Services 15.68 82.44
Network Engineering Services - 65.04
Total 15.68 147.48
23. Consumption of Raw Materials & Components Amount in ` lakhs
Particulars For the Year Ended March 31, 2015
For the Year Ended March 31, 2014
Opening balance of Raw Materials & Components 61.91 60.06
Add: Purchases 13.32 51.71
75.23 111.77
Closing balance of Raw Materials & Components 29.27 61.91
Total 45.96 49.86
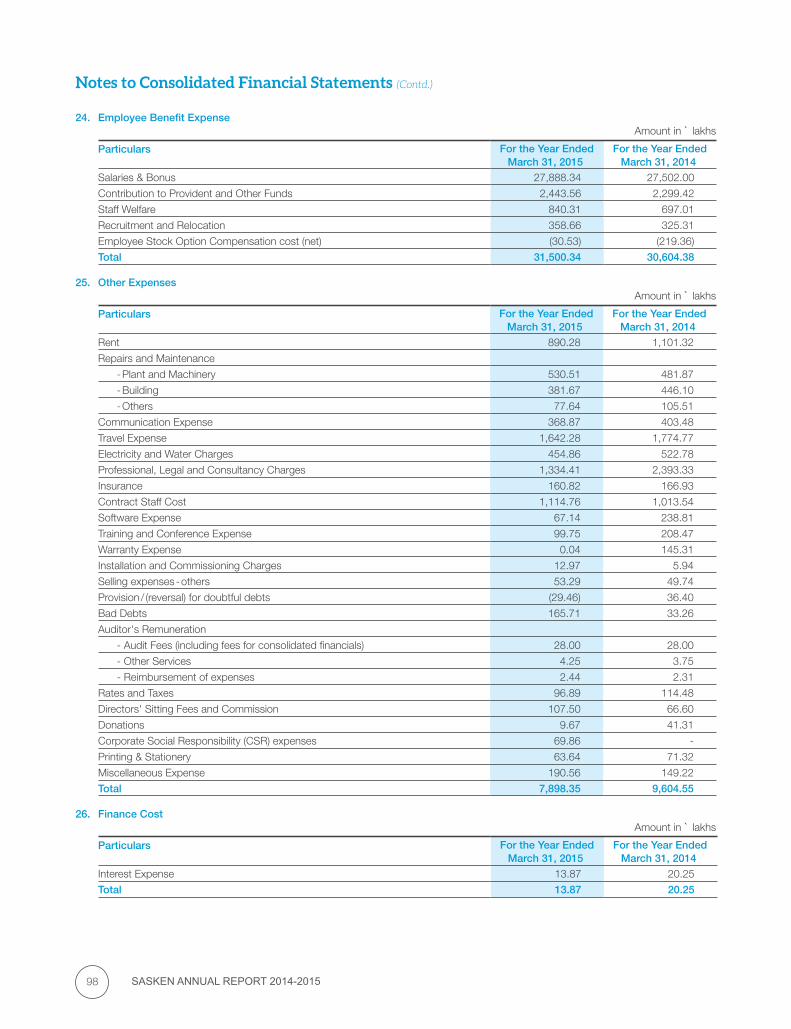
SASKEN ANNUAL REPORT 2014-201598
Notes to Consolidated Financial Statements (Contd.)
24. Employee Benefit Expense Amount in ` lakhs
Particulars For the Year Ended March 31, 2015
For the Year Ended March 31, 2014
Salaries & Bonus 27,888.34 27,502.00
Contribution to Provident and Other Funds 2,443.56 2,299.42
Staff Welfare 840.31 697.01
Recruitment and Relocation 358.66 325.31
Employee Stock Option Compensation cost (net) (30.53) (219.36)
Total 31,500.34 30,604.38
25. Other Expenses Amount in ` lakhs
Particulars For the Year Ended March 31, 2015
For the Year Ended March 31, 2014
Rent 890.28 1,101.32
Repairs and Maintenance
- Plant and Machinery 530.51 481.87
- Building 381.67 446.10
- Others 77.64 105.51
Communication Expense 368.87 403.48
Travel Expense 1,642.28 1,774.77
Electricity and Water Charges 454.86 522.78
Professional, Legal and Consultancy Charges 1,334.41 2,393.33
Insurance 160.82 166.93
Contract Staff Cost 1,114.76 1,013.54
Software Expense 67.14 238.81
Training and Conference Expense 99.75 208.47
Warranty Expense 0.04 145.31
Installation and Commissioning Charges 12.97 5.94
Selling expenses - others 53.29 49.74
Provision / (reversal) for doubtful debts (29.46) 36.40
Bad Debts 165.71 33.26
Auditor's Remuneration
- Audit Fees (including fees for consolidated financials) 28.00 28.00
- Other Services 4.25 3.75
- Reimbursement of expenses 2.44 2.31
Rates and Taxes 96.89 114.48
Directors' Sitting Fees and Commission 107.50 66.60
Donations 9.67 41.31
Corporate Social Responsibility (CSR) expenses 69.86 -
Printing & Stationery 63.64 71.32
Miscellaneous Expense 190.56 149.22
Total 7,898.35 9,604.55
26. Finance Cost Amount in ` lakhs
Particulars For the Year Ended March 31, 2015
For the Year Ended March 31, 2014
Interest Expense 13.87 20.25
Total 13.87 20.25
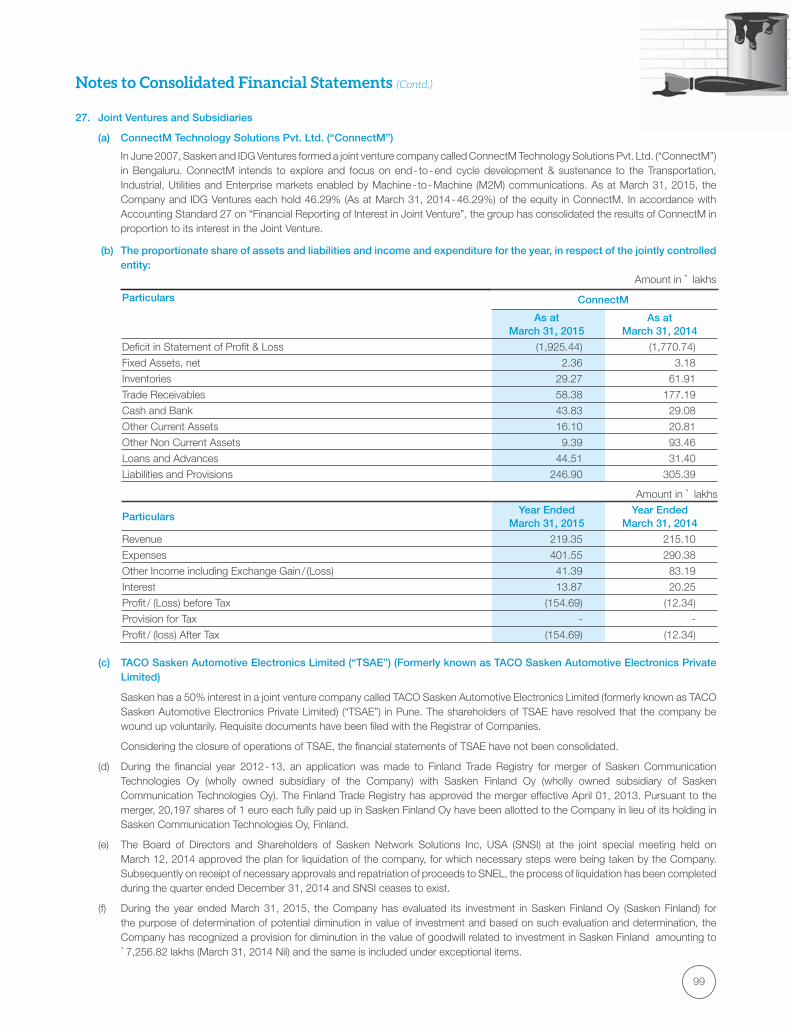
99
Notes to Consolidated Financial Statements (Contd.)
27. Joint Ventures and Subsidiaries
(a) ConnectM Technology Solutions Pvt. Ltd. (“ConnectM”)
In June 2007, Sasken and IDG Ventures formed a joint venture company called ConnectM Technology Solutions Pvt. Ltd. (“ConnectM”) in Bengaluru. ConnectM intends to explore and focus on end - to - end cycle development & sustenance to the Transportation, Industrial, Utilities and Enterprise markets enabled by Machine - to - Machine (M2M) communications. As at March 31, 2015, the Company and IDG Ventures each hold 46.29% (As at March 31, 2014 - 46.29%) of the equity in ConnectM. In accordance with Accounting Standard 27 on “Financial Reporting of Interest in Joint Venture”, the group has consolidated the results of ConnectM in proportion to its interest in the Joint Venture.
(b) The proportionate share of assets and liabilities and income and expenditure for the year, in respect of the jointly controlled entity:
Amount in ` lakhs
Particulars ConnectM
As atMarch 31, 2015
As atMarch 31, 2014
Deficit in Statement of Profit & Loss (1,925.44) (1,770.74)
Fixed Assets, net 2.36 3.18
Inventories 29.27 61.91
Trade Receivables 58.38 177.19
Cash and Bank 43.83 29.08
Other Current Assets 16.10 20.81
Other Non Current Assets 9.39 93.46
Loans and Advances 44.51 31.40
Liabilities and Provisions 246.90 305.39
Amount in ` lakhs
ParticularsYear Ended
March 31, 2015Year Ended
March 31, 2014
Revenue 219.35 215.10
Expenses 401.55 290.38
Other Income including Exchange Gain / (Loss) 41.39 83.19
Interest 13.87 20.25
Profit / (Loss) before Tax (154.69) (12.34)
Provision for Tax - -
Profit / (loss) After Tax (154.69) (12.34)
(c) TACO Sasken Automotive Electronics Limited (“TSAE”) (Formerly known as TACO Sasken Automotive Electronics Private Limited)
Sasken has a 50% interest in a joint venture company called TACO Sasken Automotive Electronics Limited (formerly known as TACO Sasken Automotive Electronics Private Limited) (“TSAE”) in Pune. The shareholders of TSAE have resolved that the company be wound up voluntarily. Requisite documents have been filed with the Registrar of Companies.
Considering the closure of operations of TSAE, the financial statements of TSAE have not been consolidated.
(d) During the financial year 2012 - 13, an application was made to Finland Trade Registry for merger of Sasken Communication Technologies Oy (wholly owned subsidiary of the Company) with Sasken Finland Oy (wholly owned subsidiary of Sasken Communication Technologies Oy). The Finland Trade Registry has approved the merger effective April 01, 2013. Pursuant to the merger, 20,197 shares of 1 euro each fully paid up in Sasken Finland Oy have been allotted to the Company in lieu of its holding in Sasken Communication Technologies Oy, Finland.
(e) The Board of Directors and Shareholders of Sasken Network Solutions Inc, USA (SNSI) at the joint special meeting held on March 12, 2014 approved the plan for liquidation of the company, for which necessary steps were being taken by the Company. Subsequently on receipt of necessary approvals and repatriation of proceeds to SNEL, the process of liquidation has been completed during the quarter ended December 31, 2014 and SNSI ceases to exist.
(f) During the year ended March 31, 2015, the Company has evaluated its investment in Sasken Finland Oy (Sasken Finland) for the purpose of determination of potential diminution in value of investment and based on such evaluation and determination, the Company has recognized a provision for diminution in the value of goodwill related to investment in Sasken Finland amounting to `7,256.82 lakhs (March 31, 2014 Nil) and the same is included under exceptional items.
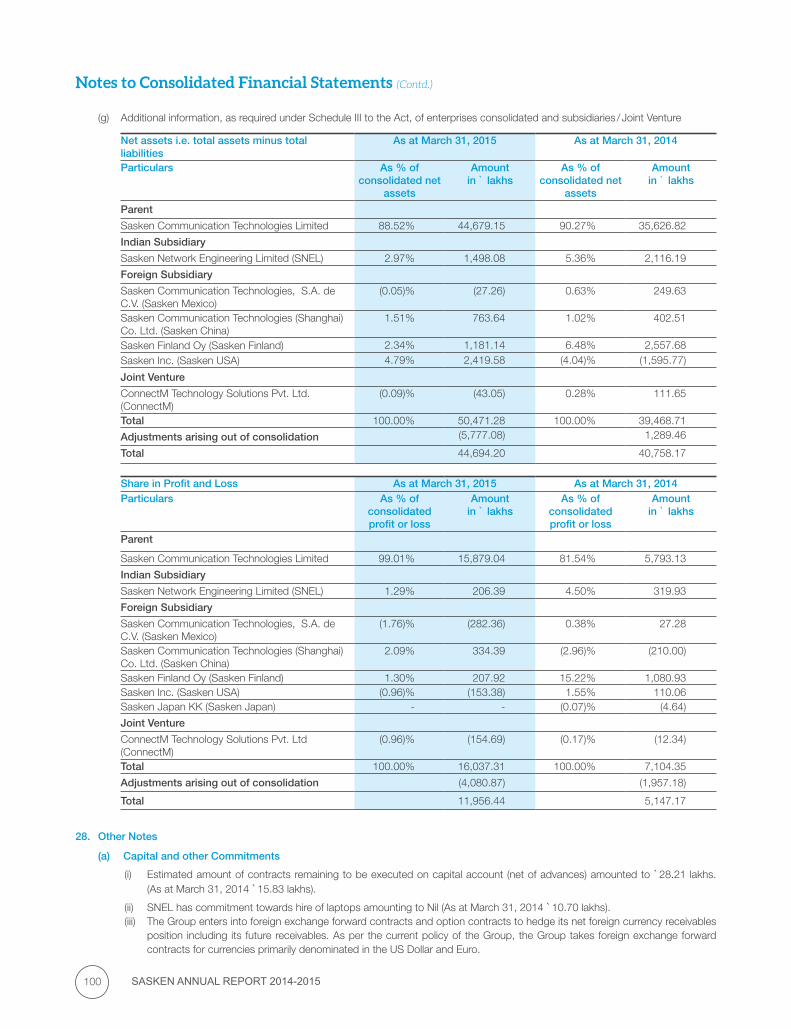
SASKEN ANNUAL REPORT 2014-2015100
Notes to Consolidated Financial Statements (Contd.)
(g) Additional information, as required under Schedule III to the Act, of enterprises consolidated and subsidiaries / Joint Venture
Net assets i.e. total assets minus totalliabilities
As at March 31, 2015 As at March 31, 2014
Particulars As % ofconsolidated net
assets
Amountin ` lakhs
As % of consolidated net
assets
Amountin ` lakhs
Parent
Sasken Communication Technologies Limited 88.52% 44,679.15 90.27% 35,626.82
Indian Subsidiary
Sasken Network Engineering Limited (SNEL) 2.97% 1,498.08 5.36% 2,116.19
Foreign Subsidiary
Sasken Communication Technologies, S.A. de C.V. (Sasken Mexico)
(0.05)% (27.26) 0.63% 249.63
Sasken Communication Technologies (Shanghai) Co. Ltd. (Sasken China)
1.51% 763.64 1.02% 402.51
Sasken Finland Oy (Sasken Finland) 2.34% 1,181.14 6.48% 2,557.68 Sasken Inc. (Sasken USA) 4.79% 2,419.58 (4.04)% (1,595.77)
Joint Venture
ConnectM Technology Solutions Pvt. Ltd.(ConnectM)
(0.09)% (43.05) 0.28% 111.65
Total 100.00% 50,471.28 100.00% 39,468.71
Adjustments arising out of consolidation (5,777.08) 1,289.46
Total 44,694.20 40,758.17
Share in Profit and Loss As at March 31, 2015 As at March 31, 2014Particulars As % of
consolidated profit or loss
Amountin ` lakhs
As % of consolidated profit or loss
Amountin ` lakhs
Parent
Sasken Communication Technologies Limited 99.01% 15,879.04 81.54% 5,793.13
Indian Subsidiary
Sasken Network Engineering Limited (SNEL) 1.29% 206.39 4.50% 319.93
Foreign Subsidiary
Sasken Communication Technologies, S.A. de C.V. (Sasken Mexico)
(1.76)% (282.36) 0.38% 27.28
Sasken Communication Technologies (Shanghai) Co. Ltd. (Sasken China)
2.09% 334.39 (2.96)% (210.00)
Sasken Finland Oy (Sasken Finland) 1.30% 207.92 15.22% 1,080.93 Sasken Inc. (Sasken USA) (0.96)% (153.38) 1.55% 110.06 Sasken Japan KK (Sasken Japan) - - (0.07)% (4.64)
Joint Venture
ConnectM Technology Solutions Pvt. Ltd(ConnectM)
(0.96)% (154.69) (0.17)% (12.34)
Total 100.00% 16,037.31 100.00% 7,104.35
Adjustments arising out of consolidation (4,080.87) (1,957.18)
Total 11,956.44 5,147.17
28. Other Notes
(a) Capital and other Commitments
(i) Estimated amount of contracts remaining to be executed on capital account (net of advances) amounted to `28.21 lakhs. (As at March 31, 2014 `15.83 lakhs).
(ii) SNEL has commitment towards hire of laptops amounting to Nil (As at March 31, 2014 `10.70 lakhs).(iii) The Group enters into foreign exchange forward contracts and option contracts to hedge its net foreign currency receivables
position including its future receivables. As per the current policy of the Group, the Group takes foreign exchange forward contracts for currencies primarily denominated in the US Dollar and Euro.
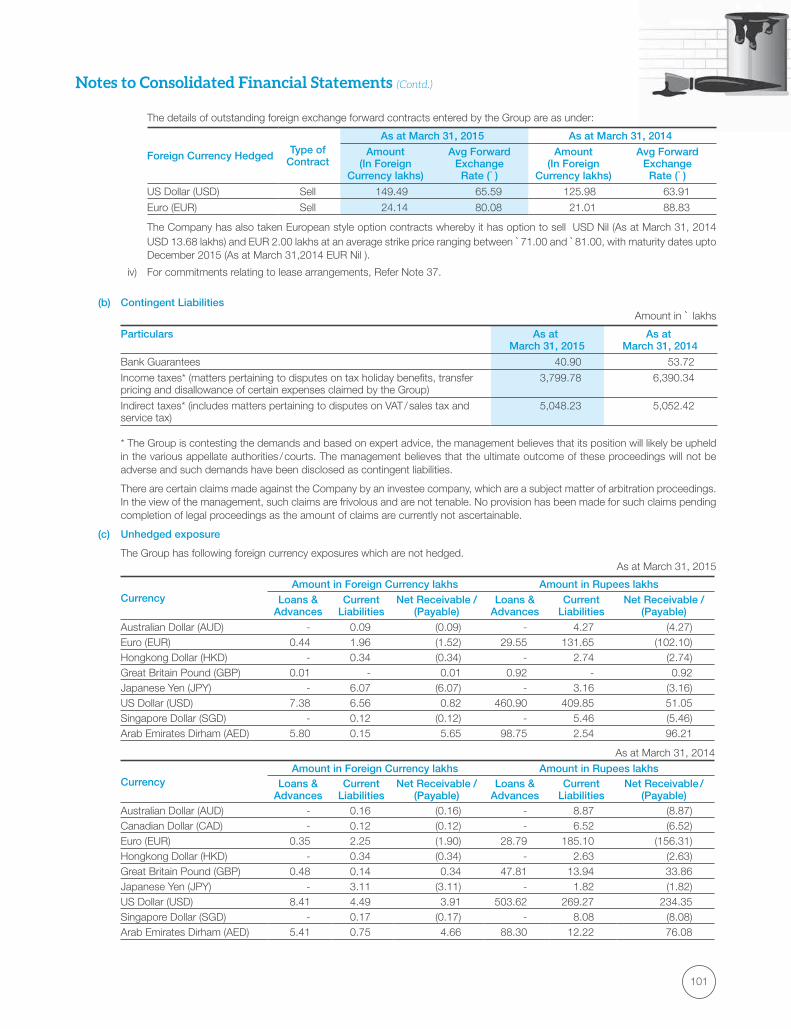
101
Notes to Consolidated Financial Statements (Contd.)
The details of outstanding foreign exchange forward contracts entered by the Group are as under:
Foreign Currency Hedged Type of Contract
As at March 31, 2015 As at March 31, 2014
Amount (In Foreign
Currency lakhs)
Avg Forward Exchange Rate (`)
Amount (In Foreign
Currency lakhs)
Avg Forward ExchangeRate (`)
US Dollar (USD) Sell 149.49 65.59 125.98 63.91
Euro (EUR) Sell 24.14 80.08 21.01 88.83
The Company has also taken European style option contracts whereby it has option to sell USD Nil (As at March 31, 2014 USD 13.68 lakhs) and EUR 2.00 lakhs at an average strike price ranging between `71.00 and `81.00, with maturity dates upto December 2015 (As at March 31,2014 EUR Nil ).
iv) For commitments relating to lease arrangements, Refer Note 37.
(b) Contingent LiabilitiesAmount in ` lakhs
Particulars As at March 31, 2015
As at March 31, 2014
Bank Guarantees 40.90 53.72
Income taxes* (matters pertaining to disputes on tax holiday benefits, transfer pricing and disallowance of certain expenses claimed by the Group)
3,799.78 6,390.34
Indirect taxes* (includes matters pertaining to disputes on VAT / sales tax and service tax)
5,048.23 5,052.42
* The Group is contesting the demands and based on expert advice, the management believes that its position will likely be upheld in the various appellate authorities / courts. The management believes that the ultimate outcome of these proceedings will not be adverse and such demands have been disclosed as contingent liabilities.
There are certain claims made against the Company by an investee company, which are a subject matter of arbitration proceedings. In the view of the management, such claims are frivolous and are not tenable. No provision has been made for such claims pending completion of legal proceedings as the amount of claims are currently not ascertainable.
(c) Unhedged exposure
The Group has following foreign currency exposures which are not hedged.As at March 31, 2015
Currency Amount in Foreign Currency lakhs Amount in Rupees lakhs
Loans & Advances
Current Liabilities
Net Receivable / (Payable)
Loans & Advances
Current Liabilities
Net Receivable /(Payable)
Australian Dollar (AUD) - 0.09 (0.09) - 4.27 (4.27)Euro (EUR) 0.44 1.96 (1.52) 29.55 131.65 (102.10)Hongkong Dollar (HKD) - 0.34 (0.34) - 2.74 (2.74)Great Britain Pound (GBP) 0.01 - 0.01 0.92 - 0.92 Japanese Yen (JPY) - 6.07 (6.07) - 3.16 (3.16)US Dollar (USD) 7.38 6.56 0.82 460.90 409.85 51.05 Singapore Dollar (SGD) - 0.12 (0.12) - 5.46 (5.46)Arab Emirates Dirham (AED) 5.80 0.15 5.65 98.75 2.54 96.21
As at March 31, 2014
Currency Amount in Foreign Currency lakhs Amount in Rupees lakhs
Loans & Advances
Current Liabilities
Net Receivable / (Payable)
Loans & Advances
Current Liabilities
Net Receivable /(Payable)
Australian Dollar (AUD) - 0.16 (0.16) - 8.87 (8.87)Canadian Dollar (CAD) - 0.12 (0.12) - 6.52 (6.52)Euro (EUR) 0.35 2.25 (1.90) 28.79 185.10 (156.31)Hongkong Dollar (HKD) - 0.34 (0.34) - 2.63 (2.63)Great Britain Pound (GBP) 0.48 0.14 0.34 47.81 13.94 33.86 Japanese Yen (JPY) - 3.11 (3.11) - 1.82 (1.82)US Dollar (USD) 8.41 4.49 3.91 503.62 269.27 234.35 Singapore Dollar (SGD) - 0.17 (0.17) - 8.08 (8.08)Arab Emirates Dirham (AED) 5.41 0.75 4.66 88.30 12.22 76.08

SASKEN ANNUAL REPORT 2014-2015102
Notes to Consolidated Financial Statements (Contd.)
(d) Based on the Special Resolution passed by the Company on November 8, 2013, the Company allotted on preferential basis 12,00,000 convertible warrants, on November 18, 2013, to Ms. Ira Bhaduri in her capacity as Trustee of Lahiri Family Trust, of which Mr. Anjan Lahiri, former Whole Time Director and CEO of the Company, is the Managing Trustee. The allottee was entitled to one equity share of `10 each of the Company for each such warrant at a price of `120.25 each and 25% of the price amounting to `360.75 lakhs was received as application money. The allottee exercised 10,40,000 options and paid `937.95 lakhs towards the balance 75% of the application money and as the proposed allotment / conversion was not to be proceeded with, this amount of `937.95 lakhs has been refunded and the stock exchanges have been informed about the non - conversion / allotment.
The Company had sought informal guidance from Securities and Exchange Board of India (“SEBI”) on whether the 25% should be forfeited or can be refunded and if so, the procedural formalities in connection with that. SEBI vide its letter dated February 23, 2015 expressed its inability to issue any guidance in the matter. The Company was advised that since SEBI has not expressed any opinion despite having placed all the relevant facts and materials, the Company could proceed to effect the refund in its entirety. Accordingly the Board at its meeting on April 13, 2015 approved refund of the application amount and the interest accrued and the whole amount was paid on April 14, 2015.
(e) Employee Benefits:
(i) The Group contributed the following amounts to defined contribution plans: Amount in ` lakhs
ParticularsYear Ended
March 31, 2015Year Ended
March 31, 2014
Superannuation Fund 28.89 27.17
Other Social Security Contributions 1,603.44 1,545.84
(ii) Defined Benefit Plans:
(a) Gratuity
Net employee benefit expense (in the Statement of Profit and Loss under the head Salaries and Bonus): Amount in ` lakhs
ParticularsYear Ended
March 31, 2015Year Ended
March 31, 2014
Current Service Cost 84.14 111.95
Interest Cost 77.04 95.84
Expected return on Plan Assets (89.07) (84.22)
Actuarial (Gain) / Loss 87.97 (65.27)
Total 160.08 58.30
Liability / (Asset) recognized in the Balance Sheet: Amount in ` lakhs
ParticularsAs at
March 31, 2015As at
March 31, 2014
Present value of the Defined Benefit Obligation 1,246.10 1,129.37
Plan Assets at the end of the year, at fair value 1,108.20 1,118.51
Liability / (Asset) recognized in the Balance Sheet 137.90 10.86
Changes in the present value of Defined Benefit obligation are as follows: Amount in ` lakhs
ParticularsAs at
March 31, 2015As at
March 31, 2014
Defined Benefit Obligations at beginning of the year 1,129.37 1,157.75
Current Service Cost 84.14 111.95
Interest Cost 77.04 95.84
Benefits Paid (264.86) (175.37)
Actuarial (gain) / loss 220.41 (60.80)
Defined Benefit Obligations at the end of the year 1,246.10 1,129.37

103
Notes to Consolidated Financial Statements (Contd.)
Changes in the fair value of Plan Assets are as follows: Amount in ` lakhs
ParticularsAs at
March 31, 2015As at
March 31, 2014
Plan Assets at the beginning of the year at fair value 1,118.51 986.92
Contributions 33.04 218.27
Expected return on Plan Assets 89.07 84.22
Actuarial Gain / (Loss) 132.44 4.47
Benefits Paid (264.86) (175.37)
Plan Assets at the end of the year at fair value 1,108.20 1,118.51
Actual Return on Plan Assets 221.51 88.69
The principal assumptions used in determining gratuity obligations for the Company’s plan are shown below:
ParticularsAs at
March 31, 2015As at
March 31, 2014Interest Rate for discount (p.a.) 7.90% 8.97%Salary increase (p.a.) 5.00% 5.00%Estimated Rate of Return on Plan Assets (p.a.) 8.00% 8.00%
Experience adjustments are as follows: Amount in ` lakhs
Particulars As atMarch 31, 2015
As atMarch 31, 2014
As atMarch 31, 2013
As atMarch 31, 2012
As atMarch 31, 2011
Defined Benefit Obligation 1,246.10 1,129.37 1,157.75 1,104.34 982.22
Plan Assets 1,108.20 1,118.51 986.92 945.61 844.88
(Surplus) / Deficit 137.90 10.86 170.83 158.73 137.34
Experience (Gain) / Loss adjustments on Plan Liabilities
131.82 16.10 (16.20) (179.66) (8.92)
Experience Gain / (Loss) adjustments on Plan Assets
132.44 4.47 12.41 31.79 (28.42)
The major categories of Plan Assets as a percentage of the Total Plan Assets are as follows:
ParticularsAs at
March 31, 2015As at
March 31, 2014
Investment with insurers managed funds 100.00% 100.00%
(b) Pension
Net Employee Benefit Expense (in Statement of Profit and Loss under the head Contribution to Provident and other funds):
Amount in ` lakhs
ParticularsYear Ended
March 31, 2015Year Ended
March 31, 2014
Current Service Cost - -
Interest Cost 29.49 35.75
Expected return on Plan Assets (18.59) (24.52)
Actuarial (Gain) / Loss 68.51 101.52
Total 79.41 112.75
Liability / (Asset) recognized in the Balance Sheet: Amount in ` lakhs
ParticularsAs at
March 31, 2015As at
March 31, 2014
Present value of the Defined Benefit Obligation 972.14 1,070.42
Plan Assets at the end of the year, at fair value 578.58 674.60
Liability / (Asset) recognized in the Balance Sheet 393.56 395.82
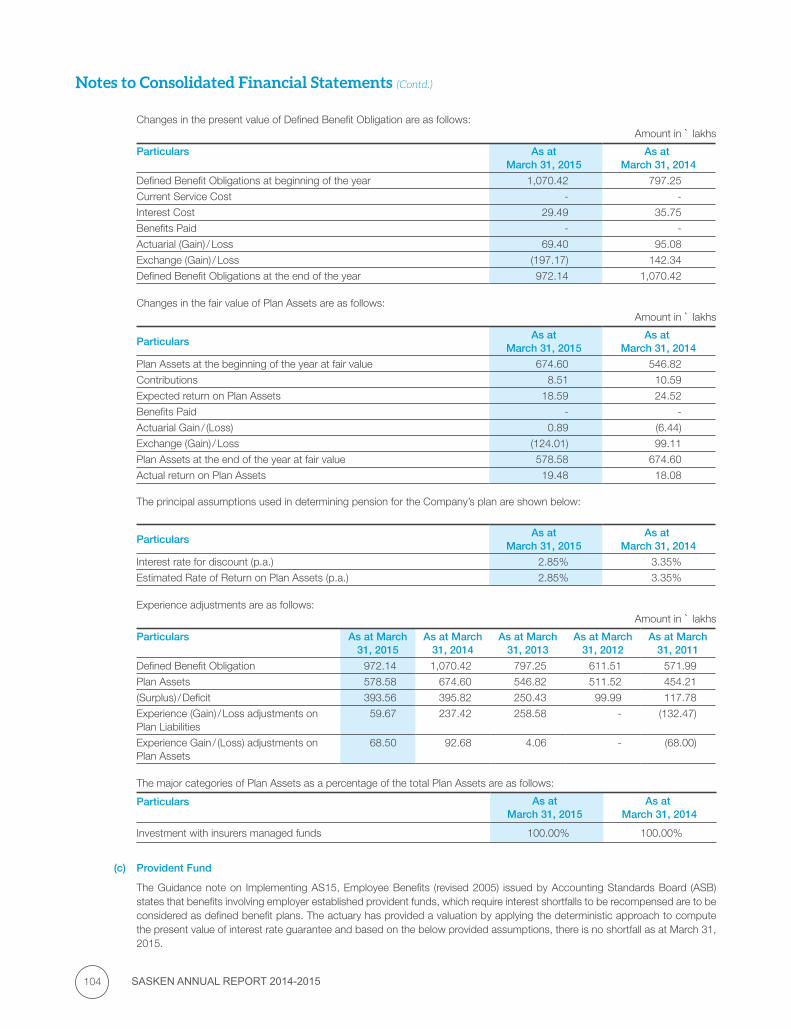
SASKEN ANNUAL REPORT 2014-2015104
Notes to Consolidated Financial Statements (Contd.)
Changes in the present value of Defined Benefit Obligation are as follows: Amount in ` lakhs
Particulars As atMarch 31, 2015
As at March 31, 2014
Defined Benefit Obligations at beginning of the year 1,070.42 797.25
Current Service Cost - -
Interest Cost 29.49 35.75
Benefits Paid - -
Actuarial (Gain) / Loss 69.40 95.08
Exchange (Gain) / Loss (197.17) 142.34
Defined Benefit Obligations at the end of the year 972.14 1,070.42
Changes in the fair value of Plan Assets are as follows: Amount in ` lakhs
ParticularsAs at
March 31, 2015As at
March 31, 2014
Plan Assets at the beginning of the year at fair value 674.60 546.82
Contributions 8.51 10.59
Expected return on Plan Assets 18.59 24.52
Benefits Paid - -
Actuarial Gain / (Loss) 0.89 (6.44)
Exchange (Gain) / Loss (124.01) 99.11
Plan Assets at the end of the year at fair value 578.58 674.60
Actual return on Plan Assets 19.48 18.08
The principal assumptions used in determining pension for the Company’s plan are shown below:
ParticularsAs at
March 31, 2015As at
March 31, 2014
Interest rate for discount (p.a.) 2.85% 3.35%
Estimated Rate of Return on Plan Assets (p.a.) 2.85% 3.35%
Experience adjustments are as follows:Amount in ` lakhs
Particulars As at March 31, 2015
As at March 31, 2014
As at March 31, 2013
As at March31, 2012
As at March 31, 2011
Defined Benefit Obligation 972.14 1,070.42 797.25 611.51 571.99
Plan Assets 578.58 674.60 546.82 511.52 454.21
(Surplus) / Deficit 393.56 395.82 250.43 99.99 117.78
Experience (Gain) / Loss adjustments on Plan Liabilities
59.67 237.42 258.58 - (132.47)
Experience Gain / (Loss) adjustments on Plan Assets
68.50 92.68 4.06 - (68.00)
The major categories of Plan Assets as a percentage of the total Plan Assets are as follows:
Particulars As atMarch 31, 2015
As at March 31, 2014
Investment with insurers managed funds 100.00% 100.00%
(c) Provident Fund
The Guidance note on Implementing AS15, Employee Benefits (revised 2005) issued by Accounting Standards Board (ASB) states that benefits involving employer established provident funds, which require interest shortfalls to be recompensed are to be considered as defined benefit plans. The actuary has provided a valuation by applying the deterministic approach to compute the present value of interest rate guarantee and based on the below provided assumptions, there is no shortfall as at March 31, 2015.
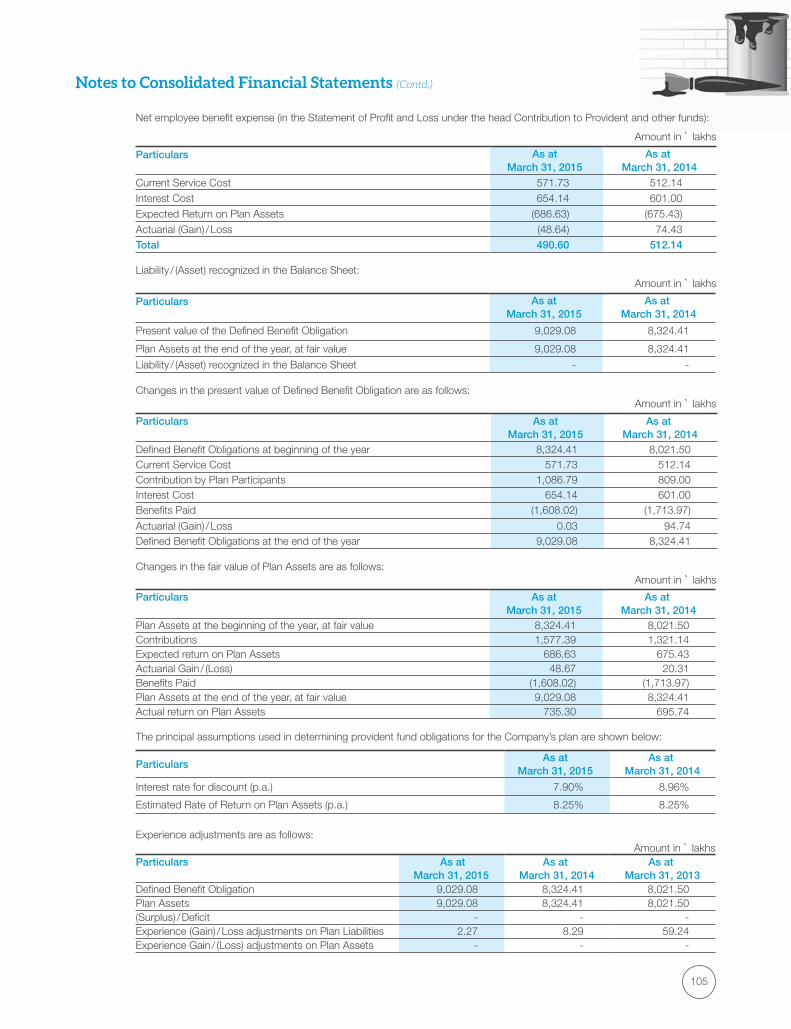
105
Notes to Consolidated Financial Statements (Contd.)
Net employee benefit expense (in the Statement of Profit and Loss under the head Contribution to Provident and other funds):
Amount in ` lakhs
Particulars As atMarch 31, 2015
As at March 31, 2014
Current Service Cost 571.73 512.14 Interest Cost 654.14 601.00 Expected Return on Plan Assets (686.63) (675.43)Actuarial (Gain) / Loss (48.64) 74.43 Total 490.60 512.14
Liability / (Asset) recognized in the Balance Sheet:Amount in ` lakhs
Particulars As atMarch 31, 2015
As at March 31, 2014
Present value of the Defined Benefit Obligation 9,029.08 8,324.41
Plan Assets at the end of the year, at fair value 9,029.08 8,324.41
Liability / (Asset) recognized in the Balance Sheet - -
Changes in the present value of Defined Benefit Obligation are as follows:Amount in ` lakhs
Particulars As atMarch 31, 2015
As at March 31, 2014
Defined Benefit Obligations at beginning of the year 8,324.41 8,021.50 Current Service Cost 571.73 512.14 Contribution by Plan Participants 1,086.79 809.00 Interest Cost 654.14 601.00 Benefits Paid (1,608.02) (1,713.97)
Actuarial (Gain) / Loss 0.03 94.74 Defined Benefit Obligations at the end of the year 9,029.08 8,324.41
Changes in the fair value of Plan Assets are as follows:Amount in ` lakhs
Particulars As atMarch 31, 2015
As at March 31, 2014
Plan Assets at the beginning of the year, at fair value 8,324.41 8,021.50 Contributions 1,577.39 1,321.14 Expected return on Plan Assets 686.63 675.43 Actuarial Gain / (Loss) 48.67 20.31 Benefits Paid (1,608.02) (1,713.97)Plan Assets at the end of the year, at fair value 9,029.08 8,324.41 Actual return on Plan Assets 735.30 695.74
The principal assumptions used in determining provident fund obligations for the Company’s plan are shown below:
ParticularsAs at
March 31, 2015As at
March 31, 2014
Interest rate for discount (p.a.) 7.90% 8.96%
Estimated Rate of Return on Plan Assets (p.a.) 8.25% 8.25%
Experience adjustments are as follows:Amount in ` lakhs
Particulars As at March 31, 2015
As at March 31, 2014
As at March 31, 2013
Defined Benefit Obligation 9,029.08 8,324.41 8,021.50 Plan Assets 9,029.08 8,324.41 8,021.50 (Surplus) / Deficit - - - Experience (Gain) / Loss adjustments on Plan Liabilities 2.27 8.29 59.24 Experience Gain / (Loss) adjustments on Plan Assets - - -

SASKEN ANNUAL REPORT 2014-2015106
Notes to Consolidated Financial Statements (Contd.)
The major categories of Plan Assets as a percentage of the fair value of total Plan Assets are as follows:
Particulars As atMarch 31, 2015
As at March 31, 2014
Government of India Securities 28.33% 26.96%
State Government Securities 21.56% 18.74%
PSU Securities 48.38% 48.78%
Others (including Bank Balances) 1.73% 5.52%
Notes:
(a) Assumptions relating to future salary increases, attrition, etc. have been considered based on relevant economic factors such as inflation, market growth, etc.
(b) The Group expects to contribute `150.00 lakhs (March 31, 2014 `Nil lakhs) to gratuity, `9.00 lakhs (March 31, 2014 `9.00 lakhs) to pension and `750 lakhs (March 31, 2014 `750.00 lakhs) to provident fund in the subsequent year.
(c) The overall return on assets is determined based on prevailing market price.
29. Provision for tax expenses
The provision for taxation includes tax liabilities in India on the Company’s global income as reduced by exempt incomes and any tax liabilities arising overseas on income sourced from those countries. Sasken’s operations are conducted through Software Technology Parks (‘STPs’) and Special Economic Zones (‘SEZs’). Income from SEZs is fully tax exempt for the first 5 years, 50% exempt for the next 5 years and 50% exempt for another 5 years subject to fulfilling certain conditions.
30. Employee Stock Option Plans (Equity Settled)
Sasken ESOP 2006
On February 25, 2006, the shareholders of the Company approved Stock Option Plan [ESOP - 2006] in accordance with the Guidelines issued by the Securities and Exchange Board of India (SEBI) for Employees Stock Option Plans. The Plan covers all employees of the Company including foreign branches, employees of the subsidiaries and Directors other than the promoter directors / employees. The Plan provides for the issue of 35,75,000 shares of `10 each duly adjusted for any bonus, splits, etc. Compensation Committee of the Board administers the scheme. The terms of each issuance would be determined by the Compensation Committee. The Options vest subject to continuation of employment.
The Company issues options convertible into equity shares of `10 each. The options issued till March 31, 2008 carry a vesting period of one to four years, options issued thereafter carry a vesting period one to three years except options issued on April 21, 2008 which carries a vesting period of one year. All the options granted have an exercise period of two years from the date of vesting except options issued on April 21, 2008 which have an exercise period of three months from the date of vesting.
Details of Option Plans
Date of issue No. of options issued Exercise Price (`)
17 - Jun - 2006 1,38,750 234 - 394
18 - Oct - 2006 1,50,000 234 - 394
1 - Jan - 2007 5,000 367 - 559
1 - Apr - 2007 2,35,000 475 - 667
1 - Jul - 2007 90,000 554 - 746
1 - Oct - 2007 10,000 410 - 602
21 - Apr - 2008 87,000 120
6 - Apr - 2009 18,60,000 52
15 - Jun - 2009 10,000 76
17 - Jul - 2009 80,000 52
19 - Sep - 2009 80,000 108
1 - Oct - 2009 60,000 155
21 - Jan - 2010 60,000 52
21 - Jan - 2010 30,000 155
30 - Apr - 2010 20,000 188
30 - Apr - 2010 70,000 190
26 - May - 2010 70,000 195
1 - Jul - 2010 3,90,000 200
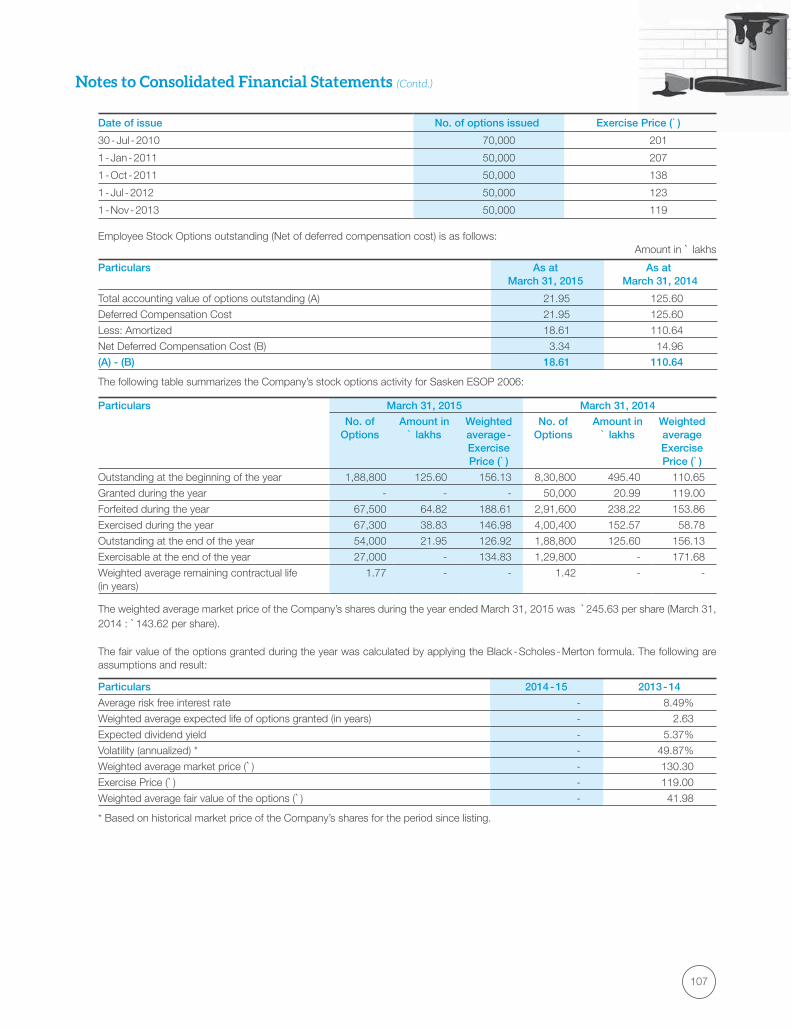
107
Notes to Consolidated Financial Statements (Contd.)
Date of issue No. of options issued Exercise Price (`)
30 - Jul - 2010 70,000 201
1 - Jan - 2011 50,000 207
1 - Oct - 2011 50,000 138
1 - Jul - 2012 50,000 123
1 - Nov - 2013 50,000 119
Employee Stock Options outstanding (Net of deferred compensation cost) is as follows:Amount in ` lakhs
Particulars As atMarch 31, 2015
As at March 31, 2014
Total accounting value of options outstanding (A) 21.95 125.60
Deferred Compensation Cost 21.95 125.60
Less: Amortized 18.61 110.64
Net Deferred Compensation Cost (B) 3.34 14.96
(A) - (B) 18.61 110.64
The following table summarizes the Company’s stock options activity for Sasken ESOP 2006:
Particulars March 31, 2015 March 31, 2014
No. ofOptions
Amount in ` lakhs
Weightedaverage -ExercisePrice (`)
No. ofOptions
Amount in ` lakhs
WeightedaverageExercisePrice (`)
Outstanding at the beginning of the year 1,88,800 125.60 156.13 8,30,800 495.40 110.65
Granted during the year - - - 50,000 20.99 119.00
Forfeited during the year 67,500 64.82 188.61 2,91,600 238.22 153.86
Exercised during the year 67,300 38.83 146.98 4,00,400 152.57 58.78
Outstanding at the end of the year 54,000 21.95 126.92 1,88,800 125.60 156.13
Exercisable at the end of the year 27,000 - 134.83 1,29,800 - 171.68
Weighted average remaining contractual life(in years)
1.77 - - 1.42 - -
The weighted average market price of the Company’s shares during the year ended March 31, 2015 was `245.63 per share (March 31, 2014 : `143.62 per share).
The fair value of the options granted during the year was calculated by applying the Black - Scholes - Merton formula. The following are assumptions and result:
Particulars 2014 - 15 2013 - 14
Average risk free interest rate - 8.49%
Weighted average expected life of options granted (in years) - 2.63
Expected dividend yield - 5.37%
Volatility (annualized) * - 49.87%
Weighted average market price (`) - 130.30
Exercise Price (`) - 119.00
Weighted average fair value of the options (`) - 41.98
* Based on historical market price of the Company’s shares for the period since listing.
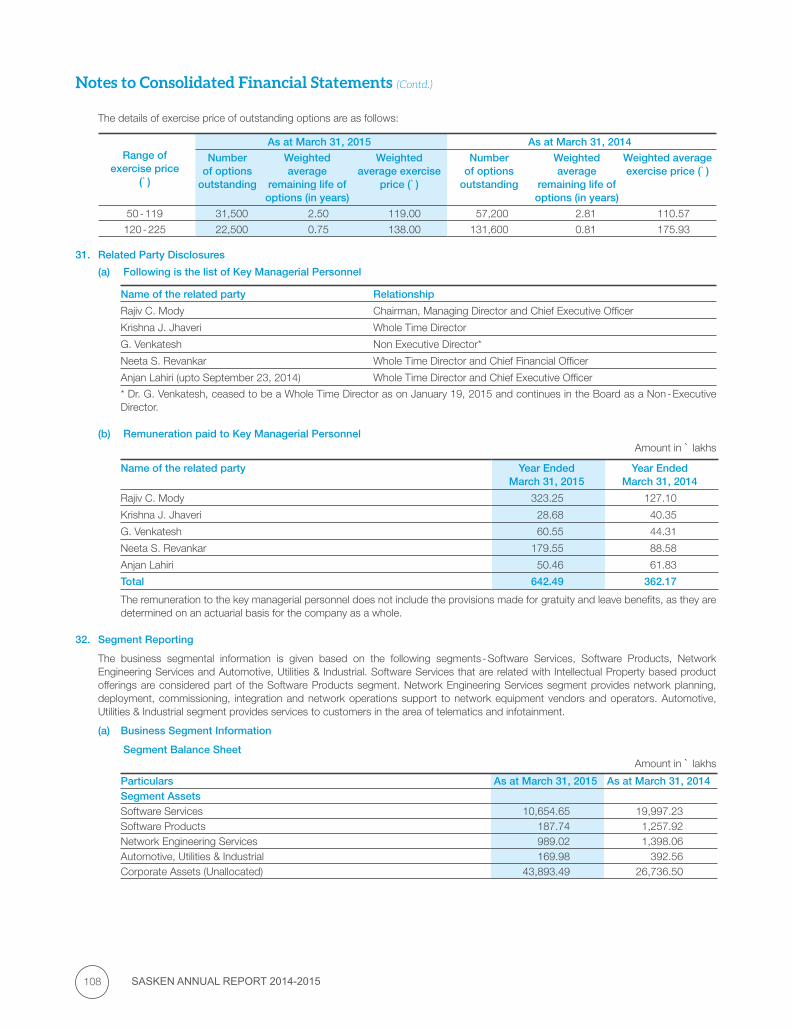
SASKEN ANNUAL REPORT 2014-2015108
Notes to Consolidated Financial Statements (Contd.)
The details of exercise price of outstanding options are as follows:
Range of
exercise price (`)
As at March 31, 2015 As at March 31, 2014
Number of options
outstanding
Weighted average
remaining life of options (in years)
Weighted average exercise
price (`)
Number of options
outstanding
Weighted average
remaining life of options (in years)
Weighted average exercise price (`)
50 - 119 31,500 2.50 119.00 57,200 2.81 110.57
120 - 225 22,500 0.75 138.00 131,600 0.81 175.93
31. Related Party Disclosures
(a) Following is the list of Key Managerial Personnel
Name of the related party Relationship
Rajiv C. Mody Chairman, Managing Director and Chief Executive Officer
Krishna J. Jhaveri Whole Time Director
G. Venkatesh Non Executive Director*
Neeta S. Revankar Whole Time Director and Chief Financial Officer
Anjan Lahiri (upto September 23, 2014) Whole Time Director and Chief Executive Officer
* Dr. G. Venkatesh, ceased to be a Whole Time Director as on January 19, 2015 and continues in the Board as a Non - Executive Director.
(b) Remuneration paid to Key Managerial PersonnelAmount in ` lakhs
Name of the related party Year EndedMarch 31, 2015
Year EndedMarch 31, 2014
Rajiv C. Mody 323.25 127.10
Krishna J. Jhaveri 28.68 40.35
G. Venkatesh 60.55 44.31
Neeta S. Revankar 179.55 88.58
Anjan Lahiri 50.46 61.83
Total 642.49 362.17
The remuneration to the key managerial personnel does not include the provisions made for gratuity and leave benefits, as they are determined on an actuarial basis for the company as a whole.
32. Segment Reporting
The business segmental information is given based on the following segments - Software Services, Software Products, Network Engineering Services and Automotive, Utilities & Industrial. Software Services that are related with Intellectual Property based product offerings are considered part of the Software Products segment. Network Engineering Services segment provides network planning, deployment, commissioning, integration and network operations support to network equipment vendors and operators. Automotive, Utilities & Industrial segment provides services to customers in the area of telematics and infotainment.
(a) Business Segment Information
Segment Balance SheetAmount in ` lakhs
Particulars As at March 31, 2015 As at March 31, 2014Segment AssetsSoftware Services 10,654.65 19,997.23 Software Products 187.74 1,257.92 Network Engineering Services 989.02 1,398.06 Automotive, Utilities & Industrial 169.98 392.56 Corporate Assets (Unallocated) 43,893.49 26,736.50
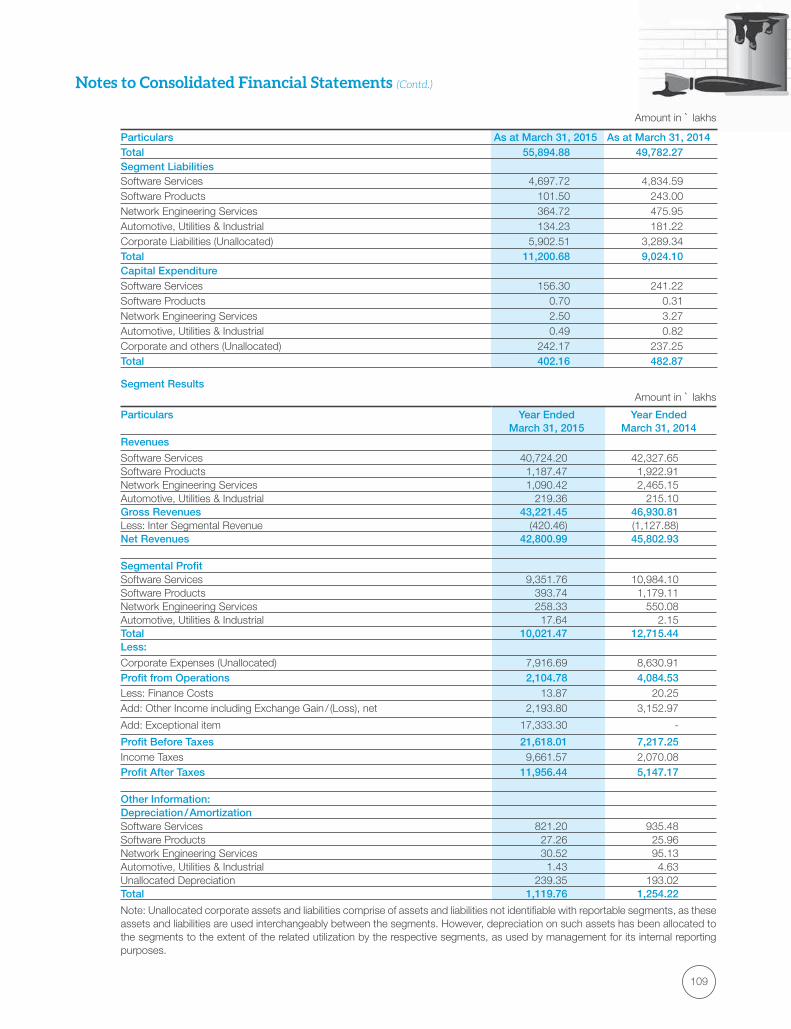
109
Amount in ` lakhs
Notes to Consolidated Financial Statements (Contd.)
Particulars As at March 31, 2015 As at March 31, 2014Total 55,894.88 49,782.27 Segment LiabilitiesSoftware Services 4,697.72 4,834.59 Software Products 101.50 243.00 Network Engineering Services 364.72 475.95 Automotive, Utilities & Industrial 134.23 181.22 Corporate Liabilities (Unallocated) 5,902.51 3,289.34 Total 11,200.68 9,024.10 Capital Expenditure Software Services 156.30 241.22 Software Products 0.70 0.31 Network Engineering Services 2.50 3.27 Automotive, Utilities & Industrial 0.49 0.82 Corporate and others (Unallocated) 242.17 237.25 Total 402.16 482.87
Segment ResultsAmount in ` lakhs
Particulars Year EndedMarch 31, 2015
Year EndedMarch 31, 2014
Revenues
Software Services 40,724.20 42,327.65 Software Products 1,187.47 1,922.91 Network Engineering Services 1,090.42 2,465.15 Automotive, Utilities & Industrial 219.36 215.10 Gross Revenues 43,221.45 46,930.81 Less: Inter Segmental Revenue (420.46) (1,127.88)Net Revenues 42,800.99 45,802.93
Segmental Profit Software Services 9,351.76 10,984.10 Software Products 393.74 1,179.11 Network Engineering Services 258.33 550.08 Automotive, Utilities & Industrial 17.64 2.15 Total 10,021.47 12,715.44 Less:
Corporate Expenses (Unallocated) 7,916.69 8,630.91 Profit from Operations 2,104.78 4,084.53 Less: Finance Costs 13.87 20.25 Add: Other Income including Exchange Gain / (Loss), net 2,193.80 3,152.97
Add: Exceptional item 17,333.30 -
Profit Before Taxes 21,618.01 7,217.25 Income Taxes 9,661.57 2,070.08 Profit After Taxes 11,956.44 5,147.17
Other Information: Depreciation / Amortization Software Services 821.20 935.48 Software Products 27.26 25.96 Network Engineering Services 30.52 95.13 Automotive, Utilities & Industrial 1.43 4.63 Unallocated Depreciation 239.35 193.02 Total 1,119.76 1,254.22
Note: Unallocated corporate assets and liabilities comprise of assets and liabilities not identifiable with reportable segments, as these assets and liabilities are used interchangeably between the segments. However, depreciation on such assets has been allocated to the segments to the extent of the related utilization by the respective segments, as used by management for its internal reporting purposes.
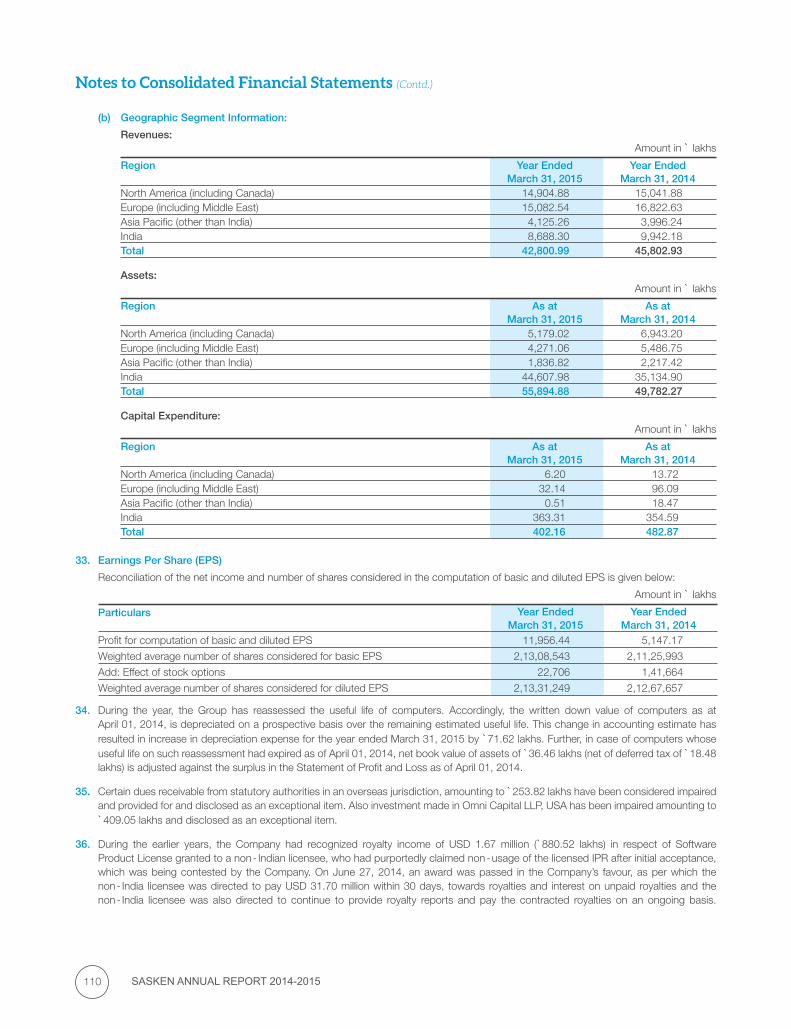
SASKEN ANNUAL REPORT 2014-2015110
(b) Geographic Segment Information:
Revenues:Amount in ` lakhs
Region Year EndedMarch 31, 2015
Year EndedMarch 31, 2014
North America (including Canada) 14,904.88 15,041.88 Europe (including Middle East) 15,082.54 16,822.63 Asia Pacific (other than India) 4,125.26 3,996.24 India 8,688.30 9,942.18 Total 42,800.99 45,802.93
Assets:Amount in ` lakhs
Region As atMarch 31, 2015
As atMarch 31, 2014
North America (including Canada) 5,179.02 6,943.20 Europe (including Middle East) 4,271.06 5,486.75 Asia Pacific (other than India) 1,836.82 2,217.42 India 44,607.98 35,134.90 Total 55,894.88 49,782.27
Capital Expenditure:Amount in ` lakhs
Region As atMarch 31, 2015
As atMarch 31, 2014
North America (including Canada) 6.20 13.72 Europe (including Middle East) 32.14 96.09 Asia Pacific (other than India) 0.51 18.47 India 363.31 354.59 Total 402.16 482.87
33. Earnings Per Share (EPS)
Reconciliation of the net income and number of shares considered in the computation of basic and diluted EPS is given below:
Amount in ` lakhs
Particulars Year EndedMarch 31, 2015
Year EndedMarch 31, 2014
Profit for computation of basic and diluted EPS 11,956.44 5,147.17
Weighted average number of shares considered for basic EPS 2,13,08,543 2,11,25,993
Add: Effect of stock options 22,706 1,41,664
Weighted average number of shares considered for diluted EPS 2,13,31,249 2,12,67,657
34. During the year, the Group has reassessed the useful life of computers. Accordingly, the written down value of computers as at April 01, 2014, is depreciated on a prospective basis over the remaining estimated useful life. This change in accounting estimate has resulted in increase in depreciation expense for the year ended March 31, 2015 by `71.62 lakhs. Further, in case of computers whose useful life on such reassessment had expired as of April 01, 2014, net book value of assets of `36.46 lakhs (net of deferred tax of `18.48 lakhs) is adjusted against the surplus in the Statement of Profit and Loss as of April 01, 2014.
35. Certain dues receivable from statutory authorities in an overseas jurisdiction, amounting to `253.82 lakhs have been considered impaired and provided for and disclosed as an exceptional item. Also investment made in Omni Capital LLP, USA has been impaired amounting to `409.05 lakhs and disclosed as an exceptional item.
36. During the earlier years, the Company had recognized royalty income of USD 1.67 million (`880.52 lakhs) in respect of Software Product License granted to a non - Indian licensee, who had purportedly claimed non - usage of the licensed IPR after initial acceptance, which was being contested by the Company. On June 27, 2014, an award was passed in the Company’s favour, as per which the non - India licensee was directed to pay USD 31.70 million within 30 days, towards royalties and interest on unpaid royalties and the non - India licensee was also directed to continue to provide royalty reports and pay the contracted royalties on an ongoing basis.
Notes to Consolidated Financial Statements (Contd.)
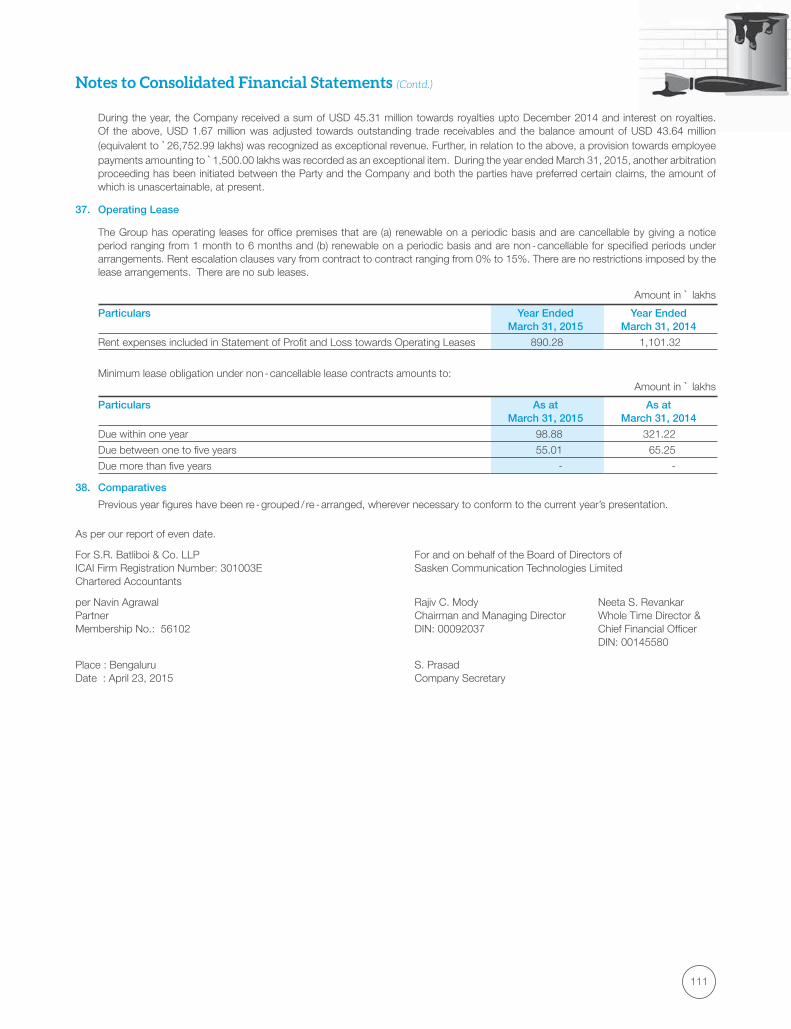
111
As per our report of even date.
For S.R. Batliboi & Co. LLP For and on behalf of the Board of Directors of ICAI Firm Registration Number: 301003E Sasken Communication Technologies Limited Chartered Accountants
per Navin Agrawal Rajiv C. Mody Neeta S. Revankar Partner Chairman and Managing Director Whole Time Director &Membership No.: 56102 DIN: 00092037 Chief Financial Officer DIN: 00145580
Place : Bengaluru S. Prasad Date : April 23, 2015 Company Secretary
During the year, the Company received a sum of USD 45.31 million towards royalties upto December 2014 and interest on royalties. Of the above, USD 1.67 million was adjusted towards outstanding trade receivables and the balance amount of USD 43.64 million (equivalent to `26,752.99 lakhs) was recognized as exceptional revenue. Further, in relation to the above, a provision towards employee payments amounting to ̀ 1,500.00 lakhs was recorded as an exceptional item. During the year ended March 31, 2015, another arbitration proceeding has been initiated between the Party and the Company and both the parties have preferred certain claims, the amount of which is unascertainable, at present.
37. Operating Lease
The Group has operating leases for office premises that are (a) renewable on a periodic basis and are cancellable by giving a notice period ranging from 1 month to 6 months and (b) renewable on a periodic basis and are non - cancellable for specified periods under arrangements. Rent escalation clauses vary from contract to contract ranging from 0% to 15%. There are no restrictions imposed by the lease arrangements. There are no sub leases.
Amount in ` lakhs
Particulars Year EndedMarch 31, 2015
Year EndedMarch 31, 2014
Rent expenses included in Statement of Profit and Loss towards Operating Leases 890.28 1,101.32
Minimum lease obligation under non - cancellable lease contracts amounts to: Amount in ` lakhs
Particulars As atMarch 31, 2015
As atMarch 31, 2014
Due within one year 98.88 321.22
Due between one to five years 55.01 65.25
Due more than five years - -
38. Comparatives
Previous year figures have been re - grouped / re - arranged, wherever necessary to conform to the current year’s presentation.
Notes to Consolidated Financial Statements (Contd.)
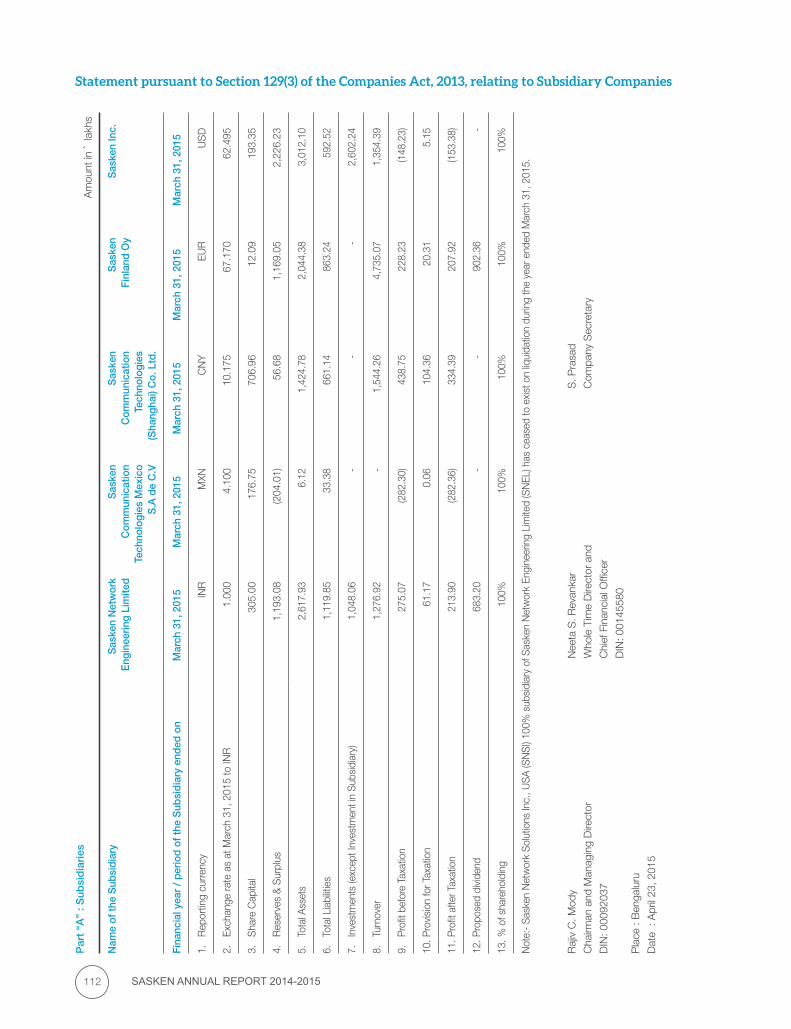
SASKEN ANNUAL REPORT 2014-2015112
Statement pursuant to Section 129(3) of the Companies Act, 2013, relating to Subsidiary CompaniesA
mou
nt in
` la
khs
Nam
e of
the
Sub
sidi
ary
Sas
ken
Net
wor
k E
ngin
eerin
g Li
mite
dS
aske
n C
omm
unic
atio
n Te
chno
logi
es M
exic
o S
.A d
e C
.V
Sas
ken
Com
mun
icat
ion
Tech
nolo
gies
(S
hang
hai)
Co.
Ltd
.
Sas
ken
Finl
and
Oy
Sas
ken
Inc.
Fina
ncia
l yea
r /
perio
d of
the
Sub
sidi
ary
ende
d on
Mar
ch 3
1, 2
015
Mar
ch 3
1, 2
015
Mar
ch 3
1, 2
015
Mar
ch 3
1, 2
015
Mar
ch 3
1, 2
015
1.R
epor
ting
curre
ncy
INR
MXN
CN
YEU
R U
SD
2.Ex
chan
ge ra
te a
s at
Mar
ch 3
1, 2
015
to IN
R 1
.000
4
.100
1
0.17
5 6
7.17
0 6
2.49
5
3.S
hare
Cap
ital
305
.00
176
.75
706
.96
12.
09
193
.35
4.R
eser
ves
& S
urpl
us 1
,193
.08
(204
.01)
56.
68
1,1
69.0
5 2
,226
.23
5.To
tal A
sset
s 2
,617
.93
6.1
2 1
,424
.78
2,0
44.3
8 3
,012
.10
6.To
tal L
iabi
litie
s 1
,119
.85
33.
38
661
.14
863
.24
592
.52
7.In
vest
men
ts (e
xcep
t Inv
estm
ent i
n Su
bsid
iary
) 1
,048
.06
-
-
-
2,6
02.2
4
8.Tu
rnov
er 1
,276
.92
-
1,5
44.2
6 4
,735
.07
1,3
54.3
9
9.Pr
ofit b
efor
e Ta
xatio
n 2
75.0
7 (2
82.3
0) 4
38.7
5 2
28.2
3 (1
48.2
3)
10.P
rovi
sion
for T
axat
ion
61.
17
0.0
6 1
04.3
6 2
0.31
5
.15
11.P
rofit
afte
r Tax
atio
n 2
13.9
0 (2
82.3
6) 3
34.3
9 2
07.9
2 (1
53.3
8)
12.P
ropo
sed
divi
dend
683
.20
-
-
902
.36
-
13.%
of s
hare
hold
ing
100%
100%
100%
100%
100%
Not
e:-
Sask
en N
etw
ork
Solu
tions
Inc.
, USA
(SN
SI) 1
00%
sub
sidi
ary
of S
aske
n N
etw
ork
Engi
neer
ing
Lim
ited
(SN
EL) h
as c
ease
d to
exi
st o
n liq
uida
tion
durin
g th
e ye
ar e
nded
Mar
ch 3
1, 2
015.
Par
t “A
” : S
ubsi
dia
ries
Raj
iv C
. Mod
y N
eeta
S. R
evan
kar
S. P
rasa
d
Cha
irman
and
Man
agin
g D
irect
or
Who
le T
ime
Dire
ctor
and
C
ompa
ny S
ecre
tary
DIN
: 000
9203
7 C
hief
Fin
anci
al O
ffice
r
DIN
: 001
4558
0
Pla
ce :
Ben
galu
ru
Dat
e :
Apr
il 23
, 201
5
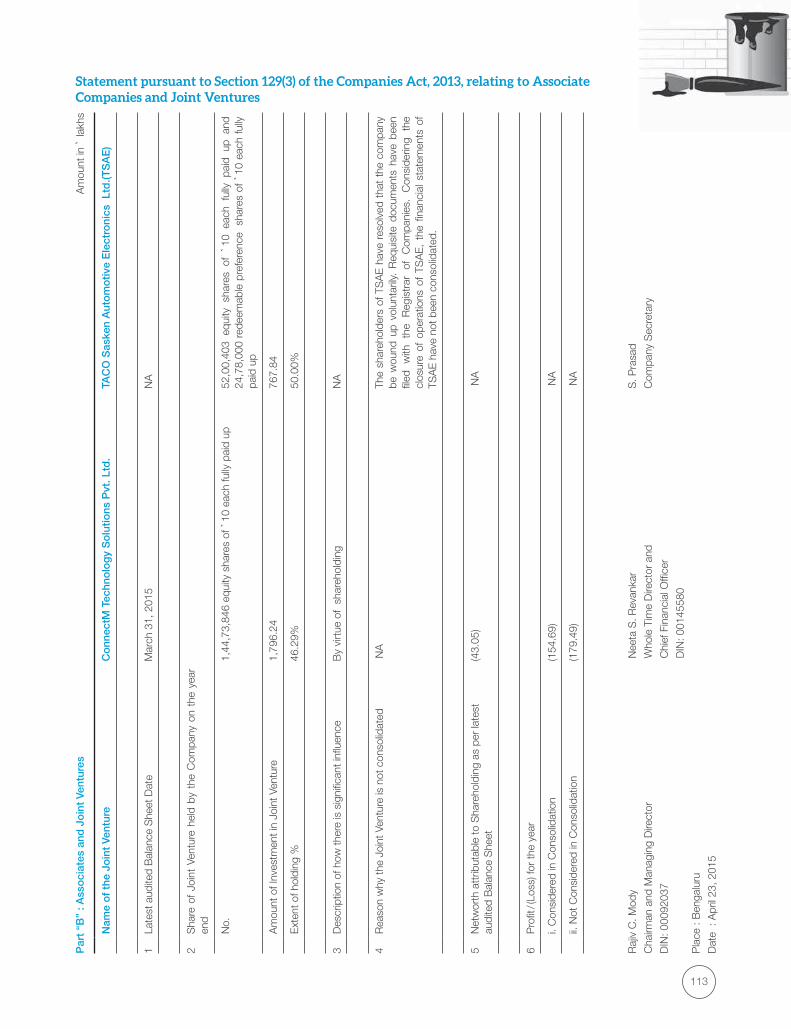
113
Statement pursuant to Section 129(3) of the Companies Act, 2013, relating to Associate
Companies and Joint VenturesN
ame
of
the
Join
t Ve
ntur
eC
onn
ectM
Tec
hno
log
y S
olu
tions
Pvt
. Ltd
.TA
CO
Sas
ken
Aut
om
otiv
e E
lect
roni
cs L
td.(T
SA
E)
1La
test
aud
ited
Bal
ance
She
et D
ate
Mar
ch 3
1, 2
015
NA
2S
hare
of
Join
t Ve
ntur
e he
ld b
y th
e C
ompa
ny o
n th
e ye
ar
end
No.
1,44
,73,
846
equi
ty s
hare
s of
`10
eac
h fu
lly p
aid
up52
,00,
403
equi
ty s
hare
s of
`10
eac
h fu
lly p
aid
up a
nd
24,7
8,00
0 re
deem
able
pre
fere
nce
sha
res
of `
10 e
ach
fully
pa
id u
p
Am
ount
of I
nves
tmen
t in
Join
t Ven
ture
1,79
6.24
76
7.84
Ext
ent o
f hol
ding
%46
.29%
50.0
0%
3D
escr
iptio
n of
how
ther
e is
sig
nific
ant i
nflue
nce
By
virt
ue o
f sh
areh
oldi
ng
NA
4R
easo
n w
hy th
e Jo
int V
entu
re is
not
con
solid
ated
NA
Th
e sh
areh
olde
rs o
f TS
AE
hav
e re
solv
ed t
hat
the
com
pany
be
wou
nd u
p vo
lunt
arily
. R
equi
site
doc
umen
ts h
ave
been
fil
ed
with
th
e R
egis
trar
of
C
ompa
nies
. C
onsi
derin
g th
e cl
osur
e of
ope
ratio
ns o
f TS
AE
, th
e fin
anci
al s
tate
men
ts o
f TS
AE
hav
e no
t bee
n co
nsol
idat
ed.
5N
etw
orth
att
ribut
able
to S
hare
hold
ing
as p
er la
test
audi
ted
Bal
ance
She
et(4
3.05
) N
A
6P
rofit
/ (Lo
ss) f
or th
e ye
ar
i. C
onsi
dere
d in
Con
solid
atio
n(1
54.6
9) N
A
ii. N
ot C
onsi
dere
d in
Con
solid
atio
n(1
79.4
9) N
A
Raj
iv C
. Mod
y N
eeta
S. R
evan
kar
S. P
rasa
d
Cha
irman
and
Man
agin
g D
irect
or
Who
le T
ime
Dire
ctor
and
C
ompa
ny S
ecre
tary
DIN
: 000
9203
7 C
hief
Fin
anci
al O
ffice
r
DIN
: 001
4558
0
Pla
ce :
Ben
galu
ru
Dat
e :
Apr
il 23
, 201
5
Par
t “B
” : A
sso
ciat
es a
nd J
oin
t Ve
ntur
esA
mou
nt in
` la
khs
SASKEN ANNUAL REPORT 2014-2015114
IN ADDITION TO HISTORICAL INFORMATION, THIS ANNUAL REPORT CONTAINS CERTAIN FORWARD - LOOKING STATEMENTS (FLS). THE FLS CONTAINED HEREIN ARE SUBJECT TO CERTAIN RISKS AND UNCERTAINTIES THAT COULD CAUSE ACTUAL RESULTS TO DIFFER MATERIALLY FROM THOSE REFLECTED IN THE FLS. FACTORS THAT MIGHT CAUSE SUCH A DIFFERENCE INCLUDE, BUT ARE NOT LIMITED TO, THOSE DISCUSSED IN THE MANAGEMENT’S DISCUSSION AND ANALYSIS OF FINANCIAL PERFORMANCE AND ELSEWHERE IN THIS REPORT. READERS ARE CAUTIONED NOT TO PLACE UNDUE RELIANCE ON THESE FLS, WHICH REFLECT MANAGEMENT’S ANALYSIS ONLY AS OF THE DATE HEREOF.
Company brief
With Product Development DNA at its core, Sasken has helped global leaders impel product development, commercialization, customization and maintenance. We are deeply entrenched in verticals like semiconductors, consumer electronics, smart devices, automotive electronics, enterprises and network equipment.
Recent trends like mobility, social media, cloud, analytics and other technologies have spurred Sasken to make segue into independent software vendors, insurance and retail industries. Today, our portfolio of offerings includes embedded R&D services, comprehensive testing services, IT infrastructure services and application development & data services.
Outlook
The growth prospects of the global economy for FY 2015 - 16 are expected to be marginally better than that of the preceding year, according to the International Monetary Fund (IMF). The pleasant surprise on the growth front is that in addition to the advanced economies, the high growth demonstrated by emerging markets and developing economies is pushing the boundaries for consumerism, thus driving technology adoption. This recovery is largely due to the smart adoption of technology on a large scale. Industry leaders have concurred that the focus of innovation is to bring about inclusive growth at a fast evolving pace. Social media is seen as a great equalizer in bridging the gap between the traditionally advantaged and disadvantaged sections of the society. The explosion of data and the resultant democratization caused by technology adoption has resulted in a shift of power from provider to consumer. However, these changes will also bring in their wake the issue of security that will require careful consideration in both the personal and enterprise space. The nexus of these forces will be the prime mover of economic development and progress as technology adoption and its concomitant benefits are expected to reach hitherto unprecedented levels.
NASSCOM - Strategy & estimates of growth of Engineering Research and Development (ER&D) space further corroborates the impact of technology across multiple industry verticals. As seen in the previous fiscal year, much of this growth is fueled by a combination of competitive dynamics and technology adoption in the automotive and consumer electronic segments. Larger enterprises, typically market leaders, are expected to be the largest investors in ER&D in their quest to retain their competitive edge and be relevant to their customer segments. Cost pressures, paucity of engineering talent, and the need for warp speed development will continue to drive decentralized and globally distributed product development initiatives. It is estimated that core development services for ER&D will move to the Asia - Pacific region, in part due to market access and in equal measure for availability of talent and attractiveness of value delivered.
The proliferation of software as a defining ingredient of almost any product - consumer or industrial - has resulted in a paradigm shift in the product development process. This is increasingly pressurizing developers to adopt innovative models for new product introduction including the use of rapid prototyping and fail - fast approaches. It has resulted in fundamental changes to product engineering practices including the adoption of agile methods for both hardware and software design. A platform approach to design is being seen as a means to stretch R&D investments and as a key enabler in delivering continuously upgraded products to an ever - demanding market.
NASSCOM has revised upwards the growth rate of global sourcing of ER&D services to USD 68 billion in 2014 from USD 63 billion in 2013. Further, NASSCOM estimates that India’s share of this will be in the range of 22 - 25 percent.
Business environment
In the midst of relentless change, there have been many constants. The adoption social, mobile, analytics and cloud (SMAC), as a core element of the business strategy, constitutes the new normal for enterprises. The only difference has been the rate of adoption of these vectors by different industries and traditional players. Platformization of business has created a fundamental shift in the way buyers and sellers engage. Traditional markets in many industries including travel, hospitality, music, retail, insurance, etc. have been subject to the disruptive forces of platforms. On the one hand, platforms have catalyzed the entrenchment of upstarts who have built tremendous equity with both their customers and financial investors. On the other hand, they have driven traditional businesses to accelerate the pace of investment into digital enterprise transformation.
The smart revolution has pervaded beyond the phone and now embraces the entire gamut of consumer electronic products including televisions, set top boxes, industrial and safety devices among others. Wearables have moved from the realm of prototypes and become real products that enable significant lifestyle benefits such as monitoring well - being, improving productivity and efficiency at work and play. In similar light, Internet of Things (IoT) has begun to see early adoption mainly in manufacturing, retail, utilities and consumer electronics segments. Development of, what is dubbed as, smart cities is another growth area for IoT as it attempts to create more livable spaces that harness the power of technology to ameliorate the challenges of ageing infrastructure in mega cities.
IoT, by itself, is in a state of evolution as key enablers including computing, communication, sensors, cloud and data are themselves in a state of constant change. Wireless connectivity spanning short range to wide area, sensor technology and computing has been continuing to evolve at a tremendous pace. Peripheral technologies such as displays and battery have also improved considerably although at a notch - lower velocity. However, the upshot is that computing and communication are increasingly available at affordable price points with reduced power consumption and host of prebuilt sensor and connectivity options. Leading semiconductor vendors have announced purpose - built platforms to abet the development of IoT. This has catalyzed the introduction of an enormous range of product service bundles that have captured the mind space of early adopters. The chasm that has to be bridged by IoT remains one of moving from an overt focus on technology disruption to that of enabling better economic returns for all stakeholders.
Management Discussion and Analysis Report
115
Industry pundits have opined that the transformation of information technology from being a ‘digital exoskeleton’ to a ‘digital nerve center’ has resulted in a paradigm shift in the mindsets of CXOs across enterprises. This has resulted in rebalancing of power within an enterprise from the Chief Information Officers (CIOs) to their peers. Companies that are embarking on a path of revamping their approach to adoption of information technology as a business enabler are increasingly finding the need to embrace a product mindset. The CIO is looking to collaborate within the organization and with new age partners. This approach holds better promise for the seamless integration of new technologies with existing infrastructure. What needs to be done is to maintain backward compatibility on the one hand and enable opportunities for the rapid creation of ‘built - for - mobility’ solutions on the other hand.
Growth opportunities for Sasken
As a pioneer in providing product engineering services with a DNA honed by two and a half decades of serving marquee customers across the globe, your Company has carved a distinctive position for itself. While there are pockets of excellence _ in semiconductors, devices, networks, and IT _ enterprises with the ability to bring a holistic approach to the table are few and far between. Your Company has been charting a course through the turbulence caused by the disruption of technology with agility and embracing a productized approach to managing the software development lifecycle.
This is evidenced by our track record in being a strategic partner to several leading vendors for whom we have successfully developed over hundred unique products. We have leveraged our expertise across diverse areas for the development of semiconductors, satellite phones, smart devices, in - vehicle Infotainment systems, set - top boxes, rugged & industrial devices, and wireless network elements. We estimate that the work carried out by our engineers have been incorporated in over 500 million products that have been shipped globally.
We have also begun the process of expanding our portfolio of offerings to address new areas like:
We embarked a path to build our capabilities to serve digital enterprises in their quest to profit from the data explosion and burgeoning application ecosystem. While we are still in a nascent stage of this endeavor, we take pride in the inroads we have made to help organizations channelize the benefits of Big Data and Analytics. We have combined our knowledge in telecom & IT to deliver a predictive analytics - based model to help mobile virtual network operators understand consumer consumption patterns. This allows the optimal management of bandwidth provisioning and enables competitive service bundles. The net result is a win - win situation for both service providers and their customers.
In the retail industry, we are extending support to a platform vendor providing logistic solutions for omni - channel commerce. This is a significant beachhead with potential upside due to the increased adoption of wireless technologies by retail industries. We have also built, among others, a number of proof - of - concepts that can accelerate the adoption of mobile commerce for retail industries. We are also building solutions that insurance carriers can take advantage to launch usage - based insurance that harness sensor - based inputs to help characterize driver behavior.
Your Company has realized its plan set forth last year to bolster the ability to serve the growing need to offer IT infrastructure services that help businesses collaborate and compete better. Our market entry into offering infrastructure services is well timed as traditional ways of managing infrastructure are increasingly coming under pressure. This is due to the need for managing heterogeneous and multi - generational infrastructure, while balancing the need to optimize operating expenditure and investments. We have established a Center of Excellence (CoE) that will deliver Sasken’s automation solutions based on our tools platform and prudent combination of third party solutions. In this practice, we have helped telecom players in the process of deploying nationwide networks in areas such as LTE, etc. We have extended this support in both the core and access side of the networks. Additionally, we have helped service providers carry out extensive network audits to assess, both, the quality of service (QoS) and quality of experience (QoE) they provide.
While we have outlined Sasken’s diversification into the IT via our Application and Data Services and IT Infrastructure Services practice, we will now delve into our entrenched practice areas, that is, Testing and ER&D services. We continue to single out testing as a practice area as it occupies a pivotal role in product development. Today, distributed product development is an industry norm, which bodes well for our ER&D service capability.
We have supported productization, commercialization and maintenance of multiple smart devices that are built on the Android platform. More recently, we have helped global OEMs upgrade and introduce new products that are built on the latest release of Android, that is, Lollipop. Our services have helped OEMs customize products to meet the requirements of key service providers as well as comply with the homologation and certification needs of the geographies in which they are deployed. We have executed numerous projects that capitalize on our undisputed leadership in integrating connectivity, multimedia, and sensors. Similarly, we have worked on the network side helping in the development of a range of products including Pico / Femto cells, base transceiver systems and the evolved packet core.
Sasken’s well - established TCoE (Testing Center of Excellence) provides a comprehensive suite of testing services for embedded, communications, and IT systems. We have forged partnerships with leading ecosystem players across the value chain. This makes your Company a trusted partner in providing specialized and independent testing services.
In summary, we are not limited by market opportunities. Our focus will continue to be in entrenching our position with existing customers and the simultaneous pursuit of acquiring new business. We have revectored our internal go - to - market and delivery capabilities to better service our growth prospects. On the people front, we will continue to invest in building the domain competencies and engineering capabilities of our talent pool. Our quality management systems and the management’s commitment to harness our abilities should hold us in good stead in the pursuit of profitable growth while achieving scale and scope.
For a more detailed summary of the business segments we operate in, please refer to the Technology and Markets section.
Management Discussion and Analysis Report (Contd.)
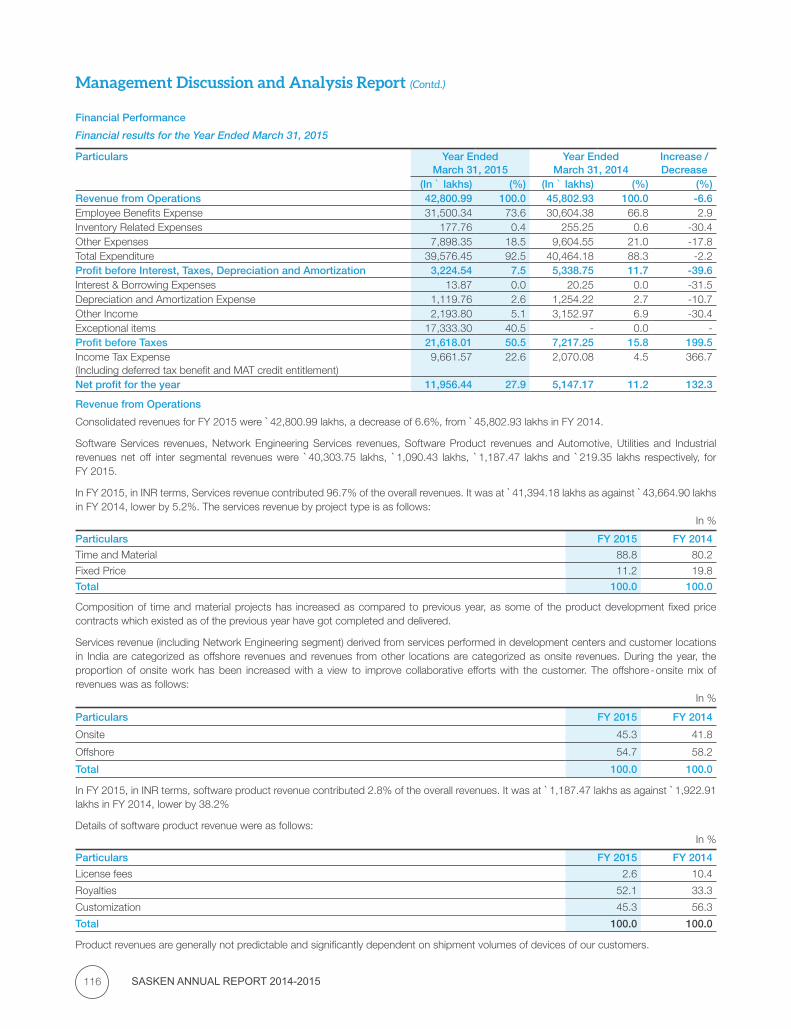
SASKEN ANNUAL REPORT 2014-2015116
Financial Performance
Financial results for the Year Ended March 31, 2015
Particulars
Year EndedMarch 31, 2015
Year EndedMarch 31, 2014
Increase /Decrease
(In ` lakhs) (%) (In ` lakhs) (%) (%)Revenue from Operations 42,800.99 100.0 45,802.93 100.0 -6.6Employee Benefits Expense 31,500.34 73.6 30,604.38 66.8 2.9Inventory Related Expenses 177.76 0.4 255.25 0.6 -30.4Other Expenses 7,898.35 18.5 9,604.55 21.0 -17.8Total Expenditure 39,576.45 92.5 40,464.18 88.3 -2.2Profit before Interest, Taxes, Depreciation and Amortization 3,224.54 7.5 5,338.75 11.7 -39.6Interest & Borrowing Expenses 13.87 0.0 20.25 0.0 -31.5Depreciation and Amortization Expense 1,119.76 2.6 1,254.22 2.7 -10.7Other Income 2,193.80 5.1 3,152.97 6.9 -30.4Exceptional items 17,333.30 40.5 - 0.0 -Profit before Taxes 21,618.01 50.5 7,217.25 15.8 199.5Income Tax Expense(Including deferred tax benefit and MAT credit entitlement)
9,661.57 22.6 2,070.08 4.5 366.7
Net profit for the year 11,956.44 27.9 5,147.17 11.2 132.3
Revenue from Operations
Consolidated revenues for FY 2015 were `42,800.99 lakhs, a decrease of 6.6%, from `45,802.93 lakhs in FY 2014.
Software Services revenues, Network Engineering Services revenues, Software Product revenues and Automotive, Utilities and Industrial revenues net off inter segmental revenues were `40,303.75 lakhs, `1,090.43 lakhs, `1,187.47 lakhs and `219.35 lakhs respectively, for FY 2015.
In FY 2015, in INR terms, Services revenue contributed 96.7% of the overall revenues. It was at `41,394.18 lakhs as against `43,664.90 lakhs in FY 2014, lower by 5.2%. The services revenue by project type is as follows:
In %
Particulars FY 2015 FY 2014
Time and Material 88.8 80.2
Fixed Price 11.2 19.8
Total 100.0 100.0
Composition of time and material projects has increased as compared to previous year, as some of the product development fixed price contracts which existed as of the previous year have got completed and delivered.
Services revenue (including Network Engineering segment) derived from services performed in development centers and customer locations in India are categorized as offshore revenues and revenues from other locations are categorized as onsite revenues. During the year, the proportion of onsite work has been increased with a view to improve collaborative efforts with the customer. The offshore - onsite mix of revenues was as follows:
In %
Particulars FY 2015 FY 2014
Onsite 45.3 41.8
Offshore 54.7 58.2
Total 100.0 100.0
In FY 2015, in INR terms, software product revenue contributed 2.8% of the overall revenues. It was at `1,187.47 lakhs as against `1,922.91 lakhs in FY 2014, lower by 38.2%
Details of software product revenue were as follows:In %
Particulars FY 2015 FY 2014
License fees 2.6 10.4
Royalties 52.1 33.3
Customization 45.3 56.3
Total 100.0 100.0
Product revenues are generally not predictable and significantly dependent on shipment volumes of devices of our customers.
Management Discussion and Analysis Report (Contd.)

117
Employee benefits expenses
Employee benefits expenses include salaries which have fixed and variable components, contribution to social security funds such as provident fund, superannuation fund, gratuity fund and other statutory schemes. It also includes expenses incurred on Employee stock compensation costs, staff welfare, recruitment and relocation.
The total employee costs for FY 2015 were `31,500.34 lakhs compared to `30,604.38 lakhs in FY 2014 - higher by `895.96 lakhs. In percentage terms, the cost in FY 2015 is 73.6% of revenues, as against 66.8% in the earlier year.
The employee benefits cost has been higher in the current year as compared to previous year on account of higher headcount in overseas location, annual wage increases and investments in sales and leadership team during the financial year. The employee strength at the end of FY 2015 was at 1,919 as compared to 1,906 in FY 2014. With a view to better manage utilization, organization continuously monitors the demand and appropriately initiates hiring in time to ensure fulfilment of a business requirements.
Inventory related expenses
Inventory related expenses include increase or decrease of work in progress, consumption of components and raw materials and purchase of traded goods.
In FY 2015, inventory related expenses are higher as compared to FY 2014 on account of consumption of inventory towards completion of some of the large fixed price ownership projects.
Other expenses
Other expenses for FY 2015 were `7,898.35 lakhs as against `9,604.55 lakhs for FY 2014 - an decrease of `1,706.20 lakhs.
Break up of other expenses into major head is as follows:Amount in ` lakhs
Particulars FY 2015 FY 2014
Facility costs 2,431.85 2,772.06
Outsourcing & Consulting costs 2,525.86 3,440.93
Travel Costs 1,642.28 1,774.77
Other Costs 698.96 694.71
Communication & IT costs 499.65 713.61
Training Costs 99.75 208.47
Total 7,898.35 9,604.55
During the year, we had consolidated some of the facilities to improve the space utilization resulting in overall reduction in facility cost and communication costs as compared to last year. During the previous year, we had incurred substantial legal expenses towards litigation which resulted in a favorable outcome. This litigation relates to one of our non - Indian licensees having breached its obligations in the prior year, inter alia, to report shipment and royalty numbers and to pay for the same. For more details, refer to the section on exceptional items.
Interest & Borrowing expenses
ConnectM, which is a Joint Venture of Sasken, has borrowed from SVB Finance India Pvt Limited, which is a Non - Banking Finance Company (NBFC). The interest expense relates to interest on secured long term borrowing from this NBFC.
Depreciation and amortization expense
Depreciation and amortization charge has decreased to `1,119.76 lakhs in FY 2015 from `1,245.22 lakhs in FY 2014. The depreciation has been lower as certain assets including intangible assets have reached the end of useful life.
Other Income
Other Income comprises of Interest earned on Fixed Deposits, Dividend on Mutual Funds including FMPS, Gain on sale of Investments, profit on sale of fixed assets, write back of unclaimed balances and provisions, exchange gains and other miscellaneous receipts.
Other income was `2,193.80 lakhs in FY 2015, a decrease of `959.17 lakhs over the other income in FY 2014 amounting to `3,152.97 lakhs. In the previous year, on account of the volatile exchange rates in FY 2014, net exchange gains, were higher by `988.48 lakhs as compared to FY 2015. This increase in previous year was mainly on account of realization of dividend declared by subsidiaries from accumulated profits, at an exchange rate higher than at which they were earned and occurs when there is significant difference in the exchange rate at which the profit is earned and repatriated from overseas subsidiaries.
We use a combination of foreign exchange forward contracts and foreign exchange options to hedge our exposure to movements in foreign exchange rates. We manage our foreign exchange exposures in line with our hedging policy which aims to ensure that foreign exchange exposures on revenue and balance sheet accounts are properly monitored and are limited to acceptable levels.
Returns from our treasury investments in FY 2015 have been `1,254.15 lakhs, higher by `168.35 lakhs compared to FY 2014.
Exceptional items
During the earlier years, the Company had recognized royalty income of USD 1.67 million (`880.52 lakhs) in respect of Software Product License granted to a non - Indian licensee, who had purportedly claimed non - usage of the licensed IPR after initial acceptance, which was being contested by the Company.
Management Discussion and Analysis Report (Contd.)
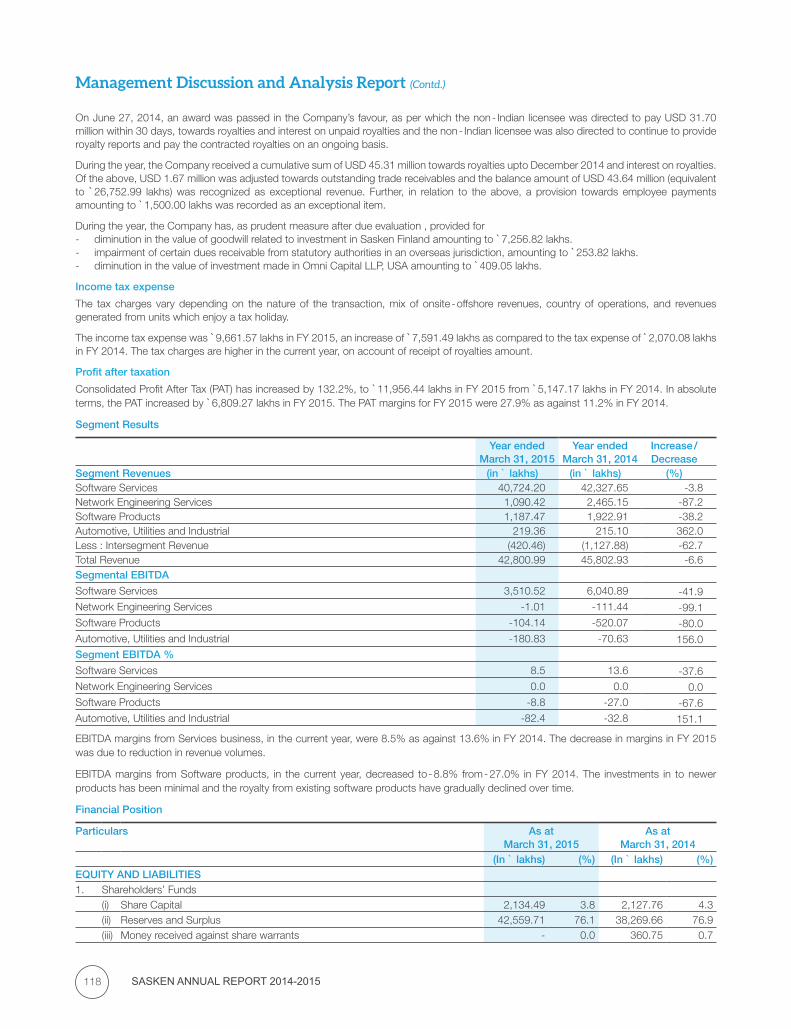
SASKEN ANNUAL REPORT 2014-2015118
On June 27, 2014, an award was passed in the Company’s favour, as per which the non - Indian licensee was directed to pay USD 31.70 million within 30 days, towards royalties and interest on unpaid royalties and the non - Indian licensee was also directed to continue to provide royalty reports and pay the contracted royalties on an ongoing basis.
During the year, the Company received a cumulative sum of USD 45.31 million towards royalties upto December 2014 and interest on royalties. Of the above, USD 1.67 million was adjusted towards outstanding trade receivables and the balance amount of USD 43.64 million (equivalent to `26,752.99 lakhs) was recognized as exceptional revenue. Further, in relation to the above, a provision towards employee payments amounting to `1,500.00 lakhs was recorded as an exceptional item.
During the year, the Company has, as prudent measure after due evaluation , provided for - diminution in the value of goodwill related to investment in Sasken Finland amounting to `7,256.82 lakhs.- impairment of certain dues receivable from statutory authorities in an overseas jurisdiction, amounting to `253.82 lakhs. - diminution in the value of investment made in Omni Capital LLP, USA amounting to `409.05 lakhs.
Income tax expense
The tax charges vary depending on the nature of the transaction, mix of onsite - offshore revenues, country of operations, and revenues generated from units which enjoy a tax holiday.
The income tax expense was `9,661.57 lakhs in FY 2015, an increase of `7,591.49 lakhs as compared to the tax expense of `2,070.08 lakhs in FY 2014. The tax charges are higher in the current year, on account of receipt of royalties amount.
Profit after taxation
Consolidated Profit After Tax (PAT) has increased by 132.2%, to `11,956.44 lakhs in FY 2015 from `5,147.17 lakhs in FY 2014. In absolute terms, the PAT increased by `6,809.27 lakhs in FY 2015. The PAT margins for FY 2015 were 27.9% as against 11.2% in FY 2014.
Segment Results
Year ended
March 31, 2015Year ended
March 31, 2014Increase /Decrease
Segment Revenues (in ` lakhs) (in ` lakhs) (%)Software Services 40,724.20 42,327.65 -3.8Network Engineering Services 1,090.42 2,465.15 -87.2Software Products 1,187.47 1,922.91 -38.2Automotive, Utilities and Industrial 219.36 215.10 362.0Less : Intersegment Revenue (420.46) (1,127.88) -62.7Total Revenue 42,800.99 45,802.93 -6.6Segmental EBITDA
Software Services 3,510.52 6,040.89 -41.9Network Engineering Services -1.01 -111.44 -99.1Software Products -104.14 -520.07 -80.0Automotive, Utilities and Industrial -180.83 -70.63 156.0Segment EBITDA %
Software Services 8.5 13.6 -37.6Network Engineering Services 0.0 0.0 0.0Software Products -8.8 -27.0 -67.6Automotive, Utilities and Industrial -82.4 -32.8 151.1
EBITDA margins from Services business, in the current year, were 8.5% as against 13.6% in FY 2014. The decrease in margins in FY 2015 was due to reduction in revenue volumes.
EBITDA margins from Software products, in the current year, decreased to - 8.8% from - 27.0% in FY 2014. The investments in to newer products has been minimal and the royalty from existing software products have gradually declined over time.
Financial Position
Particulars As at March 31, 2015
As at March 31, 2014
(In ` lakhs) (%) (In ` lakhs) (%)EQUITY AND LIABILITIES1. Shareholders’ Funds
(i) Share Capital 2,134.49 3.8 2,127.76 4.3(ii) Reserves and Surplus 42,559.71 76.1 38,269.66 76.9(iii) Money received against share warrants - 0.0 360.75 0.7
Management Discussion and Analysis Report (Contd.)
119
Particulars As at March 31, 2015
As at March 31, 2014
(In ` lakhs) (%) (In ` lakhs) (%)2. Non - Current Liabilities
(i) Long Term Borrowings - 0.0 - 0.0(ii) Long Term Provisions 690.91 1.2 770.97 1.5
3. Current Liabilities and Provisions(i) Trade Payables 2,470.86 4.4 2,632.58 5.3(ii) Other Current Liabilities 2,099.40 3.8 1,695.39 3.4(iii) Short Term Provisions 5,939.51 10.6 3,925.16 7.9
Total 55,894.88 100.0 49,782.27 100.0ASSETS1. Non - Current Assets
(i) Net Fixed Assets including Capital Work - in - Progress 4,246.23 7.6 12,686.10 25.5(ii) Non Current Investments 7,231.32 12.9 2,995.50 6.0(iii) Deferred Tax Assets (net) 1,275.65 2.3 1,117.71 2.2(iv) Long Term Loans and Advances 6,771.42 12.1 5,707.26 11.5(v) Other Non - Current Assets 259.39 0.5 93.46 0.2
2. Current Assets(i) Current Investments 12,283.75 22.0 10,355.46 20.8(ii) Inventories 44.95 0.1 209.39 0.4(iii) Trade Receivables 6,992.91 12.5 9,276.07 18.6(iv) Cash and Bank Balances 12,589.69 22.5 3,406.30 6.8(v) Short Term Loans and Advances 1,650.02 3.0 1,795.44 3.6(vi) Other Current Assets 2,549.55 4.6 2,139.58 4.3
Total 55,894.88 100.0 49,782.27 100.0
Equity and Liabilities
Share Capital
The authorized share capital is `5,000.00 lakhs comprising of 500 lakh equity shares of face value of `10 each. The number of shares outstanding, as on March 31, 2015 were 2,13,44,873 and these are fully paid up. The issued, subscribed and paid up capital as on March 31, 2015 stood at `2,134.49 lakhs, higher by `6.73 lakhs as compared to March 31, 2014.
Reserves and Surplus
Reserves and Surplus as at March 31, 2015 was `42,559.71 as against `38,269.66 lakhs as at March 31, 2014, increase of `4,290.05 lakhs. This increase over the last year is due to the following movements:
1. During FY 2015, securities premium increased by `131.02 lakhs on issue of shares on exercise of options by employees.2. The employee stock option outstanding (net of deferred compensation cost) stood at `18.61 lakhs as at March 31, 2015. 3. Increase in General Reserve of `1,610.58 lakhs at the end of FY 2015, is due to transfer from Profit and Loss account.4. Closing balance of hedging reserve as at March 31, 2015 showed a gain of `402.09 lakhs as against a gain of `338.53 lakhs as at March
31, 2014. This is in conformity with the principles laid down in Accounting Standard 30 (AS 30) ‘Financial Instruments: Recognition and Measurement’ for forward exchange contracts that are not covered by AS 11 ‘The effects of changes in foreign exchange rates’.
5. Increase in Profit & Loss account balance by `3,633.45 lakhs due to profit for the year as reduced by appropriations towards dividend and transfer to General Reserve. The balance retained in the Profit and Loss account as at March 31, 2014 was `25,970.49 lakhs after providing the interim dividend of `4,796.98 lakhs, proposed final dividend of `960.52 lakhs and dividend tax of `940.69 lakhs.
Money received against share warrants
On November 18, 2013, the Company allotted 12,00,000 convertible warrants to Ms. Ira Bhaduri in her capacity as Trustee of Lahiri Family Trust, of which Mr. Anjan Lahiri, former Whole Time Director and CEO of the Company, is the Managing Trustee, on a preferential basis on terms and conditions as approved by shareholders. The allottee was entitled for one equity share of `10 each of the Company for each such warrant at a price of `120.25 each.
In the previous year, the allottee paid 25% of the application money which is disclosed as “Money received against share warrants”. In the current year, the allottee exercised 10,40,000 options and paid `937.95 lakhs towards the balance 75% of the application money. As agreed mutually, the proposed allotment / conversion was not to be proceeded with, and this amount of `937.95 lakhs was refunded.
The Company had sought informal guidance from Securities and Exchange Board of India (SEBI) on whether the 25% should be forfeited or can be refunded and if so, the procedural formalities in connection with that. SEBI vide its letter dated February 23, 2015 expressed its inability to issue any guidance in the matter. Based on legal advice, the Board of Directors, at its meeting on April 13, 2015 approved refund of the application amount and the interest accrued and the same was paid on April 14, 2015.
Management Discussion and Analysis Report (Contd.)
SASKEN ANNUAL REPORT 2014-2015120
Long term provisions
Long term provisions include provision for long term employee benefit obligations, warranty, onerous contract and provision for mark - to - market losses on derivative contracts which are not expected to be settled within twelve months from the Balance Sheet date. In respect of these provisions, the Company has unconditional right to defer settlement beyond twelve months from Balance Sheet date and the provisions are considered to be non-current.
Long term provisions made, representing 1.2% of the Balance Sheet, were at `690.91 lakhs as at March 31, 2015, as against `770.97 lakhs as at March 31, 2014. The decrease is mainly on account of the lower provisions towards long term employee benefits.
Trade Payables
Trade payables includes amount due on account of goods purchased or services received in the normal course of business.
As at March 31, 2015, Trade payables representing 4.4% of the Balance Sheet, were at `2,470.86 lakhs, as against `2,632.58 lakhs as at March 31, 2014. The reduction in the trade payables is mainly on account of change in size of operations and rationalization of facilities.
Other Current Liabilities
Other current liabilities include current maturities of long term borrowings, Interest accrued but not due on borrowings, deferred revenues, advance received from customers, unpaid dividend, capital creditors and statutory liabilities. Current maturities of long term borrowings represent principal and interest amounts due on borrowings which are to be settled within twelve months from the Balance Sheet date. Deferred revenues consist primarily of advance billings on customers for fixed price contracts, for related costs are yet to be incurred. Advance received from customers represents amount received for customers for the delivery of services in future. Unpaid dividend represents dividend paid, but not encashed by shareholders and is represented by bank balance of the equivalent amount. Capital creditors include amounts due on account of goods purchased or services received in the nature of capital expenditure. Statutory liabilities include withholding tax and social security costs payable to statutory authorities in various countries we operate in.
Other current liabilities constituting 3.8% of the Balance Sheet, as at March 31, 2015 were at `2,099.40 lakhs, as against `1,695.39 lakhs as at March 31, 2014. The increase in current liabilities is mainly on account of increase in deferred revenues and statutory liabilities at the end of the year.
Short Term Provisions
Short term provisions include provision for long term employee benefit obligations, warranties, onerous contracts, provision for mark - to - market losses on derivative contracts and provision for dividends and tax thereon which are expected to be settled within twelve months from the Balance Sheet date and are considered to be current.
Short term provisions represent 10.64% of the Balance Sheet, and as at March 31, 2015 were at `5,939.51 lakhs as against `3,925.16 lakhs as at March 31, 2014. The increase in provisions in on account of higher income tax provisions on account of royalties received as per award in the current year.
Assets
Net Fixed assets including Capital Work - in - Progress
Net Fixed assets including Capital Work - in - Progress includes tangible and intangible assets as reduced by accumulated depreciation / amortization, Capital Work - in - Progress and Intangible assets under development.
The Net Fixed Assets, including capital Work - in - Progress, represents 7.6% of the total assets. The Fixed Assets, as at March 31, 2015, were at `4,246.23 lakhs as against `12,686.10 lakhs as at March 31, 2014.
Additions to fixed assets during the FY 2015 were `381.03 lakhs mainly on account of investments in computing equipment and software. During the year, we deducted `3,729.56 lakhs (March 31, 2014: `2,019.98 lakhs) from the gross block on retirement of assets.
Non - Current Investments
Investments are classified as current or non - current based on management intention at the time of purchase. Investments which the management intends to hold for a period more than one year from the Balance Sheet date are classified as non - current investments. Under this category, Sasken has made several strategic investments aimed at procuring business benefits and operation efficiencies.
The non - current investments, representing 12.9% of the total assets, were `7,231.32 lakhs, as at March 31, 2015 as against `2,995.50 lakhs as at March 31, 2014. The non - current investment is primarily the investment in Omni Capital Fund LLP, a limited liability partnership in USA and Fixed Maturity Plan investments. After providing impairment in diminution in value, the investment in Omni Capital Fund LLP stands at `2,602.24 lakhs. Further, during the year, certain Fixed Maturity Plan investments amounting ̀ 4,629.08 lakhs have been rolled over for another two years and the same have now be classified as non - current investments.
Deferred Tax Assets (net)
Deferred income taxes represent 2.3% of total assets. This reflects the tax impact of timing differences between taxable income and accounting income for the year and reversal of tax due to timing differences of earlier years. Deferred tax assets and deferred tax liabilities across various countries of operation are not set off against each other as we do not have a legal right to do so.
Management Discussion and Analysis Report (Contd.)
121
The Deferred tax assets, as at March 31, 2015 were ̀ 1,275.65 lakhs as against ̀ 1,117.71 lakhs as at March 31, 2014, an increase of ̀ 157.94 lakhs. The increase in deferred tax assets in FY 2015 was mainly on account of deferred tax assets recognized on employee benefit expenses and mark to market losses which are allowed for tax purposes only on payment basis.
Long Term Loans and Advances
Loans and advances consist of capital advance, security deposits, prepaid expenses, advance to employees, balances with Government Authorities and advance tax & MAT credit entitlement. Loan & advances which are non - current and not expected to be settled within twelve months from the Balance Sheet date has been classified as long term loans & advances. This represents 12.1% of the Balance Sheet, and as at March 31, 2015 was `6,771.42 lakhs, as against `5,707.26 lakhs as at March 31, 2014 - an increase of `1,064.16 lakhs. The increase is primarily due to increase in advance income tax payments, on account royalties received as per award.
Other non - current Assets
Long term trade receivables and non - current bank balances have been classified as other non - current assets. Long term trade receivables mean Trade receivables which are not due within the operating cycle of the company. Non - current bank balances include fixed deposits having maturity of more than 12 months as at the Balance Sheet date. This represents 0.5% of the total assets, and as at March 31, 2015 was at `259.39 lakhs, as against `93.46 lakhs as at March 31, 2014 - an increase of `165.93 lakhs. To take benefit of the high interest rates, the Company has locked into fixed deposits with Bank which are maturing beyond one year.
Current Investments
Investment in treasury products which are readily realisable, and that are intended to be held for not more than a year are classified under this head. These investments, representing 22% of the total assets, were `12,283.75 lakhs, as at March 31, 2015 as against `10,355.46 lakhs, as at March 31, 2014.
The guiding principle of the Company’s treasury investment is safety, liquidity and return. The Company deploys its surplus funds primarily in debt mutual funds and bank fixed deposits. During FY 2015 the composition of the investments has undergone change considering rate of returns on various instruments in the current market scenario. The total cash surplus available for investment has increased as compared to previous year on account of better collections including litigated amounts.
The breakup of treasury investments by instrument type is as follows:In %
Particulars As onMarch 31, 2015
As onMarch 31, 2014
Liquid Plan / Ultra Short Term Plan 41.4 52.4Fixed Maturity Plan 48.1 47.6Arbitrage / Equity Funds 10.5 -Total 100.0 100.0
The breakup of treasury investments by accounting classification:In %
Particulars As onMarch 31, 2015
As onMarch 31, 2014
Current Investments 72.6 100.0Non - Current Investments 27.4 -Total 100.0 100.0
Inventories
Inventories, which are 0.1% of the total assets, represent (a) Work - in - progress - that is costs related to project milestones that have not been met (b) Raw materials and components - costs related to stock of raw material and other components which are used as a part of project deliverables. The Work - in - progress, as at March 31, 2015 was at `44.95 lakhs, as against `209.39 lakhs as at March 31, 2014. The Work - in - progress will be charged off to Profit and Loss account as and when the related revenue is recognized, going by the matching principle of accounting. Raw materials and components, as at March 31, 2015 was at `29.27 lakhs, as against `61.91 lakhs as at March 31, 2014.
Trade Receivables
Trade receivables, representing 12.5% of the total assets, as at March 31, 2015 were at `6,992.91 lakhs as against `9,276.07 lakhs as at March 31, 2014. We periodically review the quality of receivables and make provision where necessary. Accordingly, the provisions for doubtful debts as at March 31, 2015 were `71.87 lakhs.
Trade receivables including long term trade receivables were 61 days (March 31, 2014: 72 days) in terms of days of sales outstanding (DSO) as at March 31, 2015.
Management Discussion and Analysis Report (Contd.)
SASKEN ANNUAL REPORT 2014-2015122
Cash and Bank Balances
Cash and Bank balances, representing 22.5% of the total assets, as at March 31, 2015 were at `12,589.69 lakhs, as against `3,406.30 lakhs as at March 31, 2014. We maintain sufficient cash balance in current accounts for operational requirements and invest surplus funds in a variety of instruments including fixed deposits in line with the Investment policy as approved by Board.
Amount in ` lakhs
Particulars As atMarch 31, 2015
As atMarch 31, 2014
Cash in Hand 1.49 1.91 With Indian Banks
In Current Accounts 1,091.08 1,508.30 Others 99.12 88.68
With Foreign Banks 1,129.12 1,784.03In Fixed Deposits 10,518.88 23.38Total 12,839.69 3,406.30 Less : Deposits with original maturity greater than 12 months shownas other non - current assets 250.00 -Cash and Bank Balances 12,589.69 3,406.30
Short Term Loans and Advances
Loans and advances consist of security deposits, prepaid expenses, advance to employees and suppliers, balances with Government Authorities. This represents 3.0% of the Balance Sheet, and as at March 31, 2015 was `1,650.02 lakhs, as against `1,795.44 lakhs as at March 31, 2014 - a decrease of `145.42 lakhs.
Other Current Assets
This represents interest accrued on fixed deposits and unbilled revenue and constitutes 4.6% of Balance Sheet. Unbilled revenue represents amounts recognized based on services performed in accordance with contract terms and where invoices are yet to be raised as on the Balance Sheet date. The prime reason for increase in other current assets is due to accrued interest on fixed deposits with banks.
Cashflow
During the year, we have generated `19,132.61 lakhs from operating activities as against `6,411.95 lakhs during March 31, 2014 on account of improved collections and collections from litigated items. Of the cash generated, `6,575.36 lakhs was utilized towards distribution of dividend (including tax thereon). The balance at the end of the year including treasury investments is `29,752.52 lakhs.
Threats, Risks and Concerns
Business Risks
We operate in a high - growth market environment characterized by rapid changes in technology along with disruptions in the industrial value chain. The fundamental attractiveness of this market results in intense competition which could have an impact on our ability to continue to attract new customers and scale existing business. The nexus of forces such as cloud, big data, mobile devices, social media and changing consumer behavior, requires us to continuously evaluate our offerings and business models to be relevant in the market place. Some of our customers face serious competitive challenges from digital upstarts and new - age enterprises that may lead to erosion in their market share and margins thus adversely affecting our business prospects with them. Additionally, we have a customer concentration risk due to our key account focus. Our geo - focus is predominantly toward North America and Europe where there is a prospect of economic upheaval which may adversely affect business from customers in those areas.
Our sectoral focus spreads from semiconductors and smart devices to networks but is largely on the wireless domain. The reconstitution of this sector’s profit pool due to the emergence of digital disruptors is both an opportunity and threat. This has led to some of our customers, who were otherwise considered stalwarts, exiting business lines we were engaged with or being acquired thus muting our business prospects. Some companies who outsource technology development in our industry have well - established global in - house centers. The presence of GICs may potentially lead to insourcing of product development engineering services which may reduce the volume of forthcoming business.
To mitigate these risks, we are endeavoring to scale business opportunities arising out of the cusp of embedded and IT systems. We continue to strengthen our traditional business in embedded systems and testing as the business prospects remain promising. We are increasing our competitive ability by embracing agile practices to continue to be a significant partner to marquee customers in the communication and devices space. We are building proof of concepts that enables the delivery of next generation services to our customers and also broaden our customer base. Our deep domain knowledge in our traditional business combined with new practices such as Application and Data Services along with IT Infrastructure enables us to provide transformative and differentiate solutions.
HR Risks
As our services are provided by highly skilled and trained engineers, attraction and retention of talent will remain a challenge. Increase employment costs in developing economies exert pressure on operating margins. Mobility of global workforce on account of immigration restrictions in key markets is another challenge faced by the industry. Legislative changes and political rhetoric against outsourcing will impact our service delivery.
Management Discussion and Analysis Report (Contd.)
123
We continued to build on our employee engagement programs and implemented a robust performance management system, align compensation to reflect market conditions. Further with a view to increase learning opportunities, we have designed and implemented training and rotation programs. Thanks to these initiatives, employee scores are moving in the right direction, employee engagement is up and attrition levels are showing signs of stability.
Financial Risks:
Foreign Exchange Fluctuation Risk
Most of the Group revenues are derived from its global customers and are generally denominated in US Dollars and Euros. A significant portion of expenses will be in Indian Rupees as majority of the service delivery of the Company happens from India. Consequently, fluctuations in the exchange rate have an influence on the operating profit. On the back of economic uncertainty especially in the euro region, there has been significant volatility in the exchange rates over the past year. During FY 2015, the rupee depreciated by 4.3% against USD and appreciated by 18.4% against Euro.
With view to minimize the impact of exchange fluctuations, the Group periodically reviews its foreign exchange exposures and takes appropriate hedges through forward contracts and option contracts, regularly. The policy of the Group is to take hedges for risk mitigation and not for profit maximization. The Group has preset loss limits and unhedged exposures are subject to these loss limits for the purpose of deciding the hedge.
Legislative Changes:
The following are some of the changes in the regulatory and accounting framework which governs Company and the Group:
Income computation and disclosure standards (ICDS) for calculation of tax charge – effective from FY 2015 - 16 Ind AS in place of Accounting Standards (AS) which is currently followed – effective from FY 2017-18 for Company and the Group Goods and Services Tax - proposed to be effective from FY 2016 - 17.
The CBDT has notified ten standards which will have to be used for computing the tax liability. Some of the standard requirements are aggressive and may be inconsistent with the accounting policies of the Company and Group. To quote an example, while the accounting policies of the Company are based on the Accounting Standards, which lay emphasis on prudency and materiality in preparation of the financial statements, the ICDS ignores these two basic premises. The ICAI is expected to issue guidance note on this which will provide clarity on these matters.
The Ministry of Corporate Affairs (MCA) has proposed to implement the Indian Accounting Standards (Ind AS), which will be in line with the International Financial Reporting Standards (IFRS) and replace the present Accounting Standards which apply to the corporates. This is intended to be implemented in two phases starting from FY 2016 - 17. Going by the announcement in this regard, the Ind AS will be applicable for Company and the Group from FY 2017 - 18.
Ind AS is expected to harmonise the treatment of transactions under the accounting standards and disclosures globally. In the era of globalisation, this will enable the enterprises in evaluation of other enterprises for business partnership, banks to evaluate their potential customers etc. The disclosure requirements and the granularity in reporting is expected to be increased under the Ind AS.
The Government of India (GoI) has proposed to bring the Goods and Services under a single legislation and in the process subsume the existing Value Added Tax, Service Tax and host of other legislations under the Goods and Services Tax Act (GST). GoI is in the process of amending the existing laws, drafting the procedure & process and making ready the infrastructure for implementation of GST. Though the tax rates have not been finalised, going by the intend of the GoI, the GST rate may be higher than the existing Service Tax and VAT rates. We hope better clarity will emerge after the laws are enacted / amended in the Parliament.
Liquidity Risk
The Board reviews the liquidity position periodically and determines the need for infusion of equity and debt capital into the business. The Company and its subsidiaries have met its working capital requirements through internal cash accruals during the current year. Cash surplus generated by the business are invested in line with Board approved policy which factors interest risk, credit risk and reinvestment risks. The Group has fund based and non - fund based lines of credit available, to satisfy any working capital requirements, if required.
Internal Control Systems
The Group aims to manage risk so as protect the value of the Group on behalf of the shareholders. Apart from identifying and documenting ‘Entity level’ risks and controls, the exercise involves identifying all significant (a) locations and (b) business processes, followed by (c) documenting each of the process flows (d) creation of risk registers (e) an assessment of controls by way of testing and (f) periodic reporting & monitoring. The risk register captures all areas of potential financial risks and operational risks and the associated internal controls that are already in place or have been identified.
Annual certification is an important procedure. It starts from the ‘control’ owner and then on to the ‘process’ owner and upwards, leading to the CEO and CFO certification. The Company complies with the requirements of Enterprise Risk Management (ERM), which is mandated by various regulations including Clause 49 of the Listing Agreement, Companies Act 2013, etc.
At intervals, the Company does assessment of the risks and controls for the existing and new process flows. As part of the assessment exercise, certain new risks have been identified. Controls to mitigate these risks are being designed for implementation in the coming periods. As a good corporate governance measure, all matters of significant importance or relevance have been reported to the Audit Committee and the Company’s Statutory Auditors.
Management Discussion and Analysis Report (Contd.)
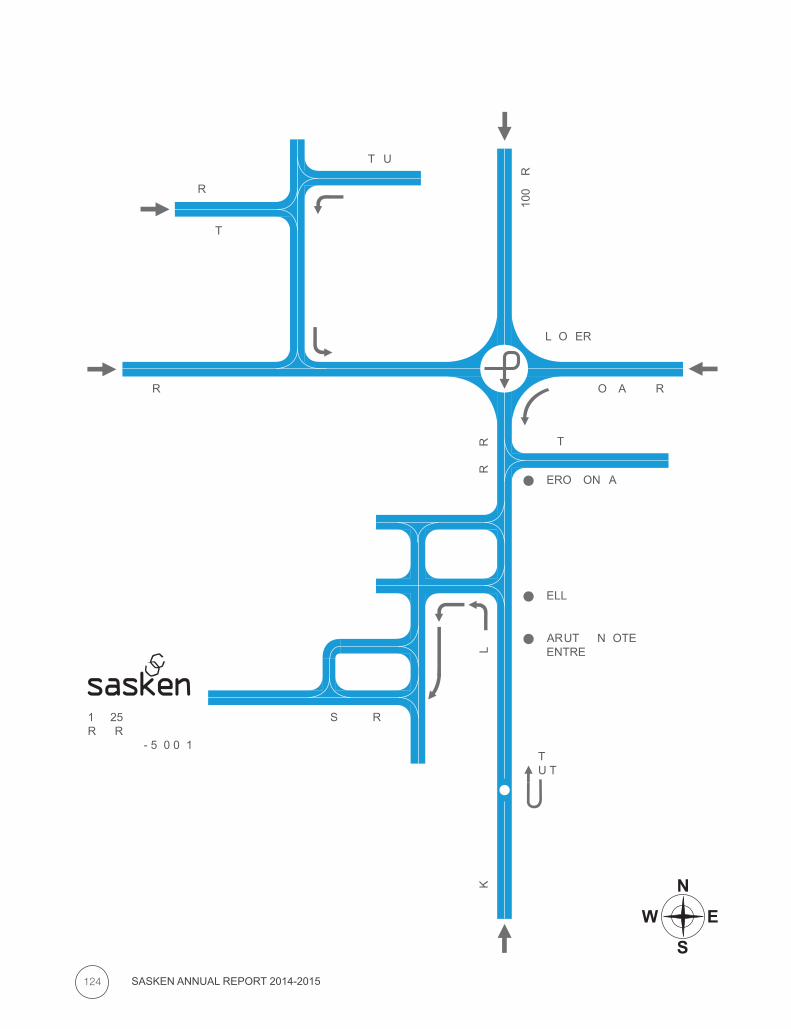
SASKEN ANNUAL REPORT 2014-2015124
O�� A������ R���
����
����
��� 1
00 ��
R��
�
������
S����� R����1���25� R��� R���� ���������������� - 5�0 0�1�������
���� R������� ������
T������ ������
�� R���
T� U�����
T� ���� ���� ������
����
� L��
���
��� R
���
R��
���
�� K
���
����
���ERO �ON�A
�L�O�ER
�ELL
�ARUT�� �N�OTE���ENTRE
T��� U T���
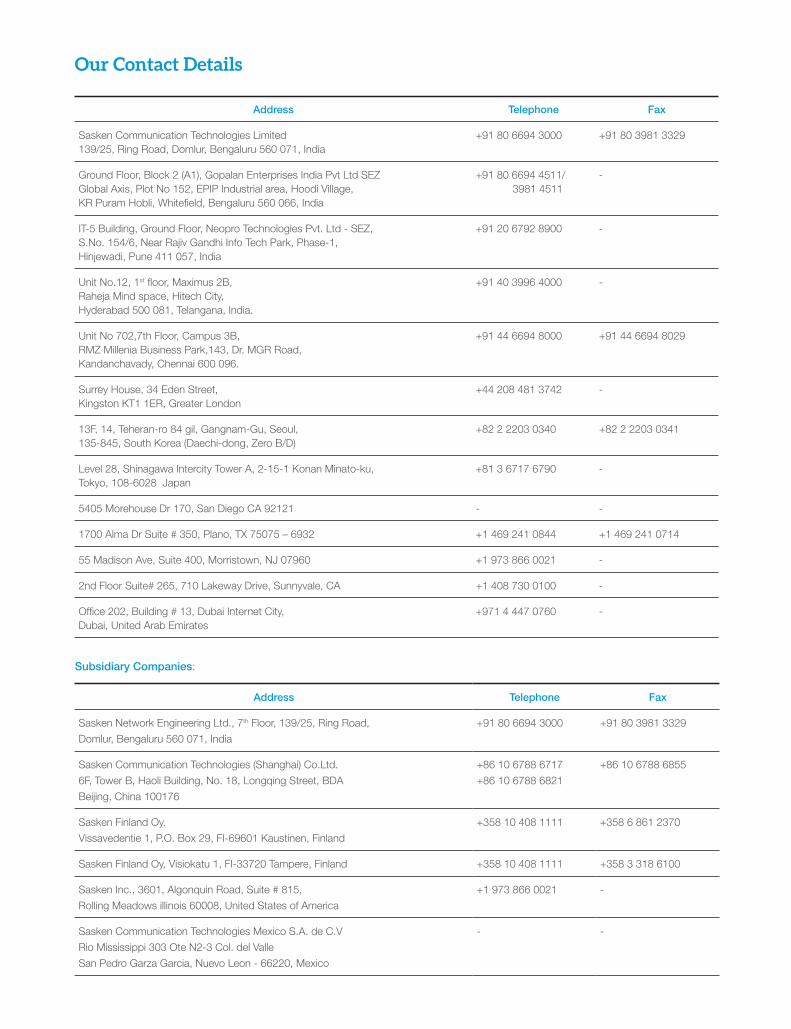
Our Contact Details
Address Telephone Fax
Sasken Communication Technologies Limited139/25, Ring Road, Domlur, Bengaluru 560 071, India
+91 80 6694 3000 +91 80 3981 3329
Ground Floor, Block 2 (A1), Gopalan Enterprises India Pvt Ltd SEZ Global Axis, Plot No 152, EPIP Industrial area, Hoodi Village, KR Puram Hobli, Whitefield, Bengaluru 560 066, India
+91 80 6694 4511/ 3981 4511
-
IT-5 Building, Ground Floor, Neopro Technologies Pvt. Ltd - SEZ,S.No. 154/6, Near Rajiv Gandhi Info Tech Park, Phase-1,Hinjewadi, Pune 411 057, India
+91 20 6792 8900 -
Unit No.12, 1st floor, Maximus 2B,Raheja Mind space, Hitech City,Hyderabad 500 081, Telangana, India.
+91 40 3996 4000 -
Unit No 702,7th Floor, Campus 3B, RMZ Millenia Business Park,143, Dr. MGR Road,Kandanchavady, Chennai 600 096.
+91 44 6694 8000 +91 44 6694 8029
Surrey House, 34 Eden Street,Kingston KT1 1ER, Greater London
+44 208 481 3742 -
13F, 14, Teheran-ro 84 gil, Gangnam-Gu, Seoul,135-845, South Korea (Daechi-dong, Zero B/D)
+82 2 2203 0340 +82 2 2203 0341
Level 28, Shinagawa Intercity Tower A, 2-15-1 Konan Minato-ku,Tokyo, 108-6028 Japan
+81 3 6717 6790 -
5405 Morehouse Dr 170, San Diego CA 92121 - -
1700 Alma Dr Suite # 350, Plano, TX 75075 – 6932 +1 469 241 0844 +1 469 241 0714
55 Madison Ave, Suite 400, Morristown, NJ 07960 +1 973 866 0021 -
2nd Floor Suite# 265, 710 Lakeway Drive, Sunnyvale, CA +1 408 730 0100 -
Office 202, Building # 13, Dubai Internet City,Dubai, United Arab Emirates
+971 4 447 0760 -
Subsidiary Companies:
Address Telephone Fax
Sasken Network Engineering Ltd., 7th Floor, 139/25, Ring Road,
Domlur, Bengaluru 560 071, India
+91 80 6694 3000 +91 80 3981 3329
Sasken Communication Technologies (Shanghai) Co.Ltd.
6F, Tower B, Haoli Building, No. 18, Longqing Street, BDA
Beijing, China 100176
+86 10 6788 6717
+86 10 6788 6821
+86 10 6788 6855
Sasken Finland Oy.
Vissavedentie 1, P.O. Box 29, FI-69601 Kaustinen, Finland
+358 10 408 1111 +358 6 861 2370
Sasken Finland Oy, Visiokatu 1, FI-33720 Tampere, Finland +358 10 408 1111 +358 3 318 6100
Sasken Inc., 3601, Algonquin Road, Suite # 815,
Rolling Meadows illinois 60008, United States of America
+1 973 866 0021 -
Sasken Communication Technologies Mexico S.A. de C.V
Rio Mississippi 303 Ote N2-3 Col. del Valle
San Pedro Garza Garcia, Nuevo Leon - 66220, Mexico
- -
© 2015, Sasken Communication Technologies Ltd. All rights reserved. Products and services mentioned are trademarks and service marks of Sasken Communication Technologies Ltd., or the respective companies.
Scan this QR code to access the digital version of this Annual Report.
www.sasken.com
CHINA ¤ FINLAND ¤ INDIA ¤ JAPAN ¤ SOUTH KOREA ¤ GERMANY ¤ UK ¤ USA
Co
ncep
t an
d D
esig
n: M
arke
ting
@S
aske
n