Embed Size (px)
Citation preview

Annual Report
INFRASTRUCTURERENEWABLES
RESOURCES
For the year ended 30 June 2018
Decmil Group Limited ABN 35 111 210 390 and Controlled Entities

AUSTRALIAN BUSINESS NUMBER35 111 210 390
ASX CODEDCG
REGISTERED ADDRESS20 Parkland Road Osborne Park, WA 6017 Tel: +61 8 9368 8877
ANNUAL GENERAL MEETINGShareholders are advised that the Decmil Group Limited 2018 Annual General Meeting (AGM) will be held on 8th November 2018 at 20 Parkland Road, Osborne Park, Western Australia, commencing at 10.00am (AWST).
ABOUT THIS REPORTThis Annual Report is a summary of Decmil Group Limited’s (ASX: DCG) (“Decmil” or “Company”) operations, activities and financial position as at 30 June 2018.
Decmil Group Limited (ABN 35 111 210 390) is the parent Company of the Decmil Group of companies. In this report, unless otherwise stated, references to ‘Decmil’, ‘DGL’ and ‘the Company’, and ‘we’, ‘us’ and ‘our’ refer to Decmil Group Limited and its controlled entities.
References in the report to ‘the year’ or ‘the reporting period’ relate to the financial year, which is 1 July 2017 to 30 June 2018, unless otherwise stated. All dollar figures are expressed in Australian currency.
In an effort to reduce its impact on the environment, Decmil will only post printed copies of this Annual Report to those shareholders who elect to receive one through the share registry. An electronic copy of this Annual Report will be available on our website at www.decmil.com
DECMIL GROUP LIMITED ABN 35 111 210 390 AND CONTROLLED ENTITIES

CONTENTSOUR COMPANY 40 Years of Success 1
Our Journey 2
Our Founder 4
Vision and Values 5
About Us 6
Our Sectors 9
MESSAGE FROM THE BOARDChairman’s Letter 10
WHAT MATTERS MOST TO USPeople & Culture 12
Health, Safety & Environment 14
Community 16
FINANCIAL REPORT Directors’ Report 18
Auditor’s Independence Declaration 46
Statement of Profit or Loss and Other Comprehensive Income 47
Statement of Financial Position 48
Statement of Changes in Equity 49
Statement of Cash Flows 50
Notes to the Financial Statements 51
Directors’ Declaration 101
Independent Auditor’s Report 102
Additional Information for Listed Public Companies 107
Corporate Directory 109
DECMIL GROUP LIMITED ANNUAL REPORT 2018

We have achieved many great things since our inception and have enjoyed celebrating our milestone with our colleagues, families and friends.
In celebrating our achievement of 40 years we wish to thank everyone who has contributed to our success. We are proud of our journey and we look forward to the future.
IN 2018, DECMIL CELEBRATES 40 YEARS OF SUCCESS.
DECMIL GROUP LIMITED ANNUAL REPORT 2018 | PAGE 1DECMIL GROUP LIMITED ABN 35 111 210 390 AND CONTROLLED ENTITIES

OUR JOURNEY ESTABLISHED IN 1978, DECMIL HAS 40 YEARS’ EXPERIENCE DELIVERING INTEGRATED
SOLUTIONS TO A RANGE OF CLIENTS.
1978 – 1983 The Early Days
1984 – 2003 Building on the
Foundation
1978In Karratha, Western Australia, four men formed a construction company, Silla Careba Pty Ltd
(one of them being Denis Criddle)
1984Decmil opened Perth office in Maddington
1985Continued growth with
Dampier Salt and key works contracts for Woodside
1988Won first major contract for
$20m with Woodside
1993Scott Criddle joined Decmil
2014 – 2018Growth and
Diversification
2015Decmil opens an office in
Auckland and launches Decmil Construction New Zealand
2016Decmil acquires Cut & Fill
(rebranded to Decmil in 2017)
TODAYToday Decmil is a very well
established and highly regarded company with an enviable record of
success and achievement
1999Decmil commences work for Rio Tinto
for the Mesa J process plant
2003Decmil broadens client base with a number of government
infrastructure projects
2009Denis Criddle is appointed as
Chairman of the Board
2009Scott Criddle is appointed Chief Executive Officer of
Decmil Group
2011Decmil expands into Queensland and opens an office in Brisbane
2011Decmil acquires
Homeground Villages
2013Decmil acquires EDE and VDM Construction (East) in Brisbane
2013Decmil wins first international
contract award for Manus Island, Papua New Guinea
1980First major contract awarded
by Dampier Salt Ltd
1982Work continued to increase and include clients such as
Woodside and BHP
1983Denis Criddle and Milan Babic
bought out partners and changed company name to Decmil
Engineering and Construction
2004 – 2008 From Strength
to Strength
2004Awarded first major Perth contract
(construction of the Gosnells Civic Centre)
2005Awarded contracts with Burrup
Fertilisers, Chevron and Rio Tinto
2007Decmil was listed
on the ASX
2007Moved to
Osborne Park premises
2007Awarded construction projects
for Hamersley Iron and Fortescue Metals Group
2008Awarded Woodside Pluto
LNG contract
2009 – 2013Continued Growth & Expansion
2017 First major renewables project
delivered (Gullen Solar Farm) in NSW
DECMIL GROUP LIMITED ANNUAL REPORT 2018 | PAGE 3
SECTION: OUR COMPANY

OUR FOUNDER, DENIS CRIDDLE
This year we recognise the achievements of Decmil’s founder Denis Criddle.
The Decmil story began in 1978 in the Pilbara town of Karratha, Western Australia.
As a young civil engineer working for Hamersley Iron in Dampier, Denis Criddle, with a passion for the region, could see the need for accommodation in the developing regional community. Together with some local businessmen in Karratha they formed a partnership which was the foundation for the Decmil business.
Starting with just four employees, Decmil has grown to now employ hundreds of people and operates across Australia and New Zealand. Denis grew the business to have a head office in Perth and to work with multiple clients including BHP, Woodside and Rio Tinto.
In 2002 Denis Criddle stepped down as Managing Director and Scott Criddle was appointed to this role.
Under Denis’ leadership, a culture of ‘family, respect and mutual support’ was established. These foundations have been a key factor in our company’s success. Additionally, his commitment to training and mentoring of the next generation of professionals in the construction and engineering industry is deeply embedded in our business.
Over the past 40 years, Denis has continued to contribute to the growth and direction of Decmil and has maintained a strong presence not only as a non-executive Board member but as a regular visitor to our offices and projects.
We would like to acknowledge Denis for his commitment and dedication to Decmil and for creating a strong culture from the very beginning. His values and foundations will continue to drive the success and sustainability of Decmil through the years to come.
UNDER DENIS’ LEADERSHIP, A CULTURE OF ‘FAMILY, RESPECT
AND MUTUAL SUPPORT’ WAS ESTABLISHED
DECMIL GROUP LIMITED ABN 35 111 210 390 AND CONTROLLED ENTITIES

OUR VISIONTo be the market leader in project delivery, achieving sustainable growth through the quality of our people and the strength of our relationships.
OUR VALUESINTEGRITY: We are honest in all aspects and treat people with respect and dignity.
EXCELLENCE: We strive to deliver results that stretch our capabilities.
ACCOUNTABILITY: We take responsibility and accountability for our actions and hold others to account.
TEAMWORK: We work together and support each other to achieve our goals.
VISION & VALUES
DECMIL GROUP LIMITED ANNUAL REPORT 2018 | PAGE 5
SECTION: OUR COMPANY
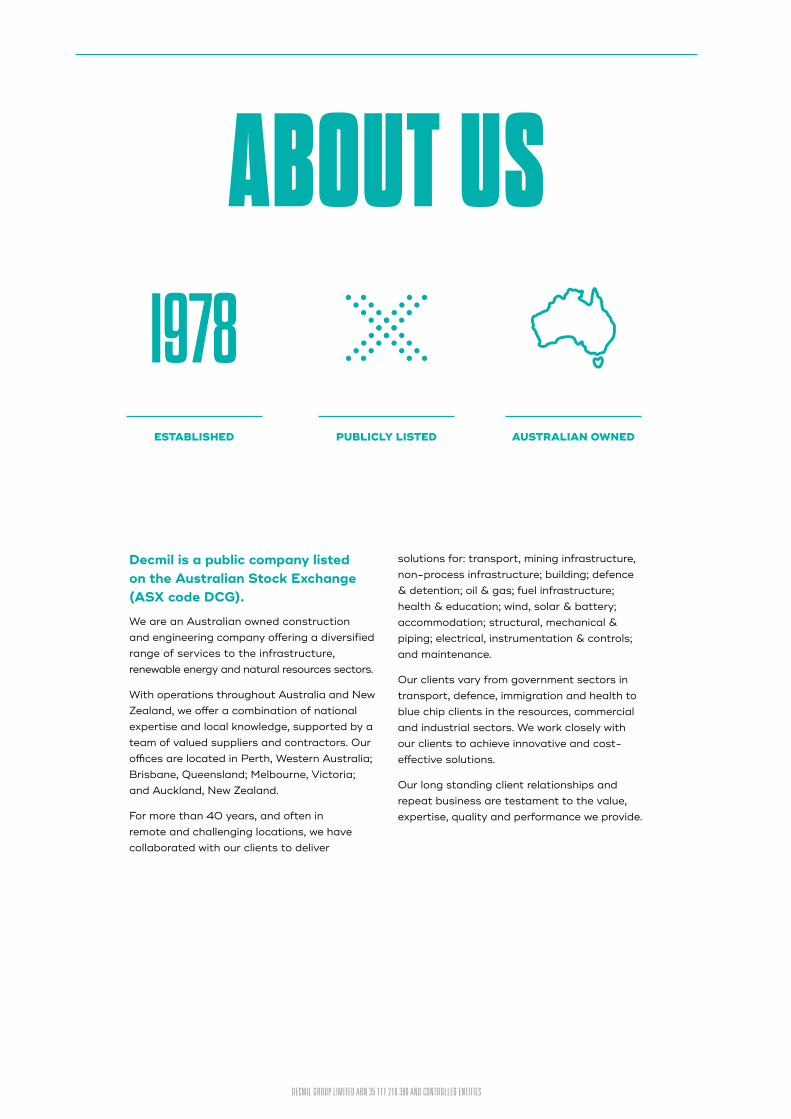
ABOUT US
Decmil is a public company listed on the Australian Stock Exchange (ASX code DCG).
We are an Australian owned construction and engineering company offering a diversified range of services to the infrastructure, renewable energy and natural resources sectors.
With operations throughout Australia and New Zealand, we offer a combination of national expertise and local knowledge, supported by a team of valued suppliers and contractors. Our offices are located in Perth, Western Australia; Brisbane, Queensland; Melbourne, Victoria; and Auckland, New Zealand.
For more than 40 years, and often in remote and challenging locations, we have collaborated with our clients to deliver
ESTABLISHED PUBLICLY LISTED AUSTRALIAN OWNED
solutions for: transport, mining infrastructure, non-process infrastructure; building; defence & detention; oil & gas; fuel infrastructure; health & education; wind, solar & battery; accommodation; structural, mechanical & piping; electrical, instrumentation & controls; and maintenance.
Our clients vary from government sectors in transport, defence, immigration and health to blue chip clients in the resources, commercial and industrial sectors. We work closely with our clients to achieve innovative and cost- effective solutions.
Our long standing client relationships and repeat business are testament to the value, expertise, quality and performance we provide.
DECMIL GROUP LIMITED ABN 35 111 210 390 AND CONTROLLED ENTITIES

DECMIL GROUP LIMITED ANNUAL REPORT 2018 | PAGE 7
SECTION: OUR COMPANY

INFRASTRUCTURE
RENEWABLES
RESOURCESDECMIL GROUP LIMITED ABN 35 111 210 390 AND CONTROLLED ENTITIES

From scoping studies through to design, approvals, delivery and operations we optimise all stages of the development process to provide our clients with a cost effective and streamlined delivery solution.
Drawing on our knowledge and experience of delivering large infrastructure projects, we deliver optimal performance, availability and reliability options for our clients.
By integrating power generation technology from recognised equipment manufacturers with our design and construction expertise, we have the proven capacity to provide the most cost-effective renewable energy solutions.
Overall, we provide a low risk, proven capability and an innovative approach to the renewable sector.
RESOURCESDecmil has an extensive history of achievement in the delivery of large scale resource projects.
We have the capacity and experience to deliver everything from accommodation, process and non-process infrastructure, civil construction, transport infrastructure and fuel infrastructure solutions.
Our proven history in delivering resource projects is due to our flexible approach and integrated engineering and construction capability.
We respond efficiently to our clients’ needs and add value at all stages of the project life cycle. We have the expertise to self-perform works and have strong relationships with specialist sub-contractors where required.
With our collaborative approach to project delivery, combined with thorough safety, environment and quality systems, we are able to achieve desired outcomes for our clients.
Decmil provides design, engineering and construction services for the infrastructure, renewable energy and natural resources sectors. Our experienced in-house teams provide customised project solutions for a range of conditions and environments.
INFRASTRUCTUREDecmil has significant experience in infrastructure engineering and construction, delivering multidisciplinary projects in sectors such as transport, utilities, water, defence, corrections, health and education.
Our capabilities include bulk earthworks, road construction and maintenance, bridgeworks and environmental remediation and engineering. Through combining a wide range of skills with new and unique methods and technologies we are able to deliver projects in a timely and safe manner.
We hold National Roads Prequalification R5, B4, F150+ meaning we are well placed and experienced to deliver transport infrastructure projects across Australia.
Our robust quality management controls and systems enable us to deliver the high integrity products required by our clients and their customers.
RENEWABLESDecmil offers a range of feasibility, engineering, project management and construction services for the renewable energy sector with capabilities in solar, wind and energy storage projects.
OUR SECTORS
DECMIL GROUP LIMITED ANNUAL REPORT 2018 | PAGE 9
SECTION: OUR COMPANY

OPERATIONSOperations in the 2018 financial year reflected the diversity of Decmil, with project activity spanning a number of sectors including WA Iron Ore works, Queensland Coal Seam Gas upstream maintenance, various public-sector infrastructure projects in Australia and New Zealand, road and bridge projects for State road authorities and renewable energy.
KEY HIGHLIGHTS ~ A project for BHP at its South Flank project in relation to
the upgrade and expansion of the Mulla Mulla village and for Fortescue in relation to its Port Hedland tug harbour;
~ Expansion of the Decmil business in New Zealand including the award of a combined NZ$185+ million Corrections project;
~ The award to Decmil’s Victorian business unit of almost $100 million of new transport infrastructure construction work and a significant increase in tendering activity in this region;
~ Completion of the Gullen solar project near Goulburn in New South Wales and secured a Memorandum of Understanding for an EPC contract with Maoneng Australia in relation to its Sunraysia project; and
~ The consolidation of the Group’s focus on the infrastructure, resources and renewable energy sectors and achieving greater operational consistency across regional business units in Australia and New Zealand.
FINANCIAL PERFORMANCE & POSITION In the 2018 financial year Decmil returned to top line revenue growth, with the core Construction & Engineering business unit growing revenue from continuing operations by 28% year on year as the Company secured a number of new and larger contracts.
CHAIRMAN’S LETTER
DECMIL GROUP LIMITED ABN 35 111 210 390 AND CONTROLLED ENTITIES

Our financial position remained sound and at 30 June 2018 the Group’s balance sheet reflected an overall net cash position of $17 million, no drawn core senior secured debt and net tangible assets of $131 million.
STRATEGY AND OUTLOOKThe Company consolidated its focus on the infrastructure, resources and renewable energy sectors across Australia and New Zealand and is experiencing strong market conditions across these sectors.
Based on the Company’s current tender pipeline and work in hand, and as at the date of this report, Decmil expects FY19 revenue to exceed $500 million with work in hand at ~$400 million.
The Group continues to see good market conditions across a number of its key sectors including:
~ Resources: FMG’s Eliwana and Rio Tinto’s Koodaideri projects coming to the contractor market in FY19 and improved market conditions in the Queensland Coal Seam Gas sector;
~ Infrastructure: Significant public-sector infrastructure spend by State and Federal Government, in the Transport sector in Victoria; and
~ Renewable energy: Actively bidding a number of solar PV and wind projects as a balance of plant contractor.
CONCLUSIONThe transformation that has occurred at Decmil in recent years has created a diverse and sustainable national business with strong market conditions in its core sectors and the strongest pipeline of opportunities seen in many years.
In addition to our business ambitions, Decmil is also committed to being a good corporate citizen by taking responsibility for all our social, ethical and environmental actions. We see ourselves as part of the communities in which we operate, and as such we strive to be a positive, active and contributing participant in community life. Decmil’s Corporate Social Responsibility program, Decmil in the Community, is about giving back, helping people in need and supporting local communities. We do this through charity events, corporate friendships, charity partnerships, volunteering and donating. Decmil strives to make a broad and meaningful contribution to the communities in which we operate through these mechanisms.
Later this year we will bid farewell to the founder of Decmil, Denis Criddle, who will retire from his formal service on the Decmil Board. We wish Denis, Nola and their family all the best for the future.
We also recently welcomed two new Board members, Don Argent and Dickie Dique, and look forward to the contribution they will make to the business.
In closing, the Board and executive team believe that the measures we have taken in the past year have placed the business in a strong position for the future. I would like to take this opportunity on behalf of the Board to thank our loyal shareholders for their ongoing support and our employees for their dedication to Decmil.
David Saxelby Chairman
IN THE 2018 FINANCIAL YEAR WE CELEBRATE THE 40TH ANNIVERSARY OF DECMIL AND IN THAT
REGARD, IT IS MY GREAT PLEASURE TO PROVIDE A SUMMARY OF THE PAST YEAR.
DECMIL GROUP LIMITED ANNUAL REPORT 2018 | PAGE 11
SECTION: MESSAGE FROM THE BOARD

PEOPLE & CULTURE
Decmil has a proud history of project delivery since 1978 and this year we celebrate 40 years of successful operations. Our business has seen many changes but our foundations and vision remain the same.
Our unique way of doing things, The Decmil Way, allows us to build a team unified by our strategy and vision, our commitment to building shareholder value and our culture. This empowers every employee to make decisions and excel.
Our vision, ‘To be the market leader in project delivery, achieving sustainable growth through the quality of our people and the strength of our relationships’, will continue to remain relevant and essential for success across Decmil.
Our values are vital as they are the essence of our identity, support our vision and shape our culture. Having a clear and defined set of values helps guide and unify us as one team.
The Decmil Way is driven by our values:
Integrity We are honest in all aspects and treat people with respect and dignity.
Excellence We strive to deliver results that stretch our capabilities.
Accountability We take responsibility and accountability for our actions and hold others to account.
Teamwork We work together and support each other to achieve our goals.
DECMIL GROUP LIMITED ABN 35 111 210 390 AND CONTROLLED ENTITIES

Our hiring philosophy ensures that we attract the right people who are highly skilled in their areas of expertise and aligned to The Decmil Way to ensure success at every level. We are driven to hire local and indigenous employees to secure a diverse and all-encompassing workforce.
With everyone aligned and working The Decmil Way we create a great workplace that will ensure the sustainability and success of Decmil.
ANNUAL OVERVIEWThe last twelve months have seen us grow our project delivery teams with a focus on civil and renewable capability. Nationally, we have welcomed several new senior positions as our regions grow and our strategy further focuses on work winning in our three key sectors of infrastructure, resources and renewables.
As a business with a large proportion of our workforce involved in contracting, Decmil continually adjusts staffing levels to meet the demands of the projects in which we are involved. As at 30 June 2018 Decmil employed 552 people; 336 salaried employees and 216 wages employees.
We are employing people across Australia and New Zealand who represent a diversity of cultures, backgrounds and skills. Over the last 12 months, our New Zealand Team has grown significantly, increasing from 17 employees to 54 employees spread across Auckland, Wellington and Christchurch.
Our regions will continue to grow in headcount throughout the upcoming year with us focusing on attracting highly skilled workers who support The Decmil Way.
To keep our employees engaged and empowered, we promote professional development through relationship building between co-workers, individual development plans, ensuring a safe work environment and offering competitive compensation.
Over the coming year, Decmil will continue to focus on initiatives aimed at recognising and developing our people to be the best they can be and creating a united culture within all the businesses.
DECMIL GROUP LIMITED ANNUAL REPORT 2018 | PAGE 13
SECTION: WHAT MATTERS MOST TO US

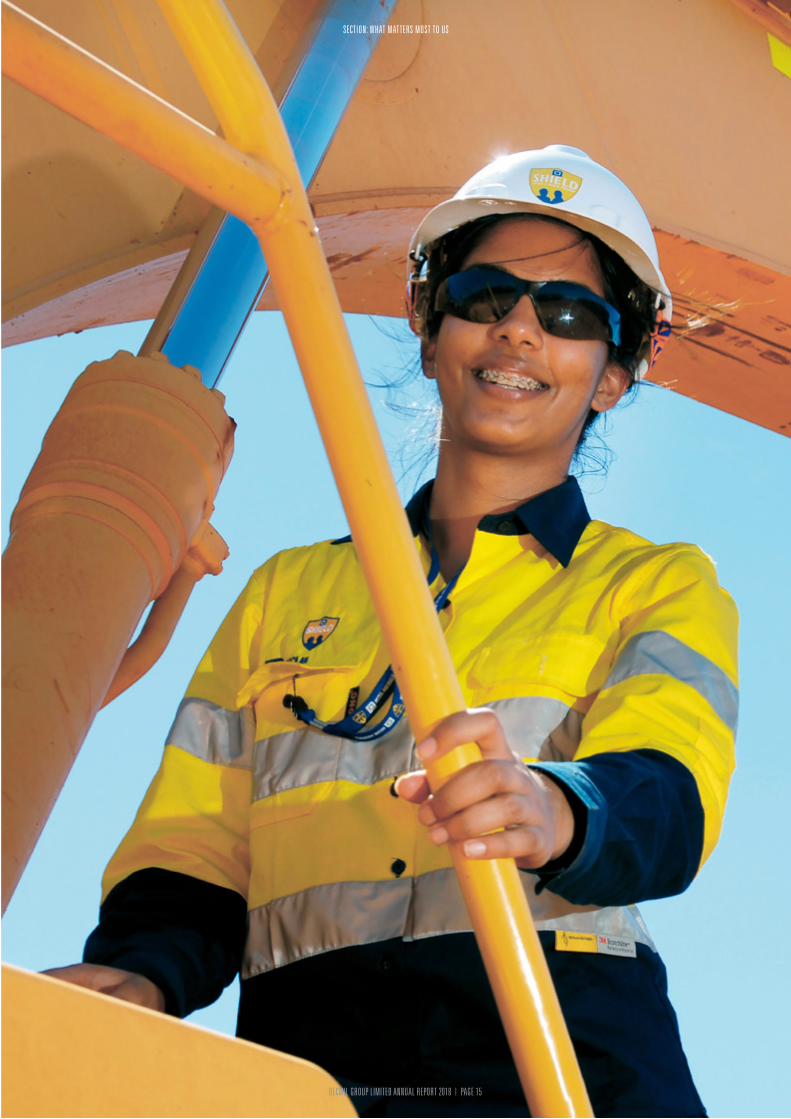
HEALTH, SAFETY & ENVIRONMENT
SHIELDKeeping our people and our projects safe is central to everything we do at Decmil.
SHIELD is about:
~ Recognising ‘What Matters Most’ to each of us;
~ Understanding those behaviours that will keep us safe at work;
~ Conducting safety conversations in the workplace to promote safe behaviours and correct at-risk behaviours; and
~ Providing a program to recognise and reward safe behaviours.
The purpose of our SHIELD program is to drive the behaviours, attitudes, decisions and actions within the business to achieve a working environment that is free from injury or incident.
Since it was implemented eight years ago, the SHIELD program has assisted significantly in reducing Total Recordable Injury Frequency Rates (TRIFR) across all Project sites.
THE HEALTH AND SAFETY OF EVERY EMPLOYEE IS FOREMOST IN EVERYTHING WE DO. IT IS A KEY FOCUS OF OUR GROUP AND IS UNDERPINNED BY OUR VALUES SYSTEM.
WORK HEALTH & SAFETY During the 2018 financial year the Group recorded improved safety performance results compared to the previous year as measured by the TRIFR. The TRIFR was 3.35 for this period. Within this result, an outstanding TRIFR performance of ‘Zero’ was achieved by the Decmil Southern region.
The Group has achieved unified certification under the Federal Safety Accreditation scheme for all of its Construction and Engineering divisions.
Over the next 12 months the Group is focused on a range of key initiatives to support the safety and well-being of our staff.
These include continued Work Health and Safety (WHS) leadership development programs, visible leadership programs focused on WHS in the field, health promotion activities and enhancement of software solutions to drive a paperless system and simplify the administration of WHS processes, as well as access to WHS management system information for our people.
ENVIRONMENTEnvironmental management is a key focus of the Group with exceptional performance reported for the 2018 financial year. There were no regulatory breaches or significant environmental impacts recorded with the Group’s operations over this period.
Over the next 12 months the Group is targeting further greenhouse gas emissions intensity reductions as a measure of our full-time equivalent staff numbers. To achieve this result we will be increasing education and awareness for staff around our carbon footprint and recognising initiatives to achieve and improve on our sustainability results.
DECMIL GROUP LIMITED ABN 35 111 210 390 AND CONTROLLED ENTITIES
DECMIL GROUP LIMITED ANNUAL REPORT 2018 | PAGE 15
SECTION: WHAT MATTERS MOST TO US

LOCAL COMMUNITIES We are proud of the positive contributions Decmil makes to the communities in which we operate. In addition to providing local employment and service opportunities, we support a range of initiatives that help create healthy, vibrant and cohesive communities.
Our Corporate Social Responsibility program, Decmil in the Community, is about giving back, helping people in need and supporting local communities. We do this through:
~ Charity events
~ Corporate friendships
~ Project based initiatives
~ Staff driven initiatives
~ Volunteering
~ Donations
We encourage our project teams to engage with local communities to support education, sport and culture as well as proactively working to help improve social amenities.
INDIGENOUS PARTICIPATIONDecmil is committed to indigenous participation across all positions and levels. We develop partnerships and initiatives with local communities to encourage indigenous participation.
In the delivery of our projects, we engage with local indigenous workforce solutions and indigenous businesses to:
~ Develop procurement strategies that provides opportunities for Indigenous people
~ Train and equip our people with cultural knowledge and understanding
~ Work with our subcontractors so that they engage with Aboriginal and Torres Strait Islander people and communities.
COMMUNITYMENTAL HEALTHA key focus of Decmil is the mental health of our people and the broader community.
We actively fundraise for mental health organisations to help raise awareness and understanding of mental health issues, empowering people to seek help, and supporting their recovery, management and resilience.
STAFF DRIVEN INITIATIVESAt Decmil, we encourage our people to participate in organised charity events. Over the past year the Company has been involved in Daffodil Day, World’s Greatest Shave, Lifewise Big Sleep, MS Walk and Fun Run and a national Christmas collection for the Smith Family.
Also, the Decmil in the Community mandate encourages staff driven charity initiatives that assist worthy charities and support the communities in which we operate. Internal assistance with fundraising and promotion is provided to staff who instigate initiatives which support Decmil’s charity partners and our local communities.
Over the past year, Decmil people have undertaken a range of initiatives such as participation in the Climb for Cancer, Walk 2 D’Feet, Fidelity Life Corporate Run, Paella Lunch, Host a Patient Dinners for the Cancer Society and chocolate sales within the office with proceeds donated to charity.
We encourage our project teams to engage with local communities to support education, sport and culture as well as proactively working to help improve social amenities.
DECMIL GROUP LIMITED ABN 35 111 210 390 AND CONTROLLED ENTITIES

WE ARE COMMITTED TO BEING A GOOD CORPORATE CITIZEN BY TAKING RESPONSIBILITY FOR ALL OF OUR
SOCIAL, ETHICAL AND ENVIRONMENTAL ACTIONS.
DECMIL GROUP LIMITED ANNUAL REPORT 2018 | PAGE 17
SECTION: WHAT MATTERS MOST TO US

DIRECTORS’ REPORT
The names of directors of the Company at any time during or since the end of the financial year are:
DAVID SAXELBYNON-EXECUTIVE CHAIRMAN
SCOTT CRIDDLEMANAGING DIRECTOR AND CHIEF EXECUTIVE OFFICER
DENIS CRIDDLENON-EXECUTIVE DIRECTOR
BILL HEALYNON-EXECUTIVE DIRECTOR
DON ARGENTNON-EXECUTIVE DIRECTOR
DICKIE DIQUENON-EXECUTIVE DIRECTOR
OUR DIRECTORS PRESENT THEIR REPORT ON THE COMPANY AND ITS CONTROLLED ENTITIES FOR THE FINANCIAL YEAR ENDED 30 JUNE 2018.
DECMIL GROUP LIMITED ANNUAL REPORT 2018 | PAGE 19DECMIL GROUP LIMITED ABN 35 111 210 390 AND CONTROLLED ENTITIES
SECTION: FINANCIAL REPORT

BOARD OF DIRECTORS
DAVID SAXELBYNON-EXECUTIVE CHAIRMAN
David was appointed as a Non-Executive Chairman in March 2018. He has held Managing Director and CEO roles for the past decade, most recently with Lendlease as CEO of Construction and Infrastructure Australia.
Prior to Lendlease, David was with the Leighton Group for 18 years, where he held a number of senior positions, most recently as Managing Director of Thiess. In addition to these roles, David has held a number of senior positions on Industry Boards and was listed in the Top 100 Engineers in Australia.
DENIS CRIDDLENON-EXECUTIVE DIRECTOR
Denis was the founder of Decmil Australia, Decmil Group Limited’s major business division. He was appointed to the Company’s Board as a Non-Executive Director in August 2007 and served as the Non-Executive Chairman from September 2009 to December 2011.
Denis is a civil engineer with more than 30 years’ experience in construction and maintenance services for the oil and gas and resources sectors in central Queensland and north-west Western Australia.
Denis has been involved in rural investments and local Government and was elected Shire President of the Roebourne Shire Council during the development years of oil and gas expansion in the Karratha region.
BILL HEALYNON-EXECUTIVE DIRECTOR
Bill Healy was appointed as Non-Executive Director in April 2009 and served as the Non-Executive Chairman from July 2014 to February 2018. Bill was a director and shareholder in Sealcorp Holdings from 1985 which then established and developed the diversified financial services group.
He was a founding director of ASGARD Capital Management Ltd, Securitor Financial Group Ltd, PACT Investment Group Pty Ltd and ASSIRT Pty Ltd. Sealcorp was acquired by St George Bank in 1997 and Bill remained on the Board until 1999.
He was founding director and Chairman of BOOM Logistics Ltd and was involved in the development of the Company’s business model, early acquisitions and preparation for listing in 2003.
DON ARGENTNON-EXECUTIVE DIRECTOR
Don was appointed as Non-Executive Director of Decmil in March 2018. Don was the Director Finance and Administration for the Thiess Group, one of the largest integrated engineering and services providers in Australia and South East Asia.
He joined Thiess Pty Ltd in 1985 following six years’ service with Thiess Holdings Ltd in the late 1970’s, and until he retired in July 2011, played an instrumental part in the growth of Thiess from a family-run business to a leading Australian construction, mining and services company.
Don holds a Bachelor of Commerce degree, is a Certified Practising Accountant and a Fellow of the Australian Institute of Company Directors.
DICKIE DIQUENON-EXECUTIVE DIRECTOR
Dickie was appointed as Non-Executive Director of Decmil in July 2018. Dickie has 25 years’ experience in senior executive and management roles in construction businesses and is a respected leader in the Western Australian construction industry.
A registered builder, Dickie’s experience covers the commercial, civil, residential, mining and modular sectors. Dickie is very familiar with Decmil, having held the roles of General Manager and Chief Operating Officer.
Dickie’s most recent operational role was as a Director at Pindan Contracting. He also sits on the Board of GO2 People Ltd.
DECMIL GROUP LIMITED ANNUAL REPORT 2018 | PAGE 21DECMIL GROUP LIMITED ABN 35 111 210 390 AND CONTROLLED ENTITIES
SECTION: FINANCIAL REPORT

EXECUTIVE MANAGEMENT
SCOTT CRIDDLEMANAGING DIRECTOR AND CHIEF EXECUTIVE OFFICER
Scott was appointed Chief Executive Officer in July 2009, and Managing Director of Decmil Group Limited in April 2010 and has been a Director of the Company since that time.
He was previously the Managing Director of Decmil Australia. In this role he was responsible for the long-term growth and strategic direction of the Company, playing a key role in building relationships with stakeholders and clients.
Scott joined Decmil Australia in 1993 as a construction labourer to gain experience and learn about the company from the ground up. He has held a variety of roles within Decmil Australia including Construction Manager, Estimator, Business Development Manager and Area Manager.
Scott holds a Bachelor of Applied Science in Construction Management and Economics.
CRAIG AMOSCHIEF FINANCIAL OFFICER
Craig was appointed Chief Financial Officer in March 2014, having previously held the position of Group Manager for Corporate Development at Decmil Group Limited.
As a qualified chartered accountant, he has over 20 years’ experience in finance, accounting, corporate transactions and commercial projects in both corporate and professional service environments.
Prior to joining Decmil he held the position of Executive Director in the Corporate Finance division of Ernst & Young where he gained extensive experience leading teams on a range of strategic corporate transactions.
Craig holds a Bachelor of Commerce (with Honours) and a Graduate Diploma in Applied Finance. He is also a Fellow of the Financial Services Institute of Australasia.
TONY RADALJ
CHIEF OPERATING OFFICER
Tony joined Decmil in 2012 and was appointed Chief Operating Officer for Decmil in August 2017. During the past six years Tony has held key positions in Decmil such as Construction Manager and General Manager for Decmil Australia.
Tony’s career spans across various sectors such as health, oil and gas, resources, government infrastructure, building and renewables. Tony brings extensive technical experience and a strong focus on strategy for Decmil.
With his flexible management style, he motivates and empowers teams to enable a strong work ethic and produce rewarding outcomes.
Tony has extensive experience in relationship style contracting ensuring positive relationships are sustained with our clients. This includes utilising contracting models such as lump sum, design & construct, alliance and early contractor involvement.
ALISON THOMPSONCOMPANY SECRETARY
Alison has held several senior financial positions within the Group since August 2007. She is currently the Group Financial Controller for Decmil and was appointed Company Secretary in January 2014.
She has extensive technical experience gained from 4 years with PricewaterhouseCoopers and prior to joining Decmil, gained valuable industry experience at international construction firm Balfour Beatty based in the United Kingdom.
Alison holds a Bachelor of Commerce and a Graduate Diploma of Applied Corporate Governance, and is a Fellow of Chartered Accountants, Australia and New Zealand.
DECMIL GROUP LIMITED ANNUAL REPORT 2018 | PAGE 23DECMIL GROUP LIMITED ABN 35 111 210 390 AND CONTROLLED ENTITIES
SECTION: FINANCIAL REPORT

Directors’ Report Cont’d FOR THE YEAR ENDED 30 JUNE 2018
Principal Activities
Decmil provides design, engineering and construction work for the Infrastructure, Resources and
Renewable Energy sectors:
Infrastructure
▪ Government infrastructure projects including accommodation, immigration facilities, corrections
facilities, office buildings, defence facilities, schools, administration buildings and storage facilities;
▪ Design and construction of fuel infrastructure facilities; and
▪ Road and bridge civil engineering projects.
Resources
▪ Construction of remote non-process infrastructure, including industrial buildings, processing plants,
workshops and storage facilities;
▪ Coal Seam Gas and LNG wellhead installation with associated pipelines and facilities; and
▪ Civil work on brown and greenfield projects including site preparation, excavation and bulk
earthworks in regional and remote areas.
Renewables
▪ Civil works for remote wind and solar projects including site preparation, foundations and pilings;
▪ Structural and mechanical installations including towers for wind farms and framing systems and PV
modules for solar projects; and
▪ Specialist electrical work for energy storage and distribution.
Operating Results
The consolidated entity reported a statutory loss after providing for income tax expense of $6,131,000
(2017: $28,347,000).
Dividends Paid or Recommended
No final dividend was paid, declared or recommended for payment.

Directors’ Report Cont’d FOR THE YEAR ENDED 30 JUNE 2018
Overview of the Activities of the Group
Decmil was established in 1978 and since has grown to provide design, engineering, construction and
maintenance engineering construction services to the Infrastructure, Resources and Renewable sectors across Australia and New Zealand.
The business currently has three key sector pillars that form the base of the business. These three
pillars of focus (along with sub-sectors) are summarised in the below table:
Infrastructure Resources Renewables
Defence Iron Ore Solar PV
Roads and Bridges Coal Seam Gas Wind
Health LNG
Corrections
Immigration
Education
As part of the Group’s focus on the above sectors, in FY18 it exited non-core operations in the
telecommunications and design consulting sectors.
Operational Highlights
Operations in FY18 reflected the diversity of the Group, with project activity spanning a number of
sectors including WA Iron Ore works, Queensland coal seam gas upstream maintenance, various public
sector infrastructure projects in Australia and New Zealand, road and bridge projects for State road
authorities and renewable energy.
Key highlights:
▪ Completion and commissioning of projects in the WA Iron Ore sector including a logistics hub for
BHP at Port Hedland and non-process infrastructure for Rio Tinto at its Amrun and Silvergrass
mines;
▪ Commencement of a project for BHP at its South Flank project in relation to the upgrade and
expansion of the Mulla Mulla village and for Fortescue in relation to its Port Hedland tug harbor;
▪ Expansion of the Decmil business in New Zealand including the award of a combined NZ$185 million
Corrections project;
▪ The award to Decmil’s Victorian business unit of ~$100 million of new transport infrastructure
construction work and a significant increase in tendering activity in this region;
▪ Completion of the Gullen solar project near Goulburn in New South Wales and secured a
Memorandum of Understanding for an EPC contract with Maoneng Australia in relation to its
Sunraysia project; and
▪ The consolidation of the Group’s focus on the Infrastructure, Resources and Renewable Energy
sectors and achieving greater operational consistency across regional business units in Australia
and New Zealand.
Operational focus for the 2019 financial year will be:
▪ Completion of BHP’s Mulla Mulla Village Expansion;
▪ Ramp up on Decmil’s project for NZ Corrections;
▪ Ramp up on a number of new road and bridge projects in Victoria; and
▪ Continued focus on project delivery on a wide range of existing projects.

Directors’ Report Cont’d FOR THE YEAR ENDED 30 JUNE 2018
Financial Performance & Position
Revenue from continuing operations of $342 million for the twelve months ended 30 June 2018 grew by
23.3% from $277 million as the Company secured a number of new and larger contracts in the later part
of the 2017 calendar year.
Gross margin percentage for the twelve months ended 30 June 2018 was 10.4%.
As part of the Group’s focus on the Infrastructure, Resources and Renewable Energy sectors it
permanently exited non-core operations in the telecommunications and design consulting sectors,
resulting in a total loss on discontinued operations of $6 million.
At 30 June 2018 the Group’s balance sheet reflected an overall net cash position of $16.8 million, no
drawn core senior secured debt and net tangible assets of $131 million.
In FY18 the Group has also expanded working capital and bonding capacity to $272 million of facilities to
fund expected growth in its operations going into FY19.
Significant Changes in State of Affairs
There were no significant changes in the state of affairs of the consolidated entity during the financial
year.
After Balance Date Events
No matters or circumstances have arisen since the end of the financial year which significantly affected
or may significantly affect the operations of the consolidated entity, the results of those operations, or the
state of affairs of the consolidated entity in future financial years.

Directors’ Report Cont’d FOR THE YEAR ENDED 30 JUNE 2018
Likely Developments and Outlook
In FY18 the business consolidated its focus on the Infrastructure, Resources and Renewable Energy
sectors across Australia and New Zealand and is experiencing strong market conditions across these
sectors.
Based on the Company’s current tender pipeline and work in hand, and as at the date of this report,
Decmil expects FY19 revenue to exceed $500 million.
Work in hand (comprised of contracted and preferred contracts) for FY19 stands at ~$400 million
comprised primarily of forward revenue from Decmil’s NZ Corrections and Schools, BHP South Flank,
QGC and various VicRoads transport infrastructure projects.
Going into FY19 the Group continues to see good market conditions across a number of its key sectors
including:
▪ Natural Resources: Sustaining capital works and replacement tonnage projects in the WA Iron Ore
market;
▪ Infrastructure: Significant opportunity in the Transport sector in Victoria where the Group is actively
pursuing new road and bridge projects as both head contractor and in joint ventures; and
▪ Renewable Energy: Actively bidding a number of solar PV and wind projects as a balance of plant
contractor.
The recent budgets announced by State and Federal Government have presented a number of opportunities for Decmil including the following transport infrastructure projects that the Company has bid or is targeting in FY19:
▪ Mordialloc Freeway (VicRoads): the Mordialloc Freeway is a proposed new 9km freeway linking
the end of the Mornington Peninsula Freeway at Springvale Road to the Dingley Bypass. Following
an Expression of Interest process Decmil, with its JV partner McConnell Dowell, has been shortlisted
to one of two bidders for the tender stage to design and construct the Mordialloc Bypass;
▪ M80 Ring Road Upgrade (VicRoads): the M80 Ring Road Upgrade relates to the design and
construction of the remaining northern sections of the M80 Ring Road. Decmil, with its JV partner
BMD, is one of two bidders that has submitted an Expression of Interest;
▪ Oxley Highway, Gunnedah (NSW RMS): Decmil is a shortlisted contractor for the Oxley Highway
project in Gunnedah. The project relates to the design and construction of a bridge over an existing
rail line; and
▪ Drysdale Bypass (VicRoads): Decmil is a shortlisted contractor for the design and construction of
the Drysdale Bypass from Grubb Road to Whitcombes Road in Victoria.
Decmil’s strategy remains based on an overall ambition to build a diverse and strong construction and
engineering business.
Directors’ Report Cont’d FOR THE YEAR ENDED 30 JUNE 2018
Material Business Risks
The key challenges for the Group going into the 2019 financial year are:
▪ To recruit quality staff that can sustain projected growth;
▪ Retain robust project controls to ensure project returns are predictable;
▪ To select projects that can deliver acceptable returns; and
▪ Control overheads across the Group.
Material risks that could adversely affect the Group include the following:
▪ The Company is exposed to a number of macro-economic cycles, in particular capital expenditure by
State and Federal Government and in natural resources. These cycles are in turn impacted by a variety
of factors inclusive of fiscal conditions in the economy, Government policy on capital expenditure and
commodity prices. Any weakness in the broader construction and engineering sector and a reduction in
growth capital expenditure across major new natural resource projects will impact the Company.
▪ A portion of the Group's contracts are 'lump sum' in nature and to the extent costs exceed the
contracted price, there is a risk these amounts may not be recovered. From time to time variations to
the planned scope occurs or issues arise during the construction phase of a project, not anticipated at
the time of bid. This may give rise to claims under the contract with the principal in the ordinary course
of business. Where such claims are not resolved in the ordinary course of business they may enter
formal dispute and the outcome upon resolution of these claims may be materially different to the
position taken by Company.
▪ In order for the Group to continue working on engineering construction projects, a robust safety
methodology needs to be in place. A serious safety incident or fatality has the ability to create a
substantial risk to Decmil's social licence to operate. Decmil mitigates this safety risk via its 'SHIELD'
safety methodology, ensuring that all employees (including senior management) and sub-contractors
are aligned and engaged with the approach to safety.
▪ The Company is dependent on various technical and financial accreditations to operate the business.
These include safety accreditations, quality assurance standards, building licences, technical
accreditations by State Main Roads agencies and various financial accreditations. Many of these
accreditations are assessed and monitored by State and Federal Government Agencies. Any failure to
maintain or comply with an accreditation can impact the eligibility of the Company to participate in
certain projects and sectors.
▪ The Company operates as a ‘Design and Construct’ or ‘Engineer, Procure and Construct’ contractor in
the engineering sector. Such projects and contracts place an obligation on the Company to design ‘Fit
for Purpose’ infrastructure and to give warranties to such effect. Any failure in design may see the
Company exposed to contractual claims for breach of ‘Fit for Purpose’ or design obligations and, from
time to time, to performance and liquidated damages. The Company manages this risk by maintaining
Professional Indemnity insurance and also engaging appropriate third party design consultants for
complex or specialist design expertise.
▪ Any abatement in economic activity in the Gladstone region will result in a short term diminution in the
occupancy levels at the Homeground Village and significantly lower levels or revenue and profit than
historically generated. Management expects that in the medium term new opportunities will arise for
Homeground Gladstone as the LNG sector in Gladstone moves from the construction to the operational
and maintenance stages; however the risk of volatility in the short term remains present.
▪ Decmil's ability to remain productive, profitable and competitive and to effect its planned growth
initiatives, depends on its ability to attract and retain skilled labour. Tightening of the labour market in
key regions due to a shortage of skilled labour, combined with a high industry turnover rate and
growing number of competing employers for skilled labour, may inhibit Decmil's ability to hire and retain
employees. Decmil is exposed to increased labour costs in markets where the demand for labour is
strong. A shortage of skilled labour could limit Decmil's ability to grow its business or lead to a decline
in productivity and an increase in training costs and adversely affect its safety record. Each of these
factors could materially adversely impact its revenue and, if costs increase or productivity declines, its
operating margins.

Directors’ Report Cont’d FOR THE YEAR ENDED 30 JUNE 2018
Material Business Risks (Cont’d)
During the 2015 financial year the Company implemented an enterprise risk review process to identify
the most material risks facing the Company enterprise wide, together with an action plan to mitigate the
occurrence or effect of each identified risk (Enterprise Risk Register). Each of the risks on the Enterprise
Risk Register have been allocated to an owner who is responsible for monitoring, reporting and
implementing action plans for each of the risks.
The Enterprise Risk Register brings together the most critical risks (both corporate and operational)
identified by the Group Risk Management System and creates a structured process for regular reporting
to the Board.
The Enterprise Risk Register is reviewed and presented to the Audit and Risk Committee on a quarterly
basis.
Capital Management
Management is continually assessing the optimal capital structure to ensure the Group is working
towards providing shareholders with adequate returns based on assessment of market risks and
opportunities. This includes the management of debt levels, distributions to shareholders and the
requirement for further equity funding.
Whilst the Group has access to substantial senior debt and bonding facilities, it ended the year with no
senior debt and low levels of gearing.
Management also periodically reviews the level of capital invested in the Homeground Gladstone Village
and where appropriate opportunity exists, will consider options to monetise the asset.
Environmental Regulation
The Company is subject to environmental regulation in accordance with applicable state, territory or
federal legislation and statutory requirements for the jurisdictions in which it operates.
There were no incident events that required reporting to relevant statutory bodies during the financial
year.
The Company aims to continually improve its environmental performance and has established carbon
emission reduction targets for the next financial year.
Directors’ Meetings
During the financial year, 10 directors’ meetings were held. Attendances by each director during the year
were:
Directors’ Meetings Audit & Risk Remuneration
Number of meetings eligible to
attend
Number attended
Number of meetings eligible to
attend
Number attended
Number of meetings eligible to
attend
Number attended
Don Argent 3 3 1 1 1 1
Denis Criddle 10 9 4 4 - -
Scott Criddle 10 10 - - - -
Bill Healy 10 10 4 4 1 1
David Saxelby 10 9 1 1 1 1
Lee Verios 4 3 2 2 - -

Directors’ Report Cont’d FOR THE YEAR ENDED 30 JUNE 2018
Remuneration Report - Audited
This Remuneration Report for the year ended 30 June 2018 details the nature and amount of
remuneration for directors and specified executives of Decmil Group Limited in accordance with the
requirements of the Corporations Act 2001 (the Act) and its regulations. This information has been
audited as required by section 308(3C) of the Act.
The Remuneration Report is presented under the following sections:
1. Remuneration governance
1.1. Remuneration committee
1.2. Use of remuneration consultants
2. Executive remuneration approach and structure
2.1. Remuneration philosophy
2.2. Executive remuneration structure
2.3. Remuneration practices
2.4. Short term incentive plan
2.5. Long term incentive plan
3. Link between Company performance and executive remuneration
4. Employment contracts of directors and senior executives
5. Non-Executive Director fee arrangements
6. Details of remuneration
This Remuneration Report sets out remuneration information for Decmil’s Key Management Personnel
(KMP) (as defined in AASB 124 Related Party Disclosures) including Non-Executive Directors, Executive
Directors and other senior executives who have authority for planning, directing and controlling the
activities of the Company.
The following persons acted as Directors or Executives during or since the end of the financial year:
Role
Non-Executive Directors (NEDs)
Mr David Saxelby – Chairman of the Board Appointed May 2016 and as Chairman 1 March 2018
Mr Bill Healy – Chairman of the Audit & Risk and Remuneration Committees
Appointed to the Board April 2009
Mr Don Argent Appointed 1 March 2018
Mr Denis Criddle Appointed August 2007
Mr Dickie Dique Appointed 1 July 2018
Mr Lee Verios Resigned 1 November 2017
Executive Directors
Mr Scott Criddle – Managing Director and Group CEO Appointed as CEO in July 2009 and Managing Director in April 2010
Executives (Other KMP)
Mr Ric Buratto1 – CEO Construction and Engineering Resigned 14 July 2017
Mr Tony Radalj2 – Chief Operating Officer Appointed to ELT on 1 August 2017
Mr Craig Amos – Chief Financial Officer Appointed March 2014
1 Ric Buratto left the Executive Leadership Team during the 2017 financial year 2 Tony Radalj joined the Executive Leadership Team during the 2018 financial year

Directors’ Report Cont’d FOR THE YEAR ENDED 30 JUNE 2018
Remuneration Report (Cont’d)
1. Remuneration governance
1.1 Remuneration committee
The Remuneration Committee is responsible for reviewing and recommending to the Board of Directors
compensation arrangements for the directors and Executive Leadership Team (ELT).
The Remuneration Committee assesses the appropriateness of the nature and amount of remuneration
of directors and the ELT on a periodic basis. The assessment is made with reference to the Group’s
performance, executive performance and comparable information from industry sectors and other listed
companies in similar industries.
1.2 Use of remuneration consultants
To ensure the Company and Remuneration Committee is fully informed when making remuneration
decisions, it from time to time seeks external remuneration advice and uses industry salary survey data.
During the financial year, the fixed remuneration of executives was benchmarked against peers based
on industry salary surveys sourced from AON Hewitt and Mercer.
In the past, Ernst & Young has also been engaged to provide advice on the structure of the long term
incentive plans and provide a comparison of the Company’s plan to market trends.
For the purposes of the Corporations Amendment (Improving Accountability on Director and Executive
Remuneration) Act 2001 (the Act), any guidance provided by remuneration consultants throughout the
financial year was not considered a remuneration recommendation in relation to KMP as defined by
Division 1 of Part 1.2 of Chapter 1 of the Act.
2. Executive remuneration approach and structure
2.1 Remuneration philosophy
The performance of the Company ultimately depends upon the quality of its directors and ELT. In order
to maintain performance and create shareholder value, the Company must attract, motivate and retain
highly skilled and experienced directors and executives.
Decmil aims to provide competitive at market remuneration and rewards in order to:
▪ attract the right people who are aligned to Decmil’s values and behaviours;
▪ motivate employees so they understand their contribution to Decmil;
▪ recognise employees’ effort and commitment to Decmil; and
▪ retain the highest quality employees within Decmil.
Decmil ensures:
▪ appropriate compensation is given to executives for the services they provide;
▪ attraction and retention of executives with the required skills to effectively manage the operations
and growth of the business;
▪ executives are motivated to perform in the best interest of Decmil; and
▪ gender pay equality.
2.2 Executive remuneration structure
The remuneration structure for executive officers, including executive directors, is based on a number of
factors, including experience, qualifications, job level and overall performance of the Company. The
service agreements between the Company and specified directors and executives are on a continuing
basis which are not expected to change in the immediate future.

Directors’ Report Cont’d FOR THE YEAR ENDED 30 JUNE 2018
Remuneration Report (Cont’d)
The following table illustrates the executive remuneration elements, including how each element aligns
to the Company’s remuneration strategy and links remuneration outcomes to performance.
Remuneration component
Vehicle Purpose Link to performance
Fixed remuneration
Comprises base salary, superannuation contributions and other benefits such as motor vehicles and life insurance.
To provide competitive fixed remuneration for senior executives as determined by the scope of their position and the knowledge, skill and experience required to perform the role.
Company and individual performance are considered during the annual remuneration review.
STI Historically, the STI component of the Chief Executive Officer’s remuneration has been paid in cash. For FY16, FY17 and FY18 100% of any STI award earned will be deferred for 12 months and will be satisfied by the issue of Restricted Rights instead of a cash award.
The STI of other executives are paid in cash.
Rewards executives for short term achievement of:
▪ financial and operational key performance indicators;
▪ progress with the delivery of the Company’s business plan and strategic objectives; and
▪ specific goals in relation to the development of people within the Company and its profile within the business community.
Examples of key performance indicators include:
▪ Achievement of financial targets such as Group revenue and NPAT;
▪ Achievement of target work in hand levels at 30 June of each year to ensure the sustainability of revenue in subsequent years;
▪ Overhead and cost control targets;
▪ Targets set in relation to the achievement of the Group’s business plan such as the diversification of the business and entry into new markets; and
▪ Targets set for safety performance based on Total Recordable Injury Frequency Rates.
LTI Executives are entitled to participate in the performance rights scheme approved by shareholders.
Performance rights do not attract dividends or voting rights.
To better align executives to the interests of shareholders and provide a reward based on long term growth in share price and earnings.
Vesting of awards is dependent on absolute TSR, achieving EPS growth targets and continuous employment.

Directors’ Report Cont’d FOR THE YEAR ENDED 30 JUNE 2018
Remuneration Report (Cont’d)
2.3 Remuneration practices
The Company aims to reward executives with a level and mix of remuneration appropriate to their
position, responsibilities and performance within the business and aligned with market practice.
The Company’s policy is to position fixed remuneration around the 50th percentile of salary bands based
on major industry surveys produced by AON Hewitt and Mercer. This aligns with the market median
ensuring Decmil remains competitive with its peers.
The performance of executives is measured against criteria agreed with each executive and is based
predominantly on the Company’s performance and shareholder value. Incentives are linked to
predetermined performance criteria. The Board may, however, exercise its discretion in relation to
approving incentives, bonuses, rights and shares. The policy is designed to attract high calibre
executives and reward them for performance that results in long-term growth in shareholder wealth.
Where applicable, executive directors and executives receive a superannuation guarantee contribution
required by the Government, which during the year was 9.5%, and do not receive any other retirement
benefits. Some individuals, however, have chosen to sacrifice all or part of their remuneration to
increase payments towards superannuation.
Upon retirement, specified directors and executives are paid employee entitlements and incentives
accrued to the date of their retirement.
All remuneration paid to directors and executives is valued at cost to the Company and expensed.
Where performance rights and shares are given to directors and executives, they are valued according
to the accounting standards.
2.4 Short term incentive plan
General Terms of the STI Plan
How is it paid Generally, in cash. The CEO STI award can be satisfied by the issue of restricted rights.
How much can executives earn? Executives can earn up to 50% of their total fixed remuneration as an STI incentive.
How is performance measured? Through a balance scorecard of financial, operational and organisation development KPI’s set prior to the commencement of each financial year. Financial measures are assessed based on the Group’s audited financial results.
When is it paid? In September or October of the financial year after the target year.
What are the deferral terms? Historically, the STI component of the Chief Executive Officer’s remuneration has been paid in cash. It was proposed that for, FY16, FY17 and FY18 100% of any STI award earned will be deferred for 12 months and will be satisfied by the issue of restricted rights instead of a cash award.
What happens if an executive leaves or there is a change of control?
The payment of any accrued or part STI benefit in these circumstances is at the discretion of the Board.
How much STI has been accrued in relation to the 2018 financial year?
No STI has been accrued in relation to the 2016, 2017 or 2018 financial years.
The STI award opportunity is based on a percentage of an individual’s base salary. For the CEO, a
maximum award opportunity of 50% of total fixed remuneration is available. The STI is based on the
previous financial year’s base salary earnings to 30 June before performance based remuneration
reviews.

Directors’ Report Cont’d FOR THE YEAR ENDED 30 JUNE 2018
Remuneration Report (Cont’d)
With the dramatic turnabout in the resources and energy sectors during the 2016 financial year the
Group undertook a number of steps to restructure and reduce the overhead base in its traditional
business units. As part of these efforts, executives of the Group agreed to a 10% reduction in total fixed
remuneration effective February 2016 (with the CEO voluntarily agreeing to a 15% reduction). As market
conditions continued to be subdued throughout FY17, the CEO took a further voluntary reduction of 30%
and the Board took a further 10% reduction in April 2017.
In addition, no STI has been accrued for either the CEO or any other KMP in relation to the 2016, 2017
or 2018 financial years.
2.5 Long term incentive plan
The LTI offered to key executives forms a key part of their remuneration and assists to align their
interests with the long term interests of shareholders.
The purpose of the LTI Scheme is to reward key executives for attaining results over a long measurable
period and for staying with the organisation. The LTI Scheme is a share based plan consisting of
performance rights and shares which have pre-determined vesting conditions.
The LTI Scheme is designed to:
▪ create a strong link between the eligible participants’ performance and Decmil’s performance;
▪ assist in retention of employees; and
▪ contribute to eligible participants feeling they own part of Decmil and have an influence in the
direction of Decmil.

Directors’ Report Cont’d FOR THE YEAR ENDED 30 JUNE 2018
Remuneration Report (Cont’d)
General Terms of the LTI Plan
How is it paid? The Company uses performance rights and restricted shares in its long term incentive plan.
How much can be earned (i.e. maximum opportunity)?
For executives, up to 150% of total fixed remuneration converted into performance rights at the 60 day VWAP to 30 June.
How is performance measured? Vesting hurdles for performance rights for executives are based on absolute TSR (40%), EPS (40%) and continuous employment (20%).
When is performance measured? The achievement of vesting conditions for performance rights are assessed between July and September after the target financial year-end. Measurement periods are from the date of award of the rights to the first tranche being eligible for vesting.
What happens if an executive leaves or there is a change of control?
If an employee resigns, or his or her employment is terminated due to misconduct or performance related reasons, all performance rights and restricted shares are immediately forfeited.
If an employee retires or an employee’s employment terminates for redundancy prior to performance rights or restricted shares vesting, the Board may use its discretion to vest the performance rights or restricted shares.
Where a change of control event occurs in respect to the Company, the Board, in its absolute discretion, may determine the treatment of any unvested performance rights or restricted shares and the timing of such treatment.
Only where the Board does not exercise its discretion to determine a particular treatment, will all unvested performance rights and restricted shares vest on change of control.
Are executives eligible for dividends? Performance rights do not accrue dividends.
The retention grant of restricted shares to the CEO accrues dividends which become payable upon vesting.
Have many shares vested under the LTI plan?
There has historically been a very low percentage of performance rights awarded that vest e.g. no performance rights have vested since the 2013 financial year other than in relation to time based conditions.
For executives, performance rights will vest (that is, shares will be issued or become transferable to the
executives upon satisfaction of the performance rights vesting conditions) to the extent that the
applicable performance hurdles set by the Board are satisfied. Subject to achievement of the hurdle, the
performance rights may be converted (on a one-for-one basis) to fully paid ordinary shares in the
Company.
Any performance rights which do not vest at any due vesting date rollover for re-assessment to the next
vesting date. The vesting conditions will be subsequently reassessed in that year and performance rights
may vest as applicable. Unvested performance rights will rollover for the length of the performance
period and will be forfeited at the end of the grant period if not vested. If an executive resigns from his or
her employment, any unvested performance rights will lapse, unless the Board determines otherwise.

Directors’ Report Cont’d FOR THE YEAR ENDED 30 JUNE 2018
Remuneration Report (Cont’d)
Performance Hurdles
Each year the Board reviews and considers the appropriateness of the performance hurdles and, where
necessary, makes adjustments and amendments to reflect market conditions.
Below is a summary of the performance hurdles that relate to unvested performance rights as at 30 June
2018:
Issued financial year ended 30 June 2013 and prior
Performance rights issued during the financial year ended 30 June 2013 and prior years are eligible for
vesting three, five and seven years after the initial grant date depending upon Total Shareholder Return
(TSR) performance relative to a comparator group identified at the time of grant (S&P/ASX 300 Index).
Performance rights granted during this period remain under these terms and conditions.
The performance rights vest according to the schedule below:
Company TSR Rank in S&P/ASX 300 Index % of Performance Rights that Vest
Below the 50th Percentile 0% At or below the 50th Percentile and below the 75th
Percentile 50%, plus 2% for every one Percentile increase above
50th Percentile At or above the 75th Percentile 100%
Issued financial year ended 30 June 2014
These performance rights vest two, three and four years after the initial grant date and are subject to the
following vesting performance measures:
a. Two thirds of the performance rights are subject to earnings per share compound annual growth
rate (EPS CAGR) performance and;
b. One third of the performance rights are subject to TSR performance relative to the other
companies in the ASX 200.
The performance rights in respect of a financial year will vest in tranches as follows:
Years after the financial year in respect of which the grant of Performance Rights is made
% of Performance Rights Eligible for Vesting
2 25% 3 25% 4 50%
For performance rights subject to EPS CAGR performance, vesting will occur as follows:
EPS CAGR – Measured from the year in respect of which grant of Performance Rights is made
% Performance Rights that Vest
<6% 0% 6% 25%
>6% <24% Pro-rata vesting between 25%-100% 24% or more 100%

Directors’ Report Cont’d FOR THE YEAR ENDED 30 JUNE 2018
Remuneration Report (Cont’d)
For performance rights subject to TSR performance, vesting will occur as follows:
TSR – Measured from the year in respect of which grant of Performance Rights is made
% Performance Rights that Vest
<50th Percentile 0% 50th Percentile 50%
>50th Percentile <75th Percentile Pro-rata vesting between 50%-100% >75th Percentile or more 100%
Issues financial year ended 30 June 2015 and later
These performance rights are subject to the following vesting conditions:
a. 20% of performance rights are subject to continuous service of employment. This portion will
vest at 100% three years after the financial year of which the grant of the performance rights are
made;
b. 40% of performance rights are subject to EPS CAGR performance; and
c. 40% of performance rights are subject to absolute TSR performance.
In relation to the performance rights subject to the EPS CAGR and TSR, the following vesting tranches
will apply:
Years after the financial year in respect of which the grant of Performance Rights is made
% of Performance Rights Eligible for Vesting
2 25% 3 25% 4 50%
For performance rights subject to EPS CAGR performance, vesting will occur as follows:
EPS CAGR – Measured from the year in respect of which grant of Performance Rights is made
% Performance Rights that Vest
<6% 0% 6% 25%
>6% <8% Pro-rata vesting between 25%-100% >8% 100%
For performance rights subject to TSR performance, vesting will occur as follows:
Absolute TSR – Measured from the year in respect of which grant of Performance Rights is made
% Performance Rights that Vest
< 7% 0% 7% 50%
>7% <11% Pro-rata vesting between 50%-100% >11% 100%
Note, the Company obtained shareholder approval at the 2015 AGM to implement a number of changes
to the hurdles attaching to the performance rights to be issued for FY15, FY16, FY17 and FY18. These
changes included the replacement of the Relative Total Shareholder Return (TSR) performance hurdle
with an Absolute TSR performance hurdle, and adjustment of the Earnings Per Share (EPS) hurdles in
line with current market expectations and inclusion of a performance hurdle relating to continuous
employment with the Group.

Directors’ Report Cont’d FOR THE YEAR ENDED 30 JUNE 2018
Remuneration Report (Cont’d)
3. Link between Company performance and executive remuneration
The remuneration policy has been tailored to increase goal congruence between shareholders, directors
and executives. There have been two methods applied in achieving this aim, the first being a
performance based short term incentive based on key performance indicators, and the second being the
issue of performance rights to executive directors and executives to encourage the alignment of
personal and shareholder interests.
4. Employment contracts of directors and senior executives
The Company has entered into a service agreement with Mr Scott Criddle who commenced in the role of
CEO on 1 July 2009.
The key terms of Mr Scott Criddle’s service agreement are:
Notice Period Three month written notice unless in relation to certain circumstances such as serious misconduct or gross neglect of duty
Term Ongoing until terminated
Restraint Period Three months after termination of employment
Total Fixed Remuneration Reviewed and established annually by the Remuneration Committee
Long Term Incentive Scheme The Decmil Group Limited LTI scheme applies
Short Term Incentive Scheme The Decmil Group Limited STI scheme applies
Termination Benefits No contractual termination benefits apply
The Company may terminate the contract without cause by providing written notice of the required
termination period or by making payment in lieu of notice based on the individual’s annual salary
component together with a discretionary payment. Termination payments are generally not payable on
resignation or dismissal for serious misconduct. In the instance of serious misconduct, the Company can
terminate employment at any time.
Other executives in the Company have similar executive service agreements which include terms and
conditions relating to confidentiality, restraint on employment and intellectual property. The executive
service agreements are typically not fixed term agreements and continue on an ongoing basis until
terminated.
These agreements may be terminated by notice of either party or earlier in the event of certain breaches.
In the event of termination for any reason, the Company will pay accrued and untaken annual leave, and
subject to legislation, any accrued and untaken long service leave owing to the executive. Termination
payments are generally not payable on resignation or dismissal for serious misconduct. In the instance
of serious misconduct, the Company can terminate employment at any time.
Non-Executive Directors are appointed under appointment letters that deal with, amongst other matters,
the following:
▪ terms of appointment and tenure;
▪ entitlements;
▪ duties and responsibilities; and
▪ indemnities, insurances and access.

Directors’ Report Cont’d FOR THE YEAR ENDED 30 JUNE 2018
Remuneration Report (Cont’d)
5. Non-Executive Director fee arrangements
The Board’s policy is to remunerate Non-Executive Directors at market rates for comparable companies
for time, commitment and responsibilities. The Board approves payments to the Non-Executive Directors
and reviews their remuneration annually, based on market practice, duties and accountability.
Independent external advice is sought when required. The maximum aggregate amount of fees that can
be paid to Non-Executive Directors is subject to approval by shareholders during a general meeting.
Fees for Non-Executive Directors are not linked to the performance of the consolidated entity however to
align directors’ interests with shareholder interests, the directors are encouraged to hold shares in the
Company.
Non-Executive Director (NED) fees consist of base fees and committee chair fees. The payment of
committee chair fees recognises the additional time commitment required by NEDs who chair Board
committees. The chair of the Board attends all committee meetings but does not receive any additional
committee fees in addition to base fees.
The table below summaries Board and committee chair fees payable to NEDs at 30 June 2018 (inclusive
of superannuation):
Board fees $000
Chairman 130 Non-Executive Director 73 Committee fees $000
Audit & Risk and Remuneration Chair 8 Member -
Maximum aggregate NED fee pool
The maximum aggregate amount of fees that can be paid to NEDs is subject to approval by
shareholders during a general meeting. The maximum aggregate amount that may be paid to NEDs for
their services is $650,000 during any financial year, as approved by shareholders at the 2012 AGM. The
Board will not seek an increase to the aggregate NED fee pool limit at the 2018 AGM.
6. Details of remuneration
As part of a restructuring and cost reduction effort by the Company, effective 1 February 2016, the fixed
remuneration of KMP (and directors from 1 May 2016) was reduced by 10% (with the Group CEO
voluntarily agreeing to a 15% reduction).
With market conditions continuing to be subdued throughout FY17, the CEO took a further voluntary
reduction of 30% and the Board took a further 10% reduction on 1 April 2017.
Details of the remuneration of KMP of the consolidated entity are set out in the following tables:

NEDs ($) Year Salary and
Fees Superannuation
STI Paid in Relation to
Prior Year
STI Accrued Current Year
Fair Value of Incentive Securities Awarded
Other Total Total Performance
Related %
Total Fixed Remuneration
%
David Saxelby 2018 91,799 - - - - - 91,799 - 100.0 2017 78,975 - - - - - 78,975 - 100.0
Don Argent1 2018 22,192 2,108 - - - - 24,300 - 100.0
2017 - - - - - - - - 100.0 Denis Criddle 2018 66,575 6,325 - - - - 72,900 - 100.0 2017 72,123 6,852 - - - - 78,975 - 100.0
Giles Everist2 2018 - - - - - - - - 100.0
2017 54,375 - - - - - 54,375 - 100.0 Bill Healy 2018 106,027 10,073 - - - - 116,100 - 100.0 2017 128,219 12,181 - - - - 140,400 - 100.0
Lee Verios3 2018 24,658 2,342 - - - - 27,000 - 100.0
2017 80,137 7,613 - - - - 87,750 - 100.0
Total 2018 311,251 20,848 - - - - 332,099 - 100.0 2017 413,829 26,646 - - - - 440,475 - 100.0
Executive Directors ($) Year Salary and
Fees Superannuation
STI Paid in Relation
to Prior Year
STI Accrued Current Year
Fair Value of Incentive Securities Awarded
Other Total
Total Performance
Related %
Total Fixed Remuneration
%
Scott Criddle4 2018 500,000 20,049 - - 227,976 - 748,025 30.5 69.5
2017 669,200 19,616 - - 484,981 - 1,173,797 41.3 58.7
Total 2018 500,000 20,049 - - 227,976 - 748,025 30.5 69.5 2017 669,200 19,616 - - 484,981 - 1,173,797 41.3 58.7
Other Executives ($) Year Salary and
Fees Superannuation
STI Paid in relation to
Prior Year
STI Accrued Current Year
Fair Value of Incentive Securities Awarded
Other Total
Total Performance
Related %
Total Fixed Remuneration
%
Tony Radalj5 2018 421,186 16,605 - - 187,500 - 625,291 30.0 70.0
2017 - - - - - - - - - Craig Amos 2018 350,000 20,049 - - 83,784 - 453,833 18.5 81.5 2017 387,500 19,616 - - 127,083 - 534,199 23.8 76.2
Ric Buratto6 2018 - - - - - - - - -
2017 393,750 14,712 - - 435,534 - 843,996 51.6 48.4
Total 2018 771,186 36,654 - - 271,284 - 1,079,124 25.1 74.9 2017 781,250 34,328 - - 562,617 - 1,378,195 40.8 59.2
1 Don Argent was appointed to the board of directors on 1 March 2018 2 Giles Everist resigned from the board of directors on 7 February 2017 3 Lee Verios resigned from the board of directors on 1 November 2017 4 As at the date of this report the total fixed remuneration for the Managing Director and Group CEO is $520,049 5 Tony Radalj was appointed to the Executive Leadership Team on 1 August 2017 6 Ric Buratto left the Executive Leadership Team during the 2017 financial year

Directors’ Report Cont’d FOR THE YEAR ENDED 30 JUNE 2018
Remuneration Report (Cont’d)
Options issued as part of remuneration for the year ended 30 June 2018
There were no options granted to directors or executives as part of their remuneration during the
financial year.
Performance Rights
During the year ended 30 June 2018, the following performance rights were granted.
Grant Date Number of Rights Granted Fair Value of Rights Granted
1 July 2017 1,676,126 $311,759
During the year ended 30 June 2018, 284,240 performance rights were vested.
During the year ended 30 June 2018, 851,506 of performance rights lapsed due to their vesting criteria
not being met.
The following rights have been granted but remain unvested at 30 June 2018:
Grant Date Number of Unvested Rights Fair Value of Unvested Rights
1 July 2011 235,210 $24,932 1 July 2012 297,665 $30,362 1 July 2014 571,169 $33,985 1 July 2015 1,544,203 $216,188 1 July 2016 2,006,769 $306,032 1 July 2017 1,676,126 $311,759
Total 6,331,142 $923,258
Additional Information
The earnings of the consolidated entity for the five years to 30 June 2018 are summarised below:
2018 $000
2017 $000
2016 $000
2015 $000
2014 $000
Revenue 349,255 305,124 301,644 666,915 618,401
EBITDA (1,722) (31,240) (75,926) 62,696 81,117
EBIT (4,736) (36,867) (82,902) 55,894 74,316
Profit/(loss) after income tax (6,131) (28,347) (58,236) 40,280 52,627
The factors that are considered to affect total shareholders return (TSR) are summarised below:
2018 2017 2016 2015 2014
Share price at financial year end ($) 0.97 0.93 0.72 1.16 1.83
Total dividends paid (cents per share) - 4.0 10.5 13.0 12.5
Basic earnings per share (cents per share) (0.10)1 (2.65)2 6.102 23.91 29.503
1 Based on continuing operations 2 Based on adjusted earnings 3 Excluding business combination gains from the 2014 reporting period

Directors’ Report Cont’d FOR THE YEAR ENDED 30 JUNE 2018
Remuneration Report (Cont’d)
Shareholdings, Option holdings and Performance Rights holdings
Shareholdings
The number of shares in the Company held during the financial year by each director and KMP of the
consolidated entity, including their personally related parties, is set out below:
30 June 2018 Balance
1.07.2017 Received as Part of Remuneration
Additions Disposals/
Other1 Balance
30.06.2018
Directors:
Don Argent - - - - -
Denis Criddle 20,989,145 - 1,390,000 - 22,379,145
Scott Criddle 5,709,695 136,573 - (205,000) 5,641,268
Bill Healy 600,190 - - - 600,190
David Saxelby - - 50,000 - 50,000
Lee Verios2 66,667 - - (66,667) -
Key management personnel:
Craig Amos 1,500 108,021 - - 109,521
Tony Radalj3 - 200,000 15,000 110,000 325,000
Total 27,367,197 444,594 1,455,000 (161,667) 29,105,124
Option holdings
There were no options held by directors or KMP at 30 June 2018.
Performance Rights holdings
The number of performance rights in the Company held during the financial year by each director and
KMP of the consolidated entity, including their personally related parties, is set out below:
30 June 2018 Balance
1.07.2017 Granted as
Remuneration Vested During
the Period Expired/ Other1
Balance 30.06.2018
Directors:
Scott Criddle 4,678,689 1,225,676 (136,573) (837,268) 4,930,524
Key management personnel:
Craig Amos 737,377 450,450 (108,021) - 1,079,806
Tony Radalj3 - - - 172,414 172,414
5,416,066 1,676,126 (244,594) (664,854) 6,182,744
1 Other includes shares included upon appointment or excluded upon resignation 2 Lee Verios resigned from the board of directors on 1 November 2017 3 Tony Radalj was appointed to the Executive Leadership Team on 1 August 2017

Directors’ Report Cont’d FOR THE YEAR ENDED 30 JUNE 2018
Remuneration Report (Cont’d)
Other transactions with directors, KMP and their related parties:
2018 $000
(a) Director Related Transactions
Rent of various properties used by Decmil Australia Pty Ltd paid to Broadway Pty Ltd, an entity in which Mr Denis Criddle has a beneficial interest
190
Consulting fees for Saxelby Associates Pty Ltd, an entity in which Mr David Saxelby has a beneficial interest
200
(b) Director Related Balances1
Amounts owing to Saxelby Associates Pty Ltd, an entity in which Mr David Saxelby has a beneficial interest, for directors’ fees and consulting fees
27
[End of Remuneration Report]
Shares Under Option
There were no unissued ordinary shares of the Company under option outstanding at the date of this
report.
Shares Issued on the Exercise of Options
There were no ordinary shares of the Company issued on the exercise of options during the year ended
30 June 2018 and up to the date of this report.
Employee Share Program
At the 2014 Annual General Meeting, shareholders approved the adoption by the Company of a broad
based employee share plan and the issue of securities pursuant to that plan. During the financial year,
213,490 shares were issued under this plan as part of the Decmil Employee Share Purchase Plan.
Under this plan, employees who purchased up to $1,000 of shares had those shares matched by the
Company. The matched shares are subject to a trade restriction until the earlier of 3 years or cessation
of employment with the Company.
Indemnifying Officers or Auditor
The Company has indemnified the Directors of the Company for costs incurred, in their capacity as a
director, for which they may be held personally liable, except where there is a lack of good faith.
During the financial year, the company paid a premium in respect of a contract to insure the Directors of
the Company against a liability to the extent permitted by the Corporations Act 2001. The contract of
insurance prohibits disclosure of the nature of the liability and the amount of the premium.
The Company has not, during or since the end of the financial year, indemnified or agreed to indemnify
the auditor of the Company or any related entity against a liability incurred by the auditor.
Proceedings on Behalf of Company
In or around August 2012, Steel Building Systems (SBS) was engaged as a subcontractor by Decmil
Australia Pty Ltd (“Decmil”) to construct the Gladstone Village in Queensland. SBS’ scope of work was
the design, manufacture and supply of modular buildings, as well as miscellaneous on-site works
associated with the modular buildings. On 17 November 2017, the liquidators of SBS commenced
proceedings against Decmil Australia Pty Ltd in the NSW Supreme Court for alleged unpaid contract
sums of $3.3 million and alleged lost profit on works removed from SBS’ scope of works. Decmil rejects
the claims brought by the liquidators of SBS and denies it is indebted to SBS as claimed.
1 Transactions relating to directors’ fees are included in the Directors’ Report details of remuneration

Directors’ Report Cont’d FOR THE YEAR ENDED 30 JUNE 2018
Proceedings on Behalf of Company (Cont’d)
Decmil’s current position is that SBS is in fact indebted to Decmil for a similar sum due to defective
works and associated rectification costs, incomplete works, overheads incurred by Decmil in connection
with the defects and rectification works, expert costs and fees. Decmil has filed a defence in relation to
the liquidator’s claims and will file a cross claim for the sum Decmil alleges it is owed by SBS.
On 1 May 2017 the Company received an advice from AusIndustry, the agency that oversees technical
elements of the Australian Tax Office’s Research and Development Inventive Scheme (“R&D Scheme”),
disputing the eligibility of certain engineering activities submitted by the Company in relation to the 2014
financial year for the R&D Scheme. R&D Scheme benefits received by the Company in relation to the
2014 financial year for the disputed engineering activities amounts to approximately $3.4 million. The
Company does not agree with the advice received from AusIndustry and under the relevant legislation
has requested an independent review of the matter. As at the date of this report, the independent review
had not been completed. The Company is also considering further review options available to it,
including submission to the Australian Administrative Tribunal.
During the year ended 30 June 2017 the liquidators for Forge Group Ltd (in liquidation)(receivers and
managers appointed) commenced an action in the Supreme Court of Western Australia against
Eastcoast Development Engineering Pty Ltd (“EDE”), a subsidiary of the Company, for the repayment of
$2.5 million for what they consider constitute unfair preference payments. The liquidators have
commenced claims against a number of parties which are joined with EDE in the same action. EDE
denies that it has any liability for repayment of any sums previously paid to EDE. Decmil has filed a
defence in this matter.
No person has applied to the Court under section 237 of the Corporations Act 2001 for leave to bring proceedings on behalf of the Company, or to intervene in any proceedings to which the Company is a party for the purpose of taking responsibility on behalf of the Company for all or part of those proceedings.
Non-Audit Services
The Board of Directors, in accordance with advice from the audit committee, is satisfied that the
provision of non-audit services during the year is compatible with the general standard of independence
for auditors imposed by the Corporations Act 2001. The directors are satisfied that the services
disclosed below did not compromise the external auditor’s independence for the following reasons:
▪ all non-audit services are reviewed and approved by the audit committee prior to commencement to
ensure they do not adversely affect the integrity and objectivity of the auditor; and
▪ the nature of the services provided does not compromise the general principles relating to auditor
independence in accordance with APES 110: Code of Ethics for Professional Accountants set by the
Accounting Professional and Ethical Standards Board.
The following fees were paid or payable to RSM Australia Partners for non-audit services provided
during the year ended 30 June 2018:
$
Taxation compliance services 29,250
Accounting assistance 9,585
Total 38,835
Auditor’s Independence Declaration
A copy of the auditor’s independence declaration as required under section 307C of the Corporations
Act 2001 can be found within this financial report.

Directors’ Report Cont’d FOR THE YEAR ENDED 30 JUNE 2018
Rounding of Amounts
The Company is of a kind referred to in Corporations Instrument 2016/191, issued by the Australian
Securities and Investments Commission, relating to ‘rounding-off’. Amounts in this report have been
rounded off in accordance with that Corporations Instrument to the nearest thousand dollars, or in
certain cases, the nearest dollar.
Corporate Governance
In recognising the need for the highest standards of corporate behaviour and accountability, the directors
of Decmil Group Limited support and have adhered to the ASX Corporate Governance Principles and
Recommendations as detailed in Decmil Corporate Governance Statement which can be found at
http://www.decmil.com.au/investor-relations/corporate-governance/
This report is made in accordance with a resolution of directors, pursuant to section 298(2)(a) of the
Corporations Act 2001.
On behalf of the directors
David Saxelby Chairman
31 July 2018

THE POWER OF BEING UNDERSTOODAUDIT | TAX | CONSULTING
RSM Australia Partners is a member of the RSM network and trades as RSM. RSM is the trading name used by the members of the RSM network. Each member of the RSM network is an independent accounting and consulting firm which practices in its own right. The RSM network is not itself a separate legal entity in any jurisdiction.
RSM Australia Partners ABN 36 965 185 036
Liability limited by a scheme approved under Professional Standards Legislation
RSM Australia Partners
Level 32 Exchange Tower, 2 The Esplanade Perth WA 6000 GPO Box R1253 Perth WA 6844
T +61 (0) 8 9261 9100 F +61 (0) 8 9261 9111
www.rsm.com.au
AUDITOR’S INDEPENDENCE DECLARATION
As lead auditor for the audit of the financial report of Decmil Group Limited for the year ended 30 June 2018, I declare that, to the best of my knowledge and belief, there have been no contraventions of:
(i) the auditor independence requirements of the Corporations Act 2001 in relation to the audit; and
(ii) any applicable code of professional conduct in relation to the audit.
RSM AUSTRALIA PARTNERS
Perth, WA J A KOMNINOS Dated: 31 July 2018 Partner

Statement of Profit or Loss and Other Comprehensive Income FOR THE YEAR ENDED 30 JUNE 2018
Consolidated Entity
2018 2017
Note $000 $000
Revenue from continuing operations 11 341,608 276,972
Cost of sales (305,927) (246,500)
Gross profit 35,681 30,472
Administration expenses (27,972) (26,342)
Equity based payments (2,248) (1,030)
Restructuring costs (747) (1,261)
Earnings from continuing operations before interest, tax, depreciation and amortisation & impairments
4,714 1,839
Interest received 11(a) 32 43
Borrowing costs 4 (1,493) (1,011)
Depreciation and amortisation expense 4, 17, 19 (2,903) (5,331)
Investment property fair value adjustment 33 - (18,763)
Profit/(loss) before income tax expense 350 (23,223)
Income tax (expense)/benefit 5 (521) 8,090
Net loss from continuing operations (171) (15,133)
Loss after tax from discontinued operations 6 (5,960) (13,214)
Net loss for the year (6,131) (28,347)
Other comprehensive income
Other comprehensive income - -
Total comprehensive income for the year (6,131) (28,347)
Overall Operations
Basic earnings per share (cents per share) 9a (3.54) (16.57)
Diluted earnings per share (cents per share) 9a (3.54) (16.57)
Continuing Operations
Basic earnings per share (cents per share) 9b (0.10) (8.85)
Diluted earnings per share (cents per share) 9b (0.10) (8.85)
Discontinuing Operations
Basic earnings per share (cents per share) 9c (3.44) (7.72)
Diluted earnings per share (cents per share) 9c (3.44) (7.72)
The accompanying notes form part of these financial statements

Statement of Financial Position FOR THE YEAR ENDED 30 JUNE 2018
Consolidated Entity
2018 2017
Note $000 $000
ASSETS
CURRENT ASSETS
Cash and cash equivalents 12 16,755 16,905
Trade and other receivables 13 43,672 34,950
Work in progress 14 28,882 11,914
Other current assets 20 8,561 5,716
TOTAL CURRENT ASSETS 97,870 69,485
NON-CURRENT ASSETS
Investment property 18 92,410 92,400
Property, plant and equipment 17 7,565 10,425
Deferred tax assets 24 30,329 28,693
Intangible assets 19 75,482 75,482
TOTAL NON-CURRENT ASSETS 205,786 207,000
TOTAL ASSETS 303,656 276,485
LIABILITIES
CURRENT LIABILITIES
Trade and other payables 21 88,223 60,158
Current tax payable 22 1,596 49
Borrowings 23 387 350
Provisions 25 5,623 4,017
TOTAL CURRENT LIABILITIES 95,829 64,574
NON-CURRENT LIABILITIES
Deferred tax liabilities 24 544 316
Borrowings 23 472 474
Provisions 25 498 1,125
TOTAL NON-CURRENT LIABILITIES 1,514 1,915
TOTAL LIABILITIES 97,343 66,489
NET ASSETS 206,313 209,996
EQUITY
Issued capital 26 165,832 163,384
Retained earnings 40,481 46,612
TOTAL EQUITY 206,313 209,996
The accompanying notes form part of these financial statements

Statement of Changes in Equity FOR THE YEAR ENDED 30 JUNE 2018
Consolidated Entity
Issued Capital
Retained Earnings
Total
Note $000 $000 $000
Balance at 1 July 2016 162,254 81,792 244,046
Net loss for the year - (28,347) (28,347)
Total comprehensive income for the year - (28,347) (28,347)
Shares issued for the period 54 - 54
Transaction costs net of tax benefit 46 - 46
Equity based payments 1,030 - 1,030
Dividends paid 10 - (6,833) (6,833)
Balance at 30 June 2017 163,384 46,612 209,996
Balance at 1 July 2017 163,384 46,612 209,996
Net loss for the year - (6,131) (6,131)
Total comprehensive income for the year - (6,131) (6,131)
Shares issued for the period 118 - 118
Transaction costs net of tax benefit 82 - 82
Equity based payments 2,248 - 2,248
Dividends paid 10 - - -
Balance at 30 June 2018 165,832 40,481 206,313
The accompanying notes form part of these financial statements

Statement of Cash Flows FOR THE YEAR ENDED 30 JUNE 2018
Consolidated Entity
2018 2017
Note $000 $000
CASH FLOWS FROM OPERATING ACTIVITIES
Receipts from customers 315,662 303,413
Payments to suppliers and employees (313,573) (309,915)
Interest received 34 53
Finance costs paid (1,496) (1,303)
Income taxes received - 800
Net cash provided by/(used in) operating activities 29(a) 627 (6,952)
CASH FLOWS FROM INVESTING ACTIVITIES
Purchase of property, plant and equipment (1,775) (1,346)
Proceeds from sale of subsidiary 29(b) 919 -
Proceeds from sale of non-current assets 259 26,061
Net cash provided by/(used in) investing activities (597) 24,715
CASH FLOWS FROM FINANCING ACTIVITIES
Net repayment of borrowings (380) (9,145)
Net proceeds from share issue 200 43
Dividends paid - (6,833)
Net cash used in financing activities (180) (15,935)
Net increase/(decrease) in cash held (150) 1,828
Cash at beginning of the financial year 16,905 15,077
Cash at end of the financial year 16,755 16,905
The accompanying notes form part of these financial statements

Notes to the Financial Statements FOR THE YEAR ENDED 30 JUNE 2018
The financial statements of Decmil Group Limited (‘the Company’) for the year ended 30 June 2018
comprise of the Company and its controlled entities (collectively referred to as ‘the consolidated entity’)
and the consolidated entity’s interests in joint operations. The separate financial statements of the parent
entity, Decmil Group Limited, have not been presented within this financial report as permitted by the
Corporations Act 2001.
Decmil Group Limited is a company limited by shares incorporated in Australia whose shares are
publicly traded on the Australian Securities Exchange.
The financial statements were authorised for issue in accordance with a resolution of the directors dated
30 July 2018.
NOTE 1: Summary of Significant Accounting Policies
Basis of Preparation
These general purpose financial statements have been prepared in accordance with the Corporations
Act 2001, Australian Accounting Standards and Interpretations of the Australian Accounting Standards
Board, and International Financial Reporting Standards as issued by the International Accounting
Standards Board. The consolidated entity is a for-profit entity for financial reporting purposes under
Australian Accounting Standards.
Material accounting policies adopted in the preparation of these financial statements are presented
below and have been consistently applied unless otherwise stated.
Except for cash flow information, the financial statements have been prepared on an accruals basis and
are based on historical costs, modified where applicable, by the measurement at fair value of selected
non-current assets, financial assets and financial liabilities.
(a) Principles of Consolidation
The consolidated financial statements incorporate the assets, liabilities and results of entities controlled
by Decmil Group Limited at the end of the reporting period. The Company controls an entity when it is
exposed to, or has rights to, variable returns from its involvement with the entity and has the ability to
affect those returns through its power over the entity. The assets, liabilities and results of all controlled
entities are fully consolidated into the financial statements of the consolidated entity from the date on
which control is obtained by the consolidated entity. The consolidation of a controlled entity is
discontinued from the date that control ceases.
Intercompany balances and transactions between entities in the consolidated entity are eliminated on
consolidation. Accounting policies of controlled entities have been changed where necessary to ensure
consistency with those adopted by the consolidated entity.
Non-controlling interests in the results and equity of controlled entities are shown separately within the
equity section of the consolidated statement of financial position and statement of profit or loss and other
comprehensive income. The non-controlling interests in the net assets of the controlled entity comprise
their interests at the date of the original business combination and their share of changes in equity since
that date.
Where the consolidated entity loses control over a controlled entity, it derecognises the assets including
goodwill, liabilities and non-controlling interest in the controlled entity together with any cumulative
translation differences recognised in equity. The consolidated entity recognises the fair value of the
consideration received and the fair value of any investment retained together with any gain or loss in
profit or loss.

Notes to the Financial Statements FOR THE YEAR ENDED 30 JUNE 2018
NOTE 1: Summary of Significant Accounting Policies (Cont’)
(b) Income Tax
The income tax expense or benefit for the period is the tax payable on that period's taxable income
based on the applicable income tax rate for each jurisdiction, adjusted by the changes in deferred tax
assets and liabilities attributable to temporary differences, unused tax losses and the adjustment
recognised for prior periods, where applicable.
Deferred tax assets and liabilities are recognised for temporary differences at the tax rates expected to
be applied when the assets are recovered or liabilities are settled, based on those tax rates that are
enacted or substantively enacted, except for:
When the deferred income tax asset or liability arises from the initial recognition of goodwill or an asset
or liability in a transaction that is not a business combination and that, at the time of the transaction,
affects neither the accounting nor taxable profits; or
When the taxable temporary difference is associated with interests in controlled entities, associates or
joint ventures, and the timing of the reversal can be controlled and it is probable that the temporary
difference will not reverse in the foreseeable future.
Tax consolidation
Decmil Group Limited and its wholly-owned Australian controlled entities have implemented the tax
consolidation legislation. As a consequence, these entities are taxed as a single entity and the deferred
tax assets and liabilities of the entities are set off in the consolidated financial statements.
Assets or liabilities arising under tax funding agreements with the tax consolidated entities are
recognised as amounts receivable from or payable to other entities in the tax consolidated group. The
tax funding arrangement ensures that the intercompany charge equals the current tax liability or benefit
of each tax consolidated group member, resulting in neither a contribution by the head entity to the
controlled entities nor a distribution by the controlled entities to the head entity.
(c) Construction Contracts and Work in Progress
Construction work in progress is valued at cost, plus profit recognised to date less any provision for
anticipated future losses. Cost includes both variable and fixed costs relating to specific contracts, and
those costs that are attributable to the contract activity in general and that can be allocated on a
reasonable basis.
Construction profits are recognised on the stage of completion basis and measured using the proportion
of costs incurred to date compared to expected actual costs. Where losses are anticipated they are
provided for in full. Construction revenue has been recognised on the basis of the terms of the contract
adjusted for any variations or claims allowable under the contract.
(d) Interests in Joint Arrangements
Joint arrangements represent the contractual sharing of control between parties in a business venture
where unanimous decisions about relevant activities are required.
Joint venture operations represent arrangements whereby joint operators maintain direct interests in
each asset and exposure to each liability of the arrangement. The consolidated entity’s interests in the
assets, liabilities, revenue and expenses of joint operations are included in the respective line items of
the consolidated financial statements.
Gains and losses resulting from sales to a joint operation are recognised to the extent of the other
parties’ interests. When the consolidated entity makes purchases from a joint operation, it does not
recognise its share of the gains and losses from the joint operations until it resells those goods/assets to
a third party.

Notes to the Financial Statements FOR THE YEAR ENDED 30 JUNE 2018
NOTE 1: Summary of Significant Accounting Policies (Cont’d)
(e) Property, Plant and Equipment
Each class of property, plant and equipment is carried at cost less, where applicable, any accumulated
depreciation and impairment losses.
The carrying amount of property, plant and equipment is reviewed annually by directors to ensure it is
not in excess of the recoverable amount from these assets. The recoverable amount is assessed on the
basis of the expected net cash flows that will be received from the assets employment and subsequent
disposal. The expected net cash flows have been discounted to their present values in determining
recoverable amounts.
Depreciation
The depreciable amount of all property, plant and equipment but excluding freehold land is depreciated
on a straight-line basis over their useful lives to the consolidated entity commencing from the time the
asset is held ready for use. The depreciation rates used for each class of depreciable assets are:
Class of Fixed Asset Depreciation Rate
Owned plant and equipment 5% to 33%
Leased plant and equipment 12.5% to 20%
The assets' residual values and useful lives are reviewed and adjusted if appropriate, at the end of each
reporting period.
An asset's carrying amount is written down immediately to its recoverable amount if the asset's carrying
amount is greater than its estimated recoverable amount.
Gains and losses on disposals are determined by comparing proceeds with the carrying amount. These
gains and losses are included in the statement of profit or loss and other comprehensive income in the
period in which they arise.
(f) Investment Property
Investment property, comprising investment interests in land and buildings, is held to generate long-term
returns. Investment property is initially measured at cost and subsequently measured at fair value.
Investment property is carried at fair value which is based on discounted cash flow projections.
Investment property is valued at least every 3 years by independent external valuers. Any resultant
changes in fair value are shown separately in the statement of profit or loss and other comprehensive
income as net gains/(losses) from fair value adjustments on investment property.
(g) Leases
Leases of fixed assets where substantially all the risks and benefits incidental to the ownership of the
asset, but not the legal ownership that are transferred to entities in the consolidated entity are classified
as finance leases.
Finance leases are capitalised by recording an asset and a liability at the lower of the amounts equal to
the fair value of the leased property or the present value of the minimum lease payments, including any
guaranteed residual values. Lease payments are allocated between the reduction of the lease liability
and the lease interest expense for the period. Leased assets are depreciated on a straight-line basis
over their estimated useful lives. Lease payments for operating leases, where substantially all the risks
and benefits remain with the lessor, are recognised as expenses in the periods in which they are
incurred.

Notes to the Financial Statements FOR THE YEAR ENDED 30 JUNE 2018
NOTE 1: Summary of Significant Accounting Policies (Cont’d)
(h) Impairment of Assets
At each reporting date, the consolidated entity reviews the carrying values of its tangible and intangible
assets to determine whether there is any indication that those assets have been impaired. If such an
indication exists, the recoverable amount of the asset, being the higher of the asset's fair value less
costs to sell and value-in-use, is compared to the asset's carrying value. Any excess of the asset's
carrying value over its recoverable amount is expensed immediately to the statement of profit or loss and
other comprehensive income.
Where it is not possible to estimate the recoverable amount of an individual asset, the consolidated
entity estimates the recoverable amount of the cash-generating unit to which the asset belongs.
(i) Goodwill
Goodwill acquired in a business combination is initially measured as the excess of the sum of the
consideration transferred, the amount of any non-controlling interests in the acquiree, and the acquisition
date fair value of any previously held equity interest over the acquisition-date fair value of the identifiable
assets acquired and the liabilities assumed.
Following initial recognition, goodwill is measured at cost less any accumulated impairment losses.
Goodwill is not amortised. Goodwill is reviewed for impairment, annually or more frequently if events or
changes in circumstances indicate that the carrying value may be impaired. It is allocated to the
consolidated entity’s cash-generating units or groups of cash-generating units, representing the lowest
level at which goodwill is monitored not being larger than an operating segment. Gains and losses on the
disposal of an entity include the carrying amount of goodwill related to the entity disposed of.
Impairment losses recognised for goodwill are not subsequently reversed.
(j) Intangibles other than Goodwill
Intangible assets acquired separately are capitalised at cost. Following initial recognition, the cost model
is applied to each class of intangible assets. Where amortisation is charged on assets with finite lives,
this expense is taken to the statement of profit or loss and other comprehensive income, through the
‘amortisation expenses’ line item.
Intangible assets are tested for impairment where an indicator of impairment exists and in the case of
intangible assets with indefinite useful lives, either individually or at the cash-generating unit level.
(k) Employee Benefits
Provision is made for the consolidated entity’s obligation for short-term employee benefits. Short-term
employee benefits are benefits that are expected to be settled wholly before 12 months after the end of
the annual reporting period in which the employees render the related service, including wages, salaries
and sick leave. Short-term employee benefits are measured at the (undiscounted) amounts expected to
be paid when the obligation is settled.
The consolidated entity’s obligations for short-term employee benefits such as wages, salaries and sick
leave are recognised as a part of current trade and other payables in the statement of financial position.
The consolidated entity’s obligations for employees’ annual leave and long service leave entitlements
are recognised as provisions in the statement of financial position.

Notes to the Financial Statements FOR THE YEAR ENDED 30 JUNE 2018
NOTE 1: Summary of Significant Accounting Policies (Cont’d)
Other long term employee benefits
Provision is made for employees’ long service leave and annual leave entitlements not expected to be
settled wholly within 12 months after the end of the annual reporting period in which the employees
render the related service. Other long-term employee benefits are measured at the present value of the
expected future payments to be made to employees. Expected future payments incorporate anticipated
future wage and salary levels, durations of service and employee departures and are discounted at rates
determined by reference to market yields at the end of the reporting period on government bonds that
have maturity dates that approximate the terms of the obligations. Any remeasurements for changes in
assumptions of obligations for other long-term employee benefits are recognised in statement of profit or
loss and other comprehensive income in the periods in which the changes occur.
The consolidated entity’s obligations for long-term employee benefits are presented as non-current
provisions in its statement of financial position, except where the consolidated entity does not have an
unconditional right to defer settlement for at least 12 months after the end of the reporting period, in
which case the obligations are presented as current provisions.
Equity-based payments
The consolidated entity provides equity-settled equity-based compensation benefits to employees. The
equity-based compensation benefits include the award of shares, and performance rights over shares, in
exchange for the rendering of services. The fair value of the equity to which employees become entitled
is measured at grant date and recognised as an expense over the vesting period, with a corresponding
increase to an equity account. The fair value of shares is measured as the share price at the date of
grant and the fair value of performance rights is ascertained using various option pricing models which
incorporate, where required, market vesting conditions. The number of shares and performance rights
expected to vest is reviewed and adjusted at the end of each reporting date such that the amount
recognised for services received as consideration for the equity instruments granted shall be based on
the number of equity instruments that eventually vest.
(l) Provisions
Provisions are recognised when the consolidated entity has a legal or constructive obligation, as a result
of past events, for which it is probable that an outflow of economic benefits will result and that outflow
can be reliably measured. Provisions are measured using the best estimate of the amounts required to
settle the obligation at the end of the reporting period, taking into account the risks and uncertainties
surrounding the obligation.
(m) Cash and Cash Equivalents
Cash and cash equivalents include cash on hand, deposits held at call with banks and other short-term
highly liquid investments with original maturities of 6 months or less.
(n) Revenue and Other Income
Revenue is recognised when it is probable that the economic benefit will flow to the consolidated entity
and the revenue can be reliably measured. Revenue is measured at the fair value of the consideration
received or receivable.
Revenue from the rendering of a service is recognised upon the delivery of the service to the customers.
Revenue recognition relating to the provision of services, namely construction activities, is determined
with reference to the stage of completion of the transaction at the end of the reporting period, where
outcome of the contract can be estimated reliably. Stage of completion is determined with reference to
the services performed to date as a percentage of total anticipated services to be performed. Where the
outcome cannot be estimated reliably, revenue is recognised only to the extent that related expenditure
is recoverable.
Interest revenue is recognised as interest accrues using the effective interest rate method.
All revenue is stated net of the amount of goods and services tax (GST).

Notes to the Financial Statements FOR THE YEAR ENDED 30 JUNE 2018
NOTE 1: Summary of Significant Accounting Policies (Cont’d)
(o) Financing Costs
Borrowing costs directly attributable to the acquisition, construction or production of assets that
necessarily take a substantial period of time to prepare for their intended use or sale, are added to the
cost of those assets, until such time as the assets are substantially ready for their intended use or sale.
All other borrowing costs are recognised in the statement of profit or loss and other comprehensive
income in the period in which they are incurred.
(p) Earnings Per Share
Basic earnings per share
Basic earnings per share is calculated by dividing the profit attributable to the owners of Decmil Group
Limited, excluding any costs of servicing equity other than ordinary shares, by the weighted average
number of ordinary shares outstanding during the financial year, adjusted for bonus elements in ordinary
shares issued during the financial year.
Diluted earnings per share
Diluted earnings per share adjusts the figures used in the determination of basic earnings per share to
take into account the after income tax effect of interest and other financing costs associated with dilutive
potential ordinary shares and the weighted average number of shares assumed to have been issued for
no consideration in relation to dilutive potential ordinary shares.
(q) Issued Capital
Ordinary shares are classified as equity.
Incremental costs directly attributable to the issue of new shares or options are shown in equity as a
deduction, net of tax, from the proceeds.
(r) Dividends
Provision is made for the amount of any dividend declared, being appropriately authorised and no longer
at the discretion of the entity, on or before the end of the reporting period but not distributed at the end of
the reporting period.
(s) Goods and Services Tax (GST)
Revenues, expenses and assets are recognised net of the amount of GST, except where the amount of
GST incurred is not recoverable from the relevant revenue authority. In these circumstances the GST is
recognised as part of the cost of acquisition of the asset or as part of an item of the expense.
Receivables and payables in the statement of financial position are shown inclusive of GST.
Cash flows are presented in the statement of cash flows on a gross basis, except for the GST
component of investing and financing activities, which are disclosed as operating cash flows.
(t) Financial Instruments
Initial recognition and measurement
Financial assets and financial liabilities are recognised when the consolidated entity becomes a party to
the contractual provisions to the instrument. For financial assets, this is equivalent to the date that the
consolidated entity commits itself to either the purchase or sale of the asset (i.e. trade date accounting is
adopted).
Financial instruments are initially measured at fair value plus transaction costs, except where the
instrument is classified ‘at fair value through profit or loss’, in which case transaction costs are expensed
to the statement of profit or loss and other comprehensive income immediately.

Notes to the Financial Statements FOR THE YEAR ENDED 30 JUNE 2018
NOTE 1: Summary of Significant Accounting Policies (Cont’d)
Classification and subsequent measurement
Financial instruments are subsequently measured at either of fair value, amortised cost using the
effective interest rate method, or cost. Fair value represents the amount for which an asset could be
exchanged or a liability settled, between knowledgeable, willing parties. Where available, quoted prices
in an active market are used to determine fair value. In other circumstances, valuation techniques are
adopted, including recent arm’s length transactions, reference to similar instruments and option pricing
models.
Amortised cost is the amount at which the financial asset or liability is measured at initial recognition less
principal repayments and any reduction for impairment, and adjusted for any cumulative amortisation of
the difference between that initial amount and the maturity amount calculated using the effective interest
rate method.
The effective interest rate method is used to allocate interest income or interest expense over the
relevant period and is equivalent to the rate that exactly discounts estimated future cash payments or
receipts (including fees, transaction costs and other premiums or discounts) over the expected life (or
when this cannot be reliably predicted, the contractual term) of the financial instrument to the net
carrying amount of the financial asset or financial liability. Revisions to expected future net cash flows
will necessitate an adjustment to the carrying value with a consequential recognition of an income or
expense in the statement of profit or loss or other comprehensive income.
The consolidated entity does not designate any interests in subsidiaries, associates or joint venture
entities as being subject to the requirements of Accounting Standards specifically applicable to financial
instruments.
i. Loans and receivables
Loans and receivables are non-derivative financial assets with fixed or determinable payments that are
not quoted in an active market and are subsequently measured at amortised cost. Gains or losses are
recognised in the statement of profit or loss and other comprehensive income through the amortisation
process and when the financial asset is derecognised.
ii. Financial liabilities
Non-derivative financial liabilities (excluding financial guarantees) are subsequently measured at
amortised cost.
iii. Available-for-sale financial assets
Available-for-sale financial assets are non-derivative financial assets that are either not suitable to be
classified into other categories of financial assets due to their nature, or they are designated as such by
management. They comprise investments in the equity of other entities where there is neither a fixed
maturity nor fixed or determinable payments.
Available-for-sale financial assets are included in non-current assets, except for those which are
expected to mature within 12 months after the end of the reporting period. All other financial assets are
classified as current assets.
Impairment
At the end of each reporting period, the consolidated entity assesses whether there is objective evidence
that a financial asset has been impaired. In the case of available-for-sale financial instruments, a
prolonged decline in the value of the instrument is considered to determine whether an impairment has
arisen. Impairment losses are recognised in the statement of profit or loss and other comprehensive
income.

Notes to the Financial Statements FOR THE YEAR ENDED 30 JUNE 2018
NOTE 1: Summary of Significant Accounting Policies (Cont’d)
(u) Trade and Other Receivables
Trade and other receivables include amounts due from customers for goods sold and services
performed in the ordinary course of business. Receivables expected to be collected within 12 months of
the end of the reporting period are classified as current assets. All other receivables are classified as
non-current assets. Trade and other receivables are initially recognised at fair value and subsequently
measured at amortised cost using the effective interest rate method, less any provision for impairment.
(v) Current and Non-current Classification
Assets and liabilities are presented in the statement of financial position based on current and non-
current classification.
An asset is classified as current when: it is either expected to be realised or intended to be sold or
consumed in normal operating cycle; it is held primarily for the purpose of trading; it is expected to be
realised within 12 months after the reporting period; or the asset is cash or cash equivalent unless
restricted from being exchanged or used to settle a liability for at least 12 months after the reporting
period. All other assets are classified as non-current.
(w) Foreign Currency Transactions and Balances
Foreign currency translation
The financial statements are presented in Australian dollars, which is the Company’s functional and
presentation currency.
Foreign currency transactions
Foreign currency transactions are translated into Australian dollars using the exchange rates prevailing
at the dates of the transactions. Foreign exchange gains and losses resulting from the settlement of
such transactions and from the translation at financial year-end exchange rates of monetary assets and
liabilities denominated in foreign currencies are recognised in profit or loss.
(x) Fair Value of Assets and Liabilities
The consolidated entity measures some of its assets and liabilities at fair value on either a recurring or
non-recurring basis, depending on the requirements of the applicable Accounting Standard.
Fair value is the price the consolidated entity would receive to sell an asset or would have to pay to
transfer a liability in an orderly (i.e. unforced) transaction between independent, knowledgeable and
willing market participants at the measurement date.
As fair value is a market-based measure, the closest equivalent observable market pricing information is
used to determine fair value. Adjustments to market values may be made having regard to the
characteristics of the specific asset or liability. The fair values of assets and liabilities that are not traded
in an active market are determined using one or more valuation techniques. These valuation techniques
maximise, to the extent possible, the use of observable market data.
To the extent possible, market information is extracted from either the principal market for the asset or
liability (i.e. the market with the greatest volume and level of activity for the asset or liability) or, in the
absence of such a market, the most advantageous market available to the consolidated entity at the end
of the reporting period (i.e. the market that maximises the receipts from the sale of the asset or
minimises the payments made to transfer the liability, after taking into account transaction costs and
transport costs).

Notes to the Financial Statements FOR THE YEAR ENDED 30 JUNE 2018
NOTE 1: Summary of Significant Accounting Policies (Cont’d)
The fair value of liabilities and the consolidated entity’s own equity instruments (excluding those related
to equity-based payment arrangements) may be valued, where there is no observable market price in
relation to the transfer of such financial instrument, by reference to observable market information where
such instruments are held as assets. Where this information is not available, other valuation techniques
are adopted and, where significant, are detailed in the respective note to the financial statements.
(y) Rounding of Amounts
The Company is of a kind referred to in Corporations Instrument 2016/191, issued by the Australian
Securities and Investments Commission, relating to ‘rounding-off’. Amounts in this report have been
rounded off in accordance with that Corporations Instrument to the nearest thousand dollars, or in
certain cases, the nearest dollar.
(z) Comparative Figures
When required by Accounting Standards, comparative figures have been adjusted to conform to
changes in presentation for the current financial year.
(aa) Critical Accounting Estimates and Judgements
The directors evaluate estimates and judgements incorporated into the financial statements based on
historical knowledge and best available current information. Estimates assume a reasonable expectation
of future events and are based on current trends and economic data, obtained both externally and within
the consolidated entity.
Impairment of goodwill and intangibles
The consolidated entity determines whether goodwill and intangible assets are impaired at least on an
annual basis. This requires an estimation of the recoverable amount of the cash-generating units to
which the goodwill and intangibles with indefinite useful lives are allocated. The assumptions used in this
estimation of recoverable amount and the carrying amount of goodwill and intangibles are discussed in
note 19.
Equity-based payment transactions
The consolidated entity measures the cost of equity-settled transactions with employees by reference to
the fair value of the equity instrument at the date at which they are granted.
The fair value of performance rights are determined using various option pricing models. The accounting
estimates and assumptions relating to equity-settled equity-based payments would have no impact on
the carrying amount of assets and liabilities within the next annual reporting period but may impact
expenses and equity.
Construction contracts
When accounting for construction contracts, the contracts are either combined or segmented if this is
deemed necessary to reflect the substance of the agreement. Revenue arising from fixed price contracts
is recognised in accordance with the percentage of completion method. Stage of completion is agreed
with the customer on a work certified to date basis, as a percentage of the overall contract. Revenue
from cost plus contracts is recognised by reference to the recoverable costs incurred plus a percentage
of fees earned during the financial year. The percentage of fees earned during the financial year is
based on the stage of completion of the contract.
Where a loss is expected to occur from a construction contract, the excess of the total expected contract
costs over expected contract revenue is recognised as an expense immediately.
Provision for maintenance
In determining the level of provision required for maintenance, the consolidated entity has made
judgements in respect of the expected outcome of construction contracts and the costs of fulfilling the
maintenance obligations. The provision is based on estimates made from historical data associated with
past construction contracts.

Notes to the Financial Statements FOR THE YEAR ENDED 30 JUNE 2018
NOTE 1: Summary of Significant Accounting Policies (Cont’d)
Fair value measurement hierarchy
The consolidated entity is required to classify all assets and liabilities, measured at fair value, using a
three level hierarchy, based on the lowest level of input that is significant to the entire fair value
measurement, being: level 1: Quoted prices (unadjusted) in active markets for identical assets or
liabilities that the consolidated entity can access at the measurement date; level 2: Inputs other than
quoted prices included within level 1 that are observable for the asset or liability, either directly or
indirectly; and level 3: Unobservable inputs for the asset or liability. Considerable judgement is required
to determine what is significant to fair value and therefore which category the asset or liability is placed
in can be subjective.
The fair value of assets and liabilities classified as level 3 is determined by the use of valuation models.
These include discounted cash flow analysis or the use of observable inputs that require significant
adjustments based on unobservable inputs.
Provision for impairment of receivables
The provision for impairment of receivables assessment requires a degree of estimation and judgement.
The level of provision is assessed by taking into account the recent sales experience, the ageing of
receivables, historical collection rates and specific knowledge of the individual debtors’ financial position.
Income tax
The consolidated entity is subject to income taxes in the jurisdictions in which it operates. Significant
judgement is required in determining the provision for income tax. There are many transactions and
calculations undertaken during the ordinary course of business for which the ultimate tax determination
is uncertain. The consolidated entity recognises liabilities for anticipated tax audit issues based on the
consolidated entity's current understanding of the tax law. Where the final tax outcome of these matters
is different from the carrying amounts, such differences will impact the current and deferred tax
provisions in the period in which such determination is made.
Recovery of deferred tax assets
Deferred tax assets are recognised for deductible temporary differences and losses only if the
consolidated entity considers it is probable that future taxable amounts will be available to utilise those
temporary differences and losses.
Employee benefits provision
The liability for employee benefits expected to be settled more than 12 months from the reporting date
are recognised and measured at the present value of the estimated future cash flows to be made in
respect of all employees at the reporting date. In determining the present value of the liability, estimates
of attrition rates and pay increases through promotion and inflation have been taken into account.
Estimation of useful lives of assets
The consolidated entity determines the estimated useful lives and related depreciation and amortisation
charges for its property, plant and equipment and finite life intangible assets. The useful lives could
change significantly as a result of technical innovations or some other event. The depreciation and
amortisation charge will increase where the useful lives are less than previously estimated lives, or
technically obsolete or non-strategic assets that have been abandoned or sold will be written off or
written down.

Notes to the Financial Statements FOR THE YEAR ENDED 30 JUNE 2018
NOTE 2: New Accounting Standards for Application in Future Periods
New, revised or amending Accounting Standards and Interpretations adopted
The consolidated entity has adopted all of the new, revised or amending Accounting Standards and
Interpretations issued by the Australian Accounting Standards Board that are mandatory for the current
reporting period. The adoption of these Accounting Standards and Interpretations did not have any
significant impact on the financial performance or position of the consolidated entity.
Any new, revised or amending Accounting Standards or Interpretations that are not yet mandatory have
not been early adopted.
New Accounting Standards and Interpretations not yet mandatory or early adopted
Australian Accounting Standards and Interpretations that have recently been issued or amended but are
not yet mandatory, have not been early adopted by the consolidated entity for the annual reporting
period ended 30 June 2018. The consolidated entity's assessment of the impact of these new or
amended Accounting Standards and Interpretations, most relevant to the consolidated entity, are set out
below.
AASB 9 Financial Instruments
This standard is applicable to annual reporting periods beginning on or after 1 January 2018. The
standard replaces all previous versions of AASB 9 and completes the project to replace IAS 39 'Financial
Instruments: Recognition and Measurement'. AASB 9 introduces new classification and measurement
models for financial assets.
A financial asset shall be measured at amortised cost, if it is held within a business model whose
objective is to hold assets in order to collect contractual cash flows, which arise on specified dates and
solely principal and interest. All other financial instrument assets are to be classified and measured at
fair value through profit or loss unless the entity makes an irrevocable election on initial recognition to
present gains and losses on equity instruments (that are not held-for-trading) in other comprehensive
income (OCI). For financial liabilities, the standard requires the portion of the change in fair value that
relates to the entity's own credit risk to be presented in OCI (unless it would create an accounting
mismatch). New simpler hedge accounting requirements are intended to more closely align the
accounting treatment with the risk management activities of the entity. New impairment requirements will
use an 'expected credit loss' (ECL) model to recognise an allowance. Impairment will be measured
under a 12-month ECL method unless the credit risk on a financial instrument has increased significantly
since initial recognition in which case the lifetime ECL method is adopted.
The standard introduces additional new disclosures. The consolidated entity will adopt this standard from
1 July 2018 but it will have minimal impact on the consolidated entity.
AASB 15 Revenue from Contracts with Customers
AASB 15 establishes a comprehensive framework for determining the timing and quantum of revenue
recognised. It replaces existing guidance, including AASB 118 Revenue and AASB 111 Construction
Contracts. The core principle of AASB 15 is that an entity shall recognise revenue when control of a
good or service transfers to a customer. This standard will become mandatory for reporting periods
beginning on or after 1 January 2018. The standard permits either a full retrospective or a modified
retrospective approach for the adoption.
Significant judgments and estimates are used in determining the impact, such as the assessment of the
probability of customer acceptance of claims, estimation of project completion date and assumed levels
of project execution productivity.
The contractual terms and the way in which the Group operates its construction contracts is
predominantly derived from projects containing one performance obligation. Contracted revenue will
continue to be recognised over time, however the new standard provides new requirements for variable
consideration, as well as accounting for claims and variations as contract modifications which all impart
a higher threshold of probability for recognition. Revenue is currently recognised when it is probable that
work performed will result in revenue whereas under the new standard, revenue is recognised when it is
highly probable that a significant reversal of revenue will not occur for these modifications.

Notes to the Financial Statements FOR THE YEAR ENDED 30 JUNE 2018
NOTE 2: New Accounting Standards for Application in Future Periods (Cont’d)
Currently under AASB 111 Construction Contracts, costs incurred during the tender process are
capitalised within other current assets when it is deemed probable the contract will be won. Under the
new standard costs can only be capitalised if they are both expected to be recovered and either would
not have been incurred if the contract had not been won or if they are intrinsic to the delivery of a project.
Based on the current assessment, the higher recognition thresholds in the new standard may lead to an
estimated adjustment reducing the current shareholder equity balance of $206.3 million by around $12.3
million (after tax) on 1 July 2018.
AASB 16 Leases
This standard is applicable to annual reporting periods beginning on or after 1 January 2019. The
standard replaces AASB 117 'Leases' and for lessees will eliminate the classifications of operating
leases and finance leases. Subject to exceptions, a 'right-of-use' asset will be capitalised in the
statement of financial position, measured as the present value of the unavoidable future lease payments
to be made over the lease term. The exceptions relate to short-term leases of 12 months or less and
leases of low-value assets (such as personal computers and small office furniture) where an accounting
policy choice exists whereby either a 'right-of-use' asset is recognised or lease payments are expensed
to profit or loss as incurred. A liability corresponding to the capitalised lease will also be recognised,
adjusted for lease prepayments, lease incentives received, initial direct costs incurred and an estimate of
any future restoration, removal or dismantling costs. Straight-line operating lease expense recognition
will be replaced with a depreciation charge for the leased asset (included in operating costs) and an
interest expense on the recognised lease liability (included in finance costs). In the earlier periods of the
lease, the expenses associated with the lease under AASB 16 will be higher when compared to lease
expenses under AASB 117. However, EBITDA (Earnings Before Interest, Tax, Depreciation and
Amortisation) results will be improved as the operating expense is replaced by interest expense and
depreciation in profit or loss under AASB 16. For classification within the statement of cash flows, the
lease payments will be separated into both a principal (financing activities) and interest (either operating
or financing activities) component. For lessor accounting, the standard does not substantially change
how a lessor accounts for leases. The consolidated entity will adopt this standard from 1 July 2019. The
adoption of this standard has been assessed by the consolidated entity and will impact its assets,
liabilities and expenses but the extent of which has not yet been assessed by the consolidated entity.

Notes to the Financial Statements FOR THE YEAR ENDED 30 JUNE 2018
NOTE 3: Parent Entity Information
Parent Entity
2018 2017
$000 $000
Statement of profit or loss and other comprehensive income
Loss for the year (27,725) (4,069)
Total comprehensive income for the year (27,725) (4,069)
Statement of financial position
ASSETS
Current assets 86,543 83,664
Non-current assets 87,175 90,987
TOTAL ASSETS 173,718 174,651
LIABILITIES
Current liabilities 158,083 140,145
Non-current liabilities 652 822
TOTAL LIABILITIES 158,735 140,967
EQUITY
Issued capital 168,628 164,751
Retained earnings (153,645) (131,067)
TOTAL EQUITY 14,983 33,684
a) Guarantees
Cross guarantees have been provided by Decmil Group Limited and its controlled entities as listed in
note 15(b).
b) Other Commitments and Contingencies
Decmil Group Limited has no commitments to acquire property, plant and equipment, and has no
contingent liabilities apart from that disclosed in note 34.

Notes to the Financial Statements FOR THE YEAR ENDED 30 JUNE 2018
NOTE 4: Expenses
Consolidated Entity
2018 2017
$000 $000
From continuing operations
(Loss)/profit before income tax includes the following specific expenses:
Employee benefits costs 73,323 71,131
Finance costs 1,493 1,011
Depreciation and amortisation of non-current assets:
- plant and equipment owned 2,792 4,558
- plant and equipment leased 109 80
- building 2 517
- amortisation of intangible assets - 176
Total depreciation 2,903 5,331
Rental expense on operating leases 2,847 1,432

Notes to the Financial Statements FOR THE YEAR ENDED 30 JUNE 2018
NOTE 5: Income Tax Expense
Consolidated Entity
2018 2017
Note $000 $000
Income tax benefit is attributable to:
(Profit)/Loss from continuing operations (521) 8,090
Loss from discontinued operations 6 589 1,680
68 9,770
The components of income tax /benefit comprise:
Current tax (1,564) 662
Deferred tax 24 2,183 8,716
Over/(under) provision for tax in prior year (551) 392
68 9,770
The prima facie tax benefit on loss before income tax is reconciled to the income tax benefit as follows:
Prima facie tax benefit on loss before income tax at 30% (2017: 30%)
1,992 11,435
Adjusted by the tax effect of:
- equity based payments (93) (230)
- deductible capital raising costs 3 54
- non-deductible items (855) (2,763)
- research and development tax offset (non-refundable) (428) 882
- over/(under) provision for tax in prior year (551) 392
Income tax benefit attributable to loss before income tax 68 9,770
The applicable weighted average effective tax rates are as follows: 1% 26%

Notes to the Financial Statements FOR THE YEAR ENDED 30 JUNE 2018
NOTE 6: Discontinued Operations
As part of the Group’s refocus on its core construction and engineering business units, on 1 November
2017 the Group’s telecommunications division consisting of SC Holdings Pty Ltd and its subsidiaries SC
Services Pty Ltd and SC Equipment Holdings Pty Ltd and the Group’s design consulting business,
Scope Australia Pty Ltd, were discontinued.
(a) Financial performance information Consolidated Entity
2018 2017
Note $000 $000
Other services revenue 7,647 28,151
Interest received 1 9
Total revenue 7,648 28,160
Cost of sales (8,644) (27,203)
Administration expenses (2,002) (4,452)
Borrowing costs (2) (291)
Depreciation and amortisation expense (111) (296)
Impairment of intangible assets - (10,685)
Restructuring costs - (127)
Loss on disposal of subsidiaries 29(b) (3,438) -
Total expenses (14,197) (43,054)
Loss before income tax expense (6,549) (14,894)
Income tax benefit 5 589 1,680
Loss after income tax expense from discontinued operations (5,960) (13,214)
(b) Financial position information Consolidated Entity
2018 2017
Note $000 $000
Current Assets
Cash and cash equivalents 10 41
Trade and other receivables 20 5,019
Work in progress - 4,179
Other current assets 752 262
Total Current Assets 782 9,501
Non-current Assets
Property, plant and equipment - 1,584
Deferred tax assets - 508
Intangible assets - 1,717
Total Non-current Assets - 3,809
Total Assets - 13,310
Current Liabilities
Trade and other payables 32 6,074
Provisions - 526
Total Current Liabilities 32 6,600
Total Liabilities 32 6,600
Net Assets 750 6,710

Notes to the Financial Statements FOR THE YEAR ENDED 30 JUNE 2018
NOTE 6: Discontinued Operations (Cont’d)
(c) Cash flow information Consolidated Entity
2018 2017
Note $000 $000
Net cash from/(used in) operating activities (991) 7,840
Net cash from/(used in) investing activities 962 (113)
Net cash used in financing activities (1) (9,000)
Net decrease in cash and cash equivalents from discontinued operations
(30) (1,273)
NOTE 7: Key Management Personnel Disclosures
a. Names and positions held of directors and other members of Key Management Personnel in office
at any time during the financial year are:
Parent Entity Directors
Don Argent (appointed 1 March 2018)
Denis Criddle
Scott Criddle
Bill Healy
David Saxelby
Lee Verios (resigned 1 November 2017)
Key Management Personnel
Tony Radalj: Chief Operating Officer
Craig Amos: Chief Financial Officer
b. Compensation for Key Management Personnel
The totals of remuneration paid to directors and KMP of the Company and the consolidated entity during
the year are as follows:
2018 2017
$000 $000
Short-term employee benefits 1,660 1,945
Equity-based payments 499 1,047
2,159 2,992
c. Loans to Key Management Personnel
No directors or KMP had any loans during the reporting period.
d. Other transactions and balances with Key Management Personnel
There were no other transactions and balances with KMP other than that disclosed in note 31.

Notes to the Financial Statements FOR THE YEAR ENDED 30 JUNE 2018
NOTE 8: Auditors’ Remuneration
Consolidated Entity
2018 2017
$000 $000
Remuneration of the auditor of the parent entity for:
- auditing or reviewing the financial report 228 266
- taxation services 29 16
- accounting assistance 10 9
267 291
NOTE 9: Earnings Per Share
Consolidated Entity
2018 2017
$000 $000
(a) Reconciliation of earnings to profit or loss from overall operations
Loss after income tax (6,131) (28,347)
Earnings used to calculate basic and dilutive EPS (6,131) (28,347)
(b) Reconciliation of earnings to profit or loss from continuing operations
Loss after income tax (171) (15,133)
Earnings used to calculate basic and dilutive EPS (171) (15,133)
(c) Reconciliation of earnings to profit or loss from discontinuing operations
Loss after income tax (5,960) (13,214)
Earnings used to calculate basic and dilutive EPS (5,960) (13,214)
No. No.
(d) Weighted average number of ordinary shares outstanding during the year used in calculating basic EPS
173,223,027 171,036,636
Weighted average number of dilutive options outstanding - -
Weighted average number of ordinary shares outstanding during the year used in calculating dilutive EPS
173,223,027 171,036,636

Notes to the Financial Statements FOR THE YEAR ENDED 30 JUNE 2018
NOTE 10: Dividends
Consolidated Entity
2018 2017
$000 $000
Distributions Paid
Final dividend for the year ended 30 June 2017 of nil cents (2016: 2.0 cents) per share fully franked at the tax rate of 30% (2017: 30%)
- 3,398
Interim dividend for the year ended 30 June 2018 of nil cents (2017: 2.0 cents) per share fully franked at the tax rate of 30% (2017: 30%)
- 3,435
- 6,833
Balance of franking account at year end 54,244 54,244
NOTE 11: Revenue
Consolidated Entity
2018 2017
Note $000 $000
From continuing operations
Construction and engineering revenue 335,901 259,847
Accommodation revenue 5,952 14,486
Other revenue
- rentals (245) 351
- profit on sale of property - 2,213
- other services revenue - 75
Total revenue from continuing operations 341,608 276,972
(a) Interest revenue
Interest revenue from:
- other persons 32 43
Total interest revenue 32 43
On 23 June 2017, a commercial building located at 20 Parkland Road, Osborne Park, Western Australia was sold for $27.5 million. The written down value at the date of sale was $23.189 million. The profit recognised on sale was $2.213 million net of selling costs.

Notes to the Financial Statements FOR THE YEAR ENDED 30 JUNE 2018
NOTE 12: Cash and Cash Equivalents
Consolidated Entity
2018 2017
$000 $000
Cash at bank and in hand 16,755 16,905
16,755 16,905
Reconciliation of cash
Cash at the end of the financial year as shown in the statement of cash flows is reconciled to items in the statement of financial position as follows:
Cash and cash equivalents 16,755 16,905
NOTE 13: Trade and Other Receivables
Consolidated Entity
2018 2017
$000 $000
CURRENT
Trade receivables 43,672 34,950
Less: Provision for impairment of receivables - -
43,672 34,950
Movement in the provision for impairment of receivables are as follows:
Opening balance - -
Additional provisions recognised 399 31
Written off during the year as uncollectable (399) (31)
Closing balance - -
The following table details the consolidated entity’s trade receivables exposed to credit risk with ageing
analysis and impairment provided for thereon. Amounts are considered as ‘past due’ when the debt has
not been settled, with the terms and conditions agreed between the consolidated entity and the customer
or counterparty to the transaction. Receivables that are past due are assessed for impairment by
ascertaining solvency of the debtors and are provided for where there are specific circumstances
indicating that the debt may not be fully repaid to the consolidated entity.
The balances of receivables that remain within initial trade terms (as detailed in the table) are considered
to be of high credit quality.
Past due but not impaired (days overdue)
Gross amount
$000
Within initial trade terms $000
31-60 $000
61-90 $000
91-120 $000
>120 $000
Past due and
impaired $000
2018
Trade receivables 43,672 42,472 547 13 2 638 -
Total 43,672 42,472 547 13 2 638 -
2017
Trade receivables 34,950 29,912 4,010 326 170 532 -
Total 34,950 29,912 4,010 326 170 532 -

Notes to the Financial Statements FOR THE YEAR ENDED 30 JUNE 2018
NOTE 14: Work in Progress
Consolidated Entity
2018 2017
Note $000 $000
CURRENT
Construction and engineering contracts
Cost incurred to date plus profit recognised 566,798 730,763
Consideration received and receivables as progress billings (545,732) (730,362)
21,066 401
Advanced billings to customers 21 (7,816) (11,513)
Unbilled amounts due from customers 28,882 11,914
21,066 401

Notes to the Financial Statements FOR THE YEAR ENDED 30 JUNE 2018
NOTE 15: Controlled Entities
(a) Controlled Entities
Percentage Owned (%)
Country of
Incorporation 2018 2017
Parent Entity:
Decmil Group Limited Australia
Controlled entities of Decmil Group Limited:
Decmil Australia Pty Ltd Australia 100% 100%
Decmil Properties Pty Ltd Australia 100% 100%
Eastcoast Development Engineering Pty Ltd Australia 100% 100%
Homeground Villages Pty Ltd Australia 100% 100%
Decmil Infrastructure Pty Ltd Australia 100% 100%
Decmil Services Pty Ltd Australia 100% 100%
Scope Australia Pty Ltd Australia - 100%
Decmil Group Limited Employee Share Plan Trust Australia 100% 100%
Controlled entities of Homeground Villages Pty Ltd:
Homeground Gladstone Pty Ltd ATF Homeground Gladstone Unit Trust
Australia 100% 100%
Homeground Gladstone Unit Trust Australia 100% 100%
Homeground Karratha Pty Ltd Australia - 100%
Controlled entities of Decmil Australia Pty Ltd:
Decmil PNG Limited Papua New
Guinea 100% 100%
Decmil Construction NZ Limited New Zealand 100% 100%
Decmil Engineering Pty Ltd Australia 100% 100%
Decmil Southern Pty Ltd (formerly Cut and Fill Pty Ltd) Australia 100% 100%
Controlled entities of Decmil Infrastructure Pty Ltd:
Cornelisse Shoal Pty Ltd Australia - 100%
Controlled entities of Decmil Services Pty Ltd:
Decmil Telecom Pty Ltd Australia 100% 100%
SC Holdings Pty Ltd Australia - 100%
SC Services Pty Ltd Australia - 100%
SC Equipment Holdings Pty Ltd Australia - 100%
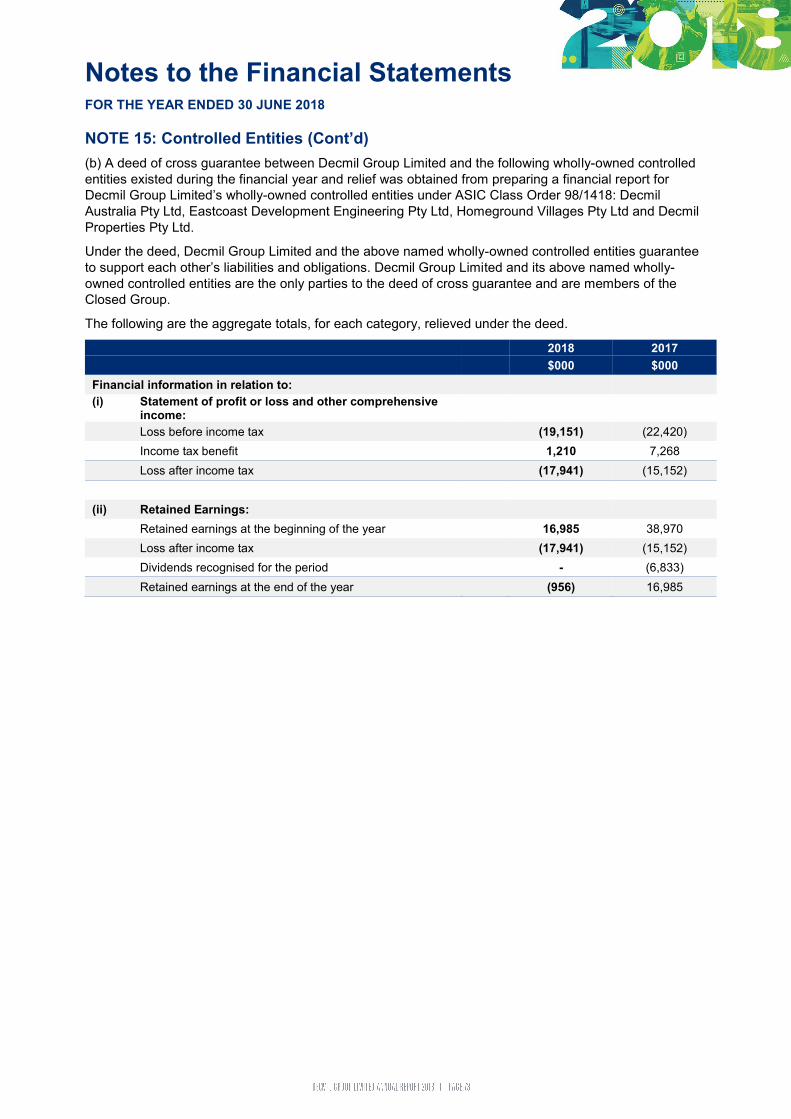
Notes to the Financial Statements FOR THE YEAR ENDED 30 JUNE 2018
NOTE 15: Controlled Entities (Cont’d)
(b) A deed of cross guarantee between Decmil Group Limited and the following wholly-owned controlled
entities existed during the financial year and relief was obtained from preparing a financial report for
Decmil Group Limited’s wholly-owned controlled entities under ASIC Class Order 98/1418: Decmil
Australia Pty Ltd, Eastcoast Development Engineering Pty Ltd, Homeground Villages Pty Ltd and Decmil
Properties Pty Ltd.
Under the deed, Decmil Group Limited and the above named wholly-owned controlled entities guarantee
to support each other’s liabilities and obligations. Decmil Group Limited and its above named wholly-
owned controlled entities are the only parties to the deed of cross guarantee and are members of the
Closed Group.
The following are the aggregate totals, for each category, relieved under the deed.
2018 2017
$000 $000
Financial information in relation to:
(i) Statement of profit or loss and other comprehensive income:
Loss before income tax (19,151) (22,420)
Income tax benefit 1,210 7,268
Loss after income tax (17,941) (15,152)
(ii) Retained Earnings:
Retained earnings at the beginning of the year 16,985 38,970
Loss after income tax (17,941) (15,152)
Dividends recognised for the period - (6,833)
Retained earnings at the end of the year (956) 16,985

Notes to the Financial Statements FOR THE YEAR ENDED 30 JUNE 2018
NOTE 15: Controlled Entities (Cont’d)
2018 2017
$000 $000
(iii) Statement of Financial Position:
Current Assets
Cash and cash equivalents 3,662 9,773
Trade and other receivables 24,176 25,602
Work in progress 27,821 6,165
Current tax receivable 820 271
Other assets 6,829 2,808
Total Current Assets 63,308 44,619
Non-current Assets
Investment property 92,410 92,400
Property, plant and equipment 3,658 5,469
Deferred tax assets 29,375 27,285
Intangible assets 71,061 69,343
Other financial assets 6,218 9,560
Total Non-current Assets 202,722 204,057
Total Assets 266,030 248,676
Current Liabilities
Trade and other payables 96,512 64,429
Borrowings 173 243
Provisions 3,427 2,194
Total Current Liabilities 100,112 66,866
Non-current Liabilities
Deferred tax liabilities 544 316
Provisions 498 1,125
Total Non-current Liabilities 1,042 1,441
Total Liabilities 101,154 68,307
Net Assets 164,876 180,369
Equity
Issued capital 165,832 163,384
Retained earnings (956) 16,985
Net Equity 164,876 180,369
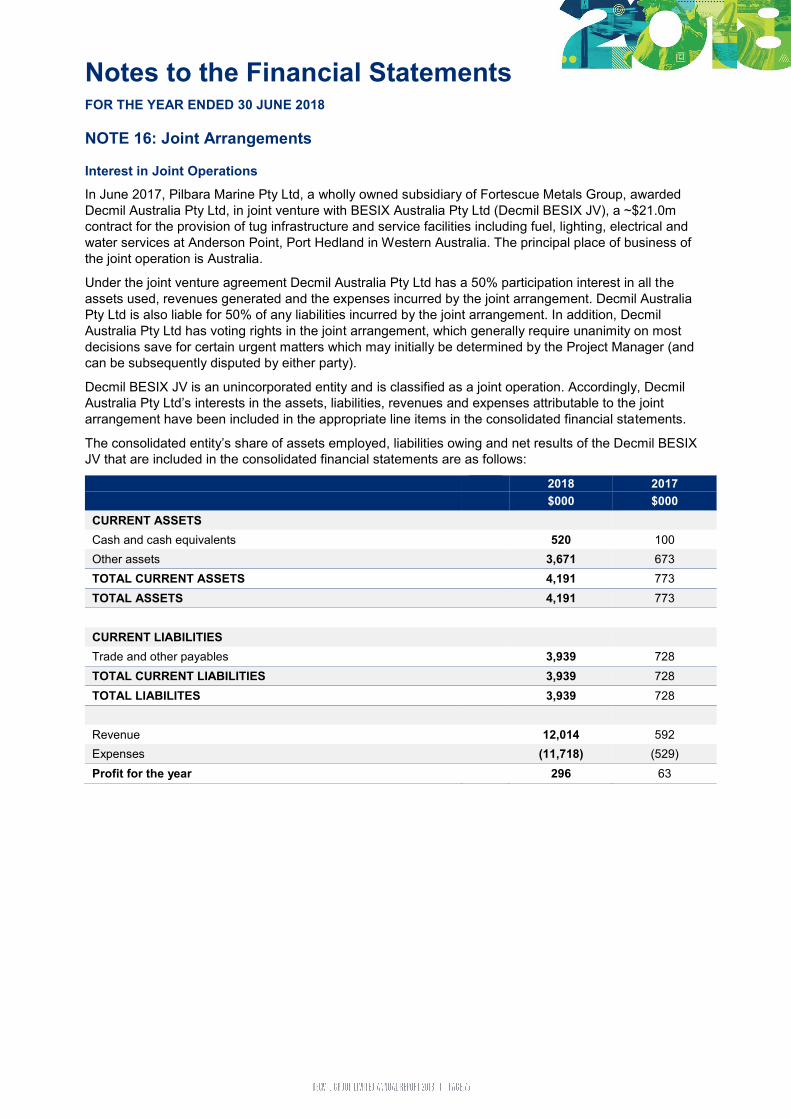
Notes to the Financial Statements FOR THE YEAR ENDED 30 JUNE 2018
NOTE 16: Joint Arrangements
Interest in Joint Operations
In June 2017, Pilbara Marine Pty Ltd, a wholly owned subsidiary of Fortescue Metals Group, awarded
Decmil Australia Pty Ltd, in joint venture with BESIX Australia Pty Ltd (Decmil BESIX JV), a ~$21.0m
contract for the provision of tug infrastructure and service facilities including fuel, lighting, electrical and
water services at Anderson Point, Port Hedland in Western Australia. The principal place of business of
the joint operation is Australia.
Under the joint venture agreement Decmil Australia Pty Ltd has a 50% participation interest in all the
assets used, revenues generated and the expenses incurred by the joint arrangement. Decmil Australia
Pty Ltd is also liable for 50% of any liabilities incurred by the joint arrangement. In addition, Decmil
Australia Pty Ltd has voting rights in the joint arrangement, which generally require unanimity on most
decisions save for certain urgent matters which may initially be determined by the Project Manager (and
can be subsequently disputed by either party).
Decmil BESIX JV is an unincorporated entity and is classified as a joint operation. Accordingly, Decmil
Australia Pty Ltd’s interests in the assets, liabilities, revenues and expenses attributable to the joint
arrangement have been included in the appropriate line items in the consolidated financial statements.
The consolidated entity’s share of assets employed, liabilities owing and net results of the Decmil BESIX
JV that are included in the consolidated financial statements are as follows:
2018 2017
$000 $000
CURRENT ASSETS
Cash and cash equivalents 520 100
Other assets 3,671 673
TOTAL CURRENT ASSETS 4,191 773
TOTAL ASSETS 4,191 773
CURRENT LIABILITIES
Trade and other payables 3,939 728
TOTAL CURRENT LIABILITIES 3,939 728
TOTAL LIABILITES 3,939 728
Revenue 12,014 592
Expenses (11,718) (529)
Profit for the year 296 63

Notes to the Financial Statements FOR THE YEAR ENDED 30 JUNE 2018
NOTE 16: Joint Arrangements (Cont’d)
In August 2016, Decmil Construction NZ Limited, a controlled entity of Decmil Group Limited entered into
a 50% participation interest in the Stanley Decmil Joint Venture with joint venture partner Stanley
Construction Limited to construct the Thames Indoor Sports Facility for the Thames Coromandel District
Council located in Thames, New Zealand valued at NZD$3.4m. The principal place of business of the
joint operation is New Zealand.
Under the joint venture agreement Decmil Construction NZ Limited has a 50% participation in all the
assets used, the revenues generated and the expenses incurred by the joint arrangement. Decmil
Construction NZ Limited is also liable for 50% of any liabilities incurred by the joint arrangement. In
addition, pursuant to the joint venture agreement, Decmil Construction NZ Limited has 50% of the voting
rights in relation to the Stanley Decmil Joint Venture.
Stanley Decmil Joint Venture is an unincorporated entity and is classified as a joint operation.
Accordingly, Decmil Construction NZ Limited’s interests in the assets, liabilities, revenues and expenses
attributable to the joint arrangement have been included in the appropriate line items in the consolidated
financial statements.
The consolidated entity’s share of assets employed, liabilities owing and net results of the Stanley
Decmil Joint Venture that are included in the consolidated financial statements are as follows:
2018 2017
$000 $000
CURRENT ASSETS
Cash and cash equivalents 95 58
Other assets 256 92
TOTAL CURRENT ASSETS 351 150
TOTAL ASSETS 351 150
CURRENT LIABILITIES
Trade and other payables 315 114
TOTAL CURRENT LIABILITIES 315 114
TOTAL LIABILITES 315 114
Revenue 432 1,556
Expenses (432) (1,506)
Profit for the year - 50

Notes to the Financial Statements FOR THE YEAR ENDED 30 JUNE 2018
NOTE 16: Joint Arrangements (Cont’d)
Decmil Australia Pty Ltd, a controlled entity of Decmil Group Limited, is a participant in two
unincorporated joint ventures with Balance Utility Solutions Pty Ltd. The first is a 50% participation
interest in the delivery of a battery energy storage system for Western Power in Perenjori, Western
Australia valued at $1.6m. The second is a 67% participation interest in the construction of a 10MW
solar farm in Goulburn, New South Wales and a two-year operation and maintenance contract for Gullen
Solar Pty Ltd valued at $19.2m.
Under the joint venture agreements entered into in 2016, Decmil Australia Pty Ltd has the respective
participation interests stated above, which reflects its percentage share of assets, distribution of funds
and percentage liability for costs and expenses incurred by the joint arrangement (whether by way of
return of capital or distribution of surplus funds). Those participation interests are supported by cross
indemnities from Decmil and its joint venture partner. Decmil Australia Pty Ltd has voting rights in each
joint arrangement, which generally require unanimity on most decisions save for certain urgent matters
that only require a majority.
Each of the arrangements described above are unincorporated entities and are classified as joint
operations. Accordingly, Decmil Australia Pty Ltd’s interests in the assets, liabilities, revenues and
expenses attributable to the joint arrangement have been included in the appropriate line items in the
consolidated financial statements.
The consolidated entity’s share of assets employed, liabilities owing and net results of Decmil Balance
JV that are included in the consolidated financial statements are as follows:
2018 2017
$000 $000
CURRENT ASSETS
Cash and cash equivalents 6 499
Other assets 742 1,955
TOTAL CURRENT ASSETS 748 2,454
TOTAL ASSETS 748 2,454
CURRENT LIABILITIES
Trade and other payables 417 1,898
TOTAL CURRENT LIABILITIES 417 1,898
TOTAL LIABILITES 417 1,898
Revenue 570 12,957
Expenses (892) (12,162)
Profit/(loss) for the year (322) 795
Contingent Liabilities in Respect of Joint Arrangements
The consolidated entity is liable for the following contingent liabilities owing from its participation interests
in the joint arrangements if and when they arise:
2018 2017
$000 $000
Guarantees given for satisfactory contract performance 4,677 18,757

Notes to the Financial Statements FOR THE YEAR ENDED 30 JUNE 2018
NOTE 17: Property, Plant and Equipment
Consolidated Entity
2018 2017
$000 $000
LAND AND BUILDING (Secured)
Freehold land, at cost 554 554
Building:
At cost - 216
Accumulated depreciation - (22)
554 748
PLANT AND EQUIPMENT
Plant and Equipment:
At cost 40,352 42,145
Accumulated depreciation (33,944) (32,973)
6,408 9,172
Leased Plant and Equipment (Secured) 1,427 1,221
Accumulated depreciation (824) (716)
603 505
Total Property, Plant and Equipment 7,565 10,425
Movements in Carrying Amounts
Movement in the carrying amounts for each class of property, plant and equipment between the
beginning and the end of the current financial year:
Land and Building
$000
Owned Plant and Equipment
$000
Leased Plant and Equipment
$000 Total $000
Balance at 1 July 2017 748 9,172 505 10,425
Additions - 1,768 207 1,975
Transfer between categories (192) 192 - -
Disposals - (388) - (388)
Disposals on divestment of subsidiary - (1,433) - (1,433)
Depreciation expense (2) (2,903) (109) (3,014)
Balance at 30 June 2018 554 6,408 603 7,565
Land and Building
$000
Owned Plant and Equipment
$000
Leased Plant and Equipment
$000 Total $000
Balance at 1 July 2016 24,232 13,180 341 37,753
Additions 222 994 353 1,569
Transfer between leased and owned - 109 (109) -
Disposals (23,189) (257) - (23,446)
Depreciation expense (517) (4,854) (80) (5,451)
Balance at 30 June 2017 748 9,172 505 10,425
On 23 June 2017, a commercial building located at 20 Parkland Road, Osborne Park, Western Australia
was sold for $27.5 million. The written down value at the date of sale was $23.189 million. The profit
recognised on sale was $2.213 million net of selling costs.

Notes to the Financial Statements FOR THE YEAR ENDED 30 JUNE 2018
NOTE 18: Investment Property
Consolidated Entity
2018 2017
$000 $000
Balance at beginning of year 92,400 111,032
Additions 10 131
Fair value adjustment - (18,763)
Balance at the end of the year 92,410 92,400
The investment property comprises the Homeground Gladstone Accommodation Village located in
Gladstone, Queensland. The investment property is carried at fair value, with fair value being determined
using a discounted cash flow valuation model based on assumptions made by the consolidated entity as
detailed in note 33.
NOTE 19: Intangible Assets
Consolidated Entity
2018 2017
$000 $000
Goodwill at cost 75,482 86,169
Goodwill written off - (10,687)
75,482 75,482
Customer contracts, at cost - 176
Accumulated amortisation - (176)
- -
Total intangible assets 75,482 75,482
Movements in Carrying Amounts
Goodwill
Balance at the beginning of the year 75,482 86,169
Goodwill written off - (10,687)
Balance at the end of the year 75,482 75,482
Customer Contracts
Balance at the beginning of the year - 176
Amortisation - (176)
Balance at the end of the year - -
Allocation of Goodwill to CGU’s
Construction & Engineering 75,482 -
Decmil Australia Pty Ltd - 69,343
Cut and Fill Pty Ltd - 4,422
Scope Australia Pty Ltd - 1,717
Balance at the end of the year 75,482 75,482

Notes to the Financial Statements FOR THE YEAR ENDED 30 JUNE 2018
NOTE 19: Intangible Assets (Cont’d)
The recoverable amount of the consolidated entity's goodwill has been determined by value-in-use
calculations using discounted cash flow models, based on a 1-year budget approved by the Board and
extrapolated for a further 4 years using a steady rate, together with a terminal value.
During the year residual goodwill values associated with Scope Australia and Decmil Southern (formerly
Cut and Fill) were amalgamated with the goodwill of Decmil Australia as certain activities and operations
of these businesses was integrated into Decmil’s principal construction and engineering business unit.
Key assumptions are those to which the recoverable amount of an asset or cash-generating units is
most sensitive.
The following key assumptions were used in the discounted cash flow model for each cash-generating
unit:
a. 12.9% (2017: 12.9%) pre-tax discount rate;
b. 5% (2017: 5%) per annum projected revenue growth rate;
c. 2.5% (2017: 2.5%) per annum increase in operating costs and overheads; and
d. 2.5% (2017: 2.5%) per annum increase in terminal value.
The discount rate of 12.9% pre-tax reflects management’s estimate of the time value of money and the
consolidated entity’s weighted average cost of capital, the risk free rate and the volatility of the share
price relative to market movements.
Management believes the projected 5% revenue growth rate and 2.5% increase in operating costs and
overheads is justified based on past experience and current market outlook. Management also believes
that a 2.5% increase in the terminal value of each cash-generating unit is prudent and appropriate based
on current market conditions.
At the date of this report there has been no reason to adjust these assumptions.
Sensitivity
As disclosed above, the directors have made judgements and estimates in respect of impairment testing
of goodwill. Should these judgements and estimates not occur the resulting goodwill carrying amount
may decrease. The sensitivities are as follows:
a. Revenue for Decmil Australia Pty Ltd would need to decrease by more than 6.2% before goodwill
would need to be impaired, with all other assumptions remaining constant.
b. Overheads for Decmil Australia Pty Ltd would need to increase by more than 17.1% before
goodwill would need to be impaired, with all other assumptions remaining constant.
Management believes that other reasonable changes in the key assumptions on which the recoverable
amount of each cash-generating unit’s goodwill is based would not cause the carrying amount to exceed
its recoverable amount.
NOTE 20: Other Current Assets
Consolidated Entity
2018 2017
Note $000 $000
CURRENT
Prepayments 1,170 1,258
Others 7,391 4,458
8,561 5,716

Notes to the Financial Statements FOR THE YEAR ENDED 30 JUNE 2018
NOTE 21: Trade and Other Payables
Consolidated Entity
2018 2017
Note $000 $000
CURRENT
Unsecured Liabilities
Trade payables 33,620 24,817
Advance billings to customers 14 7,816 11,513
Sundry payables and accrued expenses 46,787 23,828
88,223 60,158
NOTE 22: Current Income Tax
Consolidated Entity
2018 2017
Note $000 $000
Current tax payable
- provision for income tax 1,596 49
1,596 49
NOTE 23: Borrowings
Consolidated Entity
2018 2017
$000 $000
CURRENT
Secured liabilities
Hire purchase liability 214 107
Insurance premium funding 161 186
Software subscription funding 12 57
Total current borrowings 387 350
NON-CURRENT
Secured liabilities
Hire purchase liability 472 474
Total non-current borrowings 472 474
Total Borrowings 859 824
Hire purchase agreements have an average term of 5 years. The average interest rate implicit in the hire
purchase is 4.51% (2017: 4.54%). The hire purchase liability is secured by a charge over the underlying
hire purchase assets.

Notes to the Financial Statements FOR THE YEAR ENDED 30 JUNE 2018
NOTE 24: Other Deferred Tax
Consolidated Entity
1 July 2017
Opening Balance
$000
Under- provision in Prior
Year $000
Disposed on Disposal
of Subsidiary
$000
Charged to Income
$000
Charged Directly to
Equity $000
30 June 2018
Closing Balance
$000
2018
Deferred tax assets on:
Transaction costs on equity issue
7 - - 4 (3) 8
Provisions – employee benefits 1,578 315 (312) 555 - 2,136
Restructuring costs - - - - - -
Investment due diligence costs 12 - - (7) - 5
Other provisions and accruals 843 (490) - 111 - 464
Tax losses and carry forward tax credits
12,630 139 - 3,477 - 16,246
Property, plant and equipment 12,028 (417) (1) (1,307) - 10,303
Research and development tax offset (non-refundable)
1,595 - - (428) - 1,167
Total deferred tax assets 28,693 (453) (313) 2,405 (3) 30,329
Deferred tax liabilities on:
Prepayments (17) 98 - (64) - 17
Equity based payments 333 - - 212 (93) 452
Accrued income - - - 75 - 75
Total deferred tax liabilities 316 98 - 223 (93) 544
Consolidated Entity
1 July 2016
Opening Balance
$000
Under- provision in Prior
Year $000
Disposed on Disposal
of Subsidiary
$000
Charged to Income
$000
Charged Directly to
Equity $000
30 June 2017
Closing Balance
$000
2017
Deferred tax assets on:
Transaction costs on equity issue
6 - - - 1 7
Provisions – employee benefits 1,949 - - (371) - 1,578
Restructuring costs 4 - - (4) - -
Investment due diligence costs 34 - - (22) - 12
Other provisions and accruals 430 332 - 81 - 843
Tax losses and carry forward tax credits
9,130 (276) - 3,776 - 12,630
Property, plant and equipment 7,281 113 - 4,634 - 12,028
Research and development tax offset (non-refundable)
703 - - 892 - 1,595
Total deferred tax assets 19,537 169 - 8,986 1 28,693
Deferred tax liabilities on:
Prepayments - - - (17) - (17)
Equity based payments - - - 287 46 333
Total deferred tax liabilities - - - 270 46 316

Notes to the Financial Statements FOR THE YEAR ENDED 30 JUNE 2018
NOTE 25: Provisions
Consolidated Entity
2018 2017
Note $000 $000
CURRENT
Employee entitlements 25a 5,623 3,931
Onerous lease - 86
Total current provisions 5,623 4,017
NON CURRENT
Employee entitlements 25a 498 1,125
Onerous lease - -
Total non-current provisions 498 1,125
Total Provisions 6,121 5,142
(a) Provision for Employee Entitlements
Provision for employee benefits represents amounts accrued for annual leave and long service leave.
The current portion for this provision includes the total amount accrued for annual leave entitlements and
the amounts accrued for long service leave entitlements that have vested due to employees having
completed the required period of service. Based on past experience, the consolidated entity does not
expect the full amount of annual leave or long service leave balances classified as current liabilities to be
settled within the next 12 months. However, these amounts must be classified as current liabilities since
the consolidated entity does not have an unconditional right to defer the settlement of these amounts in
the event employees wish to use their leave entitlement.
The non-current portion for this provision includes amounts accrued for long service leave entitlements
that have not yet vested in relation to those employees who have not yet completed the required period
of service.
Consolidated Entity
2018 2017
Note $000 $000
Movement in provision
Balance at beginning of year 5,056 5,722
Additional provision 6,169 6,162
Disposals through disposal of controlled entity (740) -
Amounts used (4,364) (6,828)
Balance at the end of the year 6,121 5,056

Notes to the Financial Statements FOR THE YEAR ENDED 30 JUNE 2018
NOTE 26: Issued Capital
Consolidated Entity
2018 2017
$000 $000
173,811,927 (2017: 171,736,697) fully paid ordinary shares 165,832 163,384
(a) Ordinary Shares
2018 2017
No. $000 No. $000
At the beginning of reporting period 171,736,697 163,384 169,892,219 162,254
Shares issued during the year 213,490 118 124,478 54
Options exercised during the year - - - -
Issue of retention shares 1,577,500 - 1,470,000 -
Performance rights converted to shares
284,240 - 250,000 -
Equity based payments - 2,248 - 1,030
Transaction costs of issue/buy-back - 82 - 46
At the end of the reporting date 173,811,927 165,832 171,736,697 163,384
Ordinary shares participate in dividends and the proceeds on winding up of the parent entity in
proportion to the number of shares held. At the shareholders meetings each ordinary share is entitled to
one vote when a poll is called, otherwise each shareholder has one vote on a show of hands.
During the year ended 30 June 2017, the Decmil Group Limited Employee Share Plan Trust was
established. In November 2016, 1,470,000 ordinary shares were issued into the trust on an allocated
basis for 58 employees. In October 2017, a further 1,577,500 ordinary shares were issued into the trust
on an allocated basis for 80 employees. These ordinary shares will vest to employees after two years of
continuous employment from the date of grant.
Also, during the year ended 30 June 2018, 213,490 shares were issued under the Decmil Employee
Share Purchase Plan. Under this plan, employees who purchased up to $1,000 of shares had those
shares matched by the Company. The matched shares are subject to a trade restriction until the earlier
of three years or cessation of employment with the Company.
In addition to the above share issues, 284,240 shares were issued to executives upon vesting of
performance rights during the year ended 30 June 2018.
(b) Capital Management
Management controls the capital of the consolidated entity in order to maintain an optimal debt to equity
ratio, provide shareholders with adequate returns and ensure that the consolidated entity can fund its
operations and continue as a going concern. The consolidated entity’s debt and capital includes ordinary
share capital and financial liabilities (including bank guarantee and surety bonding facilities), supported
by financial assets.
Management manages the consolidated entity’s capital by assessing the consolidated entity’s financial
risks and adjusting its capital structure in response to changes in these risks and in the market. This
includes the management of debt levels, distributions to shareholders and the requirement for further
equity funding in the consolidated entity. The deployment of capital to the consolidated entity’s assets
and business units is also reviewed regularly and managed to ensure rates of return continue to be at an
acceptable level. Where necessary, management may consider redeploying capital within the
consolidated entity or alternatively returning capital to shareholders.

Notes to the Financial Statements FOR THE YEAR ENDED 30 JUNE 2018
NOTE 27: Commitments
Consolidated Entity
2018 2017
Note $000 $000
(a) Hire Purchase Commitments1
Payable – minimum HP payments
Not later than 1 year 242 131
Between 1 and 5 years 512 515
Minimum HP payments 754 646
Less future finance charges (68) (65)
Present value of minimum HP payments 686 581
(b) Insurance Premium Funding Commitments
Payable – minimum payments
Not later than 1 year 161 188
Minimum payments 161 188
Less future finance charges (2) (2)
Present value of minimum payments 159 186
(c) Software Subscription Funding Commitments
Payable – minimum payments
Not later than 1 year 12 61
Minimum payments 12 61
Less future finance charges - (4)
Present value of minimum payments 12 57
(d) Operating Leases Payable
Non-cancellable operating leases contracted for but not recognised as liabilities
Payable – minimum lease payments
Not later than 1 year 2,683 3,380
Between 1 and 5 years 8,028 8,393
More than 5 years 1,176 1,176
11,887 12,949
(e) Operating Leases Receivable
Future minimum rentals receivable for operating leases at the end of the reporting period but not recognised as assets
Receivable – minimum lease receipts
Not later than 1 year 128 167
Between 1 and 5 years 132 642
260 809
1 Hire purchase commitments include contracted amounts for various plant and equipment with a written down value of $603,252 (2017: $505,770)
secured under hire purchase contracts expiring within one to five years. Under the terms of the hire purchase contracts, the consolidated entity has the option to acquire the assets under finance for predetermined residual values on the expiry of the contracts.

Notes to the Financial Statements FOR THE YEAR ENDED 30 JUNE 2018
NOTE 28: Segment Reporting
The consolidated entity has identified its operating segments based on the internal reports that are
reviewed and used by the Board of Directors (chief operating decision makers) in assessing
performance and determining the allocation of resources.
The consolidated entity operates as three segments.
1. Construction and Engineering
▪ Decmil Australia Pty Ltd – multi-discipline design, civil engineering and construction services;
▪ Eastcoast Development Engineering Pty Ltd – fabrication and installation of high pressure pipes,
vessels and tanks;
▪ Decmil PNG Limited – construction arm of Decmil located in Papua New Guinea;
▪ Decmil Engineering Pty Ltd – civil construction including roads and bridges primarily for the
Government sector;
▪ Decmil Construction NZ Limited – construction arm of Decmil located in New Zealand;
▪ Decmil Southern Pty Ltd (formerly Cut and Fill Pty Ltd) – civil engineering company focussed on civil
infrastructure works across the South Eastern seaboard of Australia; and
▪ Scope Australia Pty Ltd – discontinued business specialising in the delivery of study, project
management, engineering and design consultancy services to the mining, resources, government
and construction sectors.
2. Accommodation
▪ Homeground Villages Pty Ltd – build-own-operation of the Homeground Gladstone Accommodation
Village located in Gladstone, Queensland.
3. Other
▪ Decmil Properties Pty Ltd – former owner and manager of a commercial office building located at 20
Parkland Road, Osborne Park, Western Australia which derived internal and external revenue;
▪ SC Services Pty Ltd – discontinued business specialising in the design, installation, commissioning
and maintenance services to telecommunications network owners, manufacturers and NBN service
providers; and
▪ Decmil Telecom Pty Ltd trading as SAS Telecom – the discontinued mining communications and
managed services business.
The consolidated entity is domiciled in Australia. 86% of revenue from external customers is generated
from Australia.
The consolidated entity derives 26%, 20% and 14% (2017: 14%, 10% and 10%) of its revenues from the
top three external customers. All of the consolidated entity’s assets are located in Australia.
Basis of accounting for purposes of reporting by operating segments
a. Accounting policies adopted
Unless stated otherwise, all amounts reported to the chief operating decision makers with
respect to operating segments, are determined in accordance with accounting policies that are
consistent with those adopted in the annual financial statements of the consolidated entity
b. Intersegment transactions
Corporate charges are allocated to reporting segments based on the segments’ overall
proportion of revenue generation within the consolidated entity. Management believes this is
representative of likely consumption of head office expenditure that should be used in assessing
segment performance and cost recoveries.
c. Segment assets
Where an asset is used across multiple segments, the asset is allocated to the segment that
receives the majority of the economic value from the asset. In most instances, segment assets
are clearly identifiable on the basis of their nature and physical location.

Notes to the Financial Statements FOR THE YEAR ENDED 30 JUNE 2018
NOTE 28: Segment Reporting (Cont’d)
d. Segment liabilities
Liabilities are allocated to segments where there is a direct nexus between the incurrence of the
liability and the operations of the segment. Tax liabilities are generally considered to relate to the
consolidated entity as a whole and are not allocated. Segment liabilities include trade and other
payables and certain direct borrowings.
e. Unallocated items
The following items of revenue, expenses, assets and liabilities are not allocated to operating
segments as they are not considered part of the core operations of any segment:
▪ income tax expense;
▪ deferred tax assets and liabilities; and
▪ current tax liabilities.
(a) Segment Performance 2018
Construction & Engineering
$000 Accommodation
$000 Other $000
Total $000
External sales 336,622 5,952 6,681 349,255
Total segment revenue 336,622 5,952 6,681 349,255
Segment earnings before interest, tax, depreciation and amortisation & impairments
5,463 (693) (6,109) (1,339)
Net interest (1,418) (20) (24) (1,462)
Depreciation & amortisation expense (2,396) (504) (114) (3,014)
Impairment of intangible assets - - - -
Investment property fair value adjustment
- - - -
Segment result 1,649 (1,217) (6,247) (5,815)
Other unallocated expenses (384)
Income tax benefit 68
Loss for the period (6,131)
Segment Performance 2017
Construction & Engineering
$000 Accommodation
$000 Other $000
Total $000
External sales 263,584 14,486 27,054 305,124
Total segment revenue 263,584 14,486 27,054 305,124
Segment earnings before interest, tax, depreciation, amortisation & impairments
(2,783) 3,298 (1,563) (1,048)
Net interest (839) (45) (366) (1,250)
Depreciation & amortisation expense (3,738) (1,024) (866) (5,628)
Impairment of intangible assets - - (10,687) (10,687)
Investment property fair value adjustment
- (18,763) - (18,763)
Segment result (7,360) (16,534) (13,482) (37,376)
Other unallocated expenses (741)
Income tax benefit 9,770
Loss for the period (28,347)

Notes to the Financial Statements FOR THE YEAR ENDED 30 JUNE 2018
NOTE 28: Segment Reporting (Cont’d)
(b) Segment Assets 2018
Construction & Engineering
$000 Accommodation
$000 Other $000
Total $000
Current assets 94,973 1,162 386 96,521
Non-current assets 81,284 92,795 - 174,079
Other unallocated assets 33,056
Total segment assets 176,257 93,957 386 303,656
Total assets includes:
Acquisition of non-current assets 1,841 198 66 2,105
Segment Assets 2017
Construction & Engineering
$000 Accommodation
$000 Other $000
Total $000
Current assets 57,515 1,732 9,612 68,859
Non-current assets 82,497 93,240 1,698 177,435
Other unallocated assets 30,191
Total segment assets 140,012 94,972 11,310 276,485
Total assets includes:
Acquisition of non-current assets 849 314 537 1,700
(c) Segment Liabilities 2018
Construction & Engineering
$000 Accommodation
$000 Other $000
Total $000
Current liabilities 90,545 1,132 - 91,677
Non-current liabilities 863 - - 863
Other unallocated liabilities 4,803
Total segment liabilities 91,408 1,132 - 97,343
Segment Liabilities 2017
Construction & Engineering
$000 Accommodation
$000 Other $000
Total $000
Current liabilities 56,734 1,200 5,017 62,951
Non-current liabilities 1,093 - - 1,093
Other unallocated liabilities 2,445
Total segment liabilities 57,827 1,200 5,017 66,489

Notes to the Financial Statements FOR THE YEAR ENDED 30 JUNE 2018
NOTE 29: Cash Flow Information
(a) Reconciliation of Cash Flow from Operations with (Loss)/Profit after Income Tax
Consolidated Entity
2018 2017
$000 $000
Loss after income tax (6,131) (28,347)
Adjustments for:
Depreciation and amortisation 3,014 5,627
Equity based payments 2,248 1,030
Impairment of investment property - 18,763
Impairment of intangible assets - 10,687
(Profit)/loss on sale of non-current assets 126 (2,615)
Loss on disposal of subsidiaries 3,438 -
Bad debts written off 399 -
Cash generated from operations before working capital changes 3,094 5,145
Changes in assets and liabilities
Trade receivables (9,969) (5,433)
Other assets (2,802) 2,215
Work in progress (20,860) 3,932
Trade payables and accruals 29,468 (3,133)
Current tax liabilities 1,547 722
Deferred tax assets (1,948) (9,859)
Deferred tax liabilities 228 316
Provisions 1,869 (857)
Change in working capital balances (2,467) (12,097)
Net cash generated from/(used in) operating activities 627 (6,952)

Notes to the Financial Statements FOR THE YEAR ENDED 30 JUNE 2018
NOTE 29: Cash Flow Information (Cont’d)
(b) Disposal of Entities
(i) On 1 November 2017, SC Holdings Pty Ltd and its subsidiaries SC Services Pty Ltd and SC
Equipment Holdings Pty Ltd were divested.
Goodwill associated with the SC Holdings entities amounting to $10,687,000 was previously
impaired at 30 June 2017.
The divestment excluded pre-completion cash and accounts receivable balances, which accrued to
the benefit of Decmil.
Residual net assets (excluding pre-completion cash and accounts receivable) were divested for a
consideration of $919,055.
Fair Value
$000
Sale consideration 919
Less: deferred consideration -
Cash inflow on disposal 919
Assets and liabilities held at disposal date:
Work in progress 3,892
Plant and equipment 1,361
Deferred tax assets 221
Payables & accruals (1,133)
Provisions (653)
3,688
Loss on disposal (2,769)
Sale consideration 919
(ii) On 1 November 2017, residual components of Scope Australia Pty Ltd were divested.
Fair Value
$000
Assets and liabilities held at disposal date:
Receivables 848
Plant and equipment 72
Deferred tax assets 92
Payables & accruals (106)
Provisions (237)
669
Loss on disposal (669)
Sale consideration -
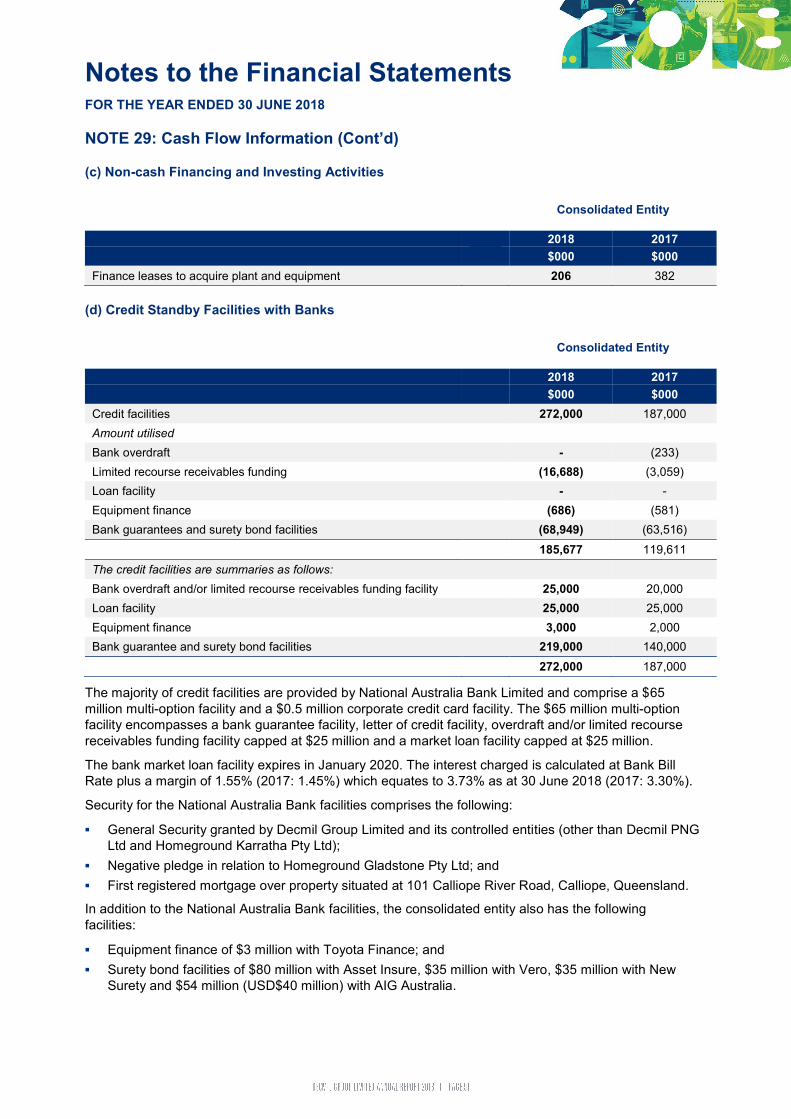
Notes to the Financial Statements FOR THE YEAR ENDED 30 JUNE 2018
NOTE 29: Cash Flow Information (Cont’d)
(c) Non-cash Financing and Investing Activities
Consolidated Entity
2018 2017
$000 $000
Finance leases to acquire plant and equipment 206 382
(d) Credit Standby Facilities with Banks
Consolidated Entity
2018 2017
$000 $000
Credit facilities 272,000 187,000
Amount utilised
Bank overdraft - (233)
Limited recourse receivables funding (16,688) (3,059)
Loan facility - -
Equipment finance (686) (581)
Bank guarantees and surety bond facilities (68,949) (63,516)
185,677 119,611
The credit facilities are summaries as follows:
Bank overdraft and/or limited recourse receivables funding facility 25,000 20,000
Loan facility 25,000 25,000
Equipment finance 3,000 2,000
Bank guarantee and surety bond facilities 219,000 140,000
272,000 187,000
The majority of credit facilities are provided by National Australia Bank Limited and comprise a $65
million multi-option facility and a $0.5 million corporate credit card facility. The $65 million multi-option
facility encompasses a bank guarantee facility, letter of credit facility, overdraft and/or limited recourse
receivables funding facility capped at $25 million and a market loan facility capped at $25 million.
The bank market loan facility expires in January 2020. The interest charged is calculated at Bank Bill
Rate plus a margin of 1.55% (2017: 1.45%) which equates to 3.73% as at 30 June 2018 (2017: 3.30%).
Security for the National Australia Bank facilities comprises the following:
▪ General Security granted by Decmil Group Limited and its controlled entities (other than Decmil PNG
Ltd and Homeground Karratha Pty Ltd);
▪ Negative pledge in relation to Homeground Gladstone Pty Ltd; and
▪ First registered mortgage over property situated at 101 Calliope River Road, Calliope, Queensland.
In addition to the National Australia Bank facilities, the consolidated entity also has the following
facilities:
▪ Equipment finance of $3 million with Toyota Finance; and
▪ Surety bond facilities of $80 million with Asset Insure, $35 million with Vero, $35 million with New
Surety and $54 million (USD$40 million) with AIG Australia.
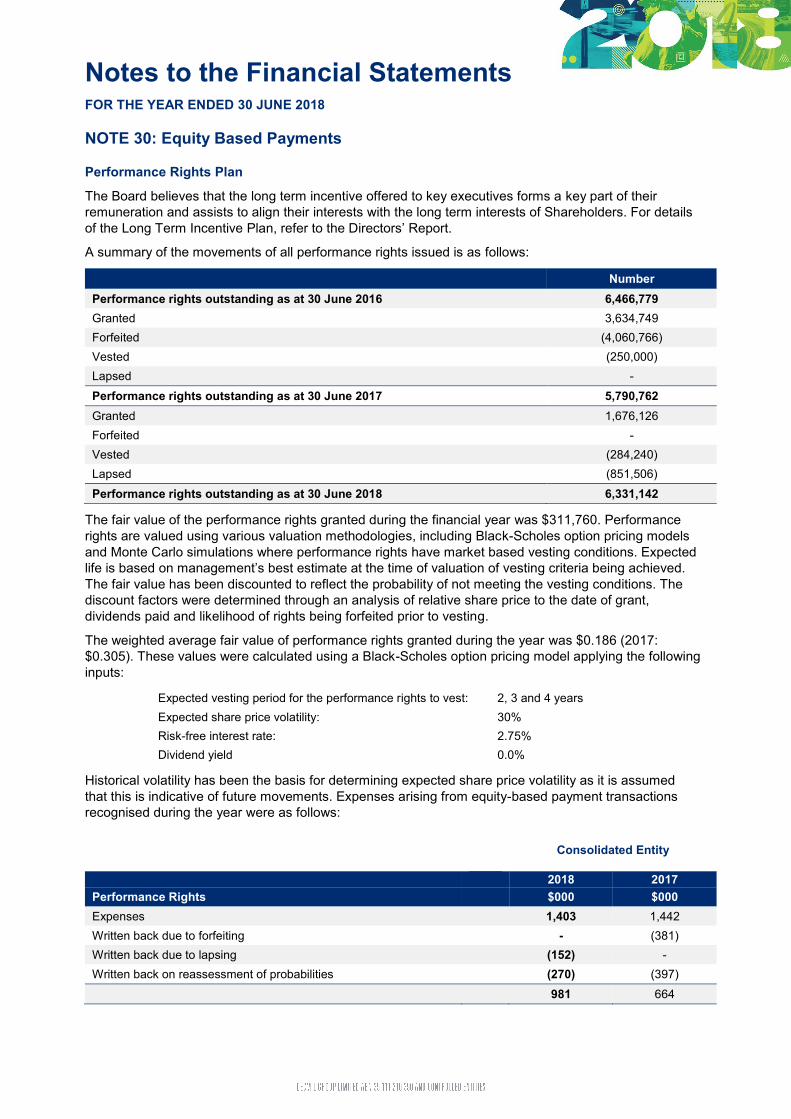
Notes to the Financial Statements FOR THE YEAR ENDED 30 JUNE 2018
NOTE 30: Equity Based Payments
Performance Rights Plan
The Board believes that the long term incentive offered to key executives forms a key part of their
remuneration and assists to align their interests with the long term interests of Shareholders. For details
of the Long Term Incentive Plan, refer to the Directors’ Report.
A summary of the movements of all performance rights issued is as follows:
Number
Performance rights outstanding as at 30 June 2016 6,466,779
Granted 3,634,749
Forfeited (4,060,766)
Vested (250,000)
Lapsed -
Performance rights outstanding as at 30 June 2017 5,790,762
Granted 1,676,126
Forfeited -
Vested (284,240)
Lapsed (851,506)
Performance rights outstanding as at 30 June 2018 6,331,142
The fair value of the performance rights granted during the financial year was $311,760. Performance
rights are valued using various valuation methodologies, including Black-Scholes option pricing models
and Monte Carlo simulations where performance rights have market based vesting conditions. Expected
life is based on management’s best estimate at the time of valuation of vesting criteria being achieved.
The fair value has been discounted to reflect the probability of not meeting the vesting conditions. The
discount factors were determined through an analysis of relative share price to the date of grant,
dividends paid and likelihood of rights being forfeited prior to vesting.
The weighted average fair value of performance rights granted during the year was $0.186 (2017:
$0.305). These values were calculated using a Black-Scholes option pricing model applying the following
inputs:
Expected vesting period for the performance rights to vest: 2, 3 and 4 years
Expected share price volatility: 30%
Risk-free interest rate: 2.75%
Dividend yield 0.0%
Historical volatility has been the basis for determining expected share price volatility as it is assumed
that this is indicative of future movements. Expenses arising from equity-based payment transactions
recognised during the year were as follows:
Consolidated Entity
2018 2017
Performance Rights $000 $000
Expenses 1,403 1,442
Written back due to forfeiting - (381)
Written back due to lapsing (152) -
Written back on reassessment of probabilities (270) (397)
981 664

Notes to the Financial Statements FOR THE YEAR ENDED 30 JUNE 2018
NOTE 30: Equity Based Payments (Cont’d)
Incentive Shares Plan
During the year the Board approved an Incentive Shares Plan whereby ordinary shares are issued into
the Decmil Group Limited Employee Share Plan Trust on an allocated basis for employees. These
ordinary shares will vest to employees after two years of continuous employment from the date of grant.
In the event an employee resigns or Decmil terminates their employment due to misconduct or
performance related reasons prior to vesting, the shares are forfeited.
A summary of the movements of all incentive shares issued is as follows:
Number
Unvested incentive shares as at 30 June 2016 -
Granted 1,475,000
Forfeited (105,000)
Unvested incentive shares as at 30 June 2017 1,370,000
Granted 1,762,500
Vested (165,000)
Forfeited (412,500)
Unvested incentive shares as at 30 June 2018 2,555,000
The fair value of the incentive shares granted during the financial year was $1,478,906. Incentive shares
are valued using the share price at the date of grant. The fair value has been discounted by 25% to
reflect the probability of not meeting the continuous employment vesting condition.
During the year ended 30 June 2018 the Board used their discretion to vest incentive securities totalling
165,000 to staff who were employed by the SC Services and Scope Australia business units which were
discontinued during the financial year.
Expenses arising from the incentive shares plan transactions recognised during the year were as
follows:
Consolidated Entity
2018 2017
Incentive Shares $000 $000
Expenses 1,441 387
Written back due to forfeiting (174) (21)
1,267 366

Notes to the Financial Statements FOR THE YEAR ENDED 30 JUNE 2018
NOTE 31: Related Party Transactions and Balances
Parent entity
Decmil Group Limited is the parent entity.
Controlled entities
Interests in controlled entities are set out in note 15.
Key management personnel
Disclosures relating to KMP are set out in note 7 and the Remuneration Report in the Directors' Report.
Transactions with related parties
The following transactions occurred with related parties:
Consolidated Entity
2018 2017
$000 $000
(a) Director Related Transactions
Rent of various properties used by Decmil Australia Pty Ltd paid to Broadway Pty Ltd, an entity in which Mr Denis Criddle has a beneficial interest
190 196
Consulting fees for Saxelby Associates Pty Ltd, an entity in which Mr David Saxelby has a beneficial interest
200 200
(b) Director Related Balances1
Amounts owing to Saxelby Associates Pty Ltd, an entity in which Mr David Saxelby has a beneficial interest, for directors’ fees and consulting fees
27 23
1 Transactions relating to directors’ fees are included in the Directors’ Report details of remuneration

Notes to the Financial Statements FOR THE YEAR ENDED 30 JUNE 2018
NOTE 32: Financial Instruments
The consolidated entity’s financial instruments consist mainly of deposits with banks, accounts
receivable and payable and borrowings.
The only derivatives used by the consolidated entity relate to forward foreign exchange contracts in
relation to offshore procurement. The consolidated entity does not speculate in the trading of derivative
instruments.
(i) Financial Risk Management Policies
The Chief Financial Officer and other senior finance executives regularly analyse financial risk exposure
and evaluate treasury management strategies in the context of the most recent economic conditions and
forecasts.
The overall risk management strategy seeks to assist the consolidated entity in meeting its financial
targets, whilst minimising potential adverse effects on financial performance.
Treasury functions are performed in accordance with policies approved by the Board of Directors. Risk
management policies are approved and reviewed by the Board on a regular basis.
(ii) Specific Financial Risk Exposures and Management
The main risks the consolidated entity is exposed to through its financial instruments are interest rate
risk, liquidity risk, credit risk, price risk and foreign exchange risk.
Interest rate risk
Exposure to interest rate risk arises on financial assets and liabilities recognised at the end of the
reporting period whereby a future change in interest rates will affect future cash flows.
Liquidity risk
The consolidated entity manages liquidity risk by monitoring forecast cash flows and ensuring that
adequate unutilised borrowing facilities are maintained.
Credit risk
The maximum exposure to credit risk, at balance date to recognise financial assets, is the carrying
amount, net of any provisions for impairment of those assets, as disclosed in the statement of financial
position and notes to the financial statements.
There are no material amounts of collateral held as security at 30 June 2018.
In respect of the parent entity, credit risk also incorporates the exposure of Decmil Group Limited to the
liabilities of all the parties to the deed of cross guarantee. Credit risk is managed on a consolidated basis
and reviewed regularly by finance executives and the Board. It arises from exposures to customers as
well as through deposits with financial institutions. The consolidated entity does not have any material
credit risk exposure to any single receivable or group of receivables under financial instruments entered
into by the consolidated entity.
Price risk
The consolidated entity is exposed to price risks associated with labour costs and to a lesser extent, fuel
and steel prices. Wherever possible, the consolidated entity contracts out such exposures or allows for
the rise and fall for changes in prices or provides sufficient contingencies to cover for such price risks.

Notes to the Financial Statements FOR THE YEAR ENDED 30 JUNE 2018
NOTE 32: Financial Instruments (Cont’d)
Foreign exchange risk
Exposure to foreign exchange risk may result in the fair value or future cash flows of a financial
instrument fluctuating due to movement in foreign exchange rates of currencies in which the
consolidated entity holds financial instruments which are other than the Australian Dollar (AUD)
functional currency of the consolidated entity. This risk is managed predominantly through forward
foreign exchange contracts.
(iii) Financial instrument composition and maturity analysis:
The tables below reflect the undiscounted contractual settlement terms for financial instruments of a
fixed period of maturity, as well as management’s expectations of the settlement period for all other
financial instruments. As such, the amounts may not reconcile to the statement of financial position.
Weighted Average Effective Interest
Rate %
Non-Interest Bearing
$000
Within
1 year
$000
1 to 5
Years
$000
Carrying Amount
$000
2018
Financial Assets
Cash and cash equivalents 1.5 - 16,755 - 16,755
Receivables - 43,672 - - 43,672
43,672 16,755 - 60,427
Financial Liabilities
Payables - (88,223) - - (88,223)
Borrowings 3.9 - (387) (472) (859)
(88,223) (387) (472) (89,082)
2017
Financial Assets
Cash and cash equivalents 1.5 - 16,905 - 16,905
Receivables - 34,950 - - 34,950
34,950 16,905 - 51,855
Financial Liabilities
Payables - (60,158) - - (60,158)
Borrowings 3.6 - (350) (474) (824)
(60,158) (350) (474) (60,982)
The cash flows in the maturity analysis above are not expected to occur significantly earlier than
contractually disclosed above.
(iv) Net Fair Values of financial instruments
Unless otherwise stated, the carrying amount of financial instruments reflect their fair value.

Notes to the Financial Statements FOR THE YEAR ENDED 30 JUNE 2018
NOTE 32: Financial Instruments (Cont’d)
(v) Sensitivity Analysis
Interest Rate Risk and Price Risk
The consolidated entity has performed sensitivity analysis relating to its exposure to interest rate risk,
price risk and foreign exchange risk at balance date. This sensitivity analysis demonstrates the effect on
the current year results and equity which could result from a change in these risks.
Interest Rate Sensitivity Analysis
The consolidated entity’s cash and cash equivalents and borrowings are subject to interest rate
sensitivities. At 30 June 2018, the effect on profit and equity as a result of changes in the interest rate,
with all other variables remaining constant is immaterial.
Price Risk Sensitivity Analysis
At 30 June 2018, the effect on profit and equity as a result of changes in the price risk, with all other
variables remaining constant would be as follows:
Consolidated Entity
2018 2017
$000 $000
Change in profit
Increase in labour costs by 5% (CPI assumption) (3,666) (3,557)
Change in equity
Increase in labour costs by 5% (CPI assumption) (3,666) (3,557)
In the opinion of the consolidated entity’s management, the majority of the above increase in labour cost,
had it been incurred, would have been negated by an increase in the price of services offered by the
consolidated entity.
The above sensitivity analysis has been performed on the assumption that all other variables remain
unchanged.
Foreign Exchange Sensitivity Analysis
The effect on profit and equity as a result of changes in foreign exchange rates, with all other variables
remaining constant, is immaterial.

Notes to the Financial Statements FOR THE YEAR ENDED 30 JUNE 2018
NOTE 33: Fair Value Measurement
Fair value hierarchy
The following tables detail the consolidated entity's assets measured or disclosed at fair value, using a
three level hierarchy, based on the lowest level of input that is significant to the entire fair value
measurement, being:
Level 1: Quoted prices (unadjusted) in active markets for identical assets that the consolidated entity can
access at the measurement date
Level 2: Inputs other than quoted prices included within level 1 that are observable for the asset, either
directly or indirectly
Level 3: Unobservable inputs for the asset
Level 1
$000
Level 2
$000
Level 3
$000
Total
$000
Consolidated 2018
Assets
Investment property - - 92,410 92,410
Total assets - - 92,410 92,410
Consolidated 2017
Assets
Investment property - - 92,400 92,400
Total assets - - 92,400 92,400
There were no transfers between levels during the financial year.
The carrying amounts of trade and other receivables and trade and other payables are assumed to
approximate their fair values due to their short-term nature.
Investment property has been valued using a discounted cash flow model.
Movements in level 3 assets during the current and previous financial year are set out below:
Consolidated Investment Properties
$000
Total
$000
Balance at 30 June 2016 111,032 111,032
Additions 131 131
Revaluation (18,763) (18,763)
Balance at 30 June 2017 92,400 92,400
Additions 10 10
Revaluation - -
Balance at 30 June 2018 92,410 92,410

Notes to the Financial Statements FOR THE YEAR ENDED 30 JUNE 2018
NOTE 33: Fair Value Measurement (Cont’d)
In July 2017, the Group’s investment property, being the Homeground Gladstone Accommodation
Village located near Gladstone, Queensland, was revalued by an independent valuer (Ernst & Young).
The primary valuation method utilised by the valuer was a discounted cash flow model.
Key assumptions utilised by the valuer in the preparation of its valuation included:
▪ Useful life of the asset in the range of 20 to 30 years with no terminal value;
▪ Various occupancy assumptions over the estimated useful life based on expected accommodation
demand (low of 15% to high of 98%);
▪ Room rate growth in the range of 0% to 2.0%; and
▪ A nominal post-tax discount rate range of 11.0% to 12.0%.
As a result of the independent valuation, the Homeground Gladstone investment property was revalued
to $92,400,000.
The fair value is sensitive to long term changes to key assumptions disclosed above. Any material
change within the range for any individual assumption or any combination of assumptions will likely have
a material impact on the fair value as follows:
Assumption Increase in Assumption Decrease in Assumption
Useful life Positive impact Negative impact
Occupancy Positive impact Negative impact
Room rate growth Positive impact Negative impact
Discount rate Negative impact Positive impact
NOTE 34: Contingent Liabilities
Consolidated Entity
2018 2017
$000 $000
Guarantees given to external parties for satisfactory contract performance for the consolidated entity
68,949 63,614
In or around August 2012, Steel Building Systems (SBS) was engaged as a subcontractor by Decmil
Australia Pty Ltd (“Decmil”) to construct the Gladstone Village in Queensland. SBS’ scope of work was
the design, manufacture and supply of modular buildings, as well as miscellaneous on-site works
associated with the modular buildings. On 17 November 2017, the liquidators of SBS commenced
proceedings against Decmil Australia Pty Ltd in the NSW Supreme Court for alleged unpaid contract
sums of $3.3 million and alleged lost profit on works removed from SBS’ scope of works. Decmil rejects
the claims brought by the liquidators of SBS and denies it is indebted to SBS as claimed. Decmil’s
current position is that SBS is in fact indebted to Decmil for a similar sum due to defective works and
associated rectification costs, incomplete works, overheads incurred by Decmil in connection with the
defects and rectification works, expert costs and fees. Decmil has filed a defence in relation to the
liquidator’s claims and will file a cross claim for the sum Decmil alleges it is owed by SBS.
On 1 May 2017 the Company received an advice from AusIndustry, the agency that oversees technical
elements of the Australian Tax Office’s Research and Development Inventive Scheme (“R&D Scheme”),
disputing the eligibility of certain engineering activities submitted by the Company in relation to the 2014
financial year for the R&D Scheme. R&D Scheme benefits received by the Company in relation to the
2014 financial year for the disputed engineering activities amounts to approximately $3.4 million. The
Company does not agree with the advice received from AusIndustry and under the relevant legislation
has requested an independent review of the matter. As at the date of this report, the independent review
had not been completed. The Company is also considering further review options available to it,
including submission to the Australian Administrative Tribunal.

Notes to the Financial Statements FOR THE YEAR ENDED 30 JUNE 2018
NOTE 34: Contingent Liabilities (Cont’d)
During the year ended 30 June 2017 the liquidators for Forge Group Ltd (in liquidation)(receivers and
managers appointed) commenced an action in the Supreme Court of Western Australia against
Eastcoast Development Engineering Pty Ltd (“EDE”), a subsidiary of the Company, for the repayment of
$2.5 million for what they consider constitute unfair preference payments. The liquidators have
commenced claims against a number of parties which are joined with EDE in the same action. EDE
denies that it has any liability for repayment of any sums previously paid to EDE. Decmil has filed a
defence in this matter.
Certain contractual claims arising out of engineering and construction contracts have been made by, or
against, controlled entities in the ordinary course of business. The Directors do not presently consider
the outcome of any of these claims will be materially different to the position taken in the financial
accounts of the Company.
Apart from the above there are no further contingent liabilities relating to the consolidated entity.
NOTE 35: Subsequent Events
No matters or circumstances have arisen since the end of the financial year which significantly affected
or may significantly affect the operations of the consolidated entity, the results of those operations, or the
state of affairs of the consolidated entity in future financial years.

Directors’ Declaration FOR THE YEAR ENDED 30 JUNE 2018
In the directors' opinion:
▪ the attached financial statements and notes comply with the Corporations Act 2001, the Accounting
Standards, the Corporations Regulations 2001 and other mandatory professional reporting
requirements;
▪ the attached financial statements and notes comply with International Financial Reporting Standards
as issued by the International Accounting Standards Board as described in note 1 to the financial
statements;
▪ the attached financial statements and notes give a true and fair view of the consolidated entity's
financial position as at 30 June 2018 and of its performance for the financial year ended on that date;
▪ there are reasonable grounds to believe that the Company will be able to pay its debts as and when
they become due and payable; and
▪ at the date of this declaration, there are reasonable grounds to believe that the members of the
Extended Closed Group identified in note 15(b) will be able to meet any obligations or liabilities to
which they are, or may become, subject by virtue of the deed of cross guarantee described.
The directors have been given the declarations required by section 295A of the Corporations Act 2001.
Signed in accordance with a resolution of directors made pursuant to section 295(5)(a) of the
Corporations Act 2001.
On behalf of the directors
David Saxelby Chairman
31 July 2018

INDEPENDENT AUDITOR’S REPORT To the Members of Decmil Group Limited
Opinion
We have audited the financial report of Decmil Group Limited (the Company) and its subsidiaries (the Group), which comprises the consolidated statement of financial position as at 30 June 2018, the consolidated statement of profit or loss and other comprehensive income, the consolidated statement of changes in equity and the consolidated statement of cash flows for the year then ended, and notes to the financial statements, including a summary of significant accounting policies, and the directors' declaration.
In our opinion the accompanying financial report of the Group is in accordance with the Corporations Act 2001, including:
(i) giving a true and fair view of the Group's financial position as at 30 June 2018 and of its financial performance for the year then ended; and
(ii) complying with Australian Accounting Standards and the Corporations Regulations 2001.
Basis for Opinion
We conducted our audit in accordance with Australian Auditing Standards. Our responsibilities under those
standards are further described in the Auditor's Responsibilities for the Audit of the Financial Report section of
our report. We are independent of the Group in accordance with the auditor independence requirements of the
Corporations Act 2001 and the ethical requirements of the Accounting Professional and Ethical Standards Board's
APES 110 Code of Ethics for Professional Accountants (the Code) that are relevant to our audit of the financial
report in Australia. We have also fulfilled our other ethical responsibilities in accordance with the Code.
We confirm that the independence declaration required by the Corporations Act 2001, which has been given to
the directors of the Company, would be in the same terms if given to the directors as at the time of this auditor's
report.
We believe that the audit evidence we have obtained is sufficient and appropriate to provide a basis for our
opinion.

Key Audit Matters
Key audit matters are those matters that, in our professional judgement, were of most significance in our audit of
the financial report of the current period. These matters were addressed in the context of our audit of the financial
report as a whole, and in forming our opinion thereon, and we do not provide a separate opinion on these matters.
Key Audit Matter How our audit addressed this matter
Recognition of Deferred Tax Assets
Refer to Note 24 in the financial statements
The Group has deferred tax assets of $30.329 million
relating mainly to tax losses and temporary
differences.
For the year ended 30 June 2018, management has
performed an assessment on the recoverability of
the deferred tax assets by using the Group’s forecast
for 2019 and beyond to satisfy the probability criteria
that future taxable profits will be available against
which the balance can be utilised.
Our audit procedures in relation to management’s
recognition of deferred tax assets included:
• Reviewing of the Group’s forecast for 5 years from 2019 and assessing management’s assumptions and inputs for reasonableness; and
• Assessing the recoverability of deferred tax assets, and the manner in which timing differences would be reversed and losses utilised. This was based on the same forecasts used in the intangible asset valuation model (refer below) and were therefore assessed in conjunction with our audit procedures over intangible assets.
Impairment of Intangible Assets
Refer to Note 19 in the financial statements
The Group has goodwill of $75.482 million relating to
the Construction and Engineering cash generating
unit (“CGU”) as disclosed in note 19. We focused on
this area due to the size of the goodwill balance, and
because the directors’ assessment of the ‘value in
use’ of the cash generating unit (“CGU”) involves
judgements about the future underlying cash flows of
the business and the discount rates applied to them.
During the year, the Group disposed of SC Services
Pty Ltd and Scope Pty Ltd (refer to note 29 (b)). The
goodwill of SC Services Pty Ltd was written off in the
previous year. The goodwill of Scope Pty Ltd was
integrated into the Construction & Engineering CGU,
as the part of the business associated with the
goodwill was restructured into the Construction &
Engineering CGU.
During the year, Decmil Southern Pty Ltd (formerly
Cut & Fill Pty Ltd) was included in the Construction
& Engineering CGU after a restructure and
reorganisation of this business unit to integrate into
the broader Construction & Engineering business.
Our audit procedures in relation to management’s
impairment assessment included:
• Assessing the appropriateness of the integration of the Decmil Southern Pty Ltd (formerly Cut & Fill Pty Ltd) and Scope goodwill into the Construction & Engineering CGU in compliance with the
requirements of AASB 136 Impairment
• Assessing the valuation methodology used and reconciling input data to supporting evidence, such as approved forecasts, then reviewing these forecasts against actual current and previous performance;
• Challenging the reasonableness of key assumptions used in the valuation model, including the cash flow forecast and discount rates used;
• Reviewing management’s sensitivity analysis on revenue growth rates and overheads used in the valuation model to determine the extent of headroom for the CGU; and

For the year ended 30 June 2018, management has
performed an impairment assessment over the
restructured Construction and Engineering CGU
goodwill balance by:
• calculating the value in use for the CGU using a discounted cash flow model. This model used cash flows (revenues, expenses and capital expenditure) for the CGU for 5 years, with a terminal growth rate applied to the 5th year. These cash flows were then discounted to net present value using the Group’s weighted average cost of capital (WACC); and
• comparing the resulting value in use of the CGU to its book value.
• Reviewing the adequacy of disclosures against the requirements of AASB 136.
Recognition of Revenue and Profits on Long Term Contracts
Refer to Note 14 in the financial statements
The Group’s largest source of revenue is from
construction and engineering.
Construction and engineering revenues are derived
from contracts where revenue is recognised based
on the stage of completion. This is measured as the
percentage of work performed up to the reporting
date with respect to the total anticipated contract
work to be performed. Construction and engineering
revenue is recognised by management after
assessing all factors relevant to each contract,
including specifically assessing the following as
applicable:
• Determination of stage of completion • Estimation of total contract revenue and
costs including the estimation of cost contingencies
• Determination of contractual entitlement and assessment of the probability of customer approval of variations and acceptance of claims
• Estimation of project completion date • Provision for loss making contracts
We focused on this area as a key audit matter due to
the number and type of estimation events over the
course of the contract life, the unique nature of
individual contract conditions, leading to complex
and judgmental revenue recognition from contracts.
Our audit procedures in relation to recognition of
revenue and profits on long term contracts included:
• Evaluating and assessing the operating effectiveness of internal controls over the accuracy and timing of revenue recognised in the financial report, including:
- Transactional controls in the revenue and billing cycles
- Transactional controls in the underlying contract related cost balances in the purchase and payroll cycles
• For material contracts with a delivery schedule of greater than 12 months, we performed the following procedures:
- Understanding the performance and status of the contracts through enquiries of personnel with responsibility for contract management.
- Assessing the Group’s ability to deliver contracts within budgeted margins by analysing the historical accuracy of forecasting margins.
- Assessing the provisions for loss making contracts and whether these appropriately reflected the expected contractual provisions.
- Evaluating the probability of recovery of outstanding amounts by reference to the status of negotiations, historical recoveries and other supporting documentation.

Other Information
The directors are responsible for the other information. The other information comprises the information included
in the Group's annual report for the year ended 30 June 2018, but does not include the financial report and the
auditor's report thereon.
Our opinion on the financial report does not cover the other information and accordingly we do not express any
form of assurance conclusion thereon.
In connection with our audit of the financial report, our responsibility is to read the other information and, in doing
so, consider whether the other information is materially inconsistent with the financial report or our knowledge
obtained in the audit or otherwise appears to be materially misstated.
If, based on the work we have performed, we conclude that there is a material misstatement of this other
information, we are required to report that fact. We have nothing to report in this regard.
Responsibilities of the Directors for the Financial Report
The directors of the Company are responsible for the preparation of the financial report that gives a true and fair
view in accordance with Australian Accounting Standards and the Corporations Act 2001 and for such internal
control as the directors determine is necessary to enable the preparation of the financial report that gives a true
and fair view and is free from material misstatement, whether due to fraud or error.
In preparing the financial report, the directors are responsible for assessing the ability of the Group to continue as
a going concern, disclosing, as applicable, matters related to going concern and using the going concern basis of
accounting unless the directors either intend to liquidate the Group or to cease operations, or have no realistic
alternative but to do so.
Auditor's Responsibilities for the Audit of the Financial Report
Our objectives are to obtain reasonable assurance about whether the financial report as a whole is free from
material misstatement, whether due to fraud or error, and to issue an auditor's report that includes our opinion.
Reasonable assurance is a high level of assurance, but is not a guarantee that an audit conducted in accordance
with the Australian Auditing Standards will always detect a material misstatement when it exists. Misstatements
can arise from fraud or error and are considered material if, individually or in the aggregate, they could reasonably
be expected to influence the economic decisions of users taken on the basis of this financial report.
A further description of our responsibilities for the audit of the financial report is located at the Auditing and
Assurance Standards Board website at: http://www.auasb.gov.au/auditors_responsibilities/ar2.pdf.
This description forms part of our auditor's report.
Report on the Remuneration Report Opinion on the Remuneration Report We have audited the Remuneration Report included within the directors' report for the year ended 30 June 2018. In our opinion, the Remuneration Report of Decmil Group Limited, for the year ended 30 June 2018, complies with section 300A of the Corporations Act 2001. Responsibilities The directors of the Company are responsible for the preparation and presentation of the Remuneration Report in accordance with section 300A of the Corporations Act 2001. Our responsibility is to express an opinion on the Remuneration Report, based on our audit conducted in accordance with Australian Auditing Standards.
RSM AUSTRALIA PARTNERS Perth, WA J A KOMNINOS Dated: 31 July 2018 Partner

Additional Information for Listed Public Companies FOR THE YEAR ENDED 30 JUNE 2018
Additional information required by the Australian Securities Exchange and not shown elsewhere in this
report is as follows.
1. Substantial shareholders
The names of substantial beneficial shareholders listed on the Company’s register as at 31 May 2018 are:
Shares %
Denis Criddle 22,479,145 12.93
Commonwealth Bank Group 20,677,928 11.90
Paradice Investment Management Pty Ltd 16,363,304 9.41
Thorney Investments Group 13,080,260 7.53
Franco Family Holdings (Retail Group) 12,675,000 7.29
The following information is made up as at 30 June 2018:
2. Distribution of shareholdings
No. of
shareholders No. of ordinary
shares %
1 – 1,000 1,494 778,531 0.45
1,001 – 5,000 1,735 5,014,979 2.89
5,001 – 10,000 606 4,729,018 2.72
10,001 – 100,000 591 15,699,485 9.03
100,001 and over 73 147,589,914 84.91
Total 4,499 173,811,927 100.00
There are 795 shareholders with an unmarketable parcel totalling 185,024 shares.
3. Voting rights
All ordinary shares issued by Decmil Group Limited carry one vote per share without restriction.

Additional Information for Listed Public Companies (Cont’d) FOR THE YEAR ENDED 30 JUNE 2018
4. Twenty largest shareholders
The names of the twenty largest registered shareholders of fully paid ordinary shares in the Company as
at 30 June 2018 are:
No. of Ordinary
Fully Paid Shares Held
%
Citicorp Nominees Pty Ltd 31,088,746 17.89
HSBC Custody Nominees (Australia) Ltd 21,450,860 12.34
National Nominees Ltd 18,251,689 10.50
J P Morgan Nominees Australia Ltd 12,769,525 7.35
Broadway Pty Ltd – Decmil Australia Fund A/C 10,475,000 6.03
Broadway Pty Ltd – Decmil Australia A/C 7,824,666 4.50
L, M & R Franco – The LMR Franco Unit A/C 5,000,000 2.88
Sandhurst Trustees Ltd – Endeavor Asset Mgmt A/C 3,703,991 2.13
CPU Share Plans Pty Limited 2,555,000 1.47
Delauney Pty Ltd – The Franco Family A/C 2,300,000 1.32
Farview Pty Ltd – Ernesto Franco Family A/C 2,300,000 1.32
BNP Paribas Noms Pty Ltd – DRP 1,966,520 1.13
Mrs Nola Criddle – Criddle Investment Fund A/C 1,947,827 1.12
AMP Life Ltd 1,894,036 1.09
BNP Paribas Nominees Pty Ltd – IB AU Noms Retailclient DRP 1,571,411 0.90
SJ & AC Criddle Holdings Pty Ltd – SJ & AC Criddle Family A/C 1,386,573 0.80
SJ & AC Criddle Holdings Pty Ltd – SJ & AC Criddle Family A/C 1,250,000 0.72
SJ & AC Criddle Holdings Pty Ltd – SJ & AC Criddle Family A/C 1,132,195 0.65
Mr Mario Franco + Mrs Immacolata Franco – The Mario Franco S/F 1,100,000 0.63
Neweconomy Com Au Nominees Pty Ltd – 900 Account 1,052,637 0.61
Total 131,020,676 75.38

Corporate Directory FOR THE YEAR ENDED 30 JUNE 2018
Directors
David Saxelby, Non-Executive Chairman
Scott Criddle, Managing Director
Don Argent, Non-Executive Director
Denis Criddle, Non-Executive Director
Dickie Dique, Non-Executive Director
Bill Healy, Non-Executive Director
Executive Team
Scott Criddle, Chief Executive Officer
Tony Radalj, Chief Operating Officer
Craig Amos, Chief Financial Officer
Company Secretary
Alison Thompson
Australian Business Number
35 111 210 390
Principal Registered Address
20 Parkland Road
Osborne Park WA 6017
Telephone: 08 9368 8877
Facsimile: 08 9368 8878
Postal Address
PO Box 1233
Osborne Park WA 6916
Operational Offices
Decmil Australia Pty Ltd
Level 6, 20 Parkland Road
Osborne Park WA 6017
Telephone: 08 9368 8877
Decmil Australia Pty Ltd &
Homeground Villages Pty Ltd
Level 5, 60 Edward Street
Brisbane QLD 4000
Telephone: 07 3640 4600
Decmil Construction NZ Limited
Level 6, 16 Kingston Street
Auckland 1010
Telephone: +64 9 443 4443
Decmil Southern Pty Ltd
Level 3, 850 Collins Street
Docklands VIC 3008
Telephone: 1300 332 645
Auditor
RSM Australia Partners
8 St Georges Terrace
Perth WA 6000
Telephone: 08 9261 9100
Share Registry
Computershare Investor Services Pty Ltd
Level 11, 172 St Georges Terrace
Perth WA 6000
Telephone: 08 9323 2000
Email: www-
au.computershare.com/Investor/Contact
Website: www.computershare.com
Bankers
National Australia Bank Ltd
100 St Georges Terrace
Perth WA 6000
Telephone: 13 10 12
Controlled Entities
Decmil Australia Pty Ltd
Decmil Engineering Pty Ltd
Decmil PNG Limited
Decmil Construction NZ Limited
Decmil Southern Pty Ltd
Eastcoast Development Engineering Pty Ltd
Homeground Villages Pty Ltd
Homeground Gladstone Pty Ltd ATF
Homeground Gladstone Unit Trust
Decmil Properties Pty Ltd
Decmil Infrastructure Pty Ltd
Decmil Services Pty Ltd
Decmil Telecom Pty Ltd
Decmil Group Limited Employee Share Plan
Trust
ASX Code
DCG

decmil.comOperating across Australia & New ZealandPerth | Melbourne | Brisbane | Auckland