Embed Size (px)
Citation preview
Kambi G
roup plc Annual report and accounts 2016
ww
w.k
amb
i.co
m www.kambi.com
Annual report and accounts 2016
2 Annual report and accounts 2016 Kambi Group plc
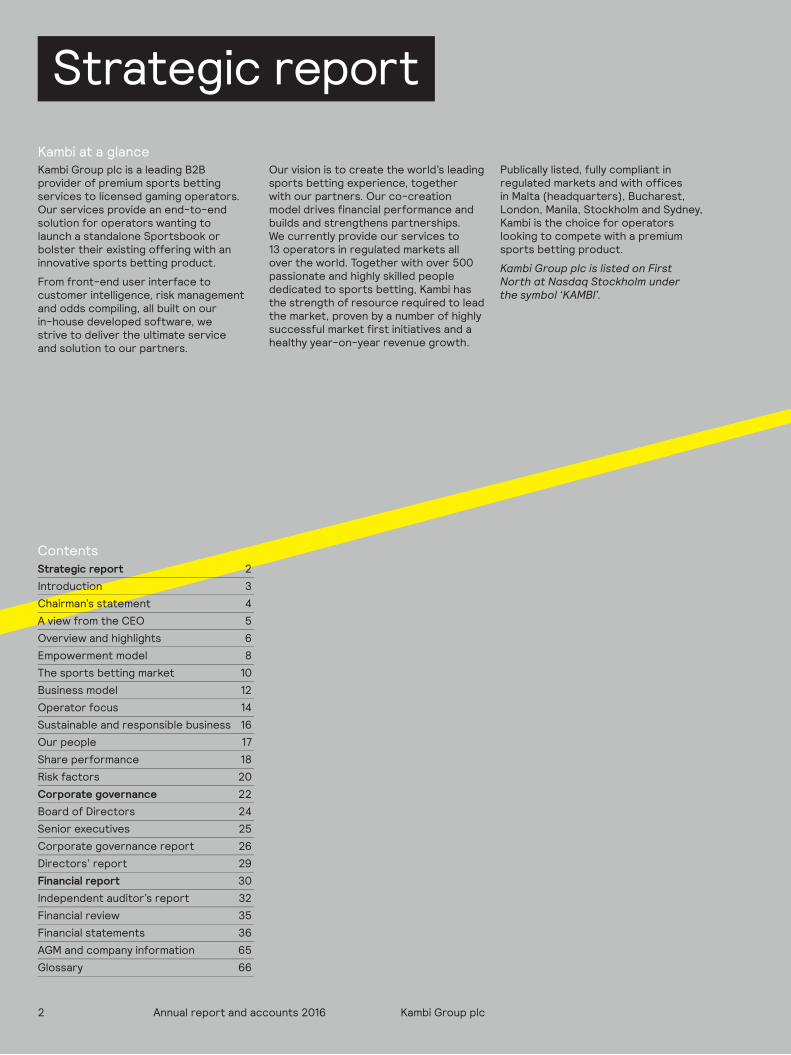
Contents Strategic report 2
Introduction 3
Chairman’s statement 4
A view from the CEO 5
Overview and highlights 6
Empowerment model 8
The sports betting market 10
Business model 12
Operator focus 14
Sustainable and responsible business 16
Our people 17
Share performance 18
Risk factors 20
Corporate governance 22
Board of Directors 24
Senior executives 25
Corporate governance report 26
Directors’ report 29
Financial report 30
Independent auditor’s report 32
Financial review 35
Financial statements 36
AGM and company information 65
Glossary 66
Kambi at a glance Kambi Group plc is a leading B2B provider of premium sports betting services to licensed gaming operators. Our services provide an end-to-end solution for operators wanting to launch a standalone Sportsbook or bolster their existing offering with an innovative sports betting product.
From front-end user interface to customer intelligence, risk management and odds compiling, all built on our in-house developed software, we strive to deliver the ultimate service and solution to our partners.
Our vision is to create the world’s leading sports betting experience, together with our partners. Our co-creation model drives financial performance and builds and strengthens partnerships. We currently provide our services to 13 operators in regulated markets all over the world. Together with over 500 passionate and highly skilled people dedicated to sports betting, Kambi has the strength of resource required to lead the market, proven by a number of highly successful market first initiatives and a healthy year-on-year revenue growth.
Publically listed, fully compliant in regulated markets and with offices in Malta (headquarters), Bucharest, London, Manila, Stockholm and Sydney, Kambi is the choice for operators looking to compete with a premium sports betting product.
Kambi Group plc is listed on First North at Nasdaq Stockholm under the symbol ‘KAMBI’.
Strategic report
Behind every victory
3Annual report and accounts 2016Kambi Group plc
Introduction The power to perform
Our vision is to create the world’s leading sports
betting experience, together with our partners.
We continue to invest heavily in technology, data and people to enable our operators to meet their individual objectives, boost their business performance and grow their top line.
This report will demonstrate in detail how Kambi’s performance over the past 12 months has empowered our operators to stay ahead of the field.
In sport, performance is everything. The ability to deliver at a precise moment is what separates the leaders from the rest.
Sports betting is no different. It is why Kambi continues to set the pace.
We do not just provide our operators with a proven, market-leading Sportsbook that delivers an unrivalled player experience. We empower them through our unique culture of co-creation which allows us to treat operators as partners, catering for their different needs while providing them with the flexibility to mould our service to fit their individual strategy and brand.
4 Annual report and accounts 2016 Kambi Group plc
In the last year, the Kambi Sportsbook platform has significantly contributed to the growth and success of our operators.
Digital technologies are transforming the world as we know it, providing businesses with a depth of consumer behavioural understanding that has inspired the creation of outstanding user experiences. In the near future, digitally connected devices will return even more data to developers, whilst providing consumers with valuable lifestyle efficiencies that free up more leisure time. This presents entertainment companies like Kambi with more opportunities than ever before to provide immediate satisfaction to demanding users. However, as digital technologies have grown more sophisticated, so has the average consumer who now expects a seamless, intuitive and immediate user experience. Glitches and cumbersome routes to digital destinations are just not tolerated. And, as gaming is successfully exploited by the wider business community as an effective engagement tool, more pressure is placed on the technology and gaming industries to continue to create ground-breaking and exciting experiences. Experiences that capture the attention of an already highly engaged audience.
At Kambi, we are passionate about sports betting. Our drive is to create the best user experience. One that is as unique as it is entertaining. We have the know-how and the heritage to be at the forefront of development and innovation, creating a Sportsbook that stands out from the crowd. Realising we have to be faster, better and smarter to stay relevant, fun and safe, our business will continue to adapt to the end users’ needs. We thrive in this competitive environment as our dedicated team constantly aims to exceed end users’ expectations. Furthermore, our co-creative approach helps shape user experience evolutions – resulting in a number of firsts to the market.
In the last year, the Kambi Sportsbook platform has significantly contributed to the growth and success of our operators. In turn, 2016 has shown the strongest financial performance in the company’s history. Looking ahead, we continue to focus on the impact of future digital technologies and how best to utilise them. Focused on today but with our eyes on tomorrow, our premium Sportsbook will continue to innovate and evolve, ensuring our operators have the capability not only to compete, but to lead.
Lars Stugemo Chairman
Chairman’s statement Lars Stugemo
Winning byoutperforming
5Annual report and accounts 2016Kambi Group plc
Throughout 2016, Kambi continued to produce outstanding results for our operators. Once again, 2016 saw our operators outperform the market, increasing their turnover by 36%. We can only ever be as successful as our operators so to see them deliver such a positive performance is very gratifying for everyone at Kambi.
With the 2016 European Football Championships held in June and July and the Rio Olympics in August, it was a really important year for our operators. So I am immensely proud that our system performed with perfect reliability and no downtime and provided the best offering on the market during both tournaments.
The year also saw a general shift towards operators outsourcing their Sportsbook which created a higher demand for Kambi’s premium Sportsbook. So much so, we added five new operators in 2016: award-winning gaming groups LeoVegas and Mr Green, as well as the largest media group in Mexico – Televisa – and two of Europe’s most renowned gaming companies, Rank and R. Franco in the UK and Spain respectively.
Retail still represents the largest proportion of the world's sports betting activity and our exciting new partnership with Televisa will see us providing online betting, together with retail services, in 18 casinos. Looking forward, 2017 has already started brightly with the addition of another new client, Greentube.
At Kambi we are all about delivering the best sports betting solution in the industry by investing in people and technology. We believe in empowering our operators so that they not only benefit from the quality and scale efficiencies of Kambi’s Sportsbook but also have the flexibility to differentiate their service, giving them brand distinction and flexibility. That is why, in 2016, we launched our HTML5 user interface – an open platform that gives operators the flexibility to personalise their offering, serving tailored content to their players. In Q4 we also launched our first price differentiation tool to allow operators to offer different odds in different markets, giving them the flexibility to choose to strengthen their competitiveness in certain markets or to earn higher margins in others. It is a tool that has already been warmly welcomed by our operators, impacting positively on their revenues.
These exciting developments saw us grow further in 2016 with new offices opening in London and Bucharest and our brilliantly talented team growing in number to 525. These are exciting times to be at Kambi and already we are looking ahead to further development and growth in 2017.
Kristian NylénCEO
At Kambi we are all about delivering the best sports betting solution in the industry by investing
in people and technology.
A view from the CEO Kristian Nylén
and growth in 2017.
6 Annual report and accounts 2016 Kambi Group plc
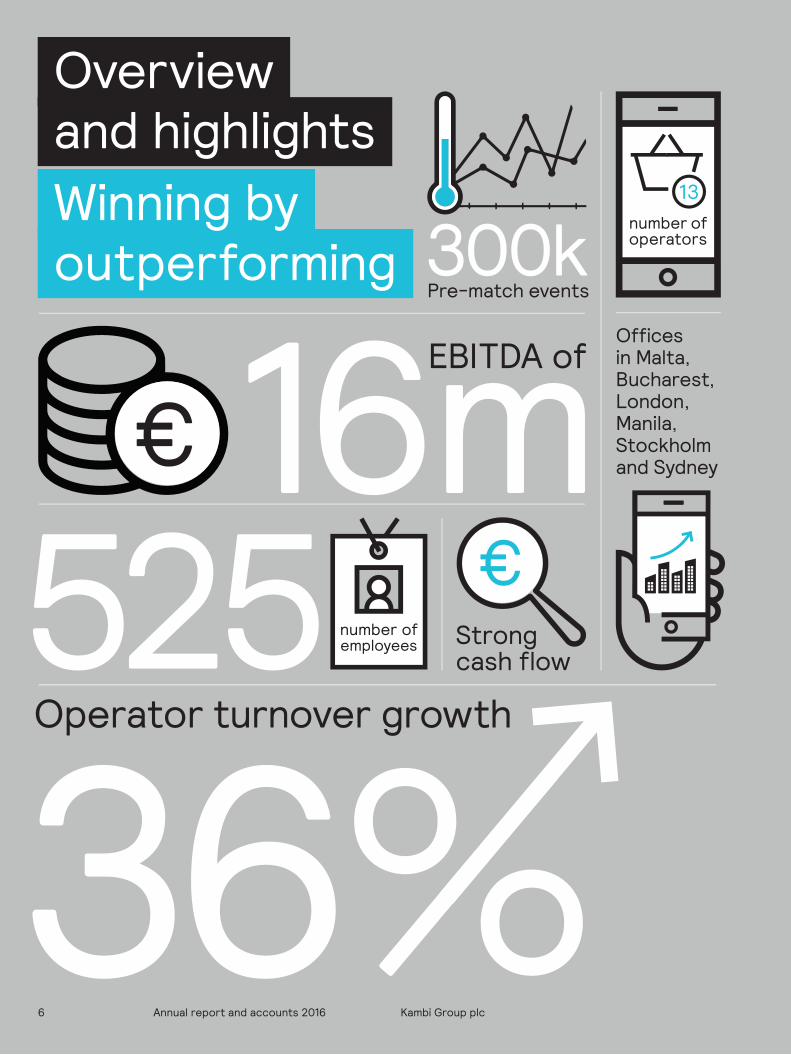
Overview and highlightsWinning by outperforming
Offices in Malta, Bucharest, London, Manila, Stockholmand Sydney
300k
Operator turnover growth525
13
16mPre-match events
36%
7Annual report and accounts 2016Kambi Group plc
Operational highlights
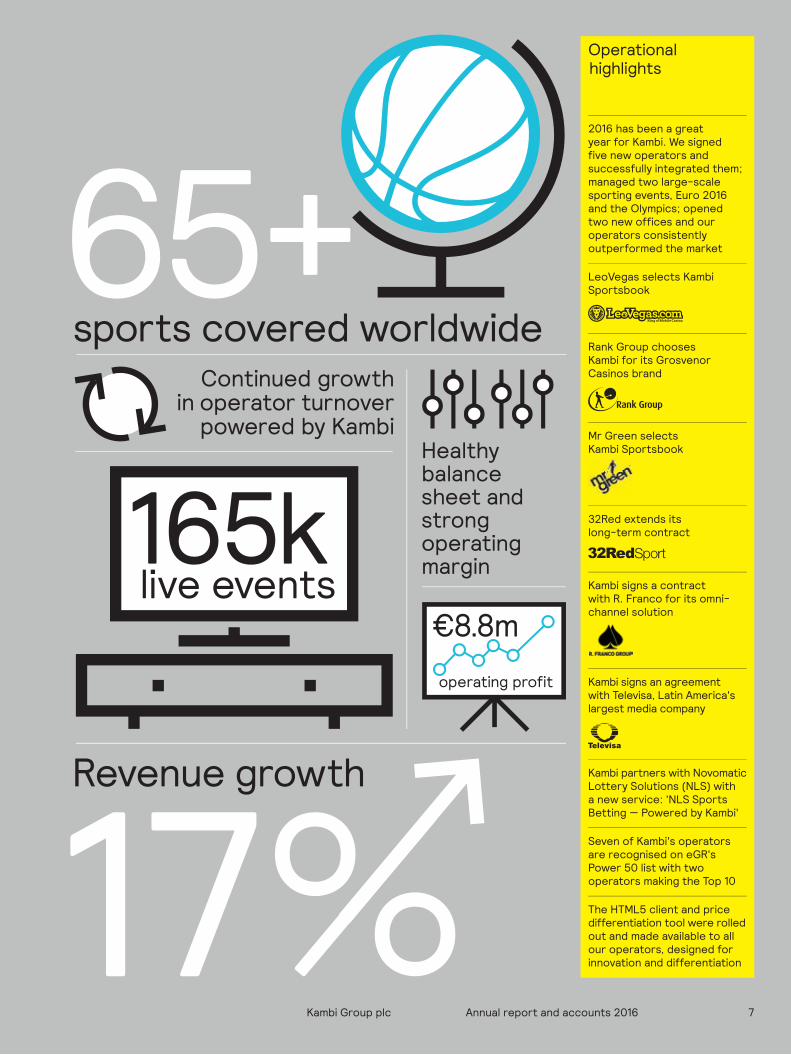
2016 has been a great year for Kambi. We signed five new operators and successfully integrated them; managed two large-scale sporting events, Euro 2016 and the Olympics; opened two new offices and our operators consistently outperformed the market
LeoVegas selects Kambi Sportsbook
Rank Group chooses Kambi for its Grosvenor Casinos brand
Mr Green selects Kambi Sportsbook
32Red extends its long-term contract
Kambi signs a contract with R. Franco for its omni-channel solution
Kambi signs an agreement with Televisa, Latin America's largest media company
Kambi partners with Novomatic Lottery Solutions (NLS) with a new service: 'NLS Sports Betting — Powered by Kambi'
Seven of Kambi's operators are recognised on eGR's Power 50 list with two operators making the Top 10
The HTML5 client and price differentiation tool were rolled out and made available to all our operators, designed for innovation and differentiation
165k
sports covered worldwide65+
€8.8m
17%Revenue growth
Cultivating empowering partnerships
8 Annual report and accounts 2016 Kambi Group plc
Empowerment modelOverview
Sports betting puts the player right at the heart of the action. The next goal, the next throw-in, the next point. They are all thrilling opportunities to participate in the outcome.
But it is more than the simple adrenaline surge of monetary reward. It is about analysis and backing your judgment. The anticipation. The tension. The excitement. That unbeatable feeling of fulfilment, having outsmarted the rest. As a form of entertainment it is immersive and utterly compelling and, for the armchair viewer, the closest thing to being involved.
But it takes the speed and technical brilliance of a premium Sportsbook like Kambi’s to deliver that experience. A Sportsbook so fast and agile, it automatically enables bets to be settled in under a single second after the conclusion of a tennis point. Allowing the player to keep pace with the action. Creating ongoing drama, real entertainment value and raising sport to another level.
In technology terms, the relationship between scalability and flexibility is not typically symbiotic. By aligning our service proposition to facilitate co-creation, our customers are empowered to benefit from the quality and scale efficiencies of Kambi’s Sportsbook while, at the same time, being agile enough to be responsive to end user demands and market forces. This dynamic proposition is boosting business performance and enabling brand distinction whilst driving efficiency and building mutual commercial success. It is a relationship that is aligned at both the commercial and service delivery level.
By empowering operators with both insight and support, we harness and broaden the resource pool and create greater leverage to compete in the market.
9Annual report and accounts 2016Kambi Group plc
In 2016, Kambi introduced several key tools for innovation and differentiation:
Price differentiation: This tool allows operators to offer different odds in different markets by controlling the payback in order to optimise the return for each regulation they are active in. It enables them to strengthen their competitiveness in certain events or to choose to earn higher margins in others. Efficient and scalable, operators welcome the flexibility it gives them in determining the mix between pricing and promotion through leveraging their knowledge of local markets. This is done without compromising on risk management and control.
HTML5: This open platform went live in 2016. It delivers a leading experience as a foundation and offers operators the full flexibility to take it further by differentiating, personalising and serving tailored content and propositions to their players. One of the features enabled in the HTML5 client is Live Visualisation. It enables operators to provide end users with an involved and informed experience.
Promotions, price boosts and free bets: Giving operators the capability to run targeted real-time and product-specific promotions to entice new players and keep them playing for longer.
A compelling user experienceTogether with our operators, Kambi is driven to create the best sports betting user experience available. Our partnerships seek to create intuitive, relevant and compelling experiences. A fulfilling experience motivates retention and drives business revenues. We achieve this by scrutinising the massive volume of network data sent back to us by Kambi’s total playing community and ratified data providers. By collating, segmenting and analysing data, we have the capability to unearth insights that inspire, shape and inform the evolution of the sports betting experience we and our partners deliver.
Structured for scalability and growthOur dedicated resources and pure focus on sports betting affords us the power required to lead the market, giving Kambi’s operators a distinct advantage from the moment they go live. Fully compliant, we offer our partners the opportunity to scale quickly and securely, not just with new types of betting, but also into new geographic territories and regulated markets.
With clear operating streams specialising in areas such as trading, user experience and retail, Kambi is ideally positioned as a specialist product development organisation. Not only does this give Kambi the advantage to deliver the right offering faster, manage risk better and enable us to create real entertainment value for our operators’ players, it also empowers our operators to rapidly grow their businesses and strengthen their brands.
Future innovation, forward focusKambi’s empowerment model is designed to harness not only the innovations and scalability that are continuously being realised in its own value chain, but to uniquely combine them with the initiatives and developments of its partners.
By empowering operators with both insight and
support, we harness and broaden the resource pool
and create greater leverageto compete in the market.
10 Annual report and accounts 2016 Kambi Group plc
The sports betting market Market figures
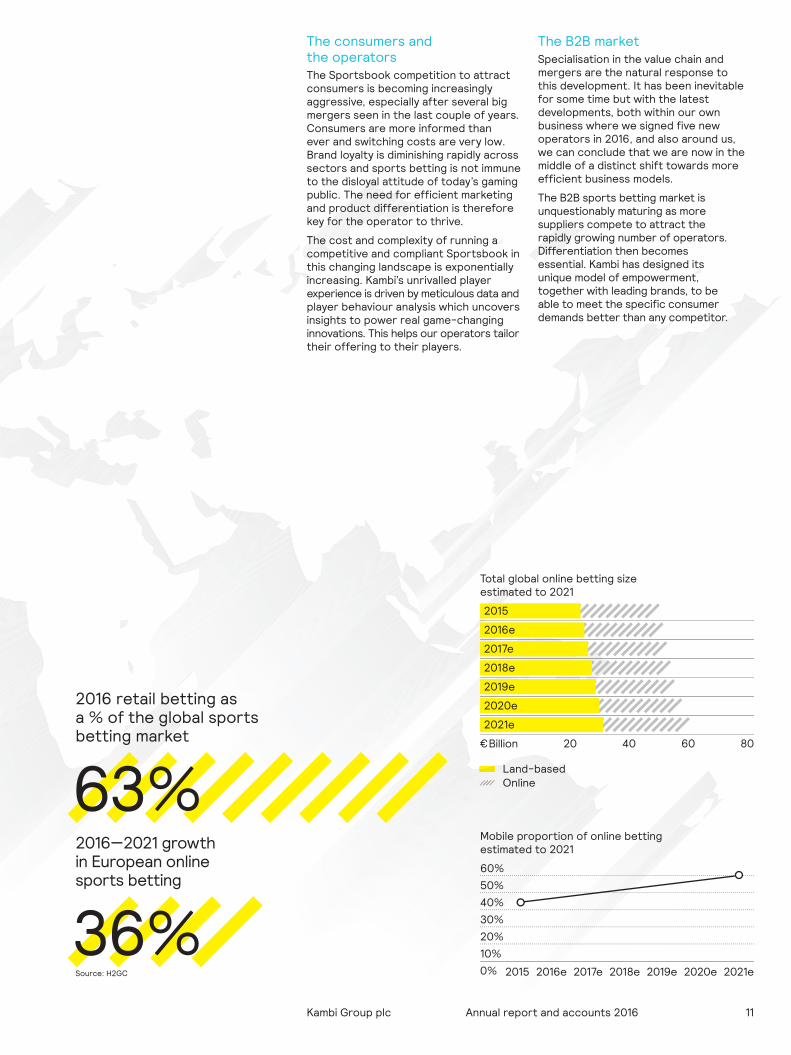
Market size and the growth in online bettingKambi operates in a market that is changing and growing rapidly. The total sports betting market is estimated to grow by around 17% over a period of five years, between 2016—2021 across all channels. Kambi’s core market, Europe online sports betting, is expected to grow by approximately 36% in the same period of time.
The estimated value for the global sports betting market in 2016 was €52.5 billion in gross gambling revenue (GGR). Asia and Europe are still the largest regions, estimated to be approximately €26.9 billion and €16.7 billion respectively.
New technology and data introduces new channels and new content, leading to drastic changes in consumer behaviour and expectations. In turn, this leads to regulations being introduced to protect consumers and to collect tax. This market development offers both great opportunities as well as challenges.
RegulationWe expect to see more governments introduce local online gaming licences. This will create a dynamic which will increase Kambi’s addressable market through new local entrants and existing sports betting operators, such as land-based gaming groups, media companies and national lotteries.
In Europe alone, we have seen countries such as Spain, Denmark and Italy introduce domestic online gaming licences. Whilst these processes move slowly, we expect more countries to follow suit, with Germany, Sweden and the Netherlands looking to be the most likely.
The market is changing in Latin America with an online licensing regime adopted in Colombia in 2016 and movement being made in Mexico, Chile, Peru and Brazil which are all expected to regulate gaming in the short to medium term. The Asian market continues to be extremely restricted, while Australia and parts of Africa are regulated.
There are movements towards a more open market in the US with a bill that proposes to legalise sports betting in New York. However, there are still many barriers to overcome, not least a federal prohibition dating back to 1992. The appetite for sports betting in the US is undeniable and many of the innovations and lessons Kambi has learned in Europe will have applications in the US as well.
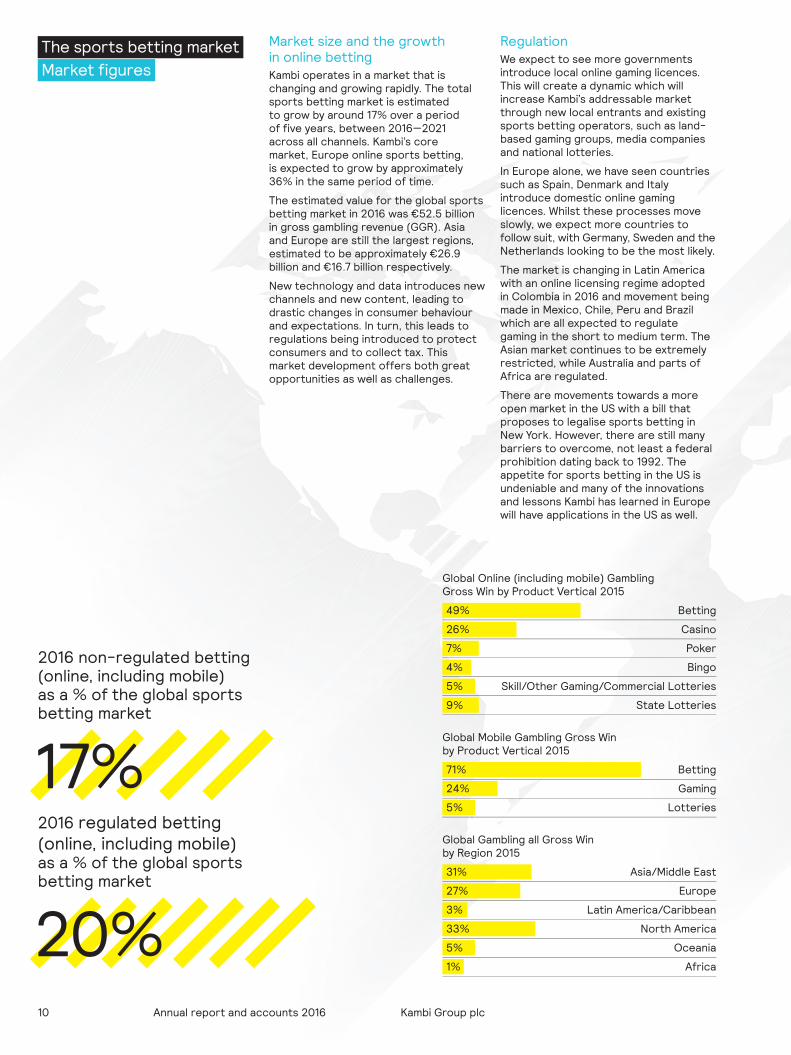
Global Online (including mobile) Gambling Gross Win by Product Vertical 2015
49% Betting
26% Casino
7% Poker
4% Bingo
5% Skill/Other Gaming/Commercial Lotteries
9% State Lotteries
Global Mobile Gambling Gross Win by Product Vertical 2015
71% Betting
24% Gaming
5% Lotteries
Global Gambling all Gross Win by Region 2015
31% Asia/Middle East
27% Europe
3% Latin America/Caribbean
33% North America
5% Oceania
1% Africa
2016 non-regulated betting (online, including mobile)as a % of the global sports betting market
17%2016 regulated betting (online, including mobile)as a % of the global sports betting market
20%
11Annual report and accounts 2016Kambi Group plc
Total global online betting sizeestimated to 2021
2015
2016e
2017e
2018e
2019e
2020e
2021e
€Billion 20 40 60 80
Land-based Online
The consumers and the operatorsThe Sportsbook competition to attract consumers is becoming increasingly aggressive, especially after several big mergers seen in the last couple of years. Consumers are more informed than ever and switching costs are very low. Brand loyalty is diminishing rapidly across sectors and sports betting is not immune to the disloyal attitude of today’s gaming public. The need for efficient marketing and product differentiation is therefore key for the operator to thrive.
The cost and complexity of running a competitive and compliant Sportsbook in this changing landscape is exponentially increasing. Kambi’s unrivalled player experience is driven by meticulous data and player behaviour analysis which uncovers insights to power real game-changing innovations. This helps our operators tailor their offering to their players.
The B2B marketSpecialisation in the value chain and mergers are the natural response to this development. It has been inevitable for some time but with the latest developments, both within our own business where we signed five new operators in 2016, and also around us, we can conclude that we are now in the middle of a distinct shift towards more efficient business models.
The B2B sports betting market is unquestionably maturing as more suppliers compete to attract the rapidly growing number of operators. Differentiation then becomes essential. Kambi has designed its unique model of empowerment, together with leading brands, to be able to meet the specific consumer demands better than any competitor.
2016 retail betting as a % of the global sports betting market
63%2016—2021 growth in European online sports betting
36%Source: H2GC
Mobile proportion of online betting estimated to 2021
60%50%40%30%20%10%0% 2015 2016e 2017e 2018e 2019e 2020e 2021e
12 Annual report and accounts 2016 Kambi Group plc
The fully scalable SportsbookKambi has built a strong track record of providing a superior Sportsbook service which has generated significant growth in revenues and market share both for our operators and for the company.
Our business model is scalable as there is limited need to add extra resources when we add more operators – the number of users is independent of our service. As we continuously invest in people and technology to create a state-of-the-art Sportsbook, we enable gambling operators to cost-efficiently offer their consumers a premium Sportsbook with a leading end user experience covering all channels including mobile, online and retail.
Our business model provides strong operating leverage in a revenue-sharing model, driving earnings growth and margin expansion for Kambi. This model incentivises Kambi to provide odds that maximise the operators’ gross gambling revenue, thus creating a natural alignment of interests. Our operators also have the flexibility to adjust pre-match odds in certain events, up to a set level, in order to differentiate and optimise their respective marketing campaigns.
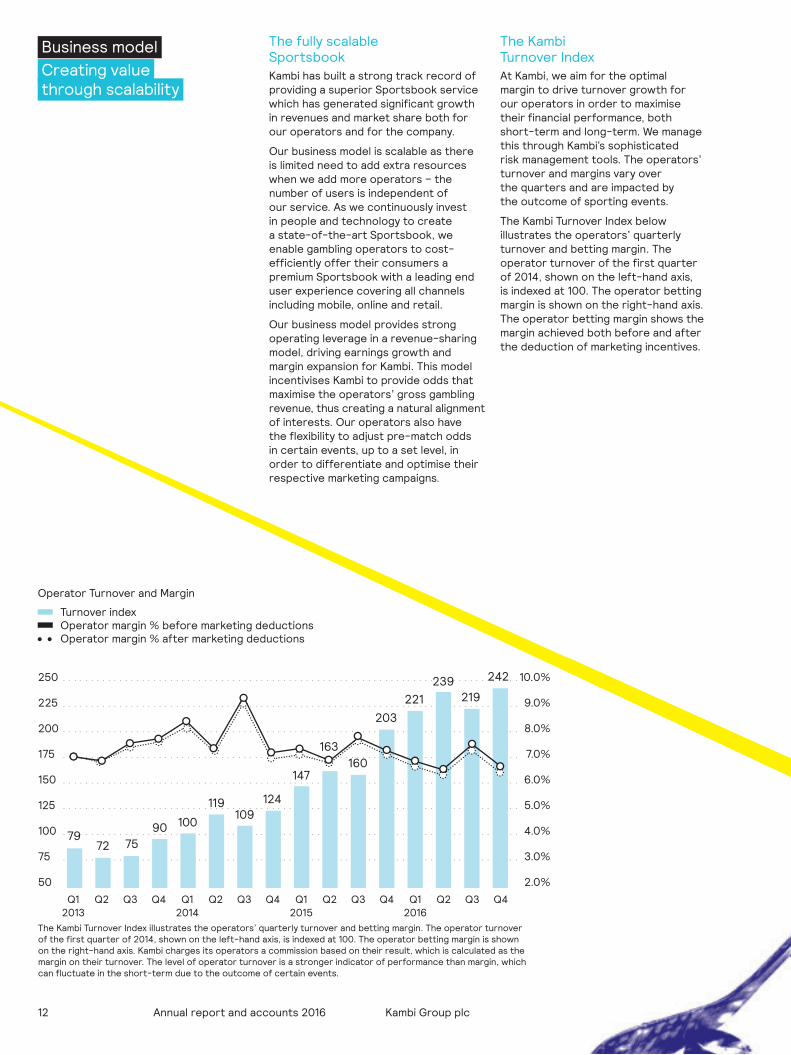
The Kambi Turnover IndexAt Kambi, we aim for the optimal margin to drive turnover growth for our operators in order to maximise their financial performance, both short-term and long-term. We manage this through Kambi’s sophisticated risk management tools. The operators’ turnover and margins vary over the quarters and are impacted by the outcome of sporting events.
The Kambi Turnover Index below illustrates the operators’ quarterly turnover and betting margin. The operator turnover of the first quarter of 2014, shown on the left-hand axis, is indexed at 100. The operator betting margin is shown on the right-hand axis. The operator betting margin shows the margin achieved both before and after the deduction of marketing incentives.
Business model Creating value through scalability
Q12013
Q2 Q3 Q4 Q12014
Q2 Q3 Q4 Q12015
Q2 Q3 Q4 Q12016
Q2 Q3 Q4
Operator Turnover and Margin
Turnover index Operator margin % before marketing deductions Operator margin % after marketing deductions
The Kambi Turnover Index illustrates the operators’ quarterly turnover and betting margin. The operator turnover of the first quarter of 2014, shown on the left-hand axis, is indexed at 100. The operator betting margin is shown on the right-hand axis. Kambi charges its operators a commission based on their result, which is calculated as the margin on their turnover. The level of operator turnover is a stronger indicator of performance than margin, which can fluctuate in the short-term due to the outcome of certain events.
10.0%
9.0%
8.0%
7.0%
6.0%
5.0%
4.0%
3.0%
2.0%
250
225
200
175
150
125
100
75
50
7972 75
90 100
119109
124
147
163160
203221
239219
242
13Annual report and accounts 2016Kambi Group plc
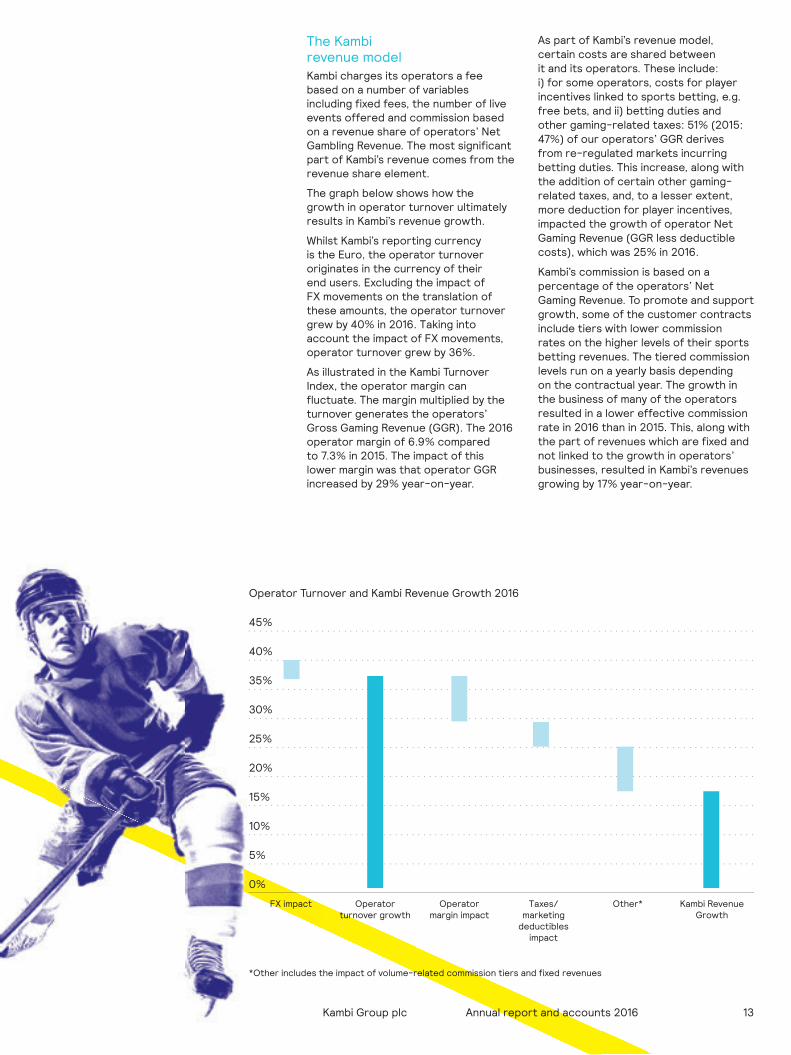
The Kambi revenue modelKambi charges its operators a fee based on a number of variables including fixed fees, the number of live events offered and commission based on a revenue share of operators’ Net Gambling Revenue. The most significant part of Kambi’s revenue comes from the revenue share element.
The graph below shows how the growth in operator turnover ultimately results in Kambi’s revenue growth.
Whilst Kambi’s reporting currency is the Euro, the operator turnover originates in the currency of their end users. Excluding the impact of FX movements on the translation of these amounts, the operator turnover grew by 40% in 2016. Taking into account the impact of FX movements, operator turnover grew by 36%.
As illustrated in the Kambi Turnover Index, the operator margin can fluctuate. The margin multiplied by the turnover generates the operators’ Gross Gaming Revenue (GGR). The 2016 operator margin of 6.9% compared to 7.3% in 2015. The impact of this lower margin was that operator GGR increased by 29% year-on-year.
As part of Kambi’s revenue model, certain costs are shared between it and its operators. These include: i) for some operators, costs for player incentives linked to sports betting, e.g. free bets, and ii) betting duties and other gaming-related taxes: 51% (2015: 47%) of our operators’ GGR derives from re-regulated markets incurring betting duties. This increase, along with the addition of certain other gaming-related taxes, and, to a lesser extent, more deduction for player incentives, impacted the growth of operator Net Gaming Revenue (GGR less deductible costs), which was 25% in 2016.
Kambi’s commission is based on a percentage of the operators’ Net Gaming Revenue. To promote and support growth, some of the customer contracts include tiers with lower commission rates on the higher levels of their sports betting revenues. The tiered commission levels run on a yearly basis depending on the contractual year. The growth in the business of many of the operators resulted in a lower effective commission rate in 2016 than in 2015. This, along with the part of revenues which are fixed and not linked to the growth in operators’ businesses, resulted in Kambi’s revenues growing by 17% year-on-year.
Operator Turnover and Kambi Revenue Growth 2016
45%
40%
35%
30%
25%
20%
15%
10%
5%
0%
FX impact Operator turnover growth
Operator margin impact
Taxes/marketing
deductibles impact
Other* Kambi Revenue Growth
*Other includes the impact of volume-related commission tiers and fixed revenues
14 Annual report and accounts 2016 Kambi Group plc
Operator focusKambi’s focus
OperatorsIn 2016, Kambi continued to deliver on its strategy of building long-term relationships with strategically significant operators by signing some of the biggest gaming brands in the sector. In addition to LeoVegas and Mr Green, Kambi welcomed two of Europe’s most established land-based gaming companies in Rank Group and R. Franco, who launched online brands in their core markets of UK and Spain, respectively. All four operators were integrated and were live and generating revenues within a few months of signing. During the year, Kambi signed its first Latin American operator, the Mexican media giant, Televisa. Following a successful proof of concept, a long-term agreement was made for the provision of both retail and online Sportsbook to the Mexican market. During the year, Spanish operators Premier Apuestas and Luckia's contracts came to an end and were not renewed.
Kambi also extended its sales reach into the Government Regulated Lottery segment by signing a Memorandum of Understanding with Novomatic Lottery Solutions. The agreement will see Kambi partner with Novomatic to jointly bid for retail and online sports betting opportunities in this sector.
Kambi’s value proposition continues to resonate with operators. The Sportsbook’s ability to transform revenues, allied with our empowering technology framework, is enabling operators to successfully differentiate their brand propositions.
Kambi will continue to focus on driving turnover for its existing operators. Sales focus will remain on regulated and re-regulating markets in the core territories of Europe, Latin America and the global Government Regulated Lotteries sector. With Kambi’s retail offering supplementing its premium online Sportsbook, Kambi’s addressable market opportunity is broadened considerably.
Unibet/KindredIn December 2016, Unibet Group plc changed its name to Kindred Group plc. It is one of the largest online gambling operators in the world, with over 15 million customers across 100 markets, and is listed on Nasdaq Stockholm. Unibet is the premium all-product brand in the Group. In 2014, Unibet signed a long-term contract with Kambi. Unibet is ranked joint fifth in the eGR Power 50.
888888 is one of the world’s leading online gaming providers and listed on the London Stock Exchange. The 888sport brand switched to Kambi in May 2013, launching in multiple regulated markets and showing impressive growth year-on-year with its Sportsbook powered by Kambi. 888 is ranked number nine in the 2016 eGR Power 50.
PafPaf is an Åland (Finland) gaming company, controlled by the local Åland government. Paf was Kambi’s first B2B customer, launched in 2011, and extended its contract in 2015. Paf’s core market is Finland and it is ranked number 33 in the 2016 eGR Power 50.
GreentubeGreentube, the Novomatic Interactive division, is 100% owned by the Novomatic Group, one of the largest gaming technology companies in the world. It signed with Kambi in February 2017. Greentube adds Kambi’s Sportsbook to its online brands across Europe to complement its casino products.
15Annual report and accounts 2016Kambi Group plc
In 2016, Kambi continued to deliver on its strategy of building
long-term relationships with strategically
significant operators.
Napoleon GamesNapoleon Games is a leading retail gaming group in Belgium. It went live with Kambi’s service for both online and retail in the Belgian market in early 2013 and extended its contract for the long-term in 2014.
Mr GreenMr Green is a Malta licensed gaming company with a focus on Scandinavia and the United Kingdom and listed on Nasdaq Stockholm Main Market. Mr Green signed with Kambi in the spring of 2016 and launched its Sportsbook at the start of Euro 2016. Mr Green is ranked number 36 in the 2016 eGR Power 50.
WanabetR. Franco signed a long-term contract with Kambi in July 2016 and is one of the founding fathers of the Spanish retail segment and one of the most trusted and established brands in the sector. R. Franco covered more than 40% of the Spanish AWP (Amusement With Prizes) market in 2016. Following its recent investment in its digital and omni-channel proposition, the company successfully launched into the Spanish online gaming market with the brand Wanabet.es.
SuertiaSuertia is a Spanish gaming company based in Barcelona with a focus on specific regions. Suertia originally signed with Kambi in early 2013 to address the Spanish online sports betting market.
LeoVegasLeoVegas Mobile Gaming Group holds a leading market position in mobile gaming and is listed on the First North Premier at Nasdaq Stockholm. LeoVegas signed with Kambi in January 2016. Its core markets are the Nordic region and the UK. LeoVegas is ranked number 31 in the 2016 eGR Power 50.
NagaWorldNagaWorld signed with Kambi in 2014 to provide a fully managed, over-the-counter Sportsbook solution at its flagship hotel, casino and entertainment complex in Phnom Penh, Cambodia. It has subsequently extended its offering to include self-service terminals. In 2016, NagaWorld extended its contract with Kambi for the long-term, which includes expansion plans for its current offering. NagaWorld is owned by NagaCorp Ltd, listed on the Hong Kong Stock Exchange.
32Red32Red focuses on the UK market and is listed on the Alternative Investment Market, a section of the London Stock Exchange. The existing 32RedSport brand switched to Kambi in May 2014 and, having enjoyed two years of growth in the Sportsbook vertical, the contract was further extended in 2016. 32Red is ranked number 22 in the 2016 eGR Power 50.
PlayCityPlayCity, a subsidiary of Mexican media company Grupo Televisa, signed a long-term contract with Kambi in November 2016 after a successful 'proof of concept' and in 2016 was operating in five casinos with Kambi’s service. This deployment will be followed by the entire Mexican land-based casino network and its online operation when the Mexican market regulates.
Grosvenor CasinosThe Rank Group is a UK-based European gaming business, listed on the London Stock Exchange. Rank signed with Kambi in January 2016. With Grosvenor Casinos, it owns the largest casino network in the UK and is utilising the strength of the brand in aiming to become one of the UK’s leading Sportsbooks. Rank Group is ranked number 19 in the 2016 eGR Power 50.
16 Annual report and accounts 2016 Kambi Group plc
Sustainable and responsible business Promoting a sustainable, responsible and regulated environment
Building trustKambi is a leader in the regulated gaming industry. We take the provision of our services very seriously and have dedicated internal compliance teams in place to review and monitor our operations and processes. This compliance department is called Sportsbook control and reports to the COO.
We are inspired by, and committed to, the principles of anti-corruption and anti-bribery, environmental responsibility, integrity, correctness and transparency. We adopt the highest standards of official directives and guidelines in the management of our activities in all the contexts in which we operate.
Integrity in sportKambi collaborates with its operators and integrity partners in order to play an active role in the fight against the manipulation of sporting events worldwide. We harness both our data and our dedicated integrity team to provide fast and reliable alerts to relevant bodies, amongst them the International Olympic Committee (IOC) and Early Warning System GmbH (a FIFA subsidiary). Our contribution assists sports governing bodies and law enforcement in keeping crime out of sports and betting.
Regulated markets and licencesKambi holds business-to-business licences in a number of markets, and has dedicated regulatory, legal and technical teams inputting into its commercial strategy. This enables Kambi to remain up to date and relevant in a changing legislative and regulatory landscape, mitigating the impact of changes in law that could otherwise adversely affect our operations. By taking a proactive approach and engaging with local regulators and authorities, Kambi is able to provide a best-in-class product that prioritises uninterrupted service provision to our operators.
Kambi is licensed by the following regulatory bodies: Alderney Gambling Control Commission (AGCC), the Malta Gaming Authority (MGA), the UK Gambling Commission (UKGC) and the Spanish Directorate General for the Regulation of Gambling (DGOJ).
Our software is certified in numerous regulated jurisdictions including Denmark and Italy and to meet our commitment to provide a responsible and regulated environment for players, is additionally certified and verified by eCOGRA (e-Commerce and Online Gaming Regulation and Assurance), an organisation that promotes moral, ethical and responsible gaming. Kambi utilises a best-in-class security approach, with guiding principles from ISO 27001.
Anti-corruption and anti-bribery policyKambi takes anti-bribery measures seriously and has established systems and controls from the executive team downwards to facilitate timely production of risk assessments and implementation of proactive measures to avoid bribery. These processes are regularly reviewed by our legal and compliance teams, with company-wide updates produced to ensure employees remain familiar with these policies.
Further to the above, Kambi is committed to ensuring that no employee suffers an injustice as a result of reporting a suspicion that actual or potential bribery or another corruption offence has taken place or may take place in the future. Our processes and internal teams support confidential reporting to facilitate an environment that prioritises the protection of the employee in the event that he or she is reporting a potential offence.
Kambi provides annual Anti Money Laundering (AML) training to all employees. They are made aware of what suspicious behaviours to look out for and how to contact the nominated AML Officer should there be a need for escalation.
Kambi does not make contributions to political parties. We only make charitable donations that are legal and ethical under local laws and practices.
Whistleblowing policyKambi is committed to high standards of corporate governance, honesty, openness and accountability. Our whistleblowing policy is in line with the Public Interest Disclosure Act 1998 and provides protection for whistleblowing made in good faith, encouraging employees to raise concerns with Kambi in the first instance. Our whistleblowing policy formalises Kambi’s commitment to encourage all employees to report any business misconduct without risk to themselves.
Local development and supportKambi takes charitable actions, both on a company level as well as on an individual level, mainly focusing on the communities in which we operate. Our employees play a hands-on role supporting local charities on a voluntary basis with their time, fund-raising and other donations, for example in various community support projects.
We also support, on a yearly basis, registered charities focusing on problem gambling therapy. Kambi supports, via monetary donations, GambleAware and Gambling Therapy (part of the UK-based charity the Gordon Moody Association).
GambleAware is one of the leading charities committed to minimising gambling-related harm in the UK. It funds education, prevention and treatment services and commissions research to broaden public understanding of gambling-related harm. Gambling Therapy relies on charitable funding and is the only online service which provides free advice, support and information to people affected by problem gambling throughout the world.
Kambi strongly supports the principles, aims and values of both GambleAware and Gambling Therapy.
Our environmentCompared to many other industries, Kambi’s impact on the environment is fairly limited, relating mainly to offices and travel. We strive to minimise any adverse effects these may have on both our business and the environment as much as possible. In 2016, we moved to new premises in London and Bucharest. These new offices are designed to be environmentally friendly. We limit the need to travel for meetings by smart communication via internet, video and telephone conferences. We apply and promote a best practice approach in all our offices as we aim to cultivate environmental responsibility.
17Annual report and accounts 2016Kambi Group plc
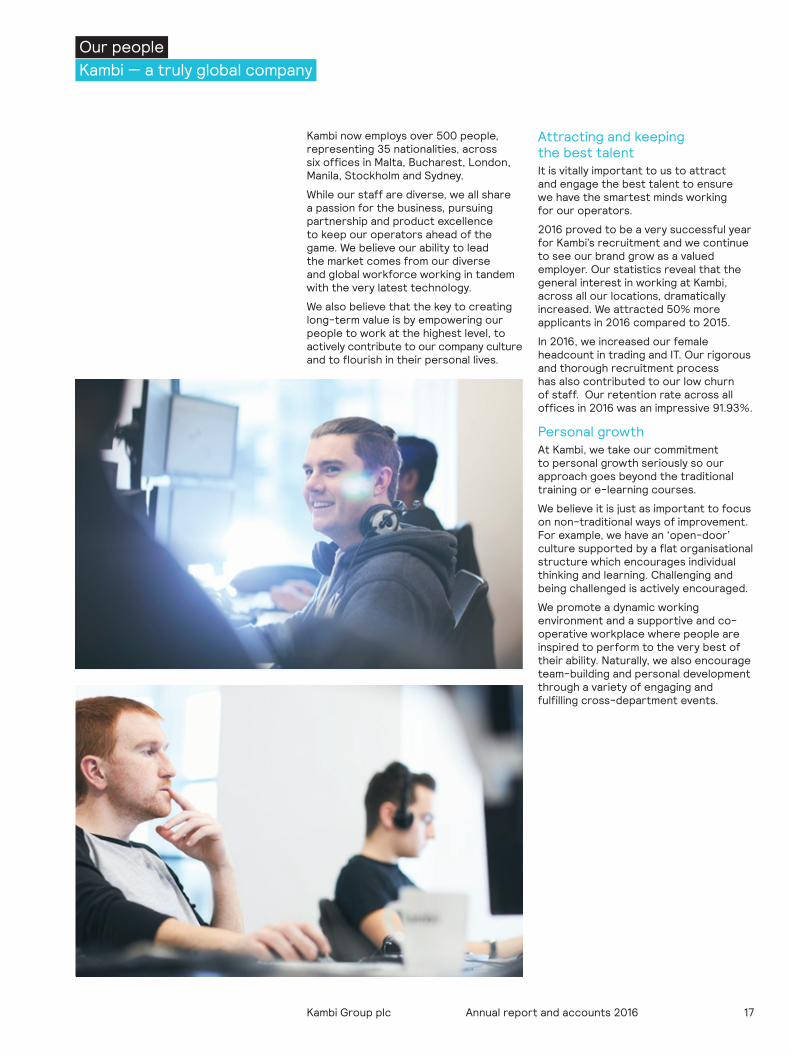
Kambi now employs over 500 people, representing 35 nationalities, across six offices in Malta, Bucharest, London, Manila, Stockholm and Sydney.
While our staff are diverse, we all share a passion for the business, pursuing partnership and product excellence to keep our operators ahead of the game. We believe our ability to lead the market comes from our diverse and global workforce working in tandem with the very latest technology.
We also believe that the key to creating long-term value is by empowering our people to work at the highest level, to actively contribute to our company culture and to flourish in their personal lives.
Attracting and keeping the best talent It is vitally important to us to attract and engage the best talent to ensure we have the smartest minds working for our operators.
2016 proved to be a very successful year for Kambi’s recruitment and we continue to see our brand grow as a valued employer. Our statistics reveal that the general interest in working at Kambi, across all our locations, dramatically increased. We attracted 50% more applicants in 2016 compared to 2015.
In 2016, we increased our female headcount in trading and IT. Our rigorous and thorough recruitment process has also contributed to our low churn of staff. Our retention rate across all offices in 2016 was an impressive 91.93%.
Personal growthAt Kambi, we take our commitment to personal growth seriously so our approach goes beyond the traditional training or e-learning courses.
We believe it is just as important to focus on non-traditional ways of improvement. For example, we have an ‘open-door’ culture supported by a flat organisational structure which encourages individual thinking and learning. Challenging and being challenged is actively encouraged.
We promote a dynamic working environment and a supportive and co-operative workplace where people are inspired to perform to the very best of their ability. Naturally, we also encourage team-building and personal development through a variety of engaging and fulfilling cross-department events.
Our people Kambi — a truly global company
18 Annual report and accounts 2016 Kambi Group plc
Share performance The Kambi share
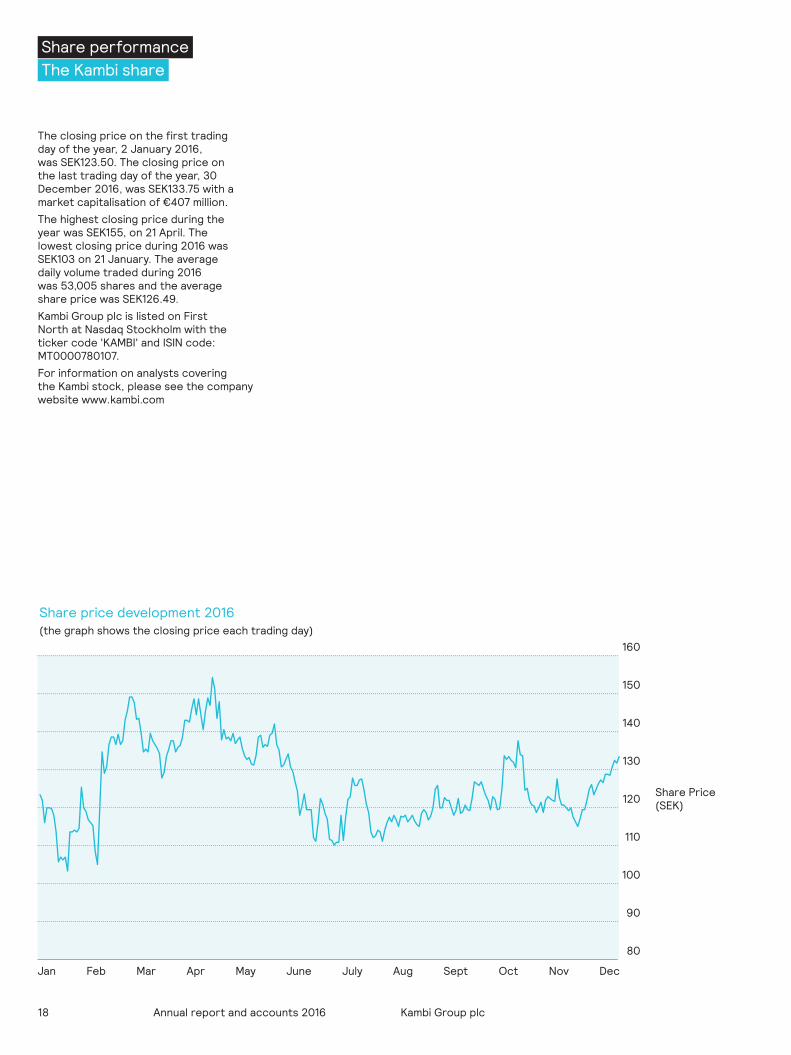
The closing price on the first trading day of the year, 2 January 2016, was SEK123.50. The closing price on the last trading day of the year, 30 December 2016, was SEK133.75 with a market capitalisation of €407 million.The highest closing price during the year was SEK155, on 21 April. The lowest closing price during 2016 was SEK103 on 21 January. The average daily volume traded during 2016 was 53,005 shares and the average share price was SEK126.49.Kambi Group plc is listed on First North at Nasdaq Stockholm with the ticker code 'KAMBI' and ISIN code: MT0000780107.For information on analysts covering the Kambi stock, please see the company website www.kambi.com
Share price development 2016(the graph shows the closing price each trading day)
160
150
140
130
120
110
100
90
80
Share Price(SEK)
Jan Feb Mar Apr May June July Aug Sept Oct Nov Dec
19Annual report and accounts 2016Kambi Group plc
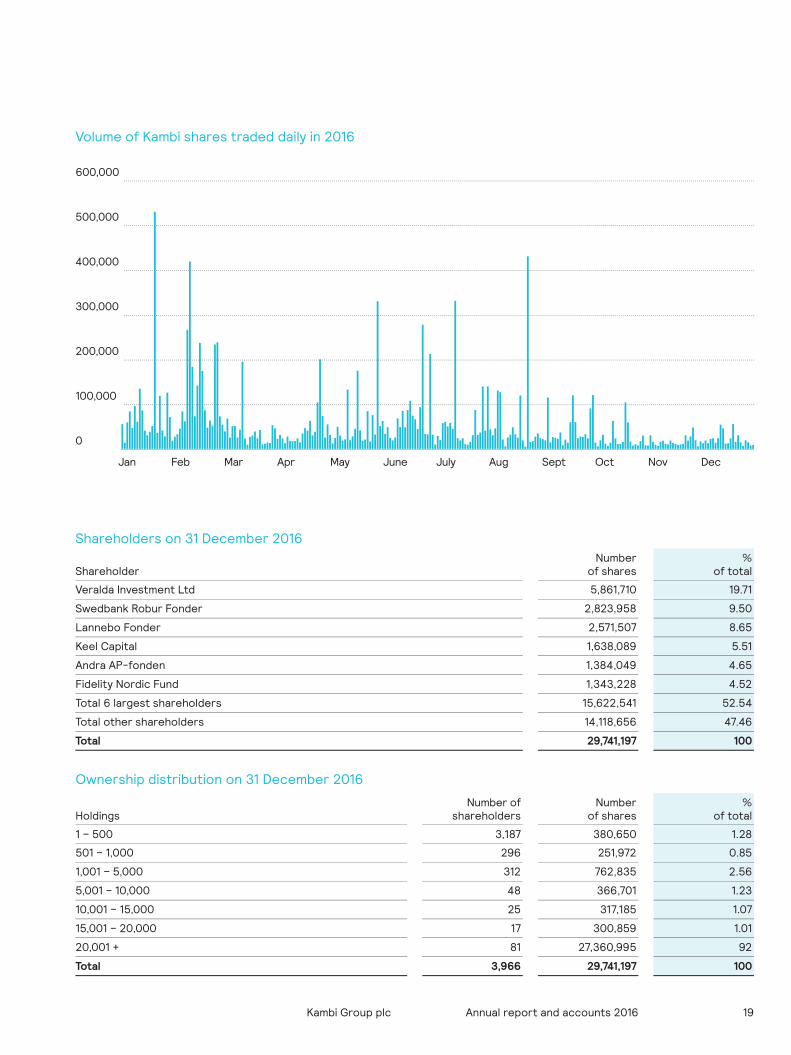
Shareholders on 31 December 2016
ShareholderNumber
of shares%
of total
Veralda Investment Ltd 5,861,710 19.71
Swedbank Robur Fonder 2,823,958 9.50
Lannebo Fonder 2,571,507 8.65
Keel Capital 1,638,089 5.51
Andra AP-fonden 1,384,049 4.65
Fidelity Nordic Fund 1,343,228 4.52
Total 6 largest shareholders 15,622,541 52.54
Total other shareholders 14,118,656 47.46
Total 29,741,197 100
Ownership distribution on 31 December 2016
HoldingsNumber of
shareholdersNumber
of shares%
of total
1 – 500 3,187 380,650 1.28
501 – 1,000 296 251,972 0.85
1,001 – 5,000 312 762,835 2.56
5,001 – 10,000 48 366,701 1.23
10,001 – 15,000 25 317,185 1.07
15,001 – 20,000 17 300,859 1.01
20,001 + 81 27,360,995 92
Total 3,966 29,741,197 100
Volume of Kambi shares traded daily in 2016
600,000
500,000
400,000
300,000
200,000
100,000
0
Jan Feb Mar Apr May June July Aug Sept Oct Nov Dec
20 Annual report and accounts 2016 Kambi Group plc
Risk factors General and financial risks
Set out on these pages are some of the business- and industry- related risk factors that could have consequences for Kambi’s future development. The risk factors are not arranged in order of importance or potential economic impact.
Regulatory and political environmentThe Group’s core business is strictly regulated by law in the markets where Kambi and its clients operate. Accordingly, political decisions, court rulings or changes in laws in the countries where Kambi or its operators have licences or commercial interests could have a material adverse effect on Kambi’s business and operations. Regulatory changes can also have a positive impact, enabling us to access a market which becomes regulated or re-regulated.
Risks related to ITKambi’s business is dependent on IT systems. System failures and other events that affect operations could have a material adverse effect on its business and results. The risk is mitigated by using continuous monitoring to detect any problems as early as possible. All critical servers are duplicated, i.e. if one server fails, another will immediately take over. Following any downtime, a detailed analysis is performed to ensure that the underlying reason for the downtime is understood and rectified.
Match fixingMatch fixing is defined as the manipulation of an event where the participants seek to fix the outcome for financial gain. To reduce the financial impact of this risk, Kambi has internal systems and alerts in place to highlight any indications of match fixing. We also collaborate with industry watchdogs and regulators. If match fixing were to lead to changes in regulatory environments, this could impact the results of operators and therefore Kambi’s financial performance.
Sport-specific IPRIn certain jurisdictions, regulators have begun to impose charges on licence holders for the right to offer odds, access data and use trademarks on certain sports. Any future changes in these charges could impact Kambi’s financial position.
Dependency on key operatorsA majority of Kambi’s revenue is currently generated from a few large operators. The loss of business with Kambi’s major operators could have a material adverse effect on the Group’s business.
Underlying performance of operatorsKambi’s financial performance depends on the underlying performance of its operators. This is a result of Kambi’s business model, whereby the commission received is set as a portion of the operators’ net gaming revenue.
A decline in the financial performance of Kambi’s operators could have a material effect on the Group’s financial position. Operators’ sports betting gross margins can vary significantly from one period to the next, depending on the outcome of sporting events.
Dependence on key personnel and skilled employeesThe future success of Kambi will significantly depend on the full involvement of the Board of Directors, management and certain key individuals. If one or more of these individuals were to resign, or otherwise not be able to perform relevant duties, this might have an adverse effect on the Group’s financial performance and reputation.
21Annual report and accounts 2016Kambi Group plc
Competition and price pressureKambi’s growth depends on its ability to develop and sell competitive products and services. As the market matures, increased competition and price pressure may materialise. The ambition is to continue striving to offer the best B2B Sportsbook in the market and to build on the customer portfolio with successful and loyal operators.
Foreign currency riskForeign exchange risks exist in the form of both transaction risks and translation risks. In the case of our operators handling transactions in a currency other than EUR to that which the invoice is issued in, currency movements can have an impact on the revenues generated by Kambi. Transaction risks occur in conjunction with purchases and sales of products and services in currencies other than the respective company's local currency. Translation risks occur in conjunction with the translation of the income statements and balance
sheets of foreign subsidiaries into EUR. Revenues are primarily derived from EUR transactions, followed by SEK, NOK and GBP. The Group’s purchases of services and overhead costs, however, are primarily in GBP and SEK. Changes in the valuation of EUR in relation to other currencies can thus have both positive and negative effects on the Group’s profit and financial position. Currency risk is to some degree managed by means of holding funds on short-term deposit in the currencies of the Group’s principal cash outflows.
Tax risksKambi conducts its business in accordance with its interpretation and understanding of the applicable tax laws and treaties, case law and the requirements of relevant tax authorities in the countries where it operates. Changes to regulatory, legislative and fiscal regimes in key markets could have an adverse effect on the Group’s results due to the added cost of gaming-related taxes, which are shared with the operators. In managing its taxation affairs, including estimating the amounts of taxation due, Kambi relies on the exercise of judgment concerning its understanding of, and compliance with, those laws assisted by professional advice.
Risk related to convertible bondIn 2014, Kambi Group plc issued a €7.5 million convertible bond to a wholly owned subsidiary of Kindred Group plc. According to the terms of the convertible bond, the Company is obliged to procure that certain events listed in the agreement do not take place unless with the prior consent of the lender. In case of a conversion, Kindred Group plc would obtain a controlling influence over the Company and would, consequently, have the power to control the outcome of most matters to be decided by vote at a shareholders’ meeting.
22 Annual report and accounts 2016 Kambi Group plc
Corporate governanceKambi Group plc
Board of Directors 24
Senior executives 25
Corporate governance report 26
Directors’ report 28

23Annual report and accounts 2016Kambi Group plc
24 Annual report and accounts 2016 Kambi Group plc
The Company’s Board of Directors consists of four ordinary members, including the Chairman of the Board. The members of the Board of Directors are listed in the table below:
Lars Stugemo Ordinary Board member (Chairman)
Anders Ström Ordinary Board member
Susan Ball Ordinary Board member
Patrick Clase Ordinary Board member
Lars Stugemo (Swedish, born 1961)Lars is CEO and President of HiQ International. HiQ is an IT and management consultancy firm, founded in 1995, with Lars as one of the co-founders. HiQ is listed on NASDAQ OMX Stockholm. Lars has been a member of IVA (Kungliga vetenskapsakademien) and VI since 2013. Lars holds a MSc Electronics Engineering from KTH Stockholm.
Lars Stugemo holds 26,180 shares in the Company.
Anders Ström (Swedish, born 1970)After studying Mathematics, Statistics and Economics at Karlstad University, Anders founded sports information company Trav- och Sporttjänsten in 1993. Founder of Kindred Group plc in 1997. He has held various positions within the Unibet Group including Chief Executive Officer and Chairman of the Board. Co-founder of Kambi Sports Solutions in 2010. Chairman of the Advisory Board in Kambi until May 2014 and then Board member of Kambi since the listing in 2014. Other board assignment: Veralda AB.
Anders Ström holds 5,861,710 shares in the Company.
Susan Ball (British, born 1961)Susan qualified at Ernst & Young and has extensive experience in private and listed online high-growth businesses across all markets. She is the ex-CFO of Unibet Group plc (2003–2008), and worked throughout its listing on Nasdaq OMX Stockholm. She has also worked for Cadbury Schweppes, Bookatable.com and MOO.com.
Susan Ball holds 14,980 shares in the Company.
Patrick Clase (Swedish, born 1968)Patrick is Chief Investment Officer and director of Veralda Investment Ltd. Amongst other positions held, Patrick has worked as a Financial Analyst with ABG Sundal Collier, Alfred Berg and is experienced in the financial markets. He holds a BSc in Economics from Lund University and a CEFA from Stockholm School of Economics.
Patrick Clase holds 22,619 shares in the Company.
Board of DirectorsKambi Group plc
25Annual report and accounts 2016Kambi Group plc
Kristian Nylén (Swedish, born 1970) Kristian joined Unibet Group plc in 2000. From 2003 Kristian was responsible for the Sportsbook operation and a part of the management team. Before Unibet Group plc Kristian worked as a Real Estate analyst at Catella and Ernst & Young. Kristian has a BSc in Business Administration, Mathematics and Statistics from the University of Karlstad. Kristian was cofounder of Kambi in 2010.
Kristian Nylén holds 465,000 shares and 300,000 options in the Company.
David Kenyon (British, born 1975) David qualified at KPMG and joined Unibet Group plc in 2002 as Group FC where he worked on the Unibet Group plc NASDAQ OMX Stockholm listing. He then spent two years at the Capital Pub Company plc as CFO, where he floated the company on AIM, before moving to Kambi. David has an MA from Oxford University.
David Kenyon holds 42,330 shares and 60,000 options in the Company.
Erik Lögdberg (Swedish, born 1979) Erik started working for Unibet Group plc in 2005, straight after he had finished his degree in Electrical Engineering at the Royal Institute of Technology in Stockholm. His main responsibility was as Head of Live Betting from an operational as well as product development perspective.
Erik Lögdberg holds 90,000 shares and 90,000 options in the Company.
Jonas Jansson (Swedish, born 1969) Before joining Kambi, Jonas was Head of Trading for Unibet’s Sportsbook from 2003 onwards. Jonas holds a Bachelor degree in Financial Economics and Mathematics from the University of Karlstad. Jonas has also studied Data and System development at the University of Stockholm.
Jonas Jansson holds 225,000 shares and 60,000 options in the Company.
Ian Freeman (British, born 1970) Ian's specialisation is developing international new business and customer relationship strategies to help organisations drive sustainable revenues streams through the development of new long-term business partnerships. Prior to joining Kambi in 2012, Ian was Global Strategic Account Director at the US based SAAS organisation, Moxie Software. Ian holds an MBA (dist) from Hult International Business School.
Ian Freeman holds 6,620 shares and 60,000 options in the Company.
Andreas Söneby (Swedish, born 1973) Before joining Kambi, Andreas held several different management positions within Unibet’s IT department from 2006 onwards: Head of Development, IT Director and finally CTO at Unibet Group plc Andreas holds a degree in Computer Science from the Royal Institute of Technology in Stockholm.
Andreas Söneby holds 150,300 shares in the Company.
Jonas Demnert (Swedish, born 1979) Jonas worked with the Unibet Group plc Sportsbook platform from 2007 onwards and has extensive knowledge in building secure, scalable and available systems. Prior to joining Unibet Group plc Jonas worked as a consultant in the telecom and media industry. Jonas holds a Master of Science in Engineering and a Degree in Information and Communication Technology from the Royal Institute of Technology Sweden.
Jonas Demnert holds 90,000 shares and 60,000 options in the Company.
Joni Hovi (Finnish, born 1970) Joni joined Kambi in January 2016 and comes with more than 13 years of expertise in the government sector. Most recently Joni held a similar role at Sportradar, and before this he spent many years within the Finnish monopoly organisation, Veikkaus. Joni has also been active in the field of sports integrity. Joni holds a degree in Production Management and Business Administration from the Kymenlaakso University of Applied Sciences.
Joni Hovi holds 30,000 options in the Company.
Kelly Hartman(Australian, born 1972)Kelly joined Kambi in January 2017 and comes with more than 20 years’ experience within the field of general HR, talent acquisition, IT start up experience and organisational development programmes. Kelly has spent many years at large companies including BHP Billiton, National Australia Bank, Regus and Deutsche Bank. She holds a BA (Hons) in Psychology and a post graduate in Applied Psychology from Monash University in Melbourne.
Senior executivesKambi Group plc
Senior executives and their positions are listed in the table below.
Kristian Nylén CEO
David Kenyon CFO
Erik Lögdberg Deputy CEO, CBDO
Jonas Jansson COO
Ian Freeman CCO
Andreas Söneby CIO
Jonas Demnert CTO
Joni Hovi Executive Director, State Lottery Business
Kelly Hartman CPO
26 Annual report and accounts 2016 Kambi Group plc
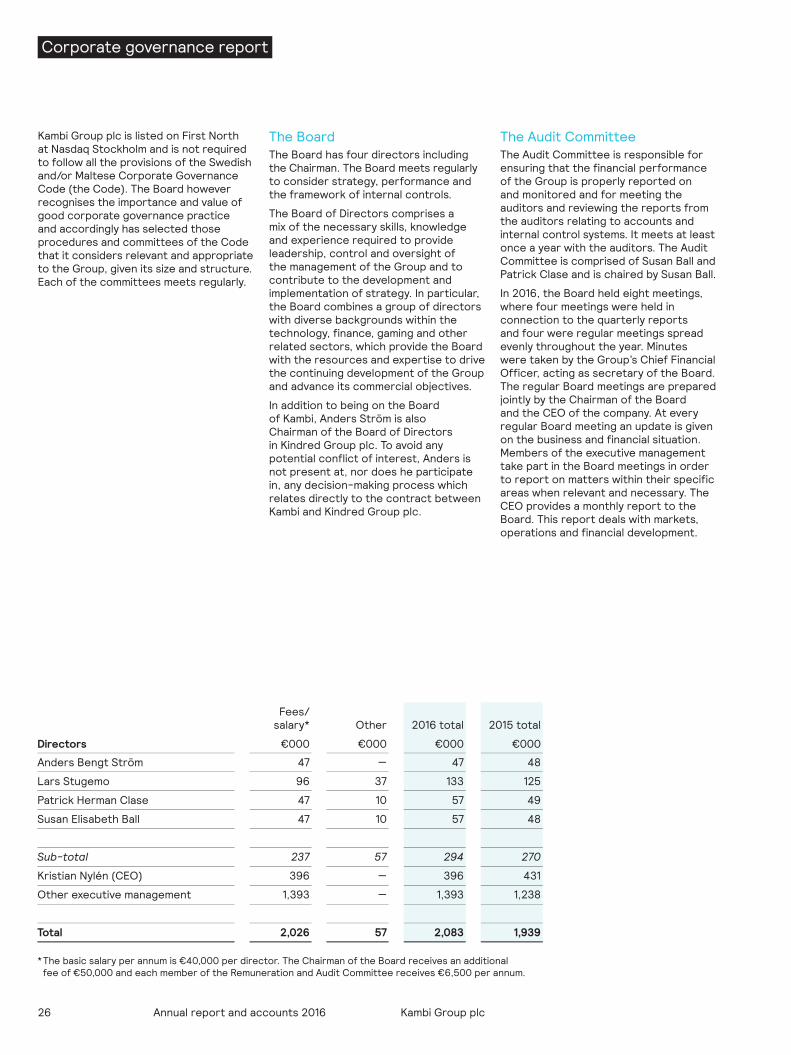
Kambi Group plc is listed on First North at Nasdaq Stockholm and is not required to follow all the provisions of the Swedish and/or Maltese Corporate Governance Code (the Code). The Board however recognises the importance and value of good corporate governance practice and accordingly has selected those procedures and committees of the Code that it considers relevant and appropriate to the Group, given its size and structure. Each of the committees meets regularly.
The Board The Board has four directors including the Chairman. The Board meets regularly to consider strategy, performance and the framework of internal controls.
The Board of Directors comprises a mix of the necessary skills, knowledge and experience required to provide leadership, control and oversight of the management of the Group and to contribute to the development and implementation of strategy. In particular, the Board combines a group of directors with diverse backgrounds within the technology, finance, gaming and other related sectors, which provide the Board with the resources and expertise to drive the continuing development of the Group and advance its commercial objectives.
In addition to being on the Board of Kambi, Anders Ström is also Chairman of the Board of Directors in Kindred Group plc. To avoid any potential conflict of interest, Anders is not present at, nor does he participate in, any decision-making process which relates directly to the contract between Kambi and Kindred Group plc.
The Audit Committee The Audit Committee is responsible for ensuring that the financial performance of the Group is properly reported on and monitored and for meeting the auditors and reviewing the reports from the auditors relating to accounts and internal control systems. It meets at least once a year with the auditors. The Audit Committee is comprised of Susan Ball and Patrick Clase and is chaired by Susan Ball.
In 2016, the Board held eight meetings, where four meetings were held in connection to the quarterly reports and four were regular meetings spread evenly throughout the year. Minutes were taken by the Group’s Chief Financial Officer, acting as secretary of the Board. The regular Board meetings are prepared jointly by the Chairman of the Board and the CEO of the company. At every regular Board meeting an update is given on the business and financial situation. Members of the executive management take part in the Board meetings in order to report on matters within their specific areas when relevant and necessary. The CEO provides a monthly report to the Board. This report deals with markets, operations and financial development.
Directors
Fees/salary*
€000
Other
€000
2016 total
€000
2015 total
€000
Anders Bengt Ström 47 — 47 48
Lars Stugemo 96 37 133 125
Patrick Herman Clase 47 10 57 49
Susan Elisabeth Ball 47 10 57 48
Sub-total 237 57 294 270
Kristian Nylén (CEO) 396 — 396 431
Other executive management 1,393 — 1,393 1,238
Total 2,026 57 2,083 1,939
* The basic salary per annum is €40,000 per director. The Chairman of the Board receives an additional fee of €50,000 and each member of the Remuneration and Audit Committee receives €6,500 per annum.
Corporate governance report
27Annual report and accounts 2016Kambi Group plc
The Nomination Committee The Nomination Committee is responsible for reviewing the size, structure and composition of the Board, succession planning, the appointment of replacement and/or additional directors and for making the appropriate recommendations to the Board. The Committee also prepares proposals regarding Board remuneration and fees to the auditor.
The members of the Nomination Committee shall represent all shareholders and be appointed by the three or four largest shareholders as at 30 September each year, having expressed their willingness to participate in the Committee. Kambi's Nomination Committee shall consist of not less than four and not more than five members, of which one shall be the Chairman of the Board.
The members are: Anders Ström — Veralda Investment Ltd, Lars Stugemo — Chairman of the Board, Evert Carlsson — Swedbank Robur Fonder, Johan Ståhl — Lannebo Fonder, and Mathias Svensson - Keel Capital. The Committee is chaired by Anders Ström.
The Remuneration Committee The Remuneration Committee reviews the performance of the senior managers and sets and reviews the scale and structure of their remuneration, the basis of their remuneration and the terms of their service agreements with due regard to the interests of shareholders. The Remuneration Committee is comprised of Anders Ström and Lars Stugemo and is chaired by Anders Ström. Details of the remuneration of the Board of Directors and senior executives are set out left.
Kambi Remuneration policy and reportThe policy of the Board is to attract, retain and motivate the best managers by rewarding them with competitive compensation packages linked to the Group’s financial and strategic objectives. The compensation packages need to be fair and reasonable in comparison with companies of a similar size, industry and international scope. The components of remuneration for executive managers comprise base salary, benefits, performance-related salary and long-term incentives.
The variable remuneration shall be in proportion to the executive’s responsibilities and authority. It shall also be subject to an upper limit and based on fulfilment of targets aligned with the shareholders’ long-term interests. Where appropriate, the variable element is based on quantitative and qualitative targets. The variable element of remuneration for the CEO and other members of the executive management are maximum 50% of the fixed salary cost, depending on the attainment of personal and company performance targets, such as new customer signings and financial goals. Salaries in 2016 were increased by an average of 3% compared to 2015. The CEO and the executive management are entitled to the same benefits as other local employees.
Termination and severance pay: in the case of the CEO, there is a reciprocal period of notice of 12 months. If employment is terminated by the Company, severance pay equivalent to 12 months’ salary is payable. If employment is terminated by the CEO, salary and other benefits are paid for 12 months after cessation of employment, during which period the CEO is prohibited from entering into competing activities. In the case of other members of the executive management, there is a mutual period of notice of six months.
Issues concerning remuneration of the executive management are handled by the CEO. Decisions on remuneration of the CEO are taken by the Board of Directors.
The members of the Remuneration Committee have no personal interest in the outcome of their decisions and give due regard to the interests of shareholders and to the continuing financial and commercial health of the business.

28 Annual report and accounts 2016 Kambi Group plc
29Annual report and accounts 2016Kambi Group plc
Directors’ report Statement of directors’ responsibilities
The directors present their report on the affairs of the Group, together with the audited consolidated financial statements and auditor’s report, for the year ended 31 December 2016.
Principal activities Kambi Group plc is a B2B supplier of fully managed sports betting services on an in-house developed software platform, providing premium turnkey sports betting services to B2C gaming operators.
Results and dividends The consolidated income statement is set out on page 36. The profit after tax was €7.5 (€6.2) million.
The Board does not propose a dividend. As stated in the Company Description in 2014, dividends should not be expected for at least three years after the listing.
Going concern As required by Listing Rule 5.62 issued by the Listing Authority, upon due consideration of the Company’s state of affairs, capital adequacy and solvency, the directors confirm the Company’s ability to continue in operational existence for the foreseeable future. For this reason, in preparing the financial statements, they continue to adopt the going concern basis.
Performance review The directors have performed a detailed review of the Group’s performance during the year, the highlights of which are disclosed on pages 6 and 7 of this annual report.
Five new customer contracts signed – LeoVegas, Rank Group, Mr Green, R. Franco and Grupo Televisa – and an extension to the contract with 32Red.
Partnership signed with Novomatic Lottery Solutions (NLS).
The HTML5 client was rolled out, a service designed for operator empowerment.
Price differentiation tools offered to Kambi's operators.
Post-reporting date eventsNo adjusting or significant non-adjusting events have occurred between the reporting date and the date of authorisation.
Financial and non-financial risk management The directors have undertaken a thorough review of both the financial and non-financial risks faced by the Group and details thereof can be found on pages 20-21 of this annual report.
Future developmentsThe Company intends to continue its investment in people and technology to develop its Sportsbook service.
Directors The following have served as directors during the year under review:
Lars Stugemo (Chairman)
Anders Ström
Susan Ball
Patrick Clase
Lars Stugemo, Anders Ström, Susan Ball and Patrick Clase will seek re-election at the forthcoming AGM.
Statement of directors’ responsibilitiesThe directors are required by the Maltese Companies Act (Chap. 386) to prepare financial statements in accordance with International Financial Reporting Standards as adopted by the EU which give a true and fair view of the state of affairs of the Group at the end of each financial year and of the profit or loss of the Group for the year then ended. In preparing the financial statements, the directors are required to:
select suitable accounting policies and apply them consistently;
make judgments and estimates that are reasonable; and
prepare the financial statements on a going concern basis, unless it is inappropriate to presume that the Group will continue in business as a going concern.
The directors are responsible for ensuring that proper accounting records are kept which disclose with reasonable accuracy at any time the financial position of the Group and which enable the directors to ensure that the financial statements comply with the Companies Act (Chap. 386).
This responsibility includes designing, implementing and maintaining such internal control as the directors determine is necessary to enable the preparation of financial statements that are free from material misstatement, whether due to fraud or error. The directors are also responsible for safeguarding the assets of the Group, and hence for taking reasonable steps for the prevention and detection of fraud and other irregularities.
Disclosure of information to the auditor At the date of making this report, the directors confirm the following:
As far as each director is aware, there is no relevant information needed by the independent auditor in connection with preparing the audit report of which the independent auditor is unaware, and
Each director has taken all steps that he/she ought to have taken as a director in order to make him/her-self aware of any relevant information needed by the independent auditor in connection with preparing the audit report and to establish that the independent auditor is aware of that information.
Independent auditor The auditor, Mazars, has indicated its willingness to continue in office and a resolution for its reappointment will be proposed at the Annual General Meeting.
On behalf of the Board Malta, 28 March 2017
Lars Stugemo Chairman
Susan Ball Member of the Board
30 Annual report and accounts 2016 Kambi Group plc
Financial reportConsolidated financial statements for the year ended 31 December 2016
Independent auditor's report 32
Financial review 34
Financial statements 36
AGM and company information 65
Glossary 66

31Annual report and accounts 2016Kambi Group plc
32 Annual report and accounts 2016 Kambi Group plc
Report on the audit of the financial statementsWe have audited the consolidated financial statements of Kambi Group plc (the Group), set out on pages 36 to 64, which comprise the consolidated statement of financial position as at 31 December 2016, and the consolidated statement of comprehensive income, consolidated statement of changes in equity and consolidated statement of cash flows for the year then ended, and notes to the financial statements, including a summary of significant accounting policies.
OpinionIn our opinion, the consolidated financial statements give a true and fair view of the financial position of the Group as at 31 December 2016 and of its financial performance and its cash flows for the year then ended in accordance with International Financial Reporting Standards as adopted by the EU (EU IFRSs) and have been prepared in accordance with the requirements of the Companies Act (Cap. 386).
Basis for opinionWe conducted our audit in accordance with International Standards on Auditing (ISAs). Our responsibilities under those standards are further described in the Auditor’s Responsibilities for the Audit of the Financial Statements section of our report. We are independent of the Group in accordance with the International Ethics Standards Board for Accountants’ Code of Ethics for Professional Accountants (IESBA Code) together with the ethical requirements that are relevant to our audit of the financial statements in accordance with the Accountancy Profession (Code of Ethics for Warrant Holders) Directive issued in terms of the Accountancy Profession Act (Cap. 281) in Malta, and we have fulfilled our other ethical responsibilities in accordance with these requirements and the IESBA Code. We believe that the audit evidence we have obtained is sufficient and appropriate to provide a basis for our opinion.
Key audit matters Key audit matters are those matters that, in our professional judgment, were of most significance in our audit of the financial statements of the current period. These matters were addressed in
the context of our audit of the financial statements as a whole, and in forming our opinion thereon, and we do not provide a separate opinion on these matters.
Dependence on key customers Risk descriptionAs described in the Revenue and Segmental note 6 to the financial statements, the Group’s revenue is mainly dependent on two key customers. Such customers currently account for 78% of the Group’s revenue.
How the scope of our audit responded to the riskWe considered the risk associated to the dependence of two key customers and the board’s assessment of this risk. We reviewed the sales strategy of the Group, as well as new sales leads being addressed by the board and the Group budgets.
Our review specifically focused on:
Assessing the size of new leads.
Assessing the successes of the Group in terms of new contracts signed during 2016.
Considering budgeted increase in the company portfolio and the consequent reduction in the dependency on these two key clients.
Findings We are satisfied that the approach being adopted by the board, the new clients won and the overall attainment of most of the sales targets to be appropriately addressing this risk.
Other information The directors are responsible for the other information. The other information comprises the directors’ report, chairman's statement and chief executive officer review. Our opinion on the financial statements does not cover this information, including the directors' report.
In connection with our audit of the financial statements, our responsibility is to read the other information and, in doing so, consider whether the other information is materially inconsistent with the financial statements or our knowledge obtained in the audit, or otherwise appears to be materially misstated.
With respect to the directors’ report, we also considered whether the directors’ report includes the disclosures required by Article 177 of the Maltese Companies Act (Cap. 386). Based on the work we have performed, in our opinion:
the information given in the directors’ report for the financial year for which the financial statements are prepared is consistent with the financial statements; and
the directors’ report has been prepared in accordance with the Maltese Companies Act (Cap.386).
In addition, in light of the knowledge and understanding of the Group and its environment obtained in the course of the audit, we are required to report if we have identified material misstatements in the directors’ report. We have nothing to report in this regard.
Responsibilities of the directorsThe directors are responsible for the preparation of the financial statements that give a true and fair view in accordance with IFRS, and for such internal control as the directors determine is necessary to enable the preparation of financial statements that are free from material misstatement, whether due to fraud or error.
In preparing the financial statements, the directors are responsible for assessing the Group’s ability to continue as a going concern, disclosing, as applicable, matters related to going concern and using the going concern basis of accounting unless the directors either intend to liquidate the Company or to cease operations, or has no realistic alternative but to do so.
Auditor’s responsibilities for the audit of the financial statementsOur objectives are to obtain reasonable assurance about whether the financial statements as a whole are free from material misstatement, whether due to fraud or error, and to issue an auditor’s report that includes our opinion. Reasonable assurance is a high level of assurance, but is not a guarantee that an audit conducted in accordance with ISAs will always detect a material misstatement when it exists. Misstatements can arise from fraud or error and are considered material
Independent auditor’s report tothe Shareholders of Kambi Group plc Report on the financial statements
33Annual report and accounts 2016Kambi Group plc
if, individually or in the aggregate, they could reasonably be expected to influence the economic decisions of users taken on the basis of these financial statements.
As part of an audit in accordance with ISAs, we exercise professional judgment and maintain professional scepticism throughout the audit. We also:
Identify and assess the risks of material misstatement of the financial statements, whether due to fraud or error, design and perform audit procedures responsive to those risks, and obtain audit evidence that is sufficient and appropriate to provide a basis for our opinion. The risk of not detecting a material misstatement resulting from fraud is higher than for one resulting from error, as fraud may involve collusion, forgery, intentional omissions, misrepresentations, or the override of internal control.
Obtain an understanding of internal control relevant to the audit in order to design audit procedures that are appropriate in the circumstances, but not for the purpose of expressing an opinion on the effectiveness of the Company’s internal control.
Evaluate the appropriateness of accounting policies used and the reasonableness of accounting estimates and related disclosures made by the directors.
Conclude on the appropriateness of the directors’ use of the going concern basis of accounting and based on the audit evidence obtained, whether a material uncertainty exists related to events or conditions that may cast significant doubt on the Company’s ability to continue as a going concern. If we conclude that a material uncertainty exists, we are required to draw attention in our auditor’s report to the related disclosures in the financial statements or, if such disclosures are inadequate, to modify our opinion. Our conclusions are based on the audit evidence obtained up to the date of our auditor’s report. However, future events or conditions may cause the company to cease to continue as a going concern.
Evaluate the overall presentation, structure and content of the financial statements, including the disclosures, and whether the financial statements represent the underlying transactions and events in a manner that achieves fair presentation.
Obtain sufficient appropriate audit evidence regarding the financial information of the entities or business activities within the Group to express an opinion on the consolidated financial statements. We are responsible for the direction, supervision and performance of the Group audit. We remain solely responsible for our audit opinion.
We communicate with the directors regarding, among other matters, the planned scope and timing of the audit and significant audit findings, including any significant deficiencies in internal control that we identify during our audit.
We also provide those charged with governance with a statement that we have complied with relevant ethical requirements regarding independence, and to communicate with them all relationships and other matters that may reasonably be thought to bear on our independence, and where applicable, related safeguards.
From the matters communicated with those charged with governance, we determine those matters that were of most significance in the audit of the consolidated financial statements of the current period and are therefore the key audit matters. We describe these matters in our auditor’s report unless law or regulation precludes public disclosure about the matter or when, in extremely rare circumstances, we determine that a matter should not be communicated in our report because the adverse consequences of doing so would reasonably be expected to outweigh the public interest benefits of such communication.
Report on other legal and regulatory requirements Report on the statement of compliance with the Principles of Good Corporate GovernanceThe Listing Rules issued by the Malta Financial Services Authority require the directors to prepare and include in their annual report a Corporate Governance Statement providing an explanation of the extent to which they have adopted the Code of Principles of Good Corporate Governance and the effective measures that they have taken to ensure compliance throughout the accounting period with those Principles.
The Listing Rules also require the auditor to include a report on the Corporate Governance Statement prepared by the directors. We read the Corporate Governance Statement and consider the implications for our report if we become aware of any apparent misstatements or material inconsistencies with the financial statements included in the annual report. Our responsibilities do not extend to considering whether this statement is consistent with any other information included in the annual report.
We are not required to, and we do not, consider whether the board's statements on internal control included in the Corporate Governance Statement cover all risks and controls, or form an opinion on the effectiveness of the company's corporate governance procedures or its risk and control procedures.
In our opinion, the Corporate governance report set out on pages 26 to 27 has been properly prepared in accordance with the requirements of the Listing Rules issued by the Malta Listing Authority.
Adequacy of explanations received and accounting recordsUnder the Maltese Companies Act (Cap. 386) we are required to report to you if, in our opinion:
We have not received all the information and explanations we require for our audit.
Adequate accounting records have not been kept, or that returns adequate for our audit have not been received from branches not visited by us.
The financial statements are not in agreement with the accounting records and returns.
We have nothing to report to you in respect of these responsibilities.
This copy of the audit report has been signed by Paul Giglio (Partner) for and on behalf of:
Mazars Malta Certified Public AccountantsAttard28 March 2017

34 Annual report and accounts 2016 Kambi Group plc
35Annual report and accounts 2016Kambi Group plc
Financial review
Revenue Revenue represents fees received for sports betting services rendered to Kambi’s operators. Kambi charges its operators a monthly fee, based on a number of variables, including fixed fees, commission based on the profits generated for operators and the number of live events offered.
Total revenue in 2016 increased to €56.0 (2015: €47.7) million. The increase of 17% year-on-year demonstrates Kambi’s continued growth, underpinned by the success of its operators.
Administrative expenses Administrative expenses for 2016 were €46.8 (2015: €40.2) million.
Excluding depreciation and amortisation, ongoing administrative expenses were €39.9 (2015: €34.0) million, of which €21.8 (2015: €20.0) million were salaries and associated costs. The increase in salaries can be attributed to the planned increase in full-time staff, as part of the continued development of the Kambi service, as well as salary increases in line with the market.
Note 7 in the financial statements on page 47 provides more analysis of operating costs.
EBITDA and operating profit Earnings before interest, tax and depreciation and amortisation (EBITDA) for the full year 2016 were €15.6 (2015: €13.6) million. Profit from operations for the full year 2016 was €8.8 (2015: €7.4) million.
Profit after tax Profit after tax for the full year 2016 was €7.5 (2015: €6.2) million.
Development and acquisition costs of intangible assets In the full year 2016, development expenditure of €7.6 (2015: €6.1) million was capitalised. The key elements of capitalised development costs during 2016 were system automation, front-end and retail service development.
Balance sheet Kambi's strong balance sheet reflects the Group's growth during the year.
Certain non-current assets of the Group relate to capitalised IT development costs. Other non-current assets include computer software, computer hardware, fixtures & fittings and deferred tax. The non-cash current assets on the balance sheet relate to trade receivables, other receivables and prepayments.
Significant liabilities on the balance sheet include the convertible bond (see note 22 on page 53) and trade and other payables (see note 21 on page 53).
Cash flow The net cash inflow for 2016 was €5.7 (2015: €4.4) million, increasing the total cash balance at the end of 2016 to €32.4 (2015: €27.5) million.
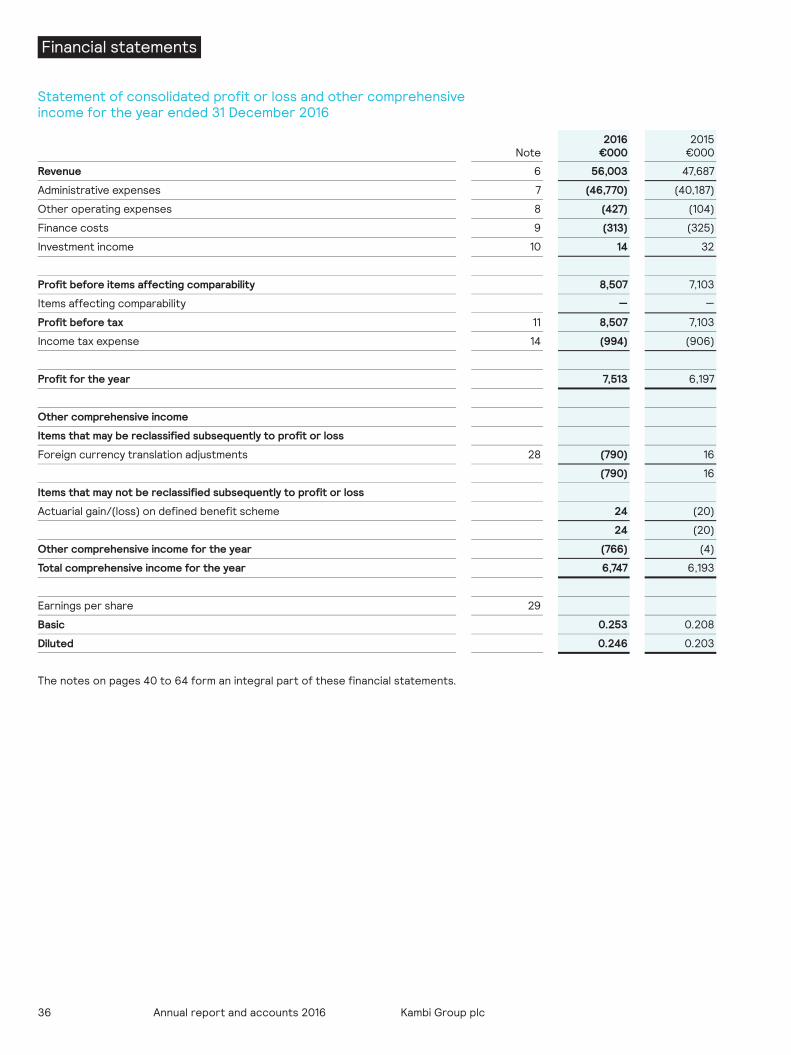
36 Annual report and accounts 2016 Kambi Group plc
Financial statements
Statement of consolidated profit or loss and other comprehensive income for the year ended 31 December 2016
Note2016
€0002015
€000
Revenue 6 56,003 47,687
Administrative expenses 7 (46,770) (40,187)
Other operating expenses 8 (427) (104)
Finance costs 9 (313) (325)
Investment income 10 14 32
Profit before items affecting comparability 8,507 7,103
Items affecting comparability — —
Profit before tax 11 8,507 7,103
Income tax expense 14 (994) (906)
Profit for the year 7,513 6,197
Other comprehensive income
Items that may be reclassified subsequently to profit or loss
Foreign currency translation adjustments 28 (790) 16
(790) 16
Items that may not be reclassified subsequently to profit or loss
Actuarial gain/(loss) on defined benefit scheme 24 (20)
24 (20)
Other comprehensive income for the year (766) (4)
Total comprehensive income for the year 6,747 6,193
Earnings per share 29
Basic 0.253 0.208
Diluted 0.246 0.203
The notes on pages 40 to 64 form an integral part of these financial statements.
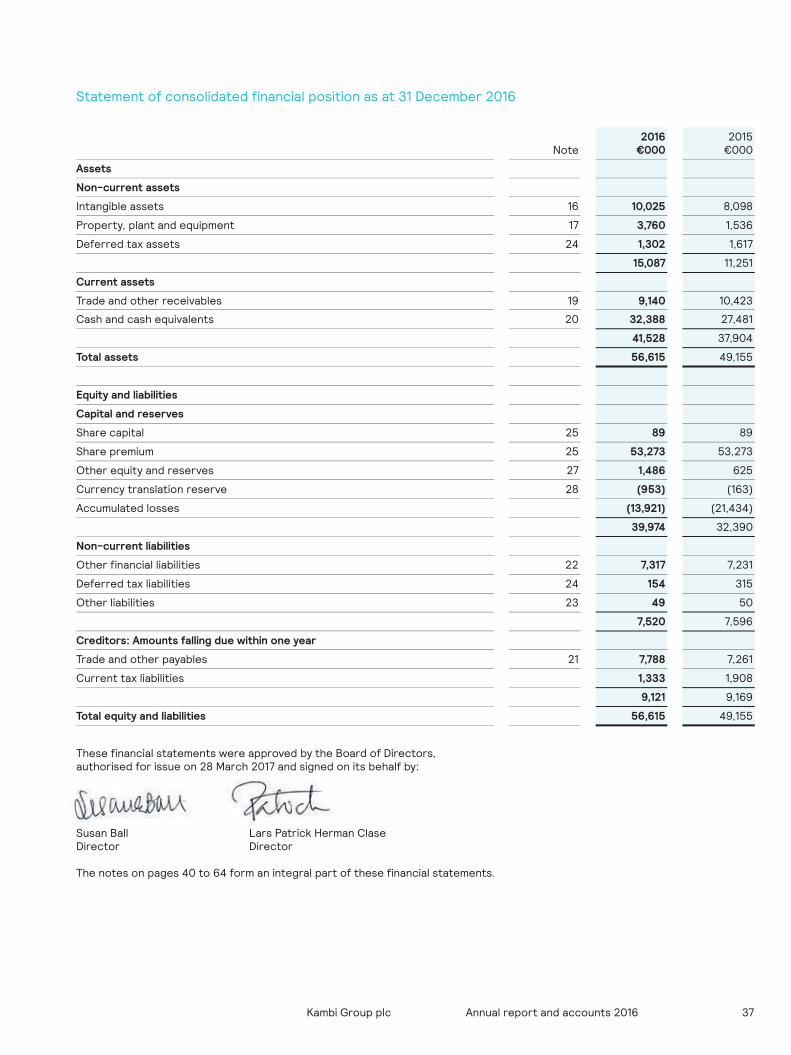
37Annual report and accounts 2016Kambi Group plc
Statement of consolidated financial position as at 31 December 2016
Note2016
€0002015
€000
Assets
Non-current assets
Intangible assets 16 10,025 8,098
Property, plant and equipment 17 3,760 1,536
Deferred tax assets 24 1,302 1,617
15,087 11,251
Current assets
Trade and other receivables 19 9,140 10,423
Cash and cash equivalents 20 32,388 27,481
41,528 37,904
Total assets 56,615 49,155
Equity and liabilities
Capital and reserves
Share capital 25 89 89
Share premium 25 53,273 53,273
Other equity and reserves 27 1,486 625
Currency translation reserve 28 (953) (163)
Accumulated losses (13,921) (21,434)
39,974 32,390
Non-current liabilities
Other financial liabilities 22 7,317 7,231
Deferred tax liabilities 24 154 315
Other liabilities 23 49 50
7,520 7,596
Creditors: Amounts falling due within one year
Trade and other payables 21 7,788 7,261
Current tax liabilities 1,333 1,908
9,121 9,169
Total equity and liabilities 56,615 49,155
These financial statements were approved by the Board of Directors, authorised for issue on 28 March 2017 and signed on its behalf by:
Susan Ball Lars Patrick Herman ClaseDirector Director
The notes on pages 40 to 64 form an integral part of these financial statements.
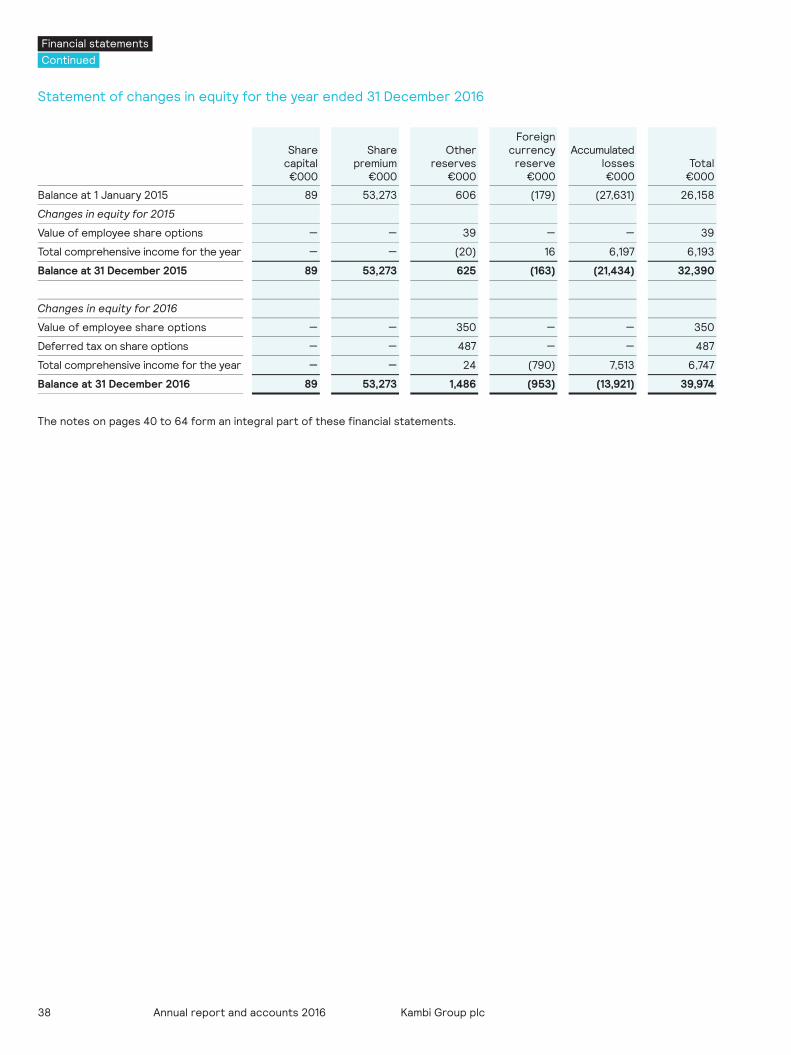
38 Annual report and accounts 2016 Kambi Group plc
Statement of changes in equity for the year ended 31 December 2016
Sharecapital€000
Share premium
€000
Other reserves
€000
Foreign currency
reserve€000
Accumulated losses€000
Total€000
Balance at 1 January 2015 89 53,273 606 (179) (27,631) 26,158
Changes in equity for 2015
Value of employee share options — — 39 — — 39
Total comprehensive income for the year — — (20) 16 6,197 6,193
Balance at 31 December 2015 89 53,273 625 (163) (21,434) 32,390
Changes in equity for 2016
Value of employee share options — — 350 — — 350
Deferred tax on share options — — 487 — — 487
Total comprehensive income for the year — — 24 (790) 7,513 6,747
Balance at 31 December 2016 89 53,273 1,486 (953) (13,921) 39,974
The notes on pages 40 to 64 form an integral part of these financial statements.
Financial statementsContinued
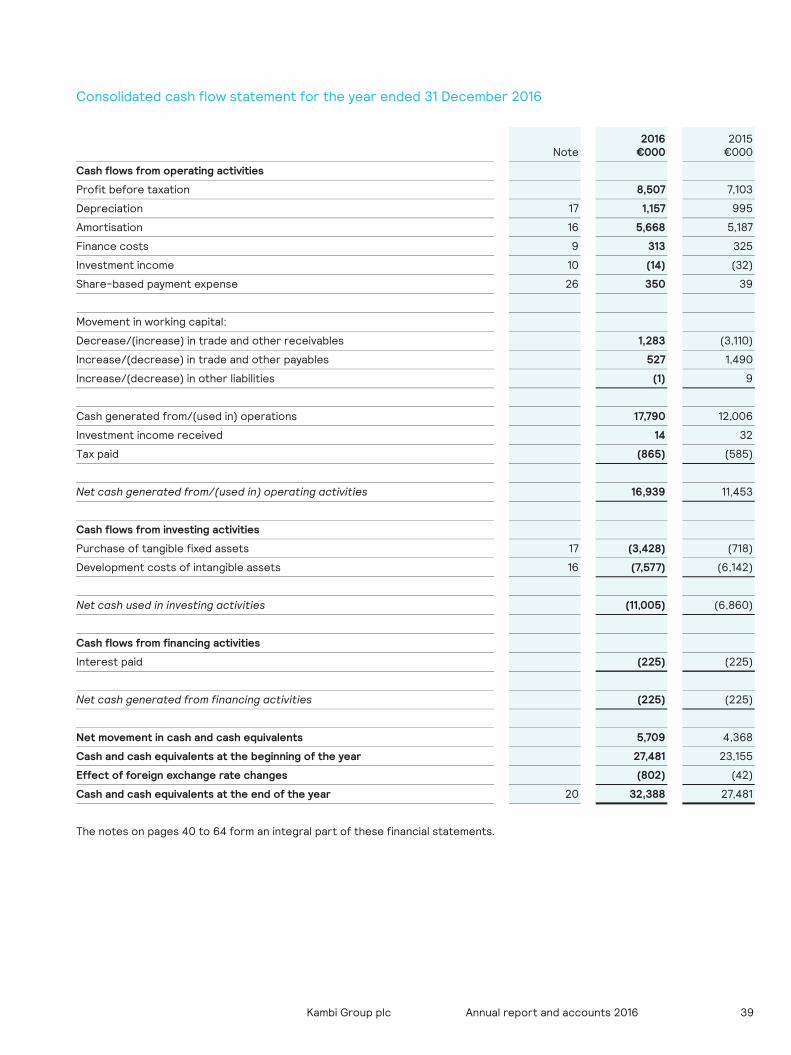
39Annual report and accounts 2016Kambi Group plc
Consolidated cash flow statement for the year ended 31 December 2016
Note2016
€0002015
€000
Cash flows from operating activities
Profit before taxation 8,507 7,103
Depreciation 17 1,157 995
Amortisation 16 5,668 5,187
Finance costs 9 313 325
Investment income 10 (14) (32)
Share-based payment expense 26 350 39
Movement in working capital:
Decrease/(increase) in trade and other receivables 1,283 (3,110)
Increase/(decrease) in trade and other payables 527 1,490
Increase/(decrease) in other liabilities (1) 9
Cash generated from/(used in) operations 17,790 12,006
Investment income received 14 32
Tax paid (865) (585)
Net cash generated from/(used in) operating activities 16,939 11,453
Cash flows from investing activities
Purchase of tangible fixed assets 17 (3,428) (718)
Development costs of intangible assets 16 (7,577) (6,142)
Net cash used in investing activities (11,005) (6,860)
Cash flows from financing activities
Interest paid (225) (225)
Net cash generated from financing activities (225) (225)
Net movement in cash and cash equivalents 5,709 4,368
Cash and cash equivalents at the beginning of the year 27,481 23,155
Effect of foreign exchange rate changes (802) (42)
Cash and cash equivalents at the end of the year 20 32,388 27,481
The notes on pages 40 to 64 form an integral part of these financial statements.
40 Annual report and accounts 2016 Kambi Group plc
Notes to the financial statements for the year ended 31 December 2016
1. General informationKambi Group plc is the Group’s ultimate parent company and is incorporated and domiciled in Malta. Its registered office and principal place of business is Level 3, Quantum House, Abate Rigord Street, Ta’ Xbiex, XBX1120 Malta. The principal activity of Kambi Group plc and its subsidiaries (the Group) is the provision of managed sports betting services.
2. Application of new and revised International Financial Reporting Standards (IFRSs)The accounting policies adopted are consistent with those of the previous financial period except as follows:The Company has adopted the following new and amended IFRS and IFRIC interpretations as of 1 January 2016:— IAS 1 Amendments – Disclosure Initiative
(effective from 1 January 2016)— Annual Improvements to IFRSs 2012–2014 Cycle
(effective from 1 January 2016)— IAS 27 Amendments – Equity Method in Separate Financial
Statements (effective from 1 January 2016)— IAS 16 and IAS 41 Amendments – Bearer Plants
(effective from 1 January 2016)— IAS 16 and IAS 38 Amendments – Clarification of
Acceptable Methods of Depreciation and Amortisation (effective from 1 January 2016)
— IFRS 11 Amendments – Accounting for Acquisition of Interest in Joint Operations (effective from 1 January 2016)
— IFRS 10, IFRS 12 and IAS 28 Amendments – Investment Entities: Applying the Consolidation Exemption (effective from 1 January 2016)
The amendments to IAS 1 give some guidance on how to apply the concept of materiality in practice. The adoption of the amendments did not have material impact on the Group’s consolidated financial statements. The application of other amendments did not apply to the Group and had no impact on the Group’s consolidated financial statements.
Standards, interpretations and amendments to published standards as adopted by the EU that are not yet effective up to 31 December 2016Up to the date of the financial position, certain new standards, amendments and interpretations to existing standards have been published but are not yet effective for the current reporting period and which the Group has not yet adopted. None of the below mentioned standards is expected to have a material impact on the Group’s financial position and performance. These are as follows:— IFRIC 19: (Amendments arising from IFRS9) – Extinguishing
Financial Liabilities with Equity Instruments (effective on adoption of IFRS 9)
— Application of new and revised IFRSs (continued)— Introduction of IFRS 9 – Financial Instruments (effective
from 1 January 2018)— Introduction of IFRS 15 – Revenue from Contracts with
Customers (effective from 1 January 2018)— IFRS 2 narrow scope amendment – Share-Based Payments— Introduction of IFRS 16 – Leases
IFRS 9 issued in November 2009 introduced new requirements for the classification and measurement of financial assets. IFRS 9 was subsequently amended in October 2010 to include requirements for the classification and measurement of financial liabilities and for de-recognition, and in November 2013 to include the new requirements for general hedge accounting. Another revised version of IFRS 9 was issued in July 2014 mainly to include a) impairment requirements for financial assets and b) limited amendments to the classification and measurement requirements by introducing a ‘fair value through other comprehensive income’ (FVTOCI) measurement category for certain simple debt instruments.
Key requirements of IFRS 9:
all recognised financial assets that are within the scope of IAS 39 Financial Instruments: Recognition and Measurement are required to be subsequently measured at amortised cost or fair value. Specifically, debt investments that are held within a business model whose objective is to collect the contractual cash flows, and that have contractual cash flows that are solely payments of principal and interest on the principal outstanding are generally measured at amortised cost at the end of subsequent accounting periods. Debt instruments that are held within a business model whose objective is achieved both by collecting contractual cash flows and selling financial assets, and that have contractual terms that give rise on specified dates to cash flows that are solely payments of principal and interest on the principal amount outstanding, are generally measured at FVTOCI. All other debt investments and equity investments are measured at their fair value at the end of subsequent accounting periods. In addition, under IFRS 9, entities may make an irrevocable election to present subsequent changes in the fair value of an equity investment (that is not held for trading) in other comprehensive income, with only dividend income generally recognised in profit or loss;
with regard to the measurement of financial liabilities designated as at fair value through profit or loss, IFRS 9 requires that the amount of change in the fair value of the financial liability that is attributable to changes in the credit risk of that liability is presented in other comprehensive income, unless the recognition of the effects of changes in the liability’s credit risk in other comprehensive income would create or enlarge an accounting mismatch in profit or loss. Changes in fair value attributable to a financial liability’s credit risk are not subsequently reclassified to profit or loss. Under IAS 39, the entire amount of the change in the fair value of the financial liability designated as fair value through profit or loss is presented in profit or loss;
in relation to the impairment of financial assets, IFRS 9 requires an expected credit loss model, as opposed to an incurred credit loss model under IAS 39. The expected credit loss model requires an entity to account for expected credit losses and changes in those expected credit losses at each reporting date to reflect changes in credit risk since initial recognition. In other words, it is no longer necessary for a credit event to have occurred before credit losses are recognised;
Financial statementsContinued
41Annual report and accounts 2016Kambi Group plc
the new general hedge accounting requirements retain the three types of hedge accounting mechanisms currently available in IAS 39. Under IFRS 9, greater flexibility has been introduced to the types of transactions eligible for hedge accounting, specifically broadening the types of instruments that qualify for hedging instruments and the types of risk components of non-financial items that are eligible for hedge accounting. In addition, the effectiveness test has been overhauled and replaced with the principle of an ‘economic relationship’. Retrospective assessment of hedge effectiveness is also no longer required. Enhanced disclosure requirements about an entity’s risk management activities have also been introduced.
In May 2014, IFRS 15 was issued which establishes a single comprehensive model for entities to use in accounting for revenue arising from contracts with customers. IFRS 15 will supersede the current revenue recognition guidance including IAS 18, IAS 11 and the related Interpretations when it becomes effective (1 January 2018).
The core principle of IFRS 15 is that an entity should recognise revenue to depict the transfer of promised goods or services to customers in an amount that reflects the consideration to which the entity expects to be entitled in exchange for those goods or services. Specifically, the Standard introduces a five-step approach to revenue recognition:
Step 1 Identify the contract(s) with a customer.
Step 2 Identify the performance obligations in the contract.
Step 3 Determine the transaction price.
Step 4 Allocate the transaction price to the performance obligations in the contract.
Step 5 Recognise revenue when (or as) the entity satisfies a performance obligation.
Under IFRS 15, an entity recognises revenue when (or as) a performance obligation is satisfied, i.e. when ‘control’ of the goods or services underlying the particular performance obligation is transferred to the customer. Far more prescriptive guidance has been added in IFRS 15 to deal with specific scenarios. Furthermore, extensive disclosures are required by IFRS 15. The directors of the Company are assessing the impact that the adoption of the above standards would have on initial application.
3. Basis of preparation and consolidationThe Group financial statements consolidate those of the parent company and of all of its subsidiaries as at 31 December 2016.
These financial statements have been prepared on the historical cost basis subject to modification where appropriate by the revaluation of financial assets and liabilities at fair value through profit or loss and in accordance with International Financial Reporting Standards as adopted by the EU. All references to IAS, IFRS or SIC/IFRIC interpretations refer to those adopted by the EU. The individual parent financial statements have been prepared separately.
Historical cost is generally considered to be the fair value of consideration paid in exchange for goods and services. Fair value is the price that would be received to sell an asset or paid to transfer a liability in an orderly transaction between market participants at the measurement date.
The Group has prepared financial statements which comply with IFRS applicable for periods ending on or after 31 December 2016, together with the comparative period data as at and for the year ended 31 December 2015, as described in the accounting policies. The significant accounting policies set out below have been consistently applied to all periods presented and have been applied consistently by the Group’s entities.
The directors believe that the Group will continue with its current growth and therefore the financial statements have been prepared on a going concern basis.
The consolidated financial statements comprise the financial statements of the Group and the entities it controls (its subsidiaries) as at 31 December 2016. An investor considers all relevant facts and circumstances when assessing whether it controls an investee. Control is achieved when the investor is exposed, or has rights, to variable returns from its involvement with the investee and has the ability to affect those returns through its power over the investee. The Group is considered to have power over an entity when it has existing rights that give it the current ability to direct the relevant activities of the investee. For the Group to have power over an entity, it must have the practical ability to exercise those rights. The entity reassesses whether or not it controls an investee if facts and circumstances indicate that there are changes to one or more of the elements of control identified above. Where necessary, adjustments are made to the financial statements of subsidiaries to bring the accounting policies used in line with those used by other members of the Group.
Consolidation of a subsidiary begins when the entity obtains control over the subsidiary and ceases when it loses control of the subsidiary. Specifically, income and expenses of a subsidiary acquired or disposed of during the year are included in the consolidated statement of profit or loss and other comprehensive income from the date the company gains control until the date the company ceases to control the subsidiary.
All intra-group assets and liabilities, equity, income, expenses and cash flows relating to transactions between members of the Group are eliminated in full in the consolidated financial statements. Unrealised losses are eliminated in the same way as unrealised gains, but only to the extent that there is no evidence of impairment.
4. Significant accounting policiesThe consolidated financial statements have been prepared using the significant accounting policies and measurement bases that are in effect at 31 December 2016, as summarised below. These were used throughout all periods presented.
Property, plant and equipmentThe Group does not own property and its tangible non-current assets in the form of plant and equipment are classified into the following classes: office equipment, fixtures & fittings, computer hardware, and leasehold improvements.
Items of plant and equipment are initially measured at cost or manufacturing cost, including any costs directly attributable to bringing the assets to the location and in the condition necessary for these to be capable of being employed in the manner intended by the Group’s management. Subsequently they are stated at cost less accumulated depreciation and any accumulated impairment losses.
42 Annual report and accounts 2016 Kambi Group plc
Subsequent costs are included in the asset’s carrying amount when it is probable that future economic benefits associated with the item will flow to the Group and the cost of the item can be measured reliably. Expenditure on repairs and maintenance is recognised as an expense when incurred.
Items of plant and equipment are derecognised on disposal or when no future economic benefits are expected from their use or disposal. Gains or losses arising from derecognition represent the difference between the net disposal proceeds, if any, and the carrying amount, and are included in profit or loss in the period of derecognition.
DepreciationDepreciation commences when the depreciable assets are available for use and is charged to profit or loss so as to write off the cost, less any estimated residual value, over their estimated useful lives, using the straight-line method. The estimated useful lives for the current and comparative period are as follows:
Leasehold improvements 5 years
Fixtures & fittings 5 years
Office equipment 5 years
Computer hardware 3 years
Depreciation methods, useful lives and material residual values are reviewed at each reporting date with the effect of any change in estimate accounted for prospectively.
Intangible assetsAn intangible asset is an identifiable non-monetary asset without physical substance. It is recognised if it is probable that the expected future economic benefits that are attributable to the asset will flow to the Group and the cost of the asset can be measured reliably. Intangible assets are initially measured at cost and subsequently stated at cost less accumulated amortisation and any accumulated impairment losses.
The useful life of intangible assets is assessed to determine whether it is finite or indefinite. Intangible assets with a finite useful life are amortised over their useful life on a systematic basis. Amortisation is charged to profit or loss on a straight-line basis so as to write off the cost of intangible assets less any estimated residual value, over their estimated useful lives.
The amortisation method applied, the useful lives and material residual values are reviewed at each reporting date with the effect of any change in estimate accounted for prospectively.
Intangible assets with an indefinite useful life are not amortised but are tested for impairment annually. They are henceforth carried at cost less any accumulated impairment losses. The useful life of an intangible asset that is not being amortised is reviewed at each year-end in order to determine whether events and circumstances continue to support an indefinite useful life assessment. If they do not, the change in the useful life assessment from indefinite to finite is accounted for as a change in an accounting estimate. Intangible assets are classified into the following classes: Computer software, Development costs and Brands.
i. Computer software
Acquired computer software licenses are capitalised on the basis of the costs incurred to acquire and install the specific software.
In determining the classification of an asset that incorporates both intangible and tangible elements, judgment is used in assessing which element is more significant. Computer software which is an integral part of the related hardware is classified under property, plant and equipment as computer hardware and accounted for in accordance with the Group’s accounting policy on property, plant and equipment. Where the software is not an integral part of the related hardware, this is classified as an intangible asset and carried at cost less any accumulated amortisation and any accumulated impairment losses. Computer software classified as an intangible asset is amortised on a straight-line basis over three years.
ii. Research and development costs
Expenditure on research activities is recognised as an expense in the period in which it is incurred.
An internally-generated intangible asset arising from the Group’s development of a Sportsbook product is recognised only if all of the following can be demonstrated by the Group:
— The technical feasibility of completing, and the intention to complete, the product so that it will be available for use or sale
— The probability that the product will generate future economic benefits
— The availability of adequate technical, financial and other resources to complete the development and to use or sell the product, and
— The ability to measure reliably the expenditure attributable to the product during its development.
The amount initially recognised for internally generated intangible assets is the total expenditure incurred from the date when the intangible asset first meets the recognition criteria listed above. Where no internally generated intangible asset can be recognised, development expenditure is recognised as an expense in the period in which it is incurred. After initial recognition, internally generated intangible assets are carried at cost less any accumulated amortisation and any accumulated impairment losses. Internally-generated intangible assets are amortised on a straight-line basis over their estimated useful lives, which is generally assumed to be three years.
iii. Brands
Brands are capitalised on the basis of the costs incurred in relation to their development. Brands are classified as an intangible asset and are amortised on a straight-line basis over three years.
Derecognition of intangible assets: an intangible asset is derecognised upon disposal or when no future economic benefits are expected from use or disposal. Gains or losses arising from derecognition represent the difference between the net disposal proceeds, if any, and the carrying amount, and are included in profit or loss in the period of derecognition.
Financial statementsContinued
43Annual report and accounts 2016Kambi Group plc
Financial instrumentsFinancial assets and financial liabilities are recognised when the Group becomes a party to the contractual provisions of the instrument.
Financial assets and financial liabilities are initially recognised at their fair value plus or minus, in the case of a financial asset or financial liability not at fair value through profit or loss, transaction costs that are directly attributable to the acquisition or issue of the financial asset or financial liability.
Financial assets are derecognised when the right to receive cash flows from the assets has expired or when the Group has transferred its contractual right to receive the cash flows of the financial assets, and either substantially all the risks and rewards of ownership have been transferred or substantially all the risks and rewards have neither been retained nor transferred but control is not retained.
Financial liabilities are classified as ‘other financial liabilities’ and include borrowings subsequently measured at amortised cost using the effective interest method. The effective interest method is a method of calculating the amortised cost of a financial liability and of allocating interest expense over the relevant period. The effective interest rate is the rate that exactly discounts estimated future cash payments (including all fees paid or received that form an integral part of the effective interest rate, transaction costs and other premiums or discounts) through the expected life of the financial liability, or where appropriate, a shorter period, to the net carrying amount on initial recognition.
Financial liabilities are derecognised when they are extinguished, that is when the obligation is discharged, is cancelled or expires.
Financial assets and financial liabilities are offset and the net amount reported in the statement of financial position when there is a legally enforceable right to offset the recognised amounts and there is an intention to settle on a net basis, or to realise the asset and settle the liability simultaneously.
An equity instrument is a contract that evidences a residual interest in the assets of an entity after deducting all of its liabilities. Equity instruments issued by a Group entity are recognised as the proceeds received, net of direct issue costs. Repurchase of the entity’s own equity instruments is recognised and deducted directly in equity. No gain or loss is recognised in profit or loss on the purchase, sale, issue or cancellation of the entity’s own equity instruments.
Debt and equity instruments issued by the Group are classified as either other financial liabilities or equity in accordance with the substance of the contractual agreements and the definitions of a financial liability and an equity instrument.
The component parts of compound instruments (the convertible bond) issued by the entity are classified separately as financial liabilities and equity in accordance with the substance of the contractual agreements and the definitions of a financial liability and an equity instrument.
At the date of issue, the fair value of the financial liability component is estimated using the prevailing market interest rate for similar risk non-convertible instruments. The amount is recognised as a liability on an amortised cost basis using the effective interest method until extinguished upon conversion or at the instrument’s maturity date.
The conversion option classified as equity is determined by deducting the amount of the liability component from the fair value of the compound instrument as a whole. This
is recognised and included in equity, net of income tax effects, and is not subsequently remeasured. In addition, the conversion option classified as equity will remain in equity until the conversion option is exercised in which case the balance recognised in equity will be transferred to other equity. When the conversion option remains unexercised at the maturity date of the convertible bond, the balance recognised in equity will be transferred to other equity. No gain or loss is recognised in profit or loss upon conversion or expiration of the conversion option. Changes in the fair value of the equity component are not recognised. Redemptions or refinancings of the equity component are recognised as changes in equity whereas gains or losses associated with redemptions or refinancings of the liability component are recognised in profit or loss.
i. Trade receivables
Trade receivables comprise amounts due from customers for services performed in the ordinary course of business. If collection is expected in one year or less (or in the normal operating cycle of the business if longer), they are classified as current assets. If not, they are presented as non-current assets. Trade receivables are classified as current assets and are stated at their nominal value unless the effect of discounting is material, in which case trade receivables are measured at amortised cost using the effective interest method. Appropriate allowances for estimated irrecoverable amounts are recognised in profit or loss when there is objective evidence that the asset is impaired.
Receivables are tested for impairment annually and when there is objective evidence that the Group will not be able to collect all amounts due in accordance with the original terms, an allowance is recognised in profit or loss. Significant financial difficulties of the debtor, probability that the debtor will enter bankruptcy or financial reorganisation and default or delinquency in payments are considered indicators that the receivable is impaired. The amount of the allowance is the difference between the carrying amount of the receivable and the present value of estimated future cash flows discounted at the original effective interest rate.
Loans and receivables are non-derivative financial assets with fixed or determinable payments that are not quoted in an active market other than those that are held for trading or are designated upon initial recognition as at fair value through profit or loss or as available-for-sale financial assets or those for which the Group may not recover substantially all of its initial investment other than because of credit deterioration.
ii. Trade payables
Trade payables are classified as current liabilities and are stated at their nominal value unless the effect of discounting is material, in which case trade payables are measured at amortised cost using the effective interest method.
iii. Shares issued by the Group
Ordinary shares issued by the Group are classified as equity instruments. Costs relating to an equity issue are offset against equity, as a deduction from the issue proceeds.
Revenue recognitionRevenue arises from the provision of services and is measured at the fair value of the consideration received or receivable for services provided in the normal course of business, net of value added tax, rebates and discounts, where applicable. Revenue is recognised when it is probable that future economic benefits will flow to the Group and the amount of revenue and the associated costs can be measured reliably.
44 Annual report and accounts 2016 Kambi Group plc
i. Provision of services
Revenue from the provision of services is recognised in profit or loss in the period in which the services are rendered, by reference to the stage of completion method of the specific transaction. This method is based on the actual service provided as a proportion of the total services to be provided. For practical purposes, when services are performed by an indeterminate number of acts over a specified period of time, revenue is recognised on a straight-line basis over the specified period unless there is evidence that some other method better represents the stage of completion.
ii. Interest income and expense
Interest income and expense is recognised on an accruals basis by reference to the principal outstanding and by using the effective interest method when it is probable that the economic benefits will flow to or from the Group and the amount of income or expense can be measured reliably.
Income taxIncome tax expense comprises current and deferred tax and is recognised in profit or loss, except to the extent that it relates to items recognised in other comprehensive income or directly in equity, in which case the current and deferred tax is also dealt with in other comprehensive income or in equity, as appropriate.
Current tax is based on the taxable income for the period using tax rates enacted or substantively enacted at the reporting date and any adjustment to tax payable in respect of previous years. The taxable result for the period differs from the result as reported in profit or loss because it excludes items which are non-assessable or disallowed and it further excludes items that are taxable or deductible in other periods.
Deferred tax is recognised in respect of temporary differences between the carrying amounts of assets and liabilities for financial reporting purposes and the amounts used for taxation purposes. Deferred tax is measured at the tax rates that are expected to be applied to temporary differences when they reverse based on the laws that have been enacted or substantively enacted by the reporting date.
A deferred tax asset is recognised for unused tax losses and deductible temporary differences to the extent that it is probable that future taxable profits will be available against which they can be utilised. The carrying amount of deferred tax assets is reviewed at the end of each reporting period and reduced to the extent that it is no longer probable that sufficient taxable profit will be available to allow all or part of the asset to be utilised.
Deferred tax assets and liabilities are offset when the Group has a legally enforceable right to set off its current tax assets and liabilities and the deferred tax assets and liabilities relate to income taxes levied by the same taxation authority on either the same taxable entity or different taxable entities which intend either to settle current tax liabilities and assets on a net basis, or to realise the assets and settle the liabilities simultaneously, in each future period in which significant amounts of deferred tax liabilities or assets are expected to be settled or recovered.
Foreign currency translationThe financial statements of the Group are presented in its functional currency, the Euro, being the currency of the primary economic environment in which the Group operates. In preparing the financial statements of each individual Group entity, transactions in currencies other than the Euro are translated at the rates of exchange prevailing at the dates of the transactions.
At the end of each reporting period, monetary items denominated in foreign currencies are re-translated to the presentation currency at the exchange rate prevailing at that date. Non-monetary assets and liabilities denominated in currencies other than the Euro that are measured at fair value are re-translated using the exchange rate ruling on the date the fair value was determined. Non-monetary items that are measured in terms of historical cost in a foreign currency are not retranslated. Exchange differences arising on the settlement and on the re-translation of monetary items are recognised in profit or loss.
For the purpose of presenting these consolidated financial statements, the assets and liabilities of the Group’s foreign operations are translated into Euro using exchange rates prevailing at the end of each reporting period. Income and expense items are translated at the average exchange rates for the period unless exchange rates fluctuate significantly during that period, in which case the exchange rates at the dates of the transactions are used. Exchange differences arising, if any, are recognised in other comprehensive income and accumulated in a foreign currency translation reserve in equity.
Exchange differences arising on the translation of non-monetary items carried at fair value are included in profit or loss for the period, except for differences arising on the re-translation of non-monetary items in respect of which gains and losses are recognised in other comprehensive income. For such non-monetary items, any exchange component of that gain or loss is also recognised in other comprehensive income.
Foreign exchange gains and losses are included within Other Income and Expenses, except in the case of significant exchange differences arising on investing or financing activities, which are classified within investment income, investment losses or finance costs as appropriate. Foreign exchange gains and losses are reported on a net basis. Such gains and losses are, however, reported separately if they are material.
Cash and cash equivalentsCash and cash equivalents comprise cash on hand and demand deposits, together with other short-term highly liquid investments that are readily convertible into known amounts of cash and which are subject to an insignificant risk of change in value. Cash and cash equivalents are carried in the statement of financial position at face value. In the statement of cash flows, cash and cash equivalents comprise cash at bank, including deposits accessible on demand.
ProvisionsProvisions are recognised when the Group has a present legal or constructive obligation as a result of a past event, it is probable that an outflow of resources embodying economic benefits will be required to settle the obligation and a reliable estimate can be made of the amount of the obligation. Provisions are measured at the directors’ best estimate of the expenditure required to settle the present obligation at the end of the reporting period taking into account the risks and uncertainties surrounding the obligation.
Financial statementsContinued
45Annual report and accounts 2016Kambi Group plc
If the effect of the time value of money is material, provisions are recognised at their present value by discounting the expected future cash flows at a pre-tax rate that reflects current market assessments of the time value of money and, where appropriate, the risks specific to the liability. When some or all of the economic benefits required to settle a provision are expected to be recovered from a third party, a receivable is recognised as an asset if it is virtually certain that reimbursement will be received and the amount of the receivable can be measured reliably.
Provisions are not recognised for future operating losses.
Items affecting comparability The Group defines items affecting comparability as those items which, by their size or nature in relation to the Group, should be separately disclosed in order to give a full understanding of the Group’s underlying financial performance, and aid comparability of the Group’s results between periods.
Leases The Group’s leases are all operating leases in which the Group is the lessee (leases in which a significant portion of the risks and rewards of ownership of the asset being leased are retained by the lessor). Operating lease payments are recognised as an expense on a straight-line basis over the term of the relevant lease (net of any incentive received from the lessor) except where another systematic basis is more representative of the time pattern in which economic benefits from the leased asset are consumed.
The aggregate benefit of lease-related incentives is recognised as a reduction of rental expense on a straight-line basis except where another systematic basis is more representative of the time pattern in which economic benefits from the leased asset are consumed.
Share-based payments Share-based payment arrangements in which the Group receives goods or services as consideration for equity instruments are accounted for as equity settled share-based payment transactions by recognising in profit or loss the fair value of the awards with a corresponding increase in equity within other reserves.
The total amount to be expensed is measured by reference to the fair value at the grant date of the options granted, taking into account market performance conditions and the impact of any non-vesting conditions, and excluding the impact of any service or vesting conditions. Non-market performance and service conditions are included in assumptions about the number of options that are expected to vest. The total amount expensed is recognised over the vesting period of the options, which is usually three years. At each balance sheet date, the estimate of the number of options expected to vest is revised with the impact recognised in the statement of consolidated profit or loss and other comprehensive income and a corresponding adjustment to equity within other reserves.
Impairment At the end of each reporting period, the Group reviews the carrying amounts of its tangible and intangible assets to determine whether there is any indication that those assets have suffered an impairment loss. If any such indication exists, an impairment test is carried out and the recoverable amount of the asset is estimated in order to determine the extent of the impairment loss (if any).
Assets that have an indefinite useful life and are therefore not subject to amortisation or depreciation and intangible assets not yet available for use are tested annually for impairment and whenever there is an indication that the asset may be impaired. When it is not possible to estimate the recoverable amount of an individual asset, the Group estimates the recoverable amount of the cash-generating unit to which the asset belongs. When a reasonable and consistent basis of allocation can be identified, intangible assets are also allocated to individual cash-generating units, or otherwise they are allocated to the smallest group of cash-generating units for which a reasonable and consistent allocation basis can be identified.
An impairment loss is recognised if the carrying amount of an asset or its cash-generating unit exceeds its estimated recoverable amount. Impairment losses are recognised in profit or loss unless they relate to revalued assets where the impairment loss is treated as a revaluation decrease. The recoverable amount is the higher of an asset’s fair value less costs to sell and value in use. In assessing value in use the estimated future cash flows are discounted to their present value using a pre-tax discount rate that reflects current market assessments of the time value of money and the risks specific to the asset.
Impairment losses recognised in prior periods are assessed at each reporting date for any indications that the loss has decreased or no longer exists.
If in a subsequent period, the amount of the impairment loss decreases and the decrease can be related objectively to an event occurring after the impairment was recognised, the previously recognised impairment loss is reversed by adjusting the allowance account. The amount of the reversal is recognised in profit or loss unless it had previously been treated as a revaluation decrease. Reversal of impairment losses on goodwill is prohibited.
Post-employment benefitsThe Group contributes towards the state pension in accordance with local legislation where required. The only obligation of the Group is to make the required contributions. Costs related to such contributions are expensed in the period in which they are incurred.
The Group also provides for certain additional post-employment retirement benefits to employees in the Philippines. The cost of providing benefits under a defined benefit plan is determined using the projected unit credit method with actuarial valuations being carried out at the end of each annual reporting period. This cost is recognised in profit or loss and includes the service cost (including current service cost, past service cost and gains/losses on curtailments and settlements), net interest expense or income on the defined benefit liability or asset and re-measurement which comprises actuarial gains and losses, the effect of changes to the asset ceiling (if applicable) and the return on plan assets (excluding interest). The net defined benefit liability or asset includes actuarial gains and losses which are recognised in other comprehensive income in the period in which they arise.
Net interest is calculated by applying the discount rate to the net defined benefit liability or asset. The Group recognises the following changes in the net defined benefit obligation under Administrative Expenses in the Consolidated Statement of Profit or Loss and Other Comprehensive Income:— Service costs — Net interest expense or income.
46 Annual report and accounts 2016 Kambi Group plc
5. Judgments in applying accounting policies and key sources of estimation uncertaintyThe amounts recognised in the financial statements are sensitive to the accounting policies, assumptions and estimates that underlie the preparation of financial statements. The judgments made by management in applying the Group’s accounting policies that have the most significant effect on the amounts recognised in the financial statements, together with information about the key assumptions concerning the future, and other key sources of estimation uncertainty at the end of the reporting period, that have a significant risk of causing a material adjustment to the carrying amounts of assets and liabilities within the next financial year are disclosed herein.
5.1 The following are the critical judgments, apart from those involving estimations (see note 5.2 below) that the directors have made in the process of applying the Group’s accounting policies and that have the most significant effect on the amounts recognised in the consolidated financial statements:
Deferred taxationThe recognition of deferred tax assets is based upon whether taxable profits will be available in the future against which the reversal of temporary differences can be deducted. To determine the future taxable profits, reference is made to the latest available profit forecasts. The amounts recognised in the consolidated financial statements are derived from the management’s best estimation and judgment of the above.
Convertible bondThe recognition of the liability component of the convertible bond requires an assessment of a discount rate which is assessed using the interest rate of an equivalent risk instrument that was not convertible. Management has estimated this rate based on historical experience with similar instruments that the Group has previously had in place.
5.2 The following are the key assumptions concerning the future and other key sources of estimation uncertainty at the end of the reporting period that may have a significant risk of causing a material adjustment to the carrying amounts of assets and liabilities within the next financial year.
Recoverability of internally generated intangible assetsIFRS requires management to undertake an annual test for impairment of internally generated intangible assets to determine if the carrying amount of any asset may not be recoverable. Impairment testing is an area involving management’s assessment that technological and economic feasibilities are achieved. In determining the amounts to be capitalised and for any impairment, management makes assumptions regarding the expected future cash generation of the project, discount rates to be applied and the expected period of benefits.
Useful lives of plant and equipmentThe useful lives and residual values of the Group’s assets are determined by management at the time the asset is acquired and reviewed throughout the year for appropriateness. The lives are based on historical experience with similar assets as well as anticipation of future events which may impact their life. If the useful life of assets is reduced, depreciation increases and the carrying amount of the asset is reduced.
Fair value measurements and valuation processesWhen the fair values of financial assets and financial liabilities recorded in the statement of financial position cannot be measured based on quoted prices in active markets, their fair value is measured using valuation techniques including the discounted cash flow (DCF) model. The variables in these models are taken from observable market inputs where possible, but where this is not feasible, a degree of estimation is required in establishing fair values.
Share options Upon exercise of the share options disclosed in Note 26, the Group will have a liability to pay the employer’s National Insurance on any gains. The amounts recognised in the consolidated financial statements are derived from the management’s best estimation of the likely option vesting patterns and are based on the share price at the balance sheet date.
The Kambi Group Executive Share Option Plan (ESOP) was introduced in December 2013. Under the scheme, options will be exercisable over a seven-year period, starting at the third anniversary of the date of grant and expiring at the tenth anniversary of the date of grant. Options are exercisable only to the extent that certain performance conditions in relation to free cash flow and EBITDA have been satisfied and are subject to the optionholders remaining in continued employment with the Group.
Different numbers of options were issued under the scheme to various groups of staff. Management has made an estimation of the likely vesting patterns within the seven-year exercise window, based on the existing length of service of the optionholders and other measures, for example, future share price.
The Kambi Group plc Share Option Plan 2015 was introduced in late December 2015, with a fixed exercise price equal to 110% of the average share value, based on the average market value of a Kambi share on the First North Exchange, for the 10 business days before the options are granted. The options will be exercisable over a one-year period, starting at the third anniversary of the date of grant and expiring at the fourth anniversary of the date of grant. Options are exercisable only to the extent that certain performance conditions in relation to EPS growth have been satisfied and are subject to the optionholders remaining in continued employment with the Group.
Based on the above, an estimation of the employer’s National Insurance liability at each balance sheet date during the exercise window has been made and accounted for accordingly. The estimation is updated regularly according to various factors including attainment of the performance conditions, the number of options outstanding and the latest share price.
Post-employment benefit obligationsThe cost of the defined benefit retirement plan in the Philippines is dependent on actuarial valuations. An actuarial valuation involves making various assumptions that may differ from actual developments in the future. These include the determination of the discount rate, future salary increases, mortality rates and future pension increases. Due to the complexities involved in the valuation and its long-term nature, a defined benefit obligation is highly sensitive to changes in these assumptions. All assumptions are reviewed at each reporting date and remeasurement gains and losses arising from such reviews are recognised in other comprehensive income.
Financial statementsContinued
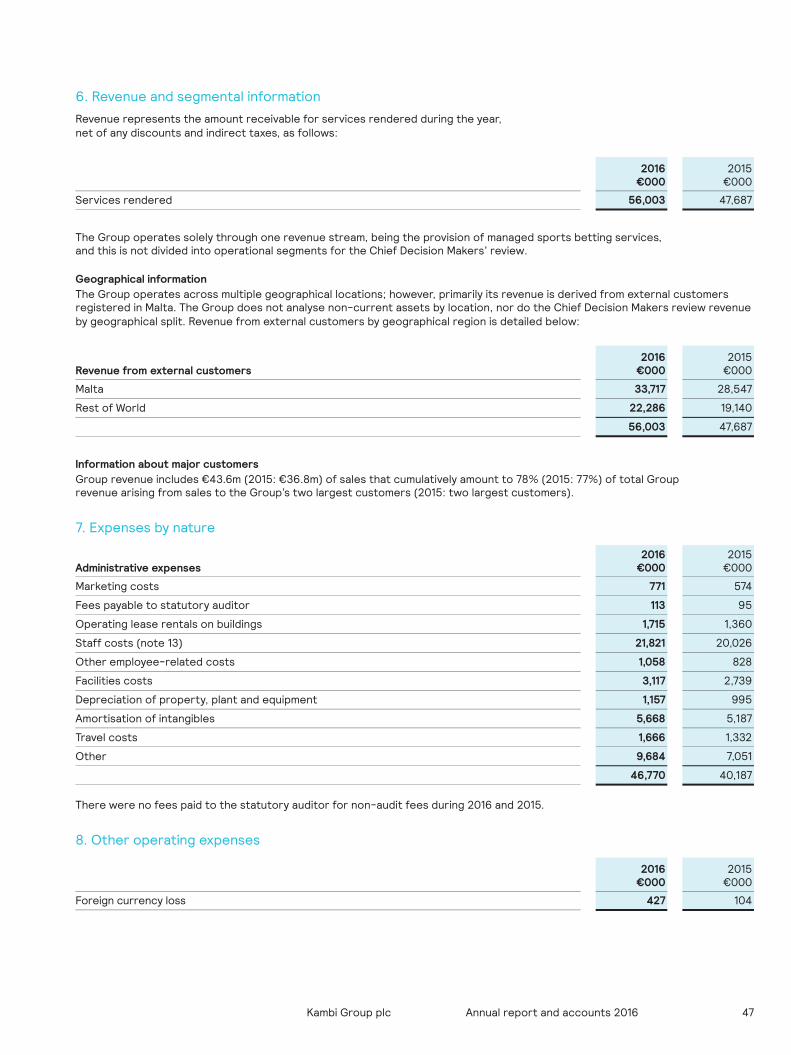
47Annual report and accounts 2016Kambi Group plc
6. Revenue and segmental information
Revenue represents the amount receivable for services rendered during the year, net of any discounts and indirect taxes, as follows:
2016€000
2015€000
Services rendered 56,003 47,687
The Group operates solely through one revenue stream, being the provision of managed sports betting services, and this is not divided into operational segments for the Chief Decision Makers’ review.
Geographical informationThe Group operates across multiple geographical locations; however, primarily its revenue is derived from external customers registered in Malta. The Group does not analyse non-current assets by location, nor do the Chief Decision Makers review revenue by geographical split. Revenue from external customers by geographical region is detailed below:
Revenue from external customers2016
€0002015
€000
Malta 33,717 28,547
Rest of World 22,286 19,140
56,003 47,687
Information about major customersGroup revenue includes €43.6m (2015: €36.8m) of sales that cumulatively amount to 78% (2015: 77%) of total Group revenue arising from sales to the Group’s two largest customers (2015: two largest customers).
7. Expenses by nature
Administrative expenses2016
€0002015
€000
Marketing costs 771 574
Fees payable to statutory auditor 113 95
Operating lease rentals on buildings 1,715 1,360
Staff costs (note 13) 21,821 20,026
Other employee-related costs 1,058 828
Facilities costs 3,117 2,739
Depreciation of property, plant and equipment 1,157 995
Amortisation of intangibles 5,668 5,187
Travel costs 1,666 1,332
Other 9,684 7,051
46,770 40,187
There were no fees paid to the statutory auditor for non-audit fees during 2016 and 2015.
8. Other operating expenses
2016€000
2015€000
Foreign currency loss 427 104
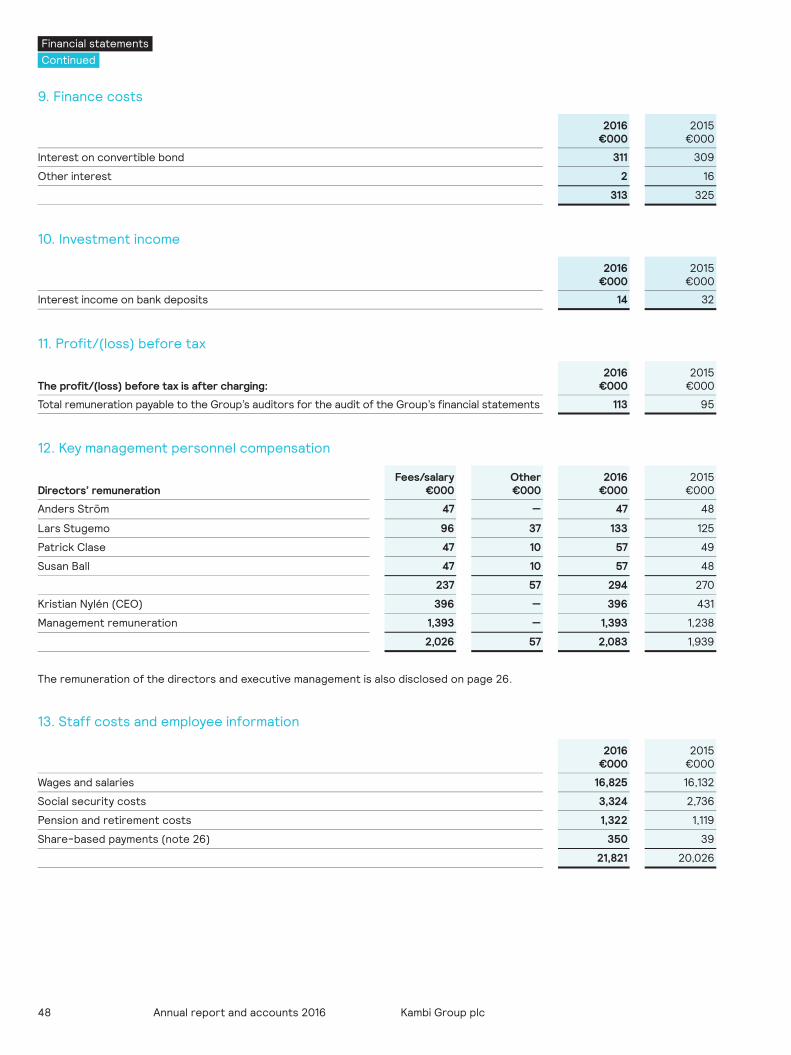
48 Annual report and accounts 2016 Kambi Group plc
9. Finance costs
2016€000
2015€000
Interest on convertible bond 311 309
Other interest 2 16
313 325
10. Investment income
2016€000
2015€000
Interest income on bank deposits 14 32
11. Profit/(loss) before tax
The profit/(loss) before tax is after charging:2016
€0002015
€000
Total remuneration payable to the Group’s auditors for the audit of the Group’s financial statements 113 95
12. Key management personnel compensation
Directors’ remunerationFees/salary
€000Other€000
2016€000
2015€000
Anders Ström 47 — 47 48
Lars Stugemo 96 37 133 125
Patrick Clase 47 10 57 49
Susan Ball 47 10 57 48
237 57 294 270
Kristian Nylén (CEO) 396 — 396 431
Management remuneration 1,393 — 1,393 1,238
2,026 57 2,083 1,939
The remuneration of the directors and executive management is also disclosed on page 26.
13. Staff costs and employee information
2016€000
2015€000
Wages and salaries 16,825 16,132
Social security costs 3,324 2,736
Pension and retirement costs 1,322 1,119
Share-based payments (note 26) 350 39
21,821 20,026
Financial statementsContinued
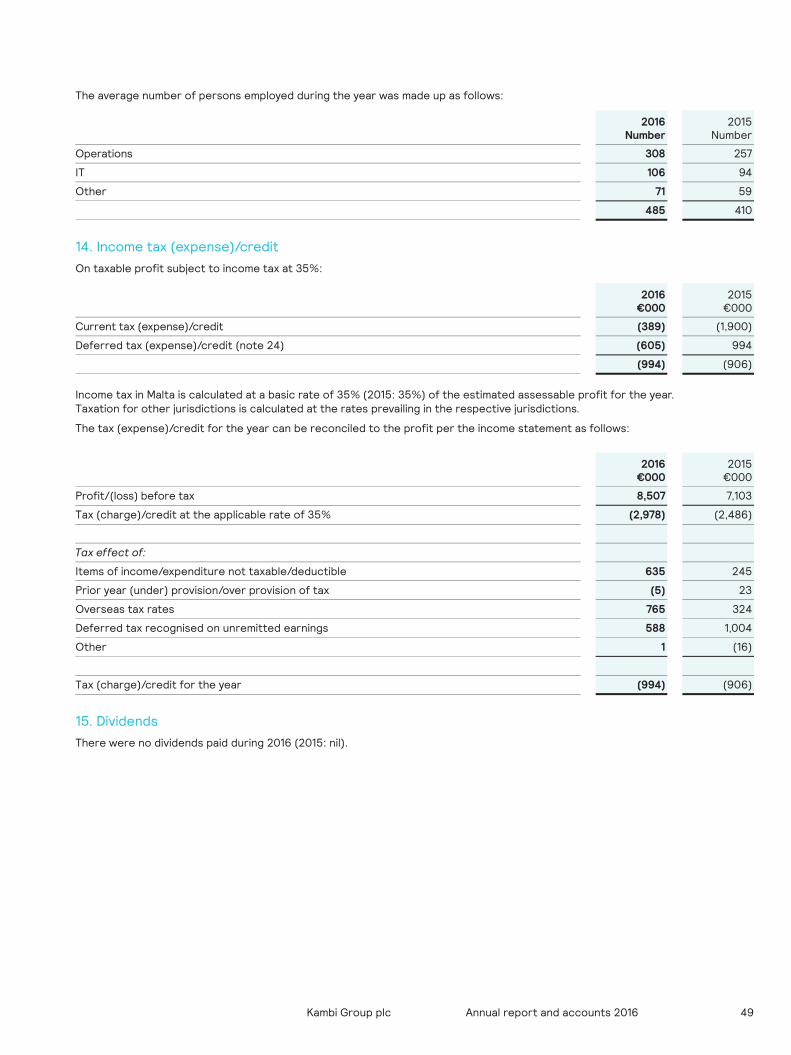
49Annual report and accounts 2016Kambi Group plc
The average number of persons employed during the year was made up as follows:
2016Number
2015Number
Operations 308 257
IT 106 94
Other 71 59
485 410
14. Income tax (expense)/creditOn taxable profit subject to income tax at 35%:
2016€000
2015€000
Current tax (expense)/credit (389) (1,900)
Deferred tax (expense)/credit (note 24) (605) 994
(994) (906)
Income tax in Malta is calculated at a basic rate of 35% (2015: 35%) of the estimated assessable profit for the year. Taxation for other jurisdictions is calculated at the rates prevailing in the respective jurisdictions.
The tax (expense)/credit for the year can be reconciled to the profit per the income statement as follows:
2016€000
2015€000
Profit/(loss) before tax 8,507 7,103
Tax (charge)/credit at the applicable rate of 35% (2,978) (2,486)
Tax effect of:
Items of income/expenditure not taxable/deductible 635 245
Prior year (under) provision/over provision of tax (5) 23
Overseas tax rates 765 324
Deferred tax recognised on unremitted earnings 588 1,004
Other 1 (16)
Tax (charge)/credit for the year (994) (906)
15. DividendsThere were no dividends paid during 2016 (2015: nil).
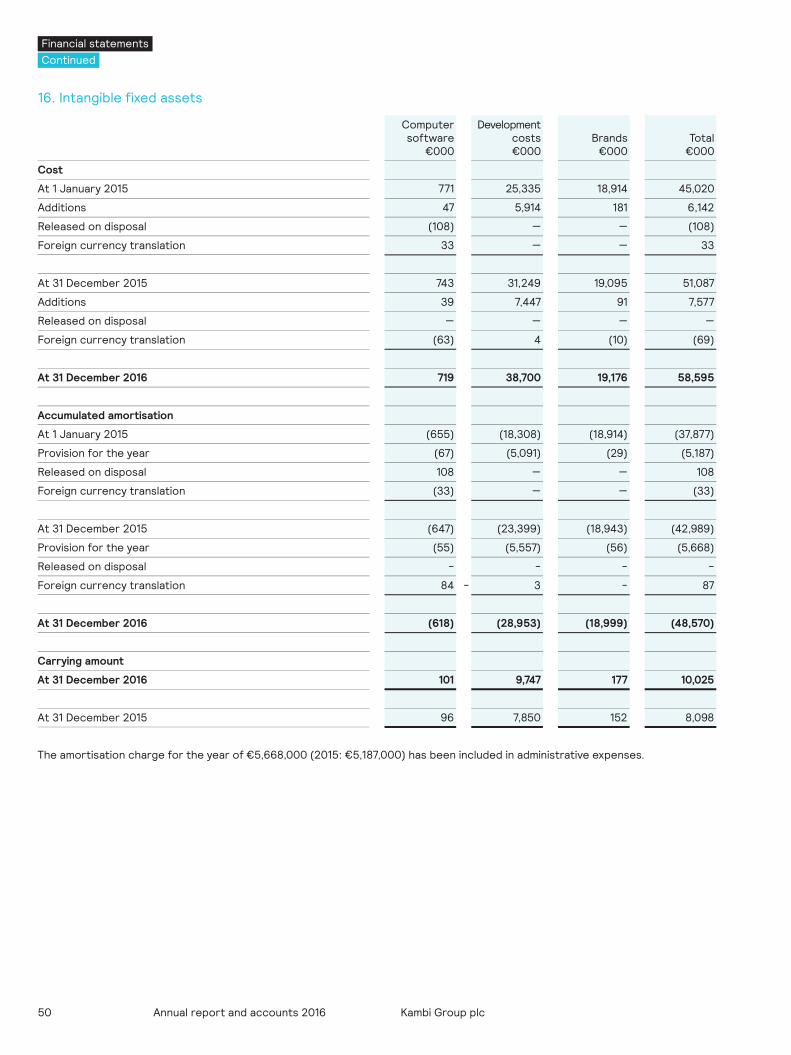
50 Annual report and accounts 2016 Kambi Group plc
16. Intangible fixed assets
Computer software
€000
Development costs€000
Brands €000
Total€000
Cost
At 1 January 2015 771 25,335 18,914 45,020
Additions 47 5,914 181 6,142
Released on disposal (108) — — (108)
Foreign currency translation 33 — — 33
At 31 December 2015 743 31,249 19,095 51,087
Additions 39 7,447 91 7,577
Released on disposal — — — —
Foreign currency translation (63) 4 (10) (69)
At 31 December 2016 719 38,700 19,176 58,595
Accumulated amortisation
At 1 January 2015 (655) (18,308) (18,914) (37,877)
Provision for the year (67) (5,091) (29) (5,187)
Released on disposal 108 — — 108
Foreign currency translation (33) — — (33)
At 31 December 2015 (647) (23,399) (18,943) (42,989)
Provision for the year (55) (5,557) (56) (5,668)
Released on disposal - - - -
Foreign currency translation 84 - 3 - 87
At 31 December 2016 (618) (28,953) (18,999) (48,570)
Carrying amount
At 31 December 2016 101 9,747 177 10,025
At 31 December 2015 96 7,850 152 8,098
The amortisation charge for the year of €5,668,000 (2015: €5,187,000) has been included in administrative expenses.
Financial statementsContinued
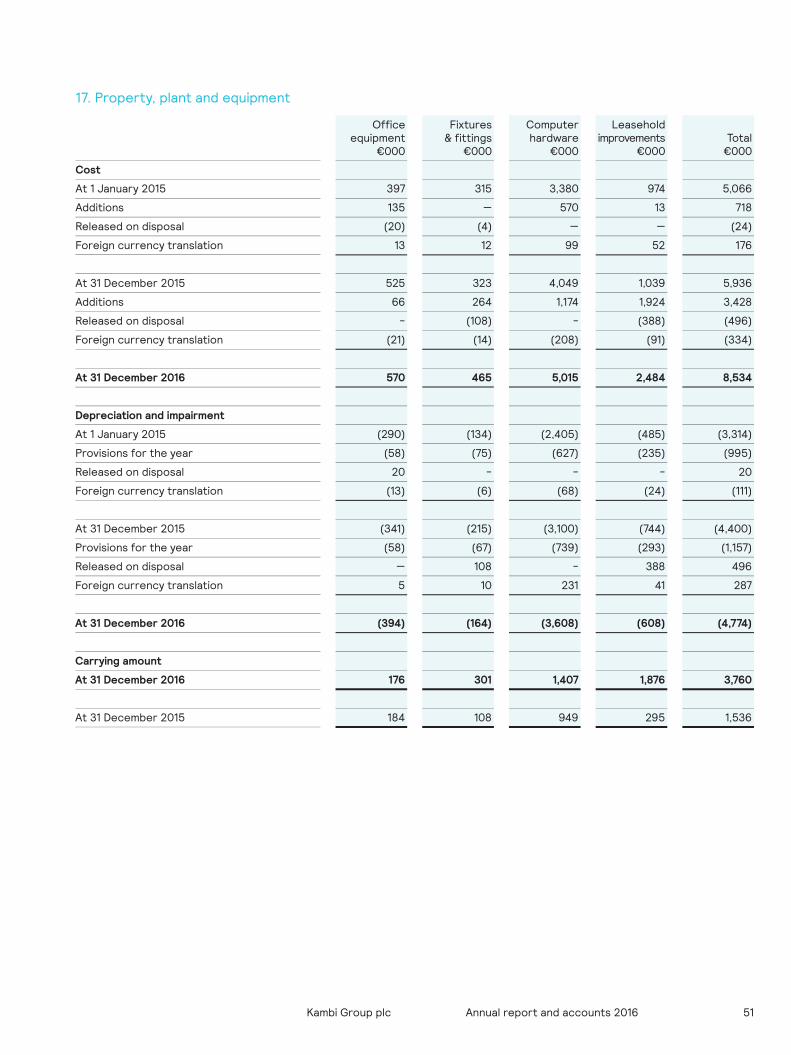
51Annual report and accounts 2016Kambi Group plc
17. Property, plant and equipment
Office equipment
€000
Fixtures & fittings
€000
Computer hardware
€000
Leasehold improvements
€000Total
€000
Cost
At 1 January 2015 397 315 3,380 974 5,066
Additions 135 — 570 13 718
Released on disposal (20) (4) — — (24)
Foreign currency translation 13 12 99 52 176
At 31 December 2015 525 323 4,049 1,039 5,936
Additions 66 264 1,174 1,924 3,428
Released on disposal - (108) - (388) (496)
Foreign currency translation (21) (14) (208) (91) (334)
At 31 December 2016 570 465 5,015 2,484 8,534
Depreciation and impairment
At 1 January 2015 (290) (134) (2,405) (485) (3,314)
Provisions for the year (58) (75) (627) (235) (995)
Released on disposal 20 - - - 20
Foreign currency translation (13) (6) (68) (24) (111)
At 31 December 2015 (341) (215) (3,100) (744) (4,400)
Provisions for the year (58) (67) (739) (293) (1,157)
Released on disposal — 108 - 388 496
Foreign currency translation 5 10 231 41 287
At 31 December 2016 (394) (164) (3,608) (608) (4,774)
Carrying amount
At 31 December 2016 176 301 1,407 1,876 3,760
At 31 December 2015 184 108 949 295 1,536
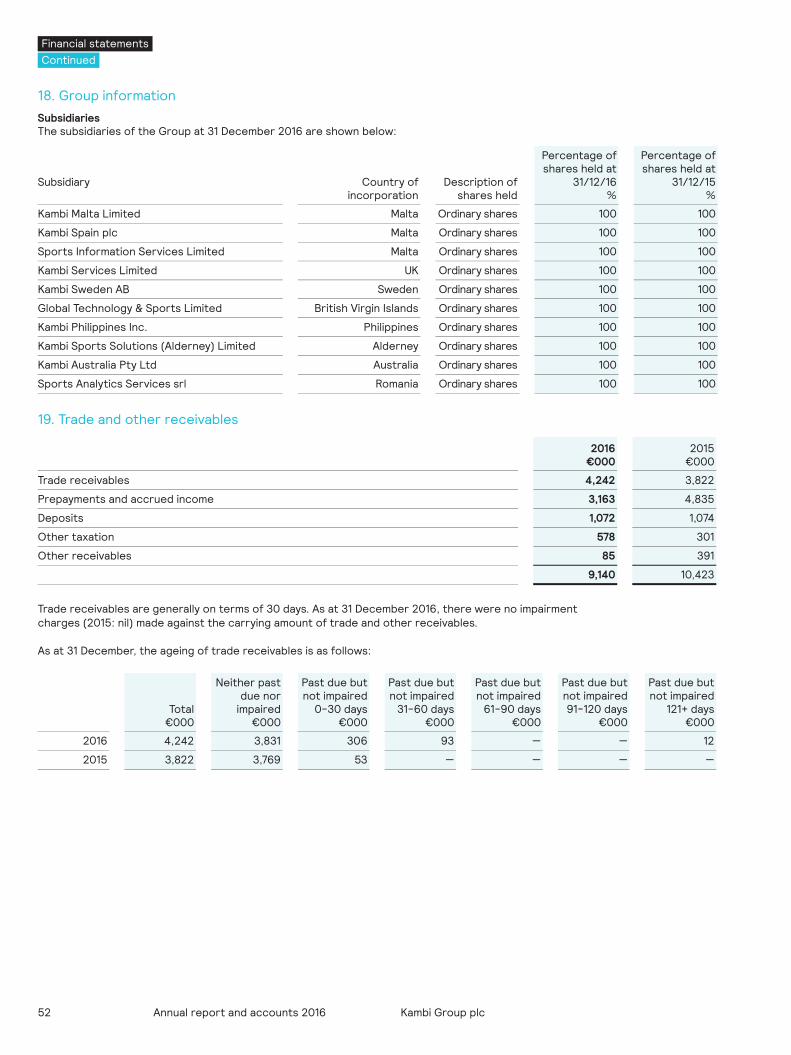
52 Annual report and accounts 2016 Kambi Group plc
18. Group information
SubsidiariesThe subsidiaries of the Group at 31 December 2016 are shown below:
Subsidiary Country ofincorporation
Description of shares held
Percentage of shares held at
31/12/16%
Percentage of shares held at
31/12/15%
Kambi Malta Limited Malta Ordinary shares 100 100
Kambi Spain plc Malta Ordinary shares 100 100
Sports Information Services Limited Malta Ordinary shares 100 100
Kambi Services Limited UK Ordinary shares 100 100
Kambi Sweden AB Sweden Ordinary shares 100 100
Global Technology & Sports Limited British Virgin Islands Ordinary shares 100 100
Kambi Philippines Inc. Philippines Ordinary shares 100 100
Kambi Sports Solutions (Alderney) Limited Alderney Ordinary shares 100 100
Kambi Australia Pty Ltd Australia Ordinary shares 100 100
Sports Analytics Services srl Romania Ordinary shares 100 100
19. Trade and other receivables
2016€000
2015€000
Trade receivables 4,242 3,822
Prepayments and accrued income 3,163 4,835
Deposits 1,072 1,074
Other taxation 578 301
Other receivables 85 391
9,140 10,423
Trade receivables are generally on terms of 30 days. As at 31 December 2016, there were no impairment charges (2015: nil) made against the carrying amount of trade and other receivables.
As at 31 December, the ageing of trade receivables is as follows:
Total€000
Neither past due nor
impaired€000
Past due but not impaired
0-30 days€000
Past due but not impaired
31-60 days€000
Past due but not impaired
61-90 days€000
Past due but not impaired91-120 days
€000
Past due but not impaired
121+ days€000
2016 4,242 3,831 306 93 — — 12
2015 3,822 3,769 53 — — — —
Financial statementsContinued
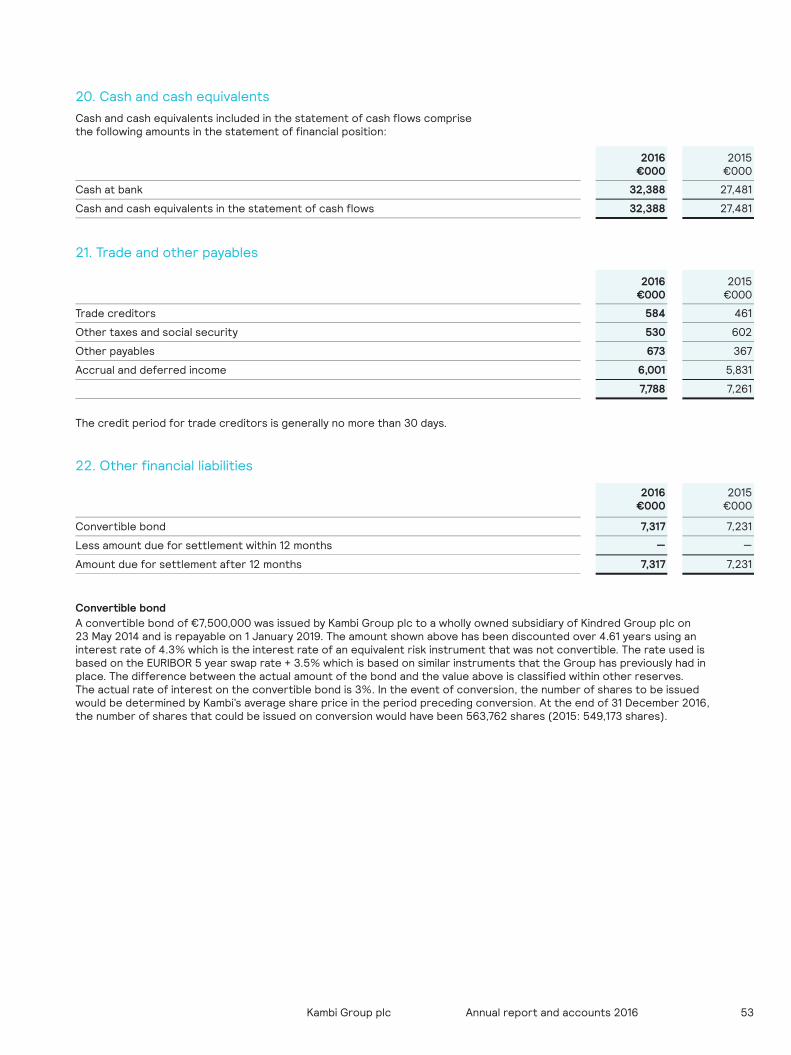
53Annual report and accounts 2016Kambi Group plc
20. Cash and cash equivalentsCash and cash equivalents included in the statement of cash flows comprise the following amounts in the statement of financial position:
2016€000
2015€000
Cash at bank 32,388 27,481
Cash and cash equivalents in the statement of cash flows 32,388 27,481
21. Trade and other payables
2016€000
2015€000
Trade creditors 584 461
Other taxes and social security 530 602
Other payables 673 367
Accrual and deferred income 6,001 5,831
7,788 7,261
The credit period for trade creditors is generally no more than 30 days.
22. Other financial liabilities
2016€000
2015€000
Convertible bond 7,317 7,231
Less amount due for settlement within 12 months — —
Amount due for settlement after 12 months 7,317 7,231
Convertible bondA convertible bond of €7,500,000 was issued by Kambi Group plc to a wholly owned subsidiary of Kindred Group plc on 23 May 2014 and is repayable on 1 January 2019. The amount shown above has been discounted over 4.61 years using an interest rate of 4.3% which is the interest rate of an equivalent risk instrument that was not convertible. The rate used is based on the EURIBOR 5 year swap rate + 3.5% which is based on similar instruments that the Group has previously had in place. The difference between the actual amount of the bond and the value above is classified within other reserves. The actual rate of interest on the convertible bond is 3%. In the event of conversion, the number of shares to be issued would be determined by Kambi’s average share price in the period preceding conversion. At the end of 31 December 2016, the number of shares that could be issued on conversion would have been 563,762 shares (2015: 549,173 shares).
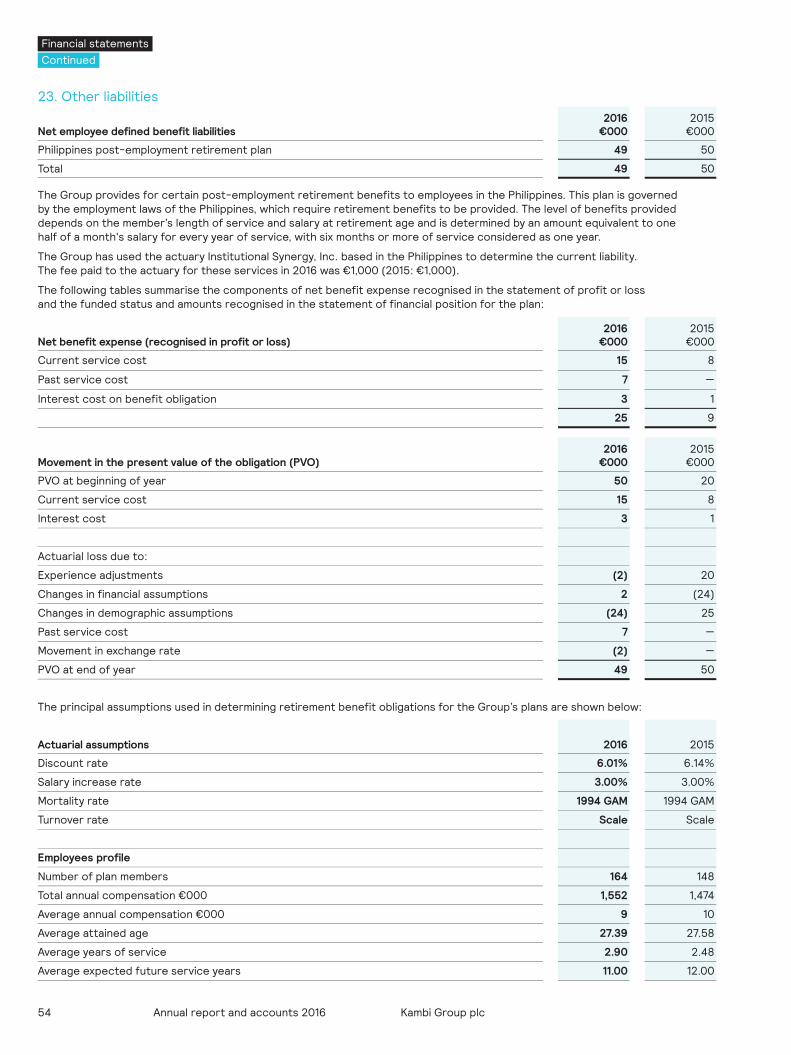
54 Annual report and accounts 2016 Kambi Group plc
23. Other liabilities
Net employee defined benefit liabilities2016
€0002015
€000
Philippines post-employment retirement plan 49 50
Total 49 50
The Group provides for certain post-employment retirement benefits to employees in the Philippines. This plan is governed by the employment laws of the Philippines, which require retirement benefits to be provided. The level of benefits provided depends on the member’s length of service and salary at retirement age and is determined by an amount equivalent to one half of a month's salary for every year of service, with six months or more of service considered as one year.
The Group has used the actuary Institutional Synergy, Inc. based in the Philippines to determine the current liability. The fee paid to the actuary for these services in 2016 was €1,000 (2015: €1,000).
The following tables summarise the components of net benefit expense recognised in the statement of profit or loss and the funded status and amounts recognised in the statement of financial position for the plan:
Net benefit expense (recognised in profit or loss)2016
€0002015
€000
Current service cost 15 8
Past service cost 7 —
Interest cost on benefit obligation 3 1
25 9
Movement in the present value of the obligation (PVO)2016
€0002015
€000
PVO at beginning of year 50 20
Current service cost 15 8
Interest cost 3 1
Actuarial loss due to:
Experience adjustments (2) 20
Changes in financial assumptions 2 (24)
Changes in demographic assumptions (24) 25
Past service cost 7 —
Movement in exchange rate (2) —
PVO at end of year 49 50
The principal assumptions used in determining retirement benefit obligations for the Group’s plans are shown below:
Actuarial assumptions 2016 2015
Discount rate 6.01% 6.14%
Salary increase rate 3.00% 3.00%
Mortality rate 1994 GAM 1994 GAM
Turnover rate Scale Scale
Employees profile
Number of plan members 164 148
Total annual compensation €000 1,552 1,474
Average annual compensation €000 9 10
Average attained age 27.39 27.58
Average years of service 2.90 2.48
Average expected future service years 11.00 12.00
Financial statementsContinued
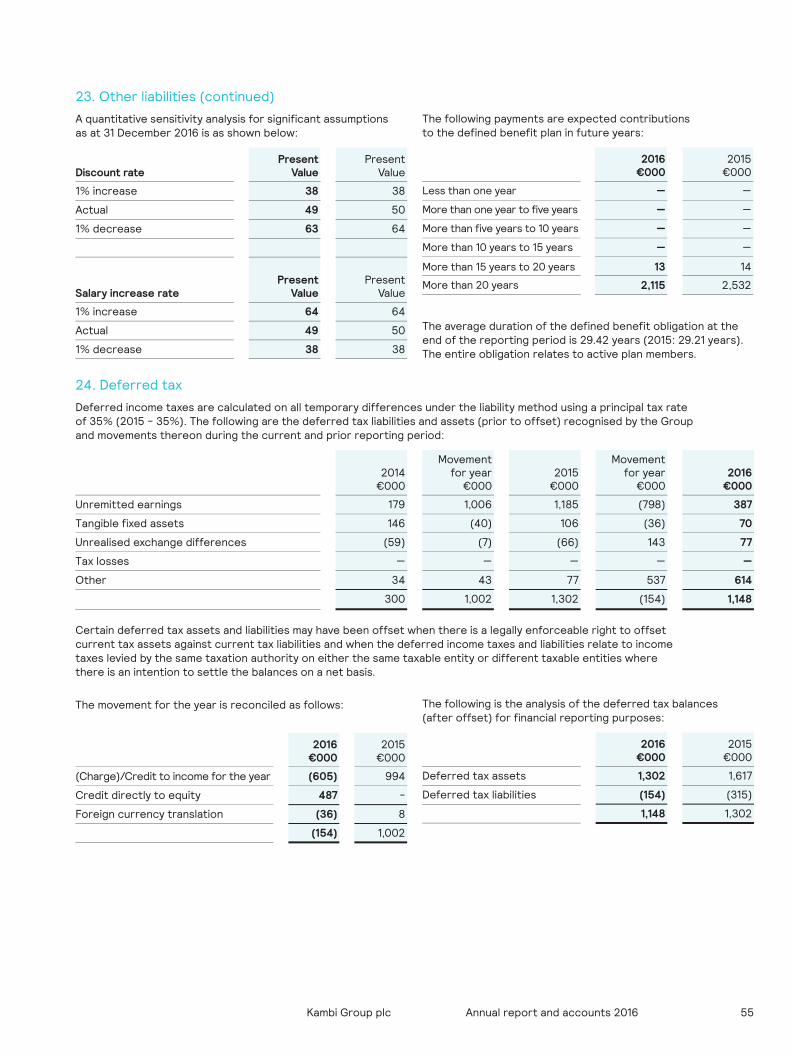
55Annual report and accounts 2016Kambi Group plc
23. Other liabilities (continued)
A quantitative sensitivity analysis for significant assumptions as at 31 December 2016 is as shown below:
Discount ratePresent
ValuePresent
Value
1% increase 38 38
Actual 49 50
1% decrease 63 64
Salary increase rate
Present
ValuePresent
Value
1% increase 64 64
Actual 49 50
1% decrease 38 38
24. Deferred tax
Deferred income taxes are calculated on all temporary differences under the liability method using a principal tax rate of 35% (2015 - 35%). The following are the deferred tax liabilities and assets (prior to offset) recognised by the Group and movements thereon during the current and prior reporting period:
2014€000
Movement for year
€0002015
€000
Movement for year
€0002016
€000
Unremitted earnings 179 1,006 1,185 (798) 387
Tangible fixed assets 146 (40) 106 (36) 70
Unrealised exchange differences (59) (7) (66) 143 77
Tax losses — — — — —
Other 34 43 77 537 614
300 1,002 1,302 (154) 1,148
Certain deferred tax assets and liabilities may have been offset when there is a legally enforceable right to offset current tax assets against current tax liabilities and when the deferred income taxes and liabilities relate to income taxes levied by the same taxation authority on either the same taxable entity or different taxable entities where there is an intention to settle the balances on a net basis.
The movement for the year is reconciled as follows:
2016 €000
2015€000
(Charge)/Credit to income for the year (605) 994
Credit directly to equity 487 -
Foreign currency translation (36) 8
(154) 1,002
The following is the analysis of the deferred tax balances (after offset) for financial reporting purposes:
2016 €000
2015€000
Deferred tax assets 1,302 1,617
Deferred tax liabilities (154) (315)
1,148 1,302
The following payments are expected contributions to the defined benefit plan in future years:
2016€000
2015€000
Less than one year — —
More than one year to five years — —
More than five years to 10 years — —
More than 10 years to 15 years — —
More than 15 years to 20 years 13 14
More than 20 years 2,115 2,532
The average duration of the defined benefit obligation at the end of the reporting period is 29.42 years (2015: 29.21 years).The entire obligation relates to active plan members.
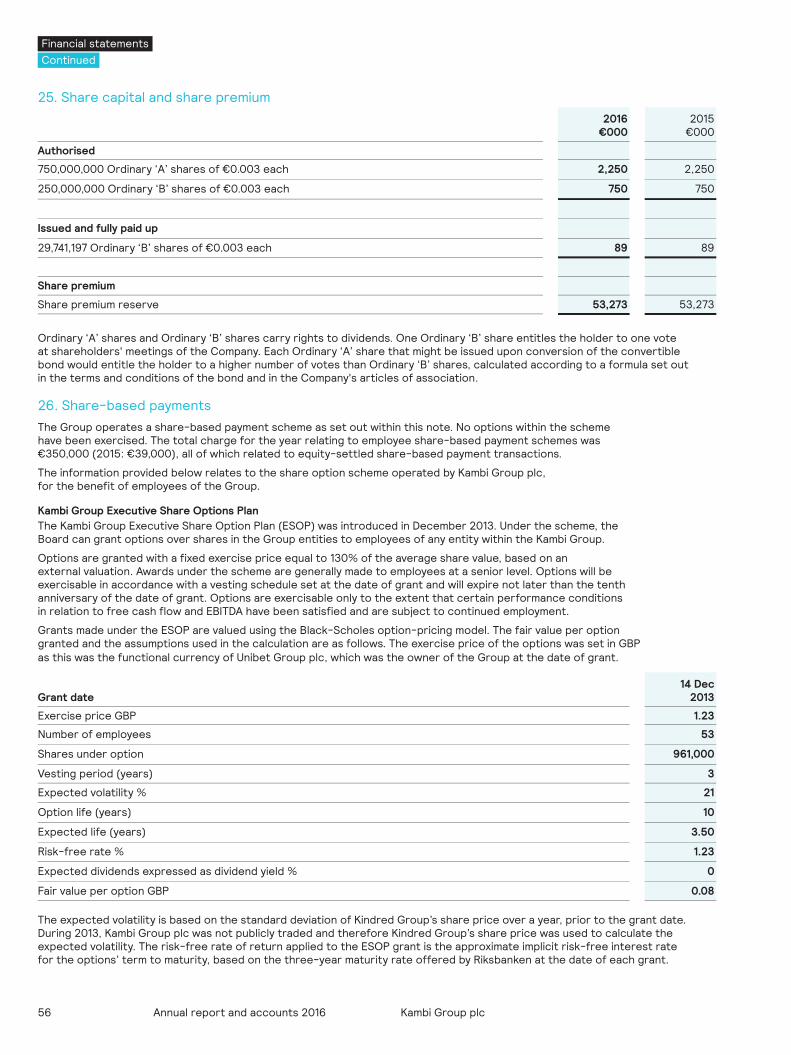
56 Annual report and accounts 2016 Kambi Group plc
25. Share capital and share premium2016
€0002015
€000
Authorised
750,000,000 Ordinary ‘A’ shares of €0.003 each 2,250 2,250
250,000,000 Ordinary ‘B’ shares of €0.003 each 750 750
Issued and fully paid up
29,741,197 Ordinary ‘B’ shares of €0.003 each 89 89
Share premium
Share premium reserve 53,273 53,273
Ordinary ‘A’ shares and Ordinary ‘B’ shares carry rights to dividends. One Ordinary ‘B’ share entitles the holder to one vote at shareholders' meetings of the Company. Each Ordinary ‘A’ share that might be issued upon conversion of the convertible bond would entitle the holder to a higher number of votes than Ordinary ‘B’ shares, calculated according to a formula set out in the terms and conditions of the bond and in the Company's articles of association.
26. Share-based paymentsThe Group operates a share-based payment scheme as set out within this note. No options within the scheme have been exercised. The total charge for the year relating to employee share-based payment schemes was €350,000 (2015: €39,000), all of which related to equity-settled share-based payment transactions.
The information provided below relates to the share option scheme operated by Kambi Group plc, for the benefit of employees of the Group.
Kambi Group Executive Share Options PlanThe Kambi Group Executive Share Option Plan (ESOP) was introduced in December 2013. Under the scheme, the Board can grant options over shares in the Group entities to employees of any entity within the Kambi Group.
Options are granted with a fixed exercise price equal to 130% of the average share value, based on an external valuation. Awards under the scheme are generally made to employees at a senior level. Options will be exercisable in accordance with a vesting schedule set at the date of grant and will expire not later than the tenth anniversary of the date of grant. Options are exercisable only to the extent that certain performance conditions in relation to free cash flow and EBITDA have been satisfied and are subject to continued employment.
Grants made under the ESOP are valued using the Black-Scholes option-pricing model. The fair value per option granted and the assumptions used in the calculation are as follows. The exercise price of the options was set in GBP as this was the functional currency of Unibet Group plc, which was the owner of the Group at the date of grant.
Grant date14 Dec
2013
Exercise price GBP 1.23
Number of employees 53
Shares under option 961,000
Vesting period (years) 3
Expected volatility % 21
Option life (years) 10
Expected life (years) 3.50
Risk-free rate % 1.23
Expected dividends expressed as dividend yield % 0
Fair value per option GBP 0.08
The expected volatility is based on the standard deviation of Kindred Group’s share price over a year, prior to the grant date. During 2013, Kambi Group plc was not publicly traded and therefore Kindred Group’s share price was used to calculate the expected volatility. The risk-free rate of return applied to the ESOP grant is the approximate implicit risk-free interest rate for the options’ term to maturity, based on the three-year maturity rate offered by Riksbanken at the date of each grant.
Financial statementsContinued
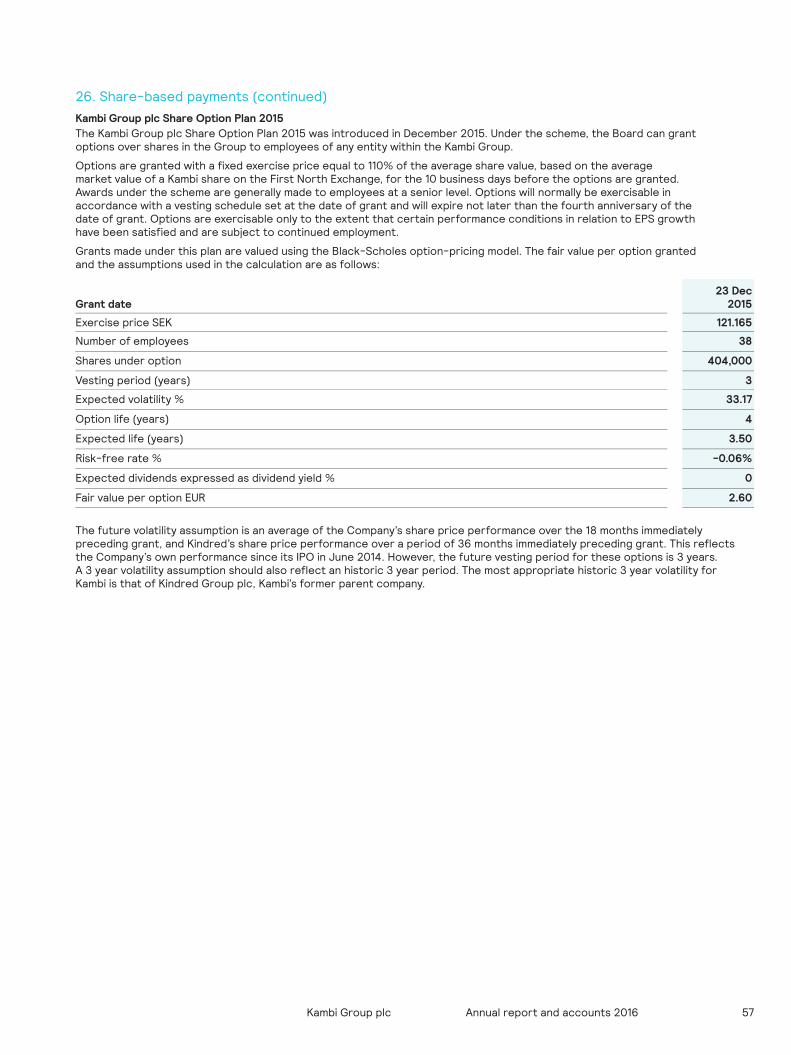
57Annual report and accounts 2016Kambi Group plc
26. Share-based payments (continued)Kambi Group plc Share Option Plan 2015The Kambi Group plc Share Option Plan 2015 was introduced in December 2015. Under the scheme, the Board can grant options over shares in the Group to employees of any entity within the Kambi Group.
Options are granted with a fixed exercise price equal to 110% of the average share value, based on the average market value of a Kambi share on the First North Exchange, for the 10 business days before the options are granted. Awards under the scheme are generally made to employees at a senior level. Options will normally be exercisable in accordance with a vesting schedule set at the date of grant and will expire not later than the fourth anniversary of the date of grant. Options are exercisable only to the extent that certain performance conditions in relation to EPS growth have been satisfied and are subject to continued employment.
Grants made under this plan are valued using the Black-Scholes option-pricing model. The fair value per option granted and the assumptions used in the calculation are as follows:
Grant date23 Dec
2015
Exercise price SEK 121.165
Number of employees 38
Shares under option 404,000
Vesting period (years) 3
Expected volatility % 33.17
Option life (years) 4
Expected life (years) 3.50
Risk-free rate % -0.06%
Expected dividends expressed as dividend yield % 0
Fair value per option EUR 2.60
The future volatility assumption is an average of the Company’s share price performance over the 18 months immediately preceding grant, and Kindred’s share price performance over a period of 36 months immediately preceding grant. This reflects the Company’s own performance since its IPO in June 2014. However, the future vesting period for these options is 3 years. A 3 year volatility assumption should also reflect an historic 3 year period. The most appropriate historic 3 year volatility for Kambi is that of Kindred Group plc, Kambi’s former parent company.
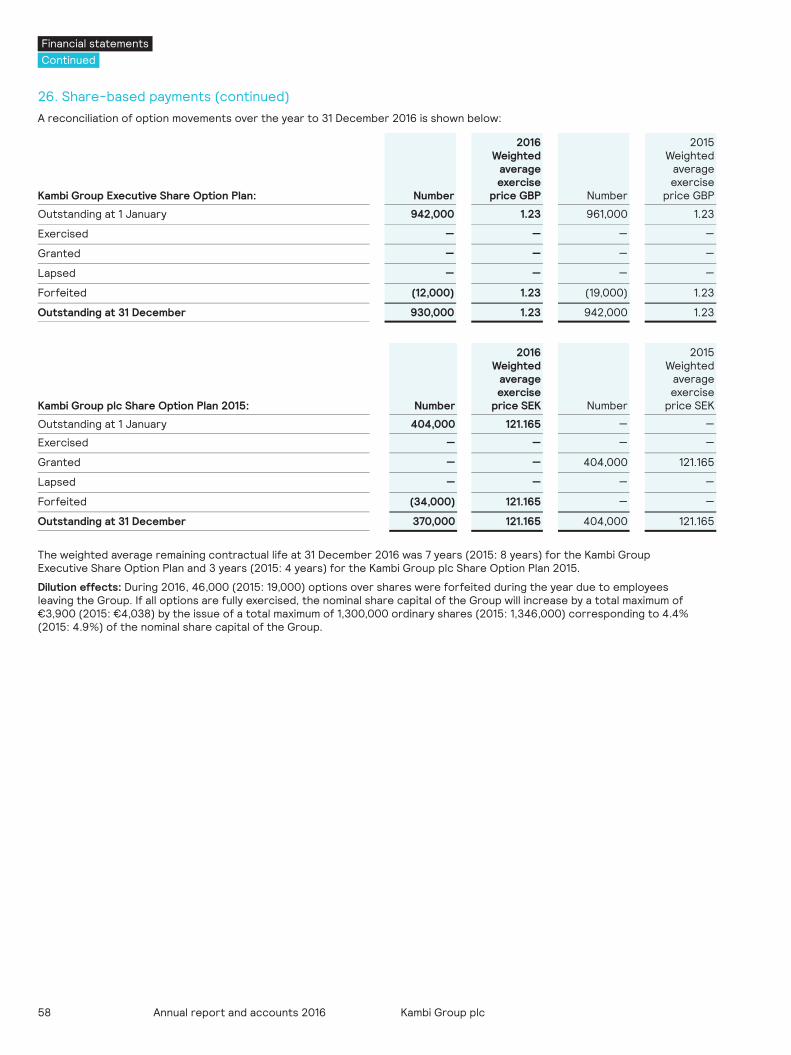
58 Annual report and accounts 2016 Kambi Group plc
26. Share-based payments (continued)A reconciliation of option movements over the year to 31 December 2016 is shown below:
Kambi Group Executive Share Option Plan: Number
2016Weighted
average exercise
price GBP Number
2015Weighted
average exercise
price GBP
Outstanding at 1 January 942,000 1.23 961,000 1.23
Exercised — — — —
Granted — — — —
Lapsed — — — —
Forfeited (12,000) 1.23 (19,000) 1.23
Outstanding at 31 December 930,000 1.23 942,000 1.23
Kambi Group plc Share Option Plan 2015: Number
2016Weighted
average exercise
price SEK Number
2015Weighted
average exercise
price SEK
Outstanding at 1 January 404,000 121.165 — —
Exercised — — — —
Granted — — 404,000 121.165
Lapsed — — — —
Forfeited (34,000) 121.165 — —
Outstanding at 31 December 370,000 121.165 404,000 121.165
The weighted average remaining contractual life at 31 December 2016 was 7 years (2015: 8 years) for the Kambi Group Executive Share Option Plan and 3 years (2015: 4 years) for the Kambi Group plc Share Option Plan 2015.
Dilution effects: During 2016, 46,000 (2015: 19,000) options over shares were forfeited during the year due to employees leaving the Group. If all options are fully exercised, the nominal share capital of the Group will increase by a total maximum of €3,900 (2015: €4,038) by the issue of a total maximum of 1,300,000 ordinary shares (2015: 1,346,000) corresponding to 4.4% (2015: 4.9%) of the nominal share capital of the Group.
Financial statementsContinued
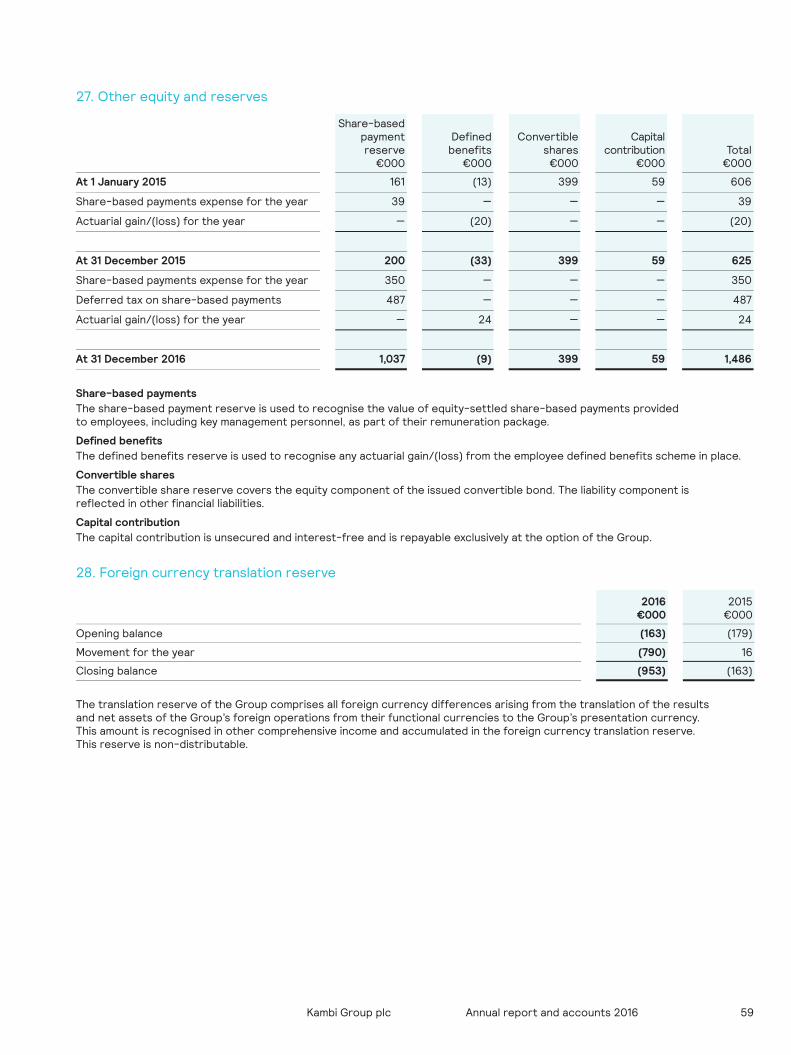
59Annual report and accounts 2016Kambi Group plc
27. Other equity and reserves
Share-based payment reserve
€000
Defined benefits
€000
Convertible shares
€000
Capital contribution
€000Total
€000
At 1 January 2015 161 (13) 399 59 606
Share-based payments expense for the year 39 — — — 39
Actuarial gain/(loss) for the year — (20) — — (20)
At 31 December 2015 200 (33) 399 59 625
Share-based payments expense for the year 350 — — — 350
Deferred tax on share-based payments 487 — — — 487
Actuarial gain/(loss) for the year — 24 — — 24
At 31 December 2016 1,037 (9) 399 59 1,486
Share-based paymentsThe share-based payment reserve is used to recognise the value of equity-settled share-based payments provided to employees, including key management personnel, as part of their remuneration package.
Defined benefitsThe defined benefits reserve is used to recognise any actuarial gain/(loss) from the employee defined benefits scheme in place.
Convertible sharesThe convertible share reserve covers the equity component of the issued convertible bond. The liability component is reflected in other financial liabilities.
Capital contributionThe capital contribution is unsecured and interest-free and is repayable exclusively at the option of the Group.
28. Foreign currency translation reserve
2016€000
2015€000
Opening balance (163) (179)
Movement for the year (790) 16
Closing balance (953) (163)
The translation reserve of the Group comprises all foreign currency differences arising from the translation of the results and net assets of the Group’s foreign operations from their functional currencies to the Group’s presentation currency. This amount is recognised in other comprehensive income and accumulated in the foreign currency translation reserve. This reserve is non-distributable.
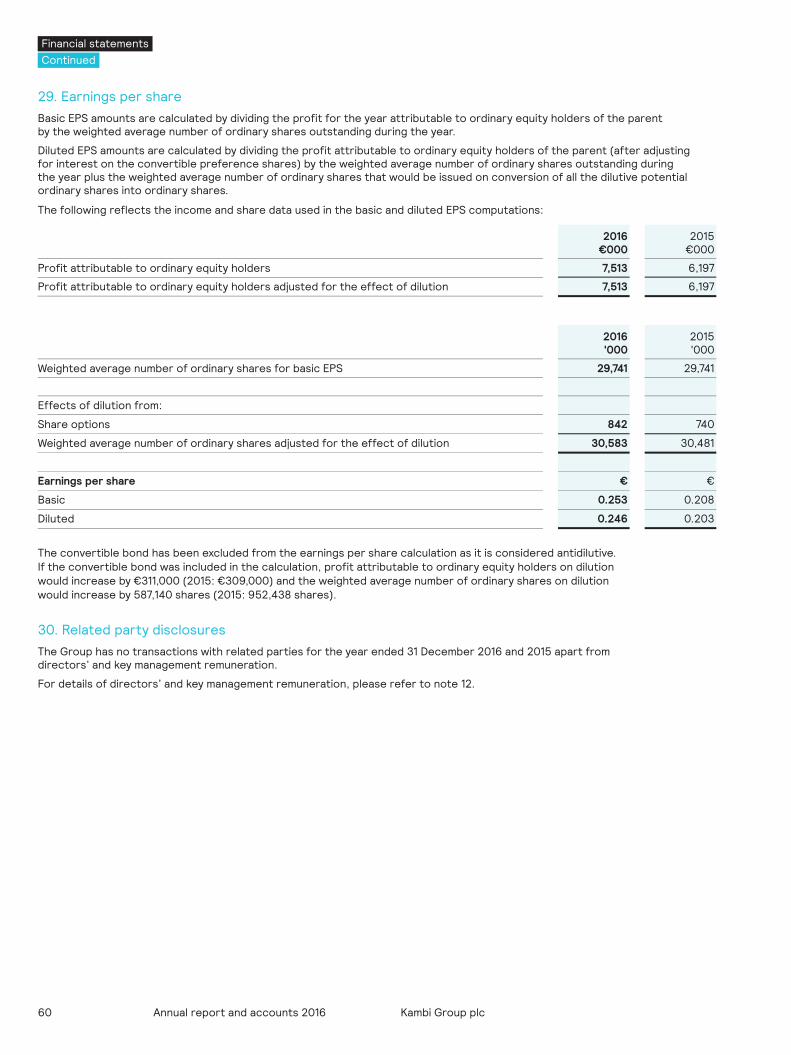
60 Annual report and accounts 2016 Kambi Group plc
29. Earnings per shareBasic EPS amounts are calculated by dividing the profit for the year attributable to ordinary equity holders of the parent by the weighted average number of ordinary shares outstanding during the year.
Diluted EPS amounts are calculated by dividing the profit attributable to ordinary equity holders of the parent (after adjusting for interest on the convertible preference shares) by the weighted average number of ordinary shares outstanding during the year plus the weighted average number of ordinary shares that would be issued on conversion of all the dilutive potential ordinary shares into ordinary shares.
The following reflects the income and share data used in the basic and diluted EPS computations:
2016€000
2015€000
Profit attributable to ordinary equity holders 7,513 6,197
Profit attributable to ordinary equity holders adjusted for the effect of dilution 7,513 6,197
2016'000
2015'000
Weighted average number of ordinary shares for basic EPS 29,741 29,741
Effects of dilution from:
Share options 842 740
Weighted average number of ordinary shares adjusted for the effect of dilution 30,583 30,481
Earnings per share € €
Basic 0.253 0.208
Diluted 0.246 0.203
The convertible bond has been excluded from the earnings per share calculation as it is considered antidilutive. If the convertible bond was included in the calculation, profit attributable to ordinary equity holders on dilution would increase by €311,000 (2015: €309,000) and the weighted average number of ordinary shares on dilution would increase by 587,140 shares (2015: 952,438 shares).
30. Related party disclosuresThe Group has no transactions with related parties for the year ended 31 December 2016 and 2015 apart from directors’ and key management remuneration.
For details of directors’ and key management remuneration, please refer to note 12.
Financial statementsContinued
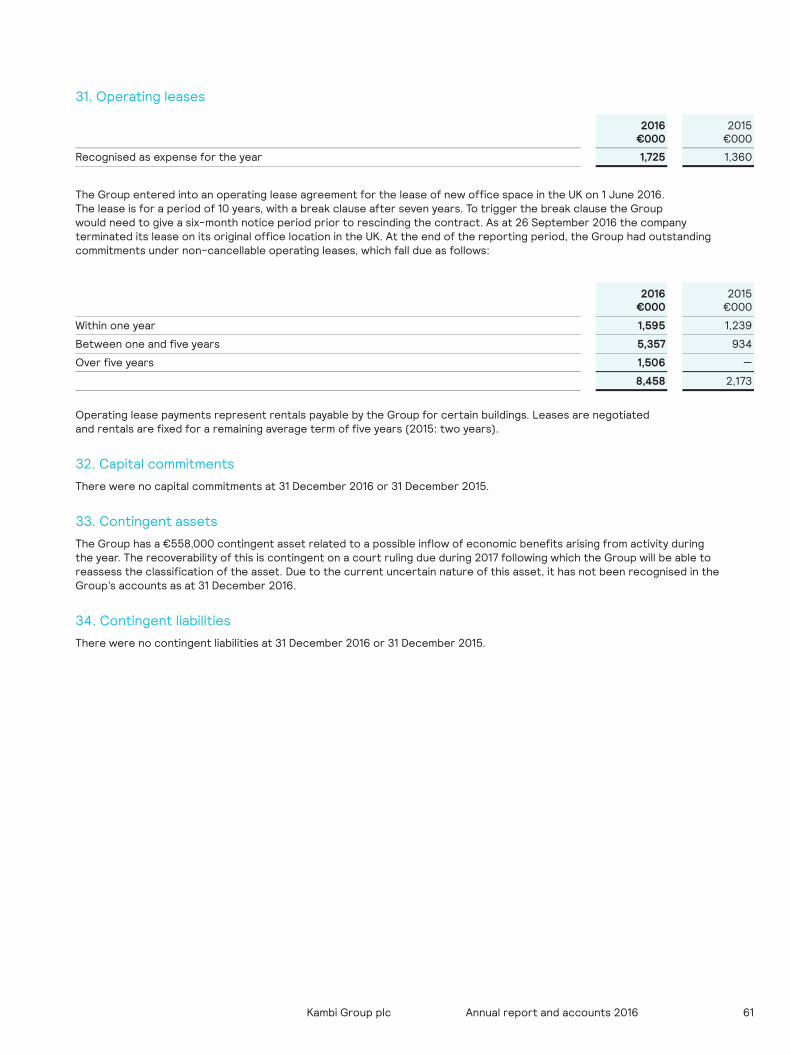
61Annual report and accounts 2016Kambi Group plc
31. Operating leases
2016€000
2015€000
Recognised as expense for the year 1,725 1,360
The Group entered into an operating lease agreement for the lease of new office space in the UK on 1 June 2016. The lease is for a period of 10 years, with a break clause after seven years. To trigger the break clause the Group would need to give a six-month notice period prior to rescinding the contract. As at 26 September 2016 the company terminated its lease on its original office location in the UK. At the end of the reporting period, the Group had outstanding commitments under non-cancellable operating leases, which fall due as follows:
2016€000
2015€000
Within one year 1,595 1,239
Between one and five years 5,357 934
Over five years 1,506 —
8,458 2,173
Operating lease payments represent rentals payable by the Group for certain buildings. Leases are negotiated and rentals are fixed for a remaining average term of five years (2015: two years).
32. Capital commitments
There were no capital commitments at 31 December 2016 or 31 December 2015.
33. Contingent assets
The Group has a €558,000 contingent asset related to a possible inflow of economic benefits arising from activity during the year. The recoverability of this is contingent on a court ruling due during 2017 following which the Group will be able to reassess the classification of the asset. Due to the current uncertain nature of this asset, it has not been recognised in the Group’s accounts as at 31 December 2016.
34. Contingent liabilities
There were no contingent liabilities at 31 December 2016 or 31 December 2015.
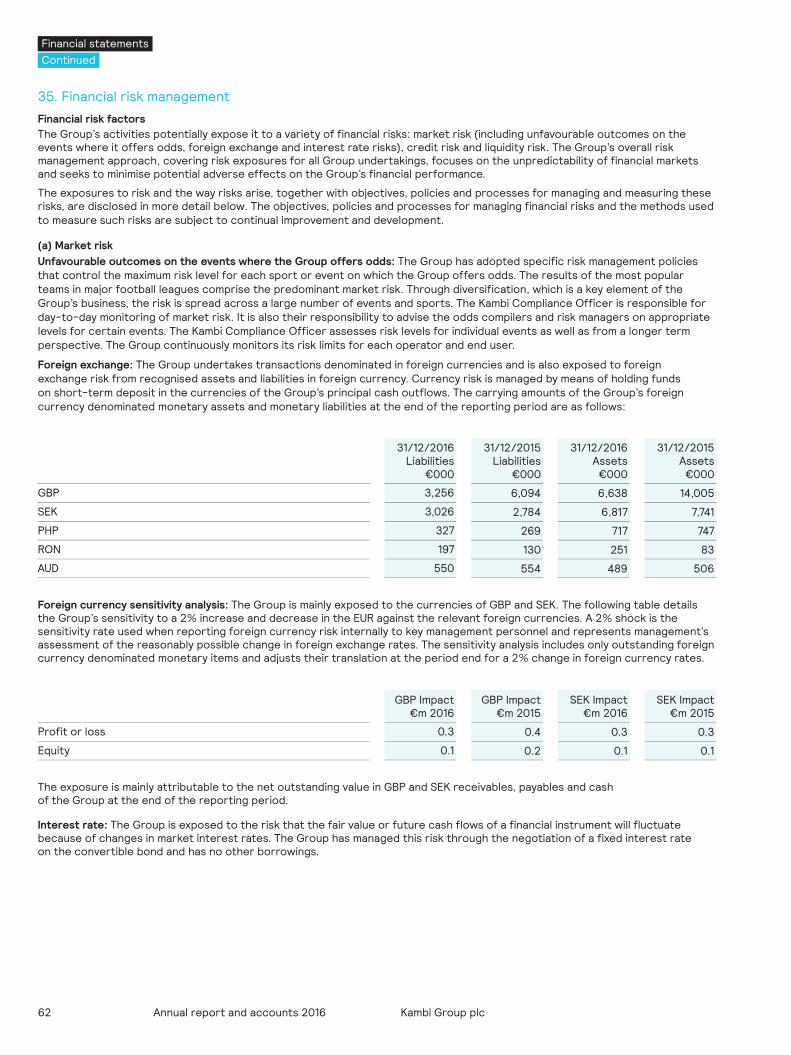
62 Annual report and accounts 2016 Kambi Group plc
Financial statementsContinued
35. Financial risk management
Financial risk factorsThe Group’s activities potentially expose it to a variety of financial risks: market risk (including unfavourable outcomes on the events where it offers odds, foreign exchange and interest rate risks), credit risk and liquidity risk. The Group’s overall risk management approach, covering risk exposures for all Group undertakings, focuses on the unpredictability of financial markets and seeks to minimise potential adverse effects on the Group’s financial performance.
The exposures to risk and the way risks arise, together with objectives, policies and processes for managing and measuring these risks, are disclosed in more detail below. The objectives, policies and processes for managing financial risks and the methods used to measure such risks are subject to continual improvement and development.
(a) Market riskUnfavourable outcomes on the events where the Group offers odds: The Group has adopted specific risk management policies that control the maximum risk level for each sport or event on which the Group offers odds. The results of the most popular teams in major football leagues comprise the predominant market risk. Through diversification, which is a key element of the Group’s business, the risk is spread across a large number of events and sports. The Kambi Compliance Officer is responsible for day-to-day monitoring of market risk. It is also their responsibility to advise the odds compilers and risk managers on appropriate levels for certain events. The Kambi Compliance Officer assesses risk levels for individual events as well as from a longer term perspective. The Group continuously monitors its risk limits for each operator and end user.
Foreign exchange: The Group undertakes transactions denominated in foreign currencies and is also exposed to foreign exchange risk from recognised assets and liabilities in foreign currency. Currency risk is managed by means of holding funds on short-term deposit in the currencies of the Group’s principal cash outflows. The carrying amounts of the Group’s foreign currency denominated monetary assets and monetary liabilities at the end of the reporting period are as follows:
31/12/2016Liabilities
€000
31/12/2015Liabilities
€000
31/12/2016 Assets
€000
31/12/2015Assets
€000
GBP 3,256 6,094 6,638 14,005
SEK 3,026 2,784 6,817 7,741
PHP 327 269 717 747
RON 197 130 251 83
AUD 550 554 489 506
Foreign currency sensitivity analysis: The Group is mainly exposed to the currencies of GBP and SEK. The following table details the Group’s sensitivity to a 2% increase and decrease in the EUR against the relevant foreign currencies. A 2% shock is the sensitivity rate used when reporting foreign currency risk internally to key management personnel and represents management’s assessment of the reasonably possible change in foreign exchange rates. The sensitivity analysis includes only outstanding foreign currency denominated monetary items and adjusts their translation at the period end for a 2% change in foreign currency rates.
GBP Impact€m 2016
GBP Impact€m 2015
SEK Impact€m 2016
SEK Impact€m 2015
Profit or loss 0.3 0.4 0.3 0.3
Equity 0.1 0.2 0.1 0.1
The exposure is mainly attributable to the net outstanding value in GBP and SEK receivables, payables and cash of the Group at the end of the reporting period.
Interest rate: The Group is exposed to the risk that the fair value or future cash flows of a financial instrument will fluctuate because of changes in market interest rates. The Group has managed this risk through the negotiation of a fixed interest rate on the convertible bond and has no other borrowings.
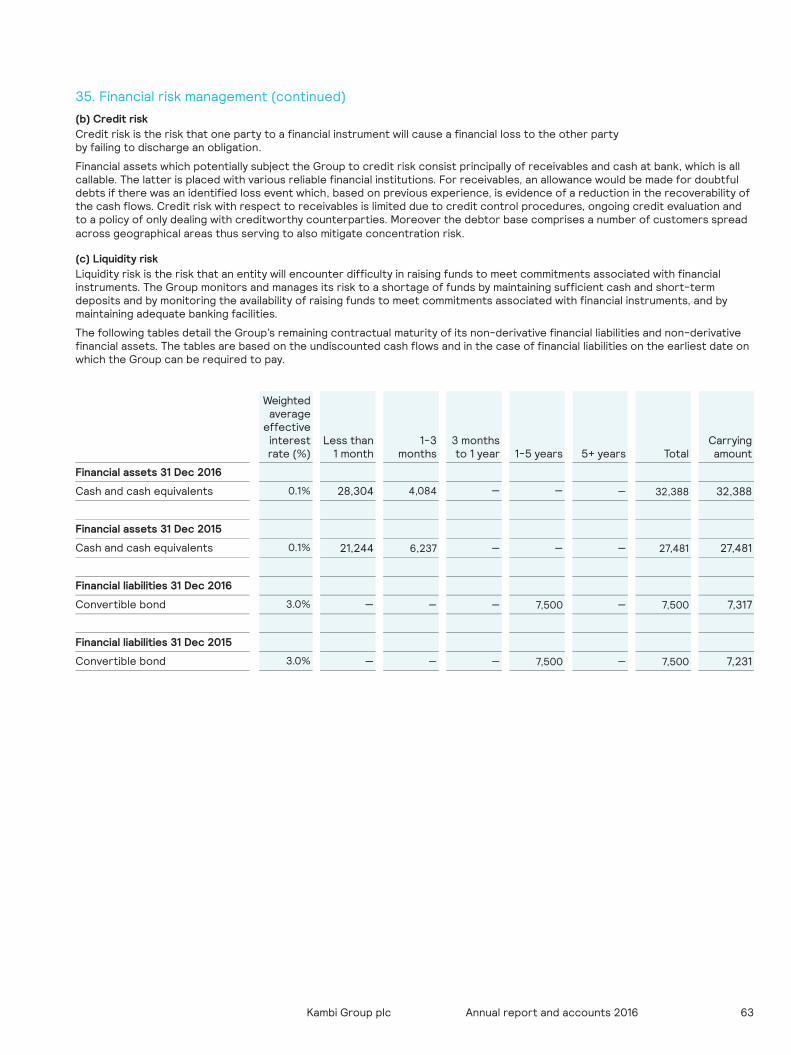
63Annual report and accounts 2016Kambi Group plc
35. Financial risk management (continued)
(b) Credit riskCredit risk is the risk that one party to a financial instrument will cause a financial loss to the other party by failing to discharge an obligation.
Financial assets which potentially subject the Group to credit risk consist principally of receivables and cash at bank, which is all callable. The latter is placed with various reliable financial institutions. For receivables, an allowance would be made for doubtful debts if there was an identified loss event which, based on previous experience, is evidence of a reduction in the recoverability of the cash flows. Credit risk with respect to receivables is limited due to credit control procedures, ongoing credit evaluation and to a policy of only dealing with creditworthy counterparties. Moreover the debtor base comprises a number of customers spread across geographical areas thus serving to also mitigate concentration risk.
(c) Liquidity riskLiquidity risk is the risk that an entity will encounter difficulty in raising funds to meet commitments associated with financial instruments. The Group monitors and manages its risk to a shortage of funds by maintaining sufficient cash and short-term deposits and by monitoring the availability of raising funds to meet commitments associated with financial instruments, and by maintaining adequate banking facilities.
The following tables detail the Group’s remaining contractual maturity of its non-derivative financial liabilities and non-derivative financial assets. The tables are based on the undiscounted cash flows and in the case of financial liabilities on the earliest date on which the Group can be required to pay.
Weighted average
effective interest rate (%)
Less than 1 month
1-3 months
3 months to 1 year 1-5 years 5+ years Total
Carrying amount
Financial assets 31 Dec 2016
Cash and cash equivalents 0.1% 28,304 4,084 — — — 32,388 32,388
Financial assets 31 Dec 2015
Cash and cash equivalents 0.1% 21,244 6,237 — — — 27,481 27,481
Financial liabilities 31 Dec 2016
Convertible bond 3.0% — — — 7,500 — 7,500 7,317
Financial liabilities 31 Dec 2015
Convertible bond 3.0% — — — 7,500 — 7,500 7,231
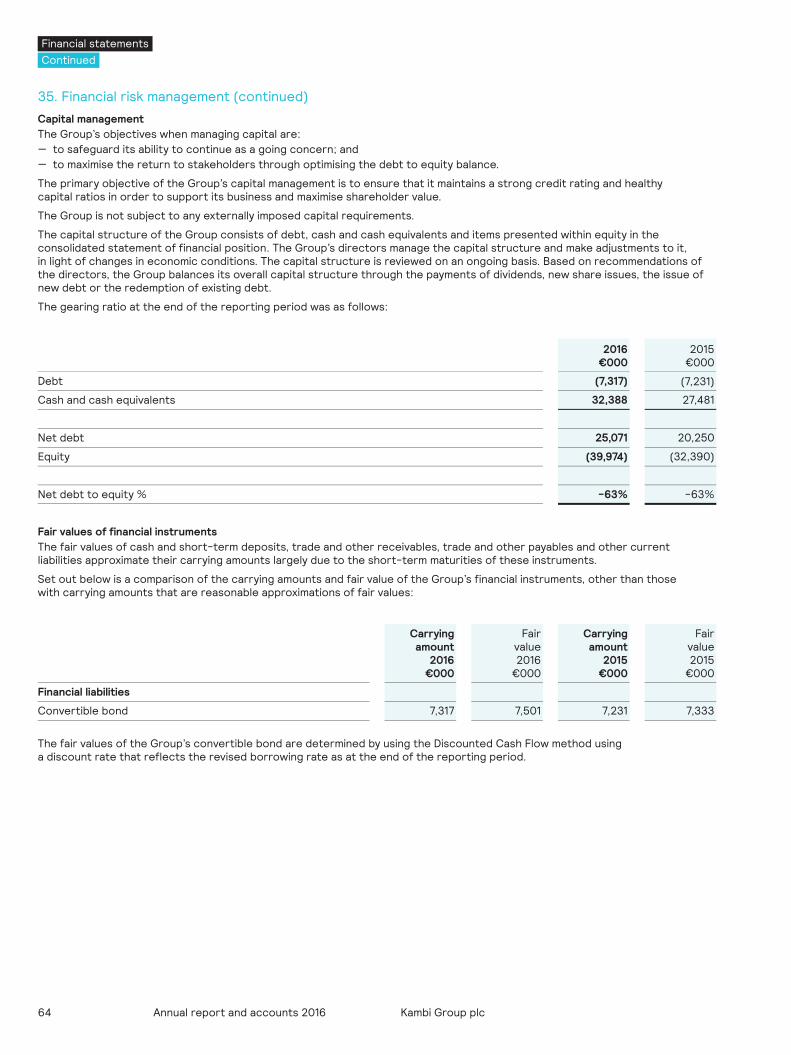
64 Annual report and accounts 2016 Kambi Group plc
Financial statementsContinued
35. Financial risk management (continued)
Capital managementThe Group’s objectives when managing capital are:— to safeguard its ability to continue as a going concern; and— to maximise the return to stakeholders through optimising the debt to equity balance.
The primary objective of the Group’s capital management is to ensure that it maintains a strong credit rating and healthy capital ratios in order to support its business and maximise shareholder value.
The Group is not subject to any externally imposed capital requirements.
The capital structure of the Group consists of debt, cash and cash equivalents and items presented within equity in the consolidated statement of financial position. The Group’s directors manage the capital structure and make adjustments to it, in light of changes in economic conditions. The capital structure is reviewed on an ongoing basis. Based on recommendations of the directors, the Group balances its overall capital structure through the payments of dividends, new share issues, the issue of new debt or the redemption of existing debt.
The gearing ratio at the end of the reporting period was as follows:
2016€000
2015€000
Debt (7,317) (7,231)
Cash and cash equivalents 32,388 27,481
Net debt 25,071 20,250
Equity (39,974) (32,390)
Net debt to equity % -63% -63%
Fair values of financial instrumentsThe fair values of cash and short-term deposits, trade and other receivables, trade and other payables and other current liabilities approximate their carrying amounts largely due to the short-term maturities of these instruments.
Set out below is a comparison of the carrying amounts and fair value of the Group’s financial instruments, other than those with carrying amounts that are reasonable approximations of fair values:
Carrying amount
2016€000
Fair value2016
€000
Carrying amount
2015€000
Fair value2015
€000
Financial liabilities
Convertible bond 7,317 7,501 7,231 7,333
The fair values of the Group’s convertible bond are determined by using the Discounted Cash Flow method using a discount rate that reflects the revised borrowing rate as at the end of the reporting period.
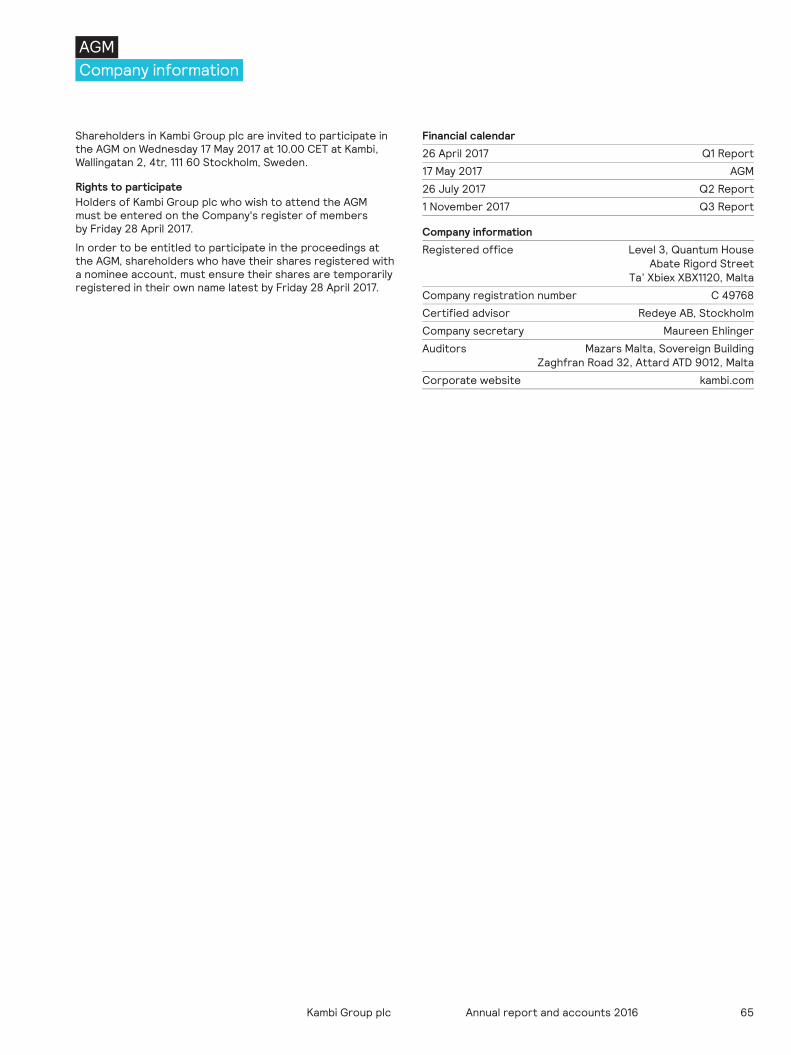
65Annual report and accounts 2016Kambi Group plc
Shareholders in Kambi Group plc are invited to participate in the AGM on Wednesday 17 May 2017 at 10.00 CET at Kambi, Wallingatan 2, 4tr, 111 60 Stockholm, Sweden.
Rights to participateHolders of Kambi Group plc who wish to attend the AGM must be entered on the Company's register of members by Friday 28 April 2017.
In order to be entitled to participate in the proceedings at the AGM, shareholders who have their shares registered with a nominee account, must ensure their shares are temporarily registered in their own name latest by Friday 28 April 2017.
Financial calendar 26 April 2017 Q1 Report
17 May 2017 AGM
26 July 2017 Q2 Report
1 November 2017 Q3 Report
Company information Registered office Level 3, Quantum House Abate Rigord Street
Ta’ Xbiex XBX1120, Malta
Company registration number C 49768
Certified advisor Redeye AB, Stockholm
Company secretary Maureen Ehlinger
Auditors Mazars Malta, Sovereign Building Zaghfran Road 32, Attard ATD 9012, Malta
Corporate website kambi.com
AGMCompany information
66 Annual report and accounts 2016 Kambi Group plc
GlossaryDefinitions
A
Average number of employees Average number of employees based on headcount at each month end
B
B2BBusiness-to-Business
B2CBusiness-to-Consumer
C
Cash flow per share Net increase/(decrease) in cash and cash equivalents, divided by the number of ordinary shares at the balance sheet date
Customer B2C operator to whom Kambi provides services
E
Earnings per share, fully dilutedProfit after tax adjusted for any effects of dilutive potential ordinary shares divided by the fully diluted weighted average number of ordinary shares for the period
EBITEarnings before interest and taxation, equates to operating profit
EBIT marginEBIT as a percentage of revenue
EBITDAOperating profit before depreciation and amortisation charges
End userA player that places bets with an operator
Equity/assets ratioTotal shareholders’ equity as a percentage of total assets
Equity per shareTotal shareholders’ equity divided by the number of ordinary shares at the balance sheet date
G
Gross Gaming Revenue (GGR) The amount wagered minus the winnings returned to players
GRLGovernment Regulated Lottery
I
iBetting Online betting including mobile
Instant bettingAn instant bet is a bet that typically has a lifetime of around one minute
L
Live betting Odds set and played during an event
N
Net cashTotal cash less debt at period end
Net Gaming Revenue (NGR)GGR less deductible costs
O
Operating marginOperating profit as a percentage of revenue
OperatorA B2C gambling operator
Operator Turnover and Margin Index This index shows Kambi’s operators’ turnover and margin based on the total stakes and payouts of their players
P
Pre-match oddsOdds set and played on prior to the start of the event
R
Return on total assets Profit after tax as a percentage of average total assets
Revenue Income from Kambi’s operators based on fixed and variable elements
S
SportsbookA platform where bets are placed and accepted on sporting and other events
W
Weighted average number of shares Calculated as the weighted average number of ordinary shares outstanding during the year
Weighted average number of shares, fully dilutedCalculated as the weighted average number of ordinary shares outstanding and potentially outstanding (i.e. including the effect of exercising all share options) during the year
U
UXUser Experience

Designed and produced by mosaiccreates.co.uk

For more information, contact: CEO Kristian Nylén Head of Investor Relations Anna-Lena Åström
+44 (0)20 3617 7270 [email protected] www.kambi.com
Kambi Group plc Level 3, Quantum House Abate Rigord Street Ta’ Xbiex XBX1120, Malta
Kambi G
roup plc Annual report and accounts 2016
ww
w.k
amb
i.co
m