Embed Size (px)
Citation preview
Annual ReportFor the year ended
31 March 2011
African Copper100 Pall MallSt. James'sLondonSW1Y 5HPUnited Kingdom
www.africancopper.com
African Copper plcRegistered in England and Wales no. 5041259
Contents
Chairman’s statement 1
Chief Executive’s review of operations 3
Financial review 6
Director’s report 11
Statement of Directors’ responsibilities 14
Statement of corporate governance 15
Directors’ remuneration report 16
Independent Auditor’s report to themembers of African Copper plc 18
Consolidated statement of comprehensive income 19
Balance sheets 20
Consolidated statement of changes in equity 21
Company statement of changes in equity 22
Consolidated cash flow statement 23
Company cash flow statement 24
Notes to the consolidated financial statements 25
Des
igne
d an
d pr
oduc
ed b
yfo
urt
hqu
arte
r
1
African Copper plc 2011 Annual Report
Chairman’s statement
The year under review saw African Copper make goodprogress overall towards its goal of delivering sustainablecommercial production levels from the Company’s highquality copper assets in north eastern Botswana.
Overview
At the Mowana Mine, the programme to upgrade andde-bottleneck the production facilities was continued withkey plant CAPEX projects awaiting delivery, installationand commissioning of units following placement of orders.Throughput has risen and progress is being made onopening up the Mowana pit by increasing the strippingratios in the short term to increase the available oreextraction footprint. These have resulted in demand forincreased drilling, blasting and load and haul capacity.
Despite the constraints on production which were mostlycaused by circuit bottlenecks and breakdowns progresswas made during the year as ore processed increased to632,981Mt compared to 290,259Mt in the previous15 month fiscal period.
Following the award of a Mining Licence for the Thakadudeposit, which is approximately 70km from Mowana mine,the start of ore extraction further increased the utilisationof the Mowana facilities. Currently, ore processing at theMowana facilities continues to be batch processed on analternating basis between Mowana and Thakadu ores dueto differences in ore quality that require different chemicalreagent suites to maximise copper recovery.
At Thakadu itself, full scale mining has commenced witha ramp up to required volumes expected in the next fewmonths. Thakadu operations have created both miningand processing flexibility with marked positive impacton de-stressing mining operations at the Mowana pit.Negotiations are at an advanced stage with the BotswanaGovernment on the remaining part of the copper depositunder the Archaeological Site. There are some positiveindications of ore quality improvement with significantpockets of sulphide ore having been extracted resulting incopper recoveries being higher than target for this ore.
At the beginning of the financial year under review, theCompany resumed exploration activities on its explorationpermits at the adjacent Matsitama Project. A panel ofinternationally recognised geological experts was assembledand an experienced exploration manager was hired.The expert panel identified ten new and highly prospectivetargets during the review process and the Matsitamaexploration staff have systematically executed on anexploration programme to assess these targets.
Due to the positive results to date and the plannedexploration programme aimed at further defining knowntargets, the Company’s subsidiary was granted a two yearrenewal on four of its six prospecting licences by theMinister for Minerals, Energy and Water Resources,Botswana. The four prospecting licenses, PL 14/2004,15/2004, 16/2004 and 17/2004, total 1,988.6km2 in extentand cover much of the highly prospective Matsitama SchistBelt. The Company’s subsidiary also holds title to two otherprospecting licenses in the Matsitama Schist Belt, whichcollectively cover an area of 96.2km2.
Results
As a result of the more than doubling of ore processedyear-on-year, the increases in grades and recovery andgenerally buoyant copper prices, revenues for the year to31 March 2011 were US$24.7 million (15 months to 31 March2010: US$7.4 million). After the higher operating costscommensurate with the increased production and increasedamortisation, these revenues led to a much reduced operatingloss of US$2.3 million (15 month period to 31 March 2010: lossof US$11.6 million, calculated prior to taking account of theUS$46.0 million reversal of prior period impairment charges)
Administrative expenses were cut significantly to US$4.8 millionfrom US$7.9 million in the prior period, reflecting expensesover a twelve month period compared to a fifteen monthperiod and significant professional fees and other one-timecosts incurred during the financial restructuring that wascompleted during 2009. After increased finance costs due toboth the quantum and interest cost of borrowings beinghigher, loss before tax was US$9.0 million, compared to aprofit of US$30.7 million in the prior period, which included aUS$46.0 million reversal of prior period impairment charges.
African Copper plc 2011 Annual Report
2
Chairman’s statementcontinued
Financing
To support the completion of the infrastructure upgrades atthe Mowana and Thakadu mines and renewed explorationefforts at Matsitama, the Company’s controlling shareholderZCI Limited (“ZCI”) has provided strong support during theyear. After providing a $10 million working capital facility inMarch 2010 (the “March Facility”), ZCI provided a further$7.5 million development facility for exploration drilling atMatsitama and Mowana North, scoping study at the Makaladeposit and certain plant enhancements at Mowana. Theircommitment was further demonstrated in February 2011with a $12.5 million development facility for Mowana plantenhancements, acceleration of mining activities at Thakaduand working capital. At 31 March 2011 $4.0 million of theavailable $12.5 million had been drawn. At 31 March 2011ZCI also provided a 1 year extension on the payment of theMarch Facility which was due.
Outlook
At Mowana, the constraint on production levels remains oredelivery to the mill as a result of poor secondary andtertiary crusher availability and although these constraintshave been somewhat offset by improving mill feed coppergrades during the past three months, a permanent solutionneeds to be implemented.
The Amec Minproc Study on the Secondary and Tertiarycrushers – long a bottleneck at the Mowana facilities – hasbeen completed, and the Company is reviewing the report’srecommendations for modification to determine a cost-effective implementation plan to upgrade the circuits assoon as possible. Once such a plan is in hand and withaccess to the February 2011 development facility providedfrom ZCI, the Company will expeditiously move to make thechanges necessary to be able to ramp up production tolevels that the assets at Mowana, Thakadu and, in duecourse, Matsitama justify.
In summary I would like to recognise and give thanks to ourBoard, our acting chief executive officer, Jordan Soko, for hisleadership and our team of managers and employees fortheir outstanding efforts and commitment towards movingthe Mowana mine to full production. I am confident thattheir contributions will ensure African Copper’s bright future.The Board expects to report further progress towards ourgoals during the current financial year.
David RodierChairman
29 June 2011
3
African Copper plc 2011 Annual Report
Chief Executive’s review of operations
Review of operations
We are looking forward to the coming year as many ofthe initiatives we have put in place are expected to beimplemented and should result in the Mowana mine finallyreaching sustained commercial production levels. Lookingback, the past year has been a challenging one but wehave achieved a considerable amount and laid thefoundation for success in our operations. In addition,we also are looking forward to encouraging results fromour exploration project Matsitama.
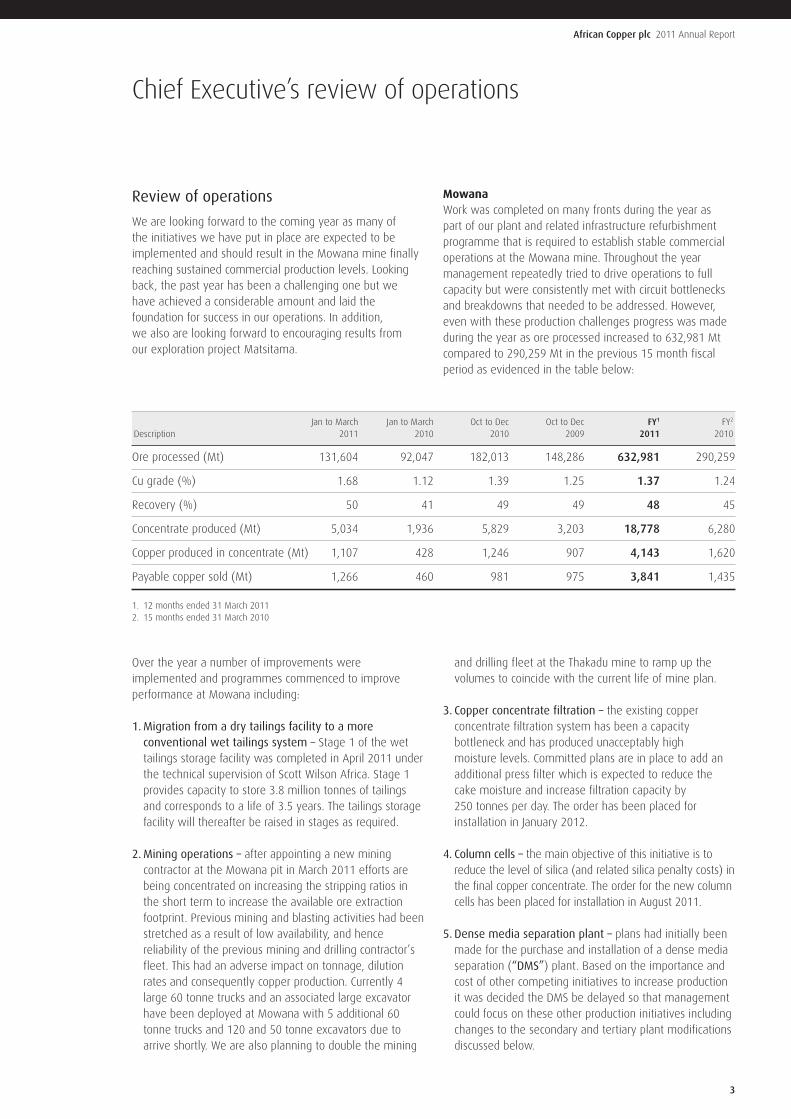
MowanaWork was completed on many fronts during the year aspart of our plant and related infrastructure refurbishmentprogramme that is required to establish stable commercialoperations at the Mowana mine. Throughout the yearmanagement repeatedly tried to drive operations to fullcapacity but were consistently met with circuit bottlenecksand breakdowns that needed to be addressed. However,even with these production challenges progress was madeduring the year as ore processed increased to 632,981 Mtcompared to 290,259 Mt in the previous 15 month fiscalperiod as evidenced in the table below:
Over the year a number of improvements wereimplemented and programmes commenced to improveperformance at Mowana including:
1.Migration from a dry tailings facility to a moreconventional wet tailings system – Stage 1 of the wettailings storage facility was completed in April 2011 underthe technical supervision of Scott Wilson Africa. Stage 1provides capacity to store 3.8 million tonnes of tailingsand corresponds to a life of 3.5 years. The tailings storagefacility will thereafter be raised in stages as required.
2.Mining operations – after appointing a new miningcontractor at the Mowana pit in March 2011 efforts arebeing concentrated on increasing the stripping ratios inthe short term to increase the available ore extractionfootprint. Previous mining and blasting activities had beenstretched as a result of low availability, and hencereliability of the previous mining and drilling contractor’sfleet. This had an adverse impact on tonnage, dilutionrates and consequently copper production. Currently 4large 60 tonne trucks and an associated large excavatorhave been deployed at Mowana with 5 additional 60tonne trucks and 120 and 50 tonne excavators due toarrive shortly. We are also planning to double the mining
and drilling fleet at the Thakadu mine to ramp up thevolumes to coincide with the current life of mine plan.
3. Copper concentrate filtration – the existing copperconcentrate filtration system has been a capacitybottleneck and has produced unacceptably highmoisture levels. Committed plans are in place to add anadditional press filter which is expected to reduce thecake moisture and increase filtration capacity by250 tonnes per day. The order has been placed forinstallation in January 2012.
4. Column cells – the main objective of this initiative is toreduce the level of silica (and related silica penalty costs) inthe final copper concentrate. The order for the new columncells has been placed for installation in August 2011.
5. Dense media separation plant – plans had initially beenmade for the purchase and installation of a dense mediaseparation (“DMS”) plant. Based on the importance andcost of other competing initiatives to increase productionit was decided the DMS be delayed so that managementcould focus on these other production initiatives includingchanges to the secondary and tertiary plant modificationsdiscussed below.
Jan to March Jan to March Oct to Dec Oct to Dec FY1 FY2
Description 2011 2010 2010 2009 2011 2010
Ore processed (Mt) 131,604 92,047 182,013 148,286 632,981 290,259
Cu grade (%) 1.68 1.12 1.39 1.25 1.37 1.24
Recovery (%) 50 41 49 49 48 45
Concentrate produced (Mt) 5,034 1,936 5,829 3,203 18,778 6,280
Copper produced in concentrate (Mt) 1,107 428 1,246 907 4,143 1,620
Payable copper sold (Mt) 1,266 460 981 975 3,841 1,435
1. 12 months ended 31 March 20112. 15 months ended 31 March 2010
African Copper plc 2011 Annual Report
4
Chief Executive’s review of operationscontinued
6.Wet season mining plan – a comprehensive wet seasonmining plan was successfully implemented which limitedthe amount of mining in wet ore. Initiatives such as theconstruction of a lifted road around the pit perimeteravoided surface drainage into the pit, the construction ofadequate sumps and associated pipe installation for pitdewatering, and the acquisition of pit dewatering pumpswere all effective in reducing the amount of wet ore fedto the plant.
7. Secondary and tertiary plant – the primary constraint onproduction levels remains ore delivery to the mill as aresult of poor secondary and tertiary (“SnT”) crusheravailability. The Amec Minproc study on the SnT crushermodifications was completed during the year, and theCompany is reviewing the report to determine a cost-effective implementation plan to complete modificationsas soon as possible. As part of this circuit modification theaddition of a washing plant is being recommended toscreen and wash out the fine fraction from the ore tofurther alleviate the demands on the SnT crusher. In aneffort to supplement existing SnT capacity mobilecrushing capacity was added during the year. While themobile crushers provided intermittent capacity duringthe year, reliability and downtime of the units wereproblematic and combined with their relative inability toconsistently crush the harder Mowana ore limited theircontribution to mill feed.
ThakaduThe receipt of the Thakadu mining licence (the “MiningLicence”) from the Botswana Government in December 2010was a major milestone for the Company. The high gradeThakadu copper-silver deposit lies about 70 km from theMowana processing infrastructure. The open pit mining areaembodied in the Mining Licence excludes the archaeologicalsite that is still under negotiations with the BotswanaGovernment. The goal is to receive permission under theissued Mining Licence to mine out the ore reserve directlyunderneath the Thakadu archaeological site by open pitmeans. It is anticipated that the current interim open pit cutdesign allows for the extraction of approximately 1.4 milliontonnes of ore out of the 2.4 million available reserves.
Thakadu’s high grade mineral reserves will be developed ona relatively small scale (and relatively low cost) operationwith a low stripping ratio and will share the Mowana Mineinfrastructure and management. The pure Thakadu oxidelayer is a relatively small portion of the deposit and isestimated to range approximately 30 metres from surface.To date this highly oxidized ore has been difficult to processwith recoveries generally below 50%. After mining down
approximately 15 metres there are some positiveindications of ore quality improvement with significantpockets of sulphide ore having been extracted. Historicaltest work estimated 40% recovery for the Thakadu oxideore but significant improvement for the Thakadu sulphideore of 90%. Management is looking forward to accessingsulphide material with grades in excess of 2% over the nextyear from Thakadu which is expected to have a significantimpact on copper units produced. The processing miningplan for the upcoming year contemplates 60% of the oreprocessed from Thakadu.
Based on the importance of accessing more sulphide ore atThakadu the Company is planning to invest in acceleratingmining activities at the Thakadu deposit. A portion of theuse of proceeds from the $12.5 million development facilitysecured from ZCI in February 2011 is allocated to miningactivities at Thakadu. As reported in the Company’sManagement Discussion & Analysis, announced in June2010, the principal operational requirement at Thakadu willbe to establish sustained transport between Thakadu andMowana. To date trucking from Thakadu has not been abottleneck and successful negotiations have beencompleted by signing longer term contracts to secure therequired capacity.
Geology and exploration
Management focused on the strengthening of our technicalteam during the year with new hiring taking place withinour mine technical services team, which covers Geology,Mine Planning, Survey and Geotechnical Services. The newteam has identified several possible opportunities toincrease the Mowana Resource Base. We have undertakensuccessful drilling of a > 1,000 metre deep borehole north ofthe current pit, examining its implications for futureunderground mining, and as a result of this drilling we haveproved potential lateral and vertical extent of mineralisationat the site. The recruitment of a senior mine geologist tomanage the near mine exploration programmes highlightsthe serious potential we believe is present here.
During the year our Board also committed to exploration atthe Matsitama Project which encompasses the highlyprospective Matsitama Schist Belt and has demonstratedsimilarities to iron oxide copper gold (“IOCG”) deposit types.During the first quarter of the past year an experiencedexploration manager was hired to oversee explorationactivities and a panel of internationally recognisedgeological experts were engaged to help generate newexploration strategies, refine mineral emplacement anddeposit models, and assist in target generation.
5
African Copper plc 2011 Annual Report
This programme was designed to ensure that explorationcommitments of the Company were met and explorationexpenditures optimally spent, in order to allow AfricanCopper to apply and obtain extensions of the existingexploration licences. On 24 June 2011 the Companyannounced the successful renewal of these licences for aperiod of two years. Results from the current programmewere also announced on 24 June 2011.
Human resources
We have experienced a very busy year and all partiesinvolved have been required to be very resourceful in theirapproach. I would like to thank our majority shareholder ZCIfor its financial and operational support and recognise thehard work from our chairman and our full team inBotswana. In addition, I would like to send a special thanksto the communities that surround our properties inBotswana who provide us tremendous support and whowill play an important role in our success.
Outlook
Our properties provide tremendous opportunities for growth.However, we understand that to achieve this potential wemust realise the full operational capacity at the Mowanamine as soon as possible. There is no doubt that theupcoming year will be a pivotal time in our Company’sdevelopment as many of the key initiatives at Mowana areimplemented to maximise production and minimise costs.Our goal this year is to have the operations at Mowana andThakadu reach sustainable profitability so we can start toleverage off the considerable assets we have in Botswana.We have a highly capable team that is committed toachieving success and building the future of our Company.
Jordan SokoActing Chief Executive Officer
29 June 2011
Cash flow statement
Year ended 15 months ended($US millions) 31 March 2011 31 March 2010
Opening cash 10.0 2.5
Used for operating activities (10.9) (20.1)
Used for investing activities (11.2) (8.1)
Inflow from financing activities 11.5 33.6
Exchange gain 3.4 2.1
Closing cash at 31 March 2.8 10.0
African Copper plc 2011 Annual Report
6
Financial review
Income statement
Year ended 15 months ended($US 000’s) 31 March 2011 31 March 2010
Revenue 24,731 7,392
Operating cost (27,038) (18,965)
Reversal of impairment of property, plant and equipment – 46,013
Results from operating activities (2,307) 34,440
Investment and other income 31 44
Finance costs (6,693) (3,770)
Net income (8,969) 30,714
Revenue of $24.7 million (2010: $7.4 million) wasgenerated from the sale of copper concentrates. Productioncommenced at the Mowana mine in August 2009 so thecomparative period reported revenue was for seven monthsof production.
Operating costs per ton remained above budgeted levels asa result of maintenance costs (caused by major componentinefficiencies and design upgrades) throughout the plantbeing higher than originally anticipated. While many of theproduction bottlenecks were proactively addressed duringthe current year the Mowana plant saw the introduction ofhighly oxidized ore from the Thakadu deposit whichrequired different plant set-up and settings while theprocessing characteristics of the oxide ore were understood.Due to the demands of responding to these challenges,production related costs consequently increased.
The Company does not believe that the operating results forthis period of production will be indicative of those it willachieve over time, after the plant is operated at fullcommercial levels.
Included in the operating costs is amortisation of $3.5million (2010: $1.1 million) of the Mowana Mine’s property,plant and equipment. In addition, operating costs includeadministrative expenses totalling $4.8 million (2009:$7.9million) and are reflective of a reduction in costs that wereincurred during 2009 as a result of the restructuring of theCompany during that period.
During the 15 month period ended 31 March 2010 theCompany recognised a $46.0 million partial reversal of theimpairment of property, plant and equipment provision thatwas recognised in fiscal 2008.
7
African Copper plc 2011 Annual Report
Cash used in operating for the current year was $10.9million compared to $20.1 million in the 15 months ended31 March 2010. The primary factor, after adjusting for the$46.0 million reversal of impairment recognised in thecomparative period, was a lower operating loss fromoperations of $2.3 million in the current year compared to$11.6 million in the comparative period. Further capitalexpenditures of $11.2 million (2010: $8.1 million) wereinvested by the Company including $8.5 million (2010:$8.1million) spent on Mowana and related infrastructure capitalexpenditure projects and $2.7 million (2010: $38K) on itsportfolio of exploration prospects. To fund these operatinglosses and investments the Company secured $11.5 million(2010: $33.6 million) during the year.
The current financing activities included the following:
$m
• Proceeds from the November 2010ZCI Development Facility 7.5
• Amount drawn from February 2011ZCI Development Facility 4.0
11.5
For further information on the amount and terms of loansfrom ZCI, please refer to Note 19 of the Company’s auditedFinancial Statements for the year ended 31 March 2011.
Group liquidity
At 31 March 2011 the Group held cash and cash equivalentsof $2.8 million (31 March 2010: $10.1 million. As at31 March 2011 the Group had a total principal debt ofUS$53.4 million to ZCI:
• a US$31.9 million Convertible Loan Facility;
• a US$10.0 million working capital facility provided inMarch 2010;
• a US$7.5 million development loan provided inNovember 2010; and
• US$4.0 million drawn on a US$12.5 million developmentfacility approved by ZCI in February 2011.
In advance of the year-end the Company exchanged $9.5million in current outstanding debt assignment agreementsheld by ZCI for the issue of 105,369,488 new ordinaryshares in the Company at a price of 5.5782p per share (“theDebt Conversion”). The Debt Conversion resulted from ZCIentering into debt assignment agreements with certain of
the Company’s large creditors, as part of the refinancing ofthe Company in May 2009.
The Convertible Loan Facility and the two developmentfacilities are longer term debts repayable in approximatelythree years time. The $10 million working capital facilitywas originally due on 31 March 2011 but ZCI consented toa deferral of this repayment date to 31 March 2012.
In addition, on 24 March 2011, the Group entered into afacility with African Banking Corporation of Botswana Limited(“ABCB”) to provide working capital and finance for certainitems of capital equipment. As such, the capital equipmentfacility is not generally available although the projected capitalexpenditure does include items that would be covered by theterms of this facility. The working capital facility is for anamount of US$3.0 million and the capital equipment facility isfor an amount of US$3.1 million. Both facilities were undrawnat the year-end pending completion of documentation.
Going concern
Attention is drawn to disclosure surrounding the goingconcern basis of preparation. Further information is providedin Note 1: Nature of operations and basis of preparation tothe Company’s audited financial statements for the yearended 31 March 2011.
Resources and reserves
Mowana MineThe table below sets out estimates of proven and probablemineral reserves and additional inferred mineral resourcesat the Mowana Mine. These estimates were prepared for ZCIby Read, Swatman & Voigt (Pty) Ltd (“RSV”) in connectionwith the preparation of a circular to ordinary shareholders ofZCI dated 17 December 2009, and appeared in a CompetentPersons Report of RSV dated October 2009 (the “CPR”).
In preparing the CPR, RSV reviewed the Company’s existingMineral Resource and Mineral Reserve models for theMowana Mine, which were calculated on assumptionsdetermined to be appropriate by African Copper (includinga 0.10% Cu cut-off grade), and which have previously beendisclosed by African Copper in its announcement dated26 November 2007. RSV applied its own set of assumptions(including a higher cut-off grade of 0.25% Cu) andre-estimated certain values as shown below. These reserveshave been re-estimated allowing for depletions due tomining between the periods August 2009 to 31 March 2011.
African Copper plc 2011 Annual Report
8
Financial reviewcontinued
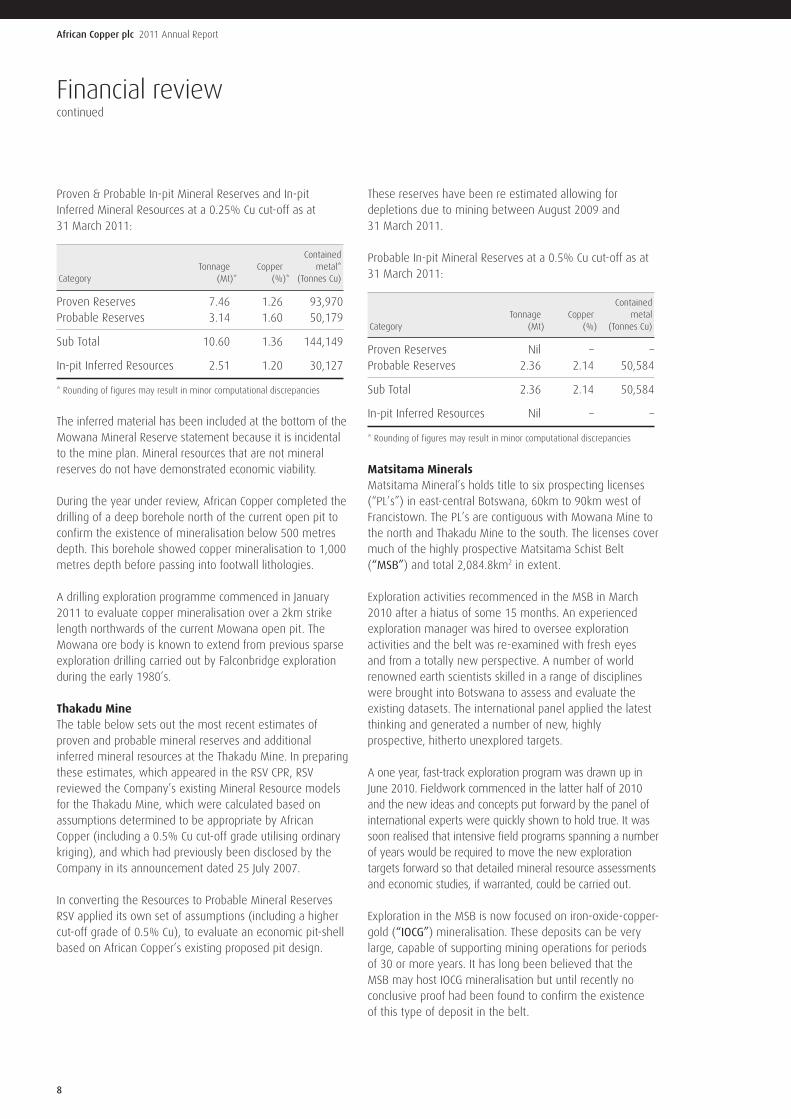
Proven & Probable In-pit Mineral Reserves and In-pitInferred Mineral Resources at a 0.25% Cu cut-off as at31 March 2011:
ContainedTonnage Copper metal*
Category (Mt)* (%)* (Tonnes Cu)
Proven Reserves 7.46 1.26 93,970Probable Reserves 3.14 1.60 50,179
Sub Total 10.60 1.36 144,149
In-pit Inferred Resources 2.51 1.20 30,127
* Rounding of figures may result in minor computational discrepancies
The inferred material has been included at the bottom of theMowana Mineral Reserve statement because it is incidentalto the mine plan. Mineral resources that are not mineralreserves do not have demonstrated economic viability.
During the year under review, African Copper completed thedrilling of a deep borehole north of the current open pit toconfirm the existence of mineralisation below 500 metresdepth. This borehole showed copper mineralisation to 1,000metres depth before passing into footwall lithologies.
A drilling exploration programme commenced in January2011 to evaluate copper mineralisation over a 2km strikelength northwards of the current Mowana open pit. TheMowana ore body is known to extend from previous sparseexploration drilling carried out by Falconbridge explorationduring the early 1980’s.
Thakadu MineThe table below sets out the most recent estimates ofproven and probable mineral reserves and additionalinferred mineral resources at the Thakadu Mine. In preparingthese estimates, which appeared in the RSV CPR, RSVreviewed the Company’s existing Mineral Resource modelsfor the Thakadu Mine, which were calculated based onassumptions determined to be appropriate by AfricanCopper (including a 0.5% Cu cut-off grade utilising ordinarykriging), and which had previously been disclosed by theCompany in its announcement dated 25 July 2007.
In converting the Resources to Probable Mineral ReservesRSV applied its own set of assumptions (including a highercut-off grade of 0.5% Cu), to evaluate an economic pit-shellbased on African Copper’s existing proposed pit design.
These reserves have been re estimated allowing fordepletions due to mining between August 2009 and31 March 2011.
Probable In-pit Mineral Reserves at a 0.5% Cu cut-off as at31 March 2011:
ContainedTonnage Copper metal
Category (Mt) (%) (Tonnes Cu)
Proven Reserves Nil – –Probable Reserves 2.36 2.14 50,584
Sub Total 2.36 2.14 50,584
In-pit Inferred Resources Nil – –
* Rounding of figures may result in minor computational discrepancies
Matsitama MineralsMatsitama Mineral’s holds title to six prospecting licenses(“PL’s”) in east-central Botswana, 60km to 90km west ofFrancistown. The PL’s are contiguous with Mowana Mine tothe north and Thakadu Mine to the south. The licenses covermuch of the highly prospective Matsitama Schist Belt(“MSB”) and total 2,084.8km2 in extent.
Exploration activities recommenced in the MSB in March2010 after a hiatus of some 15 months. An experiencedexploration manager was hired to oversee explorationactivities and the belt was re-examined with fresh eyesand from a totally new perspective. A number of worldrenowned earth scientists skilled in a range of disciplineswere brought into Botswana to assess and evaluate theexisting datasets. The international panel applied the latestthinking and generated a number of new, highlyprospective, hitherto unexplored targets.
A one year, fast-track exploration program was drawn up inJune 2010. Fieldwork commenced in the latter half of 2010and the new ideas and concepts put forward by the panel ofinternational experts were quickly shown to hold true. It wassoon realised that intensive field programs spanning a numberof years would be required to move the new explorationtargets forward so that detailed mineral resource assessmentsand economic studies, if warranted, could be carried out.
Exploration in the MSB is now focused on iron-oxide-copper-gold (“IOCG”) mineralisation. These deposits can be verylarge, capable of supporting mining operations for periodsof 30 or more years. It has long been believed that theMSB may host IOCG mineralisation but until recently noconclusive proof had been found to confirm the existenceof this type of deposit in the belt.
9
African Copper plc 2011 Annual Report
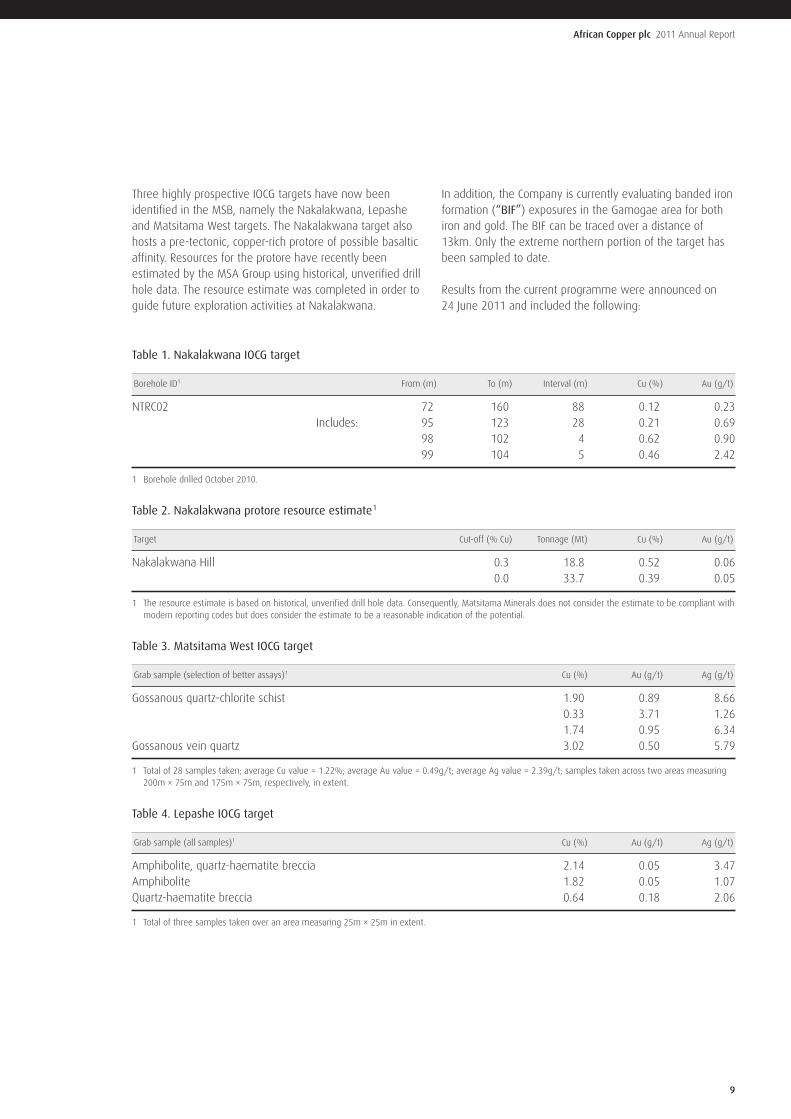
Three highly prospective IOCG targets have now beenidentified in the MSB, namely the Nakalakwana, Lepasheand Matsitama West targets. The Nakalakwana target alsohosts a pre-tectonic, copper-rich protore of possible basalticaffinity. Resources for the protore have recently beenestimated by the MSA Group using historical, unverified drillhole data. The resource estimate was completed in order toguide future exploration activities at Nakalakwana.
In addition, the Company is currently evaluating banded ironformation (“BIF”) exposures in the Gamogae area for bothiron and gold. The BIF can be traced over a distance of13km. Only the extreme northern portion of the target hasbeen sampled to date.
Results from the current programme were announced on24 June 2011 and included the following:
Table 1. Nakalakwana IOCG target
Borehole ID1 From (m) To (m) Interval (m) Cu (%) Au (g/t)
NTRC02 72 160 88 0.12 0.23Includes: 95 123 28 0.21 0.69
98 102 4 0.62 0.9099 104 5 0.46 2.42
1 Borehole drilled October 2010.
Table 2. Nakalakwana protore resource estimate1
Target Cut-off (% Cu) Tonnage (Mt) Cu (%) Au (g/t)
Nakalakwana Hill 0.3 18.8 0.52 0.060.0 33.7 0.39 0.05
1 The resource estimate is based on historical, unverified drill hole data. Consequently, Matsitama Minerals does not consider the estimate to be compliant withmodern reporting codes but does consider the estimate to be a reasonable indication of the potential.
Table 3. Matsitama West IOCG target
Grab sample (selection of better assays)1 Cu (%) Au (g/t) Ag (g/t)
Gossanous quartz-chlorite schist 1.90 0.89 8.660.33 3.71 1.261.74 0.95 6.34
Gossanous vein quartz 3.02 0.50 5.79
1 Total of 28 samples taken; average Cu value = 1.22%; average Au value = 0.49g/t; average Ag value = 2.39g/t; samples taken across two areas measuring200m × 75m and 175m × 75m, respectively, in extent.
Table 4. Lepashe IOCG target
Grab sample (all samples)1 Cu (%) Au (g/t) Ag (g/t)
Amphibolite, quartz-haematite breccia 2.14 0.05 3.47Amphibolite 1.82 0.05 1.07Quartz-haematite breccia 0.64 0.18 2.06
1 Total of three samples taken over an area measuring 25m × 25m in extent.
African Copper plc 2011 Annual Report
10
Financial reviewcontinued
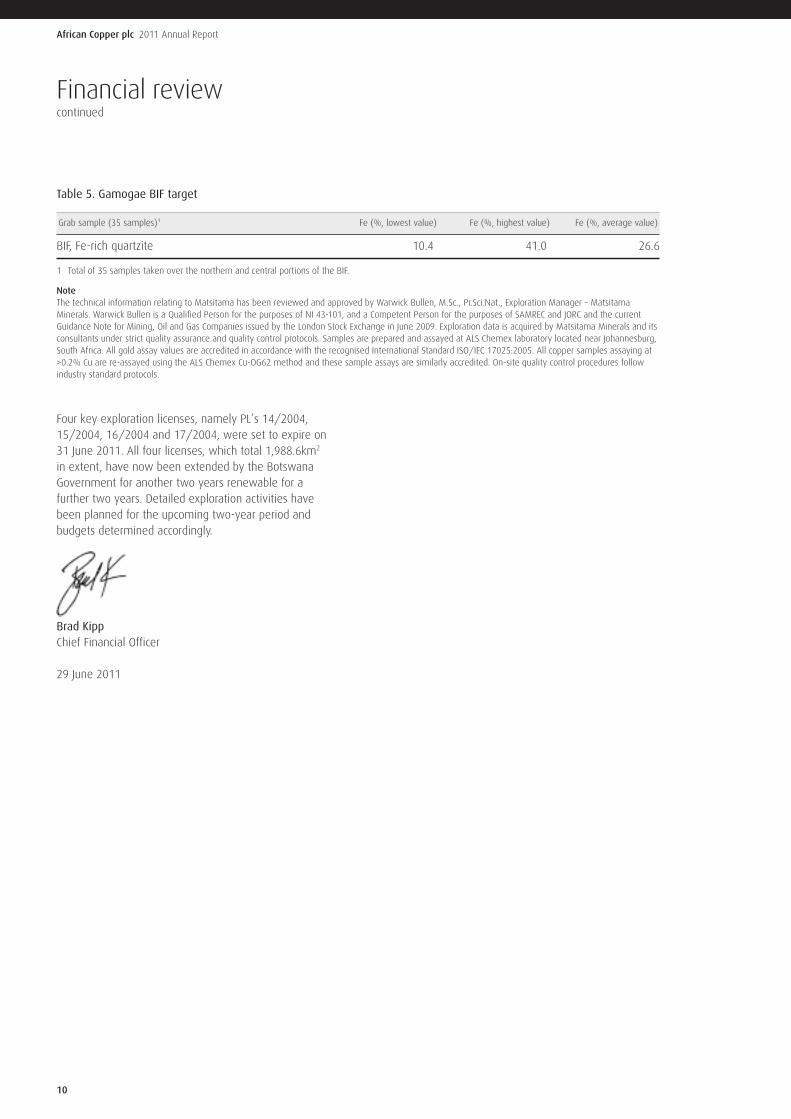
Table 5. Gamogae BIF target
Grab sample (35 samples)1 Fe (%, lowest value) Fe (%, highest value) Fe (%, average value)
BIF, Fe-rich quartzite 10.4 41.0 26.6
1 Total of 35 samples taken over the northern and central portions of the BIF.
NoteThe technical information relating to Matsitama has been reviewed and approved by Warwick Bullen, M.Sc., Pr.Sci.Nat., Exploration Manager – MatsitamaMinerals. Warwick Bullen is a Qualified Person for the purposes of NI 43-101, and a Competent Person for the purposes of SAMREC and JORC and the currentGuidance Note for Mining, Oil and Gas Companies issued by the London Stock Exchange in June 2009. Exploration data is acquired by Matsitama Minerals and itsconsultants under strict quality assurance and quality control protocols. Samples are prepared and assayed at ALS Chemex laboratory located near Johannesburg,South Africa. All gold assay values are accredited in accordance with the recognised International Standard ISO/IEC 17025:2005. All copper samples assaying at>0.2% Cu are re-assayed using the ALS Chemex Cu-OG62 method and these sample assays are similarly accredited. On-site quality control procedures followindustry standard protocols.
Four key exploration licenses, namely PL’s 14/2004,15/2004, 16/2004 and 17/2004, were set to expire on31 June 2011. All four licenses, which total 1,988.6km2
in extent, have now been extended by the BotswanaGovernment for another two years renewable for afurther two years. Detailed exploration activities havebeen planned for the upcoming two-year period andbudgets determined accordingly.
Brad KippChief Financial Officer
29 June 2011
11
African Copper plc 2011 Annual Report
Director’s report
The Directors present their report with the consolidatedfinancial statements of the Company for the year ended31 March 2011.
The Financial Statements are presented in US dollars.
The Company changed its accounting reference date during2009 from 31 December to 31 March to align with ZCILimited (formerly Zambia Copper Investments Limited)(“ZCI”) which is also the immediate controlling entity ofthe Company and to streamline its accounting processes,resulting in a transition period of 15 months for thecomparative period.
Principal activity
The principal activity of African Copper Plc during the yearwas to act as a holding company for the Group’s activities inexploration for, development and mining of, copper depositsin the Republic of Botswana. The principal activity of theCompany is that of a holding company.
The subsidiary undertakings principally affecting the loss andnet assets of the Group in the year are listed in Note 13.
Group overview
African Copper is a base metals company, incorporated inEngland and Wales, with mining and exploration interests inBotswana. Its ordinary shares are listed on the AIM marketof the London Stock Exchange (“AIM”) under the symbol“ACU” and on the Botswana Stock Exchange (“BSE”) underthe symbol “African Copper”.
The Mowana Mine, owned by the Company’s subsidiaryMessina Copper Botswana (Pty) Limited (“Messina”) islocated close to Botswana’s second largest city, Francistown,in the north-eastern part of the country. Mowana and allcurrent estimated mineral resources and reserves are partof the Dukwe Project, comprising;
1)exploration licence PL 33/2005, with an area of 139.6km2, and (within that exploration licence) mining licence2006/53L, with an area of 32.7 km2 and valid until theend of 2031.
2)exploration licence 180/2008, covering an area of 114.4km2 to the north of PL 33/2005. The Dukwe Project alsoencompasses north and south extensions of mineralisationlying outside the Mowana Mine licence area.
At the Mowana Mine, management has focussed onpromoting and ensuring that a strong safety culture isdeveloped and maintained.
The Company’s subsidiary Matsitama Minerals Pty Limited(“Matsitama”) holds the Matsitama Project, consisting ofprospecting licences contiguous with the Mowana Minedeposit. All the licences are valid and contain prospectiveareas of mineralisation.
With corporate offices in the UK, African Copper has officesin Johannesburg and Francistown and a Group workforce ofmore than 300 employees.
Business review
The information that fulfils the requirements of the BusinessReview, as required by Section 417 of the Companies Act2006, and which should be treated as forming part of thisreport by reference, is included in the following sections ofthe annual report:
• Chairman’s Statement on pages 1 to 2;
• Chief Executive’s Review on pages 3 to 5;
• Financial Review on pages 6 to 10;
• Statement of Directors’ Responsibilities on page 14;
• Statement of Corporate Governance Review onpage 15; and
• Directors’ Remuneration Report on pages 16 to 17.
Results
The Group loss after taxation for the year was US$9.0million compared to a profit of US$30.7 million, whichincluded a US$46.0 million reversal of prior periodimpairment charges, for the 15 months ended 31 March2010. A financial review of the Group’s activities can befound on pages 6 to 10.
Proposed dividend
The Directors do not recommend the payment of a dividendfor the year (2010: nil).
Directors
The directors who held office during the year were as follows:
D Rodier ChairmanB R Kipp Finance DirectorJ Soko Acting Chief Executive OfficerR D Corrans Non-ExecutiveProf S Simukanga Non-Executive
All directors’ service contracts are determinable on not morethan 12 months’ notice.
African Copper plc 2011 Annual Report
12
Director’s reportcontinued
Audit information
Each of the Directors has confirmed that so far as he isaware, there is no relevant audit information of which theCompany’s auditors are unaware, and that he has taken allthe steps that he ought to have taken as a director in orderto make himself aware of any relevant audit informationand to establish that the Company’s auditors are aware ofthat information.
Indemnification of directors and officers
During the year, the Company held insurance to indemnifyDirectors, the Company Secretary and executive officers ofthe Company against liabilities incurred in the conduct oftheir duties to the extent permitted under legislation.
Substantial share interests
As at 29 June 2011 the Company was aware of thefollowing substantial share interests:
Ordinary shares %
ZCI Limited 781,939,988 84.19
Share capital
On 28 April 2009 43 new ordinary shares of 1p were issuedby the Company in connection with the Company’sconsolidation of share capital announced on 9 April 2009 aspart of a proposed comprehensive financing package. Thisfinancing package necessitated a reorganisation of theCompany’s share capital resulting in a consolidation of theCompany’s existing ordinary shares. One new Ordinary Shareof 10p was proposed to be created for every 100 existingordinary shares. At the Extraordinary General Meeting heldon 7 May 2009 the requisite level of shareholder approvalfor this financing package was not received so accordinglythe financing did not proceed to completion.
As part of the ZCI financing package completed on 22 May2009, a total of 676,570,500 ordinary shares were issued ata price of £0.01 per ordinary share, raising total netproceeds of £6,765,705.
On 9 February 2011, the Company completed an agreementwith ZCI to exchange USD9.5 million in current outstandingdebt assignments that ZCI held for the issue of 105,369,488new ordinary shares in the Company at a price of 5.5782pper share (“the Debt Conversion”). The Debt Conversionresulted from ZCI entering into debt assignment agreementswith certain of the Company’s large creditors, as part of therefinancing of the Company in May 2009.
Creditor payment terms
It is the Group’s policy to settle all amounts due to creditorsin accordance with agreed terms of supply and marketpractice in the relevant country. The Company’s averagecreditor payment period at 31 March 2011 was 30 days.
Key performance indicators
The liquidity requirements and operational and financialperformance of the Group are monitored on a weekly basisby management, monthly and quarterly by the board andZCI, and semi-annually by external parties.
Attracting and retaining key commercial and technical staffis a key success factor in light of buoyant market conditionsin the resource sector. The Group monitors current marketconditions in the markets that it operates and aims toprovide competitive compensation packages within thecontext of its then current financial position.
The Group is involved in a comprehensive investmentprogramme at the Mowana and Thakadu mines andconducting exploration activities at the Matsitama project.All investment and expansion projects are subject to aninvestment review and justification procedure thatinvolves the board at the key stages of initiation,mandate and sanction.
Risks and key dependencies
The Company’s operations are subject to numeroussignificant risks.
To date the Company has a history of losses and its activitiesare focused primarily on the Mowana and Thakadu mines.Any adverse changes or developments affecting theseoperations would have a material and adverse effect on theCompany’s business, financial condition, working capital andresults of operations. Neither the ability of the Company tomove the Mowana mine to commercial production levelsand achieve economic viability, nor the success of othercurrent or future exploration activities can be assured.Copper price volatility and currency fluctuations may alsoaffect the Company’s production, profitability, cash flowand financial position.
The capital and operating cost estimates and mining andprocessing plans anticipated for the Mowana and Thakadumines are estimates only and may not reflect the actualcapital and operating costs incurred by the Company.
13
African Copper plc 2011 Annual Report
Foreign investments and operations are subject tonumerous risks associated with operating in foreignjurisdictions, and government regulations may have anadverse effect on the Company.
The Company’s ability to meet its obligations and continueas a going concern is dependent on its ability to generatepositive cashflow from operations at the Mowana Mine.
The Group has considered a number of key dependenciesas set out below:
• The Group is dependent on the continuing support of ZCInot to call for the repayment of amounts owed to it.If ZCI calls for repayment, the Group would, in theabsence of alternative sources of funds, have insufficientfunds to repay the loans.
• In January 2008, the Group entered into the Off-takeAgreement (for copper concentrate sales) with MRITrading AG of Zug Switzerland covering 100% of MowanaMine production during the first 5 years of production.The Off-take Agreement is based on generally acceptedinternational terms for copper concentrates and isbenchmarked to published treatment and refiningcharges. The Off-take Agreement is renewable.
• The Group’s business is dependent on retaining theservices of a small number of key personnel of theappropriate calibre as the business develops. The Grouphas entered into employment agreements with certainof its key executives. The success of the Group is, andwill continue to be, to a significant extent, dependenton the expertise and experience of the directors andsenior management.
• At the Mowana and Thakadu mines the Group usescontract mining services and is dependent on the goodmining practices of the contract miner for recovery of allthe ore and for minimising dilution of the ore.
Financial interests
The Group’s principal financial liabilities comprise tradepayables, purchase contracts, guarantees on debts owed toZCI and accrued expenses. The Group has various financialassets such as cash and cash equivalents, provisionalrevenue receivables and interest receivables, which arisedirectly from its operations. In addition, the Company’sfinancial assets include amounts due from subsidiaries.
The Group sells its copper concentrate under pricingarrangements whereby the quoted period established foreach sale contract to finalise the sales price is the monthsubsequent to the month of delivery, within which thecontract is required to be settled.
Political and charitable contributions
The Group made no political contribution and no charitabledonation during the period ended 31 March 2011 (2010: Nil).
Auditors
KPMG Audit Plc has expressed their willingness to continue inthe office as auditor, and a resolution to reappoint them willbe proposed at the forthcoming Annual General Meeting.
On behalf of the board:
Brad KippChief Financial Officer
29 June 2011.
African Copper plc 2011 Annual Report
14
Statement of Directors’ responsibilities
The directors are responsible for preparing the directors’report and the financial statements in accordance withapplicable law and regulations.
Company law requires the directors to prepare financialstatements for each financial year. Under that law thedirectors have, as required by the AIM Rules of the LondonStock Exchange, elected to prepare the group financialstatements in accordance with International FinancialReporting Standards as adopted by the European Union andhave also elected to prepare the parent company financialstatements in accordance with those standards. Undercompany law the directors must not approve the financialstatements unless they are satisfied that they give a trueand fair view of the state of affairs of the Company and theGroup and of the profit or loss of the Group for that period.In preparing these financial statements the directors arerequired to:
• select suitable accounting policies and then apply themconsistently;
• make judgments and estimates that are reasonableand prudent;
• state whether the financial statements have beenprepared in accordance with IFRSs as adopted by theEuropean Union; and
• prepare the financial statements on the going concernbasis unless it is inappropriate to presume that theCompany and the Group will continue in business.
The directors are responsible for keeping adequateaccounting records that are sufficient to show and explainthe Company’s transactions and disclose with reasonableaccuracy at any time the financial position of the Companyand the Group and enable them to ensure that the financialstatements comply with the Companies Act 2006. They arealso responsible for safeguarding the assets of the Companyand the Group and hence for taking reasonable steps for theprevention and detection of fraud and other irregularities.
The directors are responsible for the maintenance andintegrity of the corporate and financial information includedon the Company’s website. Legislation in the United Kingdomgoverning the preparation and dissemination of the financialstatements and other information included in annual reportsmay differ from legislation in other jurisdictions.
15
African Copper plc 2011 Annual Report
Statement of corporate governance
The directors support the principles of good corporategovernance. While not mandatory for an AIM company, thedirectors take due regard, where practical for a company ofthis size and nature, certain provisions of the principles ofgood governance and code of best practices under the 2008Combined Code. The disclosures presented herein arelimited and are not intended to constitute a corporategovernance statement as prescribed by the Disclosure andTransparency Rules or the Companies Act.
The Group complies with the guidance issued by the QuotedCompanies Alliance, to the extent the Directors considerappropriate, having regard to the size of the Company andits current stage of development. The Board reviews keybusiness risks, in addition to the financial risks facing theGroup in the operations of the business.
The Board
The Board is currently made up of two executive directorsand three non-executive directors. Mr. Jordan Soko is theCompany’s acting Chief Executive Officer and Mr. Brad Kipp isthe Chief Financial Officer. It is the Board’s policy to maintainindependence by having at least half of the Board comprisingnon-executive directors who are free from any business, orother relationship with the Group. The structure of the Boardensures that no one individual or group dominates the decisionmaking process. The Board meets as deemed necessary toprovide effective leadership and overall control and direction ofthe Group’s affairs through the schedule of matters reserved forits decision. This includes the approval of the budget andbusiness plan, major capital expenditures, acquisitions anddisposals, human resources, environmental management,risk management policies and the approval of the financialstatements. Formal agendas, papers and reports are sent tothe directors in a timely manner, prior to Board meetings.
All directors have access to the advice and services of theCompany Secretary. Any director may take independentprofessional advice at the Company’s expense in thefurtherance of his duties.
Audit Committee
The Audit Committee meets at least twice during the year andis responsible for ensuring that the financial performance ofthe Company is properly reported on and monitored, and formeeting the auditors and reviewing the auditors’ reportsrelating to the accounts. The Audit committee also recommendsthe appointment of, and reviews the fees of, the externalauditors. It meets at least once a year with the auditorswithout executive Board members present. The AuditCommittee comprises three members, all of whom are non-executive. The current membership of the committee is Mr RCorrans (Chairman), Mr. D. Rodier and Professor S. Simukanga.
Remuneration Committee
A Remuneration Committee meets at least once per year.It reviews the performance of the executive directors andsets and reviews the scale, structure and basis of theirremuneration and the terms of their service agreementspaying due regard to the interests of shareholders as awhole and the performance of the Company. Remunerationof executive directors is established by reference to theremuneration of executives of equivalent status both interms of level of responsibility of the position and bereference to their job qualifications and skills. TheRemuneration Committee will also have regard to the termswhich may be required to attract an executive of equivalentexperience to join the Group from another company. Suchpackages include performance related bonuses and thegrant of share options.
The Remuneration Committee comprises the non-executivedirectors, Mr R. Corrans (Chairman), Mr D. Rodier andProfessor S. Simukanga. The Directors’ remuneration reportappears on pages 16 to 17.
Internal controls
The directors have overall responsibility for the Group’sinternal control and effectiveness in safeguarding the assetsof the Group. Internal control systems are designed toreflect the particular type of business, operations and safetyrisks and to identify and manage risks, but not entirely allrisks to which the business is exposed. As a result, internalcontrols can only provide a reasonable, but not absolute,assurance against material misstatements or loss.
The processes used by the Board to review the effectivenessof the internal controls are through the Audit Committee andthe executive management reporting to the Board on aregular basis where business plans, budgets and authorisationlimits for the approval of significant expenditure, includinginvestments are appraised and agreed. The Board also seeksto ensure that there is a proper organisational andmanagement structure with clear responsibilities andaccountability. It is the Board’s policy to ensure that themanagement structure and the quality and integrity of thepersonnel are compatible with the requirements of the Group.
The Board attaches importance to maintaining goodrelationships with all its shareholders and ensures that allprice sensitive information is released to all shareholders atthe same time in accordance with London Stock Exchangeand Botswana Stock Exchange rules. The Company’sprincipal communication with its investors is through theannual report and accounts, the half-yearly statements andpress releases issued as material events unfold.
African Copper plc 2011 Annual Report
16
Directors’ remuneration report
Remuneration Committee
The Company has established a Remuneration Committeewhich is constituted in accordance with the recommendationsof the Combined Code. The members of the Committeefor the year ended 31 March 2011 were Mr. R Corrans,Mr. D Rodier and Professor S Simukanga who are allindependent non-executive directors, and the Committeewas chaired by Mr. R Corrans. Neither member of theCommittee has any personal financial interest (other thanas a shareholder), conflicts of interests, or day-to-dayinvolvement in running the business. The Committee makesrecommendations to the Board. No director plays a part inany discussion about his own remuneration. In determiningthe directors’ remuneration for the year, the Committeeconsulted Mr. J Soko (acting Chief Executive) and Mr. B Kipp(Chief Financial Officer) about its proposals.
Remuneration policy for Executive Directors
Executive remuneration packages are designed to attract,motivate and retain executives of the highest calibre to leadthe Company and to reward them for enhancing value toshareholders. The performance management of theexecutive directors and key members of seniormanagement, and the determination of their annualremuneration package are undertaken by the Committee.
There are four main elements of the remuneration packagefor executive directors and senior management:
• Basic annual salary
• Annual bonus payments
• Share option incentives
• Benefits and perks
Basic salaries and/or consulting FeesAn executive director’s basic salary or consulting feerepresents their minimum compensation for servicesrendered during the financial year. Each executive director’sbase compensation depends on the scope of his experience,responsibilities, leadership skills, performance, length ofservice, general industry trends and practices,competitiveness, and the Company’s existing financialresources. Base compensation is reviewed annually by theRemuneration Committee.
Annual bonus paymentAlthough, generally the Company has not paid cash bonusesto executive directors, the Remuneration Committee hasbeen provided with the discretion to award bonuses whenexecutive directors demonstrate exceptional performance,in circumstances where the Company is in the financialposition to make such awards. Given that the Mowana Mine
has yet to reach commercial production levels and theresulting limited financial resources of the Company, theRemuneration Committee did not consider grantingdiscretionary bonus payments to executive directors forthe year ended 31 March 2011.
Share optionsThe grant of options to purchase Ordinary Shares pursuantto the Company Option Plan has been a component of thecompensation packages of the executive directors of theCompany. The Remuneration Committee believes that thegrant of options to executive directors and Ordinary Shareownership by such directors serves to motivate achievementof the Company’s long-term strategic objectives and theresult will benefit all shareholders. Options are awarded toexecutive directors based upon the performance of theCompany and each executive director’s level of responsibilityand contribution to Company performance. TheRemuneration Committee considers the overall number ofoptions that are outstanding relative to the number ofoutstanding Ordinary Shares in determining whether tomake any new grants of options and the size of such grants.The Remuneration Committee’s decisions with respect to thegranting of options are reviewed by the Board and aresubject to its final approval. There were no options grantedto executive directors during the year ended 31 March 2011.
Benefits and perksIf available, executive directors’ are eligible to participatein group benefit plans offered to full-time employeesemployed in the respective executive director’s country ofresidence. The Company does not view these benefits as asignificant element of its compensation structure, as theyconstitute only a small percentage of total compensation,but does believe that these benefits, used in conjunctionwith base salary, attract, motivate and retain individuals ina competitive environment. There were no benefits paid toexecutive directors during the year ended 31 March 2011.
Pensions
The Company does not operate a pension scheme forexecutive directors. No pension contributions are made inrespect of non-executive directors.
Non-Executive Director compensation
The non-executive director compensation program isdesigned to achieve the following goals: (i) attract andretain the most qualified people to serve on the Board;(ii) align directors’ interests with the long-term interestsof shareholders; and (iii) fairly pay directors for risks andresponsibilities related to being a director of an entity ofthe Company’s size and scope.
17
African Copper plc 2011 Annual Report
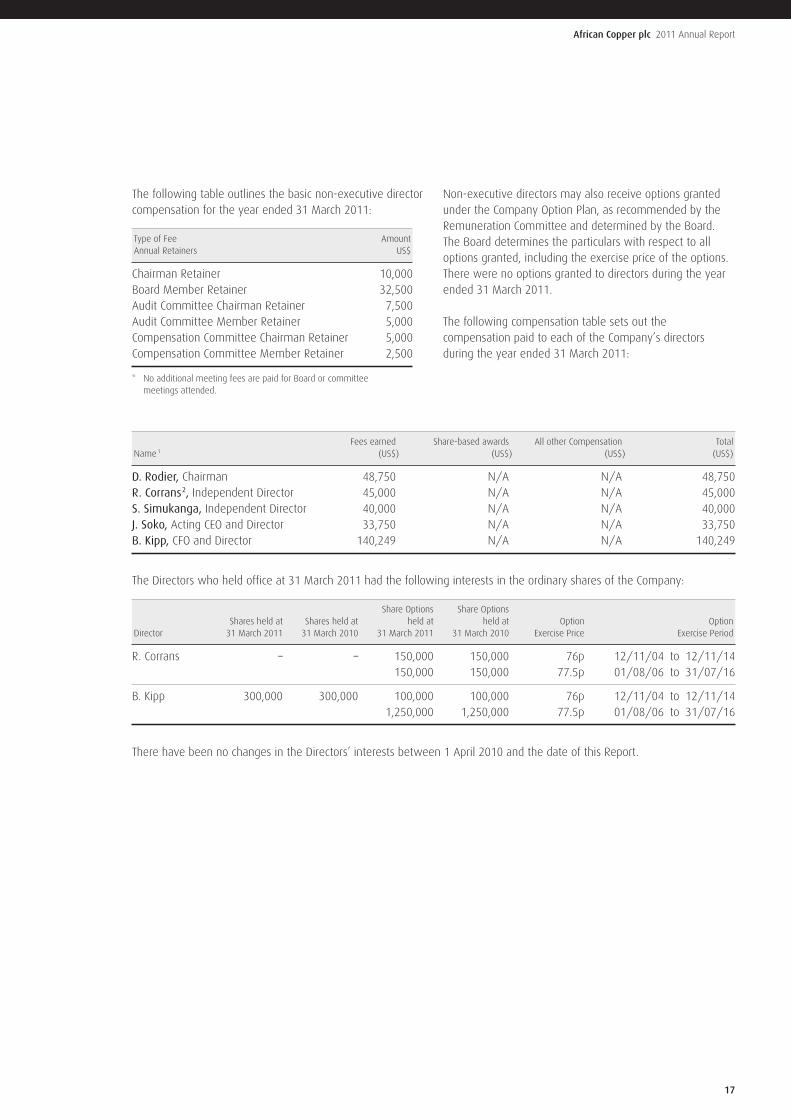
The following table outlines the basic non-executive directorcompensation for the year ended 31 March 2011:
Type of Fee AmountAnnual Retainers US$
Chairman Retainer 10,000Board Member Retainer 32,500Audit Committee Chairman Retainer 7,500Audit Committee Member Retainer 5,000Compensation Committee Chairman Retainer 5,000Compensation Committee Member Retainer 2,500
* No additional meeting fees are paid for Board or committeemeetings attended.
Non-executive directors may also receive options grantedunder the Company Option Plan, as recommended by theRemuneration Committee and determined by the Board.The Board determines the particulars with respect to alloptions granted, including the exercise price of the options.There were no options granted to directors during the yearended 31 March 2011.
The following compensation table sets out thecompensation paid to each of the Company’s directorsduring the year ended 31 March 2011:
Fees earned Share-based awards All other Compensation TotalName1 (US$) (US$) (US$) (US$)
D. Rodier, Chairman 48,750 N/A N/A 48,750R. Corrans2, Independent Director 45,000 N/A N/A 45,000S. Simukanga, Independent Director 40,000 N/A N/A 40,000J. Soko, Acting CEO and Director 33,750 N/A N/A 33,750B. Kipp, CFO and Director 140,249 N/A N/A 140,249
The Directors who held office at 31 March 2011 had the following interests in the ordinary shares of the Company:
Share Options Share Options Shares held at Shares held at held at held at Option Option
Director 31 March 2011 31 March 2010 31 March 2011 31 March 2010 Exercise Price Exercise Period
R. Corrans – – 150,000 150,000 76p 12/11/04 to 12/11/14150,000 150,000 77.5p 01/08/06 to 31/07/16
B. Kipp 300,000 300,000 100,000 100,000 76p 12/11/04 to 12/11/141,250,000 1,250,000 77.5p 01/08/06 to 31/07/16
There have been no changes in the Directors’ interests between 1 April 2010 and the date of this Report.
African Copper plc 2011 Annual Report
18
Independent Auditor’s reportto the members of African Copper Plc
We have audited the financial statements of African CopperPLC for the year ended 31st March 2011 set out on pages19 to 48. The financial reporting framework that has beenapplied in their preparation is applicable law andInternational Financial Reporting Standards (IFRSs) asadopted by the EU and, as regards the parent companyfinancial statements, as applied in accordance with theprovisions of the Companies Act 2006.
This report is made solely to the Company’s members, as abody, in accordance with Chapter 3 of Part 16 of the CompaniesAct 2006. Our audit work has been undertaken so that wemight state to the Company’s members those matters we arerequired to state to them in an auditor’s report and for no otherpurpose. To the fullest extent permitted by law, we do notaccept or assume responsibility to anyone other than theCompany and the Company’s members, as a body, for ouraudit work, for this report, or for the opinions we have formed.
Respective responsibilities ofDirectors and Auditor
As explained more fully in the Directors’ ResponsibilitiesStatement set out on page 14, the directors are responsiblefor the preparation of the financial statements and forbeing satisfied that they give a true and fair view. Ourresponsibility is to audit, and express an opinion on, thefinancial statements in accordance with applicable law andInternational Standards on Auditing (UK and Ireland). Thosestandards require us to comply with the Auditing PracticesBoard’s (APB’s) Ethical Standards for Auditors.
Scope of the audit of the financial statements
A description of the scope of an audit of financialstatements is provided on the APB’s website atwww.frc.org.uk/apb/scope/UKNP
Opinion on financial statements
In our opinion:
• the financial statements give a true and fair view of thestate of the Group’s and of the Company’s affairs as at 31stMarch 2011 and of the Group’s loss for the year then ended;
• the Group’s financial statements have been properlyprepared in accordance with IFRSs as adopted by the EU;
• the Company’s financial statements have been properlyprepared in accordance with IFRSs as adopted by the EUand as applied in accordance with the provisions of theCompanies Act 2006; and
• the financial statements have been prepared in accordancewith the requirements of the Companies Act 2006.
Emphasis of matter – going concern
In forming our opinion on the financial statements which isnot qualified, we have considered the adequacy of thedisclosures set out in note 1 of the financial statementsconcerning the Group’s and Company’s ability to continue asa going concern which depends in particular on the abilityof the business to produce sufficient levels of copper inconcentrate and for the copper price to be maintained at asufficiently high level. These conditions indicate theexistence of a material uncertainty that may cast significantdoubt on the Group’s and Company’s ability to continue as agoing concern. The financial statements do not include theadjustments that would result if the Group and Companywere unable to continue as a going concern.
Opinion on other matter prescribedby the Companies Act 2006
In our opinion the information given in the Directors’ Reportfor the financial year for which the financial statements areprepared is consistent with the financial statements.
Matters on which we are required toreport by exception
We have nothing to report in respect of the followingmatters where the Companies Act 2006 requires us toreport to you if, in our opinion:
• adequate accounting records have not been kept by theparent company, or returns adequate for our audit havenot been received from branches not visited by us; or
• the parent company financial statements are not inagreement with the accounting records and returns; or
• certain disclosures of directors’ remuneration specified bylaw are not made; or
• we have not received all the information andexplanations we require for our audit.
Lynton Richmond (Senior Statutory Auditor)
For and on behalf of KPMG Audit Plc, Statutory AuditorChartered Accountants15 Canada Square, Canary Wharf, London E14 5GLUnited Kingdom
29th June 2011
19
African Copper plc 2011 Annual Report
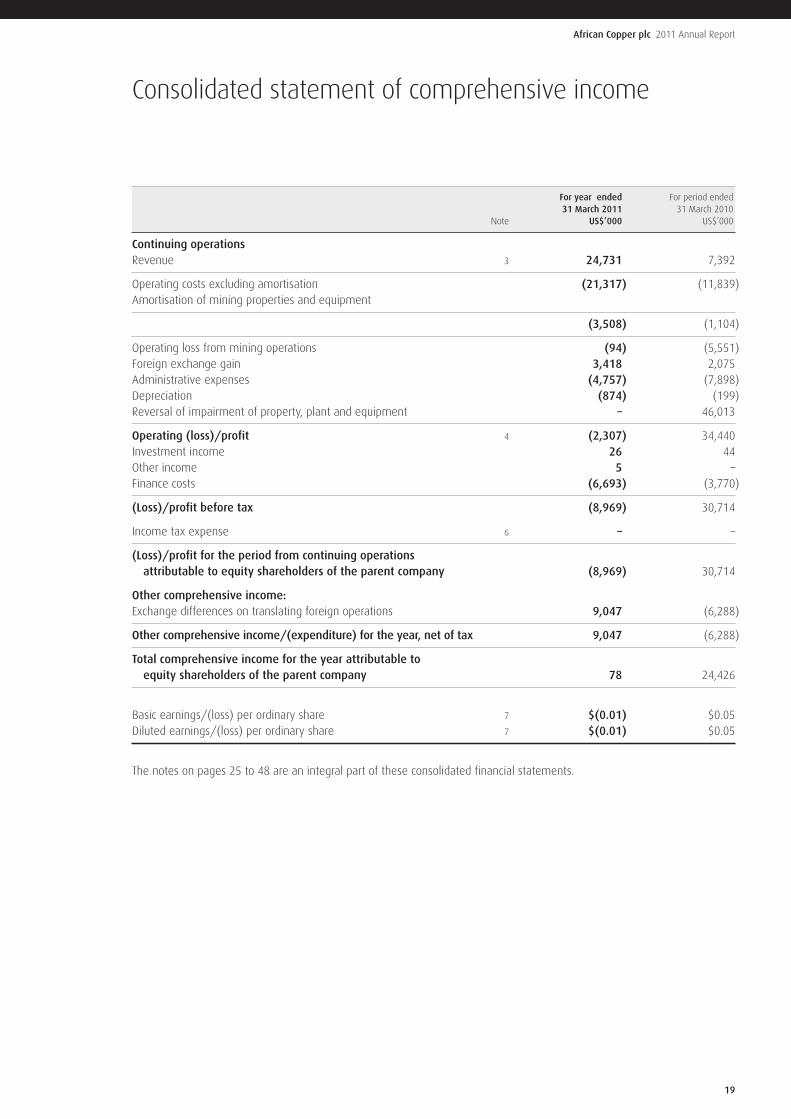
Consolidated statement of comprehensive income
For year ended For period ended31 March 2011 31 March 2010
Note US$’000 US$’000
Continuing operationsRevenue 3 24,731 7,392
Operating costs excluding amortisation (21,317) (11,839)Amortisation of mining properties and equipment
(3,508) (1,104)
Operating loss from mining operations (94) (5,551)Foreign exchange gain 3,418 2,075Administrative expenses (4,757) (7,898)Depreciation (874) (199)Reversal of impairment of property, plant and equipment – 46,013
Operating (loss)/profit 4 (2,307) 34,440Investment income 26 44Other income 5 –Finance costs (6,693) (3,770)
(Loss)/profit before tax (8,969) 30,714
Income tax expense 6 – –
(Loss)/profit for the period from continuing operationsattributable to equity shareholders of the parent company (8,969) 30,714
Other comprehensive income:Exchange differences on translating foreign operations 9,047 (6,288)
Other comprehensive income/(expenditure) for the year, net of tax 9,047 (6,288)
Total comprehensive income for the year attributable toequity shareholders of the parent company 78 24,426
Basic earnings/(loss) per ordinary share 7 $(0.01) $0.05Diluted earnings/(loss) per ordinary share 7 $(0.01) $0.05
The notes on pages 25 to 48 are an integral part of these consolidated financial statements.
African Copper plc 2011 Annual Report
20
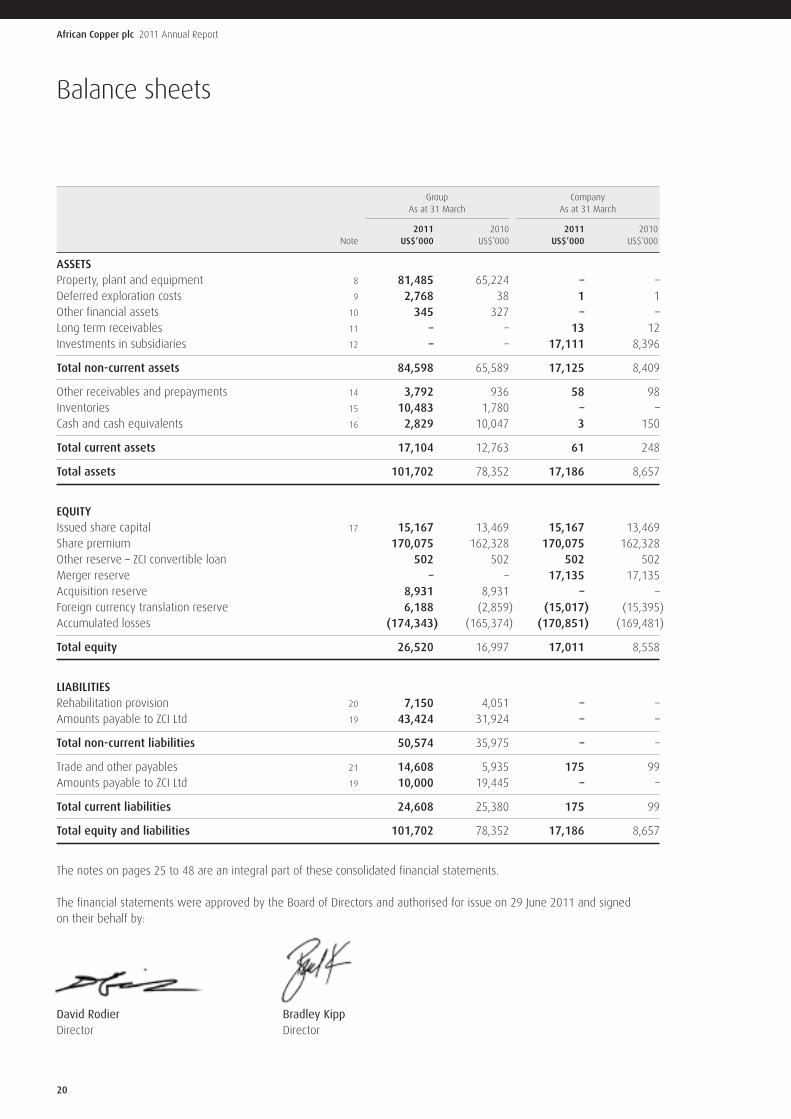
Balance sheets
Group CompanyAs at 31 March As at 31 March
2011 2010 2011 2010Note US$’000 US$’000 US$’000 US$’000
ASSETSProperty, plant and equipment 8 81,485 65,224 – –Deferred exploration costs 9 2,768 38 1 1Other financial assets 10 345 327 – –Long term receivables 11 – – 13 12Investments in subsidiaries 12 – – 17,111 8,396
Total non-current assets 84,598 65,589 17,125 8,409
Other receivables and prepayments 14 3,792 936 58 98Inventories 15 10,483 1,780 – –Cash and cash equivalents 16 2,829 10,047 3 150
Total current assets 17,104 12,763 61 248
Total assets 101,702 78,352 17,186 8,657
EQUITYIssued share capital 17 15,167 13,469 15,167 13,469Share premium 170,075 162,328 170,075 162,328Other reserve – ZCI convertible loan 502 502 502 502Merger reserve – – 17,135 17,135Acquisition reserve 8,931 8,931 – –Foreign currency translation reserve 6,188 (2,859) (15,017) (15,395)Accumulated losses (174,343) (165,374) (170,851) (169,481)
Total equity 26,520 16,997 17,011 8,558
LIABILITIESRehabilitation provision 20 7,150 4,051 – –Amounts payable to ZCI Ltd 19 43,424 31,924 – –
Total non-current liabilities 50,574 35,975 – –
Trade and other payables 21 14,608 5,935 175 99Amounts payable to ZCI Ltd 19 10,000 19,445 – –
Total current liabilities 24,608 25,380 175 99
Total equity and liabilities 101,702 78,352 17,186 8,657
The notes on pages 25 to 48 are an integral part of these consolidated financial statements.
The financial statements were approved by the Board of Directors and authorised for issue on 29 June 2011 and signedon their behalf by:
David Rodier Bradley KippDirector Director
21
African Copper plc 2011 Annual Report
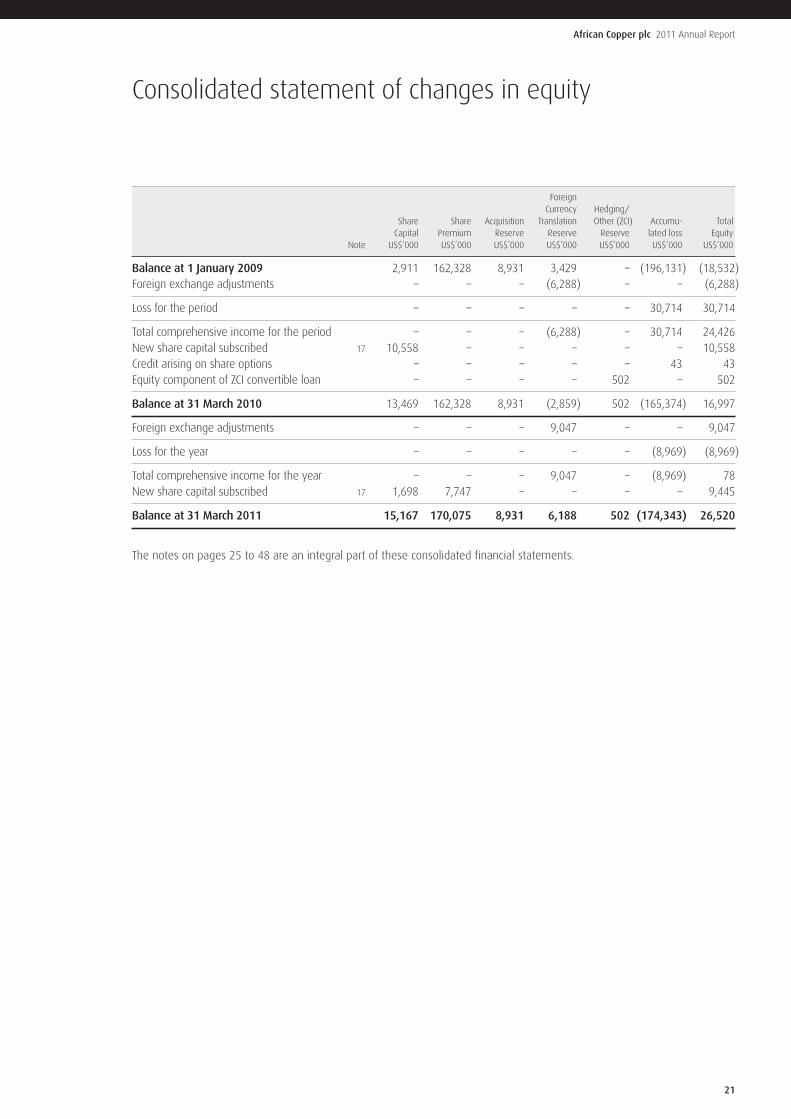
Consolidated statement of changes in equity
ForeignCurrency Hedging/
Share Share Acquisition Translation Other (ZCI) Accumu- TotalCapital Premium Reserve Reserve Reserve lated loss Equity
Note US$’000 US$’000 US$’000 US$’000 US$’000 US$’000 US$’000
Balance at 1 January 2009 2,911 162,328 8,931 3,429 – (196,131) (18,532)Foreign exchange adjustments – – – (6,288) – – (6,288)
Loss for the period – – – – – 30,714 30,714
Total comprehensive income for the period – – – (6,288) – 30,714 24,426New share capital subscribed 17 10,558 – – – – – 10,558Credit arising on share options – – – – – 43 43Equity component of ZCI convertible loan – – – – 502 – 502
Balance at 31 March 2010 13,469 162,328 8,931 (2,859) 502 (165,374) 16,997
Foreign exchange adjustments – – – 9,047 – – 9,047
Loss for the year – – – – – (8,969) (8,969)
Total comprehensive income for the year – – – 9,047 – (8,969) 78New share capital subscribed 17 1,698 7,747 – – – – 9,445
Balance at 31 March 2011 15,167 170,075 8,931 6,188 502 (174,343) 26,520
The notes on pages 25 to 48 are an integral part of these consolidated financial statements.
African Copper plc 2011 Annual Report
22
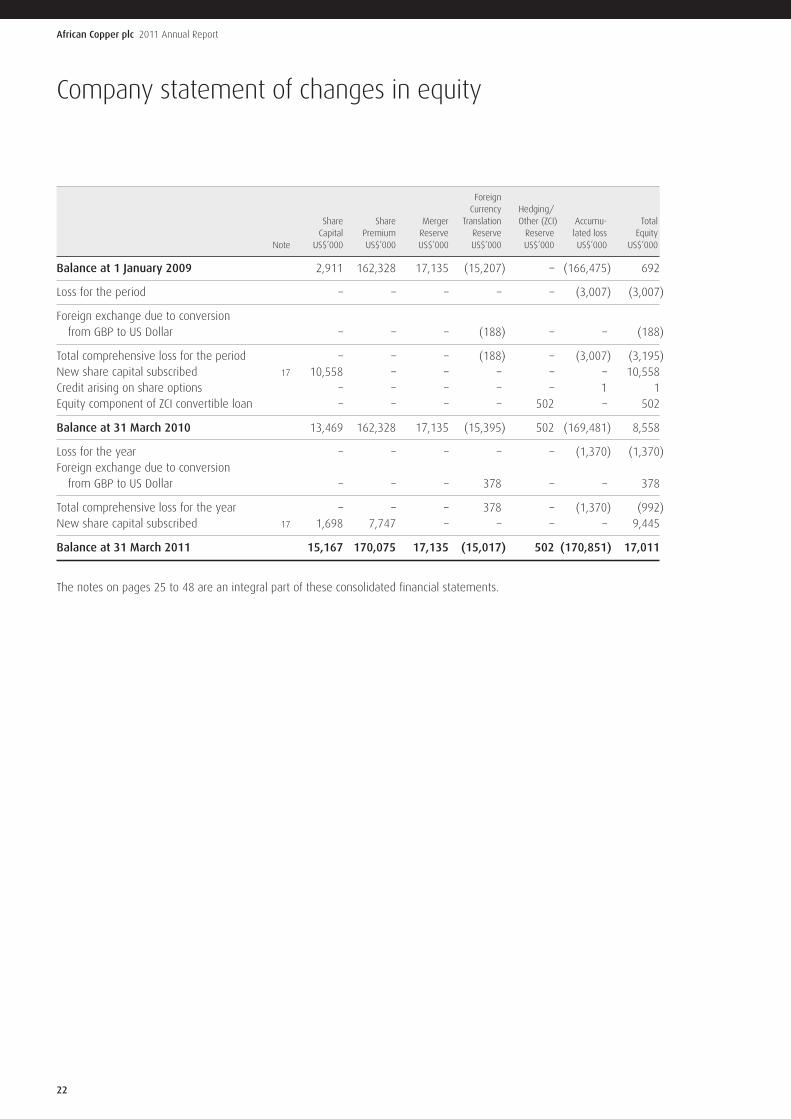
Company statement of changes in equity
ForeignCurrency Hedging/
Share Share Merger Translation Other (ZCI) Accumu- TotalCapital Premium Reserve Reserve Reserve lated loss Equity
Note US$’000 US$’000 US$’000 US$’000 US$’000 US$’000 US$’000
Balance at 1 January 2009 2,911 162,328 17,135 (15,207) – (166,475) 692
Loss for the period – – – – – (3,007) (3,007)
Foreign exchange due to conversionfrom GBP to US Dollar – – – (188) – – (188)
Total comprehensive loss for the period – – – (188) – (3,007) (3,195)New share capital subscribed 17 10,558 – – – – – 10,558Credit arising on share options – – – – – 1 1Equity component of ZCI convertible loan – – – – 502 – 502
Balance at 31 March 2010 13,469 162,328 17,135 (15,395) 502 (169,481) 8,558
Loss for the year – – – – – (1,370) (1,370)Foreign exchange due to conversionfrom GBP to US Dollar – – – 378 – – 378
Total comprehensive loss for the year – – – 378 – (1,370) (992)New share capital subscribed 17 1,698 7,747 – – – – 9,445
Balance at 31 March 2011 15,167 170,075 17,135 (15,017) 502 (170,851) 17,011
The notes on pages 25 to 48 are an integral part of these consolidated financial statements.
23
African Copper plc 2011 Annual Report
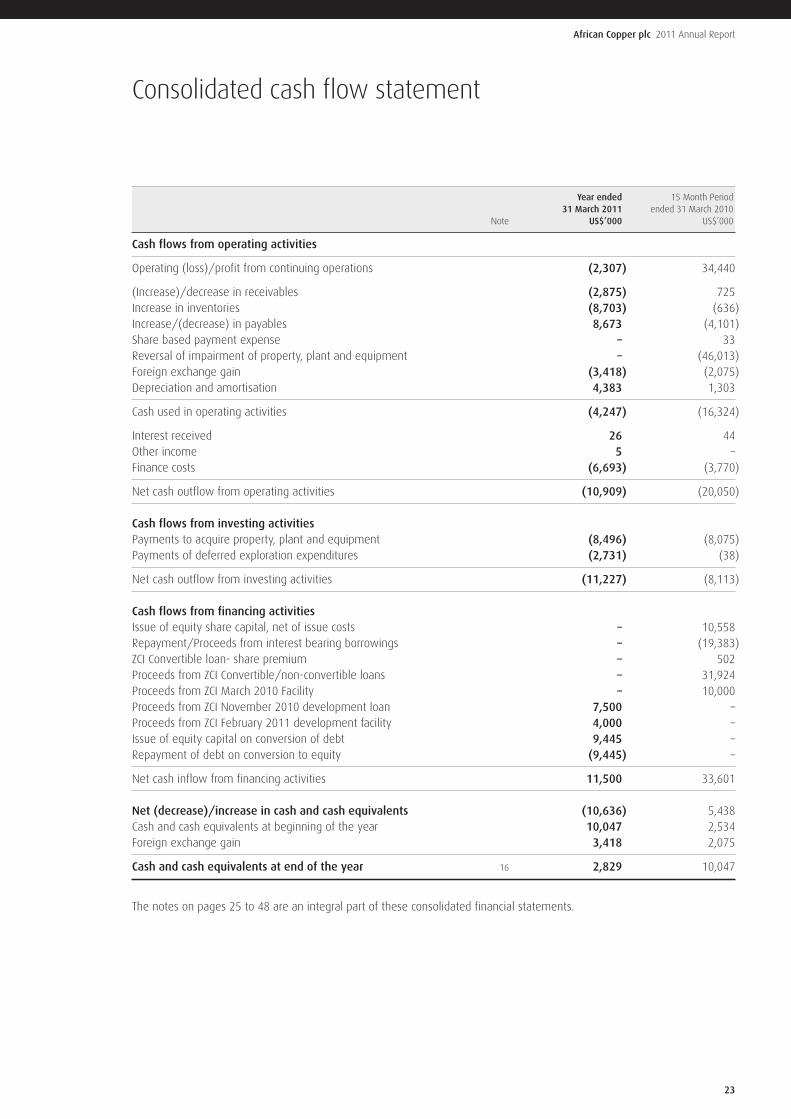
Consolidated cash flow statement
Year ended 15 Month Period31 March 2011 ended 31 March 2010
Note US$’000 US$’000
Cash flows from operating activities
Operating (loss)/profit from continuing operations (2,307) 34,440
(Increase)/decrease in receivables (2,875) 725Increase in inventories (8,703) (636)Increase/(decrease) in payables 8,673 (4,101)Share based payment expense – 33Reversal of impairment of property, plant and equipment – (46,013)Foreign exchange gain (3,418) (2,075)Depreciation and amortisation 4,383 1,303
Cash used in operating activities (4,247) (16,324)
Interest received 26 44Other income 5 –Finance costs (6,693) (3,770)
Net cash outflow from operating activities (10,909) (20,050)
Cash flows from investing activitiesPayments to acquire property, plant and equipment (8,496) (8,075)Payments of deferred exploration expenditures (2,731) (38)
Net cash outflow from investing activities (11,227) (8,113)
Cash flows from financing activitiesIssue of equity share capital, net of issue costs – 10,558Repayment/Proceeds from interest bearing borrowings – (19,383)ZCI Convertible loan- share premium – 502Proceeds from ZCI Convertible/non-convertible loans – 31,924Proceeds from ZCI March 2010 Facility – 10,000Proceeds from ZCI November 2010 development loan 7,500 –Proceeds from ZCI February 2011 development facility 4,000 –Issue of equity capital on conversion of debt 9,445 –Repayment of debt on conversion to equity (9,445) –
Net cash inflow from financing activities 11,500 33,601
Net (decrease)/increase in cash and cash equivalents (10,636) 5,438Cash and cash equivalents at beginning of the year 10,047 2,534Foreign exchange gain 3,418 2,075
Cash and cash equivalents at end of the year 16 2,829 10,047
The notes on pages 25 to 48 are an integral part of these consolidated financial statements.
African Copper plc 2011 Annual Report
24
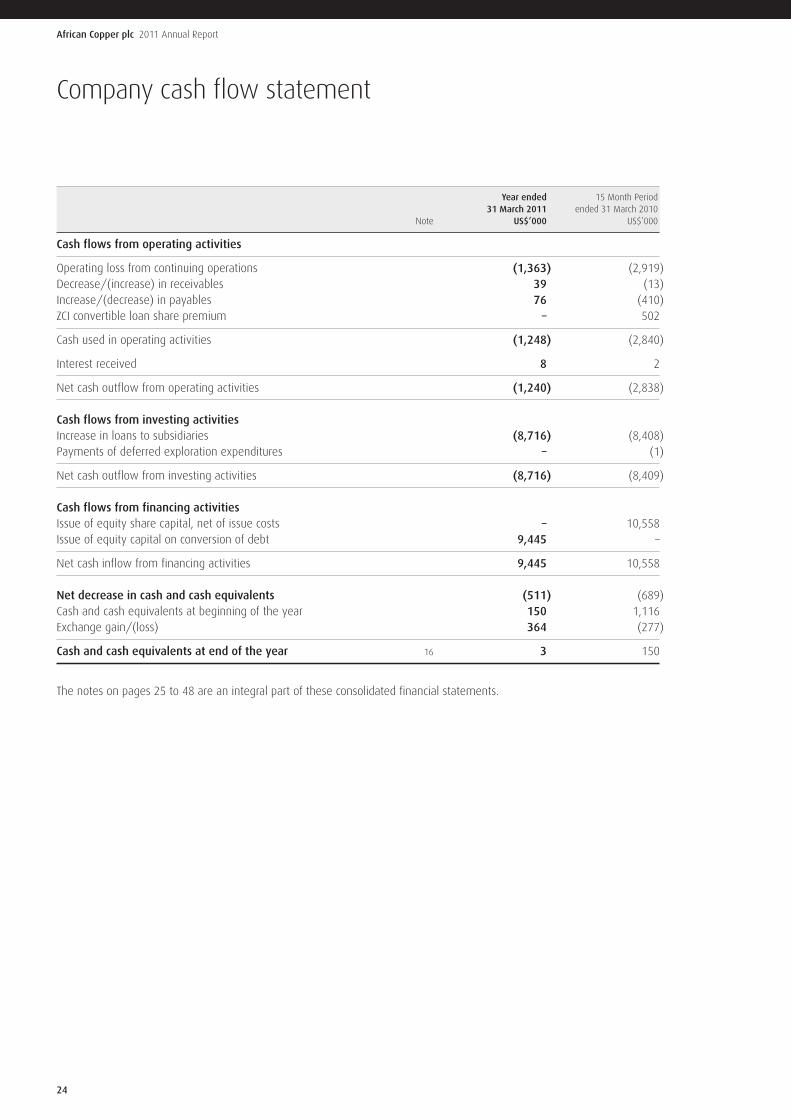
Company cash flow statement
Year ended 15 Month Period31 March 2011 ended 31 March 2010
Note US$’000 US$’000
Cash flows from operating activities
Operating loss from continuing operations (1,363) (2,919)Decrease/(increase) in receivables 39 (13)Increase/(decrease) in payables 76 (410)ZCI convertible loan share premium – 502
Cash used in operating activities (1,248) (2,840)
Interest received 8 2
Net cash outflow from operating activities (1,240) (2,838)
Cash flows from investing activitiesIncrease in loans to subsidiaries (8,716) (8,408)Payments of deferred exploration expenditures – (1)
Net cash outflow from investing activities (8,716) (8,409)
Cash flows from financing activitiesIssue of equity share capital, net of issue costs – 10,558Issue of equity capital on conversion of debt 9,445 –
Net cash inflow from financing activities 9,445 10,558
Net decrease in cash and cash equivalents (511) (689)Cash and cash equivalents at beginning of the year 150 1,116Exchange gain/(loss) 364 (277)
Cash and cash equivalents at end of the year 16 3 150
The notes on pages 25 to 48 are an integral part of these consolidated financial statements.
25
African Copper plc 2011 Annual Report
Notes to the consolidated financial statements
African Copper Plc (“African Copper” or the “Company”) isa public limited company incorporated and domiciled inEngland and is listed on the AIM market of the London StockExchange and the Botswana Stock Exchange. African Copperis a holding company of a copper producing and mineralexploration and development group of companies (the“Group”). The Group’s main project is the copper producingopen pit Mowana mine. The Group also owns the rights tothe adjacent Thakadu-Makala deposits and holds permitsin exploration properties at the Matsitama Project.The Mowana Mine is located in the north-eastern portionof Botswana and the Matsitama Project is contiguous tothe southern boundary of the Mowana Mine.
The Group has only one operating segment, namely copperexploration, development and mining in Botswana.
Basis of preparationThe consolidated and company financial statements havebeen prepared in accordance with International FinancialReporting Standards and Interpretations (collectively “IFRS”)issued by the International Accounting Standards Board(“IASB”) as adopted by the European Union (“EU”) inaccordance with EU laws.
The consolidated and company financial statements havebeen prepared according to the historic cost basis or the fairvalue basis where the fair value of relevant assets andliabilities has been applied.
The consolidated and company financial statements arepresented in United States Dollars (“US$” or “US dollar”) androunded to the nearest thousand. The Company’s functionalcurrency is GB Pounds (“£”) and the functional currency ofthe Company’s principal subsidiary is Botswana Pula.
Going concernThe Directors have prepared the financial statements onthe going concern basis having considered the status ofcurrent operations, the current funding position and theprojected funding requirements of the business for, at least,12 months from the date of approval of these financialstatements as detailed below.
Current operationsIn the year to 31st March 2011, the consolidated financialstatements show a loss before tax of US$8,969,000 and at31st March 2011, net current liabilities of US$7,504,000.
The Company’s principal subsidiary sold a total of 3,841tonnes of copper in concentrate during the financial year to31st March 2011 of which 1,266 tonnes were produced in
the final quarter of the year, i.e. an average of 422 tonnesfor each of the three months. The average price per tonneachieved during the financial year was US$8,347.00. Sincethe end of the year, copper produced in concentrate for Apriland May was 564 tonnes and 508 metric tonnes (“Mt”)respectively and the average price per tonne achieved wasUS$9,315.00.
Current fundingAt 31st March 2011, the consolidated principal debt of theGroup was US$53.4 million all of which is owed to ZCILimited (“ZCI”), African Copper’s immediate parent company,as set out in note 19 to the financial statements. Of thisfigure, US$10.0 million is classified as a current liability andis included in calculating the figure for net current liabilitiesthat existed at the year-end of US$7,504,000; the balance ofthe debt is classified as a non-current liability.
The Group has an additional US$8.5 million of undrawnfacility with ZCI.
In addition, on 24 March 2011, the Group entered into afacility with African Banking Corporation of BotswanaLimited (“ABCB”) to provide working capital and finance forcertain items of capital equipment. As such, the capitalequipment facility is not generally available although theprojected capital expenditure does include items that wouldbe covered by the terms of this facility. The working capitalfacility is for an amount of US$3.0 million and the capitalequipment facility is for an amount of US$3.1 million.Both facilities were undrawn at the year-end pendingcompletion of documentation.
Projected funding requirementsThe Directors have prepared cash flow projections coveringat least the 12 month period from the date of approval ofthese financial statements.
The projections, which have been drawn up on a monthlybasis, are based on a number of inputs and assumptionswhich include mined tonnage, all associated mining andprocessing costs, extraction and yield rates for production ofthe copper concentrate and the price of copper. The Group’sapproved capital expenditure is also included in the cashflows. The key assumptions to which the projections aremost sensitive in the opinion of the Directors are thetonnage of produced copper concentrate and the copperprice; the tonnage of produced copper concentrate is itselfa function of mining output and yield achieved in theprocessing operations. The projections show that, if the keyfinancial assumptions are achieved, the existing facility withZCI and new facility with ABCB will be sufficient to provide
1. Nature of operations and basis of preparation
African Copper plc 2011 Annual Report
26
Notes to the consolidated financial statementscontinued
the necessary funding for the Group for at least the next12 months from the date of approval of these financialstatements and in addition, enable the Group to repayUS$10.0 million of debt to ZCI which is due, under the termsof the particular facility agreement, in March 2012.
However, the mining operations at Mowana and Thakadu haveyet to reach full commercial production rates on a consistentbasis and produce positive cash flow. The Directors havealready addressed a number of the issues that have impactedthe ramp up to full production, especially at the Mowana mine,and the projections include capital expenditure to improve theprocessing capability of the operations, principally thesecondary and tertiary crusher availability. The Directors believethat with these improvements and a number of otherinitiatives which are referred to in the Review of Operationson pages 3 to 5 that the projections are achievable.
The key assumptions relating to production and pricingassume an average copper price per tonne over the 12 monthperiod to June 2012 of US$9,593 and average monthlyproduction of copper in concentrate of 1,257 Mt of copper.
The average copper price for each tonne produced wouldhave to fall to US$7,400 for the March 2012 repayment toZCI to be at risk. On the assumption that ZCI was prepared toreschedule the debt repayment to the following year, theaverage copper price per tonne could fall to US$6,500 beforethe Group was obliged to seek additional external funding.
The average monthly production of copper produced inconcentrate needs to be at least 875 Mt before therepayment of debt to ZCI in March 2012 is at risk of notbeing paid. Again assuming that the repayment could berescheduled, average monthly production of copper inconcentrate needs to be at least 775 Mt before the Grouphas to seek additional funding.
The required levels of production of copper produced inconcentrate compare with the actual rates of productionachieved in the first two months of the new financial yearof 564 Mt and 508 Mt in April and May respectively. Theunproven ability of the Group to achieve the ramp up inproduction and the volatility of the copper price representa material uncertainty which may cast significant doubton the ability of the Group and the Company to continueas a going concern.
If projected production levels and pricing fall to the levelsoutlined above, the Directors would first seek to reschedulethe debt repayment due to ZCI in March 2012. If furtherfunding was required, in addition to deferring repayment ofthe ZCI debt, the Directors would seek new sources offinance from outside the Group although currently there areno plans to do so. In the event that further funding was notavailable to the Directors, the Group would be unlikely to beable to realise its assets and discharge its liabilities in thenormal course of business.
ConclusionAfter taking account of the Group’s funding position, itscash flow projections and having considered the risks anduncertainties associated with the projections, the Directorshave a realistic expectation that the Group has adequateresources to operate for at least the next 12 months fromthe date of approval of these financial statements. For thesereasons, they continue to prepare the financial statementson the going concern basis. These financial statements donot include any adjustments that would result from thegoing concern basis of preparation being inappropriate.
The address of African Copper’s registered office is 100 PallMall, St James’s London SW1Y 5HP. These consolidatedfinancial statements have been approved for issue by theBoard of Directors on 29 June 2011.
1. Nature of operations and basis of preparation continued
The principal accounting policies applied in thepreparation of these consolidated financial statementsare set out below.
a) Comparative accounting reference dateIn the prior period the Company extended its reportingperiod from 31 December 2009 to 31 March 2010 in orderto align its year end with that of its parent company ZCI.Accordingly the results for the comparative period are forthe fifteen months ended 31 March 2010. Information forthe current year ended 31 March 2011 is for the twelve
month period and may therefore not be directly comparableto the comparative 15 month period.
b) Statement of ComplianceThe consolidated financial statements of African Copper plchave been prepared in accordance with InternationalFinancial Reporting Standards (“IFRSs”) and theirinterpretations issued by the International AccountingStandards Board (IASB), as adopted by the European Unionand with IFRSs and their interpretations issued by theInternational Accounting Standards Board (IASB). They have
2. Summary of significant accounting policies
27
African Copper plc 2011 Annual Report
also been prepared in accordance with those parts of theCompanies Act 2006 applicable to companies reportingunder IFRSs.
The accounting policies set out below have been appliedconsistently to all periods presented in these consolidatedfinancial statements.
As permitted by section 408 of the Companies Act 2006, theStatement of Comprehensive Income of the Company hasnot been presented in these financial statements.
c) Standards adopted during the yearIn these financial statements no new standards, amendmentsto standards or interpretations that are effective and havebeen adopted in the year had a material effect on thefinancial statements.
d) New standards and interpretations not yet adoptedThere are a number of new standards, amendments tostandards and interpretations that are not yet effective forthe year ended 31 December 2010. None of these havebeen adopted early in preparing these consolidatedfinancial statements.
None of these are anticipated to have any impact on theresults or statement of financial position reported in theseconsolidated financial statements. None of the newstandards, amendments to standards and interpretationsnot yet effective are anticipated to materially change theGroup’s published accounting policies.
e) Accounting basis(i) SubsidiariesThe consolidated financial statements incorporate thefinancial statements of the Company and entities controlledby the Company (its subsidiaries) made up to 31 March2011. Control is recognised where the Company has thepower to govern the financial and operating policies of aninvestee entity so as to obtain benefits from its activities.
(ii) Transactions eliminated on consolidationIntra-group transactions, balances and unrealised gains ontransactions between group companies are eliminated.Unrealised losses are eliminated in the same way asunrealised gains, but only to the extent that there is noevidence of impairment.
f) Revenue recognition & measurement(i) Revenue from sales of copper concentrate is recordednet of smelter treatment charges and deductions. Copperconcentrate is sold under pricing arrangements whereby
revenue is recognised at the time of shipment (delivery ofthe products at the mine gate), at which time legal title andrisk pass to the customer and provisional revenue isrecorded at current month average price. The quoted periodestablished for each sale contract to finalise the sales priceis the month subsequent to the month of delivery, withinwhich the contract is required to be settled. Changesbetween the prices recorded upon recognition of provisionalrevenue and final price due to fluctuation in copper marketprices result in the existence of an embedded derivative inthe accounts receivable. This embedded derivative isrecorded at fair value, with changes in fair value classifiedas a component of revenue and receivables. Changes in theestimate of concentrate copper content resulting from thefinal independent analysis of the concentrate are recognisedat the point at which such analysis is agreed.
ii) Interest incomeInterest income is recognised as it accrues to the Company.
g) Foreign currency translation(i) Functional and presentation currencyThe consolidated financial statements are presented in USdollars which is the presentation currency. Items included inthe financial statements of each of the Group’s entities aremeasured using the currency of the primary economicenvironment in which the entity operates (‘the FunctionalCurrency’). The Functional Currency of the Company remainsPounds Sterling since this is a non-trading holding Companylocated in the United Kingdom that has Pounds Sterlingdenominated share capital.
(ii) Group companiesThe results and financial position of all the group entities(none of which has the currency of a hyperinflationaryeconomy) that have a functional currency different from thepresentation currency are translated into the presentationcurrency as follows:
• assets and liabilities for each balance sheet presentedare translated at the closing rate at the date of thatbalance sheet;
• income and expenses for each income statement aretranslated at average exchange rates (unless this averageis not a reasonable approximation of the cumulativeeffect of the rates prevailing on the transaction dates, inwhich case income and expenses are translated at thedates of the transactions); and
• all resulting exchange differences are recognised as aseparate component of equity.
2. Summary of significant accounting policies continued
African Copper plc 2011 Annual Report
28
Notes to the consolidated financial statementscontinued
On consolidation, exchange differences arising from thetranslation of the net investment in foreign operations aretaken to shareholders’ equity. When a foreign operation issold, exchange differences that were recorded in equityare recognised in profit and loss as part of the gain orloss on sale.
(iii) Transactions and balancesForeign currency transactions are translated into thefunctional currency using the exchange rates prevailing atthe dates of the transactions. Foreign exchange gains andlosses resulting from the settlement of such transactionsand from the translation at year-end exchange rates ofmonetary assets and liabilities denominated in foreigncurrencies are recognised in profit and loss.
h) Property, plant and equipmentProperty, plant and equipment are recorded at cost lessaccumulated depreciation and less any accumulatedimpairment losses. Pre-production expenditure relating totesting and commissioning is capitalised to property, plantand equipment. The recognition of costs in the carryingamount of an asset ceases when the item is in the locationand condition necessary to operate as intended bymanagement. Any net income earned while the item isnot yet capable of operating as intended reduces thecapitalised amount.
Subsequent costs are included in the asset’s carryingamount only when it is probable that future economicbenefits associated with the item will flow to the Group andthe cost of the item can be reliably measured. All otherrepairs and maintenance are charged to profit and lossduring the financial period in which they are incurred.
Amortisation methods and amortisation rates are appliedconsistently within each asset class except where significantindividual assets have been identified which have differentamortisation patterns. Residual values are reviewed at leastannually. Amortisation is not adjusted retrospectively forchanges in the residual amount. Gains and losses ondisposals are determined by comparing proceeds withcarrying amount and are included in profit and loss.
Other assets consist of vehicles, information technologyequipment and furniture and equipment.
Mining development and infrastructureIndividual mining assets and deferred stripping costs areamortised using the units-of-production method based onthe estimated economically recoverable metal during thelife of mine plan. Mining costs incurred on development
activities comprising the removal of waste rock to initiallyexpose ore at the Mowana open pit mine, commonlyreferred to as “deferred stripping costs,” are capitalised.
Mining plant and equipmentIndividual mining plant and equipment assets are amortisedusing the units-of-production method based on the estimatedeconomically recoverable metal during the life of mine plan.
Other assetsThese assets are depreciated using the straight line methodover the useful life of the asset as follows:
• Vehicles 4 years
• Information technology 3 years
• Furniture & equipment 5 years
i) Deferred exploration and evaluationAll costs incurred prior to obtaining the legal right toundertake exploration and evaluation activities on a projectare written-off as incurred.
Exploration and evaluation costs arising following theacquisition of an exploration licence are capitalised on project-by-project basis, pending determination of the technicalfeasibility and commercial viability of the project. Costsincurred include appropriate technical and administrativeoverheads. Deferred exploration costs are carried at historicalcost less any impairment losses recognised.
Upon demonstration of the technical and commercialfeasibility of a project, any past deferred exploration andevaluation costs related to that project will be reclassified asMine Development and Infrastructure.
Capitalised deferred exploration expenditures are reviewedfor impairment losses (see accounting policy note below) ateach balance sheet date. In the case of undevelopedproperties, there may be only inferred resources to form abasis for the impairment review. The review is based on astatus report regarding the Group’s intentions fordevelopment of the undeveloped property.
j) Other receivables and prepaymentsOther receivables and prepayments are not interest bearingand are stated at amortised cost.
k) Derivative financial instrumentsCopper forward exchange contracts are entered into tohedge anticipated future transactions.
2. Summary of significant accounting policies continued
29
African Copper plc 2011 Annual Report
Derivative financial instruments are initially recognised inthe balance sheet at the fair value on the date of acquisitionand subsequently re-measured at fair value. The method ofrecognising the resulting gain or loss is dependent on thenature of the item being hedged. On the date that thederivative contract is entered into, the Group designatesderivatives as either a hedge of the fair value of arecognised asset or liability (fair value hedge) or a hedge ofa forecast transaction or a firm commitment (cash flowhedge). Changes in the fair value of derivatives that aredesignated and qualify as cash flow hedges and that arehighly effective are recognised in equity and are released toprofit and loss when the hedge matures. Changes in the fairvalue of derivatives that are designated as fair value hedgesare recognised in profit and loss. Certain derivativetransactions, while providing effective economic hedgesunder Group’s risk management policies, do not qualify forhedge accounting. Changes in the fair value of any suchderivative instruments are recognised immediately in profitand loss.
l) Cash and cash equivalentsCash and cash equivalents includes cash in hand, depositsheld at call with banks and other short-term highly liquidinvestments with original maturities of three months or less.
m) InventoriesInventories of broken ore and concentrate are physicallymeasured or estimated and valued at the lower of cost andnet realisable value (“NRV”).
Cost represents weighted average cost and includes directcosts and an appropriate portion of fixed and variableoverhead expenditure.
Inventories of consumable supplies and spare parts to beused in production are valued at weighted cost.
Obsolete or damaged inventories are valued at NRV. Anongoing review is undertaken to establish the extent ofsurplus items, and a provision is made for any potential losson their disposal.
n) ImpairmentWhenever events or changes in circumstance indicate thatthe carrying amount of an asset may not be recoverable anasset is reviewed for impairment. An asset’s carrying valueis written down to its estimated recoverable amount (beingthe higher of the fair value less costs to sell and value inuse) if that is less than the asset’s carrying amount.
Impairment reviews for deferred exploration and evaluationcosts are carried out on a project by project basis, with eachproject representing a potential single cash generating unit.An impairment review is undertaken when indicators ofimpairment arise but typically when one of the followingcircumstances apply:
(i) unexpected geological occurrences that render theresource uneconomic;
(ii) title to the asset is compromised;
(iii)variations in metal prices that render the projectuneconomic; and
(iv)variations in the currency of operation.
If any such indication exists, the recoverable amount of thatasset is recalculated and its carrying amount is increased tothe revised recoverable amount, if required. The increase isrecognised in the Statement of Comprehensive Income asan impairment reversal. An impairment reversal isrecognised only if it arises from a change in theassumptions that were used to calculate the recoverableamount. The increase in an asset’s carrying amount due toan impairment reversal is limited to the depreciated amountthat would have been recognised had the originalimpairment not occurred.
o) Share based paymentCertain Group employees and consultants are rewarded withshare based instruments. These are stated at fair value atthe date of grant and either expensed to profit and loss orcapitalised to deferred exploration costs, based on theactivity of the employee or consultant, over the vestingperiod of the instrument.
Fair value is estimated using the Black-Scholes valuationmodel. The estimated life of the instrument used in themodel is adjusted for management’s best estimate of theeffects of non-transferability, exercise restrictions andbehavioural considerations.
The proceeds received net of any directly attributabletransaction costs are credited to share capital (nominalvalue) and share premium when the options are exercised.
2. Summary of significant accounting policies continued
African Copper plc 2011 Annual Report
30
Notes to the consolidated financial statementscontinued
p) ProvisionsProvisions are recognised when, the Group has a legal orconstructive obligation as a result of past events, it is morelikely than not that an outflow of the resources will berequired to settle the obligation and the amount can bereliably estimated.
q) Trade and other payablesTrade and other payables are not interest bearing and arestated at amortised cost.
r) Guarantees to support Group indebtedness(Company only)Guarantees made to third parties to support interest-bearingliabilities of subsidiary companies are accounted for asfinancial guarantee contracts. Such contracts are ‘includedwithin the financial statements of the Company at theestimated fair-value of the commitment at the date thecommitment is made. The fair-value of the commitment isdetermined by reference to the interest rate differentialbetween the guaranteed interest-bearing liability and thatestimated to be applicable to a similar unguaranteed liability.
The fair-value of these guarantee contracts is considered tobe part of the Company’s investment in the relevantsubsidiary receiving the benefit of the guarantee contract.
These are intra-group transactions and are eliminated forthe purposes of the consolidated financial statements inaccordance with accounting policy 2 (g) above.
s) Income taxThe charge for taxation is based on the profit or loss for theyear and takes into account deferred tax. Deferred tax is thetax expected to be payable or recoverable on differencesbetween the carrying amounts of assets and liabilities in thefinancial statements and the corresponding tax bases usedin the computation of taxable profit or loss, and is accountedfor using the balance sheet method.
Deferred tax assets are only recognised to the extent that itis probable that future taxable profit will be available in theforeseeable future against which the temporary differencescan be utilised.
t) Asset retirement obligationsAsset retirement obligations are future costs to retire anasset including dismantling, remediation and ongoingtreatment and monitoring of the site. The asset retirement
cost is capitalised as part of the asset’s carrying value andamortised over the asset’s useful life. Subsequent to theinitial recognition of the asset retirement obligation andassociated asset retirement cost and changes resulting froma revision to either timing or the amount estimated, cashflows are prospectively reflected in the year those estimateschange. The liability is accreted over time through periodcharges to Statement of Comprehensive Income to unwindthe discount due to the passage of time.
u) Investment in subsidiariesInvestments in subsidiaries are recognised at cost less anyprovision for impairment.
v) Critical accounting estimates and judgementsEstimates and judgements are continually evaluated and arebased on historical experience and other factors, includingexpectations of future events that are believed to bereasonable under the circumstances. Many of the amountsincluded in the financial statements involve the use ofjudgement and/or estimation. These judgements andestimates are based on management’s best knowledge ofthe relevant facts and circumstances, having regard to priorexperience, but actual results may differ from the amountsincluded in the financial statements.
Information about such judgements and estimation iscontained in the accounting policies and/or the Notes to thefinancial statements, and the key areas are summarisedbelow. Areas of judgement that have the most significanteffect on the amounts recognised in the financial statements:
• Capitalisation and impairment of exploration andevaluation costs – Note 2(n) and Note 9
• Capitalisation and impairment of Property Plant andEquipment – Note 2(n) and Note 8
• Estimation of share based compensation amounts –Note 2(o) and Note 18
w) Borrowing costs.Borrowing costs are expensed as incurred, unless they aredirectly attributable to construction of assets and thereforeform part of the cost of that asset.
2. Summary of significant accounting policies continued
31
African Copper plc 2011 Annual Report
3. Group Segment reporting
An operating segment is a component of the Group distinguishable by economic activity or by its geographical location,which is subject to risks and returns that are different from those of other operating segments. The Group’s only operatingsegment is the exploration for, and the development of copper and other base metal deposits. All the Group’s activities arerelated to the exploration for, and the development of copper and other base metals in Botswana with the support providedfrom the UK. In presenting information on the basis of geographical segments, segment assets and the cost of acquiringthem are based on the geographical location of the assets. Segment capital expenditure is the total cost incurred during theperiod to acquire segment assets based on where the assets are located.
United Kingdom Botswana TotalGeographic Analysis ($US’000) ($US’000) (US$’000)
Revenue – 24,731 24,731
Non-current assets 17,125 67,473 84,598
All mining revenue derives from a single customer.
4. (Loss)/Profit on operations before tax
Year ended 15 Month period 31 March 2011 ended 31 March 2010
US$’000 US$’000
Profit/(Loss) on ordinary activities is stated after charging:Depreciation 874 1,889Amortisation 3,508 –
Auditors remuneration:– Audit fee KPMG 70 –– Audit fee PKF 8 70
Fees payable to PKF for other services:– Other services relating to tax 9 22– All other services 8 44
5. Staff numbers and costs
The average number of persons employed by the Group (including directors) during the period, analysed by category,was as follows:
Number of Employees Number of EmployeesYear ended Period ended
Group 31 March 2011 31 March 2010
Finance and administration 40 18Technical and operations 263 167
303 185
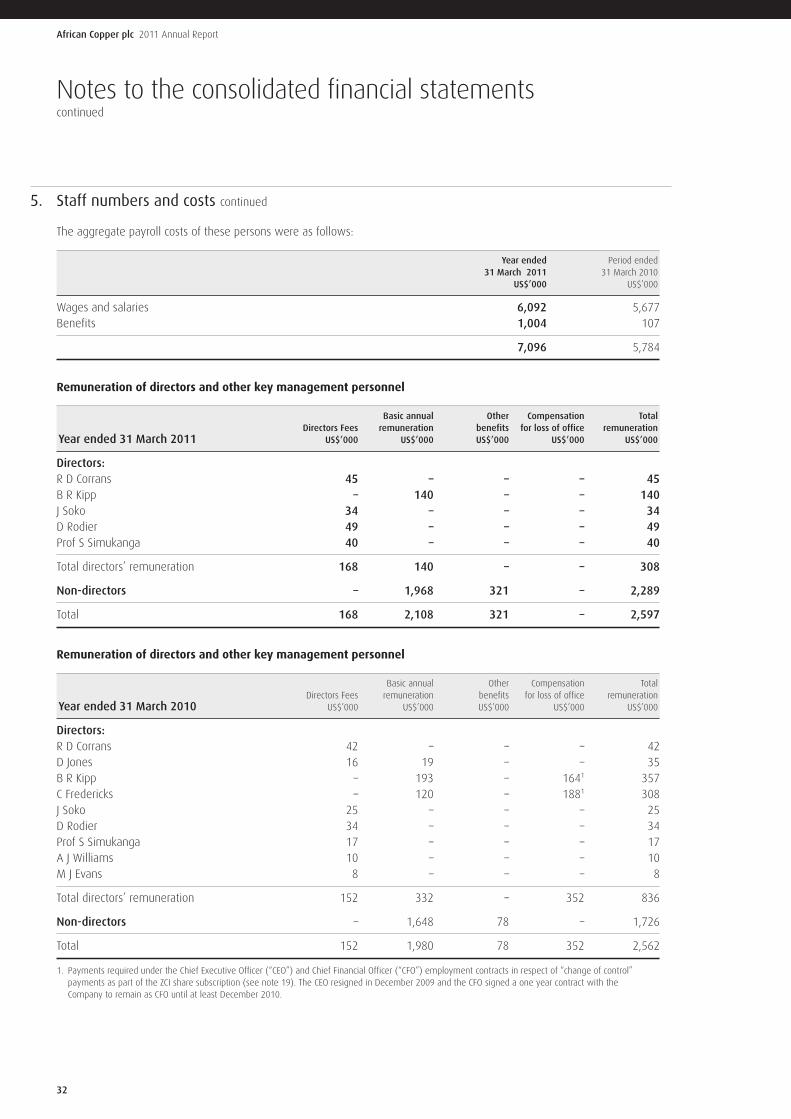
African Copper plc 2011 Annual Report
32
Notes to the consolidated financial statementscontinued
5. Staff numbers and costs continued
The aggregate payroll costs of these persons were as follows:
Year ended Period ended31 March 2011 31 March 2010
US$’000 US$’000
Wages and salaries 6,092 5,677Benefits 1,004 107
7,096 5,784
Remuneration of directors and other key management personnel
Basic annual Other Compensation Total Directors Fees remuneration benefits for loss of office remuneration
Year ended 31 March 2011 US$’000 US$’000 US$’000 US$’000 US$’000
Directors:R D Corrans 45 – – – 45B R Kipp – 140 – – 140J Soko 34 – – – 34D Rodier 49 – – – 49Prof S Simukanga 40 – – – 40
Total directors’ remuneration 168 140 – – 308
Non-directors – 1,968 321 – 2,289
Total 168 2,108 321 – 2,597
Remuneration of directors and other key management personnel
Basic annual Other Compensation Total Directors Fees remuneration benefits for loss of office remuneration
Year ended 31 March 2010 US$’000 US$’000 US$’000 US$’000 US$’000
Directors:R D Corrans 42 – – – 42D Jones 16 19 – – 35B R Kipp – 193 – 1641 357C Fredericks – 120 – 1881 308J Soko 25 – – – 25D Rodier 34 – – – 34Prof S Simukanga 17 – – – 17A J Williams 10 – – – 10M J Evans 8 – – – 8
Total directors’ remuneration 152 332 – 352 836
Non-directors – 1,648 78 – 1,726
Total 152 1,980 78 352 2,562
1. Payments required under the Chief Executive Officer (“CEO”) and Chief Financial Officer (“CFO”) employment contracts in respect of “change of control”payments as part of the ZCI share subscription (see note 19). The CEO resigned in December 2009 and the CFO signed a one year contract with theCompany to remain as CFO until at least December 2010.
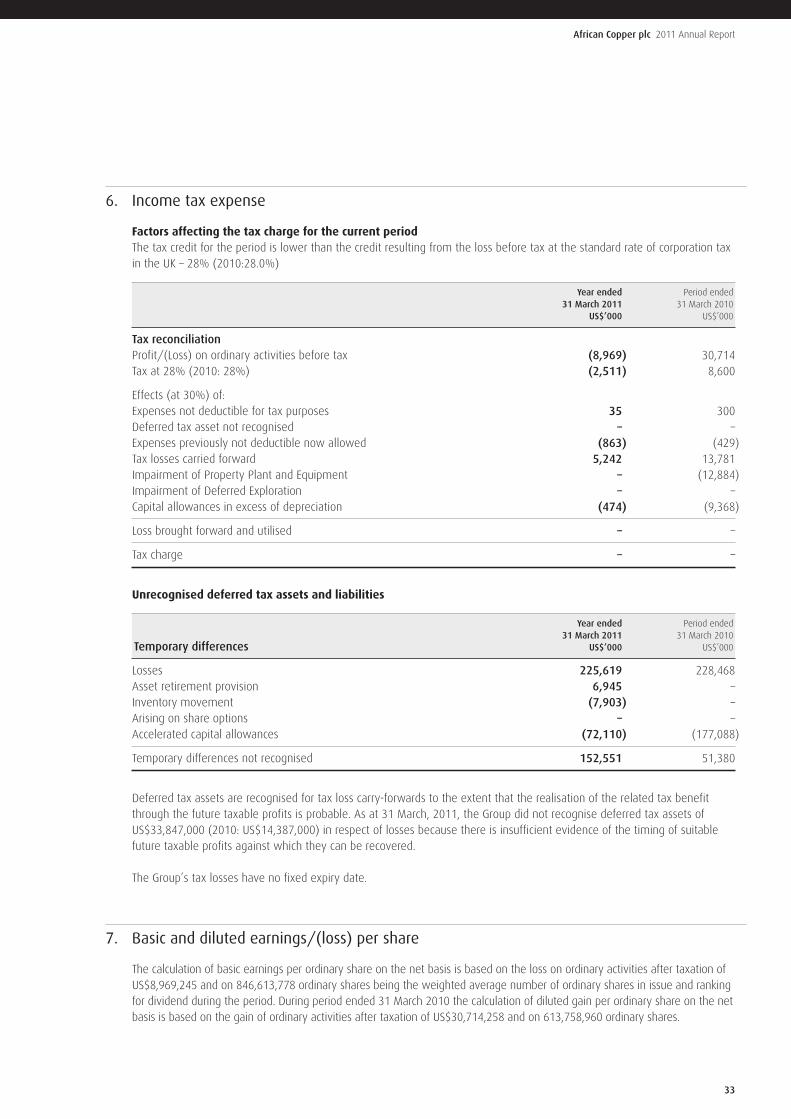
33
African Copper plc 2011 Annual Report
6. Income tax expense
Factors affecting the tax charge for the current periodThe tax credit for the period is lower than the credit resulting from the loss before tax at the standard rate of corporation taxin the UK – 28% (2010:28.0%)
Year ended Period ended 31 March 2011 31 March 2010
US$’000 US$’000
Tax reconciliationProfit/(Loss) on ordinary activities before tax (8,969) 30,714Tax at 28% (2010: 28%) (2,511) 8,600
Effects (at 30%) of:Expenses not deductible for tax purposes 35 300Deferred tax asset not recognised – –Expenses previously not deductible now allowed (863) (429)Tax losses carried forward 5,242 13,781Impairment of Property Plant and Equipment – (12,884)Impairment of Deferred Exploration – –Capital allowances in excess of depreciation (474) (9,368)
Loss brought forward and utilised – –
Tax charge – –
Unrecognised deferred tax assets and liabilities
Year ended Period ended 31 March 2011 31 March 2010
Temporary differences US$’000 US$’000
Losses 225,619 228,468Asset retirement provision 6,945 –Inventory movement (7,903) –Arising on share options – –Accelerated capital allowances (72,110) (177,088)
Temporary differences not recognised 152,551 51,380
Deferred tax assets are recognised for tax loss carry-forwards to the extent that the realisation of the related tax benefitthrough the future taxable profits is probable. As at 31 March, 2011, the Group did not recognise deferred tax assets ofUS$33,847,000 (2010: US$14,387,000) in respect of losses because there is insufficient evidence of the timing of suitablefuture taxable profits against which they can be recovered.
The Group’s tax losses have no fixed expiry date.
7. Basic and diluted earnings/(loss) per share
The calculation of basic earnings per ordinary share on the net basis is based on the loss on ordinary activities after taxation ofUS$8,969,245 and on 846,613,778 ordinary shares being the weighted average number of ordinary shares in issue and rankingfor dividend during the period. During period ended 31 March 2010 the calculation of diluted gain per ordinary share on the netbasis is based on the gain of ordinary activities after taxation of US$30,714,258 and on 613,758,960 ordinary shares.
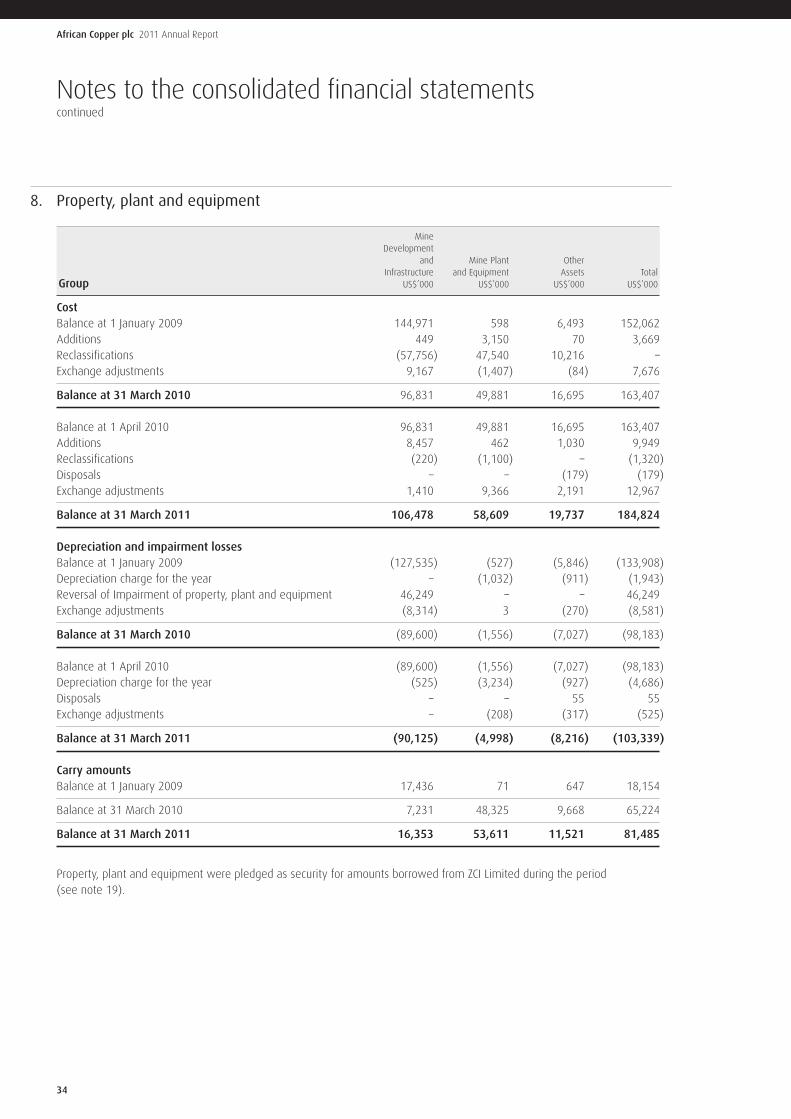
African Copper plc 2011 Annual Report
34
Notes to the consolidated financial statementscontinued
8. Property, plant and equipment
MineDevelopment
and Mine Plant OtherInfrastructure and Equipment Assets Total
Group US$’000 US$’000 US$’000 US$’000
CostBalance at 1 January 2009 144,971 598 6,493 152,062Additions 449 3,150 70 3,669Reclassifications (57,756) 47,540 10,216 –Exchange adjustments 9,167 (1,407) (84) 7,676
Balance at 31 March 2010 96,831 49,881 16,695 163,407
Balance at 1 April 2010 96,831 49,881 16,695 163,407Additions 8,457 462 1,030 9,949Reclassifications (220) (1,100) – (1,320)Disposals – – (179) (179)Exchange adjustments 1,410 9,366 2,191 12,967
Balance at 31 March 2011 106,478 58,609 19,737 184,824
Depreciation and impairment lossesBalance at 1 January 2009 (127,535) (527) (5,846) (133,908)Depreciation charge for the year – (1,032) (911) (1,943)Reversal of Impairment of property, plant and equipment 46,249 – – 46,249Exchange adjustments (8,314) 3 (270) (8,581)
Balance at 31 March 2010 (89,600) (1,556) (7,027) (98,183)
Balance at 1 April 2010 (89,600) (1,556) (7,027) (98,183)Depreciation charge for the year (525) (3,234) (927) (4,686)Disposals – – 55 55Exchange adjustments – (208) (317) (525)
Balance at 31 March 2011 (90,125) (4,998) (8,216) (103,339)
Carry amountsBalance at 1 January 2009 17,436 71 647 18,154
Balance at 31 March 2010 7,231 48,325 9,668 65,224
Balance at 31 March 2011 16,353 53,611 11,521 81,485
Property, plant and equipment were pledged as security for amounts borrowed from ZCI Limited during the period(see note 19).
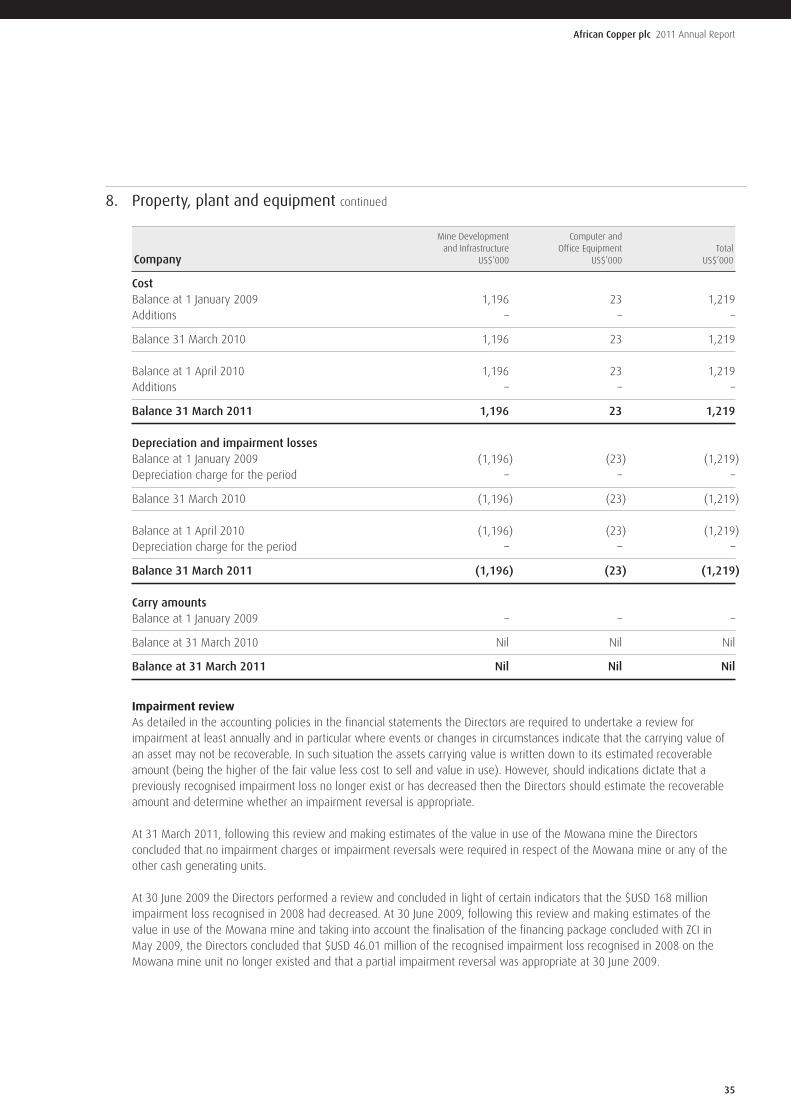
35
African Copper plc 2011 Annual Report
8. Property, plant and equipment continued
Mine Development Computer and and Infrastructure Office Equipment Total
Company US$’000 US$’000 US$’000
CostBalance at 1 January 2009 1,196 23 1,219Additions – – –
Balance 31 March 2010 1,196 23 1,219
Balance at 1 April 2010 1,196 23 1,219Additions – – –
Balance 31 March 2011 1,196 23 1,219
Depreciation and impairment lossesBalance at 1 January 2009 (1,196) (23) (1,219)Depreciation charge for the period – – –
Balance 31 March 2010 (1,196) (23) (1,219)
Balance at 1 April 2010 (1,196) (23) (1,219)Depreciation charge for the period – – –
Balance 31 March 2011 (1,196) (23) (1,219)
Carry amountsBalance at 1 January 2009 – – –
Balance at 31 March 2010 Nil Nil Nil
Balance at 31 March 2011 Nil Nil Nil
Impairment reviewAs detailed in the accounting policies in the financial statements the Directors are required to undertake a review forimpairment at least annually and in particular where events or changes in circumstances indicate that the carrying value ofan asset may not be recoverable. In such situation the assets carrying value is written down to its estimated recoverableamount (being the higher of the fair value less cost to sell and value in use). However, should indications dictate that apreviously recognised impairment loss no longer exist or has decreased then the Directors should estimate the recoverableamount and determine whether an impairment reversal is appropriate.
At 31 March 2011, following this review and making estimates of the value in use of the Mowana mine the Directorsconcluded that no impairment charges or impairment reversals were required in respect of the Mowana mine or any of theother cash generating units.
At 30 June 2009 the Directors performed a review and concluded in light of certain indicators that the $USD 168 millionimpairment loss recognised in 2008 had decreased. At 30 June 2009, following this review and making estimates of thevalue in use of the Mowana mine and taking into account the finalisation of the financing package concluded with ZCI inMay 2009, the Directors concluded that $USD 46.01 million of the recognised impairment loss recognised in 2008 on theMowana mine unit no longer existed and that a partial impairment reversal was appropriate at 30 June 2009.
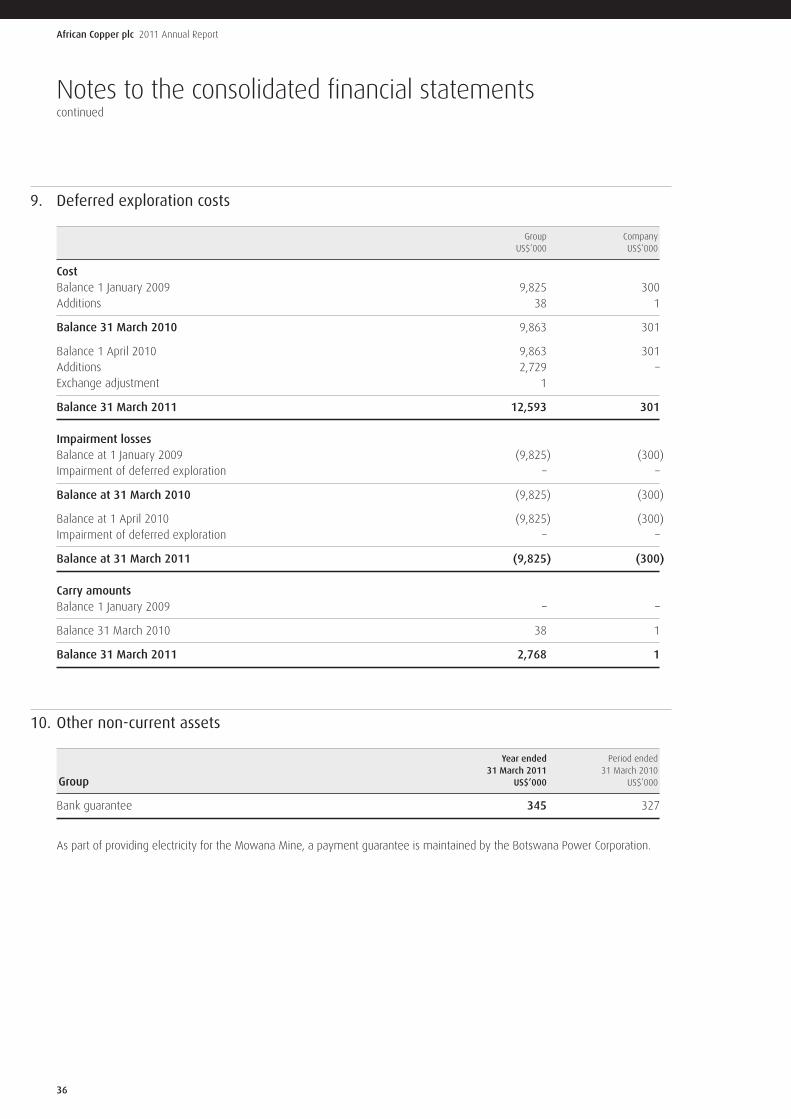
African Copper plc 2011 Annual Report
36
Notes to the consolidated financial statementscontinued
9. Deferred exploration costs
Group CompanyUS$’000 US$’000
CostBalance 1 January 2009 9,825 300Additions 38 1
Balance 31 March 2010 9,863 301
Balance 1 April 2010 9,863 301Additions 2,729 –Exchange adjustment 1
Balance 31 March 2011 12,593 301
Impairment lossesBalance at 1 January 2009 (9,825) (300)Impairment of deferred exploration – –
Balance at 31 March 2010 (9,825) (300)
Balance at 1 April 2010 (9,825) (300)Impairment of deferred exploration – –
Balance at 31 March 2011 (9,825) (300)
Carry amountsBalance 1 January 2009 – –
Balance 31 March 2010 38 1
Balance 31 March 2011 2,768 1
10. Other non-current assets
Year ended Period ended31 March 2011 31 March 2010
Group US$’000 US$’000
Bank guarantee 345 327
As part of providing electricity for the Mowana Mine, a payment guarantee is maintained by the Botswana Power Corporation.
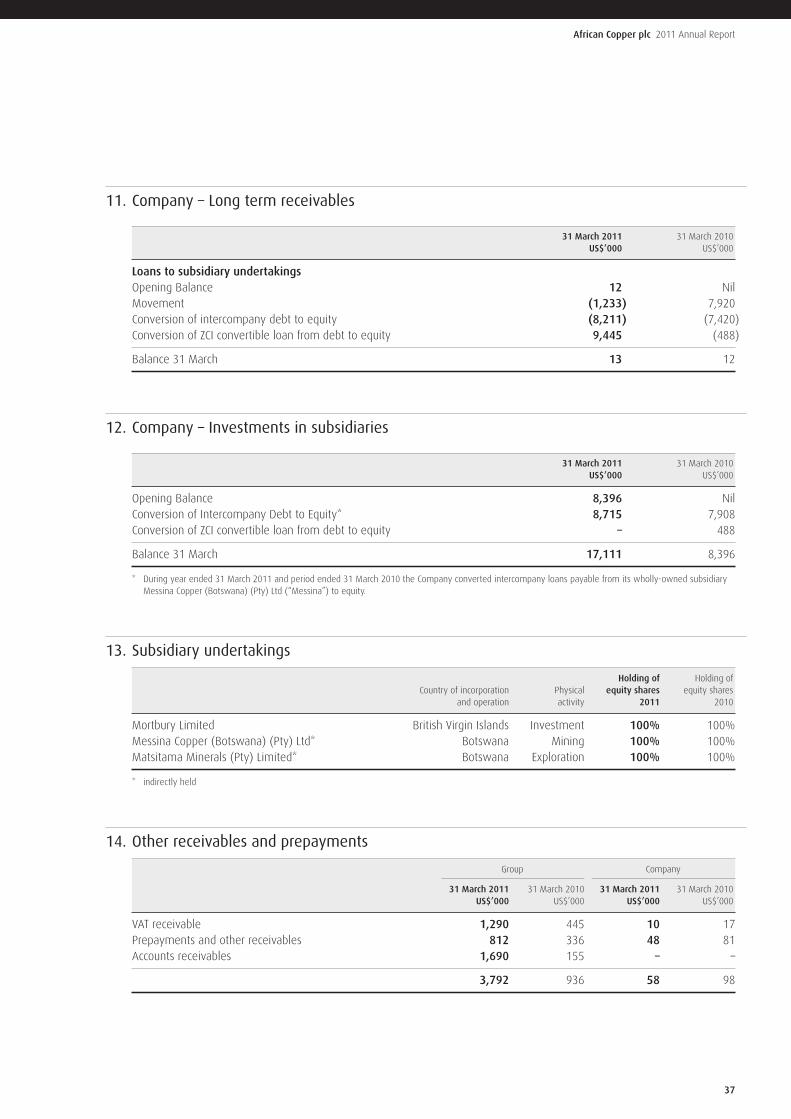
37
African Copper plc 2011 Annual Report
11. Company – Long term receivables
31 March 2011 31 March 2010US$’000 US$’000
Loans to subsidiary undertakingsOpening Balance 12 NilMovement (1,233) 7,920Conversion of intercompany debt to equity (8,211) (7,420)Conversion of ZCI convertible loan from debt to equity 9,445 (488)
Balance 31 March 13 12
12. Company – Investments in subsidiaries
31 March 2011 31 March 2010US$’000 US$’000
Opening Balance 8,396 NilConversion of Intercompany Debt to Equity* 8,715 7,908Conversion of ZCI convertible loan from debt to equity – 488
Balance 31 March 17,111 8,396
* During year ended 31 March 2011 and period ended 31 March 2010 the Company converted intercompany loans payable from its wholly-owned subsidiaryMessina Copper (Botswana) (Pty) Ltd (“Messina”) to equity.
13. Subsidiary undertakings
Holding of Holding of Country of incorporation Physical equity shares equity shares
and operation activity 2011 2010
Mortbury Limited British Virgin Islands Investment 100% 100%Messina Copper (Botswana) (Pty) Ltd* Botswana Mining 100% 100%Matsitama Minerals (Pty) Limited* Botswana Exploration 100% 100%
* indirectly held
14. Other receivables and prepayments
Group Company
31 March 2011 31 March 2010 31 March 2011 31 March 2010US$’000 US$’000 US$’000 US$’000
VAT receivable 1,290 445 10 17Prepayments and other receivables 812 336 48 81Accounts receivables 1,690 155 – –
3,792 936 58 98
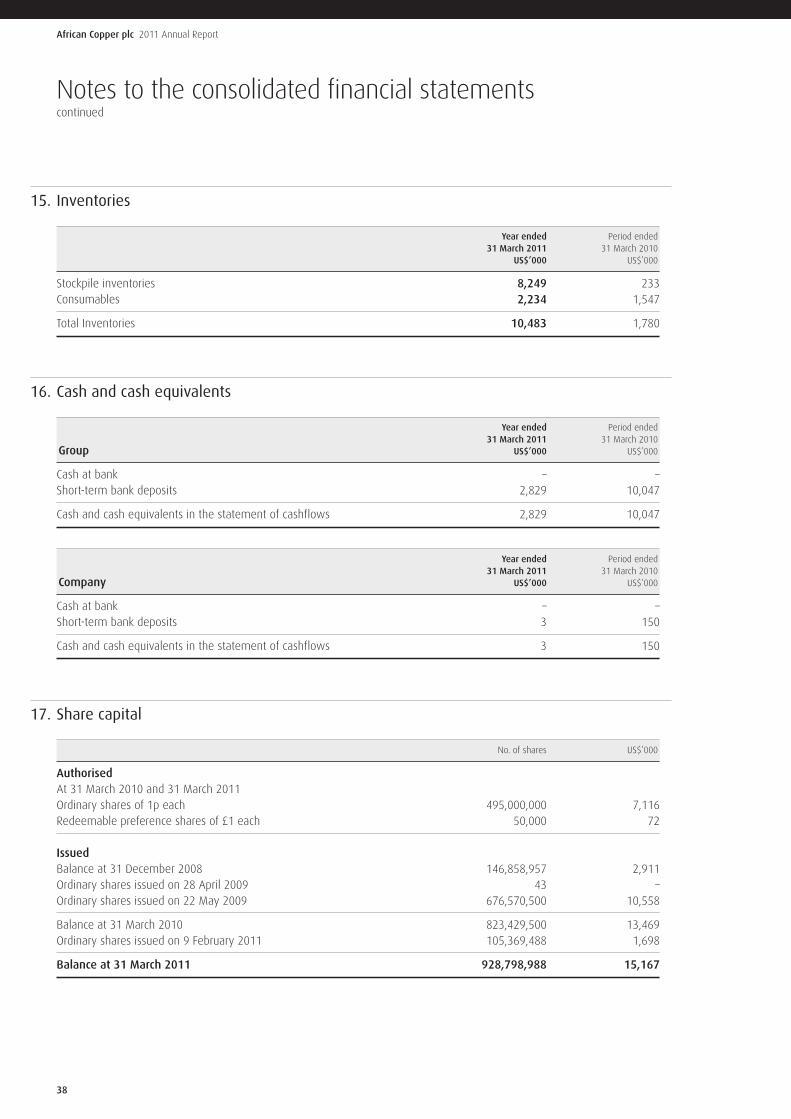
African Copper plc 2011 Annual Report
38
Notes to the consolidated financial statementscontinued
15. Inventories
Year ended Period ended 31 March 2011 31 March 2010
US$’000 US$’000
Stockpile inventories 8,249 233Consumables 2,234 1,547
Total Inventories 10,483 1,780
16. Cash and cash equivalents
Year ended Period ended 31 March 2011 31 March 2010
Group US$’000 US$’000
Cash at bank – –Short-term bank deposits 2,829 10,047
Cash and cash equivalents in the statement of cashflows 2,829 10,047
Year ended Period ended 31 March 2011 31 March 2010
Company US$’000 US$’000
Cash at bank – –Short-term bank deposits 3 150
Cash and cash equivalents in the statement of cashflows 3 150
17. Share capital
No. of shares US$’000
AuthorisedAt 31 March 2010 and 31 March 2011Ordinary shares of 1p each 495,000,000 7,116Redeemable preference shares of £1 each 50,000 72
IssuedBalance at 31 December 2008 146,858,957 2,911Ordinary shares issued on 28 April 2009 43 –Ordinary shares issued on 22 May 2009 676,570,500 10,558
Balance at 31 March 2010 823,429,500 13,469Ordinary shares issued on 9 February 2011 105,369,488 1,698
Balance at 31 March 2011 928,798,988 15,167
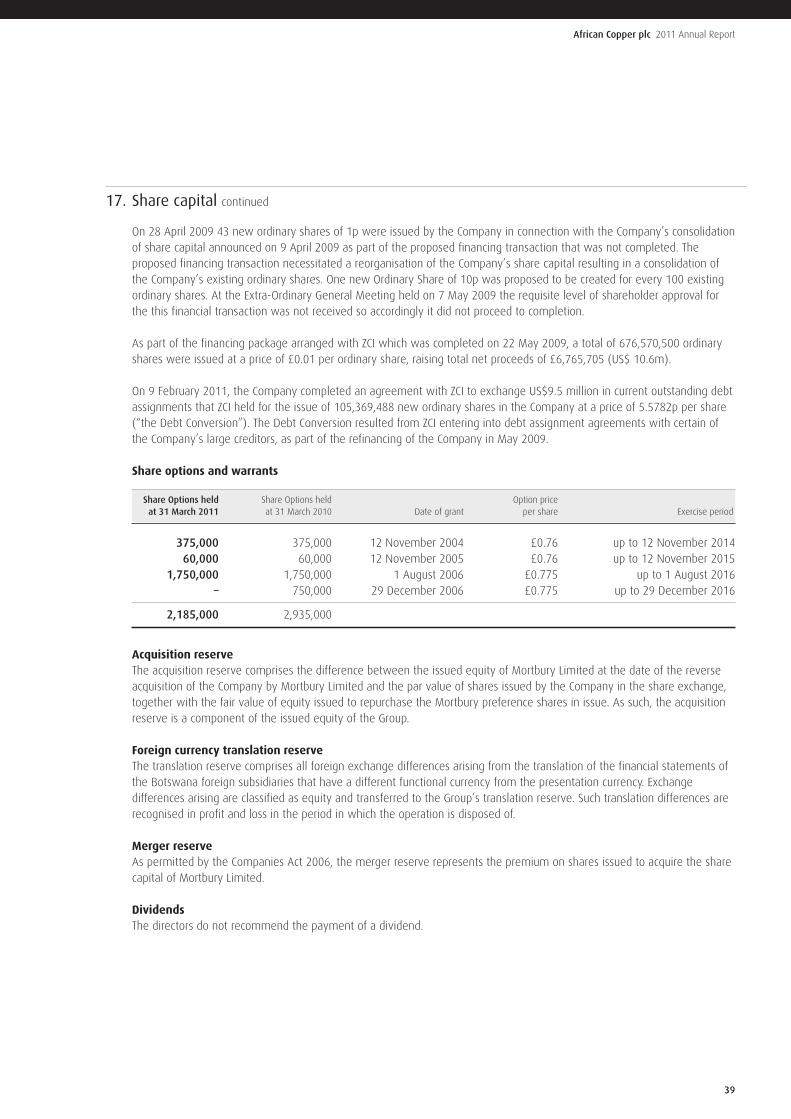
39
African Copper plc 2011 Annual Report
17. Share capital continued
On 28 April 2009 43 new ordinary shares of 1p were issued by the Company in connection with the Company’s consolidationof share capital announced on 9 April 2009 as part of the proposed financing transaction that was not completed. Theproposed financing transaction necessitated a reorganisation of the Company’s share capital resulting in a consolidation ofthe Company’s existing ordinary shares. One new Ordinary Share of 10p was proposed to be created for every 100 existingordinary shares. At the Extra-Ordinary General Meeting held on 7 May 2009 the requisite level of shareholder approval forthe this financial transaction was not received so accordingly it did not proceed to completion.
As part of the financing package arranged with ZCI which was completed on 22 May 2009, a total of 676,570,500 ordinaryshares were issued at a price of £0.01 per ordinary share, raising total net proceeds of £6,765,705 (US$ 10.6m).
On 9 February 2011, the Company completed an agreement with ZCI to exchange US$9.5 million in current outstanding debtassignments that ZCI held for the issue of 105,369,488 new ordinary shares in the Company at a price of 5.5782p per share(“the Debt Conversion”). The Debt Conversion resulted from ZCI entering into debt assignment agreements with certain ofthe Company’s large creditors, as part of the refinancing of the Company in May 2009.
Share options and warrants
Share Options held Share Options held Option price at 31 March 2011 at 31 March 2010 Date of grant per share Exercise period
375,000 375,000 12 November 2004 £0.76 up to 12 November 201460,000 60,000 12 November 2005 £0.76 up to 12 November 2015
1,750,000 1,750,000 1 August 2006 £0.775 up to 1 August 2016– 750,000 29 December 2006 £0.775 up to 29 December 2016
2,185,000 2,935,000
Acquisition reserveThe acquisition reserve comprises the difference between the issued equity of Mortbury Limited at the date of the reverseacquisition of the Company by Mortbury Limited and the par value of shares issued by the Company in the share exchange,together with the fair value of equity issued to repurchase the Mortbury preference shares in issue. As such, the acquisitionreserve is a component of the issued equity of the Group.
Foreign currency translation reserveThe translation reserve comprises all foreign exchange differences arising from the translation of the financial statements ofthe Botswana foreign subsidiaries that have a different functional currency from the presentation currency. Exchangedifferences arising are classified as equity and transferred to the Group’s translation reserve. Such translation differences arerecognised in profit and loss in the period in which the operation is disposed of.
Merger reserveAs permitted by the Companies Act 2006, the merger reserve represents the premium on shares issued to acquire the sharecapital of Mortbury Limited.
DividendsThe directors do not recommend the payment of a dividend.
African Copper plc 2011 Annual Report
40
Notes to the consolidated financial statementscontinued
17. Share capital continued
Capital managementThe Group’s objectives when managing capital is to safeguard the Group’s ability to continue as a going concern, so that itcan provide returns for shareholders and benefits for other stakeholders.
The Group sets the amount of capital in proportion to its overall financing structure, i.e. equity and financial liabilities. TheGroup manages the capital structure and makes adjustments to it in the light of changes in economic conditions and the riskcharacteristics of the underlying assets. In order to maintain or adjust the capital structure, the Group issues new shares, orsell assets to reduce debt.
At 31 March 2011 At 31 March 2010US$’000 US$’000
Total interest bearing debt 53,424 51,368Total equity 26,520 16,997
Debt-to-equity ratio 2.01:1 3.02:1
18. Share based payments
African Copper has established a share option scheme with the purpose of motivating and retaining qualified management andto ensure common goals for management and the shareholders. Under the African Copper share plan each option gives theright to purchase one African Copper ordinary share. For options granted the vesting period is generally up to three years. If theoptions remain unexercised after a period of 10 years from the date of grant, the options expire. Furthermore, options areforfeited if the employee leaves the Company. In 2005 all options were granted at 76p and in 2006 and 2007 all options weregranted at 77.5p. No options were granted during the period ended 31 March 2010 and year ended 31 March 2011.
Movements in the number of share options outstanding and their related weighted average exercise prices are as follows:
31 March 2011 31 March 2010
Weighted average Weighted average exercise price exercise price in £ per share Options in £ per share Options
At 1 April 77.3p 2,935,000 76p 11,215,000Forfeited 77.5p (750,000) 74.6p (8,280,000)
At 31 March 77.2p 2,185,000 77.3p 2,935,000
Exercisable at the end of the year 77.2p 2,185,000 77.3p 2,935,000
Expected volatility was determined by calculating the historical volatility of the Company’s share price since it was listed on theAIM market of the London Stock Exchange in November 2004. The expected life used in the model has been adjusted, basedon management’s best estimate, for the effects of non-transferability, exercise restrictions, and behavioural considerations.
The total expense in respect of share based payments for the year was nil (2010: US$40,689), of which nil (2010:US$33,101) was recorded as an expense in profit and loss and nil (2010: US$7,588) was capitalised as part of deferredexploration costs.
41
African Copper plc 2011 Annual Report
18. Share based payments continued
Share options outstanding at the end of the year have the following expiry date and exercise prices:
Exercise priceShares
Expiry date in £ per share 31 March 2011 31 March 2010
2014 76p 375,000 375,0002015 76p 60,000 60,0002016 77.5p 1,750,000 2,500,000
77.2p 2,185,000 2,935,000
The weighted average remaining contractual life of the outstanding options at 31 March 2011 was 4.5 years (2010: 4.5 years).
19. Amounts payable to ZCI Ltd
At 31 March 2011 At 31 March 2010US$’000 US$’000
Due to ZCI – Convertible loan (non-current liability) 7,891 7,891Due to ZCI – Non-convertible loan (non-current liability) 24,033 24,033Due to ZCI – Development loan (non-current liability) 7,500 –Due to ZCI – Development Facility (non-current liability) 4,000 –
43,424 31,924Due to ZCI – March 2010 Facility (current liability) 10,000 10,000Due to ZCI – Debt acquisitions(current liability) – 9,445
10,000 19,445
Balance 31 March 53,424 51,369
ZCI owns 84.19 percent of the Company. At 31 March 2011 the Company owed ZCI pursuant to the following principalindebtedness:
Convertible Loan FacilityThe Convertible Loan Facility is a four year secured part convertible credit facility of US$31,129,100 comprising a convertibleTranche A of US$8,379,100 with a coupon of 12 per cent. per annum and Tranche B that is not convertible of US$22,750,000with a coupon of 14 per cent. per annum. The Convertible Loan Facility was signed on 18 June 2009. Tranche B wassubsequently increased from US$22,750,000 to $24,032,900. Tranche A of the Convertible Loan Facility is convertible intoordinary shares of African Copper at a conversion price of 1p per share. The maximum aggregate number of new ordinaryshares which may be issued pursuant to the conversion rights attaching to Tranche A is 556,307,263 new ordinary shares(subject to usual adjustments), which would, were Tranche A to be converted in full, increase ZCI’s interest in the enlargedissued share capital of the Company from 84.19 per cent. to 90.11 per cent.
The Convertible Loan Facility contains typical covenants, warranties and events of default for an agreement of this nature.The Convertible Loan Facility is guaranteed by African Copper and all other African Copper group companies and is securedover Messina’s assets including a share pledge over the shares of Messina.
On 26 March 2010 the board of directors of ZCI resolved that the interest payment on the Tranche B Convertible Loan due bythe Company on 31 March 2010 be postponed for a period of one year until 31 March 2011 (the “Postponed Interest”).
African Copper plc 2011 Annual Report
42
Notes to the consolidated financial statementscontinued
19. Amounts payable to ZCI Ltd continued
ZCI Debt AcquisitionsIn May 2009 as part of the refinancing of the Company ZCI acquired certain debts due to large creditors of the Grouprepresenting US$9.44 million (the “Debt Acquisitions”). In February 2011 ZCI agreed to exchange the Debt Acquisitions fornew ordinary shares in the Company at a deemed price of 5.5782p per share. The conversion price of 5.5782p per sharewas calculated based on the 30 days Volume Weighted Average Price (VWAP) and resulted in the issue of 105,369,488ordinary shares to ZCI.
March 2010 FacilityOn 31 March 2010 the Company announced it had arranged agreement with ZCI pursuant to which ZCI would fundimmediately a $US 10 million term loan facility at an interest rate of 6% per annum, payable quarterly, to be repaid on orbefore 31st March 2011 and may be renewed, subject to ZCI giving its written consent to such renewal, prior to therepayment date. The March Facility is secured under the existing Convertible Loan Facility (with the exception of theconvertible option). In March 2011 ZCI agreed to renew the March Facility with payment re-scheduled to 31 March 2012.
Development LoanOn November 29, 2010 the Company announced it had secured the Development Loan from ZCI of USD7.5 million.The purpose of Development Loan was to enable exploration drilling on the Company’s Matsitama Exploration Projectand Mowana North deposit and the completion of a scoping study for the Makala deposits as well as certain plantenhancements. The Development Loan has an interest rate of 12% per annum payable half yearly, and is to be repaid onor before 30 November 2014 and may be renewed for a further 2 years, subject to ZCI giving its written consent to suchrenewal, prior to the repayment date. The other terms and conditions are otherwise on the same terms as with theConvertible Loan Facility (with the exception of the convertible option).
The Development FacilityOn February 9, 2011 the Company announced the Development Facility of $US12.5 million from ZCI. The purpose of theDevelopment Facility was to provide the Company with further working capital and funds to execute the planned investmentprogramme at its Mowana Mine facilities and accelerate mining activities at the Thakadu deposit. The Development Facilityis a 3 year secured loan facility with an interest rate of 9.0%, repayable in January 2014. Interest is to be paid semi-annuallyin arrears on 31 December and 30 June each year, commencing on 31 December 2011 with this payment including accruedinterest from the closing of the Facility. The terms and conditions of the Development Facility are on substantially similarterms to Convertible Loan Facility (with the exception of the convertible option). At 31 March 2011 $US4.0 million of theDevelopment Facility had been drawn by the Group.
As a consequence of the Convertible Loan Facility, the March Facility, the Development Loan and the drawn portion ofthe Development Facility the Group is indebted to ZCI at 31 March 2010 in an aggregate amount of approximatelyUS$53.42 million.
43
African Copper plc 2011 Annual Report
20. Rehabilitation provision
The Company estimates the total discounted amount of cash flows required to settle its asset retirement obligations at 31 March2011 is US$7,150,079 (2010 – US$4,051,477). Although the ultimate amount to be incurred is uncertain, the independentEnvironmental Impact Statement, completed on the Mowana Mine by Water Surveys Botswana (Pty) Limited in September 2006,using an assumption that mining continues to 2023, estimated the undiscounted cost to rehabilitate the Mowana Mine site of24.3 million Botswana Pula. This estimate was recently updated by GeoFlux (Pty) Limited and the undiscounted cost was revisedto 48 million Botswana Pula (due to escalation of Mowana estimate and the new estimate for Thakadu).
During the year the Company set aside US$0.54 million to a separate bank account to provide for rehabilitation of theMowana and Thakadu Mines site at closure. The cash provision is set aside on the rate of reserves depletion basis. TheCompany will annually make contributions to this account over the life of the mine so as to ensure these capitalcontributions together with the investment income earned cover the anticipated costs.
Rehabilitation Provision US$’000
Balance, 1 April 2010 4,051Provision 2,766Foreign exchange on translation 333
Balance, 31 March 2011 7,150
21. Trade and other payables
Group Company
31 March 2011 31 March 2010 31 March 2011 31 March 2010US$’000 US$’000 US$’000 US$’000
Trade payables 9,101 4,827 62 26Amounts due to related parties (Note 23) 3,971 1,052 41 19Withholding taxes 765 21 – –Accrued expenses and other payables 771 35 72 54
14,608 5,935 175 99
22. Commitments
2014 andTotal 2011 2012 2013 and thereafter
Contractual obligations US$’000 US$’000 US$’000 US$’000 US$’000
Goods, services and equipment (a) 7,629 7,517 112 – –Exploration licences (b) 5,215 917 4,298 – –Lease agreements (c) 588 409 161 18 –
13,432 8,843 4,571 18 –
a) The Company and its subsidiaries have a number of agreements with arms-length third parties who provide a wide range of goods and services and equipment.b) Under the terms of the Company’s prospecting licences Matsitama is obliged to incur certain minimum expenditures.c) The Company has entered into agreements to lease premises for various periods.
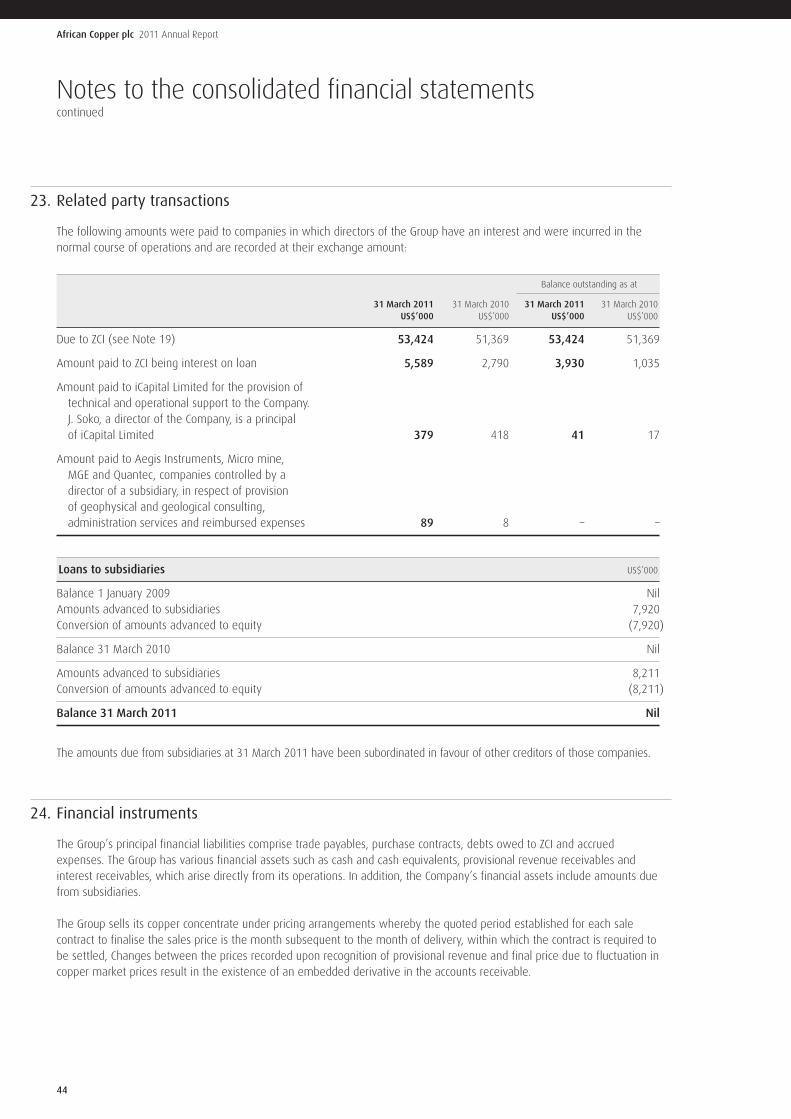
African Copper plc 2011 Annual Report
44
Notes to the consolidated financial statementscontinued
23. Related party transactions
The following amounts were paid to companies in which directors of the Group have an interest and were incurred in thenormal course of operations and are recorded at their exchange amount:
Balance outstanding as at
31 March 2011 31 March 2010 31 March 2011 31 March 2010US$’000 US$’000 US$’000 US$’000
Due to ZCI (see Note 19) 53,424 51,369 53,424 51,369
Amount paid to ZCI being interest on loan 5,589 2,790 3,930 1,035
Amount paid to iCapital Limited for the provision oftechnical and operational support to the Company.J. Soko, a director of the Company, is a principalof iCapital Limited 379 418 41 17
Amount paid to Aegis Instruments, Micro mine,MGE and Quantec, companies controlled by adirector of a subsidiary, in respect of provisionof geophysical and geological consulting,administration services and reimbursed expenses 89 8 – –
Loans to subsidiaries US$’000
Balance 1 January 2009 NilAmounts advanced to subsidiaries 7,920Conversion of amounts advanced to equity (7,920)
Balance 31 March 2010 Nil
Amounts advanced to subsidiaries 8,211Conversion of amounts advanced to equity (8,211)
Balance 31 March 2011 Nil
The amounts due from subsidiaries at 31 March 2011 have been subordinated in favour of other creditors of those companies.
24. Financial instruments
The Group’s principal financial liabilities comprise trade payables, purchase contracts, debts owed to ZCI and accruedexpenses. The Group has various financial assets such as cash and cash equivalents, provisional revenue receivables andinterest receivables, which arise directly from its operations. In addition, the Company’s financial assets include amounts duefrom subsidiaries.
The Group sells its copper concentrate under pricing arrangements whereby the quoted period established for each salecontract to finalise the sales price is the month subsequent to the month of delivery, within which the contract is required tobe settled, Changes between the prices recorded upon recognition of provisional revenue and final price due to fluctuation incopper market prices result in the existence of an embedded derivative in the accounts receivable.
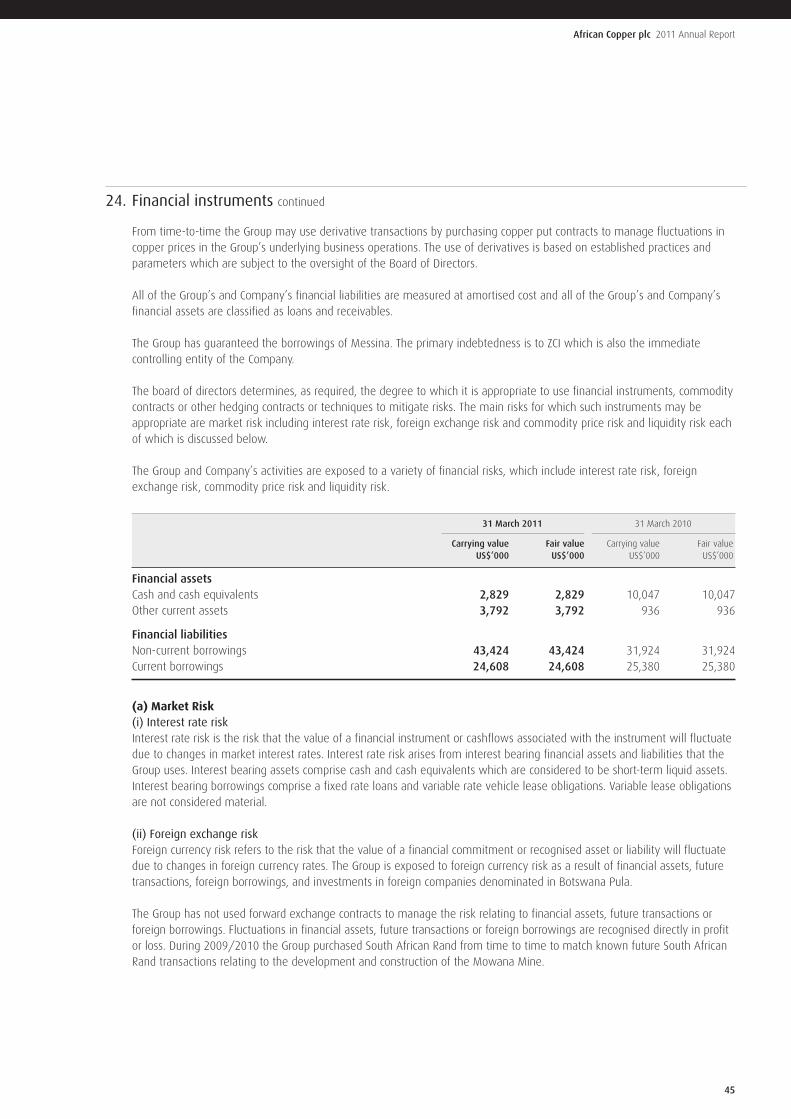
45
African Copper plc 2011 Annual Report
24. Financial instruments continued
From time-to-time the Group may use derivative transactions by purchasing copper put contracts to manage fluctuations incopper prices in the Group’s underlying business operations. The use of derivatives is based on established practices andparameters which are subject to the oversight of the Board of Directors.
All of the Group’s and Company’s financial liabilities are measured at amortised cost and all of the Group’s and Company’sfinancial assets are classified as loans and receivables.
The Group has guaranteed the borrowings of Messina. The primary indebtedness is to ZCI which is also the immediatecontrolling entity of the Company.
The board of directors determines, as required, the degree to which it is appropriate to use financial instruments, commoditycontracts or other hedging contracts or techniques to mitigate risks. The main risks for which such instruments may beappropriate are market risk including interest rate risk, foreign exchange risk and commodity price risk and liquidity risk eachof which is discussed below.
The Group and Company’s activities are exposed to a variety of financial risks, which include interest rate risk, foreignexchange risk, commodity price risk and liquidity risk.
31 March 2011 31 March 2010
Carrying value Fair value Carrying value Fair valueUS$’000 US$’000 US$’000 US$’000
Financial assetsCash and cash equivalents 2,829 2,829 10,047 10,047Other current assets 3,792 3,792 936 936
Financial liabilitiesNon-current borrowings 43,424 43,424 31,924 31,924Current borrowings 24,608 24,608 25,380 25,380
(a) Market Risk(i) Interest rate riskInterest rate risk is the risk that the value of a financial instrument or cashflows associated with the instrument will fluctuatedue to changes in market interest rates. Interest rate risk arises from interest bearing financial assets and liabilities that theGroup uses. Interest bearing assets comprise cash and cash equivalents which are considered to be short-term liquid assets.Interest bearing borrowings comprise a fixed rate loans and variable rate vehicle lease obligations. Variable lease obligationsare not considered material.
(ii) Foreign exchange riskForeign currency risk refers to the risk that the value of a financial commitment or recognised asset or liability will fluctuatedue to changes in foreign currency rates. The Group is exposed to foreign currency risk as a result of financial assets, futuretransactions, foreign borrowings, and investments in foreign companies denominated in Botswana Pula.
The Group has not used forward exchange contracts to manage the risk relating to financial assets, future transactions orforeign borrowings. Fluctuations in financial assets, future transactions or foreign borrowings are recognised directly in profitor loss. During 2009/2010 the Group purchased South African Rand from time to time to match known future South AfricanRand transactions relating to the development and construction of the Mowana Mine.
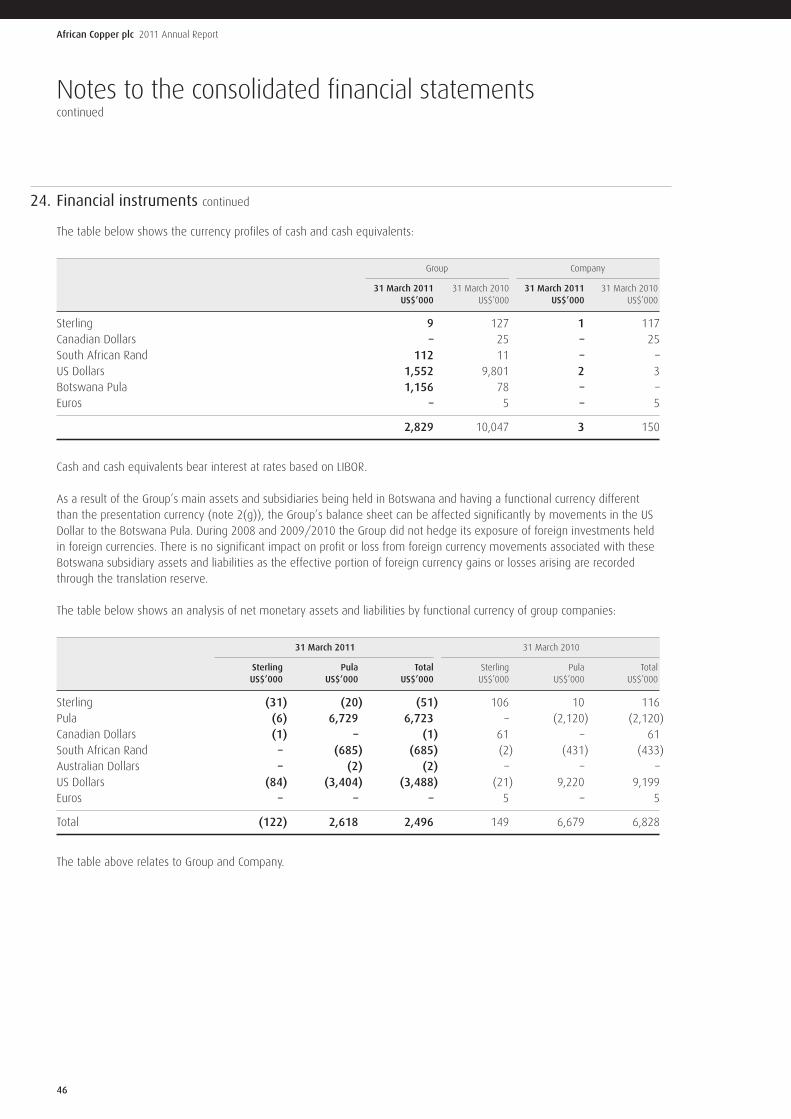
African Copper plc 2011 Annual Report
46
Notes to the consolidated financial statementscontinued
24. Financial instruments continued
The table below shows the currency profiles of cash and cash equivalents:
Group Company
31 March 2011 31 March 2010 31 March 2011 31 March 2010US$’000 US$’000 US$’000 US$’000
Sterling 9 127 1 117Canadian Dollars – 25 – 25South African Rand 112 11 – –US Dollars 1,552 9,801 2 3Botswana Pula 1,156 78 – –Euros – 5 – 5
2,829 10,047 3 150
Cash and cash equivalents bear interest at rates based on LIBOR.
As a result of the Group’s main assets and subsidiaries being held in Botswana and having a functional currency differentthan the presentation currency (note 2(g)), the Group’s balance sheet can be affected significantly by movements in the USDollar to the Botswana Pula. During 2008 and 2009/2010 the Group did not hedge its exposure of foreign investments heldin foreign currencies. There is no significant impact on profit or loss from foreign currency movements associated with theseBotswana subsidiary assets and liabilities as the effective portion of foreign currency gains or losses arising are recordedthrough the translation reserve.
The table below shows an analysis of net monetary assets and liabilities by functional currency of group companies:
31 March 2011 31 March 2010
Sterling Pula Total Sterling Pula TotalUS$’000 US$’000 US$’000 US$’000 US$’000 US$’000
Sterling (31) (20) (51) 106 10 116Pula (6) 6,729 6,723 – (2,120) (2,120)Canadian Dollars (1) – (1) 61 – 61South African Rand – (685) (685) (2) (431) (433)Australian Dollars – (2) (2) – – –US Dollars (84) (3,404) (3,488) (21) 9,220 9,199Euros – – – 5 – 5
Total (122) 2,618 2,496 149 6,679 6,828
The table above relates to Group and Company.
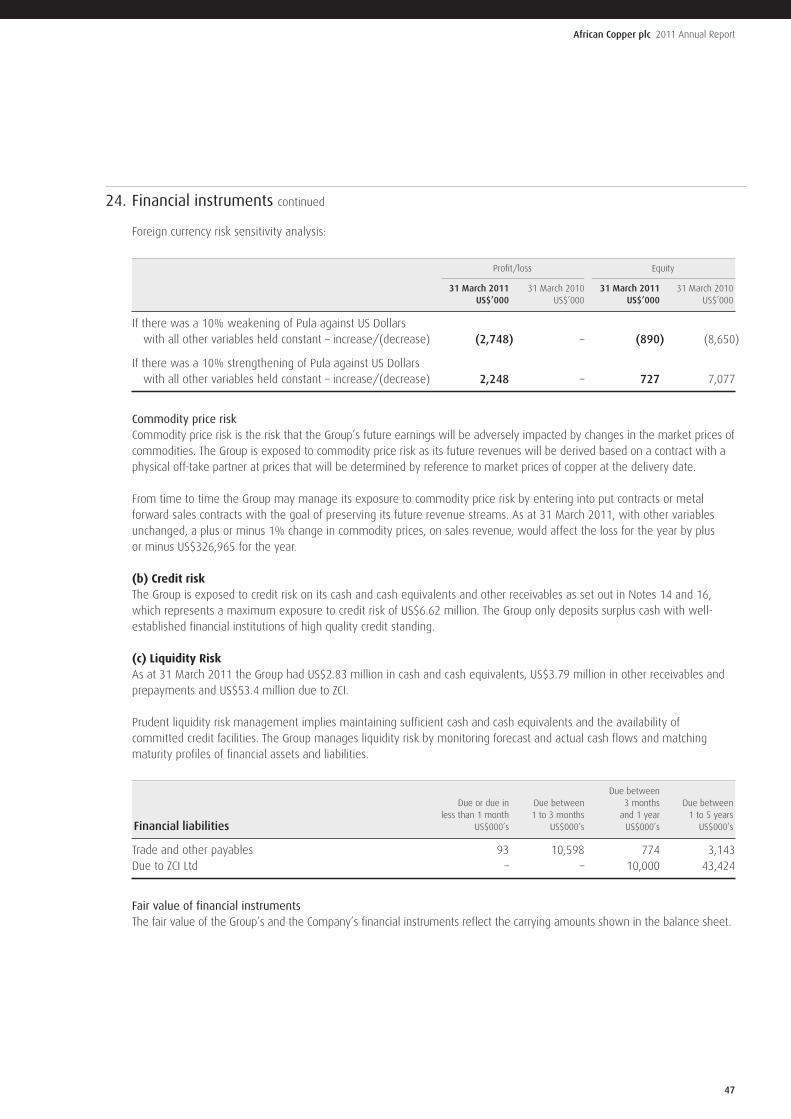
47
African Copper plc 2011 Annual Report
24. Financial instruments continued
Foreign currency risk sensitivity analysis:
Profit/loss Equity
31 March 2011 31 March 2010 31 March 2011 31 March 2010US$’000 US$’000 US$’000 US$’000
If there was a 10% weakening of Pula against US Dollarswith all other variables held constant – increase/(decrease) (2,748) – (890) (8,650)
If there was a 10% strengthening of Pula against US Dollarswith all other variables held constant – increase/(decrease) 2,248 – 727 7,077
Commodity price riskCommodity price risk is the risk that the Group’s future earnings will be adversely impacted by changes in the market prices ofcommodities. The Group is exposed to commodity price risk as its future revenues will be derived based on a contract with aphysical off-take partner at prices that will be determined by reference to market prices of copper at the delivery date.
From time to time the Group may manage its exposure to commodity price risk by entering into put contracts or metalforward sales contracts with the goal of preserving its future revenue streams. As at 31 March 2011, with other variablesunchanged, a plus or minus 1% change in commodity prices, on sales revenue, would affect the loss for the year by plusor minus US$326,965 for the year.
(b) Credit riskThe Group is exposed to credit risk on its cash and cash equivalents and other receivables as set out in Notes 14 and 16,which represents a maximum exposure to credit risk of US$6.62 million. The Group only deposits surplus cash with well-established financial institutions of high quality credit standing.
(c) Liquidity RiskAs at 31 March 2011 the Group had US$2.83 million in cash and cash equivalents, US$3.79 million in other receivables andprepayments and US$53.4 million due to ZCI.
Prudent liquidity risk management implies maintaining sufficient cash and cash equivalents and the availability ofcommitted credit facilities. The Group manages liquidity risk by monitoring forecast and actual cash flows and matchingmaturity profiles of financial assets and liabilities.
Due betweenDue or due in Due between 3 months Due between
less than 1 month 1 to 3 months and 1 year 1 to 5 yearsFinancial liabilities US$000’s US$000’s US$000’s US$000’s
Trade and other payables 93 10,598 774 3,143Due to ZCI Ltd – – 10,000 43,424
Fair value of financial instrumentsThe fair value of the Group’s and the Company’s financial instruments reflect the carrying amounts shown in the balance sheet.
African Copper plc 2011 Annual Report
48
Notes to the consolidated financial statementscontinued
25. Contingent liability
The directors are not aware of any proceedings which are threatened or pending, which may have a material effect on ourfinancial position, results of operations or liquidity. Specific claims against the Company, which arise in the ordinary course ofbusiness, have been provided for where the directors consider it probable that the claims will be settled.
26. Ultimate controlling party
The directors regard ZCI, a company registered in Bermuda, as the Company’s immediate parent undertaking. Copies ofthe accounts of ZCI Limited, the smallest and largest group for which accounts are prepared, may be obtained from theZCI Limited registered office.
The Company’s ultimate controlling party is The Copperbelt Development Foundation.

African Copper plcRegistered in England and Wales no. 5041259
Contents
Chairman’s statement 1
Chief Executive’s review of operations 3
Financial review 6
Director’s report 11
Statement of Directors’ responsibilities 14
Statement of corporate governance 15
Directors’ remuneration report 16
Independent Auditor’s report to themembers of African Copper plc 18
Consolidated statement of comprehensive income 19
Balance sheets 20
Consolidated statement of changes in equity 21
Company statement of changes in equity 22
Consolidated cash flow statement 23
Company cash flow statement 24
Notes to the consolidated financial statements 25
Des
igne
d an
d pr
oduc
ed b
yfo
urt
hqu
arte
r
Annual ReportFor the year ended
31 March 2011
African Copper100 Pall MallSt. James'sLondonSW1Y 5HPUnited Kingdom
www.africancopper.com