Embed Size (px)
Citation preview
ANNUAL REPORT
31 | DECEMBER | 2015
About CI Financial 1
Ten-Year Historical Financial Highlights 2
Letter to Shareholders 4
Corporate Social Responsibility 22
Subsidiary Profiles 24
Management’s Discussion and Analysis 27
Consolidated Financial Statements 60
Notes to Consolidated Financial Statements 66
Corporate Directory 101
Corporate Information 102
| TABLE OF CONTENTS |
ANNUAL REPORT
31 | DECEMBER | 2015
Annual Report | 1 | December 31, 2015
CI Financial Corp. is a diversified wealth management firm and Canada’s third-largest investment fund company by assets
under management. Independent and Canadian-owned, CI provides a comprehensive selection of top-quality investment
products and services. CI has two million clients and approximately $143 billion in assets (at March 31, 2016). CI operates
primarily through subsidiaries CI Investments Inc., Assante Wealth Management (Canada) Ltd., Stonegate Private Counsel LP,
and First Asset Capital Corp.
CI Investments is one of the country’s largest investment managers and offers a wide selection of funds under brands that
include CI, Black Creek, Cambridge, Harbour, Signature, Synergy, Portfolio Series, Portfolio Select Series, and G5|20 Series.
Assante Wealth Management provides financial advisory services through a national network of 750 professional financial
advisors. Stonegate Private Counsel, a division of CI Private Counsel LP, provides wealth planning services to high net worth
individuals and families.
First Asset is a leader in providing actively managed and factor-based ETFs to the Canadian marketplace, and manages a
suite of mutual funds and closed-end funds.
CI also owns a majority stake in Marret Asset Management Inc., a Toronto-based fixed-income investment manager, and
interests in Altrinsic Global Advisors, LLC, a global asset manager based in Greenwich, Connecticut, and Lawrence Park
Capital Partners Ltd. of Toronto, an alternative asset manager specializing in fixed-income strategies.
Annual Report | 2 | December 31, 2015
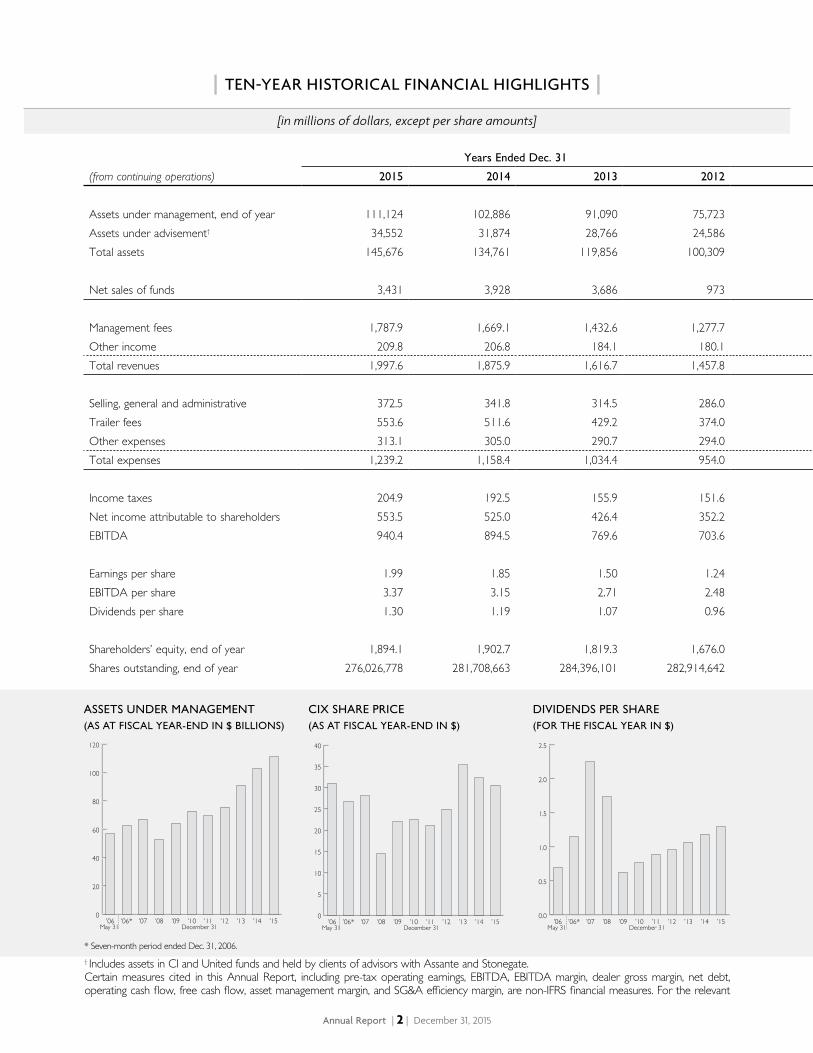
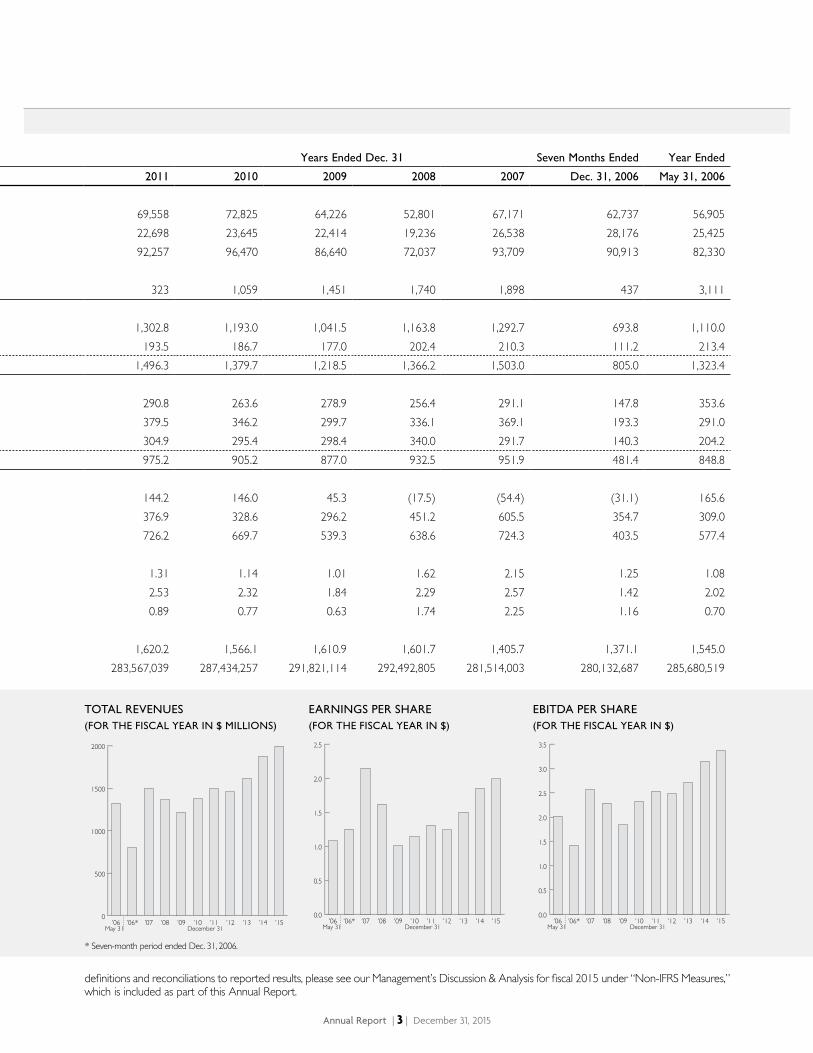
| TEN-YEAR HISTORICAL FINANCIAL HIGHLIGHTS |
[in millions of dollars, except per share amounts]
Years Ended Dec. 31 Years Ended Dec. 31 Seven Months Ended Year Ended
(from continuing operations) 2015 2014 2013 2012 2011 2010 2009 2008 2007 Dec. 31, 2006 May 31, 2006
Assets under management, end of year 111,124 102,886 91,090 75,723 69,558 72,825 64,226 52,801 67,171 62,737 56,905Assets under advisement† 34,552 31,874 28,766 24,586 22,698 23,645 22,414 19,236 26,538 28,176 25,425Total assets 145,676 134,761 119,856 100,309 92,257 96,470 86,640 72,037 93,709 90,913 82,330
Net sales of funds 3,431 3,928 3,686 973 323 1,059 1,451 1,740 1,898 437 3,111
Management fees 1,787.9 1,669.1 1,432.6 1,277.7 1,302.8 1,193.0 1,041.5 1,163.8 1,292.7 693.8 1,110.0Other income 209.8 206.8 184.1 180.1 193.5 186.7 177.0 202.4 210.3 111.2 213.4Total revenues 1,997.6 1,875.9 1,616.7 1,457.8 1,496.3 1,379.7 1,218.5 1,366.2 1,503.0 805.0 1,323.4
Selling, general and administrative 372.5 341.8 314.5 286.0 290.8 263.6 278.9 256.4 291.1 147.8 353.6Trailer fees 553.6 511.6 429.2 374.0 379.5 346.2 299.7 336.1 369.1 193.3 291.0Other expenses 313.1 305.0 290.7 294.0 304.9 295.4 298.4 340.0 291.7 140.3 204.2Total expenses 1,239.2 1,158.4 1,034.4 954.0 975.2 905.2 877.0 932.5 951.9 481.4 848.8
Income taxes 204.9 192.5 155.9 151.6 144.2 146.0 45.3 (17.5) (54.4) (31.1) 165.6Net income attributable to shareholders 553.5 525.0 426.4 352.2 376.9 328.6 296.2 451.2 605.5 354.7 309.0EBITDA 940.4 894.5 769.6 703.6 726.2 669.7 539.3 638.6 724.3 403.5 577.4
Earnings per share 1.99 1.85 1.50 1.24 1.31 1.14 1.01 1.62 2.15 1.25 1.08EBITDA per share 3.37 3.15 2.71 2.48 2.53 2.32 1.84 2.29 2.57 1.42 2.02Dividends per share 1.30 1.19 1.07 0.96 0.89 0.77 0.63 1.74 2.25 1.16 0.70
Shareholders’ equity, end of year 1,894.1 1,902.7 1,819.3 1,676.0 1,620.2 1,566.1 1,610.9 1,601.7 1,405.7 1,371.1 1,545.0Shares outstanding, end of year 276,026,778 281,708,663 284,396,101 282,914,642 283,567,039 287,434,257 291,821,114 292,492,805 281,514,003 280,132,687 285,680,519
May 31 December 31
0
20
40
60
80
100
120
’15’14’13’12’11’10’09’08’07’06*’06
ASSETS UNDER MANAGEMENT (AS AT FISCAL YEAR-END IN $ BILLIONS)
May 31 December 31
0
5
10
15
20
25
30
35
40
’15’14’13’12’11’10’09’08’07’06*’06
CIX SHARE PRICE(AS AT FISCAL YEAR-END IN $)
May 31 December 31
0.0
0.5
1.0
1.5
2.0
2.5
’15’14’13’12’11’10’09’08’07’06*’06
DIVIDENDS PER SHARE(FOR THE FISCAL YEAR IN $)
† Includes assets in CI and United funds and held by clients of advisors with Assante and Stonegate. Certain measures cited in this Annual Report, including pre-tax operating earnings, EBITDA, EBITDA margin, dealer gross margin, net debt, operating cash flow, free cash flow, asset management margin, and SG&A efficiency margin, are non-IFRS financial measures. For the relevant
* Seven-month period ended Dec. 31, 2006.
Annual Report | 3 | December 31, 2015
Years Ended Dec. 31 Years Ended Dec. 31 Seven Months Ended Year Ended
(from continuing operations) 2015 2014 2013 2012 2011 2010 2009 2008 2007 Dec. 31, 2006 May 31, 2006
Assets under management, end of year 111,124 102,886 91,090 75,723 69,558 72,825 64,226 52,801 67,171 62,737 56,905Assets under advisement† 34,552 31,874 28,766 24,586 22,698 23,645 22,414 19,236 26,538 28,176 25,425Total assets 145,676 134,761 119,856 100,309 92,257 96,470 86,640 72,037 93,709 90,913 82,330
Net sales of funds 3,431 3,928 3,686 973 323 1,059 1,451 1,740 1,898 437 3,111
Management fees 1,787.9 1,669.1 1,432.6 1,277.7 1,302.8 1,193.0 1,041.5 1,163.8 1,292.7 693.8 1,110.0Other income 209.8 206.8 184.1 180.1 193.5 186.7 177.0 202.4 210.3 111.2 213.4Total revenues 1,997.6 1,875.9 1,616.7 1,457.8 1,496.3 1,379.7 1,218.5 1,366.2 1,503.0 805.0 1,323.4
Selling, general and administrative 372.5 341.8 314.5 286.0 290.8 263.6 278.9 256.4 291.1 147.8 353.6Trailer fees 553.6 511.6 429.2 374.0 379.5 346.2 299.7 336.1 369.1 193.3 291.0Other expenses 313.1 305.0 290.7 294.0 304.9 295.4 298.4 340.0 291.7 140.3 204.2Total expenses 1,239.2 1,158.4 1,034.4 954.0 975.2 905.2 877.0 932.5 951.9 481.4 848.8
Income taxes 204.9 192.5 155.9 151.6 144.2 146.0 45.3 (17.5) (54.4) (31.1) 165.6Net income attributable to shareholders 553.5 525.0 426.4 352.2 376.9 328.6 296.2 451.2 605.5 354.7 309.0EBITDA 940.4 894.5 769.6 703.6 726.2 669.7 539.3 638.6 724.3 403.5 577.4
Earnings per share 1.99 1.85 1.50 1.24 1.31 1.14 1.01 1.62 2.15 1.25 1.08EBITDA per share 3.37 3.15 2.71 2.48 2.53 2.32 1.84 2.29 2.57 1.42 2.02Dividends per share 1.30 1.19 1.07 0.96 0.89 0.77 0.63 1.74 2.25 1.16 0.70
Shareholders’ equity, end of year 1,894.1 1,902.7 1,819.3 1,676.0 1,620.2 1,566.1 1,610.9 1,601.7 1,405.7 1,371.1 1,545.0Shares outstanding, end of year 276,026,778 281,708,663 284,396,101 282,914,642 283,567,039 287,434,257 291,821,114 292,492,805 281,514,003 280,132,687 285,680,519
May 31 December 31
0
500
1000
1500
2000
’15’14’13’12’11’10’09’08’07’06*’06
TOTAL REVENUES (FOR THE FISCAL YEAR IN $ MILLIONS)
May 31 December 31
0.0
0.5
1.0
1.5
2.0
2.5
’15’14’13’12’11’10’09’08’07’06*’06
EARNINGS PER SHARE (FOR THE FISCAL YEAR IN $)
May 31 December 31
0.0
0.5
1.0
1.5
2.0
2.5
3.0
3.5
’15’14’13’12’11’10’09’08’07’06*’06
EBITDA PER SHARE (FOR THE FISCAL YEAR IN $)
definitions and reconciliations to reported results, please see our Management’s Discussion & Analysis for fiscal 2015 under “Non-IFRS Measures,” which is included as part of this Annual Report.
* Seven-month period ended Dec. 31, 2006.

Annual Report | 4 | December 31, 2015
DEAR SHAREHOLDERS,
In 2015, your company once again recorded excellent results. Assets under management grew to an all-time high, ending
the year at $111.1 billion. We also achieved record levels of gross sales, revenues, and profitability.
These returns were achieved in the face of increasingly volatile global financial markets. CI made gains in a year when the
Canadian equity market fell and U.S. and global markets were flat. Importantly, our portfolio managers were good stewards
of our clients’ capital in this uncertain environment.
CI has a history of managing through periods of significant turmoil in financial markets to achieve strong long-term growth.
Even as global confidence remains subdued and our industry becomes increasingly competitive, CI is well positioned for
continued prosperity. We combine financial strength and scale with the flexibility to change and adapt. And, we are making
sizable investments in the key drivers of our business.
This letter reviews the highlights of 2015 and our strategy for driving the company’s continued growth and success.
| LETTER TO SHAREHOLDERS |
Annual Report | 5 | December 31, 2015
CI’S LONG-TERM STRATEGY
Product quality and diversity. By providing a broad selection of high-quality products and services to Canadian investors,
we reduce our dependence on any single market sector or product and ensure we are well positioned to respond to the
changing needs of investors. More importantly, this enhances our relationships with advisors by allowing them to meet
their clients’ needs through a single supplier.
Talented and experienced investment managers. CI has significant assets under management, and we attract investment
managers who are among the best in the industry. We select portfolio managers based on a reputation for skilled
investment management, their long-term track records and “fit” with our existing lineup.
Multiple channels of distribution. CI distributes its products through a variety of channels, including Assante and other
dealers, as well as the institutional marketplace. Our size and scale allow us to offer a high level of support and service to
each channel, helping to strengthen existing relationships and develop new ones.
Operational efficiency. This encompasses the prudent and efficient operation and administration of our funds and our
company. Our capabilities enhance our ability to launch new products and offer a comprehensive product lineup.
Skill and knowledge. CI’s managers and employees possess the specialized knowledge and experience to anticipate client
needs, and develop appropriate products. CI enhances the skill and knowledge of its staff through training programs.
Annual Report | 6 | December 31, 2015
FINANCIAL HIGHLIGHTS
Strong asset growth
Assets under management reached a month-end and year-end record of $111.1 billion at December 31, 2015, a gain of
$8.2 billion or 8.0% from $102.9 billion a year earlier. In comparison, the S&P/TSX Composite Index declined 8.3% while
the FTSE TMX Canada Universe Bond Index was up 3.5%. The increase in CI’s assets was due to positive net sales, fund
performance and the acquisition of First Asset Capital Corp. late in the year. CI’s share of industry assets remained steady
at 9% and we continued to rank as the country’s third-largest fund company.
CI’s average assets under management for 2015 also reached a record level at $108.4 billion. This represents an increase of
$10.0 billion or 10.2% from $98.4 billion in 2014. This reflects the growth in our assets in the first half of the year and our
ability to maintain asset levels even as markets declined in the third and fourth quarters.
Meanwhile, assets under advisement, which includes Assante Wealth Management and Stonegate Private Counsel, were
up $2.7 billion or 8.5% to $34.6 billion. As a result, total assets at December 31, 2015, were $145.7 billion, which represents
growth of $10.9 billion or 8.1% over the 12-month period.
In the first two months of 2016, global stock markets experienced a sharp correction, which is generally defined as a drop
of 10% or more, before rebounding in March. The volatility had a negative impact on investor confidence in general and
affected CI’s sales and asset levels. However, CI’s assets under management recovered to $108.9 billion at March 31, 2016,
while total assets were $142.9 billion.
CI posted revenue for the year of $2.0 billion – a record, as we mentioned earlier, and an increase of 6.5% from $1.9 billion
the year before. Net income was $553.5 million, up 5.4% from $525.0 million in 2014. Earnings per share rose 7.6% to $1.99
from $1.85. The higher growth rate for earnings per share reflects the impact of share buybacks.
Annual Report | 7 | December 31, 2015
EBITDA, a key metric to assess the company’s profitability, reached an all-time high of $940.4 million or $3.37 per share.
On a per share basis, EBITDA was up 7.0% from $3.15 in 2014. As a percentage of revenue, EBITDA was 47.3%. While this was
a slight decline from the 2014 ratio of 47.8%, it is consistent with the levels of previous years. This indicates that CI has
generally been maintaining its profitability, even as we increased our spending in important areas of our business, including
portfolio management, sales and marketing, and technology.
Central to this has been our ongoing focus on controlling and managing the company’s expenses. In 2015, CI’s selling,
general and administrative (SG&A) expenses increased 9.0% – a lower rate than the 10.1% increase in average assets under
management. Therefore, as a percentage of average assets under management, SG&A expenses declined to 34.4 basis
points from 34.7 basis points in 2014.
Returning cash to shareholders
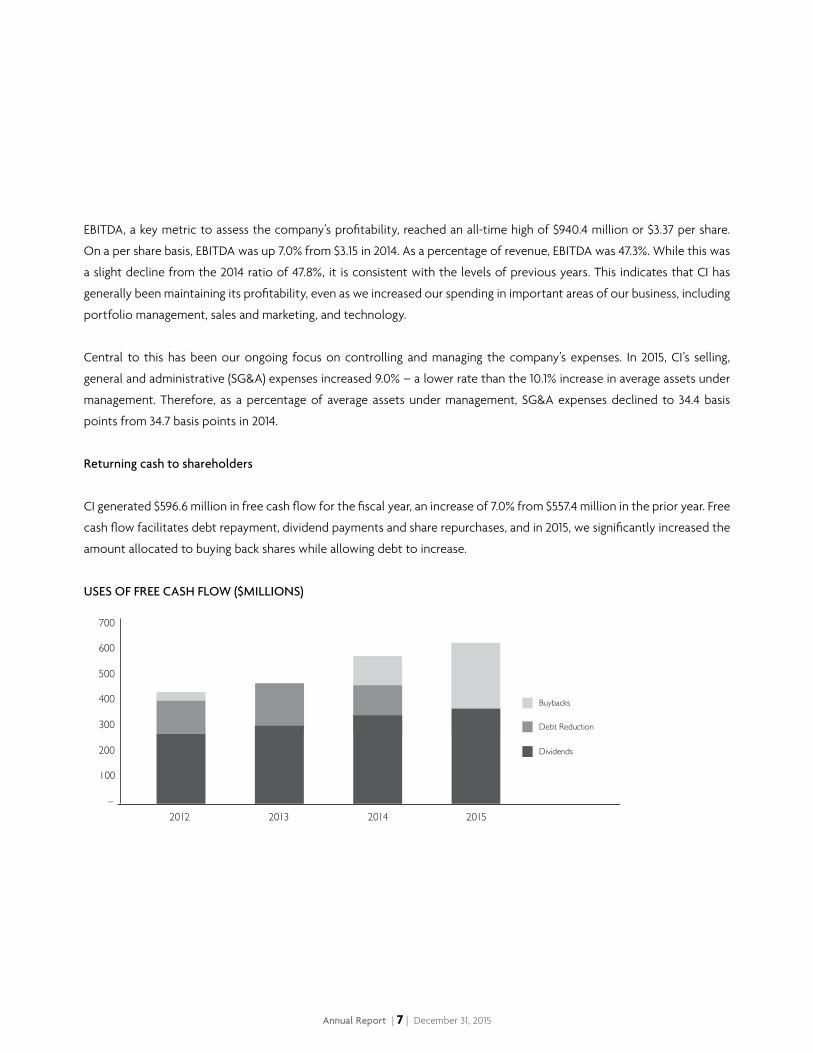
CI generated $596.6 million in free cash flow for the fiscal year, an increase of 7.0% from $557.4 million in the prior year. Free
cash flow facilitates debt repayment, dividend payments and share repurchases, and in 2015, we significantly increased the
amount allocated to buying back shares while allowing debt to increase.
USES OF FREE CASH FLOW ($MILLIONS)
700
600
500
400
300
200
100
–2014 20152012 2013
Buybacks
Debt Reduction
Dividends
Annual Report | 8 | December 31, 2015
Our target for CI’s net debt is 50 to 75% of EBITDA. In recent years, we had steadily reduced our debt, so that our net debt
of $185.2 million at the end of 2014 was just 20% of EBITDA. In December 2015, we completed a debenture offering with
a principal amount of $450 million, with the proceeds being used in part to repay $300 million in debentures and to pay
down amounts borrowed under our credit facility. Net debt stood at $433.1 million at December 31, 2015, equivalent to
48% of EBITDA and still below our target range. At this level, CI has capacity for increased leverage to finance acquisitions,
share buybacks or other initiatives.
In 2015, we spent $243.6 million to repurchase approximately 7.4 million CI shares. This compares to $108.1 million spent
on buybacks in the prior year. Dividends paid during the year amounted to $362.2 million, an increase of 8.0% from
$335.5 million paid in 2015. We increased the monthly dividend in June 2015, from $0.105 to $0.11 per share. On an annual
basis, the dividend now amounts to $1.32 per share, for a yield of 4.6% as of March 31, 2016.
The $362.2 million in dividends was equivalent to 61% of free cash flow, a ratio that is in line with previous years’ payouts.
Dividends and share buybacks together totalled $605.8 million in 2015, meaning that we returned all of CI’s free cash flow
to shareholders during the year.
This is in keeping with CI’s longstanding commitment to return excess cash to you, the owners of the company. From our
initial public offering in 1994 to December 31, 2015, CI has returned a total of $5.5 billion to shareholders, consisting of
$4.0 billion in dividends and distributions and $1.5 billion in share repurchases.
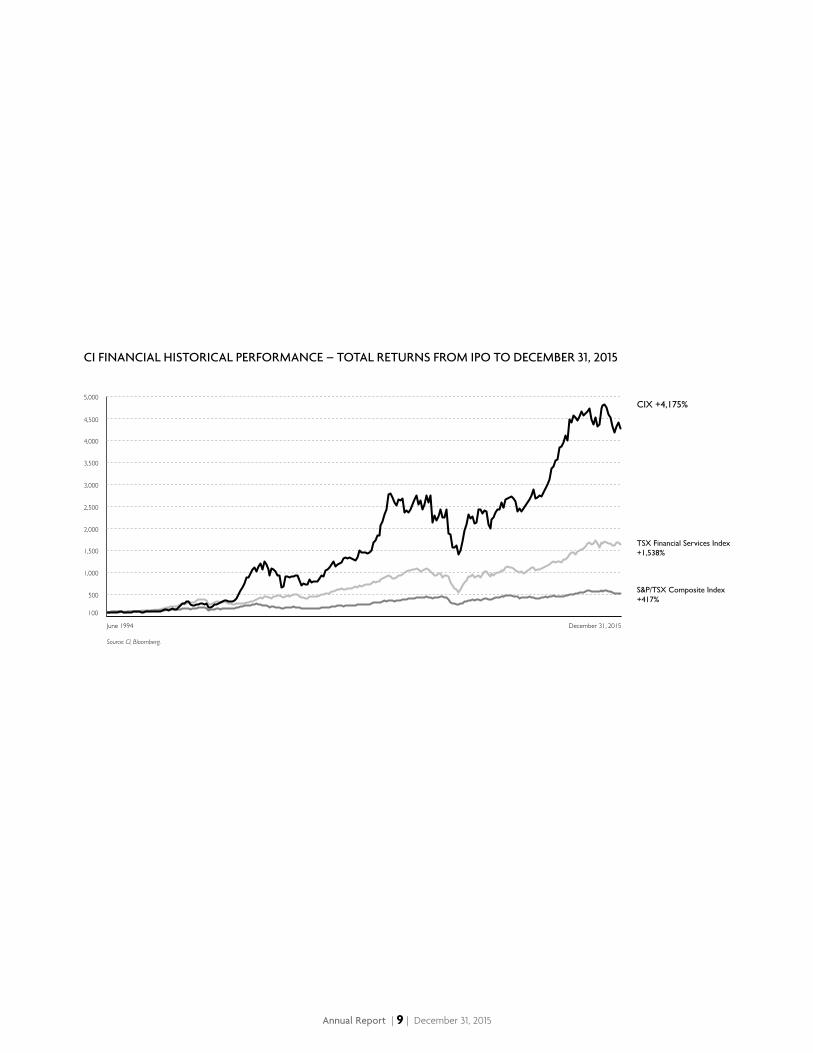
From the IPO to December 31, 2015, CI shares have recorded a cumulative return of 4,175%, for a compound annual growth
rate of 19%. Our shares have dramatically outperformed both the broader market, as the S&P/TSX Composite Index
returned 417%, and the Canadian financial sector, as the TSX Financial Services Index returned 1,538%. CI was the seventh
best performing stock on the S&P/TSX Composite Index over this period.
Annual Report | 9 | December 31, 2015
CI FINANCIAL HISTORICAL PERFORMANCE – TOTAL RETURNS FROM IPO TO DECEMBER 31, 2015
500
1,000
1,500
2,000
2,500
3,000
3,500
4,000
4,500
5,000
June 1994
Source: CI, Bloomberg.
December 31, 2015
100
CIX +4,175%
TSX Financial Services Index+1,538%
S&P/TSX Composite Index+417%
Annual Report | 10 | December 31, 2015
OPERATING HIGHLIGHTS
Consistency in sales
CI posted record gross sales of $15.4 billion in 2015, up 6.9% from $14.4 billion in 2014. Net sales were $3.4 billion and though
this was down from the prior year, it represented the third consecutive year in which CI has posted net sales above $3 billion.
CI ranked among the top five companies for net sales in 2015, and our share of industry net sales was approximately 6%. CI is
notable for the consistency of its sales over the long term, having had positive net sales in 89% of quarters since 1994.
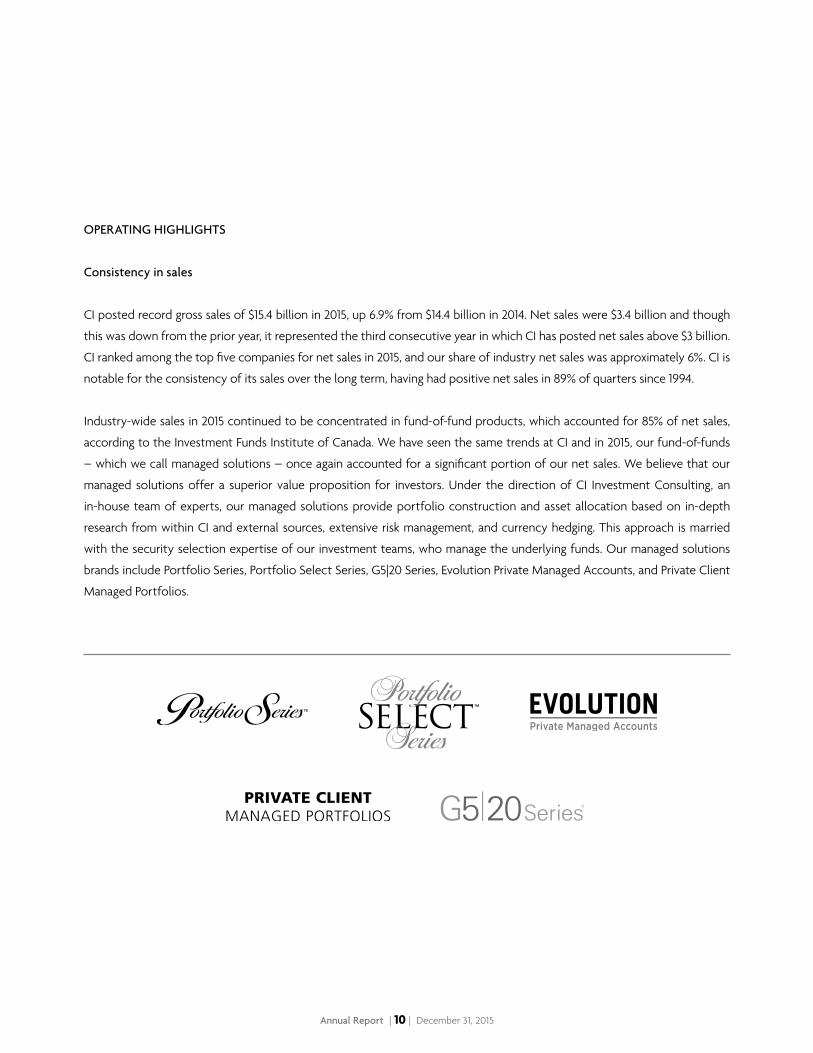
Industry-wide sales in 2015 continued to be concentrated in fund-of-fund products, which accounted for 85% of net sales,
according to the Investment Funds Institute of Canada. We have seen the same trends at CI and in 2015, our fund-of-funds
– which we call managed solutions – once again accounted for a significant portion of our net sales. We believe that our
managed solutions offer a superior value proposition for investors. Under the direction of CI Investment Consulting, an
in-house team of experts, our managed solutions provide portfolio construction and asset allocation based on in-depth
research from within CI and external sources, extensive risk management, and currency hedging. This approach is married
with the security selection expertise of our investment teams, who manage the underlying funds. Our managed solutions
brands include Portfolio Series, Portfolio Select Series, G5|20 Series, Evolution Private Managed Accounts, and Private Client
Managed Portfolios.
Annual Report | 11 | December 31, 2015
The success of these products can be seen in their consistent performance – with 90% of our managed solutions’ assets under
management being ranked first or second quartile over the 10 years ending December 31, 2015 – and industry recognition that
includes three Morningstar Awards. CI’s assets under management in managed solutions have grown 180% over the five years
ending December 31, 2015, and our company is second in the industry for total assets within fund-of-fund products.
In addition, the CI Private Investment Management program and CI Institutional Asset Management (CIIAM) made significant
contributions to our net sales. Private Investment Management, aimed at the mass affluent and higher net worth markets,
provides access to our fund mandates, including managed solutions, with fee reductions for progressively larger accounts.
We will provide more details about CIIAM later in this letter. The high net worth and institutional markets are important
parts of CI’s strategy for growth.
High-quality products
CI has developed a high-quality and diverse product lineup that’s defined by a multi-manager approach and deep expertise
spanning all asset classes. Our comprehensive lineup is a competitive advantage for CI and it helps our clients to meet their
investment objectives in a world of market volatility and low fixed-income yields.
We are continually working to enhance our lineup and new products in 2015 included:
• CI U.S. Income US$ Pool and Cambridge U.S. Dividend US$ Fund, both U.S. dollar versions of existing mandates,
launched to meet the growing interest in U.S. dollar-denominated funds;
• Signature Real Estate Pool, a global equity fund focused on the real estate sector;
• Signature Preferred Share Pool, which offers concentrated exposure to preferred shares; and
• Signature Tactical Bond Pool, a global fixed-income fund with a focus on investment-grade securities.
Annual Report | 12 | December 31, 2015
Leading portfolio management expertise
Our product lineup is founded on the expertise and talent of our portfolio management teams. Our multi-manager structure
features internal and external investment teams that operate independently of one another. Our in-house portfolio
management divisions are Signature Global Asset Management, Cambridge Global Asset Management, CI Investment
Consulting, Harbour Advisors and First Asset. CI holds a majority interest in Marret Asset Management and minority
interests in Altrinsic Global Advisors of Greenwich, Connecticut, and Lawrence Park Asset Management of Toronto.
CI’S PORTFOLIO MANAGEMENT TEAMS AND SUB-ADVISORS
Annual Report | 13 | December 31, 2015
In 2015, CI continued to re-invest in our internal portfolio management capabilities by adding staff to our in-house
investment teams. We also invested in technology to improve our productivity and enhance our investment processes.
We expect to reach a milestone in the second quarter of 2016 with the planned implementation of a new portfolio
management system for our internal portfolio management teams.
Other notable developments during the year focused on the rapidly growing Chinese and Asian markets. Signature opened
an office in Hong Kong to lead the team’s research efforts in that region. In addition, CI became the first Canadian institution
to be awarded a Renminbi Qualified Foreign Institutional Investor (“RQFII”) licence by the China Securities Regulatory
Commission, which allows CI to invest directly in the domestic renminbi-denominated fixed-income and equity markets in
China. These investments are managed by Signature.
Award-winning performance
CI’s portfolio managers have achieved above-average returns over the long term. As of December 31, 2015, 73% of CI’s
long-term assets under management were ranked first or second quartile over 10 years. Highlights included funds managed
by Black Creek Investment Management, where 100% of assets were first or second quartile for the 10-year period, while
87% of assets managed by Signature performed in the top half of their peer groups over 10 years.
The performance of our investment managers and funds was recognized in 2015 through numerous industry awards. Three
of our portfolio managers received prestigious “fund manager of the year” awards from Morningstar Canada: Richard
Jenkins of Black Creek Investment Management was named Morningstar Foreign Equity Fund Manager of the Year, while
Greg Dean and Stephen Groff of Cambridge Global Asset Management were co-winners of the Breakout Fund Manager
of the Year award. In addition, seven CI employees were named “TopGun Investment Minds” by the global advisory firm
Brendan Wood International in its announcement of the 2015-2016 TopGun Investment Minds and Canada’s TopGun
(Best in Class) Investment Teams. CI was ranked as the number two TopGun Investment Team of the year in the poll of
sell-side professionals. CI’s TopGun Investment Minds are Brandon Snow and Dean and Groff of Cambridge, and Stéphane
Champagne, Malcolm White, Hoa Hong and Jeremy Yeung of Signature.
Achieved for the year 2015
Annual Report | 14 | December 31, 2015
CI funds also received the following recognition:
• Cambridge Canadian Equity Corporate Class and Cambridge Pure Canadian Equity Fund were category winners at
the 2015 Morningstar Awards.
• Thirty-two CI mutual and segregated funds received FundGrade A+ Awards, which are awarded by Fundata Canada
and based on consistent, outstanding risk-adjusted performance. This was the third consecutive year that CI won
more of these awards than any other fund company.
• CI Global Small Companies Fund was a winner of a Lipper Fund Award for its risk-adjusted returns over 10 years.
Building enduring partnerships
CI has long recognized the importance of having multiple channels of distribution for our products and our ability to
diversify our distribution has been crucial to our growth. This continues to be a cornerstone of our strategy, as can be seen
in the acquisition of First Asset.
We have successfully built enduring relationships with financial advisors, other financial institutions and institutional
investors across Canada who offer our products to their clients. One advantage for CI is our size and financial strength,
which provides reassurance and security to our partners.
Our distribution strategy has these primary elements:
• Building Assante into the premier wealth planning organization in Canada;
• Growing our retail assets under management through increasing service and support to third-party advisors; and
• Growing our institutional assets through CI Institutional Asset Management.
Annual Report | 15 | December 31, 2015
Assante and Stonegate
Our Assante business includes our full-service investment and mutual fund dealers, operating as Assante Wealth
Management, and our high net worth discretionary investment platform, Stonegate Private Counsel. In 2015, we continued
to focus on initiatives supporting broad strategies to grow our presence in the mass affluent and high net worth market, as
well as creating a robust dealer platform to drive growth.
During 2015, our assets under advisement increased by 8.5% to $34.6 billion, reflecting strong investment performance,
increasing levels of investment from our clients and targeted recruiting of advisors. Net new investment from clients
increased 14.5% to $1.3 billion. Both the asset and sales levels for Assante represented new highs.
The financial advisory business operates in a highly regulated environment in which compliance and technology costs
related to increasing regulatory requirements are accelerating the consolidation of industry participants, or even exits
from the business. In addition, the Canadian marketplace is maturing and the demand for advisory services is changing.
Canadians are increasingly seeking advice on their entire financial situation – wealth preservation and investments, tax
planning, retirement and estate planning and risk management.
Assante and its advisors are particularly well positioned to benefit from this evolving environment through our focus
on managed money solutions and our consistent delivery of complete wealth management services to our clients. We
provide exceptional value in the services we offer. A significant portion of our assets are already administered under fee-
disclosed arrangements, meaning that Assante is well prepared for both the new disclosure rules and other fee changes
that regulators are considering.
Operating scale becomes increasingly important as firms deal with increasing costs and service expectations from clients.
At Assante, we benefit from the confidence and security our clients realize through the size and scale of CI and leverage
the operating efficiency of our entire organization through our shared services infrastructure.
Annual Report | 16 | December 31, 2015
Assante has continued to grow through prudent management of clients’ accounts, increasing levels of investment from these
clients and the attraction of new clients. This has resulted, in part, from the successful execution of the following strategies:
• Our continuing investment in support resources. We expanded our team of experts in communities across Canada
by 25% in 2015 to assist our advisors and their clients with their fully integrated, or complete wealth management
needs;
• Expanding our training and development programs at all levels of our organization to deliver a superior wealth
planning experience for our clients;
• Investing heavily in technology to support the delivery of a consistent value proposition to clients; and
• Elevating the awareness of Assante – who we are and what we stand for – through our advertising and branding
programs on the national and local levels.
These factors and Assante’s focus on executing on its broad strategies have resulted in a strong and growing presence in
the mass affluent and high net worth marketplace. At December 31, 2015, 62% or $21.3 billion of Assante’s assets were with
families investing at least $500,000 with Assante advisors. In addition, the fastest-growing segment of Assante’s business is
with families investing over $1 million with its advisors.
Assante’s commitment to an all-encompassing approach to wealth management, backed by the financial strength and
security of CI, has again positioned Assante as one of Canada’s pre-eminent financial advisory firms.
Third-party distribution partners
CI has one of the industry’s largest sales and client services team to provide ongoing support to Assante and third-party
advisors who recommend our products to the clients. In 2015, we continued to build on our strategy of providing dedicated
sales staff and services tailored to the needs of advisors at various firms and within specific distribution channels. These
efforts have been supported by a significant increase over the last two years in the number of front-line sales and client
services staff.
Annual Report | 17 | December 31, 2015
CI provides extensive support to advisors to enhance their business and professional development. For example, CI was
an early proponent of helping advisors to understand and take action to adapt their practices to impending regulatory
changes. Our Strategic Business Development team continues to spearhead these efforts. In 2015, we hired additional
staff for the CI Tax, Retirement and Estate Planning team, a group of specialists who provide expert information and
commentary to advisors on those topics. To support its educational mission, the team launched its own website
(www.ci.com/trep) early in 2016.
CI also continued to make a major investment in providing first-class educational events for advisors. In 2015, more than
1,100 advisors attended CI’s fifth-annual Leadership Forum, a three-day conference for advisors. About 400 advisors and
assistants attended Assante’s annual advisor conference, the National Wealth Management Conference. Also in 2015,
CI held two national roadshows, in which select CI portfolio managers and other experts presented to advisors across
Canada, along with numerous other advisor educational meetings and training sessions.
CI Institutional Asset Management
CI Institutional Asset Management experienced 8% growth during 2015 with $16.5 billion in assets under management at
year-end. In a generally more difficult overall investment environment, the business had a strong year in terms of both new
clients and net sales.
CIIAM operates in two general institutional markets: Alliance, which involves sub-advising mandates or participating in
fund-of-fund programs at other financial institutions, and the more traditional area of pensions, foundations and
endowments. CIIAM continues to field a multi-manager, multi-product institutional lineup, which includes a balanced
mandate, a core Canadian equity mandate, a core bond plus strategy, a global equity mandate and a series of target-risk
and target-date funds.
Annual Report | 18 | December 31, 2015
Building our brands
In our increasingly competitive marketplace, strengthening awareness of our brands is an important part of supporting
our distribution partners and generating sales. Breaking through the clutter in today’s fragmented media environment can
be difficult and expensive. In 2015, CI Investments and Assante delivered smart and cost-effective advertising campaigns.
CI Investments produced a series of television commercials and online advertisements aimed at building brand awareness
and reinforcing the company’s positioning as a trusted provider of retirement solutions to Canadians. The centrepiece of
the campaign was a television commercial with the theme “You deserve a great retirement.” The television advertising
was focused on golf and curling coverage, which provide an excellent fit with potential clients. The campaign was very
well received and surveys have demonstrated a marked increase in brand awareness for CI Investments. Building on this
momentum, a new television and radio campaign was launched in 2016.
Assante continued its national and regional advertising campaigns in 2015 based on the “complete” theme that emphasizes
how Assante advisors provide advice addressing all aspects of a client’s financial situation. Assante’s commercials
accompanied various sports with a focus on hockey, where the programming included a “complete player” profile. Assante
renewed its national and regional campaigns for 2016.

Annual Report | 19 | December 31, 2015
PRINT AD – BILLBOARD – ON-LINE DIGITAL
ON-LINE DIGITAL
TELEVISIONCOMMERCIALS
TELEVISIONCOMMERCIALSTILLS
CI INVESTMENTS AND ASSANTE ADVERTISING CAMPAIGNS
Annual Report | 20 | December 31, 2015
First Asset acquisition
On November 30, 2015, CI completed the acquisition of First Asset, which has about $3 billion under management in a
lineup of exchange-traded and mutual funds. The acquisition broadened and diversified CI’s lineup of operating businesses
and gave CI entry into the rapidly growing ETF market through a successful firm with a proven management team. First
Asset was particularly attractive to us because of its leadership in the area of actively managed and factor-based ETFs and
its strong relationships with advisors in the brokerage channel.
First Asset is continuing to operate under its own management and sales and marketing teams, while benefiting from CI’s
financial strength and capabilities in investment management and administration. CI is supporting First Asset in launching
new products and we are exploring ways in which CI portfolio managers can be involved in First Asset funds. One such
example was announced in January with the appointment of Signature as portfolio advisor to a First Asset ETF focused on
the global financial services sector. This shows how ETFs can serve as another distribution platform for CI, and how CI’s
active management can serve to differentiate products within the ETF market.
OUTLOOK
As the first quarter of 2016 draws to a close, the global economy continues its long and slow recovery from the financial
crisis, and investor sentiment remains very cautious. Despite this environment, our industry has doubled its assets over
the past 10 years and continues to enjoy good prospects for growth. Investor Economics notes that funds remain the
investment vehicle of choice for Canadians, representing 35% of household financial wealth at the end of 2014 – exceeding
the share held in deposits for the first time. The research firm expects industry assets to double again by the year 2024.
Demographic trends, along with slow growth and low yields, mean that Canadians will continue to require what the CI
group of companies offer – in-depth financial advice and actively managed, high-quality investment products. The newly
elected federal government has instituted tax hikes and other changes aimed at higher-income earners, making expert
advice and smart investing more critical than ever for Canada’s affluent.
Annual Report | 21 | December 31, 2015
As a large, independent wealth management firm, CI is well positioned for continued success. Our financial strength gives us
the resources to re-invest in our business, improve our competitive standing and make further acquisitions as opportunities
arise. We have a strong presence in key distribution channels, positioning that we have enhanced with the addition of First
Asset. We are increasing the level of support we provide to advisors, in both day-to-day and value-added services. We
continue to build up our portfolio management expertise, augmenting a lineup that is already one of the best in Canada. We
continue to emphasize the growing mass affluent and high net worth markets through CI and through our advisory businesses,
Assante and Stonegate. The business model for Assante and Stonegate, which encompasses “complete” financial advice,
not only appeals to high net worth investors, but is attracting established, successful advisors to our company. And, as we
proceed with these initiatives, we will be maintaining our focus on operating efficiently throughout CI.
We thank our fund investors for putting their trust in our company. We also thank our business partners for their support,
our employees and portfolio managers for their dedication, and our shareholders for their confidence.
Sincerely,
William T. Holland Stephen A. MacPhail
Executive Chairman Chief Executive Officer
MARCH 31, 2016
EXECUTIVE TEAM UPDATE
In February 2016, CI announced that Stephen A MacPhail would be retiring as Chief Executive Officer on June 30, 2016
and that Peter W Anderson would replace him as CEO Sheila A Murray was named President effective immediately She
also continues as General Counsel and Secretary
Mr Anderson’s experience includes serving as Executive Vice-President, Chief Investment Officer and a member of the
Board of Directors of CI He was also CEO of CI Investments for seven years
Mr MacPhail leaves CI after a 22-year career that includes more than five years as CEO He has also held the positions of
President, Chief Operating Officer and Chief Financial Officer The Board of Directors, management and employees of CI
extend their sincere thanks to Mr MacPhail for his invaluable contributions to the growth and success of CI Since joining
the management team in 1994, Mr MacPhail has played a crucial role in building CI into one of the top firms in its industry
Annual Report | 22 | December 31, 2015
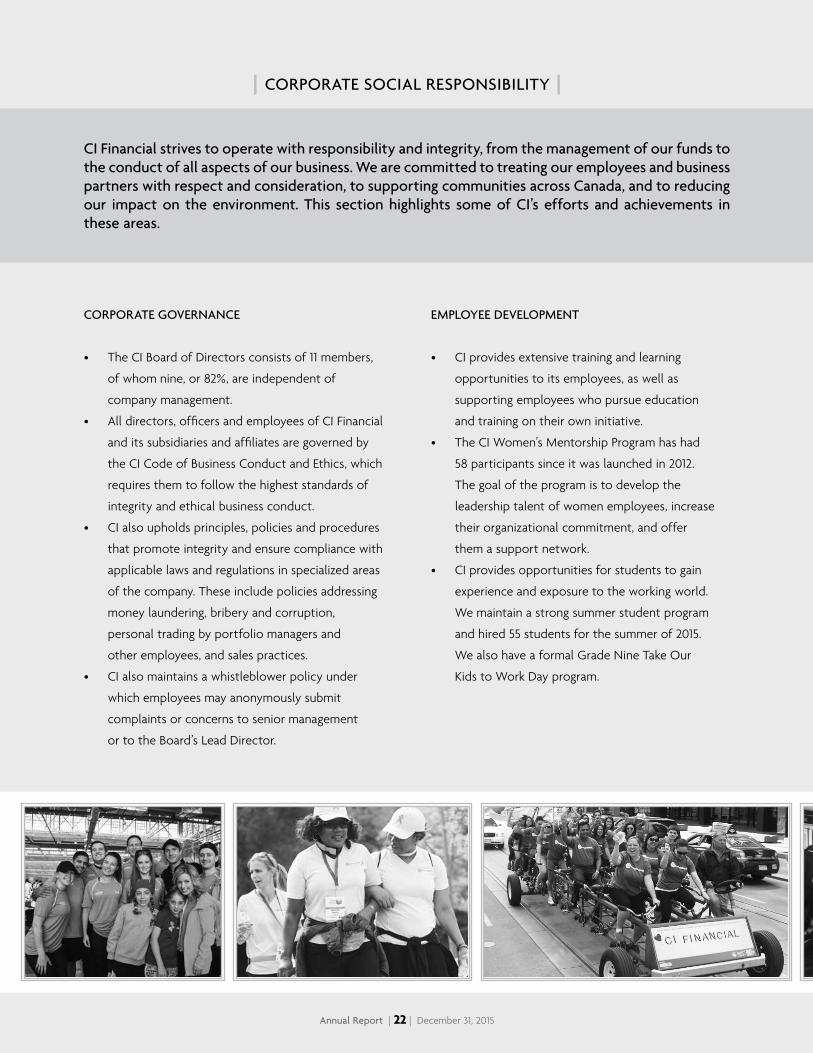
| CORPORATE SOCIAL RESPONSIBILITY |
CI Financial strives to operate with responsibility and integrity, from the management of our funds to the conduct of all aspects of our business We are committed to treating our employees and business partners with respect and consideration, to supporting communities across Canada, and to reducing our impact on the environment This section highlights some of CI’s efforts and achievements in these areas
CORPORATE GOVERNANCE
• The CI Board of Directors consists of 11 members,
of whom nine, or 82%, are independent of
company management.
• All directors, officers and employees of CI Financial
and its subsidiaries and affiliates are governed by
the CI Code of Business Conduct and Ethics, which
requires them to follow the highest standards of
integrity and ethical business conduct.
• CI also upholds principles, policies and procedures
that promote integrity and ensure compliance with
applicable laws and regulations in specialized areas
of the company. These include policies addressing
money laundering, bribery and corruption,
personal trading by portfolio managers and
other employees, and sales practices.
• CI also maintains a whistleblower policy under
which employees may anonymously submit
complaints or concerns to senior management
or to the Board’s Lead Director.
EMPLOYEE DEVELOPMENT
• CI provides extensive training and learning
opportunities to its employees, as well as
supporting employees who pursue education
and training on their own initiative.
• The CI Women’s Mentorship Program has had
58 participants since it was launched in 2012.
The goal of the program is to develop the
leadership talent of women employees, increase
their organizational commitment, and offer
them a support network.
• CI provides opportunities for students to gain
experience and exposure to the working world.
We maintain a strong summer student program
and hired 55 students for the summer of 2015.
We also have a formal Grade Nine Take Our
Kids to Work Day program.

Annual Report | 23 | December 31, 2015
COMMUNITY SUPPORT
• CI provides extensive support to Canadian
charitable organizations. In 2015, CI directly
donated $218,000 to causes that included The
OneWalk to Conquer Cancer, Holland Bloorview
Kids Rehabilitation Hospital, The Arthritis Society,
Pediatric Oncology Group of Ontario, Project
Sunshine Canada, and others. CI also funds
scholarships and other support for young adults
with the Children’s Aid Foundation.
• CI donated another $363,000 to charities
supported by our business partners, who include
advisors working across Canada.
• CI employees enthusiastically devote their time to
numerous worthy causes, with the support of the
company. Notably in 2015, CI and its employees
raised over $207,000 for The OneWalk to Conquer
Cancer, the second-largest amount raised by a
corporate team. Other causes included United
Way, Bay Street Hoops, Samaritan’s Purse and the
Heart and Stroke Foundation.
ENVIRONMENT
• CI was a leader in adopting the electronic
delivery of client communications such
as investment statements, transaction
confirmations, and disclosure documents, and
we have significantly reduced the printing and
mailing of these documents. CI has adopted
paperless technology in its back office and other
departments, allowing for documents to be
managed and processed electronically.
• CI is using “Notice and Access” for its 2016
annual meeting. Meeting materials will be
provided electronically, reducing the production
of printed documents.
Annual Report | 24 | December 31, 2015
| SUBSIDIARY PROFILES |
CI INVESTMENTS INC
CI Investments is one of Canada’s largest investment management companies, with approximately $108.9 billion in assets
under management (at March 31, 2016) on behalf of two million Canadians. We are known for our comprehensive and
high-quality selection of investment products and services, operational efficiency, and a broad lineup of leading portfolio
management teams. CI Investments has demonstrated a record of innovation and an ability to adapt to meet the changing
demands of the marketplace and its clients.
We partner with independent financial advisors and third-party institutions in the distribution of our products and services,
which include mutual funds, segregated funds, managed solutions, and alternative investments. Our brands include CI,
Black Creek, Cambridge, Harbour, Lawrence Park, Marret, Signature, Synergy, Portfolio Series, Portfolio Select Series, G5|20
Series, and CI Private Investment Management. In addition, we manage the Evolution Private Managed Accounts investment
program, which is available through advisors with Assante Wealth Management. We service the institutional marketplace
through a dedicated division, CI Institutional Asset Management.
CI’s strength is founded on the expertise and experience of its portfolio managers. Our managers, a mix of in-house teams
and sub-advisors, represent the full spectrum of investment disciplines, from value to growth. Our in-house investment
managers include: Signature Global Asset Management, Harbour Advisors, Cambridge Global Asset Management, and
CI Investment Consulting. CI and its managers have been recognized through 34 Morningstar Awards over the past 10 years.
CI has also been the recipient of 54 Lipper Fund Awards and 112 FundGrade A+ Awards.
Annual Report | 25 | December 31, 2015
ASSANTE WEALTH MANAGEMENT (CANADA) LIMITED
Assante Wealth Management is a leading provider of complete wealth management solutions for affluent Canadians.
With 750 advisors across Canada, our independent advisory network is one of the largest in the country. We serve over
300,000 clients nationwide, with $34.0 billion in assets under advisement (at March 31, 2016).
The success of Assante is closely linked to our advisors and the strong partnership we have developed with them. Backed
by a wealth of resources, including investment analysts, portfolio managers, tax lawyers, accountants, estate planning
and insurance specialists and wealth planners, Assante advisors provide a comprehensive and integrated approach to
wealth management.
We also support our advisors by providing sophisticated solutions, including Evolution Private Managed Accounts. This
program is managed by CI Investments and available exclusively through Assante advisors. For high net worth clients with
more complex wealth planning needs, Assante offers the Private Client Managed Portfolios.
Our services are offered through Assante Capital Management, an investment dealer, and Assante Financial Management,
a mutual fund dealer, which together operate under the brand name Assante Wealth Management. Stonegate Private
Counsel is a group of experienced professionals who provide wealth planning and intergenerational financial services to
high net worth individuals and families.
Annual Report | 26 | December 31, 2015
FIRST ASSET CAPITAL CORP
First Asset is an investment management company and an established leader in exchange-traded funds in the Canadian
marketplace. First Asset has $2.9 billion in assets under management (at March 31, 2016) in ETFs, as well as closed-end funds
and mutual funds.
First Asset’s focus is on delivering better risk-adjusted returns than the broad market through a comprehensive suite of smart
ETF solutions. The company has a track record of introducing market-leading approaches and investment methodologies.
First Asset was one of the first firms to offer broad, comprehensive factor-based investing to Canada, beginning with single
factor strategies focused on value and momentum.
Today, First Asset offers over 35 ETFs, which cover a variety of asset classes, all developed markets, and methodologies,
including:
• Smart beta – using methodologies based on factors such as company value, momentum or size;
• Active management – offering traditional active portfolio management by First Asset’s own investment team,
as well as sub-advisors;
• Covered call – using a covered call strategy aimed at reduced volatility;
• Core solutions – offering Canadian equity, U.S. equity and balanced mandates; and
• Fixed income – including index-based and actively managed portfolios.
In marketing its ETFs, the First Asset team works closely with financial advisors, providing information about company
products and assistance in portfolio construction that integrates ETFs. First Asset uses best-in-class portfolio software and
analytics to assist advisors in designing portfolios to help advisors achieve their clients’ financial goals.
Annual Report | 27 | December 31, 2015
MANAGEMENT’S DISCUSSION AND ANALYSIS
CI FINANCIAL CORP
31 | DECEMBER | 2015
Annual Report | 28 | December 31, 2015
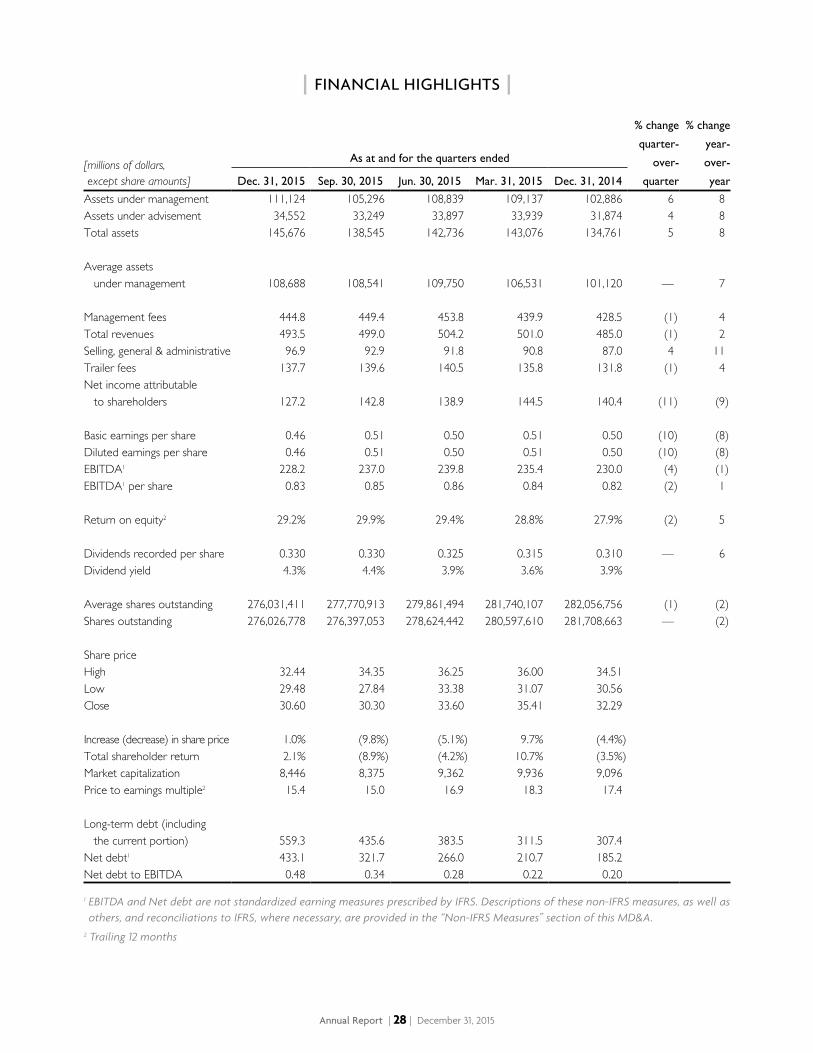
| FINANCIAL HIGHLIGHTS |
[ millions of dollars, except share amounts]
As at and for the quarters ended
% change
quarter-
over-
quarter
% change
year-
over-
yearDec. 31, 2015 Sep. 30, 2015 Jun. 30, 2015 Mar. 31, 2015 Dec. 31, 2014
Assets under management 111,124 105,296 108,839 109,137 102,886 6 8Assets under advisement 34,552 33,249 33,897 33,939 31,874 4 8Total assets 145,676 138,545 142,736 143,076 134,761 5 8
Average assets under management 108,688 108,541 109,750 106,531 101,120 — 7
Management fees 444.8 449.4 453.8 439.9 428.5 (1) 4Total revenues 493.5 499.0 504.2 501.0 485.0 (1) 2Selling, general & administrative 96.9 92.9 91.8 90.8 87.0 4 11Trailer fees 137.7 139.6 140.5 135.8 131.8 (1) 4Net income attributable to shareholders 127.2 142.8 138.9 144.5 140.4 (11) (9)
Basic earnings per share 0.46 0.51 0.50 0.51 0.50 (10) (8)Diluted earnings per share 0.46 0.51 0.50 0.51 0.50 (10) (8)EBITDA1 228.2 237.0 239.8 235.4 230.0 (4) (1)EBITDA1 per share 0.83 0.85 0.86 0.84 0.82 (2) 1
Return on equity2 29.2% 29.9% 29.4% 28.8% 27.9% (2) 5
Dividends recorded per share 0.330 0.330 0.325 0.315 0.310 — 6Dividend yield 4.3% 4.4% 3.9% 3.6% 3.9%
Average shares outstanding 276,031,411 277,770,913 279,861,494 281,740,107 282,056,756 (1) (2)Shares outstanding 276,026,778 276,397,053 278,624,442 280,597,610 281,708,663 — (2)
Share priceHigh 32.44 34.35 36.25 36.00 34.51Low 29.48 27.84 33.38 31.07 30.56Close 30.60 30.30 33.60 35.41 32.29
Increase (decrease) in share price 1.0% (9.8%) (5.1%) 9.7% (4.4%)Total shareholder return 2.1% (8.9%) (4.2%) 10.7% (3.5%)Market capitalization 8,446 8,375 9,362 9,936 9,096Price to earnings multiple2 15.4 15.0 16.9 18.3 17.4
Long-term debt (including the current portion) 559.3 435.6 383.5 311.5 307.4Net debt1 433.1 321.7 266.0 210.7 185.2Net debt to EBITDA 0.48 0.34 0.28 0.22 0.20
1 EBITDA and Net debt are not standardized earning measures prescribed by IFRS. Descriptions of these non-IFRS measures, as well as others, and reconciliations to IFRS, where necessary, are provided in the “Non-IFRS Measures” section of this MD&A.
2 Trailing 12 months
Annual Report | 29 | December 31, 2015
| MANAGEMENT’S DISCUSSION & ANALYSIS |
This Management’s Discussion and Analysis (“MD&A”) dated February 10, 2016 presents an analysis of the financial position of CI Financial Corp. and its subsidiaries (“CI”) as at December 31, 2015, compared with December 31, 2014, and the results of operations for the year ended and quarter ended December 31, 2015, compared with the year ended and quarter ended December 31, 2014 and the quarter ended September 30, 2015.
CI’s consolidated financial statements have been prepared in accordance with International Financial Reporting Standards (“IFRS”) as issued by the International Accounting Standards Board (“IASB”). Amounts are expressed in Canadian dollars. The principal subsidiaries referenced herein include CI Investments Inc. (“CI Investments”) and Assante Wealth Management (Canada) Ltd. (“AWM” or “Assante”). The Asset Management segment of the business includes the operating results and financial position of CI Investments and its subsidiaries, including CI Private Counsel LP (“CIPC”), as well as the operating results and financial position of First Asset Capital Corp. (“First Asset”). The Asset Administration segment includes the operating results and financial position of AWM and its subsidiaries, including Assante Capital Management Ltd. (“ACM”) and Assante Financial Management Ltd. (“AFM”).
This MD&A contains forward-looking statements concerning anticipated future events, results, circumstances, performance or expectations with respect to CI and its products and services, including its business operations, strategy and financial performance and condition. When used in this MD&A, such statements use such words as “may”, “will”, “expect”, “believe”, and other similar terms. These statements are not historical facts but instead represent management beliefs regarding future events, many of which, by their nature are inherently uncertain and beyond management control. Although management believes that the expectations reflected in such forward-looking statements are based on reasonable assumptions, such statements involve risks and uncertainties. Factors that could cause actual results to differ materially from expectations include, among other things, general economic and market conditions, including interest and foreign exchange rates, global financial markets, changes in government regulations or in tax laws, industry competition, technological developments and other factors described under “Risk Factors” or discussed in other materials filed with applicable securities regulatory authorities from time to time. The material factors and assumptions applied in reaching the conclusions contained in these forward-looking statements include that the investment fund industry will remain stable and that interest rates will remain relatively stable. The reader is cautioned against undue reliance on these forward-looking statements.
This MD&A includes several non-IFRS financial measures that do not have any standardized meaning prescribed by IFRS and may not be comparable to similar measures presented by other companies. However, management uses these financial measures and also believes that most shareholders, creditors, other stakeholders and investment analysts prefer to include the use of these financial measures in analyzing CI’s results. Descriptions of these non-IFRS measures and reconciliations to IFRS, where necessary, are provided in the “Non-IFRS Measures” section of this MD&A.
Note that figures in tables may not add due to rounding.
Annual Report | 30 | December 31, 2015
| MANAGEMENT’S DISCUSSION & ANALYSIS |
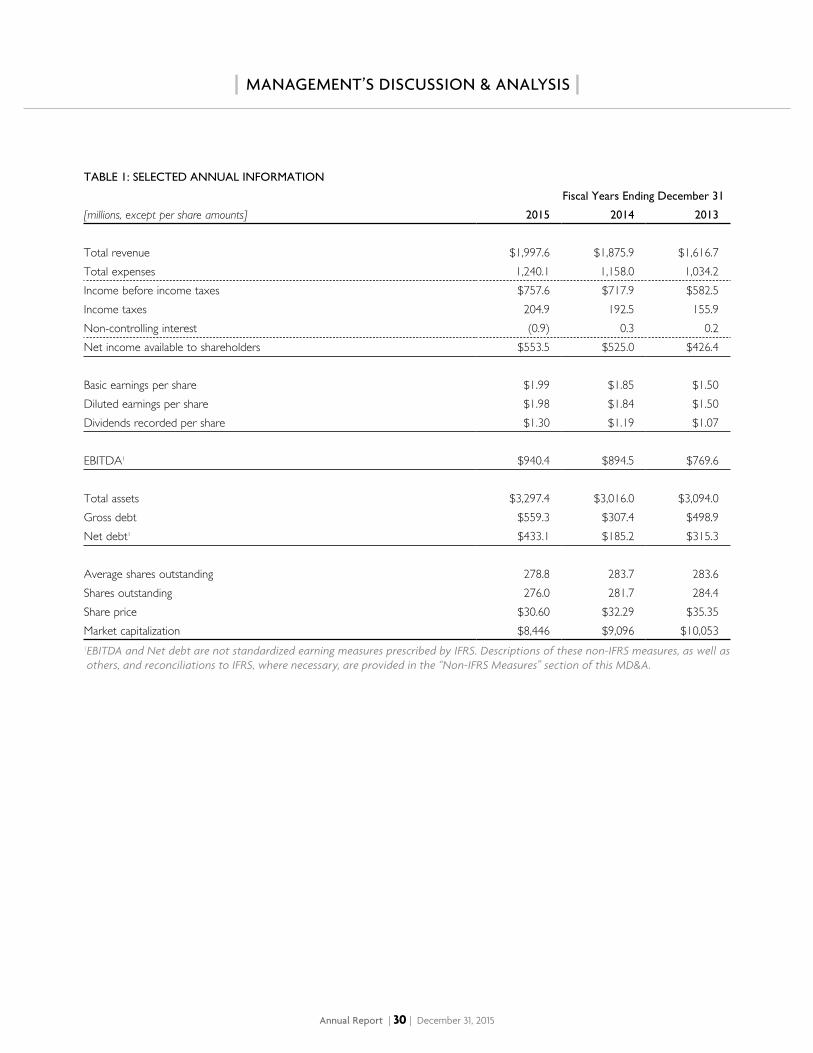
TABLE 1: SELECTED ANNUAL INFORMATION
Fiscal Years Ending December 31
[millions, except per share amounts] 2015 2014 2013
Total revenue $1,997.6 $1,875.9 $1,616.7Total expenses 1,240.1 1,158.0 1,034.2Income before income taxes $757.6 $717.9 $582.5Income taxes 204.9 192.5 155.9Non-controlling interest (0.9) 0.3 0.2Net income available to shareholders $553.5 $525.0 $426.4
Basic earnings per share $1.99 $1.85 $1.50Diluted earnings per share $1.98 $1.84 $1.50Dividends recorded per share $1.30 $1.19 $1.07
EBITDA1 $940.4 $894.5 $769.6
Total assets $3,297.4 $3,016.0 $3,094.0Gross debt $559.3 $307.4 $498.9Net debt1 $433.1 $185.2 $315.3
Average shares outstanding 278.8 283.7 283.6Shares outstanding 276.0 281.7 284.4Share price $30.60 $32.29 $35.35Market capitalization $8,446 $9,096 $10,0531 EBITDA and Net debt are not standardized earning measures prescribed by IFRS. Descriptions of these non-IFRS measures, as well as others, and reconciliations to IFRS, where necessary, are provided in the “Non-IFRS Measures” section of this MD&A.
Annual Report | 31 | December 31, 2015
| MANAGEMENT’S DISCUSSION & ANALYSIS |
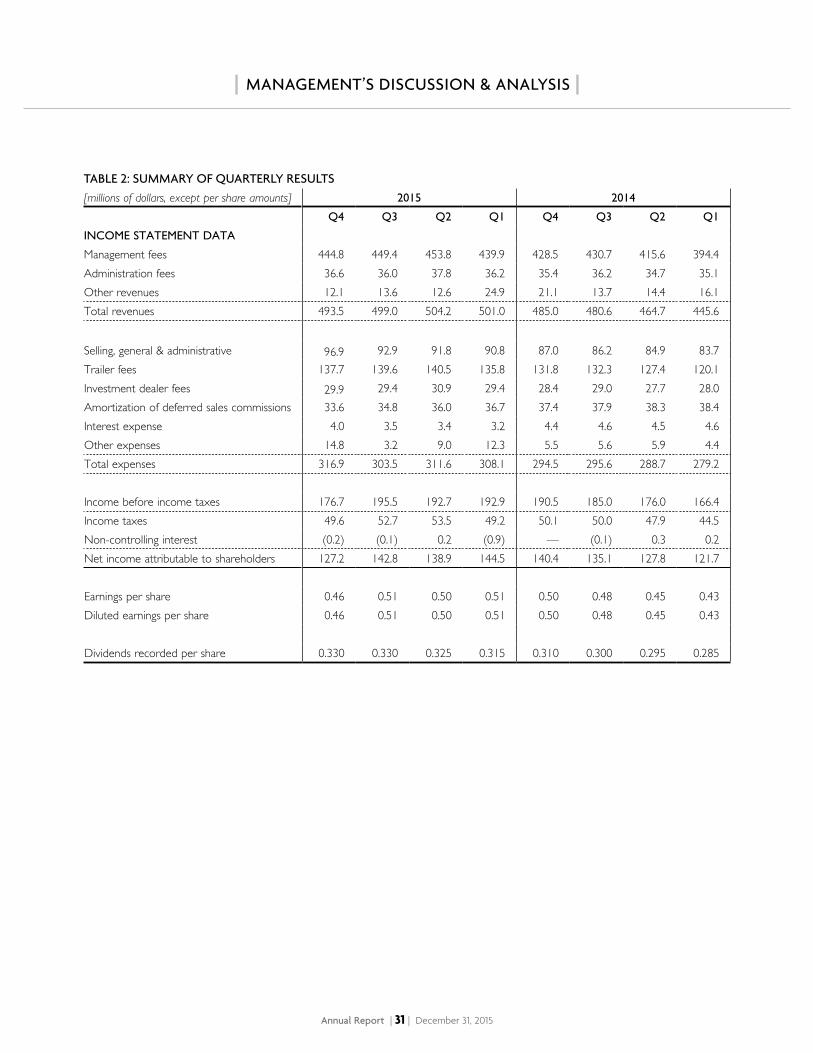
TABLE 2: SUMMARY OF QUARTERLY RESULTS[ millions of dollars, except per share amounts] 2015 2014
Q4 Q3 Q2 Q1 Q4 Q3 Q2 Q1
INCOME STATEMENT DATA
Management fees 444.8 449.4 453.8 439.9 428.5 430.7 415.6 394.4Administration fees 36.6 36.0 37.8 36.2 35.4 36.2 34.7 35.1Other revenues 12.1 13.6 12.6 24.9 21.1 13.7 14.4 16.1Total revenues 493.5 499.0 504.2 501.0 485.0 480.6 464.7 445.6
Selling, general & administrative 96.9 92.9 91.8 90.8 87.0 86.2 84.9 83.7Trailer fees 137.7 139.6 140.5 135.8 131.8 132.3 127.4 120.1Investment dealer fees 29.9 29.4 30.9 29.4 28.4 29.0 27.7 28.0Amortization of deferred sales commissions 33.6 34.8 36.0 36.7 37.4 37.9 38.3 38.4Interest expense 4.0 3.5 3.4 3.2 4.4 4.6 4.5 4.6Other expenses 14.8 3.2 9.0 12.3 5.5 5.6 5.9 4.4Total expenses 316.9 303.5 311.6 308.1 294.5 295.6 288.7 279.2
Income before income taxes 176.7 195.5 192.7 192.9 190.5 185.0 176.0 166.4Income taxes 49.6 52.7 53.5 49.2 50.1 50.0 47.9 44.5Non-controlling interest (0.2) (0.1) 0.2 (0.9) — (0.1) 0.3 0.2Net income attributable to shareholders 127.2 142.8 138.9 144.5 140.4 135.1 127.8 121.7
Earnings per share 0.46 0.51 0.50 0.51 0.50 0.48 0.45 0.43Diluted earnings per share 0.46 0.51 0.50 0.51 0.50 0.48 0.45 0.43
Dividends recorded per share 0.330 0.330 0.325 0.315 0.310 0.300 0.295 0.285
Annual Report | 32 | December 31, 2015
| MANAGEMENT’S DISCUSSION & ANALYSIS |
BUSINESS OVERVIEW
CI is a diversified wealth management firm and one of Canada’s largest independent investment fund companies. The principal business of CI is the management, marketing, distribution and administration of mutual funds, segregated funds, exchange-traded funds, structured products and other fee-earning investment products for Canadian investors. They are distributed primarily through brokers, independent financial planners and insurance advisors, including ACM and AFM financial advisors. CI operates through two business segments, Asset Management and Asset Administration. The Asset Management segment provides the majority of CI’s income and derives its revenue principally from the fees earned on the management of several families of mutual, segregated, pooled, exchange-traded and closed-end funds, structured products and discretionary accounts. The Asset Administration segment derives its revenue principally from commissions and fees earned on the sale of mutual funds and other financial products and ongoing service to clients.
BUSINESS STRATEGY
CI earns fee revenue on its assets under management (“AUM”) and assets under administration (“AUA”) and strives to maximize the growth of those assets on which it earns an acceptable margin. Management believes this can be achieved by focusing on the following factors: quality and diversity of products offered by CI; experience and depth of investment managers; performance of the funds; service levels provided to dealers and investors; and the skill and knowledge of its employees.
CI offers investors a wide range of Canadian and global investment products through a network of investment dealers, mutual fund dealers, and insurance agents, which include advisors with AWM and Sun Life Financial. Several acquisitions of fund management companies and years of product innovation and development have allowed CI to offer investors the broadest selection of investment funds in Canada.
CI uses six in-house teams and 18 external investment managers to provide investment advice regarding the portfolios of the funds. These investment managers typically have long careers in the industry as well as extensive track records with CI. This lineup of investment managers provides a wide selection of styles and areas of expertise for CI’s funds.
CI selects managers with a reputation for skilled investment management and has the size and scale to attract the top talent in this field. Many of CI’s investment managers have excellent long-term fund performance. However, CI can and will make changes to its investment managers when unsatisfactory investment performance has occurred.
CI is the manager of the funds and provides services that include managing or arranging for the management of investment portfolios, marketing of the funds, maintaining securityholders’ records and accounts, reporting to the securityholders and processing transactions relating to securities of the funds. CI has invested in information systems and internal training of staff to provide more accurate and timely service to dealers and agents selling CI’s products and to investors.
Management of CI has the specialized skills and knowledge to focus on several key objectives. These include: meeting the needs of its clients, developing new products, enhancing investor awareness and increasing market share by marketing to investment dealers, mutual fund dealers and life insurance agents.
Annual Report | 33 | December 31, 2015
| MANAGEMENT’S DISCUSSION & ANALYSIS |
KEY PERFORMANCE DRIVERS
CI’s results are driven primarily by the level of its assets under management, which are in turn driven by fund performance and the net sales of its funds. The margin earned on these assets under management determines, to a large extent, CI’s profitability.
The returns of each fund reflect the returns of equities, bonds or other securities held by the fund. These returns will reflect the returns of equity and bond indexes plus the over or underperformance of the investment manager of each fund. In years when markets generally decline, CI’s assets will likely decline. Conversely, CI’s assets will likely appreciate in years when markets perform well. For a particular period, the average assets under management will drive CI’s results as CI receives the majority of its fees on a daily basis.
Fund sales and acquisitions also affect CI’s assets under management. While sales results help increase assets under management, they are also an indicator of the level of demand for CI’s products and our success in delivering attractive products, which help determine longer-term trends for CI’s market share.
CI uses several performance indicators to assess its results. These indicators are described throughout the results of operations and the discussion of the two operating segments and include the following measures prescribed by IFRS: net income and earnings per share; and measures not prescribed by IFRS: pre-tax operating earnings, EBITDA, EBITDA margin, dealer gross margin, net debt, operating cash flow, free cash flow, asset management margin, and SG&A efficiency margin. Descriptions of these non-IFRS measures and reconciliations to IFRS are provided below.
Annual Report | 34 | December 31, 2015
| MANAGEMENT’S DISCUSSION & ANALYSIS |
NON-IFRS MEASURES
EBITDA AND EBITDA MARGIN
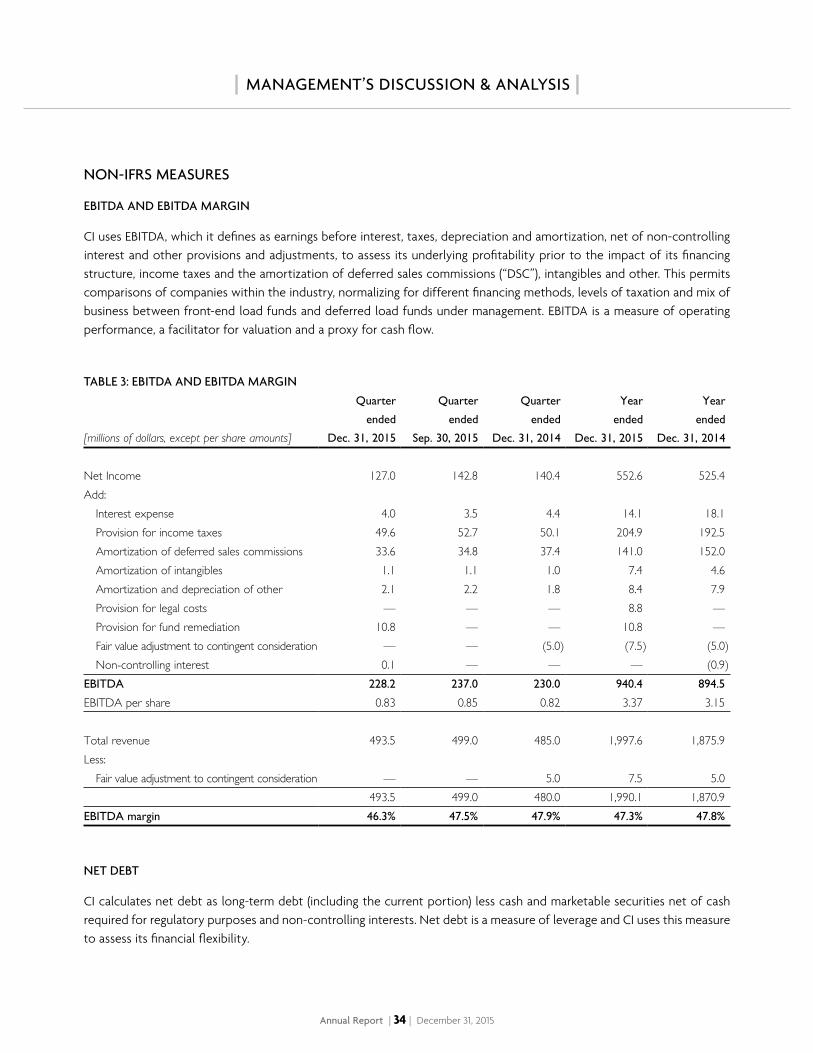
CI uses EBITDA, which it defines as earnings before interest, taxes, depreciation and amortization, net of non-controlling interest and other provisions and adjustments, to assess its underlying profitability prior to the impact of its financing structure, income taxes and the amortization of deferred sales commissions (“DSC”), intangibles and other. This permits comparisons of companies within the industry, normalizing for different financing methods, levels of taxation and mix of business between front-end load funds and deferred load funds under management. EBITDA is a measure of operating performance, a facilitator for valuation and a proxy for cash flow.
TABLE 3: EBITDA AND EBITDA MARGIN
[millions of dollars, except per share amounts]
Quarter
ended
Dec. 31, 2015
Quarter
ended
Sep. 30, 2015
Quarter
ended
Dec. 31, 2014
Year
ended
Dec. 31, 2015
Year
ended
Dec. 31, 2014
Net Income 127.0 142.8 140.4 552.6 525.4Add:
Interest expense 4.0 3.5 4.4 14.1 18.1Provision for income taxes 49.6 52.7 50.1 204.9 192.5Amortization of deferred sales commissions 33.6 34.8 37.4 141.0 152.0Amortization of intangibles 1.1 1.1 1.0 7.4 4.6Amortization and depreciation of other 2.1 2.2 1.8 8.4 7.9Provision for legal costs — — — 8.8 —Provision for fund remediation 10.8 — — 10.8 —Fair value adjustment to contingent consideration — — (5.0) (7.5) (5.0)Non-controlling interest 0.1 — — — (0.9)
EBITDA 228.2 237.0 230.0 940.4 894.5
EBITDA per share 0.83 0.85 0.82 3.37 3.15
Total revenue 493.5 499.0 485.0 1,997.6 1,875.9Less:
Fair value adjustment to contingent consideration — — 5.0 7.5 5.0493.5 499.0 480.0 1,990.1 1,870.9
EBITDA margin 46.3% 47.5% 47.9% 47.3% 47.8%
NET DEBT
CI calculates net debt as long-term debt (including the current portion) less cash and marketable securities net of cash required for regulatory purposes and non-controlling interests. Net debt is a measure of leverage and CI uses this measure to assess its financial flexibility.
Annual Report | 35 | December 31, 2015
| MANAGEMENT’S DISCUSSION & ANALYSIS |
TABLE 4: NET DEBT
[millions of dollars]
As at
Dec. 31, 2015
As at
Dec. 31, 2014
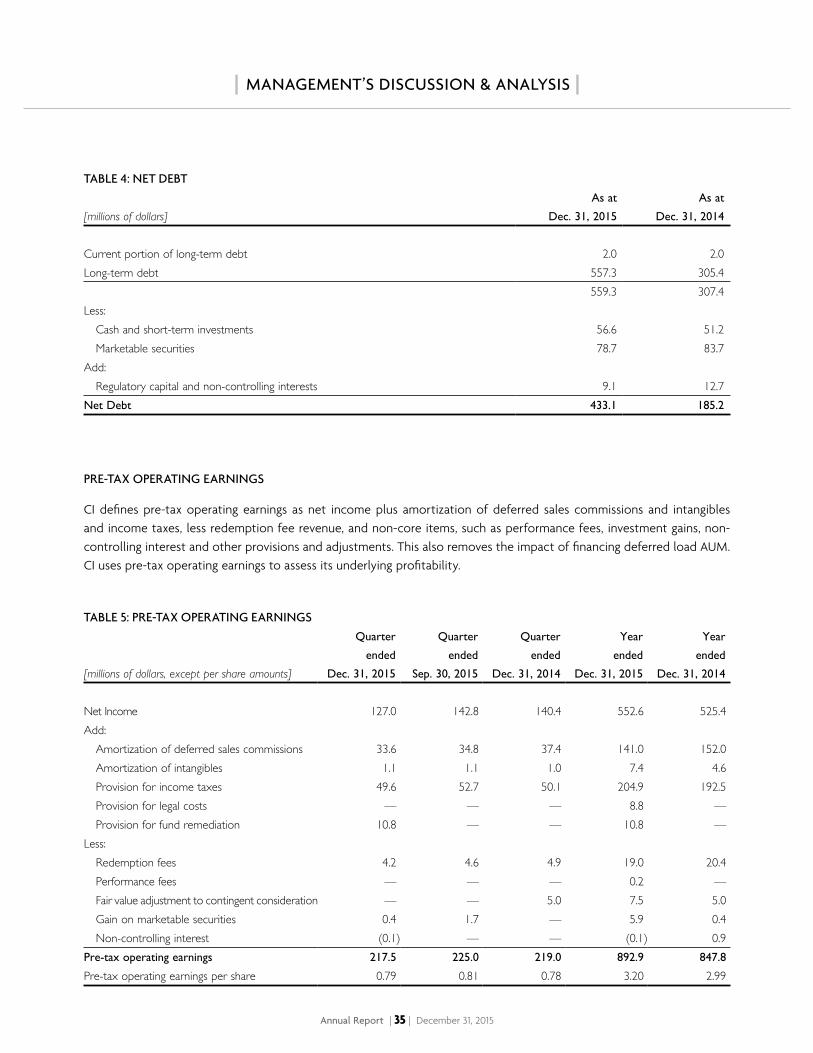
Current portion of long-term debt 2.0 2.0 Long-term debt 557.3 305.4
559.3 307.4 Less:
Cash and short-term investments 56.6 51.2 Marketable securities 78.7 83.7
Add:Regulatory capital and non-controlling interests 9.1 12.7
Net Debt 433.1 185.2
PRE-TAX OPERATING EARNINGS
CI defines pre-tax operating earnings as net income plus amortization of deferred sales commissions and intangibles and income taxes, less redemption fee revenue, and non-core items, such as performance fees, investment gains, non-controlling interest and other provisions and adjustments. This also removes the impact of financing deferred load AUM. CI uses pre-tax operating earnings to assess its underlying profitability.
TABLE 5: PRE-TAX OPERATING EARNINGS
[millions of dollars, except per share amounts]
Quarter
ended
Dec. 31, 2015
Quarter
ended
Sep. 30, 2015
Quarter
ended
Dec. 31, 2014
Year
ended
Dec. 31, 2015
Year
ended
Dec. 31, 2014
Net Income 127.0 142.8 140.4 552.6 525.4Add:
Amortization of deferred sales commissions 33.6 34.8 37.4 141.0 152.0Amortization of intangibles 1.1 1.1 1.0 7.4 4.6Provision for income taxes 49.6 52.7 50.1 204.9 192.5Provision for legal costs — — — 8.8 —Provision for fund remediation 10.8 — — 10.8 —
Less:Redemption fees 4.2 4.6 4.9 19.0 20.4Performance fees — — — 0.2 —Fair value adjustment to contingent consideration — — 5.0 7.5 5.0Gain on marketable securities 0.4 1.7 — 5.9 0.4Non-controlling interest (0.1) — — (0.1) 0.9
Pre-tax operating earnings 217.5 225.0 219.0 892.9 847.8
Pre-tax operating earnings per share 0.79 0.81 0.78 3.20 2.99
Annual Report | 36 | December 31, 2015
| MANAGEMENT’S DISCUSSION & ANALYSIS |
DEALER GROSS MARGIN
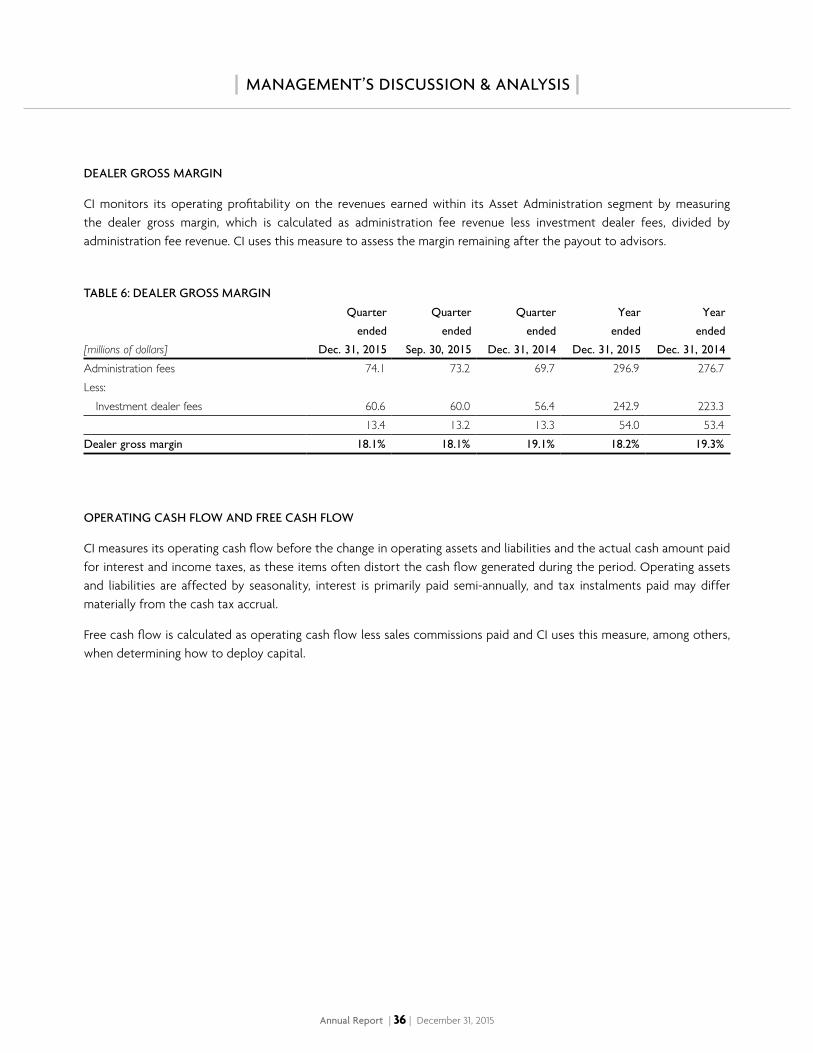
CI monitors its operating profitability on the revenues earned within its Asset Administration segment by measuring the dealer gross margin, which is calculated as administration fee revenue less investment dealer fees, divided by administration fee revenue. CI uses this measure to assess the margin remaining after the payout to advisors.
TABLE 6: DEALER GROSS MARGIN
[millions of dollars]
Quarter
ended
Dec. 31, 2015
Quarter
ended
Sep. 30, 2015
Quarter
ended
Dec. 31, 2014
Year
ended
Dec. 31, 2015
Year
ended
Dec. 31, 2014
Administration fees 74.1 73.2 69.7 296.9 276.7Less:
Investment dealer fees 60.6 60.0 56.4 242.9 223.313.4 13.2 13.3 54.0 53.4
Dealer gross margin 18.1% 18.1% 19.1% 18.2% 19.3%
OPERATING CASH FLOW AND FREE CASH FLOW
CI measures its operating cash flow before the change in operating assets and liabilities and the actual cash amount paid for interest and income taxes, as these items often distort the cash flow generated during the period. Operating assets and liabilities are affected by seasonality, interest is primarily paid semi-annually, and tax instalments paid may differ materially from the cash tax accrual.
Free cash flow is calculated as operating cash flow less sales commissions paid and CI uses this measure, among others, when determining how to deploy capital.
Annual Report | 37 | December 31, 2015
| MANAGEMENT’S DISCUSSION & ANALYSIS |
TABLE 7: OPERATING CASH FLOW AND FREE CASH FLOW
[millions of dollars]
Quarter
ended
Dec. 31, 2015
Quarter
ended
Sep. 30, 2015
Quarter
ended
Dec. 31, 2014
Year
ended
Dec. 31, 2015
Year
ended
Dec. 31, 2014
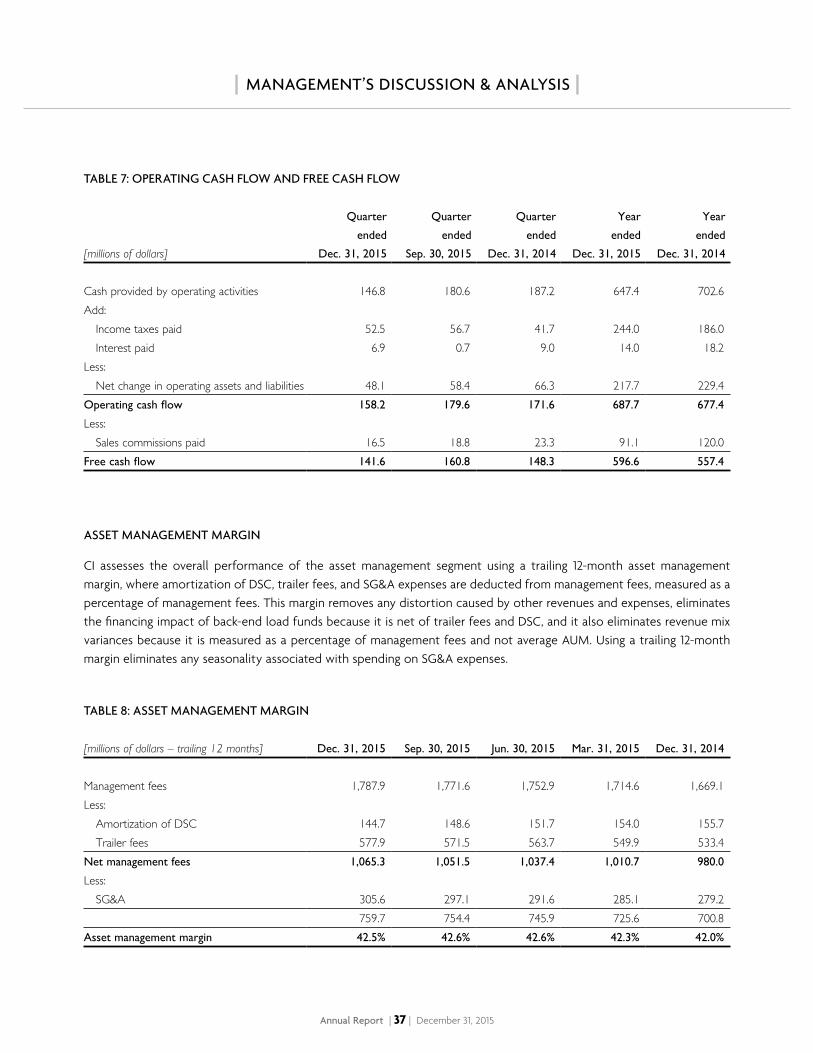
Cash provided by operating activities 146.8 180.6 187.2 647.4 702.6Add:
Income taxes paid 52.5 56.7 41.7 244.0 186.0Interest paid 6.9 0.7 9.0 14.0 18.2
Less:Net change in operating assets and liabilities 48.1 58.4 66.3 217.7 229.4
Operating cash flow 158.2 179.6 171.6 687.7 677.4
Less:Sales commissions paid 16.5 18.8 23.3 91.1 120.0
Free cash flow 141.6 160.8 148.3 596.6 557.4
ASSET MANAGEMENT MARGIN
CI assesses the overall performance of the asset management segment using a trailing 12-month asset management margin, where amortization of DSC, trailer fees, and SG&A expenses are deducted from management fees, measured as a percentage of management fees. This margin removes any distortion caused by other revenues and expenses, eliminates the financing impact of back-end load funds because it is net of trailer fees and DSC, and it also eliminates revenue mix variances because it is measured as a percentage of management fees and not average AUM. Using a trailing 12-month margin eliminates any seasonality associated with spending on SG&A expenses.
TABLE 8: ASSET MANAGEMENT MARGIN
[millions of dollars – trailing 12 months] Dec. 31, 2015 Sep. 30, 2015 Jun. 30, 2015 Mar. 31, 2015 Dec. 31, 2014
Management fees 1,787.9 1,771.6 1,752.9 1,714.6 1,669.1 Less:
Amortization of DSC 144.7 148.6 151.7 154.0 155.7 Trailer fees 577.9 571.5 563.7 549.9 533.4
Net management fees 1,065.3 1,051.5 1,037.4 1,010.7 980.0
Less:SG&A 305.6 297.1 291.6 285.1 279.2
759.7 754.4 745.9 725.6 700.8 Asset management margin 42.5% 42.6% 42.6% 42.3% 42.0%
Annual Report | 38 | December 31, 2015
| MANAGEMENT’S DISCUSSION & ANALYSIS |
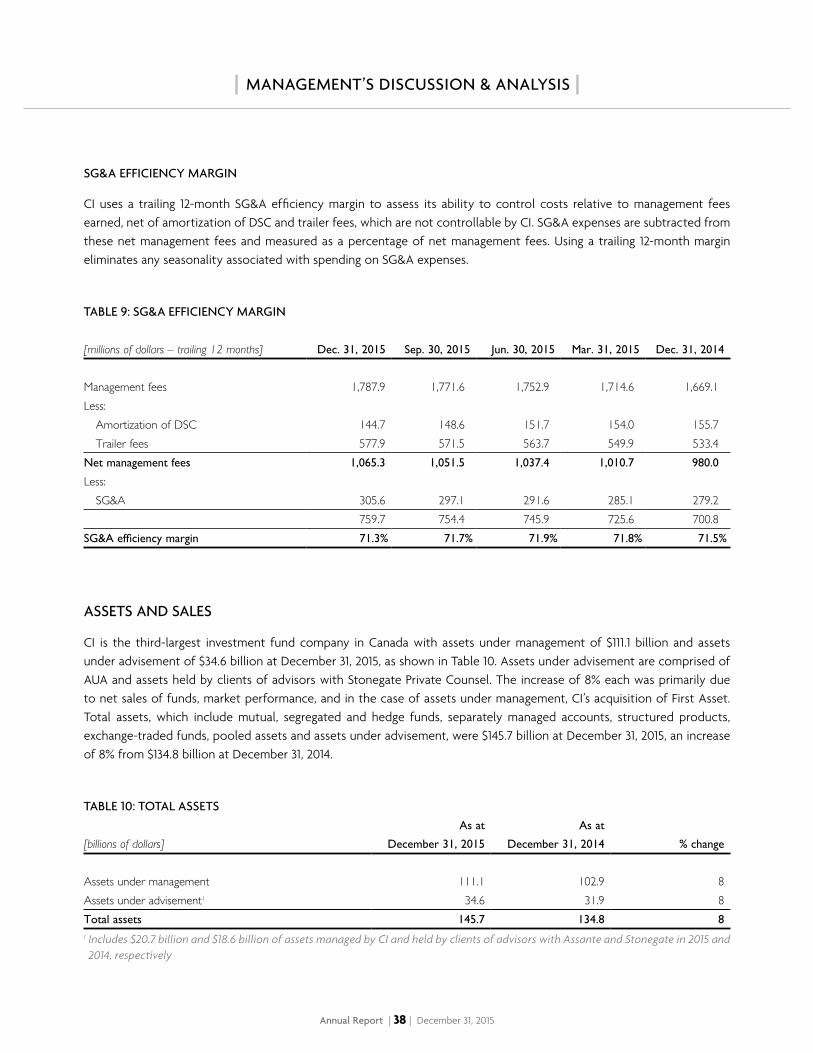
SG&A EFFICIENCY MARGIN
CI uses a trailing 12-month SG&A efficiency margin to assess its ability to control costs relative to management fees earned, net of amortization of DSC and trailer fees, which are not controllable by CI. SG&A expenses are subtracted from these net management fees and measured as a percentage of net management fees. Using a trailing 12-month margin eliminates any seasonality associated with spending on SG&A expenses.
TABLE 9: SG&A EFFICIENCY MARGIN
[millions of dollars – trailing 12 months] Dec. 31, 2015 Sep. 30, 2015 Jun. 30, 2015 Mar. 31, 2015 Dec. 31, 2014
Management fees 1,787.9 1,771.6 1,752.9 1,714.6 1,669.1 Less:
Amortization of DSC 144.7 148.6 151.7 154.0 155.7 Trailer fees 577.9 571.5 563.7 549.9 533.4
Net management fees 1,065.3 1,051.5 1,037.4 1,010.7 980.0
Less:SG&A 305.6 297.1 291.6 285.1 279.2
759.7 754.4 745.9 725.6 700.8 SG&A efficiency margin 71.3% 71.7% 71.9% 71.8% 71.5%
ASSETS AND SALES
CI is the third-largest investment fund company in Canada with assets under management of $111.1 billion and assets under advisement of $34.6 billion at December 31, 2015, as shown in Table 10. Assets under advisement are comprised of AUA and assets held by clients of advisors with Stonegate Private Counsel. The increase of 8% each was primarily due to net sales of funds, market performance, and in the case of assets under management, CI’s acquisition of First Asset. Total assets, which include mutual, segregated and hedge funds, separately managed accounts, structured products, exchange-traded funds, pooled assets and assets under advisement, were $145.7 billion at December 31, 2015, an increase of 8% from $134.8 billion at December 31, 2014.
TABLE 10: TOTAL ASSETS
[billions of dollars]
As at
December 31, 2015
As at
December 31, 2014 % change
Assets under management 111.1 102.9 8Assets under advisement1 34.6 31.9 8Total assets 145.7 134.8 81 Includes $20.7 billion and $18.6 billion of assets managed by CI and held by clients of advisors with Assante and Stonegate in 2015 and 2014, respectively
Annual Report | 39 | December 31, 2015
| MANAGEMENT’S DISCUSSION & ANALYSIS |
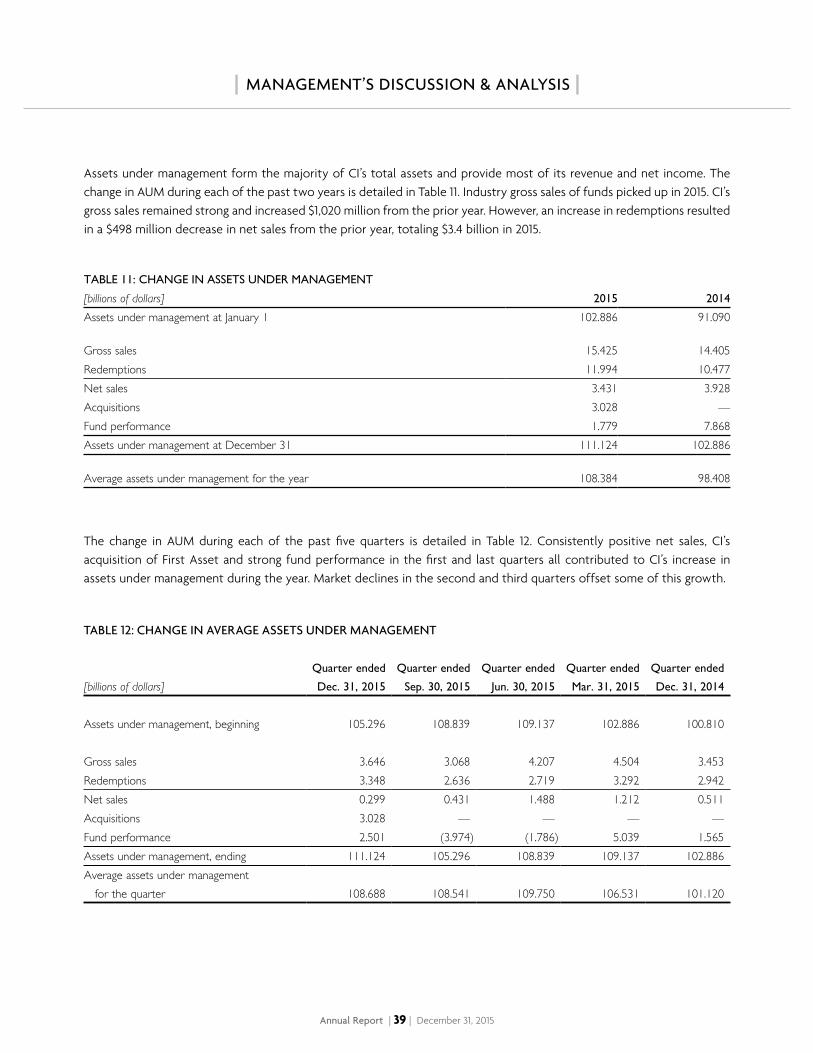
Assets under management form the majority of CI’s total assets and provide most of its revenue and net income. The change in AUM during each of the past two years is detailed in Table 11. Industry gross sales of funds picked up in 2015. CI’s gross sales remained strong and increased $1,020 million from the prior year. However, an increase in redemptions resulted in a $498 million decrease in net sales from the prior year, totaling $3.4 billion in 2015.
TABLE 11: CHANGE IN ASSETS UNDER MANAGEMENT
[billions of dollars] 2015 2014
Assets under management at January 1 102.886 91.090 Gross sales 15.425 14.405Redemptions 11.994 10.477Net sales 3.431 3.928Acquisitions 3.028 —Fund performance 1.779 7.868Assets under management at December 31 111.124 102.886
Average assets under management for the year 108.384 98.408
The change in AUM during each of the past five quarters is detailed in Table 12. Consistently positive net sales, CI’s acquisition of First Asset and strong fund performance in the first and last quarters all contributed to CI’s increase in assets under management during the year. Market declines in the second and third quarters offset some of this growth.
TABLE 12: CHANGE IN AVERAGE ASSETS UNDER MANAGEMENT
[billions of dollars]
Quarter ended
Dec. 31, 2015
Quarter ended
Sep. 30, 2015
Quarter ended
Jun. 30, 2015
Quarter ended
Mar. 31, 2015
Quarter ended
Dec. 31, 2014
Assets under management, beginning 105.296 108.839 109.137 102.886 100.810 Gross sales 3.646 3.068 4.207 4.504 3.453Redemptions 3.348 2.636 2.719 3.292 2.942Net sales 0.299 0.431 1.488 1.212 0.511 Acquisitions 3.028 — — — —Fund performance 2.501 (3.974) (1.786) 5.039 1.565Assets under management, ending 111.124 105.296 108.839 109.137 102.886Average assets under management for the quarter 108.688 108.541 109.750 106.531 101.120
Annual Report | 40 | December 31, 2015
| MANAGEMENT’S DISCUSSION & ANALYSIS |
2015 OVERVIEW
CI’s average assets under management for 2015 increased 10% from 2014 primarily as a result of strong fund performance as well as $3.4 billion in net sales. The acquisition of First Asset had a very small impact on average assets for the year as it was only included in CI’s assets for the last month of the year. The increase in year-over-year average assets under management was the primary driver of the 5% increase in net income, as approximately 90% of CI’s revenue is derived directly from the level of assets under management in the form of management fee revenue.
The trend towards lower average management fee rates continued in 2015, primarily because the proportion of high net worth products within CI’s assets under management continues to grow and these products typically bear a lower management fee. This is discussed in the “Asset Management Segment” below.
The decline in average management fee revenue was mitigated somewhat by a similar impact on trailer fee expense since high net worth products have lower or no trailer fees. However, the proportion of funds purchased on a front-end load basis is also increasing. These funds carry higher trailer fee rates and helped cause trailer fee expenses to increase 8% year over year. Selling, general and administrative (“SG&A”) expenses increased by 9% in 2015, less than the increase in average AUM. The impact of fixed expenses that changed less than the increase in AUM was offset somewhat by investments in sales, marketing and portfolio management. The decline in sales of deferred load funds over the past several years is being reflected in reduced spend on deferred sales commissions, and the amortization of deferred sales commissions was lower in 2015 than in 2014.
According to Morningstar, CI led the industry with the most four and five-star rated investment funds (including multiple versions) for all of 2015 and has ranked either first or second place for the past 10 years. In addition, CI and its portfolio managers have won 55 Morningstar Awards since 1998 and 54 Lipper Awards since 2007.
In April 2015, CI Investments discovered an administrative error. Approximately $156.1 million of interest had not been properly recorded as an asset in the accounting records of certain funds, on total assets of approximately $9.8 billion as of May 29, 2015, with the result being that the NAVs of these funds, and any funds that had invested in these funds, had been understated for several years. The interest at all times remained in bank accounts as an asset of these funds and was never comingled with the property of CI Investments. Once the error was discovered, CI Investments, with the assistance of an independent consulting firm, undertook a comprehensive investigation into how the error occurred and developed a plan to put affected investors into the economic position they would have been in if the interest had been recorded (the “Plan”). CI Investments also enhanced its systems and processes to help prevent similar errors from occurring in the future. CI Investments self-reported the error to the OSC. On February 10, 2016, CI Investments entered into a no-contest settlement agreement with the OSC in connection with the administrative error. As part of the no-contest settlement agreement, CI Investments agreed to, among other things, implement the Plan and make a voluntary payment of $8 million (and $50,000 towards costs) to the OSC. CI has made a provision of $10.75 million, net of recoveries, for the cost of this settlement as well as the costs to remediate.
Annual Report | 41 | December 31, 2015
| MANAGEMENT’S DISCUSSION & ANALYSIS |
RESULTS OF OPERATIONS
YEAR ENDED DECEMBER 31, 2015
For the year ended December 31, 2015, CI reported net income attributable to shareholders of $553.5 million ($1.99 per share) versus $525.0 million ($1.85 per share) for the year ended December 31, 2014. Net income attributable to shareholders for the year ended December 31, 2015, excluding a $7.5 million fair value adjustment to contingent consideration, an $8.8 million ($6.4 million after tax) provision for legal costs, a $10.8 million ($9.8 million after tax) provision for fund remediation, and a $3.0 million ($1.4 million after tax and non-controlling interest) acceleration in the amortization of fund management contracts, was $563.7 million ($2.02 per share). The year ended December 31, 2014 included a $5.0 million fair value adjustment to contingent consideration. Adjusting for these items, net income for 2015 was up 8.4% from 2014. All further discussion of annual earnings measures in this document are assumed to adjust for the above items, as this will assist in a comparison of results across reporting periods.
The increase in net income has been primarily driven by and is generally in line with the increase in average AUM for this period. However, to the extent that certain revenues or expenses do not vary with the level of AUM, CI’s net income will experience positive or negative operating leverage. The most significant of these types of revenue are redemption fees, the sales commissions earned and reported within administration fees, and other income. These revenue items have not increased over the past year at the same rate as AUM and therefore reduced the growth rate of CI’s net income relative to asset growth. The most significant expenses that do not vary with the level of average AUM are the fixed components within SG&A, amortization of deferred sales commissions, and interest expense. These expense items have either decreased over the past year or increased at lower rates than AUM and therefore increased the rate of growth of CI’s net income relative to AUM growth.
Total revenues increased 6.5% in 2015 to $1,997.6 million compared with $1,875.9 million in 2014. The main contributor to this change was the 7.1% increase in management fee revenues, as average AUM increased 10.1%. Management fees rose less than average AUM as a higher proportion of assets were invested in classes of funds designated for high net worth clients/fee-based accounts, which have lower management fee rates than traditional retail funds. Administration fee revenue from third-party fund companies grew 3.8%, representing the growth in Assante’s revenues net of intercompany eliminations.
For the year ended December 31, 2015, redemption fee revenue declined 6.9% to $19.0 million compared with $20.4 million for the year ended December 31, 2014. The decrease is a result of a decline in redemptions of deferred load funds that are subject to redemption fees.
Other revenue for the year ended December 31, 2015 declined by 2.2% to $44.1 million compared to $45.1 million in the prior year. The decrease was generally a result of decreased revenues earned through CI’s financial interests in Altrinsic Global Advisors LLC and Marret Asset Management Inc. (“Marret”), somewhat offset by an increase in gains on the sale of marketable securities.
In 2015, SG&A expenses were $372.5 million, a 9.0% increase from $341.8 million for 2014. This change was below the 10.1% increase in average AUM. Included in SG&A expenses are portfolio management fees, which are largely driven by the level of average AUM; however, CI has also added staff to its in-house portfolio management teams and increased the amount of discretionary spend on sales and marketing. While SG&A has increased in dollar terms because of this, as a percentage of average AUM, the level of SG&A spend declined to 0.344% from 0.347% in 2014.
Annual Report | 42 | December 31, 2015
| MANAGEMENT’S DISCUSSION & ANALYSIS |
Amortization of deferred sales commissions was $141.0 million in 2015, a decrease from $152.0 million in 2014. This represents the average amount of deferred sales commissions paid in the last seven years plus a small amount of accelerated amortization as deferred load units are redeemed ahead of their three or seven-year scheduled term. The level of spending on deferred sales commissions has generally declined over the past several years as a smaller proportion of sales have been deferred load funds versus front-end load funds.
Interest expense of $14.1 million was recorded for the year ended December 31, 2015 compared with $18.1 million for the year ended December 31, 2014. The decrease in interest expense reflects lower average debt levels at lower average interest rates during 2015 relative to 2014, as discussed under “Liquidity and Capital Resources.”
Other expenses for the year ended December 31, 2015 were $31.9 million compared to $16.9 million in the prior year. The increase from the prior year is primarily a result of an increase in legal provisions as well as a provision for fund remediation. The impact of these provisions was slightly offset by a reduction in expenses related to CI’s investment in Marret.
In 2015, CI recorded $204.9 million in income tax expense for an effective tax rate of 27.1% compared to CI’s statutory rate of 26.5%. For the prior year, the effective tax rate was 26.8% compared with a statutory rate of 26.5%.
CI’s pre-tax operating earnings, as discussed in the “Non-IFRS Measures” section and as set out in Table 5, adjust for the impact of gains and losses on marketable securities, performance fees and other provisions and adjustments. Redemption fee revenue and the amortization of deferred sales commissions and fund contracts are netted out to remove the impact of financing back-end assets under management. Pre-tax operating earnings were $892.9 million in 2015, an increase of 5.3% from 2014, reflecting the higher average assets under management less the decline in average margin earned on those assets, as discussed below in the Asset Management Segment.
As discussed in the “Non-IFRS Measures” section and as illustrated in Table 3, EBITDA for the year ended December 31, 2015 was $940.4 million ($3.37 per share) compared with $894.5 million ($3.15 per share) for the year ended December 31, 2014. The 5.1% increase is consistent with the level of average AUM and the margin earned thereon, offset by the additional impact of a decline in redemption fee revenue. EBITDA margin for 2015 was 47.3%, down from 47.8% in 2014.
QUARTER ENDED DECEMBER 31, 2015
For the quarter ended December 31, 2015, CI reported net income attributable to shareholders of $127.2 million ($0.46 per share) versus $140.4 million ($0.50 per share) for the quarter ended December 31, 2014 and $142.8 million ($0.51 per share) for the quarter ended September 30, 2015. The fourth quarter of 2015 included a $10.8 million ($9.8 million after tax) provision for fund remediation. Net income adjusted for this item was $137.0 million ($0.50 per share) in the quarter ended December 31, 2015. The fourth quarter of 2014 included a $5.0 million fair value adjustment to contingent consideration. Net income adjusted for this item was $135.4 million ($0.48 per share) for the quarter ended December 31, 2014. Including these adjustments, net income for the quarter ended December 31, 2015 was down 4.1% from the quarter ended September 30, 2015 and up 1.2% year over year. The change in net income was primarily driven by the change in average assets under management, which was up 0.1% from the third quarter of 2015 and up 7.5% from the fourth quarter of 2014. All further discussion of earnings measures in this document are assumed to adjust for the above items, as this will assist in a comparison of results across reporting periods.
Annual Report | 43 | December 31, 2015
| MANAGEMENT’S DISCUSSION & ANALYSIS |
Total revenues increased 1.8% in the fourth quarter of 2015 to $493.5 million compared to $485.0 million in the same period in 2014. The main contributor to this change was the 3.8% increase in management fee revenues as average AUM rose 7.5%. Management fees rose less than average AUM as a higher proportion of assets were invested in classes of funds designated for high net worth clients/fee-based accounts, which have lower management fee rates than traditional retail funds. Assante’s revenues net of intercompany eliminations increased 3.6%, representing the administration fee revenue from third-party fund companies. On a quarter-over-quarter basis, total revenues decreased 1.1% from $499.0 million in the third quarter of 2015 as average AUM increased 0.1% and management fee revenues decreased 1.0%. Assante administration fee revenues, net of intercompany eliminations, increased 1.8% from the prior quarter.
SG&A expenses for the fourth quarter of 2015 were $96.9 million, up 11.4% from $87.0 million for the same period in 2014, greater than the 7.5% growth in average AUM. This level of spend is a 4.3% increase from $92.9 million in the third quarter of 2015. Included in SG&A expenses are portfolio management fees, which are largely driven by the level of average AUM; however, CI has also added staff to its in-house portfolio management teams and increased the amount of discretionary spend on sales and marketing. The level of SG&A expenses, as an annualized percentage of average AUM, grew to 0.354% from 0.341% in the fourth quarter of 2014 and from 0.340% in the third quarter of 2015.
Amortization of deferred sales commissions was $33.6 million in the fourth quarter of 2015, a decrease from $37.4 million in the fourth quarter of 2014 and a decrease from $34.8 million in the third quarter of 2015. The trend of lower amortization expense is consistent with the trend of reduced spending on deferred sales commissions in recent years as a smaller proportion of sales have been deferred load funds versus front-end load funds.
Interest expense of $4.0 million was recorded for the quarter ended December 31, 2015 compared with $4.4 million for the quarter ended December 31, 2014 and $3.5 million for the quarter ended September 30, 2015. The changes in interest expense primarily reflect the changes in average debt levels, as discussed under “Liquidity and Capital Resources.”
For the fourth quarter of 2015, CI recorded $49.6 million in income tax expense for an effective tax rate of 28.1% compared to $50.1 million in the fourth quarter of 2014 for an effective tax rate of 26.3%. Income tax expense in the third quarter of 2015 was $52.7 million, for an effective tax rate of 26.9%. The higher effective tax rate for the fourth quarter of 2015 reflects the non-deductible nature of a large component of the provision for fund remediation. CI’s statutory tax rate for 2015 was 26.5%.
As discussed in the “Non-IFRS Measures” section and as set out in Table 5, pre-tax operating earnings were $217.5 million ($0.79 per share) in the fourth quarter of 2015, a decrease of 0.7% from the same quarter of 2014 and down 3.3% from the prior quarter. These changes reflect lower average margins earned on AUM due to a higher proportion of assets being invested in classes of funds with lower management fee rates in combination with increased SG&A expenses to support CI’s growth strategy.
EBITDA for the quarter ended December 31, 2015 was $228.2 million ($0.83 per share), down 0.8% from $230.0 million ($0.82 per share) for the quarter ended December 31, 2014 and down 3.7% from $237.0 million ($0.85 per share) for the quarter ended September 30, 2015. Similar to the change in pre-tax operating earnings, these changes reflect lower average margins earned on AUM due to a higher proportion of assets being invested in classes of funds with lower management fee rates in combination with increased SG&A expenses to support CI’s growth strategy. EBITDA margin for the fourth quarter of 2015 was 46.3%, down from 47.9% in the fourth quarter of 2014 and 47.5% in the prior quarter. For detailed calculations and reconciliations of net income to EBITDA, refer to the “Non-IFRS Measures” section and Table 3.
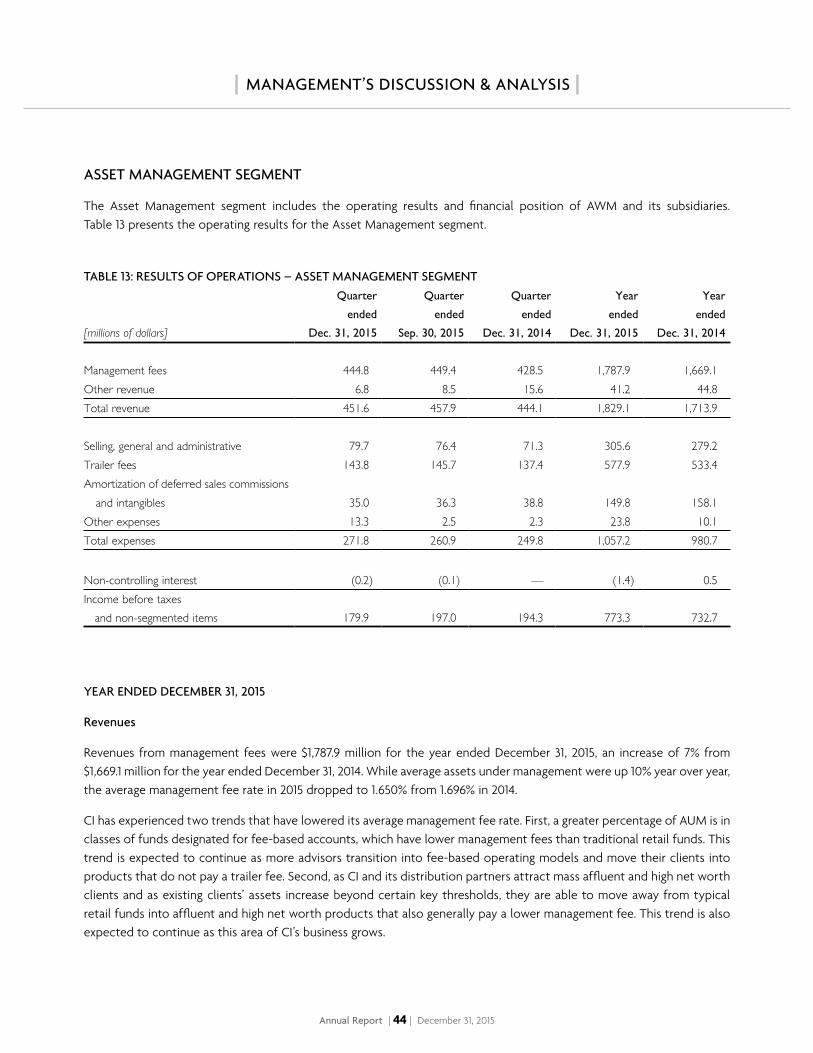
Annual Report | 44 | December 31, 2015
| MANAGEMENT’S DISCUSSION & ANALYSIS |
ASSET MANAGEMENT SEGMENT
The Asset Management segment includes the operating results and financial position of AWM and its subsidiaries. Table 13 presents the operating results for the Asset Management segment.
TABLE 13: RESULTS OF OPERATIONS – ASSET MANAGEMENT SEGMENT
[millions of dollars]
Quarter
ended
Dec. 31, 2015
Quarter
ended
Sep. 30, 2015
Quarter
ended
Dec. 31, 2014
Year
ended
Dec. 31, 2015
Year
ended
Dec. 31, 2014
Management fees 444.8 449.4 428.5 1,787.9 1,669.1Other revenue 6.8 8.5 15.6 41.2 44.8Total revenue 451.6 457.9 444.1 1,829.1 1,713.9
Selling, general and administrative 79.7 76.4 71.3 305.6 279.2Trailer fees 143.8 145.7 137.4 577.9 533.4Amortization of deferred sales commissions
and intangibles 35.0 36.3 38.8 149.8 158.1Other expenses 13.3 2.5 2.3 23.8 10.1Total expenses 271.8 260.9 249.8 1,057.2 980.7
Non-controlling interest (0.2) (0.1) — (1.4) 0.5Income before taxes and non-segmented items 179.9 197.0 194.3 773.3 732.7
YEAR ENDED DECEMBER 31, 2015
Revenues
Revenues from management fees were $1,787.9 million for the year ended December 31, 2015, an increase of 7% from $1,669.1 million for the year ended December 31, 2014. While average assets under management were up 10% year over year, the average management fee rate in 2015 dropped to 1.650% from 1.696% in 2014.
CI has experienced two trends that have lowered its average management fee rate. First, a greater percentage of AUM is in classes of funds designated for fee-based accounts, which have lower management fees than traditional retail funds. This trend is expected to continue as more advisors transition into fee-based operating models and move their clients into products that do not pay a trailer fee. Second, as CI and its distribution partners attract mass affluent and high net worth clients and as existing clients’ assets increase beyond certain key thresholds, they are able to move away from typical retail funds into affluent and high net worth products that also generally pay a lower management fee. This trend is also expected to continue as this area of CI’s business grows.
Annual Report | 45 | December 31, 2015
| MANAGEMENT’S DISCUSSION & ANALYSIS |
For the year ended December 31, 2015, other revenue was $41.2 million versus $44.8 million for the year ended December 31, 2014. The largest component of other revenue is redemption fees. Redemption fees were $19.0 million for 2015 compared with $20.4 million for 2014 as the level of deferred load business done with CI continues to decline and there are fewer deferred load redemptions. Other revenue was also lower in 2015 primarily as a result of lower revenues earned from Marret offset somewhat by an increase in gains on the sale of marketable securities.
Expenses
SG&A expenses for the Asset Management segment were $305.6 million for the year ended December 31, 2015, an increase from $279.2 million for the year ended December 31, 2014. As a percentage of average assets under management, SG&A expenses declined to 0.282% in 2015 from 0.284% in 2014, as spending increased 9.5% and average assets were up 10.1%. Certain expenses are fixed in nature and CI benefits from scale as its AUM grows. A portion of the cost savings relative to asset growth was used to fund increased spending on sales and marketing initiatives and on increasing portfolio management staff.
Trailer fees were $577.9 million for 2015, up 8.3% from $533.4 million for 2014. Net of inter-segment amounts, this expense was $553.6 million for the year ended December 31, 2015 versus $511.6 million for the year ended December 31, 2014. The change in trailer fee expense was a function of the change in average AUM as well as the change in the asset mix. The change in asset mix, where trailers are not paid on specific classes of funds, pushed trailer fee expense lower as a percentage of average AUM. However, the trend towards more front-end retail business, where trailer fees are typically higher, has helped mitigate the decline.
Amortization of deferred sales commissions and intangibles was $149.8 million for 2015, down from $158.1 million for the prior year. This change is consistent with the decline in deferred sales commissions paid over the past several years and the amount of accelerated amortization related to redemptions of deferred load funds.
Other expenses were $23.8 million for the year ended December 31, 2015 compared to $10.1 million in the year ended December 31, 2014. The increase in these expenses is primarily due to the $10.8 million ($9.8 million after tax) provision for fund remediation and $3.0 million ($1.4 million after tax and non-controlling interest) acceleration in the amortization of fund management contracts mentioned earlier.
Income before income taxes and interest expense for CI’s principal segment was $773.3 million for 2015 compared with $732.7 million in 2014. The 5.5% increase from the prior year was lower than the 10.1% change in average AUM due to the lower average management fee rate and the other provisions and adjustments discussed above. Excluding these, income before income taxes and interest expense for CI’s principal segment increased 7.4% from the prior year.
Annual Report | 46 | December 31, 2015
| MANAGEMENT’S DISCUSSION & ANALYSIS |
QUARTER ENDED DECEMBER 31, 2015
Revenues
Revenues from management fees were $444.8 million for the quarter ended December 31, 2015, an increase of 3.8% from $428.5 million for the quarter ended December 31, 2014 and a decrease of 1.0% from $449.4 million for the quarter ended September 30, 2015. The changes were partly attributable to the change in average assets under management, which were up 7.5% and up 0.1% from the quarters ended December 31, 2014 and September 30, 2015, respectively. The average management fee rate, as a percentage of average AUM, declined from 1.681% in the fourth quarter of 2014 and 1.643% in the third quarter of 2015 to 1.623% in the fourth quarter of 2015 as a result of the change in asset mix towards classes of funds designated for high net worth clients/fee-based accounts, which have lower management fee rates than traditional retail funds.
The asset management margin for the 12-month period ended December 31, 2015 was 42.5%, a decrease from 42.6% in the 12-month period ended September 30, 2015 and an increase from 42.0% in the 12-month period ended December 31, 2014. The year-over-year increase is primarily due to the reduction in amortization of DSC. The asset management margin for the fourth quarter of 2015 was 42.0%, compared to 42.3% in the fourth quarter of 2014. Calculations and definitions of asset management margin can be found in the “Non-IFRS Measures” section and in Table 8.
For the quarter ended December 31, 2015, other revenue was $6.8 million versus $15.6 million and $8.5 million for the quarters ended December 31, 2014 and September 30, 2015, respectively. The largest component of other revenue is redemption fees, which were $4.2 million for the quarter ended December 31, 2015 compared with $4.9 million and $4.6 million for the quarters ended December 31, 2014 and September 30, 2015, respectively. The fourth quarter of 2015 included a $0.4 million gain on the sale of marketable securities, compared to a gain of $1.7 million in the previous quarter and nil in the fourth quarter of 2014. The fourth quarter of 2014 also included a $5.0 million fair value adjustment to contingent consideration.
Expenses
SG&A expenses for the Asset Management segment were $79.7 million for the quarter ended December 31, 2015, an 11.8% increase from $71.3 million for the fourth quarter in 2014 and up 4.3% from $76.4 million for the quarter ended September 30, 2015. As a percentage of average AUM, SG&A expenses were 0.291% for the quarter ended December 31, 2015, up from 0.280% for the quarter ended December 31, 2014 and 0.279% in the quarter ended September 30, 2015. The rate of increase in spend year over year was slightly greater than the change in average AUM as CI continued to invest in sales initiatives and portfolio management.
Another measure that CI uses to assess its ability to control spending is the SG&A efficiency margin, as discussed in the “Non-IFRS Measures” section and as set out in Table 9. CI’s current quarter SG&A efficiency margin decreased to 70.1% compared to 71.8% in the fourth quarter of last year, and the current trailing 12-month SG&A efficiency margin of 71.3% has decreased from 71.5% in the same period in 2014 as CI has spent an increased proportion of the amount available after deducting trailer fees and amortization of DSC from management fees to support sales, marketing and investment management initiatives.
Trailer fees were $143.8 million for the quarter ended December 31, 2015, up 4.7% from $137.4 million for the quarter ended December 31, 2014 and down 1.3% from $145.7 million for the quarter ended September 30, 2015. Net of inter-segment amounts, this expense was $137.7 million for the quarter ended December 31, 2015 versus $131.8 million for the fourth
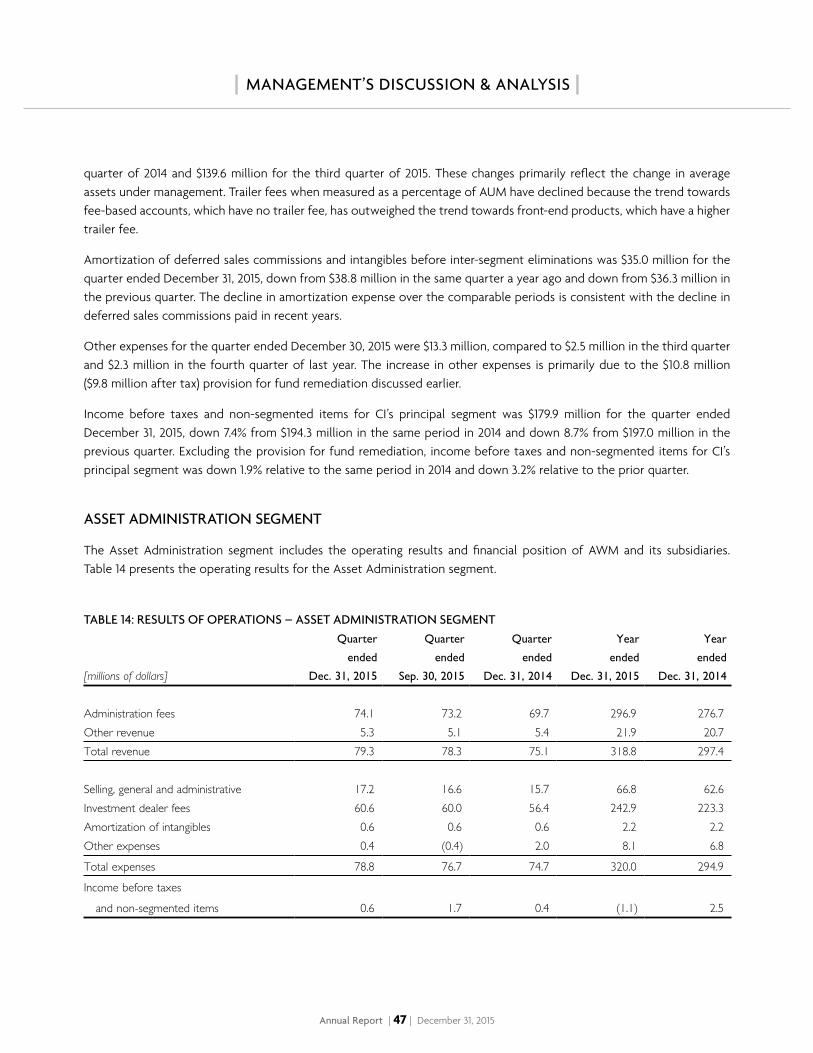
Annual Report | 47 | December 31, 2015
| MANAGEMENT’S DISCUSSION & ANALYSIS |
quarter of 2014 and $139.6 million for the third quarter of 2015. These changes primarily reflect the change in average assets under management. Trailer fees when measured as a percentage of AUM have declined because the trend towards fee-based accounts, which have no trailer fee, has outweighed the trend towards front-end products, which have a higher trailer fee.
Amortization of deferred sales commissions and intangibles before inter-segment eliminations was $35.0 million for the quarter ended December 31, 2015, down from $38.8 million in the same quarter a year ago and down from $36.3 million in the previous quarter. The decline in amortization expense over the comparable periods is consistent with the decline in deferred sales commissions paid in recent years.
Other expenses for the quarter ended December 30, 2015 were $13.3 million, compared to $2.5 million in the third quarter and $2.3 million in the fourth quarter of last year. The increase in other expenses is primarily due to the $10.8 million ($9.8 million after tax) provision for fund remediation discussed earlier.
Income before taxes and non-segmented items for CI’s principal segment was $179.9 million for the quarter ended December 31, 2015, down 7.4% from $194.3 million in the same period in 2014 and down 8.7% from $197.0 million in the previous quarter. Excluding the provision for fund remediation, income before taxes and non-segmented items for CI’s principal segment was down 1.9% relative to the same period in 2014 and down 3.2% relative to the prior quarter.
ASSET ADMINISTRATION SEGMENT
The Asset Administration segment includes the operating results and financial position of AWM and its subsidiaries. Table 14 presents the operating results for the Asset Administration segment.
TABLE 14: RESULTS OF OPERATIONS – ASSET ADMINISTRATION SEGMENT
[millions of dollars]
Quarter
ended
Dec. 31, 2015
Quarter
ended
Sep. 30, 2015
Quarter
ended
Dec. 31, 2014
Year
ended
Dec. 31, 2015
Year
ended
Dec. 31, 2014
Administration fees 74.1 73.2 69.7 296.9 276.7Other revenue 5.3 5.1 5.4 21.9 20.7Total revenue 79.3 78.3 75.1 318.8 297.4
Selling, general and administrative 17.2 16.6 15.7 66.8 62.6Investment dealer fees 60.6 60.0 56.4 242.9 223.3Amortization of intangibles 0.6 0.6 0.6 2.2 2.2Other expenses 0.4 (0.4) 2.0 8.1 6.8
Total expenses 78.8 76.7 74.7 320.0 294.9
Income before taxes
and non-segmented items 0.6 1.7 0.4 (1.1) 2.5
Annual Report | 48 | December 31, 2015
| MANAGEMENT’S DISCUSSION & ANALYSIS |
YEAR ENDED DECEMBER 31, 2015
Revenues
Administration fees are earned on assets under administration in the AWM business and from the administration of third-party business. These fees were $296.9 million for the year ended December 31, 2015, an increase of 7.3% from $276.7 million in 2014. Net of inter-segment amounts, administration fee revenue was $146.6 million for the year ended December 31, 2015, up from $141.3 million for the year ended December 31, 2014. The increase in administration fees from the prior year is mainly a result of higher asset-based revenues such as trailer fees earned from higher average assets under administration. Administration fees should be considered in conjunction with investment dealer fees, an expense that represents the payout to financial advisors.
Other revenues earned by the Asset Administration segment are generally derived from non-advisor related activities. For 2015, other revenues were $21.9 million, increasing from $20.7 million for 2014.
Expenses
Investment dealer fees represent the payout to advisors on revenues they generate and were $242.9 million for the year ended December 31, 2015, compared to $223.3 million for the year ended December 31, 2014. The increase in these fees relates directly to the increase in administration fee revenues discussed above.
As discussed in the “Non-IFRS Measures” section and as set out in Table 6, dealer gross margin was $54.0 million or 18.2% of administration fee revenue for 2015, compared to $53.4 million or 19.3% for 2014. The change in gross margin from the prior period relates to the change in average investment dealer fees paid out to financial advisors on their administration fees. Generally, as an advisor’s assets under administration and corresponding fee revenues grow, the payout rate to the advisor will increase up to a maximum payout rate.
SG&A expenses for the segment were $66.8 million for the year ended December 31, 2015 compared to $62.6 million in the year ended December 31, 2014. The 6.7% increase was largely due to an increase in the level of discretionary spending.
The Asset Administration segment had a loss before income taxes and non-segmented items of $1.1 million for 2015, down from income before income taxes and non-segmented items of $2.5 million in 2014. This decrease was primarily due to the reduction in dealer gross margin discussed earlier.
Annual Report | 49 | December 31, 2015
| MANAGEMENT’S DISCUSSION & ANALYSIS |
QUARTER ENDED DECEMBER 31, 2015
Revenues
Administration fees were $74.1 million for the quarter ended December 31, 2015, an increase of 6.3% from $69.7 million for the same period a year ago and an increase of 1.2% from the prior quarter. The change in administration fees is primarily attributable to the change in AUA, which increased from $29.7 billion on December 31, 2014 to $30.7 billion on September 30, 2015 and then to $31.9 billion on December 31, 2015. Net of inter-segment amounts, administration fee revenue was $36.6 million for the quarter ended December 31, 2015, up from $35.4 million for the quarter ended December 31, 2014 and up from $36.0 million in the previous quarter.
As mentioned above, other revenues earned by the Asset Administration segment are mainly comprised of non-advisor related activities. For the quarter ended December 31, 2015, other revenues were $5.3 million, down from $5.4 million for the fourth quarter of 2014 and up from $5.1 million in the third quarter of 2015.
Expenses
Investment dealer fees were $60.6 million for the quarter ended December 31, 2015 compared to $56.4 million for the fourth quarter of 2014 and $60.0 million for the quarter ended September 30, 2015.
As discussed in the “Non-IFRS Measures” section of this MD&A and as set out in Table 6, dealer gross margin was $13.4 million or 18.1% of administration fee revenue for the quarter ended December 31, 2015 compared to $13.3 million or 19.1% for the fourth quarter of 2014 and $13.2 million or 18.1% for the previous quarter. The changes in gross margin from the comparable quarters correspond primarily to the level of payout to financial advisors on their 12-month rolling administration fee revenues. The advisor payout rate generally increases as their 12-month rolling administration fee revenue increases.
SG&A expenses for the segment were $17.2 million for the quarter ended December 31, 2015 compared to $15.7 million in the fourth quarter of 2014 and $16.6 million in the third quarter of 2015. The change in SG&A expenses is largely attributable to the level of discretionary spend each quarter.
The Asset Administration segment had income before taxes and non-segmented items of $0.6 million for the quarter ended December 31, 2015, compared to income of $0.4 million for the fourth quarter of 2014 and income of $1.7 million for the prior quarter.
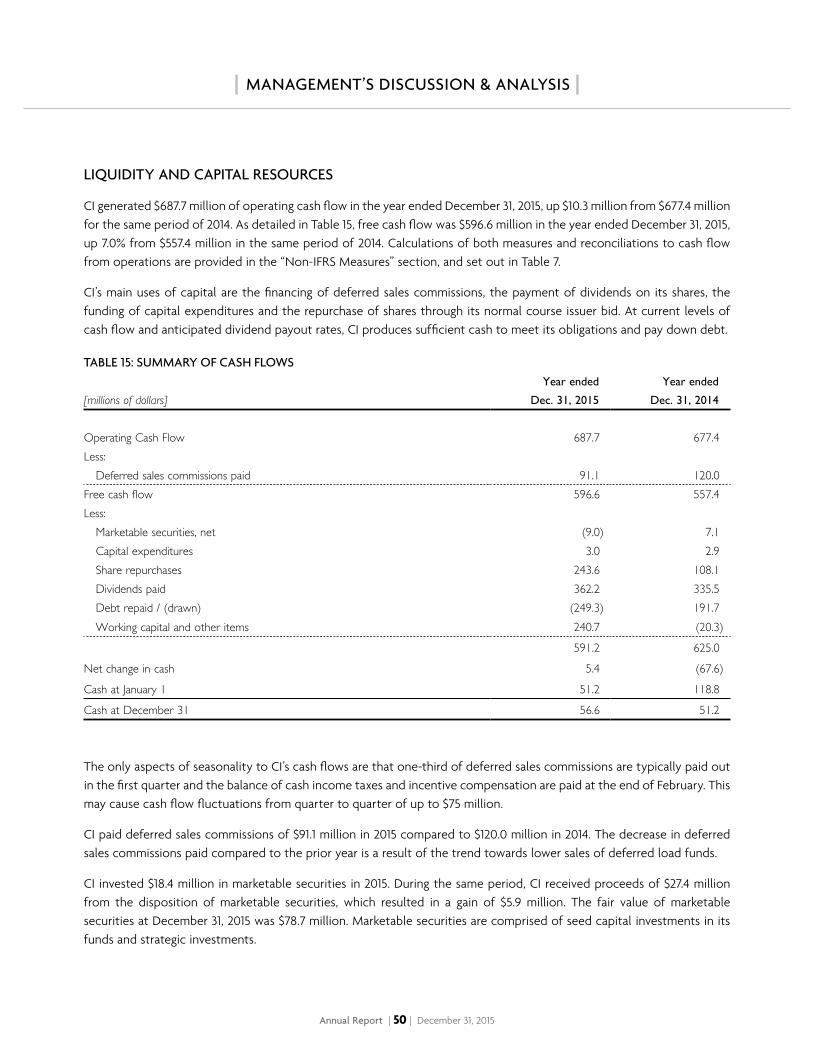
Annual Report | 50 | December 31, 2015
| MANAGEMENT’S DISCUSSION & ANALYSIS |
LIQUIDITY AND CAPITAL RESOURCES
CI generated $687.7 million of operating cash flow in the year ended December 31, 2015, up $10.3 million from $677.4 million for the same period of 2014. As detailed in Table 15, free cash flow was $596.6 million in the year ended December 31, 2015, up 7.0% from $557.4 million in the same period of 2014. Calculations of both measures and reconciliations to cash flow from operations are provided in the “Non-IFRS Measures” section, and set out in Table 7.
CI’s main uses of capital are the financing of deferred sales commissions, the payment of dividends on its shares, the funding of capital expenditures and the repurchase of shares through its normal course issuer bid. At current levels of cash flow and anticipated dividend payout rates, CI produces sufficient cash to meet its obligations and pay down debt.
TABLE 15: SUMMARY OF CASH FLOWS
[millions of dollars]
Year ended
Dec. 31, 2015
Year ended
Dec. 31, 2014
Operating Cash Flow 687.7 677.4Less:
Deferred sales commissions paid 91.1 120.0Free cash flow 596.6 557.4Less:
Marketable securities, net (9.0) 7.1Capital expenditures 3.0 2.9Share repurchases 243.6 108.1Dividends paid 362.2 335.5Debt repaid / (drawn) (249.3) 191.7Working capital and other items 240.7 (20.3)
591.2 625.0
Net change in cash 5.4 (67.6)
Cash at January 1 51.2 118.8
Cash at December 31 56.6 51.2
The only aspects of seasonality to CI’s cash flows are that one-third of deferred sales commissions are typically paid out in the first quarter and the balance of cash income taxes and incentive compensation are paid at the end of February. This may cause cash flow fluctuations from quarter to quarter of up to $75 million.
CI paid deferred sales commissions of $91.1 million in 2015 compared to $120.0 million in 2014. The decrease in deferred sales commissions paid compared to the prior year is a result of the trend towards lower sales of deferred load funds.
CI invested $18.4 million in marketable securities in 2015. During the same period, CI received proceeds of $27.4 million from the disposition of marketable securities, which resulted in a gain of $5.9 million. The fair value of marketable securities at December 31, 2015 was $78.7 million. Marketable securities are comprised of seed capital investments in its funds and strategic investments.
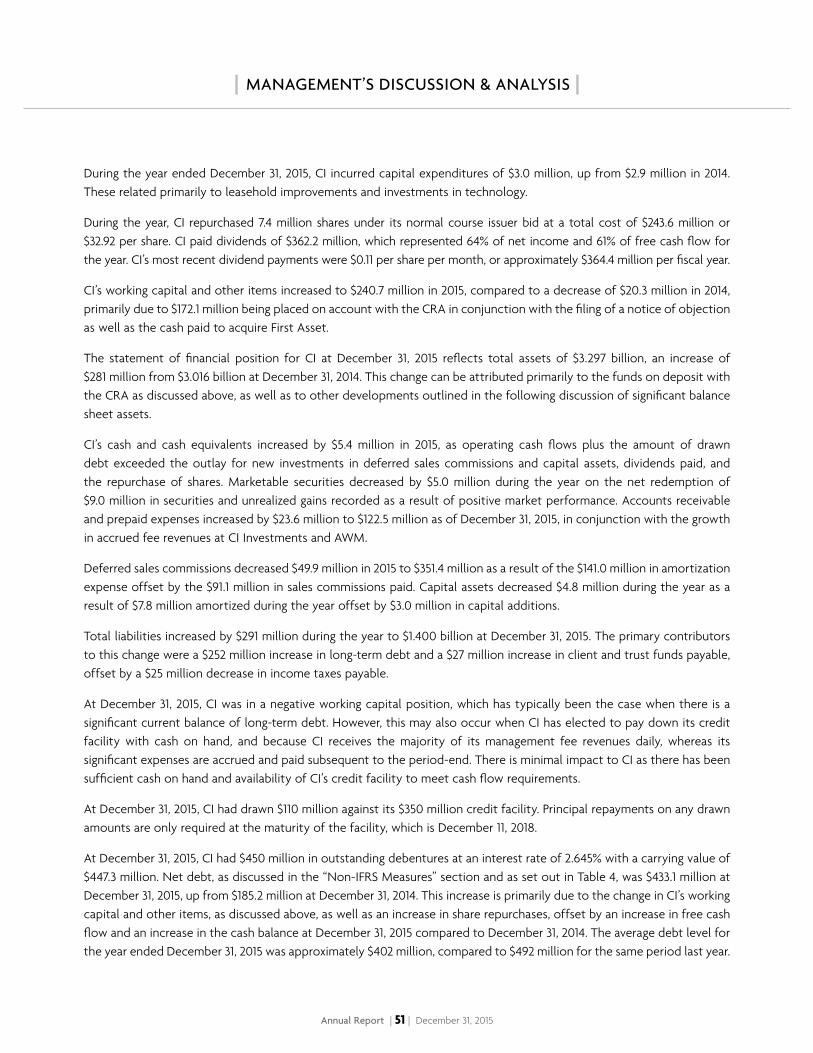
Annual Report | 51 | December 31, 2015
| MANAGEMENT’S DISCUSSION & ANALYSIS |
During the year ended December 31, 2015, CI incurred capital expenditures of $3.0 million, up from $2.9 million in 2014. These related primarily to leasehold improvements and investments in technology.
During the year, CI repurchased 7.4 million shares under its normal course issuer bid at a total cost of $243.6 million or $32.92 per share. CI paid dividends of $362.2 million, which represented 64% of net income and 61% of free cash flow for the year. CI’s most recent dividend payments were $0.11 per share per month, or approximately $364.4 million per fiscal year.
CI’s working capital and other items increased to $240.7 million in 2015, compared to a decrease of $20.3 million in 2014, primarily due to $172.1 million being placed on account with the CRA in conjunction with the filing of a notice of objection as well as the cash paid to acquire First Asset.
The statement of financial position for CI at December 31, 2015 reflects total assets of $3.297 billion, an increase of $281 million from $3.016 billion at December 31, 2014. This change can be attributed primarily to the funds on deposit with the CRA as discussed above, as well as to other developments outlined in the following discussion of significant balance sheet assets.
CI’s cash and cash equivalents increased by $5.4 million in 2015, as operating cash flows plus the amount of drawn debt exceeded the outlay for new investments in deferred sales commissions and capital assets, dividends paid, and the repurchase of shares. Marketable securities decreased by $5.0 million during the year on the net redemption of $9.0 million in securities and unrealized gains recorded as a result of positive market performance. Accounts receivable and prepaid expenses increased by $23.6 million to $122.5 million as of December 31, 2015, in conjunction with the growth in accrued fee revenues at CI Investments and AWM.
Deferred sales commissions decreased $49.9 million in 2015 to $351.4 million as a result of the $141.0 million in amortization expense offset by the $91.1 million in sales commissions paid. Capital assets decreased $4.8 million during the year as a result of $7.8 million amortized during the year offset by $3.0 million in capital additions.
Total liabilities increased by $291 million during the year to $1.400 billion at December 31, 2015. The primary contributors to this change were a $252 million increase in long-term debt and a $27 million increase in client and trust funds payable, offset by a $25 million decrease in income taxes payable.
At December 31, 2015, CI was in a negative working capital position, which has typically been the case when there is a significant current balance of long-term debt. However, this may also occur when CI has elected to pay down its credit facility with cash on hand, and because CI receives the majority of its management fee revenues daily, whereas its significant expenses are accrued and paid subsequent to the period-end. There is minimal impact to CI as there has been sufficient cash on hand and availability of CI’s credit facility to meet cash flow requirements.
At December 31, 2015, CI had drawn $110 million against its $350 million credit facility. Principal repayments on any drawn amounts are only required at the maturity of the facility, which is December 11, 2018.
At December 31, 2015, CI had $450 million in outstanding debentures at an interest rate of 2.645% with a carrying value of $447.3 million. Net debt, as discussed in the “Non-IFRS Measures” section and as set out in Table 4, was $433.1 million at December 31, 2015, up from $185.2 million at December 31, 2014. This increase is primarily due to the change in CI’s working capital and other items, as discussed above, as well as an increase in share repurchases, offset by an increase in free cash flow and an increase in the cash balance at December 31, 2015 compared to December 31, 2014. The average debt level for the year ended December 31, 2015 was approximately $402 million, compared to $492 million for the same period last year.
Annual Report | 52 | December 31, 2015
| MANAGEMENT’S DISCUSSION & ANALYSIS |
CI’s ratio of debt to EBITDA and net debt to EBITDA were 0.6 to 1 and 0.5 to 1, respectively, which provides CI with significant financial flexibility for future debt financing. CI’s intention is to maintain the ratio of net debt to EBITDA between 0.5 to 1 and 0.75 to 1 as it is expected that free cash flow will be returned to shareholders. CI is within its financial covenants with respect to its credit facility, which requires that the debt to EBITDA ratio remain below 2.5 to 1, and assets under management not fall below $60 billion, based on a rolling 30-day average.
Shareholders’ equity was $1.894 billion at December 31, 2015, a decrease of $8.6 million for the year, which approximates net income less dividends and share repurchases.
RISK MANAGEMENT
There is risk inherent in the conduct of a wealth management business. Some factors which introduce or exacerbate risk are within the control of management and others are, by their nature, outside of direct control but must still be managed. Effective risk management is a key component to achieving CI’s business objectives. It is an on-going process involving the Board of Directors, management and other personnel. Management has developed an enterprise wide approach to risk management that involves executives in each core business unit and operating area of CI. These executives identify and evaluate risks, applying both a quantitative and a qualitative analysis and then assess the likelihood of occurrence of a particular risk event. They then identify mitigating factors or strategies and a course for implementing mitigation procedures to bring each risk event to an acceptable risk level.
MARKET RISK
Market risk is the risk of a financial loss resulting from adverse changes in underlying market factors, such as interest rates, foreign exchange rates, and equity and commodity prices. A description of each component of market risk is described below:
– Interest rate risk is the risk of gain or loss due to the volatility of interest rates.
– Foreign exchange rate risk is the risk of gain or loss due to volatility of foreign exchange rates.
– Equity risk is the risk of gain or loss due to the changes in prices and volatility of individual equity instruments and equity indexes.
CI’s financial performance is indirectly exposed to market risk. Any decline in financial markets or lack of sustained growth in such markets may result in a corresponding decline in performance and may adversely affect CI’s assets under management, management fees and revenues, which would reduce cash flow to CI and ultimately impact CI’s ability to pay dividends.
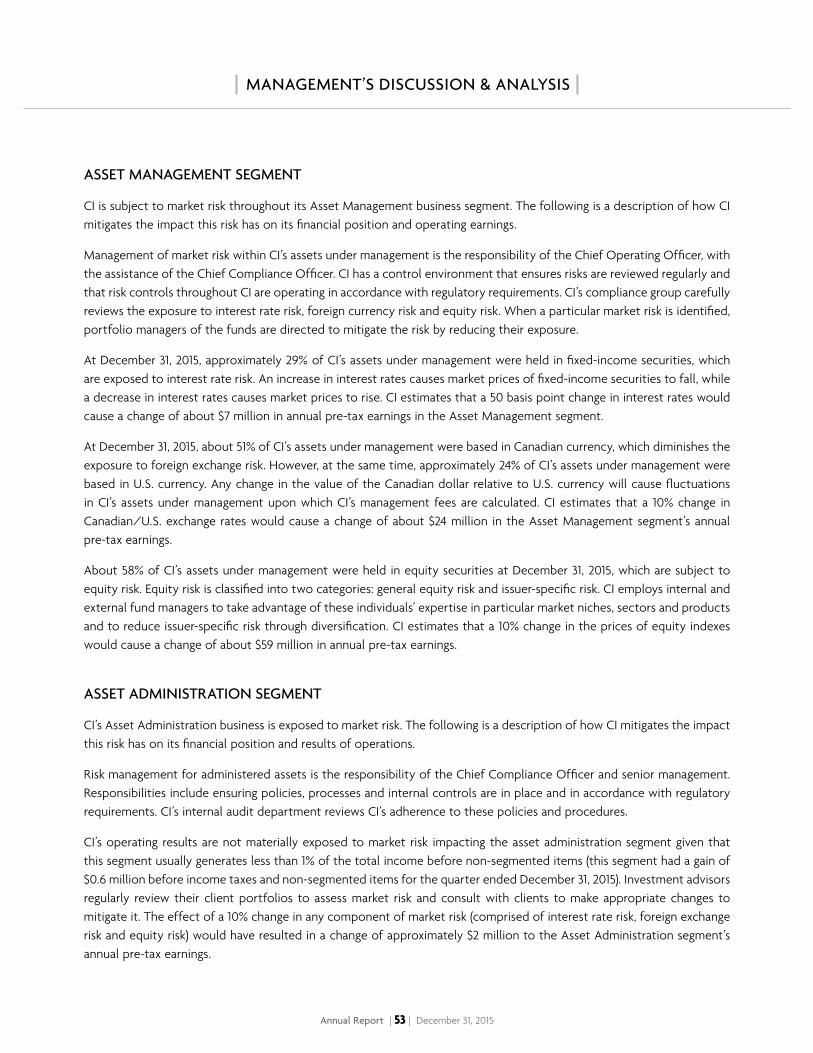
Annual Report | 53 | December 31, 2015
| MANAGEMENT’S DISCUSSION & ANALYSIS |
ASSET MANAGEMENT SEGMENT
CI is subject to market risk throughout its Asset Management business segment. The following is a description of how CI mitigates the impact this risk has on its financial position and operating earnings.
Management of market risk within CI’s assets under management is the responsibility of the Chief Operating Officer, with the assistance of the Chief Compliance Officer. CI has a control environment that ensures risks are reviewed regularly and that risk controls throughout CI are operating in accordance with regulatory requirements. CI’s compliance group carefully reviews the exposure to interest rate risk, foreign currency risk and equity risk. When a particular market risk is identified, portfolio managers of the funds are directed to mitigate the risk by reducing their exposure.
At December 31, 2015, approximately 29% of CI’s assets under management were held in fixed-income securities, which are exposed to interest rate risk. An increase in interest rates causes market prices of fixed-income securities to fall, while a decrease in interest rates causes market prices to rise. CI estimates that a 50 basis point change in interest rates would cause a change of about $7 million in annual pre-tax earnings in the Asset Management segment.
At December 31, 2015, about 51% of CI’s assets under management were based in Canadian currency, which diminishes the exposure to foreign exchange risk. However, at the same time, approximately 24% of CI’s assets under management were based in U.S. currency. Any change in the value of the Canadian dollar relative to U.S. currency will cause fluctuations in CI’s assets under management upon which CI’s management fees are calculated. CI estimates that a 10% change in Canadian/U.S. exchange rates would cause a change of about $24 million in the Asset Management segment’s annual pre-tax earnings.
About 58% of CI’s assets under management were held in equity securities at December 31, 2015, which are subject to equity risk. Equity risk is classified into two categories: general equity risk and issuer-specific risk. CI employs internal and external fund managers to take advantage of these individuals’ expertise in particular market niches, sectors and products and to reduce issuer-specific risk through diversification. CI estimates that a 10% change in the prices of equity indexes would cause a change of about $59 million in annual pre-tax earnings.
ASSET ADMINISTRATION SEGMENT
CI’s Asset Administration business is exposed to market risk. The following is a description of how CI mitigates the impact this risk has on its financial position and results of operations.
Risk management for administered assets is the responsibility of the Chief Compliance Officer and senior management. Responsibilities include ensuring policies, processes and internal controls are in place and in accordance with regulatory requirements. CI’s internal audit department reviews CI’s adherence to these policies and procedures.
CI’s operating results are not materially exposed to market risk impacting the asset administration segment given that this segment usually generates less than 1% of the total income before non-segmented items (this segment had a gain of $0.6 million before income taxes and non-segmented items for the quarter ended December 31, 2015). Investment advisors regularly review their client portfolios to assess market risk and consult with clients to make appropriate changes to mitigate it. The effect of a 10% change in any component of market risk (comprised of interest rate risk, foreign exchange risk and equity risk) would have resulted in a change of approximately $2 million to the Asset Administration segment’s annual pre-tax earnings.
Annual Report | 54 | December 31, 2015
| MANAGEMENT’S DISCUSSION & ANALYSIS |
CREDIT RISK
Credit risk is the risk of loss associated with the inability of a third party to fulfill its payment obligations. CI is exposed to the risk that third parties that owe it money, securities or other assets will not perform their obligations. These parties include trading counterparties, customers, clearing agents, exchanges, clearing houses and other financial intermediaries, as well as issuers whose securities are held by CI. These parties may default on their obligations due to bankruptcy, lack of liquidity, operational failure or other reasons. CI does not have significant exposure to any individual counterparty. Credit risk is mitigated by regularly monitoring the credit performance of individual counterparties and holding collateral where appropriate.
One of the primary sources of credit risk arises when CI extends credit to clients to purchase securities by way of margin lending. Margin loans are due on demand and are collateralized by the financial instruments in the client’s account. CI faces a risk of financial loss in the event a client fails to meet a margin call if market prices for securities held as collateral decline and if CI is unable to recover sufficient value from the collateral held. The credit extended is limited by regulatory requirements and by CI’s internal credit policy. Credit risk is managed by dealing with counterparties CI believes to be creditworthy and by actively monitoring credit and margin exposure and the financial health of the counterparties. CI has concluded that current economic and credit conditions have not significantly impacted its financial assets.
LIQUIDITY RISK
Liquidity risk is the risk that CI may not be able to generate sufficient funds and within the time required in order to meet its obligations as they come due. While CI currently has access to financing, unfavourable market conditions may affect the ability of CI to obtain loans or make other arrangements on terms acceptable to CI.
STRATEGIC RISKS
Strategic risks are risks that directly impact the overall direction of CI and the ability of CI to successfully implement proposed strategies. The key strategic risk is the risk that management fails to anticipate, and respond to changes in the business environment including demographic and competitive changes. CI’s performance is directly affected by financial market and business conditions, including the legislation and policies of the governments and regulatory authorities having jurisdiction over CI’s operations. These are beyond the control of CI; however, an important part of the risk management process is the ongoing review and assessment of industry and economic trends and changes. Strategies are then designed to mitigate the impact of any anticipated changes, including the introduction of new products and cost control strategies.
Annual Report | 55 | December 31, 2015
| MANAGEMENT’S DISCUSSION & ANALYSIS |
DISTRIBUTION RISK
CI distributes its investment products through a number of distribution channels, including brokers, independent financial planners and insurance advisors. CI’s access to these distribution channels is impacted by the strength of the relationship with certain business partners and the level of competition faced from the financial institutions that own those channels. While CI continues to develop and enhance existing relationships, there can be no assurance that CI will continue to enjoy the level of access that it has in the past, which would adversely affect its sales of investment products.
OPERATIONAL RISKS
Operational risks are risks related to the actions, or failure in the processes, that support the business, including administration, information technology, product development and marketing. The administrative services provided by CI depend on software supplied by third-party suppliers. Failure of a key supplier, the loss of these suppliers’ products, or problems or errors related to such products would have a material adverse effect on the ability of CI to provide these administrative services. Changes to the pricing arrangement with such third-party suppliers because of upgrades or other circumstances could have an adverse effect upon the profitability of CI. There can be no assurances that CI’s systems will operate or that CI will be able to prevent an extended systems failure in the event of a subsystem component or software failure or in the event of an earthquake, fire or any other natural disaster, or a power or telecommunications failure. Any systems failure that causes interruptions in the operations of CI could have a material adverse effect on its business, financial condition and operating results. CI may also experience losses in connection with employee errors. Although expenses incurred by CI in connection with employee errors have not been significant in the past, there can be no assurances that these expenses will not increase in the future.
INFORMATION TECHNOLOGY RISK
CI uses information technology and the internet to streamline business operations and to improve client and advisor experience. However, with the use of information technology and the internet, CI is exposed to information technology events that could potentially have an adverse impact on its business. These events could result in unauthorized access to sensitive information, theft and operational disruption. While CI is actively monitoring this risk and continues to develop controls to protect against cyber threats that are becoming more sophisticated and pervasive, it is possible that CI may not be able to fully mitigate the risk associated with information technology security.
TAXATION RISK
CI is subject to various uncertainties concerning the interpretation and application of Canadian tax laws. If tax authorities disagree with CI’s application of such tax laws, CI’s profitability and cash flows could be adversely affected. CI Investments is considered a large case file by the Canada Revenue Agency and, as such, is subject to audit each year. There is a significant lag between the end of a fiscal year and when such audits are completed. Therefore, at any given time, several years may be open for audit and/or adjustment.
Annual Report | 56 | December 31, 2015
| MANAGEMENT’S DISCUSSION & ANALYSIS |
COMPETITION
CI operates in a highly competitive environment, with competition based on a variety of factors, including the range of products offered, brand recognition, investment performance, business reputation, financing strength, the strength and continuity of institutional, management and sales relationships, quality of service, level of fees charged and level of commissions and other compensation paid. CI competes with a large number of mutual fund companies and other providers of investment products, investment management firms, broker-dealers, banks, insurance companies and other financial institutions. Some of these competitors have greater capital and other resources, and offer more comprehensive lines of products and services than CI. The trend toward greater consolidation within the investment management industry has increased the strength of a number of CI’s competitors. Additionally, there are few barriers to entry by new investment management firms, and the successful efforts of new entrants have resulted in increased competition. CI’s competitors seek to expand market share by offering different products and services than those offered by CI. While CI continues to develop and market new products and services, there can be no assurance that CI will maintain its current standing or market share, and that may adversely affect the business, financial condition or operating results of CI.
REGULATORY AND LEGAL RISK
Certain subsidiaries of CI are heavily regulated in all jurisdictions where they carry on business. Laws and regulations applied at the national and provincial level generally grant governmental agencies and self-regulatory bodies broad administrative discretion over the activities of CI, including the power to limit or restrict business activities as well as impose additional disclosure requirements on CI products and services. Possible sanctions include the revocation or imposition of conditions on licenses to operate certain businesses, the suspension or expulsion from a particular market or jurisdiction of any of CI’s business segments or its key personnel or financial advisors, and the imposition of fines and censures. It is also possible that the laws and regulations governing a subsidiary’s operations or particular investment products or services could be amended or interpreted in a manner that is adverse to CI. To the extent that existing or future regulations affecting the sale or offering of CI’s product or services or CI’s investment strategies cause or contribute to reduced sales of CI’s products or lower margins or impair the investment performance of CI’s products, CI’s aggregate assets under management and its revenues may be adversely affected.
Given the nature of CI’s business, CI may from time to time be subject to claims or complaints from investors or others in the normal course of business. The legal risks facing CI, its directors, officers, employees or agents in this respect include potential liability for violations of securities laws, breach of fiduciary duty and misuse of investors’ funds. Some violations of securities laws and breach of fiduciary duty could result in civil liability, fines, sanctions, or expulsion from a self-regulatory organization or the suspension or revocation of CI’s subsidiaries’ right to carry on their existing business. CI may incur significant costs in connection with such potential liabilities.
Annual Report | 57 | December 31, 2015
| MANAGEMENT’S DISCUSSION & ANALYSIS |
CAPITAL RISK
Certain subsidiaries of CI are subject to minimum regulatory capital requirements. This may require CI to keep sufficient cash and other liquid assets on hand to maintain capital requirements rather than using them in connection with its business. Failure to maintain required regulatory capital by CI may subject it to fines, suspension or revocation of registration by the relevant securities regulator. A significant operating loss by a registrant subsidiary or an unusually large charge against regulatory capital could adversely affect the ability of CI to expand or even maintain its present level of business, which could have a material adverse effect on CI’s business, results of operations, financial condition and prospects.
KEY PERSONNEL RISK
The success of CI and its strategic focus is dependent to a significant degree upon the contributions of senior management. The loss of any of these individuals, or an inability to attract, retain and motivate sufficient numbers of qualified senior management personnel on the part of CI, could adversely affect CI’s business. CI has not purchased any “key man” insurance with respect to any of its directors, officers or key employees and has no current plans to do so.
The success of CI is also dependent upon, among other things, the skills and expertise of its human resources, including the management and investment personnel and its personnel with skills related to, among other things, marketing, risk management, credit, information technology, accounting, administrative operations and legal affairs. These individuals play an important role in developing, implementing, operating, managing and distributing CI’s products and services. Accordingly, the recruitment of competent personnel, continuous training and transfer of knowledge are key activities that are essential to CI’s performance. In addition, the growth in total assets under management in the industry and the reliance on investment performance to sell financial products have increased the demand for experienced and high-performing portfolio managers. Compensation packages for these managers may increase at a rate well in excess of inflation and well above the rates of increase observed in other industries and the rest of the labour market. CI believes that it has the resources necessary for the operation of CI’s business. The loss of these individuals or an inability to attract, retain and motivate a sufficient number of qualified personnel could adversely affect CI’s business.
The market for financial advisors is extremely competitive and is increasingly characterized by frequent movement by financial advisors among different firms. Individual financial advisors of AWM have regular direct contact with clients, which can lead to a strong and personal client relationship based on the client’s trust in the individual financial advisor. The loss of a significant number of financial advisors could lead to the loss of client accounts which could have a material adverse effect on the results of operations and prospects of AWM and, in turn, CI. Although AWM uses or has used a combination of competitive compensation structures and equity with vesting provisions as a means of seeking to retain financial advisors, there can be no assurance that financial advisors will remain with AWM.
Annual Report | 58 | December 31, 2015
| MANAGEMENT’S DISCUSSION & ANALYSIS |
INSURANCE RISK
CI maintains various types of insurance which include financial institution bonds, errors and omissions insurance, directors’, trustees’ and officers’ liability insurance, agents’ insurance and general commercial liability insurance. There can be no assurance that a claim or claims will not exceed the limits of available insurance coverage, that any insurer will remain solvent or willing to continue providing insurance coverage with sufficient limits or at a reasonable cost or that any insurer will not dispute coverage of certain claims due to ambiguities in the relevant policies. A judgment against CI in excess of available coverage could have a material adverse effect on CI both in terms of damages awarded and the impact on the reputation of CI.
SHARE CAPITAL
As at December 31, 2015, CI had 276,026,778 shares outstanding.
At December 31, 2015, 7.0 million options to purchase shares were outstanding, of which 2.0 million options were exercisable.
CONTRACTUAL OBLIGATIONS
The table that follows summarizes CI’s contractual obligations at December 31, 2015.
PAYMENTS DUE BY YEAR
[millions of dollars] Total
1 year
or less 2 3 4 5
More than
5 years
Long-term debt 562.0 2.0 — 110.0 — 450.0 —Operating leases 101.2 12.4 11.7 10.8 10.4 9.8 46.1Total 663.2 14.4 11.7 120.8 10.4 459.8 46.1
Annual Report | 59 | December 31, 2015
| MANAGEMENT’S DISCUSSION & ANALYSIS |
SIGNIFICANT ACCOUNTING ESTIMATES
The December 31, 2015 Consolidated Financial Statements have been prepared in accordance with IFRS. For a discussion of all significant accounting policies, refer to Note 1 of the Notes to the Consolidated Financial Statements. Included in the Notes to the Consolidated Financial Statements is Note 2, which provides a discussion regarding the methodology used for business acquisitions. Included in the Notes to the Consolidated Financial Statements is Note 4, which provides a discussion regarding the recoverable amount of CI’s goodwill and intangible assets compared to its carrying value.
DISCLOSURE CONTROLS AND INTERNAL CONTROLS OVER FINANCIAL REPORTING
The Chief Executive Officer (“CEO”) and the Chief Financial Officer (“CFO”), together with management, are responsible for the design of CI’s disclosure controls and procedures. Management has evaluated, with participation of the CEO and CFO, the effectiveness of the disclosure controls and procedures as at December 31, 2015. Based on this evaluation, the CEO and CFO have concluded that they are reasonably assured these Disclosure Controls and Procedures were effective and that material information relating to CI was made known to them within the time periods specified under applicable securities legislation.
Management, under the supervision of the CEO and CFO, is responsible for the design and maintenance of adequate internal controls over financial reporting for the purposes of providing reasonable assurance regarding the reliability of financial reporting and the preparation of financial statements for external purposes in accordance with IFRS. However, due to its inherent limitations, internal controls over financial reporting can only provide reasonable, not absolute, assurance that the financial statements are free of misstatements. The COSO framework was used to assist management, along with the CEO and CFO, in the evaluation of these internal control systems. Management, under the direction of the CEO and CFO, has concluded that the internal controls over financial reporting are effective. Management used various tools to evaluate internal controls over financial reporting which included interaction with key control systems, review of policy and procedure documentation, observation or reperformance of control procedures to evaluate the effectiveness of controls and concluded that these controls are effective. For the quarter ended December 31, 2015, there have been no changes to the internal controls over financial reporting that have materially affected, or are reasonably likely to affect, internal controls over financial reporting.
Additional information relating to CI, including the most recent audited financial statements, management information circular and annual information form, is available on SEDAR at www.sedar.com.
Annual Report | 60 | December 31, 2015
CONSOLIDATED FINANCIAL STATEMENTS
31 | DECEMBER | 2015
CI FINANCIAL CORP
Annual Report | 61 | December 31, 2015
TO THE SHAREHOLDERS OF CI FINANCIAL CORP
We have audited the accompanying consolidated financial statements of CI Financial Corp. [“CI”], which comprise the consolidated statements of financial position as at December 31, 2015 and 2014, and the consolidated statements of income and comprehensive income, changes in shareholders’ equity and cash flows for the years then ended, and a summary of significant accounting policies and other explanatory information.
Management’s responsibility for the consolidated financial statementsManagement is responsible for the preparation and fair presentation of these consolidated financial statements in accordance with International Financial Reporting Standards, and for such internal control as management determines is necessary to enable the preparation of consolidated financial statements that are free from material misstatement, whether due to fraud or error.
Auditors’ responsibilityOur responsibility is to express an opinion on these consolidated financial statements based on our audits. We conducted our audits in accordance with Canadian generally accepted auditing standards. Those standards require that we comply with ethical requirements and plan and perform the audit to obtain reasonable assurance about whether the consolidated financial statements are free from material misstatement.
An audit involves performing procedures to obtain audit evidence about the amounts and disclosures in the consolidated financial statements. The procedures selected depend on the auditors’ judgment, including the assessment of the risks of material misstatement of the consolidated financial statements, whether due to fraud or error. In making those risk assessments, the auditors consider internal control relevant to the entity’s preparation and fair presentation of the consolidated financial statements in order to design audit procedures that are appropriate in the circumstances, but not for the purpose of expressing an opinion on the effectiveness of the entity’s internal control. An audit also includes evaluating the appropriateness of accounting policies used and the reasonableness of accounting estimates made by management, as well as evaluating the overall presentation of the consolidated financial statements.
We believe that the audit evidence we have obtained in our audits is sufficient and appropriate to provide a basis for our audit opinion.
OpinionIn our opinion, the consolidated financial statements present fairly, in all material respects, the financial position of CI as at December 31, 2015 and 2014, and its financial performance and its cash flows for the years then ended in accordance with International Financial Reporting Standards.
Toronto, CanadaFebruary 10, 2016
| INDEPENDENT AUDITORS’ REPORT |
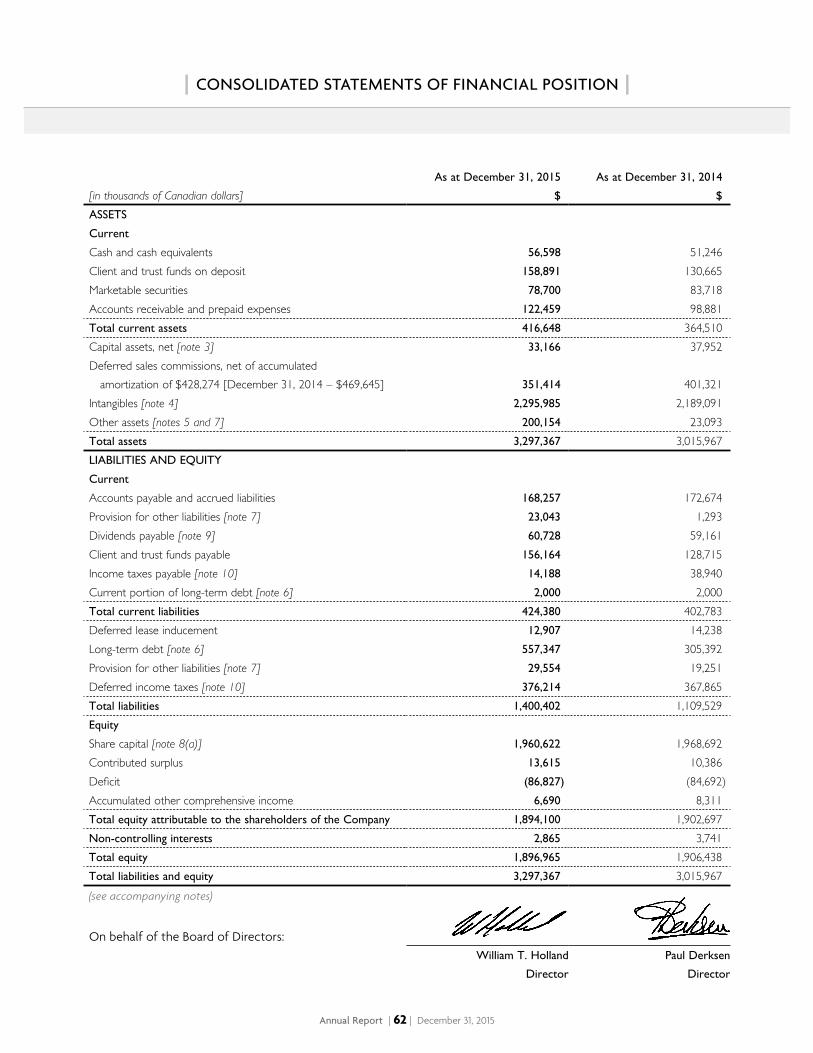
Annual Report | 62 | December 31, 2015
[in thousands of Canadian dollars]
As at December 31, 2015
$
As at December 31, 2014
$
ASSETS
Current
Cash and cash equivalents 56,598 51,246 Client and trust funds on deposit 158,891 130,665 Marketable securities 78,700 83,718 Accounts receivable and prepaid expenses 122,459 98,881 Total current assets 416,648 364,510 Capital assets, net [note 3] 33,166 37,952 Deferred sales commissions, net of accumulated amortization of $428,274 [December 31, 2014 – $469,645] 351,414 401,321 Intangibles [note 4] 2,295,985 2,189,091 Other assets [notes 5 and 7] 200,154 23,093 Total assets 3,297,367 3,015,967 LIABILITIES AND EQUITY
Current
Accounts payable and accrued liabilities 168,257 172,674 Provision for other liabilities [note 7] 23,043 1,293 Dividends payable [note 9] 60,728 59,161 Client and trust funds payable 156,164 128,715 Income taxes payable [note 10] 14,188 38,940 Current portion of long-term debt [note 6] 2,000 2,000 Total current liabilities 424,380 402,783 Deferred lease inducement 12,907 14,238 Long-term debt [note 6] 557,347 305,392 Provision for other liabilities [note 7] 29,554 19,251 Deferred income taxes [note 10] 376,214 367,865 Total liabilities 1,400,402 1,109,529 Equity
Share capital [note 8(a)] 1,960,622 1,968,692 Contributed surplus 13,615 10,386 Deficit (86,827) (84,692)Accumulated other comprehensive income 6,690 8,311 Total equity attributable to the shareholders of the Company 1,894,100 1,902,697 Non-controlling interests 2,865 3,741 Total equity 1,896,965 1,906,438 Total liabilities and equity 3,297,367 3,015,967 (see accompanying notes)
On behalf of the Board of Directors:William T. Holland
Director
Paul Derksen
Director
| CONSOLIDATED STATEMENTS OF FINANCIAL POSITION |
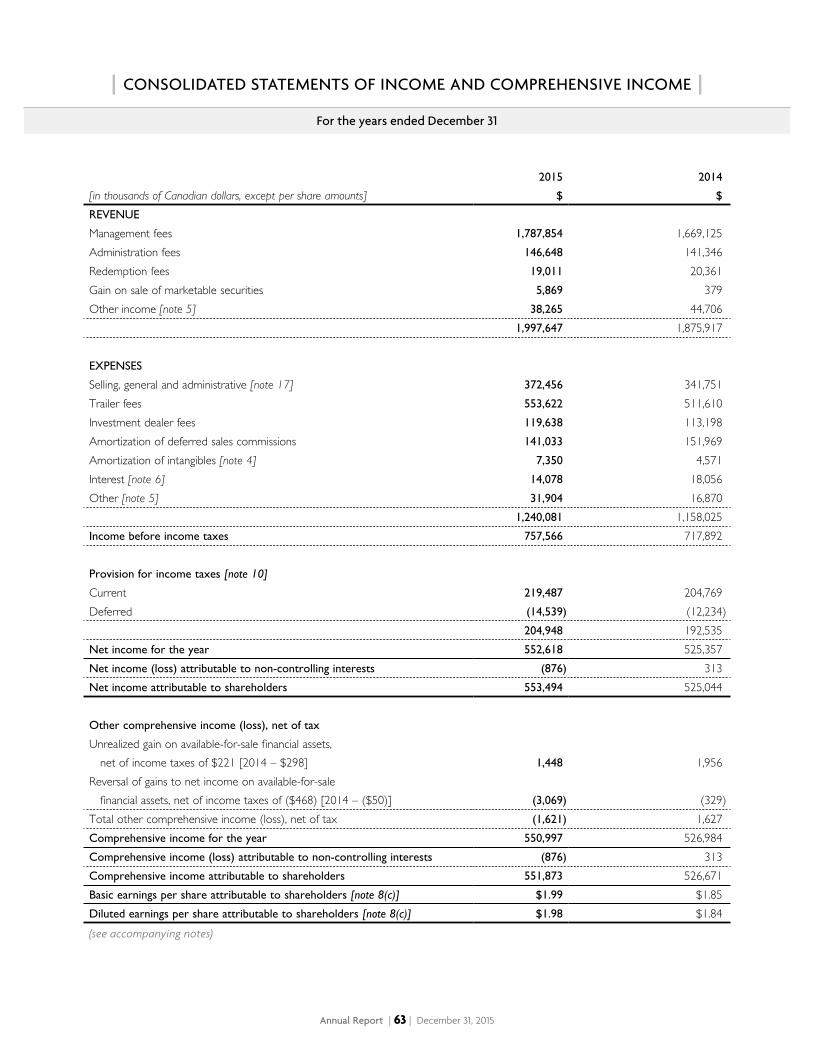
Annual Report | 63 | December 31, 2015
[in thousands of Canadian dollars, except per share amounts]
2015
$
2014
$
REVENUE
Management fees 1,787,854 1,669,125 Administration fees 146,648 141,346 Redemption fees 19,011 20,361 Gain on sale of marketable securities 5,869 379 Other income [note 5] 38,265 44,706
1,997,647 1,875,917
EXPENSES
Selling, general and administrative [note 17] 372,456 341,751 Trailer fees 553,622 511,610 Investment dealer fees 119,638 113,198 Amortization of deferred sales commissions 141,033 151,969 Amortization of intangibles [note 4] 7,350 4,571 Interest [note 6] 14,078 18,056 Other [note 5] 31,904 16,870
1,240,081 1,158,025 Income before income taxes 757,566 717,892
Provision for income taxes [note 10]
Current 219,487 204,769 Deferred (14,539) (12,234)
204,948 192,535 Net income for the year 552,618 525,357 Net income (loss) attributable to non-controlling interests (876) 313 Net income attributable to shareholders 553,494 525,044
Other comprehensive income (loss), net of tax
Unrealized gain on available-for-sale financial assets, net of income taxes of $221 [2014 – $298] 1,448 1,956 Reversal of gains to net income on available-for-sale financial assets, net of income taxes of ($468) [2014 – ($50)] (3,069) (329)Total other comprehensive income (loss), net of tax (1,621) 1,627 Comprehensive income for the year 550,997 526,984 Comprehensive income (loss) attributable to non-controlling interests (876) 313 Comprehensive income attributable to shareholders 551,873 526,671 Basic earnings per share attributable to shareholders [note 8(c)] $1.99 $1.85 Diluted earnings per share attributable to shareholders [note 8(c)] $1.98 $1.84 (see accompanying notes)
| CONSOLIDATED STATEMENTS OF INCOME AND COMPREHENSIVE INCOME |
For the years ended December 31
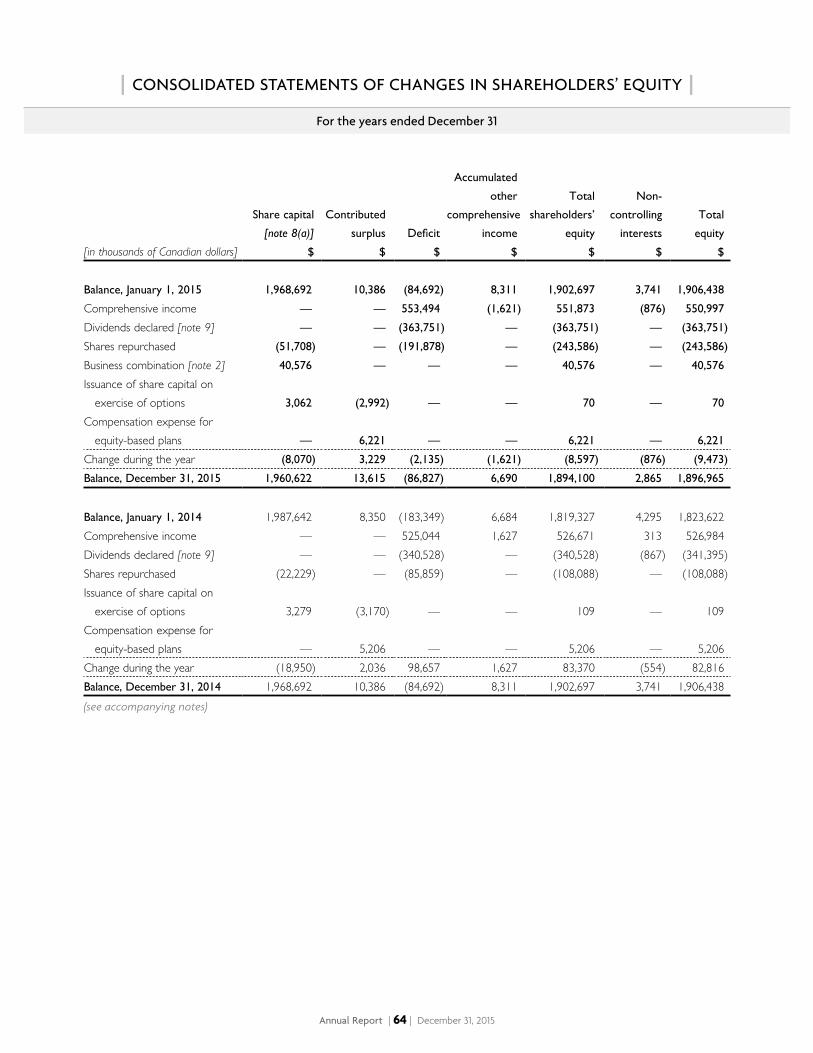
Annual Report | 64 | December 31, 2015
[in thousands of Canadian dollars]
Share capital
[note 8(a)]
$
Contributed
surplus
$
Deficit
$
Accumulated
other
comprehensive
income
$
Total
shareholders’
equity
$
Non-
controlling
interests
$
Total
equity
$
Balance, January 1, 2015 1,968,692 10,386 (84,692) 8,311 1,902,697 3,741 1,906,438
Comprehensive income — — 553,494 (1,621) 551,873 (876) 550,997
Dividends declared [note 9] — — (363,751) — (363,751) — (363,751)
Shares repurchased (51,708) — (191,878) — (243,586) — (243,586)
Business combination [note 2] 40,576 — — — 40,576 — 40,576
Issuance of share capital on exercise of options 3,062 (2,992) — — 70 — 70
Compensation expense for equity-based plans — 6,221 — — 6,221 — 6,221
Change during the year (8,070) 3,229 (2,135) (1,621) (8,597) (876) (9,473)
Balance, December 31, 2015 1,960,622 13,615 (86,827) 6,690 1,894,100 2,865 1,896,965
Balance, January 1, 2014 1,987,642 8,350 (183,349) 6,684 1,819,327 4,295 1,823,622 Comprehensive income — — 525,044 1,627 526,671 313 526,984 Dividends declared [note 9] — — (340,528) — (340,528) (867) (341,395)Shares repurchased (22,229) — (85,859) — (108,088) — (108,088)Issuance of share capital on exercise of options 3,279 (3,170) — — 109 — 109 Compensation expense for equity-based plans — 5,206 — — 5,206 — 5,206 Change during the year (18,950) 2,036 98,657 1,627 83,370 (554) 82,816 Balance, December 31, 2014 1,968,692 10,386 (84,692) 8,311 1,902,697 3,741 1,906,438(see accompanying notes)
| CONSOLIDATED STATEMENTS OF CHANGES IN SHAREHOLDERS’ EQUITY |
For the years ended December 31
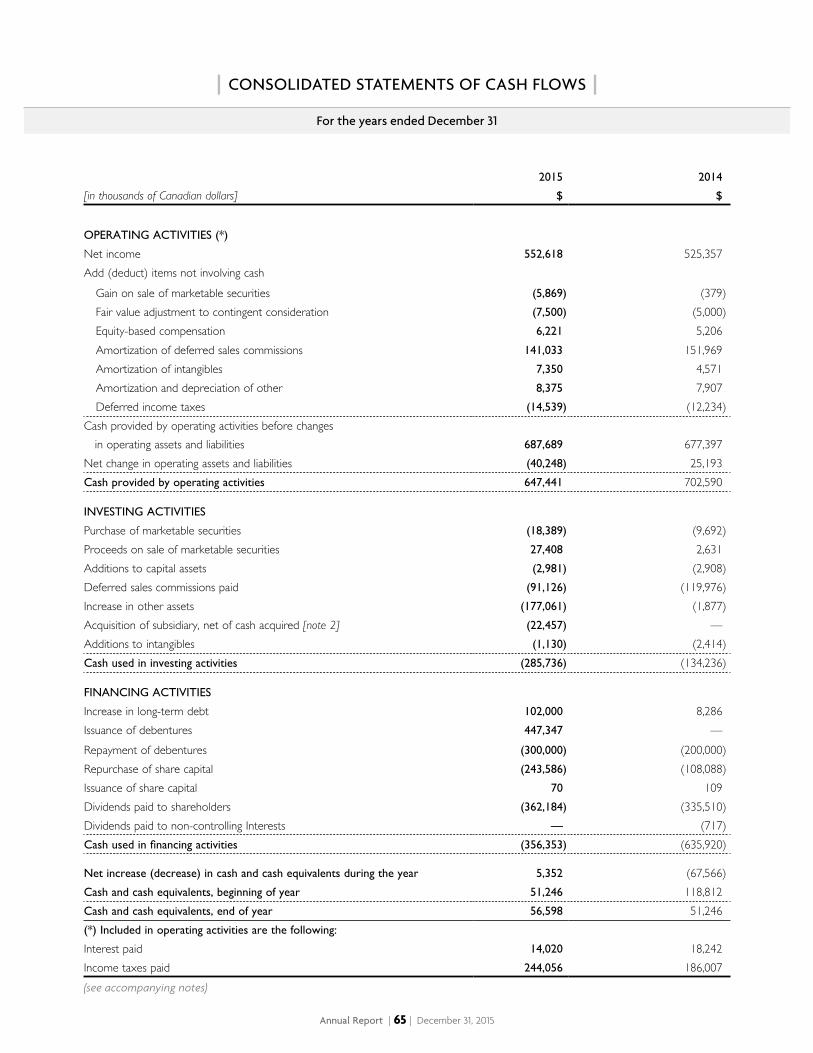
Annual Report | 65 | December 31, 2015
[in thousands of Canadian dollars]
2015
$
2014
$
OPERATING ACTIVITIES (*)
Net income 552,618 525,357 Add (deduct) items not involving cash
Gain on sale of marketable securities (5,869) (379)Fair value adjustment to contingent consideration (7,500) (5,000)Equity-based compensation 6,221 5,206 Amortization of deferred sales commissions 141,033 151,969 Amortization of intangibles 7,350 4,571 Amortization and depreciation of other 8,375 7,907 Deferred income taxes (14,539) (12,234)
Cash provided by operating activities before changes in operating assets and liabilities 687,689 677,397 Net change in operating assets and liabilities (40,248) 25,193Cash provided by operating activities 647,441 702,590
INVESTING ACTIVITIES
Purchase of marketable securities (18,389) (9,692)Proceeds on sale of marketable securities 27,408 2,631 Additions to capital assets (2,981) (2,908)Deferred sales commissions paid (91,126) (119,976)Increase in other assets (177,061) (1,877)Acquisition of subsidiary, net of cash acquired [note 2] (22,457) — Additions to intangibles (1,130) (2,414)Cash used in investing activities (285,736) (134,236)
FINANCING ACTIVITIES
Increase in long-term debt 102,000 8,286 Issuance of debentures 447,347 —Repayment of debentures (300,000) (200,000)Repurchase of share capital (243,586) (108,088)Issuance of share capital 70 109 Dividends paid to shareholders (362,184) (335,510)Dividends paid to non-controlling Interests — (717)Cash used in financing activities (356,353) (635,920)
Net increase (decrease) in cash and cash equivalents during the year 5,352 (67,566)Cash and cash equivalents, beginning of year 51,246 118,812 Cash and cash equivalents, end of year 56,598 51,246 (*) Included in operating activities are the following:
Interest paid 14,020 18,242 Income taxes paid 244,056 186,007 (see accompanying notes)
For the years ended December 31
| CONSOLIDATED STATEMENTS OF CASH FLOWS |
DECEMBER 31, 2015 and 2014 [in thousands of dollars, except per share amounts]
Annual Report | 66 | December 31, 2015
| NOTES TO CONSOLIDATED FINANCIAL STATEMENTS |
CI Financial Corp. [“CI”] is incorporated under the laws of the Province of Ontario. CI’s primary business is the management and distribution of a broad range of financial products and services, including mutual funds, segregated funds, exchange traded funds, financial planning, insurance, investment advice, wealth management and estate and succession planning.
1 SUMMARY OF SIGNIFICANT ACCOUNTING POLICIES
These consolidated financial statements of CI have been prepared in accordance with International Financial Reporting Standards [“IFRS”] as issued by the International Accounting Standards Board [“IASB”].
These consolidated financial statements were authorized for issuance by the Board of Directors of CI on February 10, 2016.
BASIS OF PRESENTATION
The consolidated financial statements of CI have been prepared on a historical cost basis, except for certain financial instruments that have been measured at fair value. The consolidated financial statements have been prepared on a going concern basis. CI’s presentation currency is the Canadian dollar. The functional currency of CI and its subsidiaries is also the Canadian dollar.
BASIS OF CONSOLIDATION
The consolidated financial statements include the accounts of CI, CI Investments Inc. [“CI Investments”] and Assante Wealth Management (Canada) Ltd. [“AWM”] and their subsidiaries, which are entities over which CI has control. Control exists when CI has the power, directly or indirectly, to govern the financial and operating policies of an entity, is exposed to variable returns from its activities, and is able to use its power to affect such variable returns to which it is exposed. Hereinafter, CI and its subsidiaries are referred to as CI.
CI holds a controlling 65% interest in Marret Asset Management Inc. [“Marret”]. A non-controlling interest is recorded in the consolidated statement of income and comprehensive income to reflect the non-controlling interest’s share of the net income and comprehensive income, and a non-controlling interest is recorded within equity in the consolidated statement of financial position to reflect the non-controlling interest’s share of the net assets of Marret.
CI manages a range of mutual funds, segregated funds, structured products and other funds that meet the definition of structured entities under IFRS. CI earns fees for providing management and administrative services to these investment funds. Fees are calculated on assets under management in these funds which totalled $111.1 billion as at December 31, 2015 [2014 – $102.9 billion]. CI does not consolidate these investment funds because the form of fees and ownership interest are not significant enough to meet the definition of control under IFRS. CI provides no guarantees against the risk of financial loss to the investors of these investment funds.
DECEMBER 31, 2015 and 2014 [in thousands of dollars, except per share amounts]
Annual Report | 67 | December 31, 2015
| NOTES TO CONSOLIDATED FINANCIAL STATEMENTS |
REVENUE RECOGNITION
Revenue is recognized to the extent that it is probable that economic benefits will flow to CI and the revenue can be reliably measured. Revenue is measured at the fair value of the consideration received or receivable. In addition to these general principles, CI applies the following specific revenue recognition policies:
Management fees are based upon the net asset value of the funds managed by CI and are recognized on an accrual basis.
Administration fees and other income are recognized as services are provided under contractual arrangements. Administration fees include commission revenue, which is recorded on a trade date basis and advisory fees, which are recorded when the services related to the underlying engagements are completed.
Redemption fees payable by securityholders of deferred sales charge mutual funds, the sales commission of which was financed by CI, are recognized as revenue on the trade date of the redemption of the applicable mutual fund securities.
FINANCIAL INSTRUMENTS
Financial assets are classified at fair value through profit or loss [“FVPL”], available-for-sale [“AFS”] or loans and receivables. Financial liabilities are classified as FVPL or other.
Financial instruments are recognized initially at fair value. Transaction costs that are directly attributable to the acquisition or issue of a financial instrument classified as other than at FVPL are added to the carrying amount of the asset or liability. Financial instruments classified as FVPL are carried at fair value in the statement of financial position and any gains or losses are recorded in net income in the period in which they arise. Financial instruments classified as FVPL include cash and cash equivalents as well as contingent consideration included in provision for other liabilities.
Financial assets classified as AFS are carried at fair value in the statement of financial position. Movements in the fair value are recorded in other comprehensive income until disposed, at which time the cumulative amount recorded in comprehensive income is recognized in net income. Where there is objective evidence that an AFS asset is impaired, the cumulative impairment loss is reclassified from other comprehensive income to net income with subsequent movements also recognized in net income. Financial assets classified as AFS include marketable securities.
Loans and receivables and other financial liabilities are recognized at amortized cost using the effective interest rate method. Such accounts include client and trust funds on deposits, accounts receivable, accounts payable and accrued liabilities, dividends payable, client and trust funds payable, provision for other liabilities and long-term debt.
Cash and cash equivalents
Cash and cash equivalents include cash on deposit, highly liquid investments and interest bearing deposits with original maturities of 90 days or less.
DECEMBER 31, 2015 and 2014 [in thousands of dollars, except per share amounts]
Annual Report | 68 | December 31, 2015
| NOTES TO CONSOLIDATED FINANCIAL STATEMENTS |
Client and trust funds
Client and trust funds on deposit include amounts representing cash held in trust with Canadian financial institutions for clients in respect of self-administered Registered Retirement Savings Plans and Registered Retirement Income Funds, and amounts received from clients for which the settlement date on the purchase of securities has not occurred or accounts in which the clients maintain a cash balance. Client and trust funds on deposit also include amounts for client transactions that are entered into on either a cash or margin basis and recorded on the trade date of the transaction. Amounts are due from clients on the settlement date of the transaction for cash accounts. For margin accounts, CI extends credit to a client for the purchase of securities, collateralized by the financial instruments in the client’s account. Amounts loaned are limited by margin regulations of the Investment Industry Regulatory Organization of Canada [“IIROC”] and other regulatory authorities, and are subject to CI’s credit review and daily monitoring procedures. The corresponding liabilities related to the above accounts and transactions are included in client and trust funds payable.
Marketable securities
Marketable securities consist of investments in mutual fund securities. Marketable securities are measured at fair value and recognized on trade date. Mutual fund securities are valued using the net asset value per unit of each fund. Realized and unrealized gains and losses are recognized using average cost. Except for impairment losses, gains and losses in the fair value of marketable securities are recorded as other comprehensive income until disposed of, at which time any gain or loss is recorded in net income. When a decline in fair value is other than temporary and there is objective evidence of impairment, the cumulative loss that had been recognized directly in other comprehensive income is removed and recognized in net income, even though the financial asset has not been derecognized. Distributions from mutual fund securities are recorded as other income. Distributions that are reinvested increase the cost base of the marketable securities.
FAIR VALUE MEASUREMENT
CI uses valuation techniques to determine the fair value of financial instruments where active market quotes are not available. This involves developing estimates and assumptions consistent with how market participants would price the instrument. CI bases its assumptions on observable data as far as possible but this is not always available. In that case management uses the best information available.
All assets and liabilities for which fair value is measured or disclosed in the financial statements are categorized within the fair value hierarchy, described as follows, based on the lowest level input that is significant to the fair value measurement as a whole:
• Level 1 – valuation based on quoted prices (unadjusted) observed in active markets for identical assets or liabilities.
• Level 2 – valuation techniques based on inputs that are quoted prices of similar instruments in active markets; quoted prices for identical or similar instruments in markets that are not active; inputs other than quoted prices used in a valuation model that are observable for that instrument; and inputs that are derived from or corroborated by observable market data by correlation or other means.
• Level 3 – valuation techniques with significant unobservable market inputs.
For assets and liabilities that are recognized in the financial statements on a recurring basis, CI determines whether transfers have occurred between levels in the hierarchy by re-assessing categorization at the end of each reporting period.
DECEMBER 31, 2015 and 2014 [in thousands of dollars, except per share amounts]
Annual Report | 69 | December 31, 2015
| NOTES TO CONSOLIDATED FINANCIAL STATEMENTS |
CAPITAL ASSETS
Capital assets are recorded at cost less accumulated amortization. These assets are amortized over their estimated useful lives as follows:
Computer hardware Straight-line over three yearsOffice equipment Straight-line over five yearsLeasehold improvements Straight-line over the term of the lease
BUSINESS COMBINATIONS
The acquisition method of accounting is used to account for the acquisition of subsidiaries by CI, whereby the purchase consideration is allocated to the identifiable assets and liabilities on the basis of fair value at the date of acquisition. Provisional fair values allocated at a reporting date are finalized as soon as the relevant information is available, within a period not to exceed twelve months from the acquisition date, with retroactive restatement of the impact of adjustments to those provisional fair values effective as at the acquisition date.
CI elects on a transaction-by-transaction basis whether to measure any non-controlling interest at fair value, or at the proportionate share of the recognized amount of the identifiable net assets of the acquired subsidiary, at the acquisition date.
Consideration transferred includes the fair values of the assets transferred, liabilities incurred and equity interests issued by CI. Consideration also includes the fair value of any contingent consideration. Subsequent to the acquisition, contingent consideration that is based on an earnings target and classified as a liability is measured at fair value with any resulting gain or loss recognized in net income. Acquisition-related costs are expensed as incurred.
INTANGIBLES
Fund contracts
Fund administration contracts and fund management contracts [collectively, “fund contracts”] are recorded net of any write-down for impairment. CI evaluates the carrying amounts of fund contracts for potential impairment by comparing the recoverable amount with their carrying amounts. These evaluations are performed on an annual basis or more frequently if events or changes in circumstances indicate a potential impairment. Any impairment would be written off to income.
Fund administration contracts are amortized on a straight-line basis over 25 years. Fund management contracts with a finite life are amortized on a straight-line basis over a period of up to 20 years, depending on the contractual terms of such agreements and management’s best estimate of their useful lives. Fund management contracts with an indefinite life are not amortized.
DECEMBER 31, 2015 and 2014 [in thousands of dollars, except per share amounts]
Annual Report | 70 | December 31, 2015
| NOTES TO CONSOLIDATED FINANCIAL STATEMENTS |
Goodwill
Goodwill is recorded as the excess of purchase price over identifiable assets acquired. Following initial recognition, goodwill is stated at cost less any accumulated impairment losses. Goodwill is evaluated for impairment at least annually and any impairment is recognized immediately in income and not subsequently reversed. Goodwill is allocated to the appropriate cash-generating unit for the purpose of impairment testing.
Other intangibles
Other intangibles include the costs of trademarks and computer software, capitalized where it is probable that future economic benefits that are attributable to the assets will flow to CI and the cost of the assets can be measured reliably. Computer software is recorded initially at cost and amortized over its expected useful life of two to ten years on a straight-line basis. Trademarks have an indefinite life and are not amortized.
Deferred sales commissions
Commissions paid on sales of deferred sales charge mutual funds represent commissions paid by CI to brokers and dealers, and are recorded on the trade date of the sale of the applicable mutual fund product. Deferred sales commissions are amortized over the expected investment period of 24 to 84 months on a straight-line basis from the date recorded. When redemptions occur, the actual investment period is shorter than expected, and the unamortized deferred sales commission related to the original investment in the mutual funds is charged to net income and included in the amortization of deferred sales commissions.
EQUITY-BASED COMPENSATION
CI uses the fair value method to account for equity-settled employee incentive share options. The value of the equity-based compensation, as at the date of grant, is recognized over the applicable vesting period as compensation expense with a corresponding increase in contributed surplus. When options are exercised, the proceeds received, together with the amount in contributed surplus, are credited to share capital.
The amount recognized as an expense is adjusted to reflect the number of awards for which the related service conditions are expected to be met, such that the amount ultimately recognized as an expense is based on the number of awards that do meet the related service condition at the vesting date.
DEFERRED LEASE INDUCEMENTS
Lease inducements are deferred and amortized on a straight-line basis over the term of the lease.
DECEMBER 31, 2015 and 2014 [in thousands of dollars, except per share amounts]
Annual Report | 71 | December 31, 2015
| NOTES TO CONSOLIDATED FINANCIAL STATEMENTS |
INCOME TAXES
Current income tax liabilities are measured at the amount expected to be paid to tax authorities, net of recoveries based on the tax rates and laws enacted or substantively enacted at the statement of financial position date.
The liability method of tax allocation is used in accounting for income taxes. Under this method, deferred income tax assets and liabilities are determined based on differences between the carrying amount and tax basis of assets and liabilities and measured using the substantively enacted tax rates and laws that will be in effect when the differences are expected to reverse. Deferred tax assets are recognized to the extent that it is probable that taxable profits will be available against which deductible temporary differences can be utilized. Deferred tax liabilities are generally recognized for all taxable temporary differences.
Deferred tax liabilities are recognized for taxable temporary differences arising in investments in subsidiaries and joint ventures except where the reversal of the temporary difference can be controlled and it is probable that the difference will not reverse in the foreseeable future. Deferred tax liabilities are not recognized on temporary differences that arise from the initial recognition of goodwill which is not deductible for tax purposes. Deferred tax assets and liabilities are not recognized in respect of temporary differences that arise on initial recognition of assets and liabilities acquired other than in a business combination.
PROVISION FOR OTHER LIABILITIES
A provision for other liabilities is recognized if, as a result of a past event, CI has a present legal or constructive obligation that can be estimated reliably, and it is probable that an outflow of economic benefits will be required to settle the obligation. In the event that the time value of money is material, provisions are determined by discounting the expected future cash flows at a pre-tax rate that reflects a current market assessment of the time value of money and the risks specific to the liability.
FOREIGN CURRENCY TRANSLATION
Monetary assets and liabilities are translated into Canadian dollars using the exchange rates in effect at the statement of financial position date. Non-monetary assets and liabilities are translated into Canadian dollars using historical exchange rates. Revenue and expenses are translated at average rates prevailing during the month. Other foreign currency transactions are translated into Canadian dollars using the exchange rate in effect on the transaction date. Translation exchange gains and losses are included in other income in the month in which they occur.
DECEMBER 31, 2015 and 2014 [in thousands of dollars, except per share amounts]
Annual Report | 72 | December 31, 2015
| NOTES TO CONSOLIDATED FINANCIAL STATEMENTS |
CRITICAL ACCOUNTING ESTIMATES AND JUDGMENTS
In the process of applying CI’s accounting policies, management has made significant judgments involving estimates and assumptions which are summarized as follows:
(i) Impairment of intangible assets
Finite life intangible assets, including deferred sales commissions, are reviewed for impairment whenever events or changes in circumstances indicate that the carrying amount may not be recoverable. Indefinite life intangible assets, including goodwill, are tested for impairment annually or more frequently if changes in circumstances indicate that the carrying amount may be impaired. The values associated with intangibles involve estimates and assumptions, including those with respect to future cash inflows and outflows, discount rates and asset lives. These estimates require significant judgment regarding market growth rates, fund flow assumptions, expected margins and costs which could affect CI’s future results if the current estimates of future performance and fair values change. These determinations also affect the amount of amortization expense on intangible assets with finite lives recognized in future periods.
(ii) Deferred tax assets
Deferred tax assets are recognized for unused tax losses to the extent that it is probable that taxable profits will be available against which the losses can be utilized. Significant management judgment is required to determine the amount of deferred tax assets that can be recognized, based upon the likely timing and level of future taxable profits together with future tax planning strategies.
(iii) Provision for other liabilities
Due to the nature of provisions, a considerable part of their determination is based on estimates and judgments, including assumptions concerning the future. The actual outcome of these uncertain factors may be materially different from the estimates, causing differences with the estimated provisions. Further details are provided in Note 7.
(iv) Share-based payments
The cost of employee services received (compensation expense) in exchange for awards of equity instruments recognized is estimated using a Black-Scholes option valuation model which requires the use of assumptions. Further details regarding the assumptions used in the option pricing model are provided in Note 8 [b].
(v) Business combinations
Business combinations require management to exercise judgement in measuring the fair value of the assets acquired and liabilities and contingent liabilities incurred or assumed.
DECEMBER 31, 2015 and 2014 [in thousands of dollars, except per share amounts]
Annual Report | 73 | December 31, 2015
| NOTES TO CONSOLIDATED FINANCIAL STATEMENTS |
2 BUSINESS ACQUISITION
On November 30, 2015, CI acquired 100% of First Asset Capital Corp. [“First Asset”] and its subsidiaries, an investment management company, for cash consideration of $26,924, equity consideration of $40,576 and contingent consideration payable in cash or common shares with an estimated fair value of $20,000. CI accounted for the acquisition using the acquisition method of accounting and the results of operations have been consolidated from the date of the transaction.
Details of the net assets acquired as at November 30, 2015, at fair value, are as follows:
$
Cash and cash equivalents 4,467Accounts receivable and prepaid expenses 593Management contracts 87,300Accounts payable and accrued liabilities (5,539)Long-term debt (2,000)Deferred tax liability (23,135)Fair value of identifiable net assets 61,686
Goodwill on acquisition 25,814Total acquired cost 87,500
The acquired fund management contracts with a fair value of $87,300 have an indefinite life. The goodwill on acquisition is not deductible for income tax purposes. Goodwill of $25,814 relates to the Asset Management segment.
Details of consideration as at the date of acquisition is as follows:
$
Cash 26,924Common shares issued, at fair value 40,576Contingent consideration liability, at fair value 20,000Total consideration 87,500
CI issued 1,301 common shares valued at $31.20 per common share as consideration for First Asset.
DECEMBER 31, 2015 and 2014 [in thousands of dollars, except per share amounts]
Annual Report | 74 | December 31, 2015
| NOTES TO CONSOLIDATED FINANCIAL STATEMENTS |
The acquisition agreement provided for contingent consideration payable in cash or common shares of CI, five years from the date of acquisition, if certain financial targets are met based on earnings before interest, tax, depreciation and amortization [“EBITDA”]. While it is not possible to determine the exact amount of contingent consideration, the potential undiscounted amount of all future payments that CI could be required to make under the agreement is unlimited. CI has estimated the fair value of the contingent consideration to be $20,000 as at December 31, 2015 which was estimated using a discounted cash flow approach. The fair value measurement is based on significant inputs that are not observable in the market, which IFRS 13 Fair Value Measurement refers to as Level 3 inputs.
Cash inflow on acquisition is as follows:
$
Net cash acquired (included in cash flows from investing activities) 4,467Transaction costs (included in cash flows from operating activities) (83)Net cash inflow on acquisition 4,384
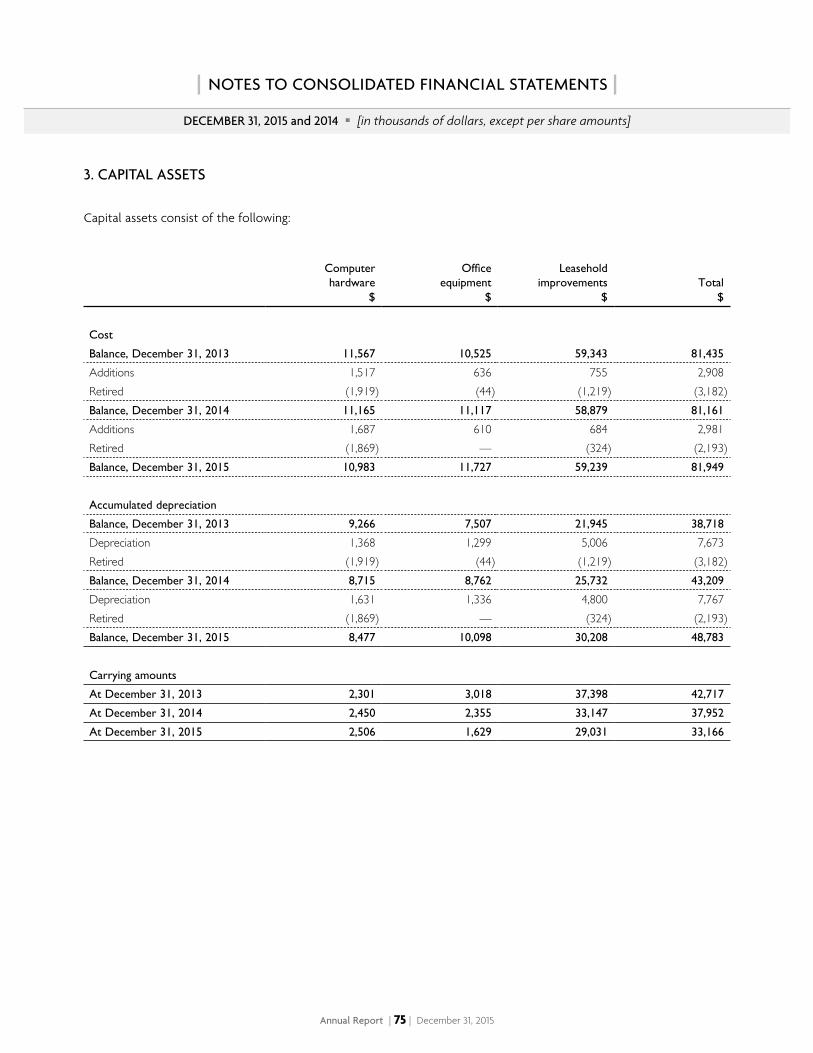
DECEMBER 31, 2015 and 2014 [in thousands of dollars, except per share amounts]
Annual Report | 75 | December 31, 2015
| NOTES TO CONSOLIDATED FINANCIAL STATEMENTS |
3 CAPITAL ASSETS
Capital assets consist of the following:
Computer hardware
$
Office equipment
$
Leasehold improvements
$Total
$
Cost
Balance, December 31, 2013 11,567 10,525 59,343 81,435
Additions 1,517 636 755 2,908Retired (1,919) (44) (1,219) (3,182)Balance, December 31, 2014 11,165 11,117 58,879 81,161
Additions 1,687 610 684 2,981Retired (1,869) — (324) (2,193)Balance, December 31, 2015 10,983 11,727 59,239 81,949
Accumulated depreciation
Balance, December 31, 2013 9,266 7,507 21,945 38,718
Depreciation 1,368 1,299 5,006 7,673Retired (1,919) (44) (1,219) (3,182)Balance, December 31, 2014 8,715 8,762 25,732 43,209
Depreciation 1,631 1,336 4,800 7,767Retired (1,869) — (324) (2,193)Balance, December 31, 2015 8,477 10,098 30,208 48,783
Carrying amounts
At December 31, 2013 2,301 3,018 37,398 42,717
At December 31, 2014 2,450 2,355 33,147 37,952
At December 31, 2015 2,506 1,629 29,031 33,166
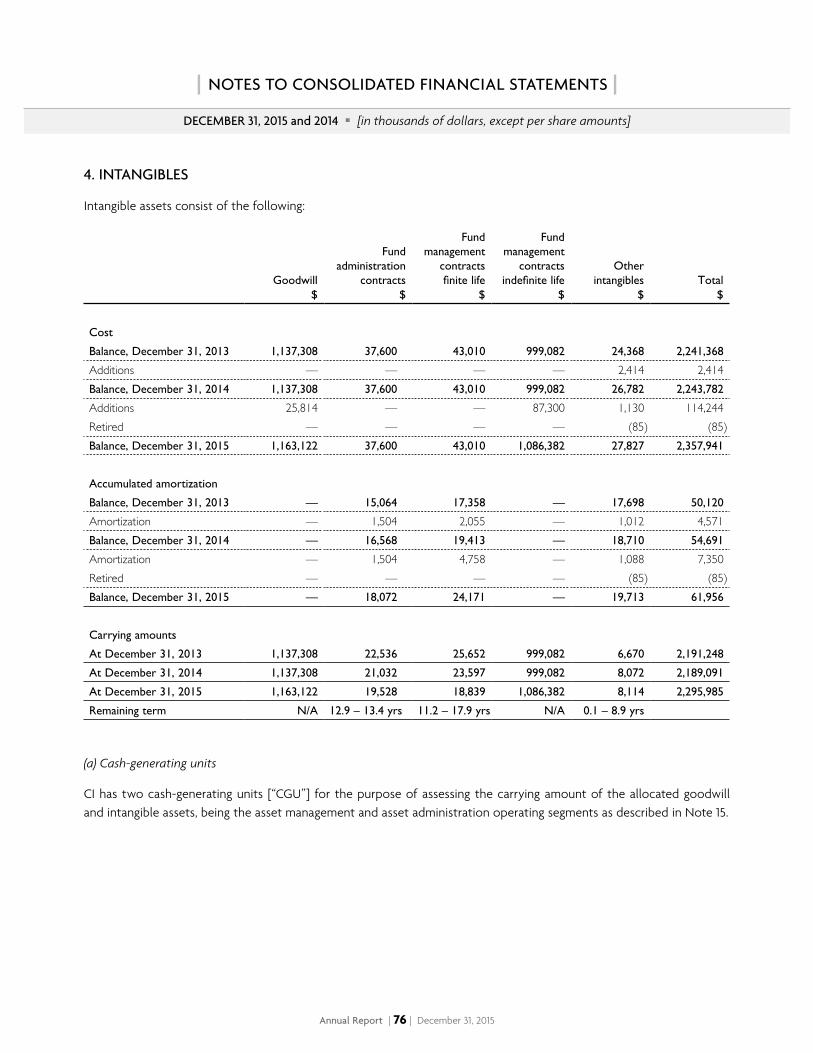
DECEMBER 31, 2015 and 2014 [in thousands of dollars, except per share amounts]
Annual Report | 76 | December 31, 2015
| NOTES TO CONSOLIDATED FINANCIAL STATEMENTS |
4 INTANGIBLES
Intangible assets consist of the following:
Goodwill $
Fund administration
contracts $
Fund management
contracts finite life
$
Fund management
contracts indefinite life
$
Other intangibles
$Total
$
Cost
Balance, December 31, 2013 1,137,308 37,600 43,010 999,082 24,368 2,241,368
Additions — — — — 2,414 2,414Balance, December 31, 2014 1,137,308 37,600 43,010 999,082 26,782 2,243,782
Additions 25,814 — — 87,300 1,130 114,244Retired — — — — (85) (85)Balance, December 31, 2015 1,163,122 37,600 43,010 1,086,382 27,827 2,357,941
Accumulated amortization
Balance, December 31, 2013 — 15,064 17,358 — 17,698 50,120
Amortization — 1,504 2,055 — 1,012 4,571Balance, December 31, 2014 — 16,568 19,413 — 18,710 54,691
Amortization — 1,504 4,758 — 1,088 7,350Retired — — — — (85) (85)Balance, December 31, 2015 — 18,072 24,171 — 19,713 61,956
Carrying amounts
At December 31, 2013 1,137,308 22,536 25,652 999,082 6,670 2,191,248
At December 31, 2014 1,137,308 21,032 23,597 999,082 8,072 2,189,091
At December 31, 2015 1,163,122 19,528 18,839 1,086,382 8,114 2,295,985
Remaining term N/A 12.9 – 13.4 yrs 11.2 – 17.9 yrs N/A 0.1 – 8.9 yrs
(a) Cash-generating units
CI has two cash-generating units [“CGU”] for the purpose of assessing the carrying amount of the allocated goodwill and intangible assets, being the asset management and asset administration operating segments as described in Note 15.
DECEMBER 31, 2015 and 2014 [in thousands of dollars, except per share amounts]
Annual Report | 77 | December 31, 2015
| NOTES TO CONSOLIDATED FINANCIAL STATEMENTS |
(b) Impairment testing of goodwill
As at December 31, 2015, CI has allocated goodwill of $970,540 [2014 – $944,726] to the asset management segment and $192,582 [2014 – $192,582] to the asset administration operating segment. The recoverable amounts of goodwill for the asset management and asset administration operating segments as at December 31, 2015 and 2014 have been determined based on a fair value less costs to sell calculation. For the asset management segment, CI uses two approaches to determine the goodwill valuation. The first methodology compares CI’s market capitalization against the carrying amount of goodwill for the segment. Market capitalization is based on the share price of CI, a level 1 fair value input. The second methodology, applies a trading multiple, a level 3 fair value input, to CI’s assets under management. This methodology is also used to determine the fair value of the asset administration segment however a trading multiple is applied to CI’s assets under administration. This methodology is commonly used in the marketplace by independent equity research analysts.
The calculation of the recoverable amounts exceeds the carrying amounts of both the asset management and the asset administration operating segments, including goodwill. CI’s current market capitalization provides additional evidence that the recoverable amount of these operating segments is in excess of the carrying amounts.
(c) Impairment testing of fund contracts
As at December 31, 2015, CI had indefinite life fund management contracts within the asset management CGU of $1,086,382 [2014 – $999,082]. These are contracts for the management of open end funds, which have no expiry or termination provisions. The fair value of indefinite life intangibles within the asset management operating segment as at December 31, 2015 and 2014 has been determined based on a value in use calculation, using 10 year forecasts and a terminal value for the period thereafter. CI uses a 10 year period to reflect the fact that following an acquisition, it may take several years to integrate operations and benefit from synergies. The key assumptions used in the forecast calculation include assumptions on market appreciation, net sales of funds and operating margins. Market appreciation rates are determined using historical inflation adjusted index returns adjusted for CI’s average management fee. Net sales are determined based on the historical two year average as well as management’s forecasts for future sales. Inputs to the operating margin include estimates for management and trailer fees using current average fee rates and historical rates for selling, general and administrative costs that are applied to forecasted average assets under management over the 10 year period. The terminal value has been calculated assuming a long-term growth rate of 2% per annum in perpetuity based on a long-term real GDP growth rate as at December 31, 2015 and 2014. A discount rate of 8.11% per annum has been applied to the recoverable calculation as at December 31, 2015 [2014 – 7.25%].
The calculation of the recoverable amount exceeds the carrying amount of indefinite life management contracts as at December 31, 2015 and 2014.
DECEMBER 31, 2015 and 2014 [in thousands of dollars, except per share amounts]
Annual Report | 78 | December 31, 2015
| NOTES TO CONSOLIDATED FINANCIAL STATEMENTS |
5 OTHER ASSETS, INCOME AND EXPENSE
Other assets consists mainly of deposits with the Canada Revenue Agency (“CRA”) discussed in Note 7, long-term investments, long-term accounts receivable, loans granted under CI’s employee share purchase plan and loans extended to investment advisors under CI’s hiring and incentive program.
CI has an employee share purchase loan program for key employees. These loans are renewable yearly and bear interest at prescribed rates. As at December 31, 2015, the carrying amount of employee share purchase loans is $5,777 [2014 – $6,722] and is included in other assets. These loans become due immediately upon termination of employment or sale of the shares that are held as collateral. As at December 31, 2015, the shares held as collateral have a market value of approximately $12,341 [2014 – $13,869].
CI has a hiring and retention incentive program whereby loans are extended to current investment advisors. These loans are initially recorded at their fair value, may bear interest at prescribed rates and are contractually forgiven on a straight-line basis over the applicable contractual period, which varies in length from three to seven years. CI utilizes the effective interest rate method to amortize the forgiven amount. The forgiven amount is included in selling, general and administrative expenses. As at December 31, 2015, loans to investment advisors of $6,999 [2014 – $5,058] are included in other assets. These loans become due on demand upon termination or breach in the terms of the agreements.
Other income consists mainly of fees received for the administration of third-party mutual funds, custody fees, investment income, foreign exchange gains (losses), interest income and the revenue earned by Marret. Other income also includes the fair value adjustment to the contingent consideration discussed in Note 7. Other expenses consist mainly of distribution fees to limited partnerships, legal settlements, amortization of debenture transaction costs and the expenses incurred by Marret. In 2015, other expenses also includes an accrual for remediation payments discussed in Note 7.
DECEMBER 31, 2015 and 2014 [in thousands of dollars, except per share amounts]
Annual Report | 79 | December 31, 2015
| NOTES TO CONSOLIDATED FINANCIAL STATEMENTS |
6 LONG-TERM DEBT
Long-term debt consists of the following:
As at
December 31, 2015
$
As at
December 31, 2014
$
Credit facility
Prime rate loan 2,000 —Banker’s acceptances 110,000 8,000
112,000 8,000
Debentures
$450 million, 2.645% due December 7, 2020 447,347 —$300 million, 3.940% until December 13, 2015 and floating rate until December 14, 2016 — 299,392
447,347 299,392Long-term debt 559,347 307,392Current portion of long-term debt 2,000 2,000
Credit facility
Effective December 11, 2015, CI renewed its revolving credit facility with two chartered banks. Amounts may be borrowed under the facility in Canadian dollars through prime rate loans, which bear interest at the greater of the bank’s prime rate and the Canadian Deposit Offering Rate plus 1.00%, or bankers’ acceptances, which bear interest at bankers’ acceptance rates plus 0.90%. Amounts may also be borrowed in U.S. dollars through base rate loans, which bear interest at the greater of the bank’s reference rate for loans made by it in Canada in U.S. funds and the federal funds effective rate plus 1.00%, or LIBOR loans which bear interest at LIBOR plus 0.90%.
CI may also borrow under this facility in the form of letters of credit, which bear a fee of 0.90% on any undrawn portion. As at December 31, 2015 and 2014, CI had not accessed the facility by way of letters of credit.
Loans are made by the banks under a three-year revolving credit facility, with the outstanding principal balance due upon maturity on December 11, 2018.
The credit facility contains a number of financial covenants that require CI to meet certain financial ratios and financial condition tests. CI is within its financial covenants with respect to its credit facility, which require that the funded debt to annualized earnings before interest, taxes, depreciation and amortization ratio remain below 2.5:1 and that CI’s assets under management not fall below $60 billion, calculated based on a rolling 30-day average. There can be no assurance that future borrowings or equity financing will be available to CI or available on acceptable terms.
DECEMBER 31, 2015 and 2014 [in thousands of dollars, except per share amounts]
Annual Report | 80 | December 31, 2015
| NOTES TO CONSOLIDATED FINANCIAL STATEMENTS |
Debentures
On December 7, 2015, CI completed an offering pursuant to which it issued $450,000 principal amount of debentures due December 7, 2020 [the “2020 Debentures”]. The 2020 Debentures were issued at par for gross proceeds of $450,000. The proceeds, net of transaction costs, were used in part to repay the debentures due December 14, 2016 [the “2016 Debentures”] of $300,000 and to pay down the amount borrowed under the credit facility. Interest on the 2020 Debentures is paid semi-annually in arrears at a rate of 2.645%. Interest attributable to the 2020 Debentures was $783 for the period from December 7 to December 31, 2015. Interest expense attributable to the 2016 Debentures was $11,302 for the period January 1 to December 14, 2015 [Year 2014 – $11,820].
On December 16, 2014, $200,000 in outstanding debentures matured [the “2014 Debentures”]. Interest attributable to the 2014 Debentures was $5,468 for the year ended December 31, 2014.
Issuance costs and the issuance discount are amortized over the term of the Debentures using the effective interest rate method. The amortization expense related to the discount and transaction costs for CI’s issued 2016 Debentures for the year ended December 31, 2015 was $607 [2014 – $522] which is included in other expenses.
CI may, at its option, redeem the 2020 Debentures in whole or in part, from time to time, on not less than 30 nor more than 60 days’ prior notice to the registered holder, at a redemption price which is equal to the greater of par or the Government of Canada yield, plus 42.5 basis points. CI considers this embedded prepayment option to be closely related to the Debentures and, as such, does not account for it separately as a derivative.
In the event that both a change of control occurs and the rating of the 2020 Debentures is lowered to below investment grade by two out of three rating agencies as defined as below BBB- by Standard and Poor’s, BBB (low) by DBRS Limited and Baa3 by Moody’s Investor Service, Inc., CI will be required to make an offer to repurchase all or, at the option of each holder, any part of each holder’s Debentures at a purchase price payable in cash equivalent to 101% of the outstanding principal amount of the Debentures together with accrued and unpaid interest, to the date of purchase.
DECEMBER 31, 2015 and 2014 [in thousands of dollars, except per share amounts]
Annual Report | 81 | December 31, 2015
| NOTES TO CONSOLIDATED FINANCIAL STATEMENTS |
7 PROVISION FOR OTHER LIABILITIES AND CONTINGENCIES
CI is a party to a number of claims, proceedings and investigations, including legal, regulatory and tax, in the ordinary course of its business. In addition, CI has provided for contingent consideration payable in business acquisitions as discussed in Note 2. Due to the inherent uncertainty involved in these matters, it is difficult to predict the final outcome or the amount and timing of any outflow related to such matters. Based on current information and consultations with advisors, CI does not expect the outcome of these matters, individually or in aggregate, to have a material adverse effect on its financial position or on its ability to continue normal business operations.
CI has made provisions based on current information and the probable resolution of any such contingent consideration, claims, proceedings and investigations. The movement in amounts provided for contingent liabilities and related expenses during the years ended December 31, are as follows:
2015
$
2014
$
Provision for other liabilities, beginning of year 20,544 22,636Additions 54,538 4,767Amounts used (14,106) (1,773)Amounts reversed (8,379) (5,086)Provision for other liabilities, end of year 52,597 20,544Current portion of provision for other liabilities 23,043 1,293
LITIGATION
CI is a defendant to certain lawsuits of which two are class action lawsuits related to events and transactions that gave rise to a settlement agreement with the Ontario Securities Commission (“OSC”) in 2004. Although CI continues to believe that this settlement fully compensated investors affected by frequent trading activity, a provision has been made based on the probable resolution of these claims and related expenses.
CI maintains insurance policies that may provide coverage against certain claims. Amounts receivable under these policies are not accrued for unless the realization of income is virtually certain. During the year ended December 31, 2015, CI received insurance proceeds of $1,373 related to the settlement of legal claims [2014 – $499]. As at December 31, 2015, CI has accrued $463 for amounts to be received under insurance policies [2014 – $906], which is included in accounts receivable.
DECEMBER 31, 2015 and 2014 [in thousands of dollars, except per share amounts]
Annual Report | 82 | December 31, 2015
| NOTES TO CONSOLIDATED FINANCIAL STATEMENTS |
TAXATION
CI is subject to various uncertainties concerning the interpretation and application of Canadian tax laws. If tax authorities disagree with CI’s application of such tax laws, CI’s profitability and cash flows could be adversely affected. CI Investments is considered a large case file by the CRA, and as such, is subject to audit each year. There is a significant lag between the end of a fiscal year and when such audits are completed. Therefore, at any given time, several years may be open for audit and/or adjustment.
During 2015, CI received notices of reassessment (“NOR”) from the CRA and the Ontario and Alberta Ministries of Finance relating to the interest rate charged on subordinated notes within CI’s income trust structure from 2006 to 2008. The NORs were in the amount of $275,208 including interest. However, notwithstanding the filing of a notice of objection, CI has made the required minimum payments of $172,115, which will remain on account until the dispute is resolved, which may take considerable time. The amount deposited has been included in other assets as at December 31, 2015. While CI believes it will be able to successfully defend its position, CI recorded a provision of $4,000 during the year 2015 for expenses to mount this defense. As at December 31, 2015, a provision of $3,821 remains.
REMEDIATION
In April 2015, CI Investments discovered an administrative error. Approximately $156.1 million of interest had not been properly recorded as an asset in the accounting records of certain funds, with the result being that the net asset values of these funds, and any funds that had invested in these funds, had been understated for several years. CI Investments self-reported the error to the OSC and on February 10, 2016 entered into a no-contest settlement agreement with the OSC in connection with the administrative error. CI has made a provision of $10.75 million, net of recoveries, for the cost of this settlement as well as the costs to remediate.
CONTINGENT CONSIDERATION
CI entered into an acquisition agreement with the shareholders of First Asset that provides for contingent consideration to be paid. Details of this agreement and the basis of calculation of the fair value of the contingent consideration are summarized in Note 2.
CI entered into an acquisition agreement with the shareholders of Marret that provided for contingent consideration payable in common shares of CI in the amount of $12,500, three years from the date of acquisition, if certain financial targets were met based on EBITDA generated during that period. Included in other income for the year ended December 31, 2015 is a fair value adjustment of $7,500 [2014 – $5,000] to reduce the estimated fair value of the contingent consideration to be nil [December 31, 2014 – $7,500].
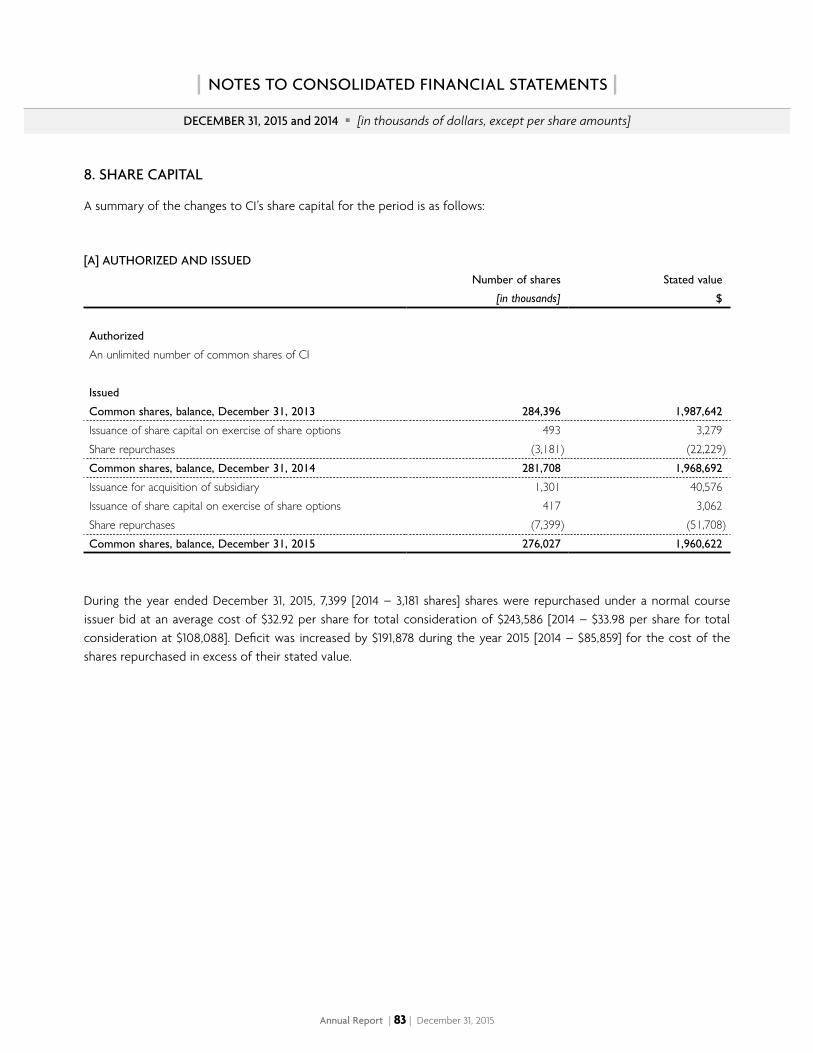
DECEMBER 31, 2015 and 2014 [in thousands of dollars, except per share amounts]
Annual Report | 83 | December 31, 2015
| NOTES TO CONSOLIDATED FINANCIAL STATEMENTS |
8 SHARE CAPITAL
A summary of the changes to CI’s share capital for the period is as follows:
[A] AUTHORIZED AND ISSUEDNumber of shares
[in thousands]
Stated value
$
Authorized
An unlimited number of common shares of CI
Issued
Common shares, balance, December 31, 2013 284,396 1,987,642
Issuance of share capital on exercise of share options 493 3,279Share repurchases (3,181) (22,229)Common shares, balance, December 31, 2014 281,708 1,968,692
Issuance for acquisition of subsidiary 1,301 40,576Issuance of share capital on exercise of share options 417 3,062Share repurchases (7,399) (51,708)Common shares, balance, December 31, 2015 276,027 1,960,622
During the year ended December 31, 2015, 7,399 [2014 – 3,181 shares] shares were repurchased under a normal course issuer bid at an average cost of $32.92 per share for total consideration of $243,586 [2014 – $33.98 per share for total consideration at $108,088]. Deficit was increased by $191,878 during the year 2015 [2014 – $85,859] for the cost of the shares repurchased in excess of their stated value.
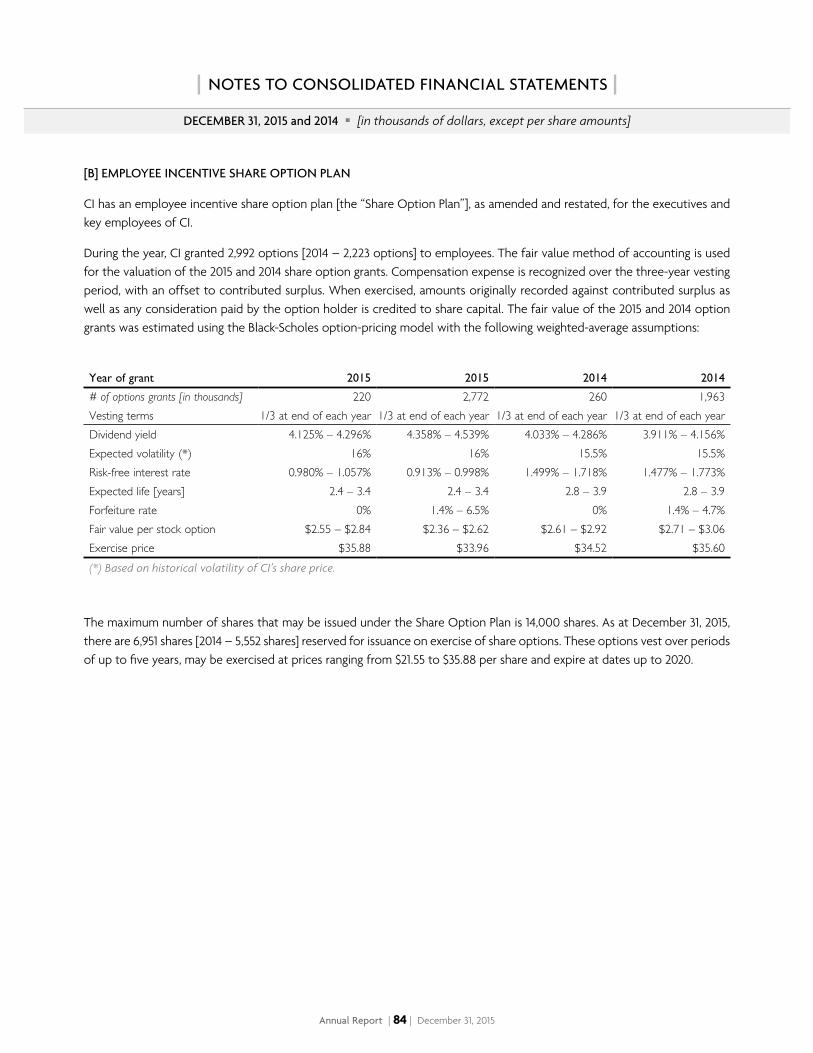
DECEMBER 31, 2015 and 2014 [in thousands of dollars, except per share amounts]
Annual Report | 84 | December 31, 2015
| NOTES TO CONSOLIDATED FINANCIAL STATEMENTS |
[B] EMPLOYEE INCENTIVE SHARE OPTION PLAN
CI has an employee incentive share option plan [the “Share Option Plan”], as amended and restated, for the executives and key employees of CI.
During the year, CI granted 2,992 options [2014 – 2,223 options] to employees. The fair value method of accounting is used for the valuation of the 2015 and 2014 share option grants. Compensation expense is recognized over the three-year vesting period, with an offset to contributed surplus. When exercised, amounts originally recorded against contributed surplus as well as any consideration paid by the option holder is credited to share capital. The fair value of the 2015 and 2014 option grants was estimated using the Black-Scholes option-pricing model with the following weighted-average assumptions:
Year of grant 2015 2015 2014 2014
# of options grants [in thousands] 220 2,772 260 1,963Vesting terms 1/3 at end of each year 1/3 at end of each year 1/3 at end of each year 1/3 at end of each yearDividend yield 4.125% – 4.296% 4.358% – 4.539% 4.033% – 4.286% 3.911% – 4.156%Expected volatility (*) 16% 16% 15.5% 15.5%Risk-free interest rate 0.980% – 1.057% 0.913% – 0.998% 1.499% – 1.718% 1.477% – 1.773%Expected life [years] 2.4 – 3.4 2.4 – 3.4 2.8 – 3.9 2.8 – 3.9Forfeiture rate 0% 1.4% – 6.5% 0% 1.4% – 4.7%Fair value per stock option $2.55 – $2.84 $2.36 – $2.62 $2.61 – $2.92 $2.71 – $3.06Exercise price $35.88 $33.96 $34.52 $35.60(*) Based on historical volatility of CI’s share price.
The maximum number of shares that may be issued under the Share Option Plan is 14,000 shares. As at December 31, 2015, there are 6,951 shares [2014 – 5,552 shares] reserved for issuance on exercise of share options. These options vest over periods of up to five years, may be exercised at prices ranging from $21.55 to $35.88 per share and expire at dates up to 2020.
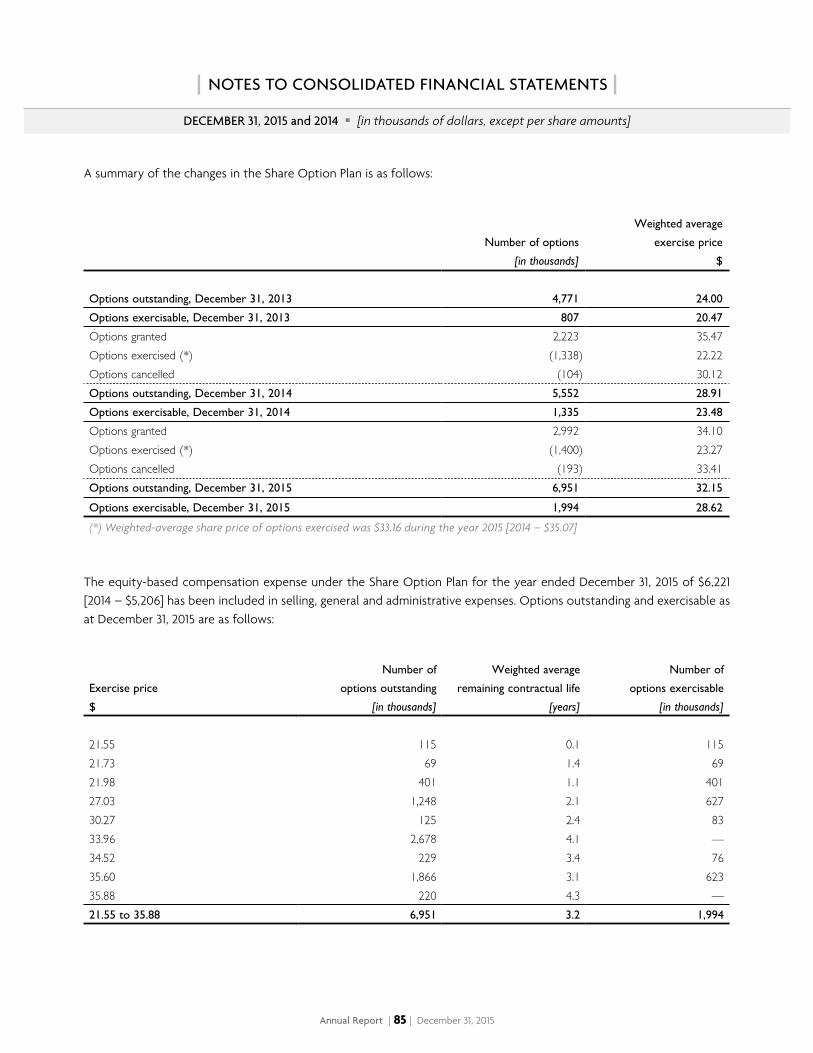
DECEMBER 31, 2015 and 2014 [in thousands of dollars, except per share amounts]
Annual Report | 85 | December 31, 2015
| NOTES TO CONSOLIDATED FINANCIAL STATEMENTS |
A summary of the changes in the Share Option Plan is as follows:
Number of options
[in thousands]
Weighted average
exercise price
$
Options outstanding, December 31, 2013 4,771 24.00
Options exercisable, December 31, 2013 807 20.47
Options granted 2,223 35.47Options exercised (*) (1,338) 22.22Options cancelled (104) 30.12Options outstanding, December 31, 2014 5,552 28.91
Options exercisable, December 31, 2014 1,335 23.48
Options granted 2,992 34.10Options exercised (*) (1,400) 23.27Options cancelled (193) 33.41Options outstanding, December 31, 2015 6,951 32.15
Options exercisable, December 31, 2015 1,994 28.62
(*) Weighted-average share price of options exercised was $33.16 during the year 2015 [2014 – $35.07]
The equity-based compensation expense under the Share Option Plan for the year ended December 31, 2015 of $6,221 [2014 – $5,206] has been included in selling, general and administrative expenses. Options outstanding and exercisable as at December 31, 2015 are as follows:
Exercise price
$
Number of
options outstanding
[in thousands]
Weighted average
remaining contractual life
[years]
Number of
options exercisable
[in thousands]
21.55 115 0.1 11521.73 69 1.4 6921.98 401 1.1 40127.03 1,248 2.1 62730.27 125 2.4 8333.96 2,678 4.1 ––34.52 229 3.4 7635.60 1,866 3.1 62335.88 220 4.3 ––21.55 to 35.88 6,951 3.2 1,994
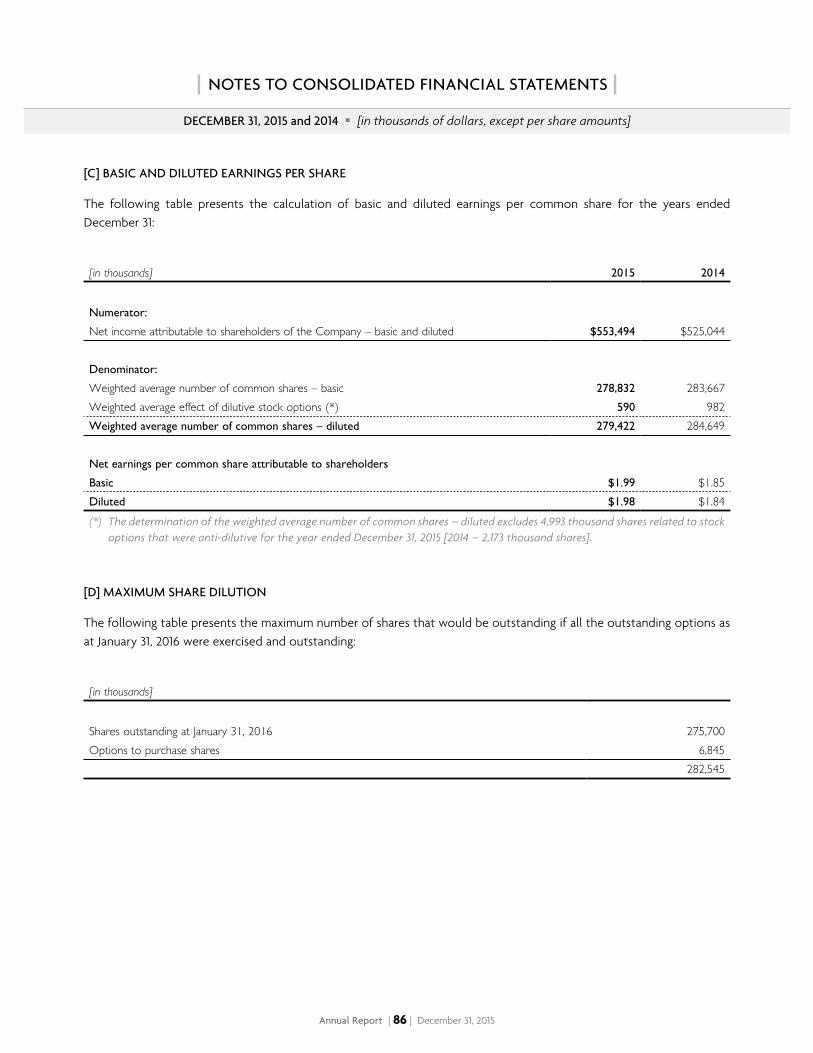
DECEMBER 31, 2015 and 2014 [in thousands of dollars, except per share amounts]
Annual Report | 86 | December 31, 2015
| NOTES TO CONSOLIDATED FINANCIAL STATEMENTS |
[C] BASIC AND DILUTED EARNINGS PER SHARE
The following table presents the calculation of basic and diluted earnings per common share for the years ended December 31:
[in thousands] 2015 2014
Numerator:
Net income attributable to shareholders of the Company – basic and diluted $553,494 $525,044
Denominator:
Weighted average number of common shares – basic 278,832 283,667Weighted average effect of dilutive stock options (*) 590 982Weighted average number of common shares – diluted 279,422 284,649
Net earnings per common share attributable to shareholders
Basic $1.99 $1.85Diluted $1.98 $1.84(*) The determination of the weighted average number of common shares – diluted excludes 4,993 thousand shares related to stock
options that were anti-dilutive for the year ended December 31, 2015 [2014 – 2,173 thousand shares].
[D] MAXIMUM SHARE DILUTION
The following table presents the maximum number of shares that would be outstanding if all the outstanding options as at January 31, 2016 were exercised and outstanding:
[in thousands]
Shares outstanding at January 31, 2016 275,700Options to purchase shares 6,845
282,545
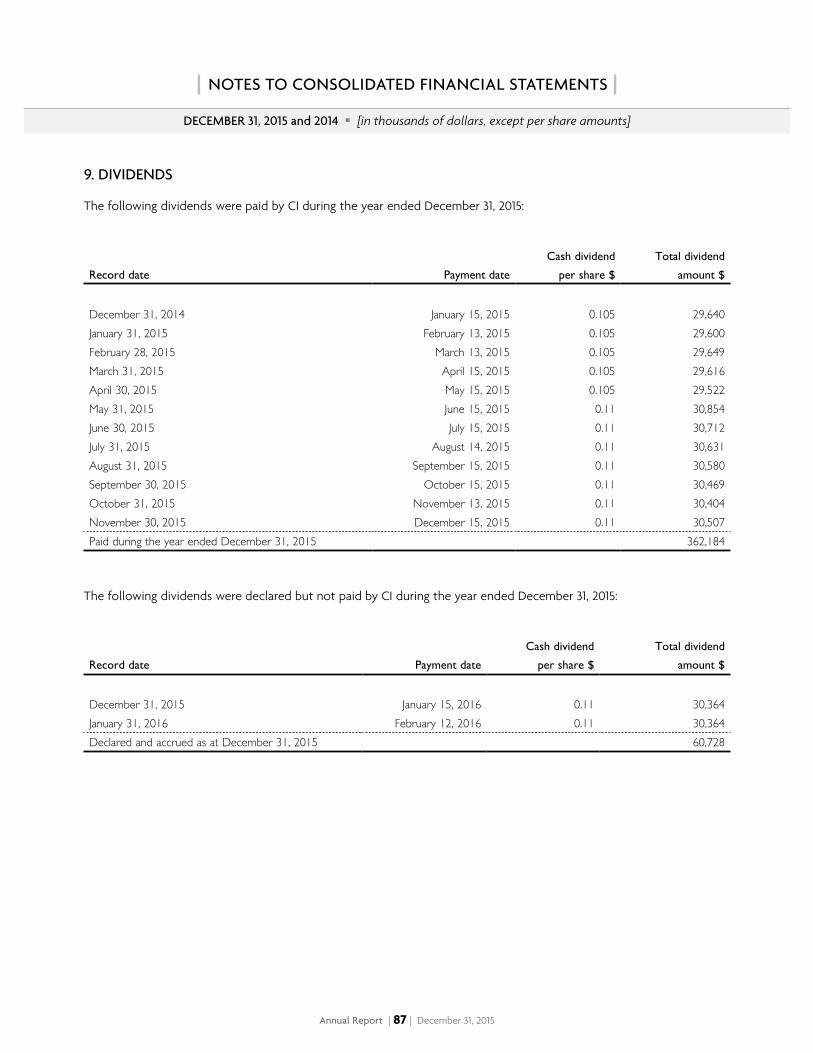
DECEMBER 31, 2015 and 2014 [in thousands of dollars, except per share amounts]
Annual Report | 87 | December 31, 2015
| NOTES TO CONSOLIDATED FINANCIAL STATEMENTS |
9 DIVIDENDS
The following dividends were paid by CI during the year ended December 31, 2015:
Record date Payment date
Cash dividend
per share $
Total dividend
amount $
December 31, 2014 January 15, 2015 0.105 29,640January 31, 2015 February 13, 2015 0.105 29,600February 28, 2015 March 13, 2015 0.105 29,649March 31, 2015 April 15, 2015 0.105 29,616April 30, 2015 May 15, 2015 0.105 29,522May 31, 2015 June 15, 2015 0.11 30,854June 30, 2015 July 15, 2015 0.11 30,712July 31, 2015 August 14, 2015 0.11 30,631August 31, 2015 September 15, 2015 0.11 30,580September 30, 2015 October 15, 2015 0.11 30,469October 31, 2015 November 13, 2015 0.11 30,404November 30, 2015 December 15, 2015 0.11 30,507Paid during the year ended December 31, 2015 362,184
The following dividends were declared but not paid by CI during the year ended December 31, 2015:
Record date Payment date
Cash dividend
per share $
Total dividend
amount $
December 31, 2015 January 15, 2016 0.11 30,364January 31, 2016 February 12, 2016 0.11 30,364Declared and accrued as at December 31, 2015 60,728
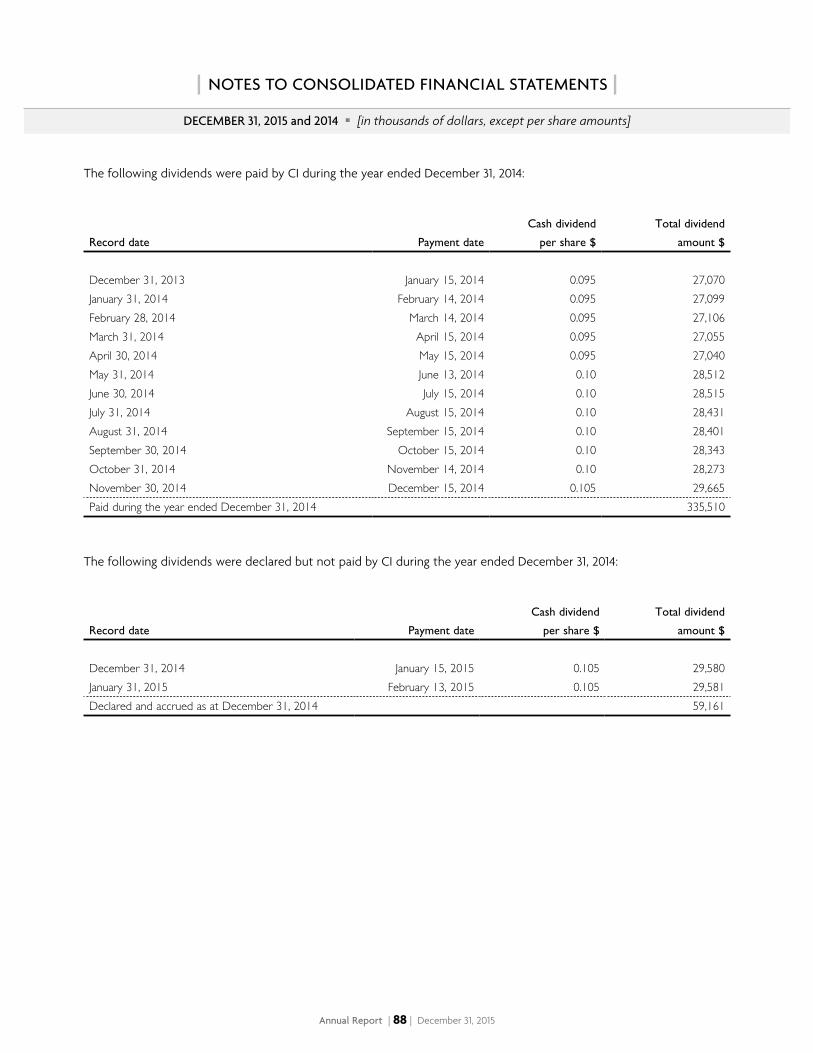
DECEMBER 31, 2015 and 2014 [in thousands of dollars, except per share amounts]
Annual Report | 88 | December 31, 2015
| NOTES TO CONSOLIDATED FINANCIAL STATEMENTS |
The following dividends were paid by CI during the year ended December 31, 2014:
Record date Payment date
Cash dividend
per share $
Total dividend
amount $
December 31, 2013 January 15, 2014 0.095 27,070January 31, 2014 February 14, 2014 0.095 27,099February 28, 2014 March 14, 2014 0.095 27,106March 31, 2014 April 15, 2014 0.095 27,055April 30, 2014 May 15, 2014 0.095 27,040May 31, 2014 June 13, 2014 0.10 28,512June 30, 2014 July 15, 2014 0.10 28,515July 31, 2014 August 15, 2014 0.10 28,431August 31, 2014 September 15, 2014 0.10 28,401September 30, 2014 October 15, 2014 0.10 28,343October 31, 2014 November 14, 2014 0.10 28,273November 30, 2014 December 15, 2014 0.105 29,665Paid during the year ended December 31, 2014 335,510
The following dividends were declared but not paid by CI during the year ended December 31, 2014:
Record date Payment date
Cash dividend
per share $
Total dividend
amount $
December 31, 2014 January 15, 2015 0.105 29,580January 31, 2015 February 13, 2015 0.105 29,581Declared and accrued as at December 31, 2014 59,161
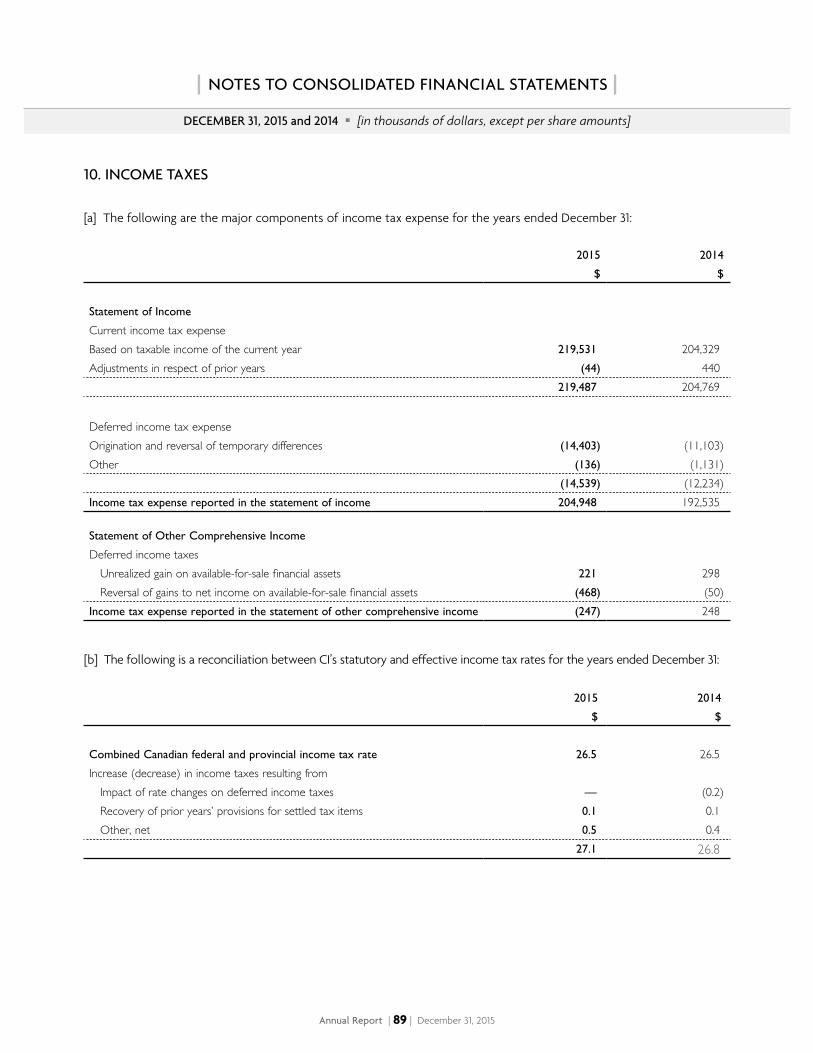
DECEMBER 31, 2015 and 2014 [in thousands of dollars, except per share amounts]
Annual Report | 89 | December 31, 2015
| NOTES TO CONSOLIDATED FINANCIAL STATEMENTS |
10 INCOME TAXES
[a] The following are the major components of income tax expense for the years ended December 31:
2015
$
2014
$
Statement of Income
Current income tax expenseBased on taxable income of the current year 219,531 204,329Adjustments in respect of prior years (44) 440
219,487 204,769
Deferred income tax expense Origination and reversal of temporary differences (14,403) (11,103)Other (136) (1,131)
(14,539) (12,234)Income tax expense reported in the statement of income 204,948 192,535 Statement of Other Comprehensive Income
Deferred income taxes Unrealized gain on available-for-sale financial assets 221 298 Reversal of gains to net income on available-for-sale financial assets (468) (50)Income tax expense reported in the statement of other comprehensive income (247) 248
[b] The following is a reconciliation between CI’s statutory and effective income tax rates for the years ended December 31:
2015
$
2014
$
Combined Canadian federal and provincial income tax rate 26.5 26.5Increase (decrease) in income taxes resulting from Impact of rate changes on deferred income taxes — (0.2) Recovery of prior years’ provisions for settled tax items 0.1 0.1 Other, net 0.5 0.4
27.1 26.8
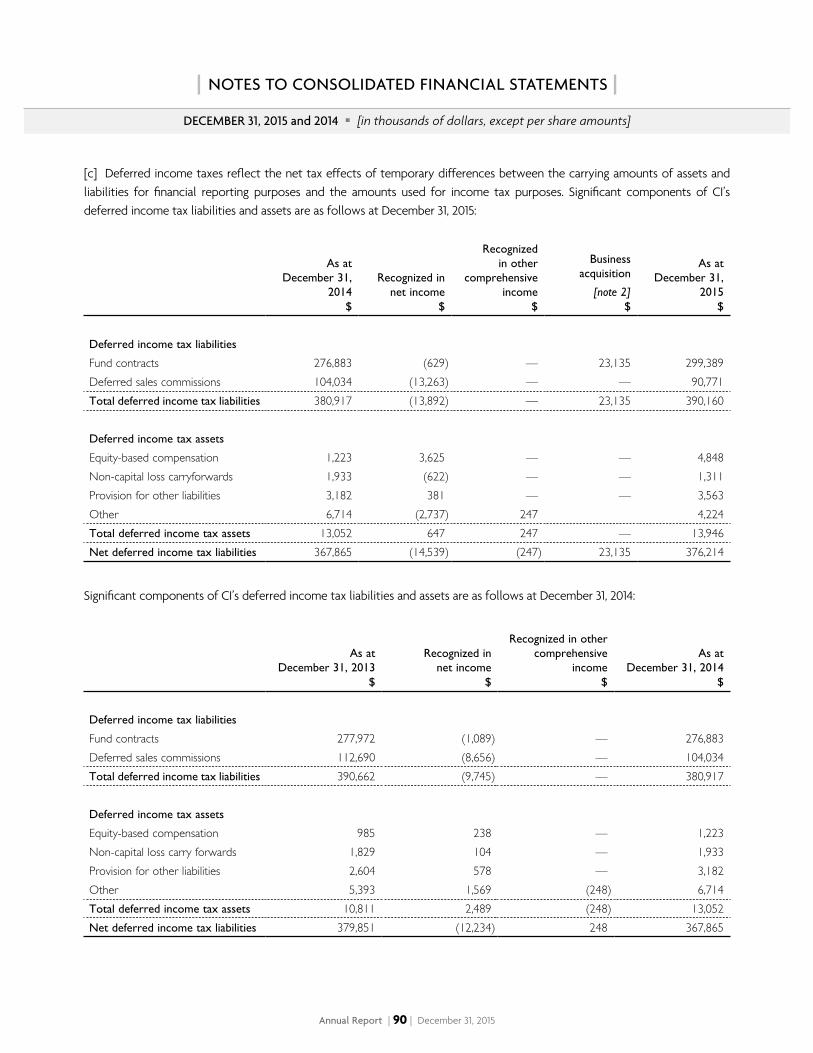
DECEMBER 31, 2015 and 2014 [in thousands of dollars, except per share amounts]
Annual Report | 90 | December 31, 2015
| NOTES TO CONSOLIDATED FINANCIAL STATEMENTS |
[c] Deferred income taxes reflect the net tax effects of temporary differences between the carrying amounts of assets and liabilities for financial reporting purposes and the amounts used for income tax purposes. Significant components of CI’s deferred income tax liabilities and assets are as follows at December 31, 2015:
As at December 31,
2014$
Recognized in net income
$
Recognized in other
comprehensive income
$
Business acquisition
[note 2] $
As at December 31,
2015 $
Deferred income tax liabilities
Fund contracts 276,883 (629) — 23,135 299,389Deferred sales commissions 104,034 (13,263) — — 90,771Total deferred income tax liabilities 380,917 (13,892) — 23,135 390,160
Deferred income tax assets
Equity-based compensation 1,223 3,625 — — 4,848Non-capital loss carryforwards 1,933 (622) — — 1,311Provision for other liabilities 3,182 381 — — 3,563Other 6,714 (2,737) 247 4,224Total deferred income tax assets 13,052 647 247 — 13,946Net deferred income tax liabilities 367,865 (14,539) (247) 23,135 376,214
Significant components of CI’s deferred income tax liabilities and assets are as follows at December 31, 2014:
As at December 31, 2013
$
Recognized in net income
$
Recognized in other comprehensive
income $
As at December 31, 2014
$
Deferred income tax liabilities
Fund contracts 277,972 (1,089) — 276,883Deferred sales commissions 112,690 (8,656) — 104,034Total deferred income tax liabilities 390,662 (9,745) — 380,917
Deferred income tax assets
Equity-based compensation 985 238 — 1,223Non-capital loss carry forwards 1,829 104 — 1,933Provision for other liabilities 2,604 578 — 3,182Other 5,393 1,569 (248) 6,714Total deferred income tax assets 10,811 2,489 (248) 13,052Net deferred income tax liabilities 379,851 (12,234) 248 367,865
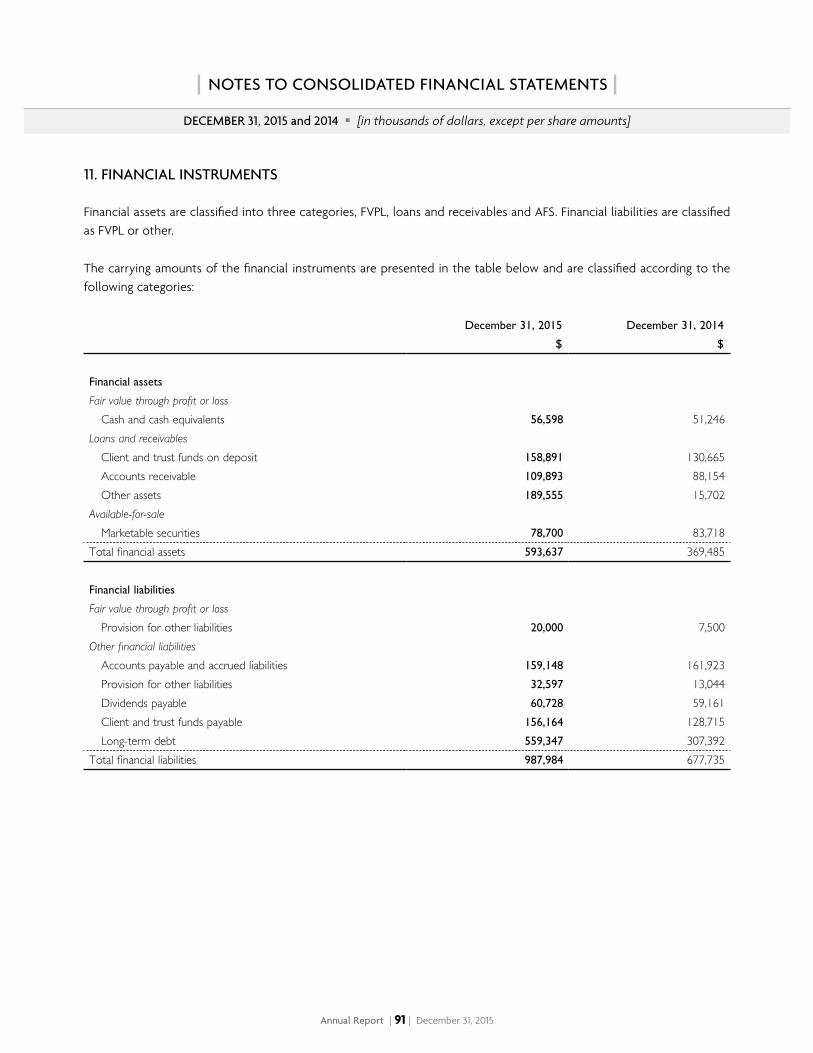
DECEMBER 31, 2015 and 2014 [in thousands of dollars, except per share amounts]
Annual Report | 91 | December 31, 2015
| NOTES TO CONSOLIDATED FINANCIAL STATEMENTS |
11 FINANCIAL INSTRUMENTS
Financial assets are classified into three categories, FVPL, loans and receivables and AFS. Financial liabilities are classified as FVPL or other.
The carrying amounts of the financial instruments are presented in the table below and are classified according to the following categories:
December 31, 2015
$
December 31, 2014
$
Financial assets
Fair value through profit or loss
Cash and cash equivalents 56,598 51,246Loans and receivables
Client and trust funds on deposit 158,891 130,665Accounts receivable 109,893 88,154Other assets 189,555 15,702
Available-for-sale
Marketable securities 78,700 83,718Total financial assets 593,637 369,485
Financial liabilities
Fair value through profit or loss
Provision for other liabilities 20,000 7,500Other financial liabilities
Accounts payable and accrued liabilities 159,148 161,923Provision for other liabilities 32,597 13,044Dividends payable 60,728 59,161Client and trust funds payable 156,164 128,715Long-term debt 559,347 307,392
Total financial liabilities 987,984 677,735
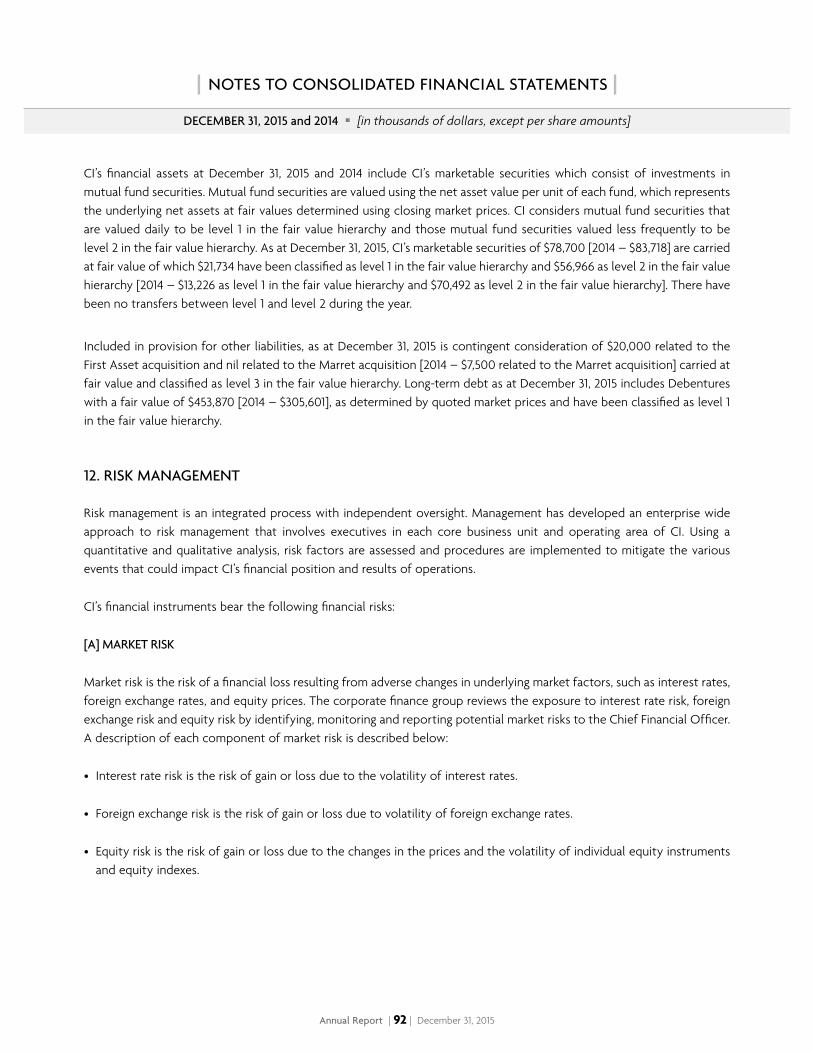
DECEMBER 31, 2015 and 2014 [in thousands of dollars, except per share amounts]
Annual Report | 92 | December 31, 2015
| NOTES TO CONSOLIDATED FINANCIAL STATEMENTS |
CI’s financial assets at December 31, 2015 and 2014 include CI’s marketable securities which consist of investments in mutual fund securities. Mutual fund securities are valued using the net asset value per unit of each fund, which represents the underlying net assets at fair values determined using closing market prices. CI considers mutual fund securities that are valued daily to be level 1 in the fair value hierarchy and those mutual fund securities valued less frequently to be level 2 in the fair value hierarchy. As at December 31, 2015, CI’s marketable securities of $78,700 [2014 – $83,718] are carried at fair value of which $21,734 have been classified as level 1 in the fair value hierarchy and $56,966 as level 2 in the fair value hierarchy [2014 – $13,226 as level 1 in the fair value hierarchy and $70,492 as level 2 in the fair value hierarchy]. There have been no transfers between level 1 and level 2 during the year.
Included in provision for other liabilities, as at December 31, 2015 is contingent consideration of $20,000 related to the First Asset acquisition and nil related to the Marret acquisition [2014 – $7,500 related to the Marret acquisition] carried at fair value and classified as level 3 in the fair value hierarchy. Long-term debt as at December 31, 2015 includes Debentures with a fair value of $453,870 [2014 – $305,601], as determined by quoted market prices and have been classified as level 1 in the fair value hierarchy.
12 RISK MANAGEMENT
Risk management is an integrated process with independent oversight. Management has developed an enterprise wide approach to risk management that involves executives in each core business unit and operating area of CI. Using a quantitative and qualitative analysis, risk factors are assessed and procedures are implemented to mitigate the various events that could impact CI’s financial position and results of operations.
CI’s financial instruments bear the following financial risks:
[A] MARKET RISK
Market risk is the risk of a financial loss resulting from adverse changes in underlying market factors, such as interest rates, foreign exchange rates, and equity prices. The corporate finance group reviews the exposure to interest rate risk, foreign exchange risk and equity risk by identifying, monitoring and reporting potential market risks to the Chief Financial Officer. A description of each component of market risk is described below:
• Interest rate risk is the risk of gain or loss due to the volatility of interest rates.
• Foreign exchange risk is the risk of gain or loss due to volatility of foreign exchange rates.
• Equity risk is the risk of gain or loss due to the changes in the prices and the volatility of individual equity instruments and equity indexes.
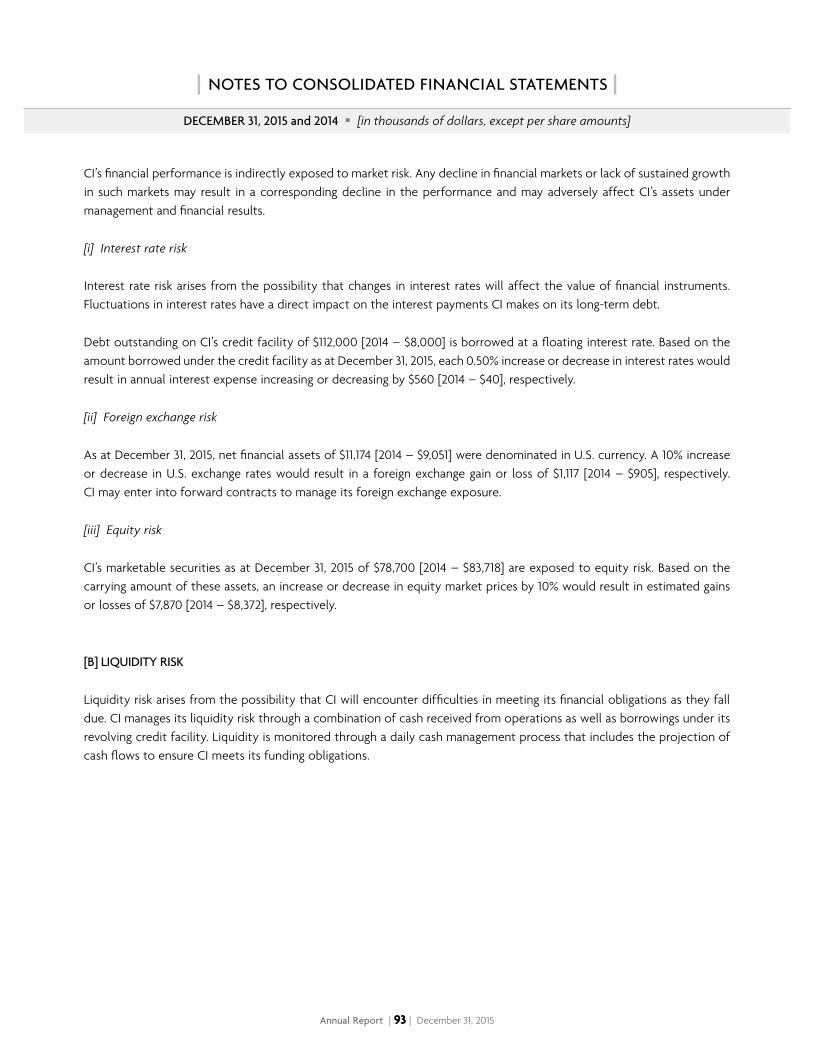
DECEMBER 31, 2015 and 2014 [in thousands of dollars, except per share amounts]
Annual Report | 93 | December 31, 2015
| NOTES TO CONSOLIDATED FINANCIAL STATEMENTS |
CI’s financial performance is indirectly exposed to market risk. Any decline in financial markets or lack of sustained growth in such markets may result in a corresponding decline in the performance and may adversely affect CI’s assets under management and financial results.
[i] Interest rate risk
Interest rate risk arises from the possibility that changes in interest rates will affect the value of financial instruments. Fluctuations in interest rates have a direct impact on the interest payments CI makes on its long-term debt.
Debt outstanding on CI’s credit facility of $112,000 [2014 – $8,000] is borrowed at a floating interest rate. Based on the amount borrowed under the credit facility as at December 31, 2015, each 0.50% increase or decrease in interest rates would result in annual interest expense increasing or decreasing by $560 [2014 – $40], respectively.
[ii] Foreign exchange risk
As at December 31, 2015, net financial assets of $11,174 [2014 – $9,051] were denominated in U.S. currency. A 10% increase or decrease in U.S. exchange rates would result in a foreign exchange gain or loss of $1,117 [2014 – $905], respectively. CI may enter into forward contracts to manage its foreign exchange exposure.
[iii] Equity risk
CI’s marketable securities as at December 31, 2015 of $78,700 [2014 – $83,718] are exposed to equity risk. Based on the carrying amount of these assets, an increase or decrease in equity market prices by 10% would result in estimated gains or losses of $7,870 [2014 – $8,372], respectively.
[B] LIQUIDITY RISK
Liquidity risk arises from the possibility that CI will encounter difficulties in meeting its financial obligations as they fall due. CI manages its liquidity risk through a combination of cash received from operations as well as borrowings under its revolving credit facility. Liquidity is monitored through a daily cash management process that includes the projection of cash flows to ensure CI meets its funding obligations.
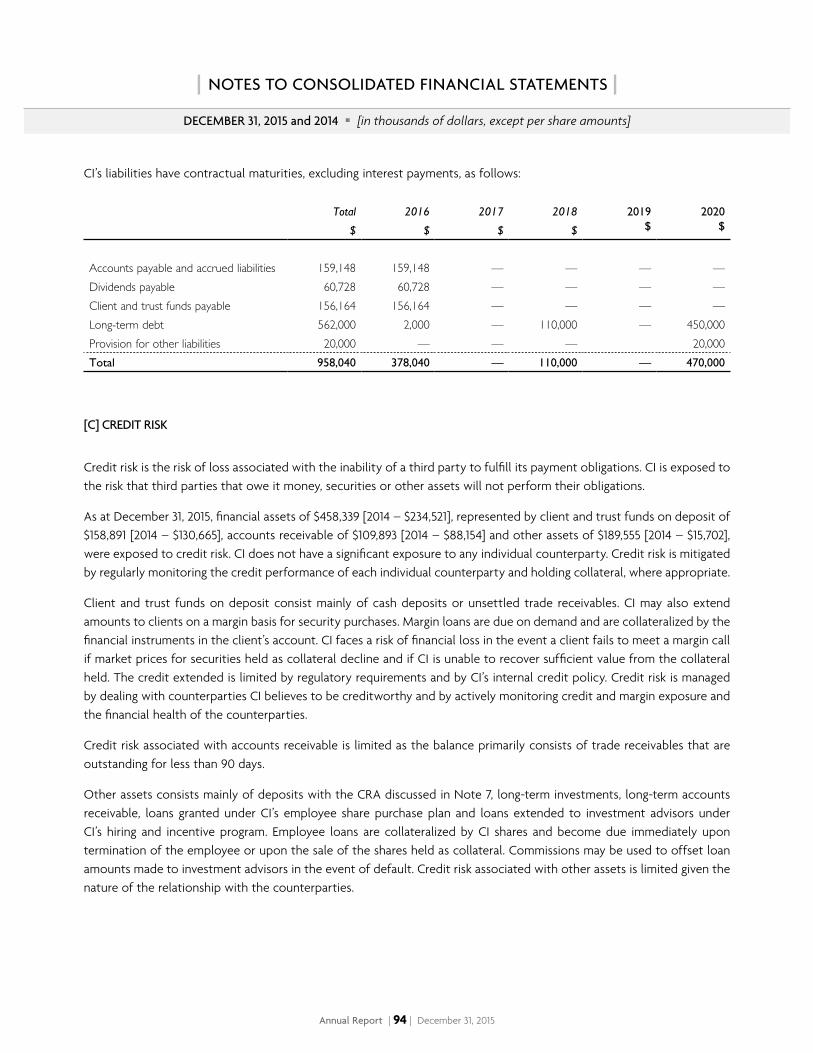
DECEMBER 31, 2015 and 2014 [in thousands of dollars, except per share amounts]
Annual Report | 94 | December 31, 2015
| NOTES TO CONSOLIDATED FINANCIAL STATEMENTS |
CI’s liabilities have contractual maturities, excluding interest payments, as follows:
Total
$
2016
$
2017
$
2018
$
2019$
2020$
Accounts payable and accrued liabilities 159,148 159,148 — — — —Dividends payable 60,728 60,728 — — — —Client and trust funds payable 156,164 156,164 — — — —Long-term debt 562,000 2,000 — 110,000 — 450,000Provision for other liabilities 20,000 — — — 20,000Total 958,040 378,040 — 110,000 — 470,000
[C] CREDIT RISK
Credit risk is the risk of loss associated with the inability of a third party to fulfill its payment obligations. CI is exposed to the risk that third parties that owe it money, securities or other assets will not perform their obligations.
As at December 31, 2015, financial assets of $458,339 [2014 – $234,521], represented by client and trust funds on deposit of $158,891 [2014 – $130,665], accounts receivable of $109,893 [2014 – $88,154] and other assets of $189,555 [2014 – $15,702], were exposed to credit risk. CI does not have a significant exposure to any individual counterparty. Credit risk is mitigated by regularly monitoring the credit performance of each individual counterparty and holding collateral, where appropriate.
Client and trust funds on deposit consist mainly of cash deposits or unsettled trade receivables. CI may also extend amounts to clients on a margin basis for security purchases. Margin loans are due on demand and are collateralized by the financial instruments in the client’s account. CI faces a risk of financial loss in the event a client fails to meet a margin call if market prices for securities held as collateral decline and if CI is unable to recover sufficient value from the collateral held. The credit extended is limited by regulatory requirements and by CI’s internal credit policy. Credit risk is managed by dealing with counterparties CI believes to be creditworthy and by actively monitoring credit and margin exposure and the financial health of the counterparties.
Credit risk associated with accounts receivable is limited as the balance primarily consists of trade receivables that are outstanding for less than 90 days.
Other assets consists mainly of deposits with the CRA discussed in Note 7, long-term investments, long-term accounts receivable, loans granted under CI’s employee share purchase plan and loans extended to investment advisors under CI’s hiring and incentive program. Employee loans are collateralized by CI shares and become due immediately upon termination of the employee or upon the sale of the shares held as collateral. Commissions may be used to offset loan amounts made to investment advisors in the event of default. Credit risk associated with other assets is limited given the nature of the relationship with the counterparties.
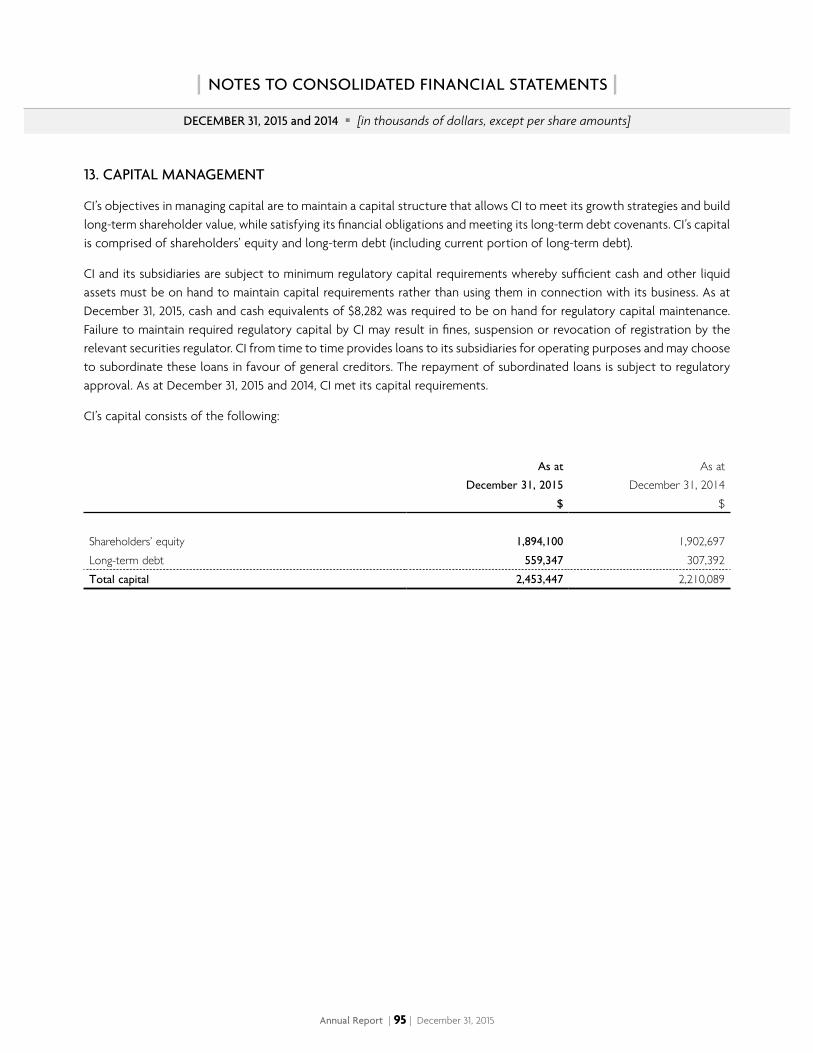
DECEMBER 31, 2015 and 2014 [in thousands of dollars, except per share amounts]
Annual Report | 95 | December 31, 2015
| NOTES TO CONSOLIDATED FINANCIAL STATEMENTS |
13 CAPITAL MANAGEMENT
CI’s objectives in managing capital are to maintain a capital structure that allows CI to meet its growth strategies and build long-term shareholder value, while satisfying its financial obligations and meeting its long-term debt covenants. CI’s capital is comprised of shareholders’ equity and long-term debt (including current portion of long-term debt).
CI and its subsidiaries are subject to minimum regulatory capital requirements whereby sufficient cash and other liquid assets must be on hand to maintain capital requirements rather than using them in connection with its business. As at December 31, 2015, cash and cash equivalents of $8,282 was required to be on hand for regulatory capital maintenance. Failure to maintain required regulatory capital by CI may result in fines, suspension or revocation of registration by the relevant securities regulator. CI from time to time provides loans to its subsidiaries for operating purposes and may choose to subordinate these loans in favour of general creditors. The repayment of subordinated loans is subject to regulatory approval. As at December 31, 2015 and 2014, CI met its capital requirements.
CI’s capital consists of the following:
As at
December 31, 2015
$
As atDecember 31, 2014
$
Shareholders’ equity 1,894,100 1,902,697Long-term debt 559,347 307,392Total capital 2,453,447 2,210,089
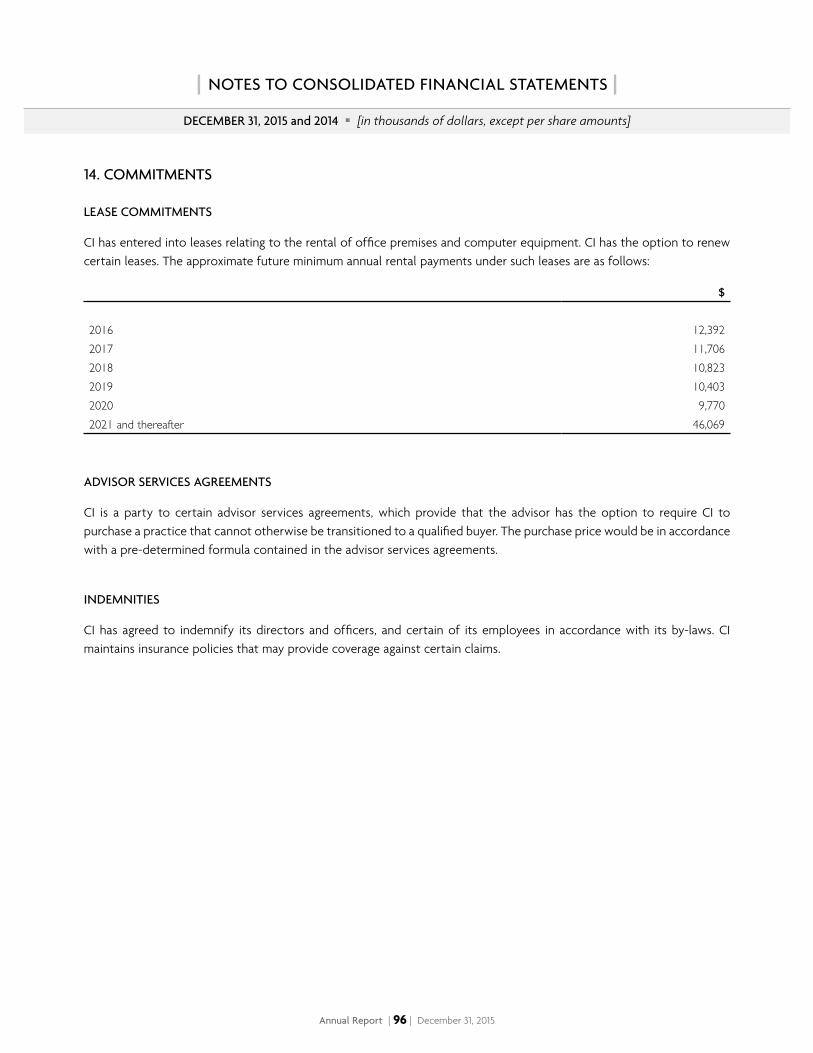
DECEMBER 31, 2015 and 2014 [in thousands of dollars, except per share amounts]
Annual Report | 96 | December 31, 2015
| NOTES TO CONSOLIDATED FINANCIAL STATEMENTS |
14 COMMITMENTS
LEASE COMMITMENTS
CI has entered into leases relating to the rental of office premises and computer equipment. CI has the option to renew certain leases. The approximate future minimum annual rental payments under such leases are as follows:
$
2016 12,3922017 11,7062018 10,8232019 10,4032020 9,7702021 and thereafter 46,069
ADVISOR SERVICES AGREEMENTS
CI is a party to certain advisor services agreements, which provide that the advisor has the option to require CI to purchase a practice that cannot otherwise be transitioned to a qualified buyer. The purchase price would be in accordance with a pre-determined formula contained in the advisor services agreements.
INDEMNITIES
CI has agreed to indemnify its directors and officers, and certain of its employees in accordance with its by-laws. CI maintains insurance policies that may provide coverage against certain claims.
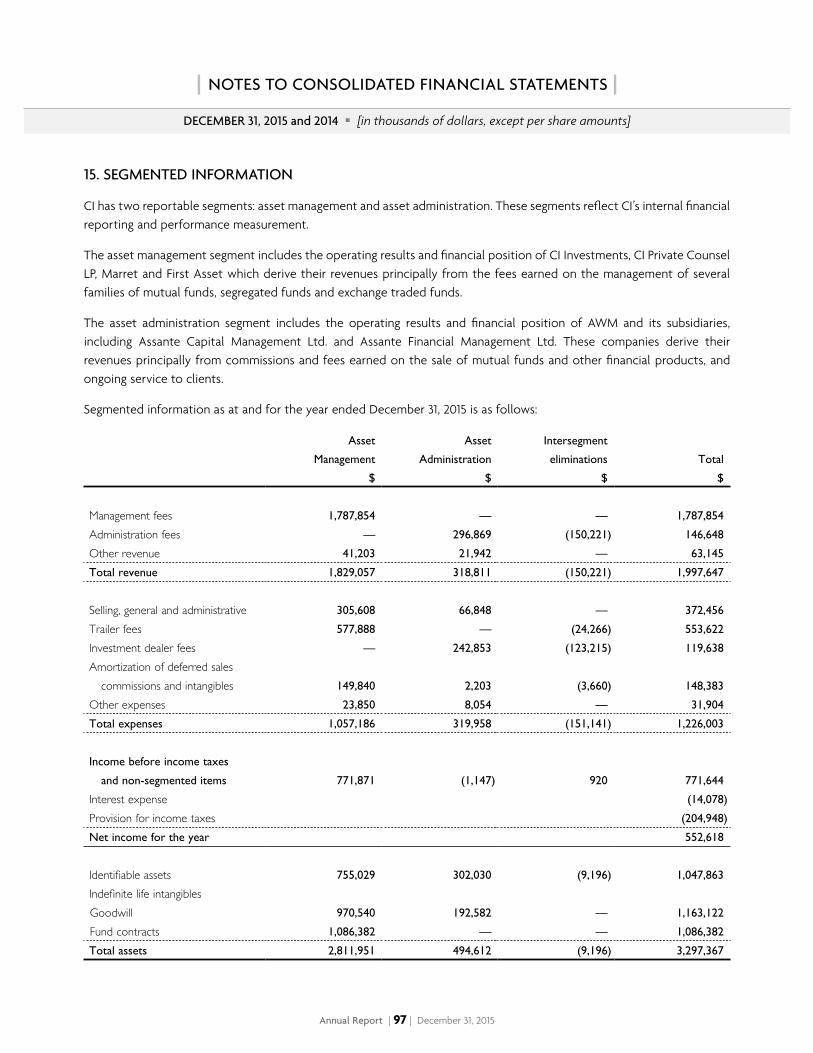
DECEMBER 31, 2015 and 2014 [in thousands of dollars, except per share amounts]
Annual Report | 97 | December 31, 2015
| NOTES TO CONSOLIDATED FINANCIAL STATEMENTS |
15 SEGMENTED INFORMATION
CI has two reportable segments: asset management and asset administration. These segments reflect CI’s internal financial reporting and performance measurement.
The asset management segment includes the operating results and financial position of CI Investments, CI Private Counsel LP, Marret and First Asset which derive their revenues principally from the fees earned on the management of several families of mutual funds, segregated funds and exchange traded funds.
The asset administration segment includes the operating results and financial position of AWM and its subsidiaries, including Assante Capital Management Ltd. and Assante Financial Management Ltd. These companies derive their revenues principally from commissions and fees earned on the sale of mutual funds and other financial products, and ongoing service to clients.
Segmented information as at and for the year ended December 31, 2015 is as follows:
Asset
Management
$
Asset
Administration
$
Intersegment
eliminations
$
Total
$
Management fees 1,787,854 — — 1,787,854
Administration fees — 296,869 (150,221) 146,648
Other revenue 41,203 21,942 — 63,145
Total revenue 1,829,057 318,811 (150,221) 1,997,647
Selling, general and administrative 305,608 66,848 — 372,456
Trailer fees 577,888 — (24,266) 553,622
Investment dealer fees — 242,853 (123,215) 119,638
Amortization of deferred salescommissions and intangibles 149,840 2,203 (3,660) 148,383
Other expenses 23,850 8,054 — 31,904
Total expenses 1,057,186 319,958 (151,141) 1,226,003
Income before income taxes
and non-segmented items 771,871 (1,147) 920 771,644
Interest expense (14,078)
Provision for income taxes (204,948)
Net income for the year 552,618
Identifiable assets 755,029 302,030 (9,196) 1,047,863
Indefinite life intangiblesGoodwill 970,540 192,582 — 1,163,122
Fund contracts 1,086,382 — — 1,086,382
Total assets 2,811,951 494,612 (9,196) 3,297,367
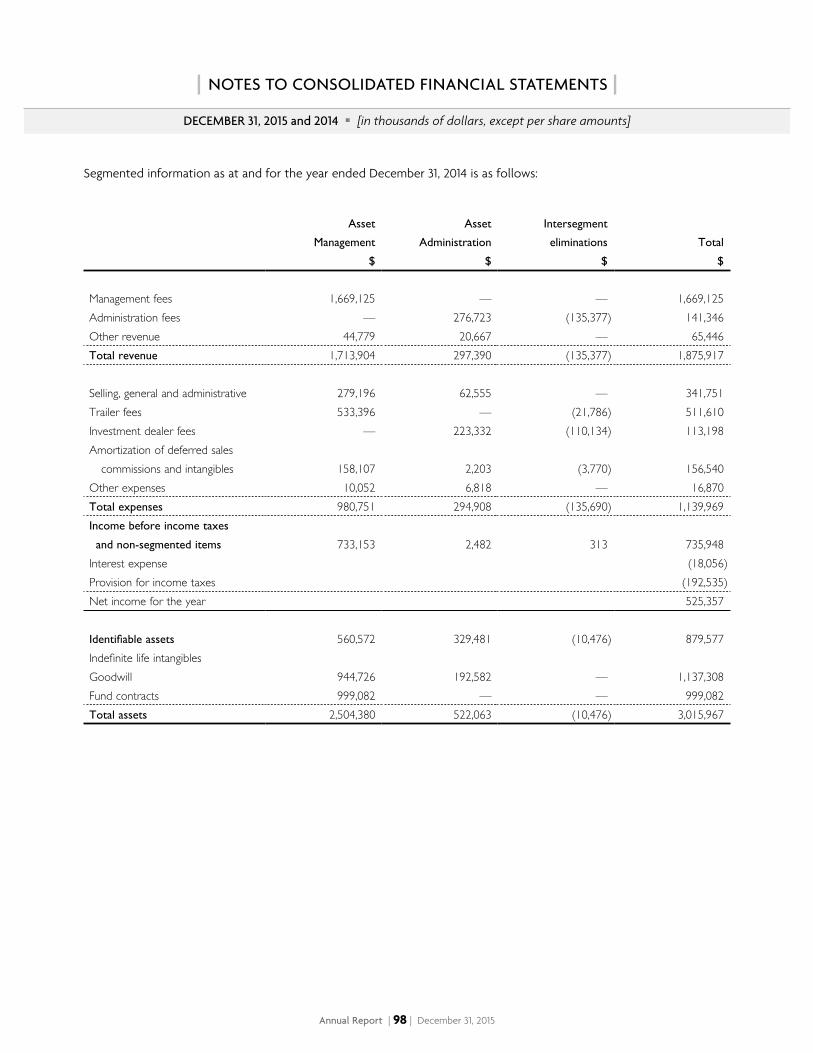
DECEMBER 31, 2015 and 2014 [in thousands of dollars, except per share amounts]
Annual Report | 98 | December 31, 2015
| NOTES TO CONSOLIDATED FINANCIAL STATEMENTS |
Segmented information as at and for the year ended December 31, 2014 is as follows:
Asset
Management
$
Asset
Administration
$
Intersegment
eliminations
$
Total
$
Management fees 1,669,125 — — 1,669,125 Administration fees — 276,723 (135,377) 141,346 Other revenue 44,779 20,667 — 65,446 Total revenue 1,713,904 297,390 (135,377) 1,875,917
Selling, general and administrative 279,196 62,555 — 341,751 Trailer fees 533,396 — (21,786) 511,610 Investment dealer fees — 223,332 (110,134) 113,198 Amortization of deferred sales
commissions and intangibles 158,107 2,203 (3,770) 156,540 Other expenses 10,052 6,818 — 16,870 Total expenses 980,751 294,908 (135,690) 1,139,969 Income before income taxes
and non-segmented items 733,153 2,482 313 735,948 Interest expense (18,056)Provision for income taxes (192,535)Net income for the year 525,357
Identifiable assets 560,572 329,481 (10,476) 879,577 Indefinite life intangiblesGoodwill 944,726 192,582 — 1,137,308 Fund contracts 999,082 — — 999,082 Total assets 2,504,380 522,063 (10,476) 3,015,967
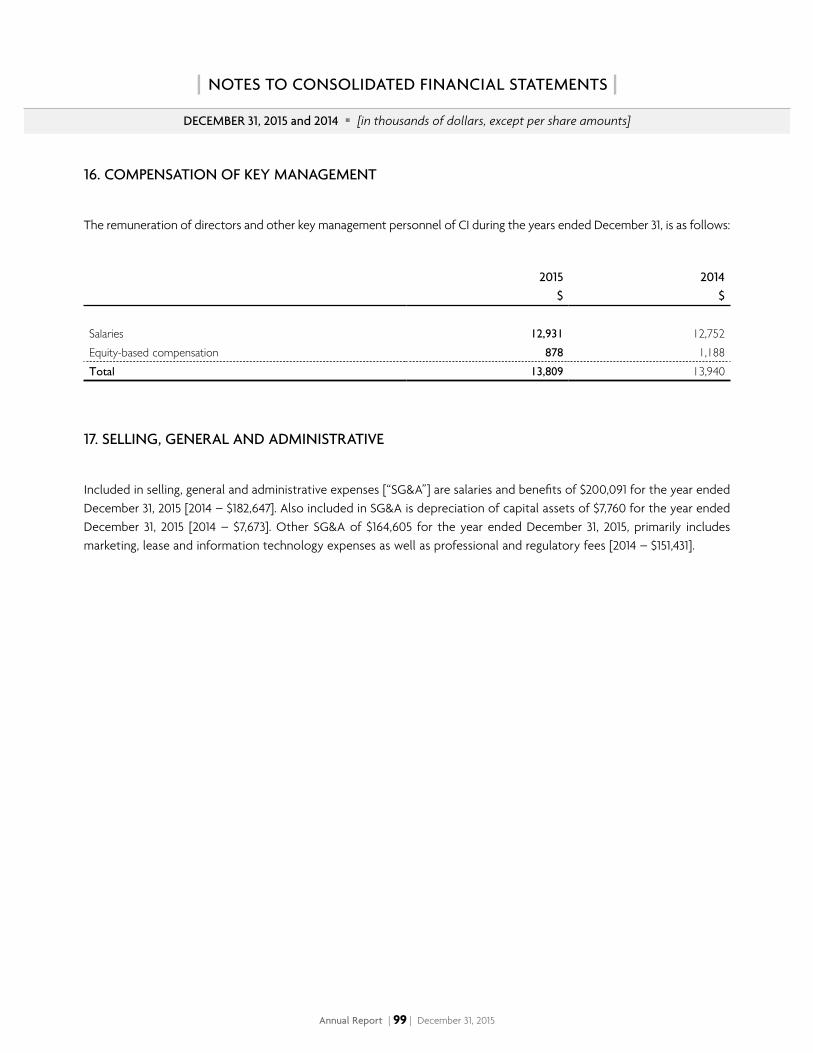
DECEMBER 31, 2015 and 2014 [in thousands of dollars, except per share amounts]
Annual Report | 99 | December 31, 2015
| NOTES TO CONSOLIDATED FINANCIAL STATEMENTS |
16 COMPENSATION OF KEY MANAGEMENT
The remuneration of directors and other key management personnel of CI during the years ended December 31, is as follows:
2015$
2014$
Salaries 12,931 12,752Equity-based compensation 878 1,188Total 13,809 13,940
17 SELLING, GENERAL AND ADMINISTRATIVE
Included in selling, general and administrative expenses [“SG&A”] are salaries and benefits of $200,091 for the year ended December 31, 2015 [2014 – $182,647]. Also included in SG&A is depreciation of capital assets of $7,760 for the year ended December 31, 2015 [2014 – $7,673]. Other SG&A of $164,605 for the year ended December 31, 2015, primarily includes marketing, lease and information technology expenses as well as professional and regulatory fees [2014 – $151,431].
DECEMBER 31, 2015 and 2014 [in thousands of dollars, except per share amounts]
Annual Report | 100 | December 31, 2015
| NOTES TO CONSOLIDATED FINANCIAL STATEMENTS |
18 FUTURE ACCOUNTING CHANGES
The following standards have been issued, but are not yet effective on the date of issuance of CI’s financial statements. CI is currently evaluating the impact of the application of these standards on the financial statements and will adopt these standards when they become effective.
IFRS 9:
IFRS 9 Financial Instruments (“IFRS 9”) was issued in July 2014 and will replace IAS 39 Financial Instruments: Recognition and Measurement (“IAS 39”). IFRS 9 provides a new approach for the classification of financial assets, which shall be based on the cash flow characteristics of the asset and the business model of the portfolio in which the asset is held. This final version includes requirements on: (1) Classification and measurement of financial assets and liabilities; (2) Impairment; and (3) Hedge accounting. Accounting for macro hedging has been decoupled from IFRS 9 and will not be considered and issued as a separate standard. For financial liabilities designated at fair value through profit or loss, IFRS 9 requires the presentation of the effects of changes in the liability’s credit risk in OCI instead of net income. IFRS 9 is effective for annual periods beginning on or after January 1, 2018. Retrospective application is required, but comparative information is not compulsory.
IFRS 15:
IFRS 15 Revenue from Contracts with Customers (“IFRS 15”) was issued in May 2014. IFRS 15 replaces prior guidance, including IAS 18 Revenue. The principles in IFRS 15 provide a more structured approach to measuring and recognizing revenue. The new guidance includes a five-step recognition and measurement approach, requirements for accounting of contract costs, and enhanced quantitative and qualitative disclosure requirements. Under IFRS 15, revenue is recognized at an amount that reflects the consideration to which an entity expects to be entitled in exchange for transferring goods or services to a customer. The standard is effective for annual periods beginning on or after January 1, 2018 and is to be applied retrospectively.
IFRS 16:
IFRS 16 Leases (“IFRS”) was issued in January 2016 and will replace the previous lease standard, IAS 17 Leases, and related Interpretations. The new standard requires lessees to recognize assets and liabilities for most leases. IRFS 16 is effective for annual periods beginning on or after January 1, 2019.
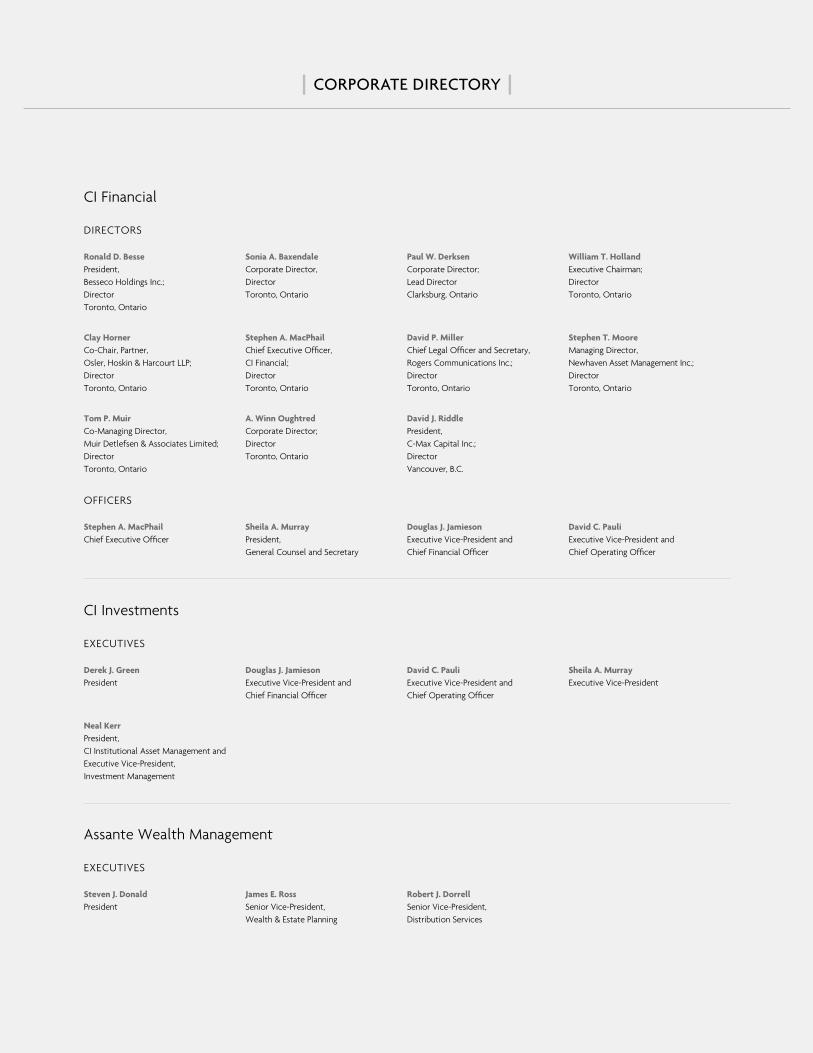
Annual Report | 101 | December 31, 2015
| CORPORATE DIRECTORY |
CI Financial
DIRECTORS
Ronald D. BessePresident, Besseco Holdings Inc.;DirectorToronto, Ontario
Sonia A. BaxendaleCorporate Director, Director Toronto, Ontario
Paul W. DerksenCorporate Director;Lead DirectorClarksburg, Ontario
William T. HollandExecutive Chairman; DirectorToronto, Ontario
Clay HornerCo-Chair, Partner, Osler, Hoskin & Harcourt LLP; Director Toronto, Ontario
Stephen A. MacPhailChief Executive Officer,CI Financial;DirectorToronto, Ontario
David P. MillerChief Legal Officer and Secretary, Rogers Communications Inc.; Director Toronto, Ontario
Stephen T. MooreManaging Director, Newhaven Asset Management Inc.; DirectorToronto, Ontario
Tom P. MuirCo-Managing Director, Muir Detlefsen & Associates Limited; Director Toronto, Ontario
A. Winn OughtredCorporate Director;DirectorToronto, Ontario
David J. RiddlePresident, C-Max Capital Inc.; DirectorVancouver, B.C.
OFFICERS
Stephen A. MacPhailChief Executive Officer
Sheila A. MurrayPresident, General Counsel and Secretary
Douglas J. JamiesonExecutive Vice-President andChief Financial Officer
David C. PauliExecutive Vice-President and Chief Operating Officer
CI Investments
EXECUTIVES
Derek J. GreenPresident
Douglas J. JamiesonExecutive Vice-President and Chief Financial Officer
David C. Pauli Executive Vice-President and Chief Operating Officer
Sheila A. MurrayExecutive Vice-President
Neal KerrPresident, CI Institutional Asset Management and Executive Vice-President, Investment Management
Assante Wealth Management
EXECUTIVES
Steven J. DonaldPresident
James E. RossSenior Vice-President,Wealth & Estate Planning
Robert J. DorrellSenior Vice-President,Distribution Services
Annual Report | 102 | December 31, 2015
| CORPORATE INFORMATION |
Head Office2 Queen Street East Twentieth FloorToronto, Ontario M5C 3G7Telephone: 416-364-1145Toll Free: 1 800 268-9374www.cifinancial.com
Administration Office15 York StreetSecond FloorToronto, Ontario M5J 0A3
Investor RelationsContact: Douglas J. Jamieson, Executive Vice-President and Chief Financial OfficerTelephone: 416-364-1145Toll Free: 1 800 268-9374E-mail: [email protected]
Trading SymbolCI Financial trades on the Toronto Stock Exchange under the symbol “CIX”.
AuditorsErnst & Young LLPChartered AccountantsToronto-Dominion CentreP.O. Box 251Toronto, Ontario M5K 1J7
Registrar and Transfer AgentComputershare Investor Services Inc.8th Floor, 100 University AvenueToronto, Ontario M5J 2Y1Telephone: 1 800 564-6253
Normal Course Issuer BidEffective June 18, 2015, the Toronto Stock Exchange accepted CI’s notice of intention to commence a normal course issuer bid (the “Notice”) through the facilities of the Toronto Stock Exchange. Under the bid, CI may purchase up to 10,000,000 Shares at the prevailing market price. Purchases under the bid will terminate no later than June 17, 2016. As of March 31, 2016, CI has acquired an aggregate of 6,250,787 Shares under the normal course issuer bid at an average price of $30.26 per Share. Shareholders may obtain a copy of the Notice, without charge, by contacting the Corporate Secretary of CI. The Corporation intends to renew its Normal Course Issuer Bid effective June 18, 2016, subject to receipt of approval from the Toronto Stock Exchange.
Shareholder rights planThe Corporation entered into an agreement (the “Rights Plan Agreement”) dated as of May 1, 2014 with Computershare Investor Services Inc., as rights agent, in connection with the adoption of a shareholder rights plan (the “Rights Plan”). The Rights Plan Agreement supersedes and replaces the rights plan agreement of the Corporation dated as of January 1, 2009 and was ratified and approved at the annual and special meeting of shareholders on June 11, 2014. The Rights Plan will terminate at the close of the annual meeting of shareholders in 2017. The Notice of Meeting and Management Information Circular of the Corporation dated May 1, 2014 includes a summary of the Rights Plan approved by the shareholders. The complete text may be found on SEDAR at www.sedar.com.
Digital ReportThis Annual Report can be downloaded from CI’s website at www.cifinancial.com under “Reports”.
Annual MeetingThis Annual Meeting of Shareholders will be held at 4 p.m. ET on June 9, 2016 at 15 York Street, Second Floor, Toronto.

This Report contains forward-looking statements with respect to CI, including its business operations and strategy and financial
performance and condition. Although management believes that the expectations reflected in such forward-looking statements are
reasonable, such statements involve risks and uncertainties. Actual results may differ materially from those expressed or implied by
such forward-looking statements. Factors that could cause results to differ materially include, among other things, general economic
and market factors, including interest rates, business competition, changes in government regulations or in tax laws, and other factors
discussed in materials filed with applicable securities regulatory authorities from time to time.
1601-0115_E (04/16)