Embed Size (px)
Citation preview
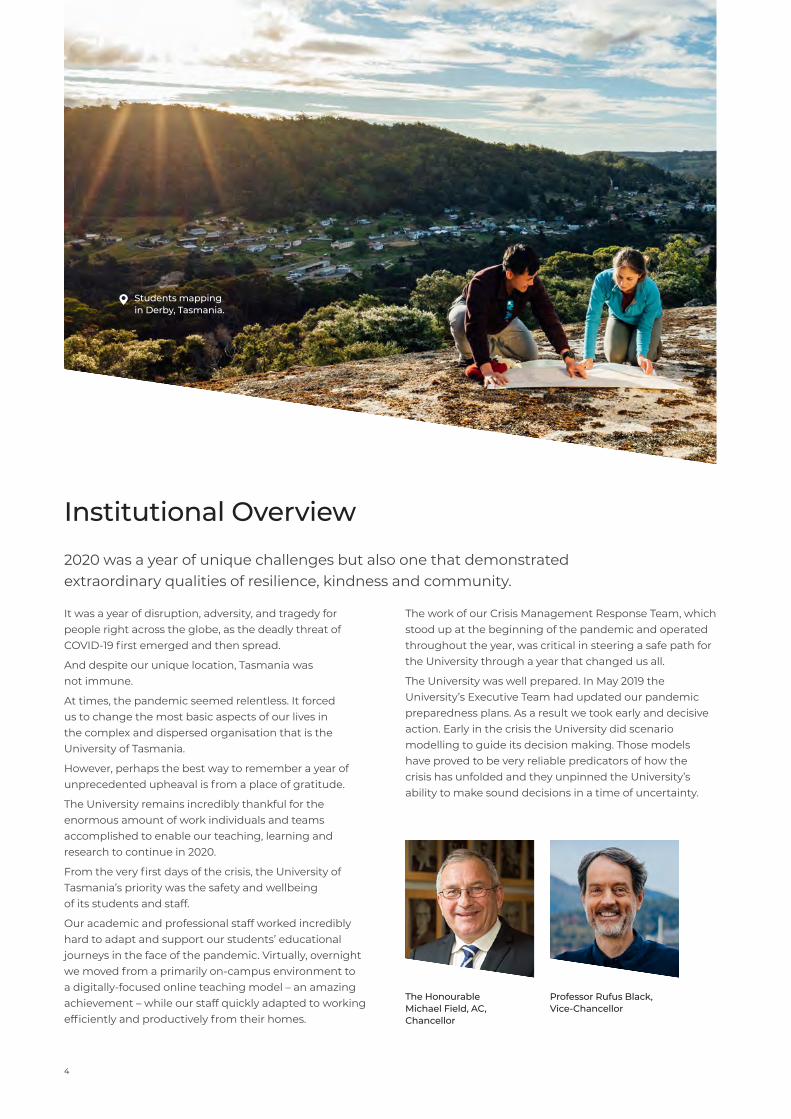
Sunrise in Derby, North-East Tasmania.
2020Annual Report
Contents
4 Institutional Overview
12 Governance
25 Financial Statements
80 Management Certificate
81 Auditor’s Report
We acknowledge the palawa/pakana and Gadigal people, the traditional custodians of the land upon which we live and work.
We honour their enduring culture and knowledges as vital to the self-determination, wellbeing and resilience of their communities, and to shaping a just, inclusive and equitable Australian society.
This report is made in accordance with a resolution of the members of the Council of the University of Tasmania on 30 April 2021.
To Her Excellency
Professor the Honourable Kate Warner AC Governor of Tasmania
May it please Your Excellency: The Council of the University of Tasmania, in conformity with the provisions of the University of Tasmania Act 1992, has the honour to report, for your Excellency’s information, the proceedings of the University for 2020 and to present the financial statements for that year.
The Hon Michael Field AC Chancellor
30 April 2021.
32020Annual Report
Institutional Overview
2020 was a year of unique challenges but also one that demonstrated extraordinary qualities of resilience, kindness and community.
It was a year of disruption, adversity, and tragedy for people right across the globe, as the deadly threat of COVID-19 first emerged and then spread.
And despite our unique location, Tasmania was not immune.
At times, the pandemic seemed relentless. It forced us to change the most basic aspects of our lives in the complex and dispersed organisation that is the University of Tasmania.
However, perhaps the best way to remember a year of unprecedented upheaval is from a place of gratitude.
The University remains incredibly thankful for the enormous amount of work individuals and teams accomplished to enable our teaching, learning and research to continue in 2020.
From the very first days of the crisis, the University of Tasmania’s priority was the safety and wellbeing of its students and staff.
Our academic and professional staff worked incredibly hard to adapt and support our students’ educational journeys in the face of the pandemic. Virtually, overnight we moved from a primarily on-campus environment to a digitally-focused online teaching model – an amazing achievement – while our staff quickly adapted to working efficiently and productively from their homes.
The work of our Crisis Management Response Team, which stood up at the beginning of the pandemic and operated throughout the year, was critical in steering a safe path for the University through a year that changed us all.
The University was well prepared. In May 2019 the University’s Executive Team had updated our pandemic preparedness plans. As a result we took early and decisive action. Early in the crisis the University did scenario modelling to guide its decision making. Those models have proved to be very reliable predicators of how the crisis has unfolded and they unpinned the University’s ability to make sound decisions in a time of uncertainty.
Students mapping in Derby, Tasmania.
The Honourable Michael Field, AC, Chancellor
Professor Rufus Black, Vice-Chancellor
4
Institutional responseThe University was able to support Tasmania to respond to the many challenges posed by COVID-19 and begin the state’s recovery in a range of ways.
We helped build capability in the State’s infectious disease team and used our strength in 3D-printing to create Personal Protective Equipment for GPs during the outbreak on the North-West Coast.
Our chemistry teams produced hand sanitiser and disinfectant for use in Tasmania’s healthcare system, while facilities in Newnham and Hobart – including the Fountainside Hotel – were made available for medical simulations, overflow and medi-hotels.
To help Tasmanians face the economic and emotional challenges of life during the pandemic, the University announced a new set of short courses called the Wellbeing Toolkit. Provided at no cost to participants and made available online, the Toolkit offered a range of modules covering topics including financial planning and budgeting, mental health, and resilience.
To provide government and NGOs with data to help shape COVID-19 policy responses, the University created the Tasmanian Project. Designed to give Tasmanians a voice in recovery planning, the Tasmania Project involved 40 researchers and more than 7000 survey responses in revealing broad community support for compliance with government restrictions, but also exposed the significant impact on financial wellbeing felt across Tasmania and the reduction in food security.
For Year 12 students facing a heavily disrupted final year of secondary education, we created the Schools Recommendation Program (SRP). This was designed to mitigate any educational disadvantage caused by the pandemic by providing students a clearer path to tertiary study. The SRP not only significantly improved Year 12 applications across all regions, but helped us engage with schools more effectively to create long-lasting relationships.
Financial responseEven before the significant impact of COVID-19, we were committed to a path of sustainability knowing full well it would be tough.
Despite the size of the challenge, we remain determined to address it in line with our values with the objective to become a sustainable operation by the mid-2020s.
Like all Australian universities, much of our financial challenge is in international education. With national borders closing in 2020 and likely to be highly controlled for a long time to come, we will see fewer international students in the years ahead. State border controls also reduced the arrival of interstate students last year, further impacting our revenues.
While international travel remains restricted, we will continue to maximise opportunities within our existing markets and products. Our international strategy of diversification and online delivery means international student applications have, in fact, held up well in the face of the significant headwinds.
Once travel does become possible again, we will develop an international recruitment strategy, which will include a focus on our distinctive offerings to complement the migration market.
In 2020, we were careful not to make rushed projections of the potential financial impact of the pandemic, nor engage in knee-jerk responses. The University Council unanimously supported a plan based on the principles of staying focused on maintaining a great experience for students, addressing non-people costs first, sharing the financial burden over time, supporting staff flexibility, and aiming for long-term sustainability of staff numbers.
In response to the financial challenge posed by COVID-19, our UTAS staff voted strongly for an Enterprise Agreement Variation containing a range of measures that allowed the University to preserve jobs. The Fair Work Commission approved the variation in June. The COVID-19 Temporary Measures Committee then initiated a program of budgetary restraint, including a hold on the scheduled 2 per cent salary increase, and offering eligible staff voluntary redundancy options. These collective measures provided an immediate saving to the University, equivalent to around 50 jobs.
The work we did in 2020 to shape our people profile has us well-positioned to be sustainable into the immediate future.
Meanwhile, the Higher Education Reform will enable us to grow funded places by 1100 EFTSL and increase domestic revenue by at least $15m. The Reform has a Transition Fund, which provides a domestic CSP revenue floor, which significantly reduces risk and uncertainty for the next three years.
The University’s COVID-19 financial strategy has set us on the path to a sustainable cost structure, and despite our challenging year we are on track to achieve our target to reduce expenses by $30m.
Strategic response In 2019, we developed a five-year strategic plan to deliver outcomes across six key areas both for Tasmania, and from Tasmania to the world.
These areas were in Education Attainment, Health, Cultural Participation, Economic Performance, Social Inclusion, and Environmental Sustainability.
In 2020, we refined the strategy to strengthen our focus on impact areas considered especially critical for recovery in the post-COVID world.
52020Annual Report

Curriculum TransformationIn 2020, we made the decision to improve our course portfolio by reducing the number of courses we offer, and to present students with clear and compelling choices with highly distinctive Tasmanian offerings.
We had concluded that the University had undergraduate courses that were duplicated, disconnected and confusing. In just 15 weeks, we consolidated our offering from 209 courses to just 60 nests containing 93 courses. In the process, we reduced the number of units in our undergraduate programs by nearly 60 per cent.
Our new course and curriculum framework portfolio is now clear, aligned, and presents a compelling array of choices, offering students a better experience from enrolment onwards.
Importantly, the new course architecture also significantly strengthens our offerings in the North and North-West, which is a critical part of our strategic commitment to be a regionally networked university and to move away from a hub-and-spoke model. Our strategies to simplify and create distinctive offerings to attract Tasmanian and interstate students are working, with pleasing growth in core course enrolments in 2020.
The University has also commenced Indigenising our curriculum through the development of new specialised units and by enhancing the content of existing units. By 2023, we aim to have 25 per cent of first-year undergraduate students completing an assessment item on Indigenous knowledge and culture that is relevant to their discipline.
Northern Transformation and Southern campus programsWe have made significant progress in our campus transformation projects. West Park is set for completion in 2021, construction well underway at Inveresk, and all other Northern Transformation projects remain on time and on budget.
Construction of the new Cradle Coast campus at West Park commenced in January, marked by the sharing in a Community Conversation of perspectives on its ongoing benefits. A successful series of Community Walks provided opportunities for engagement around new themes and ways of connecting and will continue until the campus opens.
Tasmanian lead contractors Fairbrother have remained on track with construction progress for the campus to open in Semester 2, 2021, despite COVID restrictions. This is a positive economic contribution to the region during uncertain times. In June, an onsite event with project partners was held to celebrate the progress achieved.
In December, planting of a sustainable green roof commenced, featuring over 12,000 plants to be irrigated
by rainwater tanks, providing acoustic and thermal insulation and installed using local labour.
At Inveresk, construction commenced in February for the Library and Student Experience building (opening early 2022) and the pedestrian and cycle bridge linking the precinct to the city (opening early 2021).
In May, a development application was submitted for redevelopment of the Northern car park, comprising 752 spaces to support the University and wider community, including at major events. This DA was approved in September and the project is scheduled for completion in mid-2021.
Development applications for stage two, including the River’s Edge and Willis Street buildings, were submitted in June and approved by Launceston City Council on 12 November. This was a significant milestone for the project, with strong support demonstrated from local leaders.
A DA was submitted for the Urban Realm in October, following extensive consultation and feedback on the designs from internal and external individuals and community groups.
This will include five outdoor spaces around the precinct totalling 15,830sqm for recreation, edible gardens and learning experiences. Following council planning processes, work is scheduled to commence by mid-2021. The Northern Transformation team continues to work closely with the State Government and Department of Education to ensure the theme of learning is embedded in the precinct.
A Newnham Concept Masterplan has been progressed to represent a future vision for the area following the University’s transition to Inveresk. It supports the future of key Northern Tasmanian industries and regions, incorporating ample opportunity for new and upgraded research facilities and industry co-location as well as commercial and mixed residential precincts.
In early 2020, the University convened a Community Reference Group to provide input to our plans for our future Southern campus in the city of Hobart. An informal event was held in February, and our first working group was scheduled for March 13.
What followed, as we know, delayed our plans significantly and meant the Southern campus transformation was paused while we worked to secure the University’s future.
Later in the year we were able to return to this work, reinstating our regular working group with the City of Hobart as a forum to discuss progress, pulling together our pre-COVID work and convening an expert reference group to inform a preliminary urban design framework. This framework includes our learnings, principles and draft masterplan for our city locations and urban landscape, to guide our campus transformation between now and 2030.
Institutional Overview
6

Artist's impression of the new facilities at Cradle Coast Campus, Burnie.
72020Annual Report

Island CampusIn the Strategic Plan release in 2019, we committed to being a regionally networked university, providing quality and access across each of our campuses.
As our campus redevelopments progress, we need to be confident that wherever we operate will be vibrant and dynamic for the long term, supporting a great experience for both staff and students. In 2020 we announced a series of initiatives to help us achieve this regionally networked goal.
Newnham will become the home of the Australian Maritime College, the $330 million Blue Economy CRC, and the federally funded $30 million Defence and Maritime Innovation and Design Precinct.
Our desire to further strengthen Newnham’s future will involve the eventual headquartering of the Tasmanian Institute of Agriculture (TIA) in Launceston, with a presence at both Newnham and Inveresk, and the establishment of a professional services centre to support the breadth of the University comprising around 300 staff by 2025.
They will be carefully considered and implemented over the next few years, with support arrangements in place for staff who are part of these groups.
On the Cradle Coast, we will strengthen our focus in engineering and technology, supporting the state-of-the-art Original Equipment Manufacturing (OEM) facility. This will have specific regard to agriculture, advanced manufacturing, sensing technology and IT&C.
In the South, IMAS Taroona will develop further as a distinct research precinct supporting sustainable fisheries and aquaculture. This will be supported by the consolidation of current activities from IMAS Launceston to Taroona in coming years.
The University will continue to be a vital part of the Antarctic community, with its world-class strengths in Southern Ocean and climate change research.
These proposals are designed to transform our hub-and-spoke model, in which the weight of the University and its leadership are based in Hobart, into an ’island campus’. This change will provide more opportunity for Tasmanians to study close to home, and will leverage the distinct regional advantages of its many places.
We will ensure that every place the University operates in has sufficient scale to be exciting, dynamic and sustainable for the long term.
Welcome to Country, Orientation Week, Tasmanian Museum and Art Gallery, Hobart.
Institutional Overview
8
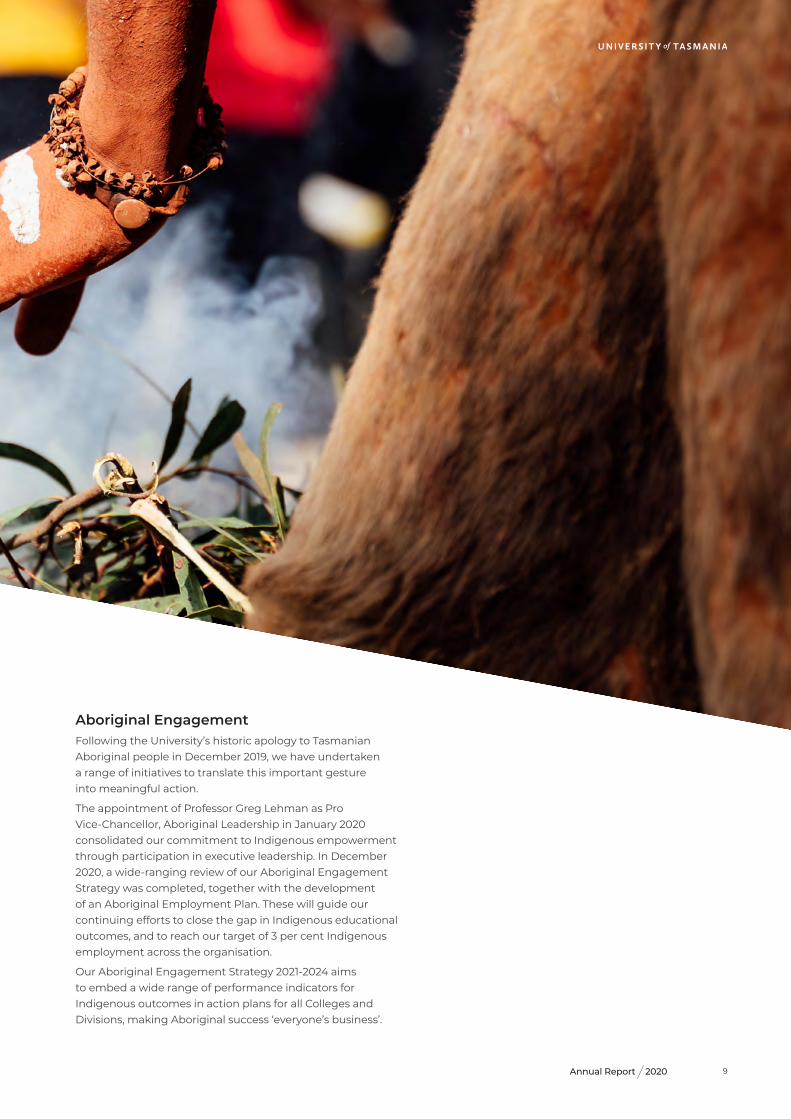
Aboriginal Engagement Following the University’s historic apology to Tasmanian Aboriginal people in December 2019, we have undertaken a range of initiatives to translate this important gesture into meaningful action.
The appointment of Professor Greg Lehman as Pro Vice-Chancellor, Aboriginal Leadership in January 2020 consolidated our commitment to Indigenous empowerment through participation in executive leadership. In December 2020, a wide-ranging review of our Aboriginal Engagement Strategy was completed, together with the development of an Aboriginal Employment Plan. These will guide our continuing efforts to close the gap in Indigenous educational outcomes, and to reach our target of 3 per cent Indigenous employment across the organisation.
Our Aboriginal Engagement Strategy 2021-2024 aims to embed a wide range of performance indicators for Indigenous outcomes in action plans for all Colleges and Divisions, making Aboriginal success ‘everyone’s business’.
92020Annual Report
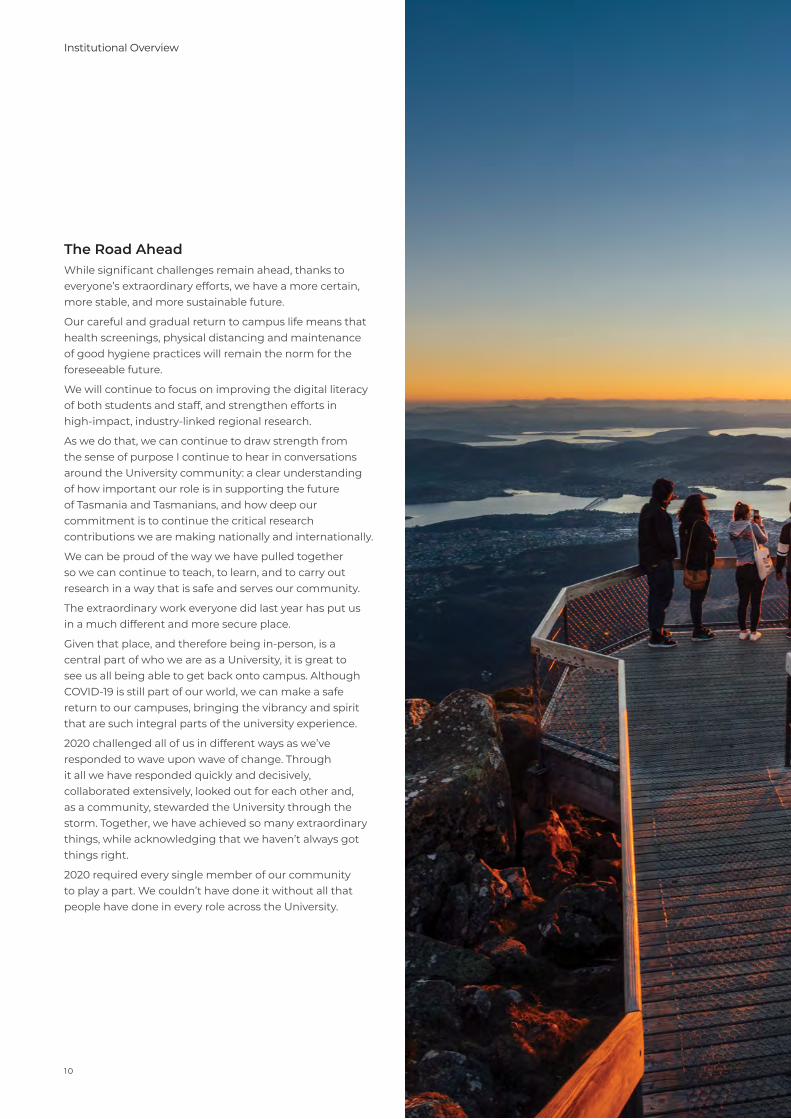
The Road AheadWhile significant challenges remain ahead, thanks to everyone’s extraordinary efforts, we have a more certain, more stable, and more sustainable future.
Our careful and gradual return to campus life means that health screenings, physical distancing and maintenance of good hygiene practices will remain the norm for the foreseeable future.
We will continue to focus on improving the digital literacy of both students and staff, and strengthen efforts in high-impact, industry-linked regional research.
As we do that, we can continue to draw strength from the sense of purpose I continue to hear in conversations around the University community: a clear understanding of how important our role is in supporting the future of Tasmania and Tasmanians, and how deep our commitment is to continue the critical research contributions we are making nationally and internationally.
We can be proud of the way we have pulled together so we can continue to teach, to learn, and to carry out research in a way that is safe and serves our community.
The extraordinary work everyone did last year has put us in a much different and more secure place.
Given that place, and therefore being in-person, is a central part of who we are as a University, it is great to see us all being able to get back onto campus. Although COVID-19 is still part of our world, we can make a safe return to our campuses, bringing the vibrancy and spirit that are such integral parts of the university experience.
2020 challenged all of us in different ways as we’ve responded to wave upon wave of change. Through it all we have responded quickly and decisively, collaborated extensively, looked out for each other and, as a community, stewarded the University through the storm. Together, we have achieved so many extraordinary things, while acknowledging that we haven’t always got things right.
2020 required every single member of our community to play a part. We couldn’t have done it without all that people have done in every role across the University.
Institutional Overview
10

Students at the pinnacle, kunanyi/Mt Wellington.
2020Annual Report 11
Governance
UNIVERSITY COUNCIL
The Council is the governing body of the University, established under the University of Tasmania Act 1992. Under the Act, the Council has responsibility for high-level strategic direction, major financial planning, monitoring management performance and compliance, staff appointments, and the allocation of funds.
Council delegates broad powers to the Vice-Chancellor (the managerial and academic leader) to manage the operations of the University in conformity with agreed plans, principles, and policies. The Vice-Chancellor, in turn, empowers other members of the University Executive Team.
Council is advised by its committees (Audit and Risk, Built Environment and Infrastructure, Ceremonial and Honorary Degrees, Finance, Remuneration and Nominations, and University Foundation) and in relation to academic matters, the Academic Senate.
COMPLIANCE WITH THE VOLUNTARY CODE OF BEST PRACTICE FOR THE GOVERNANCE OF AUSTRALIAN UNIVERSITIES
The University complies with the Voluntary Code of Best Practice for the Governance of Australian Universities.
Governance ReviewIn 2020, as part of good governance practice, the University Council engaged an external consultant to review Council operations. Council implemented the recommendations from the Review, including a change to the length of Council members’ terms to a revised maximum period of 9 years, the development of a skill matrix for Council member selection, and a revision of the structure of Council committees.
Council determined that key strategic issues that led to the foundation of the Finance Committee and Built Environment and Infrastructure Committee were well covered by management and these committees were disestablished in October 2020. Council established a Strategic Resourcing Committee to consider, engage and advise on emerging issues which impact the strategic deployment of the University’s financial and physical resources.
Governance Instruments FrameworkThe University reformed its suite of governance instruments in support of high-equality decision making. These instruments are the primary means by which University Council delegates its powers and functions and they provide policy guidance for decision making. The suite had become complex, detailed, and out of date and through the reform were reduced from over 400 to just 10 ordinances, the University by-laws, and 30 principles-based policies which are underpinned by supporting procedures and systems. The framework comprises the instruments and robust governance arrangements for their development and review.
The framework includes the new principles and risk-based General Delegations Ordinance, through which Council delegates its powers to approve contracts, borrowings and expenditure, appointment, remuneration and termination of University staff and to accept risk. Non-compliances with the ordinance are reported through to the Audit and Risk Committee.
A hands-on ‘decision making’ education program commenced to roll out the new framework, the delegations, and the new Risk Management Framework, which will continue into 2021.
AUDIT AND RISK
Risk Management Risk management at the University is overseen and supported by Council through the Audit and Risk Committee. The focus for risk management during 2020 was to:
• Develop a fit-for-purpose risk appetite statement to assist in the ongoing management of risk throughout the University.
• Review and update the Council-approved Whole of University Strategic and Operational Risk Profile.
• Develop a University Risk Management Framework and commence rollout of this across the University.
• Develop a tailored risk-appetite statement for the UTAS Property Co.
• Provide support to Colleges as they analyse, assess and report on key risks, particularly as they engage formally with the Audit and Risk Committee
12
Internal AuditDuring 2020, the University focused on providing assurance to safeguard operations most critical to enabling success. It undertook a body of internal audit activity, with major elements of the program including:
• Consideration of the effectiveness of controls in respect to fraud risk management and calculation of voluntary redundancy payments.
• Consideration of the effectiveness of controls in relation to management of conflict of interests and of the exposure of Council and Committee managing such conflicts.
• Consideration of the prevention of breaches of academic integrity (cheating) during the COVID-19 pandemic.
Compliance During 2020, the University’s compliance function:
• Progressed the implementation and embedding of the legal compliance framework including aligning all State and Commonwealth obligations with the new University Risk Appetite Statement.
• Developed and implemented a consolidated institutional complaints and culture reporting process, which provides University Council with an organisational overview on systemic and themed issues related to behaviour across the University.
• In accordance with the University Privacy Policy and Data Beach Response Plan, in September 2020, the University investigated and subsequently notified the Office of the Australian Information Commissioner and the Tasmanian Ombudsman of a privacy breach, which related to the personally identifiable information of 19,000 students. No regulatory action was taken because of the breach.
Data, Information Management and Cyber Security GovernanceIn November 2020, the Data, Information Management and Cyber Security Committee was formed with responsibility for the establishment, implementation and monitoring of the University Data and Information Management Framework and the Cyber Security Governance Framework. The Committee carries out the strategic priorities agreed by the University Executive Team. The Audit and Risk Committee has oversight of emerging risks and compliance requirements.
Right to Information (RTI)During the year, the University received nine applications for access to information under the assessed disclosure provisions of the Right to Information Act 2009 (Tas), eight of which were dealt with under the provisions of the Act.
Public Interest Disclosures (PID)The University is subject to State and Commonwealth public interest disclosure regimes.
University employees who make public interest disclosures are subject to protection under the Public Interest Disclosures Act 2002 (Tas), where disclosures are made in accordance with the Act. The University provides support to people who make disclosures that reveal corrupt and improper conduct. University PID Procedures were reviewed and approved by the Tasmanian Ombudsman in February 2020. University Public Interest Disclosures Procedures may be accessed here.
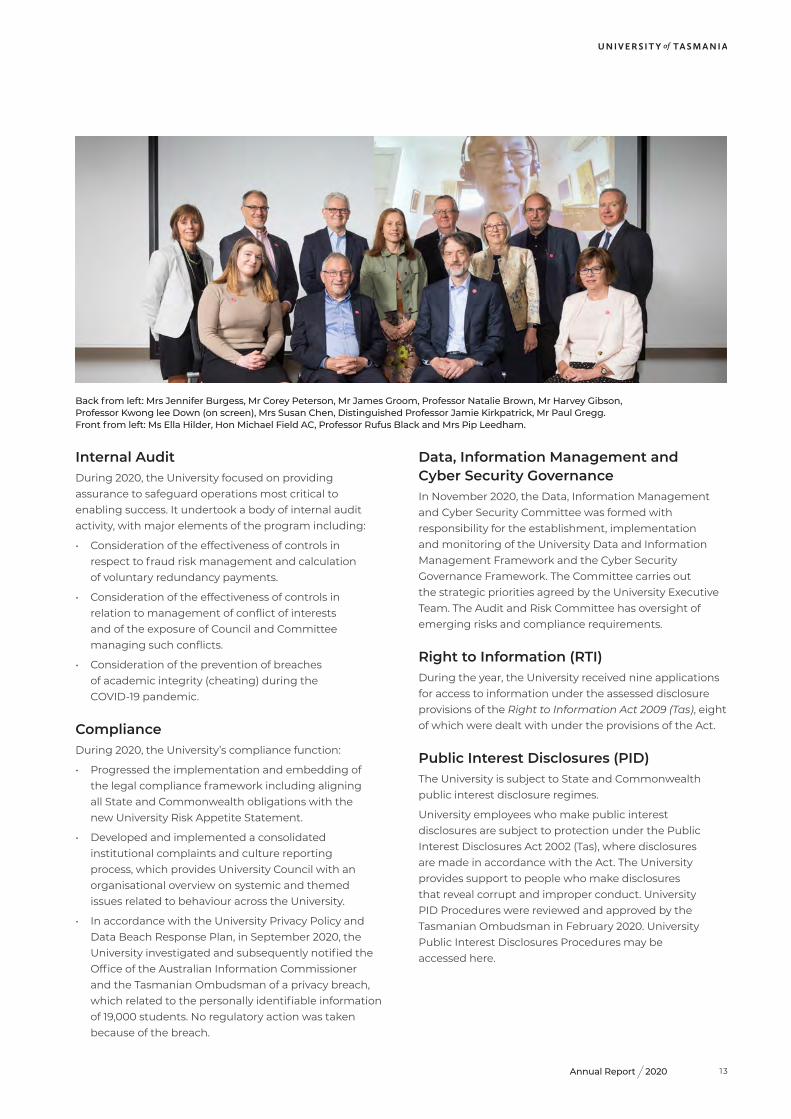
Back from left: Mrs Jennifer Burgess, Mr Corey Peterson, Mr James Groom, Professor Natalie Brown, Mr Harvey Gibson, Professor Kwong lee Down (on screen), Mrs Susan Chen, Distinguished Professor Jamie Kirkpatrick, Mr Paul Gregg. Front from left: Ms Ella Hilder, Hon Michael Field AC, Professor Rufus Black and Mrs Pip Leedham.
132020Annual Report
Governance
Public Interest Disclosures 2020• Number of disclosures made to the public body
during the year that relate to improper conduct (1)
• Number of disclosures made to the public body during the year that relate to detrimental action (0)
• Number of disclosures determined to be a public interest disclosure (1)
• Number of disclosures determined by the public body to be public interest disclosures that were investigated during the year (1)
• Number and types of disclosed matters referred to the public body by the Ombudsman for investigation (1)
• Number and types of disclosures referred by the public body to the Ombudsman for investigation (0)
• Number and types of investigations taken over from the public body by the Ombudsman (0)
• Number and types of disclosed matters that the public body has declined to investigate (0)
• Number and types of disclosed matters that were substantiated upon investigation and the action taken on completion of the investigation (0)
• Any recommendations made by the Ombudsman that relate to the public body (0)
In October 2020, the University engaged Maree Norton, independent barrister, to be an external complaints contact for any complaints from the University community into the conduct of former Vice-Chancellor Professor Peter Rathjen. This was after the South Australian Commissioner Against Corruption found Professor Rathjen had committed serious misconduct by sexually harassing two staff members whilst Vice-Chancellor at the University of Adelaide. The University of Tasmania review received 11 complaints. Ms Norton’s review made seven recommendations, including to review the Behaviour Policy, educational programs and the internal complaints processes regarding unacceptable behaviour. All recommendations have been accepted and an implementation plan has been endorsed by Council.
14
Modern Slavery StatementThe University has developed a Statement that addresses the mandatory criteria set out in the Modern Slavery Act 2018 (Cth) including requirements to identify the risks of modern slavery in University supply chains and operations, due-diligence and remediation processes in accordance with the United Nations Guiding Principles to Business and Human Rights 15 and 17.
The Statement covers activities in the reporting period 1 January 2020 – 31 December 2020 and will be published on the Department of Home Affairs website and University website on or before the 30 June 2021.
Foreign Influence, Foreign Interference and Foreign RelationsThe University has undertaken an assessment of activities in accordance with the Foreign Influence Transparency Scheme Act 2018 (Cth). The Scheme requires organisations, including universities, to report registrable activities relating to political lobbying involving foreign principals. The University has also developed and implemented risk-based processes that align with the University Foreign Interference Taskforce Guidelines to mitigate against risks of foreign interference. The University is aligning these processes with the requirements in the Australian Foreign Relations (State and Territories Arrangements) Act 2020 (Cth) which requires the University to notify the relevant Commonwealth Minister of certain arrangements with foreign governments and foreign universities.
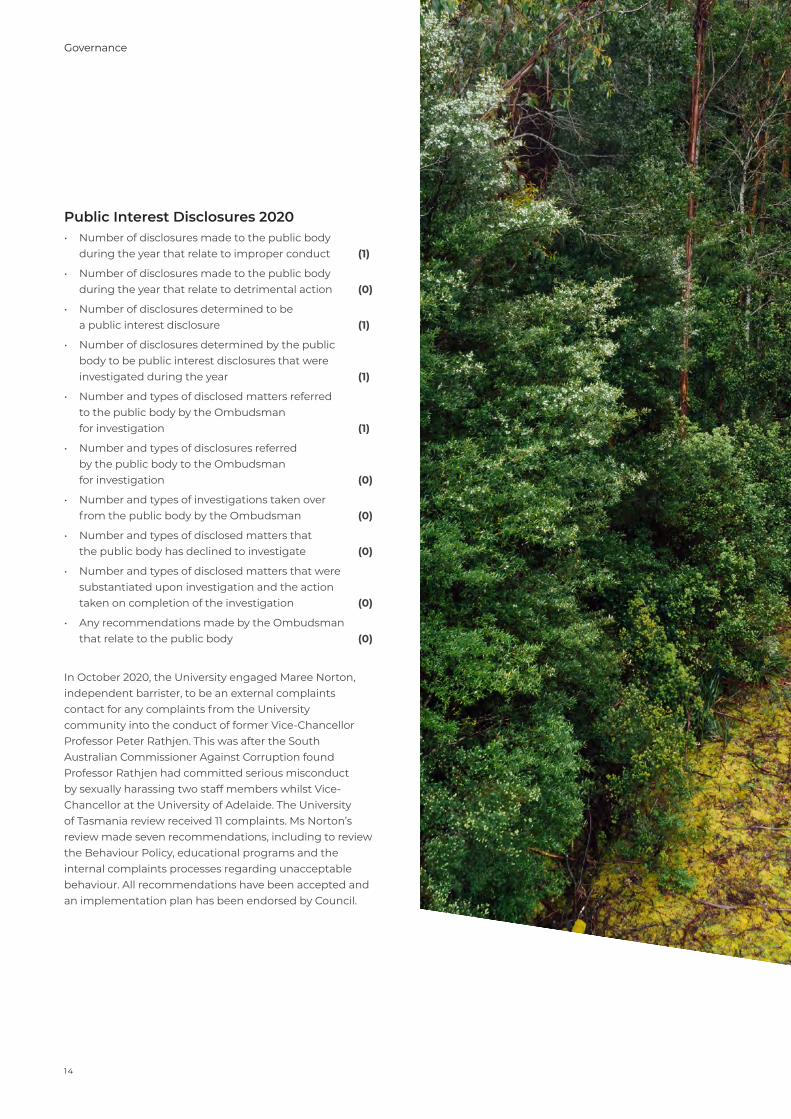
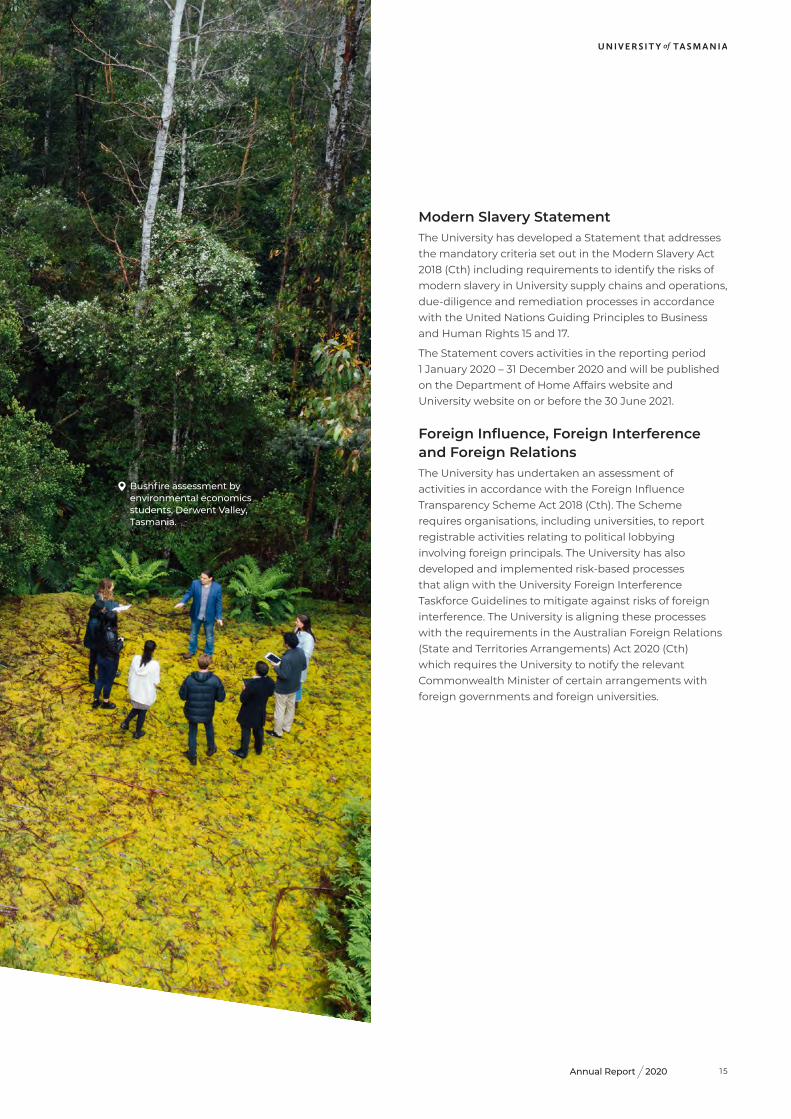
Bushfire assessment by environmental economics students, Derwent Valley, Tasmania.
152020Annual Report
Governance
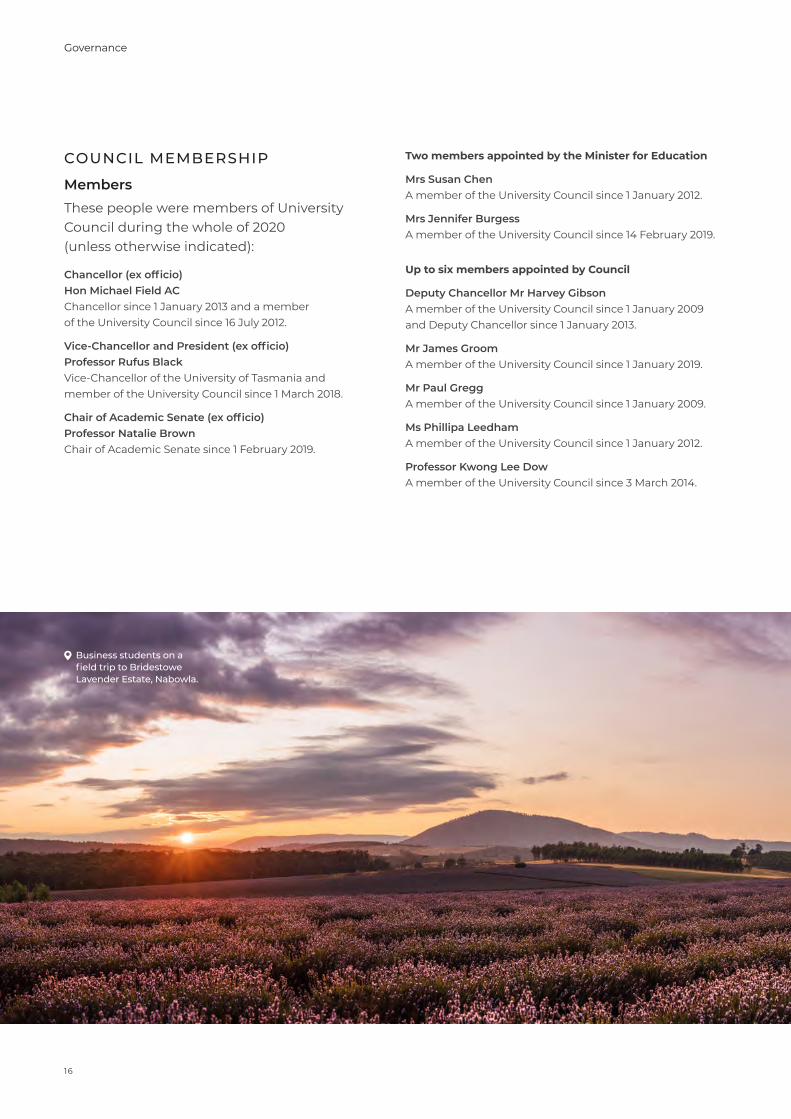
Business students on a field trip to Bridestowe Lavender Estate, Nabowla.
COUNCIL MEMBERSHIP
MembersThese people were members of University Council during the whole of 2020 (unless otherwise indicated):
Chancellor (ex officio) Hon Michael Field AC Chancellor since 1 January 2013 and a member of the University Council since 16 July 2012.
Vice-Chancellor and President (ex officio) Professor Rufus Black Vice-Chancellor of the University of Tasmania and member of the University Council since 1 March 2018.
Chair of Academic Senate (ex officio) Professor Natalie Brown Chair of Academic Senate since 1 February 2019.
Two members appointed by the Minister for Education
Mrs Susan Chen A member of the University Council since 1 January 2012.
Mrs Jennifer Burgess A member of the University Council since 14 February 2019.
Up to six members appointed by Council
Deputy Chancellor Mr Harvey Gibson A member of the University Council since 1 January 2009 and Deputy Chancellor since 1 January 2013.
Mr James Groom A member of the University Council since 1 January 2019.
Mr Paul Gregg A member of the University Council since 1 January 2009.
Ms Phillipa Leedham A member of the University Council since 1 January 2012.
Professor Kwong Lee Dow A member of the University Council since 3 March 2014.
16
One member elected by academic staff
Distinguished Professor Jamie Kirkpatrick A member of the University Council since 1 January 2017.
One member elected by professional staff
Mr Corey Peterson A member of the University Council since 1 January 2013.
A minimum of one student appointed by the Council
Ms Ella Hilder A member of the University Council since 1 January 2019.
Secretary to Council
Mr Alastair McDougall Secretary to the University Council since 1 January 2017.
172020Annual Report
Governance
COUNCIL COMMITTEE MEMBERSHIP
1 January 2020-31 December 2020
The Chancellor is an ex-officio member of every board, faculty and committee of the University, but listed here only for those committees normally attended. The Vice-Chancellor is also an ex-officio member of every board, faculty and committee of the University, with the exception of the Audit and Risk Committee, and is also listed here only for those committees normally attended.
Audit and Risk Committee
ChairMr Harvey Gibson
Members
Mr Mike Blake AM
Distinguished Professor Jamie Kirkpatrick
Professor Kwong Lee Dow
Ms Janelle O’Reilly
The Audit and Risk Committee has responsibility for overseeing the risk management framework and monitoring the performance of internal and external audit functions. It reviews and endorses the annual financial statements; receives and reviews internal audit reports and management responses; monitors the establishment of and compliance with an appropriate framework of internal control; and oversees the effectiveness of the University’s compliance framework.
Built Environment and Infrastructure Committee
Chair
Mrs Susan Chen
Members
Professor Rufus Black
Professor Natalie Brown
Mr Paul Gregg (Chair, Finance Committee, ex officio)
Mr David Button
Dr Peter Davis
Mr Rob McGauran
Mr Roger Poole
Mr Corey Peterson
Professor Elaine Stratford
The Built Environment and Infrastructure Committee has responsibility for considering, reviewing and advising Council on the development, approval and implementation of campus framework plans; priorities for major capital works; strategic asset management planning; preventative maintenance program; buildings and grounds plans, design standards for building works and landscaping and policies in respect of the built environment and sustainability. This Committee was disestablished in November of 2020.
18
Ceremonial and Honorary Degrees Committee
Chair
Hon Michael Field AC
Members
Professor Rufus Black
Mr Harvey Gibson
Professor Natalie Brown
Dr Damian Bugg AM QC (Chair, UTAS Foundation
Associate Professor Ashley Townsend (UTAS Alumni Association)
Ms Kate Robertson (Executive Director, Advancement)
The Ceremonial and Honorary Degrees Committee makes recommendations to Council for recognition by the University of individuals and organisations, the naming of buildings or facilities, graduation ceremonies and other ceremonial matters.
Finance Committee
Chair
Mr James Groom
Members
Professor Rufus Black (Vice-Chancellor, ex officio)
Professor Natalie Brown (Chair, Academic Senate, ex officio)
Mr Harvey Gibson (Chair of Audit and Risk Committee, ex officio)
Mr Paul Gregg
Ms Pip Leedham
Ms Katie McNamara
The Finance Committee provides strategic advice to Council on the University’s financial performance and sustainability and on the financial implications of future plans. It makes recommendations to Council on financial activities of the University on financial matters, including: reviewing the University’s annual operating budget; capital management plans and associated budget; proposals for the creation of new entities or participation in significant external enterprises; and business cases for major developments or strategic projects. It also monitors financial performance against the University’s operating and capital budgets, considers proposals impacting the borrowings of the University and monitors. This Committee was disestablished in November of 2020.
192020Annual Report
Remuneration and Nominations Committee
Chair
Hon Michael Field AC (Chancellor, ex officio)
Members
Mr Harvey Gibson (Deputy Chancellor, ex officio)
Mr Paul Gregg (Chair of Finance Committee, ex officio)
Mr James Groom (Chair of Strategic Resourcing Committee)
Professor Rufus Black (Vice-Chancellor, ex officio)
The Remuneration and Nominations Committee ensures the strategic alignment of human resource management and industrial negotiations with the University’s plan. It also: makes recommendations to Council on appointment; setting remuneration (within bands approved by Council); extension and removal of the Vice-Chancellor; the Provost, the Deputy Vice-Chancellors and the Chief Operating Officer. It considers and recommends to Council nominations for appointment to any position to which Council appoints, other than to Council itself (appointments to Council itself are considered by the extended nominations committee set up for that purpose).
Governance
20
Strategic Resourcing Committee
Chair
Mr James Groom
Members
Hon Michael Field AC (Chancellor, ex officio)
Professor Rufus Black (Vice-Chancellor, ex officio)
Mr Harvey Gibson (Chair of Audit and Risk Committee, ex officio)
Mrs Sue Chen
Mr Paul Gregg (Chair of Finance Committee, ex officio
Mr Daniel Minihan (Chair of Advisory and Investment Panel, ex officio)
The Strategic Resourcing Committee provides advice to Council in relation to the strategic and coordinated deployment of physical and financial resources in order to achieve medium and longer-term strategies that support the University’s mission. This Committee convened its first meeting in November 2020.
University Foundation Committee
Chair
Professor Rufus Black (Vice-Chancellor, ex officio)
Members
Ms Kate Robertson (COO’s nominee)
Mr David Clerk (Chief Operating Officer, ex officio)
Dr Damian Bugg AM QC (Council-appointed member)
Mrs Yvonne Rundle (Council appointed member)
Associate Professor Ashley Townsend (Alumni Committee member)
Ms Susan Gough (Friends of the University member)
Dr David Warren (Friends of the University member)
Mr Peter Worrall (Friends of the University member)
In accordance with Ordinance 20 (University Foundation Committee), the University Foundation Committee was established as a Council committee by the University Council on 23 March 2018. Members were appointed to the committee at the 11 May 2018 meeting of Council.
The mission of the committee is to ensure that the University’s philanthropy practices and policies are consistent with its mission and goals and that trusts, and funds provided through philanthropy are compliant with the wishes of donors, used for educational, research and other purposes of the University.
212020Annual Report
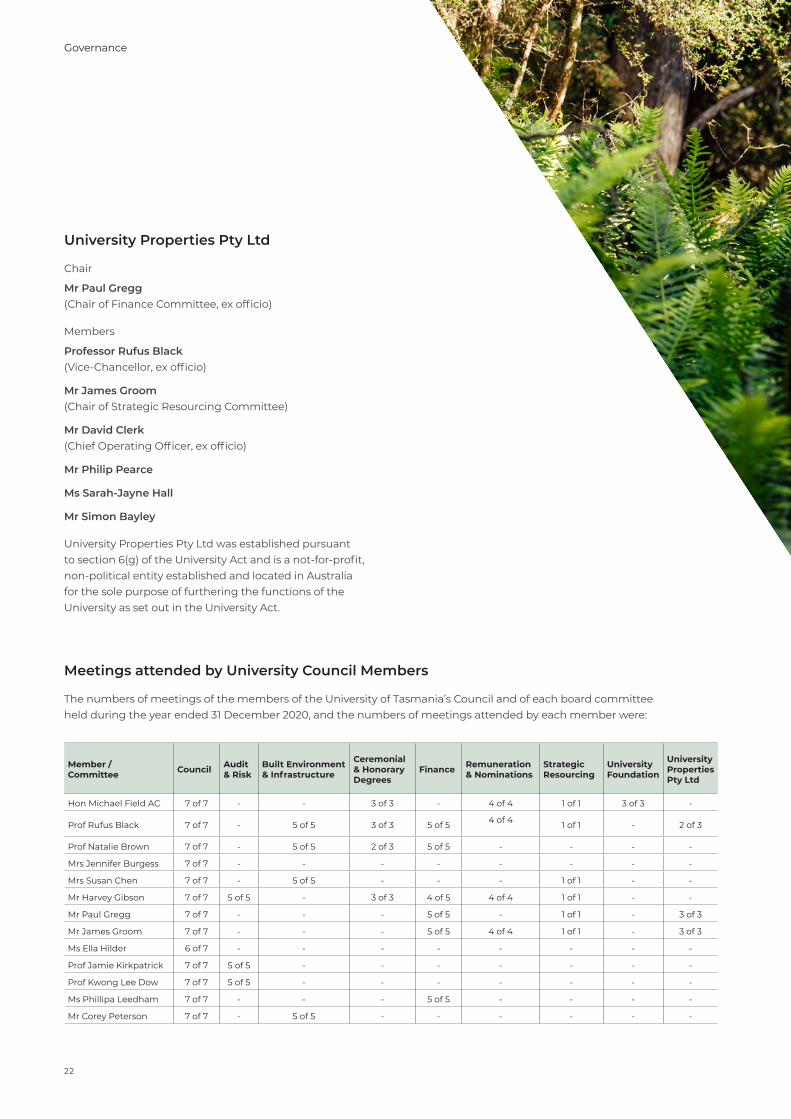
Meetings attended by University Council Members
The numbers of meetings of the members of the University of Tasmania’s Council and of each board committee held during the year ended 31 December 2020, and the numbers of meetings attended by each member were:
Member / Committee Council Audit
& RiskBuilt Environment & Infrastructure
Ceremonial & Honorary Degrees
Finance Remuneration & Nominations
Strategic Resourcing
University Foundation
University Properties Pty Ltd
Hon Michael Field AC 7 of 7 - - 3 of 3 - 4 of 4 1 of 1 3 of 3 -
Prof Rufus Black 7 of 7 - 5 of 5 3 of 3 5 of 5 4 of 4 1 of 1 - 2 of 3
Prof Natalie Brown 7 of 7 - 5 of 5 2 of 3 5 of 5 - - - -
Mrs Jennifer Burgess 7 of 7 - - - - - - - -
Mrs Susan Chen 7 of 7 - 5 of 5 - - - 1 of 1 - -
Mr Harvey Gibson 7 of 7 5 of 5 - 3 of 3 4 of 5 4 of 4 1 of 1 - -
Mr Paul Gregg 7 of 7 - - - 5 of 5 - 1 of 1 - 3 of 3
Mr James Groom 7 of 7 - - - 5 of 5 4 of 4 1 of 1 - 3 of 3
Ms Ella Hilder 6 of 7 - - - - - - - -
Prof Jamie Kirkpatrick 7 of 7 5 of 5 - - - - - - -
Prof Kwong Lee Dow 7 of 7 5 of 5 - - - - - - -
Ms Phillipa Leedham 7 of 7 - - - 5 of 5 - - - -
Mr Corey Peterson 7 of 7 - 5 of 5 - - - - - -
Governance
University Properties Pty Ltd
Chair
Mr Paul Gregg (Chair of Finance Committee, ex officio)
Members
Professor Rufus Black (Vice-Chancellor, ex officio)
Mr James Groom (Chair of Strategic Resourcing Committee)
Mr David Clerk (Chief Operating Officer, ex officio)
Mr Philip Pearce
Ms Sarah-Jayne Hall
Mr Simon Bayley
University Properties Pty Ltd was established pursuant to section 6(g) of the University Act and is a not-for-profit, non-political entity established and located in Australia for the sole purpose of furthering the functions of the University as set out in the University Act.
22

Environment student, Derby.
232020Annual Report

Geology students at the Tessellated Pavement, Eaglehawk Neck.
24
Annual Financial Statements
31 DECEMBER 2019
Contents
26 Income Statement
27 Statement of Financial Position
28 Statement of Changes in Equity
29 Statement of Cash Flows
30 Notes to the financial statements
80 Certifications
81 Auditor’s report
252020Annual Report
CONSOLIDATED PARENT ENTITY
2020$’000
2019$’000
2020$’000
2019$’000Notes
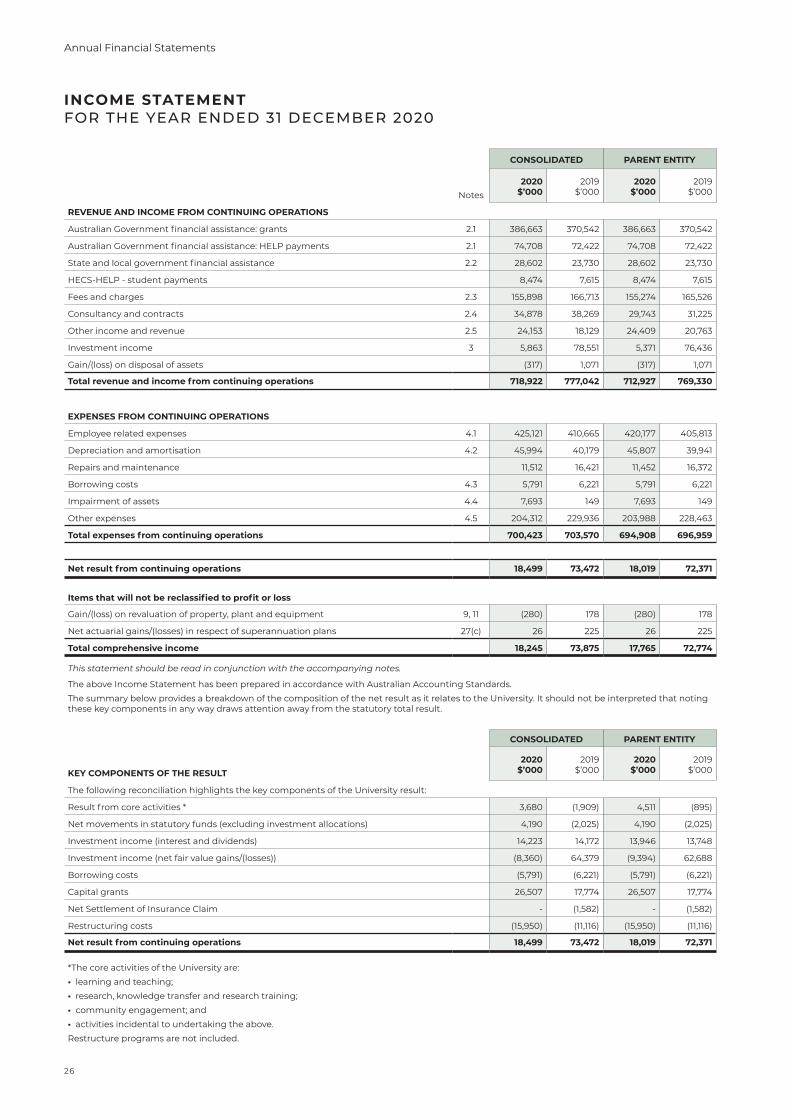
REVENUE AND INCOME FROM CONTINUING OPERATIONS
Australian Government financial assistance: grants 2.1 386,663 370,542 386,663 370,542
Australian Government financial assistance: HELP payments 2.1 74,708 72,422 74,708 72,422
State and local government financial assistance 2.2 28,602 23,730 28,602 23,730
HECS-HELP - student payments 8,474 7,615 8,474 7,615
Fees and charges 2.3 155,898 166,713 155,274 165,526
Consultancy and contracts 2.4 34,878 38,269 29,743 31,225
Other income and revenue 2.5 24,153 18,129 24,409 20,763
Investment income 3 5,863 78,551 5,371 76,436
Gain/(loss) on disposal of assets (317) 1,071 (317) 1,071
Total revenue and income from continuing operations 718,922 777,042 712,927 769,330
EXPENSES FROM CONTINUING OPERATIONS
Employee related expenses 4.1 425,121 410,665 420,177 405,813
Depreciation and amortisation 4.2 45,994 40,179 45,807 39,941
Repairs and maintenance 11,512 16,421 11,452 16,372
Borrowing costs 4.3 5,791 6,221 5,791 6,221
Impairment of assets 4.4 7,693 149 7,693 149
Other expenses 4.5 204,312 229,936 203,988 228,463
Total expenses from continuing operations 700,423 703,570 694,908 696,959
Net result from continuing operations 18,499 73,472 18,019 72,371
Items that will not be reclassified to profit or loss
Gain/(loss) on revaluation of property, plant and equipment 9, 11 (280) 178 (280) 178
Net actuarial gains/(losses) in respect of superannuation plans 27(c) 26 225 26 225
Total comprehensive income 18,245 73,875 17,765 72,774
This statement should be read in conjunction with the accompanying notes.
The above Income Statement has been prepared in accordance with Australian Accounting Standards.
The summary below provides a breakdown of the composition of the net result as it relates to the University. It should not be interpreted that noting these key components in any way draws attention away from the statutory total result.
CONSOLIDATED PARENT ENTITY
2020$’000
2019$’000
2020$’000
2019$’000KEY COMPONENTS OF THE RESULT
The following reconciliation highlights the key components of the University result:
Result from core activities * 3,680 (1,909) 4,511 (895)
Net movements in statutory funds (excluding investment allocations) 4,190 (2,025) 4,190 (2,025)
Investment income (interest and dividends) 14,223 14,172 13,946 13,748
Investment income (net fair value gains/(losses)) (8,360) 64,379 (9,394) 62,688
Borrowing costs (5,791) (6,221) (5,791) (6,221)
Capital grants 26,507 17,774 26,507 17,774
Net Settlement of Insurance Claim - (1,582) - (1,582)
Restructuring costs (15,950) (11,116) (15,950) (11,116)
Net result from continuing operations 18,499 73,472 18,019 72,371
*The core activities of the University are:
• learning and teaching;
• research, knowledge transfer and research training;
• community engagement; and
• activities incidental to undertaking the above.
Restructure programs are not included.
INCOME STATEMENT FOR THE YEAR ENDED 31 DECEMBER 2020
26
Annual Financial Statements
2020Annual Report
CONSOLIDATED PARENT ENTITY
2020$’000
2019$’000
2020$’000
2019$’000Notes
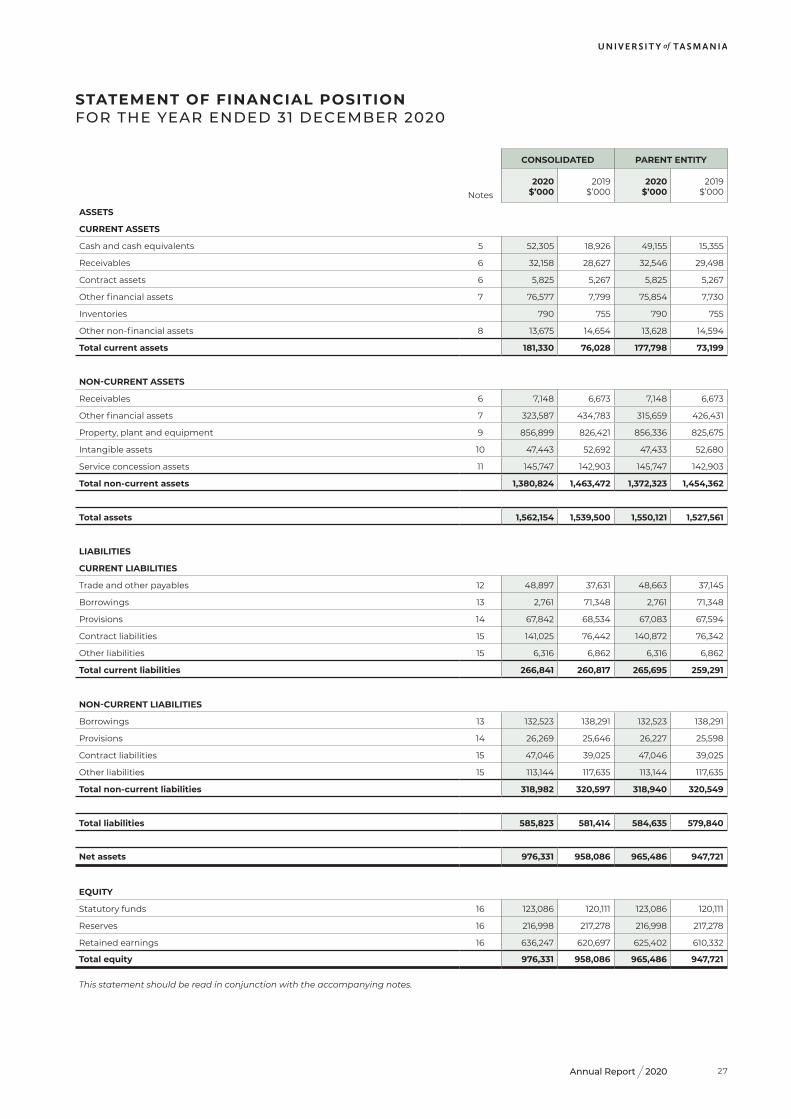
ASSETS
CURRENT ASSETS
Cash and cash equivalents 5 52,305 18,926 49,155 15,355
Receivables 6 32,158 28,627 32,546 29,498
Contract assets 6 5,825 5,267 5,825 5,267
Other financial assets 7 76,577 7,799 75,854 7,730
Inventories 790 755 790 755
Other non-financial assets 8 13,675 14,654 13,628 14,594
Total current assets 181,330 76,028 177,798 73,199
NON-CURRENT ASSETS
Receivables 6 7,148 6,673 7,148 6,673
Other financial assets 7 323,587 434,783 315,659 426,431
Property, plant and equipment 9 856,899 826,421 856,336 825,675
Intangible assets 10 47,443 52,692 47,433 52,680
Service concession assets 11 145,747 142,903 145,747 142,903
Total non-current assets 1,380,824 1,463,472 1,372,323 1,454,362
Total assets 1,562,154 1,539,500 1,550,121 1,527,561
LIABILITIES
CURRENT LIABILITIES
Trade and other payables 12 48,897 37,631 48,663 37,145
Borrowings 13 2,761 71,348 2,761 71,348
Provisions 14 67,842 68,534 67,083 67,594
Contract liabilities 15 141,025 76,442 140,872 76,342
Other liabilities 15 6,316 6,862 6,316 6,862
Total current liabilities 266,841 260,817 265,695 259,291
NON-CURRENT LIABILITIES
Borrowings 13 132,523 138,291 132,523 138,291
Provisions 14 26,269 25,646 26,227 25,598
Contract liabilities 15 47,046 39,025 47,046 39,025
Other liabilities 15 113,144 117,635 113,144 117,635
Total non-current liabilities 318,982 320,597 318,940 320,549
Total liabilities 585,823 581,414 584,635 579,840
Net assets 976,331 958,086 965,486 947,721
EQUITY
Statutory funds 16 123,086 120,111 123,086 120,111
Reserves 16 216,998 217,278 216,998 217,278
Retained earnings 16 636,247 620,697 625,402 610,332
Total equity 976,331 958,086 965,486 947,721
This statement should be read in conjunction with the accompanying notes.
STATEMENT OF FINANCIAL POSITION FOR THE YEAR ENDED 31 DECEMBER 2020
27
STATEMENT OF CHANGES IN EQUITY FOR THE YEAR ENDED 31 DECEMBER 2020
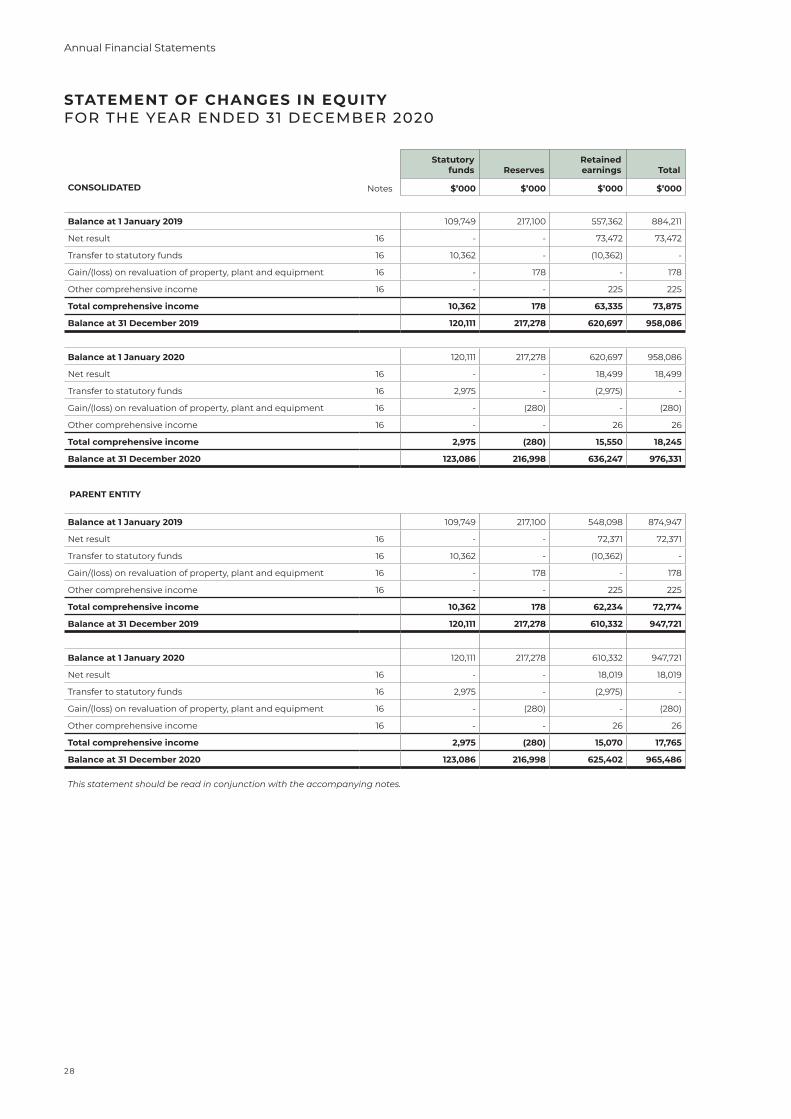
Notes
Statutory funds Reserves
Retained earnings Total
CONSOLIDATED $’000 $’000 $’000 $’000
Balance at 1 January 2019 109,749 217,100 557,362 884,211
Net result 16 - - 73,472 73,472
Transfer to statutory funds 16 10,362 - (10,362) -
Gain/(loss) on revaluation of property, plant and equipment 16 - 178 - 178
Other comprehensive income 16 - - 225 225
Total comprehensive income 10,362 178 63,335 73,875
Balance at 31 December 2019 120,111 217,278 620,697 958,086
Balance at 1 January 2020 120,111 217,278 620,697 958,086
Net result 16 - - 18,499 18,499
Transfer to statutory funds 16 2,975 - (2,975) -
Gain/(loss) on revaluation of property, plant and equipment 16 - (280) - (280)
Other comprehensive income 16 - - 26 26
Total comprehensive income 2,975 (280) 15,550 18,245
Balance at 31 December 2020 123,086 216,998 636,247 976,331
PARENT ENTITY
Balance at 1 January 2019 109,749 217,100 548,098 874,947
Net result 16 - - 72,371 72,371
Transfer to statutory funds 16 10,362 - (10,362) -
Gain/(loss) on revaluation of property, plant and equipment 16 - 178 - 178
Other comprehensive income 16 - - 225 225
Total comprehensive income 10,362 178 62,234 72,774
Balance at 31 December 2019 120,111 217,278 610,332 947,721
Balance at 1 January 2020 120,111 217,278 610,332 947,721
Net result 16 - - 18,019 18,019
Transfer to statutory funds 16 2,975 - (2,975) -
Gain/(loss) on revaluation of property, plant and equipment 16 - (280) - (280)
Other comprehensive income 16 - - 26 26
Total comprehensive income 2,975 (280) 15,070 17,765
Balance at 31 December 2020 123,086 216,998 625,402 965,486
This statement should be read in conjunction with the accompanying notes.
28
Annual Financial Statements
2020Annual Report
CONSOLIDATED PARENT ENTITY
2020$’000
2019$’000
2020$’000
2019$’000
NotesInflows
(Outflows)Inflows
(Outflows)Inflows
(Outflows)Inflows
(Outflows)
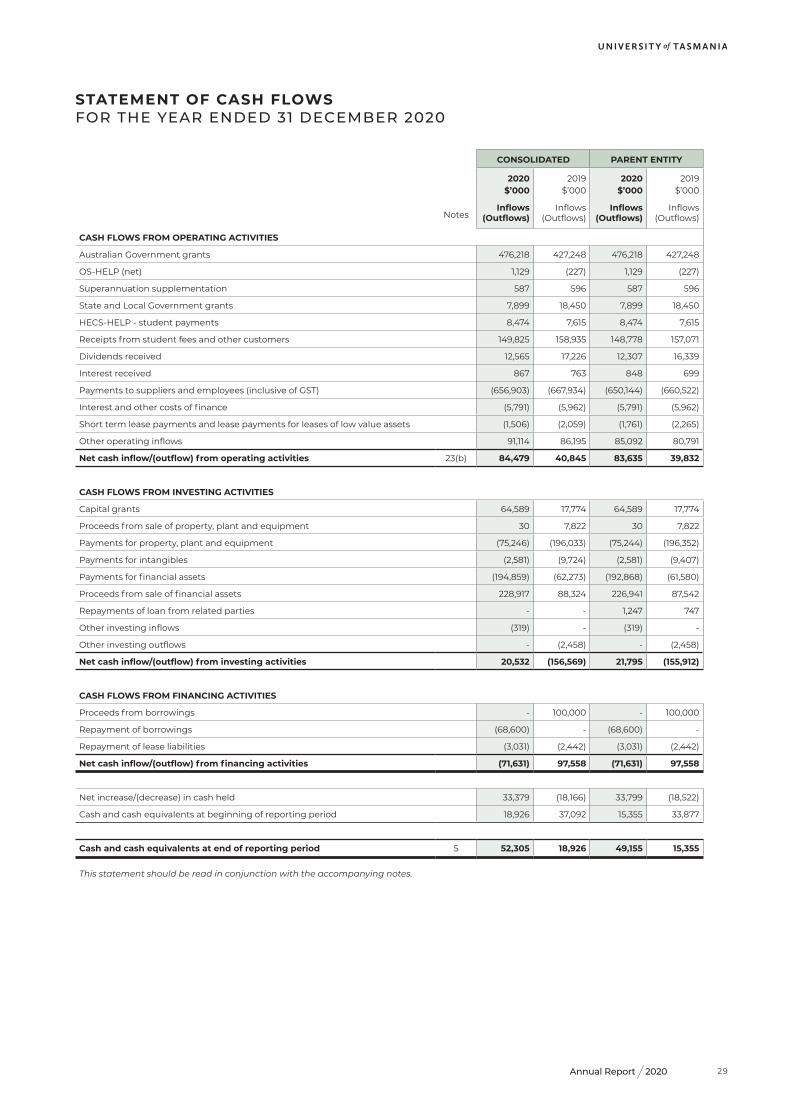
CASH FLOWS FROM OPERATING ACTIVITIES
Australian Government grants 476,218 427,248 476,218 427,248
OS-HELP (net) 1,129 (227) 1,129 (227)
Superannuation supplementation 587 596 587 596
State and Local Government grants 7,899 18,450 7,899 18,450
HECS-HELP - student payments 8,474 7,615 8,474 7,615
Receipts from student fees and other customers 149,825 158,935 148,778 157,071
Dividends received 12,565 17,226 12,307 16,339
Interest received 867 763 848 699
Payments to suppliers and employees (inclusive of GST) (656,903) (667,934) (650,144) (660,522)
Interest and other costs of finance (5,791) (5,962) (5,791) (5,962)
Short term lease payments and lease payments for leases of low value assets (1,506) (2,059) (1,761) (2,265)
Other operating inflows 91,114 86,195 85,092 80,791
Net cash inflow/(outflow) from operating activities 23(b) 84,479 40,845 83,635 39,832
CASH FLOWS FROM INVESTING ACTIVITIES
Capital grants 64,589 17,774 64,589 17,774
Proceeds from sale of property, plant and equipment 30 7,822 30 7,822
Payments for property, plant and equipment (75,246) (196,033) (75,244) (196,352)
Payments for intangibles (2,581) (9,724) (2,581) (9,407)
Payments for financial assets (194,859) (62,273) (192,868) (61,580)
Proceeds from sale of financial assets 228,917 88,324 226,941 87,542
Repayments of loan from related parties - - 1,247 747
Other investing inflows (319) - (319) -
Other investing outflows - (2,458) - (2,458)
Net cash inflow/(outflow) from investing activities 20,532 (156,569) 21,795 (155,912)
CASH FLOWS FROM FINANCING ACTIVITIES
Proceeds from borrowings - 100,000 - 100,000
Repayment of borrowings (68,600) - (68,600) -
Repayment of lease liabilities (3,031) (2,442) (3,031) (2,442)
Net cash inflow/(outflow) from financing activities (71,631) 97,558 (71,631) 97,558
Net increase/(decrease) in cash held 33,379 (18,166) 33,799 (18,522)
Cash and cash equivalents at beginning of reporting period 18,926 37,092 15,355 33,877
Cash and cash equivalents at end of reporting period 5 52,305 18,926 49,155 15,355
This statement should be read in conjunction with the accompanying notes.
STATEMENT OF CASH FLOWS FOR THE YEAR ENDED 31 DECEMBER 2020
29
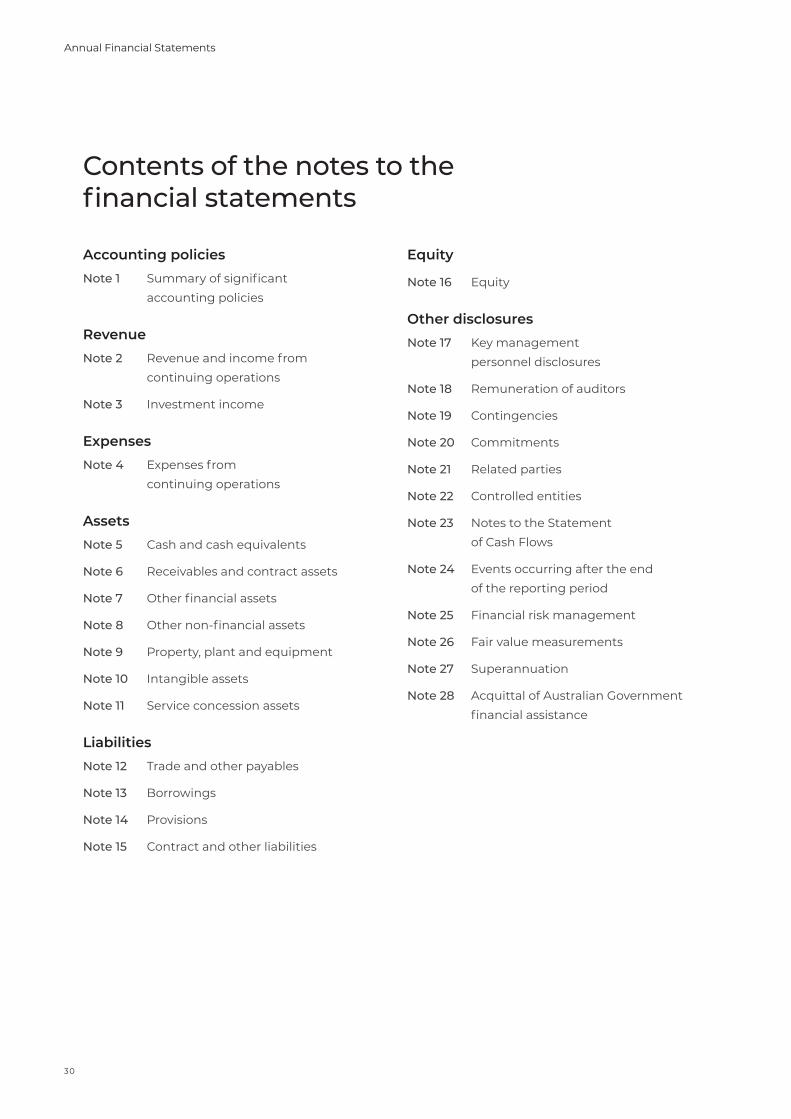
Contents of the notes to the financial statements
Accounting policiesNote 1 Summary of significant accounting policies
RevenueNote 2 Revenue and income from continuing operations
Note 3 Investment income
ExpensesNote 4 Expenses from continuing operations
AssetsNote 5 Cash and cash equivalents
Note 6 Receivables and contract assets
Note 7 Other financial assets
Note 8 Other non-financial assets
Note 9 Property, plant and equipment
Note 10 Intangible assets
Note 11 Service concession assets
LiabilitiesNote 12 Trade and other payables
Note 13 Borrowings
Note 14 Provisions
Note 15 Contract and other liabilities
Equity
Note 16 Equity
Other disclosuresNote 17 Key management personnel disclosures
Note 18 Remuneration of auditors
Note 19 Contingencies
Note 20 Commitments
Note 21 Related parties
Note 22 Controlled entities
Note 23 Notes to the Statement of Cash Flows
Note 24 Events occurring after the end of the reporting period
Note 25 Financial risk management
Note 26 Fair value measurements
Note 27 Superannuation
Note 28 Acquittal of Australian Government financial assistance
30
Annual Financial Statements
2020Annual Report
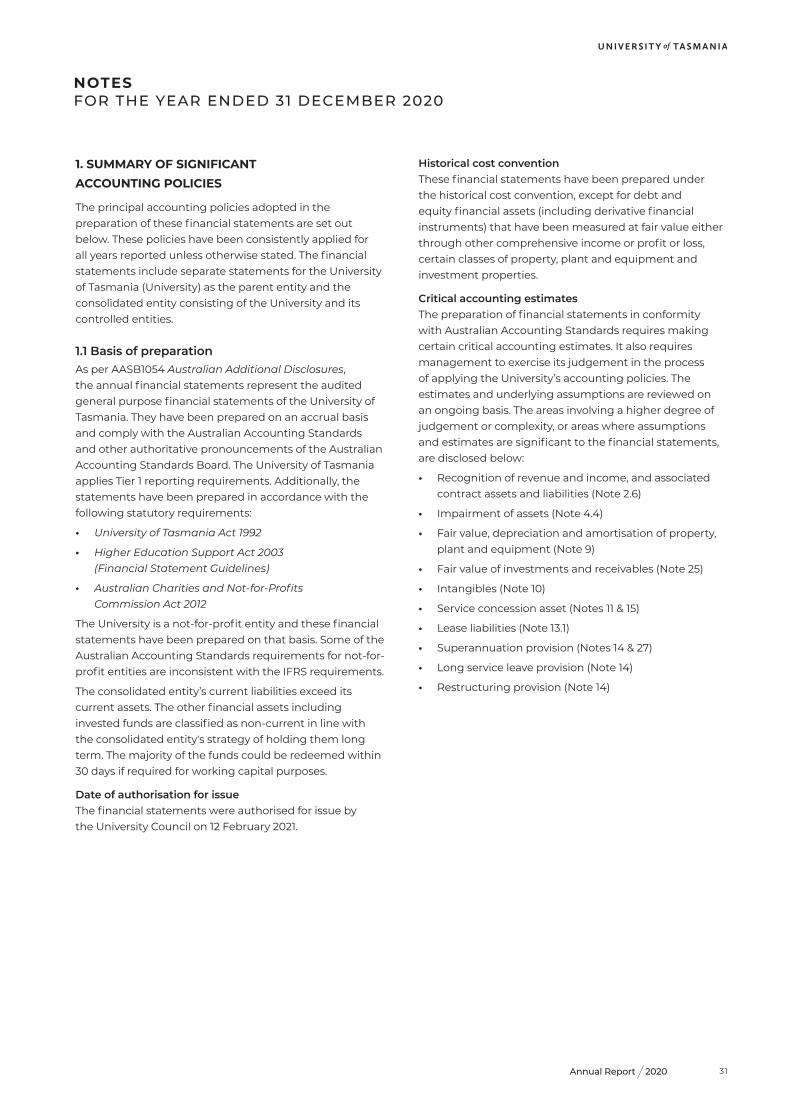
1. SUMMARY OF SIGNIFICANT ACCOUNTING POLICIES
The principal accounting policies adopted in the preparation of these financial statements are set out below. These policies have been consistently applied for all years reported unless otherwise stated. The financial statements include separate statements for the University of Tasmania (University) as the parent entity and the consolidated entity consisting of the University and its controlled entities.
1.1 Basis of preparationAs per AASB1054 Australian Additional Disclosures, the annual financial statements represent the audited general purpose financial statements of the University of Tasmania. They have been prepared on an accrual basis and comply with the Australian Accounting Standards and other authoritative pronouncements of the Australian Accounting Standards Board. The University of Tasmania applies Tier 1 reporting requirements. Additionally, the statements have been prepared in accordance with the following statutory requirements:
• University of Tasmania Act 1992
• Higher Education Support Act 2003 (Financial Statement Guidelines)
• Australian Charities and Not-for-Profits Commission Act 2012
The University is a not-for-profit entity and these financial statements have been prepared on that basis. Some of the Australian Accounting Standards requirements for not-for-profit entities are inconsistent with the IFRS requirements.
The consolidated entity’s current liabilities exceed its current assets. The other financial assets including invested funds are classified as non-current in line with the consolidated entity's strategy of holding them long term. The majority of the funds could be redeemed within 30 days if required for working capital purposes.
Date of authorisation for issueThe financial statements were authorised for issue by the University Council on 12 February 2021.
Historical cost conventionThese financial statements have been prepared under the historical cost convention, except for debt and equity financial assets (including derivative financial instruments) that have been measured at fair value either through other comprehensive income or profit or loss, certain classes of property, plant and equipment and investment properties.
Critical accounting estimatesThe preparation of financial statements in conformity with Australian Accounting Standards requires making certain critical accounting estimates. It also requires management to exercise its judgement in the process of applying the University’s accounting policies. The estimates and underlying assumptions are reviewed on an ongoing basis. The areas involving a higher degree of judgement or complexity, or areas where assumptions and estimates are significant to the financial statements, are disclosed below:
• Recognition of revenue and income, and associated contract assets and liabilities (Note 2.6)
• Impairment of assets (Note 4.4)
• Fair value, depreciation and amortisation of property, plant and equipment (Note 9)
• Fair value of investments and receivables (Note 25)
• Intangibles (Note 10)
• Service concession asset (Notes 11 & 15)
• Lease liabilities (Note 13.1)
• Superannuation provision (Notes 14 & 27)
• Long service leave provision (Note 14)
• Restructuring provision (Note 14)
NOTES FOR THE YEAR ENDED 31 DECEMBER 2020
31
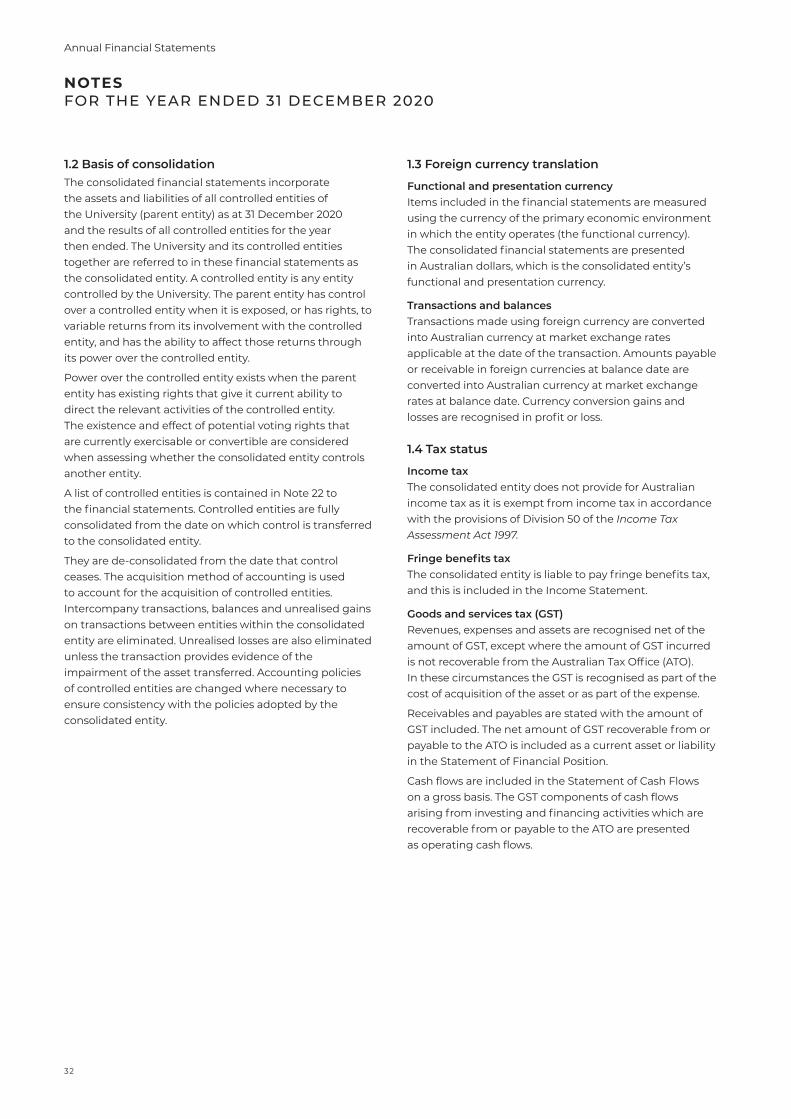
1.2 Basis of consolidationThe consolidated financial statements incorporate the assets and liabilities of all controlled entities of the University (parent entity) as at 31 December 2020 and the results of all controlled entities for the year then ended. The University and its controlled entities together are referred to in these financial statements as the consolidated entity. A controlled entity is any entity controlled by the University. The parent entity has control over a controlled entity when it is exposed, or has rights, to variable returns from its involvement with the controlled entity, and has the ability to affect those returns through its power over the controlled entity.
Power over the controlled entity exists when the parent entity has existing rights that give it current ability to direct the relevant activities of the controlled entity. The existence and effect of potential voting rights that are currently exercisable or convertible are considered when assessing whether the consolidated entity controls another entity.
A list of controlled entities is contained in Note 22 to the financial statements. Controlled entities are fully consolidated from the date on which control is transferred to the consolidated entity.
They are de-consolidated from the date that control ceases. The acquisition method of accounting is used to account for the acquisition of controlled entities. Intercompany transactions, balances and unrealised gains on transactions between entities within the consolidated entity are eliminated. Unrealised losses are also eliminated unless the transaction provides evidence of the impairment of the asset transferred. Accounting policies of controlled entities are changed where necessary to ensure consistency with the policies adopted by the consolidated entity.
1.3 Foreign currency translation
Functional and presentation currencyItems included in the financial statements are measured using the currency of the primary economic environment in which the entity operates (the functional currency). The consolidated financial statements are presented in Australian dollars, which is the consolidated entity’s functional and presentation currency.
Transactions and balancesTransactions made using foreign currency are converted into Australian currency at market exchange rates applicable at the date of the transaction. Amounts payable or receivable in foreign currencies at balance date are converted into Australian currency at market exchange rates at balance date. Currency conversion gains and losses are recognised in profit or loss.
1.4 Tax status
Income taxThe consolidated entity does not provide for Australian income tax as it is exempt from income tax in accordance with the provisions of Division 50 of the Income Tax Assessment Act 1997.
Fringe benefits taxThe consolidated entity is liable to pay fringe benefits tax, and this is included in the Income Statement.
Goods and services tax (GST)Revenues, expenses and assets are recognised net of the amount of GST, except where the amount of GST incurred is not recoverable from the Australian Tax Office (ATO). In these circumstances the GST is recognised as part of the cost of acquisition of the asset or as part of the expense.
Receivables and payables are stated with the amount of GST included. The net amount of GST recoverable from or payable to the ATO is included as a current asset or liability in the Statement of Financial Position.
Cash flows are included in the Statement of Cash Flows on a gross basis. The GST components of cash flows arising from investing and financing activities which are recoverable from or payable to the ATO are presented as operating cash flows.
NOTES FOR THE YEAR ENDED 31 DECEMBER 2020
32
Annual Financial Statements
2020Annual Report
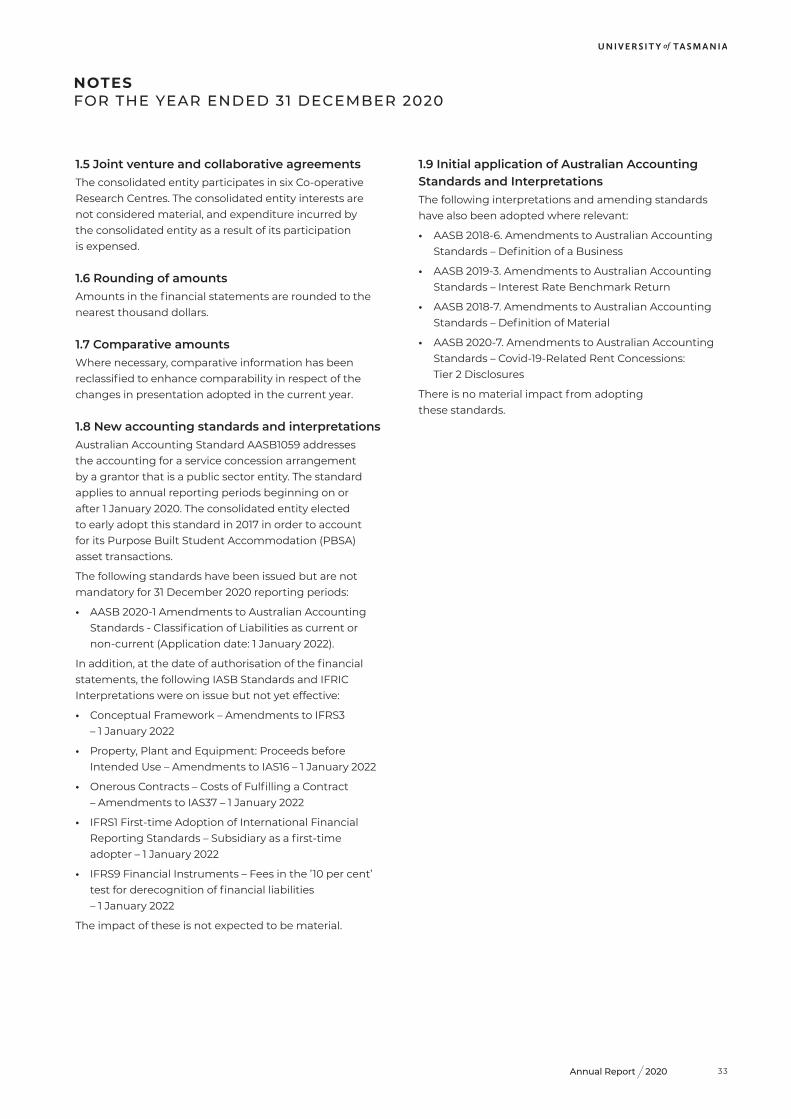
1.5 Joint venture and collaborative agreementsThe consolidated entity participates in six Co-operative Research Centres. The consolidated entity interests are not considered material, and expenditure incurred by the consolidated entity as a result of its participation is expensed.
1.6 Rounding of amountsAmounts in the financial statements are rounded to the nearest thousand dollars.
1.7 Comparative amountsWhere necessary, comparative information has been reclassified to enhance comparability in respect of the changes in presentation adopted in the current year.
1.8 New accounting standards and interpretationsAustralian Accounting Standard AASB1059 addresses the accounting for a service concession arrangement by a grantor that is a public sector entity. The standard applies to annual reporting periods beginning on or after 1 January 2020. The consolidated entity elected to early adopt this standard in 2017 in order to account for its Purpose Built Student Accommodation (PBSA) asset transactions.
The following standards have been issued but are not mandatory for 31 December 2020 reporting periods:
• AASB 2020-1 Amendments to Australian Accounting Standards - Classification of Liabilities as current or non-current (Application date: 1 January 2022).
In addition, at the date of authorisation of the financial statements, the following IASB Standards and IFRIC Interpretations were on issue but not yet effective:
• Conceptual Framework – Amendments to IFRS3 – 1 January 2022
• Property, Plant and Equipment: Proceeds before Intended Use – Amendments to IAS16 – 1 January 2022
• Onerous Contracts – Costs of Fulfilling a Contract – Amendments to IAS37 – 1 January 2022
• IFRS1 First-time Adoption of International Financial Reporting Standards – Subsidiary as a first-time adopter – 1 January 2022
• IFRS9 Financial Instruments – Fees in the ’10 per cent’ test for derecognition of financial liabilities – 1 January 2022
The impact of these is not expected to be material.
1.9 Initial application of Australian Accounting Standards and InterpretationsThe following interpretations and amending standards have also been adopted where relevant:
• AASB 2018-6. Amendments to Australian Accounting Standards – Definition of a Business
• AASB 2019-3. Amendments to Australian Accounting Standards – Interest Rate Benchmark Return
• AASB 2018-7. Amendments to Australian Accounting Standards – Definition of Material
• AASB 2020-7. Amendments to Australian Accounting Standards – Covid-19-Related Rent Concessions: Tier 2 Disclosures
There is no material impact from adopting these standards.
NOTES FOR THE YEAR ENDED 31 DECEMBER 2020
33
NOTES FOR THE YEAR ENDED 31 DECEMBER 2020
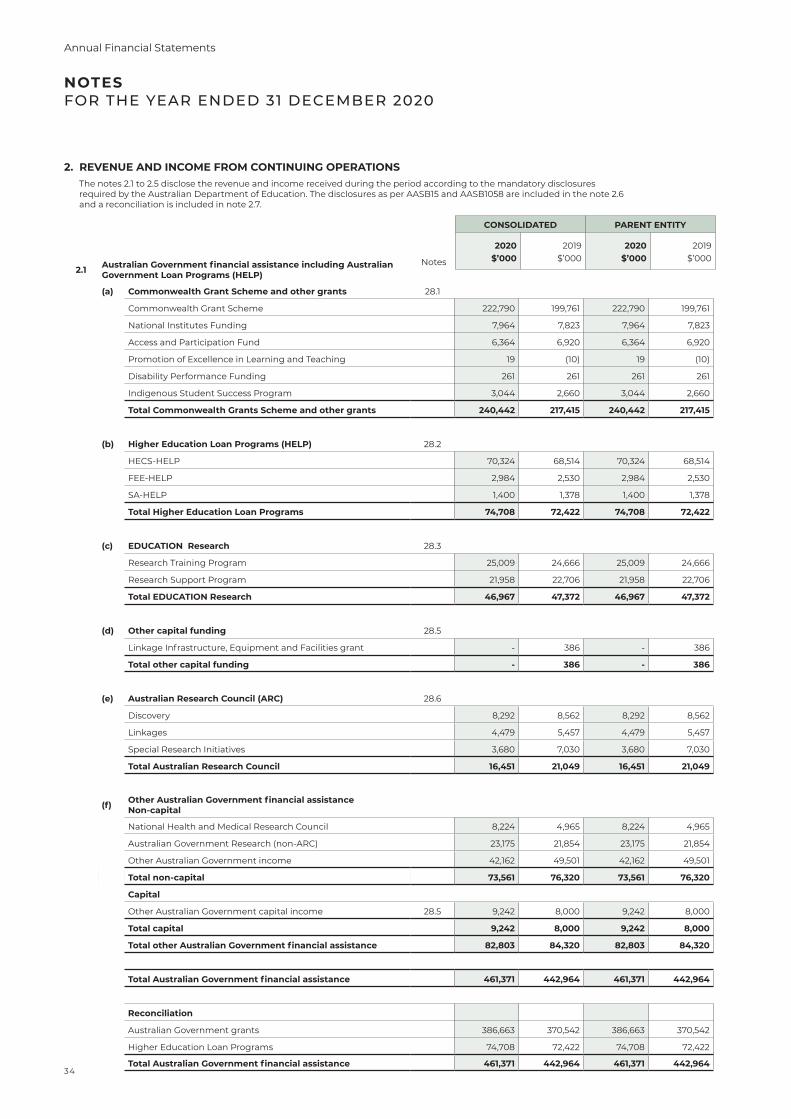
2.1 Australian Government financial assistance including Australian Government Loan Programs (HELP)
(a) Commonwealth Grant Scheme and other grants 28.1
Commonwealth Grant Scheme 222,790 199,761 222,790 199,761
National Institutes Funding 7,964 7,823 7,964 7,823
Access and Participation Fund 6,364 6,920 6,364 6,920
Promotion of Excellence in Learning and Teaching 19 (10) 19 (10)
Disability Performance Funding 261 261 261 261
Indigenous Student Success Program 3,044 2,660 3,044 2,660
Total Commonwealth Grants Scheme and other grants 240,442 217,415 240,442 217,415
(b) Higher Education Loan Programs (HELP) 28.2
HECS-HELP 70,324 68,514 70,324 68,514
FEE-HELP 2,984 2,530 2,984 2,530
SA-HELP 1,400 1,378 1,400 1,378
Total Higher Education Loan Programs 74,708 72,422 74,708 72,422
(c) EDUCATION Research 28.3
Research Training Program 25,009 24,666 25,009 24,666
Research Support Program 21,958 22,706 21,958 22,706
Total EDUCATION Research 46,967 47,372 46,967 47,372
(d) Other capital funding 28.5
Linkage Infrastructure, Equipment and Facilities grant - 386 - 386
Total other capital funding - 386 - 386
(e) Australian Research Council (ARC) 28.6
Discovery 8,292 8,562 8,292 8,562
Linkages 4,479 5,457 4,479 5,457
Special Research Initiatives 3,680 7,030 3,680 7,030
Total Australian Research Council 16,451 21,049 16,451 21,049
(f) Other Australian Government financial assistance Non-capital
National Health and Medical Research Council 8,224 4,965 8,224 4,965
Australian Government Research (non-ARC) 23,175 21,854 23,175 21,854
Other Australian Government income 42,162 49,501 42,162 49,501
Total non-capital 73,561 76,320 73,561 76,320
Capital
Other Australian Government capital income 28.5 9,242 8,000 9,242 8,000
Total capital 9,242 8,000 9,242 8,000
Total other Australian Government financial assistance 82,803 84,320 82,803 84,320
Total Australian Government financial assistance 461,371 442,964 461,371 442,964
Reconciliation
Australian Government grants 386,663 370,542 386,663 370,542
Higher Education Loan Programs 74,708 72,422 74,708 72,422
Total Australian Government financial assistance 461,371 442,964 461,371 442,964
2. REVENUE AND INCOME FROM CONTINUING OPERATIONS The notes 2.1 to 2.5 disclose the revenue and income received during the period according to the mandatory disclosures
required by the Australian Department of Education. The disclosures as per AASB15 and AASB1058 are included in the note 2.6 and a reconciliation is included in note 2.7.
CONSOLIDATED PARENT ENTITY
2020 2019 2020 2019
Notes $’000 $’000 $’000 $’000
34
Annual Financial Statements
2020Annual Report
NOTES FOR THE YEAR ENDED 31 DECEMBER 2020
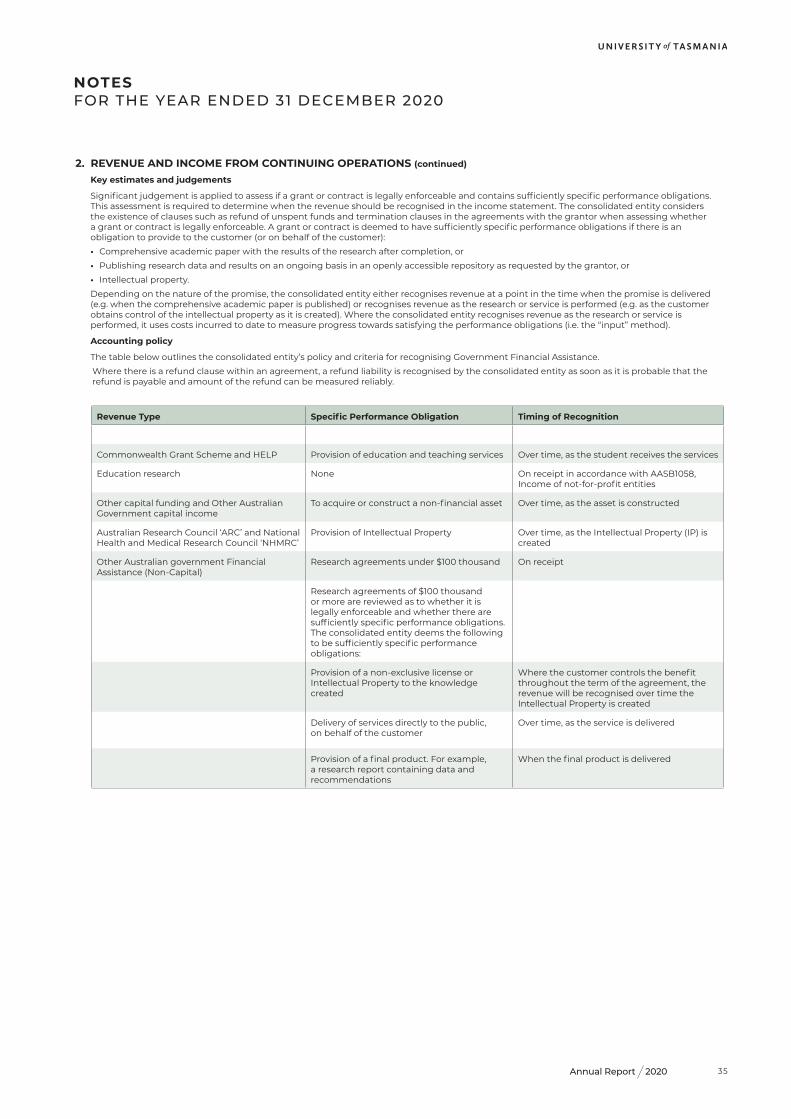
Key estimates and judgements
Significant judgement is applied to assess if a grant or contract is legally enforceable and contains sufficiently specific performance obligations. This assessment is required to determine when the revenue should be recognised in the income statement. The consolidated entity considers the existence of clauses such as refund of unspent funds and termination clauses in the agreements with the grantor when assessing whether a grant or contract is legally enforceable. A grant or contract is deemed to have sufficiently specific performance obligations if there is an obligation to provide to the customer (or on behalf of the customer):
• Comprehensive academic paper with the results of the research after completion, or
• Publishing research data and results on an ongoing basis in an openly accessible repository as requested by the grantor, or
• Intellectual property.
Depending on the nature of the promise, the consolidated entity either recognises revenue at a point in the time when the promise is delivered (e.g. when the comprehensive academic paper is published) or recognises revenue as the research or service is performed (e.g. as the customer obtains control of the intellectual property as it is created). Where the consolidated entity recognises revenue as the research or service is performed, it uses costs incurred to date to measure progress towards satisfying the performance obligations (i.e. the “input” method).
Accounting policy
The table below outlines the consolidated entity’s policy and criteria for recognising Government Financial Assistance.
Where there is a refund clause within an agreement, a refund liability is recognised by the consolidated entity as soon as it is probable that the refund is payable and amount of the refund can be measured reliably.
Revenue Type Specific Performance Obligation Timing of Recognition
Commonwealth Grant Scheme and HELP Provision of education and teaching services Over time, as the student receives the services
Education research None On receipt in accordance with AASB1058, Income of not-for-profit entities
Other capital funding and Other Australian Government capital income
To acquire or construct a non-financial asset Over time, as the asset is constructed
Australian Research Council ‘ARC’ and National Health and Medical Research Council ‘NHMRC’
Provision of Intellectual Property Over time, as the Intellectual Property (IP) is created
Other Australian government Financial Assistance (Non-Capital)
Research agreements under $100 thousand On receipt
Research agreements of $100 thousand or more are reviewed as to whether it is legally enforceable and whether there are sufficiently specific performance obligations. The consolidated entity deems the following to be sufficiently specific performance obligations:
Provision of a non-exclusive license or Intellectual Property to the knowledge created
Where the customer controls the benefit throughout the term of the agreement, the revenue will be recognised over time the Intellectual Property is created
Delivery of services directly to the public, on behalf of the customer
Over time, as the service is delivered
Provision of a final product. For example, a research report containing data and recommendations
When the final product is delivered
2. REVENUE AND INCOME FROM CONTINUING OPERATIONS (continued)
35
NOTES FOR THE YEAR ENDED 31 DECEMBER 2020
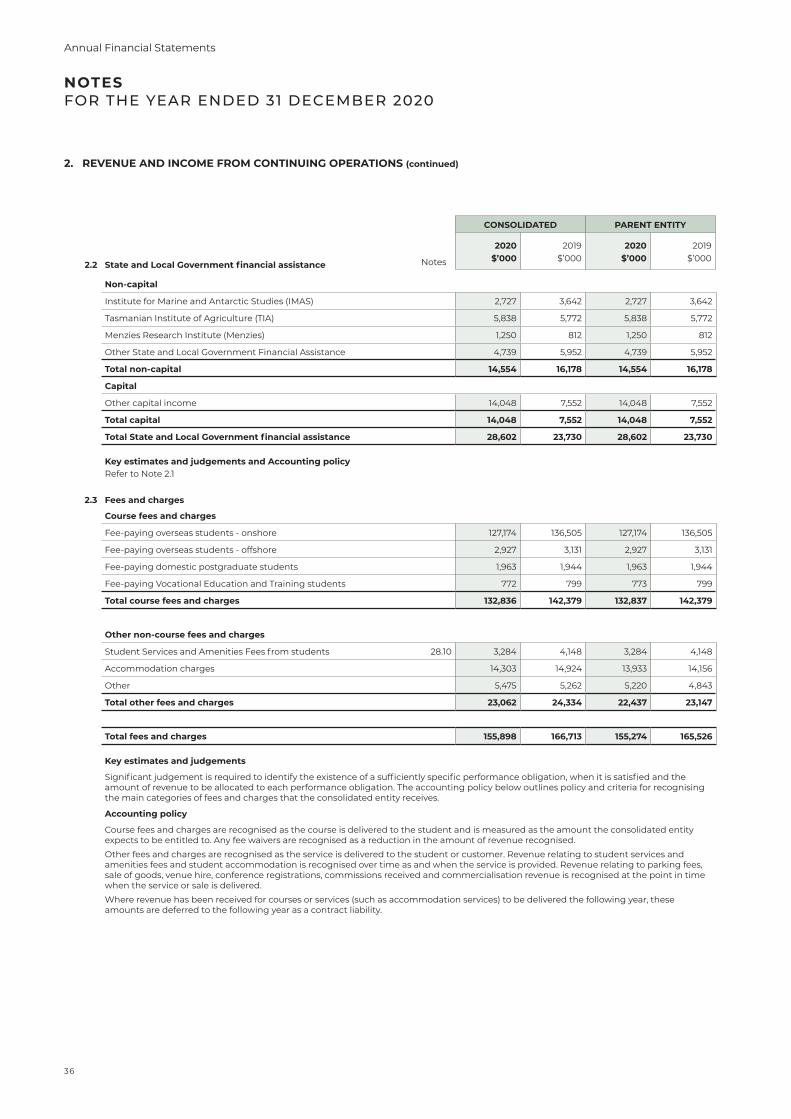
2.2 State and Local Government financial assistance
Non-capital
Institute for Marine and Antarctic Studies (IMAS) 2,727 3,642 2,727 3,642
Tasmanian Institute of Agriculture (TIA) 5,838 5,772 5,838 5,772
Menzies Research Institute (Menzies) 1,250 812 1,250 812
Other State and Local Government Financial Assistance 4,739 5,952 4,739 5,952
Total non-capital 14,554 16,178 14,554 16,178
Capital
Other capital income 14,048 7,552 14,048 7,552
Total capital 14,048 7,552 14,048 7,552
Total State and Local Government financial assistance 28,602 23,730 28,602 23,730
Key estimates and judgements and Accounting policy Refer to Note 2.1
2.3 Fees and charges
Course fees and charges
Fee-paying overseas students - onshore 127,174 136,505 127,174 136,505
Fee-paying overseas students - offshore 2,927 3,131 2,927 3,131
Fee-paying domestic postgraduate students 1,963 1,944 1,963 1,944
Fee-paying Vocational Education and Training students 772 799 773 799
Total course fees and charges 132,836 142,379 132,837 142,379
Other non-course fees and charges
Student Services and Amenities Fees from students 28.10 3,284 4,148 3,284 4,148
Accommodation charges 14,303 14,924 13,933 14,156
Other 5,475 5,262 5,220 4,843
Total other fees and charges 23,062 24,334 22,437 23,147
Total fees and charges 155,898 166,713 155,274 165,526
Key estimates and judgements
Significant judgement is required to identify the existence of a sufficiently specific performance obligation, when it is satisfied and the amount of revenue to be allocated to each performance obligation. The accounting policy below outlines policy and criteria for recognising the main categories of fees and charges that the consolidated entity receives.
Accounting policy
Course fees and charges are recognised as the course is delivered to the student and is measured as the amount the consolidated entity expects to be entitled to. Any fee waivers are recognised as a reduction in the amount of revenue recognised.
Other fees and charges are recognised as the service is delivered to the student or customer. Revenue relating to student services and amenities fees and student accommodation is recognised over time as and when the service is provided. Revenue relating to parking fees, sale of goods, venue hire, conference registrations, commissions received and commercialisation revenue is recognised at the point in time when the service or sale is delivered.
Where revenue has been received for courses or services (such as accommodation services) to be delivered the following year, these amounts are deferred to the following year as a contract liability.
2. REVENUE AND INCOME FROM CONTINUING OPERATIONS (continued)
CONSOLIDATED PARENT ENTITY
2020 2019 2020 2019
Notes $’000 $’000 $’000 $’000
36
Annual Financial Statements
2020Annual Report
NOTES FOR THE YEAR ENDED 31 DECEMBER 2020
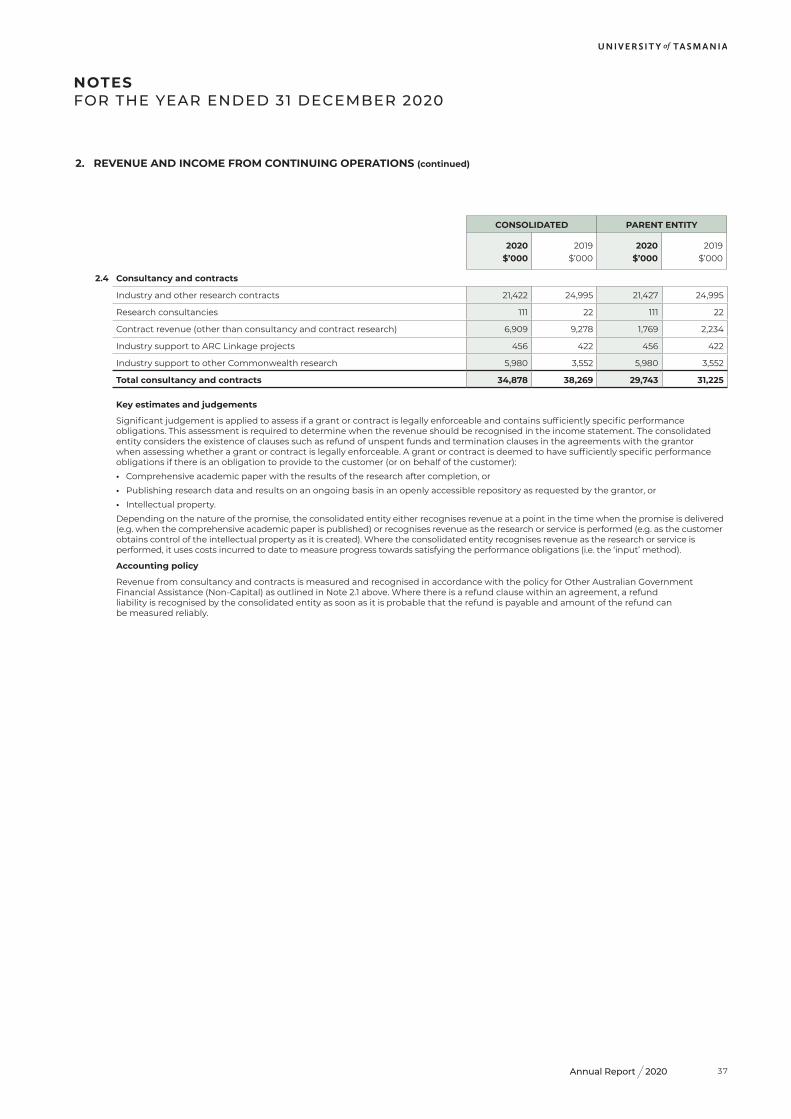
2.4 Consultancy and contracts
Industry and other research contracts 21,422 24,995 21,427 24,995
Research consultancies 111 22 111 22
Contract revenue (other than consultancy and contract research) 6,909 9,278 1,769 2,234
Industry support to ARC Linkage projects 456 422 456 422
Industry support to other Commonwealth research 5,980 3,552 5,980 3,552
Total consultancy and contracts 34,878 38,269 29,743 31,225
Key estimates and judgements
Significant judgement is applied to assess if a grant or contract is legally enforceable and contains sufficiently specific performance obligations. This assessment is required to determine when the revenue should be recognised in the income statement. The consolidated entity considers the existence of clauses such as refund of unspent funds and termination clauses in the agreements with the grantor when assessing whether a grant or contract is legally enforceable. A grant or contract is deemed to have sufficiently specific performance obligations if there is an obligation to provide to the customer (or on behalf of the customer):
• Comprehensive academic paper with the results of the research after completion, or
• Publishing research data and results on an ongoing basis in an openly accessible repository as requested by the grantor, or
• Intellectual property.
Depending on the nature of the promise, the consolidated entity either recognises revenue at a point in the time when the promise is delivered (e.g. when the comprehensive academic paper is published) or recognises revenue as the research or service is performed (e.g. as the customer obtains control of the intellectual property as it is created). Where the consolidated entity recognises revenue as the research or service is performed, it uses costs incurred to date to measure progress towards satisfying the performance obligations (i.e. the ‘input’ method).
Accounting policy
Revenue from consultancy and contracts is measured and recognised in accordance with the policy for Other Australian Government Financial Assistance (Non-Capital) as outlined in Note 2.1 above. Where there is a refund clause within an agreement, a refund liability is recognised by the consolidated entity as soon as it is probable that the refund is payable and amount of the refund can be measured reliably.
2. REVENUE AND INCOME FROM CONTINUING OPERATIONS (continued)
CONSOLIDATED PARENT ENTITY
2020 2019 2020 2019$’000 $’000 $’000 $’000
37
NOTES FOR THE YEAR ENDED 31 DECEMBER 2020
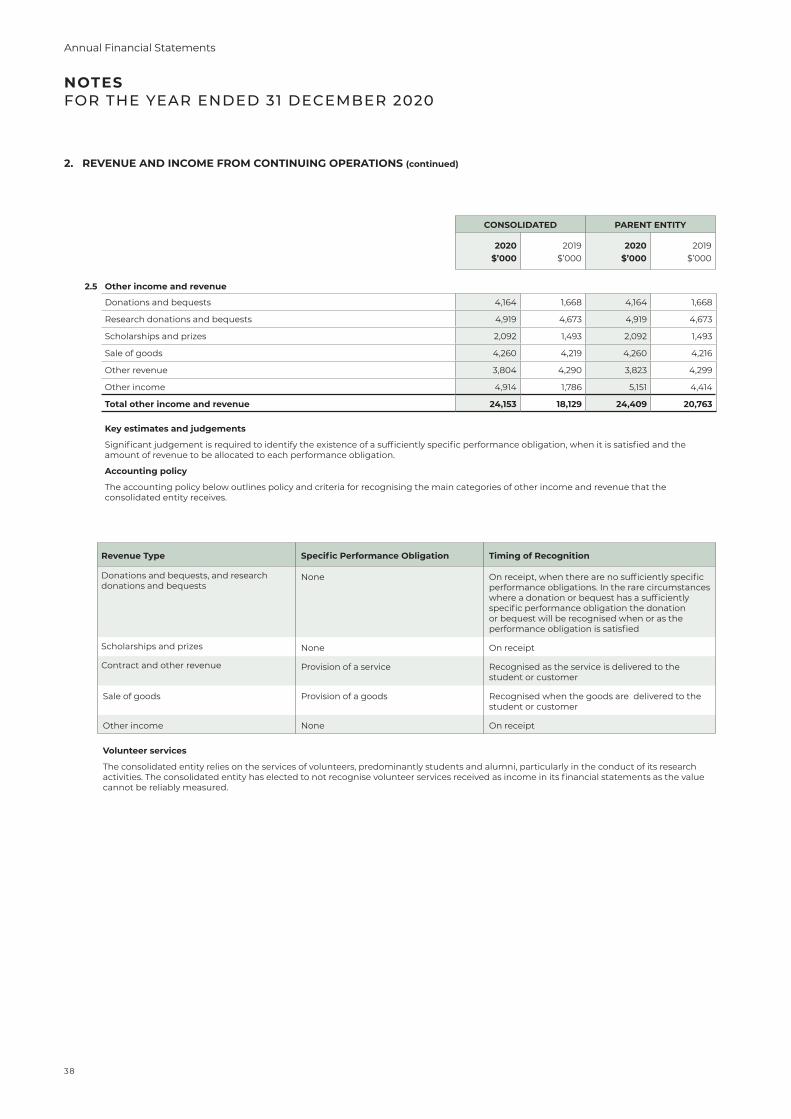
Revenue Type Specific Performance Obligation Timing of Recognition
Donations and bequests, and research donations and bequests
None On receipt, when there are no sufficiently specific performance obligations. In the rare circumstances where a donation or bequest has a sufficiently specific performance obligation the donation or bequest will be recognised when or as the performance obligation is satisfied
Scholarships and prizes None On receipt
Contract and other revenue Provision of a service Recognised as the service is delivered to the student or customer
Sale of goods Provision of a goods Recognised when the goods are delivered to the student or customer
Other income None On receipt
Volunteer services
The consolidated entity relies on the services of volunteers, predominantly students and alumni, particularly in the conduct of its research activities. The consolidated entity has elected to not recognise volunteer services received as income in its financial statements as the value cannot be reliably measured.
2.5 Other income and revenue
Donations and bequests 4,164 1,668 4,164 1,668
Research donations and bequests 4,919 4,673 4,919 4,673
Scholarships and prizes 2,092 1,493 2,092 1,493
Sale of goods 4,260 4,219 4,260 4,216
Other revenue 3,804 4,290 3,823 4,299
Other income 4,914 1,786 5,151 4,414
Total other income and revenue 24,153 18,129 24,409 20,763
Key estimates and judgements
Significant judgement is required to identify the existence of a sufficiently specific performance obligation, when it is satisfied and the amount of revenue to be allocated to each performance obligation.
Accounting policy
The accounting policy below outlines policy and criteria for recognising the main categories of other income and revenue that the consolidated entity receives.
2. REVENUE AND INCOME FROM CONTINUING OPERATIONS (continued)
CONSOLIDATED PARENT ENTITY
2020 2019 2020 2019$’000 $’000 $’000 $’000
38
Annual Financial Statements
2020Annual Report
NOTES FOR THE YEAR ENDED 31 DECEMBER 2020
2. REVENUE AND INCOME FROM CONTINUING OPERATIONS (continued)
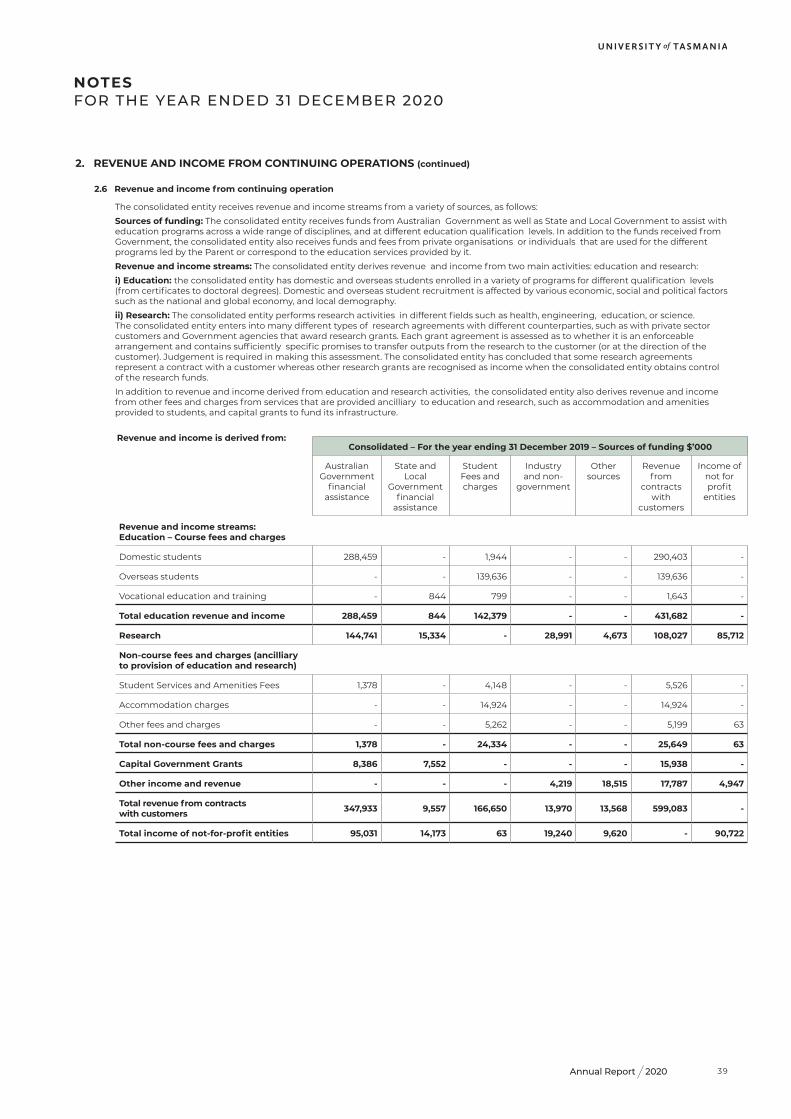
2.6 Revenue and income from continuing operation
The consolidated entity receives revenue and income streams from a variety of sources, as follows:
Sources of funding: The consolidated entity receives funds from Australian Government as well as State and Local Government to assist with education programs across a wide range of disciplines, and at different education qualification levels. In addition to the funds received from Government, the consolidated entity also receives funds and fees from private organisations or individuals that are used for the different programs led by the Parent or correspond to the education services provided by it.
Revenue and income streams: The consolidated entity derives revenue and income from two main activities: education and research:
i) Education: the consolidated entity has domestic and overseas students enrolled in a variety of programs for different qualification levels (from certificates to doctoral degrees). Domestic and overseas student recruitment is affected by various economic, social and political factors such as the national and global economy, and local demography.
ii) Research: The consolidated entity performs research activities in different fields such as health, engineering, education, or science. The consolidated entity enters into many different types of research agreements with different counterparties, such as with private sector customers and Government agencies that award research grants. Each grant agreement is assessed as to whether it is an enforceable arrangement and contains sufficiently specific promises to transfer outputs from the research to the customer (or at the direction of the customer). Judgement is required in making this assessment. The consolidated entity has concluded that some research agreements represent a contract with a customer whereas other research grants are recognised as income when the consolidated entity obtains control of the research funds.
In addition to revenue and income derived from education and research activities, the consolidated entity also derives revenue and income from other fees and charges from services that are provided ancilliary to education and research, such as accommodation and amenities provided to students, and capital grants to fund its infrastructure.
Revenue and income is derived from:Consolidated – For the year ending 31 December 2019 – Sources of funding $’000
Australian Government
financial assistance
State and Local
Government financial
assistance
Student Fees and charges
Industry and non-
government
Other sources
Revenue from
contracts with
customers
Income of not for profit
entities
Revenue and income streams: Education – Course fees and charges
Domestic students 288,459 - 1,944 - - 290,403 -
Overseas students - - 139,636 - - 139,636 -
Vocational education and training - 844 799 - - 1,643 -
Total education revenue and income 288,459 844 142,379 - - 431,682 -
Research 144,741 15,334 - 28,991 4,673 108,027 85,712
Non-course fees and charges (ancilliary to provision of education and research)
Student Services and Amenities Fees 1,378 - 4,148 - - 5,526 -
Accommodation charges - - 14,924 - - 14,924 -
Other fees and charges - - 5,262 - - 5,199 63
Total non-course fees and charges 1,378 - 24,334 - - 25,649 63
Capital Government Grants 8,386 7,552 - - - 15,938 -
Other income and revenue - - - 4,219 18,515 17,787 4,947
Total revenue from contracts with customers 347,933 9,557 166,650 13,970 13,568 599,083 -
Total income of not-for-profit entities 95,031 14,173 63 19,240 9,620 - 90,722
39
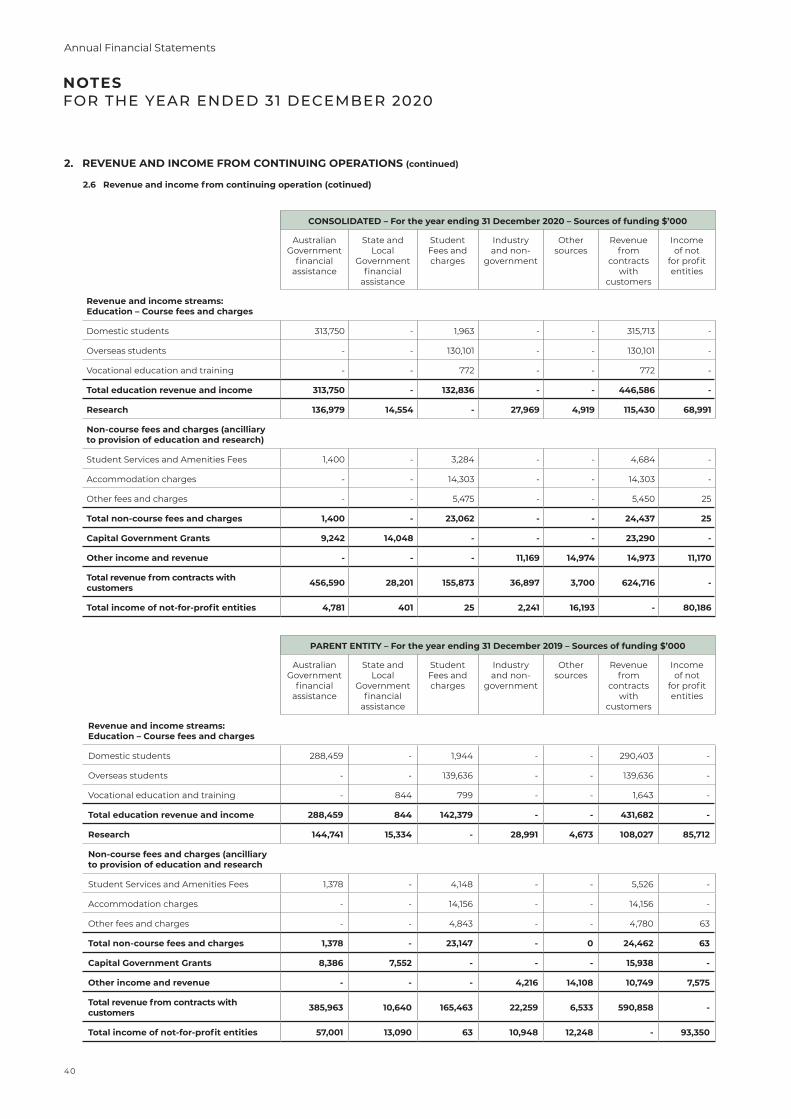
NOTES FOR THE YEAR ENDED 31 DECEMBER 2020
CONSOLIDATED – For the year ending 31 December 2020 – Sources of funding $’000
Australian Government
financial assistance
State and Local
Government financial
assistance
Student Fees and charges
Industry and non-
government
Other sources
Revenue from
contracts with
customers
Income of not
for profit entities
Revenue and income streams: Education – Course fees and charges
Domestic students 313,750 - 1,963 - - 315,713 -
Overseas students - - 130,101 - - 130,101 -
Vocational education and training - - 772 - - 772 -
Total education revenue and income 313,750 - 132,836 - - 446,586 -
Research 136,979 14,554 - 27,969 4,919 115,430 68,991
Non-course fees and charges (ancilliary to provision of education and research)
Student Services and Amenities Fees 1,400 - 3,284 - - 4,684 -
Accommodation charges - - 14,303 - - 14,303 -
Other fees and charges - - 5,475 - - 5,450 25
Total non-course fees and charges 1,400 - 23,062 - - 24,437 25
Capital Government Grants 9,242 14,048 - - - 23,290 -
Other income and revenue - - - 11,169 14,974 14,973 11,170
Total revenue from contracts with customers 456,590 28,201 155,873 36,897 3,700 624,716 -
Total income of not-for-profit entities 4,781 401 25 2,241 16,193 - 80,186
PARENT ENTITY – For the year ending 31 December 2019 – Sources of funding $’000
Australian Government
financial assistance
State and Local
Government financial
assistance
Student Fees and charges
Industry and non-
government
Other sources
Revenue from
contracts with
customers
Income of not
for profit entities
Revenue and income streams: Education – Course fees and charges
Domestic students 288,459 - 1,944 - - 290,403 -
Overseas students - - 139,636 - - 139,636 -
Vocational education and training - 844 799 - - 1,643 -
Total education revenue and income 288,459 844 142,379 - - 431,682 -
Research 144,741 15,334 - 28,991 4,673 108,027 85,712
Non-course fees and charges (ancilliary to provision of education and research
Student Services and Amenities Fees 1,378 - 4,148 - - 5,526 -
Accommodation charges - - 14,156 - - 14,156 -
Other fees and charges - - 4,843 - - 4,780 63
Total non-course fees and charges 1,378 - 23,147 - 0 24,462 63
Capital Government Grants 8,386 7,552 - - - 15,938 -
Other income and revenue - - - 4,216 14,108 10,749 7,575
Total revenue from contracts with customers 385,963 10,640 165,463 22,259 6,533 590,858 -
Total income of not-for-profit entities 57,001 13,090 63 10,948 12,248 - 93,350
2. REVENUE AND INCOME FROM CONTINUING OPERATIONS (continued)
2.6 Revenue and income from continuing operation (cotinued)
40
Annual Financial Statements
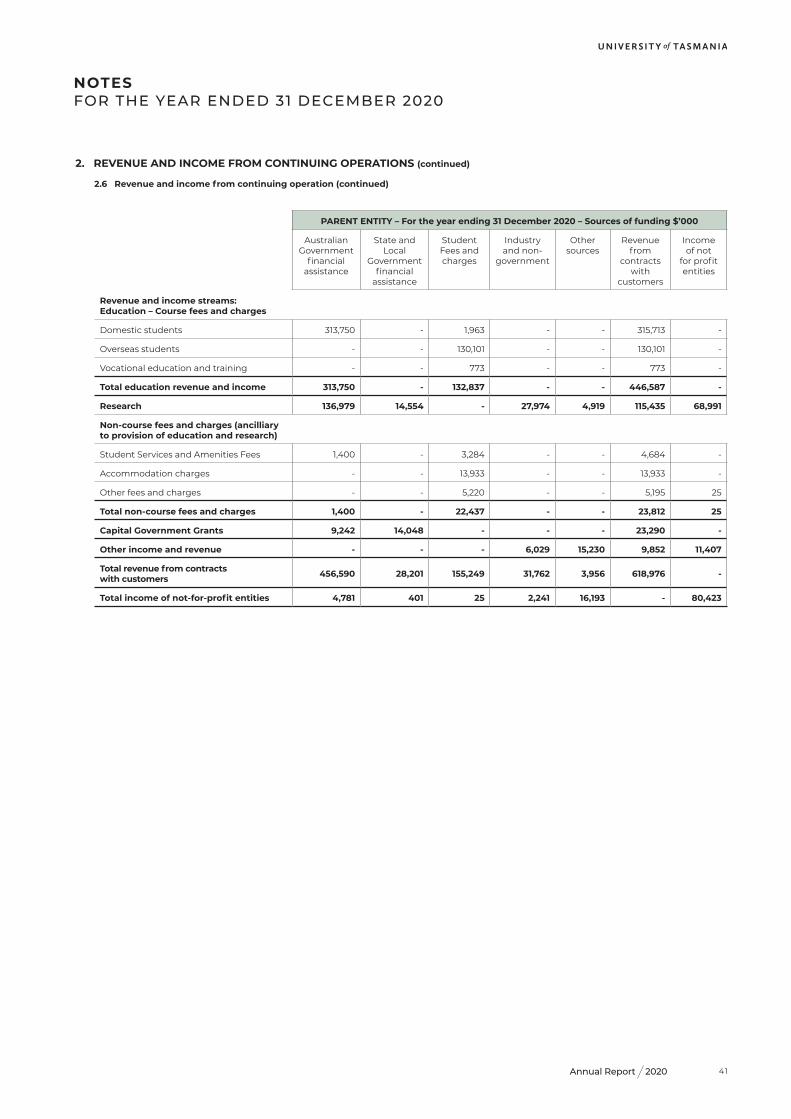
2020Annual Report
PARENT ENTITY – For the year ending 31 December 2020 – Sources of funding $’000
Australian Government
financial assistance
State and Local
Government financial
assistance
Student Fees and charges
Industry and non-
government
Other sources
Revenue from
contracts with
customers
Income of not
for profit entities
Revenue and income streams: Education – Course fees and charges
Domestic students 313,750 - 1,963 - - 315,713 -
Overseas students - - 130,101 - - 130,101 -
Vocational education and training - - 773 - - 773 -
Total education revenue and income 313,750 - 132,837 - - 446,587 -
Research 136,979 14,554 - 27,974 4,919 115,435 68,991
Non-course fees and charges (ancilliary to provision of education and research)
Student Services and Amenities Fees 1,400 - 3,284 - - 4,684 -
Accommodation charges - - 13,933 - - 13,933 -
Other fees and charges - - 5,220 - - 5,195 25
Total non-course fees and charges 1,400 - 22,437 - - 23,812 25
Capital Government Grants 9,242 14,048 - - - 23,290 -
Other income and revenue - - - 6,029 15,230 9,852 11,407
Total revenue from contracts with customers 456,590 28,201 155,249 31,762 3,956 618,976 -
Total income of not-for-profit entities 4,781 401 25 2,241 16,193 - 80,423
NOTES FOR THE YEAR ENDED 31 DECEMBER 2020
2. REVENUE AND INCOME FROM CONTINUING OPERATIONS (continued)
2.6 Revenue and income from continuing operation (continued)
41
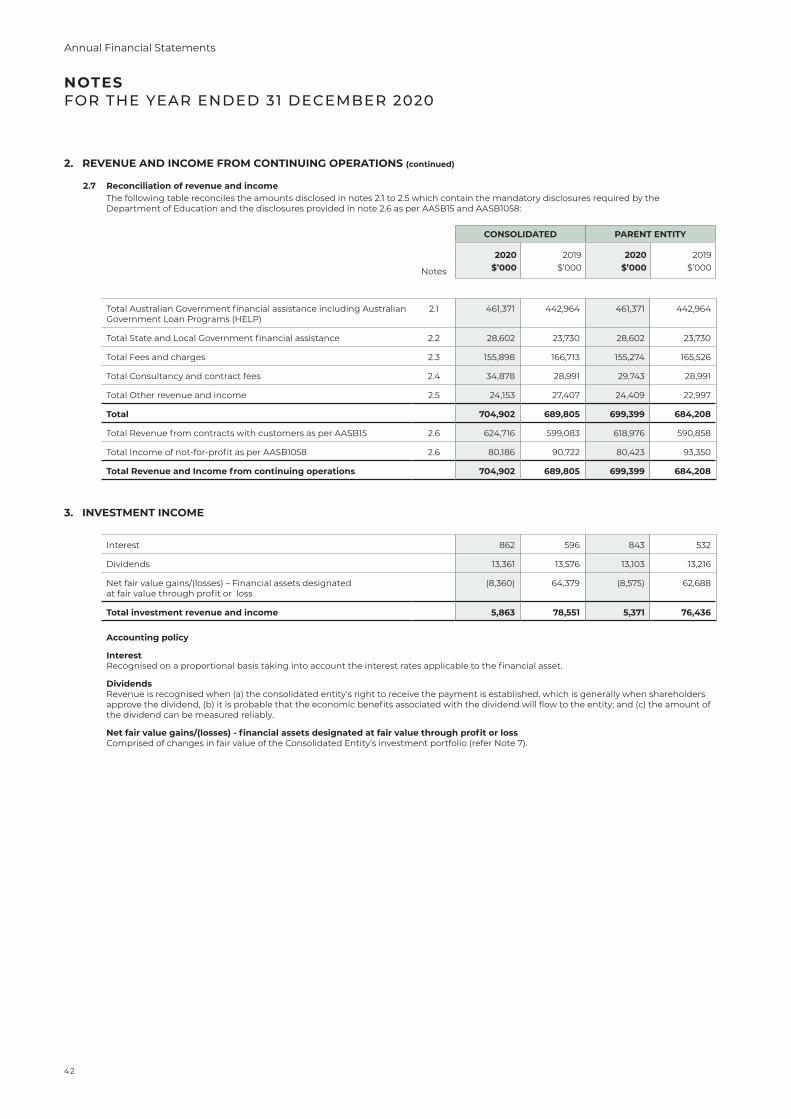
NOTES FOR THE YEAR ENDED 31 DECEMBER 2020
2.7 Reconciliation of revenue and incomeThe following table reconciles the amounts disclosed in notes 2.1 to 2.5 which contain the mandatory disclosures required by the Department of Education and the disclosures provided in note 2.6 as per AASB15 and AASB1058:
Total Australian Government financial assistance including Australian Government Loan Programs (HELP)
2.1 461,371 442,964 461,371 442,964
Total State and Local Government financial assistance 2.2 28,602 23,730 28,602 23,730
Total Fees and charges 2.3 155,898 166,713 155,274 165,526
Total Consultancy and contract fees 2.4 34,878 28,991 29,743 28,991
Total Other revenue and income 2.5 24,153 27,407 24,409 22,997
Total 704,902 689,805 699,399 684,208
Total Revenue from contracts with customers as per AASB15 2.6 624,716 599,083 618,976 590,858
Total Income of not-for-profit as per AASB1058 2.6 80,186 90,722 80,423 93,350
Total Revenue and Income from continuing operations 704,902 689,805 699,399 684,208
3. INVESTMENT INCOME
Interest 862 596 843 532
Dividends 13,361 13,576 13,103 13,216
Net fair value gains/(losses) – Financial assets designated at fair value through profit or loss
(8,360) 64,379 (8,575) 62,688
Total investment revenue and income 5,863 78,551 5,371 76,436
Accounting policy
InterestRecognised on a proportional basis taking into account the interest rates applicable to the financial asset.
DividendsRevenue is recognised when (a) the consolidated entity’s right to receive the payment is established, which is generally when shareholders approve the dividend, (b) it is probable that the economic benefits associated with the dividend will flow to the entity; and (c) the amount of the dividend can be measured reliably.
Net fair value gains/(losses) - financial assets designated at fair value through profit or lossComprised of changes in fair value of the Consolidated Entity’s investment portfolio (refer Note 7).
2. REVENUE AND INCOME FROM CONTINUING OPERATIONS (continued)
CONSOLIDATED PARENT ENTITY
2020 2019 2020 2019
Notes $’000 $’000 $’000 $’000
42
Annual Financial Statements
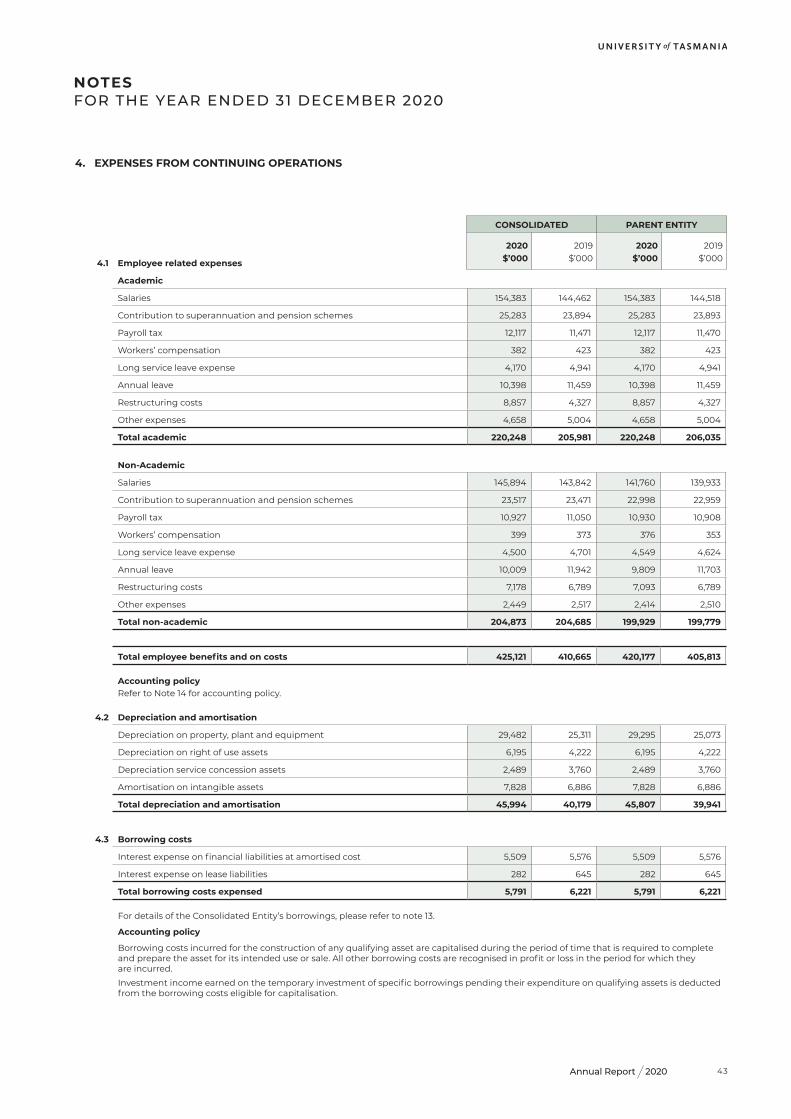
2020Annual Report
NOTES FOR THE YEAR ENDED 31 DECEMBER 2020
4. EXPENSES FROM CONTINUING OPERATIONS
4.1 Employee related expenses
Academic
Salaries 154,383 144,462 154,383 144,518
Contribution to superannuation and pension schemes 25,283 23,894 25,283 23,893
Payroll tax 12,117 11,471 12,117 11,470
Workers’ compensation 382 423 382 423
Long service leave expense 4,170 4,941 4,170 4,941
Annual leave 10,398 11,459 10,398 11,459
Restructuring costs 8,857 4,327 8,857 4,327
Other expenses 4,658 5,004 4,658 5,004
Total academic 220,248 205,981 220,248 206,035
Non-Academic
Salaries 145,894 143,842 141,760 139,933
Contribution to superannuation and pension schemes 23,517 23,471 22,998 22,959
Payroll tax 10,927 11,050 10,930 10,908
Workers’ compensation 399 373 376 353
Long service leave expense 4,500 4,701 4,549 4,624
Annual leave 10,009 11,942 9,809 11,703
Restructuring costs 7,178 6,789 7,093 6,789
Other expenses 2,449 2,517 2,414 2,510
Total non-academic 204,873 204,685 199,929 199,779
Total employee benefits and on costs 425,121 410,665 420,177 405,813
Accounting policyRefer to Note 14 for accounting policy.
4.2 Depreciation and amortisation
Depreciation on property, plant and equipment 29,482 25,311 29,295 25,073
Depreciation on right of use assets 6,195 4,222 6,195 4,222
Depreciation service concession assets 2,489 3,760 2,489 3,760
Amortisation on intangible assets 7,828 6,886 7,828 6,886
Total depreciation and amortisation 45,994 40,179 45,807 39,941
4.3 Borrowing costs
Interest expense on financial liabilities at amortised cost 5,509 5,576 5,509 5,576
Interest expense on lease liabilities 282 645 282 645
Total borrowing costs expensed 5,791 6,221 5,791 6,221
For details of the Consolidated Entity’s borrowings, please refer to note 13.
Accounting policy
Borrowing costs incurred for the construction of any qualifying asset are capitalised during the period of time that is required to complete and prepare the asset for its intended use or sale. All other borrowing costs are recognised in profit or loss in the period for which they are incurred.
Investment income earned on the temporary investment of specific borrowings pending their expenditure on qualifying assets is deducted from the borrowing costs eligible for capitalisation.
CONSOLIDATED PARENT ENTITY
2020 2019 2020 2019$’000 $’000 $’000 $’000
43
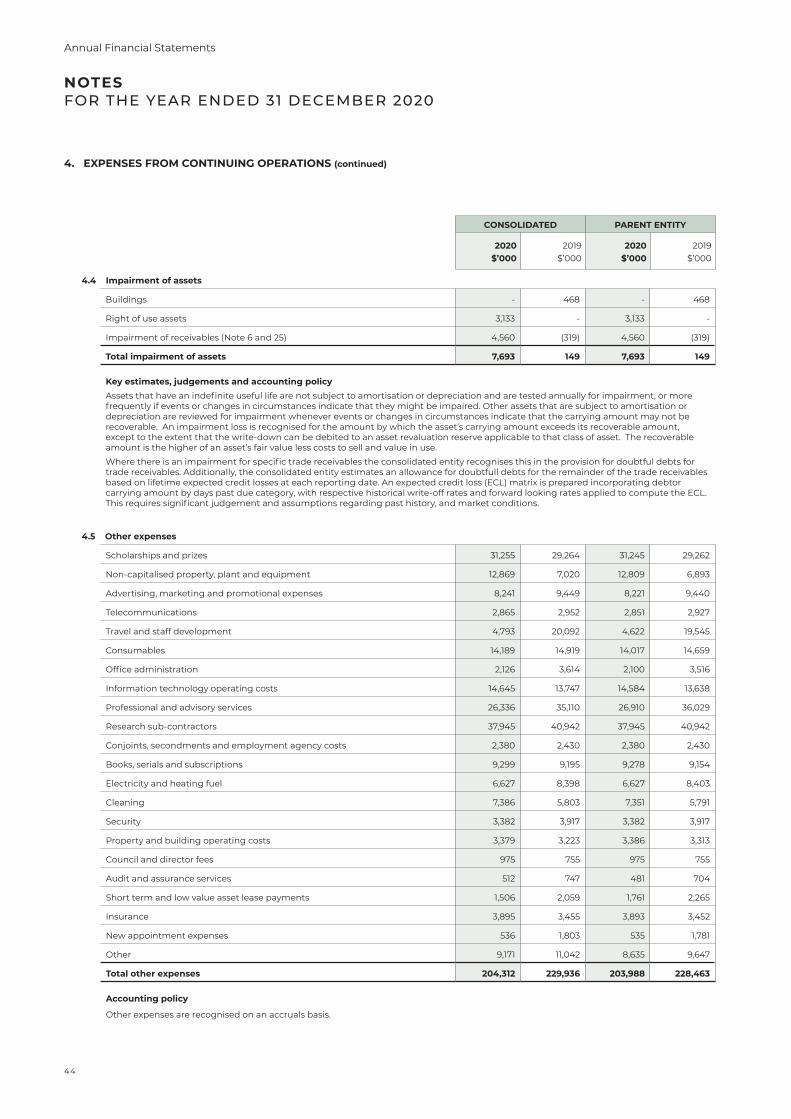
NOTES FOR THE YEAR ENDED 31 DECEMBER 2020
4.4 Impairment of assets
Buildings - 468 - 468
Right of use assets 3,133 - 3,133 -
Impairment of receivables (Note 6 and 25) 4,560 (319) 4,560 (319)
Total impairment of assets 7,693 149 7,693 149
Key estimates, judgements and accounting policyAssets that have an indefinite useful life are not subject to amortisation or depreciation and are tested annually for impairment, or more frequently if events or changes in circumstances indicate that they might be impaired. Other assets that are subject to amortisation or depreciation are reviewed for impairment whenever events or changes in circumstances indicate that the carrying amount may not be recoverable. An impairment loss is recognised for the amount by which the asset’s carrying amount exceeds its recoverable amount, except to the extent that the write-down can be debited to an asset revaluation reserve applicable to that class of asset. The recoverable amount is the higher of an asset’s fair value less costs to sell and value in use.
Where there is an impairment for specific trade receivables the consolidated entity recognises this in the provision for doubtful debts for trade receivables. Additionally, the consolidated entity estimates an allowance for doubtfull debts for the remainder of the trade receivables based on lifetime expected credit losses at each reporting date. An expected credit loss (ECL) matrix is prepared incorporating debtor carrying amount by days past due category, with respective historical write-off rates and forward looking rates applied to compute the ECL. This requires significant judgement and assumptions regarding past history, and market conditions.
4.5 Other expenses
Scholarships and prizes 31,255 29,264 31,245 29,262
Non-capitalised property, plant and equipment 12,869 7,020 12,809 6,893
Advertising, marketing and promotional expenses 8,241 9,449 8,221 9,440
Telecommunications 2,865 2,952 2,851 2,927
Travel and staff development 4,793 20,092 4,622 19,545
Consumables 14,189 14,919 14,017 14,659
Office administration 2,126 3,614 2,100 3,516
Information technology operating costs 14,645 13,747 14,584 13,638
Professional and advisory services 26,336 35,110 26,910 36,029
Research sub-contractors 37,945 40,942 37,945 40,942
Conjoints, secondments and employment agency costs 2,380 2,430 2,380 2,430
Books, serials and subscriptions 9,299 9,195 9,278 9,154
Electricity and heating fuel 6,627 8,398 6,627 8,403
Cleaning 7,386 5,803 7,351 5,791
Security 3,382 3,917 3,382 3,917
Property and building operating costs 3,379 3,223 3,386 3,313
Council and director fees 975 755 975 755
Audit and assurance services 512 747 481 704
Short term and low value asset lease payments 1,506 2,059 1,761 2,265
Insurance 3,895 3,455 3,893 3,452
New appointment expenses 536 1,803 535 1,781
Other 9,171 11,042 8,635 9,647
Total other expenses 204,312 229,936 203,988 228,463
Accounting policy
Other expenses are recognised on an accruals basis.
4. EXPENSES FROM CONTINUING OPERATIONS (continued)
CONSOLIDATED PARENT ENTITY
2020 2019 2020 2019$’000 $’000 $’000 $’000
44
Annual Financial Statements
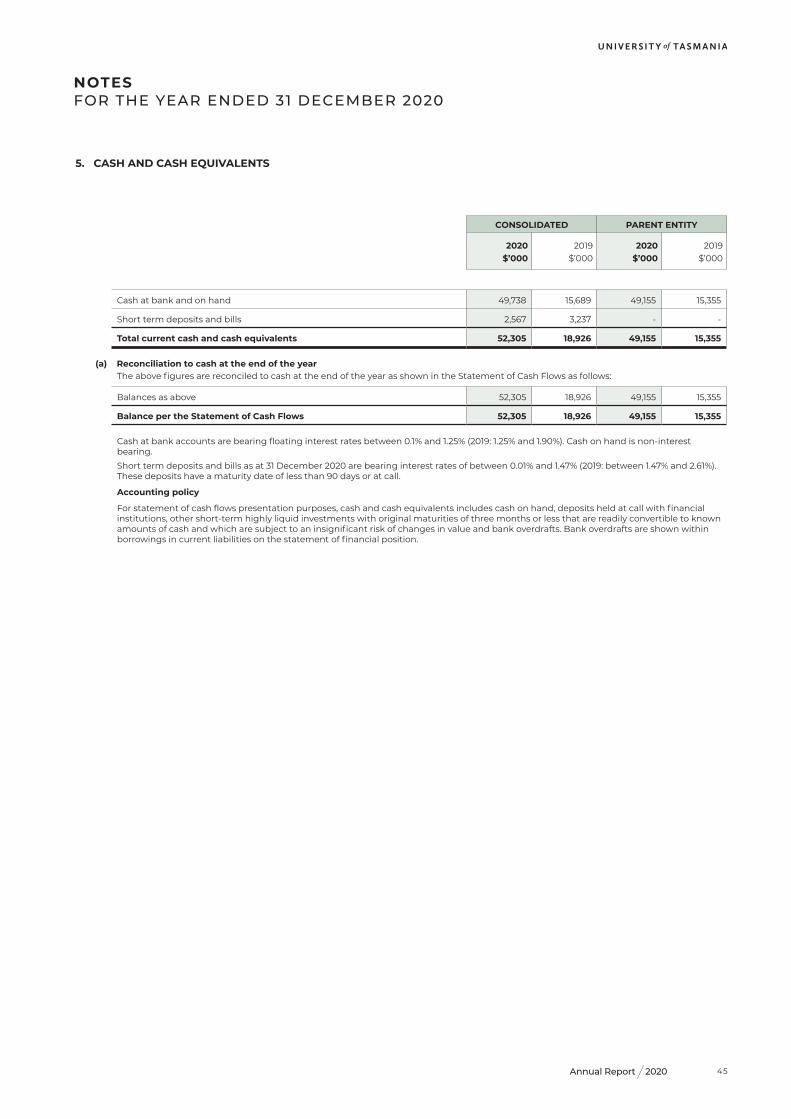
2020Annual Report
NOTES FOR THE YEAR ENDED 31 DECEMBER 2020
5. CASH AND CASH EQUIVALENTS
Cash at bank and on hand 49,738 15,689 49,155 15,355
Short term deposits and bills 2,567 3,237 - -
Total current cash and cash equivalents 52,305 18,926 49,155 15,355
(a) Reconciliation to cash at the end of the year The above figures are reconciled to cash at the end of the year as shown in the Statement of Cash Flows as follows:
Balances as above 52,305 18,926 49,155 15,355
Balance per the Statement of Cash Flows 52,305 18,926 49,155 15,355
Cash at bank accounts are bearing floating interest rates between 0.1% and 1.25% (2019: 1.25% and 1.90%). Cash on hand is non-interest bearing.
Short term deposits and bills as at 31 December 2020 are bearing interest rates of between 0.01% and 1.47% (2019: between 1.47% and 2.61%). These deposits have a maturity date of less than 90 days or at call.
Accounting policy
For statement of cash flows presentation purposes, cash and cash equivalents includes cash on hand, deposits held at call with financial institutions, other short-term highly liquid investments with original maturities of three months or less that are readily convertible to known amounts of cash and which are subject to an insignificant risk of changes in value and bank overdrafts. Bank overdrafts are shown within borrowings in current liabilities on the statement of financial position.
CONSOLIDATED PARENT ENTITY
2020 2019 2020 2019$’000 $’000 $’000 $’000
45
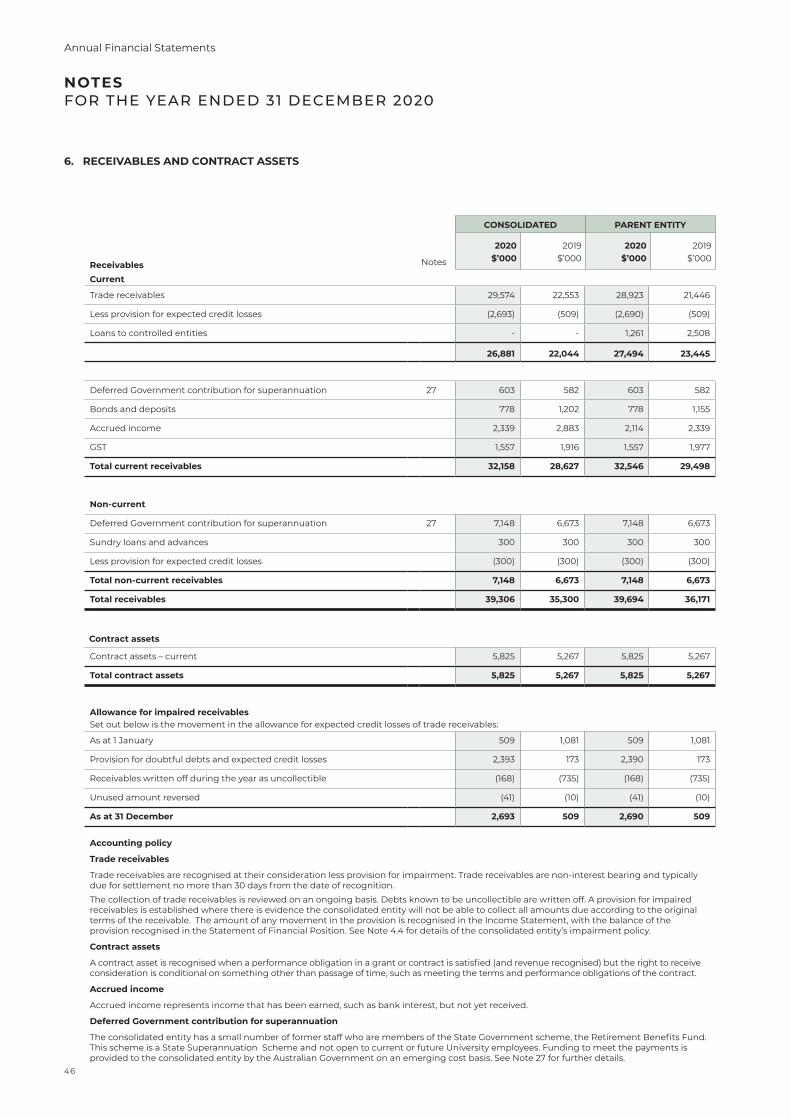
NOTES FOR THE YEAR ENDED 31 DECEMBER 2020
6. RECEIVABLES AND CONTRACT ASSETS
Receivables Current
Trade receivables 29,574 22,553 28,923 21,446
Less provision for expected credit losses (2,693) (509) (2,690) (509)
Loans to controlled entities - - 1,261 2,508
26,881 22,044 27,494 23,445
Deferred Government contribution for superannuation 27 603 582 603 582
Bonds and deposits 778 1,202 778 1,155
Accrued income 2,339 2,883 2,114 2,339
GST 1,557 1,916 1,557 1,977
Total current receivables 32,158 28,627 32,546 29,498
Non-current
Deferred Government contribution for superannuation 27 7,148 6,673 7,148 6,673
Sundry loans and advances 300 300 300 300
Less provision for expected credit losses (300) (300) (300) (300)
Total non-current receivables 7,148 6,673 7,148 6,673
Total receivables 39,306 35,300 39,694 36,171
Contract assets
Contract assets – current 5,825 5,267 5,825 5,267
Total contract assets 5,825 5,267 5,825 5,267
Allowance for impaired receivablesSet out below is the movement in the allowance for expected credit losses of trade receivables:
As at 1 January 509 1,081 509 1,081
Provision for doubtful debts and expected credit losses 2,393 173 2,390 173
Receivables written off during the year as uncollectible (168) (735) (168) (735)
Unused amount reversed (41) (10) (41) (10)
As at 31 December 2,693 509 2,690 509
Accounting policy
Trade receivables
Trade receivables are recognised at their consideration less provision for impairment. Trade receivables are non-interest bearing and typically due for settlement no more than 30 days from the date of recognition.
The collection of trade receivables is reviewed on an ongoing basis. Debts known to be uncollectible are written off. A provision for impaired receivables is established where there is evidence the consolidated entity will not be able to collect all amounts due according to the original terms of the receivable. The amount of any movement in the provision is recognised in the Income Statement, with the balance of the provision recognised in the Statement of Financial Position. See Note 4.4 for details of the consolidated entity’s impairment policy.
Contract assets
A contract asset is recognised when a performance obligation in a grant or contract is satisfied (and revenue recognised) but the right to receive consideration is conditional on something other than passage of time, such as meeting the terms and performance obligations of the contract.
Accrued income
Accrued income represents income that has been earned, such as bank interest, but not yet received.
Deferred Government contribution for superannuation
The consolidated entity has a small number of former staff who are members of the State Government scheme, the Retirement Benefits Fund. This scheme is a State Superannuation Scheme and not open to current or future University employees. Funding to meet the payments is provided to the consolidated entity by the Australian Government on an emerging cost basis. See Note 27 for further details.
CONSOLIDATED PARENT ENTITY
2020 2019 2020 2019
Notes $’000 $’000 $’000 $’000
46
Annual Financial Statements
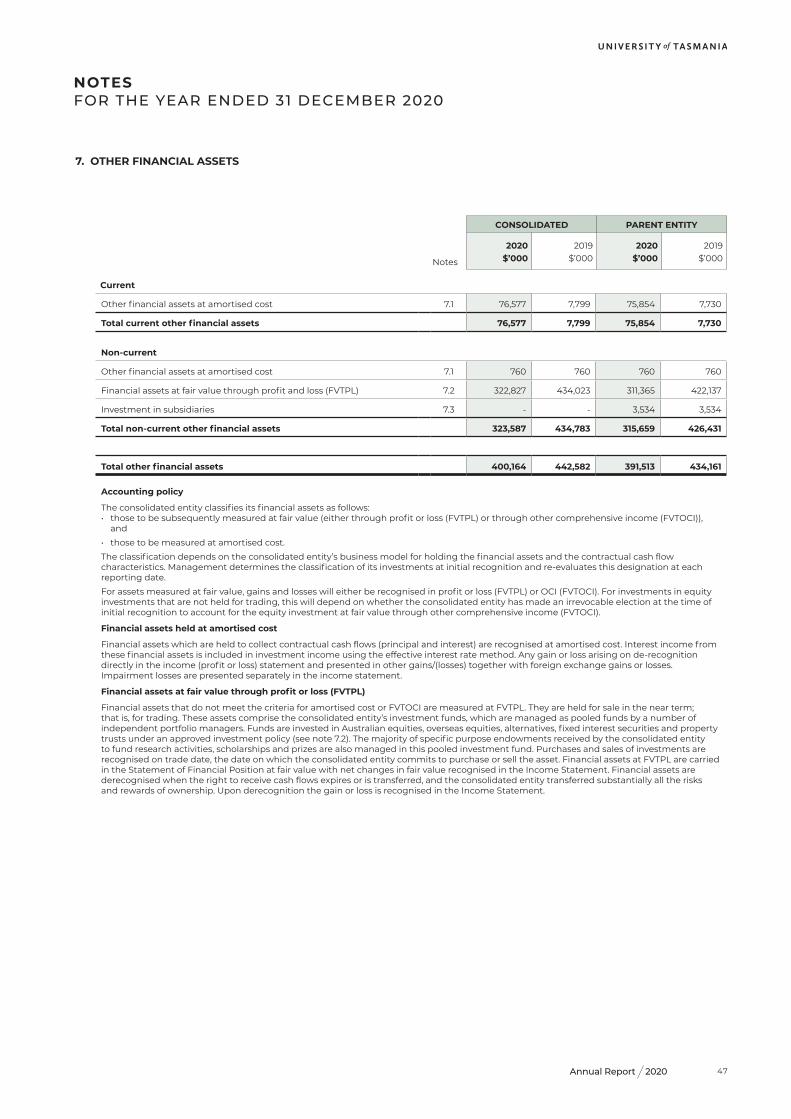
2020Annual Report
NOTES FOR THE YEAR ENDED 31 DECEMBER 2020
7. OTHER FINANCIAL ASSETS
Current
Other financial assets at amortised cost 7.1 76,577 7,799 75,854 7,730
Total current other financial assets 76,577 7,799 75,854 7,730
Non-current
Other financial assets at amortised cost 7.1 760 760 760 760
Financial assets at fair value through profit and loss (FVTPL) 7.2 322,827 434,023 311,365 422,137
Investment in subsidiaries 7.3 - - 3,534 3,534
Total non-current other financial assets 323,587 434,783 315,659 426,431
Total other financial assets 400,164 442,582 391,513 434,161
Accounting policy
The consolidated entity classifies its financial assets as follows: • those to be subsequently measured at fair value (either through profit or loss (FVTPL) or through other comprehensive income (FVTOCI)),
and
• those to be measured at amortised cost.
The classification depends on the consolidated entity’s business model for holding the financial assets and the contractual cash flow characteristics. Management determines the classification of its investments at initial recognition and re-evaluates this designation at each reporting date.
For assets measured at fair value, gains and losses will either be recognised in profit or loss (FVTPL) or OCI (FVTOCI). For investments in equity investments that are not held for trading, this will depend on whether the consolidated entity has made an irrevocable election at the time of initial recognition to account for the equity investment at fair value through other comprehensive income (FVTOCI).
Financial assets held at amortised cost
Financial assets which are held to collect contractual cash flows (principal and interest) are recognised at amortised cost. Interest income from these financial assets is included in investment income using the effective interest rate method. Any gain or loss arising on de-recognition directly in the income (profit or loss) statement and presented in other gains/(losses) together with foreign exchange gains or losses. Impairment losses are presented separately in the income statement.
Financial assets at fair value through profit or loss (FVTPL)
Financial assets that do not meet the criteria for amortised cost or FVTOCI are measured at FVTPL. They are held for sale in the near term; that is, for trading. These assets comprise the consolidated entity’s investment funds, which are managed as pooled funds by a number of independent portfolio managers. Funds are invested in Australian equities, overseas equities, alternatives, fixed interest securities and property trusts under an approved investment policy (see note 7.2). The majority of specific purpose endowments received by the consolidated entity to fund research activities, scholarships and prizes are also managed in this pooled investment fund. Purchases and sales of investments are recognised on trade date, the date on which the consolidated entity commits to purchase or sell the asset. Financial assets at FVTPL are carried in the Statement of Financial Position at fair value with net changes in fair value recognised in the Income Statement. Financial assets are derecognised when the right to receive cash flows expires or is transferred, and the consolidated entity transferred substantially all the risks and rewards of ownership. Upon derecognition the gain or loss is recognised in the Income Statement.
CONSOLIDATED PARENT ENTITY
2020 2019 2020 2019
Notes $’000 $’000 $’000 $’000
47
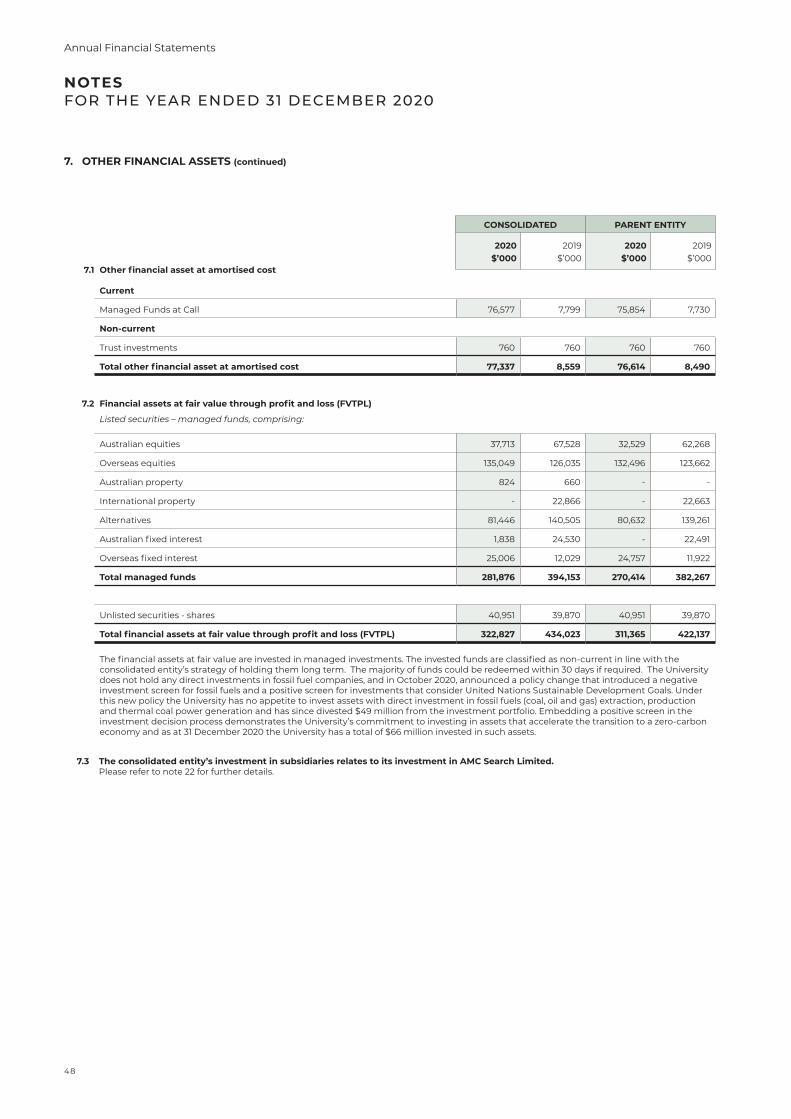
NOTES FOR THE YEAR ENDED 31 DECEMBER 2020
7. OTHER FINANCIAL ASSETS (continued)
7.1 Other financial asset at amortised cost
Current
Managed Funds at Call 76,577 7,799 75,854 7,730
Non-current
Trust investments 760 760 760 760
Total other financial asset at amortised cost 77,337 8,559 76,614 8,490
7.2 Financial assets at fair value through profit and loss (FVTPL)
Listed securities – managed funds, comprising:
Australian equities 37,713 67,528 32,529 62,268
Overseas equities 135,049 126,035 132,496 123,662
Australian property 824 660 - -
International property - 22,866 - 22,663
Alternatives 81,446 140,505 80,632 139,261
Australian fixed interest 1,838 24,530 - 22,491
Overseas fixed interest 25,006 12,029 24,757 11,922
Total managed funds 281,876 394,153 270,414 382,267
Unlisted securities - shares 40,951 39,870 40,951 39,870
Total financial assets at fair value through profit and loss (FVTPL) 322,827 434,023 311,365 422,137
The financial assets at fair value are invested in managed investments. The invested funds are classified as non-current in line with the consolidated entity’s strategy of holding them long term. The majority of funds could be redeemed within 30 days if required. The University does not hold any direct investments in fossil fuel companies, and in October 2020, announced a policy change that introduced a negative investment screen for fossil fuels and a positive screen for investments that consider United Nations Sustainable Development Goals. Under this new policy the University has no appetite to invest assets with direct investment in fossil fuels (coal, oil and gas) extraction, production and thermal coal power generation and has since divested $49 million from the investment portfolio. Embedding a positive screen in the investment decision process demonstrates the University’s commitment to investing in assets that accelerate the transition to a zero-carbon economy and as at 31 December 2020 the University has a total of $66 million invested in such assets.
7.3 The consolidated entity’s investment in subsidiaries relates to its investment in AMC Search Limited. Please refer to note 22 for further details.
CONSOLIDATED PARENT ENTITY
2020 2019 2020 2019$’000 $’000 $’000 $’000
48
Annual Financial Statements
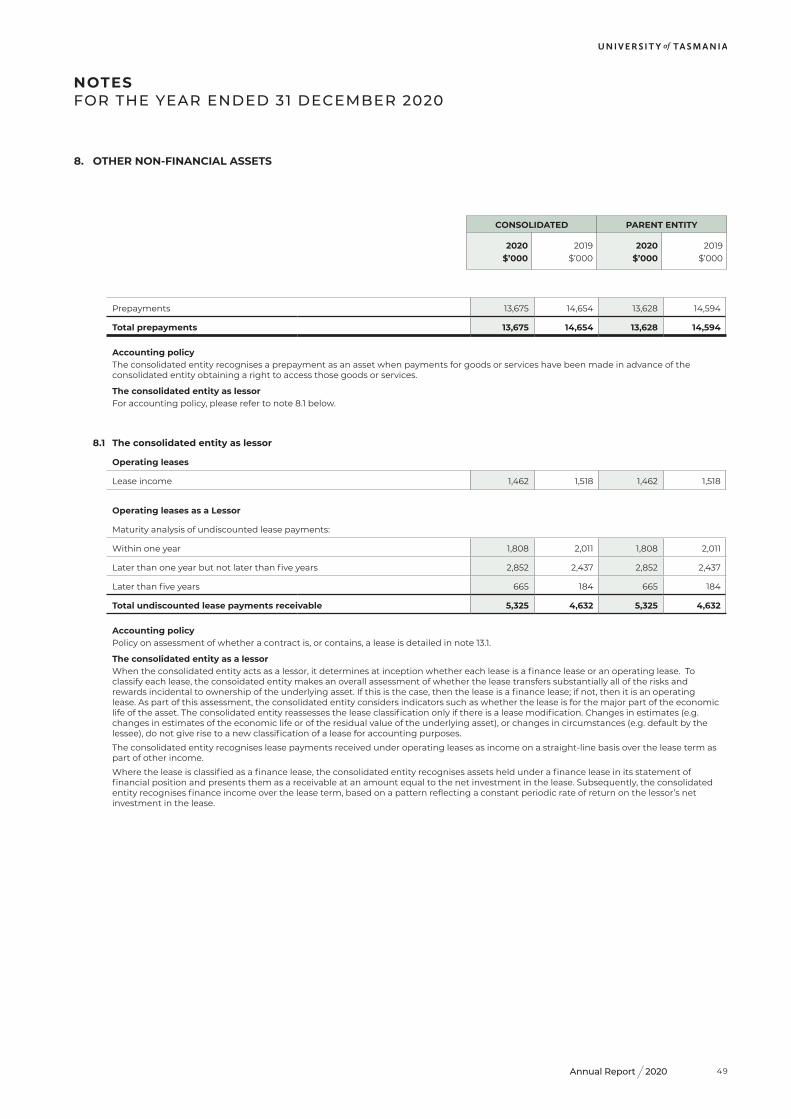
2020Annual Report
NOTES FOR THE YEAR ENDED 31 DECEMBER 2020
8. OTHER NON-FINANCIAL ASSETS
Prepayments 13,675 14,654 13,628 14,594
Total prepayments 13,675 14,654 13,628 14,594
Accounting policyThe consolidated entity recognises a prepayment as an asset when payments for goods or services have been made in advance of the consolidated entity obtaining a right to access those goods or services.
The consolidated entity as lessorFor accounting policy, please refer to note 8.1 below.
8.1 The consolidated entity as lessor
Operating leases
Lease income 1,462 1,518 1,462 1,518
Operating leases as a Lessor
Maturity analysis of undiscounted lease payments:
Within one year 1,808 2,011 1,808 2,011
Later than one year but not later than five years 2,852 2,437 2,852 2,437
Later than five years 665 184 665 184
Total undiscounted lease payments receivable 5,325 4,632 5,325 4,632
Accounting policyPolicy on assessment of whether a contract is, or contains, a lease is detailed in note 13.1.
The consolidated entity as a lessorWhen the consolidated entity acts as a lessor, it determines at inception whether each lease is a finance lease or an operating lease. To classify each lease, the consoidated entity makes an overall assessment of whether the lease transfers substantially all of the risks and rewards incidental to ownership of the underlying asset. If this is the case, then the lease is a finance lease; if not, then it is an operating lease. As part of this assessment, the consolidated entity considers indicators such as whether the lease is for the major part of the economic life of the asset. The consolidated entity reassesses the lease classification only if there is a lease modification. Changes in estimates (e.g. changes in estimates of the economic life or of the residual value of the underlying asset), or changes in circumstances (e.g. default by the lessee), do not give rise to a new classification of a lease for accounting purposes.
The consolidated entity recognises lease payments received under operating leases as income on a straight-line basis over the lease term as part of other income.
Where the lease is classified as a finance lease, the consolidated entity recognises assets held under a finance lease in its statement of financial position and presents them as a receivable at an amount equal to the net investment in the lease. Subsequently, the consolidated entity recognises finance income over the lease term, based on a pattern reflecting a constant periodic rate of return on the lessor’s net investment in the lease.
CONSOLIDATED PARENT ENTITY
2020 2019 2020 2019$’000 $’000 $’000 $’000
49
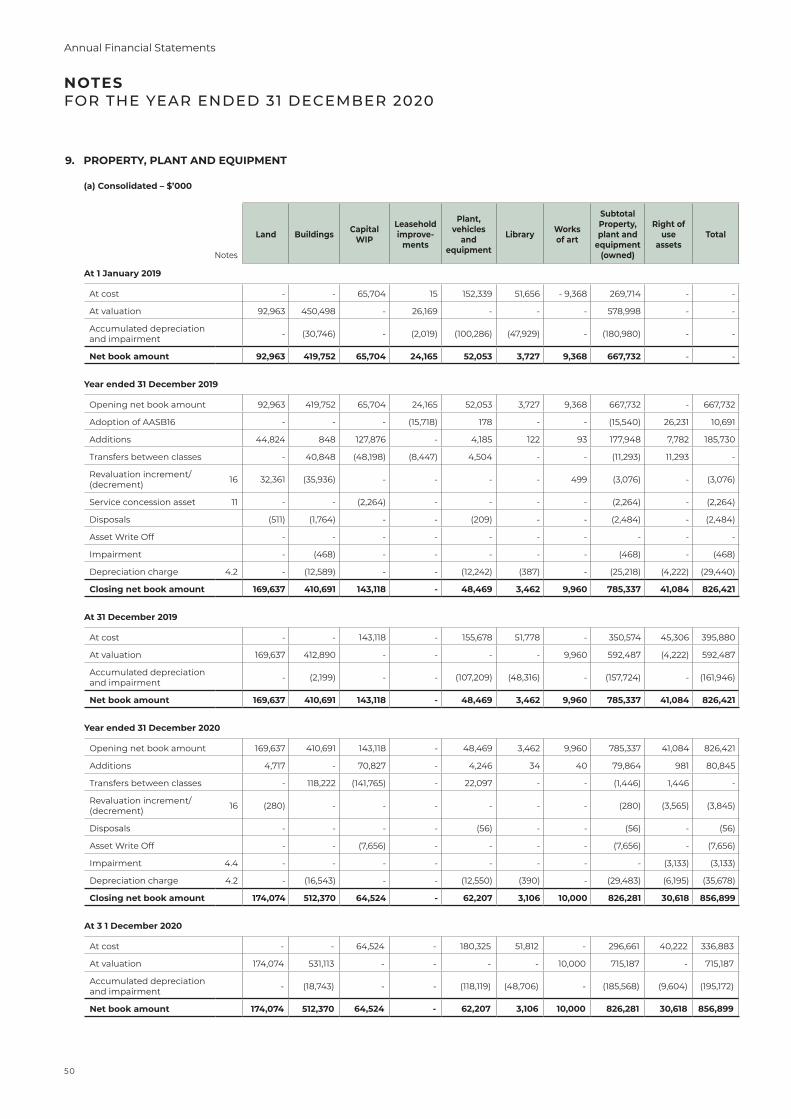
9. PROPERTY, PLANT AND EQUIPMENT
Notes
Land Buildings Capital WIP
Leasehold improve-
ments
Plant, vehicles
and equipment
Library Works of art
Subtotal Property, plant and
equipment (owned)
Right of use
assetsTotal
At 1 January 2019
At cost - - 65,704 15 152,339 51,656 - 9,368 269,714 - -
At valuation 92,963 450,498 - 26,169 - - - 578,998 - -
Accumulated depreciation and impairment - (30,746) - (2,019) (100,286) (47,929) - (180,980) - -
Net book amount 92,963 419,752 65,704 24,165 52,053 3,727 9,368 667,732 - -
Year ended 31 December 2019
Opening net book amount 92,963 419,752 65,704 24,165 52,053 3,727 9,368 667,732 - 667,732
Adoption of AASB16 - - - (15,718) 178 - - (15,540) 26,231 10,691
Additions 44,824 848 127,876 - 4,185 122 93 177,948 7,782 185,730
Transfers between classes - 40,848 (48,198) (8,447) 4,504 - - (11,293) 11,293 -
Revaluation increment/ (decrement) 16 32,361 (35,936) - - - - 499 (3,076) - (3,076)
Service concession asset 11 - - (2,264) - - - - (2,264) - (2,264)
Disposals (511) (1,764) - - (209) - - (2,484) - (2,484)
Asset Write Off - - - - - - - - - -
Impairment - (468) - - - - - (468) - (468)
Depreciation charge 4.2 - (12,589) - - (12,242) (387) - (25,218) (4,222) (29,440)
Closing net book amount 169,637 410,691 143,118 - 48,469 3,462 9,960 785,337 41,084 826,421
At 31 December 2019
At cost - - 143,118 - 155,678 51,778 - 350,574 45,306 395,880
At valuation 169,637 412,890 - - - - 9,960 592,487 (4,222) 592,487
Accumulated depreciation and impairment - (2,199) - - (107,209) (48,316) - (157,724) - (161,946)
Net book amount 169,637 410,691 143,118 - 48,469 3,462 9,960 785,337 41,084 826,421
Year ended 31 December 2020
Opening net book amount 169,637 410,691 143,118 - 48,469 3,462 9,960 785,337 41,084 826,421
Additions 4,717 - 70,827 - 4,246 34 40 79,864 981 80,845
Transfers between classes - 118,222 (141,765) - 22,097 - - (1,446) 1,446 -
Revaluation increment/ (decrement) 16 (280) - - - - - - (280) (3,565) (3,845)
Disposals - - - - (56) - - (56) - (56)
Asset Write Off - - (7,656) - - - - (7,656) - (7,656)
Impairment 4.4 - - - - - - - - (3,133) (3,133)
Depreciation charge 4.2 - (16,543) - - (12,550) (390) - (29,483) (6,195) (35,678)
Closing net book amount 174,074 512,370 64,524 - 62,207 3,106 10,000 826,281 30,618 856,899
At 3 1 December 2020
At cost - - 64,524 - 180,325 51,812 - 296,661 40,222 336,883
At valuation 174,074 531,113 - - - - 10,000 715,187 - 715,187
Accumulated depreciation and impairment - (18,743) - - (118,119) (48,706) - (185,568) (9,604) (195,172)
Net book amount 174,074 512,370 64,524 - 62,207 3,106 10,000 826,281 30,618 856,899
NOTES FOR THE YEAR ENDED 31 DECEMBER 2020
(a) Consolidated – $’000
50
Annual Financial Statements
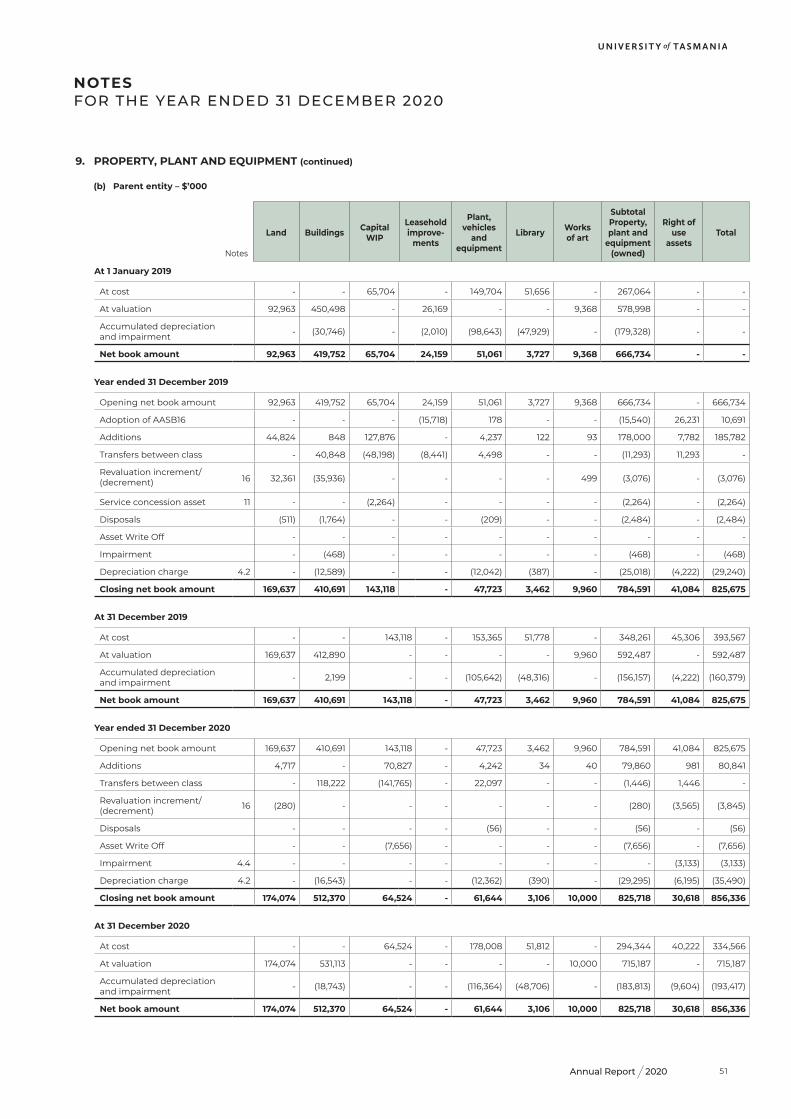
2020Annual Report
At 1 January 2019
At cost - - 65,704 - 149,704 51,656 - 267,064 - -
At valuation 92,963 450,498 - 26,169 - - 9,368 578,998 - -
Accumulated depreciation and impairment - (30,746) - (2,010) (98,643) (47,929) - (179,328) - -
Net book amount 92,963 419,752 65,704 24,159 51,061 3,727 9,368 666,734 - -
Year ended 31 December 2019
Opening net book amount 92,963 419,752 65,704 24,159 51,061 3,727 9,368 666,734 - 666,734
Adoption of AASB16 - - - (15,718) 178 - - (15,540) 26,231 10,691
Additions 44,824 848 127,876 - 4,237 122 93 178,000 7,782 185,782
Transfers between class - 40,848 (48,198) (8,441) 4,498 - - (11,293) 11,293 -
Revaluation increment/(decrement) 16 32,361 (35,936) - - - - 499 (3,076) - (3,076)
Service concession asset 11 - - (2,264) - - - - (2,264) - (2,264)
Disposals (511) (1,764) - - (209) - - (2,484) - (2,484)
Asset Write Off - - - - - - - - - -
Impairment - (468) - - - - - (468) - (468)
Depreciation charge 4.2 - (12,589) - - (12,042) (387) - (25,018) (4,222) (29,240)
Closing net book amount 169,637 410,691 143,118 - 47,723 3,462 9,960 784,591 41,084 825,675
At 31 December 2019
At cost - - 143,118 - 153,365 51,778 - 348,261 45,306 393,567
At valuation 169,637 412,890 - - - - 9,960 592,487 - 592,487
Accumulated depreciation and impairment - 2,199 - - (105,642) (48,316) - (156,157) (4,222) (160,379)
Net book amount 169,637 410,691 143,118 - 47,723 3,462 9,960 784,591 41,084 825,675
Year ended 31 December 2020
Opening net book amount 169,637 410,691 143,118 - 47,723 3,462 9,960 784,591 41,084 825,675
Additions 4,717 - 70,827 - 4,242 34 40 79,860 981 80,841
Transfers between class - 118,222 (141,765) - 22,097 - - (1,446) 1,446 -
Revaluation increment/(decrement) 16 (280) - - - - - - (280) (3,565) (3,845)
Disposals - - - - (56) - - (56) - (56)
Asset Write Off - - (7,656) - - - - (7,656) - (7,656)
Impairment 4.4 - - - - - - - - (3,133) (3,133)
Depreciation charge 4.2 - (16,543) - - (12,362) (390) - (29,295) (6,195) (35,490)
Closing net book amount 174,074 512,370 64,524 - 61,644 3,106 10,000 825,718 30,618 856,336
At 31 December 2020
At cost - - 64,524 - 178,008 51,812 - 294,344 40,222 334,566
At valuation 174,074 531,113 - - - - 10,000 715,187 - 715,187
Accumulated depreciation and impairment - (18,743) - - (116,364) (48,706) - (183,813) (9,604) (193,417)
Net book amount 174,074 512,370 64,524 - 61,644 3,106 10,000 825,718 30,618 856,336
9. PROPERTY, PLANT AND EQUIPMENT (continued)
Notes
Land Buildings Capital WIP
Leasehold improve-
ments
Plant, vehicles
and equipment
Library Works of art
Subtotal Property, plant and
equipment (owned)
Right of use
assetsTotal
NOTES FOR THE YEAR ENDED 31 DECEMBER 2020
(b) Parent entity – $’000
51
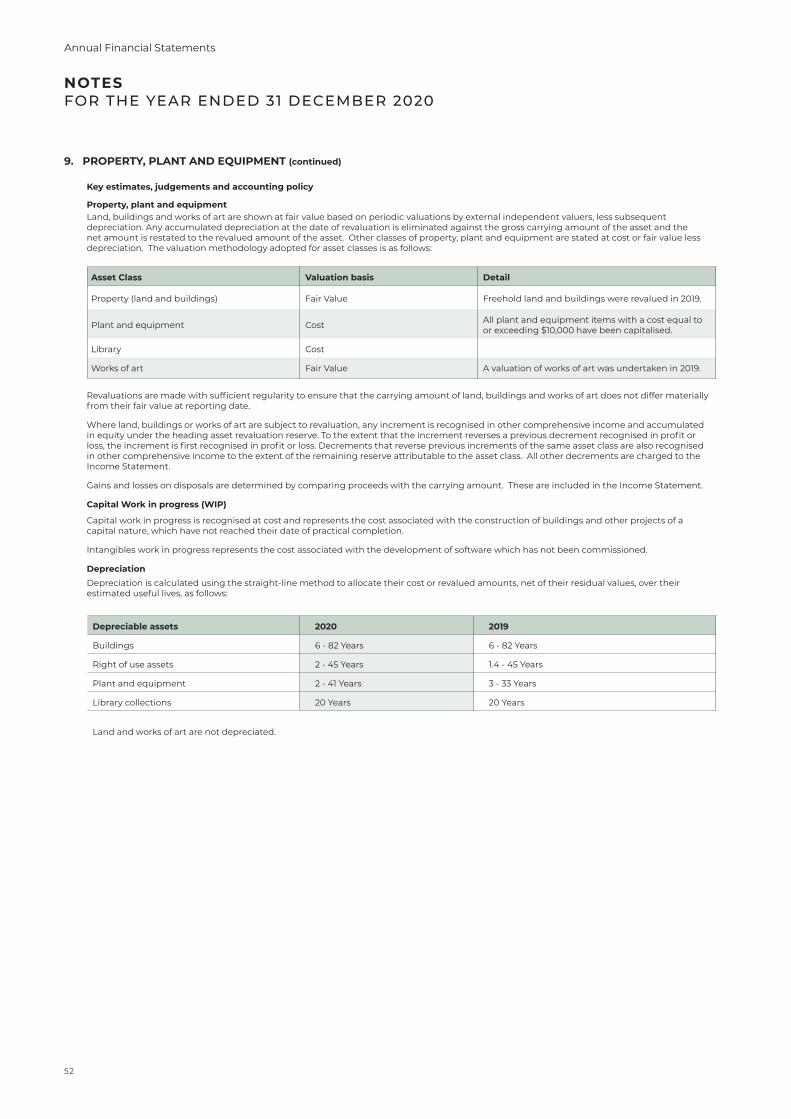
9. PROPERTY, PLANT AND EQUIPMENT (continued)
Key estimates, judgements and accounting policy
Property, plant and equipmentLand, buildings and works of art are shown at fair value based on periodic valuations by external independent valuers, less subsequent depreciation. Any accumulated depreciation at the date of revaluation is eliminated against the gross carrying amount of the asset and the net amount is restated to the revalued amount of the asset. Other classes of property, plant and equipment are stated at cost or fair value less depreciation. The valuation methodology adopted for asset classes is as follows:
Asset Class Valuation basis Detail
Property (land and buildings) Fair Value Freehold land and buildings were revalued in 2019.
Plant and equipment Cost All plant and equipment items with a cost equal to or exceeding $10,000 have been capitalised.
Library Cost
Works of art Fair Value A valuation of works of art was undertaken in 2019.
Revaluations are made with sufficient regularity to ensure that the carrying amount of land, buildings and works of art does not differ materially from their fair value at reporting date.
Where land, buildings or works of art are subject to revaluation, any increment is recognised in other comprehensive income and accumulated in equity under the heading asset revaluation reserve. To the extent that the increment reverses a previous decrement recognised in profit or loss, the increment is first recognised in profit or loss. Decrements that reverse previous increments of the same asset class are also recognised in other comprehensive income to the extent of the remaining reserve attributable to the asset class. All other decrements are charged to the Income Statement.
Gains and losses on disposals are determined by comparing proceeds with the carrying amount. These are included in the Income Statement.
Capital Work in progress (WIP)
Capital work in progress is recognised at cost and represents the cost associated with the construction of buildings and other projects of a capital nature, which have not reached their date of practical completion.
Intangibles work in progress represents the cost associated with the development of software which has not been commissioned.
Depreciation Depreciation is calculated using the straight-line method to allocate their cost or revalued amounts, net of their residual values, over their estimated useful lives, as follows:
Depreciable assets 2020 2019
Buildings 6 - 82 Years 6 - 82 Years
Right of use assets 2 - 45 Years 1.4 - 45 Years
Plant and equipment 2 - 41 Years 3 - 33 Years
Library collections 20 Years 20 Years
Land and works of art are not depreciated.
NOTES FOR THE YEAR ENDED 31 DECEMBER 2020
52
Annual Financial Statements
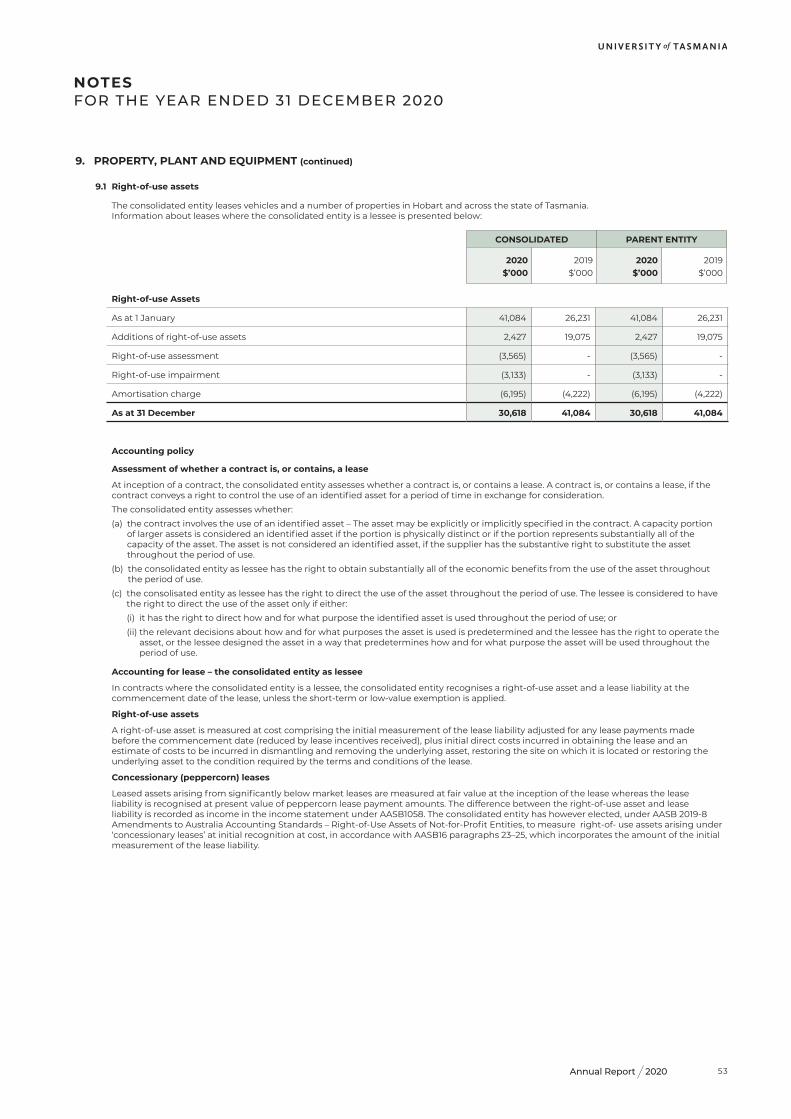
2020Annual Report
NOTES FOR THE YEAR ENDED 31 DECEMBER 2020
9. PROPERTY, PLANT AND EQUIPMENT (continued)
9.1 Right-of-use assets
The consolidated entity leases vehicles and a number of properties in Hobart and across the state of Tasmania. Information about leases where the consolidated entity is a lessee is presented below:
Right-of-use Assets
As at 1 January 41,084 26,231 41,084 26,231
Additions of right-of-use assets 2,427 19,075 2,427 19,075
Right-of-use assessment (3,565) - (3,565) -
Right-of-use impairment (3,133) - (3,133) -
Amortisation charge (6,195) (4,222) (6,195) (4,222)
As at 31 December 30,618 41,084 30,618 41,084
Accounting policy
Assessment of whether a contract is, or contains, a lease
At inception of a contract, the consolidated entity assesses whether a contract is, or contains a lease. A contract is, or contains a lease, if the contract conveys a right to control the use of an identified asset for a period of time in exchange for consideration.
The consolidated entity assesses whether:
(a) the contract involves the use of an identified asset – The asset may be explicitly or implicitly specified in the contract. A capacity portion of larger assets is considered an identified asset if the portion is physically distinct or if the portion represents substantially all of the capacity of the asset. The asset is not considered an identified asset, if the supplier has the substantive right to substitute the asset throughout the period of use.
(b) the consolidated entity as lessee has the right to obtain substantially all of the economic benefits from the use of the asset throughout the period of use.
(c) the consolisated entity as lessee has the right to direct the use of the asset throughout the period of use. The lessee is considered to have the right to direct the use of the asset only if either:
(i) it has the right to direct how and for what purpose the identified asset is used throughout the period of use; or
(ii) the relevant decisions about how and for what purposes the asset is used is predetermined and the lessee has the right to operate the asset, or the lessee designed the asset in a way that predetermines how and for what purpose the asset will be used throughout the period of use.
Accounting for lease – the consolidated entity as lessee
In contracts where the consolidated entity is a lessee, the consolidated entity recognises a right-of-use asset and a lease liability at the commencement date of the lease, unless the short-term or low-value exemption is applied.
Right-of-use assets
A right-of-use asset is measured at cost comprising the initial measurement of the lease liability adjusted for any lease payments made before the commencement date (reduced by lease incentives received), plus initial direct costs incurred in obtaining the lease and an estimate of costs to be incurred in dismantling and removing the underlying asset, restoring the site on which it is located or restoring the underlying asset to the condition required by the terms and conditions of the lease.
Concessionary (peppercorn) leases
Leased assets arising from significantly below market leases are measured at fair value at the inception of the lease whereas the lease liability is recognised at present value of peppercorn lease payment amounts. The difference between the right-of-use asset and lease liability is recorded as income in the income statement under AASB1058. The consolidated entity has however elected, under AASB 2019-8 Amendments to Australia Accounting Standards – Right-of-Use Assets of Not-for-Profit Entities, to measure right-of- use assets arising under ‘concessionary leases’ at initial recognition at cost, in accordance with AASB16 paragraphs 23–25, which incorporates the amount of the initial measurement of the lease liability.
CONSOLIDATED PARENT ENTITY
2020 2019 2020 2019$’000 $’000 $’000 $’000
53
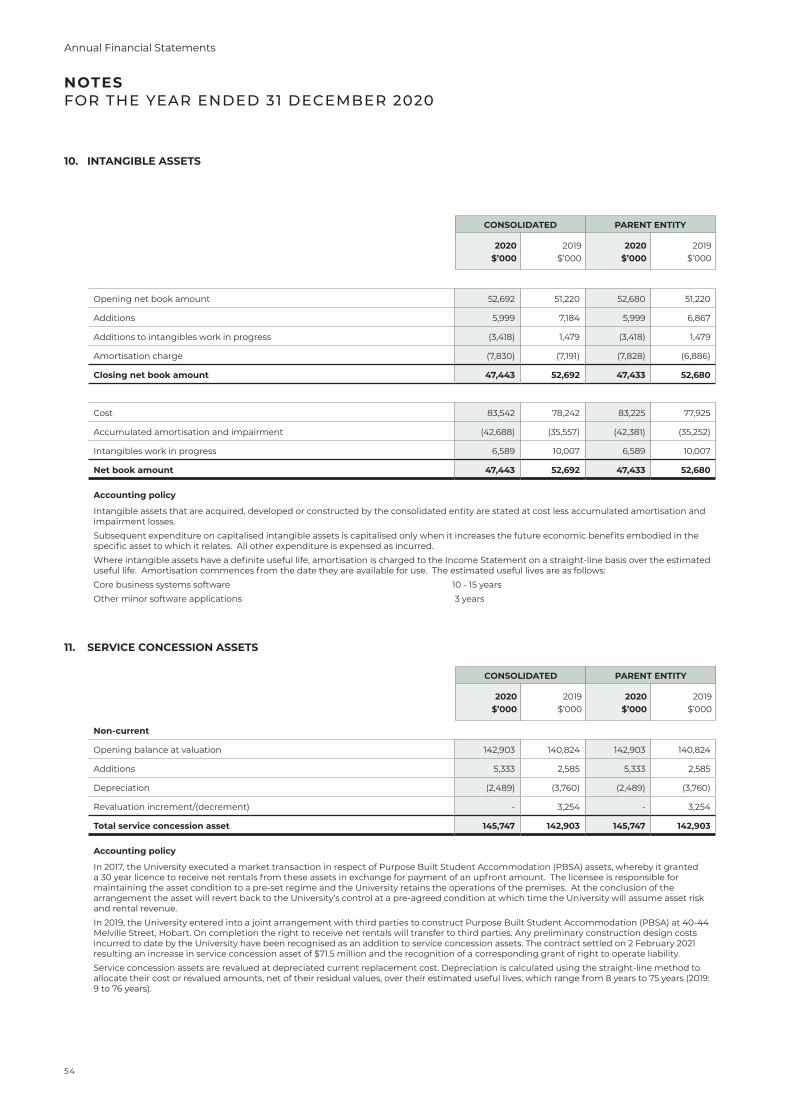
NOTES FOR THE YEAR ENDED 31 DECEMBER 2020
10. INTANGIBLE ASSETS
Opening net book amount 52,692 51,220 52,680 51,220
Additions 5,999 7,184 5,999 6,867
Additions to intangibles work in progress (3,418) 1,479 (3,418) 1,479
Amortisation charge (7,830) (7,191) (7,828) (6,886)
Closing net book amount 47,443 52,692 47,433 52,680
Cost 83,542 78,242 83,225 77,925
Accumulated amortisation and impairment (42,688) (35,557) (42,381) (35,252)
Intangibles work in progress 6,589 10,007 6,589 10,007
Net book amount 47,443 52,692 47,433 52,680
Accounting policy
Intangible assets that are acquired, developed or constructed by the consolidated entity are stated at cost less accumulated amortisation and impairment losses.
Subsequent expenditure on capitalised intangible assets is capitalised only when it increases the future economic benefits embodied in the specific asset to which it relates. All other expenditure is expensed as incurred.
Where intangible assets have a definite useful life, amortisation is charged to the Income Statement on a straight-line basis over the estimated useful life. Amortisation commences from the date they are available for use. The estimated useful lives are as follows:
Core business systems software 10 - 15 years
Other minor software applications 3 years
11. SERVICE CONCESSION ASSETS
Non-current
Opening balance at valuation 142,903 140,824 142,903 140,824
Additions 5,333 2,585 5,333 2,585
Depreciation (2,489) (3,760) (2,489) (3,760)
Revaluation increment/(decrement) - 3,254 - 3,254
Total service concession asset 145,747 142,903 145,747 142,903
Accounting policy
In 2017, the University executed a market transaction in respect of Purpose Built Student Accommodation (PBSA) assets, whereby it granted a 30 year licence to receive net rentals from these assets in exchange for payment of an upfront amount. The licensee is responsible for maintaining the asset condition to a pre-set regime and the University retains the operations of the premises. At the conclusion of the arrangement the asset will revert back to the University’s control at a pre-agreed condition at which time the University will assume asset risk and rental revenue.
In 2019, the University entered into a joint arrangement with third parties to construct Purpose Built Student Accommodation (PBSA) at 40-44 Melville Street, Hobart. On completion the right to receive net rentals will transfer to third parties. Any preliminary construction design costs incurred to date by the University have been recognised as an addition to service concession assets. The contract settled on 2 February 2021 resulting an increase in service concession asset of $71.5 million and the recognition of a corresponding grant of right to operate liability.
Service concession assets are revalued at depreciated current replacement cost. Depreciation is calculated using the straight-line method to allocate their cost or revalued amounts, net of their residual values, over their estimated useful lives, which range from 8 years to 75 years (2019: 9 to 76 years).
CONSOLIDATED PARENT ENTITY
2020 2019 2020 2019$’000 $’000 $’000 $’000
CONSOLIDATED PARENT ENTITY
2020 2019 2020 2019$’000 $’000 $’000 $’000
54
Annual Financial Statements
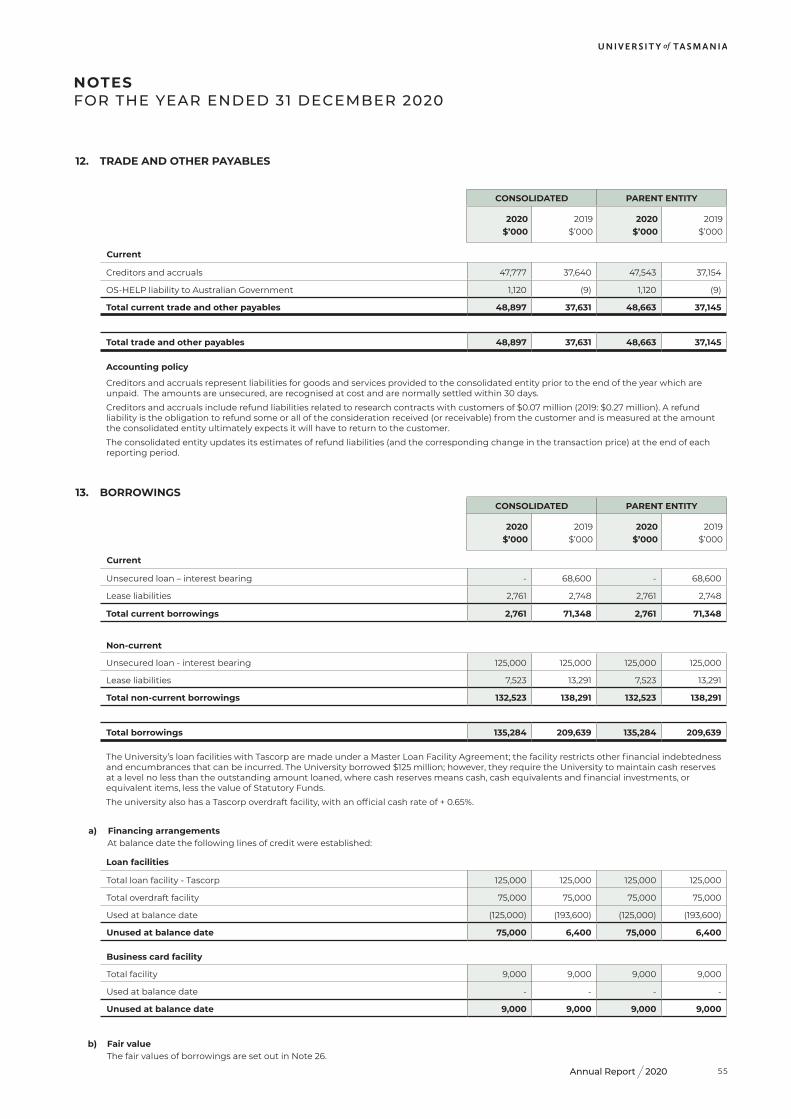
2020Annual Report
NOTES FOR THE YEAR ENDED 31 DECEMBER 2020
CONSOLIDATED PARENT ENTITY
2020 2019 2020 2019$’000 $’000 $’000 $’000
12. TRADE AND OTHER PAYABLES
Current
Creditors and accruals 47,777 37,640 47,543 37,154
OS-HELP liability to Australian Government 1,120 (9) 1,120 (9)
Total current trade and other payables 48,897 37,631 48,663 37,145
Total trade and other payables 48,897 37,631 48,663 37,145
Accounting policy
Creditors and accruals represent liabilities for goods and services provided to the consolidated entity prior to the end of the year which are unpaid. The amounts are unsecured, are recognised at cost and are normally settled within 30 days.
Creditors and accruals include refund liabilities related to research contracts with customers of $0.07 million (2019: $0.27 million). A refund liability is the obligation to refund some or all of the consideration received (or receivable) from the customer and is measured at the amount the consolidated entity ultimately expects it will have to return to the customer.
The consolidated entity updates its estimates of refund liabilities (and the corresponding change in the transaction price) at the end of each reporting period.
13. BORROWINGS
Current
Unsecured loan – interest bearing - 68,600 - 68,600
Lease liabilities 2,761 2,748 2,761 2,748
Total current borrowings 2,761 71,348 2,761 71,348
Non-current
Unsecured loan - interest bearing 125,000 125,000 125,000 125,000
Lease liabilities 7,523 13,291 7,523 13,291
Total non-current borrowings 132,523 138,291 132,523 138,291
Total borrowings 135,284 209,639 135,284 209,639
The University’s loan facilities with Tascorp are made under a Master Loan Facility Agreement; the facility restricts other financial indebtedness and encumbrances that can be incurred. The University borrowed $125 million; however, they require the University to maintain cash reserves at a level no less than the outstanding amount loaned, where cash reserves means cash, cash equivalents and financial investments, or equivalent items, less the value of Statutory Funds.
The university also has a Tascorp overdraft facility, with an official cash rate of + 0.65%.
a) Financing arrangements At balance date the following lines of credit were established:
Loan facilities
Total loan facility - Tascorp 125,000 125,000 125,000 125,000
Total overdraft facility 75,000 75,000 75,000 75,000
Used at balance date (125,000) (193,600) (125,000) (193,600)
Unused at balance date 75,000 6,400 75,000 6,400
Business card facility
Total facility 9,000 9,000 9,000 9,000
Used at balance date - - - -
Unused at balance date 9,000 9,000 9,000 9,000
b) Fair value The fair values of borrowings are set out in Note 26.
CONSOLIDATED PARENT ENTITY
2020 2019 2020 2019$’000 $’000 $’000 $’000
55
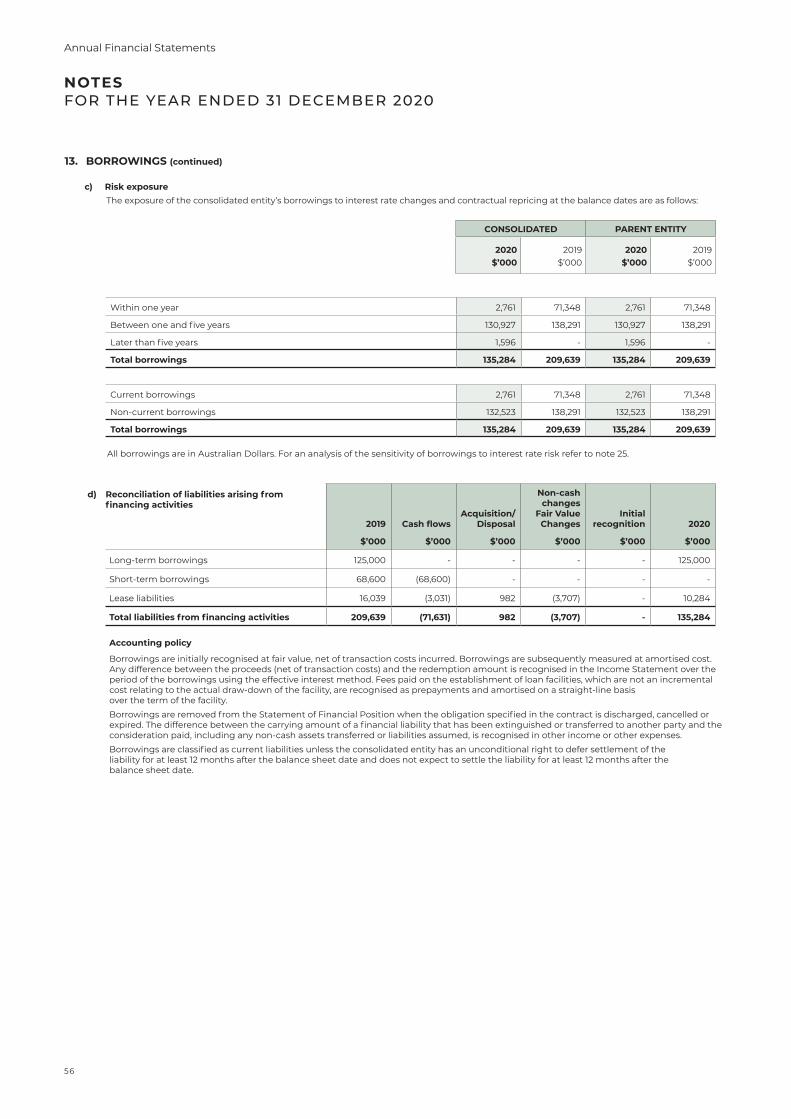
NOTES FOR THE YEAR ENDED 31 DECEMBER 2020
d) Reconciliation of liabilities arising from financing activities
2019 Cash flowsAcquisition/
Disposal
Non-cash changes
Fair Value Changes
Initial recognition 2020
$’000 $’000 $’000 $’000 $’000 $’000
Long-term borrowings 125,000 - - - - 125,000
Short-term borrowings 68,600 (68,600) - - - -
Lease liabilities 16,039 (3,031) 982 (3,707) - 10,284
Total liabilities from financing activities 209,639 (71,631) 982 (3,707) - 135,284
13. BORROWINGS (continued)
c) Risk exposure The exposure of the consolidated entity’s borrowings to interest rate changes and contractual repricing at the balance dates are as follows:
Within one year 2,761 71,348 2,761 71,348
Between one and five years 130,927 138,291 130,927 138,291
Later than five years 1,596 - 1,596 -
Total borrowings 135,284 209,639 135,284 209,639
Current borrowings 2,761 71,348 2,761 71,348
Non-current borrowings 132,523 138,291 132,523 138,291
Total borrowings 135,284 209,639 135,284 209,639
All borrowings are in Australian Dollars. For an analysis of the sensitivity of borrowings to interest rate risk refer to note 25.
CONSOLIDATED PARENT ENTITY
2020 2019 2020 2019$’000 $’000 $’000 $’000
Accounting policy
Borrowings are initially recognised at fair value, net of transaction costs incurred. Borrowings are subsequently measured at amortised cost. Any difference between the proceeds (net of transaction costs) and the redemption amount is recognised in the Income Statement over the period of the borrowings using the effective interest method. Fees paid on the establishment of loan facilities, which are not an incremental cost relating to the actual draw-down of the facility, are recognised as prepayments and amortised on a straight-line basis over the term of the facility.
Borrowings are removed from the Statement of Financial Position when the obligation specified in the contract is discharged, cancelled or expired. The difference between the carrying amount of a financial liability that has been extinguished or transferred to another party and the consideration paid, including any non-cash assets transferred or liabilities assumed, is recognised in other income or other expenses.
Borrowings are classified as current liabilities unless the consolidated entity has an unconditional right to defer settlement of the liability for at least 12 months after the balance sheet date and does not expect to settle the liability for at least 12 months after the balance sheet date.
56
Annual Financial Statements
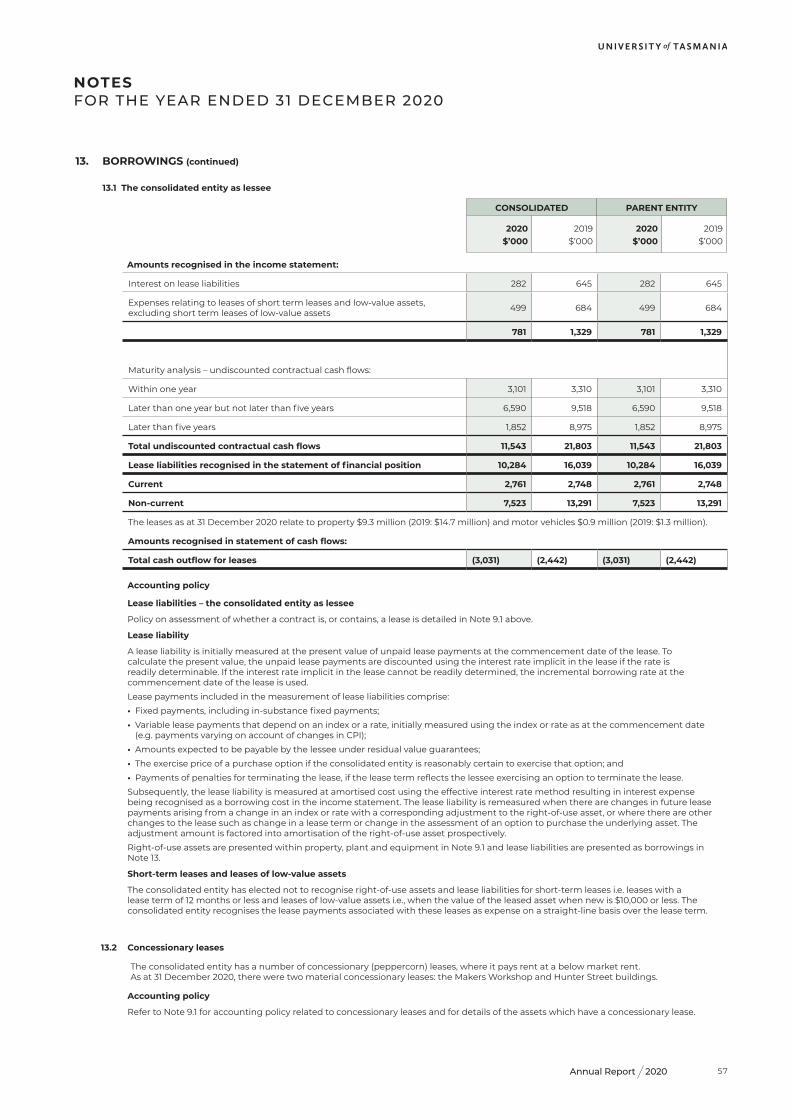
2020Annual Report
CONSOLIDATED PARENT ENTITY
2020 2019 2020 2019$’000 $’000 $’000 $’000
Accounting policy
Lease liabilities – the consolidated entity as lessee
Policy on assessment of whether a contract is, or contains, a lease is detailed in Note 9.1 above.
Lease liability
A lease liability is initially measured at the present value of unpaid lease payments at the commencement date of the lease. To calculate the present value, the unpaid lease payments are discounted using the interest rate implicit in the lease if the rate is readily determinable. If the interest rate implicit in the lease cannot be readily determined, the incremental borrowing rate at the commencement date of the lease is used.
Lease payments included in the measurement of lease liabilities comprise:
• Fixed payments, including in-substance fixed payments;
• Variable lease payments that depend on an index or a rate, initially measured using the index or rate as at the commencement date (e.g. payments varying on account of changes in CPI);
• Amounts expected to be payable by the lessee under residual value guarantees;
• The exercise price of a purchase option if the consolidated entity is reasonably certain to exercise that option; and
• Payments of penalties for terminating the lease, if the lease term reflects the lessee exercising an option to terminate the lease.
Subsequently, the lease liability is measured at amortised cost using the effective interest rate method resulting in interest expense being recognised as a borrowing cost in the income statement. The lease liability is remeasured when there are changes in future lease payments arising from a change in an index or rate with a corresponding adjustment to the right-of-use asset, or where there are other changes to the lease such as change in a lease term or change in the assessment of an option to purchase the underlying asset. The adjustment amount is factored into amortisation of the right-of-use asset prospectively.
Right-of-use assets are presented within property, plant and equipment in Note 9.1 and lease liabilities are presented as borrowings in Note 13.
Short-term leases and leases of low-value assets
The consolidated entity has elected not to recognise right-of-use assets and lease liabilities for short-term leases i.e. leases with a lease term of 12 months or less and leases of low-value assets i.e., when the value of the leased asset when new is $10,000 or less. The consolidated entity recognises the lease payments associated with these leases as expense on a straight-line basis over the lease term.
13.2 Concessionary leases
The consolidated entity has a number of concessionary (peppercorn) leases, where it pays rent at a below market rent. As at 31 December 2020, there were two material concessionary leases: the Makers Workshop and Hunter Street buildings.
Accounting policy
Refer to Note 9.1 for accounting policy related to concessionary leases and for details of the assets which have a concessionary lease.
NOTES FOR THE YEAR ENDED 31 DECEMBER 2020
Amounts recognised in the income statement:
Interest on lease liabilities 282 645 282 645
Expenses relating to leases of short term leases and low-value assets, excluding short term leases of low-value assets 499 684 499 684
781 1,329 781 1,329
Maturity analysis – undiscounted contractual cash flows:
Within one year 3,101 3,310 3,101 3,310
Later than one year but not later than five years 6,590 9,518 6,590 9,518
Later than five years 1,852 8,975 1,852 8,975
Total undiscounted contractual cash flows 11,543 21,803 11,543 21,803
Lease liabilities recognised in the statement of financial position 10,284 16,039 10,284 16,039
Current 2,761 2,748 2,761 2,748
Non-current 7,523 13,291 7,523 13,291
The leases as at 31 December 2020 relate to property $9.3 million (2019: $14.7 million) and motor vehicles $0.9 million (2019: $1.3 million).
Amounts recognised in statement of cash flows:
Total cash outflow for leases (3,031) (2,442) (3,031) (2,442)
13. BORROWINGS (continued)
13.1 The consolidated entity as lessee
57
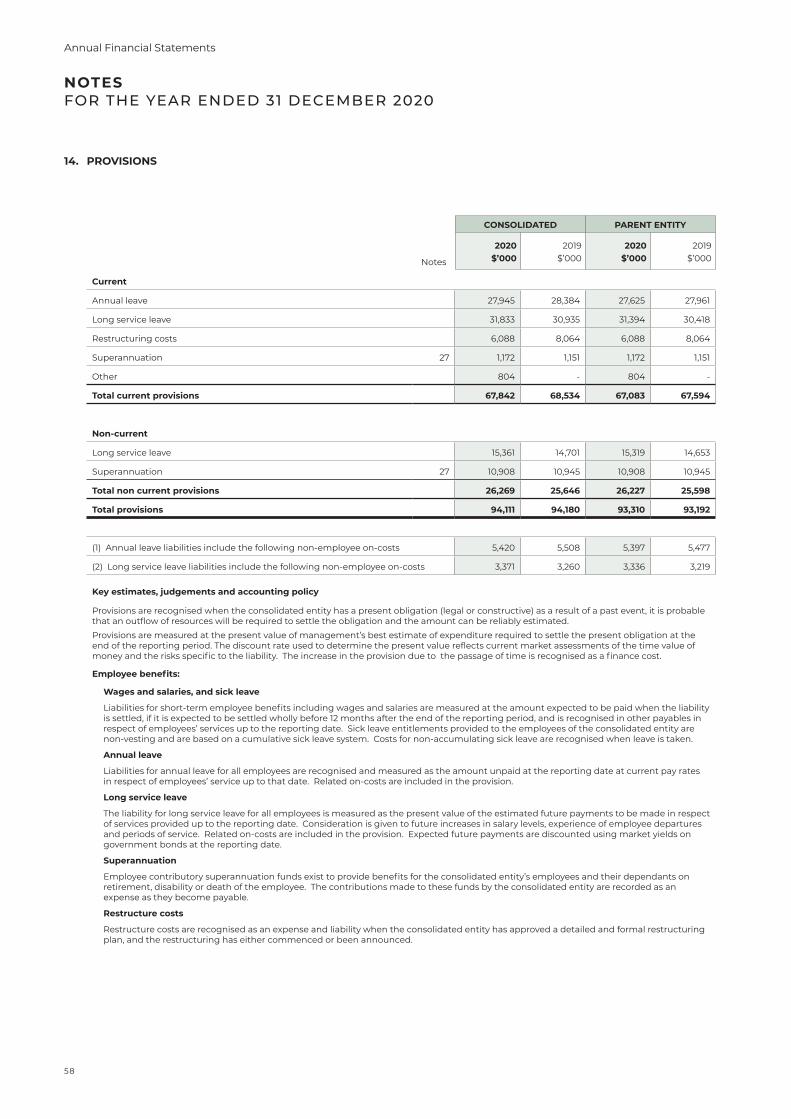
NOTES FOR THE YEAR ENDED 31 DECEMBER 2020
14. PROVISIONS
Current
Annual leave 27,945 28,384 27,625 27,961
Long service leave 31,833 30,935 31,394 30,418
Restructuring costs 6,088 8,064 6,088 8,064
Superannuation 27 1,172 1,151 1,172 1,151
Other 804 - 804 -
Total current provisions 67,842 68,534 67,083 67,594
Non-current
Long service leave 15,361 14,701 15,319 14,653
Superannuation 27 10,908 10,945 10,908 10,945
Total non current provisions 26,269 25,646 26,227 25,598
Total provisions 94,111 94,180 93,310 93,192
(1) Annual leave liabilities include the following non-employee on-costs 5,420 5,508 5,397 5,477
(2) Long service leave liabilities include the following non-employee on-costs 3,371 3,260 3,336 3,219
Key estimates, judgements and accounting policy
Provisions are recognised when the consolidated entity has a present obligation (legal or constructive) as a result of a past event, it is probable that an outflow of resources will be required to settle the obligation and the amount can be reliably estimated.
Provisions are measured at the present value of management’s best estimate of expenditure required to settle the present obligation at the end of the reporting period. The discount rate used to determine the present value reflects current market assessments of the time value of money and the risks specific to the liability. The increase in the provision due to the passage of time is recognised as a finance cost.
Employee benefits:
Wages and salaries, and sick leave
Liabilities for short-term employee benefits including wages and salaries are measured at the amount expected to be paid when the liability is settled, if it is expected to be settled wholly before 12 months after the end of the reporting period, and is recognised in other payables in respect of employees’ services up to the reporting date. Sick leave entitlements provided to the employees of the consolidated entity are non-vesting and are based on a cumulative sick leave system. Costs for non-accumulating sick leave are recognised when leave is taken.
Annual leave
Liabilities for annual leave for all employees are recognised and measured as the amount unpaid at the reporting date at current pay rates in respect of employees’ service up to that date. Related on-costs are included in the provision.
Long service leave
The liability for long service leave for all employees is measured as the present value of the estimated future payments to be made in respect of services provided up to the reporting date. Consideration is given to future increases in salary levels, experience of employee departures and periods of service. Related on-costs are included in the provision. Expected future payments are discounted using market yields on government bonds at the reporting date.
Superannuation
Employee contributory superannuation funds exist to provide benefits for the consolidated entity’s employees and their dependants on retirement, disability or death of the employee. The contributions made to these funds by the consolidated entity are recorded as an expense as they become payable.
Restructure costs
Restructure costs are recognised as an expense and liability when the consolidated entity has approved a detailed and formal restructuring plan, and the restructuring has either commenced or been announced.
CONSOLIDATED PARENT ENTITY
2020 2019 2020 2019
Notes $’000 $’000 $’000 $’000
58
Annual Financial Statements
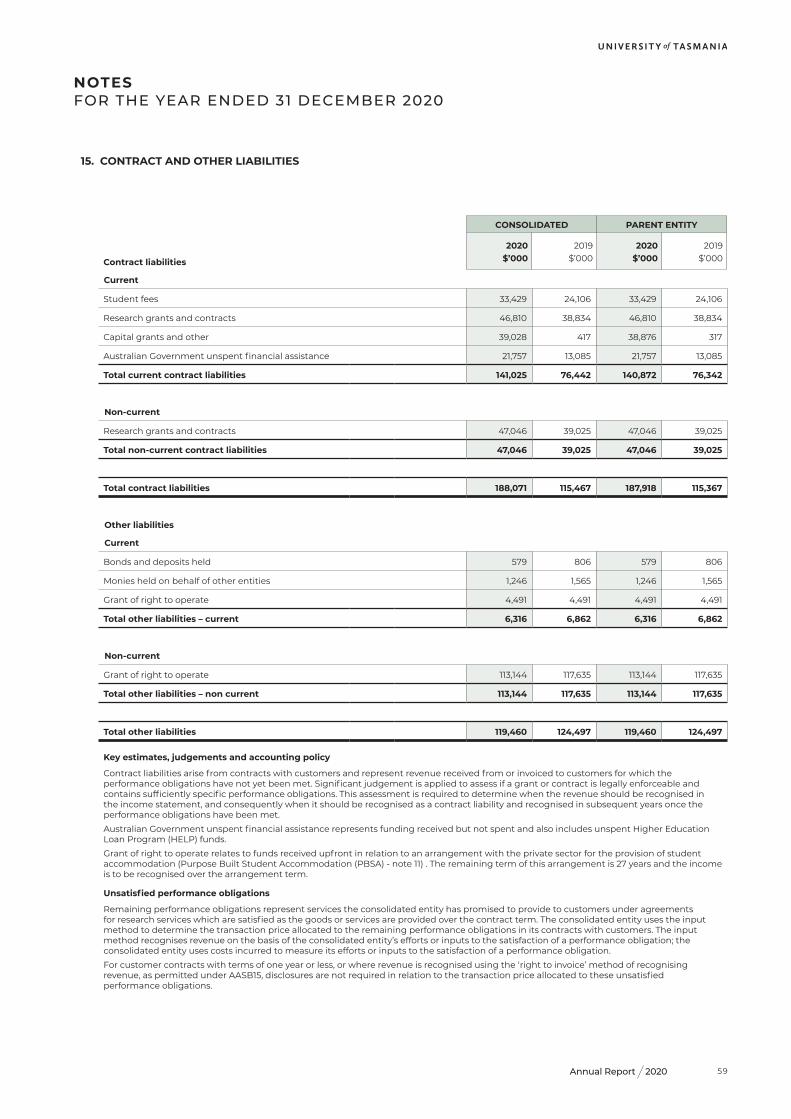
2020Annual Report
NOTES FOR THE YEAR ENDED 31 DECEMBER 2020
15. CONTRACT AND OTHER LIABILITIES
Contract liabilities
Current
Student fees 33,429 24,106 33,429 24,106
Research grants and contracts 46,810 38,834 46,810 38,834
Capital grants and other 39,028 417 38,876 317
Australian Government unspent financial assistance 21,757 13,085 21,757 13,085
Total current contract liabilities 141,025 76,442 140,872 76,342
Non-current
Research grants and contracts 47,046 39,025 47,046 39,025
Total non-current contract liabilities 47,046 39,025 47,046 39,025
Total contract liabilities 188,071 115,467 187,918 115,367
Other liabilities
Current
Bonds and deposits held 579 806 579 806
Monies held on behalf of other entities 1,246 1,565 1,246 1,565
Grant of right to operate 4,491 4,491 4,491 4,491
Total other liabilities – current 6,316 6,862 6,316 6,862
Non-current
Grant of right to operate 113,144 117,635 113,144 117,635
Total other liabilities – non current 113,144 117,635 113,144 117,635
Total other liabilities 119,460 124,497 119,460 124,497
Key estimates, judgements and accounting policy
Contract liabilities arise from contracts with customers and represent revenue received from or invoiced to customers for which the performance obligations have not yet been met. Significant judgement is applied to assess if a grant or contract is legally enforceable and contains sufficiently specific performance obligations. This assessment is required to determine when the revenue should be recognised in the income statement, and consequently when it should be recognised as a contract liability and recognised in subsequent years once the performance obligations have been met.
Australian Government unspent financial assistance represents funding received but not spent and also includes unspent Higher Education Loan Program (HELP) funds.
Grant of right to operate relates to funds received upfront in relation to an arrangement with the private sector for the provision of student accommodation (Purpose Built Student Accommodation (PBSA) - note 11) . The remaining term of this arrangement is 27 years and the income is to be recognised over the arrangement term.
Unsatisfied performance obligations
Remaining performance obligations represent services the consolidated entity has promised to provide to customers under agreements for research services which are satisfied as the goods or services are provided over the contract term. The consolidated entity uses the input method to determine the transaction price allocated to the remaining performance obligations in its contracts with customers. The input method recognises revenue on the basis of the consolidated entity’s efforts or inputs to the satisfaction of a performance obligation; the consolidated entity uses costs incurred to measure its efforts or inputs to the satisfaction of a performance obligation.
For customer contracts with terms of one year or less, or where revenue is recognised using the ‘right to invoice’ method of recognising revenue, as permitted under AASB15, disclosures are not required in relation to the transaction price allocated to these unsatisfied performance obligations.
CONSOLIDATED PARENT ENTITY
2020 2019 2020 2019$’000 $’000 $’000 $’000
59
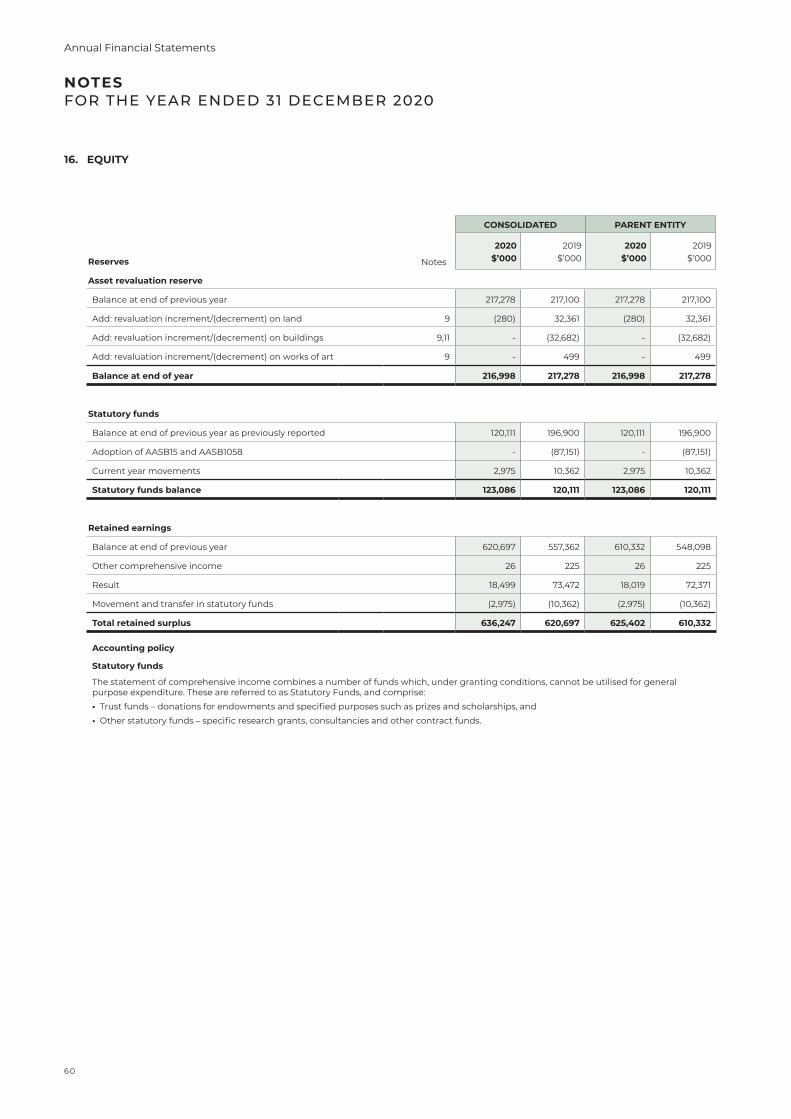
NOTES FOR THE YEAR ENDED 31 DECEMBER 2020
Reserves
Asset revaluation reserve
Balance at end of previous year 217,278 217,100 217,278 217,100
Add: revaluation increment/(decrement) on land 9 (280) 32,361 (280) 32,361
Add: revaluation increment/(decrement) on buildings 9,11 - (32,682) - (32,682)
Add: revaluation increment/(decrement) on works of art 9 - 499 - 499
Balance at end of year 216,998 217,278 216,998 217,278
Statutory funds
Balance at end of previous year as previously reported 120,111 196,900 120,111 196,900
Adoption of AASB15 and AASB1058 - (87,151) - (87,151)
Current year movements 2,975 10,362 2,975 10,362
Statutory funds balance 123,086 120,111 123,086 120,111
Retained earnings
Balance at end of previous year 620,697 557,362 610,332 548,098
Other comprehensive income 26 225 26 225
Result 18,499 73,472 18,019 72,371
Movement and transfer in statutory funds (2,975) (10,362) (2,975) (10,362)
Total retained surplus 636,247 620,697 625,402 610,332
Accounting policy
Statutory funds
The statement of comprehensive income combines a number of funds which, under granting conditions, cannot be utilised for general purpose expenditure. These are referred to as Statutory Funds, and comprise:
• Trust funds – donations for endowments and specified purposes such as prizes and scholarships, and
• Other statutory funds – specific research grants, consultancies and other contract funds.
16. EQUITY
CONSOLIDATED PARENT ENTITY
2020 2019 2020 2019
Notes $’000 $’000 $’000 $’000
60
Annual Financial Statements
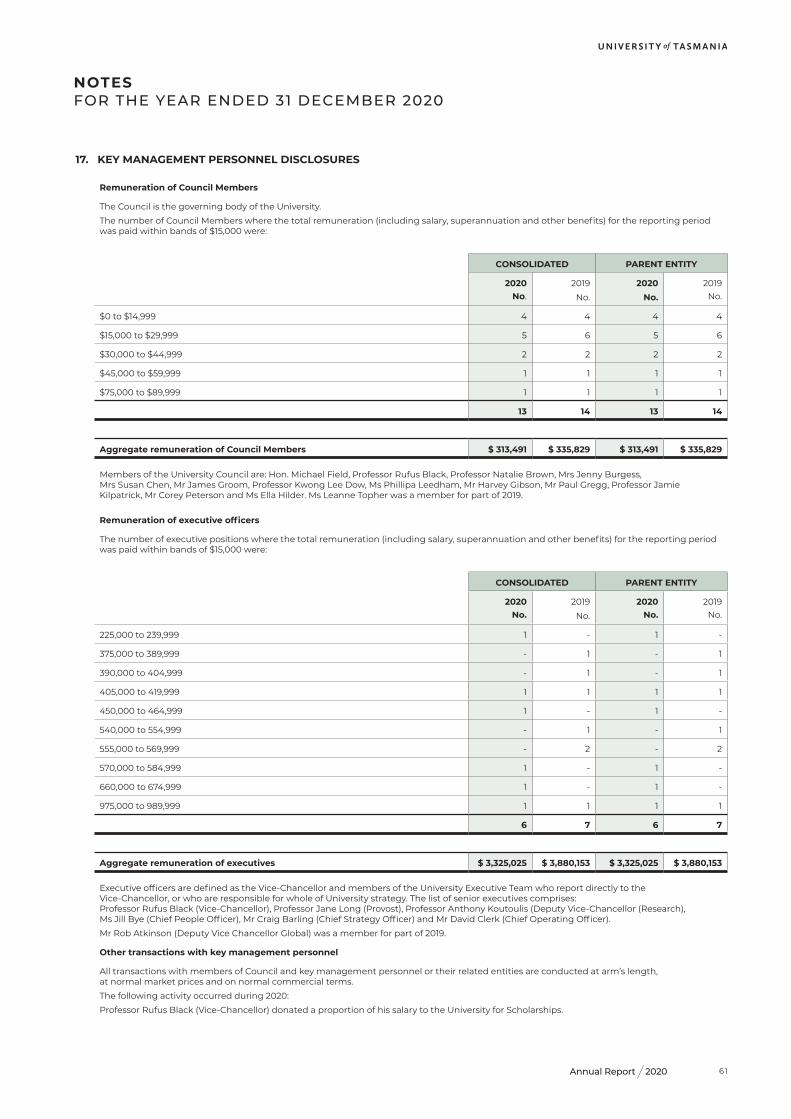
2020Annual Report
NOTES FOR THE YEAR ENDED 31 DECEMBER 2020
Remuneration of Council Members
The Council is the governing body of the University.
The number of Council Members where the total remuneration (including salary, superannuation and other benefits) for the reporting period was paid within bands of $15,000 were:
CONSOLIDATED PARENT ENTITY
2020No.
2019
No.
2020No.
2019No.
$0 to $14,999 4 4 4 4
$15,000 to $29,999 5 6 5 6
$30,000 to $44,999 2 2 2 2
$45,000 to $59,999 1 1 1 1
$75,000 to $89,999 1 1 1 1
13 14 13 14
Aggregate remuneration of Council Members $ 313,491 $ 335,829 $ 313,491 $ 335,829
Members of the University Council are: Hon. Michael Field, Professor Rufus Black, Professor Natalie Brown, Mrs Jenny Burgess, Mrs Susan Chen, Mr James Groom, Professor Kwong Lee Dow, Ms Phillipa Leedham, Mr Harvey Gibson, Mr Paul Gregg, Professor Jamie Kilpatrick, Mr Corey Peterson and Ms Ella Hilder. Ms Leanne Topher was a member for part of 2019.
Remuneration of executive officers
The number of executive positions where the total remuneration (including salary, superannuation and other benefits) for the reporting period was paid within bands of $15,000 were:
CONSOLIDATED PARENT ENTITY
2020No.
2019
No.
2020No.
2019No.
225,000 to 239,999 1 - 1 -
375,000 to 389,999 - 1 - 1
390,000 to 404,999 - 1 - 1
405,000 to 419,999 1 1 1 1
450,000 to 464,999 1 - 1 -
540,000 to 554,999 - 1 - 1
555,000 to 569,999 - 2 - 2
570,000 to 584,999 1 - 1 -
660,000 to 674,999 1 - 1 -
975,000 to 989,999 1 1 1 1
6 7 6 7
Aggregate remuneration of executives $ 3,325,025 $ 3,880,153 $ 3,325,025 $ 3,880,153
Executive officers are defined as the Vice-Chancellor and members of the University Executive Team who report directly to the Vice-Chancellor, or who are responsible for whole of University strategy. The list of senior executives comprises: Professor Rufus Black (Vice-Chancellor), Professor Jane Long (Provost), Professor Anthony Koutoulis (Deputy Vice-Chancellor (Research), Ms Jill Bye (Chief People Officer), Mr Craig Barling (Chief Strategy Officer) and Mr David Clerk (Chief Operating Officer).
Mr Rob Atkinson (Deputy Vice Chancellor Global) was a member for part of 2019.
Other transactions with key management personnel
All transactions with members of Council and key management personnel or their related entities are conducted at arm’s length, at normal market prices and on normal commercial terms.
The following activity occurred during 2020:
Professor Rufus Black (Vice-Chancellor) donated a proportion of his salary to the University for Scholarships.
17. KEY MANAGEMENT PERSONNEL DISCLOSURES
61
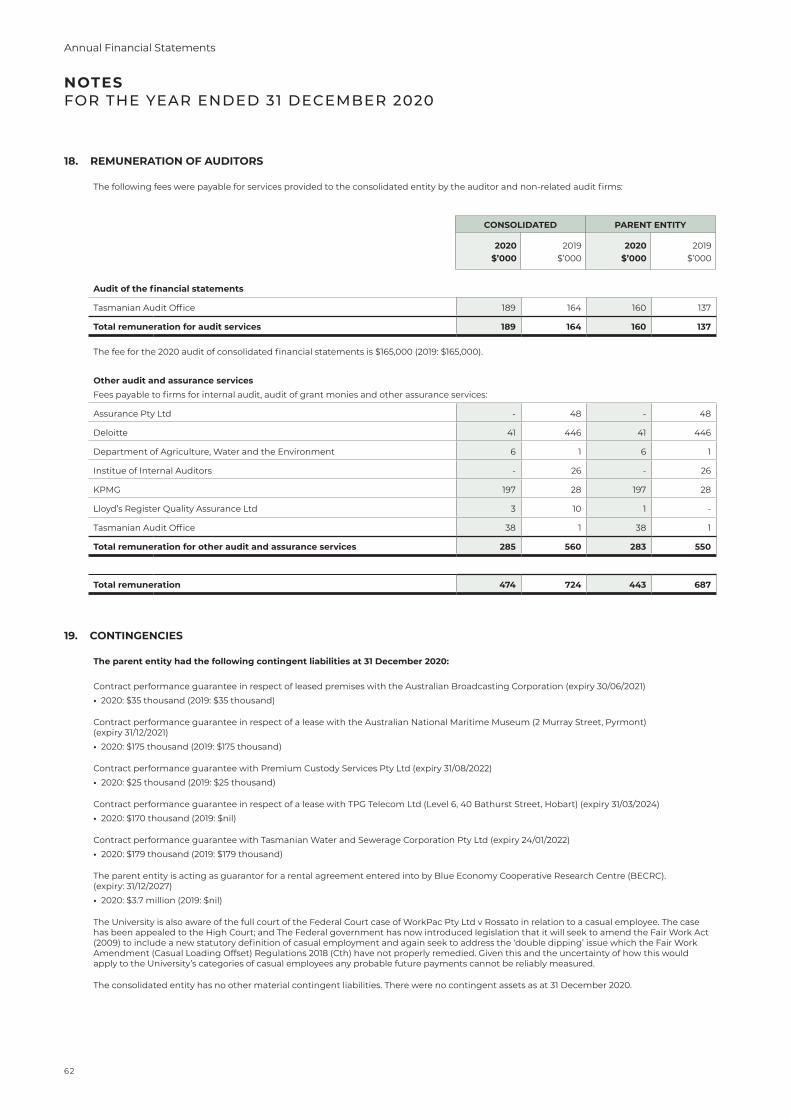
NOTES FOR THE YEAR ENDED 31 DECEMBER 2020
18. REMUNERATION OF AUDITORS
The following fees were payable for services provided to the consolidated entity by the auditor and non-related audit firms:
Audit of the financial statements
Tasmanian Audit Office 189 164 160 137
Total remuneration for audit services 189 164 160 137
The fee for the 2020 audit of consolidated financial statements is $165,000 (2019: $165,000).
Other audit and assurance servicesFees payable to firms for internal audit, audit of grant monies and other assurance services:
Assurance Pty Ltd - 48 - 48
Deloitte 41 446 41 446
Department of Agriculture, Water and the Environment 6 1 6 1
Institue of Internal Auditors - 26 - 26
KPMG 197 28 197 28
Lloyd’s Register Quality Assurance Ltd 3 10 1 -
Tasmanian Audit Office 38 1 38 1
Total remuneration for other audit and assurance services 285 560 283 550
Total remuneration 474 724 443 687
19. CONTINGENCIES
The parent entity had the following contingent liabilities at 31 December 2020:
Contract performance guarantee in respect of leased premises with the Australian Broadcasting Corporation (expiry 30/06/2021)
• 2020: $35 thousand (2019: $35 thousand)
Contract performance guarantee in respect of a lease with the Australian National Maritime Museum (2 Murray Street, Pyrmont) (expiry 31/12/2021)
• 2020: $175 thousand (2019: $175 thousand)
Contract performance guarantee with Premium Custody Services Pty Ltd (expiry 31/08/2022)
• 2020: $25 thousand (2019: $25 thousand)
Contract performance guarantee in respect of a lease with TPG Telecom Ltd (Level 6, 40 Bathurst Street, Hobart) (expiry 31/03/2024)
• 2020: $170 thousand (2019: $nil)
Contract performance guarantee with Tasmanian Water and Sewerage Corporation Pty Ltd (expiry 24/01/2022)
• 2020: $179 thousand (2019: $179 thousand)
The parent entity is acting as guarantor for a rental agreement entered into by Blue Economy Cooperative Research Centre (BECRC). (expiry: 31/12/2027)
• 2020: $3.7 million (2019: $nil)
The University is also aware of the full court of the Federal Court case of WorkPac Pty Ltd v Rossato in relation to a casual employee. The case has been appealed to the High Court; and The Federal government has now introduced legislation that it will seek to amend the Fair Work Act (2009) to include a new statutory definition of casual employment and again seek to address the ‘double dipping’ issue which the Fair Work Amendment (Casual Loading Offset) Regulations 2018 (Cth) have not properly remedied. Given this and the uncertainty of how this would apply to the University’s categories of casual employees any probable future payments cannot be reliably measured.
The consolidated entity has no other material contingent liabilities. There were no contingent assets as at 31 December 2020.
CONSOLIDATED PARENT ENTITY
2020 2019 2020 2019$’000 $’000 $’000 $’000
62
Annual Financial Statements
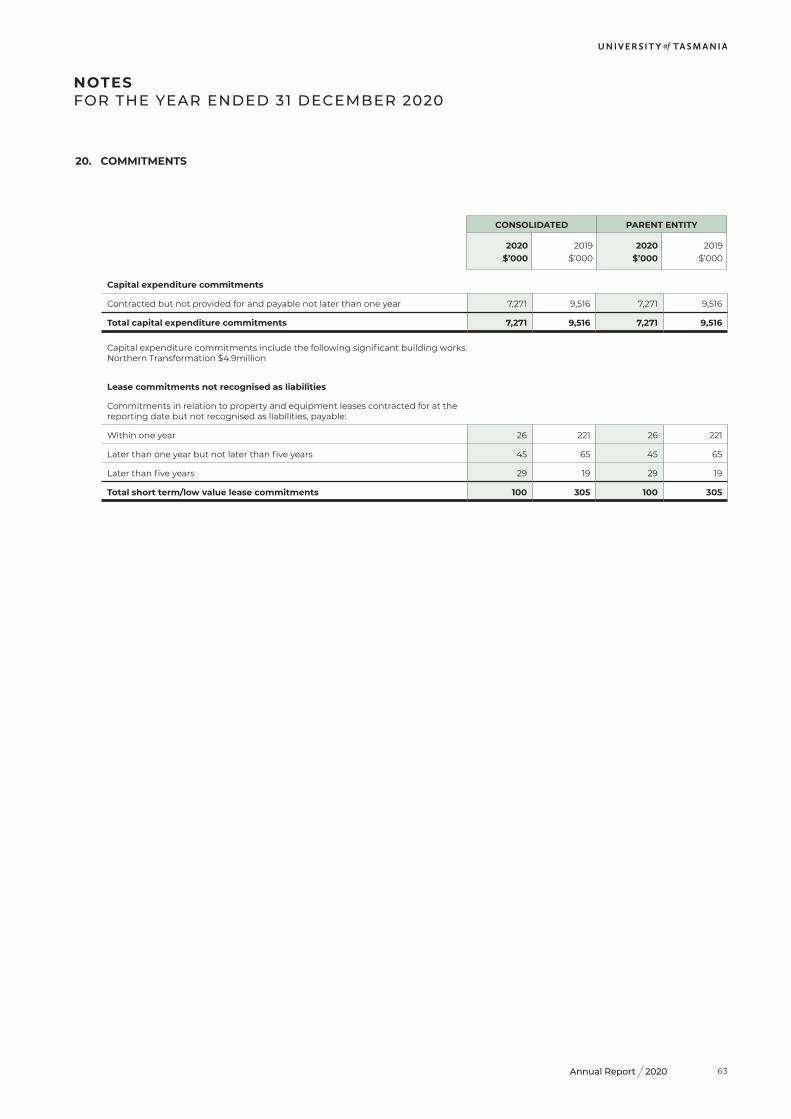
2020Annual Report
NOTES FOR THE YEAR ENDED 31 DECEMBER 2020
Capital expenditure commitments
Contracted but not provided for and payable not later than one year 7,271 9,516 7,271 9,516
Total capital expenditure commitments 7,271 9,516 7,271 9,516
Capital expenditure commitments include the following significant building works. Northern Transformation $4.9million
Lease commitments not recognised as liabilities
Commitments in relation to property and equipment leases contracted for at the reporting date but not recognised as liabilities, payable:
Within one year 26 221 26 221
Later than one year but not later than five years 45 65 45 65
Later than five years 29 19 29 19
Total short term/low value lease commitments 100 305 100 305
20. COMMITMENTS
CONSOLIDATED PARENT ENTITY
2020 2019 2020 2019$’000 $’000 $’000 $’000
63
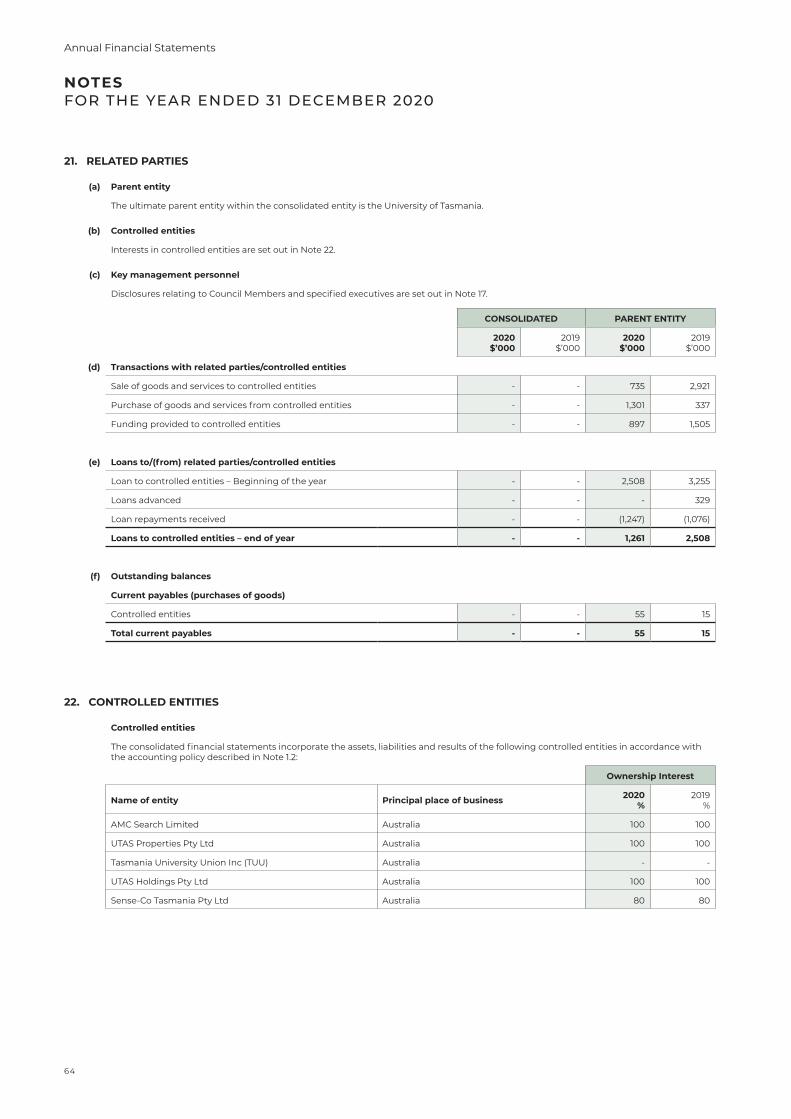
NOTES FOR THE YEAR ENDED 31 DECEMBER 2020
21. RELATED PARTIES
(a) Parent entity
The ultimate parent entity within the consolidated entity is the University of Tasmania.
(b) Controlled entities
Interests in controlled entities are set out in Note 22.
(c) Key management personnel
Disclosures relating to Council Members and specified executives are set out in Note 17.
CONSOLIDATED PARENT ENTITY
2020$’000
2019$’000
2020$’000
2019$’000
(d) Transactions with related parties/controlled entities
Sale of goods and services to controlled entities - - 735 2,921
Purchase of goods and services from controlled entities - - 1,301 337
Funding provided to controlled entities - - 897 1,505
(e) Loans to/(from) related parties/controlled entities
Loan to controlled entities – Beginning of the year - - 2,508 3,255
Loans advanced - - - 329
Loan repayments received - - (1,247) (1,076)
Loans to controlled entities – end of year - - 1,261 2,508
(f) Outstanding balances
Current payables (purchases of goods)
Controlled entities - - 55 15
Total current payables - - 55 15
22. CONTROLLED ENTITIES
Controlled entities
The consolidated financial statements incorporate the assets, liabilities and results of the following controlled entities in accordance with the accounting policy described in Note 1.2:
Ownership Interest
Name of entity Principal place of business 2020 %
2019 %
AMC Search Limited Australia 100 100
UTAS Properties Pty Ltd Australia 100 100
Tasmania University Union Inc (TUU) Australia - -
UTAS Holdings Pty Ltd Australia 100 100
Sense-Co Tasmania Pty Ltd Australia 80 80
64
Annual Financial Statements
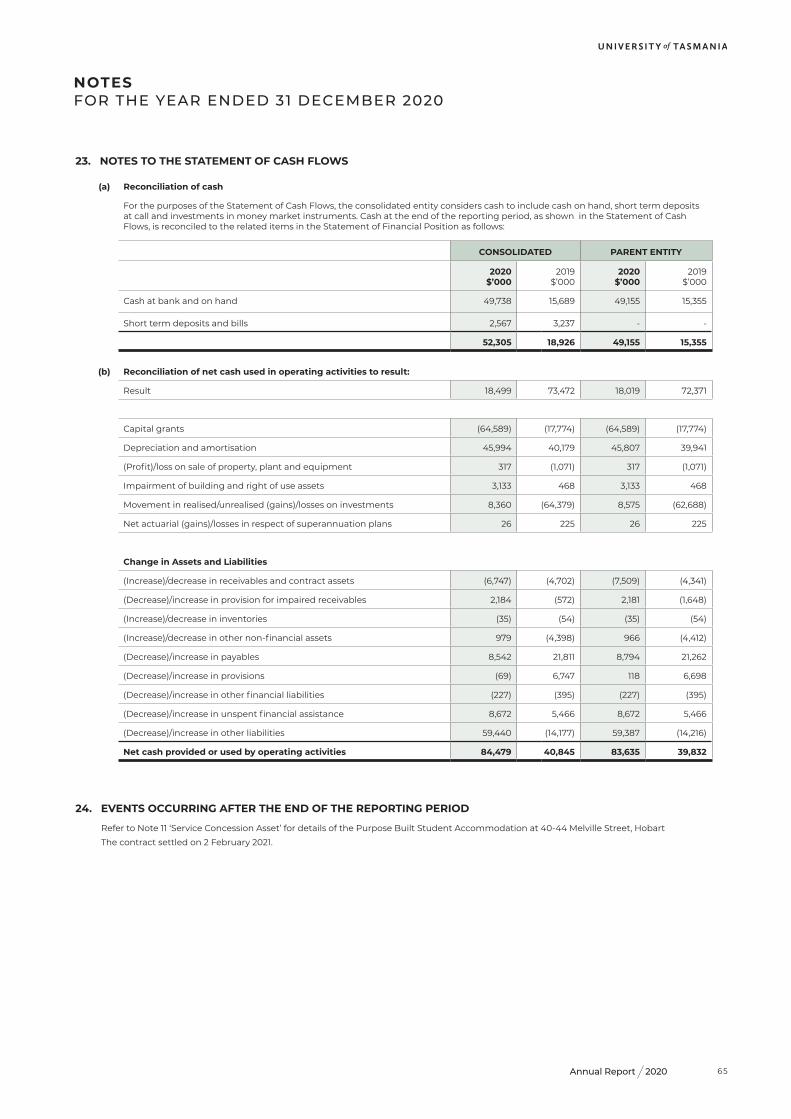
2020Annual Report
NOTES FOR THE YEAR ENDED 31 DECEMBER 2020
23. NOTES TO THE STATEMENT OF CASH FLOWS
(a) Reconciliation of cash
For the purposes of the Statement of Cash Flows, the consolidated entity considers cash to include cash on hand, short term deposits at call and investments in money market instruments. Cash at the end of the reporting period, as shown in the Statement of Cash Flows, is reconciled to the related items in the Statement of Financial Position as follows:
CONSOLIDATED PARENT ENTITY
2020$’000
2019$’000
2020$’000
2019$’000
Cash at bank and on hand 49,738 15,689 49,155 15,355
Short term deposits and bills 2,567 3,237 - -
52,305 18,926 49,155 15,355
(b) Reconciliation of net cash used in operating activities to result:
Result 18,499 73,472 18,019 72,371
Capital grants (64,589) (17,774) (64,589) (17,774)
Depreciation and amortisation 45,994 40,179 45,807 39,941
(Profit)/loss on sale of property, plant and equipment 317 (1,071) 317 (1,071)
Impairment of building and right of use assets 3,133 468 3,133 468
Movement in realised/unrealised (gains)/losses on investments 8,360 (64,379) 8,575 (62,688)
Net actuarial (gains)/losses in respect of superannuation plans 26 225 26 225
Change in Assets and Liabilities
(Increase)/decrease in receivables and contract assets (6,747) (4,702) (7,509) (4,341)
(Decrease)/increase in provision for impaired receivables 2,184 (572) 2,181 (1,648)
(Increase)/decrease in inventories (35) (54) (35) (54)
(Increase)/decrease in other non-financial assets 979 (4,398) 966 (4,412)
(Decrease)/increase in payables 8,542 21,811 8,794 21,262
(Decrease)/increase in provisions (69) 6,747 118 6,698
(Decrease)/increase in other financial liabilities (227) (395) (227) (395)
(Decrease)/increase in unspent financial assistance 8,672 5,466 8,672 5,466
(Decrease)/increase in other liabilities 59,440 (14,177) 59,387 (14,216)
Net cash provided or used by operating activities 84,479 40,845 83,635 39,832
24. EVENTS OCCURRING AFTER THE END OF THE REPORTING PERIOD
Refer to Note 11 ‘Service Concession Asset’ for details of the Purpose Built Student Accommodation at 40-44 Melville Street, Hobart
The contract settled on 2 February 2021.
65
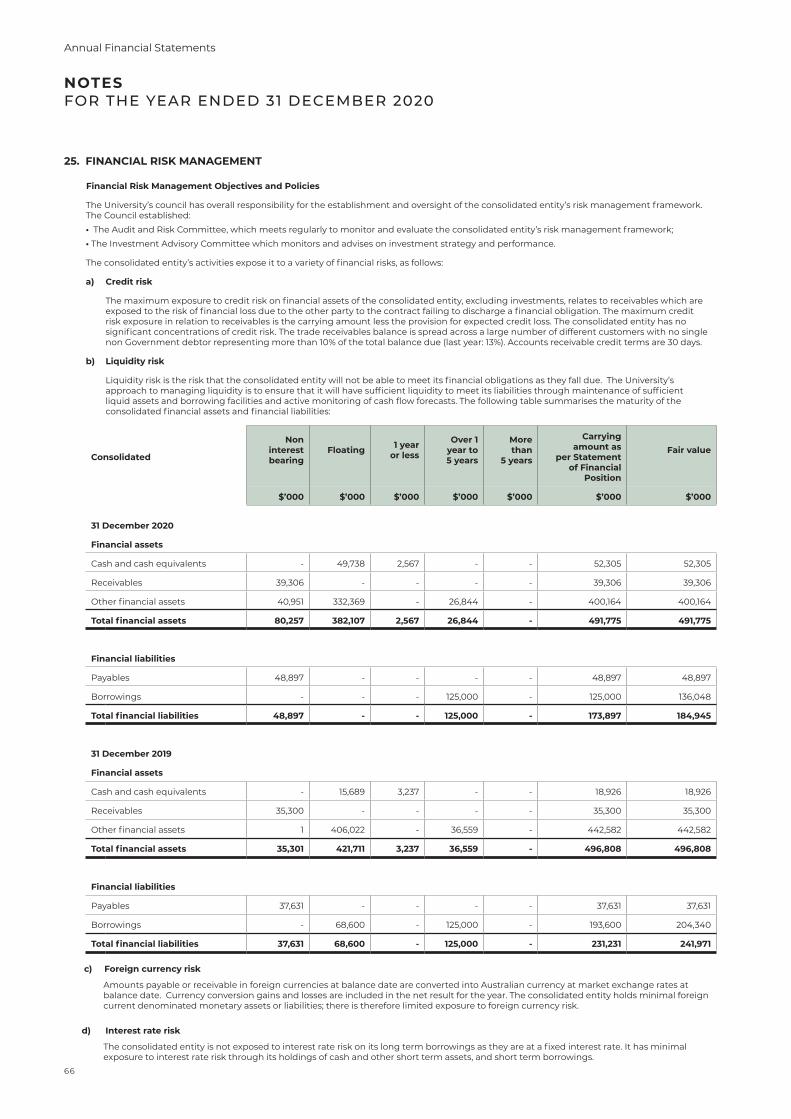
25. FINANCIAL RISK MANAGEMENT
Financial Risk Management Objectives and Policies
The University’s council has overall responsibility for the establishment and oversight of the consolidated entity’s risk management framework. The Council established:
• The Audit and Risk Committee, which meets regularly to monitor and evaluate the consolidated entity’s risk management framework;
• The Investment Advisory Committee which monitors and advises on investment strategy and performance.
The consolidated entity’s activities expose it to a variety of financial risks, as follows:
a) Credit risk
The maximum exposure to credit risk on financial assets of the consolidated entity, excluding investments, relates to receivables which are exposed to the risk of financial loss due to the other party to the contract failing to discharge a financial obligation. The maximum credit risk exposure in relation to receivables is the carrying amount less the provision for expected credit loss. The consolidated entity has no significant concentrations of credit risk. The trade receivables balance is spread across a large number of different customers with no single non Government debtor representing more than 10% of the total balance due (last year: 13%). Accounts receivable credit terms are 30 days.
b) Liquidity risk
Liquidity risk is the risk that the consolidated entity will not be able to meet its financial obligations as they fall due. The University’s approach to managing liquidity is to ensure that it will have sufficient liquidity to meet its liabilities through maintenance of sufficient liquid assets and borrowing facilities and active monitoring of cash flow forecasts. The following table summarises the maturity of the consolidated financial assets and financial liabilities:
Consolidated
Non interest bearing
Floating 1 year or less
Over 1 year to 5 years
More than
5 years
Carrying amount as
per Statement of Financial
Position
Fair value
$’000 $’000 $’000 $’000 $’000 $’000 $’000
31 December 2020
Financial assets
Cash and cash equivalents - 49,738 2,567 - - 52,305 52,305
Receivables 39,306 - - - - 39,306 39,306
Other financial assets 40,951 332,369 - 26,844 - 400,164 400,164
Total financial assets 80,257 382,107 2,567 26,844 - 491,775 491,775
Financial liabilities
Payables 48,897 - - - - 48,897 48,897
Borrowings - - - 125,000 - 125,000 136,048
Total financial liabilities 48,897 - - 125,000 - 173,897 184,945
31 December 2019
Financial assets
Cash and cash equivalents - 15,689 3,237 - - 18,926 18,926
Receivables 35,300 - - - - 35,300 35,300
Other financial assets 1 406,022 - 36,559 - 442,582 442,582
Total financial assets 35,301 421,711 3,237 36,559 - 496,808 496,808
Financial liabilities
Payables 37,631 - - - - 37,631 37,631
Borrowings - 68,600 - 125,000 - 193,600 204,340
Total financial liabilities 37,631 68,600 - 125,000 - 231,231 241,971
c) Foreign currency risk
Amounts payable or receivable in foreign currencies at balance date are converted into Australian currency at market exchange rates at balance date. Currency conversion gains and losses are included in the net result for the year. The consolidated entity holds minimal foreign current denominated monetary assets or liabilities; there is therefore limited exposure to foreign currency risk.
d) Interest rate risk
The consolidated entity is not exposed to interest rate risk on its long term borrowings as they are at a fixed interest rate. It has minimal exposure to interest rate risk through its holdings of cash and other short term assets, and short term borrowings.
NOTES FOR THE YEAR ENDED 31 DECEMBER 2020
66
Annual Financial Statements
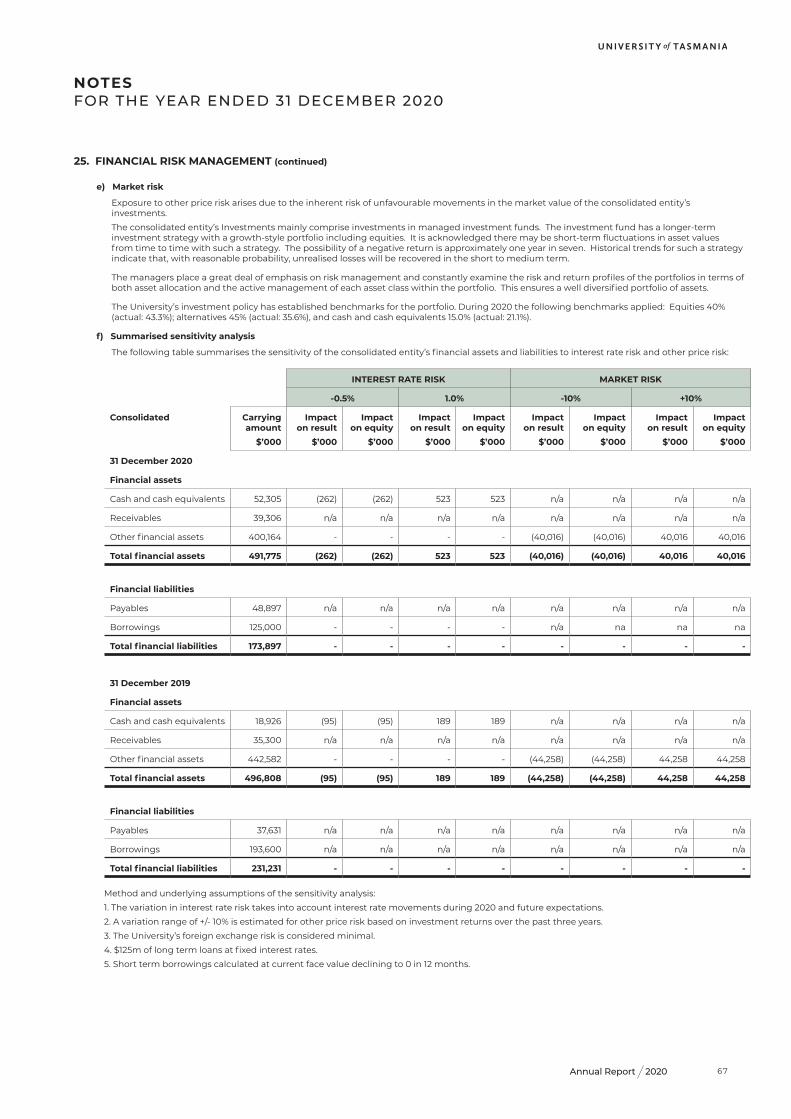
2020Annual Report
25. FINANCIAL RISK MANAGEMENT (continued)
e) Market risk
Exposure to other price risk arises due to the inherent risk of unfavourable movements in the market value of the consolidated entity’s investments.
The consolidated entity’s Investments mainly comprise investments in managed investment funds. The investment fund has a longer-term investment strategy with a growth-style portfolio including equities. It is acknowledged there may be short-term fluctuations in asset values from time to time with such a strategy. The possibility of a negative return is approximately one year in seven. Historical trends for such a strategy indicate that, with reasonable probability, unrealised losses will be recovered in the short to medium term.
The managers place a great deal of emphasis on risk management and constantly examine the risk and return profiles of the portfolios in terms of both asset allocation and the active management of each asset class within the portfolio. This ensures a well diversified portfolio of assets.
The University’s investment policy has established benchmarks for the portfolio. During 2020 the following benchmarks applied: Equities 40% (actual: 43.3%); alternatives 45% (actual: 35.6%), and cash and cash equivalents 15.0% (actual: 21.1%).
f) Summarised sensitivity analysis
The following table summarises the sensitivity of the consolidated entity’s financial assets and liabilities to interest rate risk and other price risk:
INTEREST RATE RISK MARKET RISK
-0.5% 1.0% -10% +10%
Consolidated Carrying amount
$’000
Impact on result
$’000
Impact on equity
$’000
Impact on result
$’000
Impact on equity
$’000
Impact on result
$’000
Impact on equity
$’000
Impact on result
$’000
Impact on equity
$’000
31 December 2020
Financial assets
Cash and cash equivalents 52,305 (262) (262) 523 523 n/a n/a n/a n/a
Receivables 39,306 n/a n/a n/a n/a n/a n/a n/a n/a
Other financial assets 400,164 - - - - (40,016) (40,016) 40,016 40,016
Total financial assets 491,775 (262) (262) 523 523 (40,016) (40,016) 40,016 40,016
Financial liabilities
Payables 48,897 n/a n/a n/a n/a n/a n/a n/a n/a
Borrowings 125,000 - - - - n/a na na na
Total financial liabilities 173,897 - - - - - - - -
31 December 2019
Financial assets
Cash and cash equivalents 18,926 (95) (95) 189 189 n/a n/a n/a n/a
Receivables 35,300 n/a n/a n/a n/a n/a n/a n/a n/a
Other financial assets 442,582 - - - - (44,258) (44,258) 44,258 44,258
Total financial assets 496,808 (95) (95) 189 189 (44,258) (44,258) 44,258 44,258
Financial liabilities
Payables 37,631 n/a n/a n/a n/a n/a n/a n/a n/a
Borrowings 193,600 n/a n/a n/a n/a n/a n/a n/a n/a
Total financial liabilities 231,231 - - - - - - - -
Method and underlying assumptions of the sensitivity analysis:
1. The variation in interest rate risk takes into account interest rate movements during 2020 and future expectations.
2. A variation range of +/- 10% is estimated for other price risk based on investment returns over the past three years.
3. The University’s foreign exchange risk is considered minimal.
4. $125m of long term loans at fixed interest rates.
5. Short term borrowings calculated at current face value declining to 0 in 12 months.
NOTES FOR THE YEAR ENDED 31 DECEMBER 2020
67
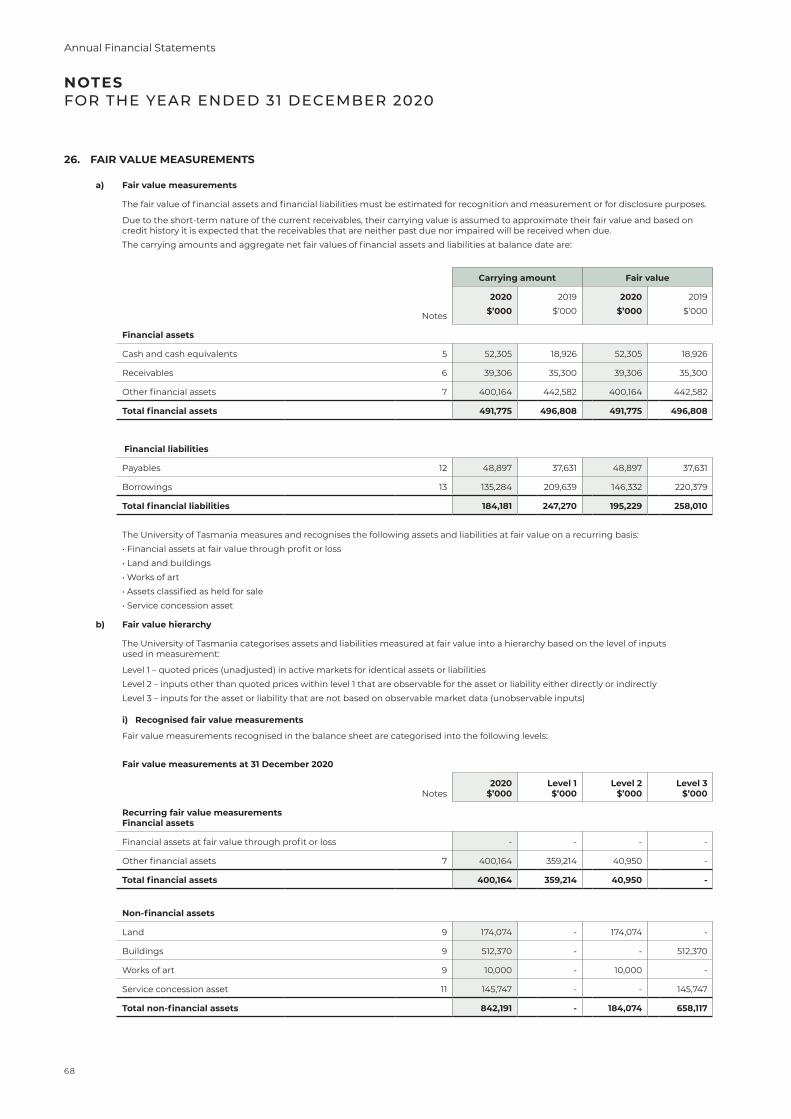
NOTES FOR THE YEAR ENDED 31 DECEMBER 2020
26. FAIR VALUE MEASUREMENTS
a) Fair value measurements
The fair value of financial assets and financial liabilities must be estimated for recognition and measurement or for disclosure purposes.
Due to the short-term nature of the current receivables, their carrying value is assumed to approximate their fair value and based on credit history it is expected that the receivables that are neither past due nor impaired will be received when due.
The carrying amounts and aggregate net fair values of financial assets and liabilities at balance date are:
Carrying amount Fair value
2020$’000
2019
$’000
2020$’000
2019
$’000Notes
Financial assets
Cash and cash equivalents 5 52,305 18,926 52,305 18,926
Receivables 6 39,306 35,300 39,306 35,300
Other financial assets 7 400,164 442,582 400,164 442,582
Total financial assets 491,775 496,808 491,775 496,808
Financial liabilities
Payables 12 48,897 37,631 48,897 37,631
Borrowings 13 135,284 209,639 146,332 220,379
Total financial liabilities 184,181 247,270 195,229 258,010
The University of Tasmania measures and recognises the following assets and liabilities at fair value on a recurring basis:
• Financial assets at fair value through profit or loss
• Land and buildings
• Works of art
• Assets classified as held for sale
• Service concession asset
b) Fair value hierarchy
The University of Tasmania categorises assets and liabilities measured at fair value into a hierarchy based on the level of inputs used in measurement:
Level 1 – quoted prices (unadjusted) in active markets for identical assets or liabilities
Level 2 – inputs other than quoted prices within level 1 that are observable for the asset or liability either directly or indirectly
Level 3 – inputs for the asset or liability that are not based on observable market data (unobservable inputs)
i) Recognised fair value measurements
Fair value measurements recognised in the balance sheet are categorised into the following levels:
Fair value measurements at 31 December 2020
Notes2020
$’000Level 1 $’000
Level 2 $’000
Level 3 $’000
Recurring fair value measurements Financial assets
Financial assets at fair value through profit or loss - - - -
Other financial assets 7 400,164 359,214 40,950 -
Total financial assets 400,164 359,214 40,950 -
Non-financial assets
Land 9 174,074 - 174,074 -
Buildings 9 512,370 - - 512,370
Works of art 9 10,000 - 10,000 -
Service concession asset 11 145,747 - - 145,747
Total non-financial assets 842,191 - 184,074 658,117
68
Annual Financial Statements
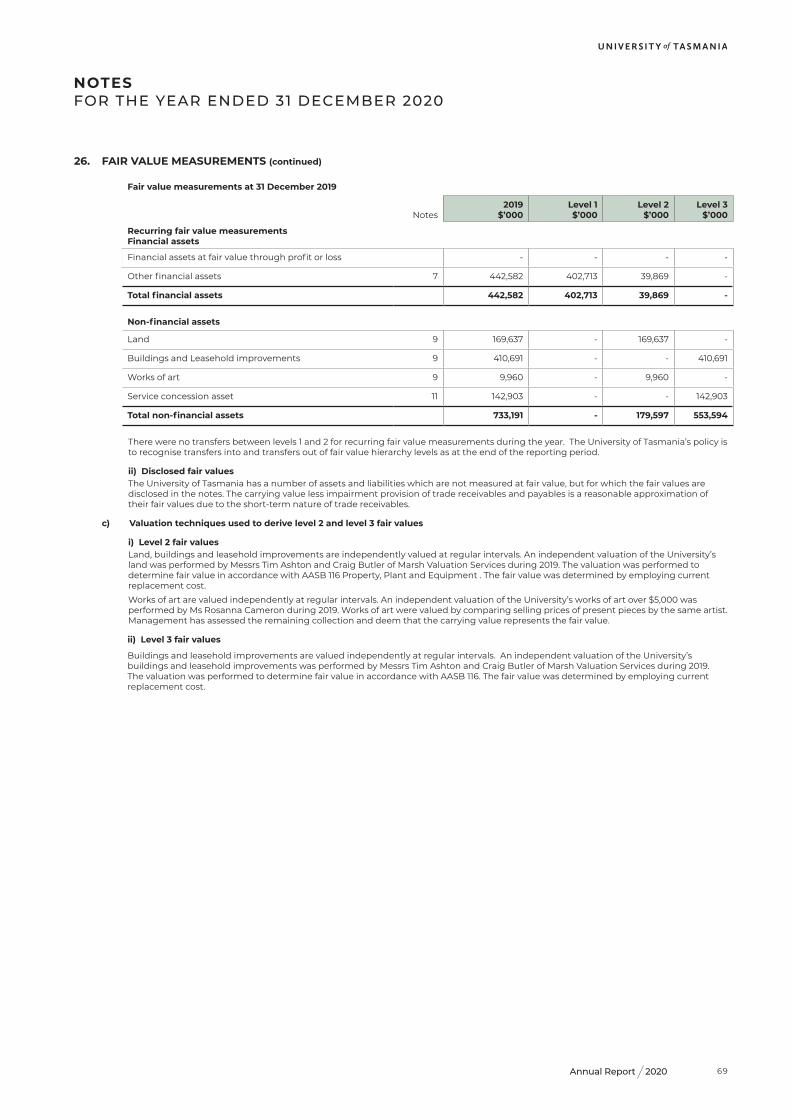
2020Annual Report
26. FAIR VALUE MEASUREMENTS (continued)
Fair value measurements at 31 December 2019
Notes2019
$’000Level 1 $’000
Level 2 $’000
Level 3 $’000
Recurring fair value measurements Financial assets
Financial assets at fair value through profit or loss - - - -
Other financial assets 7 442,582 402,713 39,869 -
Total financial assets 442,582 402,713 39,869 -
Non-financial assets
Land 9 169,637 - 169,637 -
Buildings and Leasehold improvements 9 410,691 - - 410,691
Works of art 9 9,960 - 9,960 -
Service concession asset 11 142,903 - - 142,903
Total non-financial assets 733,191 - 179,597 553,594
There were no transfers between levels 1 and 2 for recurring fair value measurements during the year. The University of Tasmania’s policy is to recognise transfers into and transfers out of fair value hierarchy levels as at the end of the reporting period.
ii) Disclosed fair valuesThe University of Tasmania has a number of assets and liabilities which are not measured at fair value, but for which the fair values are disclosed in the notes. The carrying value less impairment provision of trade receivables and payables is a reasonable approximation of their fair values due to the short-term nature of trade receivables.
c) Valuation techniques used to derive level 2 and level 3 fair values
i) Level 2 fair valuesLand, buildings and leasehold improvements are independently valued at regular intervals. An independent valuation of the University’s land was performed by Messrs Tim Ashton and Craig Butler of Marsh Valuation Services during 2019. The valuation was performed to determine fair value in accordance with AASB 116 Property, Plant and Equipment . The fair value was determined by employing current replacement cost.
Works of art are valued independently at regular intervals. An independent valuation of the University’s works of art over $5,000 was performed by Ms Rosanna Cameron during 2019. Works of art were valued by comparing selling prices of present pieces by the same artist. Management has assessed the remaining collection and deem that the carrying value represents the fair value.
ii) Level 3 fair values
Buildings and leasehold improvements are valued independently at regular intervals. An independent valuation of the University’s buildings and leasehold improvements was performed by Messrs Tim Ashton and Craig Butler of Marsh Valuation Services during 2019. The valuation was performed to determine fair value in accordance with AASB 116. The fair value was determined by employing current replacement cost.
NOTES FOR THE YEAR ENDED 31 DECEMBER 2020
69
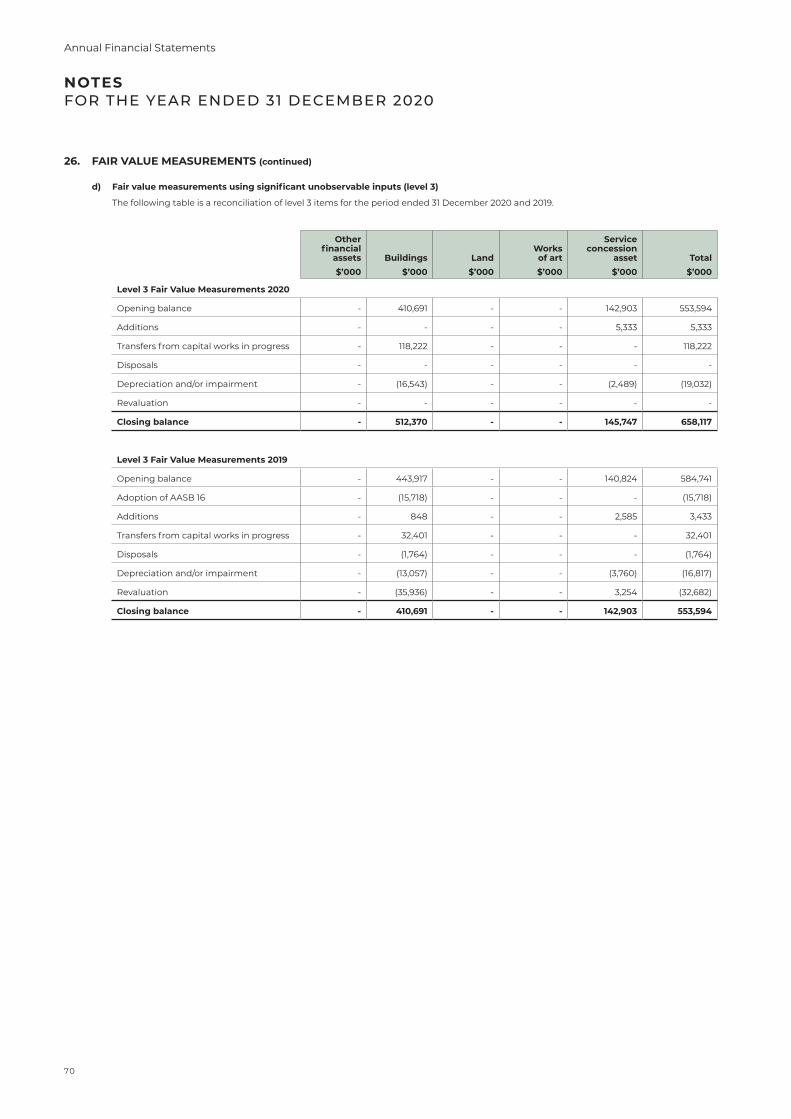
NOTES FOR THE YEAR ENDED 31 DECEMBER 2020
26. FAIR VALUE MEASUREMENTS (continued)
d) Fair value measurements using significant unobservable inputs (level 3)
The following table is a reconciliation of level 3 items for the period ended 31 December 2020 and 2019.
Other financial
assets$’000
Buildings$’000
Land$’000
Works of art$’000
Service concession
asset $’000
Total$’000
Level 3 Fair Value Measurements 2020
Opening balance - 410,691 - - 142,903 553,594
Additions - - - - 5,333 5,333
Transfers from capital works in progress - 118,222 - - - 118,222
Disposals - - - - - -
Depreciation and/or impairment - (16,543) - - (2,489) (19,032)
Revaluation - - - - - -
Closing balance - 512,370 - - 145,747 658,117
Level 3 Fair Value Measurements 2019
Opening balance - 443,917 - - 140,824 584,741
Adoption of AASB 16 - (15,718) - - - (15,718)
Additions - 848 - - 2,585 3,433
Transfers from capital works in progress - 32,401 - - - 32,401
Disposals - (1,764) - - - (1,764)
Depreciation and/or impairment - (13,057) - - (3,760) (16,817)
Revaluation - (35,936) - - 3,254 (32,682)
Closing balance - 410,691 - - 142,903 553,594
70
Annual Financial Statements
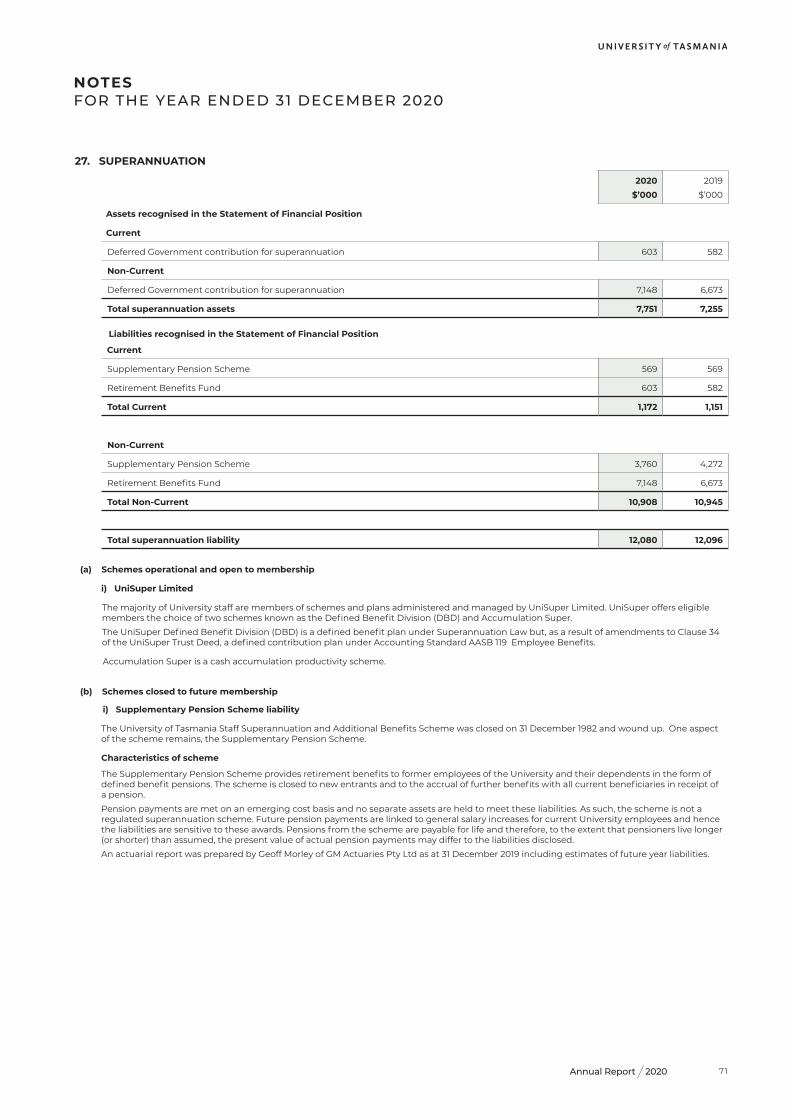
2020Annual Report
NOTES FOR THE YEAR ENDED 31 DECEMBER 2020
27. SUPERANNUATION
2020$’000
2019
$’000
Assets recognised in the Statement of Financial Position
Current
Deferred Government contribution for superannuation 603 582
Non-Current
Deferred Government contribution for superannuation 7,148 6,673
Total superannuation assets 7,751 7,255
Liabilities recognised in the Statement of Financial Position
Current
Supplementary Pension Scheme 569 569
Retirement Benefits Fund 603 582
Total Current 1,172 1,151
Non-Current
Supplementary Pension Scheme 3,760 4,272
Retirement Benefits Fund 7,148 6,673
Total Non-Current 10,908 10,945
Total superannuation liability 12,080 12,096
(a) Schemes operational and open to membership
i) UniSuper Limited
The majority of University staff are members of schemes and plans administered and managed by UniSuper Limited. UniSuper offers eligible members the choice of two schemes known as the Defined Benefit Division (DBD) and Accumulation Super.
The UniSuper Defined Benefit Division (DBD) is a defined benefit plan under Superannuation Law but, as a result of amendments to Clause 34 of the UniSuper Trust Deed, a defined contribution plan under Accounting Standard AASB 119 Employee Benefits.
Accumulation Super is a cash accumulation productivity scheme.
(b) Schemes closed to future membership
i) Supplementary Pension Scheme liability
The University of Tasmania Staff Superannuation and Additional Benefits Scheme was closed on 31 December 1982 and wound up. One aspect of the scheme remains, the Supplementary Pension Scheme.
Characteristics of scheme
The Supplementary Pension Scheme provides retirement benefits to former employees of the University and their dependents in the form of defined benefit pensions. The scheme is closed to new entrants and to the accrual of further benefits with all current beneficiaries in receipt of a pension.
Pension payments are met on an emerging cost basis and no separate assets are held to meet these liabilities. As such, the scheme is not a regulated superannuation scheme. Future pension payments are linked to general salary increases for current University employees and hence the liabilities are sensitive to these awards. Pensions from the scheme are payable for life and therefore, to the extent that pensioners live longer (or shorter) than assumed, the present value of actual pension payments may differ to the liabilities disclosed.
An actuarial report was prepared by Geoff Morley of GM Actuaries Pty Ltd as at 31 December 2019 including estimates of future year liabilities.
71
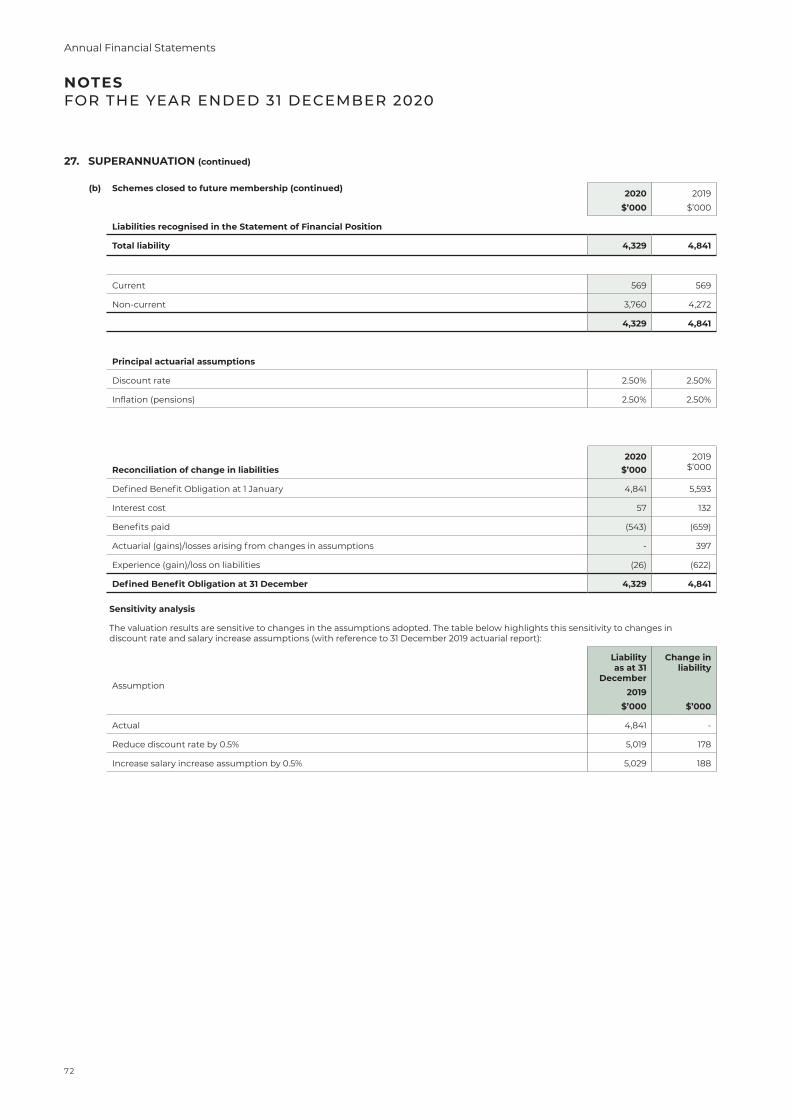
NOTES FOR THE YEAR ENDED 31 DECEMBER 2020
27. SUPERANNUATION (continued)
(b) Schemes closed to future membership (continued) 2020$’000
2019
$’000
Liabilities recognised in the Statement of Financial Position
Total liability 4,329 4,841
Current 569 569
Non-current 3,760 4,272
4,329 4,841
Principal actuarial assumptions
Discount rate 2.50% 2.50%
Inflation (pensions) 2.50% 2.50%
Reconciliation of change in liabilities2020
$’0002019
$’000
Defined Benefit Obligation at 1 January 4,841 5,593
Interest cost 57 132
Benefits paid (543) (659)
Actuarial (gains)/losses arising from changes in assumptions - 397
Experience (gain)/loss on liabilities (26) (622)
Defined Benefit Obligation at 31 December 4,329 4,841
Sensitivity analysis
The valuation results are sensitive to changes in the assumptions adopted. The table below highlights this sensitivity to changes in discount rate and salary increase assumptions (with reference to 31 December 2019 actuarial report):
Assumption
Liability as at 31
December2019
$’000
Change in liability
$’000
Actual 4,841 -
Reduce discount rate by 0.5% 5,019 178
Increase salary increase assumption by 0.5% 5,029 188
72
Annual Financial Statements
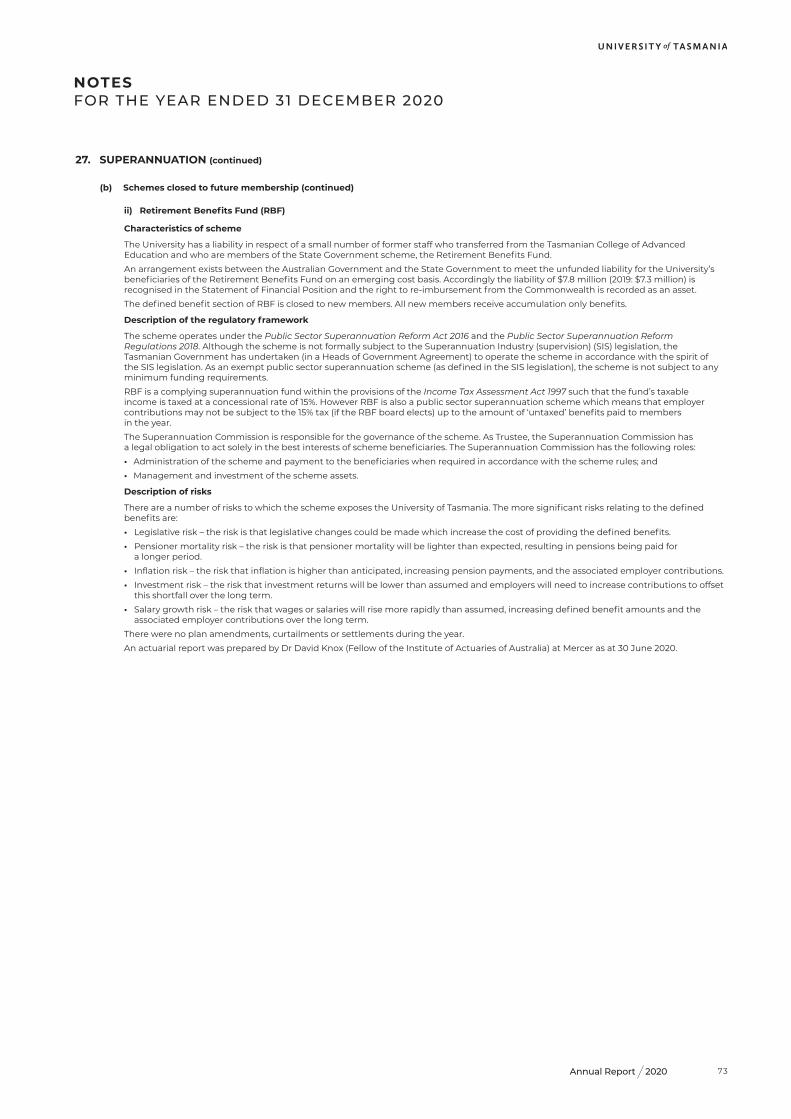
2020Annual Report
NOTES FOR THE YEAR ENDED 31 DECEMBER 2020
ii) Retirement Benefits Fund (RBF)
Characteristics of scheme
The University has a liability in respect of a small number of former staff who transferred from the Tasmanian College of Advanced Education and who are members of the State Government scheme, the Retirement Benefits Fund.
An arrangement exists between the Australian Government and the State Government to meet the unfunded liability for the University’s beneficiaries of the Retirement Benefits Fund on an emerging cost basis. Accordingly the liability of $7.8 million (2019: $7.3 million) is recognised in the Statement of Financial Position and the right to re-imbursement from the Commonwealth is recorded as an asset.
The defined benefit section of RBF is closed to new members. All new members receive accumulation only benefits.
Description of the regulatory framework
The scheme operates under the Public Sector Superannuation Reform Act 2016 and the Public Sector Superannuation Reform Regulations 2018. Although the scheme is not formally subject to the Superannuation Industry (supervision) (SIS) legislation, the Tasmanian Government has undertaken (in a Heads of Government Agreement) to operate the scheme in accordance with the spirit of the SIS legislation. As an exempt public sector superannuation scheme (as defined in the SIS legislation), the scheme is not subject to any minimum funding requirements.
RBF is a complying superannuation fund within the provisions of the Income Tax Assessment Act 1997 such that the fund’s taxable income is taxed at a concessional rate of 15%. However RBF is also a public sector superannuation scheme which means that employer contributions may not be subject to the 15% tax (if the RBF board elects) up to the amount of ‘untaxed’ benefits paid to members in the year.
The Superannuation Commission is responsible for the governance of the scheme. As Trustee, the Superannuation Commission has a legal obligation to act solely in the best interests of scheme beneficiaries. The Superannuation Commission has the following roles:
• Administration of the scheme and payment to the beneficiaries when required in accordance with the scheme rules; and
• Management and investment of the scheme assets.
Description of risks
There are a number of risks to which the scheme exposes the University of Tasmania. The more significant risks relating to the defined benefits are:
• Legislative risk – the risk is that legislative changes could be made which increase the cost of providing the defined benefits.
• Pensioner mortality risk – the risk is that pensioner mortality will be lighter than expected, resulting in pensions being paid for a longer period.
• Inflation risk – the risk that inflation is higher than anticipated, increasing pension payments, and the associated employer contributions.
• Investment risk – the risk that investment returns will be lower than assumed and employers will need to increase contributions to offset this shortfall over the long term.
• Salary growth risk – the risk that wages or salaries will rise more rapidly than assumed, increasing defined benefit amounts and the associated employer contributions over the long term.
There were no plan amendments, curtailments or settlements during the year.
An actuarial report was prepared by Dr David Knox (Fellow of the Institute of Actuaries of Australia) at Mercer as at 30 June 2020.
27. SUPERANNUATION (continued)
(b) Schemes closed to future membership (continued)
73
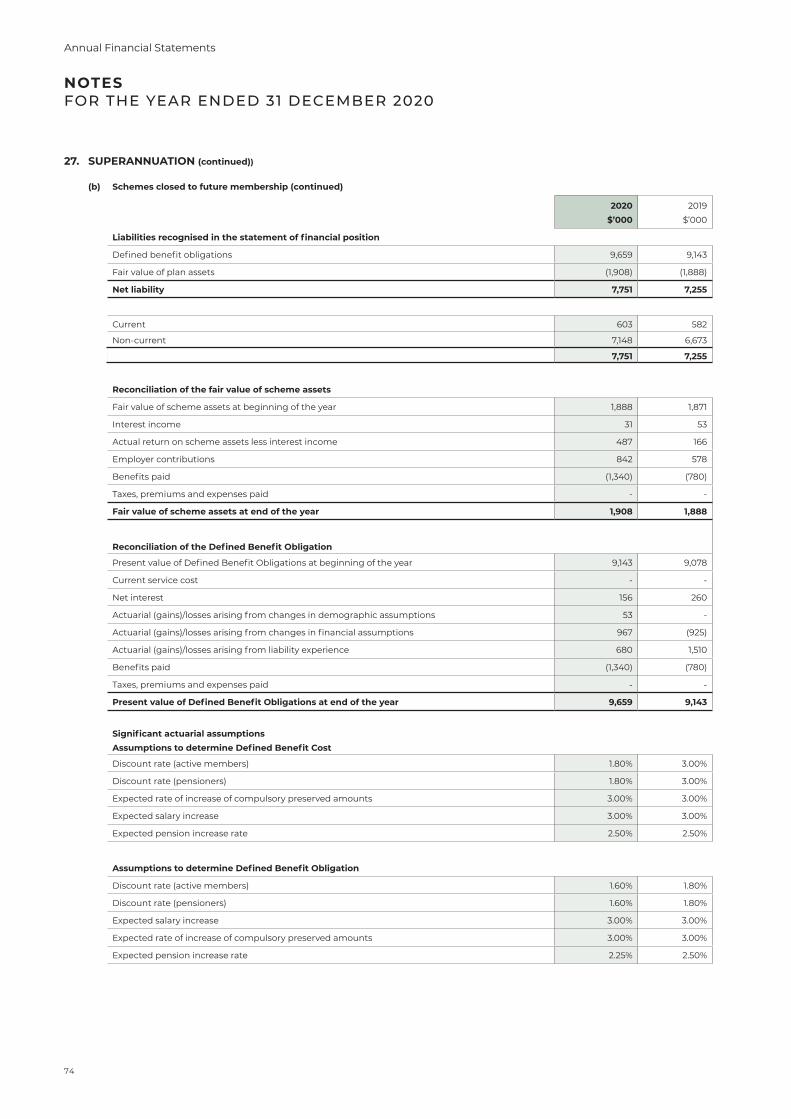
NOTES FOR THE YEAR ENDED 31 DECEMBER 2020
27. SUPERANNUATION (continued))
(b) Schemes closed to future membership (continued)
2020$’000
2019
$’000
Liabilities recognised in the statement of financial position
Defined benefit obligations 9,659 9,143
Fair value of plan assets (1,908) (1,888)
Net liability 7,751 7,255
Current 603 582
Non-current 7,148 6,673
7,751 7,255
Reconciliation of the fair value of scheme assets
Fair value of scheme assets at beginning of the year 1,888 1,871
Interest income 31 53
Actual return on scheme assets less interest income 487 166
Employer contributions 842 578
Benefits paid (1,340) (780)
Taxes, premiums and expenses paid - -
Fair value of scheme assets at end of the year 1,908 1,888
Reconciliation of the Defined Benefit Obligation
Present value of Defined Benefit Obligations at beginning of the year 9,143 9,078
Current service cost - -
Net interest 156 260
Actuarial (gains)/losses arising from changes in demographic assumptions 53 -
Actuarial (gains)/losses arising from changes in financial assumptions 967 (925)
Actuarial (gains)/losses arising from liability experience 680 1,510
Benefits paid (1,340) (780)
Taxes, premiums and expenses paid - -
Present value of Defined Benefit Obligations at end of the year 9,659 9,143
Significant actuarial assumptions Assumptions to determine Defined Benefit Cost
Discount rate (active members) 1.80% 3.00%
Discount rate (pensioners) 1.80% 3.00%
Expected rate of increase of compulsory preserved amounts 3.00% 3.00%
Expected salary increase 3.00% 3.00%
Expected pension increase rate 2.50% 2.50%
Assumptions to determine Defined Benefit Obligation
Discount rate (active members) 1.60% 1.80%
Discount rate (pensioners) 1.60% 1.80%
Expected salary increase 3.00% 3.00%
Expected rate of increase of compulsory preserved amounts 3.00% 3.00%
Expected pension increase rate 2.25% 2.50%
74
Annual Financial Statements
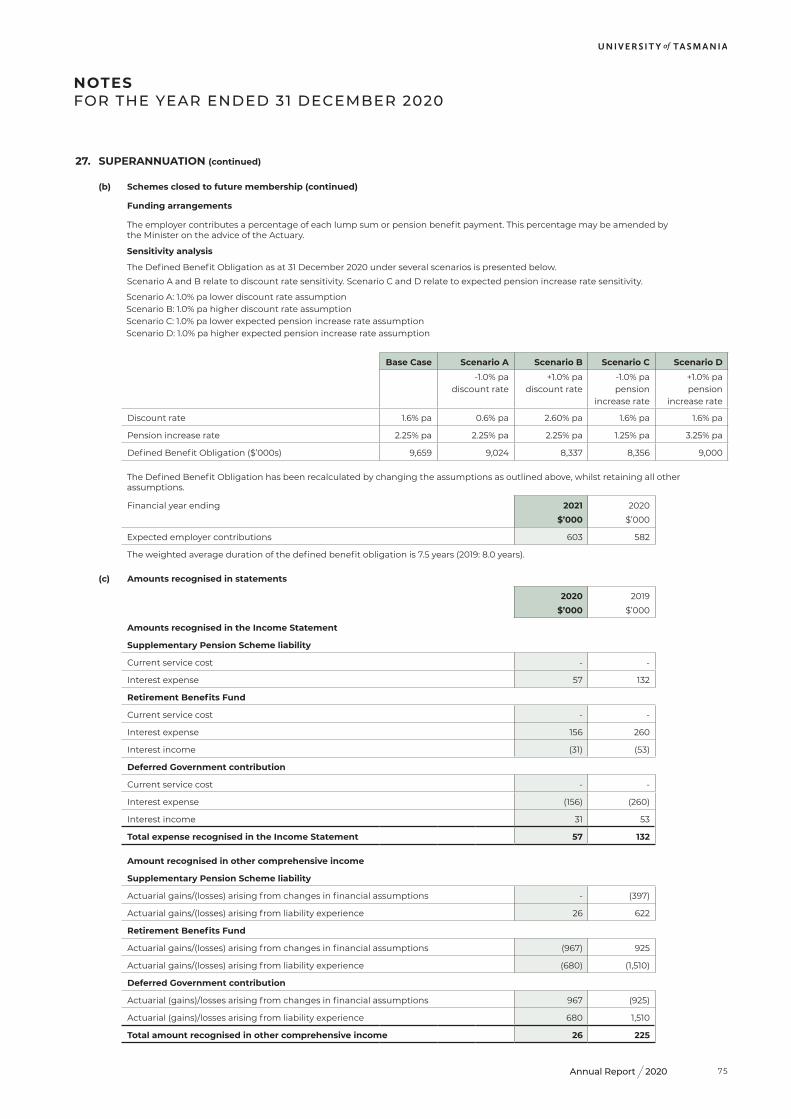
2020Annual Report
27. SUPERANNUATION (continued)
(b) Schemes closed to future membership (continued)
Funding arrangements
The employer contributes a percentage of each lump sum or pension benefit payment. This percentage may be amended by the Minister on the advice of the Actuary.
Sensitivity analysis
The Defined Benefit Obligation as at 31 December 2020 under several scenarios is presented below.
Scenario A and B relate to discount rate sensitivity. Scenario C and D relate to expected pension increase rate sensitivity.
Scenario A: 1.0% pa lower discount rate assumptionScenario B: 1.0% pa higher discount rate assumptionScenario C: 1.0% pa lower expected pension increase rate assumptionScenario D: 1.0% pa higher expected pension increase rate assumption
Base Case Scenario A Scenario B Scenario C Scenario D
-1.0% pa +1.0% pa -1.0% pa +1.0% padiscount rate discount rate pension pension
increase rate increase rate
Discount rate 1.6% pa 0.6% pa 2.60% pa 1.6% pa 1.6% pa
Pension increase rate 2.25% pa 2.25% pa 2.25% pa 1.25% pa 3.25% pa
Defined Benefit Obligation ($’000s) 9,659 9,024 8,337 8,356 9,000
The Defined Benefit Obligation has been recalculated by changing the assumptions as outlined above, whilst retaining all other assumptions.
Financial year ending 2021$’000
2020
$’000
Expected employer contributions 603 582
The weighted average duration of the defined benefit obligation is 7.5 years (2019: 8.0 years).
(c) Amounts recognised in statements
2020$’000
2019
$’000
Amounts recognised in the Income Statement
Supplementary Pension Scheme liability
Current service cost - -
Interest expense 57 132
Retirement Benefits Fund
Current service cost - -
Interest expense 156 260
Interest income (31) (53)
Deferred Government contribution
Current service cost - -
Interest expense (156) (260)
Interest income 31 53
Total expense recognised in the Income Statement 57 132
Amount recognised in other comprehensive income
Supplementary Pension Scheme liability
Actuarial gains/(losses) arising from changes in financial assumptions - (397)
Actuarial gains/(losses) arising from liability experience 26 622
Retirement Benefits Fund
Actuarial gains/(losses) arising from changes in financial assumptions (967) 925
Actuarial gains/(losses) arising from liability experience (680) (1,510)
Deferred Government contribution
Actuarial (gains)/losses arising from changes in financial assumptions 967 (925)
Actuarial (gains)/losses arising from liability experience 680 1,510
Total amount recognised in other comprehensive income 26 225
NOTES FOR THE YEAR ENDED 31 DECEMBER 2020
75
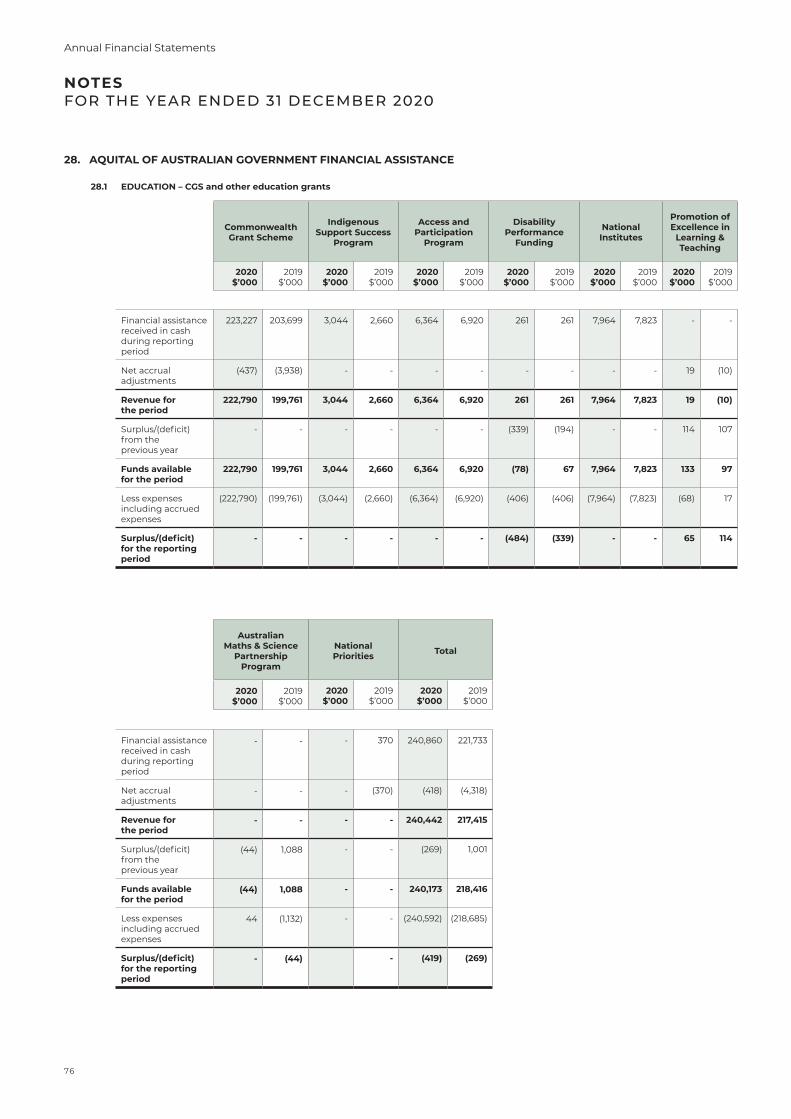
Australian Maths & Science
Partnership Program
National Priorities Total
2020 $’000
2019 $’000
2020 $’000
2019 $’000
2020 $’000
2019 $’000
Financial assistance received in cash during reporting period
- - - 370 240,860 221,733
Net accrual adjustments
- - - (370) (418) (4,318)
Revenue for the period
- - - - 240,442 217,415
Surplus/(deficit) from the previous year
(44) 1,088 - - (269) 1,001
Funds available for the period
(44) 1,088 - - 240,173 218,416
Less expenses including accrued expenses
44 (1,132) - - (240,592) (218,685)
Surplus/(deficit) for the reporting period
- (44) - (419) (269)
28.1 EDUCATION – CGS and other education grants
Commonwealth Grant Scheme
Indigenous Support Success
Program
Access and Participation
Program
Disability Performance
Funding
National Institutes
Promotion of Excellence in
Learning & Teaching
2020 $’000
2019 $’000
2020 $’000
2019 $’000
2020 $’000
2019 $’000
2020 $’000
2019 $’000
2020 $’000
2019 $’000
2020 $’000
2019 $’000
Financial assistance received in cash during reporting period
223,227 203,699 3,044 2,660 6,364 6,920 261 261 7,964 7,823 - -
Net accrual adjustments
(437) (3,938) - - - - - - - - 19 (10)
Revenue for the period
222,790 199,761 3,044 2,660 6,364 6,920 261 261 7,964 7,823 19 (10)
Surplus/(deficit) from the previous year
- - - - - - (339) (194) - - 114 107
Funds available for the period
222,790 199,761 3,044 2,660 6,364 6,920 (78) 67 7,964 7,823 133 97
Less expenses including accrued expenses
(222,790) (199,761) (3,044) (2,660) (6,364) (6,920) (406) (406) (7,964) (7,823) (68) 17
Surplus/(deficit) for the reporting period
- - - - - - (484) (339) - - 65 114
28. AQUITAL OF AUSTRALIAN GOVERNMENT FINANCIAL ASSISTANCE
NOTES FOR THE YEAR ENDED 31 DECEMBER 2020
76
Annual Financial Statements
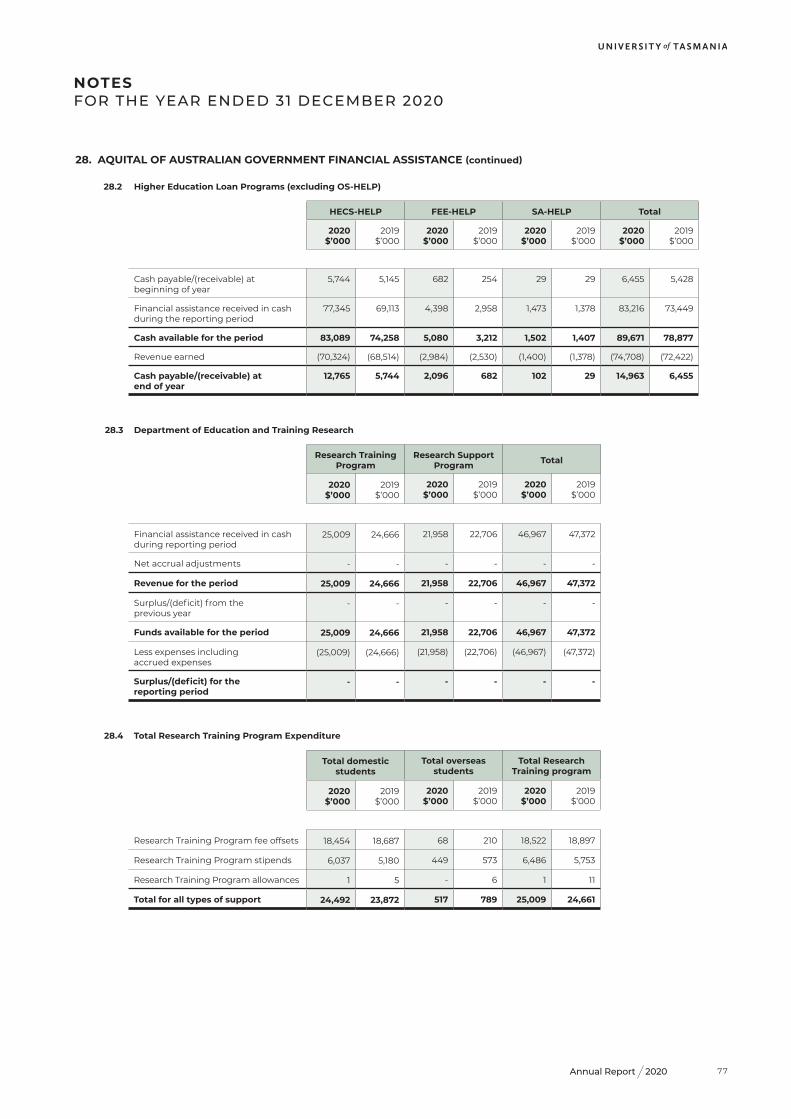
2020Annual Report
28.2 Higher Education Loan Programs (excluding OS-HELP)
HECS-HELP FEE-HELP SA-HELP Total
2020 $’000
2019 $’000
2020 $’000
2019 $’000
2020 $’000
2019 $’000
2020 $’000
2019 $’000
Cash payable/(receivable) at beginning of year
5,744 5,145 682 254 29 29 6,455 5,428
Financial assistance received in cash during the reporting period
77,345 69,113 4,398 2,958 1,473 1,378 83,216 73,449
Cash available for the period 83,089 74,258 5,080 3,212 1,502 1,407 89,671 78,877
Revenue earned (70,324) (68,514) (2,984) (2,530) (1,400) (1,378) (74,708) (72,422)
Cash payable/(receivable) at end of year
12,765 5,744 2,096 682 102 29 14,963 6,455
28. AQUITAL OF AUSTRALIAN GOVERNMENT FINANCIAL ASSISTANCE (continued)
NOTES FOR THE YEAR ENDED 31 DECEMBER 2020
28.3 Department of Education and Training Research
Research Training Program
Research Support Program Total
2020 $’000
2019 $’000
2020 $’000
2019 $’000
2020 $’000
2019 $’000
Financial assistance received in cash during reporting period
25,009 24,666 21,958 22,706 46,967 47,372
Net accrual adjustments - - - - - -
Revenue for the period 25,009 24,666 21,958 22,706 46,967 47,372
Surplus/(deficit) from the previous year
- - - - - -
Funds available for the period 25,009 24,666 21,958 22,706 46,967 47,372
Less expenses including accrued expenses
(25,009) (24,666) (21,958) (22,706) (46,967) (47,372)
Surplus/(deficit) for the reporting period
- - - - - -
28.4 Total Research Training Program Expenditure
Total domestic students
Total overseas students
Total Research Training program
2020 $’000
2019 $’000
2020 $’000
2019 $’000
2020 $’000
2019 $’000
Research Training Program fee offsets 18,454 18,687 68 210 18,522 18,897
Research Training Program stipends 6,037 5,180 449 573 6,486 5,753
Research Training Program allowances 1 5 - 6 1 11
Total for all types of support 24,492 23,872 517 789 25,009 24,661
77
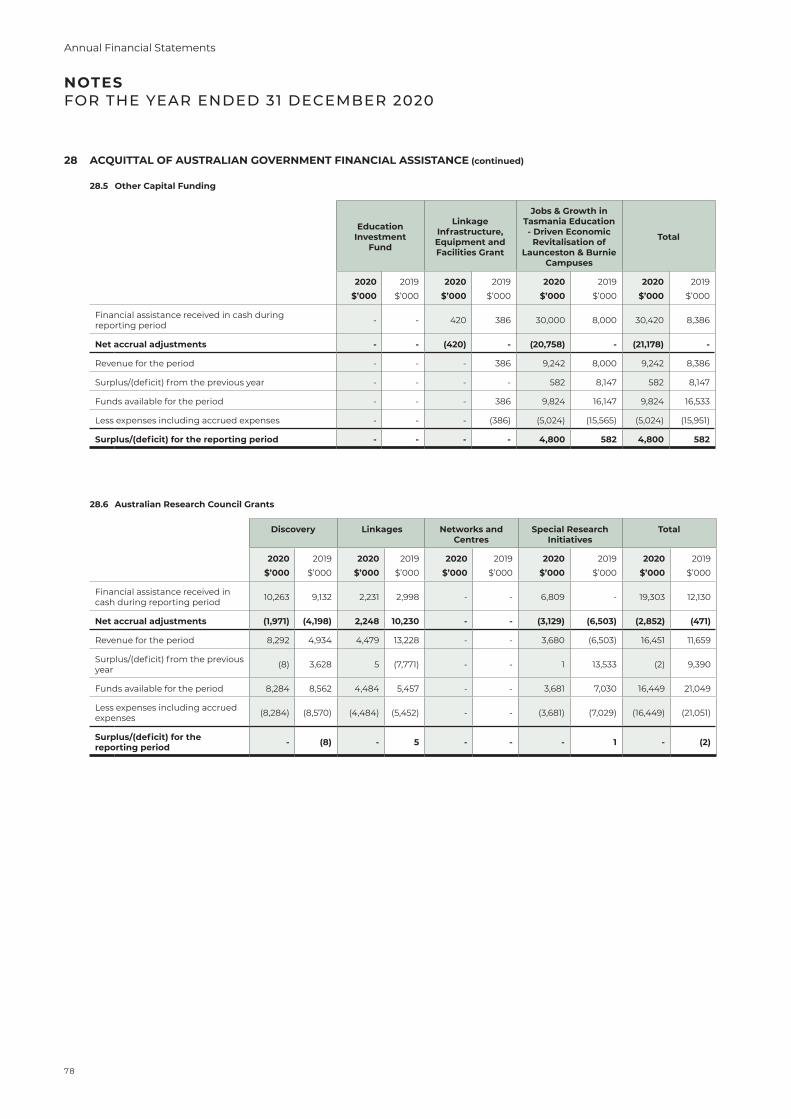
NOTES FOR THE YEAR ENDED 31 DECEMBER 2020
28 ACQUITTAL OF AUSTRALIAN GOVERNMENT FINANCIAL ASSISTANCE (continued)
28.5 Other Capital Funding
Education Investment
Fund
Linkage Infrastructure, Equipment and Facilities Grant
Jobs & Growth in Tasmania Education - Driven Economic
Revitalisation of Launceston & Burnie
Campuses
Total
2020$’000
2019
$’000
2020$’000
2019
$’000
2020$’000
2019
$’000
2020$’000
2019
$’000
Financial assistance received in cash during reporting period - - 420 386 30,000 8,000 30,420 8,386
Net accrual adjustments - - (420) - (20,758) - (21,178) -
Revenue for the period - - - 386 9,242 8,000 9,242 8,386
Surplus/(deficit) from the previous year - - - - 582 8,147 582 8,147
Funds available for the period - - - 386 9,824 16,147 9,824 16,533
Less expenses including accrued expenses - - - (386) (5,024) (15,565) (5,024) (15,951)
Surplus/(deficit) for the reporting period - - - - 4,800 582 4,800 582
28.6 Australian Research Council Grants
Discovery Linkages Networks and Centres
Special Research Initiatives
Total
2020$’000
2019
$’000
2020$’000
2019
$’000
2020$’000
2019
$’000
2020$’000
2019
$’000
2020$’000
2019
$’000
Financial assistance received in cash during reporting period 10,263 9,132 2,231 2,998 - - 6,809 - 19,303 12,130
Net accrual adjustments (1,971) (4,198) 2,248 10,230 - - (3,129) (6,503) (2,852) (471)
Revenue for the period 8,292 4,934 4,479 13,228 - - 3,680 (6,503) 16,451 11,659
Surplus/(deficit) from the previous year (8) 3,628 5 (7,771) - - 1 13,533 (2) 9,390
Funds available for the period 8,284 8,562 4,484 5,457 - - 3,681 7,030 16,449 21,049
Less expenses including accrued expenses (8,284) (8,570) (4,484) (5,452) - - (3,681) (7,029) (16,449) (21,051)
Surplus/(deficit) for the reporting period - (8) - 5 - - - 1 - (2)
78
Annual Financial Statements
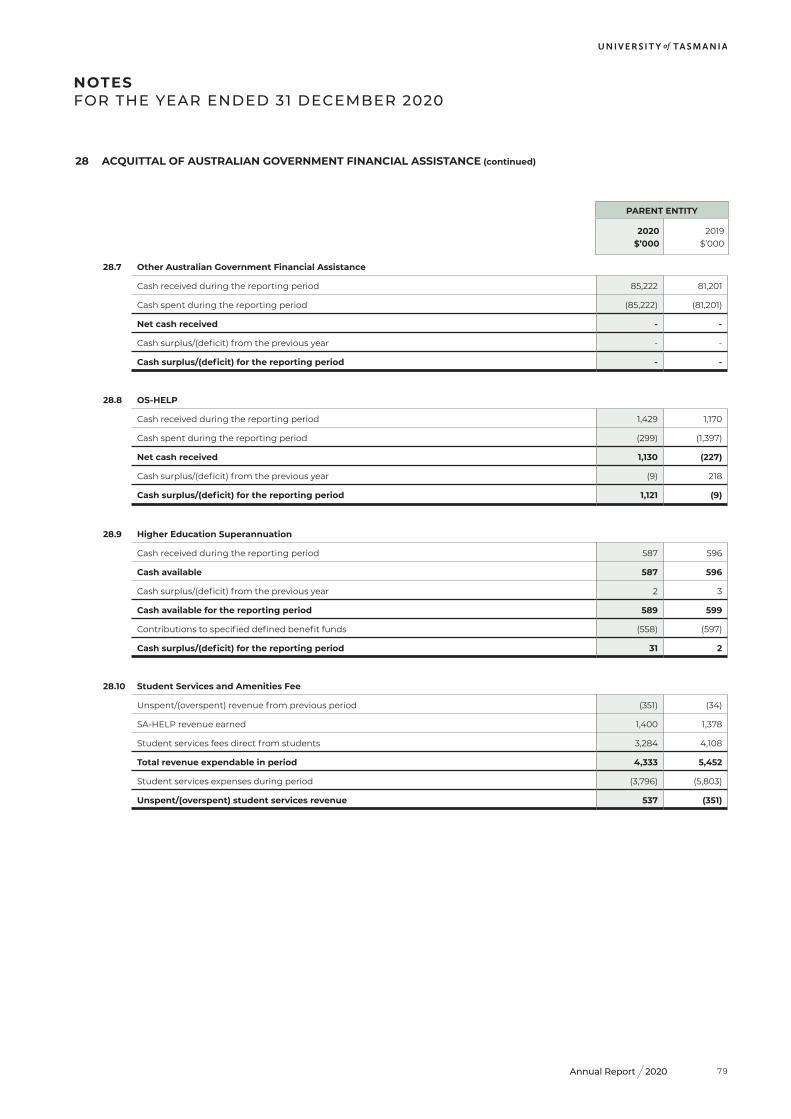
2020Annual Report
NOTES FOR THE YEAR ENDED 31 DECEMBER 2020
28 ACQUITTAL OF AUSTRALIAN GOVERNMENT FINANCIAL ASSISTANCE (continued)
28.5 Other Capital Funding
Education Investment
Fund
Linkage Infrastructure, Equipment and Facilities Grant
Jobs & Growth in Tasmania Education - Driven Economic
Revitalisation of Launceston & Burnie
Campuses
Total
2020$’000
2019
$’000
2020$’000
2019
$’000
2020$’000
2019
$’000
2020$’000
2019
$’000
Financial assistance received in cash during reporting period - - 420 386 30,000 8,000 30,420 8,386
Net accrual adjustments - - (420) - (20,758) - (21,178) -
Revenue for the period - - - 386 9,242 8,000 9,242 8,386
Surplus/(deficit) from the previous year - - - - 582 8,147 582 8,147
Funds available for the period - - - 386 9,824 16,147 9,824 16,533
Less expenses including accrued expenses - - - (386) (5,024) (15,565) (5,024) (15,951)
Surplus/(deficit) for the reporting period - - - - 4,800 582 4,800 582
PARENT ENTITY
2020 2019$’000 $’000
28.7 Other Australian Government Financial Assistance
Cash received during the reporting period 85,222 81,201
Cash spent during the reporting period (85,222) (81,201)
Net cash received - -
Cash surplus/(deficit) from the previous year - -
Cash surplus/(deficit) for the reporting period - -
28.8 OS-HELP
Cash received during the reporting period 1,429 1,170
Cash spent during the reporting period (299) (1,397)
Net cash received 1,130 (227)
Cash surplus/(deficit) from the previous year (9) 218
Cash surplus/(deficit) for the reporting period 1,121 (9)
28.9 Higher Education Superannuation
Cash received during the reporting period 587 596
Cash available 587 596
Cash surplus/(deficit) from the previous year 2 3
Cash available for the reporting period 589 599
Contributions to specified defined benefit funds (558) (597)
Cash surplus/(deficit) for the reporting period 31 2
28.10 Student Services and Amenities Fee
Unspent/(overspent) revenue from previous period (351) (34)
SA-HELP revenue earned 1,400 1,378
Student services fees direct from students 3,284 4,108
Total revenue expendable in period 4,333 5,452
Student services expenses during period (3,796) (5,803)
Unspent/(overspent) student services revenue 537 (351)
28 ACQUITTAL OF AUSTRALIAN GOVERNMENT FINANCIAL ASSISTANCE (continued)
79
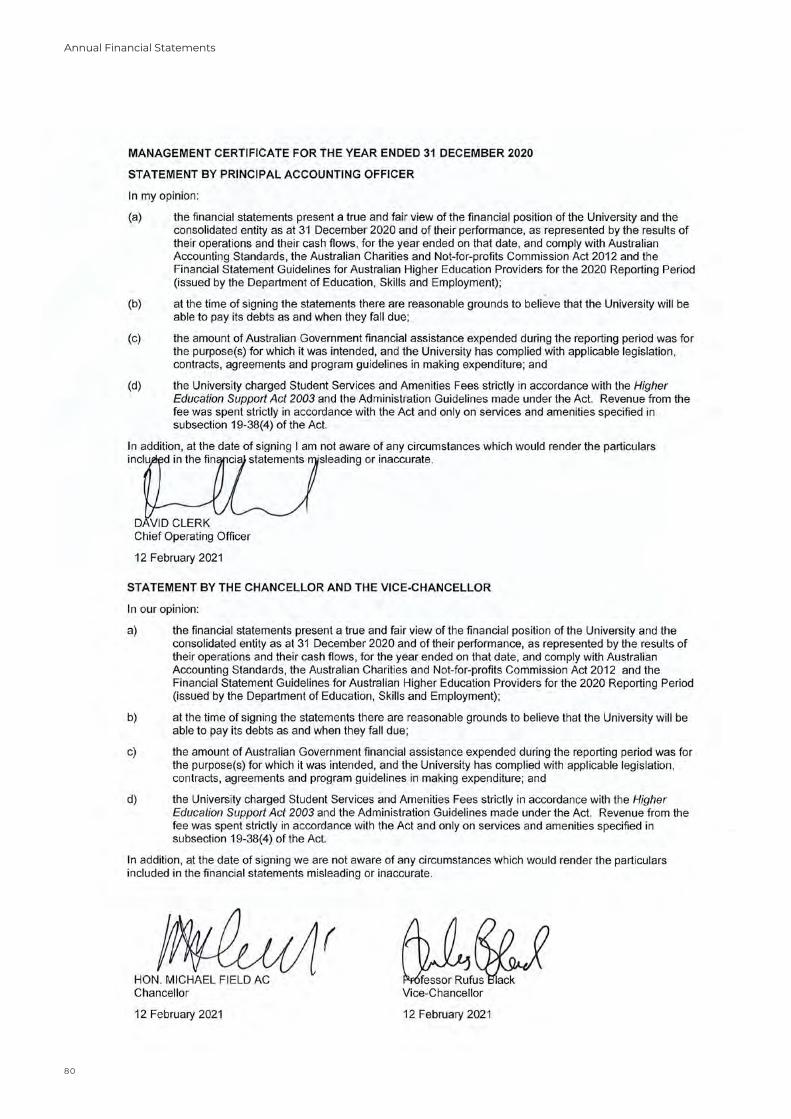
4680
Annual Financial Statements
2020Annual Report
…1 of 5
Independent Auditor’s Report To the Members of Parliament University of Tasmania Report on the Audit of the Consolidated Financial Report Opinion I have audited the financial report of the University of Tasmania and its subsidiaries (the Group), which comprises the consolidated statement of financial position as at 31 December 2020, the consolidated statements of income, changes in equity and cash flows for the year then ended, notes to the financial statements, including a summary of significant accounting policies and declaration by the Members of the Council (the Council). In my opinion, the accompanying financial report:
a) give a true and fair view, in all material respects, the Group’s financial position as at 31 December 2020 and its financial performance and its cash flows for the year then ended
b) is in accordance with the financial reporting requirements of Section 12 of the University of Tasmania Act 1992 and Division 60 of the Australian Charities and Not-for-profits Commission Act 2012 and Australian Accounting Standards.
Basis for Opinion I conducted the audit in accordance with Australian Auditing Standards. My responsibilities under those standards are further described in the Auditor’s Responsibilities for the Audit of the Financial Report section of my report. I am independent of the Group in accordance with the ethical requirements of the Accounting Professional and Ethical Standards Board’s APES 110 Code of Ethics for Professional Accountants (including Independence Standards) (the Code) that are relevant to my audit of the financial report in Australia. I have also fulfilled my other ethical responsibilities in accordance with the Code. The Audit Act 2008 further promotes the independence of the Auditor-General. The Auditor-General is the auditor of all Tasmanian public sector entities and can only be removed by Parliament. The Auditor-General may conduct an audit in any way considered appropriate and is not subject to direction by any person about the way in which audit powers are to be exercised. The Auditor-General has for the purposes of conducting an audit, access to all documents and property and can report to Parliament matters which in the Auditor-General’s opinion are significant.
81
…2 of 5
I believe that the audit evidence I have obtained is sufficient and appropriate to provide a basis for my opinion. Key Audit Matters Key audit matters are those matters that, in my professional judgement, were of most significance in my audit of the financial report of the current period. These matters were addressed in the context of my audit of the financial report as a whole, and in forming my opinion thereon, and I do not provide a separate opinion on these matters. Why this matter is considered to be one of the most significant matters in the audit
Audit procedures to address the matter included
Valuation of Investments Refer to note 7 and 26
The Group holds investments totalling $400.16m at 31 December 2020 recognised at fair value. A significant amount of the investment portfolio is managed by an investment manager and is held in managed funds. These funds invest in varied investment categories, although the majority of funds are invest in listed equities or listed equity investments.
The majority of the investments in managed funds can be valued using market data, and therefore are relatively non-judgemental. However, significant judgement is required for investments where no market data is available.
• Reviewing and evaluating the monitoring controls exercised over the performance of the investment manager.
• Obtaining confirmations from the managed fund investment managers as to their controls over the existence, completeness and valuation of assets under their management.
• Obtaining direct confirmation of units held in, and unit values of managed funds from the trustees of those funds.
• Examining audited financial statements for selected managed funds.
• Obtaining, for selected managed funds, Auditor Control Reports on the design, implementation and operating effectiveness of controls of managed funds.
• Obtaining confirmations from trustees of selected managed funds that existing, and any new, controls are still operating effectively from the date of the last Auditor Control Report to the date of the confirmation.
• Obtaining, on a sample basis, direct confirmation of balances held in other investments.
• Evaluating the adequacy of disclosures made in the financial report, including those regarding key assumptions used.
82
Annual Financial Statements
2020Annual Report
…3 of 5
Research grant income Refer to note 2.1
The Group generates significant revenue from research contracts with external parties. In complying with Australian accounting standards AASB 15 Revenue from Contracts with Customers and AASB 1058 Income of Not-for-Profit Entities, significant judgement was required to determine, on a case by case basis, whether research contracts create obligations for the Group to deliver sufficiently specific outputs to external parties. This includes whether clauses exist in the research contracts that provide access to research data and/or intellectual property (being the key performance obligations identified by the Group), and the timing of this access.
For contracts that create such obligations, revenue received in advance is initially recognised as a liability (revenue received in advance) and subsequently transferred to revenue as or when the Group fulfils the obligations, which is potentially in a future financial year. Otherwise, revenue received in advance is recognised immediately as revenue in the year of receipt. Accounting treatment differs depending on upon judgements made.
• Evaluating management’s approach to the assessment of research contracts against the requirements of AASB 15 and AASB 1058.
• For a sample of research contracts, assessing management’s judgements in relation to the recognition of revenue and revenue received in advance, and in particular:
o whether the key terms of the sampled contracts relate to research activities
o whether the research activities in these contracts are sufficiently specific for recognition under AASB 15
o whether these contracts include clauses relating to assess to research data and/or intellectual property, and the timing of this access.
• Evaluating the adequacy of disclosures made in the financial report in accordance with AASB 15 and AASB 1058.
Responsibilities of the Council for the Financial Report The Council are responsible for the preparation of the financial report that gives a true and fair view in accordance with Australian Accounting Standards, the financial reporting requirements of the University of Tasmania Act 1992 and Division 60 of the Australian Charities and Not-for-profits Commission Act 2012 and for such internal control as determined necessary to enable the preparation of the financial report that is free from material misstatement, whether due to fraud or error. In preparing the financial report, the Council are responsible for assessing the Group’s ability to continue as a going concern, disclosing, as applicable, matters related to going concern and using the going concern basis of accounting the Council intend to liquidate the Group or to cease operations, or have no realistic alternative but to do so. Auditor’s Responsibilities for the Audit of the Financial Report My objectives are to obtain reasonable assurance about whether the financial report as a whole is free from material misstatement, whether due to fraud or error, and to issue an auditor’s report that includes my opinion. Reasonable assurance is a high level of assurance, but is not a guarantee
83
…4 of 5
that an audit conducted in accordance with the Australian Auditing Standards will always detect a material misstatement when it exists. Misstatements can arise from fraud or error and are considered material if, individually or in the aggregate, they could reasonably be expected to influence the economic decisions of users taken on the basis of this financial report. As part of an audit in accordance with the Australian Auditing Standards, I exercise professional judgement and maintain professional scepticism throughout the audit. I also:
• Identify and assess the risks of material misstatement of the financial report, whether due to fraud or error, design and perform audit procedures responsive to those risks, and obtain audit evidence that is sufficient and appropriate to provide a basis for my opinion. The risk of not detecting a material misstatement resulting from fraud is higher than for one resulting from error, as fraud may involve collusion, forgery, intentional omissions, misrepresentations, or the override of internal control.
• Obtain an understanding of internal control relevant to the audit in order to design audit procedures that are appropriate in the circumstances, but not for the purpose of expressing an opinion on the effectiveness of the Group’s internal control.
• Evaluate the appropriateness of accounting policies used and the reasonableness of
accounting estimates and related disclosures made by the Council.
• Conclude on the appropriateness of the Council’s use of the going concern basis of accounting and, based on the audit evidence obtained, whether a material uncertainty exists related to events or conditions that may cast significant doubt on the Group’s ability to continue as a going concern. If I conclude that a material uncertainty exists, I am required to draw attention in my auditor’s report to the related disclosures in the financial report or, if such disclosures are inadequate, to modify my opinion. My conclusion is based on the audit evidence obtained up to the date of my auditor’s report. However, future events or conditions may cause the Group to cease to continue as a going concern.
• Evaluate the overall presentation, structure and content of the financial report, including the
disclosures, and whether the financial report represents the underlying transactions and events in a manner that achieves fair presentation.
• Obtain sufficient appropriate audit evidence regarding the financial information of the
entities or business activities within the Group to express an opinion on the financial report. I am responsible for the direction, supervision and performance of the Group audit. I remain solely responsible for my audit opinion.
I communicate with the Council regarding, among other matters, the planned scope and timing of the audit and significant audit findings, including any significant deficiencies in internal control that I identify during my audit.
84
Annual Financial Statements
2020Annual Report
…5 of 5
From the matters communicated with the Council, I determine those matters that were of most significance in the audit of the financial report of the current period and are therefore the key audit matters. I describe these matters in my auditor’s report unless law or regulation precludes public disclosure about the matter or when, in extremely rare circumstances, I determine that a matter should not be communicated in my report because the adverse consequences of doing so would reasonably be expected to outweigh the public interest benefits of such communication.
Rod Whitehead Auditor-General Tasmanian Audit Office 19 February 2021 Hobart
85

Students mapping in Derby, Tasmania.


CRICOS 00586B