Embed Size (px)
Citation preview

NATIONS TRUST BANK PLCA n n u a l R e p o r t 2 0 1 9

CONTENTS
1
4
2
5
3
6
OUR BUSINESS AND LEADERSHIP
CORPORATE GOVERNANCE &RISKMANAGEMENT
OUR STRATEGY AND PERFORMANCE
FINANCIAL STATEMENTS
CAPITAL MANAGEMENT
SUPPLEMENTARY INFORMATION
About Us 2Our Reporting 3Financial Highlights 4Non-Financial Highlights 5Chairman’s Message 6Chief Executive Officer’s Review 8Board of Directors 10Corporate Management 16Vice Presidents 18
Corporate Governance 54Annual Report of the Board of Director on the Affairs of The Bank 57Directors’ Interest in Contracts with the Bank 61Risk Management Review 62Board Integrated Risk Management Committee Report 75Board Credit Committee Report 76Board Supervisory Committee Report 77Board Nomination Committee Report 78Human Resources And Remuneration Committee Report 79Related Party Transactions Review Committee Report 80Directors’ Statement on Internal Control Over Financial Reporting 81Auditor’s Statement on Internal Control Over Financial Reporting 83 Board Audit Review Committee Report 84
Measuring Strategic Progress 20Value Creation Model 22Our Operating Environment 24Economic and Industry Performance 26Stakeholder Needs 27Material Matters 28Corporate Banking 29Treasury 30SME 31Consumer Banking 32Leasing 33
Directors’ Responsibility for Financial Reporting 87Independent Auditors’ Report 88Statement of Financial Position 91Statement of Profit or Loss 92Statement of Comprehensive Income 93Statement of Changes in Equity 94Statement of Cash Flows 95Notes to the Financial Statements 96
Financial Capital 34Manufactured Capital 37Digital Capital 38Intellectual Capital 41Human Capital 42Social and Relationship Capital 46Natural Capital 50Independent Assurance Report 53
GRI Context Index 200Material Topics 204Investor Information 205Risk Management Annexure 210Corporate Governance Annexure 229Ten Year Key Performance Trends 250Service Network 252Glossary 255Notice of Meeting 258Form of Proxy (Voting Shareholders) 259Form of Proxy (Non-Voting Shareholders) 261Corporate Information IBC

At Nations Trust, we understand the importance of digital technologies and how they reshape the way people live and
work. That’s why we continue to reinvent the status quo, offering our customers accessibility and simplicity through a range of
innovative products and services.
We’re using data analytics and state-of-the-art technology to move away from traditional legacy systems, instead designing innovative,
collaborative models that integrate our customers’ personal preferences into their banking experience.
We’ve always been known for our bold, forward-thinking approach in the work we do, and today, we’re staying ahead in a fast-
changing world, using groundbreaking digital technologies and our own exceptional skills and services to bring the speed and precision
of Next Gen Banking to Sri Lankans everywhere.

2
Nations Trust Bank PLC Annual Report 2019
OUR VISIONWe help people and businesses by providing financial services and information to achieve their goals and aspirations in a sustainable way
OUR MISSIONWe will work SMART to become the most respected financial services provider.
SMART Smart. More with less. Adaptable. Responsible. Tech savvy.
VALUES• Agile • Proactive• Excellence • Winning Together• Trust
ABOUT US
1AMERICAN EXPRESSDiscover world-class service and personal recognition with your Nations Trust Bank's American Express Membership.
OUR BUSINESS AND LEADERSHIP
About Us 2Our Reporting 3Financial Highlights 4Non-Financial Highlights 5Chairman’s Message 6Chief Executive Officer’s Review 8Board of Directors 10Corporate Management 16Vice Presidents 18
Nations Trust Bank PLC has uniquely positioned itself in Sri Lanka’s banking sector through transformative ideas and disruptive technology which has enabled it to redefine the entire customer experience. The Bank’s competitive edge has been sharpened by its focus on innovation, digitisation, an open and collaborative leadership style and a tenacious team of young professionals who have successfully built a future-fit, competitive bank. The Bank offers a wide array of innovative and relevant solutions to a diverse base of Retail and Consumer, Corporate, SME and Leasing customers. With a total asset base of LKR 325 billion as at end-December 2019, it is one of Sri Lanka’s fastest growing banks.

3
NEXT GEN BANKING
OUR REPORTING
THIS YEAR WE PRESENT OUR SIXTH INTEGRATED ANNUAL REPORT, COVERING THE OPERATIONS OF NATIONS TRUST BANK PLC AND ITS SUBSIDIARIES WALDOCK MACKENZIE LIMITED, ALLIED PROPERTIES LIMITED AND NATIONS INSURANCE BROKERS LIMITED FOR THE PERIOD FROM 1ST JANUARY TO 31ST DECEMBER 2019.
The Bank follows an annual reporting cycle and this report builds on the Bank's previous reports for the period from 1st January to 31st December 2018.
Limited printed copies are available upon request
Online HTMLversion
Digital format
CD version
REPORTING ASSURANCEThe Financial Statements have been prepared based on the Sri Lanka Financial Reporting Standards issued by the Institute of Chartered Accountants of Sri Lanka and has been assured by Messrs. Ernst and Young. This report has been prepared in accordance with the GRI Standards : Core option and is externally assured by Messrs. Ernst and Young.
FORWARD-LOOKING STATEMENTSThis Report contains certain forward-looking statements regarding the Group’s performance, financial position and operations. These statements involve risks and uncertainty as they relate to events that occur in the future. These factors could cause actual results to differ from those expressed/implied by such forward-looking statements.
FEEDBACK Please direct your queries, comments and suggestions regarding this Report to;
Evan Ranasinghe,Vice President, Management Reporting and PlanningE-mail : [email protected]
ICONOLOGYThe following navigation icons have been used across the report to demonstrate connectivity
CAPITALS
Financial Capital
Social and Relationship Capital
Human Capital
Manufactured Capital
Digital Capital Natural Capital
Intellectual Capital
The HTML version of the Annual Report 2019 can be read at:https://www.nationstrust.com/
STRATEGIC PRIORITIES
Financial Performance
Customer Focus
Delivery and Distribution
Internal Processes
Human Resources
BUSINESS LINES
Consumer
SMECorporate Treasury
Leasing
As part of our commitment towards reducing our environmental impact, we will only be printing a limited number of copies of this Annual Report. The Report is available for perusal and download through other mediums as listed above.
4
Nations Trust Bank PLC Annual Report 2019
FINANCIAL HIGHLIGHTS
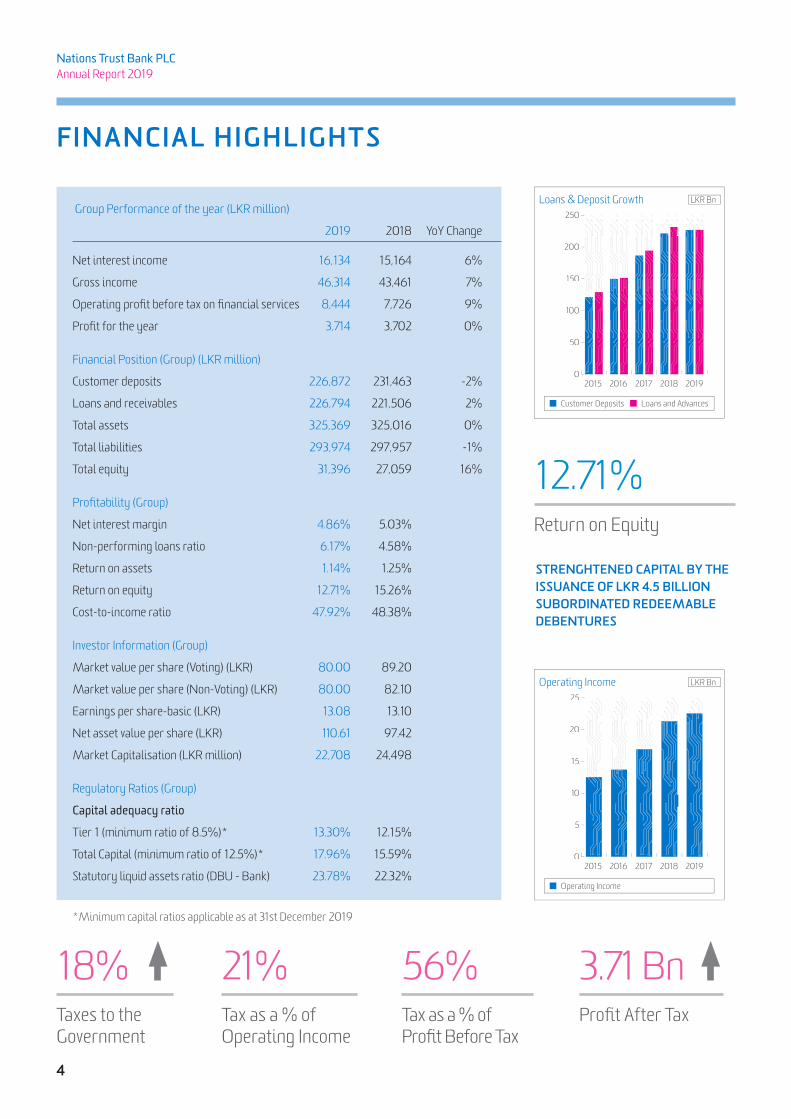
Group Performance of the year (LKR million)
2019 2018 YoY Change
Net interest income 16,134 15,164 6%
Gross income 46,314 43,461 7%
Operating profit before tax on financial services 8,444 7,726 9%
Profit for the year 3,714 3,702 0%
Financial Position (Group) (LKR million)
Customer deposits 226,872 231,463 -2%
Loans and receivables 226,794 221,506 2%
Total assets 325,369 325,016 0%
Total liabilities 293,974 297,957 -1%
Total equity 31,396 27,059 16%
Profitability (Group)
Net interest margin 4.86% 5.03%
Non-performing loans ratio 6.17% 4.58%
Return on assets 1.14% 1.25%
Return on equity 12.71% 15.26%
Cost-to-income ratio 47.92% 48.38%
Investor Information (Group)
Market value per share (Voting) (LKR) 80.00 89.20
Market value per share (Non-Voting) (LKR) 80.00 82.10
Earnings per share-basic (LKR) 13.08 13.10
Net asset value per share (LKR) 110.61 97.42
Market Capitalisation (LKR million) 22,708 24,498
Regulatory Ratios (Group)
Capital adequacy ratio
Tier 1 (minimum ratio of 8.5%)* 13.30% 12.15%
Total Capital (minimum ratio of 12.5%)* 17.96% 15.59%
Statutory liquid assets ratio (DBU - Bank) 23.78% 22.32%
Return on Equity
12.71%
Tax as a % of Operating Income
Taxes to the Government
Tax as a % of Profit Before Tax
21%18% 56%Profit After Tax
3.71 Bn*Minimum capital ratios applicable as at 31st December 2019
0
50
100
150
200
250
Customer Deposits
Loans & Deposit Growth LKR Bn
2015 2016 2017 2018 2019
Loans and Advances
0
5
10
15
20
25
Operating Income
Operating Income LKR Bn
2015 2016 2017 2018 2019
STRENGHTENED CAPITAL BY THE ISSUANCE OF LKR 4.5 BILLION SUBORDINATED REDEEMABLE DEBENTURES
5
NEXT GEN BANKING
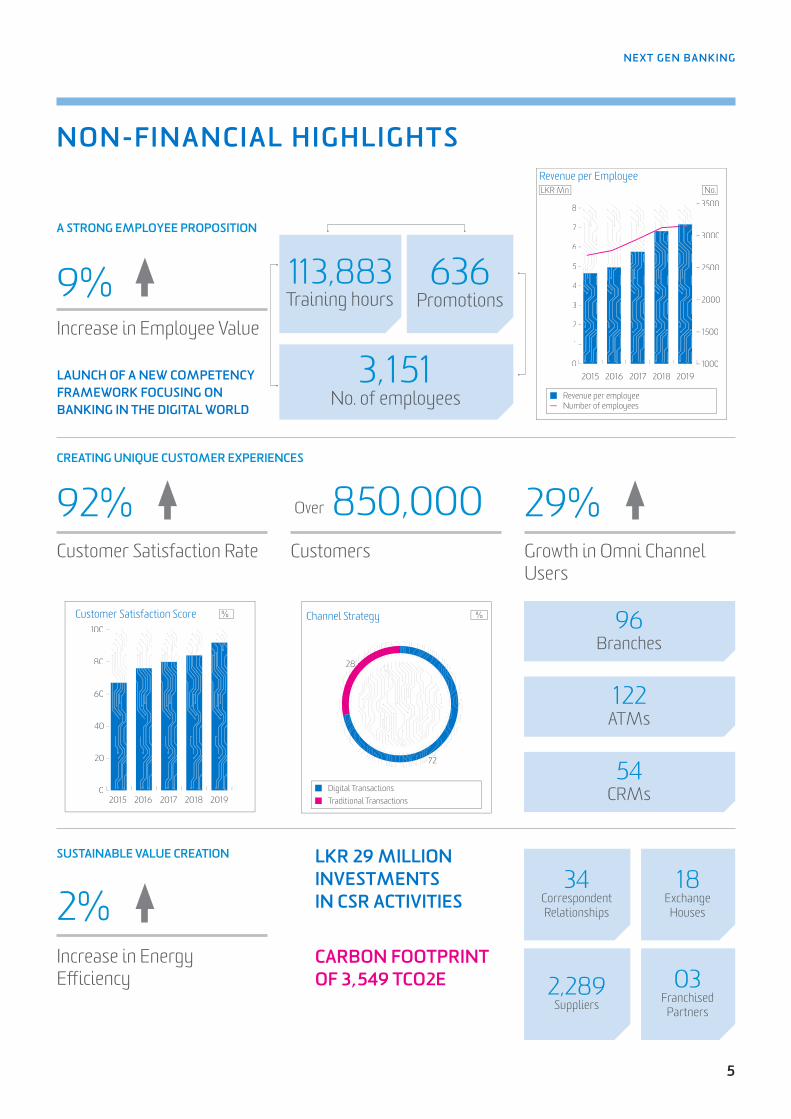
NON-FINANCIAL HIGHLIGHTS
Increase in Employee Value
Customer Satisfaction Rate
Increase in Energy Efficiency
Customers
Over
Growth in Omni Channel Users
9%
2%
92% 850,000 29%
A STRONG EMPLOYEE PROPOSITION
SUSTAINABLE VALUE CREATION
CREATING UNIQUE CUSTOMER EXPERIENCES
113,883Training hours
34Correspondent Relationships
96Branches
122ATMs
54CRMs
2,289Suppliers
18Exchange
Houses
03Franchised
Partners
636Promotions
3,151No. of employees
0
20
40
60
80
100
Customer Satisfaction Score %
2015 2016 2017 2018 2019Digital TransactionsTraditional Transactions
Channel Strategy %
72
288
727
0
1
2
3
4
5
6
7
8
Revenue per employee Number of employees
Revenue per EmployeeNo.LKR Mn
2015 2016 20192017 20181000
1500
2000
2500
3000
3500
LAUNCH OF A NEW COMPETENCY FRAMEWORK FOCUSING ON BANKING IN THE DIGITAL WORLD
LKR 29 MILLION INVESTMENTS IN CSR ACTIVITIES
CARBON FOOTPRINT OF 3,549 TCO2E

6
Nations Trust Bank PLC Annual Report 2019
CHAIRMAN’S MESSAGEPerformance was driven by the pursuit of selective growth opportunities particularly in the corporate and consumer segments, continued focus on increasing non-fund based income and strategic emphasis on driving cost efficiencies by leveraging on the agility of our digital infrastructure
Dear Shareholders,It is my pleasure to present the Integrated Annual Report and the Financial Statements for the financial year ended 31 December 2019.
I am pleased to report that Nations Trust Bank delivered a commendable financial performance in 2019 while making major progress in the execution of its strategic agenda amidst many challenges that prevailed in the operating landscape. The Bank continued to invest in building a market-leading digital experience, enabling the delivery of customer centric solutions, agile and efficient infrastructure and a collaborative, empowered work environment.
OPERATING ENVIRONMENTSri Lanka’s economic growth moderated to 2.6% in the nine months ending September 2019, reflecting global pressures, muted sentiments following the Easter Sunday attacks and unfavourable weather conditions. Despite an accommodative monetary policy stance, credit growth was lacklustre for most part of the year while cashflow stresses and declining business confidence across key industry sectors led to a broad-based increase in impairments. Accordingly, credit growth slowed to 5.0% in 2019 and the industry gross NPL ratio increased to 4.7%, from 3.4% the previous year.
On the regulatory front, caps on deposit and lending rates had a short-term impact on net interest margins. Meanwhile Sector profitability was also hampered by a considerable increase in the effective tax rate for the year, primarily due to the impact of the Debt-Repayment-Levy. While we are
encouraged by the recently announced tax concessions and measures taken to revive the SME sector, we look forward to further opportunities to engage with the Government in formulating such initiatives in order to ensure that the intended benefits are delivered through effective implementation.
PERFORMANCE AND VALUE CREATIONThe Group recorded a profit-after-tax of LKR 3.7 billion in 2019, relatively unchanged over the previous year. Conscious efforts to curtail lending to certain segments resulted in a loan growth of 2% during the year. Performance was driven by the pursuit of selective growth opportunities particularly in the corporate and consumer segments, continued focus on increasing non-fund based income and strategic emphasis on driving cost efficiencies by leveraging on the agility of our digital infrastructure. I also commend the team on the success of the ‘War on Recoveries’ initiative, which comprised a concerted, organisation-wide effort to preserve portfolio quality through eliminating bottlenecks and streamlining recovery processes. Resultantly, the increase in impairment charges was contained at 0.8% while the Bank’s gross NPL ratio stood at 4.86% as at end 2019.
The Bank continued to maintain a strong balance sheet with total assets amounting to LKR 325.4 billion as at end December 2019. During the year, a Basel III compliant debenture for LKR 4.5 billion was issued strengthening the Tier II capital of the Bank; accordingly, the Bank’s total capital ratio strengthened to 17.96% as at end December 2019. We are continuing to explore further avenues to augment capital in line with the requirements of BASEL III.

7
NEXT GEN BANKING
The Group continued to deliver on its stakeholder commitments, generating an Earnings per share (EPS) and Net Asset value per share (NAVPS) of LKR 13.08 (2018: LKR 13.10) and LKR 110.61 (2018: LKR 97.42) respectively.
On the people front, the Bank continued to invest in upskilling its employees through a development agenda focused on nurturing skills required to thrive in a digital world. Our customer value proposition centres on offering simple and intelligent solutions, redefining customer convenience through market leading digital propositions and nurturing an organisation wide service culture.
LEADERSHIP AND GOVERNANCEOn behalf of the Board, I take this opportunity to extend my appreciation to Mr. Murtaza Jafferjee, who held the position of Senior Independent Director for his valuable counsel and guidance over the last 9 years.
The Bank’s talent bench was strengthened during the year, as we attracted several highly skilled individuals for key corporate and senior management positions, thereby ensuring a balance between fresh perspectives and continuity. A clear and comprehensive process for determining succession at top management level allowed for a smooth transition in leadership, as Ms. Renuka Fernando steps down as Chief Executive Officer in April 2020. I congratulate Mr. Priyantha Talwatte, who will take over the reins as CEO from April this year and wish him well in his new role.
SUSTAINABILITY AT NATIONS TRUST As a responsible corporate citizen, we are committed to embedding the principles of sustainability to our business strategy and operations. The Bank’s sustainability policy is aligned to the United Nations’ Sustainable Development Goals and during the year we made considerable progress in furthering our CSR agenda through investments in ongoing strategic community engagements. The Bank also continued to drive concerted efforts towards increasing the energy efficiency of its operations, reducing paper consumption through lean initiatives and integrating environmental considerations into our lending decisions. These initiatives are discussed in further detail in subsequent sections of this Report.
WAY FORWARDGradual signs of economic recovery were witnessed in the last quarter of 2019 with improving collections ratios and a gradual decline in impairments. Anticipated policy stability together with realisation of the intended results of the Government’s stimulus package will augur well for the SME Sector and key industries, presenting considerable upside potential for the Banking sector in 2020.The Bank will seek selective growth opportunities across all its business verticals while leveraging on the foundation and processes put in place to preserve portfolio quality. Ongoing investments will be made in further strengthening the Bank’s IT infrastructure to serve our customers better and operate effectively in a digital environment.
DIVIDENDSYour Board of directors has declared a first and final cash dividend of LKR 2.30 per share compared to the scrip dividend of LKR 2.10 per share declared for 2018.
ACKNOWLEDGEMENTSI wish to extend my appreciation to my colleagues on the Board for their vision and invaluable contribution over the years. The Board joins me in commending the Chief Executive Officer, Ms. Renuka Fernando for her leadership and commitment over the past 08 years in propelling the Bank forward and positioning it on a strong platform to pursue future growth. I wish her well in all future endeavours. I also thank the Nations Trust Team for their dedication and drive in achieving the results set out in a challenging year. We also appreciate the guidance provided by officials of the Central Bank of Sri Lanka on regulatory matters. I take this opportunity to thank all our loyal customers, business partners and other stakeholders who have partnered us in this journey and look forward to your continued support in the years to come.
Gihan CoorayChairman
27th February 2020

8
Nations Trust Bank PLC Annual Report 2019
CHIEF EXECUTIVE OFFICER’S REVIEWThe Bank is aptly positioned to capitalise on the opportunities presented by the anticipated revival in the broader economy, as it leverages on its core strengths and capabilities to drive revenue and earnings growth
Nations Trust Bank demonstrated strong resilience in a year rife with external challenges to record a profit of LKR 3.71 billion, a marginal increase over 2018, attesting to the timeliness of our strategy in navigating economic headwinds. Despite moderating economic growth and subdued investor sentiments we maintained strategic focus on building a competitive, future-fit Bank, making solid progress in our digital transformation journey. We also focused on refining our credit risk management operating model and capabilities, which enabled the Bank to preserve portfolio quality in an environment of credit stress and rising impairments.
A RESILIENT PERFORMANCEThe Group delivered a top line growth of 7% and profit after tax of LKR 3.71 billion. A conscious effort to curtail our risk appetite, due to the economic downturn, resulted in a 2% growth in loans and advances while total assets increased marginally to LKR 325.4 billion by end-December 2019.
The capital position strengthened following a scrip dividend and Basel III compliant debenture issue during the year, resulting in the Group’s core capital and total capital ratios improving to 13.30% and 17.96% from 12.15% and 15.59% the previous year.
Performance was upheld by Corporate Banking which deepened relationships with existing customers and pursued offshore opportunities in structured finance while maintaining impressive portfolio quality. The Credit Cards vertical also performed well during the year maintaining its position as the largest issuer and recording the highest customer spend. Consumer assets, Leasing and SME recorded subdued growth reflecting the Bank’s efforts towards consolidating portfolios and preserving quality while focusing on recoveries and working proactively with customers in managing their stressed conditions.
Group net interest income increased by 6% to LKR 16.1 billion during the year, despite a minimal growth in loans and advances, primarily led by smart cost of funds and margin management.
Non-fund based income, comprising of net fees and commissions as well as net trading and other income, grew by 4% reflecting foreign exchange revaluation gains and an increase in fee-based activity.
The increase in impairment charge for the year was curtailed to 0.8% over 2018, attesting to the huge emphasis on underwriting and recoveries. Both the SME and Consumer segments saw a decline in impairment charges for the year compared to 2018 while the increase stemmed predominantly from the Leasing portfolio.
Cost efficiency continued to improve reflecting our efforts and investments over the last few years to bring productivity and efficiency to our operations, through technology and lean practices. The cost-to-income ratio maintained at 48% while the increase in operating expenses was limited to 5%.
TRANSFORMING THE BANKReimagining banking through technology has been a priority for the Bank in the past few years and today we are seen as a leader in digital transformation in the industry, having introduced several game changing solutions aimed at revolutionising the customer experience, enhancing delivery and distribution models and strengthening internal processes. Digital channels accounted for 72% of total transactions performed in 2019, among the highest in the industry. In 2019, we strengthened our mobile banking proposition with the introduction of several value-added features and enhanced the corporate banking proposition by adding cash management capabilities.
FriMi, our digital banking platform, continues to lead this industry space, growing with a 93% increase in customer base during the year and generating monthly transaction values averaging LKR 4.0 billion. FriMi was also awarded the ‘Best New Fin-Tech Bank in Sri Lanka’ by the Global Banking and Finance Awards and ranked among ‘Sri Lanka’s Top 20 E-commerce Brands’ by LMD in 2019. We continued to enhance the user experience through redesigning the customer interface and adding new features such as bill split.

9
NEXT GEN BANKING
Moderating economic growth following the Easter Sunday attacks led to an industry-wide deterioration in portfolio quality, compelling banks to curtail lending and strengthen recovery mechanisms. From the Bank’s perspective, timely decisions made in 2018 to exit certain customer segments paid dividends in 2019, while conscious efforts made in consolidating our portfolio, particularly in the SME sector allowed the Bank to preserve portfolio quality to a certain extent. Meanwhile adoption of the RAROC model in customer selection has led to increased focus on portfolio profitability, rather than volume growth, thereby enabling the Bank to optimise risk-return dynamics.
Customer focus is a key pivot of our strategy and we continued to leverage on our digital capabilities in gaining deeper insights into customer behaviour and offering simple, intelligent and inclusive solutions across customer journeys. Customer satisfaction levels improved to 92% in 2019 from 84% in 2018, while net promoter scores also increased across business verticals. Developing employee competencies in customer service continues to be a key focus with numerous training interventions targeted towards supporting our aspiration in redefining the customer experience.
During the year the bank implemented an Activity Based Costing Framework across our products and value chains mapped to our customer journeys, which captures the entire operating cost of the bank. This has given us invaluable insights that will now help us to manage and improve our resources, capacities and associated cost efficiencies. We also continued to leverage on our digital capabilities to optimise our operating model and simplify processes. We launched a number of workflow systems with straight through processing capability and continued our drive for automation of manual processes thereby moving towards our mantra of operational excellence.
RISK RETURN DYNAMICSGiven rising impairments during the year, credit risk management was a key area of focus. We further strengthened our pre-credit sanctioning, post-credit monitoring and collection activities based on the business impacts faced by our customers and leveraging on our capabilities on data and analytics to strengthen the traditional processes. This enabled us to better understand early warning signals and take risk based proacticve measures within these functions to not only manage our risks but also to assist our customers to withstand a downward cycle. We also deployed increased resources to these functions and built new collection models that would bring more effective
results in times of economic stress, especially on our consumer businesses.
Operational risk management was also strengthened during the year by further enhancing the Risk and Control Self-Assessment (RCSA) and Key Risk Indicator Framework. With the increasing pursuit of digitisation and in response to emerging vulnerabilities of the industry as a whole to cyber risks, we established a dedicated Information Security Committee and conducted independent risks assessments focusing specifically on cyber, network and infrastructure risks.
PEOPLE PROPOSITIONOur young and agile workforce are ambassadors of the Nations Trust brand and are critical in driving our digitisation agenda. The Bank’s People Strategy is aligned to it’s overall digital transformation strategy which has led to a change in our required skill composition, necessitating refinements to the Bank’s recruitment, engagement and training agenda. In 2019 we launched a new competency model centred on developing skills in data analytics, digital, entrepreneurial leadership and customer experience among others.
We also launched our new employer brand, ‘Create Tomorrow’, focusing on unique attributes of our organisational culture such as digitally savvy, agile and empowered with the aim of attracting and retaining millennialls. Meanwhile we continued to focus on digital engagement to stimulate ideas and build camaraderie, through platforms suited to the thinking and attitudes of our relatively young workforce.
WAY FORWARDThe Bank is aptly positioned to capitalise on the opportunities presented by the anticipated revival in the broader economy, as it leverages on its core strengths and capabilities to drive revenue and earnings growth. Our domain specialisation in several products and customer segments, strong customer relationships, commitment to operational excellence and significant investments and progress in digitisation, augurs well for the Bank, as we seek to sharpen our competitive edge.
While pursuing our commitment to a strong sales culture and new acquisition strategy, we will look to expanding the wallet share of our extensive customer relationships and pursue our objective of becoming the primary bank for all our customers through delivery excellence. We will leverage our data and digital capability to provide our customers with value additions and information which will enable our customers to progress through their life cycle. Businesses will focus on driving strong
growth with Returns on Capital as a key priority and deploy human capital, funding and strategic business initiatives based on such priorities. Granular understanding and efficient management of credit cost arising out of the implementation of SLFRS 9 models and aligning our businesses to enhance real returns will continue to play an important part in implementing our lending strategy.
Driving cost and process efficiencies will also be an area of focus. We will seek to leverage on the significant amount of investments made over the last few years in automation, lean process re-engineering and the Activity Based Costing Measurement framework, which has enabled a robust management of our resources and the delivery of operational excellence across the enterprise.
The Bank’s recent investments and thrust towards strengthening its digital infrastructure has placed it in a unique position to capture the opportunities presented by the industry’s ongoing digital transformation. In addition to transforming the customer experience through simple and intelligent solutions, we will seek to further optimise the digital infrastructure to drive internal efficiencies and automation. On the people front, we will continue to invest in developing and transforming our young and agile team and equipping them with the skills required to thrive in a digital world.
APPRECIATIONSAs announced in the Bank’s succession plan, Mr. Priyantha Talwatte will assume office as the Chief Executive Officer with effect from 2nd April 2020. I take this opportunity to congratulate him and wish him much success in his new role. I also wish to extend my deep appreciation to the Chairman and the Board of Directors for their unwavering support, guidance and confidence placed in me over the years. I express my heartfelt gratitude to the Nations Team for their passion and commitment in propelling our Bank to many achievements with a ‘Make it Happen’ attitude. I wish them continued success in the future. In conclusion I would also like to place on record my appreciation to the Governor of the Central Bank of Sri Lanka and his team, our external Auditors Messrs Ernst & Young, our loyal customers, shareholders and all other stakeholders for their continued support over the years.
Renuka FernandoDirector/CEO
27th February 2020

10
Nations Trust Bank PLC Annual Report 2019
BOARD OF DIRECTORS
Equipped with wide-ranging knowledge, skills and acumen, we lead the way in next-gen banking, wholly focused on being forerunners of the industry
Gihan CoorayChairman/Non-Executive Director
Renuka Fernando Director/Chief Executive Officer
Prasanna De Silva Non-Executive Director
Suran WijesingheNon-Executive Director
Conrad D’SouzaIndependent Non-Executive Director/Senior Director

11
NEXT GEN BANKING
Rachini RajapaksaIndependent Non-Executive Director
Russell De MelIndependent Non-Executive Director
Sumith MaheshwariNon-Executive Director
Theja SilvaGroup Company Secretary/General Counsel
Savanth Sebastian Independent Non-Executive Director
Sherin Cader Non-Executive Director
Chanaka WickramasuriyaIndependent Non-Executive Director
Arjun FernandoNon-Executive Director
12
Nations Trust Bank PLC Annual Report 2019
Gihan Cooray(Chairman/Non-Executive Director)
Date of appointment
Appointed to the Board on 1st May 2014
Current appointments
• Deputy Chairman/Group Finance Director of the John Keells Group and a Board member of John Keells Holdings PLC having responsibility for the Finance, Accounting, Taxation, Corporate Finance & Strategy, Treasury and Information Technology functions of the Group
• Director of many listed companies of the John Keells Group
• Committee Member of the Ceylon Chamber of Commerce
Previous appointments
• President Retail Sector, Head of Corporate Finance and Treasury of the John Keells Group
Skills and experience
He has experience in corporate finance, corporate treasury and investor relations in addition to exposure to retail supermarket operations. He has been involved in investment appraisals, capital raising and structuring transactions for the John Keells Group. He holds a MBA from the Jesse H. Jones Graduate School of Management at Rice University, Houston, USA and is an Associate Member of the Chartered Institute of Management Accountants, UK. He is also a Certified Management Accountant of the Institute of Certified Management Accountants, Australia and holds a Postgraduate Diploma in Marketing from the Chartered Institute of Marketing, UK.
(Ms) Renuka Fernando(Chief Executive Officer/Executive Director)
Date of appointment
Appointed to the Board on 15th September 2012
Current appointments
• Chairperson - Nations Insurance Brokers Limited
• Director - Allied Properties Ltd.
• Director - Waldock Mackenzie Ltd.
• Director - LankaClear (Pvt) Ltd.
• Vice President - American Chamber of Commerce
Previous appointments
• Vice President/Head - Global Transactional Services and Head of Consumer Banking at ABM Amro Bank N.V, Sri Lanka
• AGM Corporate Financial Solutions
• DGM- Retail Banking and DGM - Consumer Banking at NTB
• Appointed as Deputy CEO of NTB in June 2011
Skills and experience
During her banking career spanning 39 years, Mrs. Fernando has worked at Nederlandsche Middenstands Bank, Hong Kong and Banque Indosuez, Sri Lanka in addition to her stint at ABN Amro. She is an Associate of Chartered Institute of Bankers, UK and is a graduate of the Harvard Business School Advanced Management Programme.
Prasanna De Silva(Non-Executive Director)
Date of appointment
Appointed to the Board on 1st January 2012
Current appointments
• Director of Central Finance Company PLC
Previous appointments
• Past Chairman of the Leasing Association of Sri Lanka
Skills and experience
He has over 28 years experience in banking and finance of which 18 years have been in senior management. He has had extensive exposure to credit appraisals, recovery, operating systems, tax, regulatory framework and legal aspects at operational and managerial levels during his tenure at Central Finance Company PLC. He is an Associate Member of Chartered Financial Analyst Institute (CFA) USA and a Fellow of Chartered Institute of Management Accountants (CIMA) UK.
BOARD OF DIRECTORS

13
NEXT GEN BANKING
Suran Wijesinghe(Non-Executive Director)
Date of appointment
Appointed to the Board on 1st November 2012
Current appointments
• Chief Strategy Officer – Central Finance Company PLC
Previous appointments
• Group Financial Controller and the Chief Financial Officer of the Financial Services sector of John Keells Holdings PLC
• Group Finance Director of Securicor Botswana Ltd.
Skills and experience
He has over 35 years of work experience in the fields of auditing, financial management and general management in both local and overseas organisations. He is a Fellow Member of both the Institute of Chartered Accountants of Sri Lanka and the Chartered Institute of Management Accountants of UK.
Conrad D’Souza(Independent Non-Executive Director/ Senior Director)
Date of appointment
Appointed to the Board on 18th January 2016
Current appointments
• Member of Executive Management and Chief Investor Relations Officer of Housing Development Finance Corporation Ltd. (HDFC)
• Serves on the Boards of HDFC Investments Ltd., India, HDFC Education and Development Services Pvt. Ltd., India, HDFC HoldingsLtd., India, HDFC Sales Pvt. Ltd., India, Chalet Hotels Ltd., India, Association of Finance Professionals of India (AFPI),Housing Development Finance Corporation PLC, Maldives and First Housing Finance (Tanzania) Ltd.
Skills and experience
In HDFC he is responsible for investor relations, strategy, corporate planning and budgeting, corporate finance and sustainability. He had held the position of Treasurer of HDFC for 10 years and responsibilities included fund management, investments, resource mobilisation both domestic and international, asset liability management and investor relations. He has been associated with HDFC’s international funding from the multilateral agencies and in the international syndicate loan markets. He holds a Masters’ Degree in Commerce, a Masters’ Degree in Business Administration and is a Senior Executive Program (SEP) graduate of the London Business School.
He is also a Consultant to multilateral agencies and has undertaken assignments in Asia, Africa and Eastern Europe.
(Ms) Rachini Rajapaksa(Independent Non-Executive Director)
Date of appointment
Appointed to the Board on 29th April 2016
Current appointments
• Director/Immediate Past President - CFA Society Sri Lanka
• Director - Nations Insurance Brokers Ltd.
• Director - Asset Enterprises (Pvt) Ltd.
• Director - Lanka Bond House Ltd.
Previous appointments
• Chief Financial Officer, IBM - Sri Lanka and Bangladesh
• Senior Fund Manager at Ceybank Asset Management
• Audit Supervisor, Pricewaterhouse Coopers Sri Lanka
Skills and experience
She holds extensive leadership experience in the fields of fund management and finance. She is a Chartered Financial Analyst of the CFA Institute, Charlottesville, Virginia USA and is a Fellow Member of the Chartered Institute of Management Accountants of UK.

14
Nations Trust Bank PLC Annual Report 2019
Russell De Mel(Independent Non-Executive Director)
Date of appointment
Appointed to the Board on 6th June 2016
Current appointments
• Serves on the Boards of TAL Lanka Hotels PLC and Sunshine Teas (Pvt) Ltd.
Previous appointments
• Served on the Boards of Singer Finance Lanka PLC and HDFC Maldives (nominee of IFC) & AIA Insurance PLC
• Served as Director/CEO and Group CEO at NDB Bank and Group
• Vice President of Group Risk Management and Corporate Banking at NDB
• Served on the Boards of over 25 listed and non-listed companies
Skills and experience
He is a professional accountant with over 20 years’ experience in development banking including project financing, SME financing and merchant banking and around nine years of experience in commercial and investment banking. He is a Fellow of the Chartered Institute of Management Accountants, Chartered Global Management Accountant and Fellow of the Certified Management Accountants of Sri Lanka.
Sumith Maheshwari(Non-Executive Director)
Date of appointment
Appointed to the Board on 4th October 2018
Current appointments
• Appointed as Managing Director and CEO of Fairbridge Capital in 2018
• Serves on the Boards of Fairchem Speciality Ltd., Saurashtra Freight (Pvt) Ltd., Fairfreight Lines (Pvt) Ltd., Akalya Services (Pvt) Ltd., National Collateral Management Services Ltd., Sterling Holiday Resorts Ltd., Bangalore International Airport Ltd., Fairfax India Holding Corporation, Privi Organics India Ltd., CSB Bank Ltd., Thomas Cook (India) Ltd., Seven Island Shipping Ltd. and Anchorage Infrastructure Investments Holdings Ltd.
Previous appointments
• Audit and Accounting Advisory at KPMG in India
Skills and experience
He is a Member of Institute of Chartered Accountants of India. He has completed the Post Graduate Programme in Management from the Indian School of Business, Hyderabad and holds Bachelor of Commerce degree from the University of Mumbai.
Savanth Sebastian(Independent Non-Executive Director)
Date of appointment
Appointed to the Board on 23rd October 2018.
Current appointments
• Serves on the Boards of Voguetex Sri Lanka, and Arpico Ataraxia Asset Management
Previous appointments
• Director - Subway Development
• Equities Economist and Senior Economist at Commonwealth Bank
• Senior Manager at Commonwealth Securities – International Trading and Wealth Management
Skills and experience
• RG 146 Australian financial markets qualification; Securities Derivatives Institute of Australia Accreditation Program, Deakin University 2004
• Bachelor of Commerce – Actuarial Studies & Finance University of NSW
• Australian Stock Exchange Accredited Advisor (Level 1 & 2)
• ASX Accreditation in Derivatives 2005 and ASX Accreditation in Derivatives – Options and Warrants Level 2 2006
BOARD OF DIRECTORS

15
NEXT GEN BANKING
(Ms) Sherin Cader(Non-Executive Director)
Date of appointment
Appointed to the Board on 15th December 2018
Current appointments
• Chief Financial Officer, Financial Services Industry Group of John Keells Holdings PLC
• Director, John Keells Stock Brokers (Pvt) Ltd.
Previous appointments
• General Manager – Finance & Planning of Union Assurance PLC
• Financial Controller of John Keells Holdings PLC
Skills and experience
Mrs. Cader counts over 20 years of experience in both finance and operations. She has served in diverse fields for companies within the group in the Financial Services sector, IT Enabled Services sector and Centre Functions.
She is a Fellow Member of both the Chartered Institute of Management Accountants of UK (CIMA) and the Association of Chartered Certified Accountants of UK (ACCA). She is also a Chartered Global Management Accountant UK and a Solution Consultant my SAP Financials – Managerial & Financial Accounting.
Chanaka Wickramasuriya(Independent Non-Executive Director)
Date of appointment
Appointed to the Board on 16th December 2018
Current appointments
• Independent Consultant
Previous appointments
• Joint Managing Partner of Ironwood Capital Partners Private Equity Fund
• Managing Partner of LR Global Lanka Private Equity Fund
• Partner-Global Portfolio Manager of the Global Private Equity Fund of Aureos Capital Ltd.
• Country Head Fitch Ratings Lanka Ltd.
Skills and experience
He is a Chartered Financial Analyst of CFA Institute, Charlottesville VA,USA and he holds Bachelors in Electrical Engineering from the State University of New Jersey.
Arjun Fernando(Non-Executive Director)
Date of appointment
Appointed to the Board on 18th January 2019
Current appointments
• Serves on the Boards of eight companies including Central Finance Company PLC, Home Finance Company in Fiji, NDB Capital Holdings PLC, NDB Securities (Pvt) Ltd. and NDB ZEPHYR Partners Ltd.
Previous appointments
• Served as Chief Executive Officer/(Ex-Officio) Director of DFCC Bank
• Served as Chairman/Director on the Boards of Directors of DFCC Bank’s Subsidiaries, Joint Ventures and Associates
• Served as the DFCC Bank’s Nominee Director on the Boards of Credit Information Bureau of Sri Lanka and the Sri Lanka Banks Association
• Served as Chairman of the Association of Development Financing Institutions in Asia and the Pacific (ADFIAP) and the World Federation of Development Finance Institutions
Skills and experience
Mr. Arjun Fernando is a professional banker with over 30 years experience in banking, finance and business administration. He is an Associate of the Chartered Institute of Bankers (U.K.). He holds a MSc in Management from Clemson University of South Carolina, USA and a BSc in Engineering from Southern Illinois University of Illinois, USA.

16
Nations Trust Bank PLC Annual Report 2019
CORPORATE MANAGEMENT
Fuelled by a dynamic, energetic group of skilled professionals, we're ready to take on a future of change.
Left to rightPriyantha Talwatte - Deputy Chief Executive Officer, Renuka Fernando - Director/Chief Executive Officer, Hemantha Gunetilleke - SEVP (Consumer Banking), Theja Silva - General Counsel/Group Company Secretary, Bandara Jayathilake - SEVP (Commercial Banking)
Left to rightSheahan Daniel - SVP (Branch Network), Chamath Munasinghe - SVP (Banking Operations), Nazeem Mohamed - SVP (FriMi), Janaka Pitadeniya - Chief Digital Officer, Sajith Sameera - Chief Information Officer

17
NEXT GEN BANKING
Left to rightRandil Boteju - SVP (Consumer Sales), Niluka Gunatilaka - SVP (Cards), Sampath Perera - Chief Data Officer, Chamila Sumathiratne - Chief Risk Officer, Kushlani Allis - Chief Internal Auditor, Sanjaya Senarath - Chief Marketing Officer SEVP - Senior Executive Vice PresidentEVP - Executive Vice PresidentSVP - Senior Vice President
Left to rightPriyantha Wijesekera - EVP (Leasing), Indrajith Boyagoda - EVP (Treasury & Investment Banking), Ajith Akmeemana - Chief Financial Officer, Senal Seneviratne - EVP (Corporate Banking), Gayan Ranaweera - Chief Credit Officer, Ramanika Unamboowe - EVP (Human Resources)
18
Nations Trust Bank PLC Annual Report 2019
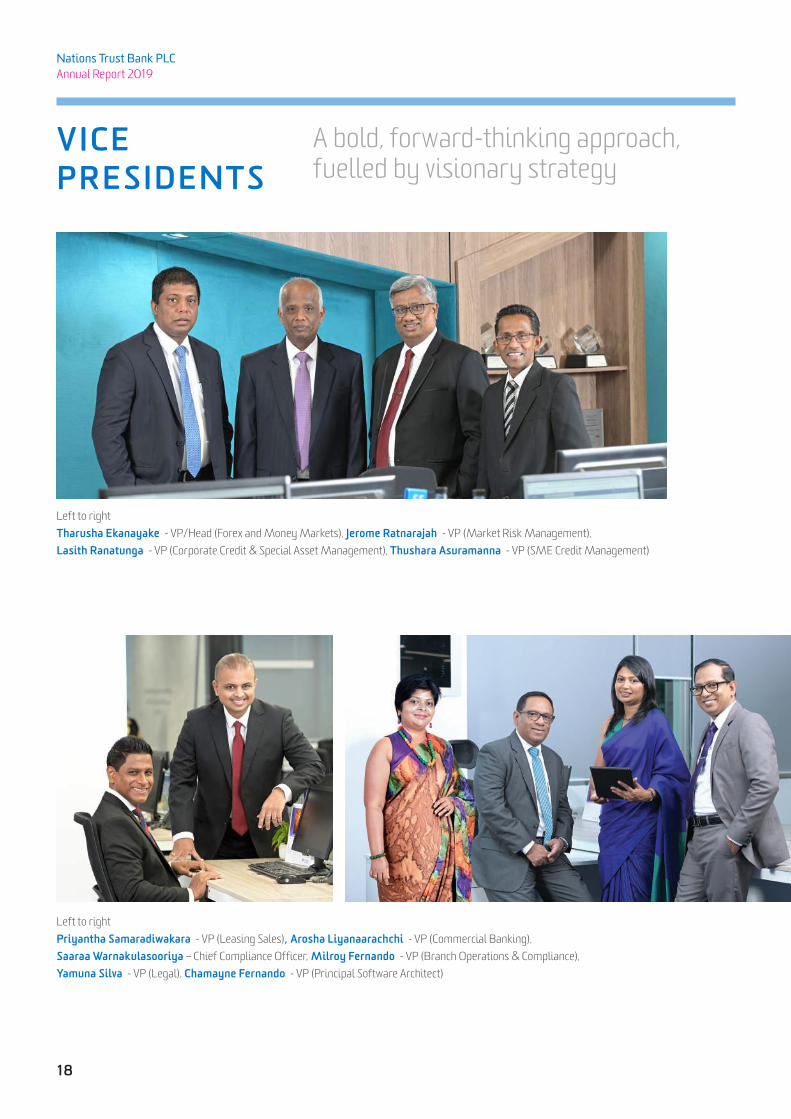
VICE PRESIDENTS
A bold, forward-thinking approach, fuelled by visionary strategy
Left to rightTharusha Ekanayake - VP/Head (Forex and Money Markets), Jerome Ratnarajah - VP (Market Risk Management), Lasith Ranatunga - VP (Corporate Credit & Special Asset Management), Thushara Asuramanna - VP (SME Credit Management)
Left to rightPriyantha Samaradiwakara - VP (Leasing Sales), Arosha Liyanaarachchi - VP (Commercial Banking), Saaraa Warnakulasooriya – Chief Compliance Officer, Milroy Fernando - VP (Branch Operations & Compliance), Yamuna Silva - VP (Legal), Chamayne Fernando - VP (Principal Software Architect)

19
NEXT GEN BANKING
Left to rightRoger Rozairo - VP (Collection Strategy, Analytics and Compliance), Evan Ranasinghe - VP (Management Reporting & Planning), Vidharshana Perera - VP (Field Collections), Kanchana Devasurendra - VP (Application Administration)
VP - Vice President
Left to rightNisaja Aryasinghe - VP (SME Banking - Western Province), Rasanja De Silva - VP (Branches - Western Province), Menaka Wavita - VP (Branches - Emerging Market), Druvi Vaidyakularatne - VP (Head of IT Infrastructure & Services), Jeremy Gnanapragasam - VP (Head of Nations Transformation), Renuka Senadheera - VP (Consumer Services)

20
Nations Trust Bank PLC Annual Report 2019
PRIVATE BANKINGNations Trust Bank Private Banking, the solution provider to satisfy the financial needs of your lifestyle.
MEASURING STRATEGIC PROGRESS
FINANCIAL PERFORMANCE
Strategic Drivers 2019• Adoption of the RAROC model
in portfolio evaluation
• Leveraging on cross-sell opportunities
• Emphasis on preserving portfolio quality
• Enhanced collection capabilities
Key Performance IndicatorsStrategic focus on profitability rather than volume growth resulted in a modest loan expansion of 2%
0
500
1,000
1,500
2,000
2,500
3,000
3,500
4,000
Profit After TaxationReturn On Average Assets
Profitability%LKR Mn
2017 201920180.9
1.2
1.5
PBT GROWTH: 9%
NIM: 4.86% (2018: 5.03%)
RETURN ON EQUITY: 12.71%
Following the issuance of LKR 4.5 billion debentures the Bank’s capital position has strengthened
TOTAL CAPITAL RATIO: 17.96%
CUSTOMER FOCUS
Strategic Drivers 2019• Product and process
development to create simple and intelligent customer experiences
• Enhance availability and accessibility of direct, self-service channels
• High level of engagement
Key Performance IndicatorsConsistent improvements in customer satisfaction scores
Customer Satisfaction score
92%
0
1,000
2,000
3,000
4,000
5,000
6,000
No of ComplaintsNo of Complaints as a % of total customers
Customer Satisfaction
%No.
2017 201920180.60
0.61
0.62
0.63
0.64
Focus on driving customer convenience through digital solutions
Growth in Omni Channel Users
29%
Our short to medium term strategy for the next few years would be consistent with the direction we have followed in the recent past.
2Measuring Strategic Progress 20Value Creation Model 22Our Operating Environment 24Economic and Industry Performance 26Stakeholder Needs 27Material Matters 28Corporate Banking 29Treasury 30SME 31Consumer Banking 32Leasing 33
OUR STRATEGYAND PERFORMANCE

21
NEXT GEN BANKING
Nations Trust maintained focus on its strategic priorities as set out in its Strategic Plan for 2017-2019. The Plan defines five areas of focus which reflect the dynamism in the operating landscape and leverages on our unique capabilities in building a future-fit, competitive bank. Performance is measured against these strategic pillars by continuously
monitoring performance against defined key performance indicators.
Despite the challenging market conditions that prevailed in 2019, Nations Trust recorded significant strategic progress, particularly in enhancing the customer experience, digital capabilities and driving process efficiencies.
Our short to medium term strategy for the next few years would be consistent with the direction we have followed in the recent past. Key areas of focus would be leveraging on our core competencies to drive growth, profitable business expansion and transforming the customer experience through simple and intelligent solutions.
DELIVERY AND DISTRIBUTION
Strategic Drivers 2019• Create simple customer
onboarding experiences
• Enhance the mobile banking proposition with value added features
• Ongoing integration of physical and digital channels
Key Performance IndicatorsContinued focus on modernising our digital infrastructure in benefiting both customers and employees
Transactions conducted through digital platforms
72%
Mobile Banking and Frimi feature enhancements
Roll out new Cash Management System
INTERNAL PROCESSES
Strategic Drivers 2019• Data analytics to drive
enhanced process efficiencies
• Ongoing investments in RPA
• Investment in workflow systems
• Sales force automation
Key Performance IndicatorsConsistent improvement in cost efficiencies
0 10 20 30 40 50 60
Cost to Income Ratio %
2015
2016
2017
2018
2019
Process efficiencies through LKR 567 million investment in IT infrastructure
Improved turnaround time in SME credit processing
HUMAN RESOURCES
Strategic Drivers 2019• Development of new
competency framework
• Launch of employer brand-‘Create Tomorrow’
• Ongoing focus on digital engagement with employees
Key Performance IndicatorsDeveloping competencies relevant to banking in a digital world through LKR 102 million investment in training
0
20,000
40,000
60,000
80,000
100,000
120,000
140,000
Training hoursInvestment in Training
Employee TrainingLKR. MnHours
2015 2016 2017 2018 20190
20
40
60
80
100
120
Employee retention rate improved to 85% from 83% of previous year
Employee productivity (Revenue per employee) increased by 5.1% during the year
0
5,000
1,0000
1,5000
20,000
25,000
30,000
35,000
Volume of Traditional TransactionsVolume of Digital Transactions% of Transactions on Digital Channels
Digital Transactions%LKR Mn
2017 2018 20190
10
20
30
40
50
60
70
80
22
Nations Trust Bank PLC Annual Report 2019
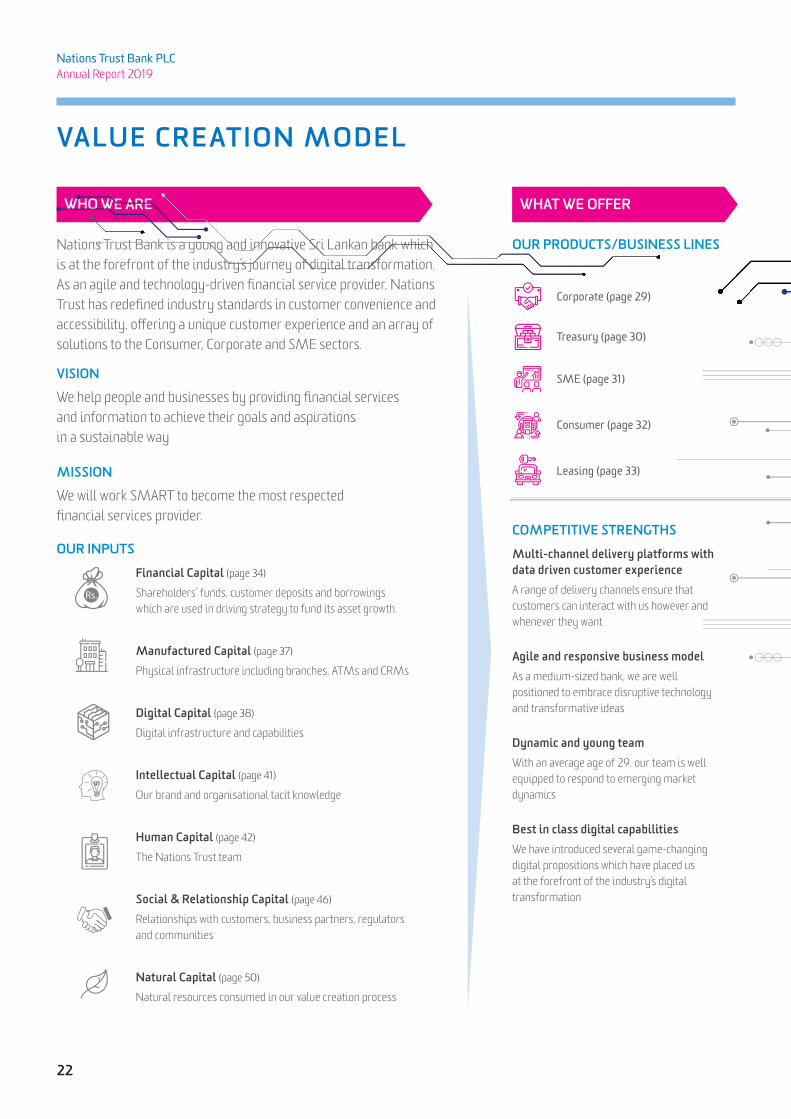
VALUE CREATION MODEL
Nations Trust Bank is a young and innovative Sri Lankan bank which is at the forefront of the industry’s journey of digital transformation. As an agile and technology-driven financial service provider, Nations Trust has redefined industry standards in customer convenience and accessibility, offering a unique customer experience and an array of solutions to the Consumer, Corporate and SME sectors.
OUR PRODUCTS/BUSINESS LINES
COMPETITIVE STRENGTHS
Multi-channel delivery platforms with data driven customer experienceA range of delivery channels ensure that customers can interact with us however and whenever they want
Agile and responsive business modelAs a medium-sized bank, we are well positioned to embrace disruptive technology and transformative ideas
Dynamic and young teamWith an average age of 29, our team is well equipped to respond to emerging market dynamics
Best in class digital capabilitiesWe have introduced several game-changing digital propositions which have placed us at the forefront of the industry’s digital transformation
VISION
We help people and businesses by providing financial services and information to achieve their goals and aspirations in a sustainable way
MISSION
We will work SMART to become the most respected financial services provider.
OUR INPUTS
Financial Capital (page 34)
Shareholders’ funds, customer deposits and borrowings which are used in driving strategy to fund its asset growth.
Manufactured Capital (page 37)
Physical infrastructure including branches, ATMs and CRMs
Digital Capital (page 38)
Digital infrastructure and capabilities
Intellectual Capital (page 41)
Our brand and organisational tacit knowledge
Human Capital (page 42)
The Nations Trust team
Social & Relationship Capital (page 46)
Relationships with customers, business partners, regulators and communities
Natural Capital (page 50)
Natural resources consumed in our value creation process
WHO WE ARE WHAT WE OFFER
Consumer (page 32)
Leasing (page 33)
Corporate (page 29)
Treasury (page 30)
SME (page 31)

23
NEXT GEN BANKING
Shareholders
Returns consistent with risk undertaken• 12.71% Return on Equity
• Dividend of LKR 2.30 per share
• 100% voting outcome for all resolutions at AGM
• 13.53% NAVPS Growth
Customers
Affordable and innovative financial solutions with excellent customer experience• LKR 156 billion in total Rupee loan disbursements
• LKR 18 billion interest payments on deposits
• Innovation to drive improved customer experiences, cash management services, new features in mobile banking, FriMi apps
• Customer satisfaction rate of 92% (page 46)
Employees
Progression and skill development in a rewarding, challenging work environment• LKR 4.5 billion in salaries and benefits
• LKR 102 million investment in training and development
• 636 promotions
• 43% female representation (page 44)
Government and Regulators
Contributing through taxes and enhancing access to finance• LKR 4.7 billion in tax and levies to the government
(17.55% increase)
• Compliance with all regulatory requirements
Community
Meaningful change in communities • LKR 4 billion SME lending outside Western Province
• LKR 29 million investment in CSR initiatives
• 2,182 volunteer hours
• Cordial community relations (page 48)
Environmental Impacts• Recycled paper of 17% (or 14.5 MT) of paper used
• Carbon footprint of 3,549 tCO2e
• Lending towards green products such as renewable energy, agriculture and other green initiatives
STAKEHOLDER OUTCOMESTHROUGH A CLEAR STRATEGY
Financial PerformanceDriving revenue growth, expansion of market share and improving profitability
Customer FocusTransformational customer experience through innovation, technology and data analytics
Delivery and DistributionLeveraging technology to bring digital experience and market access/penetration
Internal ProcessesAchieving operational excellence through automation, lean processes and data analytics
Human ResourcesAcquire and develop skills required to achieve our strategic agenda
Human Resources Financial M
anagement
Customer Focus
Inter
nal P
roce
sses
Disburse credit to Consumer, SME, Corporate clients
Offer savings and investment solutions
Facilitate payments and transactions
Innovating for our clients
Invest in operations, technology and physical infrastructure
Delivery and Distribution
A holistic strategy aimed at building
a future-ready, competitive Bank

24
Nations Trust Bank PLC Annual Report 2019
ECONOMIC AND POLICY DEVELOPMENTS2019 presented significant domestic and global economic challenges for Sri Lanka; policy measures taken to stabilise government finances and balance of payments together with impacts of the Easter Sunday attacks resulted in a sharp slowdown.
In providing the necessary impetus to stimulate the economy, the new government has announced sweeping tax cuts and measures to enhance credit flows to the SME sector. The Government is encouraging banks to support emerging entrepreneurs and new businesses, with relief to the sector being provided through an estimated 9% reduction in the effective tax rate.
Opportunities/Risks
Anticipated growth in credit demand
Potential impact on portfolio quality and recoverability
DIGITISATION AND DISRUPTIONAdvances in the technology environment are transforming every sphere of banking including the customer experience, disintermediation, delivery channels, process automations and competition among others. Technologies such as robotics, artificial intelligence, machine learning and blockchain are likely to have wide-ranging impacts on financial services over the next few years.
Opportunities/Risks
As a digitally-savvy bank, Nations Trust is well positioned to challenge the larger, traditional banks through best in class digital capabilities
Decreasing operating costs and enhancing customer service
Emergence of new risks pertaining to technology, cybersecurity and information
Competition for skills in IT and data analytics among others
OUR OPERATING ENVIRONMENT
Advances in the technology environment are transforming every sphere of banking including customer experience, disintermediation, delivery channels, process automations and competition among others.
New dynamics continue to reshape our operating landscape, presenting both opportunities and risks to long-term value creation. At Nations Trust, a dedicated team continually scans the external environment to identify these emerging trends, ensuring that the Bank’s strategy is adequately equipped to respond to these dynamics.
Our responseWe are committed to
supporting the Government’s development agenda through a
selective lending strategy which will enable us to channel funds to selected
areas of the economy while maintaining focus on portfolio
quality.
Our responseThe Bank has successfully carved
a niche position as a digital front-runner in the industry and
deploying technology to transform the customer experience and drive efficiencies will continue
to be a key priority.

25
NEXT GEN BANKING
CUSTOMER SOPHISTICATIONThe expectations of our customers continue to evolve, driven by increased sophistication, connectivity and demographic changes. Customers are increasingly demanding more convenient access and control of their finances, which in turn has transformed the way they prefer to interact with banks. Banks which are unable to respond to these dynamics are likely to see an erosion of competitive position over time, as niche digital banks offer more attractive value propositions.
Opportunities/Risks
Sharpen competitive edge through offering unique customer experience
Offer customer centric products and services
REGULATORY OVERSIGHTKey regulatory changes implemented in recent times include accounting and reporting changes such as IFRS 9-Financial Instruments, caps on deposit rates and lending rates, capital regulations, concessions to the tourism industry and SME sector and market conduct on treasury operations among others.
Opportunities/Risks
Implementation of stronger governance and risk management frameworks
Maintenance of adequate capital buffers
Increased complexity and cost of compliance
EMPHASIS ON ENVIRONMENTAL AND SOCIAL CONSIDERATIONSThe increasing prevalence of environmental and social challenges such as implications of climate change, persistent inequalities and infrastructure challenges have placed increased pressure on financial institutions to contribute towards sustainable economic, social and environmental development.
Opportunities/Risks
Contribute to sustainable finance initiatives aimed at addressing these challenges
Improved governance and transparency in overall business conduct
Emergence of new risks, particularly with regards to climate change
Our responseCustomer focus is a key pillar of
our strategy and we seek to redefine the customer experience by focusing on convenience, service and relevant
products and to be ahead of competition.
Our responseWe are committed to fully complying with all relevant
regulations and compliance is monitored by a dedicated unit on an
ongoing basis.
Our responseThe Bank is a signatory to
the SLBA’s Sustainable Banking Initiative, which encourages a multi-
stakeholder approach towards contributing to sustainable development. The Bank’s
sustainability agenda is also clearly articulated in a Sustainability Policy which is aligned to the Sustainable
Development Goals.

26
Nations Trust Bank PLC Annual Report 2019
ECONOMIC AND INDUSTRY PERFORMANCE
ECONOMIC GROWTH
0
1
2
3
4
5
6
GDP Growth
GDP Growth %
20152014 20172016 9M20192018
Sri Lanka’s economic growth slowed in 2019, with GDP expanding by a mere 2.6% in the nine months to September 2019. The slowdown reflected monetary and fiscal measures adopted to stabilise balance of payments and government finances together with effects of the Easter Sunday attacks and prolonged effects of the political uncertainties.
INTEREST RATES
7.8
8.3
8.8
9.3
9.8
10.3
10.8
11.3
11.8
12.3
12.8
AWPRT-Bill (1Yr)
AWPR and 1 Year T-Bill Rates %
Jan-
19Fe
b-19
Mar
-19
Apr-
19M
ay-1
9Ju
n-19
Jul-1
9Au
g-19
Sep-
19Oc
t-19
Nov
-19
Dec-
19
The Central Bank adopted a relatively accommodative monetary policy stance during the year, reducing policy rates by a total of 100 bps in May and August 2019. However, market interest rates remained high in the first part of the year, prompting the regulator to impose deposit and lending rate caps in April and September 2019 respectively. Resultantly, market interest rates declined during the 2nd half of 2019.
EXCHANGE RATESThe external sector recorded a mixed performance during the year, with the trade deficit and current account deficit contracting in response to policy measures taken to curb imports. As a result the Sri Lankan Rupee recorded a marginal appreciation in 2019 following its sharp depreciation in 2018.
INFLATION
3.0
3.5
4.0
4.5
5.0
5.5
6.0
6.5
CCPI CCPI (Core)
CCPI %
Jan
Feb
Mar Ap
rM
ay Jun Jul
Aug
Sep
Oct
Nov De
c
Inflation levels remained stable and in line with expectations with headline inflation recording low single digit levels in the first eight months of the year before recording a slight uptick towards the end of 2019. Y-o-Y core inflation was relatively higher than 2018 reflecting increases in the non-food category mainly impending from house rentals, education fees and fuel prices.
OUTLOOKFollowing the Presidential elections in November 2019, the new caretaker government has introduced several fiscal and monetary stimulus measures, including sweeping tax concessions and relief packages for SMEs. The Government expects these measures to accelerate credit growth, fostering a recovery of economic activity over the short to medium term. That said, the shift in fiscal policy and departure from the fiscal consolidation agenda could lead to a downturn in government revenue in the short term.
Banking sector performance indicator
Growth 5.0% credit growth in 2019 (19.4% in 2018 reflecting the slowdown in credit demand, particularly from the private sector.
Performance 11.0% decrease in profit after tax
Increase in loan loss provisioning and overhead costs
Return on Assets of 0.9% (1.1% in 2018)
Asset quality 45.0% increase in NPLs with broad-based deterioration in quality
Gross NPL ratio of 4.7% (3.4% in 2018)
Funding 7.9% growth in deposits
Shift from demand deposits to term and short-term savings
Decline of CASA ratio to 31.4%
4.7% decline in borrowings
Capital Common equity ratio of 13.0%
Total capital ratio of 16.5%
Liquidity Adequate liquidity buffers
Sri Lanka’s economic growth slowed in 2019, with GDP expanding by a mere 2.6% in the nine months to September 2019.
27
NEXT GEN BANKING
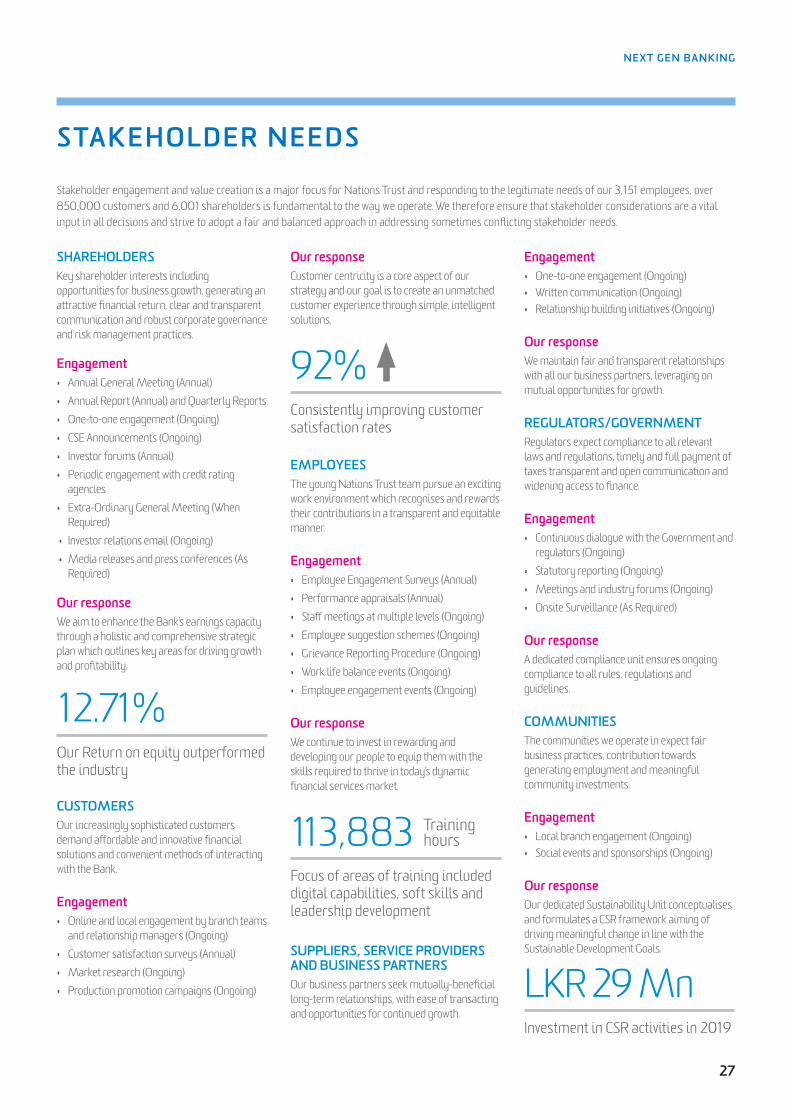
STAKEHOLDER NEEDS
SHAREHOLDERSKey shareholder interests including opportunities for business growth, generating an attractive financial return, clear and transparent communication and robust corporate governance and risk management practices.
Engagement• Annual General Meeting (Annual)• Annual Report (Annual) and Quarterly Reports• One-to-one engagement (Ongoing)• CSE Announcements (Ongoing)• Investor forums (Annual)• Periodic engagement with credit rating
agencies• Extra-Ordinary General Meeting (When
Required) • Investor relations email (Ongoing) • Media releases and press conferences (As
Required)
Our responseWe aim to enhance the Bank’s earnings capacity through a holistic and comprehensive strategic plan which outlines key areas for driving growth and profitability.
Our Return on equity outperformed the industry
12.71%
CUSTOMERSOur increasingly sophisticated customers demand affordable and innovative financial solutions and convenient methods of interacting with the Bank.
Engagement• Online and local engagement by branch teams
and relationship managers (Ongoing)• Customer satisfaction surveys (Annual)• Market research (Ongoing)• Production promotion campaigns (Ongoing)
Our responseCustomer centricity is a core aspect of our strategy and our goal is to create an unmatched customer experience through simple, intelligent solutions.
Consistently improving customer satisfaction rates
92%
EMPLOYEESThe young Nations Trust team pursue an exciting work environment which recognises and rewards their contributions in a transparent and equitable manner.
Engagement• Employee Engagement Surveys (Annual)• Performance appraisals (Annual)• Staff meetings at multiple levels (Ongoing)• Employee suggestion schemes (Ongoing)• Grievance Reporting Procedure (Ongoing)• Work life balance events (Ongoing)• Employee engagement events (Ongoing)
Our responseWe continue to invest in rewarding and developing our people to equip them with the skills required to thrive in today’s dynamic financial services market.
Focus of areas of training included digital capabilities, soft skills and leadership development
113,883
SUPPLIERS, SERVICE PROVIDERS AND BUSINESS PARTNERSOur business partners seek mutually-beneficial long-term relationships, with ease of transacting and opportunities for continued growth.
Stakeholder engagement and value creation is a major focus for Nations Trust and responding to the legitimate needs of our 3,151 employees, over 850,000 customers and 6,001 shareholders is fundamental to the way we operate. We therefore ensure that stakeholder considerations are a vital input in all decisions and strive to adopt a fair and balanced approach in addressing sometimes conflicting stakeholder needs.
Engagement• One-to-one engagement (Ongoing)• Written communication (Ongoing)• Relationship building initiatives (Ongoing)
Our responseWe maintain fair and transparent relationships with all our business partners, leveraging on mutual opportunities for growth.
REGULATORS/GOVERNMENT Regulators expect compliance to all relevant laws and regulations, timely and full payment of taxes transparent and open communication and widening access to finance.
Engagement• Continuous dialogue with the Government and
regulators (Ongoing)• Statutory reporting (Ongoing)• Meetings and industry forums (Ongoing)• Onsite Surveillance (As Required)
Our responseA dedicated compliance unit ensures ongoing compliance to all rules, regulations and guidelines.
COMMUNITIESThe communities we operate in expect fair business practices, contribution towards generating employment and meaningful community investments.
Engagement• Local branch engagement (Ongoing)• Social events and sponsorships (Ongoing)
Our responseOur dedicated Sustainability Unit conceptualises and formulates a CSR framework aiming of driving meaningful change in line with the Sustainable Development Goals.
Investment in CSR activities in 2019
LKR 29 Mn
Traininghours
28
Nations Trust Bank PLC Annual Report 2019
MATERIAL MATTERS
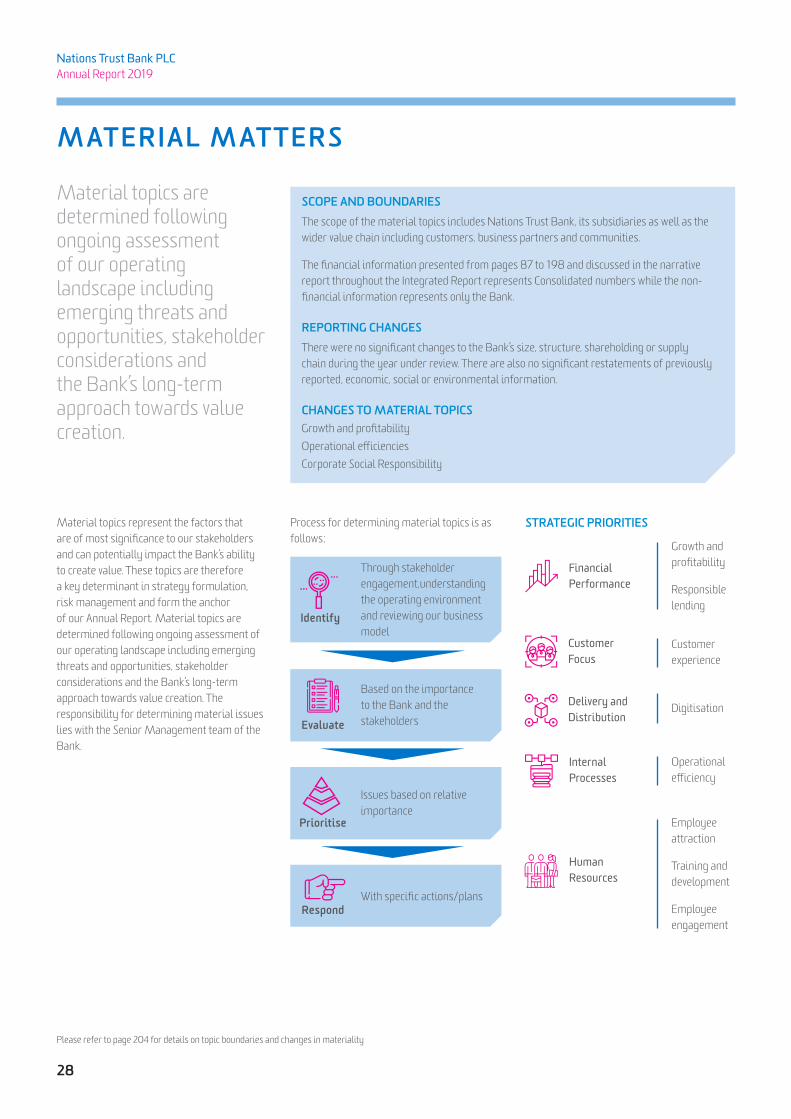
Material topics represent the factors that are of most significance to our stakeholders and can potentially impact the Bank’s ability to create value. These topics are therefore a key determinant in strategy formulation, risk management and form the anchor of our Annual Report. Material topics are determined following ongoing assessment of our operating landscape including emerging threats and opportunities, stakeholder considerations and the Bank’s long-term approach towards value creation. The responsibility for determining material issues lies with the Senior Management team of the Bank.
Identify
Evaluate
Prioritise
Respond
Through stakeholder engagement,understanding the operating environment and reviewing our business model
Based on the importance to the Bank and the stakeholders
Issues based on relative importance
With specific actions/plans
SCOPE AND BOUNDARIESThe scope of the material topics includes Nations Trust Bank, its subsidiaries as well as the wider value chain including customers, business partners and communities.
The financial information presented from pages 87 to 198 and discussed in the narrative report throughout the Integrated Report represents Consolidated numbers while the non-financial information represents only the Bank.
REPORTING CHANGESThere were no significant changes to the Bank’s size, structure, shareholding or supply chain during the year under review. There are also no significant restatements of previously reported, economic, social or environmental information.
CHANGES TO MATERIAL TOPICSGrowth and profitabilityOperational efficienciesCorporate Social Responsibility
STRATEGIC PRIORITIES
FinancialPerformance
Customer Focus
Delivery and Distribution
Internal Processes
Growth and profitability
Responsible lending
Customer experience
Digitisation
Operational efficiency
Employee attraction
Training and development
Employee engagement
Human Resources
Process for determining material topics is as follows;
Material topics are determined following ongoing assessment of our operating landscape including emerging threats and opportunities, stakeholder considerations and the Bank’s long-term approach towards value creation.
Please refer to page 204 for details on topic boundaries and changes in materiality

29
NEXT GEN BANKING
OUR BUSINESS LINES
Corporate Banking
PROGRESS IN 2019The Corporate Division’s growth strategy of focusing on client selection and service excellence continues to deliver results and with the Division demonstrating continued resilience to adverse market conditions.
Financial Performance• An effective segmentation strategy, coupled
with the acquisition of new customers and deeper relationships with existing customers resulted in portfolio growth of 16%.
• Net interest income grew by 32%, while net fee and commission too grew by 9% supported by contributions from structured financing transactions.
• Advances to corporates rated above B+ (based on internal risk ratings) accounted for 63% of the portfolio.
Customer Focus• The Division maintained proactive
engagement with customers, offering practical solutions in addressing prevalent cash flow stresses.
• Broadened the customer base by pursuing offshore opportunities in structured financing.
• Expansion of the mid-sized corporate portfolio.
Delivery and Distribution• Launch of Nations Direct Commercial
Payment solutions - the 1st phase of the cash management solution.
• Leveraging synergies across business verticals to harness cross-sell opportunities
Internal Processes• Ongoing focus on preserving portfolio
quality through emphasis on client selection, structuring facilities and risk-based pricing.
• The Division continues to achieve process and cost efficiencies; the cost-to-income ratio stood at 19%.
Human Resources• Considerable portfolio growth in recent
years has been achieved without a parallel increase in headcount, attesting to the significant gains made in employee productivity.
OUTLOOK FOR 2020With the anticipated recovery in investor sentiments, the Division will continue to drive strategy towards capturing growth opportunities in selected segments. Key areas of focus would be service excellence, relationship-driven portfolio management and pursuing cross-sell opportunities.
HIGHLIGHTS OF 2019
Loans & Advances 16%Revenue 26%Deposits -17%Cost-to-income ratio 19%
Rupee loan disbursements of
LKR 105 billion
Launch of
Nations Direct Commercial Payment
Harnessing
Cross-Sell Opportunities
STAKEHOLDER VALUE CREATION
Nations Trust Corporate Banking has uniquely positioned itself in the intensely competitive corporate segment by offering structured solutions, proactive and relationship-driven customer engagement and superior customer service
0
500
1,000
1,500
2,000
2,500
3,000
3,500
4,000
Net Interest IncomeFee IncomeOther IncomeProfit for the year
Corporate Banking LKR Mn
2017 2018 2019
Product PortfolioWorking Capital Financing | Structured finance & Syndications | Trade Finance
Cash Management | Corporate Cards
0
10
20
30
40
50
60
70
80
Corporate - Loan Portfolio LKR Bn
2017 2018 2019
Loan Portfolio

30
Nations Trust Bank PLC Annual Report 2019
OUR BUSINESS LINES
Treasury
PROGRESS IN 2019The Treasury Unit’s performance is directly impacted by fluctuations in interest and exchange rates and the year 2019 proved to be a year of mixed results. While Forex performance moderated in view of challenging market conditions, the gradual decline in interest rates during the year supported good growth in the fixed income segment.
Financial Performance• The Unit’s performance was upheld by
strong results in fixed income, with revenue and profit increasing by 35% and 38% respectively.
• The Unit also generated net trading gains of LKR 283 million during the year.
Fixed Income• The reduction in policy rates and downward
revision of the SRR resulted in a gradual decline in market interest rates.
• As prices strengthened, the Unit sought to divest a portion of its AFS portfolio leading to increased profitability.
• The Division outperformed budgets and was a key contributor to the Treasury Unit’s profitability during the year.
Forex Trading• The Unit’s Forex operations comprise
customer forex trading and proprietary trading.
• The adverse market conditions which prevailed during the year led to a drop of volumes on customer Forex trading, although this was partially offset by a few large transactions which generated healthy margins.
• The Bank continued to adopt the strategy of utilising FX SWAP book to fund its rupee loan growth due to the benefit arising from the relatively lower funding costs of the FX SWAPS compared to high cost rupee deposits.
• Overall the division recorded a 14% decline in FX income.
Asset Liability Management• The ALM desk ensures that adequate
funding is available to drive growth objectives.
• Despite exposure to mark-to-market losses arising from fluctuating SWAP premiums, the Bank continues to benefit from the relatively lower funding costs of the FX swaps compared to rupee deposits.
• The Bank raised USD 16 million through a syndicated loan, LKR 5 billion via securitised borrowings and LKR 4.5 billion via the issue of subordinated redeemable debentures.
OUTLOOK FOR 2020Policy stability is expected to provide some impetus for improved sentiments in 2020. The accommodative monetary and fiscal policy adopted by the Government is expected to stimulate economic activity, although fiscal slippage is likely given upcoming general elections. We will continue to seek avenues to diversify our funding base in obtaining relatively low-cost funding.
HIGHLIGHTS OF 2019
Revenue 35%FIS portfolio -9%Customer FX income 1%Cost-to-income ratio 11.7%
Strengthened Treasury Teamwith 424 function specific training hours
Raised
LKR 12.5 billion in New Funding
Enhanced
ALM Capabilities
STAKEHOLDER VALUE CREATION
The Treasury Unit plays a vital role in ensuring that the Bank has sufficient funding to drive its strategy while managing the investment portfolio and facilitating foreign exchange trading. It also plays a key role in managing the Bank’s market risk exposures including interest rate and liquidity risk through the ALM desk
Product PortfolioForeign exchange trading & hedging | Fixed income trading | Corporate debt issuance
0
500
1,000
1,500
2,000
2,500
3,000
3,500
4,000
Net Interest IncomeFee IncomeProfit for the year
Treasury LKR Mn
2017 2018 2019

31
NEXT GEN BANKING
SME
PROGRESS IN 2019The SME Division’s timely strategy of consciously moderating lending and consolidating its portfolio delivered results during the year, and the Division is now aptly positioned to pursue selective growth opportunities in 2020.
Financial Performance• Having recognised potential macro-
economic pressures in 2018, the Division’s conscious effort to focused underwriting resulted in the loan portfolio contracting by 6%.
• As anticipated NII and net fee and commission income also declined by a respective 17% and 1% compared to 2018.
• Continued focus on streamlining processes resulted in efficient cost management.
Customer Focus• Challenging market conditions afforded an
opportunity to nurture deeper customer relationships. We sought to segment and proactively engage with distressed customers offering flexible payment options.
• Adopted the RAROC model in clearly identifying profitable customers.
Internal Processes• Recovery drive with dedicated cross-
functional project team appointed to eliminate process bottlenecks.
• Strengthened post-disbursement credit monitoring including policies, processes and mechanisms.
• Strengthened underwriting for new credit including more stringent assessment of collateral and deeper industry analytics among others.
• Streamlined all credit processes in driving increased efficiencies, thereby recording improved audit scores.
Human Resources• Intense training for credit officers
including the introduction of a certification programme.
• Certification for relationship managers covering credit, governance, policies and grooming.
• Increased resources deployed towards recoveries.
OUTLOOK FOR 2020Given the Government’s recent policy measures including concessions granted to the SME sector, we remain optimistic regarding the revival of the economy in 2020. The Division has identified several growth sectors and will pursue a selective lending strategy, with continued focus on portfolio profitability. Having streamlined our processes and client portfolio we are now in a strong footing to capture growth opportunities arising from improved business sentiments and anticipated recovery of the economy.
HIGHLIGHTS OF 2019
Loans & Advances -6%Revenue -13%Deposits 2%Cost-to-income ratio 40%
Rupee loan disbursements of
LKR 23 billion
Strengthened
Internal Processes and Efficiencies
95 Certified Credit Officers
STAKEHOLDER VALUE CREATION
The SME Division caters to the lending and investment requirements of the country’s SME sector. Aggressive growth was cautiously curtailed during the year considering the prevailed economic conditions.
0
1,000
2,000
3,000
4,000
5,000
6,000
Net Interest IncomeFee IncomeOther IncomeProfit for the year
SME Banking LKR Mn
2017 2018 2019
Product PortfolioBusiness Banking | Investment products | Business loans
(Working capital financing, Trade financing, Fixed term financing)
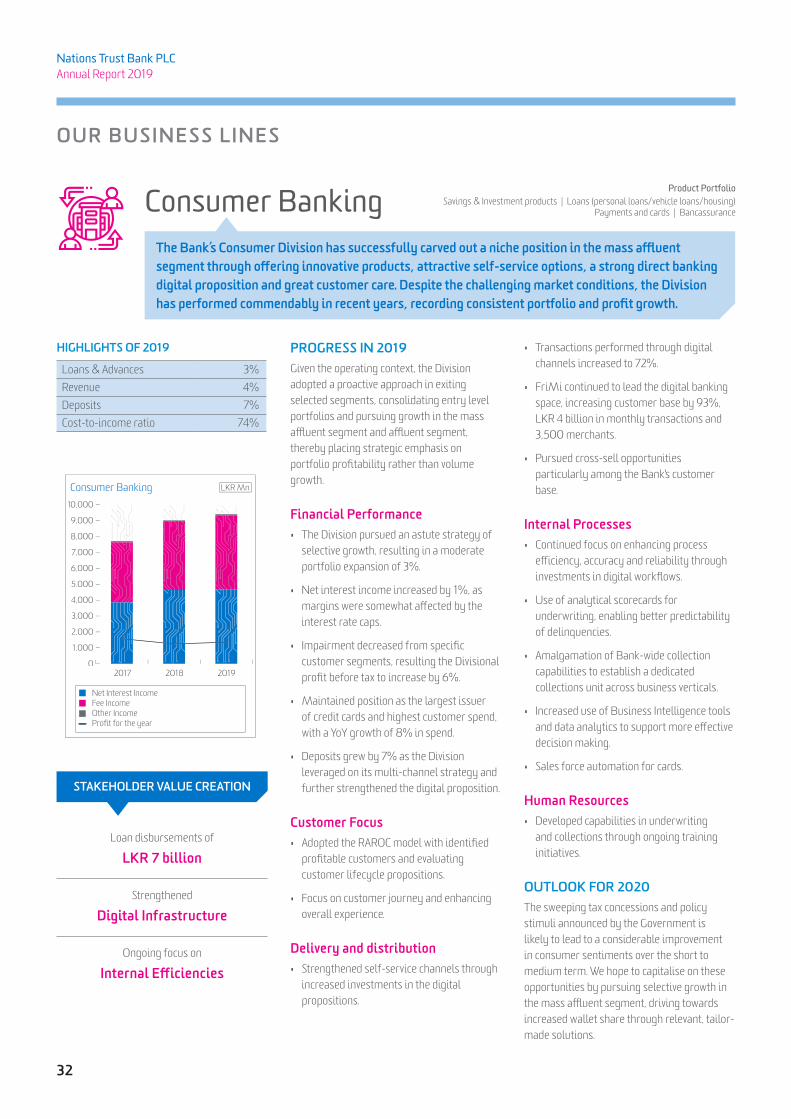
32
Nations Trust Bank PLC Annual Report 2019
OUR BUSINESS LINES
The Bank’s Consumer Division has successfully carved out a niche position in the mass affluent segment through offering innovative products, attractive self-service options, a strong direct banking digital proposition and great customer care. Despite the challenging market conditions, the Division has performed commendably in recent years, recording consistent portfolio and profit growth.
Consumer Banking
PROGRESS IN 2019Given the operating context, the Division adopted a proactive approach in exiting selected segments, consolidating entry level portfolios and pursuing growth in the mass affluent segment and affluent segment, thereby placing strategic emphasis on portfolio profitability rather than volume growth.
Financial Performance• The Division pursued an astute strategy of
selective growth, resulting in a moderate portfolio expansion of 3%.
• Net interest income increased by 1%, as margins were somewhat affected by the interest rate caps.
• Impairment decreased from specific customer segments, resulting the Divisional profit before tax to increase by 6%.
• Maintained position as the largest issuer of credit cards and highest customer spend, with a YoY growth of 8% in spend.
• Deposits grew by 7% as the Division leveraged on its multi-channel strategy and further strengthened the digital proposition.
Customer Focus• Adopted the RAROC model with identified
profitable customers and evaluating customer lifecycle propositions.
• Focus on customer journey and enhancing overall experience.
Delivery and distribution• Strengthened self-service channels through
increased investments in the digital propositions.
• Transactions performed through digital channels increased to 72%.
• FriMi continued to lead the digital banking space, increasing customer base by 93%, LKR 4 billion in monthly transactions and 3,500 merchants.
• Pursued cross-sell opportunities particularly among the Bank's customer base.
Internal Processes• Continued focus on enhancing process
efficiency, accuracy and reliability through investments in digital workflows.
• Use of analytical scorecards for underwriting, enabling better predictability of delinquencies.
• Amalgamation of Bank-wide collection capabilities to establish a dedicated collections unit across business verticals.
• Increased use of Business Intelligence tools and data analytics to support more effective decision making.
• Sales force automation for cards.
Human Resources• Developed capabilities in underwriting
and collections through ongoing training initiatives.
OUTLOOK FOR 2020The sweeping tax concessions and policy stimuli announced by the Government is likely to lead to a considerable improvement in consumer sentiments over the short to medium term. We hope to capitalise on these opportunities by pursuing selective growth in the mass affluent segment, driving towards increased wallet share through relevant, tailor-made solutions.
HIGHLIGHTS OF 2019
Loans & Advances 3%Revenue 4%Deposits 7%Cost-to-income ratio 74%
Loan disbursements of
LKR 7 billion
Strengthened
Digital Infrastructure
Ongoing focus on
Internal Efficiencies
STAKEHOLDER VALUE CREATION
0
1,000
2,000
3,000
4,000
5,000
6,000
7,000
8,000
9,000
10,000
Net Interest IncomeFee IncomeOther IncomeProfit for the year
Consumer Banking LKR Mn
2017 2018 2019
Product PortfolioSavings & Investment products | Loans (personal loans/vehicle loans/housing)
Payments and cards | Bancassurance

33
NEXT GEN BANKING
Leasing
PROGRESS IN 2019Following aggressive portfolio growth in the past few years which delivered healthy profits, the Leasing Division consciously curtailed lending in 2019, placing strategic emphasis on preserving portfolio quality.
Financial Performance• Although the leasing portfolio contracted
by 1%, the net interest income increased by 7% compared to last year.
• Cash-flow stresses across several sectors including construction, travel and tourism resulted in an increase in impairments, thereby affected overall profitability.
Customer Focus• Establishment of a one-stop-shop offering
all leasing-related services.
• As customers faced genuine cash-flow difficulties, we maintained close engagement to offer flexible solutions with a view to long-term retention.
• Increased engagement through social media platforms.
Delivery and Distribution• Initiated processes to digitise the delivery
mechanism, First in the leasing industry.
Internal Processes• Refined collection mechanisms and
deployed increased resources towards strengthening collection capabilities.
• Investments in streamlining and automating process with the objective of reducing turnaround times.
Human Resources• Ongoing investment in team building
through numerous engagement initiatives including excursions and adventure-based outdoor trainings.
• Continuous opportunities for training and competency development.
OUTLOOK FOR 2020The slowdown in market conditions offered the Division an opportunity to strengthen its internal processes and put in place a strong foundation to pursue growth in 2020. Core areas of focus will be digitisation of delivery mechanisms, increasing penetration in the mass affluent segment and strengthening our presence in the Western Province.
HIGHLIGHTS OF 2019
Loans & Advances -1%Revenue 6%Cost-to-income ratio 35%
Leasing disbursements of
LKR 21 billion
Investments in
Digital Delivery
Streamlining &
Automating Processes
STAKEHOLDER VALUE CREATION
The Bank’s Leasing Division offers a range of vehicle, equipment and machinery financing solutions. The Division’s ability to identify and respond to emerging market dynamics through innovative products, delivery mechanisms and flexible solutions has afforded it an edge in this highly competitive space
0
500
1,000
1,500
2,000
2,500
Net Interest IncomeFee IncomeProfit for the year
Leasing LKR Mn
2017 2018 2019
Product PortfolioVehicle financing | Equipment and machinery financing
0
10
20
30
40
50
Leasing Portfolio LKR Bn
2017 2018 2019
Leasing Portfolio

34
Nations Trust Bank PLC Annual Report 2019
FINANCIAL CAPITAL
3CAPITAL MANAGEMENT
Financial Capital 34Manufactured Capital 37Digital Capital 38Intellectual Capital 41Human Capital 42Social and Relationship Capital 46Natural Capital 50Independent Assurance Report 53
MOBILE BANKINGConvenience just got an upgrade, Managing your money on the go is now faster, easier and more secure than ever before!
The Group delivered a resilient performance in 2019 with profitability remaining relatively unchanged over the previous year, despite adverse operating conditions. Performance was supported by strategic focus on portfolio profitability, efforts to preserve portfolio quality and ongoing initiatives to drive productivity enhancements.
INCOME STATEMENT ANALYSIS
Net Interest Income (NII)The Group’s NII growth was moderate at 6.4% in 2019, reflecting conscious efforts to consolidate our portfolio in view of subdued economic conditions and an industry-wide deterioration in credit quality. Accordingly, loan growth moderated to 2.4%, with the SME and Leasing portfolios recording respective contractions of 6.1% and 0.5% respectively. Meanwhile the Corporate loan book continued to perform well, expanding by 16.1% as the segment sought to deepen relationships with existing customers and pursue selective client acquisition. During the year strategic focus was placed on portfolio profitability, rather than volume growth, with all business verticals adopting the RAROC model for customer selection. Regulator-imposed caps on interest rates together with the incremental interest suspension on NPLs resulted in the Group’s net interest margin (NIM) narrowing to 4.86% from 5.03% in 2018.
0
5,000
10,000
15,000
20,000
Net Interest IncomeNIM - (NTB)
NIM - (Industry)
NII Trends%LKR Mn
2015 2016 20192017 2018
3
4
5
6
Refer to Business line Reviews on pages 29 to 33 for further information

35
NEXT GEN BANKING
FINANCIAL CAPITAL INPUTS
Shareholders’ fundsLKR 31.40 billion
Customer depositsLKR 226.87 billion
Other borrowingsLKR 40.55 billion
DEVELOPMENTS IN 2019Pursued selective lending
opportunities, resulting in a loan growth of 2%
Strengthened collection and monitoring mechanisms
which enabled preservation of portfolio quality
Capital augmentation through LKR 4.5 billion debenture issue, scrip
dividend issue, DFI USD 36 million fundig line and Securitisation of LKR 6 billion
STRATEGIC RELEVANCE
Financial PerformanceOngoing focus on driving profitable volume growth
Internal ProcessesEnhanced collection and recovery
mechanisms while investing in process automation and digitisation
Value Created/Delivered
Profitable Growth Preservation of Portfolio Quality
Stronger Balance Sheet
2% growth in lending portfolio
Profit for the year: LKR 3.71 billion
Earnings per share: LKR 13.08
Gross NPL ratio of 6.17% (2018: 4.58%)
Increase in impairment charges contained at 0.8%
LKR 4.5 billion raised through BASEL III compliant redeemable debenture
Total capital ratio enhanced to 17.96%
Other IncomeThe non-interest-income comprises fee and commission income, net trading income and other operating income and increased by 4.4% to reach LKR 6.42 billion during the year. Net fee and commission increased by 1.92% reflecting the Corporate Banking segment’s presence in structured financing as well as growth in credit cards, although this was somewhat offset by lower volume growth in the SME segment. Net gains/losses from trading amounted to a loss of LKR 1.32 billion, reflecting losses on derivative financial instruments as the forex rate appreciated during the year. However, a parallel gain was recorded in Net other operating income amounting to LKR 1.57 billion (compared to a loss of LKR 2.67 billion the previous year), reflecting a positive change in the net liability. This reflects the Bank’s funding strategy of utilising the FX SWAP book to fund its Rupee loan growth, in order to benefit from the relatively lower funding costs compared to high cost Rupee deposits. Total operating income grew by 5.8% to LKR 22.55 billion during the year under review.
Impairment charges on loans and advancesThe increase in impairment charges on loans and advances was contained to 0.8% during the year, despite an industry-wide deterioration in credit quality due to moderating economic conditions post-April attacks. Timely decisions made in 2018 to exit certain customer segments coupled with the Group’s conscious efforts to curtail lending, particularly in the SME sector allowed the Group to preserve portfolio quality to a certain extent. Accordingly, the Group’s gross NPL ratio for the year clocked in at 6.17% compared to 4.58% the year before. Adoption of the RAROC model and efforts made in strengthening the Group’s collection mechanisms, upskilling employees and streamlining recovery processes will augur well for the Group in 2020, placing it on a strong platform to pursue selective lending opportunities.
Cost ManagementDriving cost efficiencies through investments in process automation, digitisation and lean initiatives is a key priority for the Group. These initiatives enabled the Group to contain the increase in operating expenses to 4.8% during the year; this was led by a 8.8% increase in personnel expenses and an increased depreciation charge following the implementation of SLFRS 16. On the other hand, other operating expenses declined by 6.9% during the year reflecting the reduction in operating lease expenses in line with SLFRS 16. Overall the Group’s cost-to-income ratio improved to 47.92% for the year, a decrease from last year’s 48.38% mainly due to the moderation in income growth.
TaxationKey components of our taxation for the year included financial VAT, Nations Buildings, Debt Repayment Levy and Income Tax. The Group’s total tax contribution increased by 17.6% to LKR 4.73 billion during the year, primarily due to the Debt Repayment Levy which was in place during the year. Accordingly, taxes and levies on financial services amounted to LKR 2.67 billion (+42.5%) while the Group’s income tax expense remained relatively unchanged at LKR 2.07 billion.
0
5,000
10,000
15,000
20,000
25,000
Net Interest IncomeNon - Interest Income
Operating Income LKR Mn
20192018201720162015

36
Nations Trust Bank PLC Annual Report 2019
0
2,000
4,000
6,000
8,000
10,000
12,000
Other ExpensesDepreciation & AmortisationPersonnel ExpensesCost-to-Income Ratio
Cost ManagementLKR Mn %
40
45
50
55
60
20192018201720162015
ProfitabilityDespite the extremely challenging operating conditions that prevailed in 2019, the Group delivered a commendable performance with profit after tax increasing marginally to LKR 3.71 billion, compared to LKR 3.70 billion the previous year. Performance reflects the Group’s focus on customer profitability, smart margin and cost management as well as proactive efforts in curtailing impairments.
Meanwhile, the Group’s Return on Assets and Return on Equity declined marginally to a respective 1.14% and 12.71%, from 1.25% and 15.26% respectively in 2018 reflecting a stronger equity base following capital augmentation during the year.
Other Comprehensive Income (OCI)The Group’s Other Comprehensive Income amounted to LKR 664 million during the year (compared to a loss of LKR 288 million) mainly due to gains generated on the net change in fair value of investment securities available for sale, as interest rates gradually tapered off. The Bank’s Available for Sale portfolio is subject to mark to market valuation and comprises government securities which are maintained primarily for regulatory requirements on liquidity.
0
1,000
2,000
3,000
4,000
Proft After TaxReturn on Assets
Earnings%LKR Mn
2015 2016 20192017 2018
0.5
1.0
1.5
2.0
Value Added Tax (VAT)Nation Building Tax (NBT)Debt Repayment Levy (DRL) Income Tax
Tax Composition %
34
418
4444444
41
34
BALANCE SHEET ANALYSIS
Asset growthStrategic emphasis on consolidating our portfolio in 2019 resulted in the total asset base remaining relatively unchanged at LKR 325.37 billion. Loan growth was curtailed at 2.4%, as the Group pursued only selective lending opportunities primarily in the Corporate and Consumer segments while the Leasing and SME portfolios recorded contraction during the year. The asset composition tilted more towards liquidity assets following a stronger funding position and the relatively slow loan growth during the year, with liquid assets (DBU) accounting for 23.78% of total assets (compared to 22.32% the previous year). Credit assets accounted for 70% of the Group’s total assets as at end-December 2019.
Capital and FundingLiabilities declined by 1.3% to LKR 294 billion during the year, reflecting a 2.0% contraction in the deposit base as the Group did not actively pursue deposit mobilisation given subdued loan growth. Borrowings increased by 40% as the Bank obtained a USD 36 million funding line from a Development Finance Institution and increased exposure to securitised borrowings. The Group strengthened its tier 2 capital with the issue of BASEL III LKR 4.5 billion subordinated, redeemable debenture issue in December 2019 which was oversubscribed. The Group also enhanced its core capital with the issue of a scrip dividend and conversion of non-voting shares to voting shares during the year. Following these initiatives, the Group’s tier 1 and overall capital adequacy ratios strengthened to 13.30% and 17.96% respectively by end-December 2019 and Nations Trust Bank is now aptly positioned to capture emerging growth opportunities in the mid to long-term.
OutlookWith economic conditions expected to improve following policy stability and the relatively accommodative fiscal and monetary policy stance, we are well positioned to pursue selective growth opportunities across all key business verticals. The prevalent conditions in 2019 afforded an opportunity to strengthen our internal processes including underwriting, collection and recovery mechanisms and the Group has built a solid platform to drive profitable asset growth in 2020 and beyond. We are also encouraged by the tax concessions granted to the Banking sector, which is expected to result in a considerable decline in the effective tax rate.
CAPITAL MANAGEMENTFinancial Capital

37
NEXT GEN BANKING
MANUFACTUREDCAPITAL
Our physical infrastructure primarily comprises our branch network, which is the key contact point for customer engagement, facilitating asset and liability growth.
ISLAND-WIDE BRANCH REACHNations Trust’s channel strategy continues to reflect more emphasis on digital channels while consolidating and optimising the physical network. The island-wide network of 96 branches are used as a platform to drive regional growth and increase the CASA base.
We adopt a three-tiered branch structure, which facilitates more effective deployment of resources. In line with our overall strategy, we focused on enhancing branch profitability during the year. Branch performances are assessed through a robust monitoring system which comprises of KPI dashboards and business intelligence tools. During the year under review 97% of our branches were profitable.
As the Bank continues to pursue cross-sell opportunities across its verticals, our branch network has also evolved to sell multiple products. During the year, cross-sold cards, Personal Loans, Leasing, Factoring and Mid Corporate Loans contributed to 23% of the total branch revenue.
VALUE ADDITION IN 2019In 2019, the Bank invested LKR 185 million in upgrading its physical infrastructure. Key avenues of investment included the following;
• Relocation of the data centre to a strategic location outside the Bank
• Establishment of a one-stop-shop for leasing in Colombo
• Opened two new branches
• Upgraded of two branches
MANUFACTUREDCAPITAL INPUTS
Network of96 branches
Other physical assetsLKR 2,390 million
DEVELOPMENTS IN 2019
LKR 185 million Investment in upgrading physical infrastructure
Consolidation ofBranch network
STRATEGIC RELEVANCE
Financial PerformanceOngoing focus on branch level profitability
Delivery and DistributionPursuing cross-sell opportunities
Value Created/Delivered
Portfolio growth and Deposit mobilisation
Cross-sell Profitability contribution
Deposit base of LKR 227 billion
27% CASA ratio
2% growth in loans and advances
LKR 27.8 billion cross - sell portfolio in branch network
40% contribution to profits from branches
93 profitable branches
0
100
200
300
400
500
600
700
800
Land & BuildingsOther EquipmentComputer HardwareFurniture, Fixtures & FittingsLeasehold Improvements
Investments in Manufactured Capital
LKR Mn
2017 2018 2019

38
Nations Trust Bank PLC Annual Report 2019
CAPITAL MANAGEMENT
DIGITALCAPITAL
Our journey of digital transformation has laid a solid foundation for driving unparalleled improvements in customer service, facilitating business value addition and ultimately sharpening our competitive edge.Digital investmentsDigital capital continues to be the key focus of investment for the Bank, accounting for 75% of total capital expenditure in 2019. It is reflected in the balance sheet at a Net Book Value of LKR 2,083 million which amounts to 47% of Property, Plant and Equipment. Aligned to the strategic priorities of customer focus, delivery and distribution and internal processes, our digital strategy aims to use technology as an enabler in creating simple, intelligent and inclusive solutions for both internal and external customers.
IT GovernanceThe Board is ultimately responsible for the Bank’s IT strategy while executive responsibility for implementation lies with the Chief Information Officer and Chief Digital Officer. The IT Steering Committee assists the CEO by providing oversight on the implementation of the digital strategy and ensures that IT and cyber-risk exposures are managed within defined parameters. As IT has gained a strategic importance, the time devoted to the IT agenda has grown in tandem, ensuring that investment objectives are met.
IT security measures in place include the following;• Compliance to ISO 27001:2013-Policies
and procedures, Security Governance and Regulatory Compliance
• Cyber drills• Security testing and assurance• Access controls and firewalls• Event correlation, log reviews, alerts and
monitoring• Malware protection• Web security• CERT support
DIGITALCAPITAL INPUTS
Computer hardwareLKR 708 Mn
Software licenses LKR 1,376 MnTech-savvy team
DEVELOPMENTS IN 2019
LKR 567 MnInvestment in upgrading
digital infrastructure
Enhance mobile banking platform and FriMi user interface
Process efficiencies through data analytics and RPA
STRATEGIC RELEVANCE
Customer FocusEmphasis on user experience and
customer service
Delivery and DistributionOffering customers a seamless,
omni-channel experience
Internal ProcessesIncreased efficiency, reliability
and accuracy of processes
Value Created/Delivered
Digital transactions Customer onboarding Process improvements
72% transactions performed through digital channels
55% increase in digital transaction volumes
29% increase in mobile/online banking subscribers
93% increase in FriMi customer base
Improved turnaround time in SME credit processing
0
200
400
600
800
1,000
1,200
Investment in Software & LicensesInvestment in Computer EquipmentInvestment in Other PPE
Digital Investments LKR Mn
2017 2018 2019

39
NEXT GEN BANKING
OUR DIGITAL STRATEGY IS AIMED AT
Enhancing the customer
experience
Driving operational efficiencies
Leveraging on ecosystem partnerships
Product focused
proposition
Branch centric interaction
Lack of agility and
adaptability
Integrated offering digital
enablement
Convenient 24/7
self-service platforms
Simplicity and agility through
digitised customer processes
Old New Offering
CUSTOMER EXPERIENCEOur goal is to offer our customers simple, intelligent and inclusive solutions through a seamless, omni-channel experience. We have prioritised investments that enhance user experience and product functionality beyond traditional banking products. Digital channels now account for 72% of transactions performed, confirming increased client preferences for self-service channels which are more accessible and convenient.
Key achievements in 2019 include,
• Enhanced the mobile banking proposition through added features and continuous improvements to user experience
We have prioritised investments that enhance user experience and product functionality beyond traditional banking products. Digital channels now account for 72% of transactions performed, confirming increasing client preferences for self-service channels which are more accessible and convenient.
• Automation of repetitive manual tasks through RPA
• Upgrade of the credit card system
• Launch of SME workflow system
• Launch of the open API Banking platform enabling business to directly link their bank accounts for transactions and information sharing
WAY FORWARDDigital capital will continue to be a key area of investment in 2020 as we seek to further sharpen our competitive edge through enhancing our digital proposition. Key areas of focus will include adding lifestyle solutions and commercialising FriMi, launch of an excess management system, upgrading the Treasury system and further strengthening digital onboarding of customers among others.
• Launch of the corporate internet banking platform with cash management solutions
• Revamped the FriMi user interface and enhanced functionality
• Enhanced customer responsiveness through increased interaction on social media
DRIVING OPERATIONAL EFFICIENCIESWe leverage on our digital capabilities in optimising business and operating models to drive operational efficiencies and simplify processes. Key areas of focus during the year included,
• Increased use of data analytics in improving predictability

40
Nations Trust Bank PLC Annual Report 2019
CAPITAL MANAGEMENTDigital Capital
Send moneySend cash instantly to other FriMi users
Fund transferInter-bank or Intra-bank fund transfers
QR paymentsSecure payment through merchant QR codes
Payments via mobile numberPayments to leading supermarkets and top retailers through the mobile number
Request moneyRequest funds from other FriMi users
Bill paymentsOver 70 billers including insurance, leasing, utility bills, club membership payments, credit card payments, education etc
Cash tokenTransfer funds to a person’s mobile number, enabling withdrawal through any Nations Trust ATM
SavingsAn account with attractive interest rates
SRI LANKA’S LEADING DIGITAL BANKING EXPERIENCE“SRI LANKA’S LEADING FULLY-FLEDGED DIGITAL BANKING EXPERIENCE, FRIMI HAS REDEFINED INDUSTRY STANDARDS IN CONVENIENCE AND CUSTOMER EXPERIENCE BY COMBINING BANKING, MOBILE WALLET AND PAYMENT SOLUTIONS INTO A SINGLE PLATFORM. AS THE UNDISPUTED MARKET LEADER IN THIS SPACE, FRIMI HAS EMERGED AS A LIFESTYLE BRAND OFFERING AN ARRAY OF SERVICES AND FEATURES TO THE DISCERNING, DIGITALLY SAVVY SRI LANKAN CONSUMER”
Highlights of 2019• Awarded the Best New Fin-
Tech Bank in Sri Lanka by the prestigious Global Banking and Finance Awards for 2019.
• Ranked among the Top 20 E-Commerce brands of Sri Lanka by the LMD Brands Annual report 2019.
• Value additions/features added during the year,
• Launch of a chatbot on the website frimi.lk
• Bill split
• Revamp of app user interface
• Credit card settlement of 13 banks
• Numerous customer engagement initiatives
93% increase in customer base
Monthly transaction
value of over LKR 4 billion
Island-wide merchant
network of over 3,500
70% market share in
Justpay internet banking
transactions
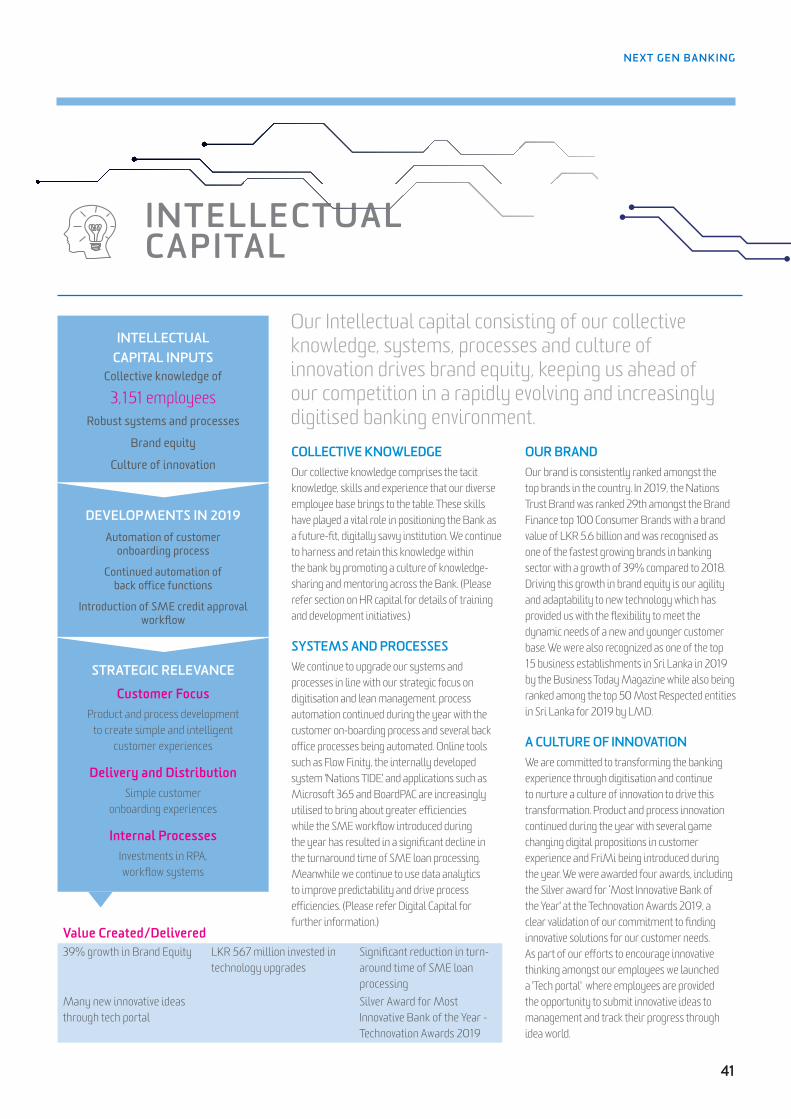
41
NEXT GEN BANKING
INTELLECTUALCAPITAL
Our Intellectual capital consisting of our collective knowledge, systems, processes and culture of innovation drives brand equity, keeping us ahead of our competition in a rapidly evolving and increasingly digitised banking environment.COLLECTIVE KNOWLEDGE Our collective knowledge comprises the tacit knowledge, skills and experience that our diverse employee base brings to the table. These skills have played a vital role in positioning the Bank as a future-fit, digitally savvy institution. We continue to harness and retain this knowledge within the bank by promoting a culture of knowledge-sharing and mentoring across the Bank. (Please refer section on HR capital for details of training and development initiatives.)
SYSTEMS AND PROCESSESWe continue to upgrade our systems and processes in line with our strategic focus on digitisation and lean management. process automation continued during the year with the customer on-boarding process and several back office processes being automated. Online tools such as Flow Finity, the internally developed system 'Nations TIDE', and applications such as Microsoft 365 and BoardPAC are increasingly utilised to bring about greater efficiencies while the SME workflow introduced during the year has resulted in a significant decline in the turnaround time of SME loan processing. Meanwhile we continue to use data analytics to improve predictability and drive process efficiencies. (Please refer Digital Capital for further information.)
OUR BRANDOur brand is consistently ranked amongst the top brands in the country. In 2019, the Nations Trust Brand was ranked 29th amongst the Brand Finance top 100 Consumer Brands with a brand value of LKR 5.6 billion and was recognised as one of the fastest growing brands in banking sector with a growth of 39% compared to 2018. Driving this growth in brand equity is our agility and adaptability to new technology which has provided us with the flexibility to meet the dynamic needs of a new and younger customer base. We were also recognized as one of the top 15 business establishments in Sri Lanka in 2019 by the Business Today Magazine while also being ranked among the top 50 Most Respected entities in Sri Lanka for 2019 by LMD.
A CULTURE OF INNOVATIONWe are committed to transforming the banking experience through digitisation and continue to nurture a culture of innovation to drive this transformation. Product and process innovation continued during the year with several game changing digital propositions in customer experience and FriMi being introduced during the year. We were awarded four awards, including the Silver award for ‘Most Innovative Bank of the Year' at the Technovation Awards 2019, a clear validation of our commitment to finding innovative solutions for our customer needs. As part of our efforts to encourage innovative thinking amongst our employees we launched a 'Tech portal' where employees are provided the opportunity to submit innovative ideas to management and track their progress through idea world.
INTELLECTUALCAPITAL INPUTS
Collective knowledge of
3,151 employeesRobust systems and processes
Brand equity
Culture of innovation
DEVELOPMENTS IN 2019Automation of customer
onboarding process
Continued automation of back office functions
Introduction of SME credit approval workflow
STRATEGIC RELEVANCE
Customer FocusProduct and process development
to create simple and intelligent customer experiences
Delivery and DistributionSimple customer
onboarding experiences
Internal ProcessesInvestments in RPA, workflow systems
Value Created/Delivered39% growth in Brand Equity LKR 567 million invested in
technology upgradesSignificant reduction in turn- around time of SME loan processing
Many new innovative ideas through tech portal
Silver Award for Most Innovative Bank of the Year - Technovation Awards 2019

42
Nations Trust Bank PLC Annual Report 2019
HUMANCAPITAL
As a young and agile team with an average age of 29, our employees are critical in driving our digitisation agenda, facilitating unique customer experiences while living our brand values.
MANAGING OUR PEOPLE We ensure the fair and equitable treatment to all employees through a clearly defined HR framework comprising a Board-approved suite of policies governance structure, systems and processes and a unique organisational culture which promotes teamwork and empowerment. The framework is structured to ensure compliance with all legal frameworks as well as industry best practices. Implementation of the HR framework is the responsibility of the HR Department which reports to the CEO and to the Remuneration Committee on matters assigned to them by the Board. All policies are reviewed and updated at least on an annual basis. The Bank does not have collective agreements in place.
STRATEGIC FOCUSIn recent years, the Bank’s People Strategy has been aligned to the Bank’s overall strategy of deploying technology to enhance the experience of external and internal customers. The Bank’s increasing digitisation has resulted in a change in the core competencies we seek from new employees, leading to revisions
to the Bank’s recruitment, engagement and training agenda.
Key areas of focus in 2019 included the following;
Attracting employees with the right skills
Team ProfileThe skill profile we seek in new recruits has changed in line with our overall strategy, with increased focus on IT, digital and data analytics. Selection procedures are designed to identify these critical skills and recruit employees who have the right ethos to thrive in the Bank’s agile and collaborative culture, with emphasis on ability to manage change and work in teams. We are an equal opportunity employer and our policies are designed to employ, remunerate and evaluate employees based on their skills, experience and performance irrespective of gender, age or religion. The remuneration ratio between men and women at entry level is 1:1. During the year, we added 960 new recruits to our team, the profiles of whom are presented in the charts.
HUMAN CAPITAL INPUTS
3,151Employees
43% Female Representation
DEVELOPMENTS IN 2019
Launch of a new Competency Framework focusing on
banking in the digital world
Launch of ‘Create Tomorrow’ - the new employer brand
Maintained a high level of engagement
STRATEGIC RELEVANCE
Human Resources
Building an agile and diverse team which can deliver our digitisation
agenda and create unique customer experience
Value Created/Delivered
A skilled workforce Building diverse teams Talent pipelines
LKR 102 million invested in training and development
28% female representation at senior management level
59% internal recruitment ratio
36 average hours of training per employee
Among the employees promoted, 55% are women
636 employees were promoted
CAPITAL MANAGEMENT

43
NEXT GEN BANKING
Employee DevelopmentA key achievement in 2019 was the development of a new competency model, centred on developing skills required to conduct banking in a digital world. The new framework is designed to equip employees with the skills required to drive our customer experience with focus on our digital proposition.
The Bank’s lifecycle training programme was also reviewed and updated in line with the new competency framework, with new elements added on design thinking, analytics and mentoring. Significant investments were also made in upskilling the branch staff, who are
the key customer contact point and effectively facilitate the customer experience.
Average Training Hours
Male Female
Corporate Managers 44 12 Senior Managers 34 36 Managers 65 51 Assistant Managers 65 47 Senior Banking Assistants
40 40
Banking Assistants 27 27 Banking Trainees 16 18 Fixed Term Contractees 31 9 Minor & Other Staff 10 8 Total 41 29
CORE COMPETENCIES
Entrepreneurial/Business AwarenessDemonstrate an entrepreneurial spirit and understanding of business situations to capitalise on market opportunities.
Drive Unparallel Customer ExperienceCare about what our customers care about and work towards always delivering beyond their expectations while building strong and lasting relationships.
Innovative LeadershipLeverage on technology and drive transformative change. Collaborate and lead our teams to stay ahead of the game.
Commitment to ExcellenceBe the best in everything we do, ensuring quality, consistency and continuous improvement in pursuing perfection.
Data-Centric Decision MakingUse a data-driven approach for everyday problem solving and decision making.
Objective Training interventions in 2019
Entrepreneurial/Business awareness
• Raise awareness on global financial changes through knowledge forums such as AI Asia Summit, Disrupt Asia, Fintech and BASEL
• Familiarisation of global concepts using company leaders through e-learning platforms
Drive unparallel customer experience
• Certifications for customer service• Mandatory customer service training through the E-learning platform
with 60% of employees completing the training• 4 modules for branch operations and back-office through digital
platforms
• 7 training modules on bank operationsInnovative leadership
• Enhancing bank level communication and report writing through ‘Minto Pyramid’ an online platform
• Design thinking through Reward and RecognitionCommittment to excellence
• 135 employees underwent a SME credit specialised online programme
Data-centric decision making
• 50+ employees trained on analytics through an online programme to enhance data driven decision making.
Male - 582 (61%) Female - 378 (39%)
New Hires by Gender - Mix
Below 30 years - 814 (84.8%)30-50 years - 144 (15%)Above 50 years - 2 (0.2%)
New Hires by Age - Mix
Western Province - 813 (85%)Central Province - 35 (4%)North Central Province - 7 (1%)Eastern Province - 18 (2%)Southern Province - 37 (4%)North Western Province - 19 (2%)Uva Province - 5 (1%)Sabaragamuwa - 14 (1%)Northern Province - 12 (1%)
New Hires by Region - Mix

44
Nations Trust Bank PLC Annual Report 2019
CAPITAL MANAGEMENTHuman Capital
Building the Employer brandDuring the year, we launched the new Nations Trust Employer brand 'Create Tomorrow', focusing on unique attributes of our organisational culture such as digitally savvy, agile, empowered and dynamic. The brand is specifically designed to attract millennials who typically seek out flexible, fun, start-up organisational cultures. All recruitment related communication and engagement centred on the new branding.
Employee engagementWe continue to focus on digital engagement platforms that are suited to the thinking and attitudes of millennials. These mechanisms are founded on the principles of transparency, leader communication and openness and have played a key role in nurturing the Bank’s unique organisational culture. In addition to the engagement mechanisms listed on page 27, the following were conducted during the year;
• Nations Colours Night (an event to appreciate the sportsmen and women within the Bank)
• Annual Trust Awards (in appreciation of the high performers in Consumer Sales)
• International Women's Day Celebrations
• Magnus Awards (the annual awards ceremony for Nations Trust Bank)
• Nations Music Club (various choir, singing opportunities for members)
• Nations Photography Club (street photography workshop)
• Nations Service Awards (appreciating employees who have been in the organisation for 20, 15 and 10 years)
• Awurudu celebrations
• Annual Dinner Dance
• Sports Day
• Kiddies Party
Measuring employee satisfaction: Following a fully fledged employee survey in 2018, we conducted a dip stick study in 2019 to ensure that the learnings of the survey are incorporated to our people proposition.
0
100
200
300
400
500
600
700
800
Male Female
Employees by Category & Gender
Corp
orat
e Man
ager
s
Seni
or M
anag
ers
Man
ager
s
Depu
ty M
anag
ers
SBA BA TBA
FTC
& T
FTC
Min
or &
Oth
er st
aff
Creating diverse teamsThe Bank’s overall female representation amounted to 43% during the year while at senior and corporate management the representations were relatively low at 28%. Focused engagement with female branch employees during the year, revealed an unwillingness to aspire to leadership positions, primarily due to domestic and other responsibilities. We hope to adopt a systematic approach to empowering women at the Bank and encourage them to take on leadership roles, offering flexible working models and creating a more conductive environment for women
Employment by Region and Contract
Permanent Temporary
Western Province 2,006 512Central Province 110 15North Central 20 6Eastern Province 38 4Southern Province 157 17North Western 93 13Uva Province 46 8Sabaragamuwa 47 5Northern Province 47 5Overseas 2 0Total 2,566 585
Employees by Gender, Category and AgeBelow 30 30 -50 50 Above
Male Female Male Female Male Female
Corporate Managers 0.0% 0.0% 0.3% 0.0% 0.2% 0.1%Senior Managers 0.0% 0.0% 4.7% 1.1% 0.2% 0.1%Managers 0.7% 0.5% 9.0% 4.0% 0.1% 0.1%Deputy Managers 1.9% 1.1% 4.6% 2.4% 0.0% 0.1%SBA 5.5% 6.1% 5.0% 2.4% 0.0% 0.0%BA 8.7% 9.9% 1.3% 1.0% 0.1% 0.0%TBA 2.6% 6.8% 0.0% 0.0% 0.0% 0.0%FTC & TFTC 10.5% 7.4% 0.4% 0.1% 0.1% 0.0%Minor & Other staff 0.1% 0.1% 0.3% 0.1% 0.1% 0.0%Total 30.1% 32.0% 25.6% 11.1% 0.8% 0.4%
The Bank typically engages employees on a full time basis: outsourced employees are used for specific functions which
are not critical
0
500
1,000
1,500
2,000
2,500
3,000
Permanent Contract
Fixed Term/Temporary
Male Female
Employees by Contract and Gender
1,434
1,132
349
236

45
NEXT GEN BANKING
REWARDS AND REMUNERATIONTotal value created to our employees in the form of rewards and remuneration amounted to LKR 4,540 million, an increase of 9% compared to the previous year. The
Bank’s reward schemes have been designed to nurture a performance-based culture and ensure a balance between guaranteed and performance-based components. Remuneration is determined based on
qualifications, competencies and performance. All our permanent employees undergo annual performance appraisals.There were no major changes to our reward schemes during the year under review.
Guaranteed Cash and allowances
Variable Pay Reimbursable expenses Subsidized loan Benefits Retirement Benefits & Other perquisites
Fuel/Travelling/Vehicle Allowance
Performance Bonus Professional & Club subscriptions
Housing/ Vehicle/ Education loans
EPF/ETF/Gratuity
Skills Allowance Sales Bonus Education assistance for job specific education programmes
SMART loan for smart devices
Surgical & Hospitalisation Insurance scheme
Accommodation assistance Overtime to eligible staff Education assistance for employees completing MBAs
Personal Accidental Cover
Relocation Allowance Risk allowance to eligible staff
Maternity Allowance and maternity gift pack
Communication Allowance Shift allowance to eligible staff
Nations Sports Club, Photography Club, Music Club & Toastmasters
Employee share appreciation rights for senior staff
SUCCESSION PLANNINGA systematic process is in place to identify employees with critical skills and groom them to be the next generation of leaders within the Bank. During the year, we also offered job rotations with the objective of providing a well rounded, holistic experience to high performing employees. In 2019, we maintained a good internal hire ratio with 59% vacancies filled by existing employees; attesting to the strength of our internal talent pipeline.
RETENTIONThe Bank’s overall retention ratio improved to 85%, from 83% the year before (higher turnover is mainly impending from the outsourced recruitment model and lower grade staff cadre). Retention continues to be an industry-wide challenge with intense competition for trained young talent. We strive to retain employees by investing in conducive work environments and offering unique opportunities for development. The profile of exit employees during the year is presented alongside;
HEALTH AND SAFETYThe most significant safety risk to employees arise from the large volumes of cash handled at delivery point. Our premises have CCTV and are manned by trained security guards with well established communication systems which can be used to raise alarm in the event of any untoward incident. Special allowances are also provided for certain categories of staff in recognition of the additional risks they are exposed to in specific roles. Other safety measures include periodic fire training and workshops on sexual exploitation. During the year, there were no significant workplace related injuries.
Male - 548 (61%) Female - 345 (39%)
Turnover by Gender - Mix
Below 30 years - 735 (82%)30-50 years - 154 (17%)Above 50 years - 4 (1%)
Turnover by Age - Mix
Western Province - 765 (86%)Central Province - 27 (3%)North Central Province - 10 (1%)Eastern Province - 18 (2%)Southern Province - 34 (4%)North Western Province - 13 (1%)Uva Province - 6 (1%)Sabaragamuwa - 8 (1%)Northern Province - 12 (1%)
Turnover by Region - Mix

46
Nations Trust Bank PLC Annual Report 2019
SOCIAL AND RELATIONSHIP CAPITAL
CAPITAL MANAGEMENT
Our stakeholders are at the heart of everything we do, and we strive to nurture meaningful win-win relationships with them through unique value propositions and integration of their legitimate needs into our corporate strategy.
CUSTOMER VALUE CREATIONThe Bank caters to a wide array of individual, corporate and SME customers across the island, focusing primarily on the mass affluent segment. Unprecedented changes in customer expectations and sophistication have compelled financial institutions to rethink the way they engage with customers, and as an agile and digitally savvy Bank, Nations Trust is well positioned to cater to these changing dynamics. Customer Focus is therefore a key pillar of our Corporate Strategy and key areas of focus in enhancing the customer experience in 2019 included the following;
Simple, Intelligent, Inclusive solutions (SI2)Our long-term goal is to make the banking experience an enjoyable one by offering simple, intelligent and inclusive solutions which extend beyond traditional banking products. To this end, we have focused on the entire customer journey, offering solutions which are relevant at each stage of the customer’s lifecycle. This approach is supported by the Bank’s capabilities in data analytics, which has given us deep insights into customer behaviour.
ConvenienceNations Trust has redefined customer convenience through the introduction of game changing digital and self-service platforms. FriMi continues to lead the market in the digital banking space and the subscriber base grew by 93% in 2019. Continued focus on user experience and addition of value added features have enabled FriMi to maintain its competitive edge despite intensifying competition in this space. During the year we also upgraded our mobile banking platform and cash management platform for corporate customers. Digital transactions now account for 72% of total transactions, among the highest in the industry.
Customer ServiceThe Bank’s customer satisfaction levels continue to be relatively high at 92% while complaints have been on a declining trend, reducing to 0.61% in 2019. Business Intelligence tools are used to observe customer interactions at branches and combine intelligence across channels to identify service drops and design personalised customer service. Monthly grievance statistics are reported to the Customer Service Steering Committee which holds responsibility for ensuring customer complaints are addressed and resolved.
SOCIAL AND RELATIONSHIP CAPITAL INPUTS
Over 850,000Customers
Business partners
Industry networks
Community
DEVELOPMENTS IN 2019
Focus on developing simple, intelligent and
inclusive solutions
Upgrade digital platforms including mobile banking
and FriMi
LKR 29 million investments in CSR activities
STRATEGIC RELEVANCE
Delivery and Distribution improved through digitisation
Customer Focusthrough placing strategic emphasis on
the customer journey
Value Created/DeliveredCustomer Satisfaction of 92%
Customer Complaints Ratio of 0.61%
72% of transactions performed through digital channels
93% Increase in FriMi base
Social and Environmental Beneficiaries: 27,661
Volunteer hours: 2,182

47
NEXT GEN BANKING
We source a range of consumables, computer equipment and other supplies required for our day-to-day activities
Essential for business continuity and the smooth functioning of the Bank’s operations.
Key partner in our digital drive, facilitating ease of transactions, offering exciting promotions and enhancing the customer experience
Responsible lending practicesThe Bank’s Customer Charter clearly sets out its’ responsibilities in communicating product information, safeguarding customer interests and servicing vulnerable segments. Relevant information such as interest rates on deposits and loans, exchange rates, product features, terms and conditions are clearly communicated
Measuring customer satisfaction
92%Satisfaction Rate
408 feedback devices Across the Branch Network
Feedback received to the Call Centre and Centralised Customer
Service Unit
Engagement with Customer Service Experience Champions at
each branch
to customers in all three languages (Sinhala, English, Tamil). We are cognisant that our increased thrust towards digital platforms could present higher risks in preserving data privacy. We continue to invest in strengthening our IT Security Infrastructure and comply with ISO27001: Information Security Management System.
Collaborators• Correspondent banks: 34• Exchange houses: 18• International Development Financial
Institutions: 4
Facilitates the Bank’s global connectivity.
Suppliers• Local suppliers: 2,224• Foreign suppliers: 65• Total payments: LKR 12.6 billion
Other service providers• Utility providers• Security services• Maintenance• Operations
Franchise/Merchant networkAMEX | Master Card | Diners Club
The Kaffeine LabWe are keen to collaborate with other ecosystems such as non financial sector industries, academics, start-ups and customers in further enhancing our digital proposition to solve real customer problems. Our innovation centre, the Kaffeine Lab facilitates this by engaging with stakeholders to prototype, pilot and implement solutions which transforms the way the Bank works.
The Bank is an active member in industry forums, engaging with stakeholders and contributing ideas to resolve industry related issues. The Bank and/or its employee holds membership in the Sri Lanka Bank’s Association, Institute of Bankers of Sri Lanka, Ceylon Chamber of Commerce, Leasing Council of Bankers of Sri Lanka and Sri Lanka Sustainable Banking Initiative among others.
0
5,000
1,0000
1,5000
20,000
25,000
30,000
35,000
Volume of Traditional TransactionsVolume of Digital Transactions% of Transactions on Digital Channels
Digital Transactions%LKR Mn
2017 2018 20190
10
20
30
40
50
60
70
80
0
1,000
2,000
3,000
4,000
5,000
6,000
No of ComplaintsNo of Complaints as a % of total customers
Customer Satisfaction
%No.
2017 201920180.60
0.61
0.62
0.63
0.64
Incidents of non-compliance concerning product and service information and labelling NilIncidents of non-compliance concerning marketing communications NilSubstantiated complaints regarding breaches of customer privacy and losses of customer data NilIncidents of non-compliance with laws and regulations in the social and economic area Nil
BUSINESS PARTNERSThe Bank engages with over 2,344 business partners who are an integral part of our value creation process. These partners range from business collaborators, franchise partners, merchant networks and outsourcing partners to suppliers. Mutual value is created through active engagement, fair and transparent business practices, timely payments and opportunities for business growth. The Bank’s ecosystem of business partners is graphically shown below;

48
Nations Trust Bank PLC Annual Report 2019
CAPITAL MANAGEMENTSocial and Relationship Capital
We believe that the key to the success of our CSR activities are the solid partnerships we form to initiate, monitor and sustain action in identified areas and the high degree of employee engagement we continue to garner.
Board of Directors CSR Fund: 1% of PAT of Previous Year
National Level Action (75%)
Regional Branch Level Action (25%)
CSR Committee & Head of CSR
Vice Presidents – Branches (EM and WP)
Sustainability & CSR Function Branches & Departments
External Partners Green Champs
Governance and Fund Administration
Decision Making
Needs Assessment, Reporting and Implementation
COMMUNITY ENGAGEMENTThe Bank’s CSR initiatives are undertaken within the broader theme of 'Empowering the Next Generation' with a particular focus on enabling quality education (SDG 4) and in contributing towards Environmental Stewardship (SDG 13, 14, and 15). In addition, the Bank’s CSR fund also has the mandate to provide immediate relief to those who are affected by disasters. In 2019, the Bank
mobilised LKR 29 million in achieving the aforementioned outcomes. (Details of programmes relating to environment are described more fully in the Natural Capital section of the report.)
We believe the key to the success of our CSR activities are the solid partnerships we form to initiate, monitor and sustain action in identified areas and the high degree
of employee engagement we continue to garner. With a workforce comprising mostly millennials, we depend on social media and social networking platforms to generate interest and awareness about our CSR initiatives among staff. Meanwhile a clear governance structure as depicted alongside ensures accountability and responsibility.

49
NEXT GEN BANKING
EMPOWERING THE NEXT GENERATION
Socio-emotional (Soft) Skills development
Beneficiaries: 314Total Investment: LKR 0.54 Mn
Nations Trust Bank, in partnership with the University of Colombo Alumni Association and international corporate training firm 'Bridge Partnership' has been conducting workshops on socio-emotional skills for undergraduates since 2017. The programme seeks to develop emotional intelligence, interpersonal communication and personal resilience of students to be effective in a professional environment. The programme also includes a mentoring component, where members of Bank’s Senior Management team volunteer to guide undergraduates over a period of three months on their transition from university life to career. During 2019, the programme saw four intakes with a total of 111 undergraduates taking part, whilst 19 Management members from the Bank volunteered as mentors.
A Socio-Emotional Skills and Future Orientation Programme was also conducted for children at the Kadawatha Catholic School to create awareness on soft-skills such as empathy and interpersonal communication.
School Infrastructure and Supplies
Beneficiaries: 1,106Total Investment: LKR 3.38 Mn The Bank continued its ongoing programme to strengthen infrastructure and provide for education consumables (stationery and school supplies) for four selected rural schools: Galgamuwa Nithalawa Kanishta Vidyalaya, Ratnapura Amunuthenna Kanishta Vidyalaya, Mulaitivu Mullivaikkal East GTM School and Kebethigollewa Wahalkada D-5 Viduhala. Students were supplied with stationery requirements (books, bags, lunch boxes and water bottles), whilst the consumable/equipment needs of schools (lab material and books for library, etc.) was also provided. The intent is to make it easier for students from
economically disadvantaged backgrounds (mostly children of farmers affected by climate change impacts) to pursue their education.
Digital Literacy
Beneficiaries: 834Total Investment: LKR 3.0 Mn
The Bank places emphasis on digital literacy given its importance in equipping the next generation with requisite skills to succeed in the age of the fourth Industrial Revolution. In commemorating its 20th Anniversary, the Bank set the ambition to upgrade 20 ICT labs by 2020 in scaling-up its ongoing efforts to enhance digital infrastructure for education of children and youth. To this end, in 2019, we engaged in revamping and upgrading computer labs in six schools. Computer labs of Thakshila Vidyalaya in Mahavilachchiya, Moragoda Vidyalaya in Galenbindunuweva and C.W.W. Kannangara Vidyalaya in Borella were handed over to the schools after completion within the year, whilst work is still ongoing on three other labs (Handessa Maha Vidyalaya in Pilimathalawa, Thirugnanasampanthar Vidiyalayam in Vavuniya, and Holy Rosary School in Colombo 02, where work has been initiated during the year).
During the year, the Bank facilitated the conversion of a class room at Nithalawa School to a smart classroom by funding the civil works and digital infrastructure. A Raspberry-pi device loaded with educational content developed by Shilpa Sayura Foundation was installed, enabling an effective e-learning platform.
Entrepreneurial Education and Education for Sustainability
Beneficiaries: 130Total Investment: LKR 0.74 Mn
Recognizing the importance of sustainable entrepreneurship in advancing the economy and quality of life, Nations Trust Bank organized programmes for current and prospective entrepreneurs on the theme of 'Sustainable Business'. Three workshops were held under this programme in Embilipitiya, Negombo and Galle to build awareness among small and medium business owners on aspects such as resource efficiency, energy management and green productivity along with brief awareness on financial literacy and solar loan scheme offered by the Bank.
During the year, Bank also supported Sri Lanka Association for Advancement of Science (SLAAS) to organize a workshop for undergraduates from government and private universities on 'Biotechnology Entrepreneurship'
Disaster Relief and Recovery
Beneficiaries: 255Total Investment: LKR 1.08 Mn
In the aftermath of the Easter Sunday bombings, the Bank’s CSR fund, its Sports Club and employees reached out to Archdiocese of Colombo in offering support to children affected by the calamity. Funds were channelled to provide school shoes for 230 children affected by the disaster and significant sums of money were deposited in favour of 25 children who were severely affected (where they were injured or a parent is incapacitated), so they would have the necessary means to pursue higher education in the future. Bank’s staff also volunteered to support Seth Sarana in organizing the information relating to victims.
ICT Lab at C W W Kannangara Vidyalaya Borella
Sustainable Business Workshop Embilipitiya

50
Nations Trust Bank PLC Annual Report 2019
NATURALCAPITAL
With the effects of climate change being increasingly felt across the globe, we are proactively seeking to manage environmental impacts arising from our own operations as well as those arising from the businesses we finance. Meanwhile we continue to create awareness on climate action and responsible consumption of resources through our strategic CSR agenda.MANAGING OUR ENVIRONMENTAL IMPACTSOur approach to manage direct and indirect environmental impacts are governed by comprehensive policy frameworks, operating manuals and external certifications. There were no instances of non compliance to any environmental laws and regulations during the year.
As a financial services organisation, the Bank is exposed to climate change primarily through its lending to the agriculture, plantation and tourism sectors which are extremely vulnerable to climatic conditions. Meanwhile, natural disasters and erratic weather conditions which affect the balance of the eco-system could have long-term implications on the smooth continuity of business. We are yet to quantify the impacts of climate change on the Bank.
EnergyThe Energy Policy is gradually shifting to renewable energy sources while energy efficiency is being enhanced through employee awareness.
MaterialsReducing paper consumption through digitisation, lean initiatives, simplifying and automating processes and encouraging customers to switch to e-statements.
WasteEmployees are encouraged to re-use and recycle paper and adopt paperless
platforms for communication. Useful life of obsolete computers is extended in placing them in school IT labs. Once the computers are beyond repair the Bank hands over the E-waste to CEA approved service providers.
EmissionsCarbon conscious certification for hub operations.
Comprehensive carbon management programme to measure the Bank's carbon footprint.
NATURAL CAPITALINPUTS
8.2 Mn kWhEnergy Consumption
86 MTPaper Consumption
DEVELOPMENTS IN 2019Ongoing capacity building of
E&S risk assessment and management
Launch of branch level renewable energy buy back programme
and soft loan scheme.
Continuation of paperless initiative through lean transformation
and digitisation drive
STRATEGIC RELEVANCE
Improved Financial Performance
Through Responsible Lending
Delivery and DistributionImproved through digitisation
Value Created/DeliveredCarbon footprint of 3,549 tCO2e
1.84 tCO2e per employee
17% (or 14.5 MT) of paper recycled
Energy efficiency increased by 2% to 2,595 kWh per employee
Over 6,390 people educated on bio-diversity
In partnership with eight leading environmental organisations
CAPITAL MANAGEMENT

51
NEXT GEN BANKING
RESPONSIBLE LENDINGWe are committed to developing a sustainable finance portfolio and strive to integrate environmental and social considerations into all our lending decisions. All Corporate and SME facilities above LKR 25 million undergo a rigorous screening process to assess potential environmental impacts and ensure environmental compliance. Meanwhile we continue to build capacity by organising knowledge sharing and awareness programmes on environmental and social risk assessment and management for our staff.
Programs conducted during the year No. of Participants
Awareness programme on 'Biodiversity Considerations in Lending' conducted in collaboration with Biodiversity Sri Lanka
20
Awareness programme on 'Going Net Zero' conducted by Carbon Consulting Company
15
Knowledge sharing session on carrying out risk assessments for climate finance
18
Technical awareness programme on 'Financial Product Prototyping for Climate Financing' held in collaboration with National Cleaner Production Centre and Adelphi Consulting
21
REDUCING OUR ENERGY CONSUMPTION The Bank’s total electricity consumption amounted to 8,177,312 kWh during the year. Efforts to reduce our dependence on grid electricity by installing solar panels at our Nawam Mawatha office continued to generate returns with the system generating 48,109 kWh of renewable energy during the year. Meanwhile ongoing efforts to increase energy efficiency within our premises resulted in electricity intensity declining by 2% to 2,595 kWh per employee.
In line with the Carbon Emission study conducted, electricity consumption of three main offices (Union Place, Nawam Mawatha and Kotahena) amounted to 3,311,102 kWh in 2019 while the electricity efficiency is 2,245 kWh per employee.
As part of the Bank’s climate action agenda, we also engaged with over 80 lessors of our branch properties, encouraging them to consider green building investments for branch premises. The Bank offered a soft loan scheme to fund any such investment together with a buy back arrangement for solar renewable energy units, if the lessors chose to invest in solar rooftop systems.
REDUCING PAPER CONSUMPTION Paper consumption amounted to 86 MT in 2019, reflecting the Bank’s ongoing lean transformation and digitisation drive. Most approvals, correspondence and transactions across the Bank are now carried out digitally, with the use of online tools which has significantly reduced paper usage. Meanwhile we continued to expand our paper-less drive, introducing several process improvements during the year. ( Please refer table alongside)
MANAGING OUR EMISSIONSThe carbon footprint of our three main offices (Union Place, Nawam Mawatha and Kotahena) are proactively monitored and managed externally by The Carbon Consulting Company, and further verified independently by The Sustainable Future Group towards retaining our 'CarbonConscious® Office' Certifications. In addition, during the previous year, the Bank expanded the boundary of the assessment by adding 10 more branches (boundary now includes locations covering 60% of our total staff).
Tonnes of CO2e
2019 2018 % change
Scope 1 177.2 187.6 -6%Scope 2 2,373.0 2,143.4 11%Scope 3 999.1 1,127.4 -11%Total* 3,549.3 3,458.4 3%Tonnes of CO2e per employee
1.84 1.78 3%
*Carbon Footprint of 3 hub operations and 10 branches
*The Carbon Footprint of the 10 branches only includes Scopes 1 & 2
MANAGING OUR WASTEWaste generated by our operation consists mainly of paper waste, E-waste and food waste. 14.5 MT of paper was recycled during the year which is approximately 17% of total paper usage. E-waste is disposed in a responsible manner through approved third parties. Accordingly, 1,787 e-waste items were safely disposed in 2019. Food waste is segregated at the point of generation and food waste stats are generated on a weekly basis and displayed on lunchroom notice boards. During the year, food waste generated at main three offices (Union Place, Nawam and Kotahena) amounted to 38 MT.
ENVIRONMENTAL STEWARDSHIP We continue to partner with environmental interest groups such as the Wildlife Conservation Society of Galle (WCS-G), Wildlife and Nature Protection Society (WNPS), Biodiversity Sri Lanka platform, Environmental Foundation Limited and Young Zoologists’ Association in conservation efforts and to create awareness on biodiversity conservation.
Paperless Drive-Key initiatives during the year• Introduction of e-learning platform
• Replacing class-room handouts with tablets for classroom-based training
• QR code system for training attendance
• Digital feedback on training
• Digital pay-slips
• Increase in digital marketing
• Digitisation of Bank statements
• Sales force automation
• Digital Annual Report
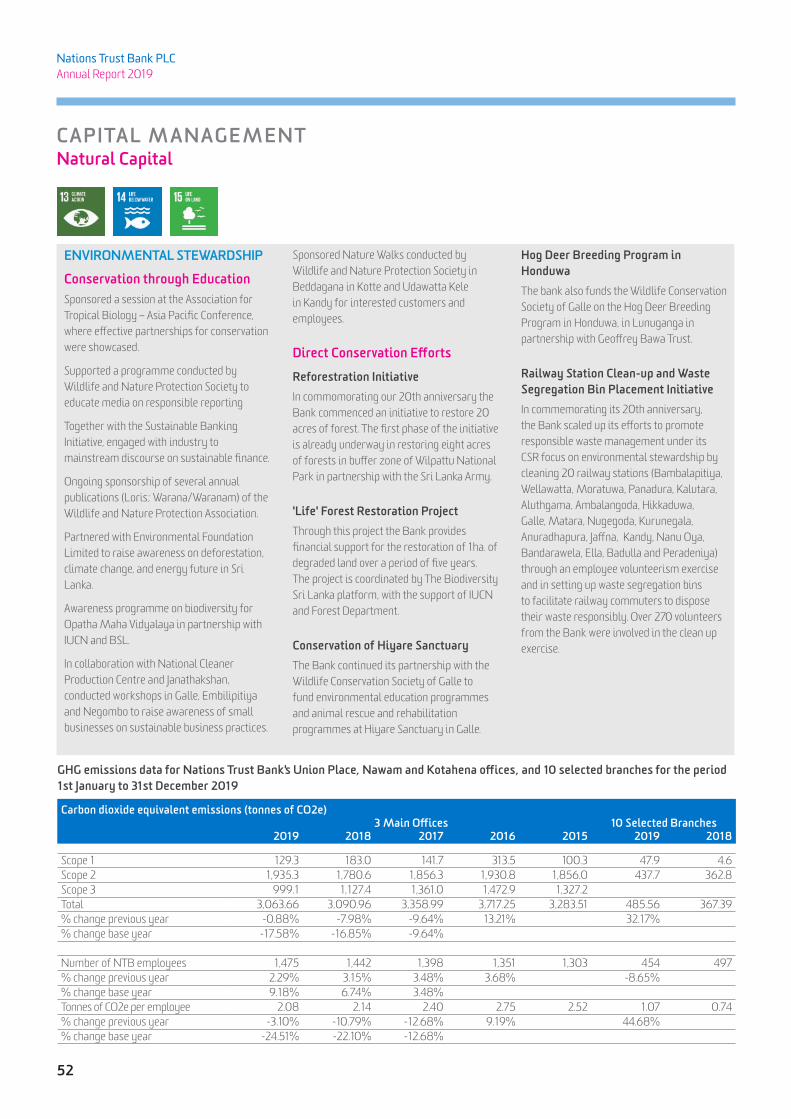
52
Nations Trust Bank PLC Annual Report 2019
ENVIRONMENTAL STEWARDSHIP
Conservation through Education Sponsored a session at the Association for Tropical Biology – Asia Pacific Conference, where effective partnerships for conservation were showcased.
Supported a programme conducted by Wildlife and Nature Protection Society to educate media on responsible reporting
Together with the Sustainable Banking Initiative, engaged with industry to mainstream discourse on sustainable finance.
Ongoing sponsorship of several annual publications (Loris; Warana/Waranam) of the Wildlife and Nature Protection Association.
Partnered with Environmental Foundation Limited to raise awareness on deforestation, climate change, and energy future in Sri Lanka.
Awareness programme on biodiversity for Opatha Maha Vidyalaya in partnership with IUCN and BSL.
In collaboration with National Cleaner Production Centre and Janathakshan, conducted workshops in Galle, Embilipitiya and Negombo to raise awareness of small businesses on sustainable business practices.
Sponsored Nature Walks conducted by Wildlife and Nature Protection Society in Beddagana in Kotte and Udawatta Kele in Kandy for interested customers and employees.
Direct Conservation Efforts
Reforestration InitiativeIn commomorating our 20th anniversary the Bank commenced an initiative to restore 20 acres of forest. The first phase of the initiative is already underway in restoring eight acres of forests in buffer zone of Wilpattu National Park in partnership with the Sri Lanka Army.
'Life' Forest Restoration ProjectThrough this project the Bank provides financial support for the restoration of 1ha. of degraded land over a period of five years. The project is coordinated by The Biodiversity Sri Lanka platform, with the support of IUCN and Forest Department.
Conservation of Hiyare SanctuaryThe Bank continued its partnership with the Wildlife Conservation Society of Galle to fund environmental education programmes and animal rescue and rehabilitation programmes at Hiyare Sanctuary in Galle.
Hog Deer Breeding Program in HonduwaThe bank also funds the Wildlife Conservation Society of Galle on the Hog Deer Breeding Program in Honduwa, in Lunuganga in partnership with Geoffrey Bawa Trust.
Railway Station Clean-up and Waste Segregation Bin Placement InitiativeIn commemorating its 20th anniversary, the Bank scaled up its efforts to promote responsible waste management under its CSR focus on environmental stewardship by cleaning 20 railway stations (Bambalapitiya, Wellawatta, Moratuwa, Panadura, Kalutara, Aluthgama, Ambalangoda, Hikkaduwa, Galle, Matara, Nugegoda, Kurunegala, Anuradhapura, Jaffna, Kandy, Nanu Oya, Bandarawela, Ella, Badulla and Peradeniya) through an employee volunteerism exercise and in setting up waste segregation bins to facilitate railway commuters to dispose their waste responsibly. Over 270 volunteers from the Bank were involved in the clean up exercise.
CAPITAL MANAGEMENTNatural Capital
GHG emissions data for Nations Trust Bank's Union Place, Nawam and Kotahena offices, and 10 selected branches for the period 1st January to 31st December 2019
Carbon dioxide equivalent emissions (tonnes of CO2e)3 Main Offices 10 Selected Branches
2019 2018 2017 2016 2015 2019 2018
Scope 1 129.3 183.0 141.7 313.5 100.3 47.9 4.6Scope 2 1,935.3 1,780.6 1,856.3 1,930.8 1,856.0 437.7 362.8Scope 3 999.1 1,127.4 1,361.0 1,472.9 1,327.2Total 3,063.66 3,090.96 3,358.99 3,717.25 3,283.51 485.56 367.39% change previous year -0.88% -7.98% -9.64% 13.21% 32.17%% change base year -17.58% -16.85% -9.64%
Number of NTB employees 1,475 1,442 1,398 1,351 1,303 454 497% change previous year 2.29% 3.15% 3.48% 3.68% -8.65%% change base year 9.18% 6.74% 3.48%Tonnes of CO2e per employee 2.08 2.14 2.40 2.75 2.52 1.07 0.74% change previous year -3.10% -10.79% -12.68% 9.19% 44.68%% change base year -24.51% -22.10% -12.68%

53
NEXT GEN BANKING
INDEPENDENT ASSURANCE REPORT
INDEPENDENT ASSURANCE REPORT TO NATIONS TRUST BANK PLC ON THE SUSTAINABILITY REPORTING CRITERIA PRESENTED IN THE INTEGRATED ANNUAL REPORT- 2019Introduction and scope of the engagementThe management of Nations Trust Bank PLC (“the Company”) engaged us to provide an independent assurance on the following elements of the sustainability reporting criteria presented in the annual report- 2019 (“the Report”).
• Limited assurance on other information presented in the Report, prepared in accordance with the requirements of the Global Reporting Initiative GRI Standards: ‘In accordance’ – Core guidelines.
Basis of our work and level of assurance We performed our procedures to provide limited assurance in accordance with Sri Lanka Standard on Assurance Engagements (SLSAE 3000): ‘Assurance Engagements Other than Audits or Reviews of Historical Financial Information’, issued by the Institute of Chartered Accountants of Sri Lanka (“CASL”).
The evaluation criteria used for this limited assurance engagement are based on the Sustainability Reporting Guidelines (“GRI Guidelines”) and related information in particular, the requirements to achieve GRI Standards ‘In accordance’ - Core guideline publication, publicly available at GRI’s global website at “www.globalreporting.org”.
Our engagement provides limited assurance as well as reasonable assurance. A limited assurance engagement is substantially less in scope than a reasonable assurance engagement conducted in accordance with SLSAE-3000
and consequently does not enable to obtain assurance that we would become aware of all significant matters that might be identified in a reasonable assurance engagement. Accordingly, we do not express an opinion providing reasonable assurance.
Management of the Company’s responsibility for the ReportThe management of the Company is responsible for the preparation of the self-declaration, the information and statements contained within the Report, and for maintaining adequate records and internal controls that are designed to support the sustainability reporting process in line with the GRI Sustainability Reporting Guidelines.
Ernst & Young’s responsibilityOur responsibility is to express a conclusion as to whether we have become aware of any matter that causes us to believe that the Report is not prepared in accordance with the requirements of the Global Reporting Initiative, GRI Standards: ‘In accordance’ - Core guidelines. This report is made solely to the Company in accordance with our engagement letter dated 13 January 2020. We disclaim any assumption of responsibility for any reliance on this report to any person other than the Company or for any purpose other than that for which it was prepared. In conducting our engagement, we have complied with the independence requirements of the Code for Ethics for Professional Accountants issued by the CASL.
Key assurance procedures We planned and performed our procedures to obtain the information and explanations considered necessary to provide sufficient evidence to support our limited assurance conclusions. Key assurance procedures included:
• Interviewing relevant the company’s personnel to understand the process for collection, analysis, aggregation and presentation of data.
• Reviewing and validation of the information contained in the Report.
• Checking the calculations performed by the Company on a sample basis through recalculation.
• Reconciling and agreeing the data on financial performance are properly derived from the Company’s audited financial statements for the year ended 31 December 2019.
• Comparison of the content of the Report against the criteria for a Global Reporting Initiative, GRI Standards: ‘In accordance’ – Core guidelines.
Our procedures did not include testing electronic systems used to collect and aggregate the information.
Limitations and considerationsEnvironmental and social performance data are subject to inherent limitations given their nature and the methods used for determining, calculating and estimating such data.
ConclusionBased on the procedures performed, as described above, we conclude that;
• Nothing has come to our attention that causes us to believe that other information presented in the Report are not fairly presented, in all material respects, in accordance with the Company’s sustainability practices and policies some of which are derived from Sustainability Reporting Guideline, GRI Standards- ‘In accordance’ Core.
Ernst & YoungChartered Accountants
27th February 2020Colombo

54
Nations Trust Bank PLC Annual Report 2019
CORPORATE GOVERNANCE
Nations Trust’s approach to corporate governance underpins its performance, promotes strategic decision making that balances the often conflicting interests of stakeholders and defines business conduct. The concise report below sets out the key elements of our governance framework and demonstrates how we achieved our governance outcomes during the year. Please refer to the Compliance tables from page 229 to 249 of this Report for detailed governance and compliance related information.
GOVERNANCE FRAMEWORKOur governance framework extends beyond compliance, embracing industry best practice to drive effective leadership and greater transparency. It enables the Board to effectively oversee key aspects of our value creation including the strategic direction, resource allocation, non financial performance and to hold the management team accountable for the implementation of strategy. Key elements of our governance framework are;
Governance structureShareholders appoint the Board of Directors who hold apex responsibility for the affairs of the Bank. The Board has appointed seven sub-committees to facilitate oversight of specific areas to assist in the discharge of its responsibilities. Related roles and responsibilities of the Board and Subcommittees are clearly defined in respective committee reports together with insights into activities taken place during the year on pages 75 to 86. Executive Committees appointed for specific roles ensure that the management sets the tone for good governance facilitating empowerment and joint decision making. 4
FRIMISri Lanka’s first fully-fledged digital banking experience…
COPORATE GOVERNANCE & RISK MANAGEMENT
Corporate Governance 54Annual Report of the Board of Director on the Affairs of The Bank 57Directors’ Interest in Contracts with the Bank 61Risk Management Review 62Board Integrated Risk Management Committee Report 75Board Credit Committee Report 76Board Supervisory Committee Report 77Board Nomination Committee Report 78Human Resources And Remuneration Committee Report 79Related Party Transactions Review Committee Report 80Directors’ Statement on Internal Control Over Financial Reporting 81Auditor’s Statement on Internal Control Over Financial Reporting 83 Board Audit Review Committee Report 84
SHAREHOLDERS
CHIEF EXECUTIVE OFFICER
BOARD OF DIRECTORS
CORPORATE MANAGEMENT
Mandatory Committees Non Mandatory Committees
Board Audit Review Committee
Board Integrated Risk Management Committee
Board Related Party Transactions Review Committee
Nomination Committee
Board Human Resources and Remuneration Committee
Board Credit Committee
Board Supervisory Committee

55
NEXT GEN BANKING
Policy FrameworkThe Bank’s clearly defined Policy Framework enables that we conduct business the right way, ensuring ethical and transparent business practices. The Policy Framework ensures compliance with several key regulatory requirements and voluntary adopted standards and codes. Policies are reviewed and revised regularly.
External instruments Internal instruments
Regulatory• Companies Act. No 7 of 2007• Banking Act No. 30 of 1988 (as amended)• All directions for licensed commercial banks issued by the Central Bank of Sri Lanka• Continuing listing requirements of the Colombo Stock Exchange• Inland Revenue Act. No 24 of 2017
• Articles of Association• Board and Sub-Committees Terms of Reference• Code of Ethics• Code of Conduct• Board approved Policy Framework
Voluntary• Code of Best Practice on Corporate Governance (2017) issued by CA Sri Lanka• Integrated Reporting Framework issued by the International Integrated Reporting Council (IIRC)• GRI Sustainability Reporting Standards issued by the Global Reporting Initiative
KEY GOVERNANCE OUTCOMESOur Governance Framework has been designed to facilitate the achievement of the following governance outcomes;
Effective leadership
Driving good performance
Culture and values
Risk management
Effective leadershipDirectors combine diverse experience and industry insights, collectively ensuring the creation and protection of shared value. The Board comprises twelve Directors, including five Independent Non-Executive Directors, six Non-Executive Directors and one Executive Director.
Board Composition Gender Balance Age Representation
Chairman (Non-Executive) 30-40 years
Independent (Non-Executive Directors) 40-50 years
Non-Independent (Non-Executive Directors) 50-60 years
Executive Directors Older than 60 years
Director induction: Newly appointed Directors receive a comprehensive induction pack (comprising Articles of Association, Policies and Board procedure manuals among others) while an overview of all compliance requirements and policies are provided by the Board Secretary. The induction is complemented by a presentation by the CEO and a visit to the Bank’s processing centre by the new directors.
Director training: Directors undertake training in their personal capacity and attend forums organised by the Central Bank of Sri Lanka and other institutions. Auditors and other experts make presentations from time to time on relevant topics.
3/12
9/12

56
Nations Trust Bank PLC Annual Report 2019
CORPORATE GOVERNANCE
DRIVING GOOD PERFORMANCEThe Board consistently reviews the Group’s performance against strategic objectives, ensuring long term success and sustainability. During the year the Board met 12 times and key areas of focus included strategy, risk management, digitisation of the Bank and talent management among others.
Corporate management team: Management of the day to day business of the Group has been delegated to the CEO and Corporate Management team. The CEO is accountable to the Board for implementing strategy and ensuring performance is in line with the set strategic agenda.
Since the end of 2018, considerable time has been dedicated to determining the succession plan of the CEO and Corporate Management. The following transparent process was carried out in
BOARD AND BOARD SUB-COMMITTEE MEETINGS
Director Board Audit Review Committee
Board Supervisory Committee
HR and Remuneration Committee
Credit Committee
Integrated Risk Management Committee
Nomination Committee
Related Party Transactions Review Committee
Mr. Gihan Cooray (Chairman) 13/13 01/01 12/12 01/01Mr. Prasanna De Silva 13/13 12/12 01/01 12/12 01/01Ms. Renuka Fernando 13/13 12/12 05/08 04/04Mr. Suran Wijesinghe 13/13 13/14 12/12 01/01 08/08Mr. Conrad D’Souza 13/13 00/00Ms. Rachini Rajapaksa 13/13 13/14 00/00 08/08Mr. Russell De Mel 13/13 12/12 04/04Mr. Sumit Maheshwari 10/13Mr. Savanth Sebastian 13/13 09/14 10/12Ms. Sherin Cader 13/13 13/14 11/12 06/08Mr. Chanaka Wickramasuriya 13/13 12/12 00/00 00/00Mr. Arjun Fernando 13/13 14/14 05/05 08/08Mr. Murtaza Jafferjee1 11/13 10/12 01/01 01/01
1Retired with effect from 15th December 2019
360-degree appraisal of all Executive Vice President staff
Obtained the services of an external consultant in developing and
conducting psychometric tests on shortlisted candidates
Inviting short-listed candidates to make presentations to the Board of
Directors
CEO and Deputy CEO succession plan determined by the Board
selecting the new CEO, who will take over from the current CEO upon her retirement in April 2020.
Self-assessment: The Board annually appraises its performance to ensure that they are discharging their responsibilities effectively. Each member of the Board carries out a self-assessment of his/her own effectiveness as an individual as well as effectiveness of the Board as a team. In 2019, a formal process was implemented to assess performance of the Sub committees which are now required to update the Board on their performance during the year, ensuring that TORs are met.
Culture and ValuesThe Board of Directors set the ethical tone for the Bank and collectively ensure that the conduct of the team is aligned to the organisational vision and values. Shared stakeholder value is delivered by ensuring regulatory compliance and balancing the diverse needs of our stakeholder universe.
The Code of Ethics and Conduct signed off by all employees clearly articulates the expectations for employee conduct and processes for dealing with perceived deviations.
Risk Management and Internal Controls The Board of Directors holds apex responsibility for ensuring the effectiveness of the Bank’s risk management framework and internal control systems. The Board is supported by a dedicated Integrated Risk Management Committee (BIRMC) and Board Audit Committee in the discharge of its risk management responsibilities. (Please refer to the Committee Reports on pages 75 and 84 for an overview of the functions performed by the Committees during the year.)
Cyber security: The Bank’s strategic thrust towards digitisation exposes it to a range of information and cyber security related risks which are managed through effective governance structures, clearly articulated procedures and security frameworks. Cyber security risk exposures are consistently monitored and communicated to the BIRMC as part of the regular risk update. Meanwhile, the Bank has deployed an independent consultant reporting to the Chief Risk Officer, who is responsible for identifying and reporting all IT related risks. A dedicated Information Security Officer also functions within the IT department, ensuring that all cyber security related risk exposures are monitored on an ongoing basis.

57
NEXT GEN BANKING
ANNUAL REPORT OF THE BOARD OF DIRECTORS ON THE AFFAIRS OF THE BANK
The Directors of Nations Trust Bank PLC (‘the Bank’) have pleasure in presenting their Report on the Affairs of the Bank together with the Audited Financial Statements for the year ended 31st December, 2019. The details set out herein provide the pertinent information in accordance with the statutory requirements, requirements of relevant regulatory authorities for the listed companies in the financial industry and best accounting practices.
GENERALNations Trust Bank PLC is a public Limited liability company incorporated in Sri Lanka on 21st January 1999 under the Companies Act No. 17 of 1982, quoted in the Colombo Stock Exchange in May 1999 and a licensed commercial bank under the Banking Act No. 30 of 1988. The Bank was re-registered on 14th February 2008 as required under the provisions of the Companies Act No. 7 of 2007.
The Annual Report of the Board of Directors on the Affairs of the Bank and the Audited Financial Statements were approved by the Directors on 27th February, 2020.
STATEMENT OF COMPLIANCE ON THE CONTENTS OF THE ANNUAL REPORTThe Annual Report including the Audited Financial Statements have been prepared and presented with the disclosures in accordance with the Sri Lanka Accounting Standards and other applicable regulatory requirements.
PRINCIPAL ACTIVITIES Nations Trust Bank PLC is a Banking Company licensed as a commercial bank. There are three fully-owned subsidiaries of Nations Trust Bank PLC which together constitute the Group.
BANKThe principal activities of the Bank are commercial, personal and private banking, trade services, leasing, factoring, treasury and capital market services and other fee based activities.
SUBSIDIARIESThe principal activities of the Bank’s subsidiaries viz. Waldock Mackenzie Ltd., Allied Properties Ltd., and Nations Insurance Brokers Ltd. are margin trading, money market operations and
fund and fee based activities, property rental, and insurance broking, respectively.
There has been no material change to the activities of the Bank or any of the subsidiaries mentioned above during the period under review.
FINANCIAL STATEMENTSFinancial Statements of the Bank and the group approved by the Board of Directors on 27th February 2020 are given on pages 91 to 198 of this Annual Report.
INDEPENDENT AUDITORS’ REPORT The Auditors of the Bank, Messrs Ernst & Young, Chartered Accountants have carried out the audit of the consolidated Financial Statements for the financial year ended 31st December 2019 and their Report on the Financial Statements is given on page 88 of this Annual Report.
SIGNIFICANT ACCOUNTING POLICIES The Accounting Policies adopted in the preparation of the Financial Statements are given on pages 96 to 198.
INTERESTS REGISTERAll Directors have made general declarations as provided for in Section 192 (2) of the Companies Act No. 7 of 2007. Arising from these, details of contracts in which they have an interest is given on page 61 of this Report.
The Following entries were made in the Interests Register during the year under review:
1. Approval of remuneration to the Executive Director by the Board – 29th March 2019.
2. Pursuant to scrip dividend issue, allotment of ordinary voting shares and ordinary non voting convertible shares to Mr. Gihan Cooray, Mr. Murtaza Jafferjee and Mr. Suran Wijesinghe and issue of ordinary voting shares to Ms. Renuka Fernando on 22nd March 2019.
3. Reclassification/conversion of ordinary non-voting convertible shares to ordinary voting shares in the name of Mr. Murtaza Jafferjee on 18th April 2019.
4. Purchase of ordinary voting shares by Mr. Murtaza Jafferjee, on 16th May 2019 and 2nd September, 2019.
DIRECTORS’ SHAREHOLDINGDirectors’ shareholding as at 31st December, 2019 and 2018 are given below.
No. of SharesName of the Director 2019 2018Mr. Gihan Cooray 8,804 (V)
1,532 (NV) 8,618(V)
1,497 (NV)Mr. Suran Wijesinghe 41,562(V)
7,242(NV)40,680(V)7,074 (NV)
Ms. Renuka Fernando 72,014(V) 70,486(V)Mr. Prasanna De Silva - -Mr. Conrad D’Souza-Senior Director - -Ms. Rachini Rajapaksa - -Mr. Russell De Mel - -Mr. Sumit Maheshwari - -Mr. Savanth Sebastian - -Ms. Sherin Cader - -Mr. Chanaka Wickramasuriya - -Mr. Arjun Fernando - -Mr. Murtaza Jafferjee (Retired w.e.f. 15th December 2019)
N/A 447,283(V)136,800(NV)
DIRECTORS’ REMUNERATIONDirectors’ fees and emoluments paid during the year are given in Note 44.
CORPORATE DONATIONSNo donations have been made by the Bank during the year.

58
Nations Trust Bank PLC Annual Report 2019
ANNUAL REPORT OF THE BOARD OF DIRECTORS ON THE AFFAIRS OF THE BANK
DIRECTORATEThe names of the Directors of the Bank during the year under review and their attendance at the Board meetings during the year were as follows;
Name and the designation Eligibility Present Excused
Non-Executive Directors Mr. Gihan Cooray 13 13 NilMr. Prasanna De Silva 13 13 NilMr. Suran Wijesinghe 13 13 NilMr. Sumit Maheshwari 13 10 03Ms. Sherin Cader 13 13 NilMr Arjun Fernando 13 13 Nil
Independent Non-Executive DirectorsMr. Conrad D’Souza - Senior Director 13 13 NilMs. Rachini Rajapaksa 13 13 NilMr. Russell De Mel 13 13 NilMr. Savanth Sebastian 13 13 NilMr. Chanaka Wickramasuriya 13 13 NilMr. Murtaza Jafferjee - Senior Director (Retired with effect from 15th December, 2019)
13 11 02
Executive Director Ms. Renuka Fernando 13 13 Nil
Independent Senior Director, Mr Murtaza Jafferjee retired from the Board with effect from 15th December 2019 upon completion of nine years service on the Board, in compliance with the Section 3(2)(ii) of the Banking Act Direction No.11 of 2007 on Corporate Governance for Licensed Commercial Banks in Sri Lanka. Mr Arjun Fernando was appointed to the Board as a Non-Executive Director with effect from 18th January 2019 and elected by the shareholders pursuant to Article 25 of the Articles of Association of the Bank and in terms of Direction No.3(2)(x) of Banking Act Direction No.11.of 2007 at the Annual General Meeting held on 29th March 2019.
Mr. Conrad D’Souza was appointed as the Senior Director of the Bank with effect from 16th December 2019. Mr Prasanna De Silva, Mr Suran Wijesinghe and Ms. Rachini Rajapaksa retire by rotation and being eligible for re-election are recommended by the Board for re-election as provided for in the Article No. 27 of the Articles of Association of the Bank.
Having given due consideration to the criterion set out in the Banking Act No. 30 of 1988 and Banking Act Direction No. 11 of 2007, The Board is of the view that all the directors of the Bank including those who are recommended for re-election are fit and proper persons to hold office as Directors of the Bank.
AUDITORSThe Bank’s Auditors during the period under review were Messrs. Ernst & Young, Chartered Accountants. The following payments were made to them during the year.
LKR ‘000 Bank Group
Audit Fees 10,170 11,368Fees for Other Services
4,648 4,648
14,818 16,017
Other services consisted of advisory and tax related work.
As far as the Directors are aware the Auditors do not have any relationship with or interest in the Bank or any of its subsidiaries other than those disclosed above.
The retiring Auditors, Messrs Ernst & Young have expressed their willingness to be re-appointed and as such, the Board recommends an adoption of a resolution to re-appoint them as Auditors and authorize the Directors to fix their remuneration.
RESULTS AND DIVIDENDS Consolidated Income Statement along with the Bank’s Income Statement for the year is given on page 92 Statement of Financial Position of the Bank and the Group are given on page 91.
Having satisfied the solvency test requirement under the Companies Act No. 7 of 2007, the Directors have declared a first and final cash dividend of LKR 2.30 per share to holders of both Ordinary Voting shares and Ordinary Non Voting Convertible shares of the Bank registered in the Books of the Bank as at 6th March 2020.
INFORMATION ON SHARES AND DEBENTURES Information relating to holdings of shares and debentures is given in pages 205 to 209 of this Report.
POST- BALANCE SHEET EVENTSNo circumstances have arisen since the reporting date that would require adjustment or disclosure other than those disclosed in Note 50 to the Financial Statements contained on page 198.
CAPITAL ADEQUACYThe Group’s capital adequacy ratios as at 31 December, 2019 were 13.30% for Tier I and 17.96% for Tier I & II and are above the minimum requirements of the Central Bank of Sri Lanka.
REPORT ON COMPLIANCE WITH PRUDENTIAL REQUIREMENTS, REGULATIONS, LAWS AND INTERNAL CONTROLSThe Bank has complied with all the regulatory and prudential requirements arising from the provisions in the statutes applicable to the Bank including the Banking Act No. 30 of 1988, directions and determinations issued

59
NEXT GEN BANKING
by the Central Bank of Sri Lanka under the Banking Act, Monetary Law Act No. 58 of 1949, Foreign Exchange Act No. 12 of 2017, Companies Act No. 7 of 2007, Sri Lanka Accounting and Auditing Standard Act No. 15 of 1995, Prevention of Money Laundering Act No. 5 of 2006, Financial Transactions Reporting Act No. 6 of 2006, Convention on the Suppression of Terrorist Financing Act No. 25 of 2005, Inland Revenue Act No. 10 of 2006, Value Added Tax Act No. 14 of 2002, Finance Act No. 5 of 2005, Economic Service Charge Act No. 13 of 2006, Listing Rules of the Colombo Stock Exchange, Securities and Exchange Commission Act No. 36 of
1987, Financial Leasing Act No. 56 of 2000, Payment of Gratuity Act No. 12 of 1983, Employees’ Provident Fund Act. No 15 of 1958, Employees’ Trust Fund Act No. 46 of 1980 etc. and amendments to such statutes.
The Bank has established and maintained an effective system of internal controls which is improved on a continuous basis based on the recommendations of Internal Audit Department and the observations of the Central Bank of Sri Lanka and the external auditors during their inspections and audits.
COMPLIANCE WITH TRANSFER PRICING REGULATIONSAll transactions entered into with associated persons during the period are on an arm's length basis and are comparable with transactions carried out with non associated persons.
TRANSACTIONS WITH RELATED PARTIESThe Bank is in compliance with the rules of the Colombo Stock Exchange and Directions Issued by the CBSL on Related Party Transactions. Details of significant related party transactions are given in the table below;
Category of Related Party LKR ‘000
Subsidiary Companies * Directors of the Bank Key Management Personnel (KMP) of
the Bank
Close Relations of Directors and KMP
Shareholders owning a material interest in the
Bank **
Concerns in which Directors, Close
Relations of Directors or material shareholders have a substantial interest
2019 2018 2019 2018 2019 2018 2019 2018 2019 2018 2019 2018
Items in the Statement of Financial PositionAssetsAccommodationLoans and Advances - - 3,073 6,954 84,119 81,470 31,737 28,443 - 815,514 82,956 59,881Credit Cards - - 2,278 2,844 10,385 7,641 2,184 1,876 260 - 187 4,100Derivative Financial Assets - - - - - - - - - - - 61,637Other Assets - 1,124 - - - - - - - - 17,674 13,146Letter of Credit/Guarantees - - - - - - - - 108,969 42,764 281,235 446,291Undrawn Facilities - - 11,836 3,776 38,197 52,969 2,744 8,305 1,907,296 6,737 1,094,328 743,658Total Accommodation - 1,124 17,187 13,575 132,701 142,080 36,665 38,624 2,016,525 865,015 1,476,380 1,328,713Less: Cash Collaterals against Total Accommodations - - 18,596 14,058 65,303 48,755 37,257 49,874 - - - - Total Net Accommodation - 1,124 - - 67,398 93,325 - - 2,016,525 865,015 1,476,380 1,328,713Total Net Accommodation % of Total Regulatory Capital 0.00% 0.00% 0.00% 0.00% 0.17% 0.29% 0.00% 0.00% 5.20% 2.69% 3.81% 4.14%LiabilitiesDue to Customers 8,4 71 472,399 137,363 105,372 146,588 162,300 166,314 127,310 1,355,588 5,567,281 591,066 1,439,098Borrowings & Others 846,219 102,348 - - - 1,504 - - 3,438,788 2,559,503 1,260,414 352,252Debenture Issued - - - - - - - - - - 57,000 629,500Other Liabilities - - 104 1 76 - 20 - 1,056 9,942 105,185 257,148Derivative Financial Liabilities - - - - - - - - - - - 721EquityDividends (Net) - - 251 1,102 60 110 14 14 370,592 379,572 - - CommitmentsForward - Foreign Exchange Contracts - - - - - - - - - - - 562,945Items in statement of profit or lossInterest Income Earned - 798 893 581 7,143 7,317 2,221 2,755 28,018 50,813 12,127 5,987Interest Expenses Paid 58,701 39,051 10,050 8,085 12,448 15,246 15,474 9,909 248,313 659,844 49,316 161,371Other Income Earned 7,620 8,046 703 511 574 378 495 120 1,932 5,741 261,672 141,890Dividends Received (Gross) - 290,529 - - - - - - - - - -

60
Nations Trust Bank PLC Annual Report 2019
Category of Related Party LKR ‘000
Subsidiary Companies * Directors of the Bank Key Management Personnel (KMP) of
the Bank
Close Relations of Directors and KMP
Shareholders owning a material interest in the
Bank **
Concerns in which Directors, Close
Relations of Directors or material shareholders have a substantial interest
2019 2018 2019 2018 2019 2018 2019 2018 2019 2018 2019 2018
Share Repurchase - - - - - - - - - - - -Expenses Paid 86,925 80,777 723 716 68 159 - - 25,060 37,399 61,134 89,830Compensation paid Short Term Employee Benefits - - 72,009 71,127 266,317 276,773 - - - - - - Post Employment Benefits - - 4,026 3,728 40,414 28,382 - - - - - - No. of Shares of the Bank acquired Voting - - 2,596 379,491 - - - - - - - - Non-Voting - - 203 145,371 - - - - - - - - No. of Shares of the Bank disposed - - - - - - - - - - - -
* Subsidiaries of the Group include Waldock Mackenzie Limited, Allied Properties Limited and Nations Insurance Brokers Limited.
** Since John Keells Holdings PLC together with Mackinnon Keells Limited, HWIC Asia Fund and Central Finance Company PLC together with CF Growth Fund Limited and CF Insurance Brokers Limited hold material interest in the Bank, transactions with these companies have been disclosed.
Key Management Personnel (KMP) consists of the Bank’s Corporate Management as designated by the Corporate Governance structure.
As required by rule 9.3.2 (a) of the CSE listing rules, there are no non-recurrent related party transactions which exceeds the lower of 10% of the equity or 5% of the total assets.
As required by rule 9.3.2 (b) of the CSE listing rules, there are no recurrent related party transactions which exceeds 10% of the gross revenue/income.
DIRECTORS OF SUBSIDIARY COMPANIESDirectorates of the Bank’s subsidiary companies are as follows;
Waldock Mackenzie LimitedMr. Prasanna De Silva–ChairmanMr. Suran WijesingheMs. Renuka Fernando
Nations Insurance Brokers LimitedMs. Renuka Fernando-ChairpersonMs. Rachini Rajapaksa
Allied Properties LimitedMr. Prasanna De Silva–ChairmanMr. Suran WijesingheMs. Renuka Fernando
GOING CONCERNDirectors after making necessary inquiries have a reasonable expectation that the Bank has adequate resources to continue in operational existence for the foreseeable future. Therefore the going concern basis has been adopted in the preparation of the Financial Statements.
ANNUAL GENERAL MEETINGAnnual General Meeting of the Bank will be held at the 6th Floor, CA Sri Lanka, 30A, Malalasekera Mawatha, Colombo 07, Sri Lanka on 31stMarch, 2020 at 10.00 a.m.
For and on behalf of the Board
Gihan Cooray Chairman
Renuka Fernando Director/Chief Executive Officer
Theja Silva Company Secretary
Colombo 27th February, 2020
ANNUAL REPORT OF THE BOARD OF DIRECTORS ON THE AFFAIRS OF THE BANK

61
NEXT GEN BANKING
DIRECTORS’ INTEREST IN CONTRACTS WITH THE BANKThe Bank Carried out transactions in the ordinary course of its business as commercial rates with the following Director related entities. Details of the transaction carried out Director related entities during the year 2019
Name of the related party Name of Director Relationship Details
Allied Properties Limited Mr. Prasanna De Silva Director A sum of LKR 29,440,619.43 was paid as Interest ExpenseMr. Suran Wijesinghe Director A sum of LKR 86,924,508.00 was paid as Rent ExpensesMs. Renuka Fernando Director
Asian Hotels & Properties PLC Mr. Gihan Cooray Director A sum of LKR 31,139,523.00 was paid as Interest ExpenseA sum of LKR 550.00 was received as Other IncomeA sum of LKR 6,546,760.92 was paid as Other Expenses
Central Finance Company PLC Mr. Prasanna De Silva Director A sum of LKR 28,018,387.00 was received as Interest IncomeMr. Arjun Rishya Fernando A sum of LKR 205,668,874.82 was paid as Interest Expense
A sum of LKR 1,604,833.36 was received as Other IncomeA sum of LKR 25,059,957.00 was paid as Other Expenses
Ceylon Cold Stores PLC Mr. Gihan Cooray Director A sum of LKR 193,464.00 was paid as Interest ExpenseA sum of LKR 154,990.37 was received as Other Income
CF Growth Fund Limited Mr. Prasanna De Silva Director A sum of LKR 27,104,592.90 as Dividend
CF Insurance Brokers (Pvt) Ltd. Mr. Prasanna De Silva Director A sum of LKR 147,351.15 was received as Other IncomeA sum of LKR 27,289,558.01 as Dividend
Gymara Fernando Trust Ms. Renuka Fernando Director A sum of LKR 2,155,863.06 was paid as Interest Expense
Hedges Court Res. (Pvt) Ltd. Mr. Prasanna De Silva Director A sum of LKR 564,901.00 was paid as Interest ExpenseA sum of LKR 5,000.00 was received as Other Income
Jaykay Marketing Services (Private) Limited Mr. Gihan Cooray Director A sum of LKR 88,150.00 was received as Interest IncomeA sum of LKR 1,559,429.00 was paid as Interest ExpenseA sum of LKR 104,575.00 was received as Other IncomeA sum of LKR 26,071,968.32 was paid as Other Expenses
John Keells Holdings PLC Mr. Gihan Cooray Director A sum of LKR 42,644,464.00 was paid as Interest ExpenseA sum of LKR 33,784.50 was received as Other IncomeA sum of LKR 120,836,766.45 as Dividend
John Keells Hotels PLC Mr. Gihan Cooray Director A sum of LKR 1,150 was received as Other Income
John Keells PLC Mr. Gihan Cooray Director A sum of LKR 282,325.00 was paid as Interest ExpenseA sum of LKR 9,050.00 was received as Other Income
John Keells Stock Brokers (Pvt) Ltd. Ms. Sherin Cader Director A sum of LKR 77,773.97 was received as Interest ExpenseA sum of LKR 258,625.00 was paid as Other Income
Keells Food Products PLC Mr. Gihan Cooray Director A sum of LKR 5,050.00 was received as Other Income
Nations Insurance Brokers Limited Ms. Rachini Rajapaksa Director A sum of LKR 20,851,175.19 was paid as Interest ExpenseMs. Renuka Fernando Director A sum of LKR 6,985,236.00 was received as Other Income
Rajawella Holdings Limited Mr. Gihan Cooray Director A sum of LKR 1,455,457.00 was received as Interest IncomeA sum of LKR 320,911.00 was paid as Interest ExpenseA sum of LKR 272,350.81 was received as Other Income
Trans Asia Hotels PLC Mr. Gihan Cooray Director A sum of LKR 5,750.00 was received as Other IncomeA sum of LKR 211,292.16 was received as Other Expense
Waldock Mackenzie Limited Mr. Prasanna De Silva Director A sum of LKR 8,409,629.28 was paid as Interest ExpenseMr. Suran Wijesinghe Director A sum of LKR 634,826.56 was received as Other IncomeMs. Renuka Fernando Director
Walkers Tours Limited Mr. Gihan Cooray Director A sum of LKR 983,994.00 was paid as Interest ExpenseA sum of LKR 189,534.56 was received as Other IncomeA sum of LKR 306,666.66 was paid as Other Expense
Details of accommodation granted and balances outstanding as at 31 December 2019
Name of the related party Name of Director Relationship Accommodation Granted Limit - LKR Outstanding as at 31 December 2019
Rajawella Holdings Limited Mr. Gihan Cooray Director Working Capital Financing 53,000,000 27,110,261 Central Finance Company PLC Mr. Prasanna De Silva Director Working Capital Financing (Bank
Guarantee-Off Balance Sheet) 2,000,000,000 108,969,003

62
Nations Trust Bank PLC Annual Report 2019
RISK MANAGEMENT REVIEW
At Nations Trust Bank, the sustainable creation of stakeholder value is underpinned by a robust risk management framework and practices which have evolved over the years to become deeply embedded in our culture.In response to emerging risk trends, regulatory changes and an increasingly dynamic business environment, the Bank has focused on proactively strengthening its Integrated Risk Management Framework, allowing it to be resilient through business cycles. This report provides a concise yet comprehensive understanding of the Integrated Risk Management Framework in place within the Bank and key aspects of our risk performance during the year.
(A) LINKING BUSINESS STRATEGY TO RISK MANAGEMENT
At Nations Trust Bank, risk management is embedded into strategic planning including projects and all daily operations. In addition to regulatory requirements, our risk management framework embraces globally accepted best practices in identifying, assessing, measuring
and managing the key risks faced, including the critical interdependencies between the risks.
Our business model and risk exposuresThe Bank’s risk profile is reflected in its business model which represents the business activities and processes in place to transform
inputs into long-term value for stakeholders. The risk management framework is aligned to the Bank’s overall business strategy, enabling it to proactively identify, measure, mitigate and respond to emerging risks arising due to the Bank’s strategic agenda. Key risks stemming from the Bank’s business model are given below;
Risks monitored
by the Bank for impact
Risks arising from the Bank’s operations and
processes
Activity Risk exposure
Lend Credit risk
Fund Funding and liquidity risk
Trade Market risk
Compete Strategic risk
Regulated industry Compliance risk
Geopolitical risk
Macro-economic risk
Legal risk
Key operations and processes Operational risk (IT, people related risk, legal risk)
DepositsBorrowingsEquityRepoOther
Funding Composition 2019 %
33
10
70
144
0
3333 733 0
LKR MnLKR Bn
0
50
100
150
200
250
Gross loans and advancesImpairment charge
Loan Book and Impairment
0
500
1,000
1,500
2,000
2,500
3,000
3,500
4,000
2012
2013
2014
2015
2016
2017
2018
2019
0.00
0.25
0.50
0.75
1.00
Operating Losses against Op. Expenses Risk Goal
%Operational Losses against Operating Expenses
2015 2016 2017 2018 2019

63
NEXT GEN BANKING
Assessing the components of the business model enables the Bank to evaluate the robustness of the existing business model and identify the events that could impact sustainable value creation. The assessment
also identifies opportunities for improving operational and compliance efficiency. This enables the Bank to identify the risks it is willing to take – often defined or characterised as the risk appetite.
(B) APPROACH TO RISK MANAGEMENT
Operational Risk
ManagementPolicy Liquidity
RiskManagement
Policy
Integrated Risk Management
(IRM) FrameworkIT Security and Data
GovernancePolicy
Stress TestingPolicy
Counter Party Credit Risk
Management Policy
Market Risk Management
Policy
Credit Risk Management
Policy
Our systematic, timely and structured approach to risk management contributes to efficiency and to consistent, comparable and reliable results. It is underpinned by setting objectives, strategies, policies, risk appetite and tolerance limits for key types of risk.
Integrated Risk Management FrameworkThe Bank’s Integrated Risk Management (IRM) Framework underpins the foundation for managing risk and clearly defines the tools, techniques and activities in place to ensure that all material risks are identified, measured, managed and reported. Clearly defined roles and responsibilities, both at Board and Executive Committee level ensure independence of judgment and judicious empowerment. A comprehensive framework of policies ensures the consistency and clarity in the identification, measurement, management and reporting of key risks.
The Bank’s key risk management objectives are,
• Establish a framework that supports the business activities to maximise risk- adjusted returns within the Board approved Risk Appetite and other aspects such as regulatory requirements and the Bank’s internal controls
• Accurately identify and measure the sources of these risks
• Recommend appropriate levels of risks, consistent with the Board of Directors’ appetite or tolerance for such risks
• Control the level of risks by establishing limits and routinely monitoring the risk exposures to these limits
• Ensure that there is no breach of relevant CBSL regulatory requirements and applicable laws including Exchange Control regulations, ICASL guidelines, Stock Exchange Requirements, CSE regulations, Company Law requirements, etc.
• Seek to enable a balance between controlling these risks and generating optimal returns within these risk constraints
• Add value to the Bank’s business units, Senior Management and Board of Directors by providing analysis and recommendations to support the achievement of the overall Bank’s strategic objectives.
Risk AppetiteAn integral part of the Bank’s Integrated Risk Management (IRM) is the development of key risk metrics, exposure limits, and governance and oversight processes to ensure enterprise-wide risks are within acceptable and manageable levels. A best-practice approach to addressing these requirements is to implement a clearly defined Risk Appetite Statement (RAS).
While developing the Bank’s RAS, we have considered the following fundamental aspects with respect to strategy, risk management, and operations, including:
• The strategies for the overall organisation and individual business units and the key assumptions underlying those strategies
• The significant risks and aggregate risk levels that the Bank is willing to accept in order to achieve its’objectives
• The governance structures and risk management policies to oversee and control risks
• Assess and quantify the key risks so that the Bank can monitor exposures and key trends over time
• Establish the appropriate risk tolerances given our business objectives, profit and growth opportunities, and regulatory requirements
• Integrate our risk appetite into strategic and tactical decision making in order to optimise our risk profile
• Establish an IRM feedback loop and provide effective reporting to the Board and Senior Management
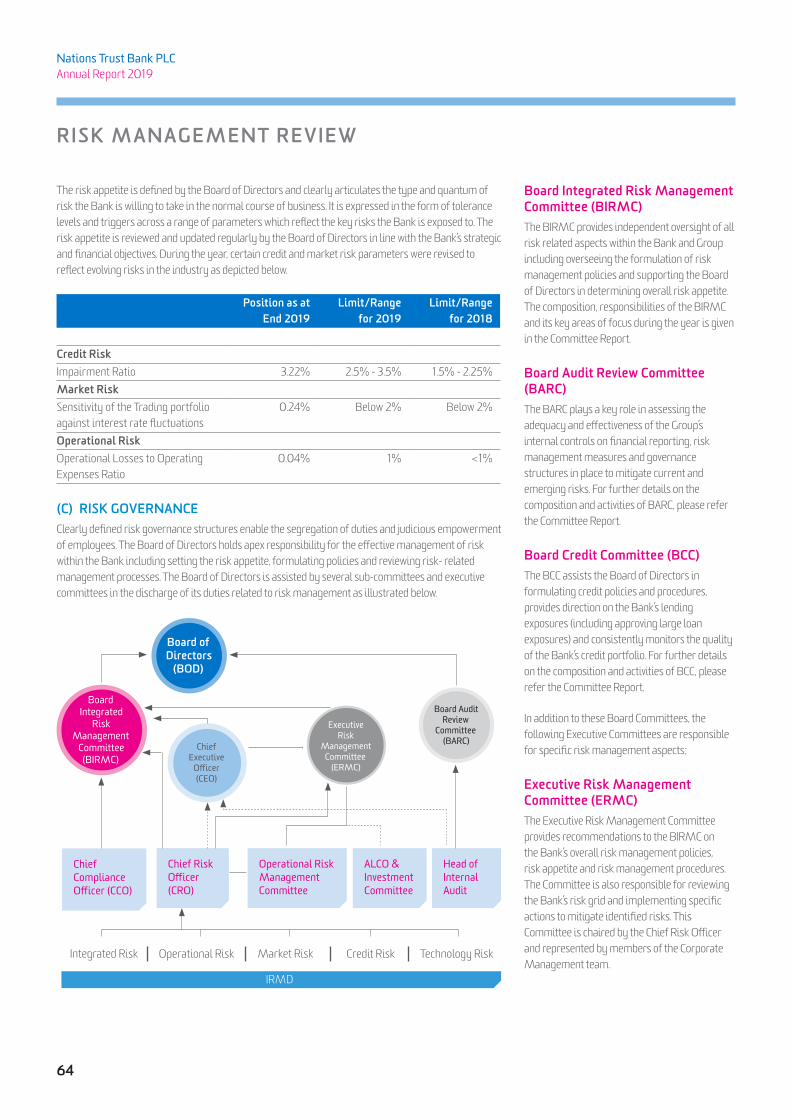
64
Nations Trust Bank PLC Annual Report 2019
RISK MANAGEMENT REVIEW
The risk appetite is defined by the Board of Directors and clearly articulates the type and quantum of risk the Bank is willing to take in the normal course of business. It is expressed in the form of tolerance levels and triggers across a range of parameters which reflect the key risks the Bank is exposed to. The risk appetite is reviewed and updated regularly by the Board of Directors in line with the Bank’s strategic and financial objectives. During the year, certain credit and market risk parameters were revised to reflect evolving risks in the industry as depicted below.
Position as at End 2019
Limit/Range for 2019
Limit/Range for 2018
Credit Risk Impairment Ratio 3.22% 2.5% - 3.5% 1.5% - 2.25%Market Risk Sensitivity of the Trading portfolio against interest rate fluctuations
0.24% Below 2% Below 2%
Operational Risk Operational Losses to Operating Expenses Ratio
0.04% 1% <1%
(C) RISK GOVERNANCEClearly defined risk governance structures enable the segregation of duties and judicious empowerment of employees. The Board of Directors holds apex responsibility for the effective management of risk within the Bank including setting the risk appetite, formulating policies and reviewing risk- related management processes. The Board of Directors is assisted by several sub-committees and executive committees in the discharge of its duties related to risk management as illustrated below.
Chief Executive
Officer (CEO)
Chief Executive
Officer (CEO)
Chief Risk Officer (CRO)
Chief Compliance Officer (CCO)
Integrated Risk Operational Risk Market Risk Credit Risk Technology Risk
Operational Risk Management Committee
ALCO & Investment Committee
Head of Internal Audit
Board ofDirectors
(BOD)
Board Integrated
Risk Management
Committee (BIRMC)
Executive Risk
Management Committee
(ERMC)
Board Audit Review
Committee (BARC)
IRMD
Board Integrated Risk Management Committee (BIRMC)The BIRMC provides independent oversight of all risk related aspects within the Bank and Group including overseeing the formulation of risk management policies and supporting the Board of Directors in determining overall risk appetite. The composition, responsibilities of the BIRMC and its key areas of focus during the year is given in the Committee Report.
Board Audit Review Committee (BARC)The BARC plays a key role in assessing the adequacy and effectiveness of the Group’s internal controls on financial reporting, risk management measures and governance structures in place to mitigate current and emerging risks. For further details on the composition and activities of BARC, please refer the Committee Report.
Board Credit Committee (BCC)The BCC assists the Board of Directors in formulating credit policies and procedures, provides direction on the Bank’s lending exposures (including approving large loan exposures) and consistently monitors the quality of the Bank’s credit portfolio. For further details on the composition and activities of BCC, please refer the Committee Report.
In addition to these Board Committees, the following Executive Committees are responsible for specific risk management aspects;
Executive Risk Management Committee (ERMC)The Executive Risk Management Committee provides recommendations to the BIRMC on the Bank’s overall risk management policies, risk appetite and risk management procedures. The Committee is also responsible for reviewing the Bank’s risk grid and implementing specific actions to mitigate identified risks. This Committee is chaired by the Chief Risk Officer and represented by members of the Corporate Management team.
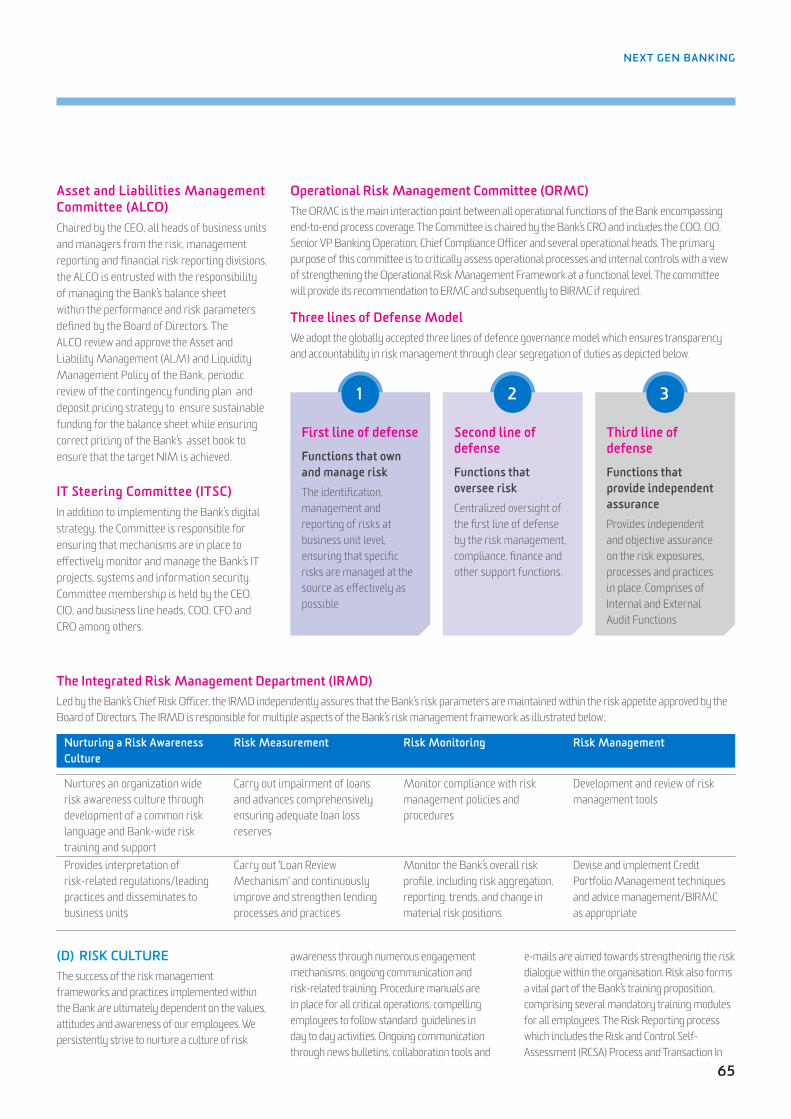
65
NEXT GEN BANKING
Asset and Liabilities Management Committee (ALCO)Chaired by the CEO, all heads of business units and managers from the risk, management reporting and financial risk reporting divisions, the ALCO is entrusted with the responsibility of managing the Bank’s balance sheet within the performance and risk parameters defined by the Board of Directors. The ALCO review and approve the Asset and Liability Management (ALM) and Liquidity Management Policy of the Bank, periodic review of the contingency funding plan and deposit pricing strategy to ensure sustainable funding for the balance sheet while ensuring correct pricing of the Bank’s asset book to ensure that the target NIM is achieved.
IT Steering Committee (ITSC)In addition to implementing the Bank’s digital strategy, the Committee is responsible for ensuring that mechanisms are in place to effectively monitor and manage the Bank’s IT projects, systems and information security.Committee membership is held by the CEO, CIO, and business line heads, COO, CFO and CRO among others.
Operational Risk Management Committee (ORMC)The ORMC is the main interaction point between all operational functions of the Bank encompassing end-to-end process coverage. The Committee is chaired by the Bank’s CRO and includes the COO, CIO, Senior VP Banking Operation, Chief Compliance Officer and several operational heads. The primary purpose of this committee is to critically assess operational processes and internal controls with a view of strengthening the Operational Risk Management Framework at a functional level. The committee will provide its recommendation to ERMC and subsequently to BIRMC if required.
Three lines of Defense ModelWe adopt the globally accepted three lines of defence governance model which ensures transparency and accountability in risk management through clear segregation of duties as depicted below.
1 2 3
First line of defense
Functions that own and manage riskThe identification, management and reporting of risks at business unit level, ensuring that specific risks are managed at the source as effectively as possible
Second line of defense
Functions that oversee riskCentralized oversight of the first line of defense by the risk management, compliance, finance and other support functions.
Third line of defense
Functions that provide independent assuranceProvides independent and objective assurance on the risk exposures, processes and practices in place. Comprises of Internal and External Audit Functions
1 2 3
The Integrated Risk Management Department (IRMD)Led by the Bank’s Chief Risk Officer, the IRMD independently assures that the Bank’s risk parameters are maintained within the risk appetite approved by the Board of Directors. The IRMD is responsible for multiple aspects of the Bank’s risk management framework as illustrated below;
Nurturing a Risk Awareness Culture
Risk Measurement Risk Monitoring Risk Management
Nurtures an organization wide risk awareness culture through development of a common risk language and Bank-wide risk training and support
Carry out impairment of loans and advances comprehensively ensuring adequate loan loss reserves
Monitor compliance with risk management policies and procedures
Development and review of risk management tools
Provides interpretation of risk-related regulations/leading practices and disseminates to business units
Carry out 'Loan Review Mechanism' and continuously improve and strengthen lending processes and practices
Monitor the Bank’s overall risk profile, including risk aggregation, reporting, trends, and change in material risk positions
Devise and implement Credit Portfolio Management techniques and advice management/BIRMC as appropriate
(D) RISK CULTUREThe success of the risk management frameworks and practices implemented within the Bank are ultimately dependent on the values, attitudes and awareness of our employees. We persistently strive to nurture a culture of risk
awareness through numerous engagement mechanisms, ongoing communication and risk-related training. Procedure manuals are in place for all critical operations, compelling employees to follow standard guidelines in day to day activities. Ongoing communication through news bulletins, collaboration tools and
e-mails are aimed towards strengthening the risk dialogue within the organisation. Risk also forms a vital part of the Bank’s training proposition, comprising several mandatory training modules for all employees. The Risk Reporting process which includes the Risk and Control Self-Assessment (RCSA) Process and Transaction In

66
Nations Trust Bank PLC Annual Report 2019
RISK MANAGEMENT REVIEW
Difficulty (TID)/Operation Loss Events (OLE) reporting has helped to instill a culture of risk-awareness.
(E) RISK MEASUREMENTThe Bank adopts an array of tools and techniques to measure its key risk exposures as listed below;
Risk exposure
Credit Risk Probability of Default (PD), Loss Given Default (LGD) and Exposure At Default (EAD), Trends and Sector Concentration, NPL Ratios, Early Warning Monitoring
Market Risk Maturity/Interest Rate Risk Gap analysis, Interest Rate Risk Ratio, PVBP, VAR, Duration Analysis, Sensitivity Analysis, and Stress Testing on IRR in Trading/Banking Book (EAR and EVE).
Liquidity Risk Maturity Mismatch, Concentration of Funding, Liquidity Coverage Ratio (LCR), Net Stable Funding Ratio (NSFR), Liquidity Early Warning Signals, Intraday liquidity Management, Contingency Funding Plan, Liquidity Transfer Pricing, Liquidity Simulations
Operational Risk Transaction In Difficulty (TID), Risk Control Self-Assessment (RCSA)/Heat map/Scenario Analysis and Stress testing/Key Risk Indicators
Reputational Risk Customer Feedback/Complaints, Positive/Negative Publicity through Qualitative Scorecard Approach
Strategic Risk Bank's Financial Performance/Peer Performance and Strategic Initiatives through Qualitative Scorecard Approach
Technology Risk Vulnerability Assessments, Security Reviews and Key Risk Indicators
(F) RISK REPORTINGClearly defined risk reporting mechanisms ensure that key risk exposures are identified and escalated to the relevant personnel and ultimately the Board of Directors in a timely and relevant manner. Risk reporting encompasses all key risk exposures and is clearly communicated to all relevant employees across the organisation.
Risk Exposure
Reporting line Risk Reporting
Content
Credit Risk Board of Directors
Credit Risk Summary
Portfolio Health/ageing and Trend Analysis, Allowance for Impairment, Concentration Risk, Analysis, NPL Vintage Analysis
Exposure vs Risk appetite
NPL ratio Net of IIS, Specific Provision Cover, Impairment Ratio, NPA Stress Test,
Loan Review Mechanism (LRM) Reports
LRM Findings & Recommendations
Management/ Management Sub Committees
Credit Risk Management Report
Top 20 Exposures, Portfolio Health/ageing and Trend Analysis, Analysis of Impairment Assessment.
Early Warning Signals Summary
Analysis of Early Warnings/Exposures
Watch Lists Management Watch List Customer Updates

67
NEXT GEN BANKING
Risk Exposure
Reporting line Risk Reporting
Content
Market Risk Board of Directors
Exception Report
Breaches of FX Net Open Position Limits, Stop Loss Limits, Counterparty Limits and Other Market Risk limits
FIS Performance
Fixed Income Government Security, Mark to Market Movement and Performance
USD and Other Currency Investments Report
Performance on Investment in Foreign Currency Securities and Corporate Debt Securities
Market Risk Dash-board
Interest Rate Risk Ratio, IRRBB, Liquidity Gap Reports, Liquidity Stress testing, Liquidity Coverage, Statutory Liquidity Ratio, Loans/Deposit Ratio (L/D), Average FX, NOP Sensitivity
Quarterly Stress Testing
Stress Testing based on Historical Market Rate Movements , as well as Forward Views of Market Expectations
Management/ Management Sub Committees
Treasury Profitability, Performance Report
Liquidity Reserve Ratio, M2M of FX and FIS Portfolios, Daily Treasury Profitability, Treasury Exceptions
ALCO Report Maturity Gap, Liquidity Reserve Ratio, Liquidity Coverage Ratio, Net Stable funding Ratio, Liquidity Stress Testing, Other Liquidity Stock Ratios, Monitoring of Contingency Funding plan, Interest Rate Risk Ratios, FX Risk and Sensitivity Analysis
Management Report
Performance of Investments in Government Securities
Operational Risk
Board of Directors
Exposure vs Risk Appetite
Uninsured Operational Losses Vs Net Income, Total Operational Losses Vs Operating Expenses Summary of Operational Losses & Loss Events
Quarterly Stress Testing
Scenarios based on historical events from internal and external loss data
Management/ Management Sub Committees
Monthly Operational Risk Management Report
Operational Risk - Risk Appetite, Detailed Analysis of Operational Losses
Technology Risk
Board of Directors
Technology Risk Dashboard
Priority 1 and 2 Information Security Incidents, Critical System Downtimes, Information Security Vulnerability Remediation Progress, etc.
(G) STRESS TESTINGStress testing is conducted on an ongoing basis to identify the potential impacts that fluctuations in market variables and other risk factors could have on the Bank’s risk profile. Impacts are measured with reference to capital, earnings and liquidity positions. The findings of the Bank’s stress testing activities are an input into several processes including capital computation under ICAAP, strategic planning and risk management among others. The BIRMC conducts regular reviews of the stress testing outcomes including the major assumptions that underpin them.
Credit Risk Deterioration in asset quality increase in large NPLs shifts in NPL categories Potential
impact on,
• Earnings
• Capital adequacy
• Funding capability/liquidity
Interest Rate RiskMovements in interest rate by +/- 100 bps and 200 bps
Foreign Exchange Risk Forex risk on net open position
Liquidity RiskFunding capability of a cash outflow in a liquidity stress scenario - up to 1 month
Operational RiskScenarios based on historical events from internal and external loss data
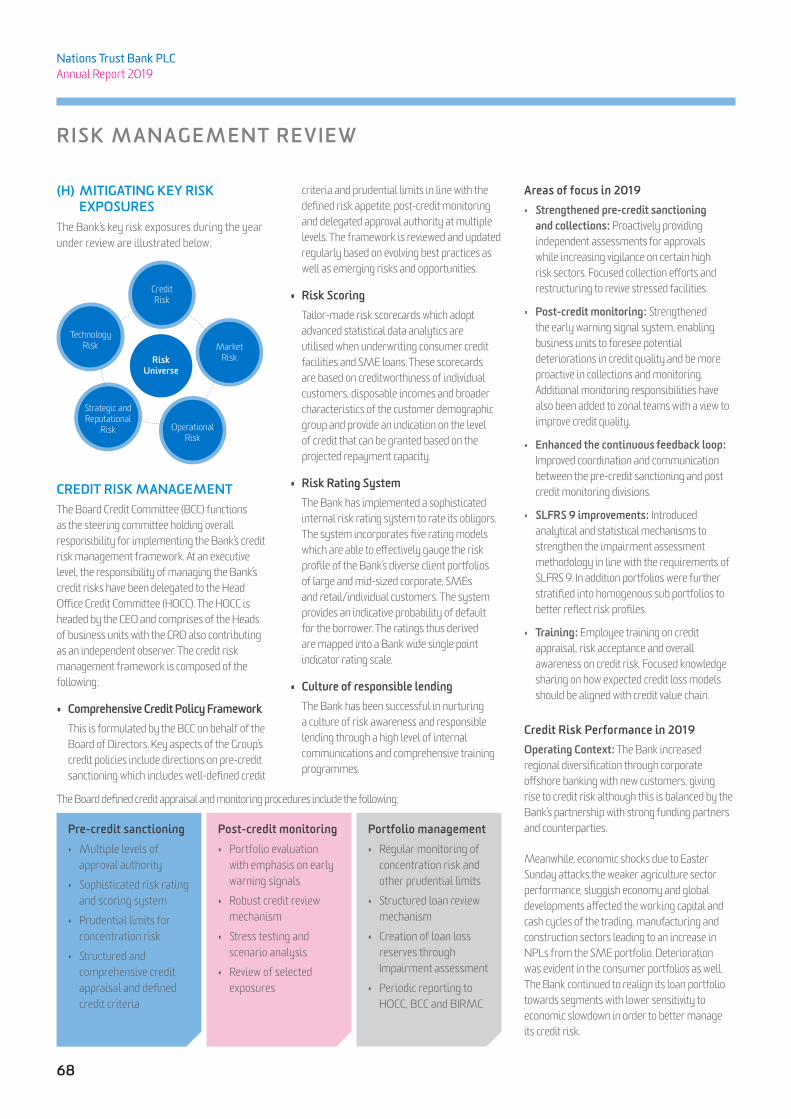
68
Nations Trust Bank PLC Annual Report 2019
RISK MANAGEMENT REVIEW
(H) MITIGATING KEY RISK EXPOSURES
The Bank’s key risk exposures during the year under review are illustrated below;
RiskUniverse
Credit Risk
Market Risk
Operational Risk
Strategic and Reputational
Risk
Technology Risk
CREDIT RISK MANAGEMENTThe Board Credit Committee (BCC) functions as the steering committee holding overall responsibility for implementing the Bank’s credit risk management framework. At an executive level, the responsibility of managing the Bank’s credit risks have been delegated to the Head Office Credit Committee (HOCC). The HOCC is headed by the CEO and comprises of the Heads of business units with the CRO also contributing as an independent observer. The credit risk management framework is composed of the following;
• Comprehensive Credit Policy Framework This is formulated by the BCC on behalf of the Board of Directors. Key aspects of the Group’s credit policies include directions on pre-credit sanctioning which includes well-defined credit
criteria and prudential limits in line with the defined risk appetite, post-credit monitoring and delegated approval authority at multiple levels. The framework is reviewed and updated regularly based on evolving best practices as well as emerging risks and opportunities.
• Risk ScoringTailor-made risk scorecards which adopt advanced statistical data analytics are utilised when underwriting consumer credit facilities and SME loans. These scorecards are based on creditworthiness of individual customers, disposable incomes and broader characteristics of the customer demographic group and provide an indication on the level of credit that can be granted based on the projected repayment capacity.
• Risk Rating SystemThe Bank has implemented a sophisticated internal risk rating system to rate its obligors. The system incorporates five rating models which are able to effectively gauge the risk profile of the Bank’s diverse client portfolios of large and mid-sized corporate, SMEs and retail/individual customers. The system provides an indicative probability of default for the borrower. The ratings thus derived are mapped into a Bank wide single point indicator rating scale.
• Culture of responsible lendingThe Bank has been successful in nurturing a culture of risk awareness and responsible lending through a high level of internal communications and comprehensive training programmes.
The Board defined credit appraisal and monitoring procedures include the following;
Pre-credit sanctioning• Multiple levels of
approval authority
• Sophisticated risk rating and scoring system
• Prudential limits for concentration risk
• Structured and comprehensive credit appraisal and defined credit criteria
Post-credit monitoring• Portfolio evaluation
with emphasis on early warning signals
• Robust credit review mechanism
• Stress testing and scenario analysis
• Review of selected exposures
Portfolio management• Regular monitoring of
concentration risk and other prudential limits
• Structured loan review mechanism
• Creation of loan loss reserves through Impairment assessment
• Periodic reporting to HOCC, BCC and BIRMC
Areas of focus in 2019• Strengthened pre-credit sanctioning
and collections: Proactively providing independent assessments for approvals while increasing vigilance on certain high risk sectors. Focused collection efforts and restructuring to revive stressed facilities.
• Post-credit monitoring: Strengthened the early warning signal system, enabling business units to foresee potential deteriorations in credit quality and be more proactive in collections and monitoring. Additional monitoring responsibilities have also been added to zonal teams with a view to improve credit quality.
• Enhanced the continuous feedback loop: Improved coordination and communication between the pre-credit sanctioning and post credit monitoring divisions.
• SLFRS 9 improvements: Introduced analytical and statistical mechanisms to strengthen the impairment assessment methodology in line with the requirements of SLFRS 9. In addition portfolios were further stratified into homogenous sub portfolios to better reflect risk profiles.
• Training: Employee training on credit appraisal, risk acceptance and overall awareness on credit risk. Focused knowledge sharing on how expected credit loss models should be aligned with credit value chain.
Credit Risk Performance in 2019Operating Context: The Bank increased regional diversification through corporate offshore banking with new customers, giving rise to credit risk although this is balanced by the Bank’s partnership with strong funding partners and counterparties.
Meanwhile, economic shocks due to Easter Sunday attacks,the weaker agriculture sector performance, sluggish economy and global developments affected the working capital and cash cycles of the trading, manufacturing and construction sectors leading to an increase in NPLs from the SME portfolio. Deterioration was evident in the consumer portfolios as well. The Bank continued to realign its loan portfolio towards segments with lower sensitivity to economic slowdown in order to better manage its credit risk.
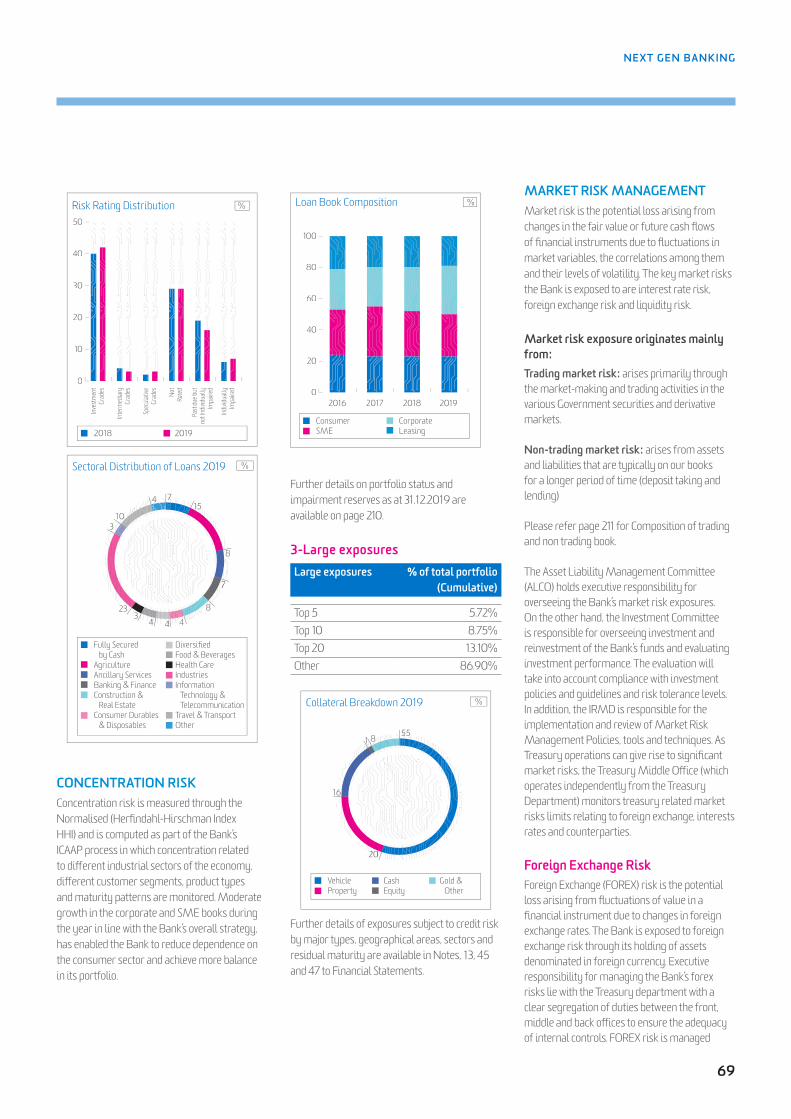
69
NEXT GEN BANKING
2018 2019
0
10
20
30
40
50
Risk Rating Distribution %
Inves
tmen
tGr
ades
Inter
med
iary
Grad
es
Spec
ulat
iveGr
ades No
tRa
ted
Past
due b
utno
t Indiv
iduall
yIm
paire
d
Indivi
duall
yIm
paire
d
Fully Secured by CashAgricultureAncillary ServicesBanking & FinanceConstruction & Real EstateConsumer Durables & Disposables
DiversifiedFood & BeveragesHealth CareIndustriesInformation Technology & TelecommunicationTravel & TransportOther
Sectoral Distribution of Loans 2019 %
103
23
74
8
7
8
4443
150
30
3
34
4
33
4
4
44
33
7
88
8
5
4
17
5
4
CONCENTRATION RISKConcentration risk is measured through the Normalised (Herfindahl-Hirschman Index HHI) and is computed as part of the Bank’s ICAAP process in which concentration related to different industrial sectors of the economy, different customer segments, product types and maturity patterns are monitored. Moderate growth in the corporate and SME books during the year in line with the Bank’s overall strategy, has enabled the Bank to reduce dependence on the consumer sector and achieve more balance in its portfolio.
0
20
40
60
80
100
Loan Book Composition %
2016 2017 2018 2019
ConsumerSME
CorporateLeasing
Further details on portfolio status and impairment reserves as at 31.12.2019 are available on page 210.
3-Large exposuresLarge exposures % of total portfolio
(Cumulative)
Top 5 5.72%Top 10 8.75%Top 20 13.10%Other 86.90%
VehicleProperty
CashEquity
Gold & Other
Collateral Breakdown 2019 %
81
16
55
20
6
02
88
20
55
Further details of exposures subject to credit risk by major types, geographical areas, sectors and residual maturity are available in Notes, 13, 45 and 47 to Financial Statements.
MARKET RISK MANAGEMENT Market risk is the potential loss arising from changes in the fair value or future cash flows of financial instruments due to fluctuations in market variables, the correlations among them and their levels of volatility. The key market risks the Bank is exposed to are interest rate risk, foreign exchange risk and liquidity risk.
Market risk exposure originates mainly from:Trading market risk: arises primarily through the market-making and trading activities in the various Government securities and derivative markets.
Non-trading market risk: arises from assets and liabilities that are typically on our books for a longer period of time (deposit taking and lending)
Please refer page 211 for Composition of trading and non trading book.
The Asset Liability Management Committee (ALCO) holds executive responsibility for overseeing the Bank’s market risk exposures. On the other hand, the Investment Committee is responsible for overseeing investment and reinvestment of the Bank’s funds and evaluating investment performance. The evaluation will take into account compliance with investment policies and guidelines and risk tolerance levels. In addition, the IRMD is responsible for the implementation and review of Market Risk Management Policies, tools and techniques. As Treasury operations can give rise to significant market risks, the Treasury Middle Office (which operates independently from the Treasury Department) monitors treasury related market risks limits relating to foreign exchange, interests rates and counterparties.
Foreign Exchange RiskForeign Exchange (FOREX) risk is the potential loss arising from fluctuations of value in a financial instrument due to changes in foreign exchange rates. The Bank is exposed to foreign exchange risk through its holding of assets denominated in foreign currency. Executive responsibility for managing the Bank’s forex risks lie with the Treasury department with a clear segregation of duties between the front, middle and back offices to ensure the adequacy of internal controls. FOREX risk is managed

70
Nations Trust Bank PLC Annual Report 2019
RISK MANAGEMENT REVIEW
through limits on exposure to currencies on an individual and aggregate basis, as well as dealer and counter-party limits, overnight and intra-day limits and stop loss limits. These limits are independently monitored on a daily basis by the Treasury Middle Office, ensuring market risk exposures are within the Board-approved limits. These transactions are also governed by the CBSL which has in place a stringent regulatory framework which includes an approval mechanism and exposure limits.
Refer Page 212 for Net Open Position of Foreign Currency Denominated Assets and Liabilities of Domestic Banking Units (in millions of respective currency).
Interest Rate RiskInterest Rate Risk arises from the possibility that fluctuations in interest rates will affect the future cash flows or fair values of financial instruments. Exposure to interest rate risk arises from its lending, trading securities and deposit liabilities. Sub types of interest rate risks are,• Repricing risk arises from the inherent
mismatch between the Bank’s assets and liabilities which results in repricing timing differences.
• Basis risk arises from the impact of relative changes in interest rates for financial instruments that have similar tenors but are priced using different interest rate indices.
• Yield curve risk arises from shifts in the yield curve that have a negative impact on the Bank’s earnings/asset values.
The Bank manages its interest rate risk primarily through asset liability repricing gap analysis, which distributes interest rate sensitive assets, liabilities and off-balance sheet positions into several maturity buckets. Board defined limits are in place for interest rate gaps and positions are monitored at least on a monthly basis to ensure compliance to the prescribed limits. In addition to the asset liability maturity mismatches.
Refer page 214 for Interest Rate Sensetivity Gap Analysis (in millions of respective currency).
The ALCO regularly monitors trends in market interest rates, as well as results of interest rate stress testing analysis.
Interest Rate Risk in Banking Book: Interest Rate Risk in Banking Book (IRRBB) refers to the current or prospective risk to the Bank’s capital and earnings arising from adverse movements in interest rates that affect the Bank’s banking book positions.
When interest rates change, the present value and timing of future cash flows change. This, inturn changes the underlying value of a bank’s assets, liabilities and off-balance sheet items and hence it’s Economic Value (EVE). Changes in interest rates also affect a bank’s earnings by altering interest rate-sensitive income and expenses, affecting its Net Interest Income (NII). Bank has a comprehensive risk management process in place that effectively identifies, measures, monitors and controls the IRRBB exposures, and that is subject to appropriate board and senior management oversight.
Refer Page 214 for Interest Rate Sensetivity gap analysis (in millions of respective currency.
Liquidity RiskLiquidity risk is the risk arising from the Bank’s potential inability to meet all payment obligations when they come due or only being able to meet these obligations at excessive costs.
Oversight responsibility for managing the Bank’s liquidity risks is with the ALCO, which ensures that a sufficient liquidity buffer is maintained to meet the Bank’s financial obligations. The ALCO regularly reviews the Bank’s cash flow projections, funding capabilities, pricing decisions and liquidity levels to ensure compliance to internal targets as well as regulatory liquidity requirements. The Committee also works closely with the Treasury Department in the implementation of ALCO decisions on a day to day basis.
Liquidity indicators were maintained comfortably within regulatory minimums and the limits defined by the Risk Appetite statement. Refer page 215.
Listed below the tools for measuring and managing liquidity I. Maturity Mismatch II. Concentration of FundingIII. Liquidity Coverage Ratio (LCR)IV. Net Stable Funding Ratio (NSFR)V. Liquidity Early Warning SignalsVI. Intraday liquidity Management
VII. Contingency Funding PlanVIII. Liquidity Transfer PricingIX. Liquidity Simulations: Stress Testing and
Scenario Analysis X. Other Liquidity Stock Ratios
Refer page 213 for Maturity Gaps in Major Currencies (in millions of respective currency)
Sound and Robust Market Risk PoliciesA comprehensive framework of policies is in place to govern all aspects of market risk management. These include the Asset and Liability Management Policy, Liquidity Risk Management Policy, Market Risk Management Policy and policy on Stress Testing, which provide guidance on the systems, procedures, tools and techniques for the identification, assessment, mitigation, monitoring and reporting on all market related risks. As and when emerging risk are identified, policies are reviewed and updated accordingly.
Risk limits and trigger pointsThe Board of Directors have defined a range of limits for investment and Treasury-related activities including foreign currency net open position limits, PVBP limits counterparty limits, stop loss limits, minimum liquidity stock ratios and other market risk related limits. Actual performance against these limits are monitored by the Middle Office and the IRMD and brought to the attention of the ALCO and BIRMC on a regular basis. Meanwhile thresholds that trigger specific management action is specified to ensure proactive management of market risks.
Areas of focus in 2019
New Policies, Revision of Policies and procedures A detailed policy on classification of Treasury Products based on SLFRS guidelines was formulated. The Bank’s Investment Management Policy have been revised to facilitate the emerging requirement of the market activities.
The Stress Testing Policy has been revised in line with regulatory guidelines and global best practices with historical risk measurement tools (e.g VaR ) and forward-looking measures (e.g expectations of market participants)

71
NEXT GEN BANKING
OPERATIONAL RISK MANAGEMENTOversight responsibility for operational risk management has been delegated to a dedicated Operational Risk Management Unit (ORMU). The Operational Risk Management Committee (ORMC) periodically met as the main interaction point between all operational functions of the Bank encompassing end to end process coverage. The Committee is accountable to Executive Risk Management Committee (ERMC) on matters related to operational risk management and to foster a culture within Nations Trust Bank that emphasises and demonstrates the benefits of a risk based approach to internal control and management of operational risks of the Bank. Meanwhile, the ORMU which functions within the purview of IRMD provides independent verification on the Bank’s operational risk exposures.
The Operational Risk Management Framework is underpinned by the following;
• Identification and assessment The Bank uses Risk and Control Self Assessments (RCSA) which are administered to all key business and operational units to evaluate the exposure to defined operational risk parameters. It is a structured mechanism for a Business Line, Supporting Unit, Product Line or Process to identify and assess its own risks and introduce measures aimed at improving risk control. In addition, the ownership of key risks and measures introduced to mitigate unacceptable risk exposure is clearly defined.RCSA process ranks the risks based on its likelihood of occurrence and its impact/severity if that risk materialises. It also critically tests the current controls available to address such risks in terms of its control design and control performance of risks in designing/reviewing suitable action. Stemming from individual departmental risk grids, a Bank-wide risk grid is prepared highlighting key risks impacting the Bank. This overall the Bank risk grid is updated every other month and presented to the Board Integrated Risk Management Committee as a 'Risk Assessment Report' which
details the prevailing or emerging risks and its management.
The Key Risk Indicators (KRIs) being implemented will ensure that early indicators of risks are given due recognition and appropriate action is taken to reduce possible losses arising from such risks.
• Limits and tolerance levels The Board of Directors have defined specific
limits and tolerance levels for operational risk indicators including the number of internal and external loss events and the total value of operational losses monitored. Regular reporting to the BIRMC and Board of Directors ensure that parameters are maintained within the defined limits and corrective action is initiated if required.
• Risk reporting The Bank maintains a well-structured
Operational Risk Loss Data Base which is aligned to the BASEL requirements. Streamlined processes are in place to
• ORM & ORC or process owners present result to division head/group head for action plans approval
Ongoing
• Action plan implemented by action plan owners follow up by ORC
• Discuss how to mitigate causes and improve controls
Propose Action plan
• Review KRIs
• Assess the risk exposure (expert judgement) on causal level
• Assess effectiveness of current controls
• Examine loss experiences and audit data
• Review root causes of the risk
• List current key controls
• ORM & ORC study business processes and risk data
1 2 4 5 6
Risk Control and Self Assessments (RCSA)
Preparation Risk & Control Identification
Assess current control
Assess risk exposure
Action plan & KRI
Reporting
Initial list of risks, controls & causes
Validated short list of risks with causes & controls
Risk register Possible action plans Action plans + new risk register
3

72
Nations Trust Bank PLC Annual Report 2019
RISK MANAGEMENT REVIEW
capture all operational loss events including near misses, which are then categorised as specified in a BASEL document in order to use them for future modelling activities. The loss events are linked to the RCSA & KRI Programme to ensure that repeat errors are minimised.
• Outsourced services The Bank outsources some of its non-critical
activities including cash transportation, labour supply, embossing of cards, document management and archiving. To mitigate the operational risks, business units submit due diligence test grid along with the relevant documents to outsourcing services unit. Outsourcing services unit participates for the Business Continuity Plan rehearsals of service providers as well as carry out periodical visits along with the business unit, These activities provide an assurance on the ability of service provider to maintain required levels of service at all times.
Areas of focus in 2019• Strengthened the RCSA Mechanism &
KRI: Strengthened RCSA mechanism with the introduction of several new risk assessment grids for business and support units. Currently the Bank maintains 40 operational risk grids for several units, which is a qualitative analysis of the Operational Risk tools.
KRI’s were designed for several Business Units and has been rolled out with the assistance of the Risk Coordinators along with defined thresholds to monitor.
• Maintained Performance Against Operational Risk Appetite: Operational losses to operating expenses ratio at 0.04% in 2019
• Increased Employee Engagement And Awareness on 'Operational Risk': Information related to operational risk continued to be shared through operational risk updates for all employees. This has enabled the prompt sharing of knowledge, notifications of operational risk incidents and nurturing a risk culture across the Bank. Operational risk training programmes were conducted for all risk coordinators of the bank.
• Increased Vibrancy and Proactiveness of ORMU: During the year, the ORMU conducted regular meetings and identified risks were escalated to the relevant personnel for immediate action.
Operational Risk Performance in 2019All operational risk indicators were maintained within the defined parameters while there were no material loss events during the year. The value of the total operational loss events remained well within risk appetite as at end of 2019.
NTB 2019
Value in Million
%
BASE
L II L
OSS E
VEN
T TYP
E CA
TEGO
RY
Internal Fraud - -External Fraud 2.24 44%Employment Practices and Workplace Safety 0.04 1%Clients Products and Business Practices 1.30 25%Damage to Physical Assets - -Business Disruption and System Failure 0.24 5%Execution Delivery & Process Management 1.24 25%Total Operating Losses 5.06 100%
INFORMATION SECURITY (IS) AND GOVERNANCE FUNCTION The information technology risk, including constantly shifting nature of cyber-risks has evolved with the Bank’s digital journey where the bank continues to institutionalise capabilities to mitigate such threats while building resilience.
There are multiple initiatives underway to strengthen existing infrastructure on system capabilities, data management and internal controls led by the Bank’s information security unit.
The technology risk management function established under CRO provides insights and feedbacks for cyber risk resilience and continuous improvement of information security over operations, changes in infrastructure and new projects while ensuring compliance for regulatory requirements across the bank.
Identification and Risk AssessmentsReview the adequacy and effectiveness of the identification, analysis, management, monitoring and reporting of Information Technology risks, ensuring that management establishes, appraises and addresses the risks to the Bank, sufficiently and swiftly.
Independent assessment of existing programmes, procedures and controls in place to manage key risks.
Maintain oversight over technology risks on an ongoing basis through KRIs (Key Risk Indicators) and an independent risk register.
Areas of Focus in 2019Independent risk assessments were specifically focused on cyber, network, infrastructure, projects and regulatory requirements during 2019.
ReportingMonitor actual risk profiles, advising on appropriate actions and regular reporting to the Management and Board–Integrated Risk Management Committee of its activities, findings, decisions, deliberations and recommendations.
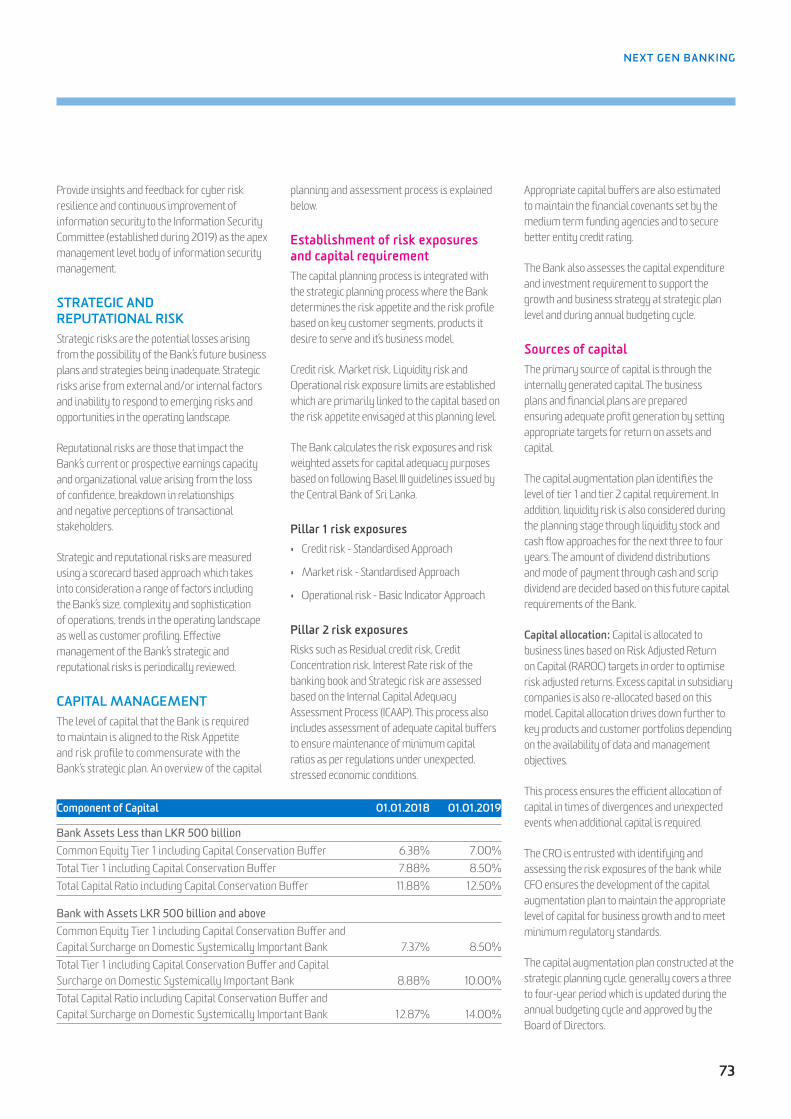
73
NEXT GEN BANKING
Provide insights and feedback for cyber risk resilience and continuous improvement of information security to the Information Security Committee (established during 2019) as the apex management level body of information security management.
STRATEGIC AND REPUTATIONAL RISKStrategic risks are the potential losses arising from the possibility of the Bank’s future business plans and strategies being inadequate. Strategic risks arise from external and/or internal factors and inability to respond to emerging risks and opportunities in the operating landscape.
Reputational risks are those that impact the Bank’s current or prospective earnings capacity and organizational value arising from the loss of confidence, breakdown in relationships and negative perceptions of transactional stakeholders.
Strategic and reputational risks are measured using a scorecard based approach which takes into consideration a range of factors including the Bank’s size, complexity and sophistication of operations, trends in the operating landscape as well as customer profiling. Effective management of the Bank’s strategic and reputational risks is periodically reviewed.
CAPITAL MANAGEMENTThe level of capital that the Bank is required to maintain is aligned to the Risk Appetite and risk profile to commensurate with the Bank’s strategic plan. An overview of the capital
planning and assessment process is explained below.
Establishment of risk exposures and capital requirementThe capital planning process is integrated with the strategic planning process where the Bank determines the risk appetite and the risk profile based on key customer segments, products it desire to serve and it’s business model.
Credit risk, Market risk, Liquidity risk and Operational risk exposure limits are established which are primarily linked to the capital based on the risk appetite envisaged at this planning level.
The Bank calculates the risk exposures and risk weighted assets for capital adequacy purposes based on following Basel III guidelines issued by the Central Bank of Sri Lanka.
Pillar 1 risk exposures• Credit risk - Standardised Approach
• Market risk - Standardised Approach
• Operational risk - Basic Indicator Approach
Pillar 2 risk exposuresRisks such as Residual credit risk, Credit Concentration risk, Interest Rate risk of the banking book and Strategic risk are assessed based on the Internal Capital Adequacy Assessment Process (ICAAP). This process also includes assessment of adequate capital buffers to ensure maintenance of minimum capital ratios as per regulations under unexpected, stressed economic conditions.
Component of Capital 01.01.2018 01.01.2019
Bank Assets Less than LKR 500 billionCommon Equity Tier 1 including Capital Conservation Buffer 6.38% 7.00%Total Tier 1 including Capital Conservation Buffer 7.88% 8.50%Total Capital Ratio including Capital Conservation Buffer 11.88% 12.50%
Bank with Assets LKR 500 billion and aboveCommon Equity Tier 1 including Capital Conservation Buffer and Capital Surcharge on Domestic Systemically Important Bank 7.37% 8.50%Total Tier 1 including Capital Conservation Buffer and Capital Surcharge on Domestic Systemically Important Bank 8.88% 10.00%Total Capital Ratio including Capital Conservation Buffer and Capital Surcharge on Domestic Systemically Important Bank 12.87% 14.00%
Appropriate capital buffers are also estimated to maintain the financial covenants set by the medium term funding agencies and to secure better entity credit rating.
The Bank also assesses the capital expenditure and investment requirement to support the growth and business strategy at strategic plan level and during annual budgeting cycle.
Sources of capitalThe primary source of capital is through the internally generated capital. The business plans and financial plans are prepared ensuring adequate profit generation by setting appropriate targets for return on assets and capital.
The capital augmentation plan identifies the level of tier 1 and tier 2 capital requirement. In addition, liquidity risk is also considered during the planning stage through liquidity stock and cash flow approaches for the next three to four years. The amount of dividend distributions and mode of payment through cash and scrip dividend are decided based on this future capital requirements of the Bank.
Capital allocation: Capital is allocated to business lines based on Risk Adjusted Return on Capital (RAROC) targets in order to optimise risk adjusted returns. Excess capital in subsidiary companies is also re-allocated based on this model. Capital allocation drives down further to key products and customer portfolios depending on the availability of data and management objectives.
This process ensures the efficient allocation of capital in times of divergences and unexpected events when additional capital is required.
The CRO is entrusted with identifying and assessing the risk exposures of the bank while CFO ensures the development of the capital augmentation plan to maintain the appropriate level of capital for business growth and to meet minimum regulatory standards.
The capital augmentation plan constructed at the strategic planning cycle, generally covers a three to four-year period which is updated during the annual budgeting cycle and approved by the Board of Directors.

74
Nations Trust Bank PLC Annual Report 2019
RISK MANAGEMENT REVIEW
Key highlights for the year:1. Total Group capital ratio under Basel III
Pillar I risks is 17.96% as at 31.12.2019 (15.59% 31.12.2018). The total capital ratio including Pillar II risks is currently being assessed.
2. The Bank raised LKR 4.5 billion Basel III complaint tier 2 capital in December 2019.
RISK REGULATION
BASEL III FrameworkFollowing the introduction of BASEL III, banks are required to enhance their capital requirements with the objective of improving the quality, quantity, consistency and transparency of the capital base. Meanwhile the Liquidity Coverage Ratio (LCR) is one of the Basel Committee’s key recommendations to strengthen global liquidity regulations to nurture a more resilient banking sector.
In light of changes that took place in global economic conditions and risk landscape, CBSL has shifted the risk management in the banking industry to the next level. BASEL III continued to follow a three-pillar approach with considerable changes in minimum capital and capital buffer requirements, further improvements in supervisory review process and additional disclosure requirements under market discipline.
Market Disclosures based on BASEL III is annexed below.
Area No Disclosure requirement Page No
Regulatory requirements on capital and liquidity
1 Key Regulatory Ratios - Capital and Liquidity Table 1 216
2 Basel III Computation of Capital Ratios Table 2 217
3 Basel III Computation of Leverage Ratio Table 3 218
4 Basel III Computation of Liquidity Coverage Ratio (All currency) Table 4 219
5 Main Features of Regulatory Capital Instruments Table 5 220
Risk Weighted Assets
6Summary discussion on adequacy/meeting current and future capital requirements
Capital Management Section of this review
73-74
7Credit Risk under Standardised Approach: Credit Risk Exposures and Credit Risk Mitigation (CRM) Effects
Table 6 222
8Credit Risk under Standardised Approach: Exposures by Asset Classes and Risk Weights
Table 7 224
9 Market Risk under Standardised Measurement Method Table 8 226
10Operational Risk under Basic Indicator Approach/The Standardised Approach/The Alternative Standardised Approach
Table 9 226
Linkages between Financial statements and regulatory exposures
11Differences Between Accounting and Regulatory Scopes and Mapping of Financial Statement Categories with Regulatory Risk Categories – Bank Only
Table 10 228
12Explanations of differences between accounting and regulatory exposure amounts
Table 10 228
Risk Management13 Bank Risk Management Approach Risk Management review
is outlined in Sections (a) to (h) in this Review
62-7414 Risk Management related to key risk exposures
75
NEXT GEN BANKING
BOARD INTEGRATED RISK MANAGEMENTCOMMITTEE REPORTCOMPOSITION The members of the Integrated Risk Management Committee (IRMC) are appointed by the Board of Directors and the Committee’s composition during the period ended 31st December, 2019 was as follows;
Mr. Suran Wijesinghe - Chairman (Non-Executive Director)
Ms. Rachini Rajapaksa (Independent Non-Executive Director)
Ms. Sherin Cader (Non-Executive Director)
Mr. Arjun Fernando (Non-Executive Director)1
1 Appointed with effect from 18th January 2019
The Chief Risk Officer, Mr. Chamila Sumathiratne functions as the Secretary to the IRMC. Chief Executive Officer, Ms. Renuka Fernando and the following Key Management Personnel attended meetings of the Integrated Risk Management Committee as required under Rule No. 3(6)(v)(a) on Rules of Corporate Governance for Licensed Commercial Banks in Sri Lanka.
Mr. Priyantha Talwatte - Deputy Chief Executive Officer
Mr. Ajith Akmeemana - Chief Financial Officer
Mr. Indrajith Boyagoda - EVP - Treasury & Investment Banking
Mr. Theja Silva - Group Company Secretary / General Counsel
Mr. Nanda Bandara - EVP - Internal Audit
Mr. Gayan Ranaweera - Chief Credit Officer
Mr. Sajith Sameera - Chief Information Officer
Mr. Mevan Balalle - Chief Compliance Officer
In addition to the above, senior management of the Integrated Risk Management Division & other business units, when required, attended meetings of the Integrated Risk Management Committee by invitation.
TERMS OF REFERENCE Integrated Risk Management Committee’s mandate includes the following:
• Ensuring that the Bank has a comprehensive risk management framework in place relative to the Bank’s activities and risk profile,
• Assessing the effectiveness of the Bank’s risk management system and monitoring the impact to the Bank from risk types such as credit, market, liquidity, operational and strategic through appropriate risk indicators and management information,
• Ensuring that a compliance function is in place to assess the Bank’s compliance with laws, regulations, regulatory guidelines, internal controls and approved policies relating to all areas of Bank operations,
• Ensuring that the Board of Directors is kept updated of the Group’s risk exposure in relation to the approved risk appetite.
ROLE AND RESPONSIBILITIESIn order to ensure that timely risk mitigation measures are initiated based on the robust risk management structure in place, the IRMC reviewed and monitored the following during the year:
• Setting up of risk appetite limits and periodic monitoring of risk reports
• Reviewing the overall stress testing framework and monitoring the results of such tests
• Reviewing the Bank risk grid taking into consideration material changes in the Bank’s risk profile and the external environment and providing necessary guidance and recommendations
• Reviewing risk management policies and terms of reference of committees dealing with risk management such as Executive Risk Management Committee, Operational Risk Management Committee and ALCO
• Monitoring the effectiveness of Management committees overseeing broad areas of risk management
• Periodically reviewing the Internal Capital Adequacy Assessment Process (ICAAP) and the resultant report
• Approving annual compliance plan and reviewing periodic compliance reports
• Setting objectives and carrying out performance appraisal of Chief Risk Officer & Chief Compliance Officer
The process through which the IRMC discharges its responsibilities is further detailed in the Risk Management section of this annual report. During the year, the IRMC continued to place special emphasis on ensuring that a risk awareness culture is maintained in the Bank through initiatives such as developing and monitoring of divisional risk grids, management meetings which discuss and assess risks, training and knowledge sharing sessions. These initiatives cascaded the risk awareness culture to the lower levels of staff and enabled the staff to understand and voice their opinions on risks and risk management practices of the Bank in an open and transparent manner. Greater emphasis was placed on information security aspects due to its increasing significance as a source of risk.
MEETINGSThe IRMC held eight (08) meetings during the year under review and the Directors’ attendance at such meetings is given on page 56 of this Annual Report. Minutes of the Meetings were forwarded to the Board. The IRMC also approved a Risk Assessment Report to be submitted to the Board within a week of every meeting. The IRMC reviewed risk policy frameworks, risk management strategies and key risk indicators at the meetings and was satisfied that the risk exposures of the Bank are being appropriately managed.
Suran WijesingheChairmanIntegrated Risk Management Committee
27th February 2020Colombo

76
Nations Trust Bank PLC Annual Report 2019
BOARD CREDIT COMMITTEE REPORT
The members of the Board Credit Committee (BCC) are appointed by the Board of Directors and the Committee’s composition during the period ended 31st December 2019 was as follows;
Mr. Gihan Cooray - Chairman (Non-Executive Director)
Mr. Prasanna De Silva (Non-Executive Director)
Mr. Russell De Mel (Independent Non-Executive Director)
Mr. Chanaka Wickramasuriya (Independent Non-Executive Director)
The Committee held twelve meetings during the year under review and the Directors’ attendance at such meetings is given on page 56 of this Annual Report. The Committee also approves credit proposals by circulation.
The mandate of the Board Credit Committee includes the following;
• Approve/Decline all credit facilities above the level of authority granted to 'Head Office Credit Committee' by the Board of Directors. BCC will constitute the final credit approval authority of the bank having been vested with the full powers to approve /decline credit by the Board of Directors.
• Approve/Decline Interest Waivers and Principal Write-offs in order to facilitate settlement of bad debts or to rehabilitate/restructure bad debts.
• Review the quality of the credit portfolio of the bank including Top 20 Exposures, Watch-listed Customers etc.
• Review, provide input and make recommendations on credit origination, appraisal, approval and administration processes/procedures.
• Any other matter referred by the Board of Directors.
In addition to the regular duties of the Board Credit Committee,
• Special guidance and knowledge sharing was provided to the management to fulfil their initiative in growing the bank’s offshore banking book including loan syndication.
• The members of the Board Credit Committee oversaw and provided guidance for the special recovery initiative launched by the bank.
The Chief Credit Officer functions as the Secretary to the Board Credit Committee and the minutes of the meetings were made available to the Board of Directors on a regular basis. The Chief Executive Officer of the Bank is invited to be present at the meetings of the Committee. Other members of the Senior Management of the Bank are invited to participate at the meetings as and when required.
The Committee which derives its scope and authority from the Board of Directors was established to provide guidance to the Management to ensure a balance between risk and growth in the Bank’s expansion strategies.
Gihan Cooray ChairmanBoard Credit Committee
27th February 2020Colombo

77
NEXT GEN BANKING
BOARD SUPERVISORY COMMITTEE REPORT
The members of the Board Supervisory Committee (BSC) are appointed by the Board of Directors and the Committee’s composition as at 31st December,2019 was as follows;
Mr. Suran Wijesinghe - Chairman (Non-Executive Director)
Mr. Prasanna De Silva (Non-Executive Director)
Mr. Savanth Sebastian (Independent Non-Executive Director)
Ms. Sherin Cader (Non-Executive Director)
Mr. Arjun Fernando (Non-Executive Director) Appointed with effect from 1st August 2019.
Mr. Murtaza Jafferjee, Non Executive Director/Senior Director who was a member of the Board Supervisory Committee retired from the Board with effect from 15th December 2019.
The Company Secretary functions as the Secretary to the Committee.
The Committee meets monthly in advance of the Board meeting and the minutes are submitted to the Board of Directors for review. The Corporate Management Team along with the Director/CEO attends all meetings by invitation. The BSC is not a committee mandated under the Corporate Governance Directions issued by the Central Bank of Sri Lanka.
The Committee held twelve meetings during the year under review and the Directors’ attendance at such meetings is given on page 56 of this Annual Report.
TERMS OF REFERENCEThe mandate of the BSC includes the following;
• Review the performance of the Bank and its business units to ensure that the Management and staff are focused towards achievement of plans approved and objectives set by the Board. The review also covers the support functions of the Bank and ensure that cost efficiencies and productivity is achieved across the Bank.
• Approving expenditure within limits delegated by the Board of Directors.
• Providing input and guidance to CEO and Corporate Management on various initiatives including IT systems, products, distribution channels etc prior to being presented to the Board of Directors for approval.
• Review, provide input and make recommendations on policy papers, business plans and other such proposals impacting the operations of the Bank prior to such papers, plans and proposals being presented to the Board of Directors for approval.
• Ensure that adequate policies, procedures and processes are in place to carry out the operations of the Bank and that these are reviewed periodically.
Suran WijesingheChairman Board Supervisory Committee
27th February 2020Colombo
78
Nations Trust Bank PLC Annual Report 2019
required skill and expertise and that their responsibilities and areas of authority are aligned with the Board approved strategy. Committee also considers and determines that the Directors and the Key Management Personnel are fit and proper persons to hold their respective offices.
Conrad D’Souza ChairmanBoard Nomination Committee
27th February 2020
BOARD NOMINATION COMMITTEE REPORT
The members of the Nomination Committee are appointed by the Board of Directors and the Committee’s composition as at 31st December, 2019 was as follows;
Mr. Conrad D’Souza - Chairman (Independent Non-Executive Director/Senior Director) Appointed with effect from 23rd December 2019
Mr. Gihan Cooray (Non-Executive Director)
Mr. Prasanna De Silva (Non-Executive Director)
Mr. Chanaka Wickramasusuriya (Independent Non-Executive Director)
Appointed with effect from 23rd December 2019
Mr. Murtaza Jafferjee, Non Executive Director/Senior Director who was the Chairman of the Committee retired from the Board with effect from 15th December 2019.
The Company Secretary functions as the Secretary to the Committee.
The Committee held one meeting during the year under review and the Directors’ attendance at such meeting is given on page 56 of this Annual Report.
During the year under review the Committee reviewed and approved the process to select/recruit the Chief Executive Officer and Key Management Personnel. Committee also considered the appointments of Chief Information Officer, Chief Internal Auditor and Chief Marketing Officer and determined that they are fit and proper persons to hold such offices. Affidavits and declarations by the continuing Directors were considered by the Committee and recommended them as fit and proper persons to hold directorships of the Bank.
The proceedings of the meeting were reported to the Board.
The Committee’s main responsibilities include the following:
• Selecting and appointing new Directors, considering and recommending from time to time the requirements of additional/new expertise on the Board and recommending after due consideration the re-election of current Directors.
• Implementing a procedure to select and appoint the Chief Executive Officer and Key Management Personnel of the Bank and setting up criteria for their appointment or promotion.
• Ensuring that the Directors and the Key Management Personnel are fit and proper persons to hold office conforming to the criteria prescribed by the Central Bank of Sri Lanka.
• Ensuring compliance with the provisions of the Articles of Association, written law, the Rules of the Colombo Stock Exchange and Directions of the Monetary Board of the Central Bank of Sri Lanka as may be applicable to the appointment of Directors, the Chief Executive Officer and Key Management Personnel.
The Committee works closely with the Board in evaluating and reviewing the skills required for the Bank and the Board. When recommending the appointment of new Directors, the Committee considers for each appointment, the particular skills, knowledge and experience that would benefit the Board most significantly. The Committee is satisfied that the representation of skills on the Board is appropriate for the Bank’s current needs at Board level.
The Committee also works closely with the Board in ensuring that the Key Management Personnel comprise of persons of

79
NEXT GEN BANKING
HUMAN RESOURCES AND REMUNERATION COMMITTEE REPORTThe Human Resources and Remuneration Committee (HRRC) comprised of the following Directors.
Mr. Gihan Cooray-Chairman (Non-Executive Director)
Mr. Suran Wijesinghe(Non-Executive Director)
Mr. Prasanna De Silva(Non-Executive Director)
Mr Murtaza Jafferjee, Non-Executive Director/Senior Director who was a member of the Committee retired from the Board with effect from 15th December 2019.
During the year under review one HRRC meeting was held. The Chief Executive Officer was present at the meeting as an invitee except when matters relating to the Chief Executive Officer were being discussed.
The workings of the Committee are governed by the Remuneration Committee Charter, the objectives of which are:
• To assist the Board of Directors in the establishment of remuneration policies and practices.
• To review, and recommend to the Board, remuneration policies and packages for the Chief Executive officer (CEO) and other Key Management Personnel of the Bank.
• To set goals and targets for the CEO and other Key Management Personnel.
• To evaluate the performance of the CEO and other Key Management Personnel against the set goals and targets.
In performing this role, the Committee ensures that:
• Shareholder and employee interests are aligned.
• The Bank is able to attract, motivate and retain employees, particularly at management level.
• The integrity of the Bank’s compensation and reward programme is maintained.
In keeping with the objectives of the Charter, the Committee during 2019, placed great emphasis in ensuring that the Compensation & Benefits policies of the Bank are appropriate in attracting and retaining the skills required as well as ensuring succession plans are in place for top management roles in pursuing the short term and long term strategic objectives of the Bank.
In March 2019 at the HRRC meeting, a review of the Bank’s Compensation and Benefits structure was presented to the Committee along with a comparison to the industry and the recommended changes were approved by the Committee.
In creating a performance driven culture, the Bank administers a variable bonus scheme linked to the Bank’s performance for the year vis-à-vis the annual budget and the performance of a peer group of banks. Individuals are rewarded based on their individual performance and responsibility levels.
During the latter half of 2018, the Bank participated in a remuneration survey carried out by an external consulting firm, with a view to ensuring that the Bank’s compensation &
benefits structure is market competitive. The findings of the survey were used as a basis for formulating the remuneration levels for the year 2019. The bank also identified critical skills & critical roles to meet the future strategic objectives powered through technology, digitalisation and data analytics.
During 2019, the Committee also evaluated the 2018 performance of the CEO and other Key Management Personnel of the Bank against their pre-agreed objectives and targets and approved the goals and objectives of CEO & KMP for the year 2019.
The Committee held one meeting during the year under review and the Directors’ attendance is given on page 56 of this Annual Report
Gihan CoorayChairmanHuman Resources and Remuneration Committee
27th February 2020Colombo

80
Nations Trust Bank PLC Annual Report 2019
RELATED PARTY TRANSACTIONS REVIEW COMMITTEE REPORTThe members of the Related Party Transactions Review Committee (RPTRC) are appointed by the Board of Directors and the Committee’s composition as at 31st December, 2019 was as follows;
Mr. Russell De Mel - Chairman (Independent Non-Executive Director)
Ms. Renuka Fernando (Executive Director)
Mr Chanaka Wickramasuriya (Independent Non-Executive Director)
Appointed with effect from 23rd December 2019
Mr Murtaza Jafferjee, Non-Executive Director/Senior Director who was a member of the Committee retired from the Board with effect from 15th December 2019.
Company Secretary functions as the Secretary to the Committee.
The Committee meets quarterly and minutes are submitted to the Board of Directors for review. Relevant Corporate Management members attend meetings by invitation.
The Committee held four meetings during the year under review and the Directors’ attendance at such meetings is given on page 56 of this Annual Report.
The Committee’s main responsibilities include the following:
• Review of Related Party Transactions (RPTs) either prior to the transaction being entered into or, if the transaction is expressed to be conditional on such review, prior to the completion of the transaction in accordance with the Listing Rules of the Colombo Stock Exchange and other applicable rules in Sri Lanka.
• Ensuring that a robust framework exists for approving, managing and reporting related party transactions in accordance with applicable rules.
• Establish guidelines for the senior management to follow in its ongoing dealings with Related Parties. Thereafter, the Committee, on an annual basis, shall review and assess ongoing relationships with Related Parties to determine whether they are in compliance with the Committee’s guidelines and that the related party transactions remains appropriate.
The Committee regularly reviewed the mechanism/process for recording, monitoring and reporting related party transactions and provided necessary guidance and advice to ensure the effectiveness of the process.
Russell De MelChairmanRelated Party Transactions Review Committee
Colombo27th February 2020
81
NEXT GEN BANKING
DIRECTORS’ STATEMENT ON INTERNAL CONTROL OVER FINANCIAL REPORTINGRESPONSIBILITYIn line with the Banking Act Direction No. 11 of 2007, section 3 (8) (ii) (b), the Board of Directors presents this report on Internal Control over Financial Reporting.
The Board of Directors (“Board”) is responsible for the adequacy and effectiveness of the internal control over financial reporting mechanism in place at Nations Trust Bank PLC, (“the Bank”). In considering such adequacy and effectiveness, the Board recognises that the business of banking requires reward to be balanced with risk on a managed basis and as such the internal control over financial reporting systems are primarily designed with a view to highlighting any deviations from the limits and indicators which comprise the risk appetite of the Bank. In this light, the system of internal controls over financial reporting can only provide reasonable, but not absolute assurance, against material misstatement of financial information and records or against financial losses or frauds.
The Board has established an ongoing process for identifying, evaluating and managing the significant risks faced by the Bank and this process includes enhancing the system of internal control over financial reporting as and when there are changes to business environment or regulatory guidelines. The process is regularly reviewed by the Board and accords with the Guidance for Directors of Banks on the Directors’ Statement on Internal Control over Financial Reporting issued by the Institute of Chartered Accountants of Sri Lanka. The Board has assessed the internal control over financial reporting taking into account principles for the assessment of internal control over financial reporting system as given in that guidance.
The Board is of the view that the system of internal controls over financial reporting in place is sound and adequate to provide reasonable assurance regarding the reliability of financial reporting, and that the preparation of financial statements for external purposes is in accordance with relevant accounting principles and regulatory requirements.
The management assists the Board in the implementation of the Board’s policies and procedures on risk and control by identifying and assessing the risks faced, and in the design, operation and monitoring of suitable internal controls over financial reporting to mitigate and control these risks.
KEY FEATURES OF THE PROCESS ADOPTED IN APPLYING AND REVIEWING THE DESIGN AND EFFECTIVENESS OF THE INTERNAL CONTROL SYSTEM OVER FINANCIAL REPORTINGThe key processes that have been established in reviewing the adequacy and integrity of the system of internal controls with respect to financial reporting include the following:
• Board and management sub committees are established by the Board to assist the Board in ensuring the effectiveness of Bank’s daily operations and that the Bank’s operations are in accordance with the corporate objectives, strategies and the annual budget as well as the policies and business directions that have been approved.
• Policies / Charters are developed covering all functional areas of the Bank and these are approved by the Board or Board approved sub committees. Such policies and charters are reviewed and approved periodically.
• The Internal Audit Department of the Bank checks for compliance with policies and procedures and the effectiveness of internal control systems on an ongoing basis using samples and rotational procedures and highlight significant findings in respect of any non-compliance. Audits are carried out on all units and branches, the frequency of which is determined by the level of risk assessed, to provide an independent and objective report. The annual audit plan is reviewed and approved by the Board Audit Review Committee. Findings of the Internal Audit Department are submitted to the Board Audit Review Committee for review at their periodic meetings.
• The Board Audit Review Committee of the Bank reviews internal control over financial reporting issues identified by the
Internal Audit Department, external audit, regulatory authorities and management, and evaluate the adequacy and effectiveness of the risk management and internal control systems. They also review the internal audit functions with particular emphasis on the scope of audits and quality of internal audits. The minutes of the Board Audit Review Committee meetings are forwarded to the Board of the Bank on a periodic basis. Further details of the activities undertaken by the Audit Committee of the Bank are set out in the Audit Committee Report on page 84.
• In assessing the internal control system over financial reporting, identified officers of the Bank collated all procedures and controls that are connected with significant accounts and disclosures of the financial statements of the Bank. These in turn were observed and checked by the Internal Audit Department for suitability of design and operating effectiveness on an ongoing basis. In adopting Sri Lanka Accounting Standards comprising LKAS and SLFRS, progressive improvements on processes to comply with requirements of recognition, measurement, classification and disclosure were made whilst further strengthening of processes namely review of disclosures with regard to financial risk management, and management information are being done. The assessment did not include subsidiaries of the Bank.
• The Bank adopted SLFRS 9 – Financial Instruments w.e.f 01 January 2018. SLFRS 9 poses a significant impact on impairment assessment as it necessitates the accounting for impairment of financial assets on the basis of expected credit loss from an incurred credit loss model in previously adopted LKAS 39. The Bank is progressively improving the required policies, procedures, financial models and underlying data used in its impairment assessments and related calculations.
The Board will continuously take steps to strengthen the processes and controls around management information systems and reports required for validating and complying with SLFRS 9.

82
Nations Trust Bank PLC Annual Report 2019
• SLFRS 16 replaced Sri Lanka Accounting Standard – LKAS 17 (Leases) and related interpretations. SLFRS 16 sets out the principles for the recognition, measurement, presentation and disclosure of leases and requires lessees to account for all leases under a single on – balance sheet model similar to the accounting for finance leases under LKAS 17.
The Bank adopted SLFRS 16 using the modified retrospective method of adoption with the date of initial application of 1 January 2019.The Bank, being the lessee is required to recognize a liability to make lease payments (i.e., lease liability) and an asset representing the right to use the underlying asset during the lease term (i.e., the right-of-use asset) at the commencement date of the lease. Furthermore, the Bank, is required to separately recognize the interest expense on the lease liability and depreciation expense on the right-of-use asset.
Lessor accounting under SLFRS 16 is substantially unchanged from LKAS 17. Lessors will continue to classify leases as either operating or finance leases using similar principles as in LKAS 17. Therefore, SLFRS 16 did not have an impact for leases where the Bank is the lessor.
CONFIRMATIONBased on the above processes, the Board confirms that the financial reporting system of the Bank has been designed to provide reasonable assurance regarding the reliability of financial reporting and the preparation of financial statements for external purposes and has been done in accordance with Sri Lanka Accounting Standards and regulatory requirements of the Central Bank of Sri Lanka.
REVIEW OF THE STATEMENT BY EXTERNAL AUDITORSThe external auditors have reviewed the above Directors Statement on internal control over financial reporting included in the annual report of the Bank for the year ended 31 December 2019 and reported to the Board that nothing has come to their attention that causes them to believe that the statement is inconsistent with their understanding of the process adopted by the Board in the review of the design and effectiveness of the internal control over financial reporting of the Bank. External Auditors’ report on statement of internal controls over financial reporting is given on page 83 to this Annual Report.
By order of the Board
Gihan CoorayChairman
Rachini Rajapaksa ChairpersonBoard Audit Review Committee
R. N. K Fernando Director/Chief Executive Officer
27th February 2020Colombo
DIRECTORS’ STATEMENT ON INTERNAL CONTROL OVER FINANCIAL REPORTING

83
NEXT GEN BANKING
AUDITOR’S STATEMENT ON INTERNAL CONTROL OVER FINANCIAL REPORTING
INDEPENDENT ASSURANCE REPORT
TO THE BOARD OF DIRECTORS OF NATIONS TRUST BANK PLC
REPORT ON THE DIRECTOR’S STATEMENT ON INTERNAL CONTROL We were engaged by the Board of Directors of Nations Trust Bank PLC (“Bank”) to provide assurance on the Directors’ Statement on Internal Control over Financial Reporting (“Statement”) included in the annual report for the year ended 31 December 2019.
MANAGEMENT’S RESPONSIBILITYManagement is responsible for the preparation and presentation of the Statement in accordance with the “Guidance for Directors of Banks on the Directors’ Statement on Internal Control” issued in compliance with section 3(8)(ii)(b) of the Banking Act Direction No. 11 of 2007, by the Institute of Chartered Accountants of Sri Lanka.
OUR INDEPENDENCE AND QUALITY CONTROLWe have complied with the independence and other ethical requirement of the Code of Ethics for Professional Accountants issued by the Institute of Chartered Accountants of Sri Lanka, which is founded on fundamental principles of integrity, objectivity, professional competence and due care, confidentiality and professional behaviour.
The firm applies Sri Lanka Standard on Quality Control 1 and accordingly maintains a comprehensive system of quality control including documented policies and procedures regarding compliance with ethical
requirements, professional standards and applicable legal and regulatory requirements.
OUR RESPONSIBILITIES AND COMPLIANCE WITH SLSAE 3050 (REVISED)Our responsibility is to assess whether the Statement is both supported by the documentation prepared by or for directors and appropriately reflects the process the directors have adopted in reviewing the design and effectiveness of the internal control of the Bank.
We conducted our engagement in accordance with Sri Lanka Standard on Assurance Engagements (SLSAE) 3050 (Revised), Assurance Report for Banks on Directors’ Statement on Internal Control, issued by the institute of Chartered Accountants of Sri Lanka.
This Standard required that we plan and perform procedures to obtain limited assurance about whether Management has prepared, in all material respects, the Statement on Internal Control over financial reporting.
For purpose of this engagement, we are not responsible for updating or reissuing any reports, nor have we, in the course of this engagement, performed an audit or review of the financial information.
SUMMARY OF WORK PERFORMEDWe conducted our engagement to assess whether the Statement is supported by the documentation prepared by or for directors; and appropriately reflected the process the directors have adopted in reviewing the system of internal control over financial reporting of the Bank.
The procedures performed were limited primarily to inquiries of bank personnel and the existence of documentation on a sample basis that supported the process adopted by the Board of Directors.
SLSAE 3050 (Revised) does not require us to consider whether the Statement covers all risks and controls or to form an opinion on the effectiveness of the Bank’s risk and control procedures. SLSAE 3050 (Revised) also does not require us to consider whether the processes described to deal with material internal control aspects of any significant problems disclosed in the annual report will, in fact, remedy the problems.
The procedures selected depend on our judgement, having regard to our understanding of the nature of the Bank, the event or transaction in respect of which the Statement has been prepared.
We believe that the evidence we have obtained is sufficient and appropriate to provide a basis for our conclusion.
OUR CONCLUSIONBased on the procedures performed, nothing has come to our attention that causes us to believe that the Statement included in the annual report is inconsistent with our understanding of the process the Board of Directors has adopted in the review of the design and effectiveness of internal control over financial reporting of the Bank.
27th February 2020Colombo
84
Nations Trust Bank PLC Annual Report 2019
BOARD AUDIT REVIEW COMMITTEE REPORT
COMPOSITION OF THE BARC The members of the Board Audit Review Committee (the “BARC”) are appointed by the Board of Directors and the Committee’s composition during the period ended 31st December 2019 was as follows;
Ms. Rachini Rajapaksa - Chairperson (Independent Non-Executive Director)
Mr. Suran Wijesinghe (Non-Executive Director)
Mr. Savanth Sebastian (Independent Non-Executive Director)
Ms. Sherin Cader (Non-Executive Director)
Mr. Arjun Fernando
(Non-Executive Director)1 1 Appointed as a member with effect from 18th January
2019
Brief profiles of the BARC members are given on pages 12 to 15 of the Annual Report.
Head of Internal Audit reports directly to the Chairperson of the BARC as a best practice that strengthens the independence of the position and acts as the secretary to the BARC. Mr. Nanda Bandara, Executive Vice President - Internal Audit held the position of Head of Internal Audit during the year under review. Upon his retirement effective end December 2019, Ms. Kushlani Allis, Senior Vice President- Internal Audit succeeded him assuming duties as the current Head of Internal Audit.
MEETINGS The BARC met on 14 occasions during the year under review and the Directors’ attendance at such meetings are given on page 56 of this Annual Report.
The minutes of BARC meetings are regularly tabled at Board meetings to enable all Board members to have access to meeting proceedings.
Chief Executive Officer and Corporate /Senior Management members including the Chief Financial Officer and External Auditors
attended these meetings on invitation. Four of these meetings were held to consider and recommend to the Board of Directors the Bank’s Quarterly and Annual Financial Statements for approval.
TERMS OF REFERENCE The Charter of the BARC clearly defines the Terms of Reference of the committee. The BARC Charter was last reviewed and approved on 29th August 2018 by the Board of Directors.
The roles and functions of the BARC are regulated by the Banking Act Direction No. 11 of 2007 on 'Corporate Governance for Licensed Commercial Banks in Sri Lanka' and its subsequent amendments, 'Rules on Corporate Governance under Listing Rules of the Colombo Stock Exchange' and 'Code of Best Practice on Corporate Governance' issued jointly by The Institute of Chartered Accountants of Sri Lanka and the Securities and Exchange Commission of Sri Lanka. The BARC is responsible to the Board of Directors and reports on its activities regularly. The functions of the Audit Committee are geared to assist the Board of Directors in fulfilling its general oversight responsibilities on financial reporting process, internal controls and functions relating to internal and external audit.
ROLE AND RESPONSIBILITIES The Committee is mainly responsible for;
i. Reviewing financial information of the Bank in order to monitor the integrity of the Bank’s financial statements prepared for disclosure and significant financial reporting judgements contained therein, prior to submission to the Board of Directors.
ii. Making recommendations on the appointment, resignation and dismissal of the External Auditor including review of the external audit function, its cost and effectiveness, monitoring of the External Auditor’s independence, service period of the engagement/re-engagement of the audit partner and review of non-audit services provided by the external auditors.
iii. Discussing and agreeing with the external auditors the nature and scope of the audit including the preparation of financial statements in accordance with relevant accounting principles and their compliance with the applicable statutes, regulations and accounting standards.
iv. Reviewing the effectiveness of the Bank’s system of internal controls
v. Ensuring the independence of the Internal Audit function and that it is performed with impartiality, proficiency and due professional care.
vi. Reviewing internal audit reports and liaising with Corporate Management of the Bank in taking precautionary measures to minimise control weaknesses, procedure violations, frauds and errors
vii. Reviewing Audit Completion Letter (External Audit Management Letter) and CBSL onsite examination reports and follow up to ensure proper remedial action is being taken to address their findings and recommendations.
ACTIVITIES DURING THE YEARFollowing are some of the activities performed by the BARC during 2019:
Financial Reporting The BARC, as part of its responsibility to oversee the Bank’s financial reporting process on behalf of the Board of Directors, reviewed and discussed with the management, the annual audited and quarterly non-audited financial statements prior to their release. In reviewing the bank’s annual and quarterly financial statements, the BARC focused particularly on;
a) The underlying assumptions for estimates and judgments
b) Any changes made in accounting policies and practices
c) Significant adjustments arising from the annual audit
d) Disclosures made under financial reporting
85
NEXT GEN BANKING
e) Compliance with Sri Lanka accounting standards (SLFRS / LKAS) and other regulatory provisions
f) Material variances in income and expenditure and assets and liabilities, between the current and previous financial periods in order to better understand the reasons for such variances and their validity
To facilitate the review and in making an overall assessment on the integrity of the financial reporting system, the BARC considered reports from Chief Financial Officer, Chief Risk Officer, Chief Credit Officer, Internal Audit Department and Audit Completion Letter issued by the External Auditor.
The BARC has taken into consideration the requirements of the SLFRS 16 – Leases which is effective from 1st January 2019 and reviewed the accounting adjustments and its impact on financial statements.
The Committee regularly reviewed the refinements made on the implementation of SLFRS 9 during 2019. Few key areas of review were:
• Deferment of consumer write off point after assessing internal & external data
• Stratification of SME portfolio and have separate LGD ratios for Secured & Unsecured exposures
• Consideration of market values instead of FSV for individual impairment
Internal Audit The risk and significance based audit plan covering all significant operational areas and mandatory regulatory audits which included branches, departments and special reviews for 2019 was approved at the beginning of the year by the BARC. The committee periodically reviewed the progress of the Internal Audit plan.
The BARC provides a forum for review of Internal Audit Reports including the evaluation of the Bank’s Internal Control Systems,
audit observations, recommendations and corrective action to be taken to mitigate recurrence of identified issues. The issues identified during the year were discussed and deliberated with the Management with a broad view of managing significant business risks and strengthening the control gaps. The department/unit heads attended the meetings when their respective audit reports were discussed. A follow up process is implemented by the Internal Audit and monitored by the BARC periodically to ensure pending significant issues are rectified by the Management.
The BARC reviewed the significant findings of internal investigations carried out during the year and ensured appropriate action were taken and mitigating controls were implemented.
During the year, as a measure of providing independent assurance over the impairment process the Internal Audit Department evaluated the effectiveness of the credit risk assessment, measurement systems and processes to ensure the acceptability of credit judgements performed by the management. Credit risk assessment models, inputs and assumptions were also validated to obtain further comfort on the adequacy of the impairment provisions made in the financial statements.
The BARC appointed an outsourced service provider to evaluate the effectiveness of the internal controls in the Finacle Core Banking System. This initiative is expected to be completed in the early part of 2020.
The BARC also reviewed the independence, objectivity and performance of the Internal Audit function and the adequacy of its resources. The performance of the Executive Vice President– Internal Audit was reviewed by the BARC and the performance appraisals of the senior officers of the Internal Audit, reviewed by EVP - IA was presented to the BARC for their concurrence.
Risks and Internal Controls Internal Audit Department uses an Audit Risk Assessment Framework approved by the BARC to determine the risk levels of auditable units based on the audits conducted as per the approved Audit Plan.
All key controls of the Bank have been documented by the relevant process owners and the Internal audit has introduced required audit procedures to relevant audit programmes to test the adequacy and effectiveness of internal controls. The BARC sought and obtained the required assurance from the Heads of the units on the remedial action taken in order to maintain the effectiveness of internal controls. Any significant non-compliance was followed-up by the BARC and where necessary, instructions were given to the management to enhance and strengthen the internal controls.
Regulatory complianceThe Internal Audit Department performed verifications to ensure compliance to applicable regulatory requirements during their process audits ensuring that systems and procedures are in place to enable adherence to such requirements.
EXTERNAL AUDIT The BARC assists the Board of Directors to implement a transparent process;
(1) In the engagement and determining the remuneration of the External Auditor for audit services with the approval of the shareholders
(2) In reviewing the non-audit services to ensure that provision of such services do not lead to impairment of the independence of the External Auditor
(3) In assisting the External Auditor to complete the audit programme within the agreed time frame in compliance with relevant guidelines issued by the Central Bank of Sri Lanka, Securities and Exchange Commission of Sri Lanka and Colombo Stock Exchange
86
Nations Trust Bank PLC Annual Report 2019
BOARD AUDIT REVIEW COMMITTEE REPORT
In order to discharge its responsibilities, the BARC met with the External Auditor on fourteen occasions including two occasions without the presence of the management. During these meetings with the External Auditor, the BARC;
(1) Discussed their audit approach and procedures including matters relating to the scope of the audit and External Auditor’s independence.
(2) Reviewed the audited financial statements with the External Auditor who is responsible for expressing an opinion on its conformity with the Sri Lanka Accounting Standards.
(3) Reviewed the Audit Completion Letter issued by the External Auditor together with management responses thereto.
(4) Discussed further strengthening of internal controls where applicable and adequacy of impairment provisions.
(5) Discussed the Key Audit Matters to understand why the matter was considered by the External Auditor to be one of most significant risk areas in the audit and how the matter was addressed during the audit.
(6) Discussed new developments in regulatory requirements, changes in Accounting standards relating to the Banking industry.
WHISTLE BLOWING POLICY The Whistle Blowing Policy was reviewed by the BARC and was approved by the Board of Directors on 27th February 2019 with a view to further strengthen the process by which employees could raise their concerns in confidence on suspected fraud, possible inconsistencies/shortcomings in financial reporting, internal controls or other matters. Concerns raised are investigated professionally and the identity of the person raising the concern is kept strictly confidential. A process has been established to track such whistle blowing incidents and take necessary action as required.
REAPPOINTMENT OF EXTERNAL AUDITORS The BARC has recommended to the Board of Directors that Messrs. Ernst & Young be reappointed as External Auditors of the Bank for the financial year ending 31 December 2020 subject to the approval of the shareholders at the next Annual General Meeting.
Rachini RajapaksaChairperson Board Audit Review Committee
27th February 2020Colombo
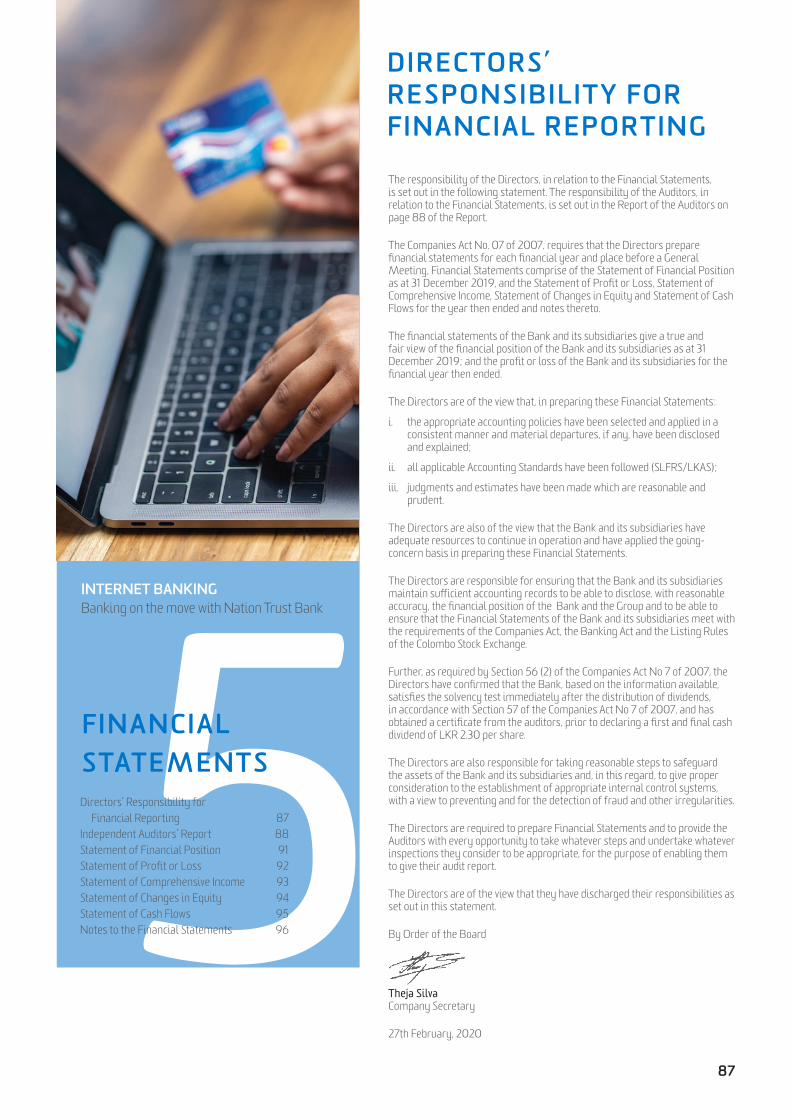
87
5FINANCIAL STATEMENTSDirectors’ Responsibility for Financial Reporting 87Independent Auditors’ Report 88Statement of Financial Position 91Statement of Profit or Loss 92Statement of Comprehensive Income 93Statement of Changes in Equity 94Statement of Cash Flows 95Notes to the Financial Statements 96
DIRECTORS’ RESPONSIBILITY FOR FINANCIAL REPORTING
The responsibility of the Directors, in relation to the Financial Statements, is set out in the following statement. The responsibility of the Auditors, in relation to the Financial Statements, is set out in the Report of the Auditors on page 88 of the Report.
The Companies Act No. 07 of 2007, requires that the Directors prepare financial statements for each financial year and place before a General Meeting, Financial Statements comprise of the Statement of Financial Position as at 31 December 2019, and the Statement of Profit or Loss, Statement of Comprehensive Income, Statement of Changes in Equity and Statement of Cash Flows for the year then ended and notes thereto.
The financial statements of the Bank and its subsidiaries give a true and fair view of the financial position of the Bank and its subsidiaries as at 31 December 2019; and the profit or loss of the Bank and its subsidiaries for the financial year then ended.
The Directors are of the view that, in preparing these Financial Statements:
i. the appropriate accounting policies have been selected and applied in a consistent manner and material departures, if any, have been disclosed and explained;
ii. all applicable Accounting Standards have been followed (SLFRS/LKAS);
iii. judgments and estimates have been made which are reasonable and prudent.
The Directors are also of the view that the Bank and its subsidiaries have adequate resources to continue in operation and have applied the going-concern basis in preparing these Financial Statements.
The Directors are responsible for ensuring that the Bank and its subsidiaries maintain sufficient accounting records to be able to disclose, with reasonable accuracy, the financial position of the Bank and the Group and to be able to ensure that the Financial Statements of the Bank and its subsidiaries meet with the requirements of the Companies Act, the Banking Act and the Listing Rules of the Colombo Stock Exchange.
Further, as required by Section 56 (2) of the Companies Act No 7 of 2007, the Directors have confirmed that the Bank, based on the information available, satisfies the solvency test immediately after the distribution of dividends, in accordance with Section 57 of the Companies Act No 7 of 2007, and has obtained a certificate from the auditors, prior to declaring a first and final cash dividend of LKR 2.30 per share.
The Directors are also responsible for taking reasonable steps to safeguard the assets of the Bank and its subsidiaries and, in this regard, to give proper consideration to the establishment of appropriate internal control systems, with a view to preventing and for the detection of fraud and other irregularities.
The Directors are required to prepare Financial Statements and to provide the Auditors with every opportunity to take whatever steps and undertake whatever inspections they consider to be appropriate, for the purpose of enabling them to give their audit report.
The Directors are of the view that they have discharged their responsibilities as set out in this statement.
By Order of the Board
Theja SilvaCompany Secretary
27th February, 2020
INTERNET BANKINGBanking on the move with Nation Trust Bank

88
Nations Trust Bank PLC Annual Report 2019
INDEPENDENT AUDITOR'S REPORT
INDEPENDENT AUDITOR'SREPORTTO THE SHAREHOLDERS OF NATIONS TRAUST BANK PLC REPORT ON THE AUDIT OF THE CONSOLIDATED FINANCIAL STATEMENTS
Opinion We have audited the financial statements of Nations Trust Bank PLC (the “Bank”) and the consolidated financial statements of the Bank and its subsidiaries (the “Group”), which comprise the statement of financial position as at 31 December 2019, Statement of Profit or Loss and the statement of comprehensive income, statement of changes in equity and statement of cash flows for the year then ended, and notes to the financial statements, including a summary of significant accounting policies.
In our opinion, the accompanying financial statements of the Bank and the Group give a true and fair view of the financial position of
the Bank and the Group as at 31 December 2019, and of their financial performance and cash flows for the year then ended in accordance with Sri Lanka Accounting Standards.
Basis for OpinionWe conducted our audit in accordance with Sri Lanka Auditing Standards (“SLAuSs”). Our responsibilities under those standards are further described in the Auditor’s responsibilities for the audit of the financial statements section of our report. We are independent of the Group in accordance with the Code of Ethics issued by CA Sri Lanka (“Code of Ethics”) and we have fulfilled our other ethical responsibilities in accordance with the Code of Ethics. We believe that the audit evidence we have obtained is sufficient and appropriate to provide a basis for our opinion.
Key Audit MattersKey audit matters are those matters that, in our professional judgement, were of most
significance in our audit of the financial statements of the current period. These matters were addressed in the context of our audit of the financial statements as a whole, and in forming our opinion thereon, and we do not provide a separate opinion on these matters. For each matter below, our description of how our audit addressed the matter is provided in that context.
We have fulfilled the responsibilities described in the Auditor’s responsibilities for the audit of the financial statements section of our report, including in relation to these matters. Accordingly, our audit included the performance of procedures designed to respond to our assessment of the risks of material misstatement of the financial statements. The results of our audit procedures, including the procedures performed to address the matters below, provide the basis for our audit opinion on the accompanying financial statements.
Key audit matter How our audit addressed the key audit matter
Allowance for impairment Losses for Loans and Advances in compliance with SLFRS 9:We considered the estimation of the Allowance for Impairment Losses for Loans and Advances as a Key Audit Matter due to the use of a model that involves complex manual calculations along with significant judgements & assumptions of the management. As at 31 December 2019, Loans and Advances, net of Allowance for Impairment Losses amounted to LKR 226,794 Mn, which represents 70% of the Group’s total assets.
Notes 2.9(iii), 13 and 36 to the financial statements provide descriptions and details of the allowance for impairment losses for loans and advances, basis of its calculation including key judgements & assumptions used in its estimation.
Our audit effort included the following procedures: • We evaluated the design and operating effectiveness of financial controls over the identification of individually
significant customers subjected to increase in credit risk which require individual assessment of allowance for impairment.
• We checked the accuracy of the underlying calculations on a sample basis; We also tested the appropriateness of the data used in such calculations on a sample basis;
• The following key focused procedures were also performed: A. For a sample of loans & advances individually assessed for impairment:
> Where impairment indicators existed, we evaluated the reasonableness of management’s estimate of future recoveries including the future cash flows, discount rates and valuation of collateral held. We also compared the actual recoveries against previously estimated amounts of future recoveries;
> For loans & advances granted to customers in industries with higher risk of credit loss, we assessed the main criteria used by management in its assessment of expected credit losses and reasonableness of impairment losses made thereof;
B. For loans and advances collectively assessed for impairment: > We tested for a sample, the completeness and accuracy of the underlying information in loans and advances used
in the calculations for Allowances for impairment Losses by agreeing details to the Group’s source documents and information in IT systems;
> We also considered the reasonableness of macro-economic conditions and other factors used by management in their judgemental overlays for various types of loan portfolios, by comparing them with publicly available data;
• We assessed the adequacy of the related financial statement disclosures as set out in notes 2.9(iii), 13 and 36.

89
NEXT GEN BANKING
Other information included in the Group’s 2019 Annual ReportOther information consists of the information included in the Annual Report, other than the financial statements and our auditor’s report thereon. Management is responsible for the other information.
Our opinion on the financial statements does not cover the other information and we do not express any form of assurance conclusion thereon.
In connection with our audit of the financial statements, our responsibility is to read the other information and, in doing so, consider whether the other information is materially inconsistent with the financial statements or our knowledge obtained in the audit or otherwise appears to be materially misstated. If, based on the work we have performed, we conclude that there is a material misstatement of this other information, we are required to report that fact. We have nothing to report in this regard.
Responsibilities of management and those charged with governance for the financial statementsManagement is responsible for the preparation of financial statements that give a true and fair view in accordance with Sri
Key audit matter How our audit addressed the key audit matter
Preparation of Financial Statements inclusive of Significant disclosures As the Bank uses multiple and complex IT systems in its operations, the preparation and presentation of financial statements inclusive of significant disclosures is heavily dependent on information derived from generating and collating reports from such multiple systems.
Accordingly, we considered the preparation and presentation of financial statements of the Group inclusive of significant disclosures together with manual, automated and IT dependent manual controls over the said process as an area of significant audit attention.
Our audit procedures included the following, amongst others:
• Understanding and evaluating the design and operating effectiveness of key automated, IT dependent and manual controls implemented by management over generation of multiple system reports and collation of required information underpinning the preparation and presentation of financial statements inclusive of significant disclosures.
• Test-checking;
> the reports used to generate significant disclosures for accuracy and completeness;
> source data of the report with those of the related IT systems;
> calculations made by management and
> reasonableness of classification/categorizations made by management;
• Where we considered necessary, performing additional audit procedures to assess management’s assertion of integrity of systems.
Lanka Accounting Standards, and for such internal control as management determines is necessary to enable the preparation of financial statements that are free from material misstatement, whether due to fraud or error.
In preparing the financial statements, management is responsible for assessing the Group’s ability to continue as a going concern, disclosing, as applicable, matters related to going concern and using the going concern basis of accounting unless management either intends to liquidate the Group or to cease operations, or has no realistic alternative but to do so.
Those charged with governance are responsible for overseeing the Bank’s and Group’s financial reporting process.
Auditor’s responsibilities for the audit of the financial statementsOur objectives are to obtain reasonable assurance about whether the financial statements as a whole are free from material misstatement, whether due to fraud or error, and to issue an auditor’s report that includes our opinion. Reasonable assurance is a high level of assurance, but is not a guarantee that an audit conducted in accordance with SLAuSs will always detect a material misstatement
when it exists. Misstatements can arise from fraud or error and are considered material if, individually or in the aggregate, they could reasonably be expected to influence the economic decisions of users taken on the basis of these financial statements.
As part of an audit in accordance with SLAuSs, we exercise professional judgement and maintain professional skepticism throughout the audit. We also:
1. Identify and assess the risks of material misstatement of the financial statements, whether due to fraud or error, design and perform audit procedures responsive to those risks, and obtain audit evidence that is sufficient and appropriate to provide a basis for our opinion. The risk of not detecting a material misstatement resulting from fraud is higher than for one resulting from error, as fraud may involve collusion, forgery, intentional omissions, misrepresentations, or the override of internal control.
2. Obtain an understanding of internal control relevant to the audit in order to design audit procedures that are appropriate in the circumstances, but not for the purpose of expressing an opinion on the effectiveness of the internal controls of the Bank and the Group.
90
Nations Trust Bank PLC Annual Report 2019
3. Evaluate the appropriateness of accounting policies used and the reasonableness of accounting estimates and related disclosures made by management.
4. Conclude on the appropriateness of management’s use of the going concern basis of accounting and, based on the audit evidence obtained, whether a material uncertainty exists related to events or conditions that may cast significant doubt on the Group’s ability to continue as a going concern. If we conclude that a material uncertainty exists, we are required to draw attention in our auditor’s report to the related disclosures in the financial statements or, if such disclosures are inadequate, to modify our opinion. Our conclusions are based on the audit evidence obtained up to the date of our auditor’s report. However, future events or conditions may cause the Group to cease to continue as a going concern.
5. Evaluate the overall presentation, structure and content of the financial statements, including the disclosures, and whether the financial statements represent the underlying transactions and events in a manner that achieves fair presentation.
6. Obtain sufficient appropriate audit evidence regarding the financial information of the entities or business activities within the Group to express an opinion on the consolidated financial statements. We are responsible for the direction, supervision and performance of the group audit. We remain solely responsible for our audit opinion.
We communicate with those charged with governance regarding, among other matters, the planned scope and timing of the audit and significant audit findings, including any significant deficiencies in internal control that we identify during our audit.
We also provide those charged with governance with a statement that we have complied with ethical requirements in accordance with the Code of Ethics regarding independence, and to communicate with them all relationships and other matters that may reasonably be thought to bear on our independence, and where applicable, related safeguards.
From the matters communicated with those charged with governance, we determine those matters that were of most significance in the audit of the financial statements of the current period and are therefore the key audit matters. We describe these matters in our auditor’s report unless law or regulation precludes
public disclosure about the matter or when, in extremely rare circumstances, we determine that a matter should not be communicated in our report because the adverse consequences of doing so would reasonably be expected to outweigh the public interest benefits of such communication.
Report on Other Legal and Regulatory RequirementsAs required by section 163 (2) of the Companies Act No. 07 of 2007, we have obtained all the information and explanations that were required for the audit and, as far as appears from our examination, proper accounting records have been kept by the Bank.
CA Sri Lanka membership number of the engagement partner responsible for signing this independent auditor’s report is 2471.
27th February 2020
Colombo
INDEPENDENT AUDITOR'S REPORT
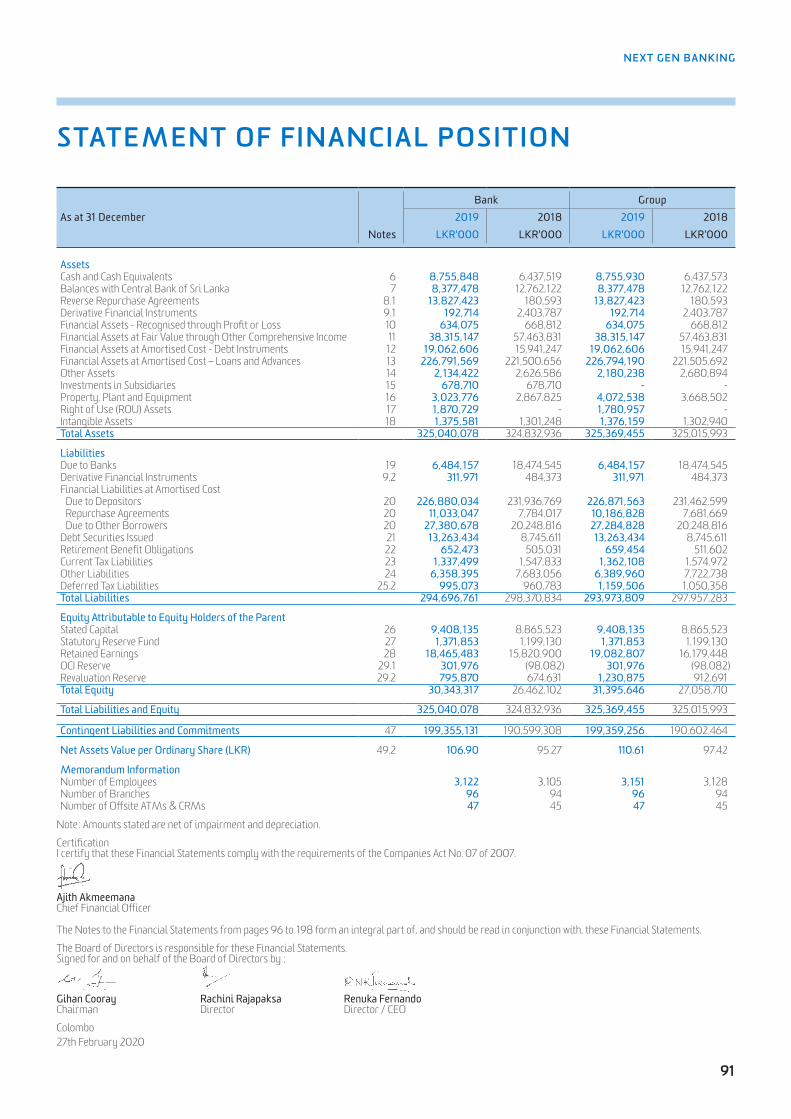
91
NEXT GEN BANKING
STATEMENT OF FINANCIAL POSITION
Bank GroupAs at 31 December 2019 2018 2019 2018
Notes LKR'000 LKR'000 LKR'000 LKR'000
AssetsCash and Cash Equivalents 6 8,755,848 6,437,519 8,755,930 6,437,573Balances with Central Bank of Sri Lanka 7 8,377,478 12,762,122 8,377,478 12,762,122Reverse Repurchase Agreements 8.1 13,827,423 180,593 13,827,423 180,593Derivative Financial Instruments 9.1 192,714 2,403,787 192,714 2,403,787Financial Assets - Recognised through Profit or Loss 10 634,075 668,812 634,075 668,812Financial Assets at Fair Value through Other Comprehensive Income 11 38,315,147 57,463,831 38,315,147 57,463,831Financial Assets at Amortised Cost - Debt Instruments 12 19,062,606 15,941,247 19,062,606 15,941,247Financial Assets at Amortised Cost – Loans and Advances 13 226,791,569 221,500,656 226,794,190 221,505,692Other Assets 14 2,134,422 2,626,586 2,180,238 2,680,894Investments in Subsidiaries 15 678,710 678,710 - - Property, Plant and Equipment 16 3,023,776 2,867,825 4,072,538 3,668,502Right of Use (ROU) Assets 17 1,870,729 - 1,780,957 - Intangible Assets 18 1,375,581 1,301,248 1,376,159 1,302,940Total Assets 325,040,078 324,832,936 325,369,455 325,015,993
LiabilitiesDue to Banks 19 6,484,157 18,474,545 6,484,157 18,474,545Derivative Financial Instruments 9.2 311,971 484,373 311,971 484,373Financial Liabilities at Amortised Cost Due to Depositors 20 226,880,034 231,936,769 226,871,563 231,462,599 Repurchase Agreements 20 11,033,047 7,784,017 10,186,828 7,681,669 Due to Other Borrowers 20 27,380,678 20,248,816 27,284,828 20,248,816Debt Securities Issued 21 13,263,434 8,745,611 13,263,434 8,745,611Retirement Benefit Obligations 22 652,473 505,031 659,454 511,602Current Tax Liabilities 23 1,337,499 1,547,833 1,362,108 1,574,972Other Liabilities 24 6,358,395 7,683,056 6,389,960 7,722,738Deferred Tax Liabilities 25.2 995,073 960,783 1,159,506 1,050,358Total Liabilities 294,696,761 298,370,834 293,973,809 297,957,283
Equity Attributable to Equity Holders of the ParentStated Capital 26 9,408,135 8,865,523 9,408,135 8,865,523Statutory Reserve Fund 27 1,371,853 1,199,130 1,371,853 1,199,130Retained Earnings 28 18,465,483 15,820,900 19,082,807 16,179,448OCI Reserve 29.1 301,976 (98,082) 301,976 (98,082)Revaluation Reserve 29.2 795,870 674,631 1,230,875 912,691Total Equity 30,343,317 26,462,102 31,395,646 27,058,710
Total Liabilities and Equity 325,040,078 324,832,936 325,369,455 325,015,993
Contingent Liabilities and Commitments 47 199,355,131 190,599,308 199,359,256 190,602,464
Net Assets Value per Ordinary Share (LKR) 49.2 106.90 95.27 110.61 97.42
Memorandum InformationNumber of Employees 3,122 3,105 3,151 3,128 Number of Branches 96 94 96 94 Number of Offsite ATMs & CRMs 47 45 47 45
Note: Amounts stated are net of impairment and depreciation.
CertificationI certify that these Financial Statements comply with the requirements of the Companies Act No. 07 of 2007.
Ajith AkmeemanaChief Financial Officer
The Notes to the Financial Statements from pages 96 to 198 form an integral part of, and should be read in conjunction with, these Financial Statements.
The Board of Directors is responsible for these Financial Statements. Signed for and on behalf of the Board of Directors by ;
Gihan Cooray Rachini Rajapaksa Renuka FernandoChairman Director Director / CEO
Colombo27th February 2020

92
Nations Trust Bank PLC Annual Report 2019
STATEMENT OF PROFIT OR LOSS
Bank GroupFor the Year Ended 31 December 2019 2018 2019 2018
Notes LKR'000 LKR'000 LKR'000 LKR'000
Gross Income 46,026,494 43,444,310 46,314,300 43,461,437
Interest Income 30 39,570,860 37,034,354 39,571,531 37,050,409Interest Expense 31 (23,510,084) (21,924,562) (23,437,059) (21,886,502)Net Interest Income 16,060,776 15,109,792 16,134,472 15,163,907
Fee and Commission Income 32.1 6,194,715 6,016,153 6,481,836 6,306,234Fee and Commission Expense 32.2 (325,106) (265,349) (325,106) (265,349)Net Fee and Commission Income 5,869,609 5,750,804 6,156,730 6,040,885
Net Gain/(Loss) from Trading 33 (1,315,658) 2,778,248 (1,315,658) 2,778,420Net Fair Value Gains/(Losses) From Financial Instruments at Fair Value Through Profit or Loss
34 11,030 (3,758) 11,030 (3,758)
Net Other Operating Income/(Loss) 35 1,565,547 (2,380,687) 1,565,561 (2,669,868)Total Operating Income 22,191,304 21,254,399 22,552,135 21,309,586
Impairment Charges 36 (3,294,033) (3,272,708) (3,300,554) (3,274,036)Net Operating Income 18,897,271 17,981,691 19,251,581 18,035,550
Personnel Expenses 37 (4,508,124) (4,143,993) (4,539,979) (4,173,771)Depreciation of Property, Plant and Equipment 16 (441,150) (367,437) (472,323) (395,736)Depreciation of Right of Use (ROU) Assets 17 (476,541) - (386,769) - Amortization of Intangible Assets 18 (347,461) (302,733) (348,575) (305,948)Other Operating Expenses 38 (5,012,625) (5,480,714) (5,060,114) (5,434,055)Total Operating Expenses (10,785,901) (10,294,877) (10,807,760) (10,309,510)
Operating Profit before Taxes and Levies on Financial Services 8,111,370 7,686,814 8,443,821 7,726,040
Taxes and Levies on Financial Services 39 (2,659,543) (1,863,948) (2,660,742) (1,866,739)
Profit before Income Tax 5,451,827 5,822,866 5,783,079 5,859,301
Income Tax Expense 40 (1,997,362) (2,054,898) (2,069,540) (2,157,418)
Profit for the Year 3,454,465 3,767,968 3,713,539 3,701,883
Attributable to:Equity Holders of the Parent 3,454,465 3,767,968 3,713,539 3,701,883
Earnings Per Share Basic / Diluted Earnings Per Share - LKR 41 12.17 13.33 13.08 13.10 Dividend Per Share - LKR 42 2.30 2.10 2.30 2.10
The Notes to the Financial Statements from pages 96 to 198 form an integral part of, and should be read in conjunction with, these Financial Statements.
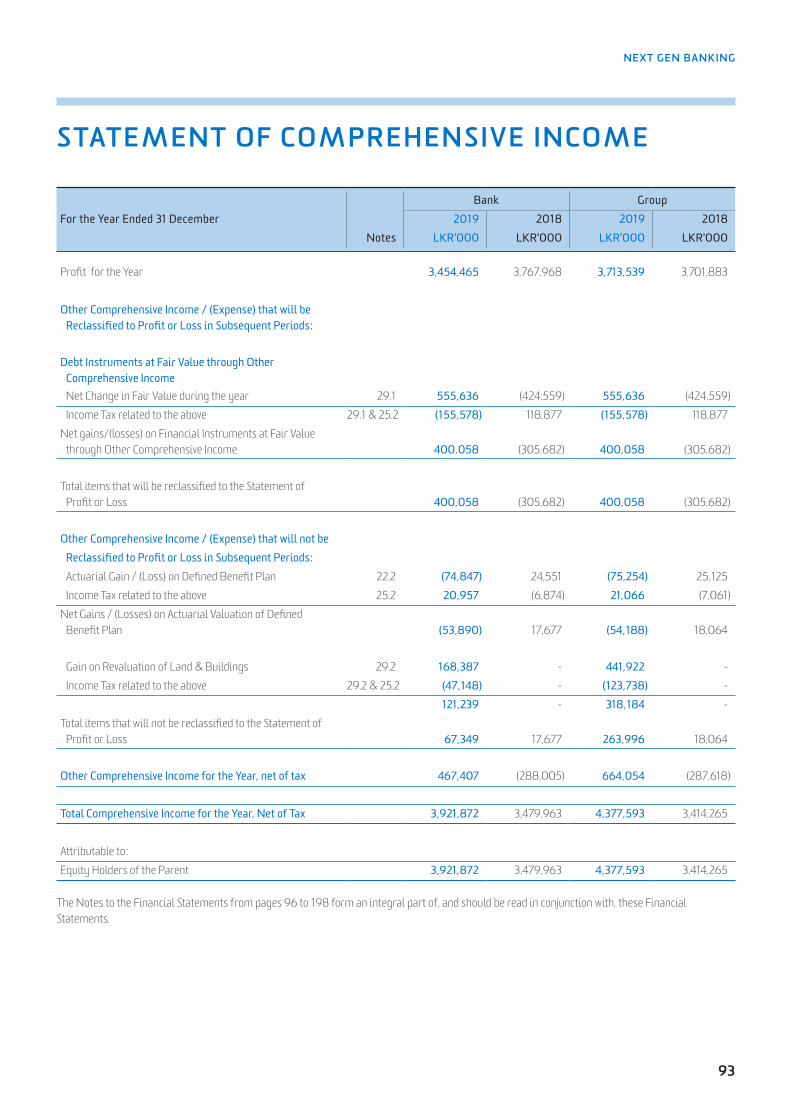
93
NEXT GEN BANKING
STATEMENT OF COMPREHENSIVE INCOME
Bank GroupFor the Year Ended 31 December 2019 2018 2019 2018
Notes LKR'000 LKR'000 LKR'000 LKR'000
Profit for the Year 3,454,465 3,767,968 3,713,539 3,701,883
Other Comprehensive Income / (Expense) that will be Reclassified to Profit or Loss in Subsequent Periods:
Debt Instruments at Fair Value through Other Comprehensive Income Net Change in Fair Value during the year 29.1 555,636 (424,559) 555,636 (424,559) Income Tax related to the above 29.1 & 25.2 (155,578) 118,877 (155,578) 118,877Net gains/(losses) on Financial Instruments at Fair Value through Other Comprehensive Income 400,058 (305,682) 400,058 (305,682)
Total items that will be reclassified to the Statement of Profit or Loss 400,058 (305,682) 400,058 (305,682)
Other Comprehensive Income / (Expense) that will not be Reclassified to Profit or Loss in Subsequent Periods: Actuarial Gain / (Loss) on Defined Benefit Plan 22.2 (74,847) 24,551 (75,254) 25,125 Income Tax related to the above 25.2 20,957 (6,874) 21,066 (7,061)Net Gains / (Losses) on Actuarial Valuation of Defined Benefit Plan (53,890) 17,677 (54,188) 18,064
Gain on Revaluation of Land & Buildings 29.2 168,387 - 441,922 - Income Tax related to the above 29.2 & 25.2 (47,148) - (123,738) -
121,239 - 318,184 - Total items that will not be reclassified to the Statement of Profit or Loss 67,349 17,677 263,996 18,064
Other Comprehensive Income for the Year, net of tax 467,407 (288,005) 664,054 (287,618)
Total Comprehensive Income for the Year, Net of Tax 3,921,872 3,479,963 4,377,593 3,414,265
Attributable to:Equity Holders of the Parent 3,921,872 3,479,963 4,377,593 3,414,265
The Notes to the Financial Statements from pages 96 to 198 form an integral part of, and should be read in conjunction with, these Financial Statements.

94
Nations Trust Bank PLC Annual Report 2019
STATEMENT OF CHANGES IN EQUITY
For the Year Ended 31 December Stated Capital Statutory Reserve
Fund
Retained Earnings
OCI Reserve
RevaluationReserve
Total
BANK Voting Non-VotingNotes LKR'000 LKR'000 LKR'000 LKR'000 LKR'000 LKR'000 LKR'000
As at 01 January 2018 5,101,369 - 1,010,732 13,813,403 207,600 674,631 20,807,735Impact of First Time Adoption of SLFRS 9 - - - (1,021,253) - - (1,021,253)Restated Opening Balance under SLFRS 9 5,101,369 - 1,010,732 12,792,150 207,600 674,631 19,786,482Profit for the Year - - - 3,767,968 - - 3,767,968Other Comprehensive Income - - - 17,677 (305,682) - (288,005)Total Comprehensive Income - - - 3,785,645 (305,682) - 3,479,963Rights Issue 26 - 3,208,449 - - - - 3,208,449Scrip Dividend for 2017 26 & 28 473,347 82,358 - (568,497) - - (12,792)Conversion of Non-Voting Shares to Voting Shares 26 165,200 (165,200) - - - - -Transfers to the Statutory Reserve Fund 27.2 - - 188,398 (188,398) - - - As at 31 December 2018 5,739,916 3,125,607 1,199,130 15,820,900 (98,082) 674,631 26,462,102
Profit for the Year - - - 3,454,465 - - 3,454,465Other Comprehensive Income - - - (53,890) 400,058 121,239 467,407Total Comprehensive Income - - - 3,400,575 400,058 121,239 3,921,872Scrip Dividend for 2018 26 & 28 466,410 76,202 - (583,269) - - (40,657)Conversion of Non-Voting Shares to Voting Shares 26 82,981 (82,981) - - - - - Transfers to the Statutory Reserve Fund 27.2 - - 172,723 (172,723) - - - As at 31 December 2019 6,289,307 3,118,828 1,371,853 18,465,483 301,976 795,870 30,343,317
For the Year Ended 31 December Stated Capital Statutory Reserve
Fund
Retained Earnings
OCI Reserve
RevaluationReserve
Total
GROUP Voting Non-VotingNotes LKR'000 LKR'000 LKR'000 LKR'000 LKR'000 LKR'000 LKR'000
As at 01 January 2018 5,101,369 - 1,010,732 14,237,649 207,600 912,691 21,470,041Impact of First Time Adoption of SLFRS 9 - - - (1,021,253) - - (1,021,253)Restated Opening Balance under SLFRS 9 5,101,369 - 1,010,732 13,216,396 207,600 912,691 20,448,788Profit for the Year - - - 3,701,883 - - 3,701,883Other Comprehensive Income - - - 18,064 (305,682) - (287,618)Total Comprehensive Income - - - 3,719,947 (305,682) - 3,414,265Rights Issue 26 - 3,208,449 - - - - 3,208,449Scrip Dividend for 2017 26 & 28 473,347 82,358 - (568,497) - - (12,792)Conversion of Non-Voting Shares to Voting Shares 26 165,200 (165,200) - - - - - Transfers to the Statutory Reserve Fund 27.2 - - 188,398 (188,398) - - - As at 31 December 2018 5,739,916 3,125,607 1,199,130 16,179,448 (98,082) 912,691 27,058,710
Profit for the Year - - - 3,713,539 - - 3,713,539Other Comprehensive Income - - - (54,188) 400,058 318,184 664,054Total Comprehensive Income - - - 3,659,351 400,058 318,184 4,377,593Scrip Dividend for 2018 26 & 28 466,410 76,202 - (583,269) - - (40,657)Conversion of Non-Voting Shares to Voting Shares 26 82,981 (82,981) - - - - - Transfers to the Statutory Reserve Fund 27.2 - - 172,723 (172,723) - - - As at 31 December 2019 6,289,307 3,118,828 1,371,853 19,082,807 301,976 1,230,875 31,395,646
The Notes to the Financial Statements from pages 96 to 198 form an integral part of, and should be read in conjunction with, these Financial Statements.

95
NEXT GEN BANKING
Bank GroupFor the Year Ended 31 December 2019 2018 2019 2018
Notes LKR'000 LKR'000 LKR'000 LKR'000
Cash Flows from Operating ActivitiesReceipts of Interest Income 38,725,874 36,742,998 38,726,545 36,754,782Receipts of Fees and Commission Income 6,196,954 6,071,711 6,474,451 6,351,140Payments of Interest Expense (22,233,385) (19,188,583) (22,183,407) (19,149,770)Payments of Fees and Commission Expense (322,980) (267,935) (322,980) (267,935)Net Trading Income 723,012 593,535 723,012 593,706Receipts from Other Operating Income 1,565,549 (2,371,078) 1,565,549 (2,661,607)Gratuity Payments Made (72,291) (60,162) (73,587) (60,162)Payments for Operating Expenses (9,329,637) (9,047,695) (9,415,353) (9,025,292)Payments for VAT & NBT on Financial Services (1,742,097) (1,719,257) (1,743,321) (1,722,670)Payments for Debt Repayment Levy (DRL) (838,801) (125,625) (838,801) (125,625)Net Cash Flows from Operating Activities before Income Tax (A) 12,672,198 10,627,909 12,912,108 10,686,567Income Tax Paid (2,343,052) (1,475,104) (2,406,062) (1,561,683)Tax Paid on Dividends (40,429) (12,495) (40,429) (44,777)Operating Profit before Changes in Operating Assets and Liabilities 10,288,717 9,140,310 10,465,617 9,080,107
(Increase)/Decrease in Operating Assets 43.1 (4,390,685) (58,562,145) (4,384,194) (58,297,244)Increase/(Decrease) in Operating Liabilities 43.2 (11,786,077) 41,279,987 (12,056,413) 41,102,831
Net Cash Flows from Operating Activities (5,888,045) (8,141,848) (5,974,990) (8,114,306)
Cash Flows from Investing ActivitiesPurchase of Property, Plant and Equipment 16 (384,758) (660,636) (397,239) (691,945)Proceeds from Sale of Property, Plant and Equipment and Intangible Assets 1,019 23,821 1,033 25,169Purchase of Intangible Assets 18 (425,691) (303,957) (425,691) (303,957)
(809,430) (940,772) (821,897) (970,733)
Cash Flows from Financing ActivitiesNet change in Debt Issued and Other Borrowed Funds 1,195,726 7,723,977 1,195,726 7,723,977Proceeds from the issue of Subordinated Debt 43.4 4,500,000 3,500,000 4,500,000 3,500,000Repayment of Subordinated Debt - (3,000,000) - (3,000,000)Proceeds from Rights Issue 26 - 3,208,449 - 3,208,449Operating Lease Rentals Paid 17.3 (547,361) - (447,921) - Interest Paid on Subordinated Debt (1,077,028) (1,150,600) (1,077,028) (1,150,600)Dividends Paid to Equity Holders of the Parent (228) (297) (228) (297)
4,071,109 10,281,529 4,170,549 10,281,529
Net Increase/(Decrease) in Cash and Cash Equivalents (2,626,366) 1,198,909 (2,626,338) 1,196,490Cash and Cash Equivalents at the Beginning of the Year 19,113,358 17,914,449 19,113,412 17,916,922Cash and Cash Equivalents at the End of the Year 16,486,992 19,113,358 16,487,074 19,113,412
Reconciliation of Cash and Cash EquivalentsCash in Hand 6 5,867,701 5,419,519 5,867,724 5,419,542Balances with Central Bank of Sri Lanka* 7 8,377,478 12,762,122 8,377,478 12,762,122Balances with Banks 6 787,329 1,018,271 787,388 1,018,302Money at Call & Short Notice 6 2,101,864 - 2,101,864 -Deposits from Other Banks 19 (647,380) (86,554) (647,380) (86,554)
16,486,992 19,113,358 16,487,074 19,113,412
A. Reconciliation of Operating ProfitProfit before Income Tax 5,451,827 5,822,866 5,783,079 5,859,301(Profit) / Loss on Disposal of Property, Plant and Equipment and Intangible Assets 2 9,609 (12) 8,261Impairment Charge / (Reversal) for Loans and Receivables 36 3,294,033 3,272,708 3,300,554 3,274,036Provision for Gratuity 37 136,997 110,127 138,296 111,348(Increase) / Decrease in Interest Receivable (2,552,173) 732,863 (2,552,173) 728,805Increase/ (Decrease) in Interest Payable 211,977 1,564,325 204,674 1,565,077Increase / (Decrease) in Financial Guarantee Liabilities & Deferred Income (25,766) 318,844 (27,173) 317,815(Increase) / Decrease in Fees & Commission Receivable 24,437 (39,095) 16,062 (48,720)Increase / (Decrease) in Fees & Commission and Operating Expenses Payable (408,907) 259,174 (317,003) 262,854Other Non - Cash Items 43.3 4,987,673 (2,513,950) 4,914,442 (2,482,648)Operating Lease Rentals Paid 17.3 547,361 - 447,921 - Interest Paid on Subordinated Debt 1,077,028 1,150,600 1,077,028 1,150,600Gratuity Payments Made (72,291) (60,162) (73,587) (60,162)
12,672,198 10,627,909 12,912,108 10,686,567* As at 31 December 2019, LKR 8,388.17 Mn (2018 - LKR 12,570.47 Mn) was not available for use by the Bank due to mandatory deposit at Central Bank of Sri Lanka.
STATEMENT OF CASH FLOWS
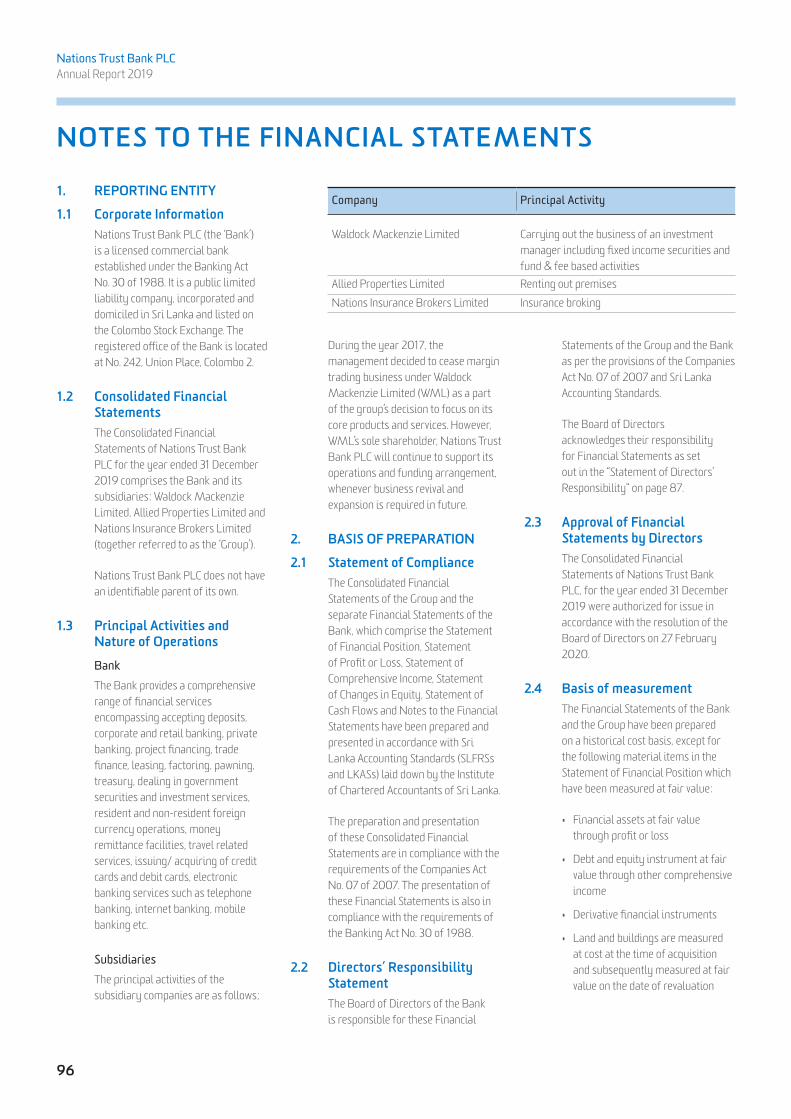
96
Nations Trust Bank PLC Annual Report 2019
NOTES TO THE FINANCIAL STATEMENTS
1. REPORTING ENTITY
1.1 Corporate Information Nations Trust Bank PLC (the ‘Bank’)
is a licensed commercial bank established under the Banking Act No. 30 of 1988. It is a public limited liability company, incorporated and domiciled in Sri Lanka and listed on the Colombo Stock Exchange. The registered office of the Bank is located at No. 242, Union Place, Colombo 2.
1.2 Consolidated Financial Statements
The Consolidated Financial Statements of Nations Trust Bank PLC for the year ended 31 December 2019 comprises the Bank and its subsidiaries: Waldock Mackenzie Limited, Allied Properties Limited and Nations Insurance Brokers Limited (together referred to as the ‘Group’).
Nations Trust Bank PLC does not have an identifiable parent of its own.
1.3 Principal Activities and Nature of Operations
Bank The Bank provides a comprehensive
range of financial services encompassing accepting deposits, corporate and retail banking, private banking, project financing, trade finance, leasing, factoring, pawning, treasury, dealing in government securities and investment services, resident and non-resident foreign currency operations, money remittance facilities, travel related services, issuing/ acquiring of credit cards and debit cards, electronic banking services such as telephone banking, internet banking, mobile banking etc.
Subsidiaries The principal activities of the
subsidiary companies are as follows;
Company Principal Activity
Waldock Mackenzie Limited Carrying out the business of an investment manager including fixed income securities and fund & fee based activities
Allied Properties Limited Renting out premisesNations Insurance Brokers Limited Insurance broking
During the year 2017, the management decided to cease margin trading business under Waldock Mackenzie Limited (WML) as a part of the group’s decision to focus on its core products and services. However, WML’s sole shareholder, Nations Trust Bank PLC will continue to support its operations and funding arrangement, whenever business revival and expansion is required in future.
2. BASIS OF PREPARATION
2.1 Statement of Compliance The Consolidated Financial
Statements of the Group and the separate Financial Statements of the Bank, which comprise the Statement of Financial Position, Statement of Profit or Loss, Statement of Comprehensive Income, Statement of Changes in Equity, Statement of Cash Flows and Notes to the Financial Statements have been prepared and presented in accordance with Sri Lanka Accounting Standards (SLFRSs and LKASs) laid down by the Institute of Chartered Accountants of Sri Lanka.
The preparation and presentation of these Consolidated Financial Statements are in compliance with the requirements of the Companies Act No. 07 of 2007. The presentation of these Financial Statements is also in compliance with the requirements of the Banking Act No. 30 of 1988.
2.2 Directors’ Responsibility Statement
The Board of Directors of the Bank is responsible for these Financial
Statements of the Group and the Bank as per the provisions of the Companies Act No. 07 of 2007 and Sri Lanka Accounting Standards.
The Board of Directors acknowledges their responsibility for Financial Statements as set out in the “Statement of Directors’ Responsibility” on page 87.
2.3 Approval of Financial Statements by Directors
The Consolidated Financial Statements of Nations Trust Bank PLC, for the year ended 31 December 2019 were authorized for issue in accordance with the resolution of the Board of Directors on 27 February 2020.
2.4 Basis of measurement The Financial Statements of the Bank
and the Group have been prepared on a historical cost basis, except for the following material items in the Statement of Financial Position which have been measured at fair value:
• Financial assets at fair value through profit or loss
• Debt and equity instrument at fair value through other comprehensive income
• Derivative financial instruments
• Land and buildings are measured at cost at the time of acquisition and subsequently measured at fair value on the date of revaluation

97
NEXT GEN BANKING
• Liability for defined benefit obligations is recognised at the present value of defined benefit obligation
2.5 Functional and Presentation Currency
The Financial Statements of the Group are presented in Sri Lankan Rupees (LKR), which is the currency of the primary economic environment in which the Group operates (Group’s functional currency). Financial information presented in Sri Lankan Rupees has been rounded to the nearest thousand (‘000) unless indicated otherwise.
There was no change in the Group’s presentation and functional currency during the year under review.
2.6 Presentation of Financial Statements
The Bank/Group presents its Statement of Financial Position broadly in order of liquidity. An analysis regarding recovery or settlement within 12 months after the reporting date (current) and more than 12 months after the reporting date (non–current) is presented in Note 45.
2.7 Materiality and aggregation In compliance with Sri Lanka
Accounting Standard - LKAS 01 - Presentation of Financial Statements, each material class of similar items are presented separately in the Financial Statements. Items of dissimilar nature or functions too are presented separately unless they are immaterial.
Financial assets and financial liabilities are offset and the net amount is reported in the Statement of Financial Position only when there is a legally enforceable right to offset the recognized amounts and there is an intention to settle on a net basis, or to realise the assets and
settle the liability simultaneously. Income and expenses are not offset in the statement of profit or loss unless required or permitted by an accounting standard or an interpretation, and as specifically disclosed in the accounting policies of the Group.
2.8 Changes in Accounting Policies
2.8.1 New and amended standards and interpretations
In these financial statements, the Group has applied SLFRS 16 Leases for the first time. The nature and effect of the changes as a result of adoption of this new accounting standard are described in Note 2.8.1.1 below. The Group has not early adopted any standards, interpretations or amendments that have been issued but are not yet effective.
Certain prior year figures and phrases have been rearranged in order to compatible with the presentation requirements of the Central Bank of Sri Lanka.
Except for below, the accounting policies adopted by the Bank/Group are consistent with those of the previous financial year.
2.8.1.1 SLFRS 16 - Leases SLFRS 16 supersedes LKAS 17
Leases, IFRIC 4 Determining whether an Arrangement contains a Lease, SIC-15 Operating Leases-Incentives and SIC-27 Evaluating the Substance of Transactions Involving the Legal Form of a Lease. The standard sets out the principles for the recognition, measurement, presentation and disclosure of leases and requires lessees to recognise most leases on the statement of financial position.
Lessor accounting under SLFRS 16 is substantially unchanged from LKAS
17. Lessors will continue to classify leases as either operating or finance leases using similar principles as in LKAS 17. Therefore, SLFRS 16 did not have an impact for leases where the Bank is the lessor.
The Bank adopted SLFRS 16 using the modified retrospective method of adoption with the date of initial application of 01 January 2019. The Bank elected to use the transition practical expedient to not reassess whether a contract is or contains a lease at 01 January 2019. Instead, the Bank applied the standard only to contracts that were previously identified as leases applying LKAS 17 and IFRIC 4 at the date of initial application.
The Bank has lease contracts for various branches and other equipment. Before the adoption of SLFRS 16, the Bank classified each of its leases (as lessee) at the inception date as either a finance lease or an operating lease. Refer to Note 48.3.1 for the accounting policy prior to 01 January 2019.
Upon adoption of SLFRS 16, the Bank applied a single recognition and measurement approach for all leases except for short-term leases (leases with a lease term of 12 months or less) and leases of low-value assets. Refer to Note 48.3.2 for the accounting policy beginning 01 January 2019. The standard provides specific transition requirements and practical expedients, which have been applied by the Bank.
Leases previously accounted for as operating leases
The Bank recognised right-of-use assets and lease liabilities for those leases previously classified as operating leases, except for short-term leases (leases with a lease term of 12 months or less) and leases of low-value assets. The right-of-

98
Nations Trust Bank PLC Annual Report 2019
use assets for most leases were recognised based on the carrying amount as if the standard had always been applied, apart from the use of incremental borrowing rate at the date of initial application. In some leases, the right-of-use assets were recognised based on the amount equal to the lease liabilities, adjusted for any related prepaid and accrued lease payments previously recognised. Lease liabilities were recognised based on the present value of the remaining lease payments, discounted using the incremental borrowing rate at the date of initial application.
The Group also applied the available practical expedients wherein it:
• Used a single discount rate to a portfolio of leases with reasonably similar characteristics
• Relied on its assessment of whether leases are onerous immediately before the date of initial application
• Applied the short-term leases exemptions to leases with lease term that ends within 12 months of the date of initial application
• Excluded the initial direct costs from the measurement of the right-of-use asset at the date of initial application
• Used hindsight in determining the lease term where the contract contained options to extend or terminate the lease
Based on the above, as at 01 January 2019:
• Right-of-use assets of LKR 2,090 Mn (Bank) were recognised and presented in the statement of financial position within “Right-of-use assets”.
• Additional lease liabilities of LKR 1,839 Mn (included in “Due to Other Borrowers”) were recognised.
• The adoption of SLFRS 16 had no material impact on the Bank’s retained earnings and no material impact on its capital adequacy ratios.
The lease liabilities as at 01 January 2019 can be reconciled to the operating lease commitments as of 31 December 2018, as follows:
BankAssets LKR'000
Operating lease commitments as at 31 December 2018 2,022,217 Less:Commitments relating to short-term leases (leases with a lease term of 12 months or less)
39,383
1,982,834 Weighted average incremental borrowing rate as at 01 January 2019 11%Discounted operating lease commitments as at 01 January 2019 1,353,952 Add:Lease payments relating to renewal periods not included in operating lease commitments as at 31 December 2018 485,638Lease liabilities as at 01 January 2019 1,839,590
2.9 Significant Accounting Judgements, Estimates and Assumptions
The preparation of the Bank’s consolidated financial statements requires management to make judgments, estimates and assumptions that affect the reported amount of revenues, expenses, assets, liabilities and the accompanying disclosures, as well as the disclosure of contingent liabilities. Uncertainty about these assumptions and estimates could result in outcomes that require a material adjustment to the carrying amount of assets or liabilities affected in future periods. In the process of applying the Bank’s accounting policies, management has made the following judgments and assumptions concerning the future and other key sources of estimation uncertainty at the reporting date, that have a significant risk of causing a material adjustment to the carrying amounts of assets and liabilities within the next financial year. Existing circumstances and assumptions about future developments may change
due to circumstances beyond the Bank’s control and are reflected in the assumptions if and when they occur. Items with the most significant effect on the amounts recognised in the consolidated financial statements with substantial management judgment and/or estimates are collated below with respect to judgments/estimates involved.
(i) Going Concern The Bank’s management has made an
assessment of its ability to continue as a going concern and is satisfied that it has the resources to continue in business for the foreseeable future. Furthermore, management is not aware of any material uncertainties that may cast significant doubt upon the Bank’s ability to continue as a going concern. Therefore, the Financial Statements continue to be prepared on the going concern basis.
(ii) Fair Value of Financial Instruments
The fair value of financial instruments is the price that would be receivedto
NOTES TO THE FINANCIAL STATEMENTS

99
NEXT GEN BANKING
• The Bank’s criteria for assessing if there has been a significant increase in credit risk and so allowances for financial assets should be measured on a Life Time Expected Credit Loss (LTECL) basis and the qualitative assessment
• The segmentation of financial assets when their ECL is assessed on a collective basis
• Development of ECL models, including the various formulas and the choice of inputs
• Determination of associations between macroeconomic scenarios and, economic inputs, such as unemployment levels and collateral values, and the effect on PDs, EADs and LGDs
• Selection of forward-looking macroeconomic scenarios and their probability weightings, to derive the economic inputs into the ECL models.
It has been the Bank’s policy to regularly review its models in the context of actual loss experience and adjust when necessary.
(iv) Fair Value of Land and Buildings
Freehold land and buildings of the Group are reflected at fair value at the date of revaluation less any accumulated depreciation and impairment losses.
The Group measures freehold land and buildings at fair value with changes in fair value being recognized in other comprehensive income. The Group engages independent valuation specialists to determine fair value of freehold land and buildings in terms of Sri Lanka Accounting Standard SLFRS 13 - Fair Value Measurement. Lands were valued by reference to market-based evidence, using comparable prices adjusted for specific market factors such as nature,
location and condition of the property, while buildings were valued based on depreciated replacement cost. Fair value related disclosures for land and buildings measured at fair value are summarized in the Note 46 to the financial statements.
(v) Useful Life-time of the Property, Plant and Equipment
The Group reviews the residual values, useful lives and methods of depreciation of property, plant and equipment at each reporting date. Judgment of the management is exercised in the estimation of these values, rates, methods hence they are subject to uncertainty. (Note 16).
(vi) Employee Benefit Liability – Gratuity
The cost of the defined benefit plan –gratuity is determined using an actuarial valuation. Actuarial valuation involves making assumptions about inter-alia discount rates, future salary increases, remaining working life of employees and mortality rates. Due to the long term nature of these obligations, such estimates are subject to significant uncertainty. Description of employee benefits is given in Note 22.
(vii) Share-Based Payments The Group measures the cost of cash
settled transactions with employees by reference to the fair value of the equity instruments on the date on which those are granted. Estimating fair value for share based payment transactions require determination of the most appropriate valuation model, which is dependent on the terms and conditions of the grant.
This estimate also requires determination of the most appropriate inputs to the valuation model including the expected life of the share appreciation rights scheme,
sell an asset or paid to transfer a liability in an orderly transaction in the principal (or most advantageous) market at the measurement date under current market conditions (i.e., an exit price) regardless of whether that price is directly observable or estimated using another valuation technique. When the fair values of financial assets and financial liabilities recorded in the Statement of Financial Position cannot be derived from active markets, they are determined using a variety of valuation techniques that include the use of valuation models. The inputs to these models are taken from observable markets where possible, but where this is not feasible, estimation is required in establishing fair values. Judgments and estimates include considerations of liquidity and model inputs related to items such as credit risk (both own and counterparty), funding value adjustments, correlation and volatility.
The valuation of financial instruments is described in more detail in Note 46.
(iii) Impairment losses on financial assets
The measurement of impairment losses under SLFRS 9 across all categories of financial assets requires judgment, in particular, the estimation of the amount and timing of future cash flows and collateral values when determining impairment losses and the assessment of a significant increase in credit risk. These estimates are driven by a number of factors, changes in which can result in different levels of allowances.
The Bank’s ECL calculations are outputs of complex models with a number of underlying assumptions regarding the choice of variable inputs and their interdependencies. Elements of the ECL models that are considered accounting judgements and estimates include:

100
Nations Trust Bank PLC Annual Report 2019
volatility and dividend yield and making assumptions about those. (Note 24.2).
(viii) Taxation The Group is subject to Income
Taxes and other taxes including VAT on Financial Services and Debt Repayment Levy. Uncertainties exist, with respect to the interpretation of the applicability of tax laws, at the time of the preparation of these Financial Statements.
Uncertainties also exist with respect to the interpretation of complex tax regulations and the amount and timing of future taxable income. Given the wide range of business relationships and the long term nature and complexity of existing contractual agreements, differences arising between the actual results and the assumptions made, or future changes to such assumptions, could necessitate future adjustments to tax income and expense amounts that were initially recorded, and deferred tax amounts in the period in which the determination is made. (Note 25 & 40).
(ix) Deferred Tax Assets Deferred tax assets are recognised
in respect of loan impairment allowances which will be recovered in the foreseeable future and tax losses to the extent that it is probable that future taxable profit will be available against which the losses can be utilised. Judgement is required to determine the amount of deferred tax assets that can be recognised, based on the likely timing and level of future taxable profits, together with future tax planning strategies.
Details on deferred tax assets are disclosed in Note 25.2 to the financial statements.
(x) Provisions for Liabilities and Contingencies
The Group receives legal claims against it in the normal course of business. Management has made judgements as to the likelihood of any claim succeeding in making provisions. The time of concluding legal claims is uncertain, as is the amount of possible outflow of economic benefits.
3. SUMMARY OF SIGNIFICANT ACCOUNTING POLICIES
3.1 Basis of Consolidation The Consolidated Financial
Statements comprise the Financial Statements of the Bank and its subsidiaries in terms of the Sri Lanka Accounting Standards, SLFRS 10 - Consolidated Financial Statements. The Bank’s Financial Statements comprise the amalgamation of the Financial Statements of the Domestic Banking Unit and the Off-shore Banking Unit.
Control is achieved when the Bank is exposed, or has rights, to variable returns from its involvement with the investee and has the ability to affect those returns through its power over the investee. The Group re-assesses whether or not it controls an investee if facts and circumstances indicate that there are changes to one or more of the three elements of control. Consolidation of a subsidiary begins when the Group obtains control over the subsidiary and ceases when the Group loses control of the subsidiary.
• Power over the investee (i.e., existing rights that give it the current ability to direct the relevant activities of the investee)
• Exposure or rights, to variable returns from its involvement with the investee
• The ability to use its power over the investee to affect its returns
Generally, there is a presumption that a majority of voting rights result in control. To support this presumption and when the Bank has less than a majority of the voting or similar rights of an investee, the Bank considers all relevant facts and circumstances in assessing whether it has power over an investee, including:
• The contractual arrangement with the other vote holders of the investee
• Rights arising from other contractual arrangements
• The group’s voting rights and potential voting rights
Profit or loss and each component of Other Comprehensive Income (OCI) are attributed to the equity holders of the parent of the Bank.
All intra- group assets and liabilities, equity, income, expenses and cash flows relating to transactions between members of the Group are eliminated in full on consolidation.
A change in the ownership interest of a subsidiary, without a loss of control, is accounted for as an equity transaction.
If the Group loses control over a subsidiary, it derecognizes the related assets (including goodwill), liabilities, non-controlling interest and other components of equity while any resultant gain or loss is recognized in profit or loss. Any investment retained is recognized at fair value, at the date of loss of control.
3.2 Foreign Currency Transactions and Balances
Transactions in foreign currencies are initially recorded at the spot middle rate of exchange ruling at the date of the transaction. Monetary assets and liabilities denominated in foreign currencies are retranslated into the
NOTES TO THE FINANCIAL STATEMENTS
101
NEXT GEN BANKING
functional currency at the spot middle rate of exchange at the reporting date. All differences arising on non–trading activities are taken to ‘Other Operating Income’ in the Profit or Loss.
Non–monetary items that are measured in terms of historical cost in a foreign currency are translated using the spot exchange rates as at the date of recognition.
3.3 Financial Instruments
3.3.1 Financial Instruments – Initial recognition
(i) Date of recognition Financial assets and liabilities, with
the exception of loans and advances to customers and balances due to customers, are initially recognised on the trade date, i.e., the date that the Bank becomes a party to the contractual provisions of the instrument. This includes regular way trades: purchases or sales of financial assets that require delivery of assets within the time frame generally established by regulation or convention in the market place. Loans and advances to customers are recognised when funds are transferred to the customers’ accounts. The Bank recognises balances due to customers when funds are transferred to the Bank.
(ii) Initial measurement of financial instruments
The classification of financial instruments at initial recognition depends on their contractual terms and the business model for managing the instruments, as described in Notes 3.3.2 (i) (a) and 3.3.2 (i) (b). Financial instruments are initially measured at their fair value, except in the case of financial assets and financial liabilities recorded at fair value through profit or loss (FVPL), transaction costs are added to, or subtracted from, this amount. Trade receivables are measured at the transaction price.
When the fair value of financial instruments at initial recognition differs from the transaction price, the Bank accounts for the Day 1 profit or loss, as described below.
(iii) Day 1 profit or loss When the transaction price of the
instrument differs from the fair value at origination and the fair value is based on a valuation technique using only inputs observable in market transactions, the Bank recognises the difference between the transaction price and fair value in net trading income. In those cases where fair value is based on models for which some of the inputs are not observable, the difference between the transaction price and the fair value is deferred and is only recognised in profit or loss when the inputs become observable, or when the instrument is derecognised.
(iv) Measurement categories of financial assets and liabilities
The Bank classifies all of its financial assets based on the business model for managing the assets and the assets' contractual terms, measured at either:
• Amortised cost, as explained in Note 3.3.2(i)
• Fair value through other comprehensive income (FVOCI), as explained in Notes 3.3.2 (iv) and 3.3.2 (v)
• Fair value through profit or loss (FVPL) as explained in Notes 3.3.2 (vii)
The Bank classifies and measures its derivative and trading portfolio at FVPL as explained in Notes 3.3.2 (ii) and 3.3.2 (iii). The Bank may designate financial instruments at FVPL, if so doing eliminates or significantly reduces measurement or recognition inconsistencies, as explained in Note 3.3.2 (vii).
Financial liabilities, other than loan commitments and financial guarantees, are measured at amortised cost or at FVPL when they are derivative instruments or the fair value designation is applied, as explained in Note 3.3.2 (vii).
3.3.2 Financial assets and liabilities
(i) Due from banks, loans and advances to customers, financial investments at amortised cost
The Bank measures due from banks, loans and advances to customers and other financial investments at amortised cost only if both of the following conditions are met:
• The financial asset is held within a business model with the objective to hold financial assets in order to collect contractual cash flows
• The contractual terms of the financial asset give rise on specified dates to cash flows that are solely payments of principal and interest (SPPI) on the principal amount outstanding.
The details of these conditions are outlined below.
a. Business model assessment The Bank determines its business
model at the level that best reflects how it manages groups of financial assets to achieve its business objective. The Bank's business model is not assessed on an instrument-by-instrument basis, but at a higher level of aggregated portfolios and is based on observable factors such as:
• The risks that affect the performance of the business model (and the financial assets held within that business model) and, in particular, the way those risks are managed
• How managers of the business are compensated (for example, whether the compensation is based on the

102
Nations Trust Bank PLC Annual Report 2019
fair value of the assets managed or on the contractual cash flows collected)
The expected frequency, value and timing of sales are also important aspects of the Bank’s assessment.
The business model assessment is based on reasonably expected scenarios without taking 'worst case' or 'stress case’ scenarios into account. If cash flows after initial recognition are realised in a way that is different from the Bank's original expectations, the Bank does not change the classification of the remaining financial assets held in that business model, but incorporates such information when assessing newly originated or newly purchased financial assets going forward.
b. The Solely Payment of Principal and Interest (SPPI) test
As a second step of its classification process, the Bank assesses the contractual terms of financial instruments to identify whether they meet the SPPI test.
‘Principal’ for the purpose of this test is defined as the fair value of the financial asset at initial recognition and may change over the life of the financial asset (for example, if there are repayments of principal or amortization of the premium/discount).
The most significant elements of interest within a lending arrangement are typically the consideration for the time value of money and credit risk. To make the SPPI assessment, the Bank applies judgement and considers relevant factors such as the currency in which the financial asset is denominated, and the period for which the interest rate is set.
In contrast, contractual terms that introduce a more than de minimis exposure to risks or volatility in
the contractual cash flows that are unrelated to a basic lending arrangement does not give rise to contractual cash flows that are solely payments of principal and interest on the amount outstanding. In such cases, the financial asset is required to be measured at FVPL.
(ii) Derivatives recorded at fair value through profit or loss
A derivative is a financial instrument or other contract with all three of the following characteristics:
• Its value changes in response to the change in a specified interest rate, financial instrument price, commodity price, foreign exchange rate, index of prices or rates, credit rating or credit index, or other variable, provided that, in the case of a non-financial variable, it is not specific to a party to the contract (i.e., the 'underlying').
• It requires no initial net investment or an initial net investment that is smaller than would be required for other types of contracts expected to have a similar response to changes in market factors.
• It is settled at a future date.
The Bank enters into derivative transactions with various counterparties. These include cross-currency swaps and forward foreign exchange contracts. Derivatives are recorded at fair value and carried as assets when their fair value is positive and as liabilities when their fair value is negative. The notional amount and fair value of such derivatives are disclosed separately in Note 9. Changes in the fair value of derivatives are included in net trading income.
(iii) Financial assets or financial liabilities held for trading
The Bank classifies financial assets or financial liabilities as held for trading when they have been purchased or
issued primarily for short-term profit making through trading activities or form part of a portfolio of financial instruments that are managed together, for which there is evidence of a recent pattern of short-term profit taking. Held-for-trading assets and liabilities are recorded and measured in the Statement of Financial Position at fair value. Changes in fair value are recognised in ‘Net Fair Value Gains/(Losses) from Financial Instruments at Fair Value through Profit or Loss’.
Included in this classification are debt securities that have been acquired principally for the purpose of selling or repurchasing in the near term.
(iv) Debt instruments at FVOCI The Bank classifies debt instruments
at FVOCI when both of the following conditions are met:
• The instrument is held within a business model, the objective of which is achieved by both collecting contractual cash flows and selling financial assets
• The contractual terms of the financial asset meet the SPPI test
FVOCI debt instruments are subsequently measured at fair value with gains or losses arising due to changes in fair value recognised in OCI. Interest income on debt instruments at FVOCI is recognised in Profit or Loss. The ECL calculation for Debt instruments at FVOCI is explained in Note 13. Where the Bank holds more than one investment in the same security, they are deemed to be disposed on a first–in first–out basis. On derecognition, cumulative gains or losses previously recognised in OCI are reclassified from OCI to profit or loss.
(v) Equity instruments at FVOCI Upon initial recognition, the Bank
occasionally elects to classify irrevocably some of its equity
NOTES TO THE FINANCIAL STATEMENTS

103
NEXT GEN BANKING
investments as equity instruments at FVOCI when they meet the definition of Equity under LKAS 32 Financial Instruments: Presentation and are not held for trading. Such classification is determined on an instrument-by instrument basis.
Gains or losses on these equity instruments are never recycled to Profit or Loss. Dividends are recognised in Profit or Loss as ‘other operating income’ when the right of the payment has been established, except when the Bank benefits from such proceeds as a recovery of part of the cost of the instrument, in which case, such gains are recorded in OCI. Equity instruments at FVOCI are not subject to an impairment assessment.
(vi)Debt issued and other borrowed funds
After initial measurement, debt issued and other borrowed funds are subsequently measured at amortised cost. Amortised cost is calculated by taking into account any discount or premium on issue funds, and costs that are an integral part of the EIR.
(vii)Financial assets and financial liabilities at fair value through profit or loss
Financial assets and financial liabilities in this category are those that are not held for trading and have been either designated by management upon initial recognition or are mandatorily required to be measured at fair value under SLFRS 9. Management only designates an instrument at FVPL upon initial recognition when one of the following criteria are met. Such designation is determined on an instrument-by-instrument basis:
• The designation eliminates, or significantly reduces, the inconsistent treatment that would otherwise arise from measuring the
assets or liabilities or recognising gains or losses on them on a different basis
or
• The liabilities are part of a group of financial liabilities which are managed and their performance evaluated on a fair value basis, in accordance with a documented risk management or investment strategy
or
• The liabilities contain one or more embedded derivatives, unless they do not significantly modify the cash flows that would otherwise be required by the contract, or it is clear with little or no analysis when a similar instrument is first considered that separation of the embedded derivative(s) is prohibited.
Financial assets and financial liabilities at FVPL are recorded in the Statement of Financial Position at fair value. Changes in fair value are recorded in profit or loss. Interest earned or incurred is accrued in interest income or interest expense, respectively, using the EIR, taking into account any discount/ premium and qualifying transaction costs being an integral part of instrument.
Interest earned on assets mandatorily required to be measured at FVPL is recorded using contractual interest rate. Dividend income from equity instruments measured at FVPL is recorded in profit or loss as other operating income when the right to the payment has been established.
(viii) Financial guarantees, letters of credit and undrawn loan commitments
In the ordinary course of business, the Bank issues financial guarantees, consisting of letters of credit, guarantees, bonds and acceptances.
Financial guarantees are initially recognised in the financial statements at fair value, being the premium received. Subsequent to initial recognition, the Bank’s liability under each financial guarantee is measured at the higher of the amount initially recognised less cumulative amortisation recognised in the income statement, and an ECL provision as set out in Note 24.3
The premium received is recognised in the statement of profit or loss in ‘Net fees and commission income’ on a straight line basis over the life of the guarantee.
Undrawn loan commitments and letters of credits are commitments under which, over the duration of the commitment, the Bank is required to provide a loan with pre-specified terms to the customer. Similar to financial guarantee contracts these contracts are in the scope of the ECL requirements.
The nominal contractual value of financial guarantees, letters of credit and undrawn loan commitments, where the loan agreed to be provided is on market terms, are not recorded in the Statement of Financial Position. The nominal values of these instruments together with the corresponding ECLs are disclosed in Note 47 and Note 24.3 respectively.
3.3.3 Reclassification of financial assets and liabilities
The Bank does not reclassify its financial assets subsequent to their initial recognition, apart from the exceptional circumstances in which the Bank acquires, disposes of, or terminates a business line. Financial liabilities are never reclassified.

104
Nations Trust Bank PLC Annual Report 2019
3.3.4 Derecognition of financial assets and liabilities
(i) Derecognition due to substantial modification of terms and conditions
The Bank derecognises a financial asset, such as a loan to a customer, when the terms and conditions have been renegotiated to the extent that, substantially, it becomes a new loan, with the difference recognised as a derecognition gain or loss, to the extent that an impairment loss has not already been recorded. The newly recognised loans are classified as Stage 1 for ECL measurement purposes, unless the new loan is deemed to be purchased or originated credit impaired (POCI).
When assessing whether or not to derecognise a loan to a customer, amongst others, the Bank considers the following factors:
• Change in currency of the loan
• Change in counterparty
• Introduction of an equity feature
• If the modification is such that the instrument would no longer meet the SPPI criterion
If the modification does not result in cash flows that are substantially different, the modification does not result in derecognition. Based on the change in cash flows discounted at the original EIR, the Bank records a modification gain or loss, to the extent that an impairment loss has not already been recorded. For financial liabilities, the Bank considers a modification substantial based on qualitative factors and if it results in a difference between the adjusted discounted present value and the original carrying amount of the financial liability of, or greater than, ten percent. For financial assets, this assessment is based on qualitative factors.
(ii) Derecognition other than for substantial modification
a. Financial assets A financial asset (or, where applicable,
a part of a financial asset or part of a group of similar financial assets) is derecognised when the rights to receive cash flows from the financial asset have expired. The Bank also derecognises the financial asset if it has both transferred the financial asset and the transfer qualifies for derecognition.
The Bank has transferred the financial asset if, and only if, either:
• The Bank has transferred its contractual rights to receive cash flows from the financial asset or;
• It retains the rights to the cash flows, but has assumed an obligation to pay the received cash flows in full without material delay to a third party under a ‘pass–through’ arrangement
Pass-through arrangements are transactions whereby the Bank retains the contractual rights to receive the cash flows of a financial asset (the 'original asset'), but assumes a contractual obligation to pay those cash flows to one or more entities (the 'eventual recipients'), when all of the following three conditions are met:
• The Bank has no obligation to pay amounts to the eventual recipients unless it has collected equivalent amounts from the original asset, excluding short-term advances with the right to full recovery of the amount lent plus accrued interest at market rates
• The Bank cannot sell or pledge the original asset other than as security to the eventual recipients
• The Bank has to remit any cash flows it collects on behalf of the eventual recipients without material delay
In addition, the Bank is not entitled to reinvest such cash flows, except for investments in cash or cash equivalents including interest earned, during the period between the collection date and the date of required remittance to the eventual recipients.
A transfer only qualifies for derecognition if either:
• The Bank has transferred substantially all the risks and rewards of the asset or;
• The Bank has neither transferred nor retained substantially all the risks and rewards of the asset, but has transferred control of the asset
The Bank considers control to be transferred if and only if, the transferee has the practical ability to sell the asset in its entirety to an unrelated third party and is able to exercise that ability unilaterally and without imposing additional restrictions on the transfer.
When the Bank has neither transferred nor retained substantially all the risks and rewards and has retained control of the asset, the asset continues to be recognised only to the extent of the Bank’s continuing involvement, in which case, the Bank also recognises an associated liability. The transferred asset and the associated liability are measured on a basis that reflects the rights and obligations that the Bank has retained.
Continuing involvement that takes the form of a guarantee over the transferred asset is measured at the lower of the original carrying amount of the asset and the maximum amount of consideration the Bank could be required to pay.
b. Financial liabilities A financial liability is derecognised
when the obligation under the liability
NOTES TO THE FINANCIAL STATEMENTS

105
NEXT GEN BANKING
is discharged, cancelled or expired. Where an existing financial liability is replaced by another from the same lender on substantially different terms, or the terms of an existing liability are substantially modified, such an exchange or modification is treated as a derecognition of the original liability and the recognition of a new liability. The difference between the carrying value of the original financial liability and the consideration paid is recognised in profit or loss.
3.3.5 The effective interest rate method
Under SLFRS 9, interest income is recorded using the effective interest rate (EIR) method for all financial instruments. The EIR is the rate that exactly discounts estimated future cash receipts through the expected life of the financial instrument or, when appropriate, a shorter period, to the net carrying amount of the financial asset.
The EIR (and therefore, the amortised cost of the asset) is calculated by taking into account any discount or premium on acquisition, fees and costs that are an integral part of the EIR. The Bank recognises interest income using a rate of return that represents the best estimate of a constant rate of return over the expected life of the loan. Hence, it recognises the effect of potentially different interest rates charged at various stages, and other characteristics of the product life cycle (including prepayments, penalty interest and charges).
If expectations of fixed rate financial assets’ or liabilities’ cash flows are revised for reasons other than credit risk, then changes to future contractual cash flows are discounted at the original EIR with a consequential adjustment to the carrying amount. The difference
from the previous carrying amount is booked as a positive or negative adjustment to the carrying amount of the financial asset or liability on the statement of financial position with a corresponding increase or decrease in interest income/expense calculated using the effective interest method.
For floating-rate financial instruments, periodic re-estimation of cash flows to reflect the movements in the market rates of interest also alters the effective interest rate, but when instruments were initially recognized at an amount equal to the principal, re-estimating the future interest payments do not significantly affect the carrying amount of the asset or the liability.
3.4 Impairment of Non–Financial Assets
The Group assesses at each reporting date whether there is an indication that an asset may be impaired. If any indication exists, or when annual impairment testing for an asset is required, the Group estimates the asset’s recoverable amount. An asset’s recoverable amount is the higher of an asset’s or Cash Generating Unit’s (CGU’s) fair value less costs to sell and its value in use. Where the carrying amount of an asset or CGU exceeds its recoverable amount, the asset is considered impaired and is written down to its recoverable amount.
In assessing value in use, the estimated future cash flows are discounted to their present value using a pre–tax discount rate that reflects current market assessments of the time value of money and the risks specific to the asset. In determining fair value less costs to sell, an appropriate valuation model is used. These calculations are corroborated by valuation multiples, and other available fair value indicators.
3.5 Provisions Provisions are recognized when
the Group has a present obligation (legal or constructive) as a result of a past event, and it is probable that an outflow of resources embodying economic benefits will be required to settle the obligation and a reliable estimate can be made of the amount of the obligation. The expense relating to any provision is presented in the Profit or Loss net of any reimbursement.
3.6 Fiduciary Assets The Group provides trust and other
fiduciary services that result in the holding or investing of assets on behalf of its clients. Assets held in a fiduciary capacity are not reported in the Financial Statements, as they are not the assets of the Group.
3.7 Recognition of Income and Expenses
Revenue is recognized to the extent that it is probable that the economic benefits will flow to the Group and the revenue can be reliably measured. The specific recognition criteria must for recognition of income is explained in Notes 30, 32, 33, 34 and 35.
All other expenses have been recognized in the Financial Statements as they are incurred in the period to which they relate. All expenditure incurred in the operation of the business and in maintaining the capital assets in a state of efficiency has been charged to revenue in arriving at the Group’s profit for the year.
3.8 Statement of Cash Flows The Statement of Cash Flows has
been prepared by using the ‘Direct Method’ in accordance with LKAS 7 on Statement of Cash Flows, whereby cash receipts and cash payments of operating activities, financing activities and investing activities

106
Nations Trust Bank PLC Annual Report 2019
have been recognized. Cash and cash equivalents as referred to in the statement of cash flows comprises of cash in hand, balances with the Central Bank of Sri Lanka, amounts due from banks on demand or with original maturity of three months or less net of amount due to banks.
3.9 Standards Issued but not yet Effective
Certain new accounting standards and amendments /improvements to existing standards have been published, that are not mandatory for 31 December 2019 reporting period.
• SLFRS 17: Insurance Contracts
• Amendments to SLFRS 3: Definition of a Business
• Amendments to LKAS 1 and LKAS 8: Definition of Material
The Institute of Chartered Accountants of Sri Lanka issued amendments to LKAS 1 - Presentation of Financial Statements and LKAS 8 - Accounting Policies, Changes in Accounting Estimates and Errors to align the definition of ‘Material’ across the standards and to clarify certain aspects of the definition. The new definition states that, ’Information
is material if omitting, misstating or obscuring it could reasonably be expected to influence decisions that the primary users of general purpose financial statements make on the basis of those financial statements, which provide financial information about a specific reporting entity.’
However, none of these standards and amendments will have an impact on the financial statements of the Bank /Group.
4 SEGMENT INFORMATION The Group’s segmental reporting is based on the following operating segments:Corporate Banking, Consumer and SME Banking, Leasing,
Treasury functions, Investment Banking, Insurance Broking and Property Management.
For management purposes, the Group is organised into operating segments based on customer segments and products , as follows:
Corporate Banking: Primary focus of business is providing loans and other credit facilities and mobilizing deposit and current accounts from top to mid tier corporate and institutional customers.
Consumer and SME Banking: Primary focus of business is deposit mobilization from high networth, mass affluent and emerging mass customer segments and providing personal financing including personal, home loans and credit card facilities and providing business financing for small and medium customer segment including lending facilities and transactional banking.
Leasing : Primary focus of business is providing finance leases and hire purchase facilities.
Treasury Function: Primary focus of business operations includes foreign exchange trading, fixed income security trading, assets & liabilities management.
Investment Banking: Primary focus on margin trading, money market operations and fund and fee based activities.
Insurance Broking: Primary focus on insurance broking.
Property Management: Primary focus on renting out premises.
Management monitors the operating results of its business units separately for the purpose of making decisions on resource allocation and performance assessment. Segment performance is evaluated based on operating profits or losses which, are measured differently from operating profits or losses in the consolidated financial statements. A fund transfer pricing mechanism is adopted for sourcing and utilizing of funds.
The following table presents income and expenses and certain asset and liability information regarding the Group’s operating segments.
NOTES TO THE FINANCIAL STATEMENTS

107
NEXT GEN BANKING 4.
1 Op
erat
ing S
egm
ents
For t
he Y
ear E
nded
31
Dece
mbe
r 201
9 LK
R '00
0 C
orpo
rate
Ba
nking
Cons
umer
&
SME B
ankin
gLe
asing
Treas
ury
Func
tions
Inve
stmen
t Ba
nking
Insu
ranc
e Br
oker
ing
Pro
perty
M
anag
emen
tUn
alloc
ated/
El
imina
tions
Total
Grou
p
Oper
ating
Inco
me
3,37
6,728
13
,716,2
88
2,34
8,882
3,
209,3
07
11,08
4 25
7,099
17
6,126
(5
43,37
9) 22
,552,1
35
Impa
irmen
t Cha
rges
(2
73,17
0) (2
,386,0
19)
(623
,150)
(71,3
00)
-
(6,52
1) -
59
,606
(3,30
0,554
)Ne
t Ope
ratin
g Inc
ome
3,10
3,558
11
,330,2
69
1,725
,732
3,13
8,007
11
,084
250,5
78
176,1
26
(483
,773)
19,25
1,581
Extra
cts of
Resu
ltsInt
erest
Incom
e 8,
163,7
78
16,82
8,271
7,
152,3
92
7,41
6,831
9,
080
20,85
1 29
,441
(49,1
13)
39,57
1,531
Int
er Se
gmen
t (4
,750,4
29)
7,59
5,343
(5
,381,3
95)
2,53
6,481
-
-
-
-
-
Int
erest
Expe
nse
(804
,185)
(16,6
92,46
0) -
(5
,827,1
99)
-
(935
) (1
,421)
(110,8
59)
(23,4
37,05
9)Ne
t Inter
est In
come
2,60
9,164
7,
731,1
54
1,770
,997
4,12
6,113
9,
080
19,91
6 28
,020
(159
,972)
16,13
4,472
Fees
and C
ommi
ssion
Inco
me 58
4,526
5,
383,9
11 41
9,102
97
,814
2,63
9 24
4,168
14
8,106
(3
98,43
0) 6,
481,8
36
Fees
and C
ommi
ssion
Expe
nse
(23,1
17)
(274
,399)
-
(27,5
91)
(635
) (6
,985)
-
7,62
1 (3
25,10
6)Ne
t Fee
s and
Comm
ission
Inco
me 56
1,409
5,
109,5
12
419,1
02
70,22
3 2,
004
237,1
83
148,1
06
(390
,809)
6,15
6,730
Net G
ain/(L
oss)
from
Tradin
g 20
6,155
38
2,258
-
(1
,904,0
71) -
-
-
-
(1
,315,6
58)
Net F
air Va
lue Ga
ins/(L
osse
s) Fr
om Fi
nanc
ial In
strum
ents
at Fa
ir Valu
e Thr
ough
Profi
t or L
oss
-
-
-
11,03
0 -
-
-
-
11
,030
Net O
ther O
perat
ing In
come
/(Los
s) -
49
3,364
15
8,783
90
6,012
-
-
-
7,
402
1,565
,561
Depr
eciat
ion of
Prop
erty,P
lant a
nd Eq
uipme
nt (2
5,007
) (4
63,45
1) (2
1,191
) (2
0,500
) -
(1
3,587
) (6
,585)
77,99
8 (4
72,32
3)De
prec
iation
of Ri
ght o
f Use
(ROU
) Asse
ts -
(3
70,81
2) -
-
-
(5
,295)
-
(10,66
2) (3
86,76
9)Am
ortiz
ation
of In
tangib
le As
sets
(31,2
35)
(257
,175)
(26,5
26)
(31,1
62)
-
(1,89
8) (5
79)
-
(348
,575)
Profi
t befo
re In
come
Tax
2,40
8,202
2,
113,18
3 78
5,483
2,
689,2
58
9,12
9 19
3,790
13
8,896
(2
,554,8
62)
5,78
3,079
Inc
ome T
ax Ex
pens
e -
-
-
-
(2
,892)
(58,0
76)
(11,21
0) (1
,997,3
62)
(2,06
9,540
)Pr
ofit f
or th
e Yea
r 2,
408,2
02
2,113
,183
785,4
83
2,68
9,258
6,
237
135,7
14
127,6
86
(4,55
2,224
) 3,
713,53
9
Capit
al Ex
pend
iture
sPr
opert
y,Plan
t and
Equip
ment
29,06
6 22
8,018
14
,440
755
-
-
5,72
3 15
4,982
43
2,984
Int
angib
le As
sets
169,7
11 38
,656
4,911
4,
472
-
-
-
107,4
37
325,1
87
Total
Asse
ts (as
at)
75,62
6,503
11
4,121
,828
44,29
2,078
89
,048,5
77
121,1
93
357,3
72
906,1
42
895,7
62
325,3
69,45
5
Total
Liab
ilities
(as a
t) 17
,636,1
08
208,7
31,71
3 66
3,792
60
,183,6
62
3,53
1 42
,240
19,85
0 6,
692,9
13
293,9
73,80
9

108
Nations Trust Bank PLC Annual Report 2019
4 SE
GMEN
T IN
FORM
ATIO
N (C
ON
TD.)
4.2
Oper
atin
g Seg
men
ts
For t
he Y
ear E
nded
31
Dece
mbe
r 201
8 LK
R '00
0 C
orpo
rate
Ba
nking
Cons
umer
&
SME B
ankin
gLe
asing
Treas
ury
Func
tions
Inve
stmen
t Ba
nking
Insu
ranc
e Br
oker
ing
Pro
perty
M
anag
emen
tUn
alloc
ated/
El
imina
tions
Total
Grou
p
Oper
ating
Inco
me
2,67
9,721
13
,675,2
09
2,32
1,815
2,
298,1
31
21,80
0 23
7,290
17
1,475
(9
5,855
) 21
,309,5
86
Impa
irmen
t Cha
rges
(1
29,18
6) (2
,900,0
50)
(232
,432)
(11,03
9) -
(1
,329)
-
-
(3,27
4,036
)Ne
t Ope
ratin
g Inc
ome
2,55
0,535
10
,775,1
59
2,08
9,383
2,
287,0
92
21,80
0 23
5,961
17
1,475
(9
5,855
) 18
,035,5
50
Extra
cts of
Resu
ltsInt
erest
Incom
e 6,
487,3
38
17,79
1,230
6,
319,1
26
6,56
0,825
21
,101
10,15
8 24
,645
(164
,014)
37,05
0,409
Int
er Se
gmen
t (3
,621,2
65)
5,94
7,607
(4
,649,5
84)
2,32
3,242
-
-
-
-
-
Int
erest
Expe
nse
(886
,136)
(15,3
90,43
9) -
(5
,751,2
49)
(798
) -
(9
91)
143,1
11 (2
1,886
,502)
Net In
teres
t Inco
me 1,9
79,93
7 8,
348,3
98
1,669
,542
3,13
2,818
20
,303
10,15
8 23
,654
(20,9
03)
15,16
3,907
Fees
and C
ommi
ssion
Inco
me 50
3,025
4,
973,6
25
447,9
74
95,00
9 2,
475
234,2
00
147,8
21
(97,8
95)
6,30
6,234
Fe
es an
d Com
missi
on Ex
pens
e (2
3,451
) (2
07,38
2) -
(2
1,223
) (9
78)
(7,06
8) -
(5
,247)
(265
,349)
Net F
ees a
nd Co
mmiss
ion In
come
479,5
74
4,76
6,243
44
7,974
73
,786
1,497
22
7,132
14
7,821
(10
3,142
) 6,
040,8
85
Net G
ain/(L
oss)
from
Tradin
g 22
0,210
36
3,008
-
2,
195,2
02
-
-
-
-
2,77
8,420
Ne
t Fair
Value
Gains
/(Los
ses)
From
Fina
ncial
Instr
umen
ts at
Fair V
alue T
hrou
gh Pr
ofit o
r Los
s -
-
-
(3
,758)
-
-
-
-
(3,75
8)
Net O
ther O
perat
ing In
come
/(Los
s) -
19
7,560
20
4,299
(3
,099,9
17)
-
-
-
28,19
0 (2
,669,8
68)
Depr
eciat
ion of
Prop
erty,P
lant a
nd Eq
uipme
nt (2
,177)
(201
,326)
(5,68
2) (8
,610)
-
(972
) (2
7,327
) (1
49,64
2) (3
95,73
6)De
prec
iation
of Ri
ght o
f Use
(ROU
) Asse
ts -
-
-
-
-
-
-
-
-
Am
ortiz
ation
of In
tangib
le As
sets
(77)
(66,9
79)
(2,27
7) (2
2,973
) -
(3
,215)
-
(210
,427)
(305
,948)
Profi
t befo
re In
come
Tax
1,954
,526
3,05
6,638
1,1
75,68
3 1,8
66,22
7 19
,530
194,4
45
127,2
26
(2,53
4,974
) 5,
859,3
01
Incom
e Tax
Expe
nse
-
-
-
-
(5,56
0) (5
4,445
) (10
,234)
(2,08
7,179
) (2
,157,4
18)
Profi
t for
the Y
ear
1,954
,526
3,05
6,638
1,1
75,68
3 1,8
66,22
7 13
,970
140,0
00
116,9
92
(4,62
2,153
) 3,
701,8
83
Capit
al Ex
pend
iture
sPr
opert
y,Plan
t and
Equip
ment
969
143,8
45
4,50
2 -
-
26
4 49
,216
506,7
75
705,5
71
Intan
gible
Asse
ts -
26
,521
29,95
1 -
-
-
-
33
3,932
39
0,404
Total
Asse
ts (as
at)
65,67
1,447
11
5,991
,379
44,97
4,997
92
,994,6
84
117,1
13
206,4
11 79
8,116
4,
261,8
46
325,0
15,99
3
Total
Liab
ilities
(as a
t) 20
,564,3
10
197,5
80,90
0 79
2,099
69
,212,1
55
5,68
8 40
,338
28,01
8 9,
733,7
75
297,9
57,28
3
*C
onsu
mer
and
SME
bank
ing
oper
atio
ns ar
e rev
iewe
d on
cons
olid
ated
bas
is.
NOTES TO THE FINANCIAL STATEMENTS

109
NEXT GEN BANKING
5 ANALYSIS OF FINANCIAL INSTRUMENTS BY MEASUREMENT BASIS
5.1 Bank
As at 31 December 2019 2018AC FVPL FVOCI Total AC FVPL FVOCI Total
LKR'000 LKR'000 LKR'000 LKR'000 LKR'000 LKR'000 LKR'000 LKR'000
AssetsCash and Cash Equivalents 8,755,848 - - 8,755,848 6,437,519 - - 6,437,519Balances with Central Bank of Sri Lanka 8,377,478 - - 8,377,478 12,762,122 - - 12,762,122Reverse Repurchase Agreements 13,827,423 - - 13,827,423 180,593 - - 180,593Derivative Financial Instruments - 192,714 - 192,714 - 2,403,787 - 2,403,787Financial Assets at Amortised Cost - Loans and Advances 226,791,569 - - 226,791,569 221,500,656 - - 221,500,656Government Securities 17,774,485 634,075 38,301,267 56,709,827 14,094,927 668,812 57,449,857 72,213,596Other Debt Instruments 1,288,120 - - 1,288,120 1,846,320 - - 1,846,320Equity Instruments - - 13,880 13,880 - - 13,974 13,974Total Financial Assets 276,814,923 826,789 38,315,147 315,956,859 256,822,137 3,072,599 57,463,831 317,358,567
LiabilitiesDue to Banks 6,484,157 - - 6,484,157 18,474,545 - - 18,474,545Derivative Financial Instruments - 311,971 - 311,971 - 484,373 - 484,373Due to Depositors 226,880,034 - - 226,880,034 231,936,769 - - 231,936,769Repurchase Agreements 11,033,047 - - 11,033,047 7,784,017 - - 7,784,017Due to Other Borrowers 27,380,678 - - 27,380,678 20,248,816 - - 20,248,816Debt Securities Issued 13,263,434 - - 13,263,434 8,745,611 - - 8,745,611Total Financial Liabilities 285,041,350 311,971 - 285,353,321 287,189,758 484,373 - 287,674,131

110
Nations Trust Bank PLC Annual Report 2019
5 ANALYSIS OF FINANCIAL INSTRUMENTS BY MEASUREMENT BASIS (CONTD.)
5.2 Group
As at 31 December 2019 2018AC FVPL FVOCI Total AC FVPL FVOCI Total
LKR '000 LKR '000 LKR '000 LKR '000 LKR'000 LKR'000 LKR'000 LKR'000
AssetsCash and Cash Equivalents 8,755,930 - - 8,755,930 6,437,573 - - 6,437,573Balances with Central Bank of Sri Lanka 8,377,478 - - 8,377,478 12,762,122 - - 12,762,122Reverse Repurchase Agreements 13,827,423 - - 13,827,423 180,593 - - 180,593Derivative Financial Instruments - 192,714 - 192,714 - 2,403,787 - 2,403,787Financial Assets at Amortised Cost - Loans and Advances 226,794,190 - - 226,794,190 221,505,692 - - 221,505,692Government Securities 17,774,485 634,075 38,301,267 56,709,827 14,094,927 668,812 57,449,857 72,213,596Other Debt Instruments 1,288,120 - - 1,288,120 1,846,320 - - 1,846,320Equity Instruments - - 13,880 13,880 - - 13,974 13,974Total Financial Assets 276,817,626 826,789 38,315,147 315,959,562 256,827,227 3,072,599 57,463,831 317,363,657
LiabilitiesDue to Banks 6,484,157 - - 6,484,157 18,474,545 - - 18,474,545Derivative Financial Instruments - 311,971 - 311,971 - 484,373 - 484,373Due to Depositors 226,871,563 - - 226,871,563 231,462,599 - - 231,462,599Repurchase Agreements 10,186,828 - - 10,186,828 7,681,669 - - 7,681,669Due to Other Borrowers 27,284,828 - - 27,284,828 20,248,816 - - 20,248,816Debt Securities Issued 13,263,434 - - 13,263,434 8,745,611 - - 8,745,611Total Financial Liabilities 284,090,810 311,971 - 284,402,781 286,613,240 484,373 - 287,097,613
AC – Financial assets/liabilities measured at amortised cost
FVPL – Financial assets/liabilities measured at fair value through profit or loss
FVOCI – Financial assets measured at fair value through other comprehensive income
6 CASH AND CASH EQUIVALENTS
Bank GroupAs at 31 December 2019 2018 2019 2018
LKR'000 LKR'000 LKR'000 LKR'000
Cash in Hand 5,867,701 5,419,519 5,867,724 5,419,542Balances with Banks 787,329 1,018,271 787,388 1,018,302Money at Call and Short Notice 2,101,864 - 2,101,864 - Less: Impairment for Balances with Banks (Note 6.1) (1,046) (271) (1,046) (271)
8,755,848 6,437,519 8,755,930 6,437,573
NOTES TO THE FINANCIAL STATEMENTS

111
NEXT GEN BANKING
6.1 Movement in impairment during the year
Bank / Group2019 2018
LKR'000 LKR'000
Balance as at 01 January 271 - Impact of first time adoption of SLFRS 9 - 228Charge / (Write back) to the income statement (Note 36) 775 43Balance as at 31 December 1,046 271
7 BALANCES WITH CENTRAL BANK OF SRI LANKA
Bank / GroupAs at 31 December 2019 2018
LKR'000 LKR'000
Statutory Balance with Central Bank of Sri Lanka 8,220,448 12,634,094Non Statutory Balance with Central Bank of Sri Lanka 157,030 128,028
8,377,478 12,762,122
As required by the provisions of section 93 of the Monetary Law Act, a cash balance is required to be maintained with the Central Bank of Sri Lanka.
As at 31 December 2019, the minimum cash reserve requirement was 5.0% (2018: 6.0%) of the rupee deposit liabilities other than margin deposits against letters of credit of Domestic Banking Unit. The minimum cash reserve requirement for margin deposits against letters of credit of Domestic Banking Unit was at 5.0% (2018 - 100%). There is no reserve requirement for foreign currency deposit liabilities in Domestic Banking Unit and the deposit liabilities in Foreign Currency Banking Unit.
8 TRANSFERRED FINANCIAL ASSETS
Reverse Repurchase/Repurchase Agreements
Accounting Policy During its normal course of business, the Bank sells securities under agreements to repurchase (repos) and purchase securities under
agreements to resell (reverse repos). The accounting treatment of these transactions is explained below;
Securities sold under agreements to repurchase at a specified future date are not derecognized from the Statement of Financial Position as the Group retains substantially all of the risks and rewards of ownership. The corresponding cash received is recognized in the Statement of Financial Position as an asset with a corresponding obligation to return it, including accrued interest as a liability within ‘Repurchase Agreements’, reflecting the transaction’s economic substance as a loan to the Group. The difference between the sale and repurchase price is treated as interest expense and is accrued over the life of agreement using the EIR.
Conversely, securities purchased under agreements to resell at a specified future date are not recognized in the Statement of Financial Position. The consideration paid, including accrued interest, is recorded in the Statement of Financial Position, within ‘Reverse Repurchase Agreements’, reflecting the transaction’s economic substance as a loan by the Group. The difference between the purchase and resale price is treated as interest income and is accrued over the life of the agreement using the EIR.

112
Nations Trust Bank PLC Annual Report 2019
8 TRANSFERRED FINANCIAL ASSETS (CONTD.)
8.1 Reverse Repurchase Agreements
Bank / GroupAs at 31 December 2019 2018
LKR'000 LKR'000
Due from;- Banks 11,404,692 172,043- Other Financial Institutions 2,402,319 - - Other Counterparties 20,412 8,550
13,827,423 180,593
The Group holds collateral against reverse repurchase agreements and is permitted to sell or repledge the collateral in case of a default by the owner of the collateral. The fair value of collateral held under reverse repurchase agreements by the Bank/Group amounts to LKR 15,264.31 Mn (2018 – LKR 199.25 Mn).
8.2 Repurchase Agreements
Bank GroupAs at 31 December 2019 2018 2019 2018
LKR'000 LKR'000 LKR'000 LKR'000
On Government SecuritiesDue to;- Banks (Note 19) - 8,509,788 - 8,509,788- Other Financial Institutions 4,158,372 - 4,158,372 - - Other Counterparties 5,648,501 6,545,752 5,535,912 6,545,752
9,806,873 15,055,540 9,694,284 15,055,540On Other SecuritiesDue to;- Other Counterparties 1,226,174 1,238,265 492,544 1,135,917
1,226,174 1,238,265 492,544 1,135,917Total Repurchase Agreements 11,033,047 16,293,805 10,186,828 16,191,457
Repurchase Agreements - Other than with banks (Note 20) 11,033,047 7,784,017 10,186,828 7,681,669
9 DERIVATIVE FINANCIAL INSTRUMENTS The below table shows the fair values of derivative financial instruments recorded as assets or liabilities, together with their notional (contract)
amounts. Settlement of these contracts against customer is on delivery against payment basis which eliminates credit risks. Settlements against the Bank is on a gross basis subject to approved credit limits.
The notional amounts that indicate the volume of transactions outstanding at the year-end are indicative of neither the market risk nor the credit risk. This transaction type is exposed to market risks due to fluctuation of market rates. The Bank may take positions with the expectation of gaining from favorable movements in rates.
Derivatives entered for risk management purposes that do not meet the hedge accounting criteria are also included under this classification.
NOTES TO THE FINANCIAL STATEMENTS

113
NEXT GEN BANKING
9.1 Derivative Assets - Held for Trading
At a Gain Position
Bank / Group Bank / Group
Fair Value of Assets
Contract Amount
Fair Value of Assets
Contract Amount
As at 31 December 2019 2019 2018 2018
LKR'000 LKR'000 LKR'000 LKR'000
Foreign Currency Derivatives
- Currency Swaps 178,201 12,299,561 1,877,602 28,034,941
- Forward Foreign Exchange Contracts 13,822 2,612,557 526,067 7,024,177
- Spot Contracts 691 343,896 118 48,350
192,714 15,256,014 2,403,787 35,107,468
9.2 Derivative Liabilities - Held for Trading
At a Loss Position
Bank / Group Bank / Group
Fair Value of Liabilities
Contract Amount
Fair Value of Liabilities
Contract Amount
As at 31 December 2019 2019 2018 2018
LKR'000 LKR'000 LKR'000 LKR'000
Foreign Currency Derivatives
- Currency Swaps 237,796 19,500,226 410,848 7,941,038
- Forward Foreign Exchange Contracts 74,132 3,874,695 73,416 1,884,900
- Spot Contracts 43 100,836 109 113,819
311,971 23,475,757 484,373 9,939,757
10 FINANCIAL ASSETS - RECOGNISED THROUGH PROFIT OR LOSS
Bank / Group
As at 31 December 2019 2018
LKR'000 LKR'000
Measured at Fair Value
- Government Treasury Bills 12,731 -
- Government Treasury Bonds 621,344 668,812
634,075 668,812
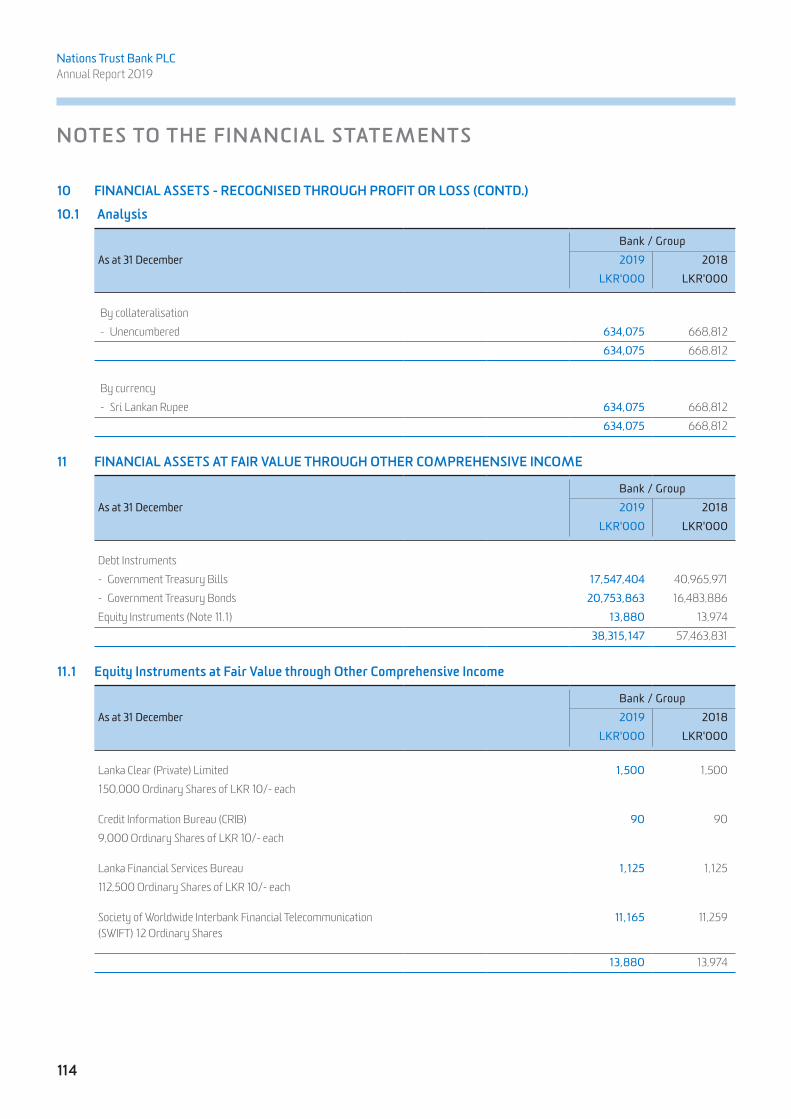
114
Nations Trust Bank PLC Annual Report 2019
10 FINANCIAL ASSETS - RECOGNISED THROUGH PROFIT OR LOSS (CONTD.)
10.1 Analysis
Bank / GroupAs at 31 December 2019 2018
LKR'000 LKR'000
By collateralisation - Unencumbered 634,075 668,812
634,075 668,812
By currency - Sri Lankan Rupee 634,075 668,812
634,075 668,812
11 FINANCIAL ASSETS AT FAIR VALUE THROUGH OTHER COMPREHENSIVE INCOME
Bank / GroupAs at 31 December 2019 2018
LKR'000 LKR'000
Debt Instruments- Government Treasury Bills 17,547,404 40,965,971- Government Treasury Bonds 20,753,863 16,483,886Equity Instruments (Note 11.1) 13,880 13,974
38,315,147 57,463,831
11.1 Equity Instruments at Fair Value through Other Comprehensive Income
Bank / GroupAs at 31 December 2019 2018
LKR'000 LKR'000
Lanka Clear (Private) Limited 1,500 1,500150,000 Ordinary Shares of LKR 10/- each
Credit Information Bureau (CRIB) 90 909,000 Ordinary Shares of LKR 10/- each
Lanka Financial Services Bureau 1,125 1,125112,500 Ordinary Shares of LKR 10/- each
Society of Worldwide Interbank Financial Telecommunication (SWIFT) 12 Ordinary Shares
11,165 11,259
13,880 13,974
NOTES TO THE FINANCIAL STATEMENTS

115
NEXT GEN BANKING
11.2 Analysis
Bank / GroupAs at 31 December 2019 2018
LKR'000 LKR'000
By collateralisation - Pledged as collateral 2,455,842 11,104,972- Unencumbered 35,859,305 46,358,859
38,315,147 57,463,831
By currency - Sri Lankan Rupee 38,303,982 57,452,572- United States Dollar 11,165 11,259
38,315,147 57,463,831
12 FINANCIAL ASSETS AT AMORTISED COST - DEBT INSTRUMENTS
Bank / GroupAs at 31 December 2019 2018
LKR'000 LKR'000
Government Treasury Bonds 13,559,215 10,208,370Sri Lanka Development Bonds 4,247,098 3,914,439Quoted Debentures (Note 12.1) 1,288,418 1,888,957Less:Impairment (Note 12.3) (32,125) (70,519)
19,062,606 15,941,247
12.1 Quoted Debentures
Company Type No of Debentures LKR '0002019 2018 2019 2018
Hemas Holdings PLC Unsecured, Redeemable Debentures - 223,900 - 23,011Lion Brewery (Ceylon) PLC Unsecured, Redeemable Debentures - 1,686,000 - 171,960Seylan Bank PLC Unsecured, Redeemable Debentures - 3,000,000 - 300,636DFCC Vardhana Bank Unsecured, Redeemable Debentures 1,988,600 1,988,600 209,024 209,024MTD Walkers PLC Unsecured, Redeemable Debentures - 1,019,134 - 104,932Housing and Development Finance Corporation
Unsecured, Redeemable Debentures 2,500,000 2,500,000 253,012 253,012
Access Engineering PLC Unsecured, Redeemable Debentures 3,500,000 3,500,000 354,226 354,226Sanasa Development Bank PLC Guaranteed, Redeemable Debentures 1,000,000 1,000,000 105,192 105,192Senkadagala Finance PLC Unsecured, Redeemable Debentures 611,500 611,500 62,345 62,345People's Leasing & Finance PLC Unsecured, Redeemable Debentures 3,000,000 3,000,000 304,619 304,619
1,288,418 1,888,957

116
Nations Trust Bank PLC Annual Report 2019
12 FINANCIAL ASSETS AT AMORTISED COST - DEBT INSTRUMENTS (CONTD.)
12.2 Analysis
Bank/ GroupAs at 31 December 2019 2018
LKR'000 LKR'000
By collateralisation - Pledged as collateral 9,060,317 5,886,719 - Unencumbered 10,002,289 10,054,528
19,062,606 15,941,247
By currency - Sri Lankan Rupee 14,847,335 12,026,808 - United States Dollar 4,215,271 3,914,439
19,062,606 15,941,247
12.3 Movement in impairment during the year
Bank/ Group2019 2018
LKR'000 LKR'000
Stage 1Balance as at 01 January 28,146 - Impact of first time adoption of SLFRS 9 - 20,785Charge/(Write back) to income statement (Note 36) 3,979 7,361Write-off during the year - - Balance as at 31 December 32,125 28,146
Stage 2Balance as at 01 January - - Impact of first time adoption of SLFRS 9 - - Charge/(Write back) to income statement - - Write-off during the year - - Balance as at 31 December - -
Stage 3Balance as at 01 January 42,373 - Impact of first time adoption of SLFRS 9 - - Charge/(Write back) to income statement (Note 36) - 42,373Write-off during the year - - Transfer to loans and advances to customers (Note 13.4) (42,373) - Balance as at 31 December - 42,373
Total impairment provision 32,125 70,519
NOTES TO THE FINANCIAL STATEMENTS

117
NEXT GEN BANKING
13 FINANCIAL ASSETS AT AMORTISED COST – LOANS AND ADVANCES
Accounting Policy
(i) Overview of the Expected Credit Loss (ECL) principles The Bank records an allowance for ECL for all loans and other debt financial assets not held at FVPL, together with loan commitments and
financial guarantee contracts, in this section all referred to as ‘Financial Instruments’. Equity instruments are not subject to impairment under SLFRS 9.
The ECL allowance is based on the credit losses expected to arise over the life of the asset (the lifetime expected credit loss or LTECL), unless there has been no significant increase in credit risk since origination, in which case, the allowance is based on the 12 months’ expected credit loss (12mECL) as outlined in Note 13 (ii). The Bank’s policies for determining if there has been a significant increase in credit risk are set out in Note 47.
The 12mECL is the portion of LTECLs that represents the ECL that results from default events on a financial instrument that are possible within the 12 months after the reporting date.
Both LTECL and 12mECL are calculated on either an individual basis or a collective basis, depending on the nature of the underlying portfolio of financial instruments. The Bank’s policy for grouping financial assets measured on a collective basis is explained in Note 47.
The Bank has established a policy to perform an assessment, at the end of each reporting period, of whether a financial instruments' credit risk has increased significantly since initial recognition, by considering the change in the risk of default occurring over the remaining life of the financial instrument. This is further explained in Note 47.
Based on the above process, the Bank groups its loans into Stage 1, Stage 2, Stage 3 and Purchased or Originated Credit Impaired (POCI), as described below:
• Stage 1: When loans are first recognised, the Bank recognises an allowance based on 12mECL. Stage 1 loans also include facilities where the credit risk has improved and the loan has been reclassified from Stage 2.
• Stage 2: When a loan has shown a significant increase in credit risk since origination, the Bank records an allowance for the LTECL. Stage 2 loans also include facilities, where the credit risk has improved and the loan has been reclassified from Stage 3.
• Stage 3: Loans considered credit-impaired (as outlined in Note 47). The bank records an allowance for the LTECL.
• POCI: POCI assets are financial assets that are credit impaired on initial recognition. POCI assets are recorded at fair value at original recognition and interest income is subsequently recognised based on a credit-adjusted EIR. The ECL allowance is only recognised or released to the extent that there is a subsequent change in the expected credit losses.
For financial assets for which the Bank has no reasonable expectations of recovering either the entire outstanding amount, or a proportion thereof, the gross carrying amount of the financial asset is reduced. This is considered a (partial) derecognition of the financial asset.
(ii) The calculation of ECL The Bank calculates ECLs based on a three probability-weighted scenarios to measure the expected cash shortfalls, discounted at an
approximation to the EIR. A cash shortfall is the difference between the cash flows that are due to an entity in accordance with the contract and the cash flows that the entity expects to receive.
The mechanics of the ECL calculations are outlined below and the key elements are as follows:
• Probability of Default (PD); The PD an estimate of the likelihood of default over a given time horizon. A default may only happen at a certain time over the assessed period, if the facility has not been previously derecognised and is still in the portfolio. The concept of PDs is further explained in Note 47.

118
Nations Trust Bank PLC Annual Report 2019
13 FINANCIAL ASSETS AT AMORTISED COST – LOANS AND ADVANCES (CONTD.)• Exposure at Default (EAD): The EAD is an estimate of the exposure at a future default date, taking into account expected changes in the
exposure after the reporting date, including repayments of principal and interest, whether scheduled by contract or otherwise, expected drawdowns on committed facilities, and accrued interest from missed payments. The EAD is further explained in Note 47.
• Loss Given Default (LGD): The LGD is an estimate of the loss arising in the case where a default occurs at a given time. It is based on the difference between the contractual cash flows due and those that the lender would expect to receive, including from the realisation of any collateral. It is usually expressed as a percentage of the EAD. The LGD is further explained in Note 47.
When estimating the ECLs, the Bank considers three scenarios (a base case, a best case, a worst case). When relevant, the assessment of multiple scenarios also incorporates how defaulted loans are expected to be recovered, including the probability that the loans will cure and the value of collateral or the amount that might be received for selling the asset.
With the exception of credit cards and other revolving facilities, for which the treatment is separately set out in Note 13 (V), the maximum period for which the credit losses are determined is the contractual life of a financial instrument unless the Bank has the legal right to call it earlier.
Impairment losses and releases are accounted for and disclosed separately from modification losses or gains that are accounted for as an adjustment of the financial asset’s gross carrying value.
Provisions for ECL for undrawn loan commitments are assessed as set out in Note 24.3. The calculation of ECLs (including the ECLs related to the undrawn element) of revolving facilities such as credit cards are explained in Note 13(V).
The mechanics of the ECL method are summarised below:
• Stage 1: The 12mECL is calculated as the portion of LTECLs that represents the ECL that results from default events on a financial instrument that are possible within the 12 months after the reporting date. The Bank calculates the 12mECL allowance based on the expectation of a default occurring in the 12 months following the reporting date. These expected 12-month default probabilities are applied to a forecast EAD and multiplied by the expected LGD and discounted by an approximation to the original EIR. This calculation is made for each of the three scenarios, as explained above.
• Stage 2: When a loan has shown a significant increase in credit risk since origination, the Bank records an allowance for the LTECLs. The mechanics are similar to those explained above, including the use of multiple scenarios, but PDs and LGDs are estimated over the lifetime of the instrument. The expected cash shortfalls are discounted by an approximation to the original EIR.
• Stage 3: For loans considered credit-impaired (as defined in Note 47) the Bankrecognises the lifetime expected credit losses for these loans. The method is similar to that for Stage 2 assets, with the PD set at 100%.
• POCI: POCI assets are financial assets that are credit impaired on initial recognition. The Bank only recognises the cumulative changes in lifetime ECLs since initial recognition, discounted by the credit adjusted EIR.
• Loan commitments and letters of credit:
When estimating LTECLs for undrawn loan commitments, the Bank estimates the expected portion of the loan commitment that will be drawn down over its expected life. The ECL is then based on the present value of the expected shortfalls in cash flows if the loan is drawn down. The expected cash shortfalls are discounted at an approximation to the expected EIR on the loan. For credit cards and revolving facilities that include both a loan and an undrawn commitment, the portion of ECLs related to the drawn amount are calculated and presented together with the loan. For undrawn loan commitments and letters of credit, the ECL is recognised within Other Liabilities.
• Financial guarantee contracts:
The Bank’s liability under each guarantee is measured at the higher of the amount initially recognised less cumulative amortisation recognised in the income statement, and the ECL provision. For this purpose, the Bank estimates ECLs based on the present value of the expected payments to reimburse the holder for a credit loss that it incurs by using Credit Conversion Factors (CCF) specified by the Central Bank of Sri Lanka for the purpose of calculating Capital Adequacy Ratio of the Bank. The shortfalls are discounted by the risk-adjusted interest rate relevant to the exposure. The calculation is made using a probability-weighting of the three scenarios. The ECL related to financial guarantee contracts are recognised within Other Liabilities.
NOTES TO THE FINANCIAL STATEMENTS

119
NEXT GEN BANKING
(iii) Debt instruments measured at fair value through OCI The ECL for debt instruments measured at FVOCI do not reduce the carrying amount of these financial assets in the Statement of Financial
Position, which remains at fair value. Instead, an amount equal to the allowance that would arise if the assets were measured at amortised cost is recognised in OCI as an accumulated impairment amount, with a corresponding charge to profit or loss. The accumulated loss recognised in OCI is recycled to the profit and loss upon derecognition of the assets.
(iv) Purchased or originated credit impaired financial assets (POCI) For POCI financial assets, the Bank only recognises the cumulative changes in LTECL since initial recognition in the loss allowance.
(v) Credit cards and other revolving facilities The Bank’s product offering includes a variety of corporate and retail overdraft and credit card facilities, in which the Bank has the right to
cancel and/or reduce the facilities with a notice. Revolving facilities are subject to regular post disbursement reviews and every such facility goes through one or more formal reviews annually. Therefore, all revolving facilities are assessed for 12mECL.
The ongoing assessment of whether a significant increase in credit risk has occurred for revolving facilities is similar to other lending products. This is mainly based on shifts in the delinquency level of the customer with a consideration given to qualitative factors such as changes in usage also.
The interest rate used to discount the ECL for credit cards is based on the average effective interest rate that is expected to be charged over the expected period of exposure to the facilities.
The calculation of ECL, including the estimation of the expected period of exposure and discount rate is made, as explained in Note 47, on an individual basis for corporate and on a collective basis for retail products.
The collective assessments are made separately for portfolios of facilities with similar credit risk characteristics.
(vi) Forward looking information In its ECL models, the Bank relies on a broad range of forward looking information as economic inputs, such as:
• GDP growth
• Inflation
• Interest rates
• Exchange rates
• Unemployment rates
The inputs and models used for calculating ECLs may not always capture all characteristics of the market at the date of the financial statements. To reflect this, qualitative adjustments or overlays are occasionally made as temporary adjustments when such differences are significantly material. Detailed information about these inputs and sensitivity analysis are provided in Note 36.

120
Nations Trust Bank PLC Annual Report 2019
13 FINANCIAL ASSETS AT AMORTISED COST – LOANS AND ADVANCES (CONTD.)
(vii) Collateral valuation To mitigate its credit risks on financial assets, the Bank seeks to use collateral, where possible. The collateral comes in various forms, such as
cash, securities, letters of credit/guarantees, real estate, receivables, inventories, other non-financial assets and credit enhancements. The Bank’s accounting policy for collateral assigned to it through its lending arrangements under SLFRS 9 is the same as it was under LKAS 39. Collateral is not recorded in the Bank’s statement of financial position. However, the fair value of collateral affects the calculation of ECLs. It is generally assessed, at a minimum, at inception and re-assessed subsequently as and when required. However, some collateral, for example, cash or securities relating to margining requirements, is valued daily. Details of the impact of the Bank’s various credit enhancements are disclosed in Note 47.
To the extent possible, the Bank uses active market data for valuing financial assets held as collateral. Other financial assets which do not have readily determinable market values are valued using models. Non-financial collateral, such as real estate, is valued based on data provided by third parties such as mortgage brokers etc.
(viii) Collateral repossessed The Group’s policy is to sell the repossessed assets at the earliest possible opportunity. Such collateral repossessed are held on a
memorandum basis without derecognizing the underlying receivable.
(ix) Write-offs Financial assets are written off either partially or in their entirety only when the Bank has stopped pursuing the recovery. If the amount to be
written off is greater than the accumulated loss allowance, the difference is first treated as an addition to the allowance that is then applied against the gross carrying amount. Any subsequent recoveries are credited to Other Operating Income in the Profit or Loss.
(x) Rescheduled Loans The Bank sometimes makes concessions or modifications to the original terms of loans as a response to the borrower’s financial difficulties,
rather than taking possession or to otherwise enforce collection of collateral. The Bank classifies a loan as a “Rescheduled Loan” when such concessions or modifications are provided as a result of the borrower’s present or expected financial difficulties and the Bank would not have agreed to them if the borrower had been financially healthy. Indicators of financial difficulties include defaults on covenants, or significant concerns raised by the Credit Management Department. A reschedulement of a loan may involve extending the payment arrangements and the agreement of new loan conditions. Once the terms have been renegotiated, any impairment is measured using the original EIR as calculated before the modification of terms. It is the Bank’s policy to monitor rescheduled loans to help ensure that future payments continue to be likely to occur. All rescheduled loans are classified as Stage 3 until the fulfillment of regulatory watch period or written off.
NOTES TO THE FINANCIAL STATEMENTS

121
NEXT GEN BANKING
Bank GroupAs at 31 December 2019 2018 2019 2018
LKR'000 LKR'000 LKR'000 LKR'000
Gross loans and advances- Stage 1 193,991,499 192,775,638 193,993,990 192,780,544- Stage 2 14,919,176 12,474,005 14,919,176 12,474,005- Stage 3 25,464,313 22,009,069 25,464,313 22,009,069
234,374,988 227,258,712 234,377,479 227,263,618(Less): Accumulated impairment under:- Stage 1 (Note 13.4) (1,009,992) (1,047,569) (1,009,862) (1,047,439)- Stage 2 (Note 13.4) (343,589) (296,431) (343,589) (296,431)- Stage 3 (Note 13.4) (6,229,838) (4,414,056) (6,229,838) (4,414,056)
(7,583,419) (5,758,056) (7,583,289) (5,757,926)Net loans and advances 226,791,569 221,500,656 226,794,190 221,505,692
Gross Loans Included under stage 1 reflects the balance net of allowance for day 1 difference of staff loans of LKR 775.931 Mn (2018 - LKR 746.857 Mn) (Note 14) which add on to LKR 235,150.920 Mn (2018 - LKR 228,005.569 Mn.)
Gross amount of loans & advances individually determined to be impaired, before deducting individually assessed impairment allowance amounts to LKR 16,371 Mn (2018 - LKR 14,088 Mn).
13.1 Gross Loans and Advances by Product
Bank GroupAs at 31 December 2019 2018 2019 2018
LKR'000 LKR'000 LKR'000 LKR'000
By ProductBills of Exchange 14,670 49,968 14,670 49,968Trade Finance 42,991,213 41,344,142 42,991,213 41,344,142Overdrafts 42,085,672 41,893,956 42,085,672 41,893,956Term Loans 73,403,787 71,110,701 73,403,787 71,110,701Staff Loans 3,652,422 3,391,441 3,652,422 3,391,441Leases (Note 13.5) 44,142,733 44,864,827 44,142,733 44,864,827Credit Cards 28,188,516 24,872,193 28,188,516 24,872,193Pawning 420,931 329,280 420,931 329,280Other Advances 250,976 149,061 253,466 153,967
235,150,920 228,005,569 235,153,410 228,010,475

122
Nations Trust Bank PLC Annual Report 2019
13 LOANS AND ADVANCES TO CUSTOMERS (CONTD.)
13.2 Gross Loans and Advances by Currency
Bank GroupAs at 31 December 2019 2018 2019 2018
LKR'000 LKR'000 LKR'000 LKR'000
By CurrencySri Lanka Rupee 208,443,170 202,521,098 208,445,660 202,526,004United States Dollar 26,414,048 25,204,522 26,414,048 25,204,522Great Britain Pound 62,947 77,651 62,947 77,651Others 230,755 202,298 230,755 202,298
235,150,920 228,005,569 235,153,410 228,010,475
13.3 Gross Loans and Advances by Industry The industry wise exposure of gross Loans and advances are disclosed in Note 47 (from Page No. 181 to 184)
13.4 Movement in impairment during the year
Bank Group2019 2018 2019 2018
LKR'000 LKR'000 LKR'000 LKR'000
Stage 1Balance as at 01 January 1,047,569 453,772 1,047,439 453,642Impact of first time adoption of SLFRS 9 - 549,706 - 549,706Charge/(Write back) to income statement (Note 36) (37,577) 44,091 (37,577) 44,091Write-off during the year - - - - Balance as at 31 December 1,009,992 1,047,569 1,009,862 1,047,439
Stage 2Balance as at 01 January 296,431 154,674 296,431 154,674Impact of first time adoption of SLFRS 9 - 157,736 - 157,736Charge/(Write back) to income statement (Note 36) 47,158 (15,979) 47,158 (15,979)Write-off during the year - - - - Balance as at 31 December 343,589 296,431 343,589 296,431
Stage 3Balance as at 01 January 4,414,056 2,000,469 4,414,056 2,000,469Impact of first time adoption of SLFRS 9 - 265,133 - 265,133Transferred from financial assets at amortised cost - debt instruments (Note 12.3)
42,373 - 42,373 -
Charge/(Write back) to income statement (Note 36) 3,294,029 3,125,851 3,294,029 3,125,851Write-off during the year (1,520,620) (977,397) (1,520,620) (977,397)Balance as at 31 December 6,229,838 4,414,056 6,229,838 4,414,056
The impact of the movement of loans & advances during the current year to stage 3 from stage 1 and stage 2 is reflected within the current year’s charge to the income statement.
NOTES TO THE FINANCIAL STATEMENTS

123
NEXT GEN BANKING
13.5 Rental Receivable on Leases
As at 31 December 2019 2018Bank/Group Bank/Group
Within 1 year
1 - 5 years Over 5 years
Total Within 1 year
1 - 5 years Over 5 years
Total
LKR '000 LKR '000 LKR '000 LKR '000 LKR '000 LKR '000 LKR '000 LKR '000
Gross Rentals Receivables 20,683,827 31,811,108 2,807,606 55,302,541 21,547,858 33,763,327 1,488,994 56,800,179Less : Unearned Income (4,786,345) (5,673,740) (699,723) (11,159,808) (5,294,351) (6,261,672) (379,329) (11,935,352)Net Rentals Receivables 15,897,482 26,137,368 2,107,883 44,142,733 16,253,507 27,501,655 1,109,665 44,864,827Less : Allowance for Impairment Losses - - - (792,788) - - - (406,420)Total Net Rentals Receivables 15,897,482 26,137,368 2,107,883 43,349,945 16,253,507 27,501,655 1,109,665 44,458,407
14 OTHER ASSETS
Bank GroupAs at 31 December 2019 2018 2019 2018
LKR'000 LKR'000 LKR'000 LKR'000
Deposits and Prepayments 337,612 560,243 347,291 569,925Unamortized Staff Cost (Note 13) 775,931 746,857 775,931 746,857Debenture Proceeds Receivable - 546,177 - 546,177Senior Citizen Interest Re-imbursement 487,692 253,962 487,692 253,962Other Receivables 555,711 539,013 599,697 584,967Less: Impairment for Leasing Charges and Other Receivables (Note 14.1) (22,524) (19,666) (30,373) (20,994)
2,134,422 2,626,586 2,180,238 2,680,894
14.1 Movement in impairment during the year
Bank Group2019 2018 2019 2018
LKR'000 LKR'000 LKR'000 LKR'000
Balance as at 01 January 19,666 4,074 20,994 4,074Impact of first time adoption of SLFRS 9 - 584 - 584Charge / (write back) to income statement (Note 36) 28,098 21,721 34,619 23,049Write -off during the Year (25,240) (6,713) (25,240) (6,713)Balance as at 31 December 22,524 19,666 30,373 20,994

124
Nations Trust Bank PLC Annual Report 2019
15 INVESTMENTS IN SUBSIDIARIES
Unquoted
BankAs at 31 December 2019 2018 2019 2018
Holding Holding Cost Cost% % LKR '000 LKR '000
Name of Company Country of IncorporationWaldock Mackenzie Limited Sri Lanka 99.99 99.99 - - Allied Properties Limited Sri Lanka 99.99 99.99 652,907 652,907Nations Insurance Brokers Limited Sri Lanka 99.99 99.99 25,803 25,803Net Carrying Amount 678,710 678,710
16 PROPERTY, PLANT AND EQUIPMENT
Accounting Policy
Cost Model The Group applies cost model to property, plant and equipment except for freehold land and buildings and records at cost of purchase or
construction together with any incidental expenses thereon less accumulated depreciation and any accumulated impairment losses.
Cost includes expenditure that is directly attributable to the acquisition of the asset. The cost of self-constructed assets includes the following;
• the cost of materials and direct labour
• any other costs directly attributable to bringing the assets to a working condition for their intended use
• when the Group has an obligation to remove the asset or restore the site, an estimate of the costs of dismantling and removing the items and restoring the site on which they are located.
Revaluation model The Group applies the revaluation model to the entire class of freehold land and buildings. Such properties are carried at a revalued amount,
being their fair value at the date of revaluation less any subsequent accumulated depreciation and subsequent accumulated impairment losses. Freehold land and buildings of the Group are revalued by independent professional valuers. Valuations are performed with sufficient frequency to ensure that the carrying amounts do not differ materially from the fair values as at the reporting date. The Group has revalued its freehold land & building during the year 2019 and details of the revaluation are given in Note 16.3.
On revaluation of an asset, any increase in the carrying amount is recognised in ‘Other comprehensive income’ and accumulated in equity, under revaluation reserve or used to reverse a previous revaluation decrease relating to the same asset, which was charged to the Statement of Profit or Loss. In this circumstance, the increase is recognized as income to the extent of the previous write down. Any decrease in the carrying amount is recognized as an expense in the Statement of Profit or Loss or debited to the other comprehensive income to the extent of any credit balance existing in the capital reserve in respect of that asset.
The decrease recognised in other comprehensive income reduces the amount accumulated in equity under capital reserves. Any balance remaining in the revaluation reserve in respect of an asset is transferred directly to retained earnings on retirement or disposal of the asset.
NOTES TO THE FINANCIAL STATEMENTS

125
NEXT GEN BANKING
Subsequent expenditure and replacement The cost of replacing a part of an item of property, plant and equipment is recognized in the carrying amount of the item if it is probable that
the future economic benefits embodied within the part will flow to the Group, and its cost can be measured reliably. The carrying amount of the replaced part is derecognized. The costs of the day-to-day servicing of property, plant and equipment are recognized in profit or loss as incurred.
Depreciation Depreciation is calculated using the straight–line method to write down the cost of property, plant and equipment to their residual values over
their estimated useful lives. Lands are not depreciated. The estimated useful lives are as follows:
Buildings 40 years
Motor Vehicles 04 years
Other Equipment 04 - 08 years
Computer Hardware 02 - 04 years
Furniture and Fittings 08 years
Leasehold Improvements Over the lease period
Depreciation methods, useful lives and residual values are reviewed at each reporting date and adjusted if requires. Changes in the expected useful life are accounted for by changing the amortisation period or method, as appropriate, and treated as changes in accounting estimates.
De-recognition The carrying amount of an item of property, plant and equipment is de-recognized upon disposal or when no future economic benefits are
expected from its use. The gain or loss arising from de-recognition of an item of property, plant and equipment is included in the Statement of Profit or Loss when the item is derecognised.
Capital work-in-progress Capital work-in-progress is stated at cost. These are the expenses of a capital nature directly incurred in the construction of buildings,
machinery and system development, awaiting capitalization. Capital work-in-progress would be transferred to the relevant asset when it is available for use, i.e. when it is in the location and condition necessary for it to be capable of operating in the manner intended by management. Capital work-in-progress is stated at cost less any accumulated impairment losses.

126
Nations Trust Bank PLC Annual Report 2019
16
PRO
PERT
Y, P
LAN
T AN
D E
QU
IPM
ENT
(CO
NTD
.)16
.1
Ban
k
Gros
s Car
rying
Amou
nts -
at Co
stLa
nd -
Free
hold
Land
- Le
aseh
oldBu
ilding
sM
otor
Ve
hicles
Office
and
Electr
ical
Equip
ment
s
Comp
uter
Ha
rdwa
reFu
rnitu
re,
Fixtu
res a
nd
Fittin
gs
Leas
ehold
im
prov
emen
ts Ca
pital
Wor
k -
In - P
rogr
ess
Total
LKR'0
00 LK
R'000
LK
R'000
LK
R'000
LK
R'000
LKR'0
00 LK
R'000
LKR'0
00 LK
R'000
LKR'0
00
As at
01 Ja
nuar
y 201
81,4
01,50
0 -
17
3,501
25,99
969
8,867
2,019
,010
787,7
6036
2,576
-
5,469
,213
Addit
ions
- -
677
- 93
,918
489,5
1542
,901
29,07
7 -
656,0
90Di
spos
als -
-
-
-
(6
4,556
)(33
2,640
)(27
,675)
-
-
(424,8
72)
Capit
al W
IP - A
dditio
ns du
ring t
he ye
ar -
-
-
-
-
-
-
-
18
,283
18,28
3As
at 31
Dec
embe
r 201
81,4
01,50
0 -
17
4,178
25,99
972
8,229
2,175
,885
802,9
8639
1,653
18,28
35,7
18,71
4Ad
dition
s -
-
-
-
60
,899
241,9
1183
,923
40,53
0 -
42
7,263
Disp
osals
-
-
-
-
(5,52
3)(2,
735)
(6,66
2) -
-
(14
,920)
Recla
ssific
ation
s * -
-
-
-
-
19
,919
-
-
-
19,91
9Re
valua
tion S
urplu
s17
7,400
-
(9,01
3) -
-
-
-
-
-
16
8,387
Accu
mulat
ed de
prec
iation
adjus
tmen
t on r
evalu
ation
-
-
(10,43
5) -
-
-
-
-
-
(10
,435)
Capit
al W
IP - A
dditio
ns du
ring t
he ye
ar -
-
-
-
-
-
-
-
9,0
949,0
94Ca
pital
WIP
- Cap
italiz
ed du
ring t
he ye
ar -
-
-
-
-
-
-
-
(18
,283)
(18,28
3)As
at 31
Dec
embe
r 201
91,5
78,90
0 -
15
4,730
25,99
978
3,605
2,434
,980
880,2
4743
2,183
9,094
6,299
,739
Depr
eciat
ion /
Amor
tizat
ionAs
at 01
Janu
ary 2
018
-
-
-
10,66
749
2,807
1,578
,701
543,8
6225
8,875
-
2,884
,912
Charg
e for
the y
ear
-
-
5,211
5,316
65,28
919
1,887
62,79
836
,936
-
367,4
37Di
spos
als -
-
-
-
(6
4,556
)(30
9,230
)(27
,673)
-
-
(401,4
60)
As at
31 D
ecem
ber 2
018
-
-
5,211
15,98
349
3,540
1,461
,358
578,9
8729
5,811
-
2,850
,889
Charg
e for
the y
ear
-
-
5,224
5,300
70,89
526
0,488
63,77
235
,471
-
441,1
50Di
spos
als -
-
-
-
(5,
415)
(2,73
5)(5,
749)
-
-
(13,89
8)Re
classi
ficati
ons *
-
-
-
-
-
8,258
-
-
-
8,2
58Ac
cumu
lated
depr
eciat
ion ad
justm
ent o
n rev
aluati
on -
-
(10
,435)
-
-
-
-
-
-
(10,43
5)As
at 31
Dec
embe
r 201
9 -
-
-
21
,283
559,0
201,7
27,36
863
7,010
331,2
82 -
3,2
75,96
3
Net B
ook V
alue
As at
01 Ja
nuar
y 201
81,4
01,50
0 -
17
3,501
15,33
220
6,060
440,3
0924
3,898
103,7
01 -
2,5
84,30
1As
at 31
Dec
embe
r 201
81,4
01,50
0 -
16
8,967
10,01
623
4,689
714,52
722
3,999
95,84
218
,283
2,867
,825
As at
31 D
ecem
ber 2
019
1,578
,900
-
154,7
304,7
1622
4,585
707,6
1124
3,237
100,9
019,0
943,0
23,77
6
Du
ring
the fi
nanc
ial y
ear,
the B
ank a
cqui
red
Prop
erty
, Pla
nt an
d Eq
uipm
ent t
o th
e agg
rega
te va
lue o
f LK
R 42
7 M
n. (2
018
-LKR
656
Mn.)
. Cas
h pa
ymen
ts am
ount
ing
to
LKR
384.
8 M
n (2
018-
LKR
660
.6M
n) w
ere m
ade d
urin
g th
e yea
r for
pur
chas
e of P
rope
rty,
Pla
nt an
d Eq
uipm
ent. P
rope
rty,
Pla
nt an
d Eq
uipm
ent i
nclu
des f
ully
dep
recia
ted
asse
ts
havin
g a g
ross
carr
ying
amou
nt o
f LKR
2,2
30 M
n (2
018-
LKR
1,9
61 M
n).
*
Recla
ssifi
catio
ns re
pres
ent t
rans
fer o
f ope
ratin
g so
ftwar
e to
com
pute
r har
dwar
e.
16.1.
1 Th
e car
ryin
g am
ount
of B
ank's
reva
lued
free
hold
land
and
build
ings
, if th
ey w
ere c
arrie
d at
cost
less
accu
mul
ated
dep
recia
tion
woul
d be
as fo
llows
;
As a
t 31
Dece
mbe
r20
1920
18Co
stAc
cum
ulat
edDe
prec
iatio
nCa
rryi
ng
Valu
eCo
stAc
cum
ulat
edDe
prec
iatio
nCa
rryi
ng
Valu
e L
KR'0
00 L
KR'0
00
LKR
'000
L
KR'0
00
LKR
'000
LKR
'000
Free
hold
Lan
d55
9,44
0 -
55
9,44
055
9,44
0 -
55
9,44
0Fr
eeho
ld B
uild
ing
119,
802
46,0
7873
,725
119,
802
43,31
076
,492
Tota
l67
9,24
246
,078
633,
165
679,
242
43,31
063
5,93
2
NOTES TO THE FINANCIAL STATEMENTS

127
NEXT GEN BANKING 16
.2
Grou
p
Gros
s Car
rying
Amou
nts -
at Co
stLa
nd -
Free
hold
Land
- Le
aseh
oldBu
ilding
sM
otor
Ve
hicles
Office
and
Electr
ical
Equip
ment
s
Comp
uter
Ha
rdwa
reFu
rnitu
re,
Fixtu
res a
nd
Fittin
gs
Leas
ehold
im
prov
emen
ts Ca
pital
Wor
k -
In - P
rogr
ess
Total
LKR'0
00 LK
R'000
LK
R'000
LK
R'000
LK
R'000
LKR'0
00 LK
R'000
LKR'0
00 LK
R'000
LKR'0
00
As at
01 Ja
nuar
y 201
81,4
01,50
014
8,000
821,7
0026
,169
704,6
902,0
23,52
479
1,231
362,5
75 -
6,2
79,39
0Ad
dition
s -
- 17
,288
- 12
6,371
489,6
3943
,199
29,07
7 -
705,5
76Di
spos
als -
-
-
-
(6
4,557
)(33
2,645
)(27
,673)
-
-
(424,8
78)
Capit
al W
IP - A
dditio
ns du
ring t
he ye
ar -
-
-
-
-
-
-
-
18
,283
18,28
3As
at 31
Dec
embe
r 201
81,4
01,50
014
8,000
838,9
8826
,169
766,5
042,1
80,51
880
6,757
391,6
5218
,283
6,578
,371
Addit
ions
-
-
-
-
64,90
324
2,862
84,69
040
,530
-
432,9
85Di
spos
als -
-
-
-
(5,
523)
(2,73
4)(6
,662)
-
-
(14,91
9)Re
classi
ficati
ons *
-
-
-
-
-
19,91
9 -
-
-
19
,919
Reva
luatio
n Sur
plus
177,4
00 -
26
4,522
-
-
-
-
-
-
441,9
22Ac
cumu
lated
depr
eciat
ion ad
justm
ent o
n rev
aluati
on -
-
(57
,732)
-
-
-
-
-
-
(57,73
2)Ca
pital
WIP
- Add
itions
durin
g the
year
-
-
-
-
-
-
-
-
9,094
9,094
Capit
al W
IP - C
apita
lized
durin
g the
year
-
-
-
-
-
-
-
-
(18,28
3)(18
,283)
As at
31 D
ecem
ber 2
019
1,578
,900
148,0
001,0
45,77
826
,169
825,8
842,4
40,56
588
4,785
432,1
829,0
947,3
91,35
7
Depr
eciat
ion /
Amor
tizat
ionAs
at 01
Janu
ary 2
018
-
22,56
2 -
10
,835
496,1
341,5
81,62
654
5,566
258,8
73 -
2,9
15,59
8Ch
arge f
or th
e yea
r -
1,8
9328
,798
5,316
67,00
319
2,555
63,23
536
,936
-
395,7
36Di
spos
als -
-
-
-
(6
4,558
)(30
9,230
)(27
,673)
-
-
(401,4
65)
As at
31 D
ecem
ber 2
018
-
24,45
428
,798
16,15
049
8,579
1,464
,951
581,1
2829
5,809
-
2,909
,869
Charg
e for
the y
ear
-
1,893
28,93
45,3
0075
,493
261,0
2964
,203
35,47
1 -
47
2,323
Disp
osals
-
-
-
-
(5,41
5)(2,
735)
(5,74
9) -
-
(13
,898)
Recla
ssific
ation
s * -
-
-
-
-
8,2
58 -
-
-
8,2
58Ac
cumu
lated
depr
eciat
ion ad
justm
ent o
n rev
aluati
on -
-
(57
,732)
-
-
-
-
-
-
(57,73
2)As
at 31
Dec
embe
r 201
9 -
26
,347
-
21,45
056
8,657
1,731
,503
639,5
8233
1,280
3,318
,819
Net B
ook V
alue
As at
01 Ja
nuar
y 201
81,4
01,50
012
5,438
821,7
0015
,334
208,5
5744
1,898
245,6
6510
3,702
-
3,363
,792
As at
31 D
ecem
ber 2
018
1,401
,500
123,5
4681
0,190
10,01
926
7,925
715,56
722
5,629
95,84
318
,283
3,668
,502
As at
31 D
ecem
ber 2
019
1,578
,900
121,6
531,0
45,77
84,7
1925
7,227
709,0
6224
5,203
100,9
029,0
944,0
72,53
8
Du
ring
the fi
nanc
ial y
ear,
the G
roup
acqu
ired
Prop
erty
, Pla
nt an
d Eq
uipm
ent t
o th
e agg
rega
te va
lue o
f LK
R 43
2 M
n (2
018
-LKR
705.
5 M
n). C
ash
paym
ents
amou
ntin
g to
LK
R 39
7.2 M
n (2
018-
LKR
691
Mn)
wer
e mad
e dur
ing
the y
ear f
or p
urch
ase o
f Pro
pert
y, P
lant
and
Equi
pmen
t. Pro
pert
y, P
lant
and
Equi
pmen
t inc
lude
s ful
ly d
epre
ciate
d as
sets
ha
ving
a gro
ss ca
rryi
ng am
ount
of
LKR
2,24
0 M
n (2
018-
LKR
1,96
6 M
n).
*
Recla
ssifi
catio
ns re
pres
ent t
rans
fer o
f ope
ratin
g so
ftwar
e to
com
pute
r har
dwar
e.
16.2
.1 T
he ca
rryi
ng am
ount
of G
roup
's rev
alue
d fr
eeho
ld la
nd an
d bu
ildin
gs, if
they
wer
e car
ried
at co
st le
ss ac
cum
ulat
ed d
epre
ciatio
n wo
uld
be as
follo
ws;
As a
t 31
Dece
mbe
r20
1920
18Co
stAc
cum
ulat
edDe
prec
iatio
nCa
rryi
ng
Valu
eCo
stAc
cum
ulat
edDe
prec
iatio
nCa
rryi
ng
Valu
e L
KR'0
00 L
KR'0
00
LKR
'000
L
KR'0
00
LKR
'000
LKR
'000
Free
hold
Lan
d55
9,44
0 -
55
9,44
055
9,44
0 -
55
9,44
0Fr
eeho
ld B
uild
ing
586,
572
202,
424
384,
148
586,
572
187,
721
398,
851
Tota
l1,
146,
012
202,
424
943,
588
1,146
,012
187,
721
958,
291

128
Nations Trust Bank PLC Annual Report 2019
16
PRO
PERT
Y, P
LAN
T AN
D E
QU
IPM
ENT
(CO
NTD
.)
16.3
D
etai
ls o
f Lan
d an
d B
uild
ings
Sta
ted
at V
alua
tion
Ba
nk/G
roup
Va
luer
- M
r. P
B Ka
luga
lage
dara
Net B
ook V
alue
Bef
ore
Reva
luat
ion
Reva
luat
ion a
mou
ntRe
valu
atio
n gai
n rec
ogni
sed i
n OCI
Loca
tion
Date
of Va
luat
ion
Land
Bu
ildin
g La
nd
Build
ing
Land
Bu
ildin
g To
tal
LKR
Mn
LKR
Mn
LKR
Mn
LKR
Mn
LKR
Mn
LKR
Mn
LKR
Mn
No.24
2, Un
ion P
lace,
Colom
bo 0
231
-12-2
019
1,22
4.00
136.6
5 1,
377.0
0 13
5.63
153.0
0 (1
.02)
151.9
8 No
.76, Y
ork S
treet
Fort,
Colom
bo 0
131
-12-2
019
177.5
0 27
.09
201.9
0 19
.10
24.40
(7
.99)
16.41
To
tal-
Bank
1,40
1.50
163.7
4 1,
578.9
0 15
4.73
177.4
0 (9
.01)
168.3
9
No.46
/58,
Nav
am M
awat
ha, C
olom
bo 0
231
-12-2
019
-
617.5
1 -
8
91.05
-
27
3.53
273.5
3 To
tal-
Grou
p * 1,
401.5
0 78
1.25
1,57
8.90
1,04
5.78
177.4
0 26
4.52
441.9
2
*
Land
and
Build
ings
cons
ist o
f pro
pert
ies o
f Nat
ions
Trus
t Ban
k PLC
(The
Ban
k) an
d Al
lied
Prop
ertie
s Lim
ited.
Met
hod
of V
alua
tion
is di
sclo
sed
in N
ote 4
6.2.1
NOTES TO THE FINANCIAL STATEMENTS

129
NEXT GEN BANKING
17 RIGHT OF USE ASSETS (ROU)
17.1 Refer the accounting policy given under note 48.3.2 on Leases.
17.2 The key assumptions used for the computation of operating lease liabilities include the following:
2019
Incremental Borrowing Rate 11%
Bank GroupLand &
BuildingsComputer
Related Equipment
Motor Vehicles
Total Land & Buildings
Computer Related
Equipment
Motor Vehicles
Total
LKR '000 LKR '000 LKR '000 LKR '000 LKR '000 LKR '000 LKR '000 LKR '000
Gross Carrying AmountImpact of first time adoption of SLFRS 16 as at 01 January 2019 1,878,064 172,482 39,982 2,090,528 1,698,520 172,482 39,982 1,910,984 Additions 239,266 - 17,476 256,742 239,266 - 17,476 256,742 Disposals - - - - - - - - As at 31 December 2019 2,117,330 172,482 57,458 2,347,270 1,937,786 172,482 57,458 2,167,726
DepreciationCharge for the year 431,837 28,747 15,957 476,541 342,065 28,747 15,957 386,769 Disposals - - - - - - - - As at 31 December 2019 431,837 28,747 15,957 476,541 342,065 28,747 15,957 386,769
Net Book Value As at 31 December 2019 1,685,493 143,735 41,501 1,870,729 1,595,721 143,735 41,501 1,780,957
In order to illustrate the significance of the incremental borrowing rate assumed in this valuation, a sensitivity analysis for all right of use (ROU) assets is as follows.
2019Incremental
Borrowing RateBank Group
LKR '000 LKR '000
12% 1,825,278 1,736,405 10% 1,918,282 1,827,598
17.3 Set out below are the carrying amounts of lease liabilities (included under due to other borrowers in Note 20.2) and the movement during the year;
2019Bank Group
LKR '000 LKR '000
Impact of first time adoption of SLFRS 16 as at 01 January 2019 1,839,590 1,660,046 Additions 227,456 227,456 Accretion of interest 196,823 181,077 Payments (547,361) (447,921)As at 31 December 2019 1,716,508 1,620,658
The Bank and Group had total cash outflows for leases of LKR 547.4 Mn and LKR 447.9 Mn respectively. The initial application of SLFRS 16 resulted in non- cash addition to right -of-use assets and lease liabilities of LKR 1,839.6 Mn and LKR 1,660.0 Mn of the Bank and Group respectively at 01 January 2019.
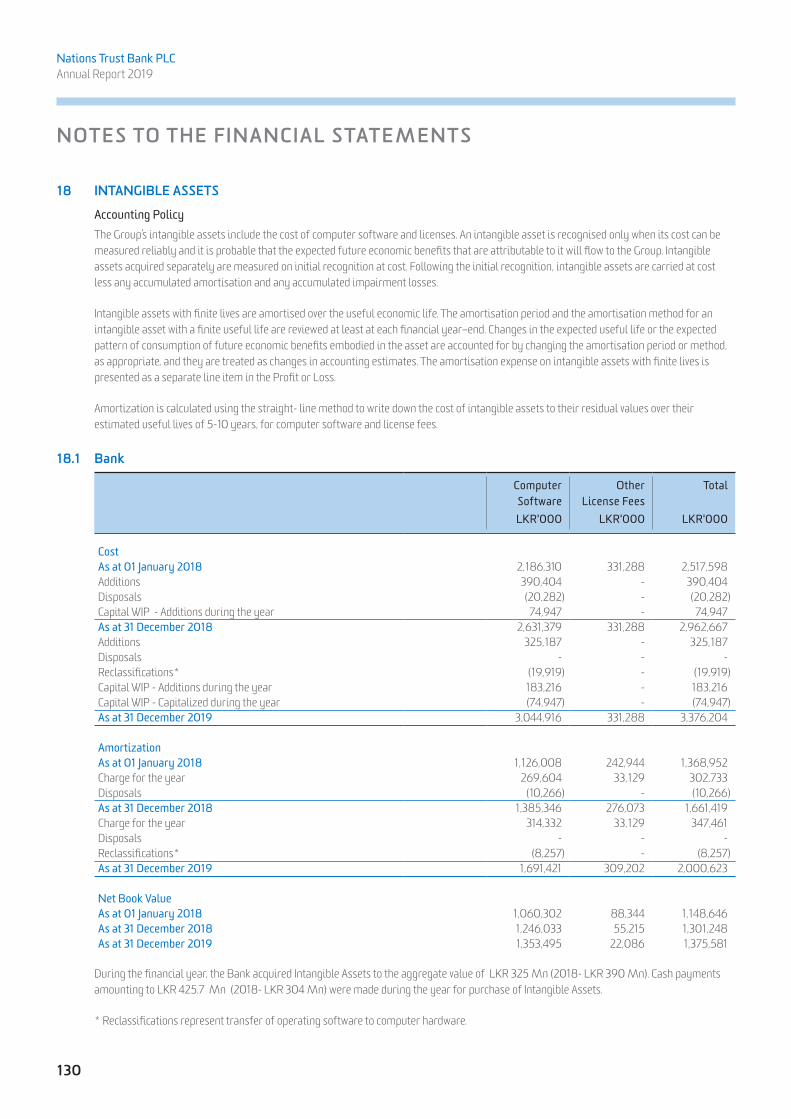
130
Nations Trust Bank PLC Annual Report 2019
18 INTANGIBLE ASSETS
Accounting Policy The Group’s intangible assets include the cost of computer software and licenses. An intangible asset is recognised only when its cost can be
measured reliably and it is probable that the expected future economic benefits that are attributable to it will flow to the Group. Intangible assets acquired separately are measured on initial recognition at cost. Following the initial recognition, intangible assets are carried at cost less any accumulated amortisation and any accumulated impairment losses.
Intangible assets with finite lives are amortised over the useful economic life. The amortisation period and the amortisation method for an intangible asset with a finite useful life are reviewed at least at each financial year–end. Changes in the expected useful life or the expected pattern of consumption of future economic benefits embodied in the asset are accounted for by changing the amortisation period or method, as appropriate, and they are treated as changes in accounting estimates. The amortisation expense on intangible assets with finite lives is presented as a separate line item in the Profit or Loss.
Amortization is calculated using the straight- line method to write down the cost of intangible assets to their residual values over their estimated useful lives of 5-10 years, for computer software and license fees.
18.1 Bank
Computer Software
Other License Fees
Total
LKR'000 LKR'000 LKR'000
CostAs at 01 January 2018 2,186,310 331,288 2,517,598Additions 390,404 - 390,404Disposals (20,282) - (20,282)Capital WIP - Additions during the year 74,947 - 74,947As at 31 December 2018 2,631,379 331,288 2,962,667Additions 325,187 - 325,187Disposals - - - Reclassifications* (19,919) - (19,919)Capital WIP - Additions during the year 183,216 - 183,216Capital WIP - Capitalized during the year (74,947) - (74,947)As at 31 December 2019 3,044,916 331,288 3,376,204
AmortizationAs at 01 January 2018 1,126,008 242,944 1,368,952Charge for the year 269,604 33,129 302,733Disposals (10,266) - (10,266)As at 31 December 2018 1,385,346 276,073 1,661,419Charge for the year 314,332 33,129 347,461Disposals - - - Reclassifications* (8,257) - (8,257)As at 31 December 2019 1,691,421 309,202 2,000,623
Net Book ValueAs at 01 January 2018 1,060,302 88,344 1,148,646As at 31 December 2018 1,246,033 55,215 1,301,248As at 31 December 2019 1,353,495 22,086 1,375,581
During the financial year, the Bank acquired Intangible Assets to the aggregate value of LKR 325 Mn (2018- LKR 390 Mn). Cash payments amounting to LKR 425.7 Mn (2018- LKR 304 Mn) were made during the year for purchase of Intangible Assets.
* Reclassifications represent transfer of operating software to computer hardware.
NOTES TO THE FINANCIAL STATEMENTS
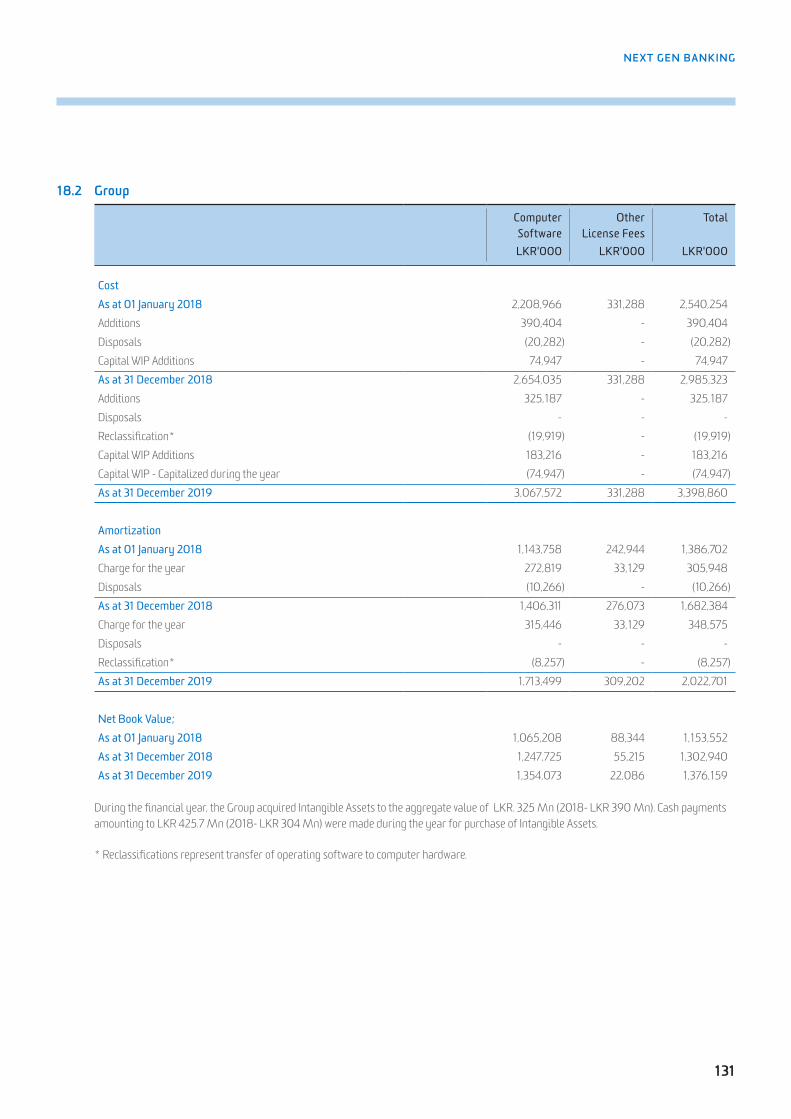
131
NEXT GEN BANKING
18.2 Group
Computer Software
Other License Fees
Total
LKR'000 LKR'000 LKR'000
CostAs at 01 January 2018 2,208,966 331,288 2,540,254Additions 390,404 - 390,404Disposals (20,282) - (20,282)Capital WIP Additions 74,947 - 74,947As at 31 December 2018 2,654,035 331,288 2,985,323Additions 325,187 - 325,187Disposals - - - Reclassification* (19,919) - (19,919)Capital WIP Additions 183,216 - 183,216Capital WIP - Capitalized during the year (74,947) - (74,947)As at 31 December 2019 3,067,572 331,288 3,398,860
AmortizationAs at 01 January 2018 1,143,758 242,944 1,386,702Charge for the year 272,819 33,129 305,948Disposals (10,266) - (10,266)As at 31 December 2018 1,406,311 276,073 1,682,384Charge for the year 315,446 33,129 348,575Disposals - - - Reclassification* (8,257) - (8,257)As at 31 December 2019 1,713,499 309,202 2,022,701
Net Book Value;As at 01 January 2018 1,065,208 88,344 1,153,552As at 31 December 2018 1,247,725 55,215 1,302,940As at 31 December 2019 1,354,073 22,086 1,376,159
During the financial year, the Group acquired Intangible Assets to the aggregate value of LKR. 325 Mn (2018- LKR 390 Mn). Cash payments amounting to LKR 425.7 Mn (2018- LKR 304 Mn) were made during the year for purchase of Intangible Assets.
* Reclassifications represent transfer of operating software to computer hardware.

132
Nations Trust Bank PLC Annual Report 2019
19 DUE TO BANKS
Bank / GroupAs at 31 December 2019 2018
LKR'000 LKR'000
Money Market Borrowing 5,836,777 9,878,203Securities Sold under Repurchase Agreements (Repo) (Note 8.2) - 8,509,788Deposits from Other Banks 647,380 86,554
6,484,157 18,474,545
20 FINANCIAL LIABILITIES AT AMORTISED COST
Bank GroupAs at 31 December 2019 2018 2019 2018
LKR'000 LKR'000 LKR'000 LKR'000
Due to Depositors (Note 20.1) 226,880,034 231,936,769 226,871,563 231,462,599Securities sold under repurchase (repo) agreements (Note 8.2) 11,033,047 7,784,017 10,186,828 7,681,669Due to Other Borrowers (Note 20.2) 27,380,678 20,248,816 27,284,828 20,248,816
265,293,759 259,969,602 264,343,219 259,393,084
20.1 Analysis of amount due to depositors
Bank GroupAs at 31 December 2019 2018 2019 2018
LKR'000 LKR'000 LKR'000 LKR'000
20.1.1 By ProductDemand Deposits 17,800,609 17,140,867 17,792,138 17,129,573Savings Deposits 43,810,397 40,873,081 43,810,397 40,873,080Call Deposits 43,941 1,319,721 43,941 1,319,721Fixed Deposits 165,176,638 172,372,828 165,176,638 171,909,953Certificate of Deposits 48,449 230,272 48,449 230,272
226,880,034 231,936,769 226,871,563 231,462,599
20.1.2 By CurrencySri Lanka Rupee 195,418,578 199,047,823 195,410,107 198,573,653United States Dollar 24,946,156 26,499,636 24,946,156 26,499,636Sterling Pound 2,094,621 2,171,230 2,094,621 2,171,230Others 4,420,679 4,218,080 4,420,679 4,218,080
226,880,034 231,936,769 226,871,563 231,462,599
NOTES TO THE FINANCIAL STATEMENTS

133
NEXT GEN BANKING
20.2 Due to Other Borrowers
Bank GroupAs at 31 December 2019 2018 2019 2018
LKR'000 LKR'000 LKR'000 LKR'000
Development Finance Institutions (DFI) (Note 20.2.1) 16,982,877 16,285,609 16,982,877 16,285,609Refinance Borrowings 1,962,222 1,411,180 1,962,222 1,411,180Financial Institutions 6,719,071 2,552,027 6,719,071 2,552,027Operating Lease Liability 1,716,508 - 1,620,658 -
27,380,678 20,248,816 27,284,828 20,248,816
20.2.1 These borrowings are from Foreign Development Finance Institutions with an original maturity of 5 years. Interest is payable on a variable base with a fixed spread.
21 DEBT SECURITIES ISSUED
Bank / GroupAs at 31 December 2019 2018
LKR'000 LKR'000
Subordinated Debt Securities Issued by the BankRated, Unsecured, Redeemable Debentures (Note 21.1 ) 13,263,434 8,745,611
13,263,434 8,745,611
Due within 1 Year - 260,419Due after 1 Year 13,263,434 8,485,192
13,263,434 8,745,611

134
Nations Trust Bank PLC Annual Report 2019
21
DEB
T SE
CURI
TIES
ISSU
ED (C
OTD
.)
21.1
D
etai
ls o
f Sub
ordi
nate
d D
eben
ture
s Is
sued
Face
Value
Intere
st Ra
tesAm
ortize
d Cos
t -
Bank
/ Grou
pInt
erest
rate o
f Com
parab
le Go
vern
ment
Secu
rity
Type
2019
2018
Coup
on
Rate
Effec
tive
Annu
al Yie
ld
Intere
st Te
rms
Issue
d Date
Matu
rity D
ate20
1920
1820
1920
18As
at Iss
ue
Date
LKR'0
00 LK
R'000
(%
)(%
) LK
R'000
LKR'0
00(%
)(%
)(%
)
NTB-
BD-0
8/11/
21-C2
363
2,410
2,410
9.17*
***
Semi
-Ann
ually
8-No
v-16
8-No
v-21
2,437
2,445
8.65*
*11.4
9**
11.71*
*NT
B-BD
-08/
11/21-
C236
5-12
.653,8
85,80
03,8
85,80
012
.6513
.05Se
mi-A
nnua
lly8-
Nov-1
68-
Nov-2
13,9
50,01
63,9
50,32
38.6
511.4
911.7
1NT
B-BD
-08/
11/21-
C236
4-12.8
1,111,
790
1,111,
790
12.80
12.80
Annu
ally
8-No
v-16
8-No
v-21
1,130
,409
1,130
,498
8.65
11.49
11.71
NTB-
BD-20
/04/
23-C2
402-1
2.65
2,213
,000
2,213
,000
12.65
13.05
Semi
-Ann
ually
20-A
pr-18
20-A
pr-2
32,2
64,99
62,2
62,04
09.3
311.5
49.9
9NT
B-BD
-20/0
4/23
-C240
1-13
1,287
,000
1,287
,000
13.00
13.00
Annu
ally
20-A
pr-18
20-A
pr-2
31,4
01,79
31,4
00,30
59.3
311.5
49.9
9NT
B-BD
-23/12
/24 -
C244
1 - 12
.82,7
00,0
00 -
12.80
12.80
Annu
ally
23-D
ec-19
23-D
ec-2
42,7
08,07
3 -
9.74
- 9.8
9NT
B-BD
-23/12
/26 -
C244
2 - 12
.91,8
00,0
00 -
12.90
12.90
Annu
ally
23-D
ec-19
23-D
ec-2
61,8
05,71
0 -
9.87
- 10
.1113
,000
,000
8,500
,000
13,26
3,434
8,745
,611
Ratio
s of D
ebt
2019
2018
Debt*
/ Equ
ity Ra
tio (%
)110
.1899
.75Int
erest
Cove
r (Tim
es)
3.24
3.76
Quick
Asse
t Rati
o (%
)12
5115
*
Borr
owin
gs o
f whi
ch o
rigin
al m
atur
ity w
ith fi
ve y
ears
or m
ore a
re co
nsid
ered
for d
ebt.
**
Flo
atin
g ra
te d
eben
ture
repr
icing
at 6
mon
ths T
-Bill
rate
+ 1.
5%
21.2
Al
l the
secu
ritie
s wer
e iss
ued
by N
atio
ns Tr
ust B
ank P
LC. T
he B
ank h
as n
ot h
ad an
y de
faul
ts o
f prin
cipal
, inte
rest
or o
ther
bre
ache
s with
rega
rd to
any
liabi
litie
s as
of 3
1 Dec
embe
r 201
9.
NOTES TO THE FINANCIAL STATEMENTS

135
NEXT GEN BANKING
22 RETIREMENT BENEFIT OBLIGATIONS
Accounting Policy
(i) Defined Contribution Plans - Employees’ Provident Fund and Employees’ Trust Fund Employees are eligible for Employees’ Provident Fund and Employees’ Trust Fund contributions in line with respective statutes and
regulations. The Bank and its subsidiaries except Nations Insurance Brokers Limited, contribute 12% of gross emoluments of employees to an approved private provident fund managed by Nations Trust Bank PLC and 3% gross emoluments of employees to the Employees’ Trust Fund respectively. Nations Insurance Brokers Limited contributes 12% and 3% of gross emoluments of employees to the Employees’ Provident Fund and the Employees’ Trust Fund respectively.
(ii) Defined Benefit Plan - Gratuity The Group measures the present value of the retirement benefits of gratuity which is a defined benefit plan using the projected unit credit
method as recommended by LKAS 19 -Employee benefits and resulting actuarial gain/loss is recognized in full in the Other Comprehensive Income (OCI).
The actuarial valuation involves making assumptions about discount rate, expected rates of return on assets, future salary increases and mortality rates. Due to the long-term nature of these plans, such estimates are subject to significant uncertainty. All assumptions are reviewed at each reporting date.
Accordingly, the employee benefit liability is based on the actuarial valuation as of 31 December 2019, carried out by M/s Actuarial and Management Consultants (Private) Limited, actuaries.
The gratuity liability is not externally funded.
The key assumptions used by the Actuary include the following:
2019 2018
Rate of Discount 9.9% 11.7%Rate of Salary Increase 8.0% 8.0%Retirement Age 55-60 years 55-60 years
22.1 Net benefit expense categorized under personnel expenses
For the Year Ended 31 December Bank Group2019 2018 2019 2018
LKR'000 LKR'000 LKR'000 LKR'000
Interest Cost 59,089 49,145 59,857 49,744Current Service Cost 77,908 60,982 78,439 61,605
136,997 110,127 138,296 111,348

136
Nations Trust Bank PLC Annual Report 2019
22 RETIREMENT BENEFIT OBLIGATIONS (CONTD.)
22.2 Changes in the present value of the Retirement Benefit Plan
Bank Group2019 2018 2019 2018
LKR'000 LKR'000 LKR'000 LKR'000
As at 01 January 505,031 486,897 511,602 493,044Liability Transferred from a subsidiary - 223 - - Interest Cost (Note 22.1) 59,089 49,145 59,857 49,744Current Service Cost (Note 22.1) 77,908 60,982 78,439 61,605Benefits Paid (62,096) (57,470) (63,392) (57,470)Gratuity Payable (2,306) (10,195) (2,306) (10,196)Actuarial (Gain)/ Loss 74,847 (24,551) 75,254 (25,125)As at 31 December 652,473 505,031 659,454 511,602
22.3 In order to illustrate the significance of the salary escalation rates and discount rates assumed in this valuation, a sensitivity analysis for all employees assuming the above is as follows;
Group Group2019 2018
Salary EscalationRate
Discount Rate PVDBO Effect on Other Comprehensive
Income
Salary EscalationRate
Discount Rate PVDBO Effect on Other Comprehensive
Income LKR '000 LKR '000 LKR '000 LKR '000 LKR '000 LKR '000
8.0% 10.90% 629,777 29,677 8.0% 12.70% 488,841 22,7618.0% 8.90% 692,045 (32,591) 8.0% 10.70% 536,536 (24,934)9.0% 9.90% 695,290 (35,836) 9.0% 11.70% 539,476 (27,874)7.0% 9.90% 626,303 33,151 7.0% 11.70% 485,794 25,808
22.4 Average future working life time as per the assumptions made in year 2019: 6.01 years (2018: 6.43 years)
NOTES TO THE FINANCIAL STATEMENTS

137
NEXT GEN BANKING
23 CURRENT TAX LIABILITIES
Bank Group2019 2018 2019 2018
LKR'000 LKR'000 LKR'000 LKR'000
Balance as at 01 January 1,547,833 803,249 1,574,972 847,501Payments made / tax credits set off (2,355,175) (1,577,886) (2,431,506) (1,666,267)Charge for the year (Note 40.1) 2,565,464 2,349,090 2,639,265 2,420,358(Over)/Under Provisions for the previous year (Note 40.1) (420,623) (26,620) (420,623) (26,620)Balance as at 31 December 1,337,499 1,547,833 1,362,108 1,574,972
24 OTHER LIABILITIES
Bank GroupAs at 31 December 2019 2018 2019 2018
LKR'000 LKR'000 LKR'000 LKR'000
Accounts Payable and Sundry Creditors 1,993,110 1,964,134 2,005,932 1,983,963Obligations under Financial Guarantees (Note 24.1) 150,856 121,357 150,856 121,357Margin Balances 513,918 1,210,053 513,918 1,210,053Pay Orders 535,622 1,095,703 535,622 1,095,703Share Based Payments (Note 24.2) 69,188 64,506 69,188 64,506Impairment in respect of off-balance sheet credit exposure (Note 24.3) 429,055 471,484 429,055 471,484Others 2,666,646 2,755,819 2,685,389 2,775,672
6,358,395 7,683,056 6,389,960 7,722,738
24.1 The movement in 'Obligations under Financial Guarantees' during the year is as follows;
Bank / Group2019 2018
LKR'000 LKR'000
As at 01 January 121,357 101,708Income recognised during the year (319,767) (292,695)Arising during the Year 349,266 312,344As at 31 December 150,856 121,357
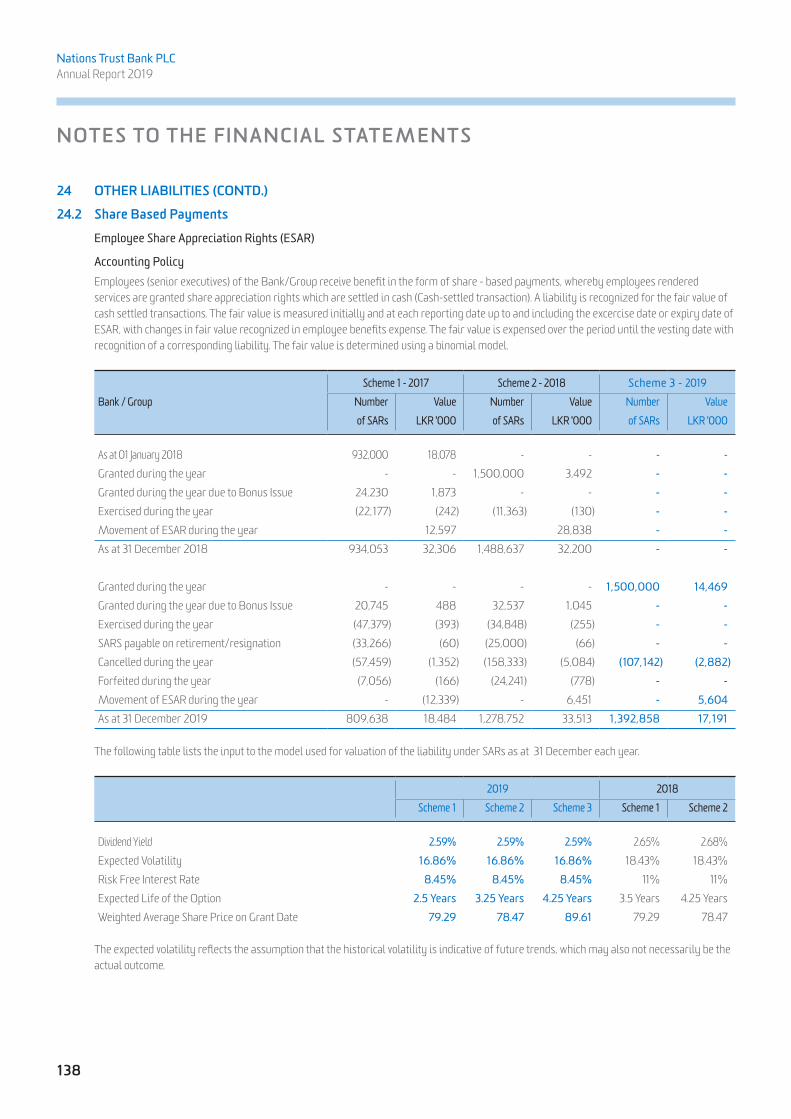
138
Nations Trust Bank PLC Annual Report 2019
24 OTHER LIABILITIES (CONTD.)
24.2 Share Based Payments
Employee Share Appreciation Rights (ESAR)
Accounting Policy Employees (senior executives) of the Bank/Group receive benefit in the form of share - based payments, whereby employees rendered
services are granted share appreciation rights which are settled in cash (Cash-settled transaction). A liability is recognized for the fair value of cash settled transactions. The fair value is measured initially and at each reporting date up to and including the excercise date or expiry date of ESAR, with changes in fair value recognized in employee benefits expense. The fair value is expensed over the period until the vesting date with recognition of a corresponding liability. The fair value is determined using a binomial model.
Scheme 1 - 2017 Scheme 2 - 2018 Scheme 3 - 2019Bank / Group Number Value Number Value Number Value
of SARs LKR '000 of SARs LKR '000 of SARs LKR '000
As at 01 January 2018 932,000 18,078 - - - - Granted during the year - - 1,500,000 3,492 - - Granted during the year due to Bonus Issue 24,230 1,873 - - - - Exercised during the year (22,177) (242) (11,363) (130) - - Movement of ESAR during the year 12,597 28,838 - - As at 31 December 2018 934,053 32,306 1,488,637 32,200 - -
Granted during the year - - - - 1,500,000 14,469Granted during the year due to Bonus Issue 20,745 488 32,537 1,045 - - Exercised during the year (47,379) (393) (34,848) (255) - - SARS payable on retirement/resignation (33,266) (60) (25,000) (66) - - Cancelled during the year (57,459) (1,352) (158,333) (5,084) (107,142) (2,882)Forfeited during the year (7,056) (166) (24,241) (778) - - Movement of ESAR during the year - (12,339) - 6,451 - 5,604As at 31 December 2019 809,638 18,484 1,278,752 33,513 1,392,858 17,191
The following table lists the input to the model used for valuation of the liability under SARs as at 31 December each year.
2019 2018Scheme 1 Scheme 2 Scheme 3 Scheme 1 Scheme 2
Dividend Yield 2.59% 2.59% 2.59% 2.65% 2.68%Expected Volatility 16.86% 16.86% 16.86% 18.43% 18.43%Risk Free Interest Rate 8.45% 8.45% 8.45% 11% 11%Expected Life of the Option 2.5 Years 3.25 Years 4.25 Years 3.5 Years 4.25 YearsWeighted Average Share Price on Grant Date 79.29 78.47 89.61 79.29 78.47
The expected volatility reflects the assumption that the historical volatility is indicative of future trends, which may also not necessarily be the actual outcome.
NOTES TO THE FINANCIAL STATEMENTS

139
NEXT GEN BANKING
24.3 Impairment in respect of off-balance sheet credit exposure
Future Working Life Time Bank/Group2019 2018
LKR'000 LKR'000
Balance as at 01 January 471,484 - Impact of first time adoption of SLFRS 9 - 424,236Charge / (Write back) to the income statement (Note 36) (42,429) 47,248Balance as at 31 December 429,055 471,484
25 TAXES
25.1 Accounting Policy
(i) Current Tax Current tax assets and liabilities for the current and prior year are measured at the amount expected to be recovered from or paid to the
taxation authorities. The tax rates and tax laws used to compute the amount are those that are enacted or substantively enacted by the reporting date.
Nations Trust Bank PLC Income tax on profit from the Domestic Banking Unit and on-shore operations of the Foreign Currency Banking Unit is calculated at the rate of
28%.
Subsidiary - Waldock Mackenzie Limited Income tax on profit from operations is calculated at the rate of 28%.
Subsidiary - Allied Properties Limited In terms of a BOI Agreement, the company enjoys a concessionary tax rate of 2% on its turnover for a period of 15 years commencing from 01
April 2007. Income tax on profit from other sources of income is calculated at 28%.
Subsidiary - Nations Insurance Brokers Limited Income tax on profit from operations is calculated at the rate of 28%.

140
Nations Trust Bank PLC Annual Report 2019
25 TAXES (CONTD.)
25.1 Accounting Policy (Contd.)
(ii) Deferred tax Deferred tax is provided on temporary differences at the reporting date between the tax bases of assets and liabilities and their carrying
amounts for financial reporting purposes. Deferred tax liabilities are recognized for all taxable temporary differences, except:
• Where deferred tax liability arises from the initial recognition of goodwill or of an asset or liability in a transaction that is not a business combination and at the time of the transaction, affects neither the accounting profit nor taxable profit or loss.
• In respect of taxable temporary differences associated with investments in subsidiaries, where the timing of the reversal of the temporary differences can be controlled and it is probable that the temporary differences will not reverse in the foreseeable future.
Deferred tax assets are recognized for all deductible temporary differences, carry forward of unused tax credits and unused tax losses, to the extent that it is probable that taxable profit will be available against which the deductible temporary differences, and the carry forward of unused tax credits and unused tax losses can be utilized except:
• Where the deferred tax asset relating to the deductible temporary difference arises from the initial recognition of an asset or liability in a transaction that is not a business combination and, at the time of the transaction, affects neither the accounting profit nor taxable profit or loss;
• In respect of deductible temporary differences associated with investments in subsidiaries, deferred tax assets are recognized only to the extent that it is probable that the temporary differences will reverse in the foreseeable future and taxable profit will be available against which the temporary differences can be utilized.
The carrying amount of deferred tax assets is reviewed at each reporting date and reduced to the extent that it is no longer probable that sufficient taxable profit will be available to allow all or part of the deferred tax asset to be utilized. Unrecognized deferred tax assets are reassessed at each reporting date and are recognized to the extent that it has become probable that future taxable profit will allow the deferred tax asset to be recovered.
Deferred tax assets (DTA) and liabilities (DTL) are measured at the tax rates that are expected to apply in the year when the asset is realized or the liability is settled, based on tax rates (and tax laws) that have been enacted or substantively enacted at the reporting date.
DTA and DTL are offset if a legally enforceable right exists to set off current tax assets against current tax liabilities and the deferred taxes relate to the same taxable entity and the same taxation authority.
NOTES TO THE FINANCIAL STATEMENTS

141
NEXT GEN BANKING 25
.2
Def
erre
d Ta
xatio
n
Bank
2019
2018
1/1/
2019
DTL/
(DTA
)Reco
gnise
d in
P&L
(Not
e 40.1
)
Reco
gnise
d in
OCI
31/1
2/20
19DT
L/(D
TA)
1/1/
2018
DTL/
(DTA
)Im
pact
of
first
time
adop
tion o
f SL
FRS 9
Reco
gnise
d in
P&L
(Not
e 40.1
)
Reco
gnise
d in
OCI
31/1
2/20
18DT
L/(D
TA)
Acce
lerate
d dep
reciat
ion al
lowan
ces f
or ta
x pur
pose
s - pr
opert
y, pla
nt an
d e
quipm
ent a
nd in
tangib
le as
sets
350,
184
(44,2
11) -
30
5,973
336,6
67 -
13
,517
-
350,1
84Ac
celer
ated d
eprec
iation
allow
ance
s for
tax p
urpo
ses-
leas
e ren
tals
rec
eivab
le1,2
44,71
5(5
03,38
3) -
74
1,332
1,754
,458
-
(509,7
43)
-
1,244
,715
Net g
ains o
n re-m
easu
ring o
f fina
ncial
asse
ts at
fair v
alue t
hrou
gh O
CI(38
,143)
-
155,5
78117
,435
80,73
4 -
-
(11
8,877
)(38
,143)
Reva
luatio
n of la
nd &
build
ings
262,3
57 -
47
,148
309,
505
262,3
57 -
-
-
26
2,357
Carry
forw
ard ta
x los
ses o
n lea
se bu
sines
s (27
9,80
6)27
9,80
6 -
-
(55
9,619
) -
27
9,813
-
(279,8
06)
Share
base
d pay
ments
(18,0
62)
(1,311
) -
(19
,373)
-
-
(18,06
2) -
(18
,062)
Retir
emen
t ben
efit p
lan - g
ratuit
y(13
4,535
)(41
,929
)(20
,957
)(19
7,421
)(13
7,085
) -
(4,
324)
6,874
(134,5
35)
Impa
irmen
t on l
oans
& ad
vanc
es
(8,75
4)(19
7,144
) -
(20
5,898
) -
-
(8
,754)
-
(8,75
4)Im
pairm
ent o
n othe
r fina
ncial
asse
ts(20
,019
)(15
,081
) -
(35
,100)
-
-
(20,01
9) -
(20
,019)
Impa
ct of
first
time a
dopti
on of
SLFR
S 9 - l
oans
& ad
vanc
es(39
1,270
)39
1,270
-
- -
(39
1,270
) -
-
(39
1,270
)Im
pact
of fir
st tim
e ado
ption
of SL
FRS 9
- othe
r fina
ncial
asse
ts(5
,884
)5,8
84 -
-
-
(5,88
4) -
-
(5,
884)
Impa
ct of
first
time a
dopti
on of
SLFR
S 16 -
opera
ting l
ease
-
(21,38
0) -
(21
,380)
-
-
-
-
-
Total
Timi
ng Di
fferen
ce96
0,78
3(14
7,479
)18
1,769
995,0
731,7
37,51
2(39
7,154
)(26
7,572
)(11
2,003
)96
0,783

142
Nations Trust Bank PLC Annual Report 2019
25
TAXE
S (C
ON
TD.)
25.2
D
efer
red
Taxa
tion
(Con
td.)
Grou
p20
1920
181/
1/20
19DT
L/(D
TA)Re
cogn
ised i
n P&
L(N
ote 4
0.1)
Reco
gnise
d in
OCI
31/1
2/20
19DT
L/(D
TA)
1/1/
2018
DTL/
(DTA
)Im
pact
of
first
time
adop
tion o
f SL
FRS 9
Reco
gnise
d in
P&L
(Not
e 40.1
)
Reco
gnise
d in
OCI
31/1
2/20
18DT
L/(D
TA)
LKR'0
00 LK
R'000
LK
R'000
LK
R'000
LK
R'000
LKR'0
00 LK
R'000
LKR'0
00 LK
R'000
Acce
lerate
d dep
reciat
ion al
lowan
ces f
or ta
x pur
pose
s - pr
opert
y plan
t and
e
quipm
ent a
nd in
tangib
le as
sets
348,
942
(43,9
19)
-
305,0
2333
5,819
-
13,12
3 -
34
8,942
Acce
lerate
d dep
reciat
ion al
lowan
ces f
or ta
x pur
pose
s-
leas
e ren
tals r
eceiv
able
1,244
,715
(503
,383)
-
741,3
321,7
54,45
8 -
(50
9,743
) -
1,2
44,71
5Ne
t gain
s on r
e-mea
surin
g of fi
nanc
ial as
sets
at fai
r valu
e thr
ough
OCI
(38,14
4) -
15
5,578
117,43
580
,733
-
-
(118,8
77)
(38,14
4)Re
valua
tion o
f land
& bu
ilding
s35
4,936
-
123,7
3847
8,67
535
4,936
-
-
-
354,9
36Ca
rry fo
rward
Tax l
osse
s on l
ease
busin
ess
(279,
806)
279,
806
-
-
(559,6
18)
-
279,8
12 -
(27
9,806
)Sh
are ba
sed p
ayme
nts(18
,062
)(1,
311)
-
(19,37
3) -
-
(18
,062)
-
(18,06
2)Re
tirem
ent b
enefi
t plan
- grat
uity
(135,9
24)
(41,8
37)
(21,0
66)
(198,
827)
(138,3
99)
-
(4,58
7)7,0
61(13
5,924
)Im
pairm
ent o
n loa
ns &
adva
nces
(9
,126)
(198,
969)
-
(208,
095)
-
-
(9,12
6) -
(9
,126)
Impa
irmen
t on o
ther fi
nanc
ial as
sets
(20,0
19)
(15,0
82)
-
(35,10
0) -
-
(20
,019)
-
(20,01
9)Im
pact
of fir
st tim
e ado
ption
of SL
FRS 9
- loa
ns &
adva
nces
(391,2
70)
391,2
70 -
-
-
(391,2
70)
-
-
(391,2
70)
Impa
ct of
first
time a
dopti
on of
SLFR
S 9 - o
ther fi
nanc
ial as
sets
(5,8
84)
5,884
-
- -
(5,
884)
-
-
(5,88
4)Im
pact
of fir
st tim
e ado
ption
of SL
FRS 1
6 - op
eratin
g lea
se -
(21
,561)
-
(21,56
1) -
-
-
-
-
To
tal Ti
ming
Diffe
rence
1,050
,358
(149,
102)
258,
250
1,159
,506
1,827
,929
(397,1
54)
(268,6
02)
(111,8
16)
1,050
,358
De
ferr
ed ta
x has
bee
n de
term
ined
bas
ed o
n th
e effe
ctive
tax r
ate o
f 28%
.
NOTES TO THE FINANCIAL STATEMENTS

143
NEXT GEN BANKING
26 STATED CAPITAL
Bank/Group2019 2018
Number LKR'000 Number LKR'000
Ordinary Shares - VotingIssued and fully paidAs at 01 January 238,664,673 5,739,916 230,607,283 5,101,369Scrip Dividend for 2017 (Note 42.1) - - 5,991,740 473,347Scrip Dividend for 2018 (Note 42.1) 5,176,579 466,410 - - Conversion of Non - Voting Shares to Voting Shares 1,037,589 82,981 2,065,650 165,200As at 31 December 244,878,841 6,289,307 238,664,673 5,739,916
Ordinary Shares - Convertible Non - Voting Issued and fully paidAs at 01 January 39,082,463 3,125,607 - - Rights Issue* - - 40,105,614 3,208,449Scrip Dividend for 2017 (Note 42.1) - - 1,042,499 82,358Scrip Dividend for 2018 (Note 42.1) 928,157 76,202 - -Conversion of Non - Voting Shares to Voting Shares (1,037,589) (82,981) (2,065,650) (165,200)As at 31 December 38,973,031 3,118,828 39,082,463 3,125,607
Total Ordinary Shares/Stated Capital as at 31 December 283,851,872 9,408,135 277,747,136 8,865,523
*Rights Issue - During the year, the Bank issued 40,105,614 Convertible Non-Voting Shares (Convertible to Ordinary Voting Shares) at a price of LKR 80 per share in order to raise a sum of up to LKR 3,208,449,120, in the proportion of 4 Convertible Non-Voting Shares for every 23 Ordinary Voting Shares held by the Shareholders in the Register of Shareholders, as at 12 January 2018. Such issued Convertible Non-Voting Shares shall have the option of convertibility into Ordinary Voting Shares at every calendar quarter at a conversion ratio of 1 Ordinary Voting Share for every 1 Convertible Non-Voting Share.
27 STATUTORY RESERVE FUND27.1 Statutory reserve fund is maintained as per the requirement in terms of Section 20 of the Banking Act No. 30 of 1988. Accordingly, a sum
equivalent to 5% of profit after tax is transferred to the reserve fund until reserve fund is equal to 50% of the Bank's Stated Capital. Thereafter a further 2% of profits will be transferred until the said reserve fund is equal to the Bank's stated Capital.
27.2 Movement in Statutory Reserve Fund
Bank / Group2019 2018
LKR'000 LKR'000
As at 01 January 1,199,130 1,010,732Transfers during the year (Note 28) 172,723 188,398As at 31 December 1,371,853 1,199,130

144
Nations Trust Bank PLC Annual Report 2019
28 RETAINED EARNINGS
Bank Group2019 2018 2019 2018
LKR'000 LKR'000 LKR'000 LKR'000
As at 01 January 15,820,900 13,813,403 16,179,448 14,237,649Impact of first time adoption of SLFRS 9 - (1,021,253) - (1,021,253)Total Comprehensive Income 3,400,575 3,785,645 3,659,351 3,719,947Dividend Paid (583,269) (568,497) (583,269) (568,497)Transfers to Reserve Fund (Note 27.2) (172,723) (188,398) (172,723) (188,398)As at 31 December 18,465,483 15,820,900 19,082,807 16,179,448
29 OTHER RESERVES
29.1 Other Comprehensive Income (OCI) Reserve
Bank / Group2019 2018
LKR'000 LKR'000
As at 01 January (98,082) 207,600Net gains / (losses) on re-measuring financial assets fair value through OCI 555,636 (424,559)Income tax relating to the above (155,578) 118,877As at 31 December 301,976 (98,082)
29.2 Revaluation Reserve
Bank Group2019 2018 2019 2018
LKR'000 LKR'000 LKR'000 LKR'000
As at 01 January 674,631 674,631 912,691 912,691Revaluation Surplus 168,387 - 441,922 - Deferred Tax charge relating to revaluation (Note 25.2) (47,148) - (123,738) - As at 31 December 795,870 674,631 1,230,875 912,691
NOTES TO THE FINANCIAL STATEMENTS

145
NEXT GEN BANKING
30 INTEREST INCOME
Accounting Policy The Bank calculates interest income by applying the EIR to the gross carrying amount of financial assets other than credit-impaired assets.
The Bank ceases the recognition of interest income on assets when it is probable that the economic benefits associated will not continue to flow to the Bank. Interest income on all trading assets and financial assets mandatorily required to be measured at FVPL is also recognised using the contractual interest rate in interest income.
Bank GroupFor the Year Ended 31 December 2019 2018 2019 2018
LKR'000 LKR'000 LKR'000 LKR'000
Cash and Cash Equivalents 48,277 46,220 48,277 46,220Financial Assets Recognized through Profit or Loss - Measured at fair value 218,407 100,189 218,407 100,189Financial Assets at Amortised Cost - Loans and Advances to Customers 32,228,385 29,958,510 32,229,056 29,968,084 - Reverse Repurchase Agreements 166,598 113,000 166,598 113,000 - Debt Instruments 1,839,547 1,503,562 1,839,547 1,510,043Financial Assets Measured at Fair Value Through Other Comprehensive Income
4,872,337 4,557,802 4,872,337 4,557,802
Interest Income Accrued on Impaired Financial Assets 197,309 755,071 197,309 755,07139,570,860 37,034,354 39,571,531 37,050,409
a Net interest income from Sri Lanka government securities
Bank GroupFor the Year Ended 31 December 2019 2018 2019 2018
LKR'000 LKR'000 LKR'000 LKR'000
Interest income 6,755,854 5,885,108 6,755,854 5,891,589Less: Interest expenses - - - - Net interest income from Sri Lanka government securities 6,755,854 5,885,108 6,755,854 5,891,589

146
Nations Trust Bank PLC Annual Report 2019
31 INTEREST EXPENSE
Accounting Policy The Bank calculates interest expense by applying the EIR to the carrying amount of financial liabilities.
Bank GroupFor the Year Ended 31 December 2019 2018 2019 2018
LKR'000 LKR'000 LKR'000 LKR'000
Due to banks 828,961 261,977 828,961 261,977Financial liabilities at amortised cost- Due to customers 18,450,986 18,018,869 18,443,432 18,005,714- Repurchase agreements 1,330,351 1,146,832 1,279,204 1,120,936- Due to Debt Security Holders 1,108,282 1,341,026 1,108,282 1,341,026- Due to Other Borrowers 1,591,571 1,155,858 1,591,571 1,156,849- Interest Expense on Lease Liabilities 196,823 - 181,077 - Others 3,110 - 4,532 -
23,510,084 21,924,562 23,437,059 21,886,502
32 NET FEE AND COMMISSION INCOME
Accounting Policy
Fee Income The Group earns fee and commission income from a diverse range of services it provides to its customers. Fee income can be divided in to the
following three categories:
a) Fee income earned from services that are provided over a certain period of time Fees earned for the provision of services are recognised as revenue as the services are provided. These fees include commission income and asset management fees, custody and other management and advisory fees.
b) Fee income from providing financial services are earned on the execution of a significant act Fees and commissions arising from negotiating or participating in the negotiation of a transaction for a third party, such as the arrangement/participation or negotiation of the lending transactions or other securities are recognised on completion of the underlying transaction. Fees or components of fees that are linked to a certain performance are recognised after fulfilling the corresponding criteria.
c) Fee income forming an integral part of the corresponding financial instrument Fees that the Bank considers to be an integral part of the corresponding financial instruments include: loan origination fees, loan commitment fees for loans that are likely to be drawn down and other credit related fees. The recognition of these fees (together with any incremental costs) form an integral part of the corresponding financial instruments and are recognised as interest income through an adjustment to the EIR. The exception is, when it is unlikely that a loan will be drawn down, the loan commitment fees are recognised as revenue on expiry.
Fee Expense
Fee expenses have been recognized in the Financial Statements as they are incurred in the period to which they relate.
NOTES TO THE FINANCIAL STATEMENTS

147
NEXT GEN BANKING
32.1 Fees and Commission Income
Bank GroupFor the Year Ended 31 December 2019 2018 2019 2018
LKR'000 LKR'000 LKR'000 LKR'000
Portfolio and Other Management Fees - - 2,639 2,475Credit Card Related Fee and Commission 3,414,325 3,432,103 3,414,325 3,432,020Commission on Trade Finance Facilities & Remittances 719,131 674,648 719,131 674,648Commission on Services - Loans 1,139,195 1,171,636 1,139,195 1,171,636Commission on Services - Deposits 563,818 454,078 563,818 454,078Other Fees 358,246 283,688 642,728 571,377
6,194,715 6,016,153 6,481,836 6,306,234
32.2 Fees and Commission Expenses
Bank GroupFor the Year Ended 31 December 2019 2018 2019 2018
LKR'000 LKR'000 LKR'000 LKR'000
Brokerage Fees (27,591) (21,225) (27,591) (21,225)Credit Card Related Fees (252,379) (193,646) (252,379) (193,646)Others (45,136) (50,478) (45,136) (50,478)
(325,106) (265,349) (325,106) (265,349)
Net Fee and Commission Income 5,869,609 5,750,804 6,156,730 6,040,885
33 NET GAIN/ (LOSS) FROM TRADING “Net gains/(losses) from trading” comprised of all realised and unrealised foreign exchange transactions and realized fair value changes on
fixed income securities.
Bank GroupFor the Year Ended 31 December 2019 2018 2019 2018
LKR'000 LKR'000 LKR'000 LKR'000
Foreign exchange- From Banks (346,491) (191,646) (346,491) (191,646)- From Other Customers 786,925 813,582 786,925 813,582Fixed Income Securities (Realised) 283,225 (28,177) 283,225 (28,005)Derivative financial instruments (2,039,317) 2,184,489 (2,039,317) 2,184,489
(1,315,658) 2,778,248 (1,315,658) 2,778,420

148
Nations Trust Bank PLC Annual Report 2019
34 NET FAIR VALUE GAINS/ (LOSSES) FROM FINANCIAL INSTRUMENTS AT FAIR VALUE THROUGH PROFIT OR LOSS
Results arising from unrealized net gains/losses due to change in fair value of financial instruments at fair value through profit or loss.
Bank / GroupFor the Year Ended 31 December 2019 2018
LKR'000 LKR'000
Net gains on financial assets at fair value through profit or loss 11,030 - Net losses on financial assets at fair value through profit or loss - (3,758)
11,030 (3,758)
35 NET OTHER OPERATING INCOME/(LOSS)
Accounting Policy
(i) Dividend Income Dividend income is recognized when the Group’s right to receive the payment is established, which is generally when the shareholders approve
the dividend.
(ii) Rental Income Rental income is recognized on an accrual basis.
(iii) Other Income Other income is recognized on an accrual basis.
For the Year Ended 31 December Bank Group2019 2018 2019 2018
LKR'000 LKR'000 LKR'000 LKR'000
Dividend Income 4,732 294,489 4,732 3,960Gain/(Loss) on Sale of Property, Plant and Equipment (2) (9,609) 12 (8,261)Gain/(Loss) on Revaluation of Foreign Exchange 1,090,693 (2,999,101) 1,090,693 (2,999,101)Other Non-Trading Foreign Exchange (11,465) (100,817) (11,465) (100,817)Recovery of Loans Written -Off 236,250 265,438 236,250 265,438Others 245,339 168,913 245,339 168,913
1,565,547 (2,380,687) 1,565,561 (2,669,868)
NOTES TO THE FINANCIAL STATEMENTS

149
NEXT GEN BANKING
36 IMPAIRMENT CHARGES
Bank GroupFor the Year Ended 31 December 2019 2018 2019 2018
Note LKR'000 LKR'000 LKR'000 LKR'000
Financial assets at amortised cost - Loans and Advances Stage 1 13.4 37,577 (44,091) 37,577 (44,091) Stage 2 13.4 (47,158) 15,979 (47,158) 15,979 Stage 3 13.4 (3,294,029) (3,125,851) (3,294,029) (3,125,851)Financial assets at amortised cost – Debt Instruments Stage 1 12.3 (3,979) (7,361) (3,979) (7,361) Stage 2 - - - - Stage 3 12.3 - (42,373) - (42,373)Financial assets at amortised cost – Others Stage 1 6.1 (775) (43) (775) (43) Stage 2 - - - - Stage 3 14.1 (28,098) (21,721) (34,619) (23,049)Contingent liabilities & commitments Stage 1 24.3 25,837 (61,283) 25,837 (61,283) Stage 2 24.3 11,085 (10,898) 11,085 (10,898) Stage 3 24.3 5,507 24,934 5,507 24,934Total Impairment Loss (3,294,033) (3,272,708) (3,300,554) (3,274,036)
Following is a sensitivity analysis of macro economic factors used in the expected credit loss calculation.
Change in Macro Economic Factors Impact on Allowance for Credit Loss
2019 2018 LKR'000 LKR'000
1% 12,799 18,9365% 63,995 94,678
10% 127,990 189,356
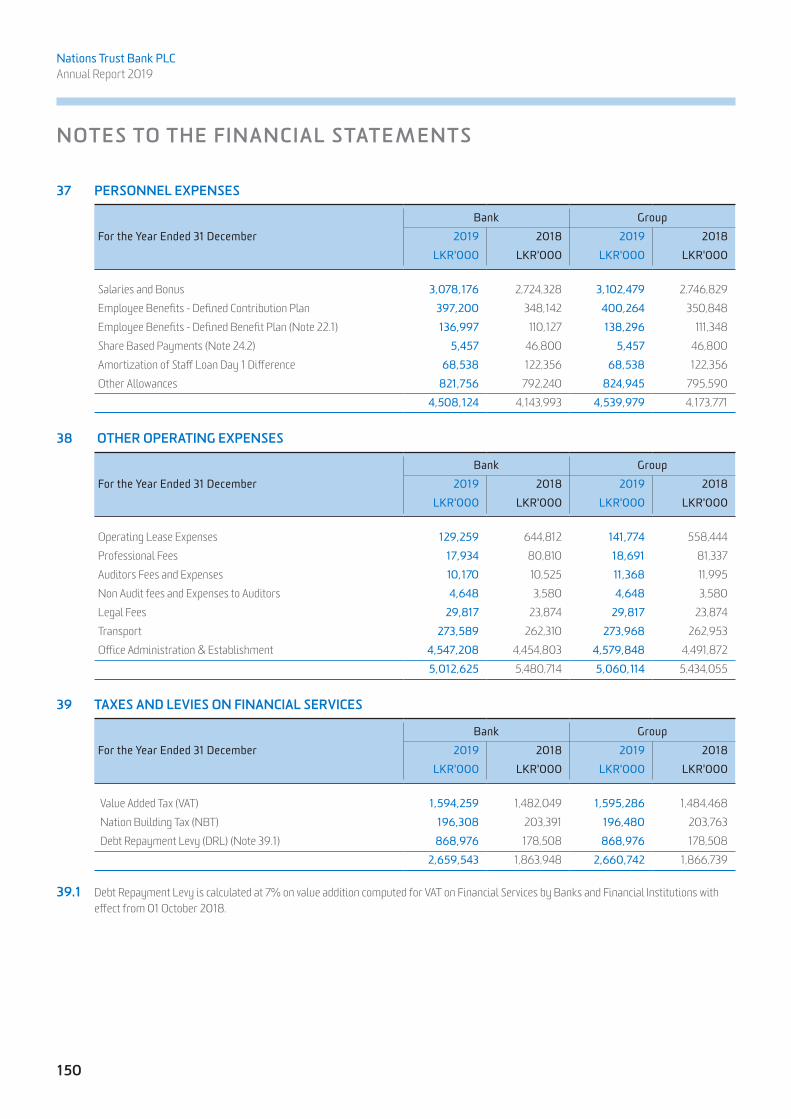
150
Nations Trust Bank PLC Annual Report 2019
37 PERSONNEL EXPENSES
Bank GroupFor the Year Ended 31 December 2019 2018 2019 2018
LKR'000 LKR'000 LKR'000 LKR'000
Salaries and Bonus 3,078,176 2,724,328 3,102,479 2,746,829Employee Benefits - Defined Contribution Plan 397,200 348,142 400,264 350,848Employee Benefits - Defined Benefit Plan (Note 22.1) 136,997 110,127 138,296 111,348Share Based Payments (Note 24.2) 5,457 46,800 5,457 46,800Amortization of Staff Loan Day 1 Difference 68,538 122,356 68,538 122,356Other Allowances 821,756 792,240 824,945 795,590
4,508,124 4,143,993 4,539,979 4,173,771
38 OTHER OPERATING EXPENSES
Bank GroupFor the Year Ended 31 December 2019 2018 2019 2018
LKR'000 LKR'000 LKR'000 LKR'000
Operating Lease Expenses 129,259 644,812 141,774 558,444Professional Fees 17,934 80,810 18,691 81,337Auditors Fees and Expenses 10,170 10,525 11,368 11,995Non Audit fees and Expenses to Auditors 4,648 3,580 4,648 3,580Legal Fees 29,817 23,874 29,817 23,874Transport 273,589 262,310 273,968 262,953Office Administration & Establishment 4,547,208 4,454,803 4,579,848 4,491,872
5,012,625 5,480,714 5,060,114 5,434,055
39 TAXES AND LEVIES ON FINANCIAL SERVICES
Bank GroupFor the Year Ended 31 December 2019 2018 2019 2018
LKR'000 LKR'000 LKR'000 LKR'000
Value Added Tax (VAT) 1,594,259 1,482,049 1,595,286 1,484,468 Nation Building Tax (NBT) 196,308 203,391 196,480 203,763 Debt Repayment Levy (DRL) (Note 39.1) 868,976 178,508 868,976 178,508
2,659,543 1,863,948 2,660,742 1,866,739
39.1 Debt Repayment Levy is calculated at 7% on value addition computed for VAT on Financial Services by Banks and Financial Institutions with effect from 01 October 2018.
NOTES TO THE FINANCIAL STATEMENTS

151
NEXT GEN BANKING
40 INCOME TAX EXPENSE
40.1 Amount recognized in profit or loss
Bank GroupFor the Year Ended 31 December 2019 2018 2019 2018
LKR'000 LKR'000 LKR'000 LKR'000
The component of Income Tax expense for years ended 31 December 2019 & 2018 are ;Current Tax ExpenseCurrent Income Tax on Profit for the Year (Note 40.2) 2,565,464 2,349,090 2,639,265 2,420,35810% Withholding Tax on Subsidiary Dividend - - - 32,282Over Provision in respect of Prior Years (420,623) (26,620) (420,623) (26,620)Deferred Tax ExpenseCharge for Deferred Tax (Note 25.2) (147,479) (267,572) (149,102) (268,602)
1,997,362 2,054,898 2,069,540 2,157,418
Effective Income Tax Rate 36.64% 35.29% 35.79% 36.82%
40.2 Reconciliation of Accounting Profit and Taxable Income A reconciliation between the tax expense and the accounting profit multiplied by Government of Sri Lanka's applicable tax rate for the years
ended 31 December 2019 and 2018 is as follows;
Bank GroupFor the Year Ended 31 December 2019 2018 2019 2018
LKR'000 LKR'000 LKR'000 LKR'000
Accounting Profit (Profit before Taxation) 5,451,827 5,822,866 5,783,079 5,859,301Add : Disallowable Expenses 19,032,011 26,857,405 18,968,533 26,787,750
24,483,838 32,680,271 24,751,612 32,647,051
Less: Allowable Expenses (15,321,468) (23,873,135) (15,325,665) (23,875,916)Exempt Income - (417,530) - (127,001)Statutory Income 9,162,370 8,389,606 9,425,947 8,644,134Taxable Income 9,162,370 8,389,606 9,425,947 8,644,134
Current Income Tax Expense 2,565,464 2,349,090 2,639,265 2,420,358
The Group Tax expense is based on the taxable profit of each Company, since at present the tax laws do not provide for Group taxation.

152
Nations Trust Bank PLC Annual Report 2019
41 BASIC / DILUTED EARNINGS PER SHARE Basic Earnings Per Share is calculated by dividing the net profit for the year attributable to Ordinary Shareholders of the Bank by the weighted
average number of Ordinary Shares in issue during the year. The following table shows the income and share data used in the basic earnings per share calculation.
41.1 Earnings per Share - Basic / Diluted
Bank GroupFor the Year Ended 31 December 2019 2018 2019 2018
Amount Used as the Numerator:Net Profit Attributable to Ordinary Shareholders (LKR '000) 3,454,465 3,767,968 3,713,539 3,701,883
No of Ordinary Shares Used as the Denominator:Weighted Average Number of Ordinary Shares (Note 41.2) 283,851,872 282,574,147 283,851,872 282,574,147
Basic / Diluted Earnings per Share (LKR) 12.17 13.33 13.08 13.10
41.2 Weighted Average Number of Ordinary Shares There have been no transactions involving ordinary shares or potential ordinary shares between the reporting date and the date of
authorisation of these financial statements that require adjustment of the weighted average number of ordinary shares.
42 DIVIDENDS PAID AND DECLARED Dividends on ordinary shares are recognized as a liability and deducted from equity when they are approved by the Board of Directors of the
Bank. Dividends for the year that are approved after the reporting date are disclosed as an event after the reporting date (Note 50).
42.1 Paid During the Year
Bank/ GroupFor the Year Ended 31 December 2019 2018
LKR'000 LKR'000
Dividends on Ordinary Voting Shares:First and Final dividend for 2018 : LKR 2.10 per share* (2017 : LKR 2.10 per share**) 501,382 484,275
Dividends on Ordinary Non-Voting Shares:First and Final dividend for 2018 : LKR 2.10 per share* (2017 : LKR 2.10 per share**) 81,887 84,222
583,269 568,497
*Dividend for the year 2018 was paid in the form of a scrip dividend in the proportion of 01 share for every 46.10018487 Ordinary Voting Shares amounting to a total of 5,176,579 new Ordinary Voting Shares and 01 share for every 42.00693871 Convertible Non-Voting Shares (Convertible to Ordinary Voting Shares) amounting to a total of 928,157 new Convertible Non-Voting Shares. Fractions in shares were paid in cash.
** Dividend for the year 2017 was paid in the form of a scrip dividend in the proportion of 01 share for every 38.4644498 shares for both Ordinary Voting Shares and Convertible Non-Voting Shares (Convertible to Ordinary Voting Shares). Fractions in shares were paid in cash.
NOTES TO THE FINANCIAL STATEMENTS

153
NEXT GEN BANKING
42.2 Declared by the Board of Directors (not recognized as a liability as at 31 December)
Bank/ GroupAs at 31 December 2019 2018
LKR'000 LKR'000
Dividends on Ordinary Voting Shares: First and Final dividend for 2019: LKR 2.30 per share 563,221 501,382 (2018: LKR 2.10 per share)
Dividends on Ordinary Non-Voting Shares:First and Final dividend for 2019: LKR 2.30 per share 89,638 81,887 (2018: LKR 2.10 per share)
652,859 583,269
42.3 Scrip Dividend Conversion Ratio Scrip dividend is declared by the Board of Directors in the proportion of 01 share for every;
Bank/ GroupAs at 31 December 2019 2018
Ordinary Voting Shares (Number) - 46.10018487Convertible Non-Voting Shares (Number) - 42.00693871
43 CASH FLOW INFORMATION
43.1 (Increase)/Decrease in Operating Assets
Bank GroupFor the Year Ended 31 December 2019 2018 2019 2018
LKR'000 LKR'000 LKR'000 LKR'000
Reverse Repurchase Agreements (13,639,817) (169,800) (13,639,817) (169,800)Financial Assets - At Fair Value through Profit or Loss 36,660 (144,500) 36,660 (144,500)Financial Assets - At Amortized Cost - Debt Instruments (2,472,597) 140,528 (2,472,597) 215,629Financial Assets - At Fair Value through Other Comprehensive Income
21,122,294 (20,061,154) 21,122,294 (20,061,154)
Financial Assets - At Amortized Cost - Loans & Advances (9,383,892) (38,200,630) (9,381,476) (37,996,666)Other Assets (53,333) (126,589) (49,258) (140,753)
(4,390,685) (58,562,145) (4,384,194) (58,297,244)
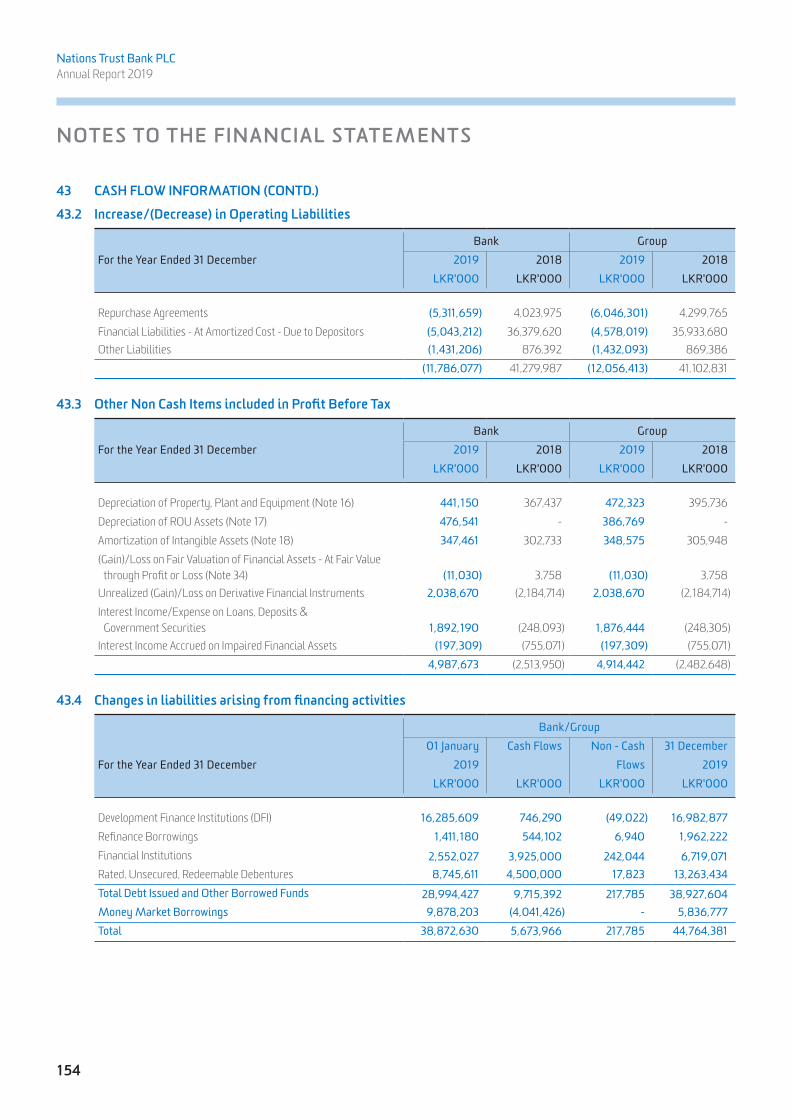
154
Nations Trust Bank PLC Annual Report 2019
43 CASH FLOW INFORMATION (CONTD.)
43.2 Increase/(Decrease) in Operating Liabilities
Bank GroupFor the Year Ended 31 December 2019 2018 2019 2018
LKR'000 LKR'000 LKR'000 LKR'000
Repurchase Agreements (5,311,659) 4,023,975 (6,046,301) 4,299,765Financial Liabilities - At Amortized Cost - Due to Depositors (5,043,212) 36,379,620 (4,578,019) 35,933,680Other Liabilities (1,431,206) 876,392 (1,432,093) 869,386
(11,786,077) 41,279,987 (12,056,413) 41,102,831
43.3 Other Non Cash Items included in Profit Before Tax
Bank GroupFor the Year Ended 31 December 2019 2018 2019 2018
LKR'000 LKR'000 LKR'000 LKR'000
Depreciation of Property, Plant and Equipment (Note 16) 441,150 367,437 472,323 395,736Depreciation of ROU Assets (Note 17) 476,541 - 386,769 -Amortization of Intangible Assets (Note 18) 347,461 302,733 348,575 305,948(Gain)/Loss on Fair Valuation of Financial Assets - At Fair Value through Profit or Loss (Note 34) (11,030) 3,758 (11,030) 3,758Unrealized (Gain)/Loss on Derivative Financial Instruments 2,038,670 (2,184,714) 2,038,670 (2,184,714)Interest Income/Expense on Loans, Deposits & Government Securities 1,892,190 (248,093) 1,876,444 (248,305)Interest Income Accrued on Impaired Financial Assets (197,309) (755,071) (197,309) (755,071)
4,987,673 (2,513,950) 4,914,442 (2,482,648)
43.4 Changes in liabilities arising from financing activities
Bank/Group01 January Cash Flows Non - Cash 31 December
For the Year Ended 31 December 2019 Flows 2019 LKR'000 LKR'000 LKR'000 LKR'000
Development Finance Institutions (DFI) 16,285,609 746,290 (49,022) 16,982,877 Refinance Borrowings 1,411,180 544,102 6,940 1,962,222 Financial Institutions 2,552,027 3,925,000 242,044 6,719,071 Rated, Unsecured, Redeemable Debentures 8,745,611 4,500,000 17,823 13,263,434 Total Debt Issued and Other Borrowed Funds 28,994,427 9,715,392 217,785 38,927,604 Money Market Borrowings 9,878,203 (4,041,426) - 5,836,777 Total 38,872,630 5,673,966 217,785 44,764,381
NOTES TO THE FINANCIAL STATEMENTS

155
NEXT GEN BANKING
Bank/Group01 January Cash Flows Non - Cash 31 December
For the Year Ended 31 December 2018 Flows 2018 LKR'000 LKR'000 LKR'000 LKR'000
Development Finance Institutions (DFI) 8,395,298 7,842,952 47,358 16,285,608 Refinance Borrowings 702,132 704,215 4,833 1,411,180 Financial Instituitions 2,564,793 - (12,766) 2,552,027 Rated, Unsecured, Redeemable Debentures 8,075,351 500,000 170,260 8,745,611 Total Debt Issued and Other Borrowed Funds 19,737,574 9,047,167 209,685 28,994,426 Money Market Borrowings 10,567,825 (689,622) - 9,878,203 Total 30,305,399 8,357,545 209,685 38,872,629
44 RELATED PARTY DISCLOSURES The Bank has carried out transactions with related parties as defined in LKAS 24 - Related Party Disclosures. The pricing applicable to such
transactions were based on the assessment of risk and pricing model of the Bank and was comparable with what was applied to transactions between the Bank and non related parties.
44.1 Transactions with Key Management Personnel Key Management Personnel (KMP) include the Board of Directors of the Bank and the Chief Executive Officer of the Bank.
(a) Compensation to Key Management Personnel
For the Year Ended 31 December 2019 2018 LKR'000 LKR'000
Key Management Personnel Benefits 72,009 71,127Post Employment Benefits 4,026 3,728
76,035 74,855
In addition to the salaries, the Group also has arranged non cash benefits such as vehicle & insurance to the Executive Director in line with approved benefits plan of the Group. The Executive Director is also entitled to 161,931 (2018 - 112,115) share appreciation rights.
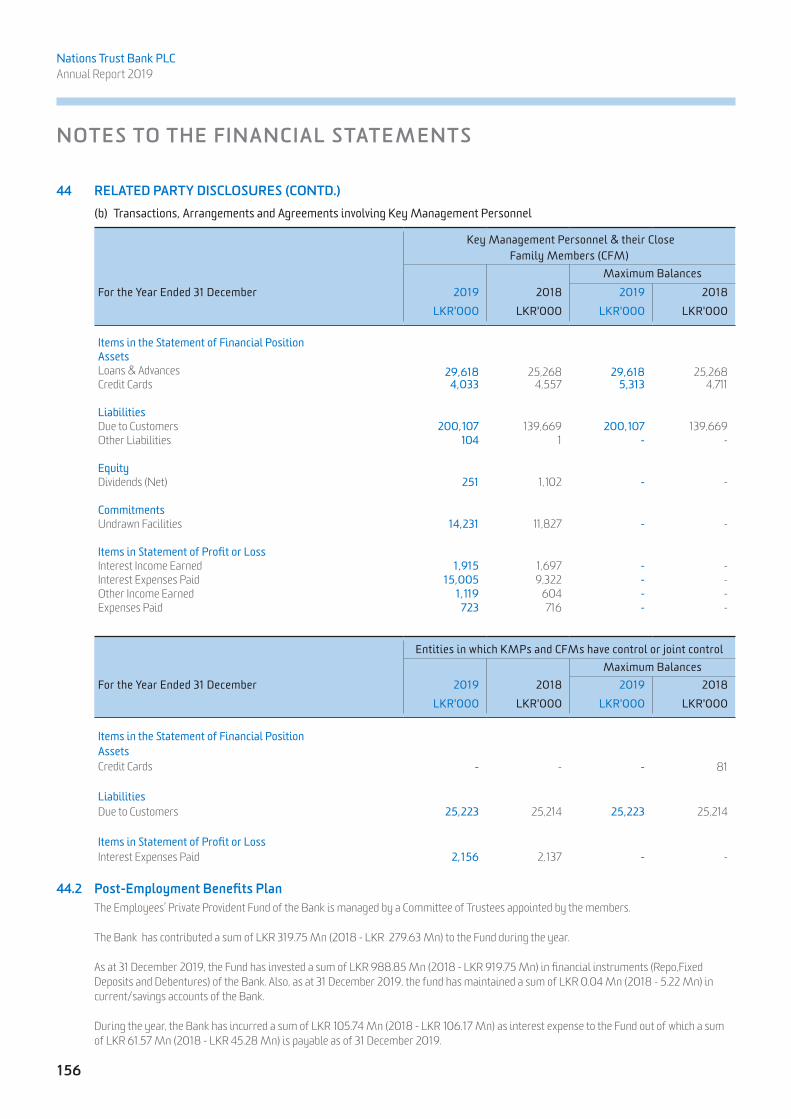
156
Nations Trust Bank PLC Annual Report 2019
44 RELATED PARTY DISCLOSURES (CONTD.) (b) Transactions, Arrangements and Agreements involving Key Management Personnel
Key Management Personnel & their Close Family Members (CFM)
Maximum BalancesFor the Year Ended 31 December 2019 2018 2019 2018
LKR'000 LKR'000 LKR'000 LKR'000
Items in the Statement of Financial PositionAssetsLoans & Advances 29,618 25,268 29,618 25,268Credit Cards 4,033 4,557 5,313 4,711
LiabilitiesDue to Customers 200,107 139,669 200,107 139,669Other Liabilities 104 1 - -
EquityDividends (Net) 251 1,102 - -
CommitmentsUndrawn Facilities 14,231 11,827 - -
Items in Statement of Profit or LossInterest Income Earned 1,915 1,697 - - Interest Expenses Paid 15,005 9,322 - - Other Income Earned 1,119 604 - - Expenses Paid 723 716 - -
Entities in which KMPs and CFMs have control or joint controlMaximum Balances
For the Year Ended 31 December 2019 2018 2019 2018 LKR'000 LKR'000 LKR'000 LKR'000
Items in the Statement of Financial PositionAssetsCredit Cards - - - 81
LiabilitiesDue to Customers 25,223 25,214 25,223 25,214
Items in Statement of Profit or LossInterest Expenses Paid 2,156 2,137 - -
44.2 Post-Employment Benefits Plan The Employees’ Private Provident Fund of the Bank is managed by a Committee of Trustees appointed by the members.
The Bank has contributed a sum of LKR 319.75 Mn (2018 - LKR 279.63 Mn) to the Fund during the year.
As at 31 December 2019, the Fund has invested a sum of LKR 988.85 Mn (2018 - LKR 919.75 Mn) in financial instruments (Repo,Fixed Deposits and Debentures) of the Bank. Also, as at 31 December 2019, the fund has maintained a sum of LKR 0.04 Mn (2018 - 5.22 Mn) in current/savings accounts of the Bank.
During the year, the Bank has incurred a sum of LKR 105.74 Mn (2018 - LKR 106.17 Mn) as interest expense to the Fund out of which a sum of LKR 61.57 Mn (2018 - LKR 45.28 Mn) is payable as of 31 December 2019.
NOTES TO THE FINANCIAL STATEMENTS

157
NEXT GEN BANKING 44
.3
Tran
sact
ions
with
Rel
ated
Ent
ities
Subs
idiar
ies *
Signifi
cant
Inve
stors
**Sig
nifica
nt In
vesto
r Rela
ted En
tities
***
Max
imum
Bala
nces
Max
imum
Bala
nces
Max
imum
Bala
nces
Year
Ende
d 31 D
ecem
ber
2019
2018
2019
2018
2019
2018
2019
2018
2019
2018
2019
2018
LKR'0
00 LK
R'000
LK
R'000
LK
R'000
LK
R'000
LKR'0
00 LK
R'000
LKR'0
00 LK
R'000
LKR'0
00 LK
R'000
LKR'0
00
Items
in th
e Stat
emen
t of F
inanc
ial Po
sition
Asse
tsLo
ans &
Adva
nces
-
-
-
33,86
1 -
81
5,514
845,7
8882
4,211
82,9
5659
,881
310,
039
123,2
35Co
rpora
te Cr
edit C
ards
-
-
-
-
260
-
422
163
187
4,100
962
5,542
Reve
rse Re
purch
ase A
gree
ments
-
-
-
-
-
-
-
-
-
-
-
-
Deriv
ative
Fina
ncial
Asse
ts -
-
-
-
-
-
-
-
-
61
,637
-
-
Othe
r Asse
ts -
1,1
24 -
1,1
24-
-
-
-
17,6
7413
,146
-
-
Liabil
ities
Due t
o Cus
tomers
8,47
147
2,399
500,
559
509,6
101,3
55,58
85,5
67,28
14,1
58,16
410
,396,2
2156
5,843
1,413
,884
1,513
,970
1,633
,951
Borro
wing
& O
thers
846,
219
102,3
4885
0,85
758
3,201
3,438
,788
2,559
,503
4,929
,695
3,117
,749
1,260
,414
352,2
521,2
60,41
452
3,190
Debe
nture
Issue
d -
-
-
-
-
-
-
-
57
,000
629,5
0057
,000
629,5
00Ot
her L
iabilit
ies -
-
-
-
1,0
569,9
42-
-10
5,185
257,1
48 -
-
De
rivati
ve Fi
nanc
ial Li
abilit
ies -
-
-
-
-
-
-
-
-
72
1 -
-
Equit
yDi
viden
ds (N
et) -
-
-
-
37
0,59
237
9,572
-
-
-
-
-
-
Comm
itmen
tsUn
draw
n Fac
ilities
-
-
-
-
1,907
,296
6,737
-
-
1,094
,328
743,6
58 -
-
Le
tter o
f Cred
it / Gu
arante
es -
-
-
-
10
8,96
942
,764
-
-
281,2
3544
6,291
-
-
Forw
ard - F
oreign
Exch
ange
Contr
acts
-
- -
-
-
-
-
-
-
56
2,945
-
-
Items
in In
come
state
ment
Int
erest
Incom
e Ear
ned
-
798
-
-
28,0
1850
,813
-
-
12,12
75,9
87 -
-
Int
erest
Expe
nses
Paid
58,70
139
,051
-
-
248,
313
659,8
44 -
-
47
,160
159,2
34 -
-
Ot
her In
come
Earn
ed7,6
208,0
46 -
-
1,9
325,7
41 -
-
26
1,672
141,8
90 -
-
Di
viden
d Rec
eived
(Gros
s) -
29
0,529
-
-
-
-
-
-
--
--
Expe
nses
Paid
86,9
2580
,777
-
-
25,0
6037
,399
-
-
61,13
489
,830
-
-
*
Subs
idia
ries o
f the
Gro
up in
clude
s Wal
dock
Mac
kenz
ie L
imite
d, A
llied
Pro
pert
ies L
imite
d an
d N
atio
ns In
sura
nce B
roke
rs L
imite
d.
**
Sign
ifica
nt In
vest
ors i
nclu
de Jo
hn K
eells
Hol
ding
s PLC
, Mac
kinn
on K
eells
Lim
ited,
HW
IC A
sia F
und,
Cen
tral F
inan
ce C
ompa
ny P
LC, C
F Gr
owth
Fun
d Li
mite
d an
d CF
Insu
ranc
e Br
oker
s (Pv
t) Lt
d.
**
* Si
gnifi
cant
inve
stor
rela
ted
entit
ies i
nclu
de en
titie
s con
trolle
d an
d/or
join
tly co
ntro
lled
by th
e sig
nific
ant i
nves
tors
of t
he B
ank a
nd p
rivat
e pro
viden
t fun
ds o
f suc
h sig
nific
ant
inve
stor
s. In
addi
tion
to th
e abo
ve, t
he b
ank h
as ca
rrie
d ou
t var
ious
pro
mot
iona
l act
ivitie
s with
rela
ted
entit
ies d
urin
g th
e yea
r.
Th
ere w
ere n
o tra
nsac
tions
carr
ied
out b
y th
e sub
sidia
ries o
f the
Ban
k with
rela
ted
part
y en
titie
s oth
er th
an w
ith th
e Ban
k, fo
r the
yea
r end
ed 31
Dec
embe
r 201
9 (2
018
- Nil)
.

158
Nations Trust Bank PLC Annual Report 2019
45 MATURITY ANALYSIS OF ASSETS AND LIABILITIES
As at 31 December 2019 Bank GroupWithin After Total Within After Total
12 months 12 months 12 months 12 months LKR'000 LKR'000 LKR'000 LKR'000 LKR'000 LKR'000
AssetsCash and Cash Equivalents 8,755,848 - 8,755,848 8,755,930 - 8,755,930 Balances with Central Bank of Sri Lanka 8,183,669 193,809 8,377,478 8,183,669 193,809 8,377,478 Reverse Repurchase Agreements 13,827,423 - 13,827,423 13,827,423 - 13,827,423 Derivative Financial Instruments 192,714 - 192,714 192,714 - 192,714 Financial Assets - Recognised through Profit or Loss 634,075 - 634,075 634,075 - 634,075 Financial Assets at Fair Value through Other Comprehensive Income 38,301,267 13,880 38,315,147 38,301,267 13,880 38,315,147 Financial Assets at Amortised Cost - Debt Instruments 2,133,651 16,928,955 19,062,606 2,133,651 16,928,955 19,062,606 Financial Assets at Amortised Cost – Loans and Advances 139,555,158 87,236,411 226,791,569 139,557,779 87,236,411 226,794,190 Other Assets 834,380 1,300,042 2,134,422 871,911 1,308,327 2,180,238 Investments in Subsidiaries - 678,710 678,710 - - - Property, Plant and Equipment - 3,023,776 3,023,776 - 4,072,538 4,072,538 Right of Use (ROU) Assets - 1,870,729 1,870,729 - 1,780,957 1,780,957 Intangible Assets - 1,375,581 1,375,581 - 1,376,159 1,376,159 Total Assets 212,418,186 112,621,893 325,040,078 212,458,419 112,911,036 325,369,455
LiabilitiesDue to Banks 6,484,157 - 6,484,157 6,484,157 - 6,484,157 Derivative Financial Instruments 311,971 - 311,971 311,971 - 311,971 Financial liabilities at amortised cost Due to Depositors 221,915,098 4,964,936 226,880,034 221,906,628 4,964,935 226,871,563 Repurchase Agreements 11,033,047 - 11,033,047 10,186,828 - 10,186,828 Due to Other Borrowers 4,822,903 22,557,775 27,380,678 4,727,053 22,557,775 27,284,828 Debt Securities Issued 271,758 12,991,676 13,263,434 271,758 12,991,676 13,263,434 Retirement benefit obligations 99,739 552,734 652,473 100,806 558,648 659,454 Current Tax Liabilities 1,337,499 - 1,337,499 1,362,108 - 1,362,108 Other Liabilities 5,422,041 936,354 6,358,395 5,448,537 941,423 6,389,960Deferred Tax Liabilities 228,452 766,621 995,073 228,069 931,437 1,159,506 Total Liabilities 251,926,666 42,770,096 294,696,761 251,027,915 42,945,894 293,973,809
Net (39,508,480) 69,851,797 30,343,317 (38,569,496) 69,965,142 31,395,646
NOTES TO THE FINANCIAL STATEMENTS
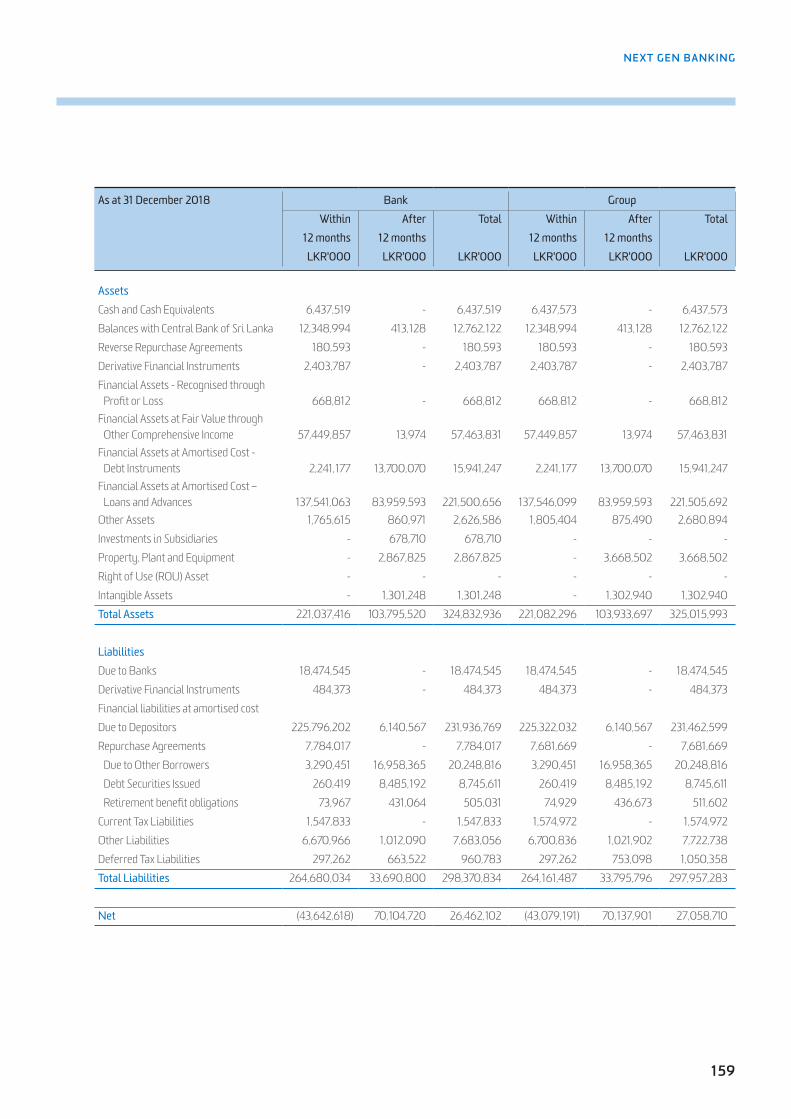
159
NEXT GEN BANKING
As at 31 December 2018 Bank GroupWithin After Total Within After Total
12 months 12 months 12 months 12 months LKR'000 LKR'000 LKR'000 LKR'000 LKR'000 LKR'000
AssetsCash and Cash Equivalents 6,437,519 - 6,437,519 6,437,573 - 6,437,573Balances with Central Bank of Sri Lanka 12,348,994 413,128 12,762,122 12,348,994 413,128 12,762,122Reverse Repurchase Agreements 180,593 - 180,593 180,593 - 180,593Derivative Financial Instruments 2,403,787 - 2,403,787 2,403,787 - 2,403,787Financial Assets - Recognised through Profit or Loss 668,812 - 668,812 668,812 - 668,812Financial Assets at Fair Value through Other Comprehensive Income 57,449,857 13,974 57,463,831 57,449,857 13,974 57,463,831Financial Assets at Amortised Cost - Debt Instruments 2,241,177 13,700,070 15,941,247 2,241,177 13,700,070 15,941,247Financial Assets at Amortised Cost – Loans and Advances 137,541,063 83,959,593 221,500,656 137,546,099 83,959,593 221,505,692Other Assets 1,765,615 860,971 2,626,586 1,805,404 875,490 2,680,894Investments in Subsidiaries - 678,710 678,710 - - - Property, Plant and Equipment - 2,867,825 2,867,825 - 3,668,502 3,668,502Right of Use (ROU) Asset - - - - - - Intangible Assets - 1,301,248 1,301,248 - 1,302,940 1,302,940Total Assets 221,037,416 103,795,520 324,832,936 221,082,296 103,933,697 325,015,993
LiabilitiesDue to Banks 18,474,545 - 18,474,545 18,474,545 - 18,474,545Derivative Financial Instruments 484,373 - 484,373 484,373 - 484,373Financial liabilities at amortised costDue to Depositors 225,796,202 6,140,567 231,936,769 225,322,032 6,140,567 231,462,599Repurchase Agreements 7,784,017 - 7,784,017 7,681,669 - 7,681,669 Due to Other Borrowers 3,290,451 16,958,365 20,248,816 3,290,451 16,958,365 20,248,816 Debt Securities Issued 260,419 8,485,192 8,745,611 260,419 8,485,192 8,745,611 Retirement benefit obligations 73,967 431,064 505,031 74,929 436,673 511,602Current Tax Liabilities 1,547,833 - 1,547,833 1,574,972 - 1,574,972Other Liabilities 6,670,966 1,012,090 7,683,056 6,700,836 1,021,902 7,722,738Deferred Tax Liabilities 297,262 663,522 960,783 297,262 753,098 1,050,358Total Liabilities 264,680,034 33,690,800 298,370,834 264,161,487 33,795,796 297,957,283
Net (43,642,618) 70,104,720 26,462,102 (43,079,191) 70,137,901 27,058,710

160
Nations Trust Bank PLC Annual Report 2019
46 FAIR VALUE OF ASSETS AND LIABILITIES
46.1 Determination of Fair Value Fair value is the price that would be received to sell an asset or paid to transfer a liability in an orderly transaction in the principal (or most
advantageous) market at the measurement date under current market conditions (i.e., an exit price), regardless of whether that price is directly observable or estimated using a valuation technique. In order to show how fair values have been derived, financial instruments are classified based on a hierarchy of valuation techniques, as summarised below:
• Level 1 financial instruments −Those where the inputs used in the valuation are unadjusted quoted prices from active markets for identical assets or liabilities that the Bank has access to at the measurement date. The Bank considers markets as active only if there are sufficient trading activities with regards to the volume and liquidity of the identical assets or liabilities and when there are binding and exercisable price quotes available on the reporting date.
• Level 2 financial instruments−Those where the inputs that are used for valuation and are significant, are derived from directly or indirectly observable market data available over the entire period of the instrument’s life. Such inputs include quoted prices for similar assets or liabilities in active markets, quoted prices for identical instruments in inactive markets and observable inputs other than quoted prices such as interest rates and yield curves, implied volatilities, and credit spreads. In addition, adjustments may be required for the condition or location of the asset or the extent to which it relates to items that are comparable to the valued instrument. However, if such adjustments are based on unobservable inputs which are significant to the entire measurement, the Bank will classify the instruments as Level 3.
• Level 3 financial instruments − Those that include one or more unobservable input that is significant to the measurement as whole.
The Bank periodically reviews its valuation techniques including the adopted methodologies and model calibrations. However, the base models may not fully capture all factors relevant to the valuation of the Bank’s financial instruments such as credit risk. Therefore, the Bank applies various techniques to estimate the credit risk associated with its financial instruments measured at fair value, which include a portfolio-based approach that estimates the expected net exposure per counterparty over the full lifetime of the individual assets, in order to reflect the credit risk of the individual counterparties for those financial instruments.
The Bank evaluates the levelling at each reporting period on an instrument-by-instrument basis and reclassifies instruments when necessary based on the facts at the end of the reporting period.
NOTES TO THE FINANCIAL STATEMENTS
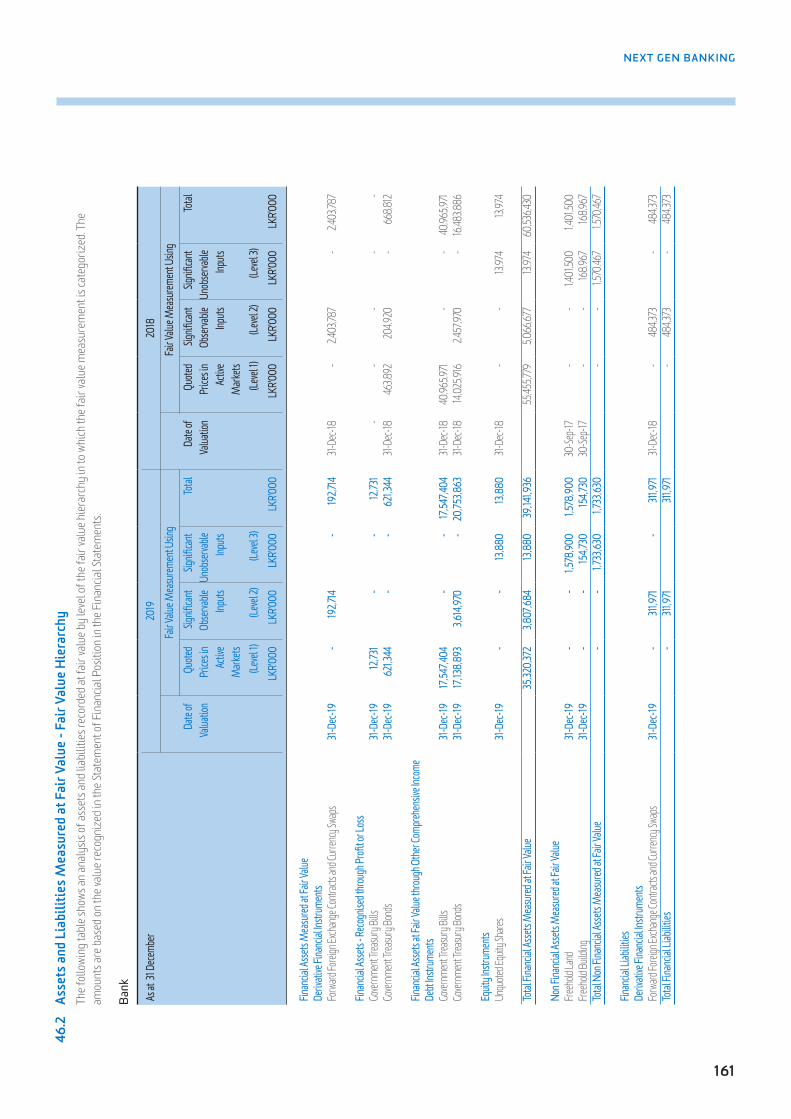
161
NEXT GEN BANKING 46
.2
Asse
ts a
nd L
iabi
litie
s M
easu
red
at F
air V
alue
- Fa
ir V
alue
Hie
rarc
hy
The f
ollo
wing
tabl
e sho
ws an
anal
ysis
of as
sets
and
liabi
litie
s rec
orde
d at
fair
valu
e by
leve
l of t
he fa
ir va
lue h
iera
rchy
in to
whi
ch th
e fai
r val
ue m
easu
rem
ent i
s cat
egor
ized
. The
am
ount
s are
bas
ed o
n th
e val
ue re
cogn
ized
in th
e Sta
tem
ent o
f Fin
ancia
l Pos
ition
in th
e Fin
ancia
l Sta
tem
ents
.
Ba
nk
As at
31 De
cemb
er
2019
2018
Fair V
alue M
easu
remen
t Usin
g
Fair V
alue M
easu
remen
t Usin
gDa
te of
Va
luatio
nQu
oted
Price
s in
Activ
e M
arkets
Signifi
cant
Obse
rvable
Inp
uts
Signifi
cant
Unob
serva
ble
Inputs
Total
Date
of
Valua
tion
Quote
d Pr
ices i
n Ac
tive
Mark
ets
Signifi
cant
Obse
rvable
Inp
uts
Signifi
cant
Unob
serva
ble
Inputs
Total
(Lev
el 1)
(Leve
l 2)
(Lev
el 3)
(Lev
el 1)
(Leve
l 2)
(Lev
el 3)
LKR'0
00
LKR'0
00
LKR'0
00
LKR'0
00 LK
R'000
LKR'0
00 LK
R'000
LKR'0
00
Finan
cial A
ssets
Mea
sured
at Fa
ir Valu
eDe
rivati
ve Fi
nanc
ial In
strum
ents
Forw
ard Fo
reign
Exch
ange
Contr
acts a
nd Cu
rrenc
y Swa
ps31
-Dec
-19 -
19
2,714
-
192,7
1431-
Dec-1
8 -
2,403
,787
- 2,4
03,78
7
Finan
cial A
ssets
- Rec
ognis
ed th
rough
Profi
t or L
oss
Gover
nmen
t Trea
sury
Bills
31-D
ec-19
12,73
1 -
-
12
,731
- -
- -
-Go
vernm
ent T
reasu
ry Bo
nds
31-D
ec-19
621,3
44 -
-
62
1,344
31-De
c-18
463,8
9220
4,920
- 66
8,812
Finan
cial A
ssets
at Fa
ir Valu
e thr
ough
Othe
r Com
prehe
nsive
Inco
meDe
bt Ins
trume
ntsGo
vernm
ent T
reasu
ry Bil
ls31
-Dec
-1917
,547,4
04 -
-
17
,547,4
0431-
Dec-1
840
,965,9
71 -
- 40
,965,9
71Go
vernm
ent T
reasu
ry Bo
nds
31-D
ec-19
17,13
8,893
3,614
,970
-
20,75
3,863
31-De
c-18
14,02
5,916
2,457
,970
- 16
,483,8
86
Equit
y Ins
trume
ntsUn
quote
d Equ
ity Sh
ares
31-D
ec-19
-
-
13,88
013
,880
31-De
c-18
- -
13,97
413
,974
Total
Fina
ncial
Asse
ts M
easu
red at
Fair V
alue
35,32
0,37
23,8
07,68
413
,880
39,14
1,936
55,45
5,779
5,066
,677
13,97
460
,536,4
30
Non F
inanc
ial As
sets
Mea
sured
at Fa
ir Valu
eFre
ehold
Land
31-D
ec-19
-
-
1,578
,900
1,578
,900
30-Se
p-17
- -
1,401
,500
1,401
,500
Freeh
old Bu
ilding
31-D
ec-19
-
-
154,7
3015
4,730
30-Se
p-17
- -
168,9
6716
8,967
Total
Non
Fina
ncial
Asse
ts M
easu
red at
Fair V
alue
-
-
1,733
,630
1,733
,630
- -
1,570
,467
1,570
,467
Finan
cial L
iabilit
iesDe
rivati
ve Fi
nanc
ial In
strum
ents
Forw
ard Fo
reign
Exch
ange
Contr
acts a
nd Cu
rrenc
y Swa
ps31
-Dec
-19 -
311
,971
-
311,97
131-
Dec-1
8 -
484,3
73 -
484,3
73To
tal Fi
nanc
ial Li
abilit
ies -
311
,971
311,97
1 -
484,3
73 -
484,3
73
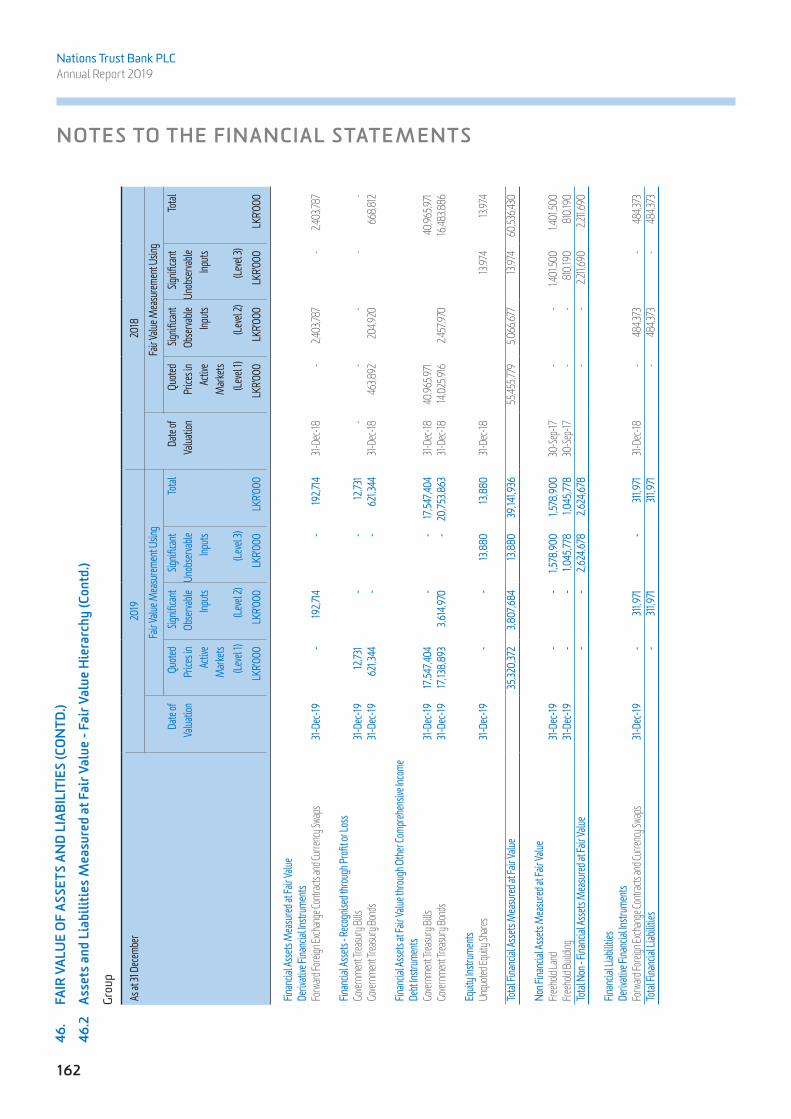
162
Nations Trust Bank PLC Annual Report 2019
46.
FAIR
VAL
UE
OF
ASSE
TS A
ND
LIA
BIL
ITIE
S (C
ON
TD.)
46.2
As
sets
and
Lia
bilit
ies
Mea
sure
d at
Fai
r Val
ue -
Fair
Val
ue H
iera
rchy
(Con
td.)
Gr
oup
As at
31 De
cemb
er
2019
2018
Fair V
alue M
easu
remen
t Usin
gFa
ir Valu
e Mea
surem
ent U
sing
Date
of
Valua
tion
Quote
d Pr
ices i
n Ac
tive
Mark
ets
Signifi
cant
Obse
rvable
Inp
uts
Signifi
cant
Unob
serva
ble
Inputs
Total
Date
of
Valua
tion
Quote
d Pr
ices i
n Ac
tive
Mark
ets
Signifi
cant
Obse
rvable
Inp
uts
Signifi
cant
Unob
serva
ble
Inputs
Total
(Lev
el 1)
(Leve
l 2)
(Lev
el 3)
(Lev
el 1)
(Leve
l 2)
(Lev
el 3)
LKR'0
00
LKR'0
00
LKR'0
00
LKR'0
00 LK
R'000
LKR'0
00 LK
R'000
LKR'0
00
Finan
cial A
ssets
Mea
sured
at Fa
ir Valu
eDe
rivati
ve Fi
nanc
ial In
strum
ents
Forw
ard Fo
reign
Exch
ange
Contr
acts a
nd Cu
rrenc
y Swa
ps31
-Dec
-19 -
19
2,714
-
192,7
1431-
Dec-1
8 -
2,403
,787
- 2,4
03,78
7
Finan
cial A
ssets
- Rec
ognis
ed th
rough
Profi
t or L
oss
Gover
nmen
t Trea
sury
Bills
31-D
ec-19
12,73
1 -
-
12
,731
- -
- -
- Go
vernm
ent T
reasu
ry Bo
nds
31-D
ec-19
621,3
44 -
-
62
1,344
31-De
c-18
463,8
9220
4,920
668,8
12
Finan
cial A
ssets
at Fa
ir Valu
e thr
ough
Othe
r Com
prehe
nsive
Inco
meDe
bt Ins
trume
ntsGo
vernm
ent T
reasu
ry Bil
ls31
-Dec
-1917
,547,4
04 -
-
17
,547,4
0431-
Dec-1
840
,965,9
7140
,965,9
71Go
vernm
ent T
reasu
ry Bo
nds
31-D
ec-19
17,13
8,893
3,614
,970
-
20,75
3,863
31-De
c-18
14,02
5,916
2,457
,970
16,48
3,886
Equit
y Ins
trume
ntsUn
quote
d Equ
ity Sh
ares
31-D
ec-19
-
-
13,88
013
,880
31-De
c-18
13,97
413
,974
Total
Fina
ncial
Asse
ts M
easu
red at
Fair V
alue
35,32
0,37
23,8
07,68
413
,880
39,14
1,936
55,45
5,779
5,066
,677
13,97
460
,536,4
30
Non F
inanc
ial As
sets
Mea
sured
at Fa
ir Valu
eFre
ehold
Land
31-D
ec-19
-
-
1,578
,900
1,578
,900
30-Se
p-17
- -
1,401
,500
1,401
,500
Freeh
old Bu
ilding
31-D
ec-19
-
-
1,045
,778
1,045
,778
30-Se
p-17
- -
810,1
9081
0,190
Total
Non
- Fina
ncial
Asse
ts M
easu
red at
Fair V
alue
-
-
2,624
,678
2,624
,678
- -
2,211,
690
2,211,
690
Finan
cial L
iabilit
iesDe
rivati
ve Fi
nanc
ial In
strum
ents
Forw
ard Fo
reign
Exch
ange
Contr
acts a
nd Cu
rrenc
y Swa
ps31
-Dec
-19 -
311
,971
-
311,97
131-
Dec-1
8 -
484,3
73 -
484,3
73To
tal Fi
nanc
ial Li
abilit
ies -
311
,971
311,97
1 -
484,3
73 -
484,3
73
NOTES TO THE FINANCIAL STATEMENTS

163
NEXT GEN BANKING
46.2.1 Fair Value Measurement of Assets classified as Level 3
Reconciliation The following table shows a reconciliation of the opening and closing amounts of Level 3 financial assets which are recorded at fair value.
Unquoted Equity SharesBank / Group2019 2018
LKR'000 LKR'000
Balance as at 01 January 13,974 5,937Investments made during the year - 6,422Change in value due to exchange rate fluctuation (94) 1,615Balance as at 31 December 13,880 13,974
Equity instruments at FVOCI classified as "Level 3" in the fair value hierarchy comprises of Unquoted Equity Shares. Further details are given in Note 11.1.
Reconciliation of the non - financial assets, " Freehold Land and Buildings" classified as level 3 in the fair value hierarchy;
Bank
Non Financial Assets Measured at Level 3 Freehold Freehold Freehold Freehold
Land Buildings Land Buildings 2019 2019 2018 2018
LKR'000 LKR'000 LKR'000 LKR'000
Balance as at 01 January 1,401,500 168,967 1,401,500 173,501Additions during the year - - - 677Depreciation charge for the year - (5,224) - (5,211)Fair value gain/(loss) due to revaluation of land and buildings 177,400 (9,013) - - Balance as at 31 December 1,578,900 154,730 1,401,500 168,967
Group
Non Financial Assets Measured at Level 3 Freehold Freehold Freehold Freehold
Land Buildings Land Buildings 2019 2019 2018 2018
LKR'000 LKR'000 LKR'000 LKR'000
Balance as at 01 January 1,401,500 810,190 1,401,500 821,700Additions during the year - - - 17,288Depreciation charge for the year - (28,934) - (28,798)Fair value gain/(loss) due to revaluation of land and buildings 177,400 264,522 - - Balance as at 31 December 1,578,900 1,045,778 1,401,500 810,190

164
Nations Trust Bank PLC Annual Report 2019
46.
FAIR
VAL
UE
OF
ASSE
TS A
ND
LIA
BIL
ITIE
S (C
ON
TD.)
46.2
As
sets
and
Lia
bilit
ies
Mea
sure
d at
Fai
r Val
ue -
Fair
Val
ue H
iera
rchy
(Con
td.)
46.2
.1 Fa
ir Va
lue
Mea
sure
men
t of A
sset
s cla
ssifi
ed a
s Lev
el 3
(Con
td.)
U
nobs
erva
ble
Inpu
ts u
sed
in M
easu
ring
Fair
Valu
e
Th
e tab
le b
elow
sets
out
info
rmat
ion
abou
t sig
nific
ant u
nobs
erva
ble i
nput
s use
d in
mea
surin
g fa
ir va
lue o
f ass
ets c
ateg
oriz
ed u
nder
Lev
el 3
of t
he fa
ir va
lue h
iera
rchy
.
Loca
tion
Type
ofAs
set
Exten
tBa
nk
Grou
pVa
luatio
nTe
chniq
ueSig
nifica
ntUn
obse
rvable
Input
s
Weig
hted
Aver
age
Rang
e of
estim
ates f
orun
obse
rvable
inpu
tsFa
ir Valu
eas
atFa
ir Valu
eas
atFa
ir Valu
eas
atFa
ir Valu
eas
at31
.12.20
1931
.12.20
1831
.12.20
1931
.12.20
1831
.12.20
1931
.12.20
18
No 76
, York
Stree
t, Fo
rt, Co
lombo
Land
10.82
P20
1,900
177,5
0020
1,900
177,5
00Di
rect C
apita
l Co
mpar
ison
Meth
od
Price
per p
erch
LKR 2
0 M
nan
d LKR
12 M
nLK
R 17.5
Mn a
nd
LKR 1
1 Mn (
arcad
e)Bu
ilding
8,660
(Sq.F
t.)19
,100
28,50
019
,100
28,50
0Pr
ice pe
r Sq.F
tLK
R 1,0
00 - L
KR
6,00
0LK
R 3,00
0-
LKR 5
,000
No 24
2, Un
ion Pl
ace,
Colom
bo 2
Land
77.2
P1,3
77,0
001,2
24,00
01,3
77,0
001,2
24,00
0Di
rect C
apita
l Co
mpar
ison
Meth
od
Price
per p
erch
LKR 1
8 Mn
LKR 1
6 Mn
Build
ing33
,650 (
Sq.Ft
.)13
5,630
145,0
0013
5,630
145,0
00Pr
ice pe
r Sq.F
tLK
R 1,0
00 - L
KR
5,000
LKR 1
,000 -
LKR
5,000
46/5
8, Na
wam
Maw
atha,
Colom
bo 2
Build
ing61
,300 (
Sq.Ft
.) -
-
89
1,048
64
8,200
In
vestm
ent m
ethod
Rent
per S
q.Ft
per m
onth
LK
R 160
/- to
LK
R 290
/-
LKR 1
15/-
to
LKR 2
50/-
Total
1,733
,630
1,575
,000
2,624
,678
2,223
,200
*
Sign
ifica
nt in
crea
ses/
(dec
reas
es) i
n an
y of
thes
e inp
uts i
n iso
latio
n wo
uld
resu
lt in
a hi
gher
/(lo
wer)
fair
valu
e. Fa
ir va
lue m
easu
rem
ents
are p
ositi
vely
corr
elat
ed w
ith th
e un
obse
rvab
le in
puts
.
NOTES TO THE FINANCIAL STATEMENTS

165
NEXT GEN BANKING
46.3 Fair Value of Financial Assets and Liabilities not carried at Fair Value Below are the methodologies and assumptions used to determine fair values for the financial instruments which are not recorded and
measured at fair value in the Bank’s financial statements. These fair values were calculated for disclosure purposes only.
Assets for which Fair Value Approximates Carrying Value For financial assets and financial liabilities that have a short term maturity (original maturities less than a year), it is assumed that the
carrying amounts approximate their fair values.
The following is a list of financial instruments whose carrying amount is a reasonable approximation of fair value as they are short-term in nature to reprice to current market rates frequently;
Financial Assets Financial Liabilities Cash and Cash Equivalents Due to Banks
Balances with Central Bank of Sri Lanka Repurchase Agreements
Reverse Repurchase Agreements
Sri Lanka Development Bonds
This assumption is also applied to demand deposits, call deposits and savings deposits which does not have a specific maturity. It is also assumed that the amortized cost of floating rate financial instruments approximate the fair value as the amortized cost represents most recent fair value. Long term deposits accepted from customers for which periodical interest is paid and loans and advances granted to customers with variable rates are also considered to be carried at fair value in the books.
Fixed Rate Financial Instruments Carrying amounts are considered as fair values for short term credit facilities. There is a significant difference between carrying value and fair
value of treasury bonds portfolio at amortised cost where the original tenors exceeds one year. In fair valuing such securities, rates published by the CBSL for similar trading securities were used. Loans and advances with fixed interest rates were fair valued using average market rates at which fresh loans were granted during the fourth quarter of the reporting year. Conversely, fixed deposits with original tenors above one year and interest paid at maturity were discounted using current market rate offered to customers during the fourth quarter of the reporting year. Interest rates based on treasury bond rates with similar tenors with an adjustment for premium have been used to arrive at the fair value of debentures issued and invested.
For financial instruments not traded in an active market, the fair value is determined by using appropriate valuation techniques. Valuation techniques include the discounted cash flow method, comparison with similar instruments for which market observable prices exist and other relevant valuation models.

166
Nations Trust Bank PLC Annual Report 2019
46.
FAIR
VAL
UE
OF
ASSE
TS A
ND
LIA
BIL
ITIE
S (C
ON
TD.)
46.3
Fi
nanc
ial A
sset
s an
d Fi
nanc
ial L
iabi
litie
s no
t car
ried
at f
air v
alue
(Con
td.)
Se
t out
bel
ow is
a co
mpa
rison
, by
class
, of t
he ca
rryi
ng am
ount
s and
fair
valu
es o
f the
Ban
k’s /G
roup
's fina
ncia
l ins
trum
ents
that
are n
ot m
easu
red
at fa
ir va
lue i
n th
e Fin
ancia
l St
atem
ents
. Thi
s tab
le d
oes n
ot in
clude
the f
air v
alue
s of n
on–fi
nanc
ial a
sset
s and
non
–fina
ncia
l lia
bilit
ies.
Ba
nk
As at
31 De
cemb
er20
1920
18Fa
ir Valu
e Mea
surem
ent U
sing
Fair V
alue M
easu
remen
t Usin
gCa
rrying
am
ount
Quote
d Pr
ices i
n Ac
tive
Mark
ets
Signifi
cant
Obse
rvable
Inp
uts
Signifi
cant
Unob
serva
ble
Inputs
Total
Carry
ing
amou
ntQu
oted
Price
s in
Activ
e M
arkets
Signifi
cant
Obse
rvable
Inp
uts
Signifi
cant
Unob
serva
ble
Inputs
Total
(Lev
el 1)
(Leve
l 2)
(Lev
el 3)
(Lev
el 1)
(Leve
l 2)
(Lev
el 3)
LKR'0
00 LK
R'000
LK
R'000
LK
R'000
LK
R'000
LKR'0
00 LK
R'000
LKR'0
00 LK
R'000
LKR'0
00
Finan
cial A
ssets
Finan
cial A
ssets
at Am
ortise
d Cos
t - De
bt Ins
trume
nts19
,062
,606
5,314
,249
14,41
6,802
-
19,73
1,051
15,94
1,247
3,548
,416
12,19
4,354
- 15
,742,7
7019
,062
,606
5,314
,249
14,41
6,802
-
19,73
1,051
15,94
1,247
3,548
,416
12,19
4,354
- 15
,742,7
70Lo
ans a
nd Ad
vanc
es to
Custo
mers
Corpo
rate L
oans
74,53
2,270
-
74,13
2,247
-
74,13
2,247
64,41
6,421
- 64
,576,5
83 -
64,57
6,583
SME
and C
onsu
mer L
endin
g10
8,391
,799
- 1
08,37
3,837
- 1
08,37
3,837
111,10
9,770
- 110
,333,5
47 -
110,33
3,547
Hous
ing Lo
ans
4,431
,696
-
4,590
,653
-
4,590
,653
4,223
,111 -
4,192
,636
- 4,1
92,63
6Le
ases
44,14
2,733
-
45,56
6,564
-
45,56
6,564
44,86
4,827
- 45
,068,6
20 -
45,06
8,620
Staff L
oans
3,652
,422
-
2,648
,692
-
2,648
,692
3,391
,441
- 2,3
04,63
4-
2,304
,634
235,1
50,92
0 -
23
5,311,
993
-
235,3
11,99
322
8,005
,570
- 22
6,476
,020
- 22
6,476
,020
Total
Fina
ncial
Asse
ts25
4,213
,526
5,314
,249
249,7
28,79
5 -
255
,043
,044
243,9
46,81
73,5
48,41
623
8,670
,374
- 24
2,218
,790
Finan
cial L
iabilit
iesDu
e to C
ustom
ers22
6,880
,034
- 2
26,89
0,75
1 -
226
,890,
751
231,9
36,76
9 -
231,2
06,47
7 -
231,2
06,47
7Du
e to O
ther B
orrow
ers27
,380,
678
-
27,73
3,460
-
27,73
3,460
20,24
8,816
- 20
,248,8
16 -
20,24
8,816
Debt
Secu
rities
Issue
d 13
,263,4
34 -
13,91
2,222
- 13
,912,2
228,7
45,61
1 -
9,024
,163
- 9,0
24,16
3To
tal Fi
nanc
ial Li
abilit
ies26
7,524
,146
- 2
68,53
6,433
- 2
68,53
6,433
260,9
31,19
6 -
260,4
79,45
6 -
260,4
79,45
6
NOTES TO THE FINANCIAL STATEMENTS

167
NEXT GEN BANKING
Grou
p
As at
31 De
cemb
er20
1920
18Fa
ir Valu
e Mea
surem
ent U
sing
Fair V
alue M
easu
remen
t Usin
gCa
rrying
am
ount
Quote
d Pr
ices i
n Ac
tive
Mark
ets
Signifi
cant
Obse
rvable
Inp
uts
Signifi
cant
Unob
serva
ble
Inputs
Total
Carry
ing
amou
ntQu
oted
Price
s in
Activ
e M
arkets
Signifi
cant
Obse
rvable
Inp
uts
Signifi
cant
Unob
serva
ble
Inputs
Total
(Lev
el 1)
(Leve
l 2)
(Lev
el 3)
(Lev
el 1)
(Leve
l 2)
(Lev
el 3)
LKR'0
00 LK
R'000
LK
R'000
LK
R'000
LK
R'000
LKR'0
00 LK
R'000
LKR'0
00 LK
R'000
LKR'0
00
Finan
cial A
ssets
Finan
cial A
ssets
at Am
ortise
d Cos
t - De
bt Ins
trume
nts19
,062
,606
5,314
,249
14,41
6,802
-
19,73
1,051
15,94
1,247
3,548
,416
12,19
4,354
- 15
,742,7
7019
,062
,606
5,314
,249
14,41
6,802
-
19,73
1,051
15,94
1,247
3,548
,416
12,19
4,354
- 15
,742,7
70Lo
ans a
nd Ad
vanc
es to
Custo
mers
Corpo
rate L
oans
74,53
2,270
-
74,13
2,247
-
74,13
2,247
64,41
6,421
- 64
,576,5
83 -
64,57
6,583
SME
and C
onsu
mer L
endin
g10
8,394
,289
- 1
08,37
6,326
- 1
08,37
6,326
111,11
4,675
- 110
,338,4
52 -
110,33
8,452
Hous
ing Lo
ans
4,431
,696
-
4,590
,653
-
4,590
,653
4,223
,111 -
4,192
,636
- 4,1
92,63
6Le
ases
44,14
2,733
-
45,56
6,564
-
45,56
6,564
44,86
4,827
- 45
,068,6
20 -
45,06
8,620
Staff L
oans
3,652
,422
-
2,648
,692
-
2,648
,692
3,391
,441
- 2,3
04,63
4 -
2,304
,634
235,1
53,41
0 -
235
,314,4
82 -
235
,314,4
8222
8,010
,475
- 22
6,480
,925
- 22
6,480
,925
Total
Fina
ncial
Asse
ts25
4,216
,016
5,314
,249
249,7
31,28
4 -
255
,045
,533
243,9
51,72
23,5
48,41
623
8,675
,279
-24
2,223
,695
Finan
cial L
iabilit
iesDu
e to C
ustom
ers22
6,871,
563
- 2
26,88
2,280
- 2
26,88
2,280
231,4
62,59
9 -
230,7
31,94
5 -
230,7
31,94
5Du
e to O
ther B
orrow
ers27
,284,8
28 -
27
,637,6
11 -
27
,637,6
1120
,248,8
16 -
20,24
8,816
- 20
,248,8
16De
bt Se
curiti
es Iss
ued
13,26
3,434
- 13
,912,2
22 -
13,91
2,222
8,745
,611
- 9,0
24,16
3 -
9,024
,163
Total
Fina
ncial
Liab
ilities
267,4
19,82
5 -
26
8,432
,113
-
268,4
32,11
326
0,457
,026
- 26
0,004
,924
- 26
0,004
,924
168
Nations Trust Bank PLC Annual Report 2019
47. FINANCIAL RISK MANAGEMENT
47.1 Introduction Risks are inherent in the Bank’s activities, but is managed through a process of ongoing identification, measurement and monitoring, subject to
risk limits and other controls. This process of risk management is critical to the Bank’s continuing profitability. The Bank is primarily exposed to credit risk, liquidity risk, market risk and operational risks. In addition, Cyber security threats have emerged as a significant risk to the industry in recent times.
The objective of the Risk Management Framework at the Bank is to establish a process to effectively identify, measure, manage, control and monitor risks faced by the Bank. The goal is to manage these risks to enhance the risk-return profile of the Bank.
The Board of Directors is responsible for establishing the overall Risk Management Framework within the Bank. This consists of approval of a risk governance structure and approval of detailed risk management policies and procedures with risk appetite and tolerance limits.
The Board delegates specific oversight of all risk management activities in the Bank to the Board Integrated Risk Management Committee (BIRMC). It reviews risk goals, department risk grids and material risk issues highlighted by different executive risk committees. It also monitors compliance with Bank policies and regulations.
The Board has appointed the Executive Risk Management Committee (ERMC) which has the overall responsibility for overseeing the establishment and implementation of frameworks, policies and limits for various risk exposures. The ERMC is assisted by the Assets and Liability Management Committee (ALCO) which specifically focus on market risk management and liquidity risk management whilst Head Office Credit Committee focuses on the credit risk management.
The Integrated Risk Management Department (IRMD), headed by the Chief Risk Officer (CRO), is responsible for developing and implementing the Bank’s Risk Management Framework. It acts as the second line of defense in managing risks. Responsibilities of the IRMD include the following:
Monitor • Formulation of Risk policies & procedures
• Compliance with Risk policies & procedures
• Bank’s overall risk profile & changes in overall risk positions
• Risks across business units and escalate risk and control issues to management
Develop and Report • Risk management standards and measurement tools
• Aggregate risk profile of the Bank in relation to capital
Support • Bank’s risk culture through development of a common risk language and Bank-wide training
• Interpretation of risk related regulations / leading practices to business units
Risk Measurement and Reporting Systems The Bank uses appropriate risk measurement techniques, models and industry best practices to evaluate its various risk exposures. Such
risks identified are managed through establishment of limits. These limits reflect the business strategy and the Bank’s stance in the market environment as well as the level of risk that the Bank is willing to accept.
The Bank also carries out a detail stress testing exercise, which is a key component of the Internal Capital Adequacy Assessment Process (ICAAP) as well as the risk management framework. This exercise measures the extent of risks the Bank is exposed to when variables associated with its risks are simulated considering plausible changes in the external/internal environment.
The risk so measured is presented to relevant board committees & heads of each business division at regular intervals.
NOTES TO THE FINANCIAL STATEMENTS

169
NEXT GEN BANKING
Risk Mitigation As part of its overall risk management, the Bank uses derivatives to manage exposures resulting from changes in foreign currencies. The Bank
also accepts various types of collateral as a credit risk mitigant whilst insurance is used to transfer operational types of risks.
Excessive Risk Concentration In order to avoid excessive concentrations of risk, the Bank’s policies and procedures include specific guidelines to focus on maintaining a
diversified portfolio. Identified concentrations of credit risks are controlled and managed accordingly.
47.2 Credit Risk Credit risk is the risk that the Bank will incur a loss resulting from its customers or counterparties failing to or delaying meeting their
contractual obligations. This arises from loans and receivables and investments in debt instruments forming direct funding exposures (on Balance Sheet exposure) or indirect liabilities such as Letters of Credit and Guarantees (off Balance Sheet exposure).
The Bank manages and controls credit risk by setting limits on the amount of risk it is willing to accept for individual counterparties and for industry concentrations and by monitoring exposures in relation to such limits and by taking appropriate collateral.
The Bank has established a credit quality review process to provide early identification of possible changes in the creditworthiness of counterparties, including regular collateral revisions. A scientifically developed internal risk rating mechanism has been implemented via a work-flow based software covering various types of customer segments of the Bank excluding consumer products. Such risk ratings are subject to regular revision. The credit quality review process aims to allow the Bank to assess the potential loss as a result of the risks to which it is exposed and take corrective action. A score card-based model is used to evaluate credit risk of consumer products as these were not evaluated through the established internal risk rating system.
Impairment Assessment The references below show where the Bank’s impairment assessment and measurement approach is set out in this report. It should be read in
conjunction with the Summary of significant accounting policies.
Definition of Default and Cure The Bank considers a financial instrument defaulted and therefore Stage 3 (credit-impaired) for ECL calculations in all cases when the
borrower becomes 90 days past due on its contractual payments or when classified as a Non Performing Loan (NPL) as per directions issued by the Central Bank of Sri Lanka (CBSL). The Bank considers Treasury and interbank balances defaulted and takes immediate action when the required intraday payments are not settled by the close of business as outlined in the individual agreements.
Individually Assessed Allowances The Bank determines the allowances appropriate for each individually significant loan or advance on an individual basis above a predetermined
threshold limit. Items considered when determining allowance amounts include the sustainability of the counterparty’s business plan, its ability to improve performance if it is in a financial difficulty, projected receipts and the expected payout if bankruptcy happens, the availability of other financial support, the realizable value and timing of collateral and expected cash flows. Impairment allowances are evaluated at each reporting date, unless unforeseen circumstances require more careful attention. The Bank has currently set Individually Significant Threshold at Rupees Fifty Million and every customer having an aggregate exposure above that limit is individually assessed for objective evidence of incurred loss (OEIL). The Bank applies a risk-based approach for its Corporate Banking portfolio where exposures between Rupees Fifty Million and Rupees Hundred Million are assessed against limited number of OEIL and exposures above Rupees Hundred Million are assessed against the complete list of OEILs. If the Bank finds such customers are having OEIL, those customers are individually impaired taking in to account the estimated value of future cash flows.
Collectively Assessed Allowances Allowances are assessed collectively for losses on loans and advances that are not individually significant and for individually significant loans
and advances that have been assessed individually and found to be not requiring an impairment provision at individual customer level.
The collective assessment is made for groups of assets with similar risk characteristics, in order to determine whether allowance should be made for expected credit losses (ECL). The collective assessment takes account of data from the loan portfolios such as utilization of

170
Nations Trust Bank PLC Annual Report 2019
NOTES TO THE FINANCIAL STATEMENTS
47. FINANCIAL RISK MANAGEMENT (CONTD.)
47.2 Credit Risk (Contd.) sanctioned limits, levels of arrears, historical losses on the portfolio and expected receipts and recoveries once defaulted. The Bank uses SLFRS
9 based ECL model to assess impairment as detailed in note 13.4
Probability of Default (PD) Estimation Process The ECL model is based on historical delinquency levels and forward looking macro-economic factors to estimate PDs of its portfolios. These
macro-economic factors include, depending on the characteristics of the individual or collective assessment: unemployment rates, Inflation, movements in Gross Domestic Product (GDP), macro environment stability in financial industry, revisions in the Interest rates, changes in regulatory environment and other available consumer data. The Bank uses aforementioned factors as appropriate to adjust the impairment allowances.
The Probability of Default only during the next twelve months is estimated for a Stage 1 asset where credit risk has remained at same level from origination to the reporting date. For Stage 2 assets where credit risk has significantly increased compared to the level which was at the origination, Probability of Default during remaining total lifetime is estimated. Stage 3 assets are where the default event has occurred.
Exposure at Default (EAD) The Exposure at Default (EAD) represents the gross carrying amount of the financial instruments subject to the impairment calculation,
addressing both the client’s ability to increase its exposure while approaching default and potential early repayments too.
The Bank uses Credit Conversion Factors (CCF) which explains the historical utilization of defaulted facilities at the time of default to calculate EAD of revolving facilities in which customers have the ability to increase their exposure. For non-revolving facilities, the already utilized amount plus any accrued interest over same is considered as the EAD.
In order to assess impairment provision at appropriate granular level, the Bank has stratified certain portfolios further reflecting grouping of similar risk customer profiles. Such stratification of the portfolios has helped the Bank to make a reasonable assessment of required impairment provisions as it focuses on avoiding generalization of possible potential loss indicative parameters.
Loss Given Default (LGD) In Loans and Receivable portfolios, The Bank assesses its LGDs using the historical default database. The Bank recovers the full amount or a
portion of the defaulted amount using multiple options including legal means and realization of collateral. The total net cash flows from the date of default are discounted in order to assess the net loss incurred from the defaulted amount. The LGD of a certain portfolio represents the actual loss incurred from its defaulted exposures.
Significant Increase in Credit Risk The Bank continuously monitors all assets subject to ECL. In order to determine whether an instrument or a portfolio of instruments is subject
to 12 months ECL or Life Time ECL, the Bank assesses whether there has been a significant increase in credit risk since initial recognition. The Bank considers an exposure to have significantly increased in credit risk when the subject borrower or exposure becomes 30 days past due on its contractual payments. When estimating ECL on a collective basis for a group of similar financial assets, the Bank applies the same principle of assessing whether there has been a significant increase in credit risk since the origination.
Credit Quality by Class of Financial Assets The Bank manages the credit quality of Corporate, Retail and SME customers through a credit rating mechanism. Customers in Consumer
lending portfolio have not been rated.

171
NEXT GEN BANKING
Qualities of Financial Assets are categorized into five categories as described below.
Credit Quality Category Definition Description
High Grade Very High Safety The exposure to the Government, Banks and Reverse Repurchase transactions backed by Government Securities are identified as ‘High Grade’. The external rating of the Banks has not been considered in this regard as these exposures are highly liquid and are of self-liquidating nature. Chances of default are negligible and highly unlikely. The obligor/counterparty is likely to honour its commitments even under adverse business/market conditions.
Investment Grade (A+& B-)
High Safety The ability to honour the terms of trade is high or fully secured by cash. The obligor/counterparty is likely to honour its commitments even under adverse business conditions. There would be an insignificant likelihood of default associated with adverse economic events of significant scale.
Intermediary Grade (C+ and C)
Moderate Safety The ability to honour the terms of trade is strong, but not as strong as in Investment Grade. The obligor/counterparty may take longer than anticipated/planned to honour its commitments under adverse business conditions. There is a moderate likelihood of default.
Speculative Grade (C- and D)
Low Safety The ability to honour the terms of trade is low. Any adverse changes in the business/economic conditions may impair the obligor’s/counterparty’s ability to honour its commitments.
Customers whose credit quality is not yet finalized
Safe The ability to honour the terms of trade is assumed acceptable but yet to be confirmed by way of a finalized rating.
Credit Risk exposure for each internal credit risk rating
Bank's Internal Credit Rating Historical Default Rates Amortized Cost 2019 2018
% LKR'000 LKR'000
Investment GradeA Less than 1% 30,332,350 33,529,300B Less than 1.5% 67,896,501 57,703,241Intermediary GradeC + and C Less than 2.5% 6,362,453 8,653,499Speculative GradeC- Less than 5.5% 3,381,757 3,691,805D Minimum of 13% 3,713,450 1,379,313Past Due - Rated Customers
Less than 30 Days 8,825,378 13,437,12230 - 90 Days 6,542,078 9,030,935More than 90 Days 4,233,971 2,668,370
Past Due - Fully Secured by Cash 2,017,296 2,645,846Individually Impaired - Rated Customers 15,943,648 13,975,085Sum of Amortized Cost of Rated Customers 149,248,883 146,714,517

172
Nations Trust Bank PLC Annual Report 2019
47. FINANCIAL RISK MANAGEMENT (CONTD.)
47.2 Credit Risk (Contd.) It is the Bank's policy to maintain accurate and consistent risk ratings across the credit portfolio. The rating system is supported by a variety of
financial analytics, combined with processed market information to provide the main inputs for the measurement of Obligor Risk. All internal risk ratings are tailored to measure specific default characteristics and risks inherent in various business segments. Shown above is internal credit rating classification of the Corporate, Retail & SME portfolios of the Bank. The attributable risk ratings are assessed and updated regularly.
The exposures of which credit quality is not yet aligned to a bank-wide single point indicator rating scale mainly consists of security backed lending and customers evaluated using risk scoring system. Leasing and cash secured lending are the significant security backed portfolios while consumer lending customers are assessed through a credit score system. The Bank is in the process of aligning such portfolios under the coverage of the bank-wide single point indicator rating scale.
NOTES TO THE FINANCIAL STATEMENTS

173
NEXT GEN BANKING
Credit Quality by Class of Financial Assets
Bank - 31 December 2019 Neither past due nor impaired High
Grade Investment
Grade Intermediary
Grade Speculative
Grade Customers
whose credit
rating is not yet
finalized
Past due but not
impaired
Individually Impaired
Total
LKR'000 LKR'000 LKR'000 LKR'000 LKR'000 LKR'000 LKR'000 LKR'000
Cash and Cash Equivalents 8,755,848 - - - - - - 8,755,848 Balances with Central Bank of Sri Lanka 8,377,478 - - - - - - 8,377,478 Reverse Repurchase Agreements 11,404,692 20,412 - - 2,402,319 - - 13,827,423
Derivative Financial InstrumentsForward Foreign Exchange Contracts and Currency Swaps 146,997 45,718 - - - - - 192,714
Financial Assets - Recognised through Profit or LossGovernment Treasury Bills and Bonds 634,075 - - - - - - 634,075
Financial Assets at Fair Value through Other Comprehensive IncomeGovernment Treasury Bills and Bonds 38,301,267 - - - - - - 38,301,267 Unqouted Equity Shares - - - - 13,880 - - 13,880
Financial Assets at Amortised CostGovernment Treasury Bills and Bonds 13,559,215 - - - - - - 13,559,215 Sri Lanka Development Bonds 4,247,098 - - - - - - 4,247,098 Quoted Debentures 209,024 1,079,394 - - - - - 1,288,418
Financial Assets at Amortised Cost – Loans and Advances (Gross)
Corporate Loans - 61,248,722 41,680 3,421,624 - 3,663,376 6,156,869 74,532,271 Retail ,SME and Consumer - 34,015,905 2,908,854 3,660,359 40,222,560 18,021,892 9,562,229 108,391,799 Housing Loans - 275,382 98,923 - 3,134,199 903,646 19,545 4,431,696 Leases - 2,688,843 3,312,995 13,225 21,050,740 16,444,745 632,186 44,142,733 Staff Loans - - - - 3,626,540 25,882 - 3,652,422
Total 85,635,694 99,374,376 6,362,453 7,095,207 70,450,237 39,059,542 16,370,829 324,348,337
Note 1: All loans under "Neither past due nor individually impaired" are Stage 1 assets. Past Due loans include any loan that is in arrears for more than one day. Out of Rs. 39Bn categorized under "Past due but not individually impaired“, Rs. 16Bn (42%) is in Stage 1, Rs. 15.8Bn (40%) is in Stage 2 and Rs. 7.2Bn (18%) is in Stage 3. All individually impaired loans are Stage 3 assets.
Note 2: Total Assets are not in line with Statement of Financial Position since figures shown above are on Gross basis

174
Nations Trust Bank PLC Annual Report 2019
47. FINANCIAL RISK MANAGEMENT (CONTD.)
Credit Quality by Class of Financial Assets
Bank - 31 December 2018 Neither past due nor impaired High
Grade Investment
Grade Intermediary
Grade Speculative
Grade Customers
whose credit
rating is not yet
finalized
Past due but not
impaired
Individually Impaired
Total
LKR'000 LKR'000 LKR'000 LKR'000 LKR'000 LKR'000 LKR'000 LKR'000
Cash and Cash Equivalents 6,437,519 - - - - - - 6,437,519 Balances with Central Bank of Sri Lanka 12,762,122 - - - - - - 12,762,122 Reverse Repurchase Agreements 172,043 - - - 8,550 - - 180,593
Derivative Financial InstrumentsForward Foreign Exchange Contracts and Currency Swaps 2,391,591 12,196 - - - - - 2,403,787
Financial Assets - Recognised through Profit or LossGovernment Treasury Bills and Bonds 668,812 - - - - - - 668,812
Financial Assets at Fair Value through Other Comprehensive IncomeGovernment Treasury Bills and Bonds 57,449,857 - - - - - - 57,449,857 Unqouted Equity Shares - - - - 13,974 - - 13,974
Financial Assets at Amortised CostGovernment Treasury Bills and Bonds 10,208,371 - - - - - - 10,208,371 Sri Lanka Development Bonds 3,914,439 - - - - - - 3,914,439 Quoted Debentures 863,886 920,139 - - - - 104,932 1,888,957
Financial Assets at Amortised Cost – Loans and Advances (Gross)
Corporate Loans - 54,866,072 25,544 2,749,806 - 3,284,184 3,490,814 64,416,421 Retail ,SME and Consumer - 32,150,810 3,629,099 2,319,315 38,225,652 24,928,556 9,856,339 111,109,770 Housing Loans - 238,180 76,356 - 3,143,056 720,114 45,405 4,223,111 Leases - 3,977,480 4,922,500 1,997 20,951,524 14,315,814 695,513 44,864,827 Staff Loans - - - - 3,391,441 - - 3,391,441
Total 94,868,639 92,164,877 8,653,499 5,071,118 65,734,196 43,248,667 14,193,003 323,934,000
Note 1: All loans under "Neither past due nor individually impaired" are Stage 1 assets. Past Due loans include any loan that is in arrears for more than one day. Out of LKR 43.2Bn categorized under “Past due but not individually impaired“, LKR 22.9Bn (25%) is in Stage 1, LKR 12.4Bn (29%) is in Stage 2 and LKR 7.9Bn (18%) is in Stage 3. All individually impaired loans are Stage 3 assets.
Note 2: Total Assets are not in line with Statement of Financial Position since figures shown above are on Gross basis
NOTES TO THE FINANCIAL STATEMENTS

175
NEXT GEN BANKING
47. FINANCIAL RISK MANAGEMENT (CONTD.)
Credit Quality by Class of Financial Assets
Group - 31 December 2019 Neither past due nor impaired High
Grade Investment
Grade Intermediary
Grade Speculative
Grade Customers
whose credit
rating is not yet
finalized
Past due but not
impaired
Individually Impaired
Total
LKR'000 LKR'000 LKR'000 LKR'000 LKR'000 LKR'000 LKR'000 LKR'000
Cash and Cash Equivalents 8,755,930 - - - - - - 8,755,930 Balances with Central Bank of Sri Lanka 8,377,478 - - - - - - 8,377,478 Reverse Repurchase Agreements 11,404,692 20,412 - - 2,402,319 - - 13,827,423
Derivative Financial InstrumentsForward Foreign Exchange Contracts and Currency Swaps 146,997 45,718 - - - - - 192,714
Financial Assets - Recognised through Profit or LossGovernment Treasury Bills and Bonds 634,075 - - - - - - 634,075
Financial Assets at Fair Value through Other Comprehensive IncomeGovernment Treasury Bills and Bonds 38,301,267 - - - - - - 38,301,267 Unqouted Equity Shares - - - - 13,880 - - 13,880
Financial Assets at Amortised CostGovernment Treasury Bills and Bonds 13,559,215 - - - - - - 13,559,215 Sri Lanka Development Bonds 4,247,098 - - - - - - 4,247,098 Quoted Debentures 209,024 1,079,394 - - - - - 1,288,418
Financial Assets at Amortised Cost – Loans and Advances (Gross)
Corporate Loans - 61,248,722 41,680 3,421,624 - 3,663,376 6,156,869 74,532,271 Retail ,SME and Consumer - 34,018,394 2,908,854 3,660,359 40,222,560 18,021,892 9,562,229 108,394,288 Housing Loans - 275,382 98,923 - 3,134,199 903,646 19,545 4,431,696 Leases - 2,688,843 3,312,995 13,225 21,050,740 16,444,745 632,186 44,142,733 Staff Loans - - - - 3,626,540 25,882 - 3,652,422
Total 85,635,775 99,376,866 6,362,453 7,095,207 70,450,237 39,059,542 16,370,829 324,350,908
Note 1: All loans under "Neither past due nor individually impaired" are Stage 1 assets. Past Due loans include any loan that is in arrears for more than one day. Out of Rs. 39.0Bn categorized under “Past due but not individually impaired“, Rs. 16Bn (42%) is in Stage 1, Rs. 15.8Bn (40%) is in Stage 2 and Rs. 7.2Bn (18%) is in Stage 3. All individually impaired loans are Stage 3 assets.
Note 2: Total Assets are not in line with Statement of Financial Position since figures shown above are on Gross basis
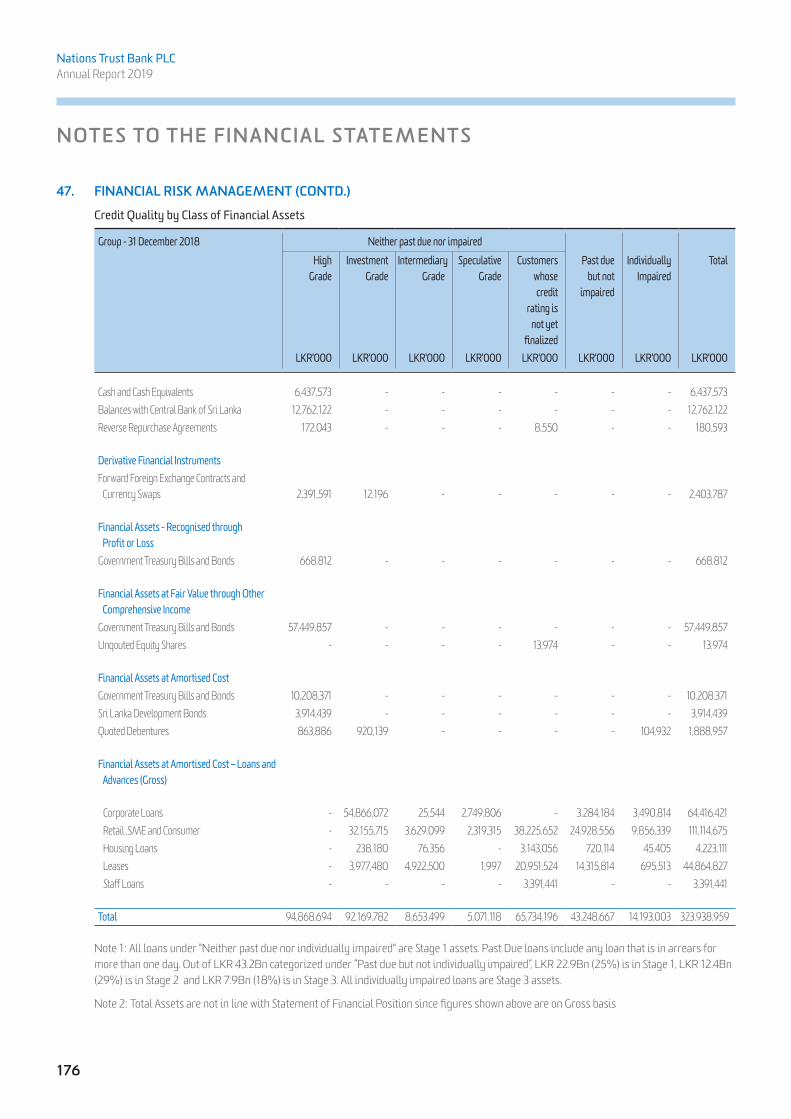
176
Nations Trust Bank PLC Annual Report 2019
47. FINANCIAL RISK MANAGEMENT (CONTD.)
Credit Quality by Class of Financial Assets
Group - 31 December 2018 Neither past due nor impaired High
Grade Investment
Grade Intermediary
Grade Speculative
Grade Customers
whose credit
rating is not yet
finalized
Past due but not
impaired
Individually Impaired
Total
LKR'000 LKR'000 LKR'000 LKR'000 LKR'000 LKR'000 LKR'000 LKR'000
Cash and Cash Equivalents 6,437,573 - - - - - - 6,437,573 Balances with Central Bank of Sri Lanka 12,762,122 - - - - - - 12,762,122 Reverse Repurchase Agreements 172,043 - - - 8,550 - - 180,593
Derivative Financial InstrumentsForward Foreign Exchange Contracts and Currency Swaps 2,391,591 12,196 - - - - - 2,403,787
Financial Assets - Recognised through Profit or LossGovernment Treasury Bills and Bonds 668,812 - - - - - - 668,812
Financial Assets at Fair Value through Other Comprehensive IncomeGovernment Treasury Bills and Bonds 57,449,857 - - - - - - 57,449,857 Unqouted Equity Shares - - - - 13,974 - - 13,974
Financial Assets at Amortised CostGovernment Treasury Bills and Bonds 10,208,371 - - - - - - 10,208,371 Sri Lanka Development Bonds 3,914,439 - - - - - - 3,914,439 Quoted Debentures 863,886 920,139 - - - - 104,932 1,888,957
Financial Assets at Amortised Cost – Loans and Advances (Gross)
Corporate Loans - 54,866,072 25,544 2,749,806 - 3,284,184 3,490,814 64,416,421 Retail ,SME and Consumer - 32,155,715 3,629,099 2,319,315 38,225,652 24,928,556 9,856,339 111,114,675 Housing Loans - 238,180 76,356 - 3,143,056 720,114 45,405 4,223,111 Leases - 3,977,480 4,922,500 1,997 20,951,524 14,315,814 695,513 44,864,827 Staff Loans - - - - 3,391,441 - - 3,391,441
Total 94,868,694 92,169,782 8,653,499 5,071,118 65,734,196 43,248,667 14,193,003 323,938,959
Note 1: All loans under "Neither past due nor individually impaired" are Stage 1 assets. Past Due loans include any loan that is in arrears for more than one day. Out of LKR 43.2Bn categorized under “Past due but not individually impaired“, LKR 22.9Bn (25%) is in Stage 1, LKR 12.4Bn (29%) is in Stage 2 and LKR 7.9Bn (18%) is in Stage 3. All individually impaired loans are Stage 3 assets.
Note 2: Total Assets are not in line with Statement of Financial Position since figures shown above are on Gross basis
NOTES TO THE FINANCIAL STATEMENTS
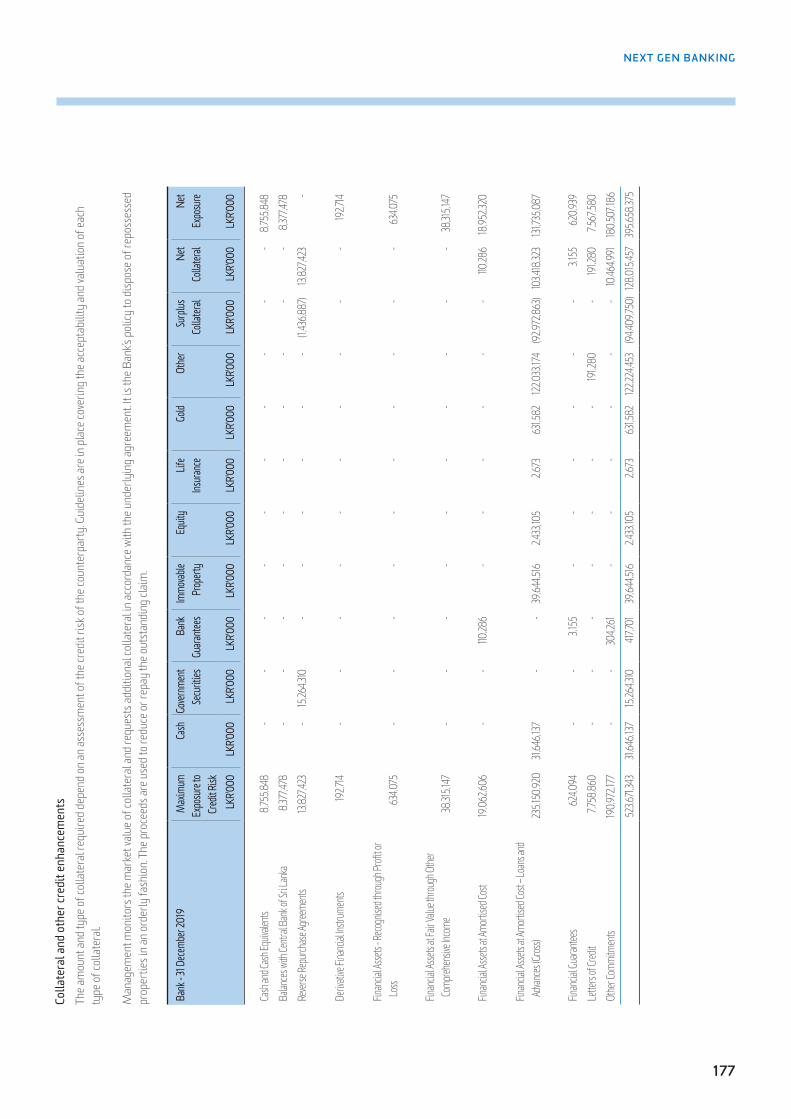
177
NEXT GEN BANKING
Colla
tera
l and
oth
er cr
edit
enha
ncem
ents
Th
e am
ount
and
type
of c
olla
tera
l req
uire
d de
pend
on
an as
sess
men
t of t
he cr
edit
risk o
f the
coun
terp
arty
. Gui
delin
es ar
e in
plac
e cov
erin
g th
e acc
epta
bilit
y an
d va
luat
ion
of ea
ch
type
of c
olla
tera
l.
M
anag
emen
t mon
itors
the m
arke
t val
ue o
f col
late
ral a
nd re
ques
ts ad
ditio
nal c
olla
tera
l in
acco
rdan
ce w
ith th
e und
erly
ing
agre
emen
t. It i
s the
Ban
k’s p
olicy
to d
ispos
e of r
epos
sess
ed
prop
ertie
s in
an o
rder
ly fa
shio
n. Th
e pro
ceed
s are
use
d to
redu
ce o
r rep
ay th
e out
stan
ding
clai
m.
Bank
- 31 D
ecem
ber 2
019
Max
imum
Ex
posu
re to
Cred
it Risk
Cash
Gove
rnme
nt Se
curit
iesBa
nk Gu
arante
esIm
mova
ble
Prop
erty
Equit
yLif
e Ins
uranc
eGo
ldOt
her
Surp
lus
Colla
teral
Net
Colla
teral
Net
Expo
sure
LKR'0
00 LK
R'000
LK
R'000
LK
R'000
LK
R'000
LKR'0
00 LK
R'000
LKR'0
00 LK
R'000
LKR'0
00 LK
R'000
LKR'0
00
Cash
and C
ash Eq
uivale
nts 8,
755,8
48
- -
- -
- -
- -
- -
8,75
5,848
Ba
lances
with
Centr
al Ba
nk of
Sri L
anka
8,37
7,478
-
- -
- -
- -
- -
- 8,
377,4
78
Rever
se Re
purch
ase Ag
reeme
nts 13
,827,4
23
- 15
,264,3
10
- -
- -
- -
(1,43
6,887
) 13
,827,4
23
-
Deriv
ative
Finan
cial In
strum
ents
192,7
14
- -
- -
- -
- -
- -
192,7
14
Finan
cial A
ssets
- Reco
gnise
d thro
ugh P
rofit o
r L
oss
634,0
75
- -
- -
- -
- -
- -
634,0
75
Finan
cial A
ssets
at Fa
ir Valu
e thro
ugh O
ther
Com
prehe
nsive
Incom
e 38
,315,1
47
- -
- -
- -
- -
- -
38,31
5,147
Finan
cial A
ssets
at Am
ortise
d Cos
t 19
,062,6
06
- -
110,28
6 -
- -
- -
- 110
,286
18,95
2,320
Finan
cial A
ssets
at Am
ortise
d Cos
t – Lo
ans a
nd
Adva
nces
(Gros
s) 23
5,150
,920
31,64
6,137
-
- 39
,644,5
16
2,433
,105
2,673
63
1,582
12
2,033
,174
(92,9
72,86
3) 10
3,418
,323
131,7
35,08
7
Finan
cial G
uaran
tees
624,0
94
- -
3,155
-
- -
- -
- 3,1
55
620,9
39
Lette
rs of
Credit
7,758
,860
- -
- -
- -
- 19
1,280
-
191,2
80
7,567
,580
Othe
r Com
mitm
ents
190,9
72,17
7 -
- 30
4,261
-
- -
- -
- 10
,464,9
91
180,5
07,18
6 52
3,671,
343
31,64
6,137
15
,264,3
10
417,7
01
39,64
4,516
2,4
33,10
5 2,6
73
631,5
82
122,2
24,45
3 (9
4,409
,750)
128,0
15,45
7 39
5,658
,375

178
Nations Trust Bank PLC Annual Report 2019
47.
FIN
ANCI
AL R
ISK
MAN
AGEM
ENT
(CO
NTD
.)
Co
llate
ral a
nd o
ther
cred
it en
hanc
emen
ts
Bank
- 31 D
ecem
ber 2
018
Max
imum
Ex
posu
re to
Cred
it Risk
Cash
Gove
rnme
nt Se
curit
iesBa
nk Gu
arante
esIm
mova
ble
Prop
erty
Equit
yLif
e Ins
uranc
eGo
ldOt
her
Surp
lus
Colla
teral
Net
Colla
teral
Net
Expo
sure
LKR'0
00 LK
R'000
LK
R'000
LK
R'000
LK
R'000
LKR'0
00 LK
R'000
LKR'0
00 LK
R'000
LKR'0
00 LK
R'000
LKR'0
00
Cash
and C
ash Eq
uivale
nts 6,
437,5
19
- -
- -
- -
- -
- -
6,43
7,519
Ba
lances
with
Centr
al Ba
nk of
Sri L
anka
12,76
2,122
-
- -
- -
- -
- -
- 12
,762,1
22
Rever
se Re
purch
ase Ag
reeme
nts 18
0,593
-
199,2
53
- -
- -
- -
(18,66
0) 18
0,593
-
Deriv
ative
Finan
cial In
strum
ents
2,403
,787
- -
- -
- -
- -
- -
2,403
,787
Finan
cial A
ssets
- Reco
gnise
d thro
ugh
Profi
t or L
oss
668,8
12
- -
- -
- -
- -
- -
668,8
12
Finan
cial A
ssets
at Fa
ir Valu
e thro
ugh O
ther
Com
prehe
nsive
Incom
e 57
,463,8
31 -
- -
- -
- -
- -
- 57
,463,8
31
Finan
cial A
ssets
at Am
ortise
d Cos
t 15
,941,2
47
- -
110,30
0 -
- -
- -
- 110
,300
15,83
0,947
Finan
cial A
ssets
at Am
ortise
d Cos
t – Lo
ans a
nd
Adva
nces
(Gros
s) 22
8,005
,570
29,72
3,835
-
- 21
,717,0
11 2,5
29,93
7 1,0
00
435,6
72
115,6
27,59
5 (7
6,785
,031)
93,25
0,019
13
4,755
,550
Finan
cial G
uaran
tees
908,2
58
- -
30,29
2 -
- -
- -
- 30
,292
877,9
66
Lette
rs of
Credit
5,92
0,213
-
- -
- -
- -
781,2
99
- 78
1,299
5,
138,9
14
Othe
r Com
mitm
ents
183,7
70,83
6 -
- 34
6,211
- -
- -
- -
8,09
1,967
17
5,678
,869
514,4
62,78
9 29
,723,8
35
199,2
53
486,8
03
21,71
7,011
2,529
,937
1,000
43
5,672
116
,408,8
94
(76,80
3,691
) 10
2,444
,469
412,0
18,31
9
NOTES TO THE FINANCIAL STATEMENTS

179
NEXT GEN BANKING
Colla
tera
l and
oth
er cr
edit
enha
ncem
ents
Grou
p - 31
Dece
mber
2019
Max
imum
Ex
posu
re to
Cred
it Risk
Cash
Gove
rnme
nt Se
curit
iesBa
nk Gu
arante
esIm
mova
ble
Prop
erty
Equit
yLif
e Ins
uranc
eGo
ldOt
her
Surp
lus
Colla
teral
Net
Colla
teral
Net
Expo
sure
LKR'0
00 LK
R'000
LK
R'000
LK
R'000
LK
R'000
LKR'0
00 LK
R'000
LKR'0
00 LK
R'000
LKR'0
00 LK
R'000
LKR'0
00
Cash
and C
ash Eq
uivale
nts 8,
755,9
30
- -
- -
- -
- -
- -
8,75
5,930
Ba
lances
with
Centr
al Ba
nk of
Sri L
anka
8,37
7,478
-
- -
- -
- -
- -
- 8,
377,4
78
Rever
se Re
purch
ase Ag
reeme
nts 13
,827,4
23
- 15
,264,3
10
- -
- -
- -
(1,43
6,887
) 13
,827,4
23
-
Deriv
ative
Finan
cial In
strum
ents
192,7
14
- -
- -
- -
- -
- -
192,7
14
Finan
cial A
ssets
- Reco
gnise
d thro
ugh
Profi
t or L
oss
634,0
75
- -
- -
- -
- -
- -
634,0
75
Finan
cial A
ssets
at Fa
ir Valu
e thro
ugh O
ther
Co
mpreh
ensiv
e Inco
me 38
,315,1
47
- -
- -
- -
- -
- -
38,31
5,147
Finan
cial A
ssets
at Am
ortise
d Cos
t 19
,062,6
06
- -
110,28
6 -
- -
- -
- 110
,286
18,95
2,320
Finan
cial A
ssets
at Am
ortise
d Cos
t – Lo
ans a
nd
Adva
nces
(Gros
s) 23
5,153
,410
31,64
6,137
-
- 39
,644,5
16
2,433
,105
2,673
63
1,582
12
2,033
,174
(92,9
72,86
3) 10
3,418
,323
131,7
35,08
7
Finan
cial G
uaran
tees
624,0
94
- -
3,155
-
- -
- -
- 3,1
55
620,9
39
Lette
rs of
Credit
7,758
,860
- -
- -
- -
- 19
1,280
-
191,2
80
7,567
,580
Othe
r Com
mitm
ents
190,9
76,30
1 -
- 30
4,261
-
- -
- -
- 10
,467,4
80
180,5
08,82
1 52
3,678
,039
31,64
6,137
15
,264,3
10
417,7
01
39,64
4,516
2,4
33,10
5 2,6
73
631,5
82
122,2
24,45
3 (9
4,409
,750)
128,0
17,94
7 39
5,660
,092

180
Nations Trust Bank PLC Annual Report 2019
47.
FIN
ANCI
AL R
ISK
MAN
AGEM
ENT
(CO
NTD
.)
Co
llate
ral a
nd o
ther
cred
it en
hanc
emen
ts
Grou
p - 31
Dece
mber
2018
Max
imum
Ex
posu
re to
Cr
edit R
isk
Cash
Gove
rnme
nt
Secu
rities
Bank
Guara
ntee
sIm
mova
ble
Prop
erty
Equit
yLif
e Ins
uran
ceGo
ldOt
her
Surp
lus
Colla
teral
Net
Colla
teral
Net
Expo
sure
LKR'0
00 LK
R'000
LK
R'000
LK
R'000
LK
R'000
LKR'0
00 LK
R'000
LKR'0
00 LK
R'000
LKR'0
00 LK
R'000
LKR'0
00
Cash
and C
ash E
quiva
lents
6,43
7,573
-
- -
- -
- -
- -
- 6,
437,5
73
Balan
ces w
ith Ce
ntral
Bank
of Sr
i Lan
ka 12
,762,1
22
-
-
-
-
-
-
-
-
-
-
12,76
2,122
Re
verse
Repu
rchas
e Agre
emen
ts 18
0,593
-
19
9,253
-
-
-
-
-
-
(18
,660)
180,5
93
-
Deriv
ative
Finan
cial In
strum
ents
2,40
3,787
-
-
-
-
-
-
-
-
-
-
2,
403,7
87
Finan
cial A
ssets
- Rec
ognis
ed th
rough
P
rofit o
r Los
s 66
8,812
-
-
-
-
-
-
-
-
-
-
66
8,812
Finan
cial A
ssets
at Fa
ir Valu
e thro
ugh O
ther
Com
prehe
nsive
Inco
me 57
,463,8
31
-
-
-
-
-
-
-
-
-
-
57,46
3,831
Finan
cial A
ssets
at Am
ortise
d Cos
t 15
,941,2
47
-
-
110,30
0 -
-
-
-
-
-
110
,300
15,83
0,947
Finan
cial A
ssets
at Am
ortise
d Cos
t – Lo
ans a
nd
Adv
ance
s (Gros
s) 22
8,010
,474
29,72
3,835
-
-
21
,717,0
11 2,
546,0
60
1,000
43
5,672
11
5,627
,595
(76,7
96,24
9)93
,254,9
24
134,7
55,55
0
Finan
cial G
uaran
tees
908,2
58
-
-
30,29
2 -
-
-
-
-
-
30
,292
877,9
66
Lette
rs of
Credit
5,92
0,213
-
-
-
-
-
-
-
78
1,299
-
78
1,299
5,
138,9
14
Othe
r Com
mitm
ents
183,7
73,99
3 -
-
34
6,211
-
-
-
-
-
-
8,09
2,749
17
5,681
,244
514,4
70,90
4 29
,723,8
35
199,2
53
486,8
03
21,71
7,011
2,54
6,060
1,0
00
435,6
72
116,4
08,89
4 (7
6,814
,909)
102,4
50,15
7 41
2,020
,747
An
alys
is o
f Ris
k Co
ncen
trat
ion
Th
e Ba
nk’s
conc
entr
atio
ns o
f ris
k ar
e m
anag
ed b
y in
dust
ry se
ctor
. The
follo
win
g ta
ble
show
s the
risk
conc
entr
atio
n by
the
indu
stry
for t
he co
mpo
nent
s of t
he St
atem
ent o
f
Fina
ncia
l Pos
ition
. Ass
ets c
once
ntra
ted
as “O
ther
” inc
lude
Con
sum
er L
oans
, Cre
dit C
ards
and
Lea
ses.
A m
ajor
por
tion
of th
e Le
ases
cons
ist o
f Lea
ses g
rant
ed to
indi
vidua
ls fo
r the
pu
rpos
e of
faci
litat
ing
thei
r sm
all/
micr
o le
vel b
usin
ess a
ctivi
ties w
hich
cann
ot b
e di
rect
ly a
ttrib
utab
le to
a si
ngle
iden
tified
sect
or, h
ence
clas
sifie
d un
der”
Oth
er”.
NOTES TO THE FINANCIAL STATEMENTS

181
NEXT GEN BANKING
Anal
ysis
of R
isk
Conc
entr
atio
n
Bank
- 31 D
ecem
ber 2
019
Agric
ulture
Cons
umer
Du
rables
&
Disp
osab
les
Food
&
Beve
rages
Ancil
lary
Servi
ces
Bank
ing &
Fin
ance
Healt
h Ca
reInf
ormati
on
Tech
nolog
y &
Telec
ommu
ni-ca
tion
Indus
tries
Dive
rsifie
dCo
nstru
ction
&
Real
Estat
e
Trave
l &
Trans
port
Othe
rCa
sh Ba
cked
/ Go
vern
ment
Secu
rities
Total
LKR'0
00 LK
R'000
LK
R'000
LK
R'000
LK
R'000
LKR'0
00 LK
R'000
LKR'0
00 LK
R'000
LKR'0
00 LK
R'000
LKR'0
00 LK
R'000
LKR'0
00
Cash
and C
ash Eq
uivale
nts -
- -
- -
- -
- -
- -
- 8,
755,8
48
8,75
5,848
Ba
lances
with
Centr
al Ba
nk of
S
ri Lan
ka -
- -
- -
- -
- -
- -
- 8,
377,4
78
8,37
7,478
Re
verse
Repu
rchase
Agree
ments
- -
- -
- -
- -
- -
- -
13,82
7,423
13
,827,4
23
Deriv
ative
Fina
ncial
Instr
umen
tsFo
rward
Forei
gn Ex
chan
ge Co
ntract
s a
nd Cu
rrenc
y Swa
ps -
- -
- 19
2,714
-
- -
- -
- -
- 19
2,714
Finan
cial A
ssets
- R
ecog
nised
thr
ough
Profi
t or L
oss
Gover
nmen
t Trea
sury
Bills a
nd Bo
nds
- -
- -
- -
- -
- -
- -
634,0
75
634,0
75
Finan
cial A
ssets
at Fa
ir Valu
e th
rough
Othe
r C
ompre
hens
ive In
come
Gover
nmen
t Trea
sury
Bills a
nd Bo
nds
- -
- -
- -
- -
- -
- -
38,30
1,267
38
,301,2
67
Unqo
uted E
quity
Share
s -
- -
- -
- -
- -
- -
13,88
0 -
13,88
0
Finan
cial A
ssets
at Am
ortise
d Cos
tGo
vernm
ent T
reasu
ry Bil
ls and
Bond
s -
- -
- -
- -
- -
- -
- 13
,559,2
15
13,55
9,215
Sri
Lank
a Deve
lopme
nt Bo
nds
- -
- -
- -
- -
- -
- -
4,24
7,098
4,
247,0
98
Quote
d Deb
entur
es
- -
- -
934,1
92
- -
354,2
26
- -
- -
- 1,2
88,41
8 Im
pairm
ent
- -
- -
- -
- -
- -
- -
- (3
2,125
)
Finan
cial A
ssets
at Am
ortize
d Cos
t -
Loa
ns an
d Adv
ance
s C
orpora
te Lo
ans
19,49
2,436
3,2
89,92
8 3,4
59,12
1 82
,329
8,18
1,078
1,5
65,89
9 1,1
59,38
0 14
,954,5
76
7,887
,694
4,69
4,596
8,
279,3
40
66
1,485
,827
74,53
2,271
Reta
il ,SM
E and
Cons
umer
8,84
6,674
4,
759,5
81
4,72
7,715
12
,359,4
57
3,712
,555
4,89
2,671
3,403
,205
29,37
2,548
1,4
07,76
3 10
,465,7
55
7,058
,614
3,372
,862
14,01
2,400
10
8,391
,799
Hou
sing L
oans
21,86
1 26
,784
17,59
6 21
5,707
48
,772
73,18
7 88
,896
579,1
66
5,97
1 7,6
89
56,25
0 3,2
83,36
1 6,
456
4,43
1,696
L
eases
7,094
,523
1,859
,659
1,837
,537
6,88
7,101
1,5
17,85
7 1,4
82,70
6 1,3
31,10
7 8,
435,0
23
250,6
34
4,24
1,618
7,5
07,91
9 1,6
97,04
8 -
44,14
2,733
S
taff lo
ans
- -
- -
2,876
,490
- -
- -
- -
- -
2,876
,490
Impa
irmen
t for L
oans
and A
dvanc
es -
- -
- -
- -
- -
- -
- -
(7,58
3,419
)Ne
t Loa
ns an
d Adva
nces
- -
- -
- -
- -
- -
- -
- 22
6,791
,569
35,45
5,494
9,
935,9
52
10,04
1,968
19
,544,5
94
17,46
3,659
8,
014,4
63
5,98
2,588
53
,695,5
40
9,55
2,063
19
,409,6
58
22,90
2,123
8,
367,2
17
103,2
07,08
7 31
5,956
,861

182
Nations Trust Bank PLC Annual Report 2019
47.
FIN
ANCI
AL R
ISK
MAN
AGEM
ENT
(CO
NTD
.)
Anal
ysis
of R
isk
Conc
entr
atio
n
Bank
- 31 D
ecem
ber 2
018
Agric
ultur
eCo
nsum
er
Dura
bles &
Di
spos
ables
Food
&
Beve
rage
sAn
cillar
y Se
rvice
sBa
nking
&
Finan
ceHe
alth
Care
Inform
ation
Te
chno
logy &
Te
lecom
muni
-catio
n
Indus
tries
Dive
rsifie
dCo
nstru
ction
&
Real
Estat
e
Trave
l &
Trans
port
Othe
rCa
sh Ba
cked
/ Go
vern
ment
Secu
rities
Total
LKR'0
00 LK
R'000
LK
R'000
LK
R'000
LK
R'000
LKR'0
00 LK
R'000
LKR'0
00 LK
R'000
LKR'0
00 LK
R'000
LKR'0
00 LK
R'000
LKR'0
00
Cash
and C
ash E
quiva
lents
- -
- -
- -
- -
- -
- -
6,43
7,519
6,
437,5
19
Balan
ces w
ith Ce
ntral
Bank
of
Sri L
anka
-
-
-
-
-
-
-
-
-
-
-
-
12,76
2,122
12
,762,1
22
Reve
rse Re
purch
ase A
gree
ments
-
-
-
-
-
-
-
-
-
-
-
-
180,5
93
180,5
93
Deriv
ative
Fina
ncial
Instr
umen
tsFo
rward
Forei
gn Ex
chan
ge Co
ntract
s a
nd Cu
rrenc
y Swa
ps -
-
-
-
2,
342,1
50
-
-
-
-
-
-
61,63
7 -
2,
403,7
87
Finan
cial A
ssets
- Rec
ognis
ed
thro
ugh P
rofit
or Lo
ssGo
vern
ment
Treas
ury
Bills
and B
onds
-
-
-
-
-
-
-
-
-
-
-
-
668,8
12
668,8
12
Finan
cial A
ssets
at Fa
ir Valu
e th
roug
h Oth
er Co
mpre
hens
ive
Inco
meGo
vern
ment
Treas
ury
Bills
and B
onds
-
-
-
-
-
-
-
-
-
-
-
- 5
7,449
,857
57,44
9,857
Un
qoute
d Equ
ity Sh
ares
-
-
-
-
-
-
-
-
-
-
-
13,97
4 -
13
,974
Finan
cial A
ssets
at
Amo
rtise
d Cos
tGo
vern
ment
Treas
ury
Bills
and B
onds
-
-
-
-
-
-
-
-
-
-
-
-
10,20
8,371
10
,208,3
71
Sri L
anka
Deve
lopme
nt Bo
nds
-
-
-
-
-
-
-
-
-
-
-
-
3,91
4,439
3,
914,4
39
Quote
d Deb
entur
es
-
23,01
1 17
1,936
-
1,2
34,85
2 -
-
45
9,158
-
-
-
-
-
1,8
88,95
7 Im
pairm
ent
-
-
-
-
-
-
-
-
-
-
-
-
-
(70,5
19)
Finan
cial A
ssets
at Am
ortiz
ed
Cos
t - Lo
ans a
nd Ad
vanc
es C
orpo
rate L
oans
16,10
5,764
3,
339,2
08
2,58
0,899
87
,027
12,36
6,953
1,1
45,68
9 1,1
68,42
5 10
,740,9
74
2,45
2,373
2,
418,1
05
11,69
6,367
20
6,367
10
8,269
64
,416,4
21
Reta
il ,SM
E and
Cons
umer
10
,124,8
93
5,09
6,736
4,
832,4
29
11,45
4,098
3,
937,1
32
3,52
7,897
3,
637,2
07
28,85
6,649
1,1
85,21
8 10
,726,8
22
7,95
9,768
6,
515,1
46
13,25
5,775
111
,109,7
70
Hou
sing L
oans
19,06
0 20
,433
22,16
0 18
8,824
33
2,303
57
,113
140,1
94
509,9
90
6,42
0 8,
558
43,76
6 2,
874,2
90
-
4,22
3,111
Lea
ses
6,86
7,648
1,8
46,25
6 1,8
31,07
8 6,
217,4
80
1,620
,737
1,685
,461
1,538
,494
8,82
5,396
24
1,050
4,
631,9
00
7,718
,457
1,840
,869
- 4
4,864
,827
Staff
loan
s -
-
-
-
2,
644,5
84
-
-
-
-
-
-
-
-
2,64
4,584
Im
pairm
ent fo
r Loa
ns an
d Adv
ance
s -
-
-
-
-
-
-
-
-
-
-
-
-
(5,7
58,05
6)Ne
t Loa
ns an
d Adv
ance
s -
-
-
-
-
-
-
-
-
-
-
-
-
221
,500,6
56
33,11
7,365
10
,325,6
45
9,43
8,501
17
,947,4
30
24,47
8,710
6,
416,1
61
6,48
4,320
49
,392,1
67
3,88
5,061
17
,785,3
85
27,41
8,358
11
,512,2
84
104,9
85,75
6 31
7,358
,568
NOTES TO THE FINANCIAL STATEMENTS

183
NEXT GEN BANKING
Anal
ysis
of R
isk
Conc
entr
atio
n
Grou
p - 31
Dece
mber
2019
Agric
ulture
Cons
umer
Du
rables
&
Disp
osab
les
Food
&
Beve
rages
Ancil
lary
Servi
ces
Bank
ing &
Fin
ance
Healt
h Ca
reInf
ormati
on
Tech
nolog
y &
Telec
ommu
ni-ca
tion
Indus
tries
Dive
rsifie
dCo
nstru
ction
&
Real
Estat
e
Trave
l &
Trans
port
Othe
rCa
sh Ba
cked
/ Go
vern
ment
Secu
rities
Total
LKR'0
00 LK
R'000
LK
R'000
LK
R'000
LK
R'000
LKR'0
00 LK
R'000
LKR'0
00 LK
R'000
LKR'0
00 LK
R'000
LKR'0
00 LK
R'000
LKR'0
00
Cash
and C
ash Eq
uivale
nts -
- -
- -
- -
- -
- -
- 8,
755,9
30
8,75
5,930
Ba
lances
with
Centr
al Ba
nk of
S
ri Lan
ka -
- -
- -
- -
- -
- -
- 8,
377,4
78
8,37
7,478
Rever
se Re
purch
ase Ag
reeme
nts -
- -
- -
- -
- -
- -
- 13
,827,4
23
13,82
7,423
Deriv
ative
Fina
ncial
Instr
umen
tsFo
rward
Forei
gn Ex
chan
ge Co
ntract
s a
nd Cu
rrenc
y Swa
ps -
- -
- 19
2,714
-
- -
- -
- -
- 19
2,714
Finan
cial A
ssets
- Rec
ognis
ed
throu
gh Pr
ofit o
r Los
sGo
vernm
ent T
reasu
ry Bil
ls and
Bond
s -
- -
- -
- -
- -
- -
- 63
4,075
63
4,075
Finan
cial A
ssets
at Fa
ir Valu
e th
rough
Othe
r C
ompre
hens
ive In
come
Gover
nmen
t Trea
sury
Bills a
nd Bo
nds
- -
- -
- -
- -
- -
- -
38,30
1,267
38
,301,2
67
Unqo
uted E
quity
Share
s -
- -
- -
- -
- -
- -
13,88
0 -
13,88
0
Finan
cial A
ssets
at Am
ortise
d Cos
tGo
vernm
ent T
reasu
ry Bil
ls and
Bond
s -
- -
- -
- -
- -
- -
- 13
,559,2
15
13,55
9,215
Sri
Lank
a Deve
lopme
nt Bo
nds
- -
- -
- -
- -
- -
- -
4,24
7,098
4,
247,0
98
Quote
d Deb
entur
es
- -
- -
934,1
92
- -
354,2
26
- -
- -
- 1,2
88,41
8 Im
pairm
ent
- -
- -
- -
- -
- -
- -
- (3
2,125
)
Finan
cial A
ssets
at Am
ortize
d Cos
t -
Loa
ns an
d Adv
ance
s C
orpora
te Lo
ans
19,49
2,436
7,8
87,69
4 3,4
59,12
1 82
,329
8,18
1,078
1,5
65,89
9 1,1
59,38
0 14
,954,5
76
3,289
,928
4,69
4,596
8,
279,3
40
66
1,485
,827
74,53
2,271
Reta
il ,SM
E and
Cons
umer
8,84
6,674
1,4
07,76
3 4,
727,7
15
12,35
9,457
3,7
15,04
5 4,
892,6
71 3,4
03,20
5 29
,372,5
48
4,75
9,581
10
,465,7
55
7,058
,614
3,372
,862
14,01
2,400
10
8,394
,288
Hou
sing L
oans
21,86
1 5,
971
17,59
6 21
5,707
48
,772
73,18
7 88
,896
579,1
66
26,78
4 7,6
89
56,25
0 3,2
83,36
1 6,
456
4,43
1,696
L
eases
7,094
,523
250,6
34
1,837
,537
6,88
7,101
1,5
17,85
7 1,4
82,70
6 1,3
31,10
7 8,
435,0
23
1,859
,659
4,24
1,618
7,5
07,91
9 1,6
97,04
8 -
44,14
2,733
S
taff lo
ans
- -
- -
2,876
,490
- -
- -
- -
- -
2,876
,490
Impa
irmen
t for L
oans
and A
dvanc
es -
- -
- -
- -
- -
- -
- -
(7,58
3,419
)Ne
t Loa
ns an
d Adva
nces
- -
- -
- -
- -
- -
- -
- 22
6,794
,059
35,45
5,494
9,
552,0
63
10,04
1,968
19
,544,5
94
17,46
6,148
8,
014,4
63
5,98
2,588
53
,695,5
40
9,93
5,952
19
,409,6
58
22,90
2,123
8,
367,2
17
103,2
07,17
0 31
5,959
,432

184
Nations Trust Bank PLC Annual Report 2019
47.
FIN
ANCI
AL R
ISK
MAN
AGEM
ENT
(CO
NTD
.)
An
alys
is o
f Ris
k Co
ncen
trat
ion
Grou
p - 31
Dece
mber
2018
Agric
ulture
Cons
umer
Du
rables
&
Disp
osab
les
Food
&
Beve
rages
Ancil
lary
Servi
ces
Bank
ing &
Fin
ance
Healt
h Ca
reInf
ormati
on
Tech
nolog
y &
Telec
ommu
ni-ca
tion
Indus
tries
Dive
rsifie
dCo
nstru
ction
&
Real
Estat
e
Trave
l &
Trans
port
Othe
rCa
sh Ba
cked
/ Go
vern
ment
Secu
rities
Total
LKR'0
00 LK
R'000
LK
R'000
LK
R'000
LK
R'000
LKR'0
00 LK
R'000
LKR'0
00 LK
R'000
LKR'0
00 LK
R'000
LKR'0
00 LK
R'000
LKR'0
00
Cash
and C
ash Eq
uivale
nts -
- -
- -
- -
- -
- -
- 6,
437,5
73
6,43
7,573
Ba
lances
with
Centr
al Ba
nk of
S
ri Lan
ka -
- -
- -
- -
- -
- -
- 12
,762,1
22
12,76
2,122
Rever
se Re
purch
ase Ag
reeme
nts -
- -
- -
- -
- -
- -
- 18
0,593
18
0,593
Deriv
ative
Fina
ncial
Instr
umen
tsFo
rward
Forei
gn Ex
chan
ge Co
ntract
s a
nd Cu
rrenc
y Swa
ps -
- -
- 2,3
42,15
0 -
- -
- -
- 61
,637
- 2,4
03,78
7
Finan
cial A
ssets
- Rec
ognis
ed
throu
gh Pr
ofit o
r Los
sGo
vernm
ent T
reasu
ry Bil
ls and
Bond
s -
- -
- -
- -
- -
- -
- 66
8,812
66
8,812
Finan
cial A
ssets
at Fa
ir Valu
e th
rough
Othe
r C
ompre
hens
ive In
come
Gover
nmen
t Trea
sury
Bills a
nd Bo
nds
- -
- -
- -
- -
- -
- -
57,44
9,857
57
,449,8
57
Unqo
uted E
quity
Share
s -
- -
- -
- -
- -
- -
13,97
4 -
13,97
4
Finan
cial A
ssets
at Am
ortise
d Cos
tGo
vernm
ent T
reasu
ry Bil
ls and
Bond
s -
- -
- -
- -
- -
- -
- 10
,208,3
71 10
,208,3
71 Sri
Lank
a Deve
lopme
nt Bo
nds
- -
- -
- -
- -
- -
- -
3,914
,439
3,914
,439
Quote
d Deb
entur
es
- 23
,011
171,9
36
- 1,2
34,85
2 -
- 45
9,158
-
- -
- -
1,888
,957
Impa
irmen
t -
- -
- -
- -
- -
- -
- -
(70,51
9)
Finan
cial A
ssets
at Am
ortize
d Cos
t -
Loa
ns an
d Adv
ance
s C
orpora
te Lo
ans
16,10
5,764
2,4
52,37
3 2,5
80,89
9 87
,027
12,36
6,953
1,1
45,68
9 1,1
68,42
5 10
,740,9
74
3,339
,208
2,418
,105
11,69
6,367
20
6,367
10
8,269
64
,416,4
21
Reta
il ,SM
E and
Cons
umer
10,12
4,893
1,1
85,21
8 4,
832,4
29
11,45
4,098
3,9
42,03
7 3,5
27,89
7 3,6
37,20
7 28
,856,6
49
5,09
6,736
10
,726,8
22
7,959
,768
6,51
5,146
13
,255,7
75
111,11
4,675
H
ousin
g Loa
ns 19
,060
6,42
0 22
,160
188,8
24
332,3
03
57,11
3 14
0,194
50
9,990
20
,433
8,55
8 43
,766
2,874
,290
- 4,
223,1
11 L
eases
6,86
7,648
24
1,050
1,8
31,07
8 6,
217,48
0 1,6
20,73
7 1,6
85,46
1 1,5
38,49
4 8,
825,3
96
1,846
,256
4,63
1,900
7,7
18,45
7 1,8
40,86
9 -
44,86
4,827
S
taff lo
ans
- -
- -
2,644
,584
- -
- -
- -
- -
2,644
,584
Impa
irmen
t for L
oans
and A
dvanc
es -
- -
- -
- -
- -
- -
- -
(5,75
7,926
)Ne
t Loa
ns an
d Adva
nces
- -
- -
- -
- -
- -
- -
- 22
1,505
,692
33,11
7,365
3,9
08,07
2 9,
438,5
01
17,94
7,430
24
,483,6
15
6,416
,161
6,48
4,320
49
,392,1
67
10,30
2,634
17
,785,3
85
27,41
8,358
11
,512,2
84
104,9
85,81
0 31
7,363
,658
NOTES TO THE FINANCIAL STATEMENTS
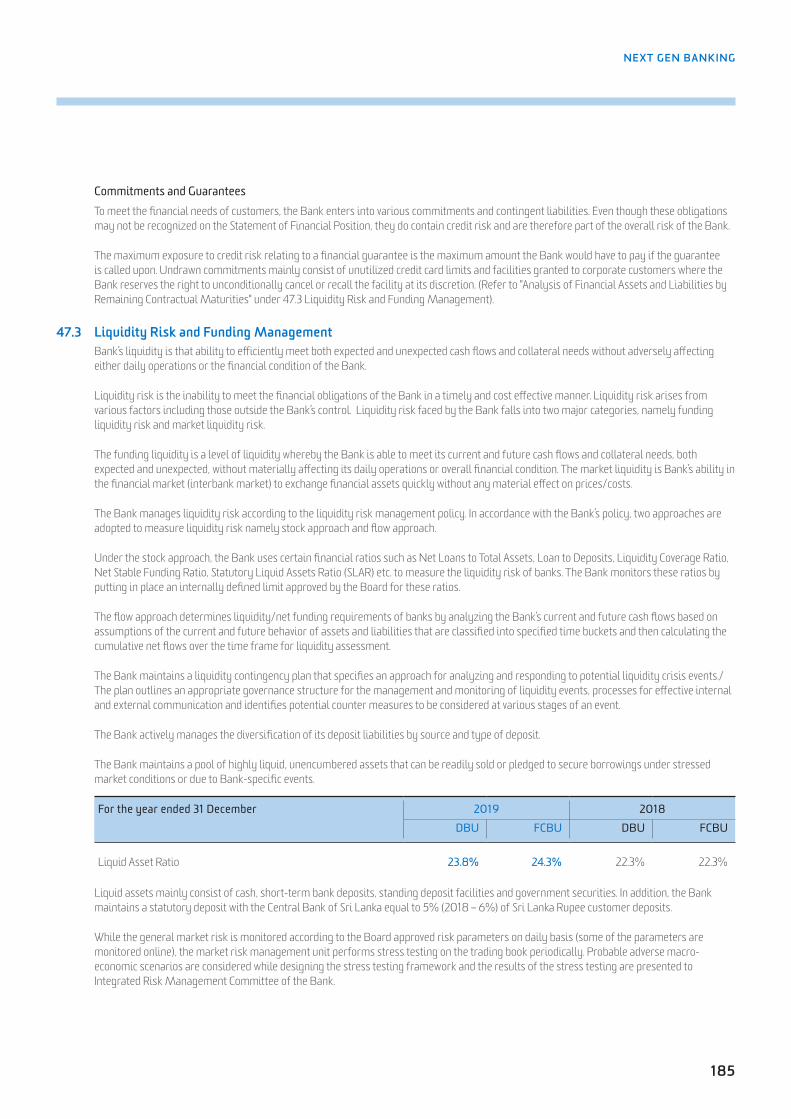
185
NEXT GEN BANKING
Commitments and Guarantees To meet the financial needs of customers, the Bank enters into various commitments and contingent liabilities. Even though these obligations
may not be recognized on the Statement of Financial Position, they do contain credit risk and are therefore part of the overall risk of the Bank.
The maximum exposure to credit risk relating to a financial guarantee is the maximum amount the Bank would have to pay if the guarantee is called upon. Undrawn commitments mainly consist of unutilized credit card limits and facilities granted to corporate customers where the Bank reserves the right to unconditionally cancel or recall the facility at its discretion. (Refer to "Analysis of Financial Assets and Liabilities by Remaining Contractual Maturities" under 47.3 Liquidity Risk and Funding Management).
47.3 Liquidity Risk and Funding Management Bank’s liquidity is that ability to efficiently meet both expected and unexpected cash flows and collateral needs without adversely affecting
either daily operations or the financial condition of the Bank.
Liquidity risk is the inability to meet the financial obligations of the Bank in a timely and cost effective manner. Liquidity risk arises from various factors including those outside the Bank’s control. Liquidity risk faced by the Bank falls into two major categories, namely funding liquidity risk and market liquidity risk.
The funding liquidity is a level of liquidity whereby the Bank is able to meet its current and future cash flows and collateral needs, both expected and unexpected, without materially affecting its daily operations or overall financial condition. The market liquidity is Bank’s ability in the financial market (interbank market) to exchange financial assets quickly without any material effect on prices/costs.
The Bank manages liquidity risk according to the liquidity risk management policy. In accordance with the Bank’s policy, two approaches are adopted to measure liquidity risk namely stock approach and flow approach.
Under the stock approach, the Bank uses certain financial ratios such as Net Loans to Total Assets, Loan to Deposits, Liquidity Coverage Ratio, Net Stable Funding Ratio, Statutory Liquid Assets Ratio (SLAR) etc. to measure the liquidity risk of banks. The Bank monitors these ratios by putting in place an internally defined limit approved by the Board for these ratios.
The flow approach determines liquidity/net funding requirements of banks by analyzing the Bank’s current and future cash flows based on assumptions of the current and future behavior of assets and liabilities that are classified into specified time buckets and then calculating the cumulative net flows over the time frame for liquidity assessment.
The Bank maintains a liquidity contingency plan that specifies an approach for analyzing and responding to potential liquidity crisis events./ The plan outlines an appropriate governance structure for the management and monitoring of liquidity events, processes for effective internal and external communication and identifies potential counter measures to be considered at various stages of an event.
The Bank actively manages the diversification of its deposit liabilities by source and type of deposit.
The Bank maintains a pool of highly liquid, unencumbered assets that can be readily sold or pledged to secure borrowings under stressed market conditions or due to Bank-specific events.
For the year ended 31 December 2019 2018DBU FCBU DBU FCBU
Liquid Asset Ratio 23.8% 24.3% 22.3% 22.3%
Liquid assets mainly consist of cash, short-term bank deposits, standing deposit facilities and government securities. In addition, the Bank maintains a statutory deposit with the Central Bank of Sri Lanka equal to 5% (2018 – 6%) of Sri Lanka Rupee customer deposits.
While the general market risk is monitored according to the Board approved risk parameters on daily basis (some of the parameters are monitored online), the market risk management unit performs stress testing on the trading book periodically. Probable adverse macro- economic scenarios are considered while designing the stress testing framework and the results of the stress testing are presented to Integrated Risk Management Committee of the Bank.

186
Nations Trust Bank PLC Annual Report 2019
47. FINANCIAL RISK MANAGEMENT (CONTD.)
Analysis of Financial Assets and Liabilities by Remaining Contractual Maturities The table below summarizes the maturity profile of the undiscounted cash flows of the Bank’s financial assets and liabilities as at 31 December
2019 under the flow approach.
Bank - As at 31 December 2019 On demand (Less than 15
days)
16 days to3 months
3 to 12 months
1 to 5 years
Over 5 years
Total
LKR'000 LKR'000 LKR'000 LKR'000 LKR'000 LKR'000
Financial AssetsCash and Cash Equivalents 8,757,606 - - - - 8,757,606 Balances with Central Bank of Sri Lanka 2,760,170 2,021,970 3,401,529 193,671 138 8,377,478 Reverse Repurchase Agreements 13,832,999 - - - - 13,832,999
Financial Assets - Recognised through Profit or LossGovernment Debt Securities - Treasury Bills and Bonds - 19,913 53,753 817,564 - 891,229
Financial Assets at Fair Value through Other Comprehensive IncomeGovernment Debt Securities - Treasury Bills and Bonds 2,892,400 4,960,459 14,119,748 21,923,454 262,741 44,158,802 Unqouted Equity Shares - - - - 13,880 13,880
Financial Assets at Amortised CostGovernment Debt Securities - Treasury Bills and Bonds 94,036 329,842 1,070,819 12,594,938 5,460,521 19,550,157 Other Financial Assets - 116,165 1,895,720 4,122,332 - 6,134,217
Financial Assets at Amortised Cost – Loans and Advances 87,681,347 33,983,744 45,525,482 90,313,750 14,077,573 271,581,896
Total Undiscounted Financial Assets 116,018,558 41,432,091 66,067,050 129,965,710 19,814,854 373,298,263
Financial LiabilitiesDue to Banks 4,111,131 2,395,065 - - - 6,506,195
Financial Liabilities at Amortised CostDue to Depositors 73,468,434 57,015,180 97,099,192 6,213,085 3,200 233,799,091 Repurchase Agreements 6,442,960 4,472,526 156,320 - - 11,071,807 Due to Other Borrowers 552,773 566,100 5,428,113 24,126,031 2,995,314 33,668,330
Debt Securities Issued - - 1,660,199 15,346,691 2,264,400 19,271,290
Total Undiscounted Financial Liabilities 84,575,299 64,448,871 104,343,824 45,685,807 5,262,914 304,316,714 Net Undiscounted Financial Assets/ (Liabilities) 31,443,259 (23,016,779) (38,276,774) 84,279,903 14,551,941 68,981,549
Gross Settled Derivatives not Held for TradingFinancial AssetsContractual Amounts Receivable 2,636,549 10,019,475 2,506,340 93,650 - 15,256,014 Contractual Amounts Payable (2,636,549) (10,019,475) (2,506,340) (93,650) - (15,256,014)
- - - - - - Financial LiabilitiesContractual Amounts Receivable 1,770,054 7,626,072 13,892,082 187,550 - 23,475,758 Contractual Amounts Payable (1,770,054) (7,626,072) (13,892,082) (187,550) - (23,475,758)
- - - - - - Total Gross Settled Derivative Assets/(Liabilities) not Held for Trading - - - - - - Total Net Financial Assets/ (Liabilities) 31,443,259 (23,016,779) (38,276,774) 84,279,903 14,551,941 68,981,549
NOTES TO THE FINANCIAL STATEMENTS

187
NEXT GEN BANKING
Analysis of Financial Assets and Liabilities by Remaining Contractual Maturities
Bank - As at 31 December 2018 On demand (Less than 15
days)
16 days to3 months
3 to 12 months
1 to 5 years
Over 5 years
Total
LKR'000 LKR'000 LKR'000 LKR'000 LKR'000 LKR'000
Financial AssetsCash and Cash Equivalents 6,437,790 - - - - 6,437,790 Balances with Central Bank of Sri Lanka 3,932,452 3,165,745 5,303,155 360,452 318 12,762,122 Reverse Repurchase Agreements 172,043 8,655 - - - 180,698
Financial Assets - Recognised through Profit or LossGovernment Debt Securities - Treasury Bills and Bonds 54,063 24,375 338,650 247,093 205,030 869,210
Financial Assets at Fair Value through Other Comprehensive IncomeGovernment Debt Securities - Treasury Bills and Bonds 4,054,050 8,866,156 40,708,973 8,002,209 799,419 62,430,807 Unqouted Equity Shares - - - - 13,974 13,974
Financial Assets at Amortised CostGovernment Debt Securities - Treasury Bills and Bonds 131,136 213,742 1,422,071 9,274,732 3,825,466 14,867,147 Other Financial Assets - 678,290 893,667 5,220,960 - 6,792,917
Financial Assets at Amortised Cost – Loans and Advances 91,032,164 29,855,189 40,358,081 89,334,561 14,902,784 265,482,778
Total Undiscounted Financial Assets 105,813,696 42,812,152 89,024,596 112,440,007 19,746,992 369,837,444
Financial LiabilitiesDue to Banks 14,456,181 4,048,419 - - - 18,504,600
Financial Liabilities at Amortised CostDue to Depositors 72,734,426 61,202,250 98,314,436 7,538,812 6,215 239,796,140 Repurchase Agreements 5,361,034 2,288,653 184,405 - - 7,834,092 Due to Other Borrowers 28,960 351,531 3,996,394 17,951,876 1,722,307 24,051,068
Debt Securities Issued - - 1,081,388 11,417,991 - 12,499,379
Total Undiscounted Financial Liabilities 92,580,601 67,890,854 103,576,624 36,908,679 1,728,522 302,685,280 Net Undiscounted Financial Assets/ (Liabilities) 13,233,095 (25,078,702) (14,552,027) 75,531,328 18,018,470 67,152,164
Gross Settled Derivatives not Held for TradingFinancial AssetsContractual Amounts Receivable 7,963,642 13,754,739 13,389,086 - - 35,107,468 Contractual Amounts Payable (7,963,642) (13,754,739) (13,389,086) - - (35,107,468)
- - - - - - Financial LiabilitiesContractual Amounts Receivable 2,819,499 4,283,439 2,836,819 - - 9,939,757 Contractual Amounts Payable (2,819,499) (4,283,439) (2,836,819) - - (9,939,757)
- - - - - - Total Gross Settled Derivative Assets/(Liabilities) not Held for Trading - - - - - - Total Net Financial Assets/ (Liabilities) 13,233,095 (25,078,702) (14,552,027) 75,531,328 18,018,470 67,152,164

188
Nations Trust Bank PLC Annual Report 2019
47. FINANCIAL RISK MANAGEMENT (CONTD.)
Analysis of Financial Assets and Liabilities by Remaining Contractual Maturities
Group - As at 31 December 2019 On demand (Less than 15
days)
16 days to3 months
3 to 12 months
1 to 5 years
Over 5 years
Total
LKR'000 LKR'000 LKR'000 LKR'000 LKR'000 LKR'000
Financial AssetsCash and Cash Equivalents 8,757,688 - - - - 8,757,688 Balances with Central Bank of Sri Lanka 2,760,170 2,021,970 3,401,529 193,671 138 8,377,478 Reverse Repurchase Agreements 13,832,999 - - - - 13,832,999
Financial Assets - Recognised through Profit or LossGovernment Debt Securities - Treasury Bills and Bonds - 19,913 53,753 817,564 - 891,229
Financial Assets at Fair Value through Other Comprehensive IncomeGovernment Debt Securities - Treasury Bills and Bonds 2,892,400 4,960,459 14,119,748 21,923,454 262,741 44,158,802 Unqouted Equity Shares - - - - 13,880 13,880
Financial Assets at Amortised CostGovernment Debt Securities - Treasury Bills and Bonds 94,036 329,842 1,070,819 12,594,938 5,460,521 19,550,157 Other Financial Assets - 116,165 1,895,720 4,122,332 - 6,134,217
Financial Assets at Amortised Cost – Loans and Advances 87,683,838 33,983,744 45,525,482 90,313,750 14,077,573 271,584,387
Total Undiscounted Financial Assets 116,021,131 41,432,091 66,067,050 129,965,710 19,814,854 373,300,836
Financial LiabilitiesDue to Banks 4,111,131 2,395,065 - - - 6,506,195
Financial Liabilities at Amortised CostDue to Depositors 73,459,964 57,015,180 97,099,192 6,213,085 3,200 233,790,620 Repurchase Agreements 6,330,371 3,738,896 156,320 - - 10,225,587 Due to Other Borrowers 552,773 591,514 5,504,355 24,126,031 2,995,314 33,769,986
Debt Securities Issued - - 1,660,199 15,346,691 2,264,400 19,271,290
Total Undiscounted Financial Liabilities 84,454,239 63,740,654 104,420,066 45,685,807 5,262,914 303,563,680 Net Undiscounted Financial Assets/ (Liabilities) 31,566,891 (22,308,563) (38,353,016) 84,279,903 14,551,941 69,737,156
Gross Settled Derivatives not Held for TradingFinancial AssetsContractual Amounts Receivable 2,636,549 10,019,475 2,506,340 93,650 - 15,256,014 Contractual Amounts Payable (2,636,549) (10,019,475) (2,506,340) (93,650) - (15,256,014)
- - - - - - Financial LiabilitiesContractual Amounts Receivable 1,770,054 7,626,072 13,892,082 187,550 - 23,475,758 Contractual Amounts Payable (1,770,054) (7,626,072) (13,892,082) (187,550) - (23,475,758)
- - - - - - Total Gross Settled Derivative Assets/(Liabilities) not Held for Trading - - - - - - Total Net Financial Assets/ (Liabilities) 31,566,891 (22,308,563) (38,353,016) 84,279,903 14,551,941 69,737,156
NOTES TO THE FINANCIAL STATEMENTS
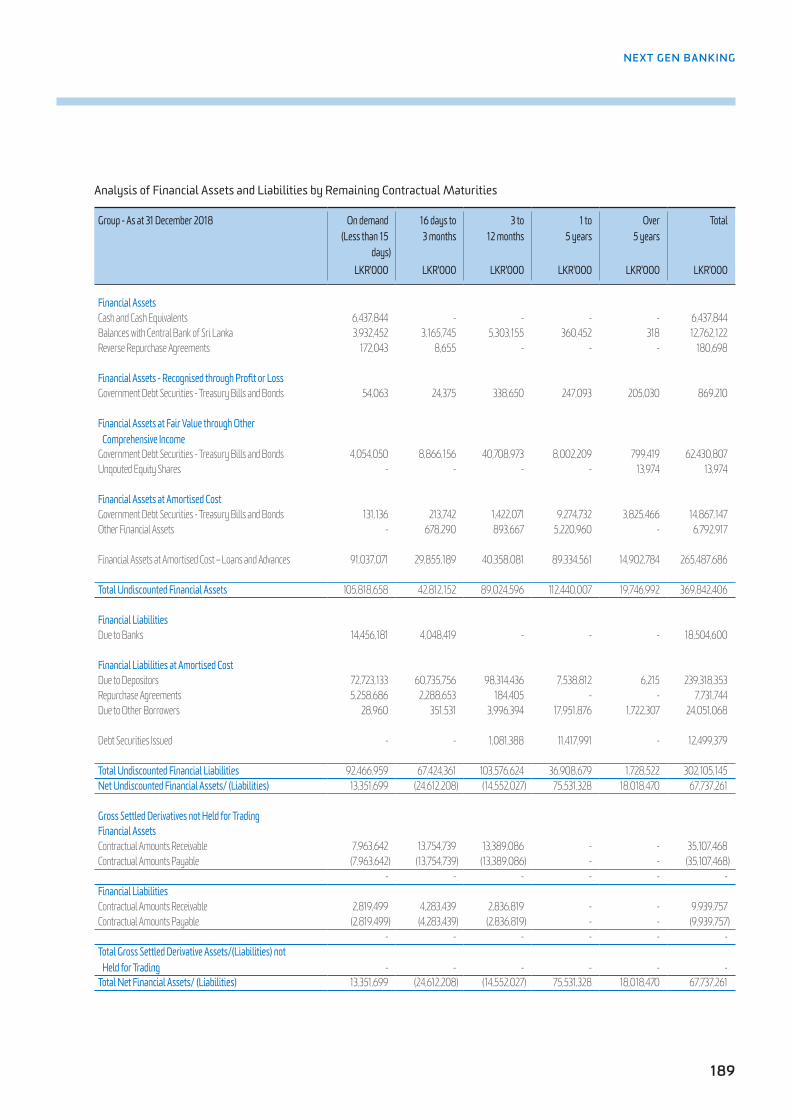
189
NEXT GEN BANKING
Analysis of Financial Assets and Liabilities by Remaining Contractual Maturities
Group - As at 31 December 2018 On demand (Less than 15
days)
16 days to3 months
3 to 12 months
1 to 5 years
Over 5 years
Total
LKR'000 LKR'000 LKR'000 LKR'000 LKR'000 LKR'000
Financial AssetsCash and Cash Equivalents 6,437,844 - - - - 6,437,844 Balances with Central Bank of Sri Lanka 3,932,452 3,165,745 5,303,155 360,452 318 12,762,122 Reverse Repurchase Agreements 172,043 8,655 - - - 180,698
Financial Assets - Recognised through Profit or LossGovernment Debt Securities - Treasury Bills and Bonds 54,063 24,375 338,650 247,093 205,030 869,210
Financial Assets at Fair Value through Other Comprehensive IncomeGovernment Debt Securities - Treasury Bills and Bonds 4,054,050 8,866,156 40,708,973 8,002,209 799,419 62,430,807 Unqouted Equity Shares - - - - 13,974 13,974
Financial Assets at Amortised CostGovernment Debt Securities - Treasury Bills and Bonds 131,136 213,742 1,422,071 9,274,732 3,825,466 14,867,147 Other Financial Assets - 678,290 893,667 5,220,960 - 6,792,917
Financial Assets at Amortised Cost – Loans and Advances 91,037,071 29,855,189 40,358,081 89,334,561 14,902,784 265,487,686
Total Undiscounted Financial Assets 105,818,658 42,812,152 89,024,596 112,440,007 19,746,992 369,842,406
Financial LiabilitiesDue to Banks 14,456,181 4,048,419 - - - 18,504,600
Financial Liabilities at Amortised CostDue to Depositors 72,723,133 60,735,756 98,314,436 7,538,812 6,215 239,318,353 Repurchase Agreements 5,258,686 2,288,653 184,405 - - 7,731,744 Due to Other Borrowers 28,960 351,531 3,996,394 17,951,876 1,722,307 24,051,068
Debt Securities Issued - - 1,081,388 11,417,991 - 12,499,379
Total Undiscounted Financial Liabilities 92,466,959 67,424,361 103,576,624 36,908,679 1,728,522 302,105,145 Net Undiscounted Financial Assets/ (Liabilities) 13,351,699 (24,612,208) (14,552,027) 75,531,328 18,018,470 67,737,261
Gross Settled Derivatives not Held for TradingFinancial AssetsContractual Amounts Receivable 7,963,642 13,754,739 13,389,086 - - 35,107,468 Contractual Amounts Payable (7,963,642) (13,754,739) (13,389,086) - - (35,107,468)
- - - - - - Financial LiabilitiesContractual Amounts Receivable 2,819,499 4,283,439 2,836,819 - - 9,939,757 Contractual Amounts Payable (2,819,499) (4,283,439) (2,836,819) - - (9,939,757)
- - - - - - Total Gross Settled Derivative Assets/(Liabilities) not Held for Trading - - - - - - Total Net Financial Assets/ (Liabilities) 13,351,699 (24,612,208) (14,552,027) 75,531,328 18,018,470 67,737,261

190
Nations Trust Bank PLC Annual Report 2019
47. FINANCIAL RISK MANAGEMENT (CONTD.) Whilst the management understands above contractual maturity gaps, more emphasis is given for the behavioral nature of these cash flows
when managing the overall liquidity profile. Management has arranged diversified funding sources in addition to its core deposit base, and adopted a policy of managing asset growth with liquidity in mind whilst monitoring future cash flows and liquidity.
In accordance with the Bank’s policy, the liquidity position is assessed and managed under a variety of scenarios, giving due consideration to stress factors relating to both the market in general and specifically to the Bank. This incorporates an assessment of expected cash flows and the availability of high grade collateral which could be used to secure additional funding if required
The table below shows the contractual expiry by maturity of the Bank’s contingent liabilities and commitments. Each undrawn loan commitment is included in the time band containing the earliest date it can be drawn down. For issued financial guarantee contracts, the maximum amount of the guarantee is allocated to the earliest period in which the guarantee could be called.
Bank On demand Less than 3 months
3 to 12 months
1 to 5 years Over 5 years
Total
31 December 2019 LKR'000 LKR'000 LKR'000 LKR'000 LKR'000 LKR'000
Bonds 966,881 3,985,783 8,632,264 3,820,134 - 17,405,062Acceptance 586,185 2,569,583 380,880 - - 3,536,649Guarantees 624,094 - - - - 624,094Letters of Credit 828,270 5,614,876 1,315,714 - - 7,758,860Foreign Exchange Contracts 4,406,603 17,645,547 16,398,422 281,200 - 38,731,772Forward Contracts to Buy/Sell Government Securities 308,728 - - - - 308,728Undrawn Commitments Credit Cards 40,800,230 - - - - 40,800,230 Other 90,189,736 - - - - 90,189,736Total Commitments and Guarantees 138,710,728 29,815,789 26,727,280 4,101,334 - 199,355,131
Note 1: Forward Exchange Contract amounts shown above are the total of gross purchase and sales contracts with the counter parties. However, the net exposure on these contracts are estimated at LKR 605Mn as at end of 2019 based on a 2.5% price premium movement on 6 month forward exchange rate as at end of year.
Note 2: Group Undrawn Commitments include, LKR 4Mn of undrawn commitments of Margin Trading.
Bank On demand Less than 3 months
3 to 12 months
1 to 5 years Over 5 years
Total
31 December 2018 LKR'000 LKR'000 LKR'000 LKR'000 LKR'000 LKR'000
Bonds 1,051,230 3,075,481 8,603,341 2,041,205 - 14,771,258Acceptance 959,459 2,492,680 423,865 - - 3,876,005Guarantees 908,258 - - - - 908,258Letters of Credit 529,636 4,617,130 773,447 - - 5,920,213Foreign Exchange Contracts 10,783,141 18,038,178 16,225,905 - - 45,047,225Forward Contracts to Buy/Sell Government Securities - - - - - - Undrawn Commitments Credit Cards 35,952,592 - - - - 35,952,592 Other 84,123,758 - - - - 84,123,758Total Commitments and Guarantees 134,308,074 28,223,470 26,026,559 2,041,205 - 190,599,308
Note 1: Forward Exchange Contract amounts shown above are the total of gross purchase and sales contracts with the counter parties. However, the net exposure on these contracts are estimated at LKR 706Mn as at end of 2018 based on a 2.5% price premium movement on 6 month forward exchange rate as at end of year.
Note 2: Group Undrawn Commitments include, LKR 3Mn of undrawn commitments of Margin Trading.
NOTES TO THE FINANCIAL STATEMENTS

191
NEXT GEN BANKING
47.4 Market Risk Market Risk denotes the risk of losses in the banking book as a result of unfavorable movements in market indices such as interest rates,
foreign exchange rates, credit spreads, equity prices and commodity prices. The values of these indices are set in public market and the risk cannot be eliminated through diversification.
The Bank manages the market risk on both trading and non-trading portfolios through a comprehensive market risk management framework. The objective of such framework is to reduce the exposure to the aforementioned unfavorable movements and mitigate the impact on the economic income and cash flows.
The Bank sets market risk limits for both trading and non-trading portfolios which carries the concurrence of the Board of Directors. These limits are reviewed periodically and all revisions and amendments are subject to Board approval. A daily report summarizes the Bank’s market risk exposure against approved limits and same being scrutinized by the relevant members in the management team which includes the Chief Executive Officer as well.
Types of Market Risk Both trading and non-trading activities of the Bank are exposed to unfavorable movements in the market indices which reflect in the profit and
losses. Bank identifies two types of market risks which directly influence the banking book.
• Interest Rate Risk • Currency Risk
Interest Rate Risk Interest Rate Risk (IRR) arises from the possibility that changes in interest rates will affect future cash flows or the fair values of financial
instruments. Any mismatches in the cash flows (fixed rate assets or liabilities) or re-pricing dates (floating rate assets or liabilities) expose the Bank’s Net Interest Income to variations. The Board has established limits on the interest rate gaps. The Bank’s policy is to monitor positions on a monthly basis and to ensure positions are maintained within the established limits.
IRR exposure is primarily managed with repricing gap analysis that distributes interest rate sensitive assets, liabilities and off-balance sheet positions at carrying amount into a number of pre-defined time-bands according to their residual term to maturity (fixed rate) or residual term for their next re-pricing (floating rate). The Classifications are based on the basis agreed at ALCO for monitoring of repricing gaps.
Bank - As at 31 December 2019 Total On demand (Less than
15 days)
16 days to 3 months
3 to 12 months
1 to 5 years
Over 5 years
Non-interest bearing
LKR'000 LKR'000 LKR'000 LKR'000 LKR'000 LKR'000 LKR'000
AssetsCash and balances with Central Bank of Sri Lanka 14,872,345 - - - - - 14,872,345 Loans and Advances 226,653,235 79,628,548 50,676,588 34,992,898 45,025,219 5,371,600 10,958,383 Investments 72,440,133 16,665,317 8,320,899 14,287,860 27,108,641 4,581,818 1,475,598 Other 49,986,633 6,985,808 17,536,651 16,022,130 272,130 - 9,169,914 Total Assets 363,952,346 103,279,673 76,534,138 65,302,888 72,405,990 9,953,418 36,476,240
LiabilitiesDeposits 221,564,372 55,003,604 53,682,467 90,211,411 4,476,821 3,200 18,186,869 Borrowings 55,326,639 9,807,119 17,403,019 9,971,579 14,294,763 3,850,160 - Other 87,061,335 5,360,183 17,620,376 16,320,408 281,200 - 47,479,167 Total Shareholder Funds and Liabilities 363,952,346 70,170,906 88,705,863 116,503,398 19,052,784 3,853,360 65,666,037
Total Interest Sensitivity Gap 33,108,767 (12,171,724) (51,200,510) 53,353,206 6,100,058 (29,189,797)

192
Nations Trust Bank PLC Annual Report 2019
47. FINANCIAL RISK MANAGEMENT (CONTD.)
Interest Rate Risk
Bank - As at 31 December 2018 Total On demand (Less than
15 days)
16 days to 3 months
3 to 12 months
1 to 5 years
Over 5 years
Non-interest bearing
LKR'000 LKR'000 LKR'000 LKR'000 LKR'000 LKR'000 LKR'000
AssetsCash and balances with Central Bank of Sri Lanka 19,071,884 - - - - - 19,071,884 Loans and Advances 220,370,911 88,280,424 36,654,207 37,936,864 45,971,593 3,741,868 7,785,955 Investments 74,895,298 4,021,551 11,894,997 39,966,495 14,114,794 3,581,818 1,315,644 Other 59,843,299 11,226,043 18,661,935 17,049,096 - - 12,906,225 Total Assets 374,181,392 103,528,018 67,211,139 94,952,455 60,086,387 7,323,686 41,079,708
LiabilitiesDeposits 226,537,358 54,909,102 58,021,120 90,621,342 5,524,127 4,880 17,456,787 Borrowings 54,712,237 19,644,099 16,878,876 8,319,029 8,589,900 1,280,333 - Other 92,931,797 10,968,370 18,109,214 16,382,388 - - 47,471,826 Total Shareholder Funds and Liabilities 374,181,392 85,521,571 93,009,210 115,322,758 14,114,027 1,285,213 64,928,613
Total Interest Sensitivity Gap 18,006,446 (25,798,071) (20,370,303) 45,972,360 6,038,473 (23,848,905)
Group - As at 31 December 2019 Total On demand (Less than
15 days)
16 days to 3 months
3 to 12 months
1 to 5 years
Over 5 years
Non-interest bearing
LKR'000 LKR'000 LKR'000 LKR'000 LKR'000 LKR'000 LKR'000
AssetsCash and balances with Central Bank of Sri Lanka 14,872,929 - - - - - 14,872,929 Loans and Advances 226,655,725 79,631,037 50,676,588 34,992,898 45,025,219 5,371,600 10,958,383 Investments 72,440,133 16,665,317 8,320,899 14,287,860 27,108,641 4,581,818 1,475,598 Other 50,020,780 6,985,808 17,536,651 16,022,130 272,130 - 9,204,062 Total Assets 363,989,567 103,282,162 76,534,138 65,302,888 72,405,990 9,953,418 36,510,971
LiabilitiesDeposits 221,564,372 55,003,604 53,682,467 90,211,411 4,476,821 3,200 18,186,869 Borrowings 54,891,230 9,694,553 17,080,176 9,971,579 14,294,763 3,850,160 - Other 87,533,964 5,360,183 17,620,376 16,320,408 281,200 - 47,951,797 Total Shareholder Funds and Liabilities 363,989,567 70,058,340 88,383,020 116,503,398 19,052,784 3,853,360 66,138,666
Total Interest Sensitivity Gap 33,223,822 (11,848,882) (51,200,510) 53,353,206 6,100,058 (29,627,695)
NOTES TO THE FINANCIAL STATEMENTS
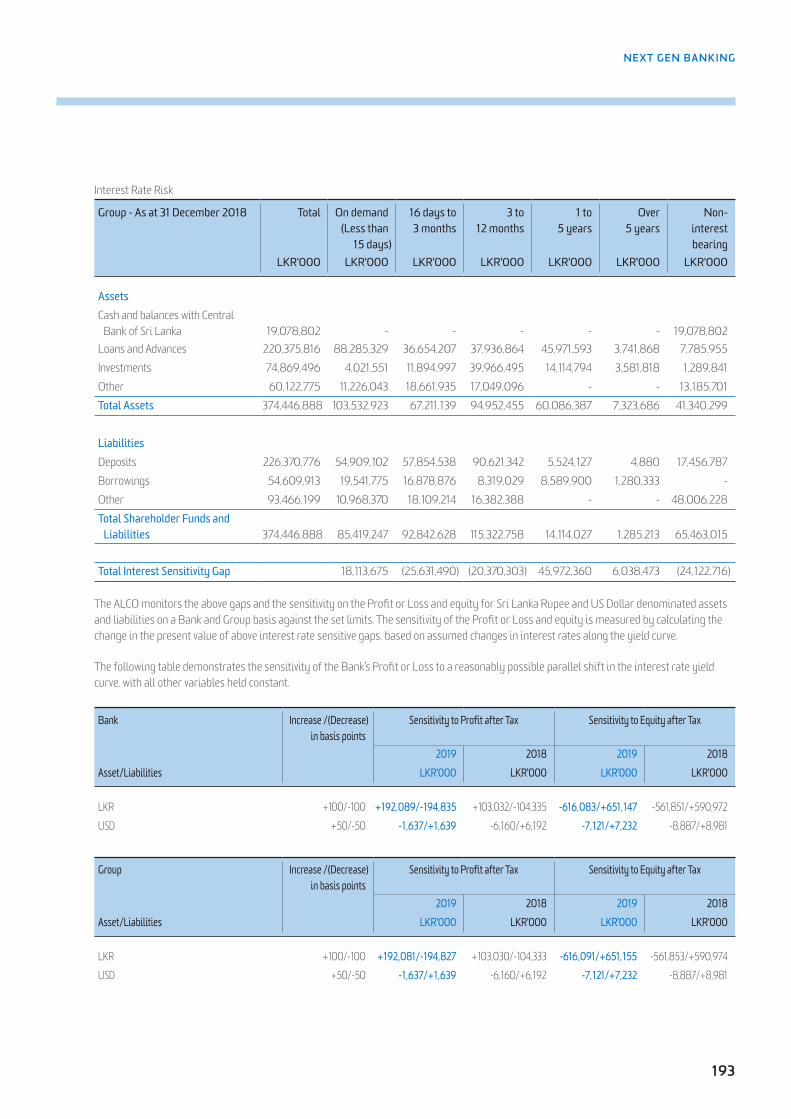
193
NEXT GEN BANKING
Interest Rate Risk
Group - As at 31 December 2018 Total On demand (Less than
15 days)
16 days to 3 months
3 to 12 months
1 to 5 years
Over 5 years
Non-interest bearing
LKR'000 LKR'000 LKR'000 LKR'000 LKR'000 LKR'000 LKR'000
AssetsCash and balances with Central Bank of Sri Lanka 19,078,802 - - - - - 19,078,802 Loans and Advances 220,375,816 88,285,329 36,654,207 37,936,864 45,971,593 3,741,868 7,785,955 Investments 74,869,496 4,021,551 11,894,997 39,966,495 14,114,794 3,581,818 1,289,841 Other 60,122,775 11,226,043 18,661,935 17,049,096 - - 13,185,701 Total Assets 374,446,888 103,532,923 67,211,139 94,952,455 60,086,387 7,323,686 41,340,299
LiabilitiesDeposits 226,370,776 54,909,102 57,854,538 90,621,342 5,524,127 4,880 17,456,787 Borrowings 54,609,913 19,541,775 16,878,876 8,319,029 8,589,900 1,280,333 - Other 93,466,199 10,968,370 18,109,214 16,382,388 - - 48,006,228 Total Shareholder Funds and Liabilities 374,446,888 85,419,247 92,842,628 115,322,758 14,114,027 1,285,213 65,463,015
Total Interest Sensitivity Gap 18,113,675 (25,631,490) (20,370,303) 45,972,360 6,038,473 (24,122,716)
The ALCO monitors the above gaps and the sensitivity on the Profit or Loss and equity for Sri Lanka Rupee and US Dollar denominated assets and liabilities on a Bank and Group basis against the set limits. The sensitivity of the Profit or Loss and equity is measured by calculating the change in the present value of above interest rate sensitive gaps, based on assumed changes in interest rates along the yield curve.
The following table demonstrates the sensitivity of the Bank’s Profit or Loss to a reasonably possible parallel shift in the interest rate yield curve, with all other variables held constant.
Bank Increase /(Decrease) in basis points
Sensitivity to Profit after Tax Sensitivity to Equity after Tax
2019 2018 2019 2018Asset/Liabilities LKR'000 LKR'000 LKR'000 LKR'000
LKR +100/-100 +192,089/-194,835 +103,032/-104,335 -616,083/+651,147 -561,851/+590,972 USD +50/-50 -1,637/+1,639 -6,160/+6,192 -7,121/+7,232 -8,887/+8,981
Group Increase /(Decrease) in basis points
Sensitivity to Profit after Tax Sensitivity to Equity after Tax
2019 2018 2019 2018Asset/Liabilities LKR'000 LKR'000 LKR'000 LKR'000
LKR +100/-100 +192,081/-194,827 +103,030/-104,333 -616,091/+651,155 -561,853/+590,974 USD +50/-50 -1,637/+1,639 -6,160/+6,192 -7,121/+7,232 -8,887/+8,981

194
Nations Trust Bank PLC Annual Report 2019
47. FINANCIAL RISK MANAGEMENT (CONTD.) Exposure to market risk in the trading book is separately monitored and measured by setting limits on products, maturity profile of the
portfolio, cut-loss limits and by setting sub-limits within above interest rate sensitive gap analysis.
Currency Risk Currency risk is the potential risk of loss due to unfavorable movements in foreign exchange rates when the Bank has foreign currency
denominated assets, liabilities or trading positions. Exposure to each currency is arrived at by calculating the Net Asset or Liability position including the spot and forward contracts of the relevant currency.
The Board has set following limits to mitigate against currency risk exposures;
• Exposure on currencies on individual and an aggregate basis
• Exposure for each currency by maturity for forward currency contracts
• Dealer and counter-party Limits
• Overnight and Intra-Day Limits
• Stop-loss limits
Treasury Middle Office (TMO) monitors the above positions on a daily basis to ensure positions are maintained within established limits.
The table below indicates the currencies to which the Bank had material exposures at 31 December 2019. The analysis calculates the effect of a reasonably possible movement of the currency rate against the Sri Lankan Rupee, with all other variables held constant, on the Profit or Loss. A negative amount in the table reflects a potential net reduction in Profit or Loss, while a positive amount reflects a net potential increase. An equivalent decrease in each of the below currencies against the Sri Lankan Rupee would have resulted in an equivalent but opposite impact.
The sensitivity related to trading position in the Domestic Banking Unit is given below.
Currency Change in Currency Rate
in %
Change in Currency Rate
in %
Effect on Profit
after tax
Effect on Profit
after tax2019 2018 2019 2018
LKR'000 LKR'000
USD +5 +5 (5,414.4) 1,332.3 GBP +5 +5 281.9 (422.7)EUR +5 +5 109.1 113.9 AUD +5 +5 (1,460.6) (157.0)JPY +5 +5 2.0 142.3 Other +5 +5 1,044.4 632.7
In addition to above trading exposures, the Bank carries a structural position arising from the negative US Dollar reserves accumulated in Foreign Currency Banking Unit books. The sensitivity to Profit or Loss from this exposure is as follows;
Currency Change in Currency Rate
in %
Change in Currency Rate
in %
Effect on Profit
after tax
Effect on Profit
after tax2019 2018 2019 2018
LKR'000 LKR'000
USD +5 +5 4,535.4 (678.2)
NOTES TO THE FINANCIAL STATEMENTS
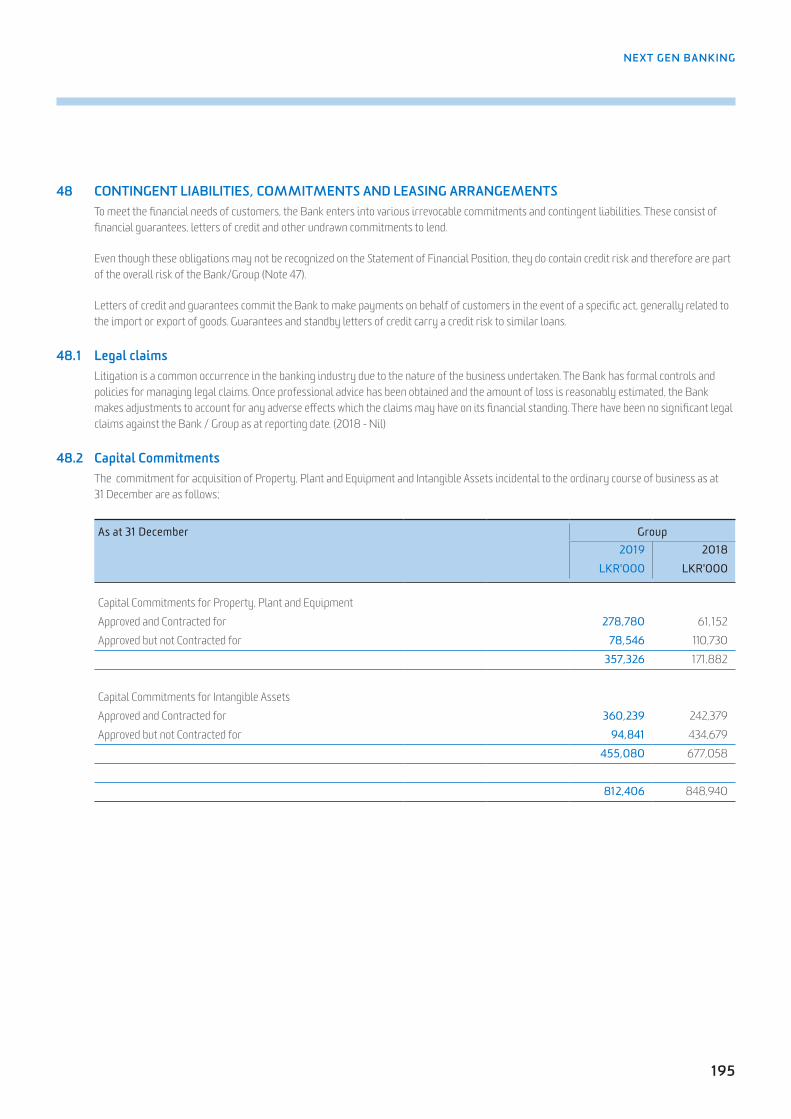
195
NEXT GEN BANKING
48 CONTINGENT LIABILITIES, COMMITMENTS AND LEASING ARRANGEMENTS To meet the financial needs of customers, the Bank enters into various irrevocable commitments and contingent liabilities. These consist of
financial guarantees, letters of credit and other undrawn commitments to lend.
Even though these obligations may not be recognized on the Statement of Financial Position, they do contain credit risk and therefore are part of the overall risk of the Bank/Group (Note 47).
Letters of credit and guarantees commit the Bank to make payments on behalf of customers in the event of a specific act, generally related to the import or export of goods. Guarantees and standby letters of credit carry a credit risk to similar loans.
48.1 Legal claims Litigation is a common occurrence in the banking industry due to the nature of the business undertaken. The Bank has formal controls and
policies for managing legal claims. Once professional advice has been obtained and the amount of loss is reasonably estimated, the Bank makes adjustments to account for any adverse effects which the claims may have on its financial standing. There have been no significant legal claims against the Bank / Group as at reporting date. (2018 - Nil)
48.2 Capital Commitments The commitment for acquisition of Property, Plant and Equipment and Intangible Assets incidental to the ordinary course of business as at
31 December are as follows;
As at 31 December Group2019 2018
LKR'000 LKR'000
Capital Commitments for Property, Plant and Equipment Approved and Contracted for 278,780 61,152Approved but not Contracted for 78,546 110,730
357,326 171,882
Capital Commitments for Intangible AssetsApproved and Contracted for 360,239 242,379Approved but not Contracted for 94,841 434,679
455,080 677,058
812,406 848,940

196
Nations Trust Bank PLC Annual Report 2019
48 CONTINGENT LIABILITIES, COMMITMENTS AND LEASING ARRANGEMENTS (CONTD.)48.3 Lease Arrangements48.3.1 Policy applicable before 01 January 2019 The determination of whether an arrangement is a lease, or contains a lease, is based on the substance of the arrangement and requires an
assessment of whether the fulfilment of the arrangement is dependent on the use of a specific asset or assets or whether the arrangement conveys a right to use the asset.
Group as a lessor Leases where the Group does not transfer substantially all of the risk and benefits of ownership of the asset are classified as operating leases.
Rental income is recorded as earned based on the contractual terms of the lease in other operating income. Initial direct costs incurred in negotiating operating leases are added to the carrying amount of the leased asset and recognised over the lease term on the same basis as rental income. Contingent rents are recognised as revenue in the period in which they are earned.
Group as a lessee Leases that do not transfer to the Group substantially all of the risks and benefits incidental to ownership of the leased items are operating
leases. Operating lease payments are recognised as an expense in the income statement on a straight-line basis over the lease term. Contingent rental payable is recognised as an expense in the period in which they are incurred.
48.3.2 Policy applicable after 01 January 2019 The Group assesses at contract inception whether a contract is, or contains, a lease. That is, if the contract conveys the right to control the use
of an identified asset for a period of time in exchange for consideration.
Group as a lessee The Group applies a single recognition and measurement approach for all leases, except for short-term leases (leases with a lease term of
12 months or less) and leases of low-value assets. The Group recognises lease liabilities to make lease payments and right-of-use assets representing the right to use the underlying assets
Right-of-use assets The Group recognises right-of-use assets at the commencement date of the lease (i.e., the date that underlying asset is available for use).
Right-of-use assets are measured at cost, less any accumulated depreciation and impairment losses, and adjusted for any remeasurement of lease liabilities. The cost of right-of-use assets includes the amount of lease liabilities recognised, initial direct costs incurred, and lease payments made at or before the commencement date less any lease incentives received. Right-of-use assets are depreciated on a straight-line basis over the lease term. The right-of-use assets are presented in Note 17 and are subject to impairment in line with the Group’s policy as described in Note 3.4 Impairment of non-financial assets.
Lease liabilities At the commencement date of the lease, the Group recognises lease liabilities measured at the present value of lease payments to be made
over the lease term. The lease payments include fixed payments (less any lease incentives receivable), variable lease payments that depend on an index or a rate, and amounts expected to be paid under residual value guarantees. The lease payments also include the exercise price of a purchase option reasonably certain to be exercised by the Group and payments of penalties for terminating the lease, if the lease term reflects exercising the option to terminate. Variable lease payments that do not depend on an index or a rate are recognised as expenses in the period in which the event or condition that triggers the payment occurs.
NOTES TO THE FINANCIAL STATEMENTS
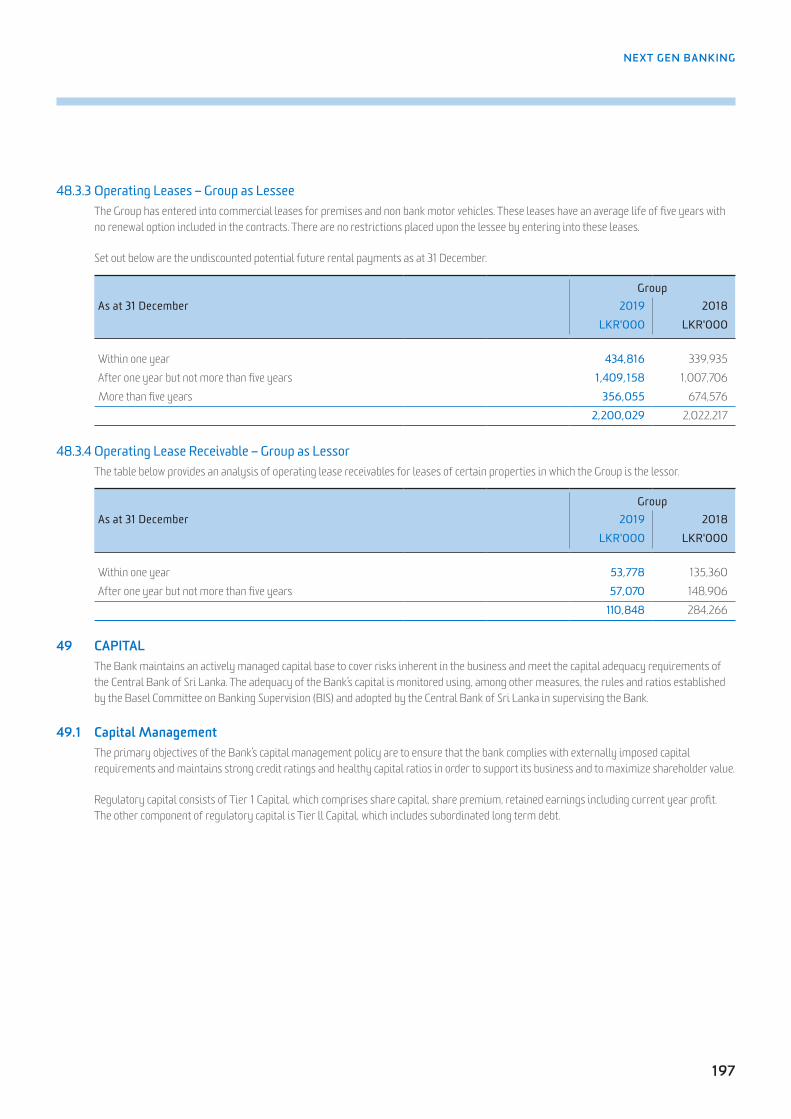
197
NEXT GEN BANKING
48.3.3 Operating Leases – Group as Lessee The Group has entered into commercial leases for premises and non bank motor vehicles. These leases have an average life of five years with
no renewal option included in the contracts. There are no restrictions placed upon the lessee by entering into these leases.
Set out below are the undiscounted potential future rental payments as at 31 December.
GroupAs at 31 December 2019 2018
LKR'000 LKR'000
Within one year 434,816 339,935After one year but not more than five years 1,409,158 1,007,706More than five years 356,055 674,576
2,200,029 2,022,217
48.3.4 Operating Lease Receivable – Group as Lessor The table below provides an analysis of operating lease receivables for leases of certain properties in which the Group is the lessor.
GroupAs at 31 December 2019 2018
LKR'000 LKR'000
Within one year 53,778 135,360After one year but not more than five years 57,070 148,906
110,848 284,266
49 CAPITAL The Bank maintains an actively managed capital base to cover risks inherent in the business and meet the capital adequacy requirements of
the Central Bank of Sri Lanka. The adequacy of the Bank’s capital is monitored using, among other measures, the rules and ratios established by the Basel Committee on Banking Supervision (BIS) and adopted by the Central Bank of Sri Lanka in supervising the Bank.
49.1 Capital Management The primary objectives of the Bank’s capital management policy are to ensure that the bank complies with externally imposed capital
requirements and maintains strong credit ratings and healthy capital ratios in order to support its business and to maximize shareholder value.
Regulatory capital consists of Tier 1 Capital, which comprises share capital, share premium, retained earnings including current year profit. The other component of regulatory capital is Tier ll Capital, which includes subordinated long term debt.

198
Nations Trust Bank PLC Annual Report 2019
49 CAPITAL (CONTD.)
49.2 Net Assets Value per Ordinary Share Net Assets Value per Ordinary Share is calculated by dividing the equity attributable to Equity Holders of the Parent / Group by the number of
Ordinary Shares in issue as at the reporting date.
As at 31 December Bank Group2019 2018 2019 2018
Amount Used as the Numerator:Net Assets Attributable to Equity Holders of the Parent (LKR'000) 30,343,317 26,462,102 31,395,646 27,058,710
Number of Ordinary Shares Used as the Denominator:Number of Ordinary Shares in Issue at the End of the Year (Note 26) 283,851,872 277,747,136 283,851,872 277,747,136
Net Assets Value per Ordinary Share (LKR) 106.90 95.27 110.61 97.42
50 EVENTS AFTER THE REPORTING DATE No material events have taken place since 31 December 2019 that require disclosure or/and adjustments in these financial statements, except
for the following;
a) Dividends Declared (Note 42.2) The Board of Directors declared a payment of a first and final cash dividend of LKR 2.30 per share for both Ordinary Voting and Ordinary
Non - Voting Shareholders for the year ended 31 December 2019.
b) Income Tax Changes As per the announcement dated 12 February 2020, the income tax rate applicable for the banking sector will be reduced to 24% from the year
of assessment 2020/21. Since the above amendment is yet to be enacted, existing rate of 28% was applied in ascertaining the deferred tax liability as at 31 December 2019. Had we considered the proposed rate;
for Bank :- the deferred tax liability as at 31 December 2019 would have decreased by LKR 142 Mn resulting in an increase of LKR 84 Mn in profit after tax and LKR 58 Mn increase in OCI.
for Group :- the deferred tax liability as at 31 December 2019 would have decreased by LKR 166 Mn resulting in an increase of LKR 83 Mn in profit after tax and LKR 82 Mn increase in OCI.
c) Debt Repayment Levy (DRL) Debt Repayment Levy (DRL) was repealed with effect from 01 January 2020 by the Bill to amend Finance Act No. 35 of 2018,
issued on 07 February 2020.

199
NEXT GEN BANKING
6CASH MANAGEMENTYour world, now digital...
SUPPLEMENTARY INFORMATION
GRI Context Index 200Material Topics 204Investor Information 205Risk Management Annexure 210Corporate Governance Annexure 229Ten Year Key Performance Trends 250Service Network 252Glossary 255Notice of Meeting 258Form of Proxy (Voting Shareholders) 259Form of Proxy (Non-Voting Shareholders) 261Corporate Information IBC
Nations Trust has reshaped the way people live and work through a range of innovative products and services for the past decade. We have created a banking experience that has survived in a fast changing world.
SNAPSHOT OF OUR 10 YEAR PERFORMANCE
Overall increase in Branches over a 10 year period
Overall increase in Employees over a 10 year period
Overall increase in ATMs over a 10 year period
48
1,326
116

200
Nations Trust Bank PLC Annual Report 2019
GRI CONTEXT INDEXGRI Standard Disclosure Page Number
GRI 101: Foundation 2016 (does not include any disclosures)General DisclosuresGRI 102: General Disclosures 2016
102-1 Name of Organisation 3
102-2 Activities, brands, products and services 22, 29-33102-3 Location of headquarters IBC102-4 Location of operations 253102-5 Ownership and legal form 207, IBC102-6 Markets served 22, 252-254102-7 Scale of the organisation 4-5102-8 Information on employees and other workers 44102-9 Supply chain 47102-10 Significant changes to the organisation and supply chain 28102-11 Precautionary principle 47102-12 External initiatives 55102-13 Membership of associations 47102-14 Statement from senior decision maker 8-9102-16 Values, principles, norms and standards of behaviour 2, 56102-18 Governance Structure 54102-40 List of stakeholder groups 27102-41 Collective bargaining agreements 42102-42 Identifying and selecting stakeholders 27102-43 Approach to stakeholder engagement 27102-44 Key topics and concerns raised 27102-45 Entities included in the consolidated financial statements 3102-46 Defining report content and topic boundary 28, 204102-47 Material topics 204102-48 Restatement of information 28102-49 Changes in reporting 28102-50 Reporting period 3102-51 Date of most recent report 3102-52 Reporting cycle 3102-53 Contact point for questions regarding Report 3102-54 Claims of reporting in accordance with GRI Standards 3102-55 GRI context index 200-203102-56 External assurance 3, 53
GRI Specific DisclosuresEconomic PerformanceGRI 103: Management Approach
103-1 Explanation of material topics and its boundaries 204
103-2 The Management Approach and its components 25, 50103-3 Evaluation of the Management Approach 50
GRI 201: Economic Performance 2016
201-2- Financial implications and other risks and opportunities due climate change 50
IBC - Inner Back Cover

201
NEXT GEN BANKING
GRI Standard Disclosure Page Number
Indirect Economic ImpactsGRI 103: Management Approach
103-1 Explanation of material topics and its boundaries 204
103-2 The Management Approach and its components 25, 48103-3 Evaluation of the Management Approach 48, 49
GRI 203: Indirect Economic Impacts
203-1 Infrastructure investments and services supported 49
MaterialsGRI 103: Management Approach
103-1 Explanation of material topics and its boundaries 204
103-2 The Management Approach and its components 25, 50103-3 Evaluation of the Management Approach 51
GRI 301: Materials 2016 301-1 Materials used by weight or volume 51EnergyGRI 103: Management Approach
103-1 Explanation of material topics and its boundaries 204
103-2 The Management Approach and its components 25, 50103-3 Evaluation of the Management Approach 51
GRI 302: Energy 2016 302-1 Energy consumption within the organization 51302-3 Energy intensity 51
BiodiversityGRI 103: Management Approach
103-1 Explanation of material topics and its boundaries 204
103-2 The Management Approach and its components 25, 50103-3 Evaluation of the Management Approach 51-52
GRI 304: Biodiversity 2016 304-2 Significant impacts of activities, products and services on biodiversity 51-52EmissionsGRI 103: Management Approach
103-1 Explanation of material topics and its boundaries 204
103-2 The Management Approach and its components 25, 50103-3 Evaluation of the Management Approach 51
GRI 305 Emissions: 2016 305-1 Direct greenhouse gas (GHG) emissions (Scope 1) 51-52305-2 Energy indirect greenhouse gas (GHG) emissions (Scope 2) 51-52305-3 Other indirect greenhouse gas (GHG) emissions (Scope 3) 51-52305-4 GHG emission intensity 51-52
Effluents and wasteGRI 103: Management Approach
103-1 Explanation of material topics and its boundaries 204
103-2 The Management Approach and its components 25, 50103-3 Evaluation of the Management Approach 51
GRI 306 Effluents and Waste 2016
306-2 Waste by type and disposal method 51
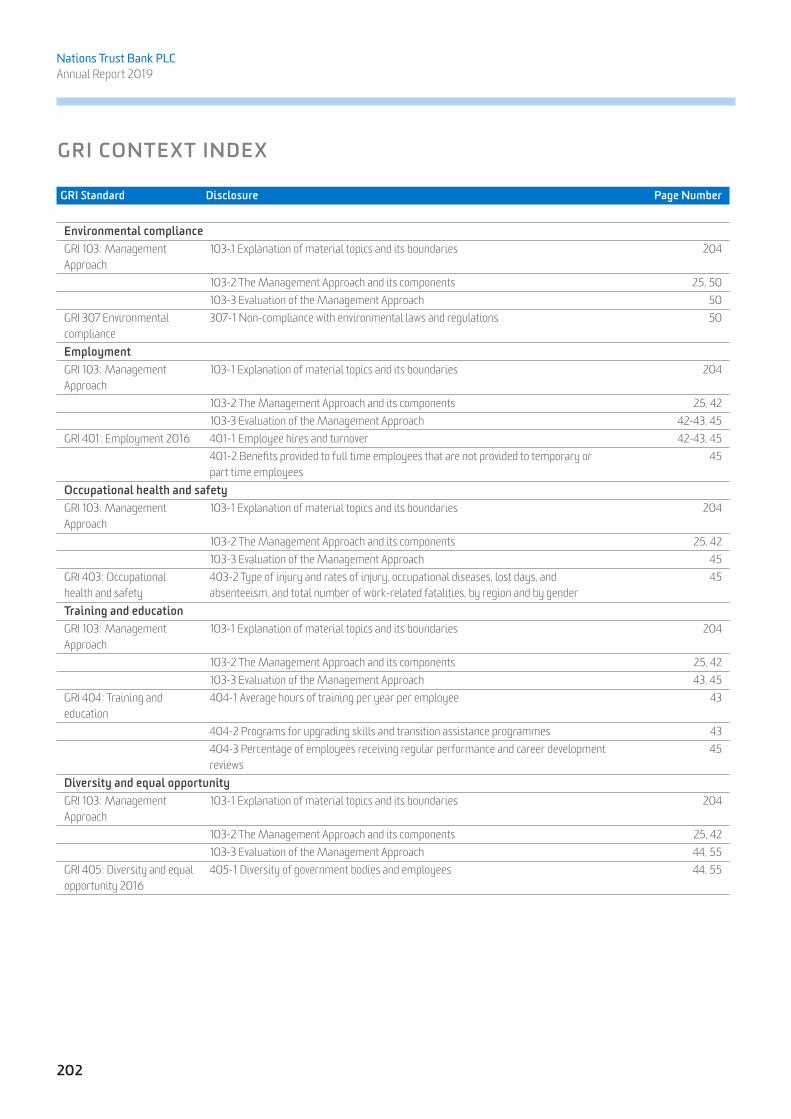
202
Nations Trust Bank PLC Annual Report 2019
GRI CONTEXT INDEX
GRI Standard Disclosure Page Number
Environmental complianceGRI 103: Management Approach
103-1 Explanation of material topics and its boundaries 204
103-2 The Management Approach and its components 25, 50103-3 Evaluation of the Management Approach 50
GRI 307 Environmental compliance
307-1 Non-compliance with environmental laws and regulations 50
EmploymentGRI 103: Management Approach
103-1 Explanation of material topics and its boundaries 204
103-2 The Management Approach and its components 25, 42103-3 Evaluation of the Management Approach 42-43, 45
GRI 401: Employment 2016 401-1 Employee hires and turnover 42-43, 45401-2 Benefits provided to full time employees that are not provided to temporary or part time employees
45
Occupational health and safetyGRI 103: Management Approach
103-1 Explanation of material topics and its boundaries 204
103-2 The Management Approach and its components 25, 42103-3 Evaluation of the Management Approach 45
GRI 403: Occupational health and safety
403-2 Type of injury and rates of injury, occupational diseases, lost days, and absenteeism, and total number of work-related fatalities, by region and by gender
45
Training and educationGRI 103: Management Approach
103-1 Explanation of material topics and its boundaries 204
103-2 The Management Approach and its components 25, 42103-3 Evaluation of the Management Approach 43, 45
GRI 404: Training and education
404-1 Average hours of training per year per employee 43
404-2 Programs for upgrading skills and transition assistance programmes 43404-3 Percentage of employees receiving regular performance and career development reviews
45
Diversity and equal opportunityGRI 103: Management Approach
103-1 Explanation of material topics and its boundaries 204
103-2 The Management Approach and its components 25, 42103-3 Evaluation of the Management Approach 44, 55
GRI 405: Diversity and equal opportunity 2016
405-1 Diversity of government bodies and employees 44, 55

203
NEXT GEN BANKING
GRI Standard Disclosure Page Number
Local communitiesGRI 103: Management Approach
103-1 Explanation of material topics and its boundaries 204
103-2 The Management Approach and its components 25, 48103-3 Evaluation of the Management Approach 48-49
GRI 413: Local Communities 413-1 Operations with local community engagement, impact assessments and development programs
48-49
Marketing and labellingGRI 103: Management Approach
103-1 Explanation of material topics and its boundaries 204
103-2 The Management Approach and its components 25, 46103-3 Evaluation of the Management Approach 47
GRI 417: Marketing and labelling
417-1 Requirements for product and service labelling 47
417-2 Incidents of non-compliance concerning product and service information and labelling
47
417-3 Incidents of non-compliance concerning marketing communications 47Customer privacyGRI 103: Management Approach
103-1 Explanation of material topics and its boundaries 204
103-2 The Management Approach and its components 25, 46103-3 Evaluation of the Management Approach 47
GRI 418: Customer Privacy 2016
418-1 Substantial complaints regarding breaches of customer privacy and losses of customer data
47
Socio-economic compliance GRI 103: Management Approach
103-1 Explanation of material topics and its boundaries 204
103-2 The Management Approach and its components 25, 46103-3 Evaluation of the Management Approach 47
GRI 419 Socio-economic compliance
419-1 Non-compliance with laws and regulations in the social and economic area 47

204
Nations Trust Bank PLC Annual Report 2019
MATERIAL TOPICS ANNEXURE
Material topic and why it is material to us Topic boundary and change in boundary Corresponding GRI topics
Materiality in comparison to 2018
Growth and profitabilityAchieving sustainable growth in earnings is vital in driving shareholder value and ensuring the sufficiency of financial resources in fulfilling strategic aspirations.
The Group’s financial performance will directly impact its primary stakeholders such as shareholders, employees and customers.
201: Economic Performance
Customer experienceElevating customer experience through convenience, accessibility and technology to a be a key source of competitive advantage is a strategic priority for the Bank.
While the impacts of the material topic arise primarily from customers it will have a long-term impact on the Bank’s commercial sustainability.
No change
DigitisationDigitisation has transformed the way Banks interact with their customers as well as how business is conducted, and risks are managed on a day to day basis.
The impacts of digitisation are both internal and external as it directly affects our internal efficiencies, cost management and customer experience.
No change
Responsible lendingIn order to remain commercially viable and socially relevant we ensure customer rights are protected and that lending is directed towards sustainable businesses.
Our lending practices have a direct impact on our customers, but over the long term will have an impact on our brand, market share and performance.
417: Marketing and labelling418: Customer privacy
No change
Employee attractionRecruiting and retaining the employees with the right skills, attitudes and work ethic is vital in achieving our strategic objectives.
Human capital management relates primarily to our direct employees across the island
401: Employment405: Diversity and equal opportunity403: Occupational health and safety
No change
Training and developmentWith the Bank’s digital transformation, it is imperative that we continue to upskill our employees and equip them with the rights tools to drive our strategic ambitions.
Relates to the Bank’s direct employees. 404: Training and education
No change
Employee satisfactionA satisfied pool of employees ensure retention, productivity, good customer engagement and performance.
Satisfaction relates primarily to the Bank’s employees but will have long-term implications on the Bank’s competitive edge.
No change
Operational efficiencyAchieving process efficiencies and increased productivity has a direct impact on the Bank’s profitability while freeing up employee time for customer interaction.
Directly impacts the Group’s financial performance.
Preserving the environmentAs a responsible corporate citizen, we strive to minimise the adverse environmental impacts of our operations
The Group’s internal environmental impacts consist of paper, energy and water consumption and the carbon footprint it generates. The Bank’s most significant external environmental impact arises from its lending portfolio.
301: Materials302: Energy304: Bio diversity305: Emissions306: Effluents and waste
No change
Corporate social responsibilityCreating value to the communities we operate in through strategic, ongoing CSR projects can help us sustain our social license to operate.
The impacts of this topic arise in the communities we operate in across the island.
413: Local communities203: Indirect economic impact
GRI 203 : Indirect Economic Impact is added
Corporate Governance and complianceSustainable value creation is underpinned by robust governance frameworks and practices.
Non-compliance to regulations and laws as well as weak corporate governance practices could result in potential legal liability and significant affect the Bank’s reputation and continuity of operations.
307: Environmental compliance419: Socio-economic compliance
No change

205
NEXT GEN BANKING
INVESTOR INFORMATION
STOCK EXCHANGE LISTINGThe ordinary shares of the Bank are all listed in the Colombo Stock Exchange. The audited Statement of Profit or Loss for the year ended 31 December 2019, and the Statement of Financial Position as at that date will be submitted to the Colombo Stock Exchange within two months of the reporting date.
DISTRIBUTION OF ORDINARY SHAREHOLDERS - VOTINGAs at December 31, 2019 Resident Non - Resident TotalShareholdings No. of
Shareholders No. of Shares
% No. of Shareholders
No. of Shares
% No. of Shareholders
No. of Shares
%
1 - 1000 3,411 992,578 0.41 27 9,806 0.00 3,438 1,002,384 0.411001 - 10,000 1,898 5,069,983 2.07 34 103,232 0.04 1,932 5,173,215 2.1110,001 - 100,000 302 7,706,796 3.15 6 206,980 0.09 308 7,913,776 3.24100,001 - 1,000,000 40 8,653,679 3.53 6 3,800,514 1.55 46 12,454,193 5.08Over 1,000,000 14 157,656,202 64.38 4 60,679,071 24.78 18 218,335,273 89.16
5,665 180,079,238 73.54 77 64,799,603 26.46 5,742 244,878,841 100.00
DISTRIBUTION OF ORDINARY SHAREHOLDERS - NON VOTINGAs at December 31, 2019 Resident Non - Resident TotalShareholdings No. of
Shareholders No. of Shares
% No. of Shareholders
No. of Shares
% No. of Shareholders
No. of Shares
%
1 - 1000 208 46,685 0.12 - - - 208 46,685 0.121001 - 10,000 36 102,467 0.26 - - - 36 102,467 0.2610,001 - 100,000 7 112,356 0.29 - - - 7 112,356 0.29100,001 - 1,000,000 2 350,138 0.90 - - - 2 350,138 0.90Over 1,000,000 5 32,514,473 83.43 1 5,846,912 15.00 6 38,361,385 98.43
258 33,126,119 85.00 1 5,846,912 15.00 259 38,973,031 100.00
ANALYSIS OF SHAREHOLDERS - VOTING31 December 2019 31 December 2018
No. of Shareholders
No. of Shares
% No. of Shareholders
No. of Shares
%
Individual 5,454 24,264,905 9.91 5,432 24,376,755 10.21Institutional 288 220,613,936 90.09 292 214,287,918 89.79
5,742 244,878,841 100.00 5,724 238,664,673 100.00
ANALYSIS OF SHAREHOLDERS - NON VOTING31 December 2019 31 December 2018
No. of Shareholders
No. of Shares
% No. of Shareholders
No. of Shares
%
Individual 229 534,788 1.37 235 1,253,612 3.21 Institutional 30 38,438,243 98.63 33 37,828,851 96.79
259 38,973,031 100.00 268 39,082,463 100.00

206
Nations Trust Bank PLC Annual Report 2019
INVESTOR INFORMATION
FLOAT ADJUSTED MARKET CAPITALISATION 31.12.2019 31.12.2018
Number % Number %
Number of shareholders representing the public holding (Voting) 5,730 35.68 5,711 35.28 Number of shareholders representing the public holding (Non Voting) 250 1.54 258 8.15 Float Adjusted Market Capitalization LKR 7.04 Bn LKR 7.77 BnCompliant under Option 3 Option 2
MARKET INFORMATION ON ORDINARY SHARES OF THE BANKVoting Non-Voting
2019 2018 2019 2018
Market ValueHighest Value (LKR) 94.80 93.00 95.00 100.00 Lowest Value (LKR) 76.00 77.00 70.20 77.20 Value at end of year (LKR) 80.00 89.20 80.00 82.10
Trading StatisticsNo. of Transactions 2,158 3,194 47 53 No. of shares Traded (Mn) 10.92 27.52 1.92 0.51 Value of shares Traded (LKR Mn) 936.09 2,255.62 159.28 41.45
Market Capitalization Market Capitalization (LKR Mn) 19,590.31 21,288.89 3,117.84 3,208.67

207
NEXT GEN BANKING
TWENTY LARGEST VOTING SHAREHOLDERS AS AT 31 DECEMBER 2019 Name of the Shareholder 2019 2018*
No. of Shares % No. of Shares %
John Keells Holdings PLC 48,347,078 19.74 47,320,605 19.83 HWIC Asia Fund 36,731,826 15.00 35,799,700 15.00 Central Finance Company PLC A/C No. 03 24,124,933 9.85 23,612,729 9.89 Mackinnons Keells Limited 23,931,802 9.77 23,423,698 9.81 Janashakthi Insurance PLC - Shareholders 19,479,368 7.95 19,065,795 7.99 Bnymsanv Re-First State Investments ICVC- Stewart Investors Asia Pacific Fund
15,374,091 6.28 16,588,969 6.95
CF Insurance Brokers (Pvt) Ltd 12,152,256 4.96 11,894,248 4.98 CF Growth Fund Ltd A/C No. 01 12,069,880 4.93 11,813,621 4.95 Citi Bank New York S/A Norges Bank Account 2 7,188,806 2.94 2,152,294 0.90 Janashakthi Insurance PLC (Policy Holders) 4,288,517 1.75 4,197,467 1.76 Hatton National Bank PLC A/C No. 01 3,882,252 1.59 3,799,827 1.59 Mr. M.F. Hashim 2,606,412 1.06 2,668,324 1.12 Mr. Premalal Brahammanage 2,152,839 0.88 2,105,399 0.88 Mr. N.R. Somaiya 1,384,348 0.57 1,354,957 0.57 Timex Garments (Pvt) Ltd 1,298,225 0.53 1,270,662 0.53 Mrs. H. K. S. R. Perera 1,153,763 0.47 133,664 0.06 Malship Ceylon Ltd 1,115,192 0.46 1,091,515 0.46 East India Holding (Pvt) Ltd 1,053,685 0.43 313,357 0.13 SSBT - Parametric Tax-Managed Emerging Markets Fund 979,263 0.40 958,472 0.40 Mellon Bank N.A-Eaton Vance Trust Co. Collective Inv. Trust for Empolyee Benefit Plans-Eaton Vance T 835,246 0.34 483,897 0.20
220,149,782 89.90 210,049,200 88.01 Others 24,729,059 10.10 28,615,473 11.99 Total 244,878,841 100.00 238,664,673 100.00
*Shareholding as at 31 December 2018 of the top twenty shareholders as at 31st December 2019.
The Director of Bank Supervision of the Central Bank of Sri Lanka (CBSL) has by letter dated 7th November 2017 informed the Bank that the Monetary Board of the CBSL has permitted the John Keells Group and Central Finance Group to retain their respective current shareholdings in the Bank till 31 December 2020 and to reduce it to 15% each with effect from that date. The Monetary Board has also required the Bank to limit the voting rights of the John Keells Group and Central Finance Group to 10% each with effect from 31 March 2018.
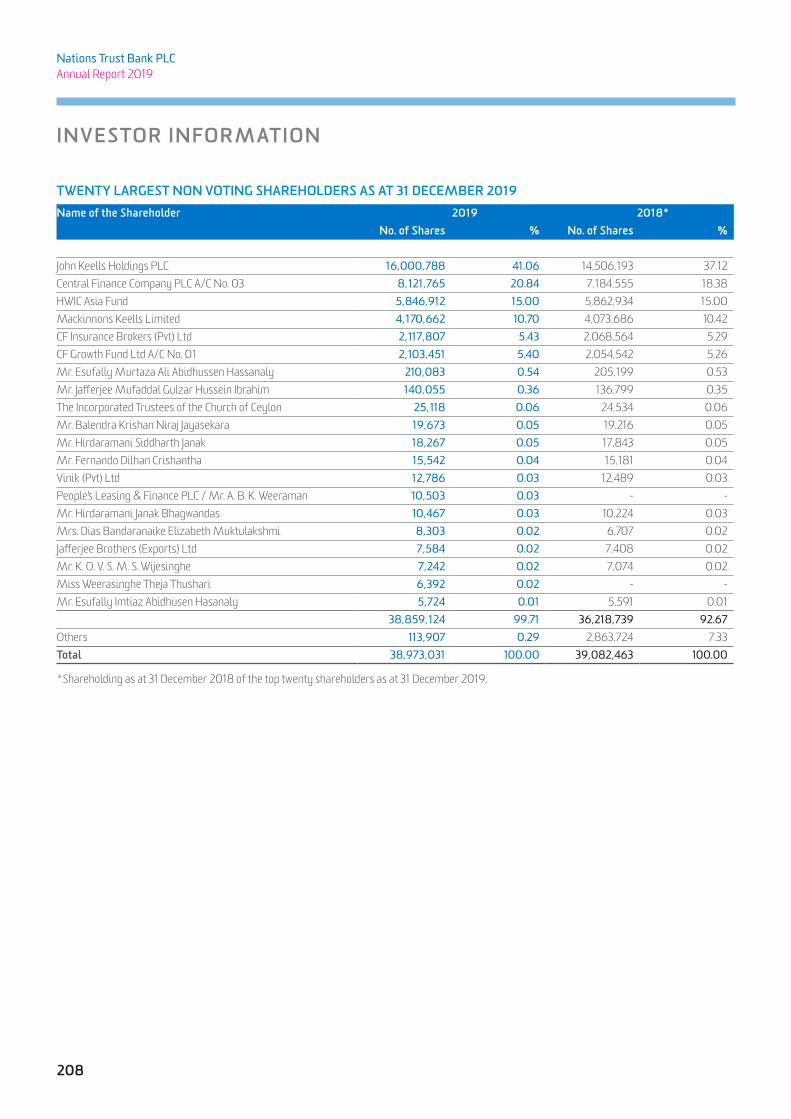
208
Nations Trust Bank PLC Annual Report 2019
INVESTOR INFORMATION
TWENTY LARGEST NON VOTING SHAREHOLDERS AS AT 31 DECEMBER 2019 Name of the Shareholder 2019 2018*
No. of Shares % No. of Shares %
John Keells Holdings PLC 16,000,788 41.06 14,506,193 37.12 Central Finance Company PLC A/C No. 03 8,121,765 20.84 7,184,555 18.38 HWIC Asia Fund 5,846,912 15.00 5,862,934 15.00 Mackinnons Keells Limited 4,170,662 10.70 4,073,686 10.42 CF Insurance Brokers (Pvt) Ltd 2,117,807 5.43 2,068,564 5.29 CF Growth Fund Ltd A/C No. 01 2,103,451 5.40 2,054,542 5.26 Mr. Esufally Murtaza Ali Abidhussen Hassanaly 210,083 0.54 205,199 0.53 Mr. Jafferjee Mufaddal Gulzar Hussein Ibrahim 140,055 0.36 136,799 0.35 The Incorporated Trustees of the Church of Ceylon 25,118 0.06 24,534 0.06 Mr. Balendra Krishan Niraj Jayasekara 19,673 0.05 19,216 0.05 Mr. Hirdaramani Siddharth Janak 18,267 0.05 17,843 0.05 Mr. Fernando Dilhan Crishantha 15,542 0.04 15,181 0.04 Vinik (Pvt) Ltd 12,786 0.03 12,489 0.03 People's Leasing & Finance PLC / Mr. A. B. K. Weeraman 10,503 0.03 - - Mr. Hirdaramani Janak Bhagwandas 10,467 0.03 10,224 0.03 Mrs. Dias Bandaranaike Elizabeth Muktulakshmi 8,303 0.02 6,707 0.02 Jafferjee Brothers (Exports) Ltd 7,584 0.02 7,408 0.02 Mr. K. O. V. S. M. S. Wijesinghe 7,242 0.02 7,074 0.02 Miss Weerasinghe Theja Thushari 6,392 0.02 - - Mr. Esufally Imtiaz Abidhusen Hasanaly 5,724 0.01 5,591 0.01
38,859,124 99.71 36,218,739 92.67 Others 113,907 0.29 2,863,724 7.33 Total 38,973,031 100.00 39,082,463 100.00
*Shareholding as at 31 December 2018 of the top twenty shareholders as at 31 December 2019.

209
NEXT GEN BANKING D
EBEN
TURE
INFO
RMAT
ION
The r
ated
uns
ecur
ed su
bord
inat
ed re
deem
able
deb
entu
res 2
016/
21, 2
018/
23, 2
019/
24 an
d 20
19/2
6 of
the B
ank a
re li
sted
in th
e Col
ombo
Stoc
k Exc
hang
e.
Debe
nture
Categ
ories
CSE L
isting
Int
erest P
ayab
le Fre
quen
cyIss
ued D
ateM
aturity
Da
teFa
ce Va
lueM
arket
Value
s 201
9Int
erest R
ates 2
019
Intere
st Rate
of Co
mpara
ble Go
vernm
ent
Secu
rities
Othe
r Rati
os as
at Da
te of
Last T
rade
2019
LK
R '00
020
18
LKR '
000
High
est
LKR
Lowe
st LK
RYe
ar En
d LK
RCo
upon
Ra
te %
Effect
ive
Annu
al Yie
ld %
31.12
.2019 %
31.12
.2018 %
As at
Issue
Date %
Intere
st Yiel
d %
Yield t
o M
aturity %
Floatin
gNT
B-BD-0
8/11/
21-C2
363
Semi -A
nnual
ly8-N
ov-16
8-Nov-
212,4
102,4
10No
t trade
d duri
ng the
curre
nt year
9.17*
* **
8.65*
* 11.4
9**
11.71**
No
t trade
d duri
ng the
curre
nt year
Fixed
Rate
NTB-B
D-08
/11/21
-C236
5-12.6
5Sem
i -Ann
ually
8-Nov-
168-N
ov-21
3,885
,800
3,885
,800
100.0
0 98
.50
100.0
0 12
.65
13.05
8.65
11.49
11.71
12.65
12
.62
Fixed
Rate
NTB-B
D-08
/11/21
-C236
4-12.8
Annu
ally8-N
ov-16
8-Nov-
211,11
1,790
1,111,7
90 No
t trade
d duri
ng the
curre
nt year
12.80
12.
80 8.6
5 11.4
9 11.7
1 No
t trade
d duri
ng the
curre
nt year
Fixed
Rate
NTB-B
D-20
/04/2
3-C24
02-12
.65Sem
i -Ann
ually
20-Ap
r-18
20-Ap
r-23
2,213,
000
2,213,
000
Not tr
aded d
uring
the cu
rrent y
ear 12
.65
13.05
9.33
11.54
9.99
Not tr
aded d
uring
the cu
rrent y
ear
Fixed
Rate
NTB-B
D-20
/04/2
3-C24
01-13
Annu
ally20
-Apr-1
820
-Apr-2
31,2
87,00
01,2
87,00
0 No
t trade
d duri
ng the
curre
nt year
13.00
13.
00 9.3
3 11.5
4 9.9
9 No
t trade
d duri
ng the
curre
nt year
Fixed
Rate
NTB-B
D-23/1
2/24 -
C244
1 - 12
.8An
nually
23-De
c-19
23-De
c-24
2,700
,000
- No
t trade
d duri
ng the
curre
nt year
12.80
12.
80 9.7
4 -
9.89
Not tr
aded d
uring
the cu
rrent y
ear
Fixed
Rate
NTB-B
D-23/1
2/26 -
C244
2 - 12
.9An
nually
23-De
c-19
23-De
c-26
1,800
,000
- No
t trade
d duri
ng the
curre
nt year
12.90
12.
90 9.8
7 -
10.11
Not tr
aded d
uring
the cu
rrent y
ear
13,00
0,000
8,500
,000
Ratio
s of
Deb
t20
1920
18
Debt
*/Eq
uity
Rat
io (%
)11
0.18
99.75
Inte
rest
Cov
er (T
imes
) 3
.24
3.76
Qu
ick A
sset
Rat
io (%
)12
511
5
* Bo
rrow
ings
ove
r five
yea
rs o
rigin
al m
atur
ity ar
e con
sider
ed fo
r deb
t**
Flo
atin
g ra
te d
eben
ture
repr
icing
at 6
mon
ths T
-Bill
rate
+ 1.
5%Al
l the
secu
ritie
s wer
e iss
ued
by N
atio
ns Tr
ust B
ank P
LC. T
he B
ank h
as n
ot h
ad an
y de
faul
ts o
f prin
cipal
, inte
rest
or o
ther
bre
ache
s with
rega
rd to
any
liabi
litie
s as o
f 31 D
ecem
ber 2
019.
Nat
ions
Tru
st B
ank
PLC
– U
tiliz
atio
n of
Fun
ds R
aise
d vi
a Ca
pita
l Mar
ket a
s at
31.
12.2
019
The u
tiliz
atio
n of
LKR
4.5
Bn
raise
d th
roug
h th
e iss
ue o
f deb
entu
res o
n 23
Dec
embe
r 201
9.
Obj
ectiv
eN
umbe
rO
bjec
tive
as P
erPr
ospe
ctus
Amou
ntAl
loca
ted
as p
erPr
ospe
ctus
in L
KR
Prop
osed
Dat
e of
Util
isat
ion
as p
erPr
ospe
ctus
Amou
ntAl
loca
ted
from
Proc
eeds
in L
KR
(A)
% o
f Tot
alPr
ocee
dsAm
ount
sU
tilis
ed in
LK
R (B
)
% o
f U
tilis
atio
nag
ains
tAl
loca
tion
(B
/A)
Clar
ifica
tion
ifN
ot F
ully
Util
ized
incl
udin
g w
here
the
Fund
s are
Inve
sted
1Ex
pans
ion
of L
oan
Book
4.5
BnW
ithin
6 to
18 m
onth
s fr
om d
ate o
f rec
eipt
of
cash
flow
s
4.5
Bn10
0%-
-Pr
opos
ed ti
me l
ines
are
not y
et la
psed
& u
nutil
ized
fu
nds a
re in
vest
ed in
reve
rse
repu
rcha
se ag
reem
ents
2
Impr
ove t
he T
ier I
I Cap
ital
Base
thus
, incr
easin
g th
e Ca
pita
l Ade
quac
y Ra
tio
(CAR
)
4.5
BnSu
bseq
uent
to C
BSL
appr
oval
4.5
Bn10
0%4.
5 Bn
100%
N/A
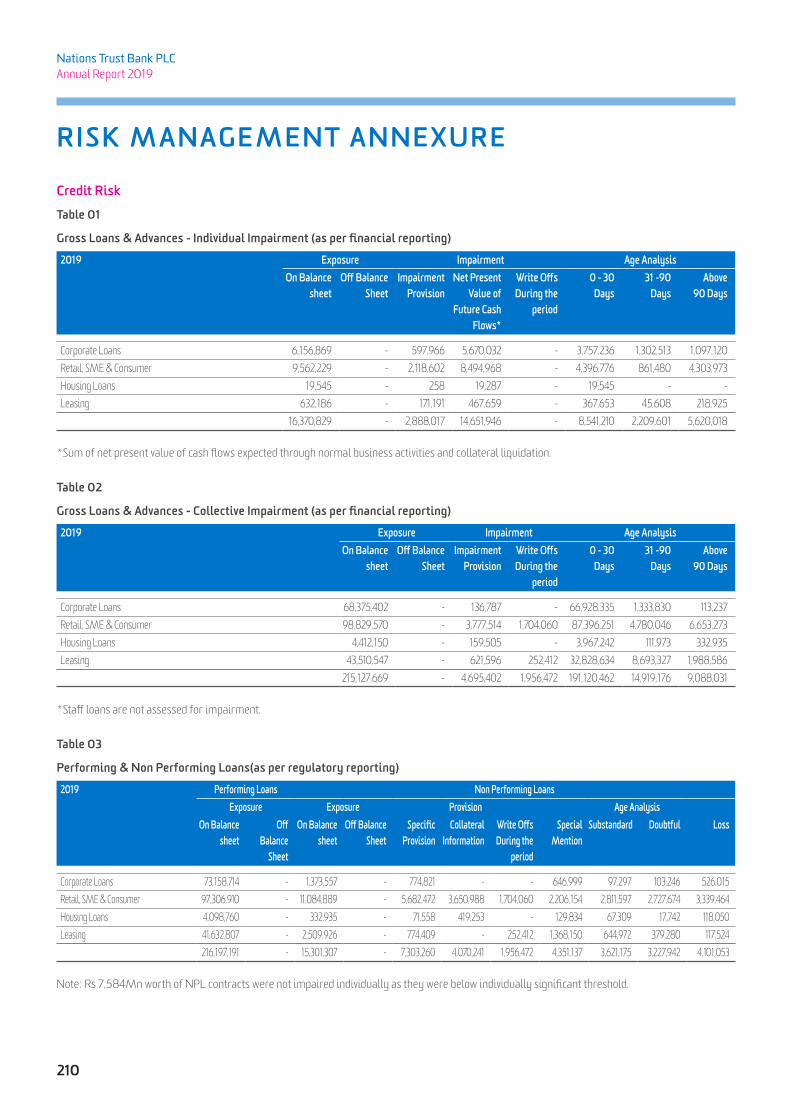
210
Nations Trust Bank PLC Annual Report 2019
RISK MANAGEMENT ANNEXURE
Credit Risk
Table 01
Gross Loans & Advances - Individual Impairment (as per financial reporting)
2019 Exposure Impairment Age Analysis On Balance
sheet Off Balance
SheetImpairment
ProvisionNet Present
Value of Future Cash
Flows*
Write Offs During the
period
0 - 30 Days
31 -90 Days
Above 90 Days
Corporate Loans 6,156,869 - 597,966 5,670,032 - 3,757,236 1,302,513 1,097,120 Retail, SME & Consumer 9,562,229 - 2,118,602 8,494,968 - 4,396,776 861,480 4,303,973 Housing Loans 19,545 - 258 19,287 - 19,545 - - Leasing 632,186 - 171,191 467,659 - 367,653 45,608 218,925
16,370,829 - 2,888,017 14,651,946 - 8,541,210 2,209,601 5,620,018
*Sum of net present value of cash flows expected through normal business activities and collateral liquidation.
Table 02
Gross Loans & Advances - Collective Impairment (as per financial reporting)
2019 Exposure Impairment Age Analysis On Balance
sheet Off Balance
SheetImpairment
ProvisionWrite Offs During the
period
0 - 30 Days
31 -90 Days
Above 90 Days
Corporate Loans 68,375,402 - 136,787 - 66,928,335 1,333,830 113,237Retail, SME & Consumer 98,829,570 - 3,777,514 1,704,060 87,396,251 4,780,046 6,653,273Housing Loans 4,412,150 - 159,505 - 3,967,242 111,973 332,935Leasing 43,510,547 - 621,596 252,412 32,828,634 8,693,327 1,988,586
215,127,669 - 4,695,402 1,956,472 191,120,462 14,919,176 9,088,031
*Staff loans are not assessed for impairment.
Table 03
Performing & Non Performing Loans(as per regulatory reporting)
2019 Performing Loans Non Performing Loans Exposure Exposure Provision Age Analysis
On Balance sheet
Off Balance
Sheet
On Balance sheet
Off Balance Sheet
Specific Provision
Collateral Information
Write Offs During the
period
Special Mention
Substandard Doubtful Loss
Corporate Loans 73,158,714 - 1,373,557 - 774,821 - - 646,999 97,297 103,246 526,015 Retail, SME & Consumer 97,306,910 - 11,084,889 - 5,682,472 3,650,988 1,704,060 2,206,154 2,811,597 2,727,674 3,339,464 Housing Loans 4,098,760 - 332,935 - 71,558 419,253 - 129,834 67,309 17,742 118,050 Leasing 41,632,807 - 2,509,926 - 774,409 - 252,412 1,368,150 644,972 379,280 117,524
216,197,191 - 15,301,307 - 7,303,260 4,070,241 1,956,472 4,351,137 3,621,175 3,227,942 4,101,053
Note: Rs 7,584Mn worth of NPL contracts were not impaired individually as they were below individually significant threshold.

211
NEXT GEN BANKING
Market Risk
Table: 1
Composition of Trading and Non-Trading Book
2019Assets Trading book
(LKR million)
Non-trading book
(LKR million)
Total
(LKR million)
Cash and Cash Equivalents - 8,756 8,756Balances with Central Bank of Sri Lanka - 8,377 8,377Reverse Repurchase Agreements - 13,827 13,827Derivative Financial Instruments 193 - 193Financial Assets 634 38,315 38,949Other Financial Assets - - -Financial Assets at Amortised Cost - Debt Instruments 19,063 19,063Financial Assets at Amortised Cost – Loans and Advances - 226,792 226,792Other Assets - 2,134 2,134Investments in Subsidiaries - 679 679Fixed Assets (PPE, ROU & Intangibles) - 6,270 6,270Total 827 324,213 325,040
LiabilitiesDue to Banks - 6,484 6,484Derivative Financial Instruments 312 - 312Due to Depositors 226,880 226,880Repurchase Agreements - 11,033 11,033Due to other Borrowers 27,381 27,381Debt Securities Issued - 13,263 13,263Retirement benefit obligations 652 652Tax Liabilities (Current &Deffered) - 2,334 2,334Other Liabilities - 6,358 6,358Equity & Other Reserves - 30,343 30,343Total 312 324,728 325,040
Contingent Liabilities & Commitments 39,041 160,314 199,355Commitment & Guarantees - 160,314 160,314Forward on Government Securities 309 - 309Derivative Assets- Held for Trading (Net) 38,732 - 38,732

212
Nations Trust Bank PLC Annual Report 2019
Table: 2
Net Open Position of Foreign Currency Denominated Assets and Liabilities of Domestic Banking Unit * (in millions of respective currency)
CCY Up to
One month 1 - 3 Months
3 - 6 Months
6 - 12 Months
1 - 3 Years
3 - 5 Years
Over 5 Years
NOP
USD
Assets (On & Off Balance sheet) 93.459 52.388 46.664 38.475 11.621 6.476 4.810 (0.829)Liabilities (On & Off Balance sheet) 59.874 36.477 33.420 27.816 37.487 9.979 49.669
Periodic Gap 33.585 15.911 13.244 10.659 (25.866) (3.503) (44.859)
GBP
Assets (On & Off Balance sheet) 7.064 3.659 0 .014 0 .033 0 .091 0 .004 0 .014 0 .033 Liabilities (On & Off Balance sheet) 0 .924 2.536 0 .579 1.021 0 .822 0 .311 4.653
Periodic Gap 6.140 1.123 (0.565) (0.988) (0.731) (0.307) (4.639)
EUR
Assets (On & Off Balance sheet) 6.412 4.789 0 .018 0 .057 0 .085 0 .008 0 .080 0 .014 Liabilities (On & Off Balance sheet) 1.250 0 .766 0 .594 0 .852 2.517 0 .955 4.501
Periodic Gap 5.162 4.023 (0.576) (0.795) (2.432) (0.947) (4.421)
AUD
Assets (On & Off Balance sheet) 7.919 8.053 0 .004 0 .009 0 .038 0 .026 - (0.319)Liabilities (On & Off Balance sheet) 2.013 1.427 1.433 2.053 0 .528 0 .201 8.713
Periodic Gap 5.906 6.626 (1.429) (2.044) (0.490) (0.175) (8.713)
JPY
Assets (On & Off Balance sheet) 42.174 0 .209 0 .330 6.433 1.569 - 17.297 0.011 Liabilities (On & Off Balance sheet) 59.047 0 .594 0 .733 0 .271 2.249 0 .845 4.262
Periodic Gap (16.873) (0.385) (0.403) 6.162 (0.680) (0.845) 13.035
RISK MANAGEMENT ANNEXURE

213
NEXT GEN BANKING
Liquidity Risk
Table: 3
Maturity gaps in major currencies (in millions of respective currency)
CCY Up to
One month 1 - 3 Months
3 - 6 Months
6 - 12 Months
1 - 3 Years
3 - 5 Years
Over 5 Years
LKR
Assets (On & Off Balance sheet) 90,588 20,147 18,642 21,932 64,440 29,792 50,389 Liabilities (On & Off Balance sheet) 52,693 31,775 27,076 26,556 19,446 20,262 263,106 Periodic Gap 37,895 (11,628) (8,434) (4,624) 44,994 9,530 (212,717)Cumulative GAP 37,895 26,267 17,833 13,209 58,203 67,733 (144,984)
USD
Assets (On & Off Balance sheet) 54 61 61 47 60 32 12 Liabilities (On & Off Balance sheet) 74 57 34 37 65 19 106 Periodic Gap (20) 4 27 10 (5) 13 (94)Cumulative GAP (20) (16) 11 21 16 29 (65)
GBP
Assets (On & Off Balance sheet) 7 4 - - - - -Liabilities (On & Off Balance sheet) 1 3 1 1 1 - 11 Periodic Gap 6 1 (1) (1) (1) - (11)Cumulative GAP 6 7 6 5 4 4 (7)
EUR
Assets (On & Off Balance sheet) 6 5 - - - - -Liabilities (On & Off Balance sheet) 1 1 1 1 3 1 8 Periodic Gap 5 4 (1) (1) (3) (1) (8)Cumulative GAP 5 9 8 7 4 3 (5)
AUD
Assets (On & Off Balance sheet) 8 8 - - - - -Liabilities (On & Off Balance sheet) 2 1 1 2 1 - 8 Periodic Gap 6 7 (1) (2) (1) - (8)Cumulative GAP 6 13 12 10 9 9 1
JPY
Assets (On & Off Balance sheet) 42 - - 6 2 - 17 Liabilities (On & Off Balance sheet) 70 12 1 - 2 1 209 Periodic Gap (28) (12) (1) 6 - (1) (192)Cumulative GAP (28) (40) (41) (35) (35) (36) (228)

214
Nations Trust Bank PLC Annual Report 2019
RISK MANAGEMENT ANNEXURE
Table: 4Interest Rate Sensitive gap Analysis (in millions of respective currency)
CCY Up to
One month 1 - 3 Months
3 - 6 Months
6 - 12 Months
1 - 3 Years
3 - 5 Years
Over 5 Years
Total
LKR
Assets 113,288 22,158 19,852 26,108 45,456 26,294 9,937 263,093 Liabilities 71,235 46,374 48,020 46,524 8,210 10,842 3,853 235,058 Periodic Gap 42,053 (24,216) (28,168) (20,416) 37,246 15,452 6,084 28,035
USD
Assets 69 137 71 36 3 1 - 317 Liabilities 96 104 78 30 - - - 308 Periodic Gap (27) 33 (7) 6 3 1 - 9
GBP
Assets 7 4 - - - - - 11 Liabilities 4 4 1 2 - - - 11 Periodic Gap 3 - (1) (2) - - - -
EUR
Assets 6 5 - - - - - 11 Liabilities 9 1 1 1 - - - 12 Periodic Gap (3) 4 (1) (1) - - - (1)
AUD
Assets 8 8 - - - - - 16 Liabilities 4 3 4 5 - - - 16 Periodic Gap 4 5 (4) (5) - - - -
JPY
Assets 28 - - 2 - - - 30 Liabilities 66 1 1 - - - - 68 Periodic Gap (38) (1) (1) 2 - - - (38)
Table: 5
Interest Rate Risk in Banking Book- Economic Value at Risk- in Millions (LKR equivalent) Up to One month
1 - 3 Months
3 - 6 Months
6 - 12 Months
1 - 3 Years
3 - 5 Years
Over 5 Years
Total
LKR Up by 200bp (6.80) 69.18 177.40 318.40 (963.83) (229.59) (288.94) (924.18)
Down by 200bp 6.93 (70.75) (182.04) (329.05) 1,027.36 251.46 350.40 1,054.32
USD
Up by 200bp (1.23) (17.51) 74.10 60.95 (9.94) (7.36) (1.54) 97.48 Down by 200bp 1.25 17.98 (76.32) (63.13) 10.64 8.16 1.79 (99.63)
GBP Up by 200bp 0.19 1.80 2.36 8.50 (0.54) (0.06) - 12.25
Down by 200bp ( 0.2) (1.84) (2.43) (8.81) 0.58 0.06 - (12.63)
EUR Up by 200bp 0.19 0.61 0.90 2.60 (0.30) (0.06) - 3.94
Down by 200bp (0.19) (0.63) (0.93) (2.69) (0.32) (0.06) - (4.05)
AUD Up by 200bp 0.20 1.40 3.62 9.46 (0.20) (0.22) - 14.25
Down by 200bp (0.21) (1.43) (3.72) (9.79) 0.21 0.25 - (14.69)

215
NEXT GEN BANKING
%
0
50
100
150
200
250
300
Liquid Assets to Short Term Liability Ratio
Dec-
18
Jan-
19
Feb-
19
Mar
-19
Apr-
19
May
-19
un-1
9
Jul-1
9
Aug-
19
Sep-
19
Oct-1
9
Nov
-19
Dec-
19
60 days30 days 30 days limit 60 days limit (Internal)
%
00
100
200
300
400
500
600
DBU FCBU CBSL Limit
Liquidity Coverage Ratio
Dec-
18
Jan-
19
Feb-
19
Mar
-19
Apr-
19
May
-19
un-1
9
Jul-1
9
Aug-
19
Sep-
19
Oct-1
9
Nov
-19
Dec-
19
%
92
94
96
98
100
102
104
106
Loan to Deposit Ratio
Dec-
18
Jan-
19
Feb-
19
Mar
-19
Apr-
19
May
-19
un-1
9
Jul-1
9
Aug-
19
Sep-
19
Oct-1
9
Nov
-19
Dec-
19
L/D Internal Limit
%
0
20
40
60
80
100
120
140
160
Net Stable Funding Ratio CBSL Limit
Net Stable Funding Ratio
Sep-
18
Dec-
18
Mar
-19
Jun-
19
Sep-
19
Dec-
19
%
60
65
70
75
80
Net Loans to Total Assets Ratio
Dec-
18
Jan-
19
Feb-
19
Mar
-19
Apr-
19
May
-19
un-1
9
Jul-1
9
Aug-
19
Sep-
19
Oct-1
9
Nov
-19
Dec-
19
NL/TA Internal Limit
%
0
5
10
15
20
25
30
DBU FCBU CBSL Limit
Statutory Liquidity Ratio
Dec-
18
Jan-
19
Feb-
19
Mar
-19
Apr-
19
May
-19
un-1
9
Jul-1
9
Aug-
19
Sep-
19
Oct-1
9
Nov
-19
Dec-
19

216
Nations Trust Bank PLC Annual Report 2019
BASEL III - Market Discipline - Minimum Disclosure Requirement Under Pillar 3 as per the Banking Act Direction No. 01 of 2016
Table 1
Key Regulatory Ratios - Capital and Liquidity
Item Bank Group31-Dec-2019 31-Dec-2018 31-Dec-2019 31-Dec-2018
Regulatory Capital (LKR ’000)Common Equity Tier 1 28,561,701 24,935,511 29,178,446 25,292,362Tier 1 Capital 28,561,701 24,935,511 29,178,446 25,292,362Total Capital 38,785,371 32,106,836 39,402,116 32,463,687
Regulatory Capital Ratios (%)Common Equity Tier 1 Capital Ratio (Minimum Requirement - 7.00%) 12.99% 11.96% 13.30% 12.15%Tier 1 Capital Ratio (Minimum Requirement - 8.50%) 12.99% 11.96% 13.30% 12.15%Total Capital Ratio (Minimum Requirement - 12.50%) 17.64% 15.40% 17.96% 15.59%Leverage Ratio(Minimum Requirement -3%) 8.47% 7.44% 8.64% 7.55%
Regulatory LiquidityStatutory Liquid Assets Domestic Banking Unit (LKR’000) 63,911,288 60,396,397 Off-Shore Banking Unit (LKR’000) 5,666,387 4,568,492Statutory Liquid Assets Ratio % (Minimum Requirement - 20%) Domestic Banking Unit (%) 23.78% 22.32% Off-Shore Banking Unit (%) 24.34% 22.29%Total Stock of High-Quality Liquid Assets (LKR’000) 47,734,687 56,908,941 Liquidity Coverage Ratio (%) Rupee (Minimum Requirement - 100%) 400.77% 250.57% All Currency (Minimum Requirement - 100%) 295.15% 189.66%
RISK MANAGEMENT ANNEXURE

217
NEXT GEN BANKING
Table 2
Basel III Computation of Capital Ratios
ITEM Bank GroupLKR ‘000 LKR ‘000
31-Dec-2019 31-Dec-2018 31-Dec-2019 31-Dec-2018
Common Equity Tier 1 (CET1) Capital after Adjustments 28,561,701 24,935,511 29,178,446 25,292,362 Common Equity Tier 1 (CET1) Capital 29,937,283 26,553,409 30,554,608 26,911,955 Equity Capital (Stated Capital)/Assigned Capital 9,408,135 8,865,523 9,408,135 8,865,523 Reserve Fund 1,371,853 1,199,130 1,371,854 1,199,130 Published Retained Earnings/(Accumulated Retained Losses) 18,976,109 16,586,839 19,593,434 16,945,384 Published Accumulated Other Comprehensive Income (OCI) 181,185 (98,083) 181,185 (98,083)General and other Disclosed Reserves - - - - Unpublished Current Year's Profit/Loss and Gains reflected in OCI - - - - Ordinary Shares issued by Consolidated Banking and Financial Subsidiaries of the Bank and held by Third Parties
- - - -
Total Adjustments to CET1 Capital 1,375,582 1,617,899 1,376,162 1,619,593 Goodwill (net) - - - - Intangible Assets (net) 1,375,582 1,301,248 1,376,162 1,302,942 Shortfall of the Cumulative Impairment to Specific Provisions - 316,650 - 316,650 Additional Tier 1 (AT1) Capital after Adjustments - - - - Additional Tier 1 (AT1) Capital - - - - Qualifying Additional Tier 1 Capital Instruments - - - - Instruments issued by Consolidated Banking and Financial Subsidiaries of the Bank and held by Third Parties
- - - -
Total Adjustments to AT1 Capital - - - - Investment in Own Shares - - - - Others (specify) - - - - Tier 2 Capital after Adjustments 10,223,670 7,171,325 10,223,670 7,171,325 Tier 2 Capital 10,223,670 7,171,325 10,223,670 7,171,325 Qualifying Tier 2 Capital Instruments 8,666,667 5,866,667 8,666,667 5,866,667 Revaluation Gains 337,316 337,316 337,316 337,316 Loan Loss Provisions 1,219,688 967,343 1,219,688 967,343 Instruments issued by Consolidated Banking and Financial Subsidiaries of the Bank and held by Third Parties
- - - -
Total Adjustments to Tier 2 - - - - Investment in Own Shares - - - - Others (specify) - - - - CET1 Capital 28,561,701 24,935,511 29,178,446 25,292,362 Total Tier 1 Capital 28,561,701 24,935,511 29,178,446 25,292,362 Total Capital 38,785,371 32,106,836 39,402,116 32,463,687
Note : As per the Directive No. 4 of 2018 issued by Central Bank of Sri Lanka on “Adoption of Sri Lanka Accounting Standard - SLFRS 9: Financial Instruments”, for the purpose of calculating Capital Adequacy Ratio, Banks shall stagger additional credit loss provision arising from SLFRS 9 at the transition date, 01 January 2018. The Bank has charged only 50% of the first day impact (Rs. 511 Mn) against the retained earnings of the Bank for the purpose of calculating Capital Adequacy Ratio as at 31 December 2019. If 100% of the first day impact is considered, the Bank total Tier 1 Capital ratio and Bank Total Capital ratio would be decreased by 0.23%.

218
Nations Trust Bank PLC Annual Report 2019
RISK MANAGEMENT ANNEXURE
Table 2 (Contd.)
Basel III Computation of Capital Ratios
Item Bank Bank Group GroupLKR ‘000 LKR ‘000 LKR ‘000 LKR ‘000
31-Dec-2019 31-Dec-2018 31-Dec-2019 31-Dec-2018
Total Risk Weighted Assets (RWA) 219,814,897 208,535,184 219,397,465 208,201,892RWAs for Credit Risk 188,095,481 180,709,189 187,795,048 180,523,460RWAs for Market Risk 7,292,301 5,989,190 7,292,301 5,989,190RWAs for Operational Risk 24,427,115 21,836,805 24,310,115 21,689,242CET1 Capital Ratio (including Capital Conservation Buffer, Countercyclical Capital Buffer & Surcharge on D-SIBs) (%) 12.99% 11.96% 13.30% 12.15%of which: Capital Conservation Buffer (%) 2.500% 1.875% 2.500% 1.875%of which: Countercyclical Buffer (%) - - - -of which: Capital Surcharge on D-SIBs (%) - - - -Total Tier 1 Capital Ratio (%) 12.99% 11.96% 13.30% 12.15%Total Capital Ratio (including Capital Conservation Buffer, Countercyclical Capital Buffer & Surcharge on D-SIBs) (%) 17.64% 15.40% 17.96% 15.59%of which: Capital Conservation Buffer (%) 2.500% 1.875% 2.500% 1.875%of which: Countercyclical Buffer (%) - - - -of which: Capital Surcharge on D-SIBs (%) - - - -
Table 3
Basel III Computation of Leverage Ratio
Item Bank GroupAmount (LKR ‘000) Amount (LKR ‘000)
31-Dec-2019 31-Dec-18 31-Dec-2019 31-Dec-18
Tier 1 Capital 28,561,701 24,935,511 29,178,446 25,292,362Total Exposures 337,243,362 335,320,528 337,572,151 335,173,551On-Balance Sheet Items (excluding Derivatives and Securities Financing Transactions, but including Collateral) 309,651,464 323,076,300 309,977,763 322,924,418Derivative Exposures 819,853 762,771 819,853 762,771Securities Financing Transaction Exposures 13,820,317 180,500 13,822,806 185,405Other Off-Balance Sheet Exposures 12,951,728 11,300,956 12,951,728 11,300,956Basel III Leverage Ratio (%) (Tier 1/Total Exposure) 8.47% 7.44% 8.64% 7.55%
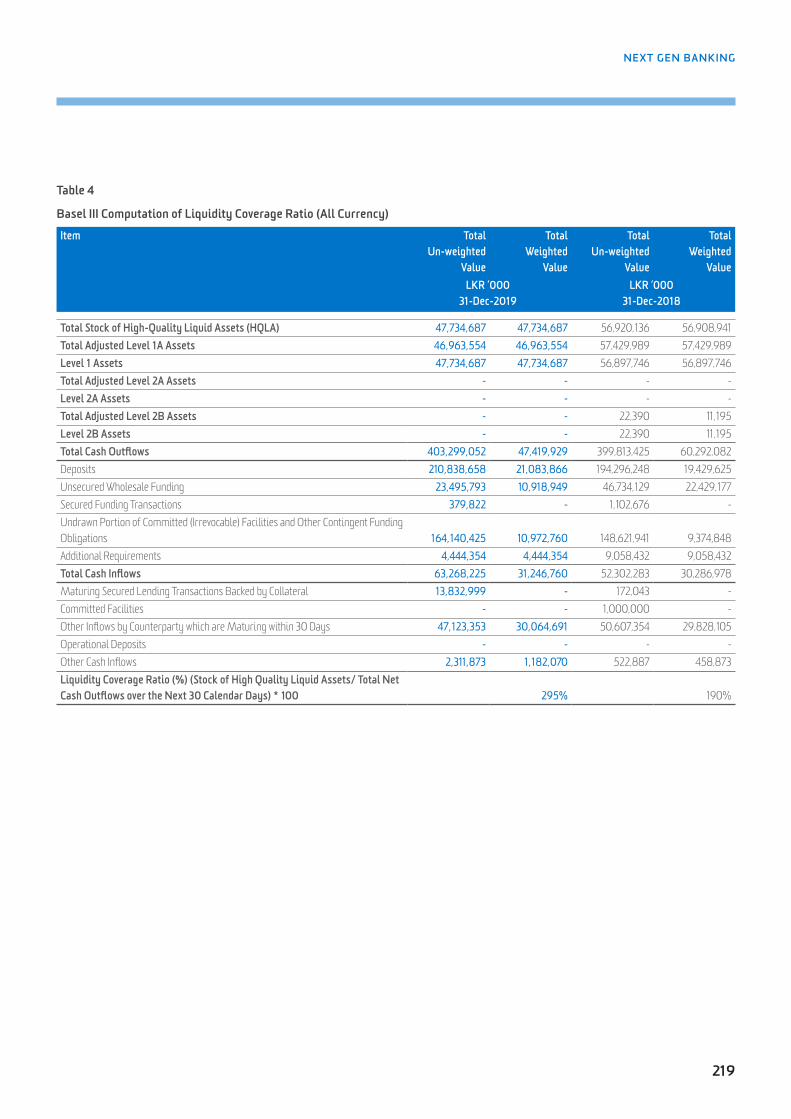
219
NEXT GEN BANKING
Table 4
Basel III Computation of Liquidity Coverage Ratio (All Currency)
Item Total Un-weighted
Value
Total Weighted
Value
Total Un-weighted
Value
Total Weighted
ValueLKR ‘000
31-Dec-2019LKR ‘000
31-Dec-2018
Total Stock of High-Quality Liquid Assets (HQLA) 47,734,687 47,734,687 56,920,136 56,908,941 Total Adjusted Level 1A Assets 46,963,554 46,963,554 57,429,989 57,429,989 Level 1 Assets 47,734,687 47,734,687 56,897,746 56,897,746 Total Adjusted Level 2A Assets - - - - Level 2A Assets - - - - Total Adjusted Level 2B Assets - - 22,390 11,195 Level 2B Assets - - 22,390 11,195 Total Cash Outflows 403,299,052 47,419,929 399,813,425 60,292,082 Deposits 210,838,658 21,083,866 194,296,248 19,429,625 Unsecured Wholesale Funding 23,495,793 10,918,949 46,734,129 22,429,177 Secured Funding Transactions 379,822 - 1,102,676 - Undrawn Portion of Committed (Irrevocable) Facilities and Other Contingent Funding Obligations 164,140,425 10,972,760 148,621,941 9,374,848 Additional Requirements 4,444,354 4,444,354 9,058,432 9,058,432 Total Cash Inflows 63,268,225 31,246,760 52,302,283 30,286,978 Maturing Secured Lending Transactions Backed by Collateral 13,832,999 - 172,043 - Committed Facilities - - 1,000,000 - Other Inflows by Counterparty which are Maturing within 30 Days 47,123,353 30,064,691 50,607,354 29,828,105 Operational Deposits - - - - Other Cash Inflows 2,311,873 1,182,070 522,887 458,873 Liquidity Coverage Ratio (%) (Stock of High Quality Liquid Assets/ Total Net Cash Outflows over the Next 30 Calendar Days) * 100 295% 190%

220
Nations Trust Bank PLC Annual Report 2019
RISK MANAGEMENT ANNEXURE
Table 5
Main Features of Regulatory Capital Instruments
Description of the Capital Instrument Ordinary Shares (Voting)
Ordinary Shares (Non Voting)
Subordinated Debt (Debentures)
Subordinated Debt (Debentures)
Subordinated Debt (Debentures)
Subordinated Debt (Debentures)
Subordinated Debt (Debentures)
Subordinated Debt (Debentures)
Subordinated Debt (Debentures)
Issuer Nations Trust Bank PLC Nations Trust Bank PLC Nations Trust Bank PLC Nations Trust Bank PLC Nations Trust Bank PLC Nations Trust Bank PLC Nations Trust Bank PLC Nations Trust Bank PLC Nations Trust Bank PLCUnique Identifier (e.g., ISIN or Bloomberg Identifier for Private Placement)
LK0309N00001 LK0309N00001 NTB-BD-08/11/21-C2365-12.65
NTB-BD-08/11/21-C2364-12.8
NTB-BD-08/11/21-C2363 NTB-BD-20/04/23-C2402-12.65
NTB-BD-20/04/23-C2401-13
NTB-BD-23/12/24 - C2441 - 12.8
NTB-BD-23/12/26 - C2442 - 12.9
Governing Law(s) of the Instrument Companies Act, No.7 of 2007
Companies Act, No.7 of 2007
Companies Act, No.7 of 2007 Monetary Law Act No. 58 of 1949
Companies Act, No.7 of 2007 Monetary Law Act No. 58 of 1949
Companies Act, No.7 of 2007 Monetary Law Act No. 58 of 1949
Companies Act, No.7 of 2007 Monetary Law Act No. 58 of 1949
Companies Act, No.7 of 2007 Monetary Law Act No. 58 of 1949
Companies Act, No.7 of 2007 Monetary Law Act No. 58 of 1949
Companies Act, No.7 of 2007 Monetary Law Act No. 58 of 1949
Original Date of Issuance 3-May-99 20-Feb-18 8-Nov-16 8-Nov-16 8-Nov-16 20-Apr-18 20-Apr-18 23-Dec-19 23-Dec-19Par Value of Instrument 22.12 80 100 100 100 100 100 100 100Perpetual or Dated Perpetual Perpetual Dated Dated Dated Dated Dated Dated DatedOriginal Maturity Date, if Applicable N/A N/A 8-Nov-21 8-Nov-21 8-Nov-21 20-Apr-23 20-Apr-23 23-Dec-24 23-Dec-26Amount Recognised in Regulatory Capital (in LKR ‘000 as at the Reporting Date) 6,289,306 3,118,828 1,424,793 407,656 884 1,475,333 858,000 2,700,000 1,800,000 Accounting Classification (Equity/Liability) Equity Equity Liability Liability Liability Liability Liability Liability LiabilityIssuer Call subject to Prior Supervisory ApprovalOptional Call Date, Contingent Call Dates and Redemption Amount (LKR ‘000)
N/A N/A N/A N/A N/A N/A N/A N/A N/A
Subsequent Call Dates, if Applicable N/A N/A N/A N/A N/A N/A N/A N/A N/ACoupons/DividendsFixed or Floating Dividend/Coupon Discretionary dividend
amountDiscretionary dividend amount
Fixed Fixed Floating Fixed Fixed Fixed Fixed
Coupon Rate and any Related Index Distributable profit that has been declared as dividend
Distributable profit that has been declared as dividend
12.65% 12.80% 9.17% 12.65% 13.00% 12.80% 12.90%
Non-Cumulative or Cumulative Non-Cumulative Non-Cumulative Non-Cumulative Non-Cumulative Non-Cumulative Non-Cumulative Non-Cumulative Non-Cumulative Non-CumulativeConvertible or Non-Convertible Non-Convertible Convertible Non-Convertible Non-Convertible Non-Convertible Convertible Convertible Convertible ConvertibleIf Convertible, Conversion Trigger (s) Non-Convertible Starting from last market
date of quarter ending 30th June and forward
Non-Convertible Non-Convertible Non-Convertible As per Banking Act Direction No. 1 of 2016
As per Banking Act Direction No. 1 of 2016
As per Banking Act Direction No. 1 of 2016
As per Banking Act Direction No. 1 of 2016
If Convertible, Fully or Partially Non-Convertible Fully or Partially Non-Convertible Non-Convertible Non-Convertible Fully or Partially Fully or Partially Fully or Partially Fully or PartiallyIf Convertible, Mandatory or Optional Non-Convertible Optional Non-Convertible Non-Convertible Non-Convertible Mandatory Mandatory Mandatory MandatoryIf Convertible, Conversion Rate Non-Convertible 1:1 Non-Convertible Non-Convertible Non-Convertible Simple Average of Volume
WA Price of ordinary voting shares published by the CSE, during the 3 months period, immediately preceding the date of the Trigger Event.
Simple Average of Volume WA Price of ordinary voting shares published by the CSE, during the 3 months period, immediately preceding the date of the Trigger Event.
Simple Average of Volume WA Price of ordinary voting shares published by the CSE, during the 3 months period, immediately preceding the date of the Trigger Event.
Simple Average of Volume WA Price of ordinary voting shares published by the CSE, during the 3 months period, immediately preceding the date of the Trigger Event.
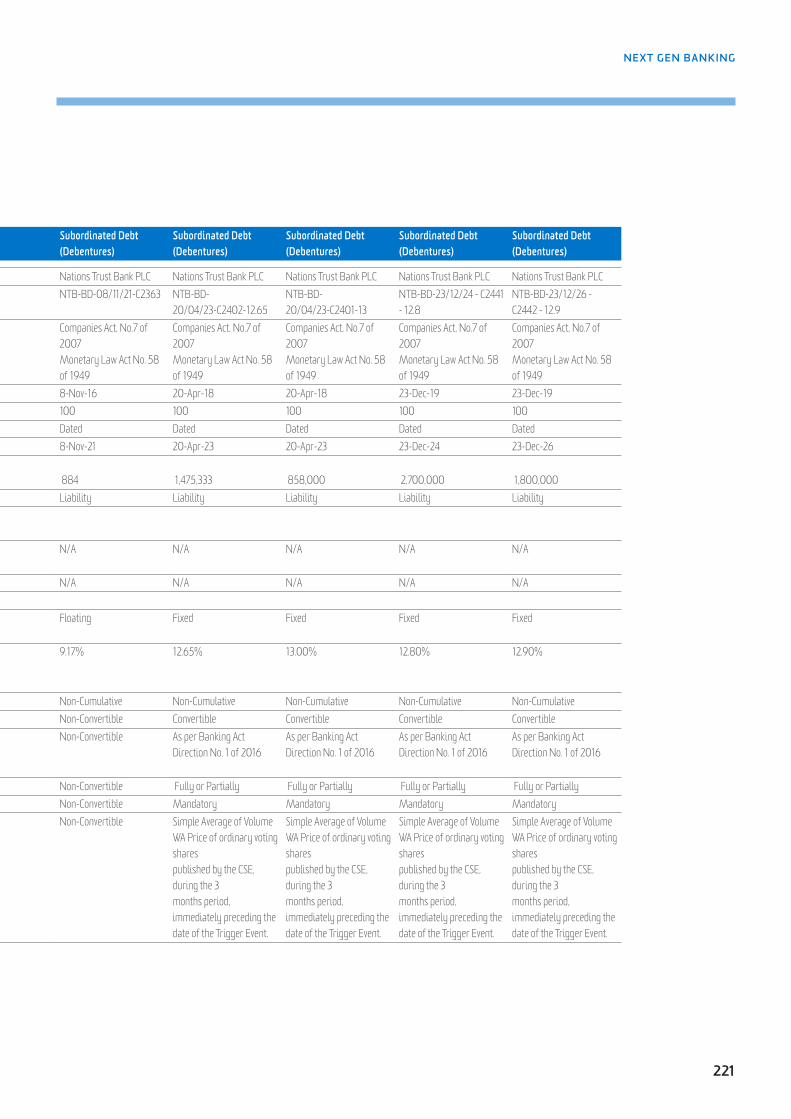
221
NEXT GEN BANKING
Table 5
Main Features of Regulatory Capital Instruments
Description of the Capital Instrument Ordinary Shares (Voting)
Ordinary Shares (Non Voting)
Subordinated Debt (Debentures)
Subordinated Debt (Debentures)
Subordinated Debt (Debentures)
Subordinated Debt (Debentures)
Subordinated Debt (Debentures)
Subordinated Debt (Debentures)
Subordinated Debt (Debentures)
Issuer Nations Trust Bank PLC Nations Trust Bank PLC Nations Trust Bank PLC Nations Trust Bank PLC Nations Trust Bank PLC Nations Trust Bank PLC Nations Trust Bank PLC Nations Trust Bank PLC Nations Trust Bank PLCUnique Identifier (e.g., ISIN or Bloomberg Identifier for Private Placement)
LK0309N00001 LK0309N00001 NTB-BD-08/11/21-C2365-12.65
NTB-BD-08/11/21-C2364-12.8
NTB-BD-08/11/21-C2363 NTB-BD-20/04/23-C2402-12.65
NTB-BD-20/04/23-C2401-13
NTB-BD-23/12/24 - C2441 - 12.8
NTB-BD-23/12/26 - C2442 - 12.9
Governing Law(s) of the Instrument Companies Act, No.7 of 2007
Companies Act, No.7 of 2007
Companies Act, No.7 of 2007 Monetary Law Act No. 58 of 1949
Companies Act, No.7 of 2007 Monetary Law Act No. 58 of 1949
Companies Act, No.7 of 2007 Monetary Law Act No. 58 of 1949
Companies Act, No.7 of 2007 Monetary Law Act No. 58 of 1949
Companies Act, No.7 of 2007 Monetary Law Act No. 58 of 1949
Companies Act, No.7 of 2007 Monetary Law Act No. 58 of 1949
Companies Act, No.7 of 2007 Monetary Law Act No. 58 of 1949
Original Date of Issuance 3-May-99 20-Feb-18 8-Nov-16 8-Nov-16 8-Nov-16 20-Apr-18 20-Apr-18 23-Dec-19 23-Dec-19Par Value of Instrument 22.12 80 100 100 100 100 100 100 100Perpetual or Dated Perpetual Perpetual Dated Dated Dated Dated Dated Dated DatedOriginal Maturity Date, if Applicable N/A N/A 8-Nov-21 8-Nov-21 8-Nov-21 20-Apr-23 20-Apr-23 23-Dec-24 23-Dec-26Amount Recognised in Regulatory Capital (in LKR ‘000 as at the Reporting Date) 6,289,306 3,118,828 1,424,793 407,656 884 1,475,333 858,000 2,700,000 1,800,000 Accounting Classification (Equity/Liability) Equity Equity Liability Liability Liability Liability Liability Liability LiabilityIssuer Call subject to Prior Supervisory ApprovalOptional Call Date, Contingent Call Dates and Redemption Amount (LKR ‘000)
N/A N/A N/A N/A N/A N/A N/A N/A N/A
Subsequent Call Dates, if Applicable N/A N/A N/A N/A N/A N/A N/A N/A N/ACoupons/DividendsFixed or Floating Dividend/Coupon Discretionary dividend
amountDiscretionary dividend amount
Fixed Fixed Floating Fixed Fixed Fixed Fixed
Coupon Rate and any Related Index Distributable profit that has been declared as dividend
Distributable profit that has been declared as dividend
12.65% 12.80% 9.17% 12.65% 13.00% 12.80% 12.90%
Non-Cumulative or Cumulative Non-Cumulative Non-Cumulative Non-Cumulative Non-Cumulative Non-Cumulative Non-Cumulative Non-Cumulative Non-Cumulative Non-CumulativeConvertible or Non-Convertible Non-Convertible Convertible Non-Convertible Non-Convertible Non-Convertible Convertible Convertible Convertible ConvertibleIf Convertible, Conversion Trigger (s) Non-Convertible Starting from last market
date of quarter ending 30th June and forward
Non-Convertible Non-Convertible Non-Convertible As per Banking Act Direction No. 1 of 2016
As per Banking Act Direction No. 1 of 2016
As per Banking Act Direction No. 1 of 2016
As per Banking Act Direction No. 1 of 2016
If Convertible, Fully or Partially Non-Convertible Fully or Partially Non-Convertible Non-Convertible Non-Convertible Fully or Partially Fully or Partially Fully or Partially Fully or PartiallyIf Convertible, Mandatory or Optional Non-Convertible Optional Non-Convertible Non-Convertible Non-Convertible Mandatory Mandatory Mandatory MandatoryIf Convertible, Conversion Rate Non-Convertible 1:1 Non-Convertible Non-Convertible Non-Convertible Simple Average of Volume
WA Price of ordinary voting shares published by the CSE, during the 3 months period, immediately preceding the date of the Trigger Event.
Simple Average of Volume WA Price of ordinary voting shares published by the CSE, during the 3 months period, immediately preceding the date of the Trigger Event.
Simple Average of Volume WA Price of ordinary voting shares published by the CSE, during the 3 months period, immediately preceding the date of the Trigger Event.
Simple Average of Volume WA Price of ordinary voting shares published by the CSE, during the 3 months period, immediately preceding the date of the Trigger Event.

222
Nations Trust Bank PLC Annual Report 2019
RISK MANAGEMENT ANNEXURE
Table 6
Credit Risk under Standardised Approach – Credit Risk Exposures and Credit Risk Mitigation (CRM) Effects Asset Class Bank Bank
LKR’000 as at -31-Dec-2019 LKR’000 as at -31-Dec-2018Exposures before
Credit Conversion Factor (CCF) and CRM
Exposures post CCF and CRM
RWA and RWA Density (%) Exposures before Credit Conversion Factor (CCF)
and CRM
Exposures post CCF and CRM
RWA and RWA Density (%)
On- Balance Sheet
Amount
Off- Balance Sheet
Amount
On- Balance Sheet
Amount
Off- Balance Sheet
Amount
RWA RWA Density(ii) On- Balance Sheet
Amount
Off- Balance Sheet
Amount
On- Balance Sheet
Amount
Off- Balance Sheet
Amount
RWA RWA Density(ii)
Claims on Central Government and CBSL 26,489,626 - 26,489,626 - 843,054 3% 25,296,968 - 25,296,968 - 782,888 3%Claims on Foreign Sovereigns and their Central Banks - - - - - 0% - - - - - 0%Claims on Public Sector Entities - - - - - 0% - - - - - 0%Claims on Official Entities and Multilateral Development Banks
- - - - - 0% - - - - - 0%
Claims on Banks Exposures 4,411,592 36,974,802 4,411,592 769,380 2,105,068 41% 1,928,632 37,790,696 1,928,632 776,434 1,003,952 37%Claims on Financial Institutions 9,236,145 3,270,978 9,236,145 1,213,161 6,576,362 63% 13,229,173 3,845,670 13,229,173 1,172,885 7,529,533 52%Claims on Corporates 65,293,748 88,212,393 65,293,748 9,038,623 72,107,571 97% 56,394,370 77,969,149 56,394,370 7,516,188 61,178,409 96%Retail Claims 106,088,045 74,730,209 106,088,045 2,703,118 82,898,691 76% 111,221,643 70,572,055 111,221,643 2,635,431 87,169,949 77%Claims Secured by Residential Property 8,580,908 - 8,580,908 - 6,247,199 73% 8,793,378 - 8,793,378 - 6,279,153 71%Claims Secured by Commercial Real Estate 668,810 40,359 668,810 17,500 686,310 100% 894,721 56,198 894,721 25,898 920,619 100%Non-Performing Assets (NPAs)(i) 8,684,090 - 8,684,090 - 10,645,923 123% 5,640,268 - 5,640,268 - 7,526,209 133%Higher-risk Categories 25,803 - 25,803 - 64,507 250% 25,803 - 25,803 - 64,507 250%Cash Items and Other Assets 13,252,470 - 13,252,470 - 5,920,797 45% 15,807,771 - 15,807,771 - 8,253,970 52%Total 242,731,236 203,228,741 242,731,236 13,741,782 188,095,481 73% 239,232,727 190,233,768 239,232,727 12,126,835 180,709,189 72%
Asset Class Group GroupLKR’000 as at -31-Dec-2019 LKR’000 as at -31-Dec-2018
Exposures before Credit Conversion Factor (CCF)
and CRM
Exposures post CCF and CRM
RWA and RWA Density (%) Exposures before Credit Conversion Factor (CCF)
and CRM
Exposures post CCF and CRM
RWA and RWA Density (%)
On- Balance Sheet
Amount
Off- Balance Sheet
Amount
On- Balance Sheet
Amount
Off- Balance Sheet
Amount
RWA RWA Density(ii) On- Balance Sheet
Amount
Off- Balance Sheet
Amount
On- Balance Sheet
Amount
Off- Balance Sheet
Amount
RWA RWA Density(ii)
Claims on Central Government and CBSL 26,489,626 - 26,489,626 - 843,054 3% 25,296,968 - 25,296,968 - 782,888 3%Claims on Foreign Sovereigns and their Central Banks - - - - - 0% - - - - - 0%Claims on Public Sector Entities - - - - - 0% - - - - - 0%Claims on Official Entities and Multilateral Development Banks - - - - - 0% - - - - - 0%Claims on Banks Exposures 4,411,651 36,974,802 4,411,651 769,380 2,105,080 41% 1,928,663 37,790,696 1,928,663 776,434 1,003,958 37%Claims on Financial Institutions 9,236,145 3,270,978 9,236,145 1,213,161 6,576,362 63% 13,229,173 3,845,670 13,229,173 1,172,885 7,529,533 52%Claims on Corporates 65,296,237 88,216,518 65,296,237 9,038,623 72,110,061 97% 56,399,275 77,972,305 56,399,275 7,516,188 61,183,314 96%Retail Claims 106,088,045 74,730,209 106,088,045 2,703,118 82,898,691 76% 111,221,643 70,572,055 111,221,643 2,635,431 87,169,949 77%Claims Secured by Residential Property 8,580,908 - 8,580,908 - 6,247,199 73% 8,793,378 - 8,793,378 - 6,279,153 71%Claims Secured by Commercial Real Estate 668,810 40,359 668,810 17,500 686,310 100% 894,721 56,198 894,721 25,898 920,619 100%Non-Performing Assets (NPAs)(i) 8,684,090 - 8,684,090 - 10,645,923 123% 5,640,268 - 5,640,268 - 7,526,209 133%Higher-risk Categories - - - - - 0% - - - - - 0%Cash Items and Other Assets 13,014,065 - 13,014,065 - 5,682,368 44% 15,681,660 - 15,681,660 - 8,127,836 52%Total 242,469,577 203,232,866 242,469,577 13,741,782 187,795,048 73% 239,085,750 190,236,924 239,085,750 12,126,835 180,523,460 72%
Note: (i) NPAs – As per Banking Act Directions on Classification of loans and advances, income recognition and provisioning. (ii) RWA Density – Total RWA/Exposures post CCF and CRM.

223
NEXT GEN BANKING
Table 6
Credit Risk under Standardised Approach – Credit Risk Exposures and Credit Risk Mitigation (CRM) Effects Asset Class Bank Bank
LKR’000 as at -31-Dec-2019 LKR’000 as at -31-Dec-2018Exposures before
Credit Conversion Factor (CCF) and CRM
Exposures post CCF and CRM
RWA and RWA Density (%) Exposures before Credit Conversion Factor (CCF)
and CRM
Exposures post CCF and CRM
RWA and RWA Density (%)
On- Balance Sheet
Amount
Off- Balance Sheet
Amount
On- Balance Sheet
Amount
Off- Balance Sheet
Amount
RWA RWA Density(ii) On- Balance Sheet
Amount
Off- Balance Sheet
Amount
On- Balance Sheet
Amount
Off- Balance Sheet
Amount
RWA RWA Density(ii)
Claims on Central Government and CBSL 26,489,626 - 26,489,626 - 843,054 3% 25,296,968 - 25,296,968 - 782,888 3%Claims on Foreign Sovereigns and their Central Banks - - - - - 0% - - - - - 0%Claims on Public Sector Entities - - - - - 0% - - - - - 0%Claims on Official Entities and Multilateral Development Banks
- - - - - 0% - - - - - 0%
Claims on Banks Exposures 4,411,592 36,974,802 4,411,592 769,380 2,105,068 41% 1,928,632 37,790,696 1,928,632 776,434 1,003,952 37%Claims on Financial Institutions 9,236,145 3,270,978 9,236,145 1,213,161 6,576,362 63% 13,229,173 3,845,670 13,229,173 1,172,885 7,529,533 52%Claims on Corporates 65,293,748 88,212,393 65,293,748 9,038,623 72,107,571 97% 56,394,370 77,969,149 56,394,370 7,516,188 61,178,409 96%Retail Claims 106,088,045 74,730,209 106,088,045 2,703,118 82,898,691 76% 111,221,643 70,572,055 111,221,643 2,635,431 87,169,949 77%Claims Secured by Residential Property 8,580,908 - 8,580,908 - 6,247,199 73% 8,793,378 - 8,793,378 - 6,279,153 71%Claims Secured by Commercial Real Estate 668,810 40,359 668,810 17,500 686,310 100% 894,721 56,198 894,721 25,898 920,619 100%Non-Performing Assets (NPAs)(i) 8,684,090 - 8,684,090 - 10,645,923 123% 5,640,268 - 5,640,268 - 7,526,209 133%Higher-risk Categories 25,803 - 25,803 - 64,507 250% 25,803 - 25,803 - 64,507 250%Cash Items and Other Assets 13,252,470 - 13,252,470 - 5,920,797 45% 15,807,771 - 15,807,771 - 8,253,970 52%Total 242,731,236 203,228,741 242,731,236 13,741,782 188,095,481 73% 239,232,727 190,233,768 239,232,727 12,126,835 180,709,189 72%
Asset Class Group GroupLKR’000 as at -31-Dec-2019 LKR’000 as at -31-Dec-2018
Exposures before Credit Conversion Factor (CCF)
and CRM
Exposures post CCF and CRM
RWA and RWA Density (%) Exposures before Credit Conversion Factor (CCF)
and CRM
Exposures post CCF and CRM
RWA and RWA Density (%)
On- Balance Sheet
Amount
Off- Balance Sheet
Amount
On- Balance Sheet
Amount
Off- Balance Sheet
Amount
RWA RWA Density(ii) On- Balance Sheet
Amount
Off- Balance Sheet
Amount
On- Balance Sheet
Amount
Off- Balance Sheet
Amount
RWA RWA Density(ii)
Claims on Central Government and CBSL 26,489,626 - 26,489,626 - 843,054 3% 25,296,968 - 25,296,968 - 782,888 3%Claims on Foreign Sovereigns and their Central Banks - - - - - 0% - - - - - 0%Claims on Public Sector Entities - - - - - 0% - - - - - 0%Claims on Official Entities and Multilateral Development Banks - - - - - 0% - - - - - 0%Claims on Banks Exposures 4,411,651 36,974,802 4,411,651 769,380 2,105,080 41% 1,928,663 37,790,696 1,928,663 776,434 1,003,958 37%Claims on Financial Institutions 9,236,145 3,270,978 9,236,145 1,213,161 6,576,362 63% 13,229,173 3,845,670 13,229,173 1,172,885 7,529,533 52%Claims on Corporates 65,296,237 88,216,518 65,296,237 9,038,623 72,110,061 97% 56,399,275 77,972,305 56,399,275 7,516,188 61,183,314 96%Retail Claims 106,088,045 74,730,209 106,088,045 2,703,118 82,898,691 76% 111,221,643 70,572,055 111,221,643 2,635,431 87,169,949 77%Claims Secured by Residential Property 8,580,908 - 8,580,908 - 6,247,199 73% 8,793,378 - 8,793,378 - 6,279,153 71%Claims Secured by Commercial Real Estate 668,810 40,359 668,810 17,500 686,310 100% 894,721 56,198 894,721 25,898 920,619 100%Non-Performing Assets (NPAs)(i) 8,684,090 - 8,684,090 - 10,645,923 123% 5,640,268 - 5,640,268 - 7,526,209 133%Higher-risk Categories - - - - - 0% - - - - - 0%Cash Items and Other Assets 13,014,065 - 13,014,065 - 5,682,368 44% 15,681,660 - 15,681,660 - 8,127,836 52%Total 242,469,577 203,232,866 242,469,577 13,741,782 187,795,048 73% 239,085,750 190,236,924 239,085,750 12,126,835 180,523,460 72%
Note: (i) NPAs – As per Banking Act Directions on Classification of loans and advances, income recognition and provisioning. (ii) RWA Density – Total RWA/Exposures post CCF and CRM.

224
Nations Trust Bank PLC Annual Report 2019
RISK MANAGEMENT ANNEXURE
Table 7
Credit Risk under Standardised Approach: Exposures by Asset Classes and Risk Weights Description Bank Bank
LKR’000 as at 31-Dec-2019 (Post CCF & CRM) LKR’000 as at 31-Dec-2018 (Post CCF & CRM)Risk Weight Asset Classes 0% 20% 50% 60% 75% 100% 150% >150% Total Credit
Exposures Amount
0% 20% 50% 60% 75% 100% 150% >150% Total Credit Exposures
Amount
Claims on Central Government and Central Bank of Sri Lanka 22,274,355 4,215,271 - - - - - - 26,489,626 21,382,529 3,914,439 - - - - - - 25,296,968 Claims on Foreign Sovereigns and their Central Banks - - - - - - - - - - - - - - - - - - Claims on Public Sector Entities - - - - - - - - - - - - - - - - - - Claims on Official Entities and Multilateral Development Banks - - - - - - - - - - - - - - - - - - Claims on Banks Exposures - 3,399,791 712,144 - - 1,069,038 - - 5,180,972 - 1,276,193 1,360,318 - - 68,554 - - 2,705,065 Claims on Financial Institutions - 306,764 7,255,065 - - 2,887,476 - - 10,449,305 - 3,697,242 7,829,462 - - 2,875,354 - - 14,402,059 Claims on Corporates - 5,551 4,722,027 - - 69,323,483 281,310 - 74,332,371 - - 5,464,297 - - 58,446,261 - - 63,910,558 Retail Claims 339,334 68,819 - 2,642,807 97,763,842 7,976,362 - - 108,791,163 98,384 228,591 - 2,789,194 101,160,762 9,580,143 - - 113,857,074 Claims Secured by Residential Property - - 4,667,419 - - 3,913,489 - - 8,580,908 - - 5,028,450 - - 3,764,928 - - 8,793,378 Claims Secured by Commercial Real Estate - - - - - 686,310 - - 686,310 - - - - - 920,619 - - 920,619 Non-Performing Assets (NPAs) - - 240,849 - - 4,278,725 4,164,516 - 8,684,090 - - 49,507 - - 1,769,373 3,821,388 - 5,640,268 Higher-risk Categories - - - - - - - 25,803 25,803 - - - - - - - 25,803 25,803 Cash Items and Other Assets 5,865,018 1,833,320 - - - 5,554,133 - - 13,252,470 5,419,519 2,667,853 - - - 7,720,400 - - 15,807,771 Total 28,478,707 9,829,514 17,597,505 2,642,807 97,763,842 95,689,016 4,445,826 25,803 256,473,018 26,900,432 11,784,318 19,732,035 2,789,194 101,160,762 85,145,632 3,821,388 25,803 251,359,562
Description Group GroupLKR’000 as at 31-Dec-2019 (Post CCF & CRM) LKR’000 as at 31-Dec-2018 (Post CCF & CRM)
Risk Weight Asset Classes 0% 20% 50% 60% 75% 100% 150% >150% Total Credit Exposures
Amount
0% 20% 50% 60% 75% 100% 150% >150% Total Credit Exposures
Amount
Claims on Central Government and Central Bank of Sri Lanka 22,274,355 4,215,271 - - - - - - 26,489,626 21,382,529 3,914,439 - - - - - - 25,296,968 Claims on Foreign Sovereigns and their Central Banks - - - - - - - - - - - - - - - - - - Claims on Public Sector Entities - - - - - - - - - - - - - - - - - - Claims on Official Entities and Multilateral Development Banks - - - - - - - - - - - - - - - - - - Claims on Banks Exposures - 3,399,849 712,144 - - 1,069,038 - - 5,181,031 - 1,276,224 1,360,318 - - 68,554 - - 2,705,097 Claims on Financial Institutions - 306,764 7,255,065 - - 2,887,476 - - 10,449,305 - 3,697,242 7,829,462 - - 2,875,354 - - 14,402,059 Claims on Corporates - 5,551 4,722,027 - - 69,325,973 281,310 - 74,334,860 - - 5,464,297 - - 58,451,166 - - 63,915,463 Retail Claims 339,334 68,819 - 2,642,807 97,763,842 7,976,362 - - 108,791,163 98,384 228,591 - 2,789,194 101,160,762 9,580,143 - - 113,857,074 Claims Secured by Residential Property - - 4,667,419 - - 3,913,489 - - 8,580,908 - - 5,028,450 - - 3,764,928 - - 8,793,378 Claims Secured by Commercial Real Estate - - - - - 686,310 - - 686,310 - - - - - 920,619 - - 920,619 Non-Performing Assets (NPAs) - - 240,849 - - 4,278,725 4,164,516 - 8,684,090 - - 49,507 - - 1,769,373 3,821,388 - 5,640,268 Higher-risk Categories - - - - - - - - - - - - - - - - - - Cash Items and Other Assets 5,865,041 1,833,320 - - - 5,315,705 - - 13,014,065 5,419,542 2,667,853 - - - 7,594,266 - - 15,681,660 Total 28,478,730 9,829,573 17,597,505 2,642,807 97,763,842 95,453,077 4,445,826 - 256,211,359 26,900,455 11,784,350 19,732,035 2,789,194 101,160,762 85,024,403 3,821,388 - 251,212,585

225
NEXT GEN BANKING
Table 7
Credit Risk under Standardised Approach: Exposures by Asset Classes and Risk Weights Description Bank Bank
LKR’000 as at 31-Dec-2019 (Post CCF & CRM) LKR’000 as at 31-Dec-2018 (Post CCF & CRM)Risk Weight Asset Classes 0% 20% 50% 60% 75% 100% 150% >150% Total Credit
Exposures Amount
0% 20% 50% 60% 75% 100% 150% >150% Total Credit Exposures
Amount
Claims on Central Government and Central Bank of Sri Lanka 22,274,355 4,215,271 - - - - - - 26,489,626 21,382,529 3,914,439 - - - - - - 25,296,968 Claims on Foreign Sovereigns and their Central Banks - - - - - - - - - - - - - - - - - - Claims on Public Sector Entities - - - - - - - - - - - - - - - - - - Claims on Official Entities and Multilateral Development Banks - - - - - - - - - - - - - - - - - - Claims on Banks Exposures - 3,399,791 712,144 - - 1,069,038 - - 5,180,972 - 1,276,193 1,360,318 - - 68,554 - - 2,705,065 Claims on Financial Institutions - 306,764 7,255,065 - - 2,887,476 - - 10,449,305 - 3,697,242 7,829,462 - - 2,875,354 - - 14,402,059 Claims on Corporates - 5,551 4,722,027 - - 69,323,483 281,310 - 74,332,371 - - 5,464,297 - - 58,446,261 - - 63,910,558 Retail Claims 339,334 68,819 - 2,642,807 97,763,842 7,976,362 - - 108,791,163 98,384 228,591 - 2,789,194 101,160,762 9,580,143 - - 113,857,074 Claims Secured by Residential Property - - 4,667,419 - - 3,913,489 - - 8,580,908 - - 5,028,450 - - 3,764,928 - - 8,793,378 Claims Secured by Commercial Real Estate - - - - - 686,310 - - 686,310 - - - - - 920,619 - - 920,619 Non-Performing Assets (NPAs) - - 240,849 - - 4,278,725 4,164,516 - 8,684,090 - - 49,507 - - 1,769,373 3,821,388 - 5,640,268 Higher-risk Categories - - - - - - - 25,803 25,803 - - - - - - - 25,803 25,803 Cash Items and Other Assets 5,865,018 1,833,320 - - - 5,554,133 - - 13,252,470 5,419,519 2,667,853 - - - 7,720,400 - - 15,807,771 Total 28,478,707 9,829,514 17,597,505 2,642,807 97,763,842 95,689,016 4,445,826 25,803 256,473,018 26,900,432 11,784,318 19,732,035 2,789,194 101,160,762 85,145,632 3,821,388 25,803 251,359,562
Description Group GroupLKR’000 as at 31-Dec-2019 (Post CCF & CRM) LKR’000 as at 31-Dec-2018 (Post CCF & CRM)
Risk Weight Asset Classes 0% 20% 50% 60% 75% 100% 150% >150% Total Credit Exposures
Amount
0% 20% 50% 60% 75% 100% 150% >150% Total Credit Exposures
Amount
Claims on Central Government and Central Bank of Sri Lanka 22,274,355 4,215,271 - - - - - - 26,489,626 21,382,529 3,914,439 - - - - - - 25,296,968 Claims on Foreign Sovereigns and their Central Banks - - - - - - - - - - - - - - - - - - Claims on Public Sector Entities - - - - - - - - - - - - - - - - - - Claims on Official Entities and Multilateral Development Banks - - - - - - - - - - - - - - - - - - Claims on Banks Exposures - 3,399,849 712,144 - - 1,069,038 - - 5,181,031 - 1,276,224 1,360,318 - - 68,554 - - 2,705,097 Claims on Financial Institutions - 306,764 7,255,065 - - 2,887,476 - - 10,449,305 - 3,697,242 7,829,462 - - 2,875,354 - - 14,402,059 Claims on Corporates - 5,551 4,722,027 - - 69,325,973 281,310 - 74,334,860 - - 5,464,297 - - 58,451,166 - - 63,915,463 Retail Claims 339,334 68,819 - 2,642,807 97,763,842 7,976,362 - - 108,791,163 98,384 228,591 - 2,789,194 101,160,762 9,580,143 - - 113,857,074 Claims Secured by Residential Property - - 4,667,419 - - 3,913,489 - - 8,580,908 - - 5,028,450 - - 3,764,928 - - 8,793,378 Claims Secured by Commercial Real Estate - - - - - 686,310 - - 686,310 - - - - - 920,619 - - 920,619 Non-Performing Assets (NPAs) - - 240,849 - - 4,278,725 4,164,516 - 8,684,090 - - 49,507 - - 1,769,373 3,821,388 - 5,640,268 Higher-risk Categories - - - - - - - - - - - - - - - - - - Cash Items and Other Assets 5,865,041 1,833,320 - - - 5,315,705 - - 13,014,065 5,419,542 2,667,853 - - - 7,594,266 - - 15,681,660 Total 28,478,730 9,829,573 17,597,505 2,642,807 97,763,842 95,453,077 4,445,826 - 256,211,359 26,900,455 11,784,350 19,732,035 2,789,194 101,160,762 85,024,403 3,821,388 - 251,212,585

226
Nations Trust Bank PLC Annual Report 2019
Table 8
Market Risk under Standardised Measurement Method
Item Bank GroupRWA (LKR’000) RWA (LKR’000)
31-Dec-2019 31-Dec-2018 31-Dec-2019 31-Dec-2018
(a) RWA for Interest Rate Risk 887,576 703,460 887,576 703,460 General Interest Rate Risk 887,576 703,460 887,576 703,460 (i) Net Long or Short Position 887,576 703,460 887,576 703,460 (ii) Horizontal Disallowance - - - - (iii) Vertical Disallowance - - - - (iv) Options - - - - Specific Interest Rate Risk - - - - (b) RWA for Equity - - - - (i) General Equity Risk - - - - (ii) Specific Equity Risk - - - - (c) RWA for Foreign Exchange & Gold 23,962 7,756 23,962 7,756 Capital Charge for Market Risk [(a) + (b) + (c)] * CAR 7,292,301 5,989,190 7,292,301 5,989,190
Table 9
Operational Risk under Basic Indicator Approach/ The Standardised Approach/ The Alternative Standardised Approach
Business Lines BankCapital Charge Factor
Fixed Factor
Gross Income (LKR’000)as at 31-Dec-2019
Capital Charge Factor
Fixed Factor
Gross Income (LKR’000)as at 31-Dec-2018
1st Year 2nd Year 3rd Year 1st Year 2nd Year 3rd Year
The Basic Indicator Approach 15% 17,622,084 21,254,398 22,191,304 15% 13,217,045 17,622,084 21,023,282The Standardised Approach - - - - - - Corporate Finance 18% - - - 18% - - - Trading and Sales 18% - - - 18% - - - Payment and Settlement 18% - - - 18% - - - Agency Services 15% - - - 15% - - - Asset Management 12% - - - 12% - - - Retail Brokerage 12% - - - 12% - - - Retail Banking 12% - - - 12% - - - Commercial Banking 15% - - - 15% - - - The Alternative Standardised Approach - - - - - - Corporate Finance 18% - - - 18% - - - Trading and Sales 18% - - - 18% - - - Payment and Settlement 18% - - - 18% - - - Agency Services 15% - - - 15% - - - Asset Management 12% - - - 12% - - - Retail Brokerage 12% - - - 12% - - - Retail Banking 12% 0.035 - - - 12% 0.035 - - - Commercial Banking 15% 0.035 - - - 15% 0.035 - - - Capital Charges for Operational Risk (LKR’000)The Basic Indicator Approach 3,053,389 2,593,121 The Standardised Approach - - The Alternative Standardised Approach - - Risk Weighted Amount for Operational Risk (LKR’000)The Basic Indicator Approach 24,427,115 21,836,805 The Standardised Approach - - The Alternative Standardised Approach - -
RISK MANAGEMENT ANNEXURE

227
NEXT GEN BANKING
Table 9 (Contd.)
Operational Risk under Basic Indicator Approach/ The Standardised Approach/ The Alternative Standardised Approach
Business Lines GroupCapital Charge Factor
Fixed Factor
Gross Income (LKR’000)as at 31-Dec-2019
Capital Charge Factor
Fixed Factor
Gross Income (LKR’000)as at 31-Dec-2018
1st Year 2nd Year 3rd Year 1st Year 2nd Year 3rd Year
The Basic Indicator Approach 15% 16,913,568 21,309,585 22,552,135 15% 13,519,915 16,913,568 21,078,467The Standardised Approach - - - - - - Corporate Finance 18% - - - 18% - - - Trading and Sales 18% - - - 18% - - - Payment and Settlement 18% - - - 18% - - - Agency Services 15% - - - 15% - - - Asset Management 12% - - - 12% - - - Retail Brokerage 12% - - - 12% - - - Retail Banking 12% - - - 12% - - - Commercial Banking 15% - - - 15% - - - The Alternative Standardised Approach - - - - - - Corporate Finance 18% - - - 18% - - - Trading and Sales 18% - - - 18% - - - Payment and Settlement 18% - - - 18% - - - Agency Services 15% - - - 15% - - - Asset Management 12% - - - 12% - - - Retail Brokerage 12% - - - 12% - - - Retail Banking 12% 0.035 - - - 12% 0.035 - - - Commercial Banking 15% 0.035 - - - 15% 0.035 - - - Capital Charges for Operational Risk (LKR’000)The Basic Indicator Approach 3,038,764 2,575,598 The Standardised Approach - - The Alternative Standardised Approach - - Risk Weighted Amount for Operational Risk (LKR’000)The Basic Indicator Approach 24,310,115 21,689,242 The Standardised Approach - - The Alternative Standardised Approach - -

228
Nations Trust Bank PLC Annual Report 2019
Table 10 Differences between Accounting and Regulatory Scopes and Mapping of Financial Statement Categories with Regulatory Risk Categories
Bank LKR ‘000 as at 31-Dec-2019a b c d e
Carrying Values as Reported in Published
Financial Statements
Carrying Values under Scope of Regulatory
Reporting
Subject to Credit Risk Framework
Subject to Market Risk Framework
Not subject to Capital Requirements or
Subject to Deduction from Capital
Assets 325,040,079 324,150,411 241,457,723 38,469,075 45,171,643 Cash and Cash Equivalents 8,755,848 6,655,029 6,655,029 - - Balances with Central Banks 8,377,478 8,220,448 8,220,448 - - Placements with Banks 13,827,423 16,057,000 2,257,000 - 13,800,000 Derivative Financial Instruments 192,714 - - - - Financial Assets - Recognised through Profit or Loss 634,075 38,469,075 - 38,469,075 - Financial Assets Designated at Fair Value through Profit or Loss - - - - - Loans and Receivables to Banks - - - - - Financial Assets at Amortised Cost – Loans and Advances 226,791,569 226,084,188 197,052,087 - 29,980,131 Financial Assets at Fair Value through Other Comprehensive Income 38,315,147 - - - - Financial Assets at Amortised Cost - Debt Instruments 19,062,606 18,621,840 18,621,840 - - Investments in Subsidiaries 678,710 678,710 678,710 - - Investments in Associates and Joint Ventures - - - - - Property, Plant and Equipment 4,894,505 3,069,684 3,069,684 - - Investment Properties - - - - - Goodwill and Intangible Assets 1,375,581 - - - - Other Assets 2,134,422 6,294,437 4,902,925 - 1,391,512 Liabilities 294,696,761 294,543,818 - - - Due to Banks 6,484,157 12,873,100 - - - Derivative Financial Instruments 311,971 - - - - Other Financial Liabilities Held-For- Trading - - - - - Financial Liabilities Designated at Fair Value Through Profit or Loss - - - - - Due to Depositors 226,880,034 221,709,349 - - - Due to Other Borrowers 38,413,725 29,865,862 - - - Debt Securities Issued - - - - - Current Tax Liabilities 1,337,499 - - - - Deferred Tax Liabilities 995,073 - - - - Other Provisions - - - - - Other Liabilities 7,010,868 17,095,508 - - - Due to Subsidiaries - - - - - Subordinated Term Debts 13,263,434 13,000,000 - - - Off-Balance Sheet Liabilities 199,355,131 212,042,142 208,032,991 - 4,009,151 Guarantees 624,094 624,094 624,094 - - Performance Bonds 17,405,062 17,405,062 15,336,411 - 2,068,651 Letters of Credit 7,758,860 7,758,860 6,976,027 - 782,833 Other Contingent Items 3,536,649 3,536,649 3,536,649 - - Undrawn Loan Commitments 130,989,966 132,053,172 132,053,172 - - Other Commitments 39,040,500 50,664,305 49,506,637 - 1,157,667 Shareholders' EquityEquity Capital (Stated Capital)/Assigned Capital 9,408,135 9,408,134 - - - of which Amount Eligible for CET1 9,408,135 9,408,135 - - - of which Amount Eligible for AT1 - - - - - Retained Earnings 18,465,483 18,999,328 - - (510,627)Accumulated Other Comprehensive Income 301,976 - - - - Other Reserves 2,167,723 1,199,130 - - 458,555 Total Shareholders' Equity 30,343,317 29,606,593 - - (52,072)
Notes: 1) Differences in Cash and Cash Equivalents, Financial Assets - Recongnised through Profit or Loss, Financial Assets at Amortised Cost – Loans and Advances, Financial
Assets at Amortised Cost - Debt Instruments, Property, Plant and Equipment, Other Assets, Due to Banks, Due to Depositors, Due to Other Borrowers, Subordinated Term Debts and Other Liabilities is due to Classification differences and adjustments to published financial statements subsequently.
2) Difference in Retained Earnings is due to profit difference in SLAS and SLFRS accounting standards and Revaluation Reserve classification differences.3) Accumulated Other Comprehensive Income is not considered in (b) as it is based on SLAS accounting standards. 4) Differences in Other Commitments is due to Notional Value of Derivative contracts reported in Published Financial Statements (a) and Carrying Value reported in
Regulatory Reporting (b).
RISK MANAGEMENT ANNEXURE
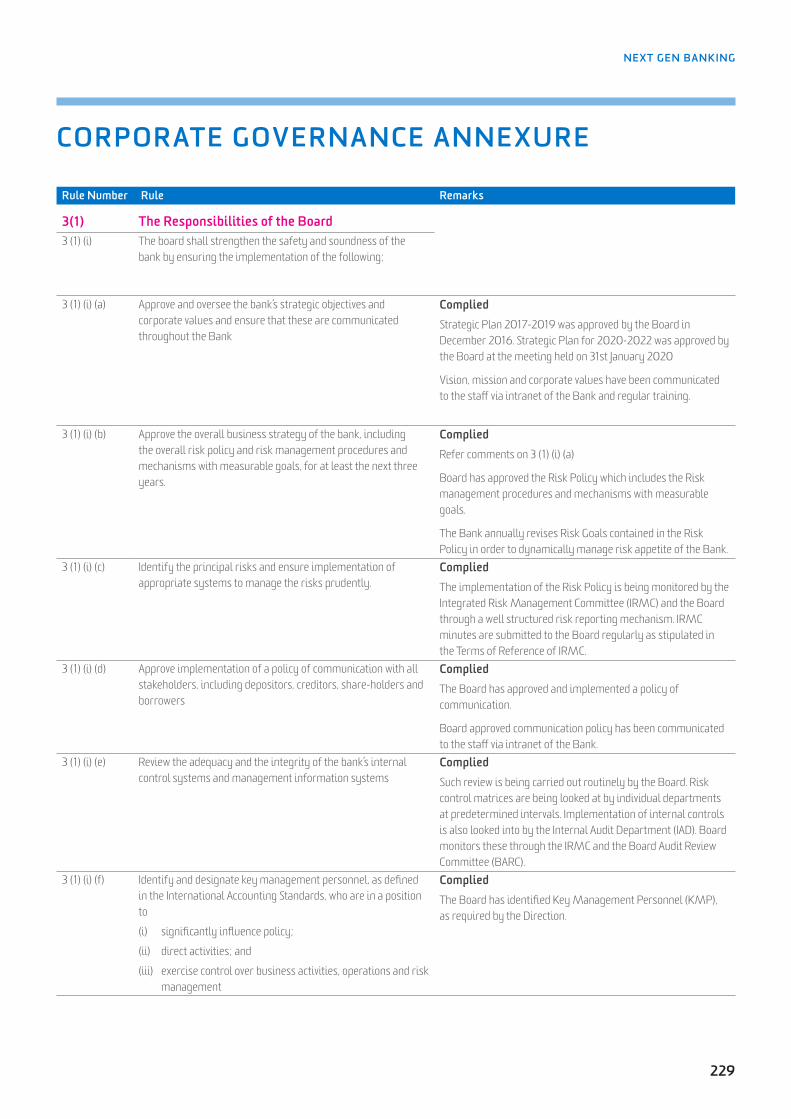
229
NEXT GEN BANKING
CORPORATE GOVERNANCE ANNEXURE
Rule Number Rule Remarks
3(1) The Responsibilities of the Board 3 (1) (i) The board shall strengthen the safety and soundness of the
bank by ensuring the implementation of the following;
3 (1) (i) (a) Approve and oversee the bank’s strategic objectives and corporate values and ensure that these are communicated throughout the Bank
CompliedStrategic Plan 2017-2019 was approved by the Board in December 2016. Strategic Plan for 2020-2022 was approved by the Board at the meeting held on 31st January 2020
Vision, mission and corporate values have been communicated to the staff via intranet of the Bank and regular training.
3 (1) (i) (b) Approve the overall business strategy of the bank, including the overall risk policy and risk management procedures and mechanisms with measurable goals, for at least the next three years.
CompliedRefer comments on 3 (1) (i) (a)
Board has approved the Risk Policy which includes the Risk management procedures and mechanisms with measurable goals.
The Bank annually revises Risk Goals contained in the Risk Policy in order to dynamically manage risk appetite of the Bank.
3 (1) (i) (c) Identify the principal risks and ensure implementation of appropriate systems to manage the risks prudently.
CompliedThe implementation of the Risk Policy is being monitored by the Integrated Risk Management Committee (IRMC) and the Board through a well structured risk reporting mechanism. IRMC minutes are submitted to the Board regularly as stipulated in the Terms of Reference of IRMC.
3 (1) (i) (d) Approve implementation of a policy of communication with all stakeholders, including depositors, creditors, share-holders and borrowers
CompliedThe Board has approved and implemented a policy of communication.
Board approved communication policy has been communicated to the staff via intranet of the Bank.
3 (1) (i) (e) Review the adequacy and the integrity of the bank’s internal control systems and management information systems
CompliedSuch review is being carried out routinely by the Board. Risk control matrices are being looked at by individual departments at predetermined intervals. Implementation of internal controls is also looked into by the Internal Audit Department (IAD). Board monitors these through the IRMC and the Board Audit Review Committee (BARC).
3 (1) (i) (f) Identify and designate key management personnel, as defined in the International Accounting Standards, who are in a position to
(i) significantly influence policy;
(ii) direct activities; and
(iii) exercise control over business activities, operations and risk management
CompliedThe Board has identified Key Management Personnel (KMP), as required by the Direction.

230
Nations Trust Bank PLC Annual Report 2019
CORPORATE GOVERNANCE ANNEXURE
Rule Number Rule Remarks
3 (1) (i) (g) Define the areas of authority and key responsibilities for the board directors themselves and for the Key Management Personnel
CompliedMatters reserved for the Board are specifically identified and approved by the Board.
Areas of authority and key responsibilities of the other KMP are included in the respective job descriptions
3 (1) (i) (h) Ensure that there is appropriate oversight of the affairs of the bank by key management personnel, that is consistent with board policy
CompliedOversight of affairs of the Bank is carried out through a Board sub Committee, namely Board Supervisory Committee (BSC) where all KMPs present their performance and make themselves available for any clarifications and explanations required by the BSC members. Board monitors this through the minutes of the BSC.
KMP also communicate to the Board via the monthly management report submitted to the Board of Directors.
KMP make regular presentations to the Board on matters under their purview and are also called in by the Board to explain matters relating to their areas.
KMP responsible for internal controls and compliance attend every IRMC meeting.
Board has delegated the function of overseeing IAD to BARC.
Board exercise oversight of the affairs of the Bank by KMP through the minutes of the meetings of the IRMC, BARC and Assets and Liabilities Management Committee (ALCO) tabled at Board meetings.
3 (1) (i) (i) Periodically assess the effectiveness of the board of directors’ own governance practices, including
(i) the selection, nomination and election of directors and key management personnel;
(ii) the management of conflicts of interests and
(iii) the determination of weaknesses and implementation of changes where necessary.
CompliedThe Board appraises its performance annually by using the Board of Directors self assessment questionnaire. Every Director is required to complete the questionnaire which aims to obtain Directors’ feedback on the Board’s performance on many aspects. The responses received from the Directors are reviewed by the Senior Director and discussed at the Board meeting.
3 (1) (i) (j) Ensure that the bank has an appropriate succession plan for key management personnel.
CompliedA comprehensive succession planning process is undertaken for KMP. The process involves identification of senior officers and grooming them to take over Corporate Management positions.
Succession Plan for KMP has been approved by the Board.
Human Resources Department is vested with the responsibility of revising and keeping the succession planning process up to date.
Succession at Board levels is ensured through maintaining the Board composition at a level higher than the statutorily required minimum number. This permits the Board to carefully fill any sudden vacancy created without an adverse impact on the functionality.

231
NEXT GEN BANKING
Rule Number Rule Remarks
3 (1) (i) (k) Meet regularly, on a needs basis, with the key management personnel to review policies, establish communication lines and monitor progress towards corporate objectives
CompliedRefer comment on 3 (1) (i) (h) above
3 (1) (i) (l) Understand the regulatory environment and ensure that the bank maintains an effective relationship with regulators.
CompliedThe Company Secretary is statutorily responsible for communications with the Registrar of Companies. This is included in the JD of the Company Secretary.
Maintaining an effective relationship with the regulators is carried out through diligent compliance with applicable rules and regulations. This is included in the JD of the Compliance Officer.
The Board is updated of the changes in the regulatory environment by the relevant KMP at the Board subcommittee and Board levels which discusses/endorses the steps taken to comply which such changes as appropriate.
Compliance with statutory regulations is monitored regularly by the Board. The Compliance Officer of the Bank submits a monthly compliance report which covers all returns submitted to the regulators. A monthly report is submitted to the IRMC by the Compliance Officer capturing interactions with the Regulators and actions to be taken on new regulations.
3 (1) (i) (m) Exercise due diligence in the hiring and oversight of external auditors
CompliedBoard has delegated this function to the BARC. TOR of the BARC contains provisions for hiring and oversight of External Auditors. The appointment of the External Auditor is made at the Annual General Meeting.
3 (1) (ii) The Board shall appoint the chairman and the chief executive officer and define and approve the functions and responsibilities of the chairman and the chief executive officer in line with direction 3 (5) of these Directions.
CompliedFunctions and the responsibilities of the Chairman and the CEO have been defined and approved by the Board. Chairman’s functions and responsibilities are distinct from those of the CEO.
Board procedure3 (1)(iii) The Board shall meet regularly and board meetings shall be
held at least twelve times a year at approximately monthly intervals. Such regular board meetings shall normally involve active participation in person of a majority of directors entitled to be present.
Obtaining the board’s consent through the circulation of written resolutions/papers shall be avoided as far as possible.
CompliedBoard met 13 times in the year on a monthly basis which includes two meetings held in the month of September. All Directors actively participate at such meetings. Any concern or comment by such directors requiring action is minuted.
Approval of the Board by circular resolutions has been kept to a minimum and resorted to only where necessary.
3 (1) (iv) The board shall ensure that arrangements are in place to enable all directors to include matters and proposals in the agenda for regular board meetings where such matters and proposals relate to the promotion of business and the management of risks of the bank.
CompliedApproved Board procedure includes a provision to indicate that all Directors are entitled to include such matters and proposals in the agenda for Board Meetings. Also monthly meetings are scheduled and informed to the Board at the beginning of each year to facilitate this.

232
Nations Trust Bank PLC Annual Report 2019
Rule Number Rule Remarks
3(1) (v) The Board procedures shall ensure that notice of at least 7 days is given of a regular board meeting to provide all directors an opportunity to attend. For all other board meetings, reasonable notice may be given.
CompliedThe Board Procedure, provides that the schedule of dates of meetings for the year is approved by the Board at, or before the, first Board meeting of the year and such approved schedule is notified to every Director thereby giving more than 7 days notice.
Any change to the schedule shall be notified to the Directors at least 7 days prior to the date of the meeting.
Board procedure further provides that any meeting other than that contained in the schedule shall be given 7 days prior notice unless all the directors agree to meet at a shorter notice.
3 (1) (vi) The Board procedures shall ensure that a director, who has not attended at least two-thirds of the meetings in the period of 12 months immediately preceding or has not attended the immediately preceding three consecutive meetings held, shall cease to be a Director. Participation at the directors’ meetings through an alternate director shall, however, be acceptable as attendance.
CompliedThe Board procedure contains a similar provision.
Details of the Directors attendance is set out on Page 56 of the Annual Report, 2019.
No director has violated this requirement during the financial year 2019.
3(1)(vii) The Board shall appoint a company secretary who satisfies the provisions of section 43 of the Banking Act No.30 of 1988, whose primary responsibilities shall be to handle the secretariat services to the board and shareholder meetings and to carry out other functions specified in the statutes and other regulations.
CompliedThe Company Secretary who is an Attorney-at-Law satisfies the provisions contained in Section 43 of the Banking Act.
JD of the Company Secretary includes the responsibilities to handle the secretariat services to the Board and shareholder meetings and carry out other functions specified in the statutes and other regulations.
3(1) (viii) All directors shall have access to advise and services of the company secretary with a view to ensure that board procedures and all applicable rules and regulations are followed.
CompliedAll Directors have access to the advice and services of the Company Secretary.
Board Procedure provides for same.
3 (1) (ix) The company secretary shall maintain the minutes of Board meetings and such minutes shall be open for inspection at any reasonable time, on reasonable notice by any director.
CompliedBoard minutes are maintained by the Company Secretary. The Board Procedure also provides for same. The Directors have access to the Board papers and minutes through a secure electronic link.
CORPORATE GOVERNANCE ANNEXURE

233
NEXT GEN BANKING
Rule Number Rule Remarks
3(1)(x) Minutes of Board meetings shall be recorded in sufficient detail so that it is possible to gather from the minutes, as to whether the board acted with due care and prudence in performing its duties.
The minutes shall serve as a reference for regulatory and supervisory authorities to assess the depth of deliberations at the board meetings. Therefore the minutes of a board meeting shall clearly contain or refer to the following;
(a) A summary of data and information used by the Board in its deliberations
(b) The matters considered by the board
(c) The fact finding discussions and the issues of contention or dissent which may illustrate whether the Board was carrying out its duties with due care and prudence.
(d) The testimonies and confirmations of relevant executives which indicate compliance with the Board’s strategies and policies and adherence to relevant laws and regulations
(e) The Board’s knowledge and understanding of the risks to which the bank is exposed and an overview of the risk management measures adopted
(f) The decisions and board resolutions.
CompliedMinutes of Board meetings are recorded in sufficient detail to enable a proper assessment to be made of the depth of deliberations at the meetings.
Every paper submitted to the Board seeking approval of the Board contains recommendations from the executive management and also discloses a reasonable basis for making such recommendations.
Minutes will refer to the paper which contains the data and opinions relied on by the Board and also contain any other matter considered by the Board outside what is contained in the paper if any. Minutes are to be read with the relevant board paper. Reference of the paper considered is included in the minute.
The Board procedure also provides for the contents of the Board minutes.
3 (1) (xi) There shall be a procedure agreed by the Board to enable directors, upon reasonable request, to seek independent professional advise in appropriate circumstances, at the bank’s expense.
The Board shall resolve to provide separate independent professional advice to directors to assist the relevant director or directors to discharge his/her/their duties to the bank.
CompliedApproved Board procedure includes a provision to enable the Directors to seek independent professional advice at the Bank’s expense.
3(1)(xii) Directors shall avoid conflicts of interests, or the appearance of conflicts of interests, in their activities with, and commitments to, other organizations or related parties.
If a director has a conflict of interest in a matter to be considered by the board, which the board has determined to be material, the matter should be dealt with at a board meeting, where independent Non-Executive directors [refer to direction 3(2)(iv) of these Directions] who have no material interest in the transaction, are present.
Further a director shall abstain from voting on any board resolution in relation to which he/she or any of his/her close relation or a concern in which a director has substantial interest, is interested, and he/she shall not be counted in the quorum for the relevant agenda item at the board meeting.
CompliedBoard procedure specifically addresses avoidance of conflicts of interest.
Board has made a determination as to what should be considered as material and such matters have been dealt by the Board as required by the Rule. Directors abstain from participating in the discussions, voicing their opinion or approving in situations where there is a conflict of interest. Board minutes provide evidence of compliance.
3(1)(xiii) The board shall have a formal schedule of matters specifically reserved to it for decision to ensure that the direction and control of the bank is firmly under its authority.
CompliedThere is a schedule of matters reserved for Board approval which has been approved by the Board.

234
Nations Trust Bank PLC Annual Report 2019
Rule Number Rule Remarks
3 (1) (xiv) The board shall, if it considers that the bank is, or is likely to be, unable to meet its obligations or is about to become insolvent or is about to suspend payments due to depositors and other creditors, forthwith inform the Director of Bank Supervision of the situation of the bank prior to taking any decision or action.
CompliedSuch a situation has not arisen. Board is furnished with sufficient information on a regular basis to enable the Board to act in the required manner if such a situation arises.
Board has also approved and put in place a robust ALCO mechanism that would keep the liquidity position under control.
IRMC discusses in detail the Key Risk Goals at each IRMC meeting and the minutes of the IRMC are submitted to the Board.
3 (1) (xv) The board shall ensure that the bank is capitalized at levels as required by the Monetary Board in terms of the capital adequacy ratio and other prudential grounds.
CompliedThe Bank is in compliance with regulatory and prudential requirements relating to capital adequacy. Capital Adequacy Ratios are submitted to the Board quarterly. IRMC also monitors this on a monthly basis through Key Risk Goals.
3 (1) (xvi) The Board shall publish in the Bank’s Annual Report, an annual corporate governance report setting out the compliance with Direction 3 of these Directions.
CompliedReport is published in page 54 of the Annual Report of 2019.
3 (1) (xvii) The board shall adopt a scheme of self assessment to be undertaken by each director annually and maintain records of such assessments.
CompliedThe Board appraises its performance by using the Board evaluation form which is filled by each director in relation to business strategy and contributions of Board members based on their field of expertise, annually. The responses are collated and reviewed by the Senior Director and discussed at the Board meeting.
The records of these assessments are maintained with the Company Secretary.
3 (2) The Board’s composition3(2)(i) The number of directors on the board shall not be less than 7
and not more than 13CompliedBoard composition was in compliance with this requirement throughout the year.
3(2)(ii)(A) The total period of service of a Director other than a director who holds the position of chief executive officer shall not exceed nine years.
CompliedNo Director served for a period exceeding Nine years during the year.
3(2)(iii) An employee of a bank may be appointed, elected or nominated as a director of the bank (hereinafter referred to as an ‘executive director’) provided that the number of executive directors shall not exceed one-third of the number of directors of the board. In such an event, one of the executive directors shall be the chief executive officer of the bank.
CompliedThe Board consisted of twelve directors with one Executive Director and eleven Non-Executive Directors as at 31st December, 2019. Number of Executive Directors has not exceeded the specified number at any time during the year.
CORPORATE GOVERNANCE ANNEXURE

235
NEXT GEN BANKING
Rule Number Rule Remarks
3(2)(iv) The board shall have at least three independent Non-Executive directors or one third of the total number of directors, whichever is higher. This sub direction shall be applicable from January 1st, 2010 onwards.
A Non-Executive director shall not be considered independent if he/she;
a) has direct and indirect shareholding of more than 1% of the bank;
b) currently has or had during the period of two years immediately preceding his/her appointment as director, any business transactions with the bank as described in Direction 3 (7) hereof, exceeding 10% of the regulatory capital of the bank;
c) has been employed by the bank during the two year period immediately preceding the appointment as director
d) has a close relation who is a director or chief executive officer or a member of key management personnel or a material shareholder of the bank or another bank. For this purpose a ‘close relation’ shall mean the spouse or a financially dependent child;
e) represents a specific stakeholder of the bank
f) is an employee or a director or a material shareholder in a company or business organization;
1. which currently has a transaction with the bank as defined in Direction 3(7) of these Directions, exceeding 10% of the regulatory capital of the bank, or
11. in which any of the other directors of the bank are employed or are directors or are material shareholders; or
111. in which any of the other directors of the bank have a transaction as defined in Direction 3(7) of these Directions, exceeding 10% of regulatory capital in the bank.
CompliedThe Bank had five Independent Non-Executive Directors throughout the year thus complies with the requirement.
The Board determined the independent and non-independent status of the Non-Executive Directors based on the declarations submitted by them in accordance with the criteria defined in this direction.
3 (2) (v) In the event an alternate director is appointed to represent an independent director, the person so appointed shall also meet the criteria that applies to the independent director.
Not ApplicableNo alternate director has been appointed during the year.
3(2)(vi) Non-Executive directors shall be persons with credible track records and/or have necessary skills and experience to bring an independent judgment to bear on issues of strategy, performance and resources.
CompliedDirectors possess qualifications and experience to meet the criteria specified in the Rule. Brief profiles of the Directors are given on pages 12 to 15 of the Annual Report, 2019.
Directors nominate names of eminent professionals or academics from various disciplines to the Board Nomination Committee which peruse the profiles and recommends suitable candidates to the Board.
Central Bank approval is also obtained for all new appointments and for continuing directors, annually.

236
Nations Trust Bank PLC Annual Report 2019
Rule Number Rule Remarks
3(2)(vii) A meeting of the board shall not be duly constituted, although the number of directors required to constitute the quorum at such meeting is present, unless more than one half of the number of directors present at such meeting are Non-Executive directors. This sub direction shall be applicable from January 1, 2010 onwards.
CompliedAll meetings of the Board held during the year have been attended by a majority of Non-Executive Directors.
3 (2) (viii) The Independent non-executive directors shall be expressly identified as such in all corporate communications that disclose the names of directors of the bank. The bank shall disclose the composition of the board, by category of directors, including the names of the chairman, executive directors, Non-Executive directors and independent Non-Executive directors in the annual corporate governance report.
CompliedComposition of the Board, including the names of the Chairman, Executive Directors, Non-Executive Directors and Independent Non- Executive directors are disclosed in page 58 of the Annual Report, 2019.
3 (2) (ix) There shall be a formal, considered and transparent procedure for the appointment of new directors to the board. There shall also be procedures in place for the orderly succession of appointments to the board.
CompliedA Board composition and succession plan is in place. All appointments are considered and approved by the Nomination Committee and by the full Board thereafter in addition to obtaining approval from the Central Bank of Sri Lanka.
3 (2) (x) All directors appointed to fill a casual vacancy shall be subject to election by shareholders at the first general meeting after their appointment.
CompliedMr. Arjun Fernando who was appointed to the Board in January 2019 was elected at the AGM held in March 2019. No further appointments were made during the year.
3(2)(xi) If a director resigns or is removed from office, the board shall :
(a) announce the director’s resignation or removal and the reasons for such removal or resignation including but not limited to information relating to the relevant director’s disagreement with the bank, if any; and
(b) issue a statement confirming whether or not there are any matters that need to be brought to the attention of shareholders.
Complied One Director retired from the Board during the year. Necessary formalities as required by the Rule have been complied with.
3(2)(xii) A director or an employee of a bank shall not be appointed, elected or nominated as a director of another bank except where such bank is a subsidiary company or an associate company of the first mentioned bank.
CompliedBased on the quarterly declarations submitted by individual directors in the year 2019, no director is a Director of another Bank.
Letter of appointment of employees includes a clause which stipulates that an employee shall not have any dealing with any other financial institution.
3(3) Criteria to assess the fitness and propriety of directors In addition to provisions of Section 42 of the Banking Act No.30 of 1988, the criteria set out below shall apply to determine the fitness and propriety of a person who serves or wishes to serve as a director of a bank. Non-compliance with any one of the criteria as set out herein shall disqualify a person to be appointed, elected or nominated as a director or to continue as a director.
CORPORATE GOVERNANCE ANNEXURE

237
NEXT GEN BANKING
Rule Number Rule Remarks
3(3) (i) The age of a person who serves as a director shall not exceed 70 years.
There are no directors on the Board of the Bank who are over 70 years of age.
3(3)(ii) A person shall not hold office as a director of more than 20 companies/entities/institutions inclusive of subsidiaries or associate companies of the bank.
CompliedNo director of the Bank holds Directorships in more than 20 companies.
3(3)(iii) A Director or a Chief Executive Officer of a licensed bank operating in Sri Lanka shall not be appointed as a Director or a Chief Executive Officer of another licensed bank operating in Sri Lanka before the expiry of a period of 6 months from the date of cessation of his/her office at the licensed bank in Sri Lanka. Any variation thereto in exceptional situations such as where expertise of retiring bankers may be required when reconstituting Boards of licensed banks which need restructuring, shall be subject to the prior approval of the Monetary Board. In this regard, licensed banks shall ensure to adhere to the requirement of the cooling-off period when appointing Directors or Chief Executive Officer. If a Director is appointed to the licensed bank by an appointing authority violating these Directions, the licensed bank shall take steps to prevent such appointee from exercising any powers or enjoying any privileges or benefits.
CompliedOne Director was appointed during the year and he has not functioned as a Director of another licensed bank during last six months prior to his appointment. No change to the position Chief Executive Officer during the year.
3 (4) Management functions delegated by the Board3 (4) (i) The directors shall carefully study and clearly understand the
delegation arrangements in placeCompliedBoard Procedure includes a provision for delegation of powers by the Board. Board has delegated matters pertaining to the affairs of the Bank to the Board sub committees within the scope of the respective Board approved Terms of Reference. All delegations have been done by the Board after due consideration.
3 (4) (ii) The board shall not delegate any matters to a board committee, chief executive officer, executive directors or key management personnel, to an extent that such delegation would significantly hinder or reduce the ability of the board as a whole to discharge its functions.
CompliedRefer comment on 3.4.(i) above.
3 (4) (iii) The board shall review the delegation process in place on a periodic basis to ensure that they remain relevant to the needs of the bank.
CompliedAs and when new requirements have arisen, the Board has reviewed and amended delegation arrangements based on the recommendations made by the management.
3 (5) The Chairman and the Chief Executive Officer3 (5) (i) The roles of the chairman and the chief executive officer shall be
separate and shall not be performed by the same individual.CompliedRoles of the Chairman and the CEO are separated and held by two separate individuals. Chairman provides leadership to the Board while the CEO manages the day to day operations of the Bank giving effect to the strategies and policies approved by the Board.

238
Nations Trust Bank PLC Annual Report 2019
Rule Number Rule Remarks
3 (5) (ii) The chairman shall be a Non-Executive director and preferably an independent director as well.
In the case where the Chairman is not an independent director, the board shall designate an Independent Director as the Senior Director with suitably documented terms of reference to ensure a greater independent element.
The designation of the Senior Director shall be disclosed in the bank’s Annual Report.
CompliedMr. Gihan Cooray, a Non-Executive Director is the Chairman as at 31st December, 2019. An Independent Non-Executive Director Mr. Murtaza Jafferjee functioned as the Senior Director during the year till his retirement on 15th December, 2019. Independent Director Mr. J C A D’souza was appointed as the Senior Director with effect from 16th December 2019. Terms of Reference of the Senior Director is approved by the Board.
The designation of the Senior Director has been disclosed in the Annual Report, 2019.
3 (5) (iii) The board shall disclose in its corporate governance report, which shall be an integral part of its Annual Report, the identity of the chairman and the chief executive officer and the nature of the relationship [including financial, business, family or other material/relevant relationship (s), if any], between the chairman and the chief executive officer and the relationships among members of the board.
CompliedThe identity of the Chairman and the Chief Executive Officer and the absence of a relationship between the two persons are disclosed in the Annual Report 2019. No relationship exists amongst the members of the Board other than in respect of the following:
• Directors Mr. Gihan Cooray and Ms. Sherin Cader were nominated to the Board by the Bank's material shareholder John Keells Holdings PLC.
• Directors Mr. Suran Wijesinghe, Mr. Prasanna De Silva and Mr. Arjun Fernando were nominated to the Board by the Bank's material shareholder Central Finance Company PLC.
3 (5) (iv) The chairman shall;
(a) provide leadership to the board
(b) ensure that the board works effectively and discharges its responsibilities; and
(c) ensure that all key and appropriate issues are discussed by the board in a timely manner.
CompliedThese are considered as the three key responsibilities of the Chairman and included in the ‘Functions of the Chairman and the CEO’ approved by the Board.
The requirement is further covered by the self evaluation process of the Board.
3 (5) (v) The chairman shall be primarily responsible for drawing up and approving the agenda for each board meeting, taking into account where appropriate, any matters proposed by the other directors for inclusion in agenda. The chairman may delegate the drawing up of the agenda to the company secretary.
CompliedAccording to Board Procedure, drawing up of the agenda has been delegated to the Company Secretary with strict adherence to the guidelines given in the said Procedure.
3 (5) (vi) The chairman shall ensure that all the directors are properly briefed on issues arising at board meetings and also ensure that directors receive adequate information in a timely manner.
CompliedThis has been identified as a responsibility of the Chairman, in the paper on ‘Functions of the Chairman and the CEO’ which was approved by the Board. Provision contained in the Board Procedure strengthens this requirement.
3 (5) (vii) The chairman shall encourage all directors to make a full and active contribution to the board’s affairs and take the lead to ensure that the board acts in the best interests of the bank.
CompliedThere is active participation by all directors at the Board meetings as well as at Board sub committee meetings as evidenced in the minutes.
The Board appraises its performance by using the Board evaluation form which is filled by each director in relation to business strategy and contributions of Board members based on their field of expertise.
CORPORATE GOVERNANCE ANNEXURE
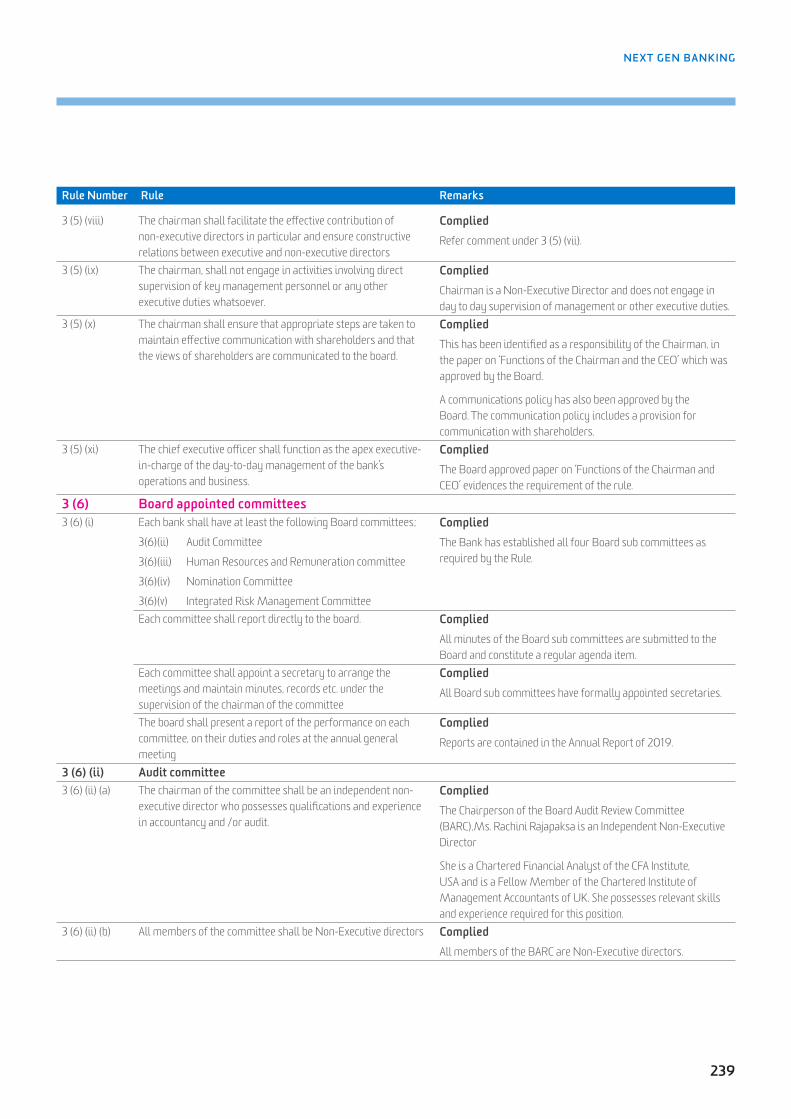
239
NEXT GEN BANKING
Rule Number Rule Remarks
3 (5) (viii) The chairman shall facilitate the effective contribution of non-executive directors in particular and ensure constructive relations between executive and non-executive directors
CompliedRefer comment under 3 (5) (vii).
3 (5) (ix) The chairman, shall not engage in activities involving direct supervision of key management personnel or any other executive duties whatsoever.
CompliedChairman is a Non-Executive Director and does not engage in day to day supervision of management or other executive duties.
3 (5) (x) The chairman shall ensure that appropriate steps are taken to maintain effective communication with shareholders and that the views of shareholders are communicated to the board.
CompliedThis has been identified as a responsibility of the Chairman, in the paper on ‘Functions of the Chairman and the CEO’ which was approved by the Board.
A communications policy has also been approved by the Board. The communication policy includes a provision for communication with shareholders.
3 (5) (xi) The chief executive officer shall function as the apex executive-in-charge of the day-to-day management of the bank’s operations and business.
CompliedThe Board approved paper on ‘Functions of the Chairman and CEO’ evidences the requirement of the rule.
3 (6) Board appointed committees3 (6) (i) Each bank shall have at least the following Board committees;
3(6)(ii) Audit Committee
3(6)(iii) Human Resources and Remuneration committee
3(6)(iv) Nomination Committee
3(6)(v) Integrated Risk Management Committee
CompliedThe Bank has established all four Board sub committees as required by the Rule.
Each committee shall report directly to the board. CompliedAll minutes of the Board sub committees are submitted to the Board and constitute a regular agenda item.
Each committee shall appoint a secretary to arrange the meetings and maintain minutes, records etc. under the supervision of the chairman of the committee
CompliedAll Board sub committees have formally appointed secretaries.
The board shall present a report of the performance on each committee, on their duties and roles at the annual general meeting
CompliedReports are contained in the Annual Report of 2019.
3 (6) (ii) Audit committee 3 (6) (ii) (a) The chairman of the committee shall be an independent non-
executive director who possesses qualifications and experience in accountancy and /or audit.
CompliedThe Chairperson of the Board Audit Review Committee (BARC),Ms. Rachini Rajapaksa is an Independent Non-Executive Director
She is a Chartered Financial Analyst of the CFA Institute, USA and is a Fellow Member of the Chartered Institute of Management Accountants of UK. She possesses relevant skills and experience required for this position.
3 (6) (ii) (b) All members of the committee shall be Non-Executive directors CompliedAll members of the BARC are Non-Executive directors.

240
Nations Trust Bank PLC Annual Report 2019
Rule Number Rule Remarks
3 (6) (ii) (c) The committee shall make recommendations on matters in connection with;(i) the appointment of the external auditor for audit services to
be provided in compliance with the relevant statutes;
(ii) the implementation of the Central Bank guidelines issued to auditors from time to time;
(iii) the application of the relevant accounting standards; and
(iv) the service period, audit fee and any resignation or dismissal of the auditor, provided that the engagement of the Audit partner shall not exceed five years, and that the particular Audit partner is not reengaged for the audit before the expiry of three years from the date of the completion of the previous term
Complied
The reappointment of the external auditor for audit services has been recommended to the Board by the BARC.
The BARC has discussed the implementation of CBSL guidelines issued to auditors from time to time and the application of the relevant accounting standards.
The BARC ensures that the service period of the engagement of the External Audit partner shall not exceed five years, and that the particular Audit partner is not re-engaged for the audit before the expiry of three years from the date of the completion of the previous term.
The BARC evaluates and makes recommendations to the Board with regard to the audit fee.
3 (6) (ii) (d) The committee shall review and monitor the external auditor’s independence and objectivity and the effectiveness of the audit process in accordance with applicable standards and best practices.
CompliedThe BARC obtains representations from the External Auditor on their independence and that the audit is carried out in accordance with the Sri Lanka Auditing Standards.
3 (6) (ii) (e) The committee shall develop and implement a policy on the engagement of an external auditor to provide non-audit services that are permitted under the relevant statutes, regulations, requirements and guidelines. In doing so, the committee shall ensure that the provision by an external auditor of non –audit services does not impair the external auditor’s independence or objectivity. When assessing the external auditor’s independence or objectivity in relation to the provision of non audit services, the committee shall consider;
I. whether the skills and experience of the audit firm make it a suitable provider of the non-audit services;
11. whether there are safeguards in place to ensure that there is no threat to the objectivity and/or independence in the conduct of the audit resulting from the provision of such services by the external auditor; and
111. whether the nature of the non-audit services, the related fee levels and the fee levels individually and in aggregate relative to the audit firm, pose any threat to the objectivity and/or independence of the external auditor
CompliedThe matters referred to in the Rule are covered in the Terms of Reference of the BARC and are exercised with due care and diligence.
Further, a separate policy on the engagement of the external auditor to provide non-audit services was developed by the BARC and approved by the Board of Directors to cover all aspects stated in this Direction. This Policy was reviewed by the BARC and was approved by the Board of Directors in February 2019.
BARC further monitors the payments made to the auditor during the year for non-audit services to ensure compliance to the Direction.
.
CORPORATE GOVERNANCE ANNEXURE

241
NEXT GEN BANKING
Rule Number Rule Remarks
3 (6) (ii) (f) The committee shall, before the audit commences, discuss and finalize with the external auditors the nature and scope of the audit, including;
(i) an assessment of the bank’s compliance with the relevant directions in relation to corporate governance and the management’s internal controls over financial reporting;
(ii) the preparation of financial statements for external purposes in accordance with relevant accounting principles and reporting obligations; and
(iii) the coordination between firms where more than one audit firm is involved.
CompliedThe BARC Terms of Reference requires the BARC to discuss and finalise with the External Auditor the nature and scope of the audit. In order to comply, the External Auditors make a presentation at the BARC meeting detailing the proposed audit plan and scope. The Committee discussed and finalized the audit plan and scope with the External Auditor.
During the tenure of the audit, regular status updates were obtained and discussed at the BARC meetings.
As all audits within the group are carried out by the same External Auditor, there was no requirement to discuss arrangements for coordinating activities with other auditors.
3 (6) (ii) (g) The committee shall review the financial information of the bank, in order to monitor the integrity of the financial statements of the bank, its annual report, accounts and quarterly reports prepared for disclosure, and the significant financial reporting judgments contained therein. In reviewing the bank’s annual report and accounts and quarterly reports before submission to the board, the committee shall focus particularly on;
(i) major judgemental areas
(ii) any changes in accounting policies and practices
(iii) significant adjustments arising from the audit
(iv) the going concern assumption; and
(v) the compliance with relevant accounting standards and other legal requirements.
CompliedBARC meetings were held in 2019 to review/comment and discuss the Bank’s financial information and reports that are submitted by the CEO/CFO to ensure the integrity of the Financial statements prepared for disclosure and published in the Bank’s annual report and in the quarterly unaudited financial statements and reports.
The Financial Statements discussed and reviewed are recommended to the Board for approval.
3 (6) (ii) (h) The committee shall discuss issues, problems and reservations arising from the interim and final audits, and any matters the auditor may wish to discuss including those matters that may need to be discussed in the absence of key management personnel, if necessary.
CompliedThe BARC met the External Auditors in the absence of the management of the Bank on two occasions in 2019. The External Auditors were invited to draw the attention of BARC any areas of concern or any matter they wish to raise regarding the accounts or otherwise.
3 (6) (ii) (i) The committee shall review the external auditor’s management letter and the management’s response thereto.
CompliedRegular discussions with the External Auditors were carried out on the Audit Completion Letter (the management letter) and the management’s response thereto. The BARC has also issued appropriate recommendations and guidance where necessary to ensure that such matters are resolved satisfactorily.

242
Nations Trust Bank PLC Annual Report 2019
Rule Number Rule Remarks
3 (6) (ii) (j) The committee shall take the following steps with regard to the internal audit function of the bank;
(i) Review the adequacy of the scope, functions and resources of the internal audit department, and satisfy itself that the department has the necessary authority to carry out its work;
(ii) Review the internal audit programme and results of the internal audit process and, where necessary, ensure that appropriate actions are taken on the recommendations of the internal audit department;
(iii) Review any appraisal or assessment of the performance of the head and senior staff members of the internal audit department.
(iv) Recommend any appointment or termination of the head, senior staff members and outsourced service providers to the internal audit function;
(v) Ensure that the committee is apprised of resignations of senior staff members of the internal audit department including the chief internal auditor and any outsourced service providers, and to provide an opportunity to the resigning senior staff members and outsourced service providers to submit reasons for resigning
(vi) Ensure that the internal audit function is independent of the activities it audits and that it is performed with impartiality, proficiency and due professional care;
CompliedThe BARC carries out the following with regard to the Internal Audit function:
Reviews the adequacy of the internal audit function and ensures that it conforms with the Internal Audit Charter which was reviewed by BARC in 2018. The annual audit plan of Internal Audit Department as well as the staff requirements were reviewed/ discussed at the time of approving the Audit Plan.
The Audit plan for the year was approved by the BARC and the progress was reviewed on a regular basis.
The committee reviewed the internal audit reports and considered the findings, recommendations and corrective action.
The performance appraisal of the Executive Vice President Internal Audit (EVP- IA) is carried out by the Chairperson of the BARC in consultation with the other members of the BARC along with adequate input from the CEO. Performance appraisals of senior staff are reviewed by the EVP- IA and presented to the BARC for their concurrence.All senior appointments to the audit team were recommended by the BARC. Vice President - Internal Audit was appointed in 4Q 2019 to understudy Executive Vice President - Internal Audit to assume duties upon his retirement. Additionally, one new senior appointment was made to the Audit team during the year 2019 upon a move by the existing incumbent to a another division in the Bank.
A process is in place to ensure that resignations of senior staff members of the internal audit department including the EVP - IA are advised to the Chairman BARC at periodic BARC meetings. (There have been no resignations of senior level staff during the year 2019).
The internal audit staff directly reports to EVP- IA who in turn directly reports to BARC for independence. The audits are performed impartially, proficiently and with due professional care.
3 (6) (ii) (k) The committee shall consider the major findings of internal investigations and management’s responses thereto
CompliedInvestigation reports were tabled at the BARC meeting together with a status update on ongoing investigations and the relevant issues were discussed in detail with suitable action points agreed upon.
BARC also ensures the key recommendations arising from such investigations are implemented.
CORPORATE GOVERNANCE ANNEXURE

243
NEXT GEN BANKING
Rule Number Rule Remarks
3 (6) (ii) (l) The chief finance officer, the chief internal auditor and a representative of the external auditors may normally attend meetings. Other board members and the chief executive officer may also attend meetings upon the invitation of the committee.
However, at least twice a year, the committee shall meet with the external auditors without the executive directors being present.
CompliedCEO attends all BARC meetings upon invitation. Where it is deemed necessary, other corporate heads including the CFO/CRO/CCO are called for the meetings.
During the period under review, BARC met with the External Auditor on fourteen occasions including two occasions without the presence of the management.
3 (6) (ii) (m) The committee shall have
(i) explicit authority to investigate into any matter within its terms of reference
(ii) the resources which it needs to do so
(iii) full access to information; and
(iv) authority to obtain external professional advise and to invite outsiders with relevant experience to attend, if necessary
CompliedThis has been covered in detail in the Terms of Reference of the BARC and Internal Audit Charter.
Please refer the Board Audit Review Committee Report on page 84 of the Annual Report
3 (6) (ii) (n) The committee shall meet regularly, with due notice of issues to be discussed and shall record its conclusions in discharging its duties and responsibilities.
CompliedThe committee met fourteen times during the year, 2019. Adequate notices of issues to be discussed are made available to all members of BARC. Minutes of proceedings of BARC are maintained by Head of the Internal Audit who functions as the Secretary to the BARC.
3 (6) (ii) (o) The board shall disclose in an informative way,
(i) details of the activities of the audit committee
(ii) the number of audit committee meetings held in the year
(iii) details of attendance of each individual director at such meetings
CompliedPlease refer the Board Audit Review Committee Report on page 84 of the Annual Report.
3 (6) (ii) (p) The secretary of the Committee (who may be the company secretary or the head of the internal audit function) shall record and keep detailed minutes of the committee meetings.
CompliedDetailed minutes are maintained by the Head of the Internal Audit who is the secretary to the BARC.
3 (6) (ii) (q) The Committee shall review arrangements by which employees of the bank may, in confidence, raise concerns about possible improprieties in financial reporting, internal control or other matters. Accordingly the committee shall ensure that proper arrangements are in place for the fair and independent investigation of such matters and for appropriate follow-up action and to act as the key representative body for overseeing the bank’s relations with the external auditor.
CompliedThe committee reviews issues relating to violation of internal controls if any and the arrangements by which the staff of the Bank may in confidence raise concerns about possible improprieties. The Committee also ensured that the procedures for the independent investigations of such matters are appropriate and are in place.
The Whistle Blowing Policy provides for the confidentiality of potential whistle blowers. The Whistle Blowing Policy was last reviewed by BARC and approved by the Board of Directors in February 2019.
The BARC is the key representative body for overseeing the Bank’s relations with the External Auditor and meets the Auditor on a regular basis to discharge this function.

244
Nations Trust Bank PLC Annual Report 2019
Rule Number Rule Remarks
3 (6) (iii) Human Resources and Remuneration Committee (HRRC)
3 (6) (iii) (a) The committee shall determine the remuneration policy (salaries, allowances and other financial payments) relating to directors, CEO and key management personnel of the bank.
CompliedBoard approved remuneration policy is in place
3 (6) (iii)(b) The committee shall set goals and targets for the directors, CEO and key management personnel.
CompliedGoals and targets are set by the Committee for the CEO which gets transformed as goals for the Key Management Personnel through the Balanced Scorecard process.
3 (6) (iii) (c) The committee shall evaluate the performance of the CEO and key management personnel against the set targets and goals periodically and determine the basis for revising remuneration, benefits and other payments of performance-based incentives.
CompliedMinutes of the meeting of the HRRC indicate that such evaluations and the proposal put forward by HR/CEO for the remuneration in 2019 has been approved.
3 (6) (iii) (d) The CEO shall be present at all meetings of the committee, except when matters relating to the CEO are being discussed.
CompliedApproved TOR includes the provisions stipulated. CEO has attended all meetings and was excused when matters relating to her were discussed.
3 (6) (iv) Nomination Committee3 (6) (iv) (a) The Committee shall implement a procedure to select/appoint
new directors, CEO and key management personnelCompliedApproved TOR of the Nomination Committee includes the provisions stipulated. Nomination Committee has also adopted a process to select/recruit Chief Executive Officer and Key Management Personnel.
3 (6) (iv) (b) The Committee shall consider and recommend (or not recommend) the re-election of current directors, taking into account the performance and contribution made by the director concerned towards the overall discharge of the board’s responsibilities.
CompliedThe Committee has considered and recommended re-election of directors in compliance with the Rule.
3 (6) (iv) (c) The committee shall set the criteria such as qualifications, experience and key attributes required for eligibility to be considered for appointment or promotion to the post of CEO and the key management positions.
CompliedCriteria has been set and included in the JDs of KMP approved by the Nomination Committee.
3 (6) (iv) (d) The committee shall ensure that directors, CEO and key management personnel are fit and proper persons to hold office as specified in the criteria given in Direction 3(3) and as set out in the Statutes.
CompliedAffidavits and declarations of the Directors and CEO were submitted to the Committee during 2019 in order for the Committee to determine the suitability of the Directors and CEO. Having considered the Affidavits and declarations the Committee decided that the Directors and CEO are fit and proper persons to hold office. CBSL confirmation was also received on the fit and proper status of Directors. .
3 (6) (iv) (e) The committee shall consider and recommend from time to time, the requirements of additional/ new expertise and the succession arrangements for retiring directors and key management personnel.
CompliedThe Committee has met the criteria set out in the Rule.
CORPORATE GOVERNANCE ANNEXURE

245
NEXT GEN BANKING
Rule Number Rule Remarks
3 (6) (iv) (f) The committee shall be chaired by an Independent Director and preferably be constituted with a majority of Independent Directors.
The CEO may be present at the meetings by invitation.
CompliedMr. Murtaza Jafferjee, Senior Independent Non-Executive Director functioned as the Chairman during the year till his retirement from the Board on 15th December, 2019. Independent Director Mr J C A D’souza was designated as the Senior Director and appointed as the Chairman of the Committee with effect from 16th December, 2019.
CEO was invited to attend when her presence was deemed required by the Committee.
3 (6) (v) Integrated Risk Management Committee (IRMC)3 (6) (v) (a) Committee shall consist of at least three non-executive
directors, chief executive officer and key management personnel supervising broad risk categories, i.e. credit, market, liquidity, operational and strategic risks.
The committee shall work with key management personnel very closely and make decisions on behalf of the board within the framework of the authority and responsibility assigned to the committee.
CompliedIRMC comprises of three non-executive directors, CEO and other relevant KMP.
Committee functions as per the Board approved Terms of Reference in close co-operation with relevant KMP
KMP in charge of risk management and control functions attend IRMC meetings regularly and other KMP attend and discuss the critical risk grids pertaining to their areas once a year.
3 (6) (v) (b) The committee shall assess all risks, i.e, credit, market, liquidity, operational and strategic risks to the bank on a monthly basis through appropriate risk indicators and management information. In the case of subsidiary companies and associate companies, risk management shall be done, both on a bank basis and group basis.
CompliedRisk indicators are monitored by IRMC monthly through the Key Risk Goals paper. Key risks involved in the subsidiary companies are included in the Risk grids of the department overseeing such subsidiary and presented assessed and discussed at IRMC meetings. Each and every business/support unit of the Bank and subsidiary companies have separate risk grids populated using Risk and Control Self Assessment methodology covering all material risks.
3 (6) (v) (c) The committee shall review the adequacy and effectiveness of all management level committees such as the credit committee and the asset-liability committee to address specific risks and to manage those risks within quantitative and qualitative risk limits as specified by the committee.
CompliedThe committee reviews the adequacy and effectiveness of all management level committees that has a relevance to risk. Minutes of Management level committees, namely Investment Committee, ALCO, Executive Risk management committee etc. are submitted to the Committee to review the adequacy and effectiveness of same. However in view of the role played by the Board credit Committee, minutes of the management level credit committee have not been submitted to IRMC
3 (6) (v) (d) The committee shall take prompt corrective action to mitigate the effects of specific risks in the case such risks are at levels beyond the prudent levels decided by the committee on the basis of the bank’s policies and regulatory and supervisory requirements.
CompliedRisks are monitored through monthly submission of Key Risk Goals report as well as bank risk grid submitted to live IRMC meetings where corrective action has been taken as reflected in the minutes.
3 (6) (v) (e) The committee shall meet at least quarterly to assess all aspects of risk management including updated business continuity plans.
CompliedThe IRMC has held meetings once in two months

246
Nations Trust Bank PLC Annual Report 2019
Rule Number Rule Remarks
3 (6) (v) (f) The committee shall take appropriate actions against the officers responsible for failure to identify specific risks and take prompt corrective actions as recommended by the committee, and/or as directed by the Director of Bank Supervision.
CompliedCurrently Committee monitors risk Management by Departments through the departmental risk grids. In the event action is required against an officer found to have failed in identifying specific risks and take prompt corrective actions as recommended by the committee, action will be taken against him/her in terms of the Bank’s established Human Resources policy.
The Committee is authorized to direct Chief Executive Officer to take appropriate actions against the officers responsible for failure to identify specific risks and take prompt corrective actions as recommended by the Committee and is documented in the Terms of Reference of IRMC.
3 (6) (v) (g) The committee shall submit a risk assessment report within a week of each meeting to the board seeking the board’s views, concurrence and/or specific directions.
CompliedA report has been submitted to the Board after each IRMC meeting as required by the Rule. In addition minutes of all IRMC meetings have been submitted to the Board. .
3 (6) (v) (h) The committee shall establish a compliance function to assess the bank’s compliance with laws, regulations, regulatory guidelines, internal controls and approved policies on all areas of business operations. A dedicated compliance officer selected from key management personnel shall carry out the compliance function and report to the committee periodically.
CompliedThe Compliance officer submits a report to the Committee at every meeting. The Bank has established a separate Compliance Division to assess the Bank’s compliance. The Compliance Officer carries out the compliance function and report to the committee periodically on Bank’s compliance with laws, regulations and approved policies on all areas of business operations.
3 (7) Related Party Transactions3 (7) (i) The Board shall take the necessary steps to avoid any conflicts
of interest that may arise from any transaction of the bank with any person, and particularly with the following categories of persons who shall be considered as ‘related parties’ for the purpose of this Direction
(a) Any of the bank’s subsidiary companies
(b) Any of the bank’s associate companies
(c) Any of the directors of the bank
(d) Any of the bank’s key management personnel
(e) A close relation of any of the bank’s directors or key management personnel
(f) A shareholder owning a material; interest in the bank
(g) A concern in which any of the bank’s directors or a close relation of any of the bank’s directors or any of its material shareholders has a substantial interest
CompliedBoard procedure contains provisions on avoiding conflicts of interests. Bank’s credit policy contains provisions for ensuring compliance. Necessary steps have been taken by the Board to avoid any conflicts of interests that may arise, in transacting with related parties as per the definition in the direction.
Board has also approved a framework for managing Related Party Transactions and monitors its implementation through Related Party Transactions Review Committee.
CORPORATE GOVERNANCE ANNEXURE

247
NEXT GEN BANKING
Rule Number Rule Remarks
3 (7) (ii) The type of transactions with related parties that shall be covered by this Direction shall include the following;
(a) The grant of any type of accommodation, as defined in the Monetary Board’s Directions on maximum amount of accommodation
(b) The creation of any liabilities of the bank in the form of deposits, borrowings and investments
(c) The provision of any services of a financial or non financial nature provided to the bank or received from the bank
(d) The creation or maintenance of reporting lines and information flows between the bank and any related parties which may lead to the sharing of potentially proprietary, confidential or otherwise sensitive information that may give benefits to such related parties.
CompliedThe Board approved related party policy contains provisions for same.
3 (7) (iii) The board shall ensure that the bank does not engage in transactions with related parties as defined in Direction 3(7)(i) above, in a manner that would grant such parties ‘more favorable treatment’ than that accorded to other constituents of the bank carrying on the same business. In this context, ‘more favorable treatment’ shall mean and include treatment, including the;
(a) Granting of ‘total net accommodation’ to related parties, exceeding a prudent percentage of the bank’s regulatory capital, as determined by the board. For purpose of this sub- direction;
(i) ‘Accommodation’ shall mean accommodation as defined in the Banking Act Directions No.7 of 2007 on Maximum Amount of Accommodation.
(ii) the ‘total net accommodation’ shall be computed by deducting from the total accommodation, the cash collateral and investments made by such related parties in the Bank’s share capital and debt instruments with a maturity of 5 years or more.
(b) Charging of a lower rate of interest than the bank’s best lending rate or paying more than the bank’s deposit rate for a comparable transaction with an unrelated comparable counterparty;
(c) Providing of preferential treatment, such as favorable terms, covering trade losses and/or waiving fees/commissions, that extend beyond the terms granted in the normal course of business undertaken with unrelated parties;
(d) Providing services to or receiving services from a related- party without an evaluation procedure;
(e) Maintaining reporting lines and information flows that may lead to sharing potentially proprietary, confidential or otherwise sensitive information with related parties, except as required for the performance of legitimate duties and functions.
CompliedRefer comment in 3 (7) (i) above
Board approved Related Party Transactions policy contains provisions to ensure compliance.
Board has taken steps to establish a Related Party Transactions Review Committee which has been entrusted with the task of ensuring that a robust framework exists for approving, managing and reporting related party transactions in accordance with applicable rules. This committee met four times during the year 2019.

248
Nations Trust Bank PLC Annual Report 2019
Rule Number Rule Remarks
3(7)(iv) A bank shall not grant any accommodation to any of its directors or to a close relation of such director unless such accommodation is sanctioned at a meeting of its board of directors, with not less than two-thirds of the number of directors other than the director concerned, voting in favor of such accommodation. This accommodation shall be secured by such security as may from time to time be determined by the Monetary Board as well.
CompliedAll accommodations to directors and/or their close relatives have been granted with the approval of the Board. The Board ensured that such accommodation was secured by security determined by the Monetary Board.
3(7) (v) (a) Where any accommodation has been granted by a bank to a person or a close relation of a person or to any concern in which the person has a substantial interest, and such person is subsequently appointed as a director of the bank, steps shall be taken by the bank to obtain the necessary security as may be approved for that purpose by the Monetary Board, within one year from the date of appointment of the person as a director.
(b) Where such security is not provided by the period as provided in direction 3(7)(v)(a) above, the bank shall take steps to recover any amount due on account of any accommodation, together with interest, if any, within the period specified at the time of the grant of accommodation or at the expiry of a period of eighteen months from the date of appointment of such director, whichever is earlier.
(c) Any director who fails to comply with the above sub directions shall be deemed to have vacated the office of director and the bank shall disclose such fact to the public.
(d) This sub-direction, however, shall not apply to a director who at the time of the grant of the accommodation was an employee of the bank and the accommodation was granted under a scheme applicable to all employees of such bank.
Not applicableThis situation has not arisen in the Bank to date. However the Company Secretary obtains declarations from all the Directors prior to their appointment and they are requested to declare the transactions.
3(7)(vi) A bank shall not grant any accommodation or ‘more favourable treatment’ relating to the waiver of fees and/or commissions to any employee or a close relation of such employee or to any concern in which the employee or close relation has a substantial interest other than on the basis of a scheme applicable to the employees of such bank or when secured by security as may be approved by the Monetary Board in respect of accommodation granted as per Direction 3(7)(v) above
CompliedBoard approved Related Party Transactions policy contains provisions to ensure compliance.
3(7)(vii) No accommodation granted by a bank under Direction 3(7) (v) and 3 (7) (vi) above, nor any part of such accommodation, nor any interest due thereon shall be remitted without the prior approval of the Monetary Board and any remission without such approval shall be void and of no effect.
CompliedNo such facility has been remitted in violation of this rule.
3(8) Disclosures3(8) (i) The Board shall ensure that;
(a) annual audited financial statements and quarterly financial statements are prepared and published in accordance with the formats prescribed by the supervisory and regulatory authorities and applicable accounting standards
and that(b) such statements are published in the newspapers in an
abridged form, in Sinhala, Tamil and English.
Complied
CORPORATE GOVERNANCE ANNEXURE

249
NEXT GEN BANKING
Rule Number Rule Remarks
3 (8) (ii) The Board shall ensure that the following minimum disclosures are made in the Annual Report;
(a) A statement to the effect that the annual audited financial statements have been prepared in line with applicable accounting standards and regulatory requirements, inclusive of specific disclosures.
(b) A report by the Board on the Bank’s internal control mechanism that confirms that the financial reporting system has been designed to provide reasonable assurance regarding the reliability of financial reporting, and that the preparation of financial statements for external purposes has been done in accordance with relevant accounting principles and regulatory requirements.
(c) The external Auditor’s certification on the effectiveness of the internal control mechanism referred to in Direction 3(8)(ii)(b) above, in respect of any statements prepared or published after December 31, 2008.
(d) Details of Directors, including names, fitness and propriety transactions with the Bank the total of fees/remuneration
paid by the Bank
(e) Total net accommodation as defined in 3(7)(iii) granted to each category of related parties.
The net accommodation granted to each category of related parties shall also be disclosed as a percentage of the Bank’s regulatory capital.
(f) The aggregate values of remuneration paid by the Bank to its key management personnel and the aggregate values of the transactions of the Bank with its key management personnel, set out by Broad categories such as remuneration paid, accommodation granted and deposits or investments made in the Bank.
(g) The external auditor’s certification of the compliance with these Directions in the Annual Corporate Governance reports published after January 1, 2010.
(h) A report setting out details of the compliance with prudential requirements, regulations, laws and internal controls and measures taken to rectify any material non-compliances
(i) A statement of the regulatory and supervisory concerns on lapses in the Bank’s risk management, or non compliance with these Directions that have been pointed out by the Director of Bank Supervision, if so directed by the Monetary Board to be disclosed to the public, together with the measures taken by the Bank to address such concerns.
Complied
Included in page 87 of the Annual Report of 2019
Included in pages 81 to 82 of the Annual Report of 2019.
Assurance Report by auditors under “Sri Lanka Standard on Assurance Engagements (SLSAE) 3050 – Assurance Reports for Banks on Directors’ Statements on Internal Control” has been obtained and included in the Annual Report of 2019.
Included in pages 57 to 61 of the Annual Report of 2019
Disclosed under Report of Board of Directors on the Affairs of the Bank included in pages 57 to 60 of the Annual Report 2019.
Included in pages 57 to 60 of the Annual Report of 2019.
All findings of the ‘Factual Findings Reports” of auditors issued under “Sri Lanka Related Services Practice Statement 4750” have been incorporated in this report.
Included in the Annual Report, 2019.
No such matter has been specified by the Monetary Board of CBSL.

250
Nations Trust Bank PLC Annual Report 2019
TEN YEAR KEY PERFORMANCE TRENDS
2010 2011 2012 2013 2014 2015 2016 2017 2018 2019
Year Ended December 31stLKR Mn (Group)OPERATING RESULTSGross Income 12,215 11,885 17,673 20,362 20,854 20,279 25,547 35,333 43,461 46,314 Net Interest Income 4,565 4,404 5,755 7,675 8,940 9,105 9,786 11,909 15,164 16,134 Net Fees & Other Income 2,125 2,089 2,576 2,235 3,177 3,414 3,925 5,005 6,146 6,418 Total Operating Income 6,690 6,493 8,331 9,910 12,117 12,519 13,711 16,914 21,310 22,552 Operating Expenses (3,996) (4,017) (4,697) (5,779) (6,363) (6,862) (7,620) (8,773) (10,310) (10,808)Impairment (203) 235 (433) (451) (1,182) (985) (690) (1,089) (3,274) (3,301)Profit Before Taxation 2,492 2,711 3,201 3,681 4,571 4,672 5,400 7,052 7,726 8,444 Taxation & Levies (1,408) (1,105) (1,250) (1,544) (2,035) (2,058) (2,531) (3,680) (4,024) (4,730)Profit After Taxation 1,084 1,607 1,951 2,136 2,537 2,614 2,869 3,371 3,702 3,714 Other Comprehensive Income (OCI) (9) 104 (32) (236) 1,262 (288) 664 Total Comprehensive Income 2,127 2,641 2,582 2,633 4,634 3,414 4,378
As at December 31stASSETSCash & Short-Term Funds 1,531 3,695 2,534 3,020 6,900 6,392 4,188 6,850 6,438 8,756 Statutory Deposits with Central Bank 2,416 4,284 5,089 4,032 3,992 5,284 8,512 11,213 12,762 8,377 Government Treasury Bills & Bonds 26,876 24,982 34,038 44,812 40,696 31,623 36,738 49,335 74,254 71,839 Investment Securities 4,020 3,153 2,221 2,315 3,949 7,065 6,926 7,028 - - Loans & Advances 44,571 61,188 73,424 82,327 98,347 121,143 149,818 186,746 221,506 226,794 Other Assets 1,287 2,280 2,591 2,894 1,419 1,386 1,814 1,941 5,085 4,154 Property Plant & Equipment 1,788 1,891 1,908 2,048 2,194 2,143 1,996 3,364 3,669 4,073 Intangible Assets 759 600 642 680 1,283 1,224 1,189 1,154 1,303 1,376 Total Assets 83,248 102,073 122,447 142,128 158,781 176,262 211,180 267,629 325,016 325,369
LIABILITIESDeposits 48,315 67,633 86,274 95,730 111,010 129,158 151,502 194,269 231,463 226,872 Due to Banks 500 1,277 2,712 1,401 2,923 2,276 11,851 12,315 18,475 6,484 Deferred Tax Liabilities 456 236 280 341 413 733 969 1,828 1,050 1,160 Borrowings 21,979 20,203 18,695 27,508 25,402 23,433 23,536 30,573 36,676 50,735 Other Liabilities 5,193 4,095 4,390 5,410 5,138 5,491 6,001 7,175 10,294 8,723 Total Liabilities 76,443 93,444 112,351 130,390 144,887 161,090 193,859 246,159 297,957 293,974
SHAREHOLDERS' FUNDSShare Capital/Stated Capital 4,368 5,101 5,101 5,101 5,101 5,101 5,101 5,101 8,866 9,408 Reserve Fund 156 224 314 419 538 661 796 1,011 1,199 1,372 Reserves 2,281 3,304 4,681 6,217 8,255 9,409 11,423 15,358 16,994 20,616 Total Shareholders' Funds 6,805 8,629 10,096 11,738 13,895 15,171 17,321 21,470 27,059 31,396 Total Liabilities & Shareholders' Funds 83,248 102,073 122,447 142,128 158,781 176,262 211,180 267,629 325,016 325,369 Commitments & Contingencies 60,547 72,792 86,239 90,267 98,799 96,792 123,585 171,587 190,602 199,359

251
NEXT GEN BANKING
2010 2011 2012 2013 2014 2015 2016 2017 2018 2019
RATIOS (GROUP)Operating Income Growth (%) 17.20 (2.94) 28.31 18.95 22.27 3.33 9.52 23.36 25.99 5.83 Cost/Income Ratio (%) 59.73 61.86 56.38 58.31 52.52 54.81 55.58 51.87 48.38 47.92 Return On Average Assets (%) 1.41 1.73 1.74 1.61 1.69 1.56 1.48 1.41 1.25 1.14 Total Assets to Shareholders' Funds (Times) 12.23 11.83 12.13 12.11 11.43 11.62 12.19 12.47 12.01 10.36 Tier 1 Capital Adequacy Ratio (%) 13.43 13.42 13.82 14.78 14.16 13.15 11.40 10.83 12.15 13.30 Total Capital Adequacy Ratio (%) 15.74 17.44 18.18 20.00 18.28 15.53 15.82 13.89 15.59 17.96 Return on Average Shareholders' Funds (%) 18.72 20.82 20.84 19.57 19.79 17.99 17.66 17.38 15.26 12.71
SHAREHOLDER INFORMATION (GROUP)Market Value per Share (LKR) - Voting 83.40 57.00 56.00 62.20 97.00 86.30 80.90 78.00 89.20 80.00 Market Value per Share (LKR) - Non Voting 82.10 80.00 Net Asset Value per Share (LKR) 32.46 37.42 43.78 50.90 60.25 65.79 75.11 93.10 97.42 110.61 Earnings Per Share (LKR) 5.02 6.79 8.24 9.03 10.72 11.04 12.12 14.24 13.10 13.08 Price Earning Ratio (Times) 16.60 8.40 6.79 6.89 9.05 7.81 6.67 5.48 6.81 6.11 Earnings Yield (%) 6.02 11.91 14.72 14.51 11.05 12.80 14.98 18.26 14.69 16.35 Cash Dividend Per Share (LKR) 2.00 2.10 2.10 2.10 2.10 2.10 2.10 - - 2.30Scrip Dividend Per Share (LKR) - - - - - - - 2.10 2.10 -Dividend Payout Ratio (%) 39.81 30.94 25.48 23.27 19.60 19.02 17.33 14.74 16.03 17.58 % of 20 Largest Shareholders - Voting 78.58 78.22 65.78 79.64 81.53 86.02 87.69 88.77 89.51 89.90 % of 20 Largest Shareholders - Non Voting 99.57 99.71
OTHER INFORMATION (GROUP)Number of Employees 1,608 1,853 2,037 2,262 2,562 2,695 2,770 2,943 3,128 3,151Number of Branches 40 48 57 72 89 92 93 93 94 96No of ATMs/CRMs 51 60 70 100 124 131 136 136 172 176
Note : Figures prior to year 2011 are based on Sri Lanka Accounting Standards (SLAS)
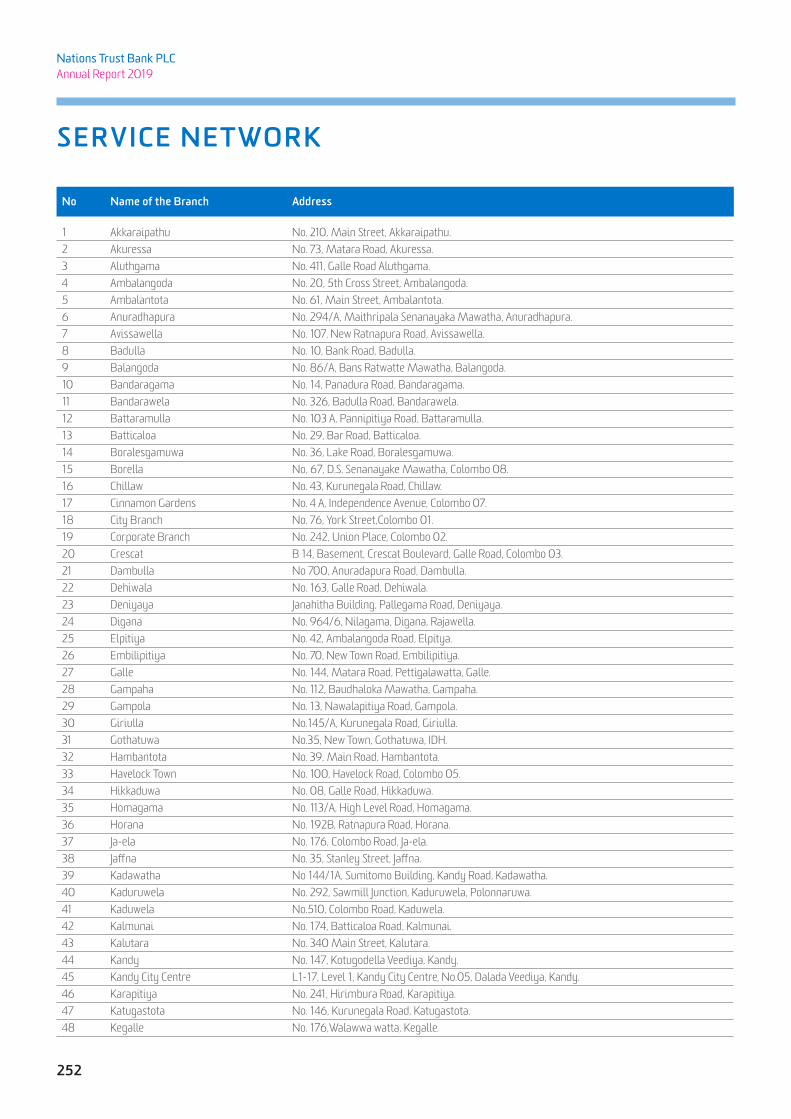
252
Nations Trust Bank PLC Annual Report 2019
SERVICE NETWORK
No Name of the Branch Address
1 Akkaraipathu No. 210, Main Street, Akkaraipathu.2 Akuressa No. 73, Matara Road, Akuressa.3 Aluthgama No. 411, Galle Road Aluthgama.4 Ambalangoda No. 20, 5th Cross Street, Ambalangoda.5 Ambalantota No. 61, Main Street, Ambalantota.6 Anuradhapura No. 294/A, Maithripala Senanayaka Mawatha, Anuradhapura.7 Avissawella No. 107. New Ratnapura Road, Avissawella.8 Badulla No. 10, Bank Road, Badulla.9 Balangoda No. 86/A, Bans Ratwatte Mawatha, Balangoda.10 Bandaragama No. 14, Panadura Road, Bandaragama.11 Bandarawela No. 326, Badulla Road, Bandarawela.12 Battaramulla No. 103 A, Pannipitiya Road, Battaramulla.13 Batticaloa No. 29, Bar Road, Batticaloa.14 Boralesgamuwa No. 36, Lake Road, Boralesgamuwa.15 Borella No, 67, D.S. Senanayake Mawatha, Colombo 08.16 Chillaw No. 43, Kurunegala Road, Chillaw.17 Cinnamon Gardens No. 4 A, Independence Avenue, Colombo 07.18 City Branch No. 76, York Street,Colombo 01.19 Corporate Branch No. 242, Union Place, Colombo 02.20 Crescat B 14, Basement, Crescat Boulevard, Galle Road, Colombo 03.21 Dambulla No 700, Anuradapura Road, Dambulla.22 Dehiwala No. 163, Galle Road, Dehiwala.23 Deniyaya Janahitha Building, Pallegama Road, Deniyaya.24 Digana No. 964/6, Nilagama, Digana, Rajawella.25 Elpitiya No. 42, Ambalangoda Road, Elpitya.26 Embilipitiya No. 70, New Town Road, Embilipitiya.27 Galle No. 144, Matara Road, Pettigalawatta, Galle.28 Gampaha No. 112, Baudhaloka Mawatha, Gampaha.29 Gampola No. 13, Nawalapitiya Road, Gampola.30 Giriulla No.145/A, Kurunegala Road, Giriulla.31 Gothatuwa No.35, New Town, Gothatuwa, IDH.32 Hambantota No. 39, Main Road, Hambantota.33 Havelock Town No. 100, Havelock Road, Colombo 05.34 Hikkaduwa No. 08, Galle Road, Hikkaduwa.35 Homagama No. 113/A, High Level Road, Homagama.36 Horana No. 192B, Ratnapura Road, Horana.37 Ja-ela No. 176, Colombo Road, Ja-ela.38 Jaffna No. 35, Stanley Street, Jaffna.39 Kadawatha No 144/1A, Sumitomo Building, Kandy Road, Kadawatha.40 Kaduruwela No. 292, Sawmill Junction, Kaduruwela, Polonnaruwa.41 Kaduwela No.510, Colombo Road, Kaduwela.42 Kalmunai No. 174, Batticaloa Road, Kalmunai.43 Kalutara No. 340 Main Street, Kalutara.44 Kandy No. 147, Kotugodella Veediya, Kandy.45 Kandy City Centre L1-17, Level 1, Kandy City Centre, No.05, Dalada Veediya, Kandy.46 Karapitiya No. 241, Hirimbura Road, Karapitiya.47 Katugastota No. 146, Kurunegala Road, Katugastota.48 Kegalle No. 176,Walawwa watta, Kegalle.
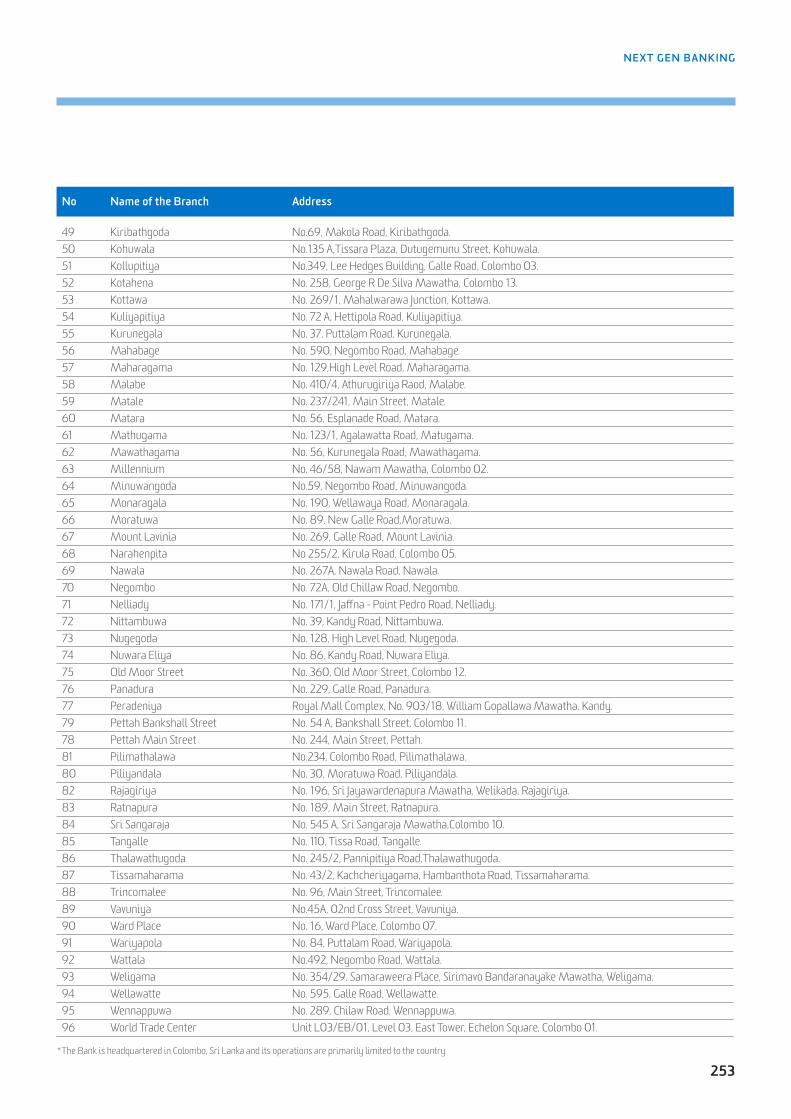
253
NEXT GEN BANKING
No Name of the Branch Address
49 Kiribathgoda No.69, Makola Road, Kiribathgoda.50 Kohuwala No.135 A,Tissara Plaza, Dutugemunu Street, Kohuwala.51 Kollupitiya No.349, Lee Hedges Building, Galle Road, Colombo 03.52 Kotahena No. 258, George R De Silva Mawatha, Colombo 13.53 Kottawa No. 269/1, Mahalwarawa Junction, Kottawa.54 Kuliyapitiya No. 72 A, Hettipola Road, Kuliyapitiya.55 Kurunegala No. 37, Puttalam Road, Kurunegala.56 Mahabage No. 590, Negombo Road, Mahabage.57 Maharagama No. 129,High Level Road, Maharagama.58 Malabe No. 410/4, Athurugiriya Raod, Malabe.59 Matale No. 237/241, Main Street, Matale.60 Matara No. 56, Esplanade Road, Matara.61 Mathugama No. 123/1, Agalawatta Road, Matugama.62 Mawathagama No. 56, Kurunegala Road, Mawathagama.63 Millennium No. 46/58, Nawam Mawatha, Colombo 02.64 Minuwangoda No.59, Negombo Road, Minuwangoda.65 Monaragala No. 190, Wellawaya Road, Monaragala.66 Moratuwa No. 89, New Galle Road,Moratuwa.67 Mount Lavinia No. 269, Galle Road, Mount Lavinia.68 Narahenpita No 255/2, Kirula Road, Colombo 05.69 Nawala No. 267A, Nawala Road, Nawala.70 Negombo No. 72A, Old Chillaw Road, Negombo.71 Nelliady No. 171/1, Jaffna - Point Pedro Road, Nelliady.72 Nittambuwa No. 39, Kandy Road, Nittambuwa.73 Nugegoda No. 128, High Level Road, Nugegoda.74 Nuwara Eliya No. 86, Kandy Road, Nuwara Eliya.75 Old Moor Street No. 360, Old Moor Street, Colombo 12.76 Panadura No. 229, Galle Road, Panadura.77 Peradeniya Royal Mall Complex, No. 903/18, William Gopallawa Mawatha, Kandy.79 Pettah Bankshall Street No. 54 A, Bankshall Street, Colombo 11.78 Pettah Main Street No. 244, Main Street, Pettah.81 Pilimathalawa No.234, Colombo Road, Pilimathalawa.80 Piliyandala No. 30, Moratuwa Road, Piliyandala.82 Rajagiriya No. 196, Sri Jayawardenapura Mawatha, Welikada, Rajagiriya.83 Ratnapura No. 189, Main Street, Ratnapura.84 Sri Sangaraja No. 545 A, Sri Sangaraja Mawatha,Colombo 10.85 Tangalle No. 110, Tissa Road, Tangalle.86 Thalawathugoda No. 245/2, Pannipitiya Road,Thalawathugoda.87 Tissamaharama No. 43/2, Kachcheriyagama, Hambanthota Road, Tissamaharama.88 Trincomalee No. 96, Main Street, Trincomalee.89 Vavuniya No.45A, 02nd Cross Street, Vavuniya.90 Ward Place No. 16, Ward Place, Colombo 07.91 Wariyapola No. 84, Puttalam Road, Wariyapola.92 Wattala No.492, Negombo Road, Wattala.93 Weligama No. 354/29, Samaraweera Place, Sirimavo Bandaranayake Mawatha, Weligama.94 Wellawatte No. 595, Galle Road, Wellawatte.95 Wennappuwa No. 289, Chilaw Road, Wennappuwa.96 World Trade Center Unit L03/EB/01, Level 03, East Tower, Echelon Square, Colombo 01.
*The Bank is headquartered in Colombo, Sri Lanka and its operations are primarily limited to the country

254
Nations Trust Bank PLC Annual Report 2019
SERVICE NETWORK
OFFSITE ATMS
No ATM Location Address
1 Arpico Hyde Park Arpico Super Centre, No.69, Hyde Park Corner, Colombo 02.2 Arpico Matara Arpico Super Centre, No A2, Matara Road, Matara.3 Arpico Navinna Arpico Super Centre, No.310, High Level Road, Navinna, Maharagama.4 Arpico Panadura Arpico super center, No. 542, Galle road, Panadura.5 Asiri-General Hospital No. 181, Kirula Road, Narahenpita.6 Asiri-Surgical Hospital No. 21, Kirimandala Mawatha , Narahenpita.7 Athurugiriya No. 25, Malabe Road, Athurugiriya.8 Attidiya L & S Engineering (Pvt) Ltd, No 208, Main Road, Attidiya.9 Avissawella Union Apparel Union Apparel (Pvt) Ltd, Block C1, C.V.Gunarathne Industrial Park, Seethawakapura, Avissawella.10 Cinnamon Lakeside No: 115, Sir Chitthampalam A Gardiner Mawatha, Colombo 02.11 Dambulla Dambulla Giman Hala, Dambulla.12 Digana MAS Factory, BOI, Pallekelle.13 Galle Sahana "Sahana" No 438, Matara Road, Megalle, Galle.14 Gampaha Railway Station Railway station, Gampaha.15 Ganemulla Railway Station, Ganemulla.16 JKH Water Front Water Front, No. 92, Glennie Street, Colombo 02.17 Kaduruwela Texwin Clothing (PVT) Ltd, BOP 398, Abayapura, Pulasthigama, Kaduruwela.18 Kaduwela Main Bus Stand, Awissawella Road, Kaduwela.19 Kandy Railway Station Railway Station, Kandy.20 Keells Borella Keells Super, No 85, Dr N.M. Perera Mawatha, Colombo 08.21 Keells Kalubowila Keells super, No. 53, Hospital Road, Kalubowila, Dehiwala.22 Keells Kottawa Keells super, No. 119, Horana Road, Kottawa.23 Keells Mt Lavinia Keells Super, Mt. Lavinia, No. 388, Galle Road, Mt. Lavinia.24 Kolonnawa Laugfs Supermarket, No 228, Kolonnawa Road, Kolonnawa.25 Laugfs Kohuwala Laughs Sun-up Super Market, No.17, Sunethradevi Mawatha, Kohuwala.26 Laugfs Nedimala Laughs Sun-up Super Market, No. 288, Hill Street, Dehiwala.27 Laugfs Pitakotte No: 338, Kotte Road, Pitakotte.28 Laugfs Seeduwa Laugfs Sun-up Super Market, No: 10, Kotugoda Road, Seeduwa.29 Leesons Ragama Leesons Hospital, No: 32, Thewatta Road, Ragama.30 Mawaramandiya Biyagama Multi Corporative Society Limited, “Samupakara Mandiraya”, Mawaramandiya, Siyambalape.31 Miriswatte Lanka Filling Station, No: 144, Kandy Road, Miriswatte, Mudungoda.32 Negombo Negombo Super K, No: 250, Colombo Road, Negombo.33 Orion City Orion Management Consortium Ltd, No 752/1, Base Line Road, Colombo 09.34 PBC Kandana Arpico Daily, No: 88, Negombo road, Kandana.35 PBC Rajagiriya Keells Super Rajagiriya, No.475, Sri Jayewardenepura Road, Rajagiriya.36 PBC Wattala Keells Super-Wattala, No.385, Negombo Road, Wattala.37 Peradeniya Royal Mall Shopping Complex, No. 903/18, William Gopallawa Mawatha, Kandy.38 Rathmalana Lanka Sathosa Limited, Rathmalana Mega, Police Trans Camp, No. 650/A, Galle Road, Rathmalana.39 Rathnapura No. 278, Colombo Road, Rathnapura.
OFFSITE CRMS
No CRM Location Address
1 Ampara Off-site Liyanwala Building, Nidahas Mawatha, Ampara.2 ANC Education ANC Education, No. 310, R A De Mel Mawatha, Colombo 03.3 CINEC CINEC Maritime Campus, Millennium Drive, IT Park ,Malabe.4 Kurunegala Arpico Super centre, No 27l,Colmbo Road, Kurunegala.5 SLIIT SLIIT, New Kandy Road, Malabe.
255
NEXT GEN BANKING
GLOSSARY
AACCOUNTING POLICIESThe specific principles, bases, conventions, rules and practices adopted by an entity in preparing and presenting Financial Statements.
ACCRUAL BASISRecognition of the effects of transactions and other events when they occur without waiting for receipt or payment of cash or its equivalents.
ACTUARIAL GAIN/LOSSGain or loss arising from the difference between estimates and actual experience in an entity’s pension plan.
BBASEL IIIThe BCBS issued the Basel III rules text, which presents the details of strengthened global regulatory standards on bank capital adequacy and liquidity.
BASIS POINT (BP)One hundredth of a percentage point (0.01 per cent); 100 basis points is 1 percentage point. Used in quoting movements in interest rates or yields on securities.
CCAGRCompounded annual growth rate. The rate at which it would have grown if it grew at an even rate compounded annually.
CAPITAL ADEQUACY RATIOThe relationship between capital and risk weighted assets as defined in the framework developed by the Bank for International Settlements and as modified by the Central Bank of Sri Lanka to suit local requirements.
CAPITAL RESERVESCapital Reserves consist of revaluation reserves arising from revaluation of properties owned by the Bank and Reserve Fund set aside for specific purposes defined under the Banking Act, No 30 of 1988 and shall not be reduced or impaired without the approval of the Monetary Board.
CONTRACTUAL MATURITYContractual maturity refers to the final payment date of a loan or other financial instrument, at which point all the remaining outstanding principal will be repaid and interest is due to be paid.
COST TO INCOME RATIOOperating expenses (excluding provision for bad and doubtful debts) expressed as a percentage of net Income
CREDIT RATINGAn evaluation of a corporate’s ability to repay its obligations or the likelihood of not defaulting, carried out by an independent rating agency.
CREDIT RISKCredit risk is the risk of financial loss to the Bank if a customer or counter party to a financial instrument fails to meet its contractual obligations, and arises principally from the loans and advances to customers and other banks and investment in debt/ equity securities.
CREDIT RISK MITIGATIONA technique to reduce the credit risk associated with an exposure by application of credit risk mitigants such as collateral, guarantee and credit protection.
CURRENCY RISKThe risk that the fair value or future cash flows of a financial instrument will fluctuate because of changes in foreign exchange rates.
CURRENCY SWAPSThe simultaneous purchase of an amount of a currency for spot settlement and the sale of the same amount of the same currency for forward settlement.
DDELINQUENCYA debt or other financial obligation is considered to be in a state of delinquency when payments are overdue. Loans and advances are considered to be delinquent when consecutive payments are missed. Also known as ‘Arrears’.
DERECOGNITIONRemoval of a previously recognised financial asset or financial liability from an entity’s statement of financial position.
DIVIDEND COVERProfit after tax divided by gross dividends. This ratio measures the number of times dividend is covered by the current year’s distributable profits.
DIVIDEND YIELDDividend earned per share as a percentage of its market value.
EEFFECTIVE INCOME TAX RATEProvision for taxation divided by the profit before taxation.
EVENTS AFTER THE REPORTING PERIODEvents after the reporting period are those events, favourable and unfavourable, that occur between the end of the reporting period and the date when the financial statements are authorised for issue.
EXPOSUREA claim, contingent claim or position which carries a risk of financial loss.
EXPECTED CREDIT LOSSES ('ECL')The weighted average, with respect to the risk of default occurring, of the difference between all contractual cash flows that are due in accordance with the contract and all the cash flows that are expected to be received, discounted at the original effective interest rate.
EXPOSURE AT DEFAULT (‘EAD’)Under the standardised approach, the amount expected to be outstanding after any credit risk mitigation, if and when the counterparty defaults. Under IRB, the amount outstanding if and when the counterparty defaults. EAD reflects drawn balances as well as allowances for undrawn amounts of commitments and contingent exposures.
256
Nations Trust Bank PLC Annual Report 2019
GLOSSARY
FFINANCE LEASEA contract whereby a lessor conveys to the lessee the right to use an asset for rent over an agreed period of time which is sufficient to amortise the capital outlay of the lessor. The lessor retains the ownership of the asset but transfers substantially all the risks and rewards of ownership to the lessee.
FINANCIAL ASSETIs any asset that is cash, an equity instrument of another entity or a contractual right to receive cash or another financial asset from another entity.
FINANCIAL GUARANTEE CONTRACTIs a contract that requires the issuer to make specified payments to reimburse the holder for a loss it incurs because a specified debtor fails to make payment when due in accordance with the original or modified terms of a debt instrument.
FINANCIAL INSTRUMENTFinancial Instrument is any contract that gives rise to a financial asset of one entity and a financial liability or equity instrument of another entity.
FINANCIAL LIABILITYIs a contractual obligation to deliver cash or another financial asset to another entity.
FORWARD EXCHANGE CONTRACTAgreement between two parties to exchange one currency for another at a future date at a rate agreed upon today.
GGLOBAL REPORTING INITIATIVE (GRI)The GRI is an international independent standards organisation that helps businesses, governments, and other organisations understand and communicate their impacts on issues such as climate change, human rights, and corruption. GRI promotes sustainability reporting as a way for organisations to become more sustainable and contribute to sustainable development.
GROSS DIVIDENDSThe portion of profits distributed to the shareholders including tax withheld.
GUARANTEESThree party agreement involving a promise by one party (the guarantor) to fulfill the obligations of a person owning a debt if that person fails to perform.
HHIGH QUALITY LIQUID ASSETS (HQLA)Assets that are unencumbered, liquid in markets during a time of stress and, ideally, be central bank eligible. These include, for example, cash and claims on Central Governments and Central Banks.
IIMPAIRED LOANSLoans where the Group does not expect to collect all the contractual cash flows or expects to collect them later than they are contractually due.
INTEREST MARGINNet interest income expressed as a percentage of interest earning assets.
INDIVIDUALLY ASSESSED IMPAIRMENTExposure to loss is assessed on all individually significant accounts and all other accounts that do not qualify for collective assessment.
INTEREST RATE RISKThe risk that the fair value or future cash flows of a financial instrument will fluctuate because of changes in market interest rates.
INTEREST COVERA ratio showing the number of times interest charges is covered by earnings before interest and tax.
INTEREST SPREADThis represents the difference between the average interest rate earned and the average interest rate paid on funds.
INTERNAL CAPITAL ADEQUACY ASSESSMENT PROCESSThe Group’s own assessment of the levels of capital that it needs to hold through an examination of its risk profile from regulatory and economic capital viewpoints.
LLIQUID ASSETSAssets that are held in cash or in a form that can be converted to cash readily, such as deposits with other banks, bills of exchange, treasury bills.
LIQUID ASSETS RATIOAssets that are held in cash or in a form that can be converted to cash readily (as prescribed by the Central Bank of Sri Lanka) divided by the total liabilities including contingent liabilities.
LIQUIDITY COVERAGE RATIO (‘LCR’)The ratio of the stock of high quality liquid assets to expected net cash outflows over the following 30 days. High quality liquid assets should be unencumbered, liquid in markets during a time of stress and, ideally, be central bank eligible.
LOANS TO DEPOSITS RATIOTotal loans and advances expressed as a percentage of the total deposit portfolio.
LIQUIDITY RISKThe risk that an entity will encounter difficulty in meeting obligations associated with financial liabilities
LOAN-TO-VALUE RATIO (LTV)The LTV ratio is a mathematical expression which expresses the amount of a first mortgage lien as a percentage of the total appraised value of real property. The LTV ratio is used in determining the appropriate level of risk for the loan and therefore the correct price of the loan to the borrower.
MMARKET CAPITALISATIONNumber of ordinary shares in issue multiplied by the market value of a share as at the year-end.

257
NEXT GEN BANKING
MATERIALITYThe relative significance of a transaction or an event, the omission or misstatement of which could influence the economic decisions of users of Financial Statements.
MARKET RISKThis refers to the possibility of loss arising from changes in the value of a financial instrument as a result of changes in market variables such as interest rates, exchange rates, credit spreads and other asset prices.
NNET ASSETS VALUE PER ORDINARY SHAREShareholders’ funds excluding Preference Shares divided by the number of ordinary shares in issue.
NET DIVIDENDSDividends net of withholding tax.
NET INTEREST INCOMEDifference between what banks earn on assets such as loans and securities and what it pays on liabilities such as deposits, refinance funds and inter-bank borrowings.
NPA RATIOTotal non-performing advances (net of Interest in Suspense) divided by total advances portfolio (net of Interest in Suspense).
NON-PERFORMING ADVANCES (NPA)All loans are classified as nonperforming when a payment is 90 days in arrears.
NON-PERFORMING ADVANCES COVER (NPA COVER)Cumulative loan loss provision as a percentage of total Non-Performing Advances (net of Interest in Suspense).
NET STABLE FUNDING RATIO (NSFR)Measures the amount of longer term, stable sources of funding employed by a Bank relative to the liquidity profiles of the assets funded and the potential for contingent calls on funding liquidity arising from off-balance sheet commitments and obligations.
OOPERATIONAL RISKOperational risk refers to the losses arising from fraud, negligence, oversight, human error, process errors, system failures, external events, etc.
PPAST DUEA financial asset is past due when a counterparty has failed to make a payment when contractually due.
PROVISION COVERTotal provisions for loan losses expressed as a percentage of net non-performing loans and advances before discounting for provisions on non-performing loans and advances.
RRELATED PARTIESParties where one party has the ability to control the other party or exercise significant influence over the other party in making financial and operating decisions.
RETURN ON ASSETSProfit after tax divided by average assets.
RETURN ON EQUITYProfit after Tax divided by the average shareholders’ funds.
RISK APPETITE The aggregate level and types of risk a firm is willing to assume within its risk capacity to achieve its strategic objectives and business plan.
RISK WEIGHTED ASSETSOn Balance Sheet assets and the credit equivalent of off Balance Sheet assets multiplied by the relevant risk weighting factors.
SSEGMENTAL ANALYSISAnalysis of financial information by segments of an enterprise specifically, the different industries and the different geographical areas in which it operates.
SWAPS (CURRENCY)The simultaneous purchase of an amount of a currency for spot settlement and the sale of the same amount of the same currency for forward settlement. Alternatively a simultaneous spot sale and forward purchase of a currency.
TTIER I CAPITALCore capital representing permanent shareholders’ equity and reserves created or increased by appropriations of retained earnings or other surpluses.
TIER II CAPITALSupplementary capital representing revaluation reserves, general provisions and other capital instruments which combine certain characteristics of equity and debt such as hybrid capital instruments and subordinated term debt.
TOTAL CAPITALCapital base is summation of the core capital (Tier I) and the supplementary capital (Tier II).
VVALUE AT RISK (‘VaR’) A measure of the loss that could occur on risk positions as a result of adverse movements in market risk factors (e.g. rates, prices, volatilities) over a specified time horizon and to a given level of confidence.
YYIELD TO MATURITYDiscount rate at which the present value of future payments would equal the security’s current price.

258
Nations Trust Bank PLC Annual Report 2019
NOTICE OF MEETING
Notice is hereby given that the Twenty First Annual General Meeting of Nations Trust Bank PLC will be held at 10.00 a.m. on 31st March, 2020 at the 6th Floor, CA Sri Lanka, 30A, Malalasekera Mawatha, Colombo 07, Sri Lanka.
The business to be brought before the meeting will be:
1. To read the notice convening the Meeting.
2. To receive and consider the Annual Report of the Board of Directors and the Statement of Accounts for the period ended 31st December, 2019 with the Report of the Auditors thereon.
3. To re-elect Mr. Prasanna De Silva who retires by rotation at the Annual General Meeting as a Director pursuant to Article 27 of the Articles of Association of the Company.
4. To re-elect Mr. Suran Wijesinghe who retires by rotation at the Annual General Meeting as a Director pursuant to Article 27 of the Articles of Association of the Company.
5. To re-elect Ms. Rachini Rajapaksa who retires by rotation at the Annual General Meeting as a Director in terms of Article 27 of the Articles of Association of the Company.
6. To approve the sale of Bank owned vehicle used by the Chief Executive Officer since 2016, a Mercedes Benz E 200, to the Chief Executive Officer on her retirement on 01 April 2020 at the book value as at that date, as per the Board approved terms of employment.
7. To reappoint Auditors and to authorise the Directors to determine their remuneration.
8. To authorise the Directors to determine and make donations.
9. To consider any other business of which due notice has been given.
Notes:
i. A member unable to attend is entitled to appoint a proxy to attend and vote in his/her place.
ii. A proxy need not be a member of the Company.
iii. A member wishing to vote by proxy at the meeting may use the Proxy Form enclosed.
iv. To be valid, the completed Proxy Form must be lodged at the Registered Office of the Company not less than 48 hours before the meeting.
By Order of the Board
Theja SilvaCompany Secretary
Colombo27th February 2020

259
NEXT GEN BANKING
FORM OF PROXY (VOTING SHAREHOLDERS)
I/We…………………………………………………………......……………………………………………………………………………………………………………………………………………………………………………………………………………………………………………………………………of …………………………………………………………………………………………………………………………………………………………………………………………………………………………………………………………………………………....... being a member/members of Nations Trust Bank PLC, hereby appoint ….....………………………………………………………………………………………………………………………………………………………………………………………………………………………………………………of …………………………………………....…………………………………………………………………………………………………………………………………………………………………………………………………………………………………………………….... or failing him/her
Mr. Gihan Cooray or failing himMr. Prasanna De Silva or failing himMr. Suran Wijesinghe or failing himMr. Conrad D’Souza or failing himMs. Rachini Rajapaksa or failing herMr. Russell De Mel or failing himMr. Sumit Maheshwari or failing himMr. Savanth Sebastian or failing himMs. Sherin Cader or failing herMr. Chanaka Wickramasuriya or failing himMr. Arjun Fernando or failing himMs. Renuka Fernando
as my/our Proxy to represent me/us and to vote for me/us on my/our behalf at the Annual General Meeting of the Company to be held on 31st March, 2020 at 10.00 a.m. and at any adjournment thereof and at every poll which may be taken in consequence thereof.
The Proxy may vote as he/she thinks fit on any other resolution brought before the meeting and may also speak on my/our behalf at the meeting.
In witness I/we placed my/our hand/s hereto on this ………………………………………………. (…………………….) day of March, 2020.
............................................................Signature/s
Please indicate with a () in the space below how you wish your votes to be cast:
For Against
1. To receive and consider the Annual Report of the Board of Directors and the Statement of Accounts for the period ended 31st December 2019 with the Report of the Auditors thereon.
2. To re-elect Mr. Prasanna De Silva who retires by rotation at the Annual General Meeting as a Director pursuant to Article 27 of the Articles of Association of the Company.
3. To re-elect Mr. Suran Wijesinghe who retires by rotation at the Annual General Meeting as a Director pursuant to Article 27 of the Articles of Association of the Company.
4. To re-elect Ms. Rachini Rajapaksa who retires by rotation at the Annual General Meeting as a Director in terms of Article 27 of the Articles of Association of the Company.
5. To approve the sale of Bank owned vehicle used by the Chief Executive Officer since 2016, a Mercedes Benz E 200, to the Chief Executive Officer on her retirement on 01 April 2020 at the book value as at that date, as per the Board approved terms of employment.
6. To reappoint Auditors and to authorise the Directors to determine their remuneration.
7. To authorise the Directors to determine and make donations.
8. To consider any other business of which due notice has been given.

260
Nations Trust Bank PLC Annual Report 2019
FORM OF PROXY (VOTING SHAREHOLDERS)
Instructions as to Completion1. Please perfect the Form of Proxy by filling in legibly your full name and address, by signing in the space provided and filling in the date of
signature.
2. The completed Form of Proxy should be deposited at the Registered Office of the Company at No. 242, Union Place, Colombo 2, not less than 48 hours before the time appointed for the holding of the Meeting.
3. If the Form of Proxy is signed by an Attorney, the Power of Attorney should accompany the Form of Proxy for registration, if such Power of Attorney has not already been registered with the Company.
4. If the appointer is a Company or Corporation, this Form must be executed under the Common Seal or the hand of a duly Authorised Officer.
5. If this Form is returned without any indication as to how the person appointed as Proxy shall vote, the Proxy shall exercise his/her discretion as to how he/she votes, or whether he/she abstains from voting.
Please fill in the following details:
NIC No.:
Share Folio No.:
Name:
Address:
Jointly with:

261
NEXT GEN BANKING
FORM OF PROXY (NON-VOTING SHAREHOLDERS)
I/We…………………………………………………………......……………………………………………………………………………………………………………………………………………………………………………………………………………………………………………………………………of …………………………………………………………………………………………………………………………………………………………………………………………………………………………………………………………………………………....... being a member/members of Nations Trust Bank PLC, hereby appoint ….....………………………………………………………………………………………………………………………………………………………………………………………………………………………………………………of …………………………………………....…………………………………………………………………………………………………………………………………………………………………………………………………………………………………………………….... or failing him/her
Mr. Gihan Cooray or failing him
Mr. Prasanna De Silva or failing him
Mr. Suran Wijesinghe or failing him
Mr. Conrad D’Souza or failing him
Ms. Rachini Rajapaksa or failing her
Mr. Russell De Mel or failing him
Mr. Sumit Maheshwari or failing him
Mr. Savanth Sebastian or failing him
Ms. Sherin Cader or failing her
Mr. Chanaka Wickramasuriya or failing him
Mr. Arjun Fernando or failing him
Ms. Renuka Fernando
as my/our Proxy to represent me/us at the Annual General Meeting of the Company to be held on 31st March, 2020 at 10.00 a.m. and at any adjournment thereof.
In witness I/we placed my/our hand/s hereto on this ……………………………………. (……….) day of March, 2020.
...................................................................................Signature/s

262
Nations Trust Bank PLC Annual Report 2019
FORM OF PROXY (NON-VOTING SHAREHOLDERS)
Instructions as to Completion1. Please perfect the Form of Proxy by filling in legibly your full name and address, by signing in the space provided and filling in the date of
signature.
2. The completed Form of Proxy should be deposited at the Registered Office of the Company at No. 242, Union Place, Colombo 2, not less than 48 hours before the time appointed for the holding of the Meeting.
3. If the Form of Proxy is signed by an Attorney, the Power of Attorney should accompany the Form of Proxy for registration, if such Power of Attorney has not already been registered with the Company.
4. If the appointer is a Company or Corporation, this Form must be executed under the Common Seal or the hand of a duly Authorised Officer.
Please fill in the following details:
NIC No.:
Share Folio No.:
Name:
Address:
Jointly with:

263
NEXT GEN BANKING
NOTES


CORPORATE INFORMATION
REGISTERED NAME Nations Trust Bank PLC
LEGAL FORMA Public Limited Liability Company incorporated in Sri Lanka under the Companies Act No.17 of 1982 and re-registered under the Companies Act No.07 of 2007. A Licensed Commercial Bank established under the Banking Act No. 30 of 1988.
COMPANY REGISTRATION NUMBERPQ 118
DATE OF INCORPORATION21st January 1999
COMPANY SECRETARYMr. Theja Silva
REGISTERED OFFICENo. 242, Union Place, Colombo 2.
Telephone : +94 11 4313131
Facsimile : +94 11 2307854
E-mail : ntb.investorrelations@ nationstrust.com
Web page : www.nationstrust.com
SWIFT : NTBCLKLX
AUDITORSMessrs. Ernst & YoungChartered Accountants,No. 201, De Saram Place,Colombo 10.
CREDIT RATINGA (lka) from Fitch Ratings Lanka Ltd.
DIRECTORSMr. Gihan Cooary - Chairman
Mr. Conrad D’Souza - Senior Director
Ms. Rachini Rajapaksa
Mr. Prasanna De Silva
Mr. Suran Wijesinghe
Mr. Russell De Mel
Mr. Sumit Maheshwari
Mr. Savanth Sebastian
Ms. Sherin Cader
Mr. Chanaka Wickramasuriya
Mr. Arjun Fernando
Ms. Renuka Fernando
Mr Murtaza Jafferjee, Independent/Senior Director
retired from the Board on 15th December 2019
Board Supervisory CommitteeMr. Suran Wijesinghe - Chairman
Mr. Prasanna de Silva
Mr. Savanth Sebastian
Ms. Sherin Cader
Mr. Arjun Fernando
Board Audit Review CommitteeMs. Rachini Rajapaksa - Chairperson
Mr. Suran Wijesinghe
Mr. Savanth Sebastian
Ms. Sherin Cader
Mr. Arjun Fernando
Human Resources and Remuneration CommitteeMr. Gihan Cooray - Chairman
Mr. Prasanna De Silva
Ms. Rachini Rajapaksa
Mr. Russell De Mel
Nomination CommitteeMr. Conrad D’Souza -Chairman
Mr. Gihan Cooray
Mr. Prasanna De Silva
Mr. Chanaka Wickramasuriya
Credit CommitteeMr. Gihan Cooray - Chairman
Mr. Prasanna De Silva
Mr. Russel De Mel
Mr. Chanaka Wickramasuriya
Integrated Risk Management CommitteeMr. Suran Wijesinghe - Chairman
Ms. Rachini Rajapaksa
Ms. Sherin Cader
Mr. Arjun Fernando
Related Party Transactions Review CommitteeMr. Russell De Mel - Chairman
Ms. Renuka Fernando
Mr. Chanaka Wickramasuriya
Designed & produced by
Photography by Taprobane Street

www.nationstrust.com